Dipartimento di Scienze Economiche e Metodi Matematici ......profitable if the relationship with the...
27
Università degli Studi di Bari Dipartimento di Scienze Economiche e Metodi Matematici Southern Europe Research in Economic Studies S.E.R.I.E.S. SERIES e MATEF sono pubblicati a cura del Dipartimento di Scienze economiche dell'Università degli Studi di Bari. I lavori riflettono esclusivamente le opinioni degli autori e non impegnano la responsabilità del Dipartimento. SERIES e MATEF vogliono promuovere la circolazione di studi ancora preliminari e incompleti, per suscitare commenti critici e suggerimenti. Si richiede di tener conto della natura provvisoria dei lavori per eventuali citazioni o per ogni altro uso. SERIES and MATEF are published under the auspices of the Department of Economics of the University of Bari. Any opinions expressed here are those of the authors and not those of the Department. Often SERIES and MATEF divulge preliminary or incomplete work, circulated to favor discussion and comment. Citation and use of these paper should consider their provisional character. WORKING PAPER NO. Francesca Bartoli, Giovanni Ferri, Pierluigi Murro, Zeno Rotondi Bank-firm relations and the role of Mutual Guarantee Institutions during the crisis 0034
Transcript of Dipartimento di Scienze Economiche e Metodi Matematici ......profitable if the relationship with the...

Università degli Studi di BariDipartimento di Scienze Economiche e Metodi
Matematici
Southern Europe Research in Economic StudiesS.E.R.I.E.S.
SERIES e MATEF sono pubblicati a cura del Dipartimento di Scienzeeconomiche dell'Università degli Studi di Bari.I lavori riflettono esclusivamente le opinioni degli autori e nonimpegnano la responsabilità del Dipartimento.SERIES e MATEF vogliono promuovere la circolazione di studi ancorapreliminari e incompleti, per suscitare commenti critici esuggerimenti.Si richiede di tener conto della natura provvisoria dei lavori pereventuali citazioni o per ogni altro uso.
SERIES and MATEF are published under the auspices of theDepartment of Economics of the University of Bari.Any opinions expressed here are those of the authors and notthose of the Department.Often SERIES and MATEF divulge preliminary or incomplete work,circulated to favor discussion and comment.Citation and use of these paper should consider their provisionalcharacter.
WORKING PAPER NO.
Francesca Bartoli, Giovanni Ferri, Pierluigi Murro, Zeno Rotondi
Bank-firm relations and the role of Mutual GuaranteeInstitutions during the crisis
0034

1
Bank-firm relations and the role of Mutual Guarantee Institutions during the crisis
by
Francesca Bartoli, Giovanni Ferri**, Pierluigi Murro***, Zeno Rotondi****
November 2010
Abstract
We examine the role played by Mutual Guarantee Institutions (MGIs) in the lending policies undertaken by
banks at the peak of the Great Crisis of 2007-2009. We address this issue by using a large database on
Italian firms built from the credit files of UniCredit banking Group and focusing on small business. We
provide an empirical analysis of the determinants of the probability that a borrowing firm will suffer
financial tension and obtain two main innovative findings. First, we show that small firms supported by
MGIs were less likely to experience financial tensions even at that time of utmost financial stress. Second,
our empirical evidence shows that MGIs have played a signalling role beyond the simple provision of a
collateral. This latter finding suggests that the information provided by MGIs turned out to be key for bank-
firm relations as scoring and rating systems – being typically based on pro-cyclical indicators – had
become less informative during the crisis.
JEL Classification: D82, G21, G30
Keywords: financial crisis, bank-firm relationships, asymmetric information, credit guarantee schemes,
small business finance, peer monitoring
1 Introduction
We bring together two different strands of literature related to the extent of financial
constraints. First, given the existing state of the firm-bank relationship, we ask whether
the support of external institutions may help ease those financial constraints. Second, we
address that issue within the specific context of the Great Crisis of 2007-2009.
On the first matter, the literature often recognizes that borrowers’ access to credit may
benefit from the assistance of Mutual Guarantee Institutions (MGIs). However, it is not
clear through which channel that beneficial effect materializes. On one hand, the bank
could simply value the guarantee offered by the MGI to the borrowing firm, which would
reduce both the probability of default and the loss given default. In this sense, the MGI
UniCredit Group, Head of Family & SME Analysis, Territorial Research and Strategies; e-mail:
Full professor of Economics, University of Bari; e-mail: [email protected];
University of Bari; e-mail: [email protected];
UniCredit Group, Head of Territorial Research & Strategies; e-mail: [email protected].
(corresponding author).
We wish to thank all the participants at “The Pro-Development Role of Banking and Finance in the
Economic Periphery” international workshop held at Bellagio in October 2010. Without naming them
individually, we also thank several experts within UniCredit Group for crucial assistance in constructing
the database as well as for key insights in setting up our analysis. In spite of this, the usual disclaimer
applies. Namely, the views put forward in the paper belong exclusively to the authors and do not involve in
any way the institutions of affiliation.

2
guarantee acts merely as a collateral available to the bank vis-à-vis that borrower. On the
other hand, the bank might interpret the MGI guarantee as an important signal of the
good quality of the firm. Indeed, the MGI has access to private information on the firm
beyond what the bank can normally see and if the MGI grants its guarantee to that firm it
is implicitly revealing to the bank that such private information is good.
On the second matter, the Great Crisis of 2007-09 brought about extreme financial
instability, especially after the bankruptcy of Lehman Brothers, by mid-September 2008.
That wave of instability kept aggravating during the rest of 2008. The acute difficulty
they had to obtain funding on the wholesale markets induced the banks to become
particularly reluctant to maintain their supply of credit at the previous levels, let alone
granting new loans. So, there is evidence the banks curtailed credit supply by the end of
2008 and that the adjustment reached its climax during the first half of 2009. Even
though, given the concurrent drop in demand, most enterprises postponed their
investment projects or even cut their production levels, the resulting drop in the demand
for credit was much less than the drop in the credit supply. Thus, the extent of financial
constraints during the crisis is a very special experience, something that comes close to a
laboratory experiment, where the external shock imparted by the crisis induced a sudden
and likely unexpected contraction in the credit supply. In turn, it is useful to assess
whether the value of the MGI support eclipsed because of the crisis or it was still working
at that time of utmost financial stress.
To answer those research questions we use the credit files of a large commercial bank
(UniCredit) taking two snapshots of them: at the end of December 2008 and at the end of
March 2009. First, we build a proxy measure of credit constraints considering the ratio
between the amount of credit effectively drawn by the enterprise and the amount of the
credit limits the banks had granted to it. Namely, we classify as experiencing financial
tension those enterprises that: i) had a very high value of such ratio by end December
2008 and ii) suffered a significant increase in that ratio by end March 2009. Then, we
study empirically whether and to what extent, controlling for other possible determinants,
the probability of suffering financial tension was smaller for the firms assisted by MGIs.
As regards our research questions, we reach the following results. First, we confirm that
borrowing firms assisted by MGIs less likely experienced financial tension. Second, MGI
assistance benefited more the borrowing firms with intermediate and low internal ratings
whereas it did not matter so much for the companies enjoying higher ratings. Third, our
results indicate that MGIs’ beneficial impact to reduce the probability of financial tension
was significantly larger for the more opaque firms, namely those endowed with a shorter
firm-bank relationship length. The second and third results together suggest that MGIs
played a signalling role beyond the pure provision of guarantees.
In the rest of the paper, section 2 presents a brief summary of the literature on the two
aspects: i) the impact of systemic financial crises on the amplification of credit
constraints via the bank lending channel, and ii) the effect of MGI assistance at
facilitating firms’ access to credit during normal times. The bulk of the paper consists of
section 3, where we present our empirical analysis in detail. Finally, section 4 concludes
highlighting why our results have a bearing on the design of an optimal financial
structure, particularly with a view at the small business segment.

3
2 The literature background
It is a well known tenet that banks exist to (partly) overcome the information
asymmetries between investors and borrowers. Building on the seminal paper by Stiglitz
and Weiss (1981), Diamond (1984) shows that savers/depositors delegate to banks the
monitoring of borrowers. It follows from this that banks play a key function to remedy
market failures in the credit market given that, by accumulating information on
borrowers, they may lower the extent of asymmetries in information and provide the
borrowers with the appropriate incentives to tackle the adverse selection and moral
hazard problems.
According to a bulky strand of the literature, banks perform the task above better if they
engage in long-term relationships with borrowers, i.e. if they follow the relationship
banking model. Boot (2000) holds that relationship banking centers around two critical
dimensions: the extraction of proprietary information from the borrower by the lender
and the occurrence of multiple interactions between the two parties. As such, relationship
banking may be defined as “the provision of financial services by a financial
intermediary that: i. invests in obtaining customer-specific information, often proprietary
in nature; and ii. evaluates the profitability of these investments through multiple
interactions with the same customer over time and/or across products”. This special status
can facilitate a Pareto-improving exchange of information between the borrower and the
bank. But relationship banking can also add value through several additional contractual
welfare-improving enhancements: i) through flexibility and discretion, it can facilitate
implicit long term contracting; ii) it may help controlling potential conflicts of interest;
iii) it can improve the monitoring of collateral; iv) it may render feasible for the bank to
make loans that would not be profitable from a short term perspective but may become
profitable if the relationship with the borrower lasts long enough.
But, why should relationship banking be most valuable during financial crises? The
answer depends on the fact that in those circumstances economies experience widespread
distress. This implies that borrowers need financial assistance the most exactly when the
economy is plundered by pervasive lack of liquidity. If this financial assistance is denied,
many viable firms might become insolvent and become bankrupt, with large potential
depletion of corporate value (Andrade and Kaplan, 1998). Which is then the link between
relationship banking and distress? We find a rather general agreement that relationship
banking may help deal with financial distress.
Analyzing the case of Japanese firms, Hoshi, Kashyap, and Scharfstein (1990) show that
the costs borne to overcome episodes of financial distress are significantly lower for
firms enjoying long-standing relationships with a main bank. Kawai, Hashimoto, and
Izumida (1996) find that the main bank system reduces the firm’s financial cost for
Japanese firms in financial distress. Elsas, and Krahnen (1998) reach analogous
conclusions on German data: they unveil that housebanks provide liquidity insurance in
situations of unexpected deterioration of borrower ratings. Building on the hypothesis
that implicit contracts may characterize bank lending (Fried and Howitt, 1980), Berlin,
and Mester (1998) find evidence that relationship banks smooth loan rates in response to
exogenous shocks. They argue that loan rate smoothing is part of an optimal long-term
contract between a bank and its borrower if it happens in response to interest rate shocks
– but not in response to a credit risk. Examining micro-data on corporate borrowing in
Italy during the episode of sharp monetary tightening in 1992 – aimed to resist the extant
4
exchange rate crisis – Conigliani, Ferri, and Generale (1997) show that the intensity of
lending rate increase and of credit constraints was higher the larger the number of lending
banks.
While there is general consensus that relationship banking should be most valuable
during financial crises, we need to make an important caveat. Specifically, as Berlin, and
Mester (1998) also show, loan rate smoothing – and, we can add, the provision of
liquidity insurance more in general – reduces bank profits. This means that financial
crises may impose a greater burden on relationship banks than on arm’s length banks. If
one considers that such a burden is compounded with the accrual of increasing losses
triggered by the crisis, this entails that the stability of (some) relationship banks may be at
risk. In other words, there is a limit to the intertemporal smoothing and liquidity
insurance offered by relationship banks. And, in some cases, relationship banks may
become distressed. Should such occurrence materialize, borrowers would be hit by the
curse of relationship banking rather than enjoying its benefits. In practice, distressed
relationship banks would be recalling their loans and their borrowers might be the least
prepared to deal with such a situation. It may, in fact, be rather difficult for borrowers to
substitute distressed relationship banks exactly at the time of a financial crisis.
Ferri, Kang and Kim (2001) reach relevant findings in this respect. Studying the Korean
crisis of 1997-98 they show that: i) outstanding loans plunge more for firms with weaker
pre-crisis relationship banking; ii) also the drop in credit lines – arguably a proxy
identifying shifts in the loan supply – is larger for firms relying less on strong
relationship banking; iii) more intense pre-crisis relationship banking reduces the
probability that a previously non-delinquent firm will build (increase her) loans in
arrears; iv) ceteris paribus, the aforementioned probability depends on whether firms
were borrowing from one (or more) of the five banks foreclosed in June 1998, testifying
that it may be particularly difficult for borrowers to substitute distressed lending banks
during a financial crisis.
Credit guarantee schemes have recently experienced renewed interest as a response to
credit crunch in advanced economies (see for instance Honohan 2010). Columba et al.
(2010) provide empirical evidence showing that even young small firms, with little
collateral and short credit relationships, may mitigate their borrowing constraints by
joining MGIs. Members of MGIs contribute to a guarantee fund used as collateral for
obtaining loans. Banks, especially large ones, appreciate this kind of lending technology
as MGIs members are better informed about each member’s characteristics and behavior.
Hence participation to an MGI provides a signaling effect on firms creditworthiness.
Moreover, as MGIs members incur a penalty in case of default by a single member,
members have an incentive to monitor each other (peer monitoring).1
However, to our knowledge, little is known in the literature about the role of MGIs
during financial crises. The present paper provides a first assessment for the Great Crisis
of 2007-2009 and focuses on the lending practices followed by a large bank, for which
asymmetric information problems with opaque borrowers are more severe compared to
small territorial banks.
1 As explained by Columba et al. (2010) this mechanism is similar to a collective credit agreement where a
group of borrowers without collateral are linked by a joint responsibility clause. See also the literature
reported in their article.
5
3 Empirical evidence
This section is divided into four parts. Subsection 3.1 is devoted to outline the definition
of the data sources, of the variables we use as well as to present some descriptive
statistics. In subsection 3.2 we introduce our empirical model. Subsection 3.3 articulates
our main results while subsection 3.4 reports various robustness checks to further
ascertain the strength of our results.
3.1 Variables and descriptive statistics
Data on firms are taken from the UniCredit loan portfolio of the Italian small business
segment.2 The sample used in the empirical analysis comprises around 77,000 firms,
customers of the bank, and is based on the information available at the end of December
2008 and at the end of March 2009. An important additional source of information for
our dataset is represented by the Italian Credit Register, where banks can verify granted
credit lines and actual utilization of credit lines with respect to the whole banking system
for each customer.3
The dataset is obtained by treating a wider record file: we have filtered outliers and
misreported cases from the Italian Credit Register; we have also dropped all the
observations for which no information about the internal rating of UniCredit was
available. The variables investigated are those reported in Table 1.
The dependent variable is an indicator of financial tension. We define financial tension as
a dichotomous variable taking value 1 if in December 2008 the firm was using more than
70% of the credit lines granted by the banking system and subsequently, in March 2009,
it was using more than 80%. This variable identifies firms in a situation of potential
financial stress that during the crisis faced a worsening of their situation with an increase
of at least 10% of the indicator of financial tension4.
In order to test the robustness of our definition of financial tension we consider as
alternative dependent variable the rate of growth from December 2008 to March 2009 of
the total granted credit line for the firm by the banking system. Having defined the
indicator of financial tension in terms of the amount of the credit line used with respect to
the amount granted, ceteris paribus, an increase of the granted credit line diminishes the
risk of potential financial stress.
The key explanatory variable is a dichotomous variable taking value 1 if the line of credit
granted to the firm is backed by mutual guarantees. As discussed previously, MGIs may
enhance the bank-firm relationship by favouring the access to bank loans for small firms
with a limited collateral capacity, or characterized by the lack of a sufficient track record
or credit history. Specifically, the MGI may reduce asymmetric information problems
through members’ screening and monitoring activities on each other (peer monitoring),
and/or can mitigate the risk borne by the bank by supplying financial guarantees (and in
some cases also personal and real estate guarantees) that allow a partial coverage of
2 In the present analysis small business is defined as firms with turnover up to 5 million euros.
3 Banks must report to the Italian Credit Register when: granted or actual short term credit lines are no less
than 75,000 €, while bad loans or losses are reported regardless of the amount. 4 The thresholds introduced are derived from heuristic evidence based on operational experience, and have
been tested by means of a sensitivity analysis.
6
potential losses. In the present sample 19% of firms had a guarantee posted by an MGI on
a loan. 5
Moreover, we have added several control variables:
- the firm’s rating according to the UniCredit internal assessment in December
2008. The original values have been rearranged such that better firms are
associated with higher values of the rating, with 1 being the worst (default) and 14
being the best, and then taken in logarithms. We also construct three dichotomous
variables based on the discrete specification, such that values from 5 to 9
correspond to bad quality firms, values from 10 to 12 correspond to intermediate
quality firms, and values 13 and 14 correspond to high quality firms;6
- the firm’s share of short-term loans from the banking system in December 2008;
- a proxy of the firm’s leverage, defined as the logarithm of the ratio of firm’s total
loans from the banking system to firm’s sales in December 2008, which measures
the firm's ability to repay debt;
- Corporation, a dummy variable taking value 1 if the firm is a limited liability
company;
- Size, defined as the logarithm of the firm’s employees in December 2008;
- HHI, corresponding to the average value of the Herfindhal Hirschman index of
concentration on bank loans in the province during 1991-1998 period;7
- Growth, corresponding to the rate of growth of the provincial value added during
the 1991-1998 period;
- North, a dummy variable taking value 1 if the bank branch where the credit
relationship takes place is located in Northern Italy (Emilia Romagna, Veneto,
Friuli Venezia Giulia, Trentino Alto Adige, Lombardia, Piemonte, Val d'Aosta); 0
otherwise;
- Agriculture, an industry dummy variable taking value 1 if the firm operates in
Agriculture; 0 otherwise;
- Energy, an industry dummy variable taking value 1 if the firm operates in the
Energy sector; 0 otherwise;
- Manufacturing, an industry dummy variable taking value 1 if the firm operates in
the Manufacturing sector; 0 otherwise;
- Constructions, an industry dummy variable taking value 1 if the firm operates in
the Constructions sector; 0 otherwise;
- Trade, an industry dummy variable taking value 1 if the firm operates in the Trade
and repair sector; 0 otherwise;
- Other services, an industry dummy variable taking value 1 if the firm operates in
the sector “Other services”; 0 otherwise.
In order to estimate with Instrumental Variables techniques we consider the following set
of instruments:
5 Columba et al. (2010) examine Italian small firms with less than 20 employees that received a loan in
June 2005, 17% of which had a guarantee posted by an MGI on a loan. 6 The worst quality firms, characterized by a rating from 1 to 4, are not informative for the analysis so these
latter classes are not taken into consideration. 7 These data are based on Bank of Italy statistics and we have used the values computed in Herrera and
Minetti [2007].

7
- Branches per thousand inhabitants in the region in 1936;
- Number of saving banks per thousand inhabitants in the region in 1936;
Table 2 reports the summary statistics for all the variables included in the regressions
presented in the paper.
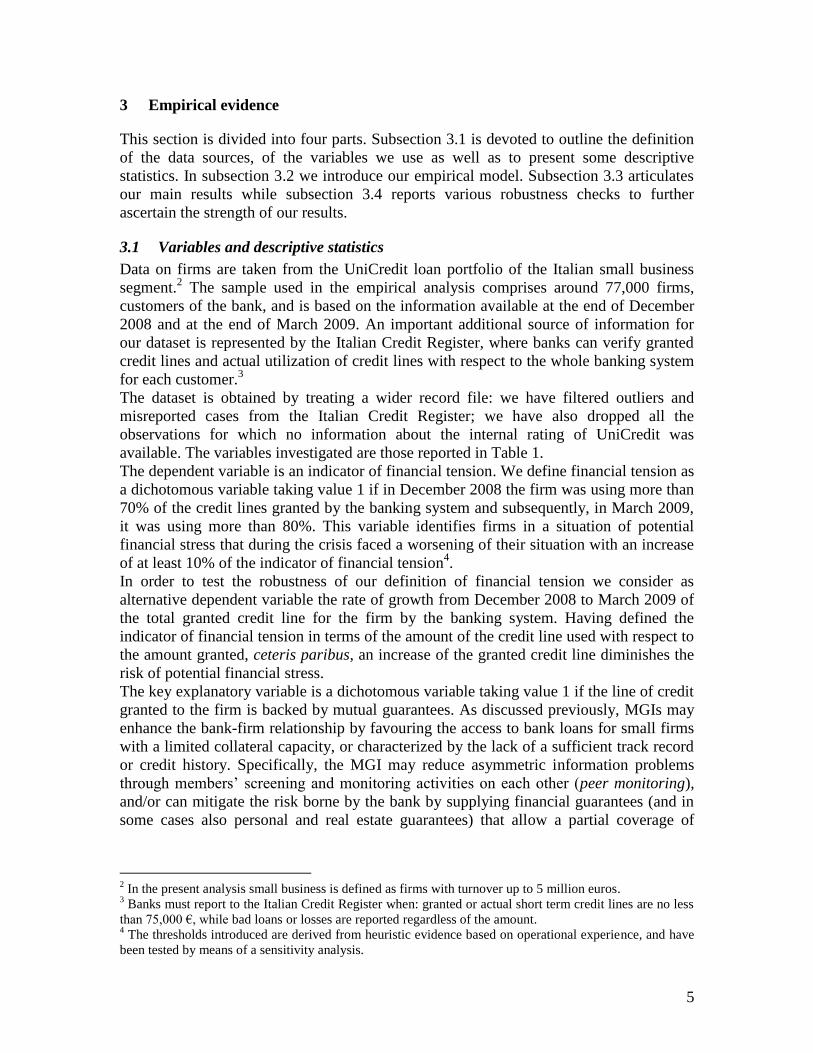
As it is possible to observe in Figure 1, the sector composition is affected by the nature of
the sample. In fact, small firms are usually overrepresented in sectors such as Trade and
Other Services compared to medium or large firms.
3.2 The empirical model
A situation of potential financial stress experienced by a firm can be modelled as:
.111 iiii uxzy (1)
where yi is the Financial Tension proxy experienced by firm i, zi is the vector of control
variables, xi accounts for the presence of a MGI providing firm i with guarantees to be
used as collateral to back bank loans and ui is the vector of heteroskedastic-robust
standard errors.
Instrumental variables are used to account for endogeneity in estimating the relation
between a situation of financial tension and the presence of MGI guarantees. To fix ideas,
think of the two-stage least squares interpretation of instrumental variables (IV,
henceforth). First, we define a vector of instrumental variables that are correlated with the
explanatory variable xi X, but are uncorrelated with the error term in the regression (1).
The effect of these instruments on xi is captured by the parameters in the following
relationship equation:
,21 iii vwx (2)
where xi is the endogenous variable in (1), wi is the vector of instruments and vi is the
stochastic error term. After estimating the first-stage regression (2) xi is replaced with the
fitted values of xi in the second-stage regression (1).
The set of instruments in the present empirical analysis are taken from Guiso, Sapienza
and Zingales [2004]. In particular, we have a set of variables that describe the banking
market in 1936, when a strict entry regulation was introduced: the number of branches
per thousand inhabitants in the region in 1936, and the number of saving banks per
thousand inhabitants in the region in 1936. Guiso, Sapienza and Zingales [2004] have
used these instruments to account for endogeneity in the case of a local banking
development indicator, taken as a regressor in a firm’s growth equation. Since the quality
of MGI is probably related to banking development, we use an analogous set of
instruments.8
To ensure the validity of the chosen instruments we have to perform diagnostic checks.
First of all, we consider the F-test of linear restrictions that the instruments are jointly
8 For a detailed discussion on the justification of these instruments, see Guiso, Sapienza and Zingales
[2004].

8
significant. Then, for an excluded exogenous variable to be a good instrument, it must
be sufficiently correlated with the included endogenous regressor and orthogonal to the
error term. The first-stage regression indicates that the instrumental variables are
correlated. The assumption of correlation is tested with an F-test of the excluded
instruments that corresponds to Shea's (1997) “partial R-squared” measure of instrument
relevance, that takes inter-correlations among instruments into account. The first-stage
results are considered with small-sample statistics, to be consistent with the
recommended use of the first-stage F-test as a diagnostic. As the estimated equation is
reported with heteroskedastic-robust standard errors, the first-stage F-test is also
heteroskedastic-robust. In turn, the assumption of orthogonality to the error term is
tested using the Hansen-Sargan over-identification test. Tests of over-identifying
restrictions actually check also whether the equation is misspecified, meaning that one
or more of the excluded exogenous variables should be included in the structural
equation. Hence, a rejection of the Hansen-Sargan over-identification test can be
interpreted as either having invalid instruments and/or incorrect model specification.
We also report a test of endogeneity for the instrumented variable, in order to check
whether the variable presumed to be endogenous in the OLS model could instead be
treated as exogenous. If the null hypothesis of exogeneity cannot be rejected, then the
OLS estimator is more efficient, and should be used instead. Under the null hypothesis
that the specified endogenous regressor can actually be treated as exogenous, the test
statistic is distributed as a chi-squared with a number of degrees of freedom equal to the
number of regressors tested. The endogeneity test is implemented like the C statistic,
defined as the difference of two Hansen-Sargan statistics: one for the equation with the
smaller set of instruments, where the suspect regressor is treated as endogenous, and one
for the equation with the larger set of instruments, where the suspect regressor is treated
as exogenous. Under conditional homoskedasticity, this endogeneity test statistic is
numerically equal to the Hausman test statistic (see Hayashi, 2000).
Unfortunately, the IV estimation method relies on the assumption of a linear probability
model for mutual guarantees influencing the financial tension experienced by firms.
Therefore we also provide the estimates derived from a conditional maximum likelihood
(IV-Probit) technique proposed in Wooldridge (2002) which does not require the
assumption of a linear probability model. This technique uses maximum likelihood to
estimate a probit model in the presence of an endogenous variable. We report a Wald test
of endogeneity for the instrumented variable, i.e. an MGI backing firms’ loans. Under the
null hypothesis that the specified endogenous regressor can actually be treated as
exogenous, the test statistic is distributed as a chi-squared with one degree of freedom.
3.3 Findings
We examine six different specifications. First of all, we use the following baseline
equation:
Financial tension = + 1 MGIi + 2Rating + 3 Share of short term loansi + 4 Leveragei +
5Corporationi + 6Sizei + 7HHIi + 8Growthi + 9Northi +
5
1J
ijj Sector + ui (3)
9
where i = 1, …, N represents the firm, and j = 1, …, 5 is the economic activity sector.
The financial tension experienced by firm i depends on both firm and local economy
characteristics. We consider as explanatory variable the affiliation with an MGI (dummy
MGI), and take as control variables the following firm characteristics: the rating assigned
(Rating), the share of short-term loans received from the banking system (Share of short
term loans), the ratio of total loans to sales (Leverage), the limited liability (dummy
Corporation), the number of employees (Size), the geographical location (dummy North),
and the activity sector (one dummy variable for each sector considered). Local economy
characteristic are the degree of concentration on bank loans in the province (HHI) and the
rate of growth of provincial value added (Growth).
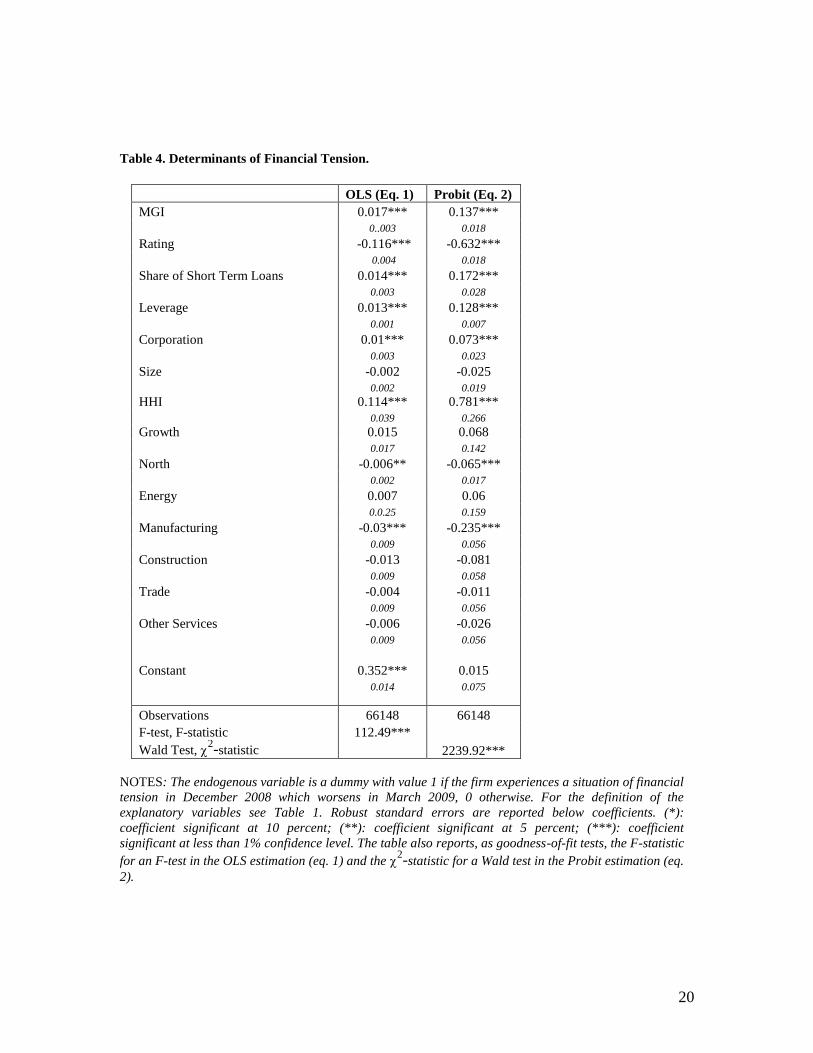
Results by OLS and Probit are reported in Table 4. In both cases, the 1 coefficient
indicates that firms guaranteed by MGIs have a higher probability of experiencing
financial tension than those not associated with an MGI. The sign of the coefficient is not
the one we expect, but this counterintuitive finding can be rationalized in the light of an
endogeneity problem: on one hand, firms supported by MGIs experience less difficulties
in obtaining loans; on the other hand, firms join an MGI since they actually experience
difficulties in obtaining loans.
In order to control for this endogenity problem we estimate with IV techniques. The
first-stage regression (eq. 3a reported in Table 5) shows that we can reject the null that
the chosen instruments are jointly not significant in the equation of financial tension (eq.
3b reported in Table 6): the F-statistic on the F-test on linear restriction is significant at
less than 1% confidence level. Moving to the second-stage regression, the results of the
test of exogeneity in the 2SLS estimation establish the need for an IV approach. In fact,
the F-test of excluded instruments confirms that the instrumental variables considered
are correlated with the endogeous regressor MGI.9 Second, the result on the χ
2-statistic
on the Hansen-Sargan over-identification states that the null of either having invalid
instruments and/or incorrect model specification can be rejected. Finally, the test of
endogeneity for the instrumented variable rejects the null that the MGI variable could be
treated as exogenous in the OLS estimation.
Consider now the effect of an MGI backing firms’ loans. Contrary to the OLS and
Probit estimation, which, as shown above, are affected by endogeneity problems, the IV
estimation confirms the importance of MGI in reducing the probability of financial
tension. In fact, the estimated coefficient of MGI is negative and significant at less than
the 1% confidence level. However, the IV estimation method relies on the assumption of
a linear probability model. Therefore, in Table 6 we also provide the estimates derived
from a conditional maximum likelihood (IV-Probit) estimation, which does not impose
the assumption of a linear probability model (eqs. 4 to 6).
Besides the baseline equation, which features MGI as explanatory variable (eq. 4), we
study how the probability of experiencing financial tension changes when the guarantee
is associated to an intermediate or bad quality firm (eq. 5 and eq. 6, respectively).
Replacing the explanatory variable MGI with the two corresponding interaction
variables, the baseline equation hence becomes:
9 Specifically, the F-statistic equal to 490.52, with a p-value of 0.0000. Stock, Wright and Yogo [2002]
suggest that the F-statistic should exceed 10 for inference based on the 2SLS estimator to be reliable where
there is only one endogenous regressor.

10
Financial tension = + 1 MGIi intermediate quality firmi + 2Rating + 3 Share of short term loansi +
4 Leveragei + 5Corporationi + 6Sizei + 7HHIi + 8Growthi + 9Northi +
5
1J
ijj Sector + ui (3a)
and:
Financial tension = + 1 MGIi bad quality firmi + 2Rating + 3 Share of short term loansi +
4 Leveragei + 5Corporationi + 6Sizei + 7HHIi + 8Growthi + 9Northi +
5
1J
ijj Sector + ui (3b)
In all three specifications, the Wald test confirms that the instrumented regressor should
be treated as endogenous, and the 1 coefficient is negative and significant at less than
1% confidence level. However, since the IV-probit estimates are not linear, for
comparison purpose we have to compute marginal effects (Table 7). MGIs turn out more
effective in reducing the probability of experiencing financial tension when associated
with intermediate and bad quality firms. During the crisis asymmetric information
problems have been exacerbated, so that the signals typically embedded in scoring and
rating systems to assess credit worthiness have become less informative, since typically
based on pro-cyclical indicators. Our findings show that MGIs played an important role
during the crisis in relaxing asymmetric information problems for intermediate and low
quality firms, allowing them to reduce the probability of experiencing financial tension
and to increase granted credit. In particular, the MGI assistance was more important for
firms with intermediate and low internal rating whereas it did not matter so much for
firms having a high rating.
Now, given that MGIs are most valuable for small firms during financial crises, as
shown above, is the rationale for this finding to be found in their capacity to convey
signal to banks about their members creditworthiness or in their capacity to provide a
guarantee fund for the group of members lacking collateral?
In order to examine this issue we split the sample into two subsamples, with respect to
the median value of the length of the bank-firm relationship, in our sample equal to 4.28
years. In fact, a long-term relation of the firm with its main bank may be important in
reducing the extent of information asymmetry. By distinguishing between long-term and
short-term bank-firm relationships we can study the signalling effect of MGIs in the two
subsamples.
The corresponding IV-probit estimations are reported in Table 8. In order to maintain
internal consistency, the set of instruments used is the same of previous regressions.
First of all, we consider the relationship length (taken in logarithms) as explanatory
variable instead of MGIs, and analyze its impact over the probability of experiencing
financial tension. The equation we estimate is the following:
Financial tension = + 1 Relationship length with the Banki + 2Rating + 3 Share of short term loansi +
4 Leveragei + 5Corporationi + 6Sizei + 7HHIi + 8Growthi + 9Northi +
5
1J
ijj Sector + ui (4)
As expected, the 1 coefficient is negative and significant at less than 1% confidence
level (eq. 7, in Table 8). Having confirmed the role of long-term relationships with the
bank in reducing the probability of financial tension, we then re-estimate our baseline
specifications (3), distinguishing between long-term and short-term relationships (eq. 8

11
and 9, respectively), where the threshold is given by the median value of the relationship
length with the bank, equal to 4.28 years. Despite having the correct sign, the coefficient
associated with MGIs is not significant when considering the long-term relationships
sub-sample. On the contrary, it becomes significant at less than 1% confidence level in
the short-term sub-sample, which confirms our hypothesis. During extreme financial
crises, asymmetric information problems entail that in the presence of a short-term bank-
firm relationship, MGIs play a signalling role that goes beyond the pure provision of
guarantees.
3.4 Robustness analysis
As the definition of financial tension is somehow arbitrary although logically grounded,
we test the robustness of our findings by considering a variable indirectly linked to
financial tension. Specifically, we consider as endogenous variable the rate of growth
from December 2008 to March 2009 of the total line of credit granted to the firm by the
banking system. Having defined the indicator of financial tension in terms of the amount
of the credit line used with respect to the amount granted, ceteris paribus, an increase of
the granted credit line diminishes the risk of potential financial stress. Given that it was
very difficult for banks to extend new credit lines and/or amplify the existing ones during
the period examined, hence the benefits arising from MGIs are now confirmed by a
positive impact on the dependent variable. The findings of this exercise are reported in
Table 9. First of all, we use the following baseline equation:
Growth of the granted credit line = + 1 MGIi + 2Rating + 3 Share of short term loansi + 4 Leveragei
+ 5Corporationi + 6Sizei + 7HHIi + 8Growthi + 9Northi +
5
1J
ijj Sector + ui (5)
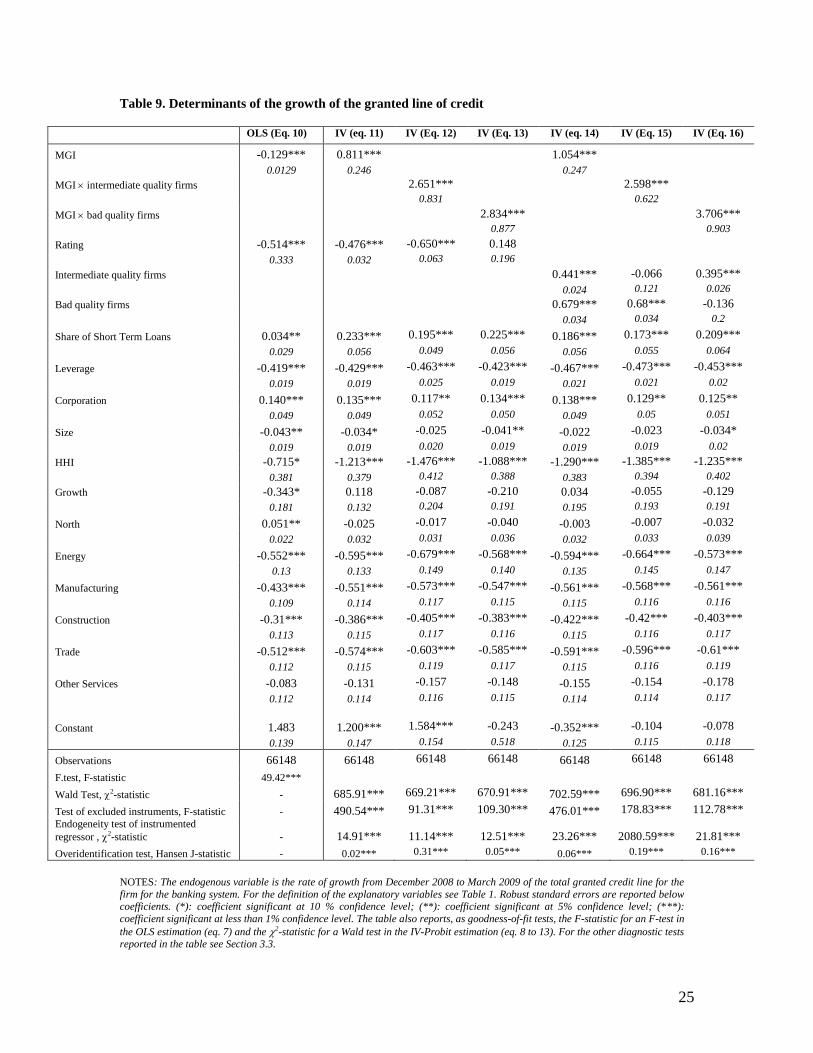
Also in this case the sign of the 1 coefficient in the OLS estimate may reveal an
endogenity problem, and the results of the tests in the 2SLS estimations (eq. 10 to 16)
support the need for an IV approach. The set of instruments is the same used in the
previous analysis.
Consider then the 2SLS estimations. First of all, we work on the baseline equation by
replacing the variable MGI with two interaction variables which jointly feature the
presence of an MGI and an intermediate (eq. 12) or bad quality firm (eq. 13). In this two
latter cases, the size of the 1 estimated coefficient is larger compared to the result
obtained in the equation featuring MGI only. This seems to confirm the importance of
MGIs in favouring the access to bank loans for small firms with a limited collateral
capacity, or characterized by the lack of a sufficient track record or credit history.
However, note that the rating has a positive impact on the growth of the granted credit
line only when worse customers are considered, and still the coefficient is not significant
(eq. 13). The crisis imparts a negative shock characterized by a shortage of liquidity, and
firms with lower ratings are the ones likely asking for more credit, resulting thereby the
more financed. Differently put, during the crisis a “demand effect” is at work, which
contrasts the traditional “credit worthiness effect”, inserting a bias in the analysis.
Equations 14 to 16 support this reasoning. In fact, once we replace the rating variable
with the two dummies, identifying respectively an intermediate or bad quality firms with

12
respect to the rating associated, the signs of the coefficients become positive within each
cluster of rating. Specifically, the estimated equation is:
Growth of the granted credit line = + 1 MGIi + 2 Intermediate quality firm + 3 bad quality firm +
4 Share of short term loansi + 5 Leveragei + 6Corporationi + 7Sizei + 8HHIi + 9Growthi + 10Northi
+
5
1J
ijj Sector + ui (6)
The 1, 2 and 3 coefficient are positive, and significant at less than 1% confidence level.
Moreover, the coefficient associated to bad quality firms is bigger than the one
associated to intermediate quality firms. Clusters of rating render explicit the situation
the market faces during the crisis: thanks to MGIs, lower rated firms turn out to have
more credit, having asked for more. Once we consider the interaction variables instead
of accounting for the presence of an MGI only, the phenomenon is even more evident
(eq. 15 and 16). Whereas the single dummy is not significant per se, when already
captured on the explanatory variable, the other one has a coefficient significant at less
than 1%, an with the expected positive sign.
Summing up, the robustness check confirms the importance of MGIs in favouring the
access to bank loans for small firms with a limited collateral capacity, or characterized
by the lack of a sufficient track record or credit history. In harsh times MGIs allow to
reduce asymmetric information problems, providing a signalling effect that counts more
than the simple guarantee itself. This is especially true for intermediate quality firms.
That is, firms maybe creditworthy, but damaged by the shortage of liquidity generated
by the crisis.
4 Conclusions
The Great Financial Crisis of 2007-2009 imparted an exogenous, likely unanticipated,
shock on the macroeconomy. In particular, the crisis dried up liquidity sources for the
banking system while, at the same time, it worsened business prospects in the economy at
large. As such, the peak of the crisis provides a unique vantage point for the researchers
aiming to investigate how financial constraints aggravate. Following the widely studied
literature on the credit channel of transmission of monetary and financial shocks, we
expect that, in those circumstances, financial constraints will amplify principally for the
small businesses. By and large, the small-sized enterprises are, in fact, the ones suffering
the most severe asymmetry of information vis-à-vis lenders and, so, the lenders will
naturally tend to place on them overwhelmingly the burden of their crisis-provoked,
selected stiffening in credit supply.
In this paper we studied whether the assistance of Mutual Guarantee Institutions (MGIs)
can offer small businesses a shield against aggravating credit constraints. Specifically, we
asked two questions. First, as previous literature has shown that MGI support may ease
financial constraints for small-sized enterprises in normal times, is that mechanism still
functioning during the harsh times of a systemic crisis? And, second, if so, through which
particular channel does the MGI’s assistance benefit the small businesses? As to the first
question, our results confirm that MGI assistance proved if anything even more important
during the dire straits of the crisis. Regarding the second question, we showed that MGIs
played a signalling role beyond the pure provision of guarantees.

13
Therefore, our empirical evidence suggests that the presence of MGIs constitutes an
important component of the financial system to tame the malfunctioning of credit markets
at the time of systemic crises. Accordingly, since the episodes of instability have by far
intensified within the financially liberalised environment of the recent decades, it appears
desirable for countries to be able deploying MGIs to help the small businesses weather
the negative consequences of those recurrent crises.
Finally, we can envisage two possible directions to be investigated. First, building on the
detailed taxonomy of SME lending provided by Berger and Udell (2006), it would be
interesting to ascertain whether the introduction of MGIs as a lending facilitator between
the bank and the firm could itself provide a new twist to the available lending
technologies. For instance, it might turn out that, thanks to the support of MGIs, even
transactional banks could be able to lend to opaque firms normally thought to fall in the
domain of relational banks. Second, it could be worth investigating whether the presence
of MGIs as ancillary counterparts in SME lending brings about a change in the bank’s
organizational model, possibly favoring convergence across different types of banks. We
leave these questions for future research.
14
References
Andrade, G., and S.N. Kaplan (1998), “How costly is financial (not economic) distress?
Evidence from highly leveraged transactions that became distressed”, Journal of Finance
53, 1443-1495.
Berger, A.N., and G.F. Udell (2006), “A more complete conceptual framework for SME
finance”, Journal of Banking and Finance 30, 2945–2966.
Berlin, M., and L.J. Mester (1998), “On the profitability and cost of relationship lending”,
Journal of Banking and Finance 22, 873-97.
Bongini, P., G. Ferri, and H. Hahm (2000), “Corporate Bankruptcy in Korea: Only the
Strong Survive?”, The Financial Review 35 (4), 31-50.
Boot, A.W.A. (2000), “Relationship Banking: What Do We Know?”, Journal of
Financial Intermediation 9 (1), 7-25.
Columba, F., L. Gambacorta, P.E. Mistrulli, (2010), “Mutual garantee institutions and
small business finance”, Journal of Financial Stability 6, 45-54.
Conigliani, C., G. Ferri, and A. Generale (1997), “The impact of bank-firm relations on
the propagation of monetary policy squeezes: An empirical assessment for Italy”, Banca
Nazionale del Lavoro Quarterly Review 50, 271-99.
Diamond, D.W. (1984), “Financial Intermediation and Delegated Monitoring”, The
Review of Economic Studies 51 (3), 393-414.
Ferri, G., T.S. Kang, and I.J. Kim (2001), “The Value of Relationship Banking During
Financial Crises: Evidence from Korea”, World Bank Policy Research w.p. 2553.
Ferri G., Riggi M.R., Rotondi Z., (2009), “Inside the crisis: the importance of the bank-
firm relationship in harsh times”. In: Bracchi G., Masciandaro D. (eds.), Le banche
italiane tra crisi finanziaria, tutela del risparmio e sviluppo produttivo, XIV Rapporto sul
Sistema Finanziario Italiano della Fondazione Rosselli, EdiBank, Rome.
Fried, J., and P. Howitt (1980), “Credit rationing and implicit contract theory”, Journal of
Money, Credit, and Banking 12 (3), 471-487.
Elsas, R., and J.P. Krahnen (1998), “Is relationship lending special? Evidence from
credit-file data in Germany”, Journal of Banking and Finance 22, 1283-316.
Guiso, L., Sapienza P., Zingales L., (2004), “Does local financial development matter?”
Quarterly Journal of Economics 119, 929-969.
Hayashi F., (2000), Econometrics, Princeton University Press, Princeton.
Herrera A.M, Minetti R., (2007), “Informed finance and technological change: evidence
from credit relationship”, Journal of Financial Economics 83, 223-269.
Honohan, P., (2010), “Partial credit guarantees: principles and practice”, Journal of
Financial Stability 6, 1-9.
Hoshi, T., A. Kashyap e D.S. Scharfstein (1990), “The role of banks in reducing the cost
of financial distress in Japan”, Journal of Financial Economics 27 (1), 67-88.

15
Kawai, M., J. Hashimoto, and S. Izumida (1996), “Japanese firms in financial distress
and main banks: Analyses of interest-rate premia”, Japan and the World Economy 8,
175-94.
Shea J., (1997), “Instrument relevance in multivariate linear models: A simple measure”,
Review of Economics and Statistics 79, 348–352.
Stiglitz, J.E. and A.M. Weiss (1981), “Credit Rationing in Markets with Imperfect
Information”, American Economic Review 71, 393-410.
Stock J.H., Wright J.H., Yogo M., (2002), “A Survey of Weak Instruments and Weak
Identification in Generalized Method of Moments”, in Journal of Business and Economic
Statistics 20, 518-529.
Wooldridge J.M., (2002), Econometric Analysis of Cross Section and Panel Data, The
MIT Press, Cambridge, Mass.
Yamori, N., and A. Murakami (1999), “Does bank relationship have an economic value?
The effect of main bank failure on client firms”, Economics Letters 65, 115-20.

16
Table 1. Variables: definition and source
Variable Definition
Financial Tension Takes value 1 if in December 2008 the firm was using more than 70% of its
line of credit granted by the banking system and subsequently in March
2009 it was using more than 80% (i.e. an increase of more than 10%). It
takes value 0 otherwise
Growth of granted line of
credit
Rate of growth from December 2008 to March 2009 of the total granted
line of credit for the firm for the banking system.
MGI Dummy variable taking value 1 if the line of credit granted to the firm is
backed by a Mutual Guarantees Institution
Rating Log of the firm’s rating, a discrete variable taking value 1 for customers
with the highest probability of default and 14 for those with the lowest
probability of default
Intermediate quality firm Dummy variable taking value 1 if the firm belongs to discrete rating classes
from 10 to 12
Bad quality firm Dummy variable taking value 1 if the firm belongs to discrete rating classes
from 5 to 9
MGI intermediate
quality firms
Interaction between MGI and intermediate quality firm
MGI bad quality firms Interaction between MGI and bad quality firm
Relationship Length with
the Bank
Log of the number of years of the relationship between the firm and the
bank
Share of Short-Term
Loans
Firm’s share of short-term loans over the total (short & long-term) granted
to it by the banking system as of end December 2008
Leverage Log of the ratio of firm’s total used loans from the banking system to firm’s
sales as of end December 2008
Corporation Dummy variable taking value 1 if the firm is a limited liability company; 0
otherwise
Size Log of the firm’s number of employees as of end December 2008
HHI Average value of the Herfindhal Hirschman index of concentration on bank
loans in the province during 1991-1998 period
Growth Rate of growth of the provincial value added during 1991-1998 period
North Dummy variable taking value 1 if the bank branch where the credit
relationship with the firm takes place is located in Northern Italy; 0
otherwise
Agriculture Dummy variable taking value 1 if the firm belongs to the Agriculture
industry; 0 otherwise
Energy Dummy variable taking value 1 if the firm belongs to the Energy industry;
0 otherwise
Manufacturing Dummy variable taking value 1 if the firm belongs to the Manufacturing
industry; 0 otherwise
17
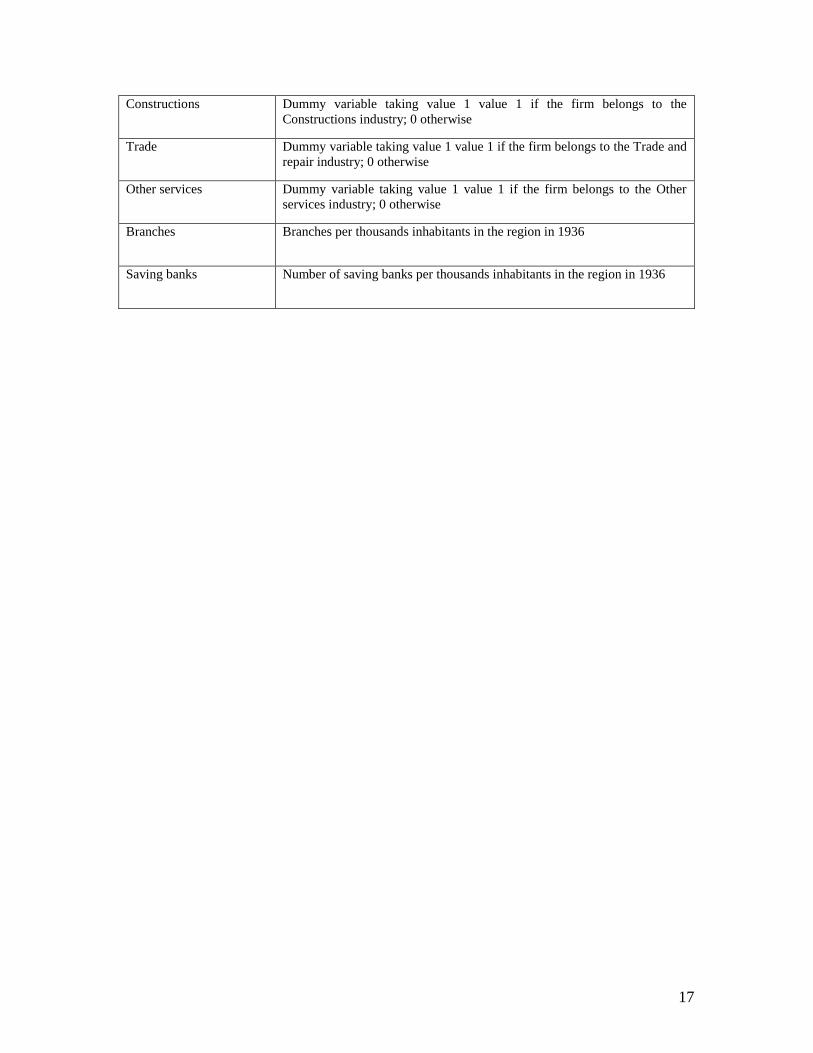
Constructions Dummy variable taking value 1 value 1 if the firm belongs to the
Constructions industry; 0 otherwise
Trade Dummy variable taking value 1 value 1 if the firm belongs to the Trade and
repair industry; 0 otherwise
Other services Dummy variable taking value 1 value 1 if the firm belongs to the Other
services industry; 0 otherwise
Branches Branches per thousands inhabitants in the region in 1936
Saving banks Number of saving banks per thousands inhabitants in the region in 1936

18
Table 2. Summary statistics
Variables Median mean 1st
percentile
99th
percentile
Standard
Deviation
Financial Tension
0.0000 0.0713 0.0000 1.0000 0.2574
Growth of granted line of credit 0.0000 0.4101 -0.3693 7.5882 2.7607
MGI 0.0000 0.1957 0.0000 1.0000 0.3967
Rating 2.3979 2.3262 1.3863 2.6390 0.3338
Relationship Length with the Bank 1.4532 1.3066 -1.4691 3.0598 0.8655
Share of Short Term Loans
0.7760 0.6975 0.0287 1.0000 0.3131
Leverage
-1.1005 -1.1795 -4.7493 1.9445 1.2263
Corporation
0.0000 0.1323 0.0000 1.0000 0.3388
Size
0.0000 0.0773 0.0000 2.7080 0.4355
HHI 0.0644 0.0718 0.0362 0.1963 0.0293
Growth 0.0558 0.0680 -0.1241 0.2702 0.0578
North
1.0000 0.6394 0.0000 1.0000 0.4802

19
Table 3. Correlation matrix
Financial
Tension
Growth of the
granted line of
credit
MGI Rating Relationship
Length with
the Bank
Share of
Short Term
Loans
Leverage Corporation Size HHI Growth North
Financial Tension 1.0000
Growth of the granted
line of credit -0.0002 1.0000
MGI 0.0298 -0.0386 1.0000
Rating -0.1653 -0.0375 -0.0166 1.0000
Relationship Length
with the Bank -0.0273 -0.0181 0.0624 0.02184 1.0000
Share of Short Term
Loans -0.0075 0.0806 -0.1750 -0.0426 0.0043 1.0000
Leverage 0.0730 -0.1644 0.1135 -0.1425 -0.0370 -0.4366 1.0000
Corporation 0.0161 0.0109 0.0066 0.0089 0.0529 -0.0208 0.0306 1.0000
Size -0.0096 -0.0097 -0.0075 0.0238 -0.0020 -0.0144 0.0007 -0.0456 1.0000
HHI 0.0286 -0.0024 0.0094 -0.0788 -0.0425 0.0098 -0.0286 0.0075 -0.0047 1.0000
Growth -0.0137 -0.0042 -0.0233 0.0690 0.0686 0.0073 -0.0152 0.0047 0.0024 -0.1829 1.0000
North -0.0390 -0.0085 0.0815 0.1726 0.1308 -0.0323 0.0482 0.0272 -0.0006 -0.3533 0.2205 1.0000
20
Table 4. Determinants of Financial Tension.
OLS (Eq. 1) Probit (Eq. 2)
MGI 0.017*** 0.137***
0..003 0.018
Rating -0.116*** -0.632***
0.004 0.018
Share of Short Term Loans 0.014*** 0.172***
0.003 0.028
Leverage 0.013*** 0.128***
0.001 0.007
Corporation 0.01*** 0.073***
0.003 0.023
Size -0.002 -0.025
0.002 0.019
HHI 0.114*** 0.781***
0.039 0.266
Growth 0.015 0.068
0.017 0.142
North -0.006** -0.065***
0.002 0.017
Energy 0.007 0.06
0.0.25 0.159
Manufacturing -0.03*** -0.235***
0.009 0.056
Construction -0.013 -0.081
0.009 0.058
Trade -0.004 -0.011
0.009 0.056
Other Services -0.006 -0.026
0.009 0.056
Constant 0.352*** 0.015
0.014 0.075
Observations 66148 66148
F-test, F-statistic 112.49***
Wald Test, 2-statistic 2239.92***
NOTES: The endogenous variable is a dummy with value 1 if the firm experiences a situation of financial
tension in December 2008 which worsens in March 2009, 0 otherwise. For the definition of the
explanatory variables see Table 1. Robust standard errors are reported below coefficients. (*):
coefficient significant at 10 percent; (**): coefficient significant at 5 percent; (***): coefficient
significant at less than 1% confidence level. The table also reports, as goodness-of-fit tests, the F-statistic
for an F-test in the OLS estimation (eq. 1) and the 2-statistic for a Wald test in the Probit estimation (eq.
2).

21
Table 5. Determinants of firms’ participation to a MGI (first stage regression).
OLS (Eq. 3a)
Instrumental variables
Branches 0.063***
0.017
Saving banks 17.271***
0.615
Exogenous variables
Rating -0.052***
0.005
Share of Short Term Loans -0.206***
0.006
Leverage 0.008***
0.001
Corporation 0.005
0.005
Size -0.006*
0.003
HHI 0.643***
0.056
Growth -0.356***
0.033
North 0.073***
0.01714***
Energy 0.06**
0.0.3
Manufacturing 0.115***
0.01
Construction 0.082***
0.01
Trade 0.07***
0.01
Other Services 0.052***
0.01
Constant 0.257***
0.016
Observations 66148
F-statistic 313.88***
F-test of linear restrictions on
instruments 808.23***
NOTES: The endogenous variable is the natural logarithm of the firm’s rating. For the definition of the
explanatory variables see Table 1. Robust standard errors are reported below coefficients. (*):
coefficient significant at 10% confidence level; (**): coefficient significant at 5% confidence level; (***):
coefficient significant at less than 1% confidence level. The table also reports, as goodness-of-fit test, the
F-statistic for an F-test.

22
Table 6. Determinants of Financial Tension.
IV (Eq. 3b) IV-probit
(Eq. 4)
IV-probit
(Eq. 5)
IV-Probit
(Eq. 6)
MGI -0.064*** -0.564***
0.02 0..142
MGI intermediate quality firms -1.759***
0.361
MGI bad quality firms -1.903***
0.415
Rating -0.119*** -0.638*** -0.462*** -1.009***
0.004 0.018 0.056 0.066
Share of Short Term Loans -0.003 0.019 0.035 0.02
0.005 0.042 0.036 0.039
Leverage 0.014*** 0.131*** 0.141*** 0.119***
0.001 0.007 0.006 0.008
Corporation 0.01*** 0.074*** 0.079*** 0.069***
0.003 0.022 0.021 0.021
Size -0.003 -0.031* -0.034** -0.023
0.002 0.019 0.017 0.017
HHI 0.157*** 1.083*** 1.172*** 0.911***
0.042 0.262 0.243 0.243
Growth -0.004 -0.099 -0.117 -0.024
0.018 0.142 0.131 0.129
North 0.001 -0.006 -0.007 0.006
0.003 0.021 0.019 0.021
Energy 0.010 0.091 0.142 0.066
0.025 0.155 0.144 0.143
Manufacturing -0.21** -0.146*** -0.112** -0.136**
0.009 0.056 0.057 0.056
Construction -0.006 -0.021 -0.004 -0.023
0.009 0.057 0.054 0.054
Trade 0.001 0.036 0.054 0.040
0.009 0.055 0.051 0.051
Other Services -0.001 0.011 0.029 0.022
0.009 0.055 0.051 0.052
Constant 0.376*** 0.23*** -0.034 1.199***
0.015 0.085 0.07 0.247
Observations 66148 66148 66148 66148
Wald Test, 2-statistic 1520.70*** 2379.07*** 3539.76*** 2427.10***
Test of excluded instruments, F-statistic 490.54***
Endogeneity test of instrumented
regressor , 2-statistic 16.49*** 22.47*** 19.77*** 20.67***
Overidentification test, Hansen J-statistic 1.98***
NOTES: The endogenous variable is a dummy with value 1 if the firm experiences a situation of financial
tension in December 2008 which worsens in March 2009, 0 otherwise. For the definition of the
explanatory variables see Table 1. Robust standard errors are reported below coefficients. (*):
coefficient significant at 10% confidence level; (**): coefficient significant at 5% confidence level; (***):
coefficient significant at less than 1% confidence level. The table also reports, as goodness-of-fit tests, the
2-statistic for a Wald test. For the other diagnostic tests reported in the table see Section 3.3.

23
Table 7. Marginal Effects of the Determinants of Financial Tension
IV-Probit
(Eq. 4)
IV-Probit
(Eq. 5)
IV-Probit
(Eq. 6)
MGI (i)
-0.059***
0.014
MGI intermediate quality firms (i)
-0.115***
0.023
MGI bad quality firms (i)
-0.108***
0.019
Rating -0.085*** -0.076*** -0.162***
0.003 0.003 0.026
Share of Short Term Loans 0.002 0.006 0.003
0.005 0.005 0.006
Leverage 0.018*** 0.023*** 0.019***
0.001 0.002 0.001
Corporation (i)
0.010*** 0.013*** 0.011***
0.003 0.004 0.004
Size -0.004* -0.006* -0.004
0.002 0.003 0.003
HHI 0.145*** 0.194*** 0.146***
0,036 0.049 0.042
Growth -0.013 -0.0194 -0.004
0,019 0.022 0.021
North (i)
-0.001 -0.001 0.001
0.003 0.003 0.003
Energy (i)
0.013 0.026 0.011
0.024 0.029 0.025
Manufacturing (i)
-0.019*** -0.018** -0.021***
0.007 0.008 0.008
Construction (i)
-0.003 -0.001 -0.003
0.007 0.009 0.008
Trade (i)
0.005 0.009 0.006
0.007 0.009 0.008
Other Services (i)
0.001 0.005 0.003
0.007 0.009 0.008
NOTES: The endogenous variable is a dummy with value 1 if the firm experiences a situation of financial
tension in December 2008 which worsens in March 2009, 0 otherwise. For the definition of the
explanatory variables see Table 1. Robust standard errors are reported below coefficients. (*):
coefficient significant at 10% confidence level; (**): coefficient significant at 5% confidence level; (***):
coefficient significant at less than 1% confidence level. (i) dy/dx is for discrete change of dummy variable from 0 to 1.

24
Table 8. Determinants of financial tension with respect to the relationship length with the bank
IV-Probit
(Eq. 7)
IV-Probit
(Eq. 8)
IV-Probit
(Eq. 9)
Long-term
relationship
(> 4.28 years)
Short-term
relationship
(≤ 4.28 years)
MGI
-0.187 -0.806***
0.207 0.197
Relationship Length with the Bank -0.541***
0.112
Rating -0.289*** -0.643*** -0.646***
0.089 0.028 0.025
Share of Short Term Loans 0.146*** 0.174*** -0.098*
0.025 0.060 0.058
Leverage 0.112*** 0.147*** 0.118***
0.009 0.011 0.009
Corporation 0.136*** 0.091*** 0.056*
0.024 0.031 0.032
Size -0.027 -0.015 -0.043*
0.017 0.028 0.025
HHI 0.939*** 1.292*** 0.746**
0.243 0.420 0.337
Growth 0.326** 0.155 -0.323
0.143 0.200 0.202
North 0.043 -0.016 -0.160
0.026 0.034 0.025
Energy 0.089 -0.128 0.308
0.146 0.240 0.210
Manufacturing -0.174*** -0.276*** -0.048
0.054 0.085 0.077
Construction -0.065 -0.133 0.056
0.053 0.086 0.076
Trade 0.020 -0.044 0.099
0.052 0.082 0.074
Other Services 0.016 -0.075 0.089
0.053 0.081 0.074
Constant -0.023 0.092 0.372***
0.070 0.122 0.124
Observations 66148 33107 33041
Wald Test, 2-statistic 3286.63*** 1077.40*** 1256.89***
Endogeneity test of instrumented
regressor , 2-statistic 17.43*** 2.30 20.16***
NOTES: The endogenous variable is a dummy with value 1 if the firm experiences a situation of financial
tension in December 2008 which worsens in March 2009, 0 otherwise. For the definition of the
explanatory variables see Table 1. Robust standard errors are reported below coefficients. (*):
coefficient significant at 10% confidence level; (**): coefficient significant at 5% confidence level; (***):
coefficient significant at less than 1% confidence level.
25
Table 9. Determinants of the growth of the granted line of credit
OLS (Eq. 10) IV (eq. 11) IV (Eq. 12) IV (Eq. 13) IV (eq. 14) IV (Eq. 15) IV (Eq. 16)
MGI -0.129*** 0.811*** 1.054***
0.0129 0.246 0.247
MGI intermediate quality firms 2.651*** 2.598***
0.831 0.622
MGI bad quality firms 2.834*** 3.706***
0.877 0.903
Rating -0.514*** -0.476*** -0.650*** 0.148
0.333 0.032 0.063 0.196
Intermediate quality firms 0.441*** -0.066 0.395***
0.024 0.121 0.026
Bad quality firms 0.679*** 0.68*** -0.136
0.034 0.034 0.2
Share of Short Term Loans 0.034** 0.233*** 0.195*** 0.225*** 0.186*** 0.173*** 0.209***
0.029 0.056 0.049 0.056 0.056 0.055 0.064
Leverage -0.419*** -0.429*** -0.463*** -0.423*** -0.467*** -0.473*** -0.453***
0.019 0.019 0.025 0.019 0.021 0.021 0.02
Corporation 0.140*** 0.135*** 0.117** 0.134*** 0.138*** 0.129** 0.125**
0.049 0.049 0.052 0.050 0.049 0.05 0.051
Size -0.043** -0.034* -0.025 -0.041** -0.022 -0.023 -0.034*
0.019 0.019 0.020 0.019 0.019 0.019 0.02
HHI -0.715* -1.213*** -1.476*** -1.088*** -1.290*** -1.385*** -1.235***
0.381 0.379 0.412 0.388 0.383 0.394 0.402
Growth -0.343* 0.118 -0.087 -0.210 0.034 -0.055 -0.129
0.181 0.132 0.204 0.191 0.195 0.193 0.191
North 0.051** -0.025 -0.017 -0.040 -0.003 -0.007 -0.032
0.022 0.032 0.031 0.036 0.032 0.033 0.039
Energy -0.552*** -0.595*** -0.679*** -0.568*** -0.594*** -0.664*** -0.573***
0.13 0.133 0.149 0.140 0.135 0.145 0.147
Manufacturing -0.433*** -0.551*** -0.573*** -0.547*** -0.561*** -0.568*** -0.561***
0.109 0.114 0.117 0.115 0.115 0.116 0.116
Construction -0.31*** -0.386*** -0.405*** -0.383*** -0.422*** -0.42*** -0.403***
0.113 0.115 0.117 0.116 0.115 0.116 0.117
Trade -0.512*** -0.574*** -0.603*** -0.585*** -0.591*** -0.596*** -0.61***
0.112 0.115 0.119 0.117 0.115 0.116 0.119
Other Services -0.083 -0.131 -0.157 -0.148 -0.155 -0.154 -0.178
0.112 0.114 0.116 0.115 0.114 0.114 0.117
Constant 1.483 1.200*** 1.584*** -0.243 -0.352*** -0.104 -0.078
0.139 0.147 0.154 0.518 0.125 0.115 0.118
Observations 66148 66148 66148 66148 66148 66148 66148
F.test, F-statistic 49.42***
Wald Test, 2-statistic - 685.91*** 669.21*** 670.91*** 702.59*** 696.90*** 681.16***
Test of excluded instruments, F-statistic - 490.54*** 91.31*** 109.30*** 476.01*** 178.83*** 112.78***
Endogeneity test of instrumented
regressor , 2-statistic - 14.91*** 11.14*** 12.51*** 23.26*** 2080.59*** 21.81***
Overidentification test, Hansen J-statistic - 0.02*** 0.31*** 0.05*** 0.06*** 0.19*** 0.16***
NOTES: The endogenous variable is the rate of growth from December 2008 to March 2009 of the total granted credit line for the
firm for the banking system. For the definition of the explanatory variables see Table 1. Robust standard errors are reported below coefficients. (*): coefficient significant at 10 % confidence level; (**): coefficient significant at 5% confidence level; (***):
coefficient significant at less than 1% confidence level. The table also reports, as goodness-of-fit tests, the F-statistic for an F-test in
the OLS estimation (eq. 7) and the 2-statistic for a Wald test in the IV-Probit estimation (eq. 8 to 13). For the other diagnostic tests reported in the table see Section 3.3.

26
Figure 1. Industry distribution of the sample
Constructions; 13,2%Trade and repair; 26,2%
Other services; 24,7%
Agriculture; 1,7%Energy; 0,2%
Manufacturing; 34,0%
Agriculture Energy Manufacturing Constructions Trade and repair Other services