Scienze e Tecnologie delle Produzioni Agro-Alimentari XXI ...
129
UNIVERSITÀ DEGLI STUDI DI NAPOLI FEDERICO II Tesi di Dottorato di Ricerca in Scienze e Tecnologie delle Produzioni Agro-Alimentari XXI ciclo Resistance to abiotic stress in Rhizobium leguminosarum bv. viciae and Sinorhizobium meliloti 1021 Tutor: PhD Student: Prof. Giancarlo Moschetti Dott. Valeria Ventorino Co-tutor: Prof.ssa Olimpia Pepe Coordinator: Prof. Giancarlo Barbieri
Transcript of Scienze e Tecnologie delle Produzioni Agro-Alimentari XXI ...

UNIVERSITÀ DEGLI STUDI DI NAPOLI FEDERICO II
Tesi di Dottorato di Ricerca in
Scienze e Tecnologie delle Produzioni Agro-Alimentari
XXI ciclo
Resistance to abiotic stress in Rhizobium leguminosarum bv.
viciae and Sinorhizobium meliloti 1021
Tutor: PhD Student:
Prof. Giancarlo Moschetti Dott. Valeria Ventorino
Co-tutor:
Prof.ssa Olimpia Pepe
Coordinator:
Prof. Giancarlo Barbieri

INDEX
INTRODUCTION.......................................................................................................5
1. NITROGEN FIXATION .......................................................................................62. RHIZOBIA-PLANT SYMBIOSIS ........................................................................7
2.1. Rhizobia-plant interaction ...............................................................................72.2. Nodule formation ...........................................................................................9
3. RHIZOBIAL GENES FOR INFECTION AND NODULATION.........................133.1. Production of exopolysaccharides during nodule invasion ............................133.2. Nodulation genes ..........................................................................................143.3. Nitrogen fixing genes ...................................................................................16
4. COMPETITIVENESS AND PERSISTENCE IN THE SOIL ..............................185. REFERENCES ...................................................................................................21
CHAPTER I – EFFECT OF SALINITY STRESS ON STRAIN OF RHIZOBIUM LEGUMINOSARUM BV. VICIAE AND THEIR HOST PLANTS ........................27
I.1. INTRODUCTION ..............................................................................................28I.2. MATERIALS and METHODS .........................................................................33
I.2.1. BACTERIAL STRAINS and GROWTH CONDITIONS ...............................33I.2.2. PLANT NODULATION TESTS ...................................................................33I.2.3. EXPERIMENTAL FIELD .............................................................................34I.2.4. RHIZOBIA ISOLATION ..............................................................................36I.2.5. RAPD FINGERPRINTING ...........................................................................37
I.3. RESULTS ...........................................................................................................38I.3.1. SOIL ..............................................................................................................38I.3.2. YELD ............................................................................................................38I.3.3. SALT TOLERANCE FUNCTION ................................................................40I.3.4. PHENOTYPIC CHARACTERISTICS OF RHIZOBIAL ISOLATES ............40I.3.5. RAPD-PCR ...................................................................................................41
I.4. DISCUSSION .....................................................................................................44I.5. CONCLUSIONS ................................................................................................50I.6. REFERENCES ...................................................................................................51I.7. FIGURES ...........................................................................................................59I.8. TABLES .............................................................................................................65
CHAPTER II – CORRELATION BETWEEN KANAMYCIN RESISTANCE AND “PUTATIVE AMINOGLYCOSIDE 3’-O-PHOSPHOTRANSFERASE” GENE IN SINORHIZOBIUM MELILOTI STRAIN 1021 ......................................70
II.1. INTRODUCTION ............................................................................................71II.1.1. AMINOGLYCOSIDE ANTIBIOTICS .........................................................73II.1.2. SINORHIZOBIUM MELILOTI STRAIN 1021 ..............................................75
II.2. MATERIALS and METHODS ........................................................................78II.2.1. GROWTH MEDIA .......................................................................................78II.2.2. MOLECULAR IDENTIFICATION .............................................................81
II.2.2.1. RFLP-16S rDNA ...................................................................................81II.2.2.2. RAPD-PCR ............................................................................................82II.2.2.3. REA-PFGE ............................................................................................82
II.2.3. PHETOTYPIC CHARACTERIZATION ......................................................83II.2.3.1. METABOLIC FINGERPRINTS ............................................................83II.2.3.2. GROWTH CURVES .............................................................................83II.2.3.3. PLANT NODULATION TESTS ...........................................................84
II.2.4. CORRELATION BETWEEN SMC03094 GENE AND KMR
PHENOTYPE ...............................................................................................84II.2.4.1. RT-PCR OF SMC03094 GENE ..............................................................85II.2.4.2. WESTERN-BLOTTING ........................................................................85II.2.4.3. CLONING of SMC03094 GENE in EXPRESSION VECTOR ...............86
II.2.4.3.1. Preparation of electrocompetent cells of E. coli TOP10 ...................86II.2.4.3.2. Preparation of insert and vector .......................................................87II.2.4.3.3. Ligation ..........................................................................................88II.2.4.3.4. Transformation of E. coli ................................................................88II.2.4.3.5. Plasmid extraction and sequencing ..................................................89
II.2.5. DNA-MICROARRAYS ...............................................................................89II.2.5.1. RNA ISOLATION .................................................................................89II.2.5.2. Sm14KOligo Microarrays ......................................................................89II.2.5.3. HYBRIDIZATION and IMAGE ACQUISITION ..................................90
II.2.6. PROMOTER ACTIVITY of SMC03094 and SMC03095 GENES ...............91II.2.6.1. CONSTRUCTION of PROMOTER PROBE VECTOR pGvig ..............91II.2.6.2. PROMOTER PROBE VECTOR pSRPP18 .............................................92II.2.6.3. PREPARATION of COMPETENT CELLS of E. coli DH5α
and S17-1 ...............................................................................................92II.2.6.4. TRANSFORMATION of COMPETENT CELLS by DNA ....................93

II.2.6.5. CONJUGATION ....................................................................................94II.2.7. FUNCTIONAL ANALYSIS of SMC03094 and SMC03095 GENES ...........94
II.2.7.1. SMC03094 GENE ..................................................................................95II.2.7.2. SMC03095 GENE .................................................................................95II.2.7.3. PLASMID CLONING VECTOR ...........................................................96
II.3. RESULTS .........................................................................................................98II.3.1. MOLECULAR IDENTIFICATION .............................................................98II.3.2. PHENOTYPIC CHARACTERIZATION .....................................................98
II.3.3.1. METABOLIC FINGERPRINTS ............................................................98II.3.3.2. GROWTH CURVES .............................................................................99II.3.3.3. PLANT NODULATION TESTS ...........................................................99
II.3.3. CORRELATION BETWEEN SMC03094 GENE AND KMR
PHENOTYPE .............................................................................................100II.3.3.1. RT-PCR OF SMc03094 GENE ............................................................100II.3.3.2. WESTERN-BLOTTING ......................................................................101II.3.3.3. EXPRESSION of SMC03094 GENE in E. coli .....................................101
II.3.4. TRANSCRIPTIONAL DIFFERENCES in S. meliloti 1021 and GM42 .......102II.3.5. PROMOTER ACTIVITY ..........................................................................103II.3.6. FUNCTIONAL ANALYSIS of SMC03094 and SMC03095 GENES .........105
II.4. DISCUSSION .................................................................................................107II.4.1. PHENOTYPE CHARACTERIZATION of GM42.......................................107II.4.2. KANAMYCIN RESISTANCE DETERMINANTS.....................................108
II.5. REFERENCES ...............................................................................................112II.6. FIGURES ........................................................................................................118II.7. TABLES ..........................................................................................................128

5
- INTRODUCTION -
6
1. NITROGEN FIXATION
Virtually all plants live in intimate association with microorganisms, which can
colonize the surfaces of plants (epiphytic colonization) or occupy spaces within plants
tissues (endophytic colonization). Many types of microbes live in close association with
host plants and benefit from these associations by obtaining carbon and other nutrients
from their hosts.
The rhizosphere (the zone that surrounds the roots of plants) and roots are easily
colonized by microbes (Bolton et al., 1992; Bowen and Rovira, 1999), since sources of
carbon and minerals are very abundant in this zone (Curl and Truelove, 1986; Walker et
al., 2003). Plants exude high levels of nutrients from their roots: low-molecular-weight
root exudates (such as amino acids, organic acids, sugars, aromatiscs and other
secondary metabolite) and high-molecular-weight root exudates (such as
polysaccharides and proteins) (Marschner, 1995). This complex mixture of organic
compounds results in the “rhizosphere effect” (Bolton et al., 1992).
A large variety of bacteria, fungi, protozoa, and nematodes colonize the rhizosphere
(Bolton et al., 1992; Bowen and Rovira, 1999). These organisms may exist as free-
living organisms in the soil or attached to surface of roots.
Soil bacteria belonging to various genera of the order Rhizobiales (collectively called
rhizobia) are able to invade legume roots in nitrogen-limiting environments, leading to
the formation of a highly specialized organ, the root nodule. The -proteobacteria
include various nitrogen-fixing plant symbiont, such as Bradyrhizobium,
Mesorhizobium, Rhizobium, and Sinorhizobium (Ensifer). In the root structures the
bacteria, through the induction of the nitrogenase complex, are able to convert
7
atmospheric dinitrogen into ammonia, which is used by the plant as a nitrogen source,
while the plant supplies the carbon source for the reduction of nitrogen.
2. RHIZOBIA-PLANT SYMBIOSIS
2.1. Rhizobia- plant interaction
Nodule formation is a complex process that requires a continuous and adequate signal
exchange between the plant and the bacteria, of which we only have a fragmentary
knowledge.
The early and essential step in the plant-microbe interactions involves bacterial
chemiotaxis toward plant roots. Rhizobia are attracted by root exudates and colonize the
plant root surface. Specific flavonoid compounds present in the exudates activate the
expression of the bacterial nodulation (nod) genes involved in the synthesis and
secretion of Nod-factors (NF), lipochito-oligosaccharides that are recognized by the
plant. The genes specifically required for interaction with a host plant are carried on the
symbiotic plasmids pSymA and pSymB in Sinorhizobium meliloti (Galibert et al.,
2001), and on a chromosomally located symbiotic island in Bradyrhizobium japonicum
and Mesorhizobium loti (Kaneko et al., 2000; Kaneko et al., 2002).
Nod factors, together with additional microbial signals such as polysaccharides and
secreted protein, allow bacteria attached to root hairs to penetrate the root. For many
rhizobia, primary target sites for infection are young growing root hairs, but there are no
exclusive loci for rhizobial attachment (van Rhijin and Vanderleyden, 1995). Binding of
rhizobia to plant surface is thought to take in two steps (Matthysse and Kijne, 1998).

8
The first one is a weak and reversible binding step that involves same bacterial
polysaccharides (Brencic and Winans, 2005). The second binding step requires the
synthesis of bacterial cellulose, which causes a tight, irreversible binding and formation
of bacterial aggregates on the host surface (Matthysse, 1983; Robertson et al., 1988).
Specific adherence of compatible rhizobia was proposed to be mediated by specific
binding of particular polysaccharide structures present on the bacterial cell surface to
host plant lectins (van Rhijin and Vanderleyden, 1995). The synthesis and release by a
legume host of Nod factors induces developmental changes in the plant (Downie and
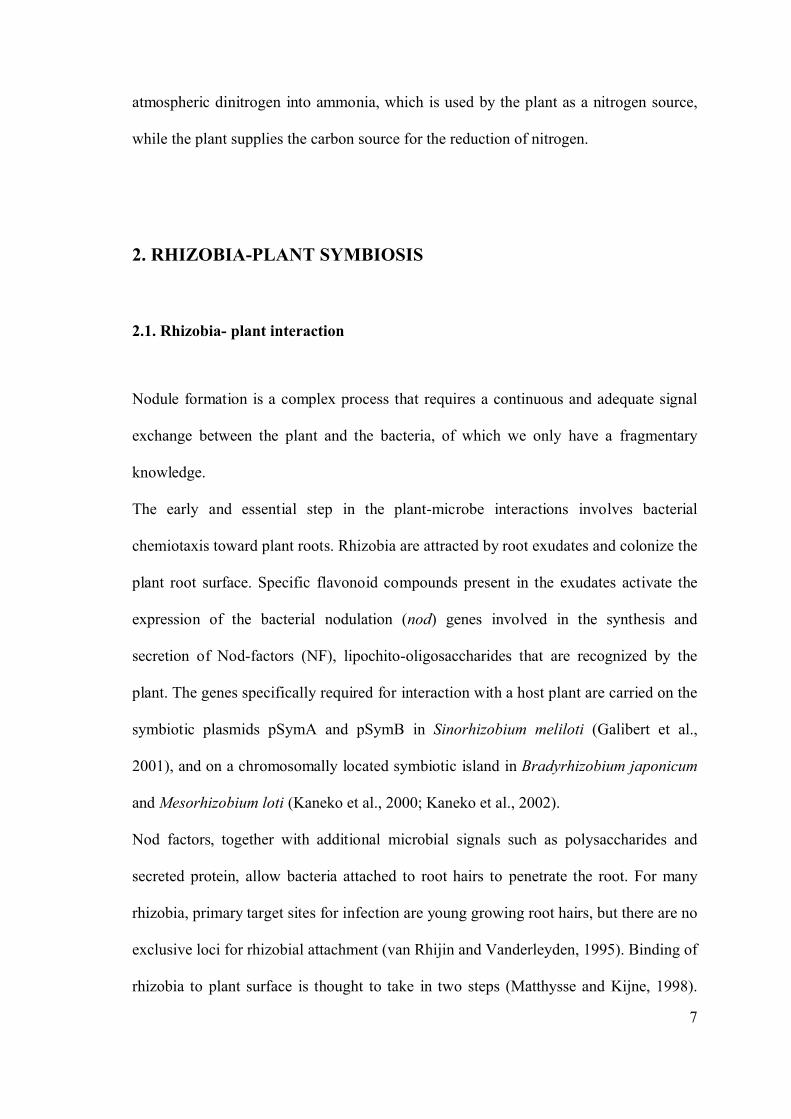
Walker, 1999; Stougaard ,2000; Geurt and Bisseling, 2002). The tip of a root hair, to
which rhizobia are bound, curls back on itself, trapping the bacteria within a pocket of
host cell wall (Fig. 1). After entrapment, a local lesion of the root hair cell wall is
formed by hydrolysis of the cell wall. The plasma membrane invaginates and the host
plant deposits new cell wall material around the lesion forming a tube. The bacteria
proliferate in this zone forming an intracellular-infection thread (Brencic and Winans,
2005). The infection thread grows toward the inner tangential wall of the root hair cell
tip by a process of tip growth (van Rhijin and Vanderleyden, 1995).
Initial NF signalling
a

9
Fig. 1. The initial signalling dialogue between Sinorhizobium meliloti and Medicago truncatula. a, The induction of rhizobial nod genes requires plant flavonoids. The nod gene products produce Nod factor (NF), which is initially perceived by the M. truncatula MtNFP receptor; b, Root hair curling and cortical cell division; c, formation and colonization of curled root hair (CCRH) (Jones et al., 2007).
At the same time with formation of the infection thread, particular cortical cells divide
to form a nodule primordium, and the infection thread grows toward these primordia
(Vasse and Truchet, 1984; Wood and Newcomb, 1989).
2.2. Nodule formation
The sequence of rhizobia-induced cell division and cell invasion varies for different
legumes, and this has important consequences for nodule morphogenesis; in fact
nodules induced by rhizobia can be of two types, determinate and indeterminate.
Root hair curling
b
c

10
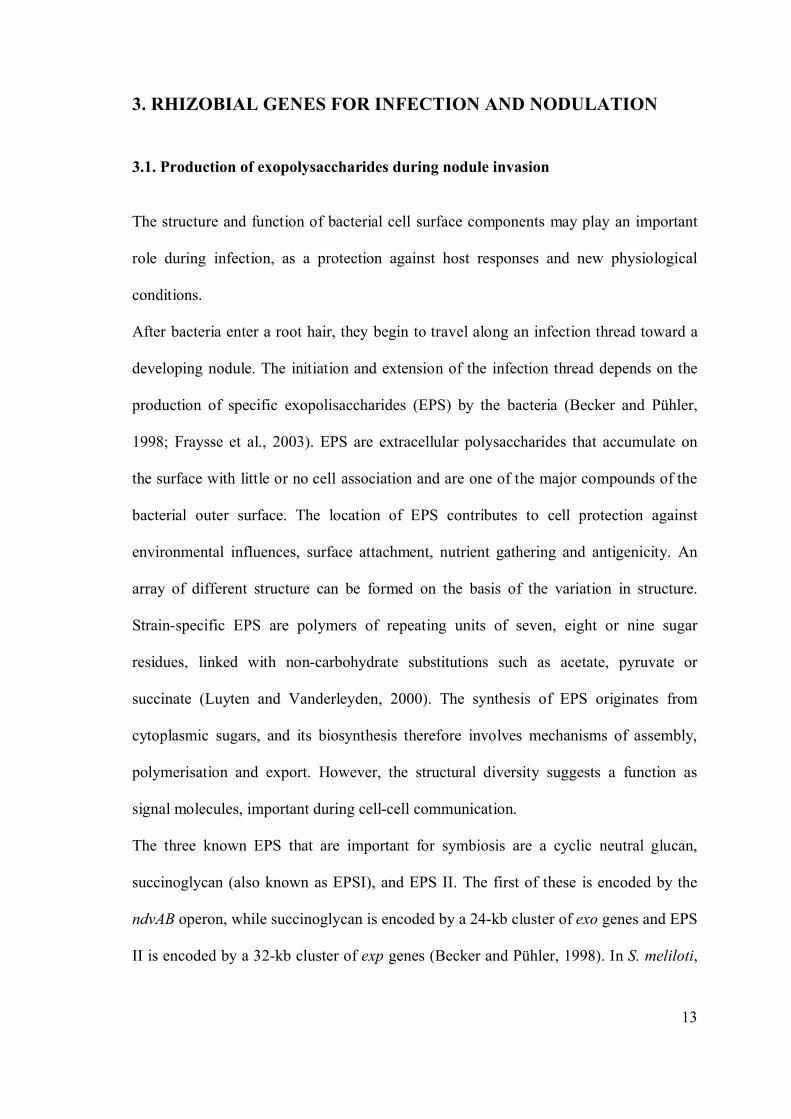
Legumes that form determinate nodules are typically tropical in origin and include
Glycine max (soybean) and Lotus japonicus (Gage, 2004). In these host plants, cortical
cell division occurs just beneath the epidermis. These cells are invaded by rhizobia
before they become meristematic and therefore rhizobia can spread by dividing within
the cytoplasm of host cells, which are, in their turn, dividing. Thus the nodule meristem
involves a mixture of infected and uninfected cells derived from the root cortex,
together with uninfected cells derived from the root pericycle. This form of nodule
development results in the formation of spherical nodules in which meristematic activity
is only a transient. In fact, they are characterized by a persistent meristem in which all
cells in the interior of the nodule proliferate, differentiate and senesce synchronously
(Brewin, 1991) (Fig. 2).
Fig. 2. Scheme of the determinate globose nodule. CS, central stele; VB, vascular bundle; PT, peripheral tissue; BTs, bacteroids; SBs, symbiosomes; SG, starch grain; IC, invaded cell; UC, uninvaded cell (Patriarca et al., 2002).
Medicago sativa (alfalfa), Medicago truncatula, Pisum sativum (pea), Vicia species
(vetches), and Trifolium species (clovers) have historically been used as models for

11
studying the formation of indeterminate nodules (Gage, 2004). Indeterminate nodules
appear elongated because they are characterized by a continuously growing nodule
meristem at the distal end and they have zones of tissue at different stages of
development (Jones et al., 2007). While the meristem is active, rhizobia are released
from the infection threads into the plant cell cytoplasm, where they differentiate into
their endosymbiotic form, the bacteroids. These bacteroids are able to reduce dinitrogen
into ammonia, which is used by the plant. In return, the bacteria are supplied with
carbohydrates in a protected environment. It is possible to distinguish five steps in
bacteroid differentiation (types 1 to 5) in the four different histological zones of the
indeterminate nodule (Vasse et al., 1990; Luyten and Vanderleyden, 2000) (Fig. 3).
Zone I is situated at the apical part of the nodule and contains meristematic tissue
devoid of bacteria.
Zone II is the infection zone. In this zone the bacteria penetrate the root cells via
infection threads. Bacteria released from the infection threads are called type 1
bacteroids. They are cells characterized by a large periplasmic space. Type 1 bacteroids
divide and resemble free-living bacteria by size and cytoplasm content. In the proximal
part of zone II there are type 2 bacteroids. Type 2 bacteroids are eloganted cells; in fact
their periplasmic and peribacteroid spaces are reduced. The bacteroid differentiation
occurrs by stop of the cell division and of the DNA replication, but this one occurs only
after a few rounds of replication, when bacteria are released into the plant cytoplasm.
Therefore, bacteroids have an increased DNA content comparing to the free-living cell.
Interzone II-III is a very restricted zone, containing three to four layers of cells in the
mature nodule. It contains type 3 bacteroids, which stopped elongating and which are
about seven times longer than free-living bacteria. The cells do not fix nitrogen in this

12
zone, but transcription of the nitrogen fixation genes (nif and fix) starts here, since the
nodule parenchyma forms the oxygen diffusion barrier.
Zone III spreads over eight to twelve cell layers. In the distal zone the type 4 bacteroids
(bacteroids fully differentiated) are present. Nitrogen fixation takes place since
leghaemoglobin, capable to bind oxygen molecules, is produced, protecting the
nitrogenase.
In the proximal zone III the last step of bacteroid differentiation occurs. The bacteroids
(type 5) become variable in morphology and stop fixing nitrogen.
Zone IV is the senescence zone and it is located proximal to the point of attachment to
the plant root. Here, both symbiotic partners degrade and the number of bacteroids
gradually decreases. Ghost membranes of plant and bacteroid origin are the ultimate
result of the senescing process.
Fig. 3. Scheme of the indeterminate elongated nodule. BA, bacteria; BTs, bacteroids; SBs, symbiosomes; SG, starch grain; CS, central stele; VB, vascular bundle. The nodule zones (Z) are indicated (Patriarca et al., 2002).
13
3. RHIZOBIAL GENES FOR INFECTION AND NODULATION
3.1. Production of exopolysaccharides during nodule invasion
The structure and function of bacterial cell surface components may play an important
role during infection, as a protection against host responses and new physiological
conditions.
After bacteria enter a root hair, they begin to travel along an infection thread toward a
developing nodule. The initiation and extension of the infection thread depends on the
production of specific exopolisaccharides (EPS) by the bacteria (Becker and Pühler,
1998; Fraysse et al., 2003). EPS are extracellular polysaccharides that accumulate on
the surface with little or no cell association and are one of the major compounds of the
bacterial outer surface. The location of EPS contributes to cell protection against
environmental influences, surface attachment, nutrient gathering and antigenicity. An
array of different structure can be formed on the basis of the variation in structure.
Strain-specific EPS are polymers of repeating units of seven, eight or nine sugar
residues, linked with non-carbohydrate substitutions such as acetate, pyruvate or
succinate (Luyten and Vanderleyden, 2000). The synthesis of EPS originates from
cytoplasmic sugars, and its biosynthesis therefore involves mechanisms of assembly,
polymerisation and export. However, the structural diversity suggests a function as
signal molecules, important during cell-cell communication.
The three known EPS that are important for symbiosis are a cyclic neutral glucan,
succinoglycan (also known as EPSI), and EPS II. The first of these is encoded by the
ndvAB operon, while succinoglycan is encoded by a 24-kb cluster of exo genes and EPS
II is encoded by a 32-kb cluster of exp genes (Becker and Pühler, 1998). In S. meliloti,

14
the last two clusters are located on the large symbiotic plasmid pSymB (Galibert et al.,
2001). EPS and their role in symbiosis have been studied intensively in S. meliloti.
EPS production depends on the concentration of available phosphate, which might be
sensed by the bacteria during the process of nodulation (Mendrygal and Gonzales, 2000;
Zhan et al., 1991). Phosphate concentration is very low in the soil (typically 1 to 10
M) and considerably higher within plant tissues (10 to 20 mM). EPS II is produced
preferentially under low-phosphate conditions, whereas succinoglycan synthesis is
stimulated at high concentrations of phosphate (Mendrygal and Gonzales, 2000). This
suggests that inside the plant, bacteria produce succinoglycan, which is consistent with
the observation that although both EPS can mediate nodule invasion, succinoglycan is
much more efficient in this process (Pellock et al., 2000).
Mutations in exo genes, which abolish the EPSI production, cause severe defects in
symbiosis in S. meliloti (Jones et al., 2007). While, in a different host-symbiont pair,
involving vetch (Vicia sativa) and R. leguminosarum, the structure of the bacterial
exopolysaccharide appears to be less critical for infection thread extention (Laus et al.,
2005).
3.2. Nodulation genes
Nod factors synthesized by bacteria consist of a -1,4-linked N-acetyl-D- glucosamine
backborne with four or five residues. Nod factors are synthesized and exported from the
bacteria by the products of the nod genes (Downie, 1998). The nod genes are expressed
in response to specific polycyclic aromatic compounds called flavonoids, which are
released by plants into the rhizosphere (Brencic and Winans, 2005). Each rhizobial
species possesses specie-specific nod gene; therefore it produces a different set of Nod

15
factors, which play a critical role in host specificity (Downie, 1998; Cullimore et al.,
2001).
The nodABC genes are present in all rhizobia and are essential for the nodulation. In
fact these genes are required for production of the basic Nod factor, since they encode
for the enzymes involved in the synthesis of the chitin oligomer backbone (John et al.,
1993; Geremia et al., 1994; Rohrig et al., 1994). In most species, the nod ABC genes are
part of a single operon. Inactivation of these genes abolishes the ability to elicit any
symbiotic reaction in the plant, including root hair curling, infection thread formation,
cortical cell division, and nodule formation, regardless of the host, the mode of
infection, the type of nodule development and the nodule location (Long, 1989;
Martinez et al., 1990).
NodD gene is expressed constitutively (Mylona et al., 1995). NodD proteins are
members of the LysR family of transcriptional regulators (Schell, 1993). They are
thought to be direct receptors of the plant-released signals and to be flavonoid-
dependent transcriptional activators of nod promoters (Schlaman et al., 1998). Many
species of rhizobia possess more than one copy of the nodD gene, and the properties of
different nodD genes vary within the same strain as well as from one rhizobia species to
another. Some strains possess two to five copies of nodD genes (Fellay et al., 1995;
Schlaman et al., 1998) and may in addition possess one or two copies of another LysR-
type regulator gene called syrM (symbiotic regulator) (Michiels et al., 1993; Swanson et
al., 1993; Hanin et al., 1998). Different NodD proteins may differ in their affinity for
various nod boxes and may also have different flavonoids specificities (Brencic and
Winans, 2005).
Other nodulation genes have been identified, which are not functionally or structurally
conserved among rhizobia. These genes are necessary for the nodulation of a particular

16
host plant. Mostly mutations in these genes result in alteration or extension of the host
range (van Rhijin and Vanderleyden, 1995). nodEF mutants have a delayed nodulation
phenotype and show low number of infection threads in Sinorhizobium meliloti
(Demont et al., 1993) and nodulate white and red clover poorly but they have acquired
the ability to infect and nodulate peas in R. leguminosarum bv. trifolii (Spaink et al.,
1989). In Rhizobium sp. strain NGR234 and in R. tropici CIAT899, mutation of nodS
causes a loss of nodulation in particular host plants (Lewin et al., 1990; Waelkens et al.,
1995). In S. meliloti, nodL mutant have a delayed nodulation phenotype and the overall
production of Nod factors is reduced 5- to 10-fold. Depending on the host tested, nodL
mutants show different symbiotic defects (Luyten and Vanderleyden, 2000). Mutations
in nodIJ result in a delay of nodulation in R. leguminasarum (Enavs and Downie, 1986).
The nodHPQ genes are responsible for the formation of the sulphate group on the
reducing sugar in S. meloliti (Roche et al., 1991).
3.3. Nitrogen fixing genes
In the rhizobium-legume symbiosis, the bacterial partner differentiates into nondividing
endocellular symbionts that, through the induction of nitrogenase complex, convert
atmospheric N2 to NH3/NH4+, which is eventually used by the plant.
Nitrogen fixation is a highly energy-dependent process. Therefore, it is not surprising
that not only the genes encoding for nitrogenase components are crucial for the nitrogen
fixation, but also the genes encoding for electron transport chain proteins, for proteins
of metabolic pathways and for the dicarboxilic acid transporter protein. Nitrogen
fixation is directed by two sets of genes, nif genes and fix genes (Fischer, 1994;
Kaminski et al., 1998).

17
The transcription of the rhizobial genes coding for the nitrogenase complex is
dependent on the nifA gene encoding a regulatory protein, which is expressed under
specific environmental conditions, including low O2 tension (Batut and Boistard, 1994).
nifHDK genes encode structural proteins of the nitrogenase enzyme, nifENB genes
encode enzymes involved in biosynthesis of the nitrogenase Fe-Mo cofactor and nifSWX
genes encode proteins of unknown functions that are required for full nitrogenase
activity (Brencic and Winans, 2005).
The fix genes represent a very heterogeneous class including genes involved in the
development and metabolism of bacteroids. The fix L, fixJ and fixK genes encode
regulatory proteins. The fix L, fixJ genes belong to a family of prokaryotic two-
component signal transduction system and they are responsible for the oxygen
regulation in S. meliloti (Agron and Helinski, 1995). FixL, the sensor, activates FixJ by
phosphorylation under microaerobic conditions. Phosphorylated FixJ induces the
expression of the regulatory fixK and nifA genes, whose products regulate transcription
of the most nitrogen fixation genes (Luyten and Vanderleyden, 2000). Mutations in
fixLJ result in bacteroids that are impaired in their development once they reach the type
II bacteroid stage (Vasse et al., 1990).
The fixABCX genes might code for an electron transport chain to nitrogenase. Mutations
in any one of the fixABCX genes of S. meliloti, B. japonicum, and A. caulinodans
completely abolish nitrogen fixation. All four fixGHIS gene products are predicted to be
transmembrane proteins, but further biochemical analysis is required to define their
function in rhizobial nitrogen fixation (Fischer, 1994). The fixNOQP genes encode the
membrane-bound cytochrome oxidase that is required for respiration of the rhizobia in
low-oxygen environments (Delgado et al., 1998; Preising et al., 1996).

18
4. COMPETITIVENESS AND PERSISTENCE IN THE SOIL
A large variety of bacteria, fungi, protozoa, and nematodes colonize the rhizosphere.
Plant root exudates contain a great variety of different compounds, and nearly 5% to
21% of all photosynthetically fixed carbon can be transferred to the rhizosphere through
the root exudates (Walker et al., 2003). Microbes compete for the utilization of the
abundant, organic compounds released by the plant upon growth and for mineral
elements (Mirlerau et al., 2000). Therefore, in field conditions, the ability to transport
and catabolize the compounds represented in the root exudates is crucial for the survival
and competitiveness of bacteria in the plant rhizosphere.
Bacteria have evolved a wide variety of metabolic strategies to cope with varied
environments. Some are specialists and only able to survive in restricted environments;
others are generalists and able to cope with diverse environmental conditions. Rhizobia
can survive and compete for nutrients in the soil and the plant rhizosphere but can also
form a beneficial symbiosis with legumes in a highly specialized plant cell environment.
Different strains and species of rhizobia exhibit different catabolic capacity, this might
be important in their adaptation to survival in the rhizospheres of different groups of
host and non-host plants.
The metabolic diversity of rhizobia is reflected in their large, complex genome, which
range in size from 6.5 Mb (R. etli; www.cifn.unam.mx/retlidb/), 6.7 Mb (S. meliloti;
Galibert et al., 2001) and 7.6 Mb (M. loti; Kaneko et al., 2000) to 7.8 Mb (R.
leguminosarum; www.sanger.ac.uk/Projects/R_leguminosarum/) and 9.1Mb (B.
japonicum; Kaneko et al., 2002). Many genes are involved to transport, regulation and a
wide range of catabolic systems (Boussau et al., 2004). For example, rhizobia have
approximatively 170 ATP-binding cassette (ABC) transport systems (compared with 47

19
in Escherichia coli), which enable rhizobia to access a far greater range of nutrients
present at low concentrations in soil and the plant rhizosphere (Prell and Poole, 2006).
Abiotic factors, such as temperature, osmotic pressure, UV light, and pH, and the
relevant variation of these factors also play a role in the selection and activity of
microbes in soils or at the plant surface (Savka et al., 2002). Some rhizobial strains,
which are integral to legume production, seem more tolerant to abiotic stress than their
host plants; under stress conditions, root-associated beneficial bacteria can help improve
plant growth and nutrition. An example, in saline soils, organic matter application or
inoculation of crops with tolerant symbiotic strains of Rhizobium may improve plant
nutrition, increasing their stress tolerance (Rao, 1998). The aim of inoculation is to
provide sufficient numbers of viable effective rhizobia to induce a rapid colonization of
the rhizosphere so that nodulation will take place as soon as possible after germination
and produce optimum yields (Catroux et al., 2001).
The microorganisms living at the plant surface are well adapted to the biological and
physico-chemical constraints of the environment (Parke, 1991; Savka et al., 2002).
Hence, they are poorly accessible to displacement by the introduced microbe.
Several possibilities exist to improve the competitiveness of an introduced
microorganism of interest in the plant environment. One may promote its multiplication
in the plant environment, impede growth of competing microorganisms, or interfere
with some of the signals perceived by the microbes, provided these signals control (at
least in part) the expression of functions central to microbial fitness. Since this
environment is a triple interface (bacteria, plant, and soil), it is theoretically possible to
modify one, two, or three of these parameters to improve microbial colonization.
Bacteria in the rhizosphere compete via production of and resistance to antibacterial
compounds that can originate both from plant root system and from other soil organisms

20
(Savka et al., 2002). For example, the toxin mimosine, produced by the tree legume
Leucaena, provides a nodulation competition advantage to mimosine-degrading
Rhizobium strains (Soedarjo et al., 1994). Moreover, the production of the peptide
antibiotic trifolitoxin (TFX) by Rhizobium leguminozarum bv. trifolii results in an
increased nodule occupancy at least 20% higher than the non-producing strains in field
grown plants 2 years after inoculation (Robleto et al., 1998).

21
5. REFERENCES
Agron, P.G., Helinski, D.R., 1995. Symbiotic expression of Rhizobium meliloti nitrogen
fixation genes is regulated by oxygen,. In Two-component signal transduction, Hoch
J.A. and Silhavy T.J. (ed.), ASM Press, Washington, D.C. p. 275-287.
Batut, J., Boistard, P., 1994. Oxygen control in Rhizobium. Antonie Van Leeuwenhoek
66, 129 -150.
Becker, A., Pühler, A., 1998. Production of exopolysaccharides. In The Rhizobiaceae.
Spaink, H.P., Kondorosi,A., Hooykaas, P.J.J. (ed.), Kluwer Academic Publishers,
Dordrecht, The Netherlands, p. 97-118.
Bolton, H., Fredrikson, J.K., Elliot, L.E., 1992. Microbial ecology of the rhizosphere. In
Soil microbial ecology, F.B. Metting Jr. (ed.), Marcel Dekker, Inc., New York, N.Y.,
p. 27-63.
Boussau, B., Karlberg, E.O., Frank, A.C., Legault, B.A., Andersson, S.G., 2004.
Computational inferences of scenarios for -proteobacterial genome evolution. Proc.
Natl. Acad. Sci. USA 101, 9722-9727.
Bowen, G.D., Rovira, A.D., 1999. The rhizosphere and its management to improve
plant growth. Adv. Agron. 66, 1-102.
Brencic, A., Winans, S.C., 2005. Detection of and response to signals involved in host-
microbe interactions by plant-associated bacteria. Microbiol. Mol. Biol. Rev. 69,
155-194.
Brewin, N.J., 1991. Development of the legume root nodule. Ann. Rev. Cell Biol. 7,
191-226.
Catroux, G., Hartmann, A., Revellin, C., 2001. Trends in rhizobial inoculant production
and use. Plant Soil 230, 21-30.
Cullimore, J.V., Ranjeva, R., Bono J.J., 2001. Perception of lipochitooligosaccharidic
Nod factors in legumes. Trends Plant Sci. 6, 24-30.
Curl, E.A., Truelove, B., 1986. The rhizosphere. Springer-Verlag, New York, N.Y.
Delgado, M.J., Bedmar, E.J., Downie, J.A., 1998. Genes involved in the formation and
assembly of rhizobial cytochromes and their role in symbiotic nitrogen fixation. Adv.
Microb. Physiol. 40, 191-231.

22
Demont, N., Debelle, F., Aurelle, H., Denarie, J., Prome, J.C., 1993. Role of the
Rhizobium meliloti nodF and nodE genes in the biosynthesis of lipo-oligosaccharidic
nodulation factors. J. Biol. Chem. 268, 20134-20142.
Downie, J.A., 1998. Function of rhizobial nodulation genes. In The Rhizobiaceae.
Spaink, H.P., Kondorosi,A., Hooykaas, P.J.J. (ed.), Kluwer Academic Publishers,
Dordrecht, The Netherlands.
Downie, J.A., Walker, S.A., 1999. Plant responses to nodulation factors. Curr. Opin.
Plant Biol. 2, 483-489.
Evans, I.J., Downie, J.A., 1986. The NodI product of Rhizobium leguminosarum is
closely related to ATP-binding bacterial transport proteins: nucleotide sequence of
the nodI and nodJ genes. Gene 43, 95-101.
Fellay, R., Perret, X., Viprey, V., Broughton, W.J., Brenner, S., 1995. Organization of
host-inducible transcripts on the symbiotic plasmid of Rhizobium sp NGR234. Mol.
Microbiol. 16, 657-667.
Fischer, H.M., 1994. Genetic regulation of nitrogen fixation in rhizobia. Microbiol.
Rev. 58, 352-286.
Fraysse, N., Couderc, F., Poinsot, V., 2003. Surface polysaccharide involvement in
establishing the rhizobium-legume symbiosis. Eur. J. Biochem. 270, 1365-1380.
Gage, D.J., 2004. Infection and invasion of roots by symbiotic, nitrogen-fixing rhizobia
during nodulation of temperate legumes. Microbiol. Mol. Biol. Rev. 68, 280-300.
Galibert, F., Finan, T.M., Long, S.R., Pühler, A., Abola, P., Ampe, F., Barloy-Hubler,
F., Barnett, M.J., Becker, A., Boistard, P., Bothe, G., Boutry, M., Bowser,
L., Buhrmester, J., Cadieu, E., Capela, D., Chain, P., Cowie, A., Davis, R.W.,
Dreano, S., Federspiel, N.A., Fisher, R.F., Gloux, S., Godrie, T., Goffeau,
A., Golding, B., Gouzy, J., Gurjal, M., Hernandez-Lucas, I., Hong, A., Huizar, L.,
Hyman, R.W., Jones, T., Kahn, D., Kahn, M.L., Kalman, S., Keating, D.H., Kiss,
E., Komp, C., Lelaure, V., Masuy, D., Palm, C., Peck, M.C., Pohl, T.M., Portetelle,
D., Purnelle, B., Ramsperger, U., Surzycki, R., Thebault, P., Vandenbol, M.,
Vorhölter, F.J., Weidner, S., Wells, D.H., Wong, K., Yeh, K.C., Batut J., 2001. The
composite genome of the legume symbiont Sinorhizobium meliloti. Science 293,
668-672.

23
Geremia, R.A., Mergaert, P., Geelen, D., Van Montagu, M., Holsters, M., 1994. The
NodC protein of Azorhizobium caulinodans in an N- acetylglucosaminyltransferase.
Proc. Natl. Acad. Sci. USA 91, 2669-2673.
Geurts, R., Bisseling, T., 2002. Rhizobium Nod factor perception and signalling. Plant
Cell 14(Suppl.), S239-S249.
Hanin, M., Jabbouri, S., Broughton, W.J., Fellay, R., 1998. SyrM1 of Rhizobium sp.
NGR234 activates transcription of symbiotic loci and controls the level of sulfated
Nod factors. Mol. Plant-Microbe Interact. 11, 343-350.
John, M., Rohrig, H., Schmidt, J., Wieneke, U., Schell, J., 1993. Rhizobium NodB
protein involved in nodulation signal synthesis is a chitooligosaccharide deacetylase.
Proc. Natl. Acad. Sci. USA 90, 625-629.
Jones, K.M., Kobayashi, H., Davies, B.W., Taga, M.E., Walzer, G.C., 2007. How
rhizobial symbionts invade plants: the Sinorhizobium-Medicago model. Nat. Rev.
Microbiol. 5, 619-633.
Kaminski, P.A., Batut, J., Boistard, P., 1998. A survey of symbiotic nitrogen fixation by
rhizobia. In The Rhizobiaceae. Spaink, H.P., Kondorosi,A., Hooykaas, P.J.J. (ed.),
Kluwer Academic Publishers, Dordrecht, The Netherlands, p. 431-460.
Kaneko, T., Nakamura, Y., Sato, S., Asamizu, E., Kato, T., Sasamoto, S., Watanabe, A.,
Idesawa, K., Ishikawa, A., Kawashima, K., Rimura, T., Kishida, Y., Kiyokawa, C.,
Kohara, M., Matsumoto, M., Matsuno, A., Mochizuki, Y., Nakayama, S., Nakazaki,
N., Shimpo, S., Sugimoto, M., Takeuchi, C., Yamada, M., Tabata, S., 2000.
Complete genome structure of the nitrogen-fixing symbiotic bacterium
Mesorhizobium loti. DNA Res. 7, 331-338.
Kaneko, T., Nakamura, Y., Sato, S., Minamisawa, K., Uchiumi, T., Sasamoto, S.,
Watanabe, A., Idesawa, Iriguchi, M., Kawashima, K., Kohara, M., Matsumoto, M.,
Shimpo, S., Tsuruoka, H., Wada, T., Yamada, M., Tabata, S., 2002. Complete
genome sequence of the nitrogen-fixing symbiotic bacterium Bradyrhizobium
japonicum USDA110. DNA Res. 9, 189-197.
Laus, M.C., van Brussel, A.A., Kijne, J.W., 2005. Exopolysaccharide structure is not a
determinant of host-plant specificity in nodulation of Vicia sativa roots. Mol. Plant
Microbe Interact. 18, 1123-1129.
Lewin, A., Cervantès, E., Wong, C.H., Broughton, W.J., 1990. nodSU, two new nod
genes of the broad host-range Rhizobium strain NGR234 encode host-specific

24
nodulation of the tropical tree Leucaena leucocephala. Mol. Plant-Microbe Interact.
3, 317-326.
Long, S.R., 1989. Rhizobium-legume nodulation: life together in the underground. Cell
56, 203-214.
Luyten, E., Vanderleyden, J., 2000. Survey of genes identified in Sinorhizobium meliloti
spp., necessary for the development of an efficient symbiosis. Eur. J. Soil Biol. 36, 1-
26.
Marschner, H., 1995. Mineral nutrition of higher plants, 2nd ed. Academic Press, Ltd.,
London, United Kingdom.
Martinez, E., Romero, D., Palacios, R., 1990. The Rhizobium genome. Crit. Rev. Plant
Sci. 9, 59-93.
Matthysse, A.G., 1983. Role of bacterial cellulose fibrils in Agrobacterium tumefaciens
infection. J. Bacteriol. 154, 906-915.
Matthysse, A.G., Kijne, J.W., 1998. Attachment of Rhizobiaceae to plant cells. The
Rhizobiaceae, H.P. Spaink, A. Kondorosi, and P.J.J. Hooykaas (ed.), Kluwer
Academic Publishers, Dordrecht, The Netherlands , p. 235-249.
Mendrygal, K.E., Gonzales, J.E., 2000. Environmental regulation of exopolysaccharide
production in Sinorhizobium meliloti. J. Bacteriol. 182, 599-606.
Michiels, J., De Wilde, P., Vanderleyden, J., 1993. Sequence of the Rhizobium
leguminosarum biovar phaseoli syrM gene. Nucleic Acids Res. 21, 3893.
Mirleau, P., Delorme, S., Philippot, L., Meyer, J.M., Mazurier, S., Lemanceau P., 2000.
Fitness in soil and rhizosphere of Pseudomonas fluorescens C7R12 compared with a
C7R12 mutant affected in pyoverdine synthesis and uptake. FEMS Microbiol. Ecol.
34, 35-44.
Mylona, P., Pawlowski, K., Bisseling, T., 1995. Symbiotic Nitrogen Fixation. Plant Cell
7, 869-885.
Parke, J.L., 1991. Root colonization by indigenous and introduced microorganisms. In
The Rhizosphere and Plant Growth. D.L. Keister and P.B. Cregan (ed.), Kluwer
Academic Publishers, Dordrecht, The Netherlands, p. 33-42.
Pellock, B.J., Cheng, H.P., Walker, G.C., 2000. Alfalfa root nodule invasion efficiency
is dependent on Sinorhizobium meliloti polysaccharides. J. Bacteriol. 182, 4310-
4318.

25
Prell, J., Poole, P., 2006. Metabolic changes of rhizobia in legume nodules. Trends
Microbiol. 14, 161-168.
Rao, D.L.N., 1998. In: Microbial Interactions in Agriculture and Forestry, vol. 1.
Subbarao, N.S., Dommergues, V.R., ed. Oxford and IBH Publishing, New Delhi, p.
219-238.
Robertson, J.L., Holliday, T., Matthysse, A.G., 1988. Mapping of Agrobacterium
tumefaciens chromosomal genes affecting cellulose synthesis and bacterial
attachment to host cells. J. Bacteriol. 170, 1408-1411.
Robleto, E.A., Kmiecik, K., Oplinger, E.S., Nienhuis, J., Triplett, E.W., 1998.
Trifolitoxin production increases nodulation competitiveness of Rhizobium etli CE3
under agricultural conditions. Appl. Environ. Microbiol. 64, 2630-2633.
Roche, P., Debelle, F., Maillet, F., Lerouge, P., Faucher, C., Truchet, G., Denarie, J.,
Prome, J.C., 1991. Molecular basis of symbiotic host specificity in Rhizobium
meliloti: nodH and nodPQ genes encode the sulfation of lipo-oligosaccharide signals.
Cell 67, 1131-1143.
Rohrig, H., Schmidt, J., Wieneke, U., Kondorosi, E., Barlier, I., Schell, J., John, M.,
1994. Biosynthesis of lipooligosaccharide nodulation factors: Rhizobium NodA
protein is involved in N-acylation of the chitooligosaccharide backbone. Proc. Natl.
Acad. Sci. USA 91, 3122-3126.
Preisig, O., Zufferey, R., Thony-Meyer, L., Appleby, C.A., Hennecke, H., 1996. A
high-affinity cbb3-type cytochrome oxidase terminates the symbiosis-specific
respiratory chain of Bradyrhizobium japonicum. J. Bacteriol. 178, 1532-1538.
Savka, M.A., Dessaux, Y., Oger, P., Rossbach, S., 2002. Engineering bacterial
competitiveness and persistence in the phytosphere. Mol. Plant-Microbe Interact. 15,
866-874.
Schell, M.A., 1993. Molecular biology of the LysR family of transcriptional regulators.
Ann. Rev. Microbiol. 47, 597-626.
Schlaman, H.R.M., Phillips, D.A., Kondorosi, E., 1998. Genetic organization and
transcriptional regulation of rhizobial nodulation genes. In The Rhizobiaceae.
Spaink, H.P., Kondorosi, A., Hooykaas, P.J.J. (ed.), Kluwer Academic Publishers,
Dordrecht, The Netherlands, p. 361-386.
26
Soedarjo, M., Hemscheidt, T.K., Borthakur, D., 1994. Mimosine, a toxin present in
leguminous trees (Leucaena spp.), induces a mimosine-degrading enzyme activity in
some Rhizobium strains. Appl. Environ. Microbiol. 60, 4268-4272.
Spaink, H. P., Weinman, J., Djordjevic, M.A., Wijfelman, C.A., Okker, J.H.,
Lugtenberg, B.J.J., 1989. Genetic analysis and cellular localization of the Rhizobium
host specificity-determining NodE protein. EMBO J. 8, 2811-2818.
Stougaard, J., 2000. Regulators and regulation of legume root nodule development.
Plant. Physiol. 124, 531-540.
Swanson, J.A., Mulligan, J.T., Long, S.R., 1993. Regulation of syrM and nodD3 in
Rhizobium meliloti. Genetics 134, 435-444.
van Rhijn, P., Vanderleyden, J., 1995. The Rhizobium-plant symbiosis. Microbiol. Rev.
59, 124-142.
Vasse, J., Truchet G., 1984. The Rhizobium-legume symbiosis: observation of root
infection by bright-field microscopy after staining with methylene blue. Planta 161,
487-489.
Vasse, J., de Billy, F., Camut, S., Truchet, G., 1990. Correlation between ultrastructural
differentiation of bacteroids and nitrogen fixation in alfalfa nodules. J. Bacteriol.
172, 4295-4306.
Waelkens, F., Voets, T., Vlassak, K., Vanderleyden, J., van Rhijn, P., 1995. The nodS
gene of Rhizobium tropici strain CIAT899 is necessary for nodulation on Phaseolus
vulgaris and on Leucaena leucocephala. Mol. Plant-Microbe Interact. 8, 147-154.
Walker, T.S., Bais, H.B., Grotewold, E., Vivanco, J.M., 2003. Root exudation and
rhizosphere biology. Plant. Physiol. 132, 44-51.
Wood, S.M., Newcomb, W., 1989. Nodule morphogenesis: the early infection of alfalfa
(Medicago sativa) root hairs by Rhizobium meliloti. Can. J. Bot. 67, 3108-3122.
Zhan, H.J., Lee, C:C., Leigh, J.A., 1991. Induction of the second exopolysaccharide
(EPSb) in Rhizobium meliloti SU47by low phosphate concentrations. J. Bacteriol.
173, 7391-7394.

27
- CHAPTER 1 -
EFFECT OF SALINITY STRESS ON STRAINS OF RHIZOBIUM
LEGUMINOSARUM BV. VICIAE AND THEIR HOST PLANTS

28
I.1. INTRODUCTION
One of most severe and widespread problems facing the agricultural industry is the
degradation of soil quality due to desiccation and salinity. Soil salinization is increasing
steadily in many parts of the world and causes major problems for the productivity of
agricultural crops (Rao and Sharma, 1995). Nearly 40% of the world’s land surface can
be categorized as having potential salinity problems (Zahran, 1999).
In coastal regions of Mediterranean areas, summer crops are often irrigated with saline
water. As a consequence, if the rainfall is not sufficient to remove them from the root-
zone, salts accumulate along the soil profile. The consequences of soil salification on
soil physical fertility are well documented. The saturation level of sodium is considered
the main cause of clay dispersion and degradation of the aggregate stability (Varallyay,
1977; Tedeschi and Dell’Aquila, 2005), with the consequent reduction in permeability,
porosity and hydraulic conductivity of soils (Frenkel et al., 1978; Amézketa, 1999).
These harsh environmental conditions can have a dramatic impact on the soil bacteria
(Fierer et al., 2003; Griffiths et al., 2003) and their impact on the endogenous group of
proteobacteria, the rhizobia, is of particular importance for agricultural industry. The
importance of nitrogen fixation for agriculture cannot be understated and is illustrated
by the numerous studies of the impact of soil management on rhizobial populations in
arid regions (Howieson and Ballard, 2004), as well as the isolation and characterization
of desiccation- and salt-resistant strains (Chen et al., 2000; Yan et al., 2000; Jenkins,
2003). Furthermore, to enhance nodulation and nitrogen fixation efficiency, techniques
that allow close contact between the bacteria and the host seed have been developed.
Several studies showed the effects of cover crop incorporation in sodic soil
reclaimation, because they allowed soil physical characteristics to be improved,

29
including water infiltration (Cassman and Rains, 1986), aggregation and porosity
(Macrae and Mehuys, 1985) and reductions in soil crust formation (Mitchell et al.,
2000).
Leguminous cover crop, thanks to biological nitrogen fixation (BNF) and organic N
input, may also reduce the seasonal fertilizer-N requirement (Shennan, 1992), and
satisfy the nitrogen uptake of horticultural crops (de Luca et al., 2006).
Unfortunately the legume crops are known as very sensitive to saline conditions (Katerji
et al., 1992) most likely because, besides the effects of salinity on soil water potential
and soil physical properties, there is an additional effect of soil salinity on symbiotic N-
fixation and thus on N uptake of the plant (Bernstein e Ogata, 1966; Katerji et al.,
1998). The nitrogen contribution of the soil decreases as salinity increases, because
salinity reduces the mineral nitrogen production by biological activity in the soil
through nitrogen fixation and transformation of organic nitrogen (Van Horn et al.,
2001). This effect could be related to the reduction of porosity and thus of aerobic
conditions of salinized soils.
The legume crops show different salt sensitivity that could be explained by other
experiments that found chickpea very resistant to drought, due to an osmotic adjustment
until to -2 MPa, but more sensitive to saline stress than broadbean and soybean for a
different salt tolerance of the respective rizobia strains (Katerji et al., 2003).
Considering that nodule conductance to O2 diffusion is judged a major factor of the
inhibition of N2 fixation by soil salinity, the different tolerance was associated with
stability in nodule conductance under salinity of the tolerant genotypes (L’taief et al.,
2007).
Information on resistance in the common vetch (Vicia sativa L.) and other vetch species
to salinity are not available (UC SAREP, 2008). Only the salinity resistance of 30 days

30
plantlets of common vetch at seedling stages was evaluated with an experiment in
which this species showed an increase of seedling fresh weight until to 1.35 dS/m and a
decrease at 2.70 dS/m, while dry weight was not affected by salinity (Orak and Ates,
2005).
Legumes are suggested as appropriate crops for the enhancement of bioproductivity of
marginal lands as well; in fact, these plants not only yield nutritious fodder, protein-rich
seeds and fruits, but they also have the advantage of being able to establish symbiotic
association with certain bacterial microsymbionts such as rhizobia and so to enrich soil
nitrogen (Alexander, 1984). Nodulation and nitrogen fixation in legume-Rhizobium
associations are adversely affected by salinity, which can preclude legume
establishment and growth, or reduce crop yield (Mohammad et al., 1991). Some strains
of Rhizobium spp., which are integral to legume production, seem more salt tolerant
than their host plants; under stress conditions, root-associated beneficial bacteria can
help improve plant growth and nutrition. Actually, rhizobial strains differ in their ability
to response to an abiotic stress and they may use distinct mechanisms for osmotic
adaptation when exposed to salt stress. After an osmotic up shift, general metabolism
slows; in fact the genes involved in the tricarboxylic acid cycle, in the uptake of a
carbon source (using mannitol), and in respiratory chains and ribosomal genes are
repressed. Interestingly, 25% of all genes specifically downregulated by NaCl encode
ribosomal proteins (Dominguez-Ferreras et al., 2006; Vriezen et al., 2007).
In stress condition, rhizobia strains can accumulate low-molecular-weight organic
solutes (Miller and Wood, 1996; Zahran, 1999) or change in cell morphology and size,
and modifications in the pattern of extracellular polysaccharides (Lloret et al., 1995;
Lloret et al., 1998; Soussi et al., 2001). Rhizobia accumulate potassium ions (Yap and
Lim, 1983), for which no new protein synthesis is required. This suggests that K+
31
uptake is regulated biochemically and used as a secondary messenger. Nogales et al.
(2002) reported a high-affinity K+ uptake (Kup) system in Rhizobium tropici that has a
homolog in S. meliloti 1021 (SMa1798), while a second, low-affinity Kup system can
be identified (SMc00873), as well as the osmosensitive Kdp system (SMa2329, -2331,
and -2333). BetS is a betaine/proline transporter also involved in the early response to
osmotic stress. As with K+ uptake activity, BetS is regulated biochemically (Pocard et
al., 1997). Moreover, under growth-limiting conditions, C sources accumulate in the
form of glycogen, which may assist in restoring cell volume after osmotic shock (Han et
al., 2005), but accumulation of glycogen may also be a response to prevent starvation
(Dominguez-Ferreras et al., 2006). After these initial reactions, stressed cells
accumulate compatible solutes, which include carbohydrates, disaccharides such as
sucrose and trehalose (Breedveld et al., 1993; Gouffi et al., 1999), maltose, cellobiose,
turanose, gentiobiose, palatinose (Gouffi et al., 1999), and amino acids, among which
mainly glutamate and proline (Hua et al., 1982; Botsford, 1984; Botsford and Lewis,
1990; Ruberg et al., 2003; Dominguez-Ferreras et al., 2006). Finally, osmotically
stressed cells alter macromolecular structures, including long-chain exopolysaccharides
(EPS) (Breedveld et al., 1991; Cheng and Walker, 1998; Lloret et al., 1998) and
lipopolysaccharides (LPS) (Lloret et al., 1995; Bhattacharya and Das, 2003; Campbell
et al., 2003).
In saline soils, organic matter application or inoculation of crops with tolerant symbiotic
strains of Rhizobium may improve plant nutrition, increasing their stress tolerance (Rao,
1998); actually it is widely recognized that indigenous rhizobia play an important role in
the dominance of Fabaceae in poor and arid soils (Zahran, 1999). The aim of
inoculation is to provide sufficient numbers of viable effective rhizobia to induce a
rapid colonization of the rhizosphere, so that nodulation will take place as soon as

32
possible after germination and produce optimum yields (Catroux et al., 2001). The
legume seed is commonly inoculated with peat cultures or liquid inoculant before
planting (Deaker et al., 2004).
Laboratory studies showed that salinity reduces nitrogen fixation, but no data are
available for the salinity effect on nitrogen fixation for crops grown during a full season
under field conditions (Cordovilla et al., 1994; Cordovilla et al., 1999).
In this study we evaluated, in open field, the effect of increasing soil salinity on the
most interesting legume cover crops for the mediterranean area, broad bean and
common vetch (Guiducci et al., 2004), inoculated with salt-tolerant and salt-sensitive
strains of Rhizobium leguminosarum biovar viciae (R. leg. bv. viciae) showing a high
symbiotic potential. The two rhizobia strains were evaluated for their ability to compete
in soil containing a naturalised population of rhizobia and their potential use in
sustainable agriculture projects, since biological nitrogen fixation (BNF) and his
ecological role is an important process in plant nutrition.

33
I.2. MATERIALS and METHODS
I.2.1. BACTERIAL STRAINS and GROWTH CONDITIONS
Salt-tolerant strain Rhizobium leguminosarum biovar viciae (R. leg. bv. viciae) SAAN1
(able to grow up to 2% (w/v) NaCl) and salt-sensitive strain Rhizobium leguminosarum
biovar viciae (R. leg. bv. viciae) POHY2B1 (able to grow up to 0.1% (w/v) NaCl),
previously isolated in Campania region (Southern Italy) (Moschetti et al., 2005), were
used for inoculation on seeds in artificial salt soils.
The strains were grown on yeast mannitol (YM) medium (10g/L mannitol, 0.4 g/L yeast
extract, 0.5 g/L K2HPO4, 0.2 g/L MgSO4, 0.1 g/L NaCl, pH 6.8-7.0, Vincent, 1970) at
28 °C for 5 days with rotary shaking at 150 rpm. Strain cultures were harvested at the
late exponential phase of growth. Routine plating on YM agar supplemented with congo
red (Graham, 1969) were performed to confirm the purity.
I. 2.2. PLANT NODULATION TESTS
The strains were evaluated for their symbiotic potential with broad bean (Vicia faba L.
var. major Harz., cv. ‘Dulce’) and vetch (Vicia sativa L). Inoculation and seed treatment
were performed as previously reported (Moschetti et al., 2005). The plants were
cultured in a growth chamber under a constant temperature of 21 °C and 12 h d-1
photoperiod and watered with nitrogen-free nutrient solution (Priefer et al., 2001). Forty
days after planted, the effectiveness of the nodules for nitrogen fixation was estimated
from the pink of the nodules and the dark green of the leaves compared to control plants
(without inoculation) (Moschetti et al., 2005). All experiments were performed in
triplicate.

34
I.2.3. EXPERIMENTAL FIELD
In 2004 and 2005, winter experiments were carried out at the University of Naples
experimental farm (latitude 40° 31’ N; longitude 14° 58’ E) on a field that had been
irrigated since 1988 with saline water during the summer (DePascale and Barbieri,
1995). The soil was clay loam with 42% sand, 27% silt, 31% clay, trace amounts of
lime, 1.57% organic matter, 0.09% N, pH of 7.1, and soil water contents at field
capacity and at −1.5MPa of 34.5 and 17.5% (v/v), respectively. The effects of residual
soil salinization were evaluated on broad bean (Vicia faba L. var. major Harz., cv.
‘Dulce’) and vetch (Vicia sativa L.). The irrigated summer crop, which preceded broad
bean and vetch, was tomato. For this crop, the salinization treatments consisted of four
salt concentrations of the irrigation water with ECw of 2.3 (S1), 4.4 (S2), 8.5 (S3) and
15.7 (S4) dSm−1. Saline water was obtained by adding commercial sea salt (Na+ 12.3,
K+ 3.8, Ca2+ 0.02, Mg2+ 0.04, Cl− 14.4, SO42− 0.03 mol kg−1) to the irrigation water
(Na+ 0.53, K+ 0.05, Ca2+ 1.55, Mg2+ 0.84, Cl− 0.38, SO42− 0.15, HCO3− 4.73 mol m−3).
Furthermore, a non-salinized control (NSC, 0.5 dSm−1) was included. In 1988, when we
began a project aimed at evaluating the long-term effect of soil salinization on plant
response to saline irrigation, the salinity treatments and relative controls were arranged
in a randomized block design with three replications. Since the objective of that study
was to investigate long-term effects of salinization, the salinity treatments, randomly
assigned within each block in 1988, had to be reassigned to the same experimental field
plots in the following years. Therefore, since 1988 each 100 m2 experimental plot had
been receiving the same EC irrigation water.
In the 2004-2005 fall/winter, the salt-tolerant strain SAAN1 (I1) and the salt sensitive
strain POHY2B1 (I2) of R. leg. bv. viciae, were inoculated on seeds of broad bean and

35
vetch as above reported. Seeds were coated with liquid inoculants applied at 3.0 ml/kg
of seed (approximately 105 bacteria/seed) or with a physiological solution (Negative
Control, I0) before planting. After 24 h the seeds were sowed on December 7, 2004, in
rows 0.8 m apart to reach 9 seeds m-2 for broad bean and 180 seeds m-2 for vetch. Two
days after sowing, plots were irrigated with cell suspension (in physiological solution)
of SAAN1, POHY2B1 or with physiological solution (Negative Control). To ascertain
the successful of the inoculums, a total of 20 pre-treated seeds were put in greenhouse
chamber and experiment was carried out as above reported.
Plants were harvested at flowering stage on May 11, 2005. Plants were cut at the soil
surface, counted and weighted. Fresh and dry mass (after drying at 60 °C) yield were
recorded.
Samples of plant tissues (dried and ground) were analyzed for organic nitrogen
(Kjeldhal method) and nitrate contents (spectrophotometrically).
Before sowing and later, at 1-month intervals, soil samples were taken in each
individual plot at 0.2 m depth increments along the 0-0.4 m soil profile for electrical
conductivity (ECe) and pH measurements of the saturated-soil extract.
For each treatment, 6 individual soil samples [one per each soil depth (0–0.2 and 0.2–
0.4) per three replications)] were taken monthly (6 months). Organic Nitrogen (Kjeldhal
method), N-NO3 and N-NH4 (HACH DR/2000 spectrophotometer) were also measured
on soil samples upon oven dehydration at 60°C.
Before sowing and after harvesting, soil aggregate stability was determined on soil
samples collected in the 0-0.40 m soil layer. Aggregate stability was determined using
the wet sieve method developed by Kemper and Rosenau (1986) and expressed as the
mean weight diameter of the water-stable aggregates (MWD-WSAs). At the same time,
soil bulk density (BD) was measured on undisturbed soil core collected by using 100

36
cm3 metal cylinder samplers. Soil cores were oven dried at 105°C for 24 hours and
weighed. The total soil porosity (TSP) was estimated from the bulk density data, using
2.65 g cm-3 as soil specific weight: TPS = (2.65-BD/2.65) x 100.
The data were analysed by ANOVA and the means were compared by Duncan’s
Multiple Range Test.
Yield response to salinity was evaluated according to the Maas and Hoffman threshold-
slope model Y = 100−s(ECe −T), where Y is the relative yield (%); s the slope [yield
reduction (%) per unit increase in salinity above T], ECe the time-weighted average
electrical conductivity of the soil saturation extract taken from the root zone (0–0.4 m
soil profile) (dSm−1); T the threshold, i.e. the maximum soil salinity that does not reduce
yield below the one obtained under non-saline conditions (Maas and Hoffman, 1977).
I.2.4. RHIZOBIA ISOLATION
The root nodules were excised randomly from legume crops (two months old) and
rhizobia were isolated from fresh nodules by the “Hotel isolation method” (Vincent,
1970). Single colonies were picked and checked for purity by repeated streaking on YM
agar medium (Vincent, 1970) supplemented with Congo red in order to highlight
possible contaminants (Graham, 1969). All isolates were incubated at 28 °C and kept at
–20 °C in YM broth with 25% (v/v) glycerol until analysis.
All field isolates were streaked on YMA plates supplemented with NaCl at the
concentration of 1%, 2%, 3%, 4% and 5% (w/v) in order to test their salt tolerance in
vitro. The standard YMA medium with 0.1% (w/v) NaCl was used as control. Plates
were incubated at 28 °C for 14d. These tests were carried out in triplicate.

37
I.2.5. RAPD FINGERPRINTING
Total genomic DNA from the isolates and from the 2 inoculated strains was extracted
using Instagene Matrix (BioRad), following the manufacturer’s instructions. RAPD-
PCR was performed in a total volume of 25 µl containing 3 µl (approximatively 20 ng)
of bacterial DNA, 1 buffer (Invitrogen), 3.5 mM l-1 MgCl2, 0.4 mM l-1 of each of the
four dNTPs, 0.6 µM l-1 of primer and 2.5 U Taq polymerase (Invitrogen). The 10-mer
random primers used for genomic strain typing were CC1 (5’-AGC AGC GTG G-3’)
and PRIMM239 (5’-CTG AAG CGG A-3’) (Moschetti et al., 2005), with 70% and 80%
G-C content, respectively. The amplifications were carried out in a PTC-100
thermocycler (M J Research Inc.) and template DNA was denatured for 1 min at 94 °C;
then the PCR was carried out for 40 cycles (1 min at 94 °C, 1 min at 31 °C, 2 min at
72°C, for each cycle). Finally, a 7 min extension period at 72 °C was performed.
Amplified products were resolved on a 2% and 1.5% (w/v) agarose-TBE gel
electrophoresis, respectively. 1 Kb Plus DNA Ladder (Invitrogen) was used as
molecular weight marker.
Bands were automatically detected by using the software Phoretix 1 advanced version
3.01 (Phoretix International Limited, Newcastle upon Tyne, England). The cluster
analysis was performed by the program after band matching; the method described by
Saitou and Nei (1987) was used to obtain the correlation matrix of the RAPD patterns.
For each primer a similarity matrix was created, and finally joined into a single matrix,
in which the respective values from each primer contributed to the mean. The resulting
matrix was used in the average linkage method by the Cluster procedure of Systat 5.2.1
in order to estimate the percentage of similarity (S) in the RAPD fingerprints among
strains.

38
I.3. RESULTS
I.3.1. SOIL
On September 2004, after the harvest of the tomato crop, the ECe in the 0–0.4 m soil
layer ranged between 2.3 (S0) and 9.6 dSm−1 (S4) on the average. The ECe values
decreased throughout the growing season. By the end of the growing season, rainfall
was sufficient to reduce the ECe in the 0–0.4 soil layer to 1.8 and 5.8 dSm−1, in S0 and
S4 respectively (data not shown). After summer, the mean soil pH in the 0-0.4 m soil
layer ranged between 7.1 (S0) and 8.0 (S4) and it was generally higher at increasing
salinity. Soil pH remained rather stable during the growing cycle.
The diameter of water stable aggregates (MWD-WSA) strongly decreased as salinity
increased, showing 39% reduction in S4 as compared to S0 (Table 1). A little increase
(5% on the average) occurred from September to May, thanks to the reduction of soil
salinity due to the leaching rainfalls (Fig. 1).
As a consequence of degradation of structural stability, the bulk density increased (from
1.23 to 1.38) and total porosity decreased (from 54% to 48%) when salinity increased
(Table 2).
Time-weighted average electrical conductivity of the soil saturation extract taken from
the root zone (0–0.4 m soil profile) was not affected by the crop and by the inoculation
treatment (Table 2).
I.3.2. YIELD

39
The residual soil salinity affected both fresh and dry yield of non-irrigated broad bean.
In contrast, the yield of vetch was significantly reduced only in the most salinized plots
(S4).
Soil salinity significantly reduced the total nitrogen concentration in broad bean,
whereas it remained relatively constant in vetch. Consequently, the total nitrogen
(Organic N plus nitrates) accumulated by the crop decreased in broad bean at increasing
soil salinity from 232 kg ha-1 (NSC) to 60 kg ha-1 (S4) (Table 3).
Plant dry matter accumulation was affected by soil salinity in both species. At harvest,
plant survival was not affected by soil ECe. The fresh yield of vetch in S1, S2 and S3
treatments (30.4 t ha−1, on average) was not significantly different from the non-
salinized control treatment (31.0 t ha−1) whereas it was 19% smaller in S4 plants as a
consequence of a reduced weight (Table 3). The dry mass yield of vetch resembled the
pattern observed for the fresh yield: a significant 20% decrease of the dry mass yield
was observed in S4 plants relatively to the non-salinized control (Table 3). In contrast,
the yield of broadbean was remarkably reduced in terms of fresh and dry mass, which
were 67 and 74% smaller, respectively, in S4 compared to NSC plants (Table 3).
Salinity did not affect nitrogen concentration in both species (Table 3). The total
amount of nitrogen accumulated by the plants was lower in broad bean than in vetch
and, in the former, it was inversely correlated with soil salinity (Table 3).
Salinity affected the dry mass of inoculated plots: a significant decrease of the dry mass
yield was observed in S1 plots inoculated with SAAN1 (I1) and POHY2B1 (I2)
reference strains relatively to the non-salinized control (S0) and the non-inoculated
control (I0). By contrast, the dry mass yield of non-inoculated plots (I0) did not
significantly differ at increasing of salinity, remaining relatively constant (Fig. 2)
40
Total N uptake showed a similar trend. In fact, total nitrogen of non-inoculated plots
(I0) was relatively constant at increasing of salinity and it was lower than the one of
inoculated plots (I1 and I2) in non salinized control (S0), while the total N of inoculated
plots (I1 and I2) showed a significant decrease in S1 relatively to the S0 (Fig. 3).
1.3.3. SALT TOLERANCE FUNCTION
Although we do not have sufficient data points in the plateau region of the Maas and
Hoffman relationship to unequivocally assess when the relative yield began to decline,
we estimated a threshold of 1.7 and a relative yield reduction of 16.6% per unit increase
in ECe above the threshold for broad bean (Fig. 4A). The 50% yield reduction (ECe50)
was 3.5 dSm−1. For vetch, the salinity response curve revealed a constant yield at low
and medium soil salinity and a relatively rapid decrease at higher soil salinity levels
(Fig. 4B).
The relative fresh yield (Yr) was correlated with the soil pH, also. Approximately 80%
yield reduction per unit increase in pH above a 7.20 threshold and 119% yield reduction
above a 7.12 threshold were observed for vetch and broad bean, respectively.
I.3.4. PHENOTYPIC CHARACTERISTICS OF RHIZOBIAL ISOLATES
Strains previously isolated in Campania region were evaluated for their potential use as
inoculants on seeds of V. faba and V. sativa in artificial salt soils. Salt-tolerant strain R.
leg. bv. viciae SAAN1 and salt-sensitive strain R. leg. bv. viciae POHY2B1 were used
in this study.
41
Visual observations of nodule formation on the host plant and of plant size and foliage
colour compared to non-inoculated controls after 40 d of growth were used to evaluate
their symbiotic potential with the two leguminous host plants tested. The reference
strains SAAN1 and POHY2B1 showed a high ability to nodulate V. faba and V. sativa
plants in vitro (Table 4).
Moreover, to ascertain the success of the inoculum, a total of 20 pre-treated seeds were
put in greenhouse chamber and the experiment was carried out as above reported.
Visual observations of nodule formation after 40 d of growth were used to evaluate the
success of inoculum of seeds used for field experiment. Both reference strains used in
field inoculation experiments were able to nodulate V. faba and V. sativa plants derived
from seeds coated with rhizobial strains before planting and growth in hydroponic
conditions (Table 5).
Thirty-three rhizobial isolates were purified from root nodules of plants of broad bean
and vetch grown in artificial salt soils (0%, 0.125%, 0.25%, 0.5%, 1% NaCl) (Table 6).
Salt tolerance of isolates was investigated and compared with that of the two control
strains (R. leg. bv. viciae SAAN1 and R. leg. bv. viciae POHY2B1). All isolates were
found to be salt-sensitive because they were able to grown only in standard culture
medium (sodium chloride concentration of 0.1% (w/v)).
1.3.5. RAPD-PCR
RAPD-PCR was used to evaluate the nodule occupancy after seed inoculation of broad
bean and vetch in soils with indigenous rhizobial populations. The degree of similarity
among R. leg. bv. viciae isolates and reference strains was investigated by RAPD-PCR
using CC1 and PRIMM239 primers. The primer CC1 produced 9 RAPD-profiles among

42
the 33 isolates and the 2 reference strains investigated. No rhizobial isolates produced
RAPD profiles similar to the ones exhibited by inoculated strains (SAAN1 and
POHY2B1) (Figg. 5a e 5b). These results were confirmed using primer PRIMM239, but
the amplification patterns obtained with this primer showed a lower degree of
polymorphism than those obtained with primer CC1. In fact, 6 RAPD-profiles were
obtained using primer PRIMM239. Therefore, in order to obtain a result representing
intraspecies relationships among all our isolates and reference strains, we combined
data from RAPD-PCR patterns obtained with the two primers in a single dendrogram
(Fig. 6).
A total of 12 RAPD-genotypes were obtained. Fingerprints similarity varied from 32%
to 100%; patterns could be grouped into two major clusters with a similarity level of at
least 65%. Cluster I (S 69%) grouped four genotypes (B1; B2; B3; C) containing 15
isolates; while, cluster II (S 71%) grouped five genotypes (D1; D2; E1; E2; F)
containing 16 isolates. The isolates included in these clusters were further divided into
closely related subgroups with a similarity level of at least 80%. Cluster I can be
divided into two subgroups: B1, B2 and B3 made up the first subgroup and C the
second subgroup; while cluster II can be divided into three subgroups: D1and D2, E1
and E2, F.
The two inoculated strains SAAN1 (genotype H) and POHY2B1 (genotype G) could
not be included in any cluster. The genotype A, which included two strains isolated
from the same plot, showed a similarity level of 32% with all isolates and reference
strains.
Moreover, two nodules per plant were excised from V. faba and V. sativa coated with
reference strains before planting and growth in hydroponic conditions as control. Total
DNA was extracted and PCR-RAPD was performed in order to check the inoculated

43
strains. All isolates showed a RAPD pattern identical to the two inoculated strains with
both primers used proving the success of inoculum.
44
I.4. DISCUSSION
After recurrent summer irrigations with saline waters, the residual soil salinity affected
yield of non-irrigated Legume winter cover crops. Threshold (1.7 dSm−1) and slope
[16.6% (dSm−1)−1] values, estimated according to Maas and Hoffman (1977), were close
to those found by De Pascale and Barbieri (1997) in similar experimental conditions but
they were lower and higher, respectively, than those reported by other authors for the
same species (Katerji et al., 1992). Consequently, the ECe50 for broad bean was about
60% smaller than the corresponding value of 8.2 dSm−1 reported by Maas and
Hofmann. It is known that environmental and cultural variables may affect plant
response to salinity (Hoffman, 1990; Dalton et al., 2001; Maggio et al., 2002b). In our
experimental conditions, salt-induced permanent modifications of the soil
physicochemical properties may have further aggravated the effects of salinization on
crop yield (Maas, 1990; Maas and Grattan, 1999). The S4 soil presented typical
characteristics of alkaline–saline soil with high sodium adsorption ratio (54.7 in S4
versus 0.14 in NSC), decreased structural index and porosity, low hydraulic
conductivity to water, surface seals, salts build-up along the soil profile and reduced
root zone aeration (De Pascale and Barbieri, 2000). These results indicate that salinity
becomes one component of a more complex scenario, which includes soil pH
modifications, waterlogging and anoxia (Rhoades et al., 1992; De Pascale et al., 2003a,
2003b). All these events may seriously compromise crop growth and yield (Emerman
and Dawson, 1996; Hachicha et al., 2000). Anaerobic conditions, for instance, may
impair ion compartmentation and/or exclusion and consequently they may reduce plant
salt tolerance (West, 1978; West and Taylor, 1984; Shannon and Grieve, 1999).
Increasing soil pH as a result of saline irrigation is normally observed in alkaline soils,

45
where typically the high activity of Na+ ions, relative to those of Ca2+ and Mg2+, affects
the soil chemical properties. Any excess of CO32− or HCO3
−, which is not precipitated
by Ca2+ or Mg2+, will increase the soil pH (Tanji, 1990). This is especially true in soils
with low permeability and high exchangeable cation capacity, such as the one used in
this study. In addition to species-specific pH effects on plant growth, yield reductions
associated with high soil pH may be caused by nutrient imbalance (Page et al., 1990)
and/or reduced soil hydraulic conductivity (Shainberg and Singer, 1990).
In contrast, soil salinity significantly reduced the plant growth and yield only at high
salinity in vetch. The observed differences confirm that species within the same family
may have different tolerance to salt stress (van Hoorn et al., 2001). This difference may
be associated to different water and nutrient uptake in these two species, and/or
alternatively to different nutrient use efficiency. Moreover, from an agronomic
perspective this may have important implications in terms of legume crop selection in
saline environments even under fall winter conditions.
Competition effects between different anions (Bar et al., 1997; Feigin et al., 1987;
Kafkafi et al., 1982) and different cations (Subbarao et al., 1990; Izzo et al., 1991;
Pérez-Alfocea et al., 1996) are known to occur in saline environment and they may
result deleterious for normal plant growth (Grattan and Grieve, 1999). The presence of
excess Cl- in the solution in contact with the roots was inversely correlated to nitrogen
concentration (Gomez et al., 1996; Gunes et al., 1996). Consistently, we found a
decreased N concentration at increasing soil salinity in broad bean. Although under
saline conditions the N content in many glycophytes is severely reduced (Song and
Fujiyama, 1996; Lopez and Satti, 1996), in our experimental conditions the N
concentration in vetch was not significantly affected by salinity, suggesting that vetch
may possess a more efficient N uptake system if compared to broad bean. In addition,
46
the higher efficiency in nitrogen uptake in vetch versus broad bean plants might have
prevented the yield decline in the former (Adams and Ho, 1995).
Overall, in Mediterranean areas exposed to salinization, although rainfall may mitigate
the deleterious effects of salinity on crop yield by leaching the excess of salts from the
root zone, residual salts from the summer irrigations and salt-induced permanent
modifications of the soil physical–chemical properties may affect both yield and
mineral composition of non-irrigated winter cover crops such as broad bean and vetch.
An important problem in microbial ecology concerns the efficacy of rhizobial
inoculants for the formation of nitrogen fixing root nodules on legume crop plants.
Therefore, the present study has been mainly focused on the evaluation of nodulation
competitiveness of salt-tolerant and salt-sensitive rhizobia, showing a high symbiotic
potential, inoculated in artificial salt soils. R. leg. bv. viciae SAAN1 and R. leg. bv.
viciae POHY2B1 strains were evaluated for their ability to compete in soils containing a
naturalised population of rhizobia and their potential use in sustainable agriculture
projects, since biological nitrogen fixation (BNF) and its ecological role is an important
process in plant nutrition.
In our experiments the inoculated rhizobia showed a lesser competitiveness than the
natural rhizobial population. In fact, 100% of nodules contained indigenous rhizobia
strains since no one out of thirty-three rhizobial isolates produced RAPD profiles
similar to the ones exhibited by the reference strains (SAAN1 and POHY2B1). The
success of rhizobial inoculation on plant roots is often limited by several factors,
including environmental conditions, the number of infective cells applied, the
inoculation method and the presence of competing indigenous rhizobia (Bogino et al.,
2008). Selected strains inoculated on legume seeds often fail to occupy a significant
proportion of nodules when an indigenous competitor rhizobial population is

47
established in the soil (Dowling and Broughton, 1986; Triplett and Sadowsky, 1992;
Streeter, 1994; Toro, 1996). In such soils, the better adapted indigenous populations
show a higher level of infectivity than inoculants, resulting in a higher level of
occupancy of the nodules formed (Van Dillewijn et al., 2001). Studies on peanut by
Bogino et al., (2006) inoculated with Bradyrhizobium sp. showed limited response to
new inoculation in fields where peanut was planted in prior years if compared with
inoculation in areas cultivated with peanut for the first time. In the experimental farm
used for this experiment, since ‘80s legume crops had been introduced in crop rotations,
so that inoculation was not necessary for nodulation and N-fixation. Therefore, in our
case, it seems that the inoculant strains were not sufficiently competitive and that the
indigenous rhizobia were already maximally effective.
The presumptive failure of infection of inoculant strains of broad bean and vetch roots
could be due to the inoculation technique used, even though in greenhouse the same
inoculated seeds produced nodules with inside our reference strains.
Rhizobia may be introduced to legumes by inoculation of seed or soil in different
methods and formulations. The selection of one of these methods depends on the seed
size, fragility of cotyledons and convenience. We applied liquid inoculants to seeds and
after two days to soil, so the competition problem could result from a genetic/
physiological advantage of the adapted soil population over the introduced inoculant or
from a positional advantage. In fact, the natural soil population already occupies the soil
profile where the roots will penetrate, while the strains artificially inoculated remain
concentrated around the seeds (López-García et al., 2002).
Moreover, the dry mass and total nitrogen uptake showed a significant increase in S0
plots inoculated with reference strain SAAN1 (I1) and little lower in S0 plots inoculated
with reference strain POHY2B1 (I2) relatively to the non inoculated control (I0); while

48
a significant decrease of the dry mass yield and total N was observed in S1 plots
inoculated with SAAN1 and POHY2B1 relatively to the non-salinized control and the
non-inoculated control. By contrast, dry mass and total N uptake values obtained in
non-inoculated control plots remained relatively constant at increasing of salinity. The
increased values in S0 plots inoculated could be due to the presence in the field of the
reference strains but we were not able to isolate them because we analysed a low
number of root nodules in non-salinized control plots. This hypothesis could be in
according with the results obtained in plant nodulation tests that we made in vitro. In
fact, the reference strain SAAN1 showed higher nodulation efficiency and consequently
higher symbiotic potential in field than the reference strain POHY2B1.
Furthermore, it has been shown that Rhizobium mutants, whose adaptation to high
salinity is affected, have deficiencies in their symbiotic capacity (Nogales et al., 2002).
Nevertheless, response and adaptation to environmental stresses are probably complex
phenomena involving many physiological and biochemical processes that may reflect
changes in gene expression and in the activity of enzymes and transport proteins
(Djordjevic et al., 2003; Wei et al., 2004).
We expected that the new field isolates were salt tolerant strains and were tested for
their tolerance to sodium chloride in vitro. Interestingly, all the isolates were found to
be salt-sensitive because they were able to grown only in standard culture medium
(sodium chloride concentration of 0.1% (w/v)). Therefore, the influence of salt on
survival of rhizobial strains is different in vitro experiment or in soil. A complex
interaction between bacteria, plant and soil structure can determine the survival of
sensitive rhizobial strains and the failure of inoculant resistant rhizobia. In fact, levels of
salinity that inhibit the symbiosis between legumes and rhizobia are different from those
that inhibit the growth of the individual symbionts.

49
These results emphasize the importance of studying the mechanisms of adaptation of
rhizobia to changes in the salinity conditions of their environment.
50
I.5. CONCLUSIONS
Summer irrigations with saline waters damage soil physical fertility, reducing the size
of soil aggregates and total porosity. Legume cover crop incorporation could be
effective in sodic soil reclaimation and in improving nitrogen balance of cropping
systems, but the residual soil salinity could also affect yield of non-irrigated legume
winter cover crops. In this process the legume cover crops, most used for green
manuring in the Mediterranean area, showed a different sensitivity to soil salinity,
broadbean resulting more sensitive than common vetch. Therefore, this last species
resulted more effective for nitrogen supply to cropping systems, allowing a N input
higher than 200 kg ha-1 in the more salinized treatment, whereas broadbean reduced N
input from 215 in the not-salinized treatment to 60 kg ha-1 in the most salinized one.
This different sensitivity to saline soils, besides the effects on soil water potential and
soil physical properties, could be also related to some effects on symbiotic N-fixation.
The failure of the inoculation of the rhizobial strains in the field could be due to their
not sufficient competitiveness compared to the indigenous rhizobia that were already
maximally effective, because since ‘80s legume crops had been introduced in crop
rotations in the experimental farm used for this experiment. Moreover the indigenous
rhizobia analyzed showed high sodium chloride salt sensitivity in vitro; so they were not
really tolerant to sodium chloride and not to able to help improve plant growth and
nutrition in different saline soils.
51
I.6. REFERENCES
Abdul-Wahid, A., Shamshad, A., Iftikar, A., Ejaz, A., 1998. Ameloriation of saline
sodic soils with organic matter and their use for weath growth. Comm. Soil Sci. Plant
Anal. 29, 2307-2318.
Alexander, M., 1984. Ecology of Rhizobium. In: Alexander, M. (Eds.), Biological
Nitrogen Fixation: Ecology, Technology and Physiology. Plenum Press, New York,
pp. 39-50.
Amézketa, E., 1999. Soil aggregate stability: a review. J. Sust. Agric. 14 (2–3), 83–151.
Bhattacharya, L., Das, H.R., 2003. Cell surface characteristics of two halotolerant
strains of Sinorhizobium meliloti. Microbiol. Res. 158, 187-194.
Bernstein, L., Ogata, G., 1966. Effects of salinity on nodulation, nitrogen fixation, and
growth of soybean and alfalfa. Agron. J. 58, 201–203.
Bogino, P., Banchio, E., Rinaudi, L., Cerioni, G., Bonfiglio, C., Giordano, W., 2006.
Peanut (Arachis hypogaea) response to inoculation with Bradyrhizobium sp. In soils
of Argentina. Ann. Appl. Biol. 148, 207-212.
Bogino, P., Banchio, E., Bonfiglio, C., Giordano, W., 2008. Competitiveness of a
Bradyrhizobium sp. strain in soils containing indigenous rhizobia. Curr. Microbiol.
56, 66-72.
Botsford, J.L., 1984. Osmoregulation in Rhizobium meliloti: inhibition of growth by
salts. Arch. Microbiol. 137, 124-127.
Botsford, J.L., Lewis, T.A., 1990. Osmoregulation in Rhizobium meliloti: production of
glutamic acid in response to osmotic stress. Appl. Environ. Microbiol. 56, 488-494.
Breedveld, M.W., Zevenhuizen, L.P.T.M., Zehnder, A.J.B., 1991. Osmotically induced
oligo and polysaccharide synthesis by Rhizobium meliloti SU-47. J. Gen. Microbiol.
136, 2511-2519.
Breedveld, M.W., Dijkema, C., Zevenhuizen, L.P.T.M., Zehnder, A.J.B., 1993.
Response of intracellular carbohydrates to a NaCl shock in Rhizobium
leguminosarum bv. Trifolii TA-1 and Rhizobium meliloti SU-47. J. Gen. Microbiol.
139, 3157-3163.
Breland, T.A., Hansen, S., 1996. Nitrogen mineralization and microbial biomass as
affected by soil compaction. Soil Biol. Biochem. 28, 655-663.

52
Campbell, G.R., Sharypova, L.A., Scheidle, H., Jones, K.M., Niehaus, K., Becker, A.,
Walker, G.C., 2003. Striking complexity of lipopolysaccharide defects in a collection
of Sinorhizobium meliloti mutants. J. Bacteriol. 185, 3853-3862.
Cassman, K.G., Rains, D.W., 1986. A cropping systems approach to salinity
management in California. Amer. J. Alt. Agric. 1, 115-121.
Catroux, G., Hartmann, A., Revellin, C., 2001. Trends in rhizobial inoculant production
and use. Plant Soil 230, 21-30.
Chen, W.M., Lee, T.M., Lan, C.C., Cheng, C.P., 2000. Characterization of halotolerant
rhizobia isolated from root nodules of Canavalia rosea from seaside areas. FEMS
Microbiol. Ecol. 34, 9-16.
Cheng, H.P., Walker, G.C., 1998. Succinoglycan production by Rhizobium meliloti is
regulated through the ExoS-ChvI two-component regulatory system. J. Bacteriol.
180, 20-26.
Cordovilla, M.P., Ligero, F., Lluch, C., 1994. The effect of salinity on N fixation and
assimilation in Vicia faba. J. Exp. Bot., 45, 1483–1488.
Cordovilla, M.P., Ligero, F., Lluch, C., 1999. Effects of NaCl on growth and nitrogen
fixation and assimilation of inoculated and KNO3 fertilized Vicia faba L. and Pisum
sativum L. plants. Plant Science, 140, 127–136.
Deaker, R., Roughley, R.J., Kennedy, I.R., 2004. Legume seed inoculation technology –
a review. Soil Biol. Biochem. 36, 1275-1288.
De Luca S., Fagnano M. and Quaglietta Chiarandà F., 2006. The Effect of Organic
Fertilization on Yield of Tomato Crop in Sele River Plain. Acta Horticolture (ISHS),
700, 103-106.
DePascale, S., Barbieri, G., 1995. Effects of soil salinity from long-term irrigation with
saline-sodic water on yield and quality of winter vegetable crops. Scientia
Horticulturae 64, 145-157.
De Pascale, S., Barbieri, G., 1997. Effect of soil salinity and top removal on growth and
yield of broadbean as green vegetable. Scientia Horticulturae 71, 147-165.
Djordjevic, M.A., Chen, H.C., Natera, S., Van Noorden, G., Menzel, C., Taylor, S.,
Renard, C., Geiger, O., Weiller, G.F., 2003. A global analysis of protein expression
profiles in Sinorhizobium meliloti: discovery of new genes for nodule occupancy and
stress adaptation. Mol. Plant-Microbe Interact. 16, 508-524.
53
Dominguez-Ferreras, A., Perez-Arnedo, R., Becker, A., Olivares, J., Soto, M.J.,
Sanjuan, J., 2006. Transcriptome profiling reveals the importance of plasmid pSymB
for osmoadaptation of Sinorhizobium meliloti. J. Bacteriol. 188, 7617-7625.
Dowling, D.N., Broughton, W.J., 1986. Competition for nodulation of legumes. Annu.
Rev. Microbiol. 40, 131-157.
Fierer, N., Schimel, J.P., Holden, P.A., 2003. Influence of drying-rewetting frequency
on soil bacterial community structure. Microbiol. Ecol. 45, 63-71.
Frenkel, H., Goertzen, J.O., Rhoades, J.D., 1978. Effects of clay type and content
exchangeable sodium percentage, and electrolyte concentration on clay dispersion
and soil hydraulic conductivity. Soil Sci. Soc. Am. 42, 32–39.
Gouffi, K., Pica, N., Pichereau, V., Blanco, C., 1999. Disaccharides as a new class of
nonacumulated osmoprotectants for Sinorhizobium meliloti. Appl. Environ.
Microbiol. 65, 1491-1500.
Graham, P.H., 1969. Selective medium for growth of Rhizobium. Appl. Environ.
Microbiol. 17, 769.
Greenway, H., Munns, R., 1980. Mechanisms of salt tolerance in nonhalophytes. Annu.
Rev. Plant Physiol. 31, 149-190.
Griffiths, R.I., Whiteley, A.S., O’Donnell, A.G., Bailey, M.J., 2003. Physiological and
community responses of established bacterial populations to water stress. Appl.
Environ. Microbiol. 69, 6961-6968.
Guiducci M., Bonciarelli U., Stagnari F., Benincasa P., 2004. Total N supply and profit
from several green manure crops. In Book of Proceedings–Addendum, VIII ESA
Congress: European agriculture in a global context, Copenhagen, Danimarca, 11-15
luglio: 981-982.
Han, Y., Zhou, D., Pang, X., Zhang, L., Song, Y., Tong, Z., Bao, J., Dai, E., Wang, J.,
Guo, Z., Zhai, J., Du, Z., Wang, X., Wang, J., Huang P., Yang, R., 2005.
Comparative transcriptome analysis of Yersina pestis in response to hyperosmotic
and high-salinity stress. Res, Microbiol. 156, 403-415.
Hasegawa, P.M., Bressan, R.A. Zhu, J.K., Bohnert, H.J., 2000. Plant cellular and
molecular responses to high salinity. Annu. Rev. Plant Physiol. Plant Mol. Biol. 51,
463-499.

54
Howieson, J., Ballard, R., 2004. Optimising the legume symbiosis in stressful and
competitive environments within southern Australia-some contemporary thoughts.
Soil Biol. Biochem. 36, 1261-1273.
Hua, S.T., Tsai, V.Y., Lichens, G.M., Noma, A.T., 1982. Accumulation of amino acids
in Rhizobium sp. strain WR1001 in response to sodium chloride salinity. Appl.
Environ. Microbiol. 44, 135-140.
Hussain, N., Hassan, G., Ulla, M.A., Tahir, A.G., Naseem, A.R., Khan ,G.D., 1996.
Bioameloration of sandy clay loam saline sodic soils. In “Drainage in 21th Century:
food production and environment”. Proc. 7th Int. Drainage symposium. 293-300.
Orlando, FL.
Illayas, M., Qureshi, R.H., Quadir, M.A., 1997. Chemical changes in saline-sodic soil
after gypsum application and cropping. Soil Technol. 10, 247-260.
Jenkins, M.B., 2003. Rhizobial and bradyrhizobial symbionts of mesquite from the
Sonoran Desert: salt tolerance, facultative halophily and nitrate respiration. Soil Biol.
Biochem. 35, 1675-1682.
Katerji, N., van Hoorn, J.W., Hamdy, A., Bouzid, N., El-Sayed Mahrous, S., Mastrorilli,
M., 1992. Effect of salinity on water stress, growth and yield of broadbeans. Agric.
Water Manage. 21, 107-117.
Katerji, N., van Hoorn, J.W., Hamdy, A., Mastrorilli, M., Karam., F., 1998. Salinity and
drought, a comparison of their effect on the relationship between yield and
evapotranspiration. Agric. Water Manag. 36, 45-54.
Katerji, N., van Hoorn, J.W., Hamdy, A., Mastrorill,i M., 2003. Salinity effect on crop
development and yield, analysis of salt tolerance according to several classification
methods. Agric. Water Manag. 62, 37-66.
Kemper, W.D., Rosenau, R.C., 1986. Aggregate Stability and Size Distribution. In:
Klute, A. (Eds.). Methods of Soil Analysis, Part 1: Physical and Mineralogical
Methods. No. 9, Agronomy. ASA. SSSA, Madison, WI, pp. 425-442.
Lloret, J., Bolaños, L., Lucas, M.M., Peart, J.M., Brewin, N.J., Bonilla, I., Rivilla, R.,
1995. Ionic stress and osmotic pressure induce different alterations in the
lipopolysaccharide of a Rhizobium meliloti strain. Appl. Environ. Microbiol. 61,
3701-3704.

55
Lloret, J., Wulff, B.B.H., Rubio, J.M., Downie, J.A., Bonilla, I., Rivilla, R., 1998.
Exopolysaccharide II production is regulated by salt in the halotolerant strain
Rhizobium meliloti EFB1. Appl. Environ. Microbiol. 64, 1024-1028.
López-García, S.L., Vázquez, T.E., Favelukes, G., Lodeiro, A.R., 2002. Rhizobial
position as a main determinant in the problem of competition for nodulation in
soybean. Environ. Microbiol. 4, 216-224.
L’taief B., Sifi B., Zaman-Allah M., Drevon J.J., Lachaal M., 2007. Effect of salinity on
root-nodule conductance to the oxygen diffusion in the Cicer arietinum–
Mesorhizobium ciceri symbiosis. J.Plant Physiol., 164, 1028-1036.
Maas, E.V., Hoffman, G.J., 1977. Crop salt tolerance. ASCE J. Irrig. Drain. Div. 103,
115-134.
Macrae, R.J., Mehuys, G.R., 1985. The effect of green manuring on the physical
properties of temperate area soils. In: Advances in Soil Science, vol. 3. Springer, NY,
pp. 71-94.
Miller, K.J., Wood J.M., 1996. Osmoadaptation by rhizosphere bacteria. Annu. Rev.
Microbiol. 50, 101-136.
Mitchell J.P., Shennan C., Singer M.J., Peters D.W., Miller R.O., Prichard T., Grattan
S.R., Rhoades J.D., May D.M., Munk D.S., 2000. Impacts of gypsum and winter
cover crops on soil physical properties and crop productivity when irrigated with
saline water. Agricultural Water Management, 45, 55-71.
Mohammad, R.M., Akhavan-Kharazian, M., Campbell, W.F., Rumbaugh, M.D., 1991.
Identification of salt- and drought-tolerant Rhizobium meliloti L. strains. Plant Soil
134, 271- 276.
More, S.D., 1994. Effect of farm wastes and organic manures on soil properties, nutrient
availability and yield of rice and wheat grown on sodic vertisoil. J. Indian Soc. Soil
Sci. 42, 253-256.
Moschetti, G., Peluso, A.L., Protopapa, A., Anastasio, M., Pepe, O., Defez, R., 2005.
Use of nodulation pattern, stress tolerance, nodC gene amplification, RAPD-PCR
and RFLP-16S rDNA analysis to discriminate genotypes of Rhizobium
leguminosarum biovar viciae, Syst. Appl. Microbiol. 28, 619-631.
Nogales, J., Campos, R., BenAbdelkhalek, H., Olivares, J., Llunch, C., Sanjuan, J.,
2002. Rhizobium tropici genes involved in free-living salt tolerance are required for
56
the establishment of efficient nitrogen-fixing symbiosis with Phaseolus vulgaris.
Mol. Plant-Microbe Interact. 15, 225-232.
Orak A., Ates E., 2005. Resistance to salinity stress and available water levels at the
seedling stage of the common vetch (Vicia sativa L.). Plant Soil Environ. 51, 51–56.
Pocard, J.A., Vincent, N., Boncompagni, E., Smith, L.T., Poggi, M.C., Le Rudulier, D.,
1997. Molecular characterization of the bet genes encoding glycine betaine synthesis
in Sinorhizobium meliloti 102F34. Microbiol. 143, 1369-1379.
Priefer, U.B., Auag, J., Boesten, B., Bouhmouch, I., Defez, R., Filali-Maltouf, A.,
Miklis, M., Moawad, H., Mouhsne, B., prel, J., Schluter, A., Senatore, B., 2001.
Characterization of Phaseolus symbionts isolated from Mediterranean soils and
analysis of genetic factors related to pH tolerance. J. Bacteriol. 91, 223-236.
Rao, D.L.N., Sharma, P.C., 1995. Effectiveness of rhizobial strains for chickpea under
salinity stress and recovery of nodulation on desalinization. Indian J. Exp. Biol. 33,
500-504.
Rao, D.L.N., 1998. In: Microbial Interactions in Agriculture and Forestry, vol. 1.
Subbarao, N.S., Dommergues, V.R. (Eds.) Oxford and IBH Publishing, New Delhi,
pp. 219-238.
Ruberg, S., Tian, Z.X., Krol, E., Linke, B., Meyer, F., Wang, Y.P., Pühler, A., Weidner,
S., Becker, A., 2003. Construction and validation of a Sinorhizobium meliloti whole
genome DNA microarray: genome-wide profiling of osmoadaptive gene expression.
J. Biotechnol. 106, 255-268.
Saitou, N., Nei, M., 1987. The neighbour-joining method: a new method for
reconstructing phylogenetic trees. Mol. Biol. Evol. 4, 406-425.
Sekon, B.S., Baiwa, M.S., 1993. Effect of organic matter and gypsum in controlling soil
sodicity in a rice-wheat-maize system irrigated with saline waters. Agric. Water
Manag. 24, 15-25.
Shennan, C., 1992. Cover crops, nitrogen cycling and soil properties in semi-arid
irrigated vegetable production systems. Hort. Sci. 27, 749-754.
Soussi, M., Santamarìa, M., Ocaña A., Lluch, C., 2001. Effects of salinity on protein
and lipopolysaccharide pattern in a salt-tolerant strain of Mesorhizobium ciceri. J.
Appl. Microbiol. 90, 476-481.
Streeter, J.G., 1994. Failure of inoculant rhizobia to overcome the dominance of
indigenous strains for nodule formation. Can. J. Microbiol. 40, 513-522.
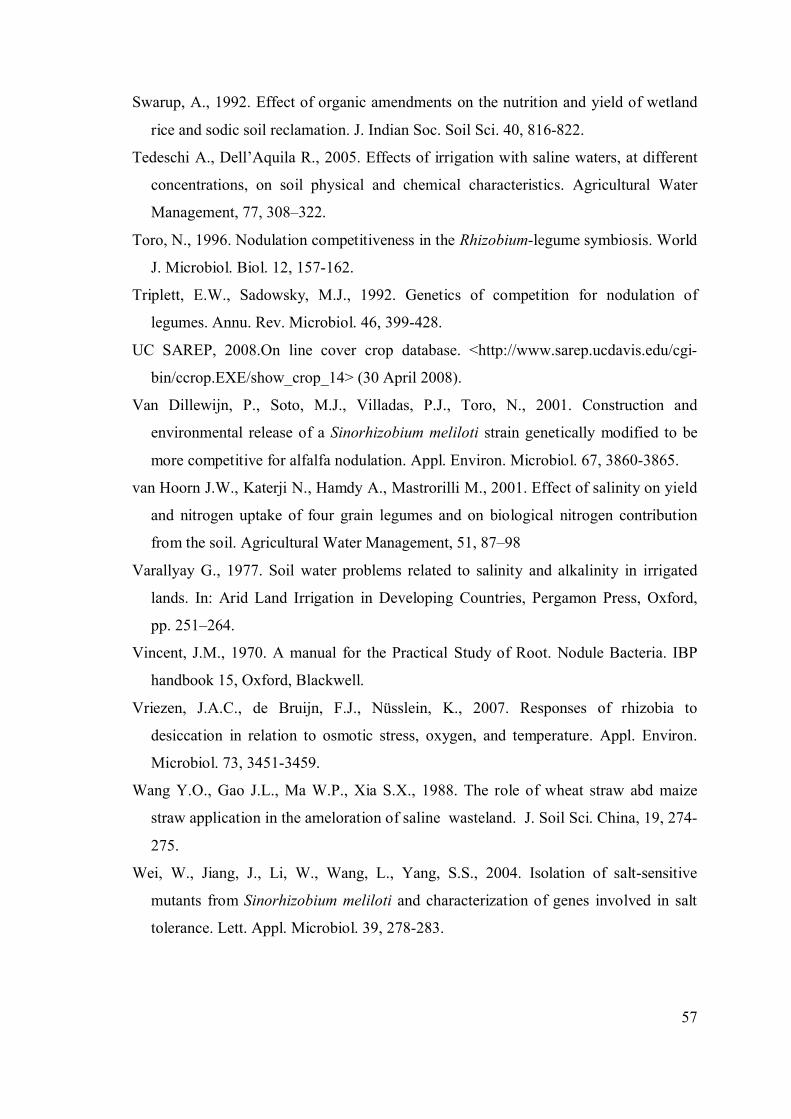
57
Swarup, A., 1992. Effect of organic amendments on the nutrition and yield of wetland
rice and sodic soil reclamation. J. Indian Soc. Soil Sci. 40, 816-822.
Tedeschi A., Dell’Aquila R., 2005. Effects of irrigation with saline waters, at different
concentrations, on soil physical and chemical characteristics. Agricultural Water
Management, 77, 308–322.
Toro, N., 1996. Nodulation competitiveness in the Rhizobium-legume symbiosis. World
J. Microbiol. Biol. 12, 157-162.
Triplett, E.W., Sadowsky, M.J., 1992. Genetics of competition for nodulation of
legumes. Annu. Rev. Microbiol. 46, 399-428.
UC SAREP, 2008.On line cover crop database. <http://www.sarep.ucdavis.edu/cgi-
bin/ccrop.EXE/show_crop_14> (30 April 2008).
Van Dillewijn, P., Soto, M.J., Villadas, P.J., Toro, N., 2001. Construction and
environmental release of a Sinorhizobium meliloti strain genetically modified to be
more competitive for alfalfa nodulation. Appl. Environ. Microbiol. 67, 3860-3865.
van Hoorn J.W., Katerji N., Hamdy A., Mastrorilli M., 2001. Effect of salinity on yield
and nitrogen uptake of four grain legumes and on biological nitrogen contribution
from the soil. Agricultural Water Management, 51, 87–98
Varallyay G., 1977. Soil water problems related to salinity and alkalinity in irrigated
lands. In: Arid Land Irrigation in Developing Countries, Pergamon Press, Oxford,
pp. 251–264.
Vincent, J.M., 1970. A manual for the Practical Study of Root. Nodule Bacteria. IBP
handbook 15, Oxford, Blackwell.
Vriezen, J.A.C., de Bruijn, F.J., Nüsslein, K., 2007. Responses of rhizobia to
desiccation in relation to osmotic stress, oxygen, and temperature. Appl. Environ.
Microbiol. 73, 3451-3459.
Wang Y.O., Gao J.L., Ma W.P., Xia S.X., 1988. The role of wheat straw abd maize
straw application in the ameloration of saline wasteland. J. Soil Sci. China, 19, 274-
275.
Wei, W., Jiang, J., Li, W., Wang, L., Yang, S.S., 2004. Isolation of salt-sensitive
mutants from Sinorhizobium meliloti and characterization of genes involved in salt
tolerance. Lett. Appl. Microbiol. 39, 278-283.

58
Yadvinder-Singh, Bijay-Singh, Timsina J., 2005. Crop residue management for nutrient
cycling and improving soil productivity in rice-based cropping systems in the tropics.
Adv. Agron. 85, 269-408.
Yan, A.M., Wang, E.T., Kan, F.L., Tan, Z.Y., Sui, X.H., Reinhold-Hurek, B., Chen,
W.X., 2000. Sinorhizobium meliloti associated with Medicago sativa and Melilotus
spp. in arid saline soils in Xinjiang, China. Int. J. Syst. Evol. Microbiol. 50, 1887-
1891.
Yap, S.F., Lim, S., 1983. Response of Rhizobium sp. UMKI-20 to sodium-chloride
stress. Arch. Microbiol. 135, 224-228.
Zahran, H.H., 1999. Rhizobium-legume symbiosis and nitrogen fixation under severe
conditions in an arid climate. Microbiol. Mol. Biol. Rev. 63, 968-989.

59
I.7. FIGURES
Figure 1. Mean weight diameter of water stable aggregates (MWD WSAs) at increasing soil salinity (ECe). Each point is the mean of 72 samples±standard errors.
y = -0.101 x + 1.18R2 = 0.931
0,0
0,2
0,4
0,6
0,8
1,0
1,2
0 1 2 3 4 5 6 7
Time-weighted average ECe (dS m-1)
MD
W

60
Figure 2. Dry mass yield at increasing soil salinity in response to the inoculation treatment (Negative I0; SAAN1, I1 and POHY2B1, I2).
Figure 3. Total N uptake at increasing soil salinity in response to the inoculation treatment (Negative I0; SAAN1, I1 and POHY2B1, I2).
0
1
2
3
4
5
6
7
8
0 1 2 3 4 5 6 7
Time-weighted average ECe (dS m-1)
Yie
ld (t
DW
ha-1
)
I0 I1 I2
0
50
100
150
200
250
300
0 1 2 3 4 5 6 7
Time-weighted average ECe (dS m-1)
N u
ptak
e (k
g N
ha-1
)
I0 I1 I2
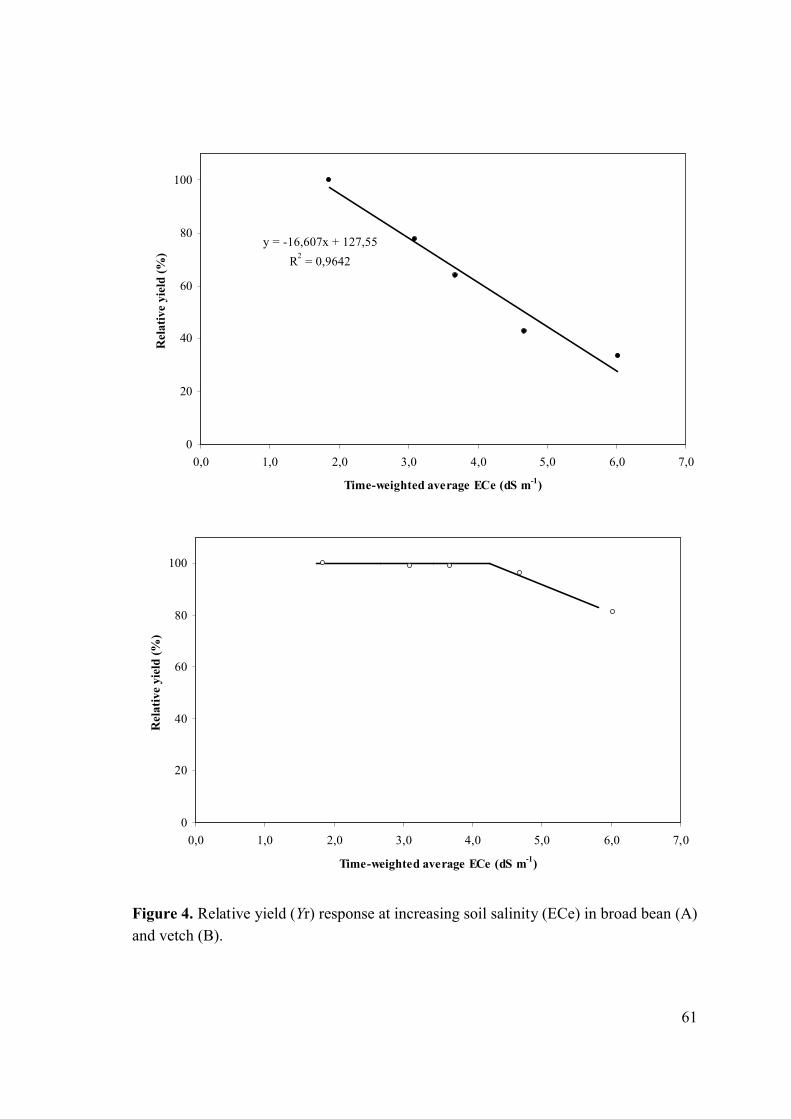
61
Figure 4. Relative yield (Yr) response at increasing soil salinity (ECe) in broad bean (A) and vetch (B).
y = -16,607x + 127,55R2 = 0,9642
0
20
40
60
80
100
0,0 1,0 2,0 3,0 4,0 5,0 6,0 7,0
Time-weighted average ECe (dS m-1)
Rel
ativ
e yi
eld
(%)
0
20
40
60
80
100
0,0 1,0 2,0 3,0 4,0 5,0 6,0 7,0
Time-weighted average ECe (dS m-1)
Rel
ativ
e yi
eld
(%)

62
Figure 5a. Randomly amplified polymorphic DNA patterns generated by primer CC1 of 7 representative Rhizobium isolates and two reference strains of Rh. leg. bv. viciae. Lane a, reference strain SAAN1; lane b, reference strain POHY2B1; lane c, pattern D; lane d, pattern H; lane e, pattern E; lane f, pattern I; lane g, pattern C; lane h, pattern F; Lane I, pattern G. M: 1kb Plus DNA Ladder ( Invitrogen, slr).
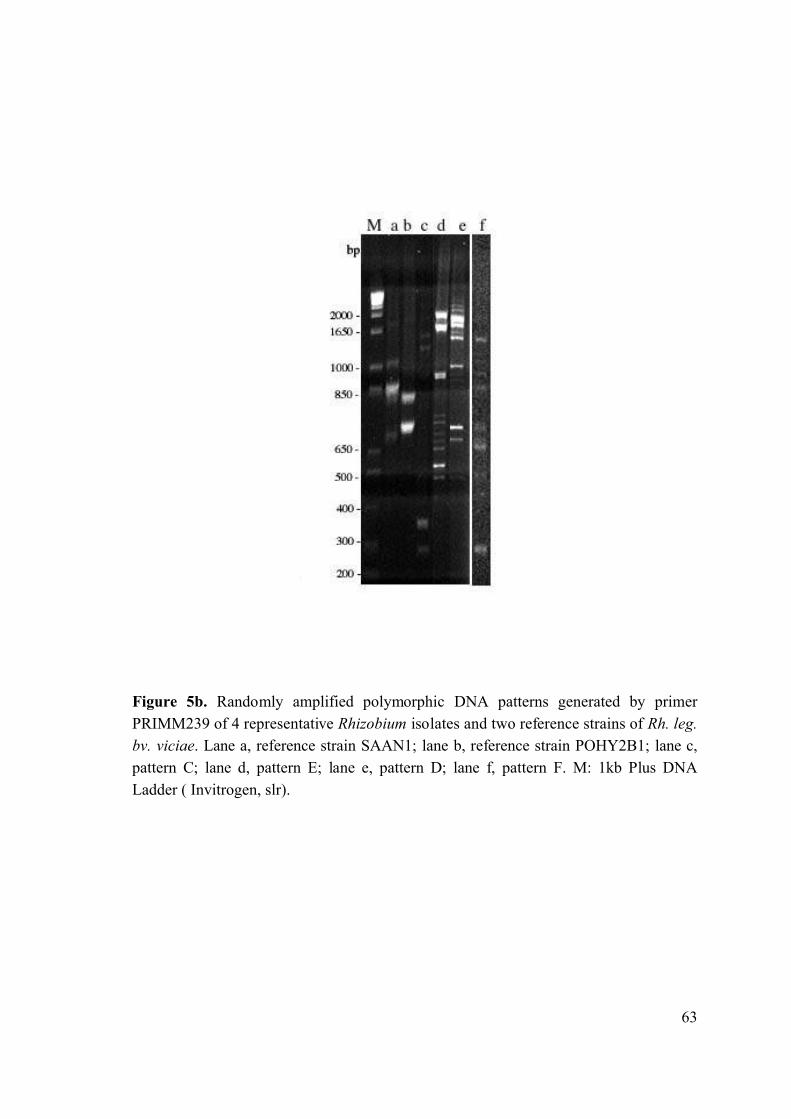
63
Figure 5b. Randomly amplified polymorphic DNA patterns generated by primer PRIMM239 of 4 representative Rhizobium isolates and two reference strains of Rh. leg. bv. viciae. Lane a, reference strain SAAN1; lane b, reference strain POHY2B1; lane c, pattern C; lane d, pattern E; lane e, pattern D; lane f, pattern F. M: 1kb Plus DNA Ladder ( Invitrogen, slr).

64
Figu
re 6
. Den
drog
ram
show
ing
the
degr
ee o
f sim
ilarit
y (%
) of R
APD
fing
erpr
ints
of a
ll is
olat
es in
vest
igat
ed
and
two
refe
renc
e st
rain
s of R
h. le
g. b
v. v
icia
eus
ing
prim
ers C
C1
and
PRIM
M23
9.

65
I.8. TABLES
Table 1. Mean weight diameter of water stable aggregates (MWD-WSAs) at transplanting (September 2004) and at the end of the experiment (May 2005) in the 0-0.4 m soil layer.MWD-WSAs (mm)TimeSeptember 2004 0.79May 2005 0.83*
Soil salinityS0 1.03S1 0.90S2 0.79S3 0.68S4 0.63LSD 0.133
66
Table 2. Time-weighted average ECe and pH, bulk density and total N content in the 0-0.4 m soil layer (ns, *, **, non significant or significant at P < 0.05 or 0.01, respectively
Crop (A) pH ECe Bd NtotdS m-1 t/m-3 ‰
Broad bean 7.36 3.86 1.30 0.99Vetch 7.44 3.58 1.31 0.95
ns ns ns ns
Soil salinity (B)S0 6.80 1.80 1.23 0.98S1 7.20 2.88 1.26 0.98S2 7.32 3.55 1.31 0.98S3 7.63 4.45 1.34 0.97S4 8.05 5.92 1.38 0.96LSD 0.09 0.35 0.02 0.04
Strain (C)I0 7.38 3.57 1.30 0.97I1 7.41 3.78 1.31 0.96I2 7.40 3.82 1.30 0.99
ns ns ns ns
Int. AxB ns ns ns nsInt. BxC ns ns ns nsInt. AxC ns ns ns nsInt. AxBxC ns ns ns ns

67
Table 3. Fresh (FW) and dry mass (DW) yields, plant nitrogen concentration and total nitrogen uptake in broad bean and vetch (ns, *, **, non significant or significant at P < 0.05 or 0.01, respectively; different letters indicate significant differences by Duncan’sMRT at P < 0.05).
FW Dry Matter DW Ntot Ntot CROP (A) t/ha % t/ha % DW kg/haBroad bean 23.2 13.7 3.2 3.7 118.1Vetch 29.5 21.9 6.4 3.7 226.1
* ** ** ns *
Broad bean FW Dry Matter DW Ntot Ntot Soil salinity (B) t/ha % t/ha % DW kg/haS0 36.5 11.6 6.1 3.8 215.0S1 28.3 13.1 3.7 3.8 135.9S2 23.3 13.6 2.7 3.8 100.9S3 15.7 13.7 2.1 3.7 78.7S4 12.2 16.7 1.6 3.5 60.3LSD 6.9 4.4 1.6 0.2 54.8VetchS0 31.0 20.4 6.89 3.96 267.60S1 30.7 22.1 6.74 3.78 249.02S2 30.7 22.3 6.71 3.64 238.59S3 29.9 22.3 6.30 3.60 236.51S4 25.2 22.5 5.57 3.56 203.09
3.5 2.7 1.2 0.3 52.2Strain (C)I0 27,8 17,5 4,9 3,7 182,7I1 25,8 18,2 4,9 3,7 178,6I2 25,5 17,8 4,7 3,7 174,4
ns ns ns ns ns
Int. BxC ns ns * ns *Int. AxBxC ns ns ns ns ns

68
Table 4. Number of nodules per plants (20 plants) obtained after 40 d of growth on hydroponic conditions.Strain Vicia sativa Vicia faba
SAAN1 67.0 11.5 65.7 9.0
POHY2B1 43.3 9.6 47.6 8.5
Table 5. Number of nodules per plants (20 plants) after 40 d of growth on hydroponic conditions obtained from pre-treated seeds.Strain Vicia sativa Vicia faba
SAAN1 65.0 9.5 63.4 8.6
POHY2B1 44.0 9.0 46.5 8.5

69
Table 6. RAPD genotypes obtained using primers CC1 and PRIMM239Strain/isolate
aPlant bNaCl %
Profile CC1
Profile 239
RAPDGenotype
SAAN1 A a HPOHY2B1 B b GR1 V. sativa 1 C c AR2 V. sativa 1 C c AR3 V. sativa 1 D d B2R4 V. faba 0.5 D d B2R5 V. sativa 0.25 D d B2R6 V. faba 0.125 D e D1R7 V. sativa 0 E e D2R8 V. sativa 1 E e D2R9 V. faba 0.5 E e D2R10 V. faba 1 D d B2R11 V. sativa 0.5 F e E1R12 V. faba 0.25 G e E2R13 V. sativa 0.125 E e D2R14 V. faba 1 D e D1R15 V. faba 1 E e D2R16 V. faba 1 D d B2R17 V. faba 1 E e D2R18 V. sativa 0.5 D d B2R19 V. sativa 0.5 H e FR20 V. sativa 0.125 D d B2R21 V. faba 0 E e D2R22 V. faba 1 D d B2R23 V. sativa 1 E e D2R24 V. sativa 1 E e D2R25 V. sativa 1 E e D2R26 V. sativa 1 D d B2R27 V. faba 0.5 D f CR28 V. sativa 0.25 D f CR29 V. faba 0.125 I d B1R30 V. sativa 0 D e D1R31 V. faba 0.5 D d B2R32 V. sativa 1 D d B2R33 V. faba 0.5 E d B3a Plant the nodule was excised fromb Residual salinity percentage in plot
70
- CHAPTER 2 -
CORRELATION BETWEEN KANAMYCIN RESISTANCE AND
“PUTATIVE AMINOGLYCOSIDE 3’-O-
PHOSPHOTRANSFERASE” GENE IN SINORHIZOBIUM
MELILOTI STRAIN 1021

71
II.1. INTRODUCTION
Soil shows a high diversity of bacterial species; it has been estimated that half the
known bacterial genera contain species, which can be considered as soil bacteria.
Soil is a long term sink for the group of potentially toxic elements. While these
elements display a range of properties in soils, including difference in mobility and
bioavailability, leaching losses and plant uptake are usually relatively small when
compared with the total quantities entering soils from different diffuse and agricultural
sources. As a consequence, these potentially toxic elements slowly accumulate in the
soil profile over long periods of time. This could have long term implications for the
quality of agricultural soils, including the maintenance of soil microbial processes,
phytotoxicity at high concentrations, and the transfer of zootoxic elements into the
human diet from increased crop uptake or soil ingestion by grazing.
The development of bacterial resistance to antibiotics is one of the best documented
cases of contemporary biological evolution. The huge consumption of these
compounds, able to inhibit bacterial growth at very low concentration, has resulted in
the emergence and spread of a great amount of antibiotic resistance determinants among
bacterial populations.
Antibiotic resistance is a public health concern of great urgency because of the growing
ineffectiveness of antimicrobial agents in treating infectious diseases. This is mainly
caused by the propagation of antibiotic resistance genes, which is exacerbated by the
overuse of antimicrobials in humans and the intensive use of antibiotics in animal
agriculture (Mollen et al., 2001; Rysz and Alvarez 2004).
The analysis of completed microbial genomes has indicated that horizontal gene transfer
(HGT) continues to be an important factor contributing to the rearrangement of

72
microbial genomes (Beiko et al., 2005; Gogarten and Townsend 2005). HGT driven by
mobile genetic elements, such as plasmids (Frost et al., 2005), insertion sequences
(Mahillon and Chandler 1998), integrons (Nemergut et al., 2004), transposons (Pearson
et al., 1996) and phages (Canchaya et al., 2003), has been shown to provide microbes
with a wide variety of adaptive traits for microbial survival and proliferation (e.g.
antibiotic and heavy metal resistance and diverse metabolic capabilities, including
xenobiotic compound degradation and virulence). While point mutations contribute to
microbial adaptation, horizontal dissemination of genes has proved to be more critical in
promoting rapid genomic flexibility and microbial evolution (Thomas and Nielsen
2005).
The knowledge of the possibility of horizontal gene transfer is necessary, in view of the
possibility of deliberate release of a variety of nonrecombinant microorganisms into the
environment for such agricultural purposes as nitrogen fixation (Rhizobium,
Bradyrhizobium, Sinorhizobium, Mesorhizobium, Frankia), phosphate solubilization
(Burkholderia, Erwinia), plant growth stimulation (Rhizobium, Pseudomonas,
Azospirillium, Agrobacterium), control of phytopathogenic fungi and bacteria
(Pseudomonas, Erwinia), insect control (Bacillus thuringiensis), weed control
(phytopathogenic fungi), bioremediation of xenobiotic polluted sites (Pseudomonas,
Alcaligenes, Burkholderia, Comamonas), and denitrification (Pseudomonas,
Alcaligenes, Comamonas) (Davison, 1988; Wilson and Lindow, 1993; Davison, 1999).
Indeed, data are also needed concerning the persistence, survival, competition, nutrition,
stress, and physiological state of the introduced bacteria (van Veen et al., 1997). For
example, it was shown, under optimized laboratory conditions, that a kanamycin
resistance gene integrated in the DNA of a transgenic plant could transform
Acinetobacter sp. to KmR (Gebhard and Smalla, 1998).

73
II.2. AMINOGLYCOSIDE ANTIBIOTICS
The aminoglycoside/aminoclyclitol antibiotics include many important drugs such as
kanamycin, gentamicin, amikacin, tobramycin, and streptomycin. These antibiotics
constitute a large family of amino-compounds which exhibit broad antibacterial and
antiprotozoal activity. The aminoglycosides target the bacterial ribosome, and in
particular footprint to the 16S rRNA, where they are thought to interfere with
translation, often resulting in incorrect reading of the mRNA, which results in a variety
of downstream effects. Unlike other antibiotics which interfere with bacterial translation
such as tetracycline and chloramphenicol, most aminoglycosides are bactericidal rather
than bacteriostatic. This property makes aminoglycosides highly desirable antiinfective
agents (Wright and Thompson, 1999).
One of the more significant consequences associated with translational errors caused by
many aminoglycosides is membrane damage (Davis et al., 1986). This results in a
breach of membrane integrity and a disruption of ion gradients, which precipitates cell
death. Aminoglycosides that bind to the ribosome but do not bring about mistranslation,
such as hygromycin or spectinomycin, do not result in membrane damage and, as a
consequence, are bacteriostatic (Bakker, 1992).
All aminoglycosides contain a six-membered aminocyclitol ring (a cyclohexane group
to which amino and hydroxyl groups are attached) and carbohydrate moieties, many of
which are aminosugars. Thus aminoglycosides are water soluble, basic in nature, and
generally positively charged at physiological pH. The aminocyclitol ring is generally
derived from glucose-6-phosphate, either through the synthesis of myo-inositol followed
by oxidation and transamination, to give scyllo inosamine in the case of streptamine
containing aminoglycosides e.g. streptomycin, or through 2-deoxyscyllo-inosamine
74
required for the synthesis of 2-deoxystreptamine containing aminoglycosides such as
kanamycin, gentamicin, and neomycin (Piepersberg, 1997; Wright and Thompson,
1999).
Resistance to the aminoglycoside antibiotics can show itself in three manners: 1)
mutations in target ribosomal RNA or proteins, 2) altered uptake of the molecules, or 3)
the expression of resistance enzymes.
Enzymatic resistance reveals itself in two forms: enzymes which modify the target
rRNA, and enzymes which modify the aminoglycosides directly. Modifying enzymes
include acetyl CoAdependent N-acetyltransferases, ATP-dependent O-
adenyltransferases, and ATP-dependent O-phosphoryltransferases. Modified
aminoglycosides lose their capacity to bind ribosomes in such a way which impairs their
biological activity, and thus the cells exhibit a drug-resistance phenotype.
The aminoglycoside phosphotransferases (APH) family of enzymes include several
members which are differentiated on the basis of three criteria: 1) substrate specificity
or resistance phenotype, 2) regiospecificity of phosphoryl transfer, and 3) protein/gene
sequence.
The largest family of APHs includes the enzymes that modify kanamycin and related
compounds at the 3’-hydroxyl group (Fig. I-1).
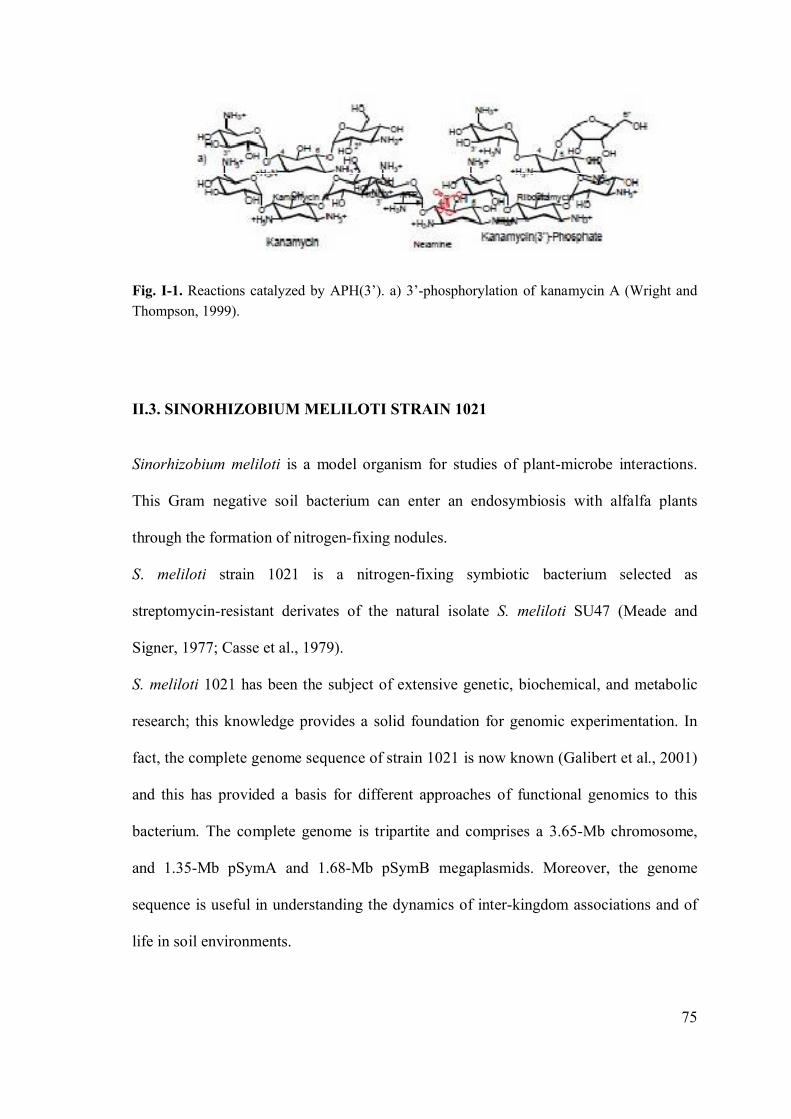
75
Fig. I-1. Reactions catalyzed by APH(3’). a) 3’-phosphorylation of kanamycin A (Wright and Thompson, 1999).
II.3. SINORHIZOBIUM MELILOTI STRAIN 1021
Sinorhizobium meliloti is a model organism for studies of plant-microbe interactions.
This Gram negative soil bacterium can enter an endosymbiosis with alfalfa plants
through the formation of nitrogen-fixing nodules.
S. meliloti strain 1021 is a nitrogen-fixing symbiotic bacterium selected as
streptomycin-resistant derivates of the natural isolate S. meliloti SU47 (Meade and
Signer, 1977; Casse et al., 1979).
S. meliloti 1021 has been the subject of extensive genetic, biochemical, and metabolic
research; this knowledge provides a solid foundation for genomic experimentation. In
fact, the complete genome sequence of strain 1021 is now known (Galibert et al., 2001)
and this has provided a basis for different approaches of functional genomics to this
bacterium. The complete genome is tripartite and comprises a 3.65-Mb chromosome,
and 1.35-Mb pSymA and 1.68-Mb pSymB megaplasmids. Moreover, the genome
sequence is useful in understanding the dynamics of inter-kingdom associations and of
life in soil environments.

76
Antibiotic resistance has been frequently used in ecological studies as well as in
distinguishing the introduced inoculants strain from indigenous rhizobia and monitoring
their survival and occupancy of legume nodules (Josey et al., 1979; Bromfield et al.,
1985; Simon and Kalalova, 1996). Studies carried out on Rhizobium strains from
different host infective groups have shown that most rhizobial strains exhibit multiple
antibiotic resistance (Josey et al., 1979; Dadarwal et al., 1987; Xavier et al., 1998).
However, some of the rhizobial strains possess no detectable antibiotic markers
(Dadarwal et al., 1987; Sharma et al., 1991). In such strains antibiotic markers could be
introduced either by isolating spontaneous mutants or transposition (Schwinghamer,
1967; Ramirez et al., 1998).
Variation in competitiveness for nodule formation and ability to fix dinitrogen has been
found for antibiotic-resistant mutants of Rhizobium or Bradyrhizobium strains
nodulating alfalfa (Lewis et al., 1987), clover (Rynne et al., 1992), and Desmodium
intortum (Date and Hurse, 1992).
Changes in symbiotic effectiveness have been reported to vary with the type of
antibiotic resistance (Sindhu and Dadarwal, 2001). Therefore, the antibiotic- resistant
mutants should be analyzed for their symbiotic effectiveness before using these mutants
for ecological studies or nodulation competitiveness.
S. meliloti 1021 is known as a kanamycin sensitive strain (30 µg/ml). A spontaneous
kanamycin-resistant mutant (GM42) (200 µg/ml) was isolated from S. meliloti strain
1021 (Ventorino et al., 2006). Capela and co-workers (2001) identified a “putative
aminoglycoside 3’-O-phosphotransferase” as the hypothetical product obtained by
coding the SMc03094 chromosomal gene.

77
In this study the GM42 mutant strain was investigated by phenotypic and molecular
characterization and the correlation between SMc03094 gene and kanamycin resistance
phenotype in GM42 was evaluated.
78
II.2. MATERIALS and METHODS
II.2.1. GROWTH MEDIA
All the media, if another not indicated, were dissolved by distilled water and
autoclaved.
LB-medium (Luria-Bertrani Broth), (Sambrook et al., 1989) ), used for E. coli strains
10 g/l Tryptone
5 g/l Yeast Extract
5 g/l NaCl
pH 7.0
TY-medium (Beringer, 1974), used for rhizobial strains
5 g/l Tryptone
3 g/l Yeast extract
0.4 g/l CaCl2pH 7.0
Modified Vincent minimal-medium (Becker et al., 2004; Vincent, 1970)
Stock Solution A: 2.56 g/l K2HPO4
1.56 g/l KH2PO4
0.246 g/l MgSO4 × 7 H2O
1 g/l NH4Cl
Ingredients were dissolved in 800 ml Millipore water and
the pH value was set to 7.0 by KOH or H3PO4. Then,
Millipore water was added to fill 1 liter and the stock
solution was autoclaved.

79
Stock Solution B: 1 mg/ml Biotine
Dissolved by 0.1 N NaOH and sterile filtered
Stock Solution C: 67 g/l CaCl2Autoclaved
Stock Solution D: 10 g/l FeCl3 × 6 H2O
Sterile filtered
Stock Solution E: 3 g/l H3BO3
2.23 g/l MnSO4 × 4 H2O
0.287 g/l ZnSO4 × 7 H2O
0.125 g/l CuSO4 × 5 H2O
0.065 g/l CoCl2 × 6 H2O
0.12 g/l NaMoO4 × 2 H2O
Sterile filtered
For full strength medium, 10 ml of solution B, 1 ml of each solution C, D, and E, and 10
ml of a solution 1 M of mannitol or maltose (Dissolved in Millipore water and sterile
filtered) were added one by one to 980 ml of solution A.
SOB Medium (Inoue et al., 1990), used for preparation of the competent E. coli cells
Stock Solution A: 20 g Tryptone
5 g Yeast extract
0.58 g NaCl
dissolved in 980 ml H2O
Stock Solution B: 2.5 mM KCl
Stock Solution C: 10 mM MgCl2 × 6 H2O
80
Stock Solution D: 10 mM MgSO4 × 7 H2O
10ml of the stock solution B were added to the stock solution A before autoclaving.
Solutions C and D were autoclaved separately, and 5 ml of each were added to the
autoclaved and cooled mixture of A and B solutions.
SOC medium (Inoue et al., 1990), used for recovery of the transformed E. coli cells
SOB medium supplemented with 20 ml 180 g/l solution of glucose
Plant medium for hydroponic condition (Priefer et al., 2001)
Stock Solution A: 0.75 g/l KCl
Stock Solution B: 0.1875 g/l MgSO4 × 7H2O
Stock Solution C: 0.1875 g/l CaSO4× 2H2O
Stock Solution D: 0.1875 g/l Ca3(PO4)2
Stock Solution E: 9.6 g/l FeEDTA
Stock solution F: 0.57 g/l H3BO3
0.31 g/l MnSO4 × 2H2O
0.09 g/l ZnSO4 × H2O
0.08 g/l CuSO4 × 5H2O
0.016 g/l MoO3
0.0008 g/l CoCl3 × 6H2O
After stirring, pH value was measured and set to pH 7.0.
81
II.2.2. MOLECULAR IDENTIFICATION
To ascertain the identification of GM42 at species and strain level, RFLP-16S rDNA,
RAPD-PCR, and REA-PFGE were performed. For the polymerase chain reaction
assays, total DNA was extracted using Instagene Matrix (BioRad). The amplifications
were carried out in a PTC-100 thermocycler (M J Research Inc.).
II.2.2.1. RFLP-16S rDNA
FD1 (5’-AGA GTT TGA TCC TGG CTC AG-3’) and RD1 (5’-AAG GAG GTG ATC
CAG CAG CC-3’) primers described by Weisburg et al. (1991) which correspond to
Escherichia coli 16S rRNA gene positions 8-27 and 1524-1540, respectively, were used
(approximately 1.5 kb). PCR was performed in a total volume of 50 µl containing 20 ng
of bacterial DNA, 1 buffer (Invitrogen), 2.5 mM l-1 MgCl2, 250 µM l-1 of each of the
four dNTPs, 0.2 µM l-1 of each primer and 2.5 U Taq polymerase (Invitrogen). (Blaiotta
et al. 2002). PCR conditions consisted of initial denaturing step at 95°C for 3 min, 30
cycles (94°C for 1 min, 54°C for 45 s and 72°C for 2 min) and an additional final chain
elongation step at 72°C for 7 min. The presence of PCR products was ascertained by
agarose (1% w/v) gel electrophoresis, at 100V for 1 h.
Restriction endonucleases CfoI, HinfI, MspI and NdeII (Promega), as recommended by
Laguerre et al. (1994), were used separately to digest 30 µl of PCR products. Restricted
DNA was analyzed by electrophoresis in 2% agarose at 120V for 4 h. E. coli S17-1 and
R. phaseoli 163 were used as controls.

82
II.2.2.2. RAPD-PCR
RAPD-PCR was performed in the total volume of 25 µl containing 20 ng of bacterial
DNA, 1 buffer (Invitrogen), 3.5 mM l-1 MgCl2, 0.4 mM l-1 of each of the four dNTPs,
0.6 µM l-1 of primer and 2.5 U Taq polymerase (Invitrogen). The 10-mer random primer
used for genomic strain typing was CC1 (5’-AGC AGC GTG G-3’) (Moschetti et al.,
2005), with 70% G-C content. The template DNA was denatured for 1 min at 94°C;
then the PCR was carried out for 40 cycles (1 min at 94°C, 1 min at 31°C, 2 min at
72°C, for each cycle). Finally, a 7 min extension period at 72°C was performed.
Amplified products were resolved on a 2% (w/v) agarose-TBE gel electrophoresis. R.
phaseoli 163 was used as control. 1 Kb Plus DNA Ladder (Invitrogen) was used as
molecular weight marker.
II.2.2.3. REA-PFGE
Samples were prepared according to Corich et al. (1991) with some modifications. The
pellet from 10 mL of broth culture was washed with 5 mL of SE buffer (75 mM NaCl,
25 mM sodium EDTA, pH 7.4) and resuspended in SE in order to obtain a final
concentration of 30 mg/mL (McClelland et al., 1987). A small slice, about 1–2 mm long
of plug, was placed in a Petri dish (5 cm Ø) containing 6 mL of Tris (10 mM) for 15–30
min. Finally, the enzymatic digestion with XbaI was performed as reported by Corich et
al. (1991).
Electrophoresis of the digested DNA was performed by the CHEF system (Bio-Rad)
with 1% (w/v) agarose gel and 0.5 × tris borate EDTA (TBE) as running buffer, at
10°C. 8-48- kb ladder in agarose plugs (BioRad) was used as molecular size marker.
Restriction fragments were resolved at a constant voltage of 6 V/cm, with the following

83
pulse times: 5 s for 6 h, 10 s for 6 h, and 15 s for 9 h. (Ventorino et al., 2007). E. coli
S17-1and R. phaseoli 163 were used as controls.
II.2.3. PHENOTYPIC CHARACTERIZATION
Metabolic fingerprints of the strains 1021 and GM42 were obtained by measuring their
ability to metabolize different carbon sources.
Moreover, the nodulation efficiency of the two strains was evaluated too.
II.2.3.1. METABOLIC FINGERPRINTS
The strains were grown on TY media at 30°C for 24 h. These cells in inoculating fluid
(OD600 = 0.3 ± 0.05) (absorbance was assessed by software) were used to inoculate the
Biolog GN2 microplates (150 µl per well). Microplates were incubated at 30°C for 24 h.
After incubation the microplates were placed in the MicroStation Reader for analysis
and the metabolic fingerprints was obtained. All experiments were performed in
triplicate.
II.2.3.2. GROWTH CURVES
The strains were grown on TY media at 30°C for 24 h. A single colony was picked and
inoculated in 5 ml TY and grown overnight. The day after the OD600 of each strain was
measured. An equal cell number was centrifuged to eliminate TY medium and the cells
were inoculated in 50 ml of minimal medium with mannitol or maltose as carbon

84
source. The samples were collected and OD600 was measured every two hours. All
experiments were performed in triplicate.
The growth curves were fitted by Gompertz function using Curve Expert 1.3 software,
and growth rate and asymptotic value were calculated for each fit. When applied to
microbial growth curve, Gompertz’s function is : y = a*exp[ - exp(b-cx)], where a is the
asymptote, defined as the maximum number of microorganisms that can be reached
(Nmax); b is the lag time, defined as the x-axis intercept of the tangent in the inflection
point; c, is the maximum specific growth rate, defined as the tangent in the inflection
point (µmax).
II.2.3.3. PLANT NODULATION TESTS
The strains were evaluated for their symbiotic efficiency with alfalfa plants. Inoculation
and seed treatment were performed as previously reported (Moschetti et al., 2005). The
plants were cultured in a growth chamber under a constant temperature of 21°C and 12
h d-1 photoperiod and watered with nitrogen-free nutrient solution (Priefer et al., 2001).
Forty days after planting, the effectiveness of the nodules for nitrogen fixation was
estimated from the pink of the nodules and the dark green of the leaves compared to
control plants (without inoculation) (Moschetti et al., 2005). All experiments were
performed in triplicate.
II.2.4. CORRELATION BETWEEN SMC03094 GENE AND KMR PHENOTYPE
Different approaches were performed to find a gene or genes determining the
kanamycin resistant phenotype in GM42.

85
II.2.4.1. RT-PCR of SMc03094 GENE
S. meliloti 1021 and GM42 were grown on TY media at 30°C for 24 h. A single colony
was picked and inoculated in 50 ml TY. The cells were grown overnight and harvested
by centrifugation of 1 ml of the culture (OD600 = 0.6). Total RNA was extracted using
NucleoBond RNA/DNA (Macherey-Nagel) following the manufactures’instructions.
PAP-Forw (5’ –GCT TCG AGA GGG ACG CAC TG -3’) and PAP-Rev (5’ –GCA
GCC GGT AAA AGG CGA GC -3’) primers were used to amplify Smc03094 gene.
RT-PCR was performed in a total volume of 50 µl containing 1 µg of bacterial RNA
(previously treated with DnaseI), 1 Reaction Mix (Invitrogen), 0.2 µM l-1 of each
primer and 1 µl RT/Platinum Taq Mix (Invitrogen). PCR conditions consisted of an
initial cycle at 50°C for 25 min for cDNA synthesis and one step at 94°C for 2 min for
pre-denaturation, followed by 35 cycles (94°C for 30 s, 56°C for 30 s and 72°C for 1
min) and an additional final chain extension step at 72°C for 10 min. RT-PCRs of nodL
gene and of 16S rDNA were performed as positive controls.
II.2.4.2 WESTERN-BLOTTING
The strains were grown on TY media at 30°C for 24 h. A single colony was picked and
inoculated in 50 ml TY and grown overnight. 0.1 g of cells and 0.2 g of glass beads
were resuspended into 1 ml lysis buffer (0.125 M Tris-HCl pH 6.8, 4% SDS, 10% β-
mercaptoethanol, 20% glycerol, 0.005% bromophenol blue) and were crushed in
Ribolyser, power 6.5 for 30 s. Then, the samples were boiled at 100°C for 10 min,
centrifuged at 13000 rpm at 4°C for 10 min and the supernatant was recovered.
Electrophoresis was carried out using SDS-PAGE gel (12% polyacrylamide) and the
Tris–glycine–SDS buffer (25 mM Tris, 198 mM glycine, and 0.1% SDS) on a Mini-

86
Protean system (BioRad) at 11 mA/gel until the dye front reached the bottom edge of
the gel. Precision plus protein standard Dual Color (BioRad) was used. Then, the
proteins were transferred on a nitrocellulose filter (0.2 µm) using Tris-glycine-methanol
buffer (25 mM Tris, 198 mM glycine, and 20% methanol) on a Mini Trans-Blot Cell
(BioRad). The blocking was performed using 5% dry milk dissolved in TBS buffer and
shaking at RT for 30 min. The filter was washed in TBS buffer with shaking at RT for
15 min.
The first hybridization was performed using rabbit polyclonal primary antibody to
Neomycin Phosphotransferase II (1:250) (abcam) in 2.5% dry milk dissolved in TBS
buffer and incubating at 4°C overnight with shaking. The filter was washed three times
using TBS (10 min each wash step). The second hybridization was performed using
goat polyclonal to rabbit IgG (conjugated to HRP) antibody in 2.5% dry milk dissolved
in TBS buffer and incubating at RT for 3 h with shaking. Three wash steps were
performed as above reported.
The signal detection was performed using HRP-color (Bio-rad) and hydrogen peroxide.
Proteins extracted from E. coli S17-1 pSup 1021 (containing neomycin
phosphotransferaseII gene) were used as positive control; proteins extracted from E.
coli DH5 were used as negative control.
II.2.4.3 CLONING of SMc03094 GENE in EXPRESSION VECTOR
II.2.4.3.1. Preparation of electrocompetent cells of E. coli TOP10
1. Inoculate a single colony of E. coli into 5 ml LB medium and grow at 37°C
overnight with moderate shaking

87
2. Inoculate 0.5 ml of the culture into 50 ml LB medium and grow at 37°C with
shaking to an OD600 of 0.6
3. Chill cells on ice for 15 min and transfer to a pre-cooled centrifuge tube
4. Centrifuge cells 20 min at 4200 rpm at 2°C
5. Pour off supernatant and resuspend the pellet in 50 ml ice-cold water. Centrifuge
cells as in step 4
6. Pour off supernatant immediately and resuspend the pellet by swirling in
remaining liquid
7. Add 50 ml of ice-cold water, mix well, and centrifuge cells as in step 4
8. Pour off supernatant immediately and resuspend the pellet by swirling in
remaining liquid
9. Add 5 ml ice-cold 10% glycerol and mix well. Centrifuge cells at 4200 rpm for
10 min at 2°C
10. Aliquot 50 µl cells into pre-cooled microcentrifuge tubes and freeze on dry ice.
Store at -80°C.
II.2.4.3.2. Preparation of insert and vector
SMc03094 gene was amplified using PAPHF-EcoRI (5’ –GAG GGA ATT CAT GGA
CGT GAG AGA ATT G- 3’) and PAPHR-PstI (5’ –CCA ACT GCA GTC AGA AAA
ATT CGT CCA G -3’) primers. PCR was performed in a total volume of 50 µl
containing 20 ng of bacterial DNA, 1 buffer (Invitrogen), 2.5 mM l-1 MgCl2, 250 µM
l-1 of each of the four dNTPs, 0.2 µM l-1 of each primer and 2.5 U Taq polymerase
(Invitrogen). PCR conditions consisted of initial denaturing step at 94°C for 3 min, 5
cycles (94°C for 45 s, 53 °C for 45 s and 72°C for 1 min), 30 cycles (94°C for 45 s,
88
57°C for 45 s and 72°C for 1 min), and an additional final chain elongation step at
72°C for 7 min. The presence of PCR products was ascertained by agarose (1% w/v) gel
electrophoresis, at 100V for 1 h.
Restriction endonucleases EcoRI and PstI (Promega) were used to digest PCR product
(insert) and pKK223-3 prokaryotic expression vector (Pharmacia Biotech).
II.2.4.3.3. Ligation
The digested DNA fragments with compatible “sticky” ends can be joined together
using the enzyme T4-Ligase. DNA ligation involves creating a phosphodiester bond
between the 3´ hydroxyl of one nucleotide and the 5´ phosphate of another.
Ligation reaction was performed in a total volume of 10 µl containing 50 ng plasmid, 30
ng insert, 1 × ligation buffer, 1 µl T4-Ligase (Invitrogen). The ligation mixture was
incubated overnight at 4°C.
II.2.4.3.4. Transformation of E. coli
Transformation of E. coli TOP10 was performed by electroporation.
Add ligation product to 50 µl electrocompetent cells and mix
Transfer the DNA and cells into a pre-cooled cuvette
Place the cuvette into the sample chamber
Apply the pulse (2.5 kV, 25 µF, 200 ohms)
Remove the cuvette. Add immediately 1 ml SOC medium and transfer to a
sterile tube. Incubate 60 min at 37°C with moderate shaking
Plate the transformed cells (10 – 100 μl) on LB plates containing the antibiotic
for selection.

89
II.2.4.3.5. Plasmid extraction and sequencing
Plasmid DNA from transformed cells of E. coli was isolated using QIAprep Spin
Miniprep kit (Qiagen) following the manufactures’ instruction.
To ascertain the presence and the identity of the insert, plasmid DNA was sequenced
using two primers (4505F: 5’ –TGA TTT AAT CTG TAT CAG GCT G -3’; and 47R:
5’ –AAT GTG TGG AAT TGT GAG CGG -3’) synthesized by Primm based on
pKK223-3 sequence (GenBank accession number M77749).
II.2.5. DNA-MICROARRAYS
Transcriptional profiles of S. meliloti 1021 and GM42 were compared by DNA-
microarrays.
II.2.5.1 RNA isolation
Cells (OD600=0.8) were briefly centrifuged (13000 rpm, 1 min, 4°C) and cell pellets
were immediately frozen in liquid nitrogen. Total RNA was purified using the RNeasy
Mini Kit (Qiagen). Cells were disrupted in RLT buffer provided with the kit in Fast
Protein tubes (Qbiogene) using the Ribolyser (Hybaid, Heidelberg, Germany) (30 s,
level 6.5) before spinnig column purification according to the RNeasy Mini Kit RNA
purification protocol (Rüberg et al., 2003).
II.2.5.2. Sm14KOligo microarrays
Each array contained 6208 70mer oligonucleotides directed against protein-coding orfs
of S. meliloti and 8080 50mer to 70mer oligonucleotides directed against intergenic

90
regions in two replicates; a set of 70mer stringency control oligonucleotides (70 % to 90
% identity); 6 alien 70mer oligonucleotides as negative control; and spotting buffer and
empty position controls. Each spot was in duplicate.
II.2.5.3. Hybridization and image acquisition
Hybridization and image acquisition were performed as described by Rüberg et al.,
2003.
Image processing was performed with ImaGene (version 6.0.1). For each spot the
background corrected spot intensities were calculated using the means of all chosen
pixels for background and signal. Negative spots or spots that were flagged as empty or
having bad quality were removed.
The mean intensity (A-value) was calculated for each spot using the standard formula
Ai=log2(RiGi)0.5. Ri=Ich1i-Bgch1i and Gi= Ich2i-Bgch2i, where Ich1i or Ich2i is the intensity of a
spot in channel 1 or channel 2 and Bgch1i or Bgch2i is the background intensity of a spot in
channel 1 or channel 2, respectively. The logarithm to the base 2 of the ratio of
intensities (the M-value) was calculated for each spot using the formula Mi=log2(Ri/Gi)
(Becker et al., 2004). Normalization and t-statistics were carried out using the EMMA
1.1 microarray data analysis software developed at the Bioinformatics Resource
Facility, Center for Biotechnology, Bielefeld University) (http://www.genetik.uni-
bielefeld.de/ EMMA/) (Dondrup et al. 2003). Genes were regarded as differentially
expressed if p ≤ 0.05 and M ≥ 1 or M ≤ -1.

91
II.2.6. PROMOTER ACTIVITY of SMC03094 and SMC03095 GENES
Smc03094Forw-Kpn (5’ -GAC AGG TAC CAT CAT GAA CCC ACT TGC GG -3’)
and Smc03094Rev-Bam (5’ -ACT CGG ATC CTG GCA GGT CCA ATT CTC TCA -
3’) primers were used to amplify the intergenic region upstream the SMc03094 gene;
while Smc03095Forw-Kpn (5’ -GAC AGG TAC CCG GAG GCA TCT TCT TCG
AGA -3’) and Smc03095Rev-Bam (5’ -ACT CGG ATC CAT CTG CTC GGT CAT
GTC GTA -3’) primers were used to amplify the intergenic region upstream the
SMc03095 gene. PCR was performed in a total volume of 50 µl containing 20 ng of
bacterial DNA, 1 buffer (Invitrogen), 2.5 mM l-1 MgCl2, 250 µM l-1 of each of the
four dNTPs, 0.2 µM l-1 of each primer and 2.5 U Taq polymerase (Invitrogen). PCR
conditions consisted of initial denaturing step at 95°C for 3 min, 30 cycles (95°C for 30
s, 52°C for 30 s and 72°C for 30 s), and an additional final chain elongation step at 72°C
for 7 min. The presence of PCR products was checked by agarose (2% w/v) gel
electrophoresis, at 80V for 1 h.
Restriction endonucleases KpnI and BamHI (Fermentas) were used to digest purified
PCR product.
II.2.6.1. Construction of promoter probe vector pGvig
Plasmid pGvig carrying the exoP-EGFP cassette was constructed based on the vector
pG18mob2 (Kirchner and Tauch, 2003). The cassette derived from plasmid pKmig and
contained exoP gene for the insertion in the S. meliloti genome and promoterless EGFP
gene to evaluate the activity of hypothetical promoter region.
Linear plasmid pG18mob2 obtained by using restriction endonucleases EcoRI and
HindIII (Fermentas) was used for the ligation reaction with the exoP-EGFP cassette.

92
The promoter fragments to be tested were inserted into the resulting pGvig vector by
using the KpnI, and BamHI restriction sites located upstream of the promoterless EGFP
gene.
Plasmids obtained by ligation reaction were cloned in E. coli DH5α (high efficient
strain for transformation), and the plasmid isolated from DH5α transformed cells was
cloned into E. coli S17-1 (high efficient strain for conjugation experiment with S.
meliloti).
II.2.6.2. Promoter probe vector pSRPP18
The hypothetical promoter region was inserted into the plasmid pSRPP18 (Bahlavane et
al., 2008) by using the KpnI, and BamHI restriction sites located upstream of the
promoterless LacZ gene.
The aacC1 gene (gentamicin resistance gene), derived from plasmid pMS255 (Becker et
al., 1995), was inserted in antisense orientation upstream of the insert by using
restriction endonucleases KpnI.
Plasmids obtained by ligation reaction were cloned in E. coli DH5α (high efficient
strain for transformation), and the plasmid extracted from DH5α transformed cells was
cloned into E. coli S17-1 (high efficient strain for conjugation experiment with S.
meliloti).
II.2.6.3. Preparation of competent cells of E. coli DH5α and S17-1
In this work a highly efficient chemical method of competent cell preparation was used
(Inoue et al., 1990):
93
1. Pick 7 - 10 large E.coli colonies from the LB-agar plate and resuspend them in 3
ml of SOB. Use approximately 1 ml of the cell suspension to inoculate 150 ml
of SOB. Incubate the flask in a shaker (150 rpm) overnight at the room
temperature (18 – 22°C). Harvest the culture at the O.D.600 of 0.5 – 0.6.
2. Transfer the culture to centrifuge tubes and cool them 10 min on ice
3. Centrifuge for 10 min, at 3000 rpm, 4°C, discard the supernatant
4. Add 50 ml ice-cold TB buffer (10 mM HEPES, 55 mM MnCl2 × 2H2O, 15 mM
CaCl2 × 2H2O, 250 mM KCl) and incubate for 10 min on ice
5. Centrifuge as step 3
6. Resuspend the pellets gently in 10 ml of ice-cold TB buffer. Add 0.7 ml of
DMSO and incubate on ice for 10 min more
7. Aliquot the cells (200 µl) using pre-cooled microcentrifuge tubes and plastic
tips.
8. Freeze the aliquots in liquid nitrogen and store at -80°C.
II.2.6.4. Transformation of competent cells by DNA
1. Thaw 200 μl of competent cells at room temperature. Add DNA in the volume
of 10 μl or less. Incubate the cells together with DNA on ice for 30 min
2. Heat-shock the cells by placing in 42°C water bath for 30 s and later cooling
them on ice for 5 min
3. Add 750 μl of SOC medium to the cells and incubate at 37°C for 1 h
4. Plate the transformed cells (100 μl) on LB plates containing the antibiotic for
selection.

94
II.2.6.5. Conjugation
Resuspend in 1 ml of TY a little colony from one day old S. meliloti culture on
TY agar and from one to three day old E. coli S17-1 culture on LB agar
containing Km (50 µg/ml) and mix (OD600 = 0.2)
Drop 30 µl on TY agar without antibiotics and incubate overnight at 30°C
Resuspend a tiny amount of the mixed strain colony in 1 ml of TY (OD600 = 0.4)
Plate 100 µl of the suspension on TY medium containing Nx (10 µg/ml) and Gm
(40 µg/ml). Incubate at 30°C for three days
To ascertain that the colonies obtained were S. meliloti, PCR was performed by using
ExoP2683-H-for (5’ -CCC AAG CTT TAC GCG ATC TGC TCC ACT C-3’) and
LacZ2rev (5’ -TGA GGG GAC GAC GAC AGT ATC-3’) primers in a total volume of
10 µl. PCR conditions consisted of initial denaturing step at 95°C for 5 min, 30 cycles
(92°C for 30 s, 55°C for 30 s and 72°C for 1 min), and an additional final chain
elongation step at 72°C for 5 min. The presence of PCR products was checked by
agarose (2% w/v) gel electrophoresis, at 80V for 1 h.
II.2.7. FUNCTIONAL ANALYSIS of SMC03094 and SMC03095 GENES
To test the correlation between kanamycin resistant phenotype and the chromosomal
region comprising SMc03094 and SMc03095 genes, cloning vectors for gene distruption
of these genes in GM42 was constructed.

95
II.2.7.1. SMc03094 gene
Smc03094-HindIIIForwUp (5’ -CGC TAA GCT TAG CTT GGA ACC CTT TCG C -
3’) and 03094-PstI-Rev-Up (5’ -CGC TGC AGG GTG GCA GGT CCA ATT CTC -3’)
primers were used to amplify the upstream region of the SMc03094 gene, comprising 50
bp of the gene and 450 bp of the upstream region; while 660-PstI-For (5’ -CGC TGC
AGA TCA CCC ACA ACC TGG GAG A -3’) and 1180-BamHI-Rev (5’ -GCG GAT
CCA TTC TGA CGA GCG CCG AT -3’) primers were used to amplify the
downstream region of the SMc03094 gene, comprising 50 bp of the gene and 450 bp of
the downstream region. PCR was performed in a total volume of 50 µl containing 20 ng
of bacterial DNA, 1 buffer (Invitrogen), 2.5 mM l-1 MgCl2, 250 µM l-1 of each of the
four dNTPs, 0.2 µM l-1 of each primer and 2.5 U Taq polymerase (Invitrogen). PCR
conditions consisted of initial denaturing step at 95°C for 3 min, 30 cycles (95°C for 30
s, 53°C for 30 s and 72°C for 30 s), and an additional final chain elongation step at
72°C for 7 min. The presence of PCR products was checked by agarose (2% w/v) gel
electrophoresis, at 80V for 1 h.
Restriction endonucleases HindIII and PstI (Fermentas) were used to digest purified
PCR products obtained by using Smc03094-HindIIIForwUp and 03094-PstI-Rev-Up
primers; while PstI and BamHI (Fermentas) were used to digest purified PCR products
obtained by using 660-PstI-For and 1180-BamHI-Rev primers.
II.2.7.2. SMc03095 gene
Smc03095-UP-Hin-For (5’ -CAG AAG CTT ATC TTC AAC CGG TCG CTG AA -3’)
and Smc03095-UP-PstI-Rev (5’ -CGC TGC AGA ATT CGA TCG CCT GCC TCA -
3’) primers were used to amplify the upstream region of the SMc03095 gene,

96
comprising 50 bp of the gene and 500 bp of the upstream region; while Smc03095-do-
PstI-For (5’ -CGC TGC AGA CAG ATC ATG AAC CCA CTT GC -3’) and
Smc03095-do-Bam-Rev (5’ -GCG GAT CCT TTT GCC GCA GCA ATG CT -3’)
primers were used to amplify the downstream region of the SMc03095 gene, comprising
50 bp of the gene and 500 bp of the downstream region. PCR conditions were
performed as above reported.
Restriction endonucleases HindIII and PstI (Fermentas) were used to digest purified
PCR products obtained by using Smc03095-UP-Hin-For and Smc03095-UP-PstI-Rev
primers; while PstI and BamHI (Fermentas) were used to digest purified PCR products
obtained by using Smc03095-do-PstI-For and Smc03095-do-Bam-Rev primers.
II.2.7.3. Plasmid cloning vector
Plasmid pK18mobsac (Schäfer et al., 1994) was used to transform GM42. The
experimental procedures for the construction of the plasmid cloning vectors used for
gene distruption of the SMc03094 and SMc03095 genes were the same for both of them.
Ligation reaction, transformation of competent cells of E. coli, and selection of
transformed cells were performed as above reported.
Upstream gene region insert (insert I) and plasmid pK18mobsac were cut by
using restriction endonucleases enzymes HindIII and PstI
Ligation reaction was performed by using T4-ligase enzyme
Competent cells of E. coli DH5α were transformed with ligation product I
Transformed cells were selected and plasmid was extract by using QIAprep Spin
Miniprep kit (Qiagen)

97
Plasmid was sequenced by using pQE-FP primer (5’ -CGG ATA ACA ATT
TCA CAC AG -3’) to verify the orientation of the insert into the plasmid
Downstream gene region insert (insert II) and plasmid pK18mobsac were cut by
using restriction endonucleases enzymes PstI and BamHI
Ligation reaction was performed by using T4-ligase enzyme
Competent cells of E. coli DH5α were transformed with ligation product II
Transformed cells were selected and plasmid was extract
Plasmid was sequenced by using pM13-FP primer (5’ -TGT AAA ACG ACG
GCC AGT -3’) to verify the orientation of the insert into the plasmid
LacZ-aacC1 cassette (insert III), derived from plasmid pAB2001 (Becker et al.,
1995), and plasmid pK18mobsac were cut by using restriction endonucleases
enzyme PstI
Dephosforylation of DNA 5’-termini of the linear plasmid was performed by
using shrimp alkaline phosphatase (SAP) (Invitrogen). SAP was added directly
to the restriction mixture of the plasmid after restriction reaction. 1 unit of SAP
was added per 1 picomole of DNA 5´-termini and the mixture was incubated at
37°C for 1 h. The reaction was stopped by heating at 65°C for 15 min
Ligation reaction was performed by using T4-ligase enzyme
Competent cells of E. coli DH5α were transformed with ligation product III
Transformed cells were selected and plasmid was extract
Plasmid was sequenced by using pM13-FP (5’ -TGT AAA ACG ACG GCC
AGT -3’) and pQE-FP (5’ -CGG ATA ACA ATT TCA CAC AG -3’) primers to
verify the orientation of the insert into the plasmid
Purified plasmid cloning vector was used to transform competent cells of E. coli
S17-1.

98
II.3. RESULTS
II.3.1. MOLECULAR IDENTIFICATION
To ascertain the identification of GM42 three different molecular approaches were
performed. The genomic DNAs of S. meliloti 1021 and GM42 were compared by using
restriction fragment length polymorphism analysis of the 16S rDNA (RFLP-16S rDNA)
for species-specific differentiation, randomly amplified polymorphic DNA-PCR
(RAPD-PCR) analysis for intra-specific differentiation, and restriction endonucleases
analysis combined with pulsed-field gel electrophoresis (REA-PFGE). Comparing
fingerprints obtained there were no differences in all cases (Fig. 1, 2, and 3).
II.3.2. PHENOTYPIC CHARACTERIZATION
II.3.2.1. METABOLIC FINGERPRINTS
The MicroLog System Biolog brings a high level of accuracy to the rapid
characterization of microbial organisms. Biolog’s microplates incorporates 95 pre-
selected carbon sources (including carboxylic acids, amino acids, and peptides) in a pre-
filled microtiter format. The ability of strains to metabolize each carbon source is
measured by the presence or absence of a purple hue in the wells. Tetrazolium violet, a
redox dye, forms a purple color when oxidized by cellular respiration of the
microorganism. Therefore, data obtained provide an enormous amount of discriminating
biochemical characterization information.
99
S. meliloti strain 1021 and GM42 showed a different metabolic fingerprint. The ability
of GM42 to metabolize the N-Acetyl-D-glucosamine involved in the glycoprotein
synthesis and in the transport mediated by the phosphotransferase system proved to be
interesting. The different carbon sources metabolized by S. meliloti 1021 or GM42 are
listed in Table 1.
II.3.2.2. GROWTH CURVE
To confirm the results obtained with metabolic analysis using MicroLog Biolog, we
performed exponential growth analysis of the strain 1021 and GM42.
The strains were inoculated in minimal medium supplemented with mannitol or maltose
as unique carbon source. The growth curves generated were fitted by Gompertz
function.
GM42 was not able to metabolize mannitol (Table 2). S. meliloti 1021 showed an
asymptotic value (Nmax) equal to 1.67 OD600 and a maximum specific growth rate value
(µmax) equal to 0.89 OD600 h-1. By contrast, there no was significant variation of the
growth in GM42 (Nmax = 0.47 OD600; µmax = 0.03 OD600 h-1).
Moreover, GM42 showed a slow growth in presence of maltose. In fact, S. meliloti 1021
showed a µmax value equal to 0.2 OD600 h-1, while GM42 showed a µmax value equal to
0.06 OD600 h-1. In addition, the Nmax value was 1.52 and 1.29 OD600 in S. meliloti 1021
and GM42, respectively (Table 2).
II.3.2.3. PLANT NODULATION TESTS
Seeds of alfalfa were inoculated with S. meliloti 1021 and GM42 to verify the
nodulation efficiency of the kanamycin-resistant strain. Visual observations of nodule

100
formation on the host plant and of plant size and foliage colour compared to non-
inoculated controls after 40 days of growth were used to evaluate their symbiotic
effectiveness. GM42 did not lose its nodulation efficiency; in fact, no significant
difference, comparing the number of nodules obtained inoculating alfalfa with 1021 or
GM42, was found (Table 3).
II.3.3. CORRELATION BETWEEN SMC03094 GENE AND KMR PHENOTYPE
Capela and co-workers (2001) identified a “putative aminoglycoside 3’-O-
phosphotransferase” as the hypothetical product obtained by coding the SMc03094
chromosomal gene. Therefore, different approaches were used to verify the relationship
between SMc03094 gene and the kanamycin resistance in S. meliloti strain 1021.
II.3.3.1. RT-PCR of SMc03094 GENE
RT-PCR of the SMc03094 gene was performed to check transcriptional difference in
this chromosomal region between S. meliloti 1021 and GM42.
RT-PCR was performed using the total RNA extracted from S. meliloti 1021 and
GM42. After amplification it was possible to see the difference in the transcription of
SMc03094 gene comparing the two strains. In fact, S. meliloti 1021 did not produced
any RT-PCR product, while GM42 showed a single RT-PCR product at around 700 bp
(nucleotide size of SMc03094 gene) (Fig. 4). Moreover, RT-PCRs of the nodL gene and
of 16S rDNA were performed to confirm the presence of RNA extracted from S.
meliloti 1021 in the amplification reactions (positive controls) (Fig. 4).
101
This result confirmed that there might be a correlation between coding SMc03094 gene
and resistance to aminoglycoside antibiotics.
II.3.3.2. WESTERN-BLOTTING
Western-blotting on the total proteins extracted from S. meliloti 1021 and GM42 was
performed to check the presence of an amynoglicoside phosphotransferase enzyme in
GM42. Protein extractions were performed from three independent cultures of the two
strains.
Anti-Neomycin Phosphotransferase II (NPTII) antibody was used as primary antibody.
The results confirmed that in GM42 there might be a protein that conferred resistance to
aminoglycoside antibiotics. In fact, S. meliloti 1021 did not produce any signal after
hybridization, while GM42 showed a single signal corresponding to the presence of a
protein of about 25 kD (Fig. 5). Moreover, total proteins extracted from E. coli S17-1
pSup 1021 (containing the plasmid pSup1021 carrying the NPTII gene) were used as
positive control while total proteins extracted from E. coli DH5α were used as negative
control (Fig. 5). In E. coli S17-1 pSup 1021 Anti-Neomycin Phosphotransferase II
antibody recognized a protein of about 25 kD just like in GM42.
II.3.3.3. EXPRESSION of SMc03094 GENE in E. coli
SMc03094 gene from S. meliloti 1021 was cloned in the high-expression vector
pKK223-3, derived from plasmid pBR322. In this construct the putative aminoglycoside
phosfotransferase (APH) gene was placed under the control of the strong tac promoter.
The construct was used to transform electrocompetent cells of E. coli TOP10.
Transformed cells were selected and tested for their kanamycin resistance.

102
Transformed cells showed a kanamycin-resistant phenotype; in fact, they were able to
grow on LB medium containing 500 µg/ml kanamycin. Moreover, the insert was
sequenced by using two oligonuclotide based on the plasmid sequence, to ascertain the
presence and the identity of the insert. The sequences obtained were compared with the
NCBI sequence (GenBank accession number NC003047). No oligonucletide difference
was found.
This result proved that the expression of SMc03094 gene in E. coli conferred resistance
to kanamycin.
II.3.4. TRANSCRIPTIONAL DIFFERENCES in S. MELILOTI 1021 and GM42
DNA microarrays are used to measure the levels of abundance of defined mRNAs in the
experimental conditions. The known DNAs (probe), corresponding to the mRNAs of
the studied organism, are affixed to a support at the pre defined spots. The mRNAs,
isolated from the sample, are reverse transcribed and labelled with two different
fluorofores (Cyanine 5 and Cyanine 3). The samples (targets) are mixed and hybridized
to the array.
An oligonucleotide-based whole-genome S. meliloti 1021 was used to analyze and to
compare the transcriptional profiles of GM42 and S. meliloti 1021.
Results showed a few expression differences in GM42. In fact, comparing the
expression of the open reading frame sequences, only seven genes were up-regulated
and six genes were down-regulated in GM42 (Fig. 6). The genes up-regulated were:
SMc03095 (hypothetical unknown protein), SMc00183 (conserved hypothetical
protein), SMc01217 (major facilitator superfamily-transport protein), SMc01609
103
(putative 6,7-dimethyl-8-ribityllumazine synthase) on the chromosome; SMa0232
(conserved hypothetical protein) and SMa0329 (short chain alcohol dehydrogenase-
related dehydrogenase) on the pSymA; SMb20647 (hypothetical protein) on the pSymB.
The genes down-regulated were: SMc00784 (bacterial extracellular solute-binding
protein), and SMc01714 (hypothetical transmembrane protein) on the chromosome;
SMa0983 (hypothetical protein) on the pSymA; SMb21293 (putative guanine
deaminase), SMb20040 (hypothetical protein transmembrane), and SMb20684
(conserved hypothetical protein) on the pSymB. SMc03094 was up-regulated in GM42,
but its M-value was 0.89. Therefore, SMc03094 was considered not differential
expressed in the data analysis. It turned out to be very interesting the up-regulation of
SMc03095. This gene is located on the chromosomal region upstream of SMc03094
gene and, besides, it has the same transcriptional orientation of SMc03094; therefore,
these two genes might be under the control of the same promoter.
If we consider, in the data analysis, the intergenic region in addition to the genes, many
transcriptional differences were obtained (Fig. 7). It proved interesting the up-regulation
of intergenic region 4934 that showed a M-value equal to 2.33, the highest value
obtained. This region is the intergenic region that is located on the chromosome
between SMc03095 and SMc03094. Since the intergenic region 4934 is upstream of
SMc03094 gene, it might be the promoter region for coding this gene.
II.3.5. PROMOTER ACTIVITY
To check the promoter region that regulate the coding of SMc03095 and SMc03094
genes, the intergenic regions located upstream of these two genes were cloned in the
promoter probe pGvig.

104
The plasmid pGvig derived from pGmob2, which already contained the RP4 mob
region, necessary for the transfer into S. meliloti from E. coli S17-1 cells, which have a
chromosomally integrated copy of RP4 able to supply the transfer functions in trans.
Furthermore, pG18Mob2 is a suicide vector since it is able to replicate in E. coli, but not
in S.meliloti.
Plasmid pGvig (Fig. 8) was constructed inserting the exoP-EGFP cassette. The exoP
partial gene derived from S.meliloti 1021 and it is necessary for the insertion of the
fragment in the S. meliloti genome by recombination. The enhanced green fluorescent
protein (EGFP) gene is promoterless and was used to evaluate the activity of
hypothetical promoter region. The promoter fragments to be tested were inserted into
the pGvig vector by using the KpnI, and BamHI restriction sites located upstream of the
promoterless EGFP gene.
The intergenic regions upstream SMc03095 and SMc03094 genes and deriving from S.
meliloti 1021 and GM42 were cloned in pGvig and used to transform S. meliloti 1021.
The fluorescence emitted by EGFP in S. meliloti 1021 transformed with the four
plasmids was measured by using a spectrofluorimeter. The empty plasmid (pGvig
without intergenic region) in E. coli S17-1 was used as negative control.
The experiment failed because there was a mistake at the beginning of the nucleotide
sequence in the EGFP gene used. In fact, the empty plasmid emitted a high
fluorescence and thus it was impossible to measure the effective fluorescence emitted
by the activity of promoter regions inside the transformed cells of S. meliloti 1021.
Therefore, another promoter probe vector (pSRPP18) was used.
Plasmid pSRPP18 derived from pK18mob which, like pGmob2, is a suicide vector and
contains the RP4 mob. Plasmid pSRPP18 carried the exoP partial gene (SMb20961) for
the insertion of the fragment in the S. meliloti genome and a proterless LacZ gene. The

105
promoter fragments were inserted upstream of the LacZ gene. Therefore, in this case, it
is possible to evaluate the promoter activity by β-Galactosidase assays of S. meliloti
strains carrying the integrated promoter probe vector pSRPP18 with promoter fragment
inserts.
Moreover, since pSRPP18 carried the kanamycin resistance gene, it was necessary to
clone the aacC1 gene, which confers gentamicin resistance, in the promoter vector.
The promoter probe vectors pSRPP18 with promoter region were obtained (Fig. 9), and
the next step will be the transformation of S. meliloti 1021.
II.3.6. FUNCTIONAL ANALYSIS of SMC03094 and SMC03095 GENES
DNA-microarrays results showed the up-regulation of SMc03095 gene. Therefore
functional analysis of SMc03095 and SMc03094 genes was performed by gene
destruption of these genes in GM42, to ascertain their involving in kanamycin- resistant
phenotype.
Plasmid pK18mobsac was used as vector. This plasmid derives from pK18mob,
therefore it is a suicide vector and contains the RP4 mob. In addition, pK18mobsac
carries a genetically modified sacB gene which confers sucrose-sensitivity to Gram-
negative bacteria as additional selection.
Two pK18mobsacV plasmids (Fig. 10) were obtained by cloning three inserts in the
multi-cloning site (MCS) of pK18mobsac.
Plasmid pK18mobsacV-94 carried: two inserts containing the upstream chromosomal
region of SMc03094 gene and 5’-end (50 bp) of SMc03094 gene (insert I), and the 3’-
end (50 bp) of SMc03094 gene and downstream chromosomal region of SMc03094

106
gene (insert II) for the crossing-over; one insert containing LacZ-aacC1 cassette (insert
III) for both the selection of S. meliloti strains carrying the integrated vector
pK18mobsacV-94 and destruption and replacement of SMc03094 gene.
Plasmid pK18mobsacV-95 carried: two inserts containing the upstream chromosomal
region of SMc03095 gene and 5’-end (50 bp) of SMc03095 gene (insert I), and the 3’-
end (50 bp) of SMc03095 gene and downstream chromosomal region of SMc03095
gene (insert II) for the crossing-over; and one insert comprising LacZ-aacC1cassette
(insert III).
Actually, the vectors pK18V were obtained, and the next step will be the transformation
of S. meliloti 1021.
107
II.4. DISCUSSION
II.4.1. PHENOTYPE CHARACTERIZATION of GM42
S. meliloti 1021 is known as a kanamycin sensitive strain (30 µg/ml). A spontaneous
kanamycin-resistant mutant (GM42) (200 µg/ml) was isolated from S. meliloti strain
1021.
It is reported that variation exists in effectiveness of nodule formation, competitiveness
for nodule formation, and ability to fix nitrogen in antibiotic-resistant mutant of
rhizobial strains (Date and Hurse, 1992; Simon and Kalalova, 1996). Therefore the
kanamycin- resistant mutant strain GM42 was evaluated for its symbiotic effectiveness
in alfalfa and compared with S. meliloti 1021.
Sindhu and Dadarwal (2001) tested the nodulation ability and symbiotic effectiveness of
spontaneous streptomycin - resistant mutants. Their results showed that acquisition of
streptomycin resistance in Rhizobium sp. Cicer strains is associated with decreased
symbiotic effectiveness in chickpea. In fact, some mutants showed Nod- phenotype,
some showed Nod+ fix- phenotype, and others showed decreased nodule number. By
contrast, GM42 was not found symbiotically inferior in comparison with parent strain,
owing to the absence of variation in the nodule formation of GM42 in alfalfa. In fact, no
significant difference, comparing the number of nodules obtained inoculating alfalfa
seeds with 1021 or GM42, was found. This result showed that the antibiotic-resistant
mutated phenotype is not always associated with variation in effectiveness of nodule
formation according to Pankhurst (1977), Lewis et al. (1987), and Rynne et al. (1991).
They found little or no change in symbiotic effectiveness in antibiotic resistant mutants
of Lotus rhizobia, R. meliloti,and R.leguminosarum bv. trifolii.

108
Moreover, the metabolic characterization of GM42, on the basis of its capability to
metabolize different carbon sources, was performed. GM42 and S. Meliloti 1021
showed a very different metabolic fingerprint. It turned out interesting to notice the
inability of GM42 to metabolize mannitol, a typical carbon source that rhizobial strains
are able to metabolize. In order to confirm these results, exponential growth analysis of
the strain 1021 and GM42 was performed. GM42 was not able to grow in minimal
medium with mannitol as sole carbon source. In fact, S. meliloti 1021 showed an
asymptotic value equal to 1.67 OD600 and a maximum specific growth rate value equal
to 0.89 OD600 h-1. By contrast, there no was significant variation of the growth in GM42
(Nmax = 0.47 OD600; µmax = 0.03 OD600 h-1), confirming the result obtained by using
MicroLog Biolog.
II.4.2. KANAMYCIN RESISTANCE DETERMINANTS
Different molecular approaches were performed to identify gene or genes determining
the kanamycin-resistant phenotype in GM42. We analyzed the chromosomal region
comprising SMc03094 and SMc03095 genes.
Capela and co-workers (2001) identified a “putative aminoglycoside 3’-O-
phosphotransferase” as the hypothetical product obtained by the transcription of the
SMc03094 chromosomal gene. Moreover, Alexandre and co-workers (2006) found
congruence of results obtained clustering different isolates by the use of intrinsic
antibiotic resistance (IAR) and 16S rDNA RFLP/sequence isolates, which suggested a
chromosomal location for antibiotic resistance genes. This hypothesis is supported by
the identification of two antibiotic resistance genes, coding for kanamycin and
109
streptomycin resistance proteins, annotated in the rhizobial chromosome of M. loti
strain MAFF303099 (Kaneko et al., 2000).
RT-PCR of the SMc03094 gene showed the expression of this gene in GM42 but not in
S. meliloti 1021. Moreover, the western-blotting, performed by using anti-Neomycin
Phosphotransferase II (NPTII) antibody as primary antibody, showed the presence of an
aminoglycoside phosphotransferase protein in GM42. On the contrary, no signal
corresponding to a protein was found in S. meliloti 1021.
In addition, the SMc03094 gene was cloned and expressed in E. coli cells. In this case,
the transformed cells showed kanamycin-resistant phenotype, thus confirming the
previous results.
In order to have a major vision of the transcriptional differences between GM42 and S.
meliloti 1021, DNA-microarrays were performed. An oligonucleotide-based whole-
genome S. meliloti 1021 was used and the transcriptional profiles of GM42 and S.
meliloti 1021 were analyzed and compared.
As we expected, results showed a few transcriptional differences in GM42. In fact, with
this approach it is possible to analyze partially the genome sequence.
Comparing the expression of the open reading frame sequences obtained from GM42
and S. meliloti 1021, only seven genes were up-regulated and six genes were down-
regulated in GM42, and most of them coded for unknown proteins. Interestingly, the
SMc03095 gene was up-regulated (M-value = 1.93). By contrast the SMc03094 gene
was clustered with genes that showed standard expression level. SMc03094 gene
showed M-value equal to 0.89; therefore this gene is up-regulated if compared with S.
meliloti 1021, but the statistical analysis used regarded as differentially expressed the
genes with M ≥ 1 or M ≤ -1. These results confirmed that correlation might be between
kanamycin resistance and the chromosomal region analyzed.
110
Therefore, in order to ascertain the involvement or not of SMc03094 and SMc03095
genes in kanamycin- resistant phenotype, functional analysis of these genes was
performed in GM42. Two plasmids for the destruption and replacement of SMc03094
and SMc03095 genes in S. meliloti 1021 were constructed. Because of the difficulty to
clone the LacZ-aacC1 cassette (about 4.5 kb), transformation experiments of GM42 are
in progress at the moment.
The microarrays analysis showed many regulation differences if intergenic regions were
compared. Interestingly, the intergenic region 4934, which is located on the
chromosome between SMc03095 and SMc03094, was up-regulated, showing a M-value
equal to 2.33, the highest value obtained. Since the intergenic region 4934 is upstream
of SMc03094 gene, it might be the promoter region for the transcription of this gene.
Therefore, to check the promoter region that regulates the transcription of SMc03095
and SMc03094 genes, the intergenic regions located upstream of these two genes were
cloned in the constructed promoter probe pGvig. The activity of the hypothetical
promoter region was measured by the luminescence emitted from the prometerless
EGFP gene located downstream of the cloned insert. Unfortunately, the experiment
failed because there was a mistake at the beginning of the nucleotide sequence in the
EGFP gene used. In fact, the empty plasmid emitted a high fluorescence and thus it was
impossible to measure the real fluorescence emitted by the activity of promoter regions
inside the transformed cells of S. meliloti 1021.
Therefore, another promoter probe vector (pSRPP18) was used. In this case, the
hypothetical promoter regions were cloned upstream of the LacZ gene. The activity of
the promoter will be measured by β-Galactosidase assays of S. meliloti strains carrying
the integrated promoter probe vector pSRPP18 with promoter fragment inserts.

111
The promoter probe vectors pSRPP18v were obtained and, at the moment,
transformation experiments of S. meliloti 1021 are in progress.
The results obtained confirm that the SMc03094 gene codes for a kanamycin resistant
protein when transcripted in E. coli. Moreover, the transcription of SMc03094 and
SMc03095 genes occurs in GM42 but not in S. meliloti 1021, and an amynoglycoside
phosphotransferase protein is coded in GM42 but not in the parental strain. Therefore,
correlation might be between kanamycin-resistant phenotype and the chromosomal
region analyzed in GM42.
Further analysis will be performed to understand metabolic and transcriptional
differences in GM42.

112
II.5. REFERENCES
Alexandre, A., Laranjo, M., Oliveira, S., 2006. Natural populations of chickpea rhizobia
evacuated by antibiotic resistance profiles and molecular methods. Microb. Ecol. 51,
128-136.
Bahlawane, C., Baumgarth, B., Serrania, J., Rüberg, S., Becker, A., 2008. Fine-tuning
of galactoglucan biosynthesis in Sinorhizobium melilotiby differential WggR
(ExpG)-, PhoB-, and MucR-dependent regulation of two promoters. J. Bacteriol.
190, 3456-3466.
Bakker, E.P., 1992. Aminoglycoside and aminocyclitol antibiotics: hygromycin B is an
atypical bactericidal compound that exerts effects on cells of Escherichia coli
characteristics for bacteriostatic aminocyclitols. J. Gen. Microbiol. 138, 563-569.
Becker, A., Schmidt, M., Jäger, W., Pühler, A., 1995. New gentamicin-resistance and
lacZpromoter-probe cassette suitable for insertion mutagenesis and generation of
transcriptional fusions. Gene 162, 37-39.
Becker, A., Bergès, H., Krol, E., Bruand, C., Rüberg, S., Capela, D., Lauber, E.,
Meilhoc, E., Ampe, F., Bruijn, F.J.d., Fourment, J., Francez-Charlot, A., D. Kahn,
H.K., Liebe, C., Pühler, A., Weidner, S., Batut, J., 2004. Global changes in gene
expression in Sinorhizobium meliloti 1021 under microoxic and symbiotic
conditions. Mol. Plant Microbe Interact. 17, 292-303.
Beiko, R.G., Harlow, T.J., Ragan, M.A., 2005. Highways of gene sharing in
prokaryotes. Proc. Natl. Acad. Sci. USA 102, 14332-14337.
Beringer, J.E., 1974. R factor transfer in Rhizobium leguminosarum. J. Gen. Microbiol.
84, 188-198.
Blaiotta, G., Pepe, O., Mauriello, G., Villani, F., Andolfi, R., Moschetti, G., 2002. 16S-
23S rDNA intergenic spacer region polymorphism of Lactococcus garviae,
Lactococcus raffinolactis and Lactococcus lactis as revealed by PCR and nucleotide
sequence analysis. Syst. Appl. Microbiol. 25, 520-527.
Bromfield, E.S.P., Lewis, D.M., Baran, L.R., 1985. Cryptic plasmid and rifampicin
resistance in R. meliloti influence nodulation competitiveness. J. Bacteriol. 164, 410-
413.

113
Canchaya, C., Fournous, G., Chibani-Chennoufi, S., Dillmann, M.L., Brussow, H.,
2003. Phage as agents of lateral gene transfer. Curr. Opin. Microbiol. 6, 417-424.
Capela, D., Barloy-Hubler, F., Gouzy, J., Bothe, G., Ampe, F., Batut, J., Boistard, P.,
Becker, A., Boutry, M., Cadieu, E., Dreano, S., Gloux, S., Godrie, T., Goffeau, A.,
Kahn, D., Kiss, E., Lelaure, V., Masuy, D., Pohl, T., Portetelle, D., Puhler, A.,
Purnelle, B., Ramsperger, U., Renard, C., Thebault, P., Vandenbol, M., Weidner, S.,
Galibert, F., 2001. Analysis of the chromosome sequence of the legume symbiont
Sinorhizobium meliloti strain 1021. Proc. Natl. Acad. Sci. U.S.A. 98, 9877-9882.
Casse, F., Boucher, C., Julliot, J.S., Michel, M., Denarié, J., 1979. Identification and
characterization of large plasmids in Rhizobium meliloti using agarose gel
electrophoresis. J. Gen. Microbiol. 113, 229-242.
Corich, V., Giacomini, A., Ollero, F.J., Squartini, A., Nuti, M.P., 1991. Pulsed-field
electrophoresis in contour-clamped homogeneous electric fields (CHEF) for the
fingerprinting of Rhizobium spp. FEMS Microbiol. Lett. 83, 193-198.
Dadarwal, K.R., Sindhu, S.S., Garg, R.P., 1987. Effect of curing on genes controlling
antibiotic resistance and symbiosis in cowpea misc. rhizobia. Ind. J. Micobiol. 27,
16-21.
Date, R.A., Hurse, L.S., 1992. Growth, competitiveness and effectiveness of
spontaneous antibiotic resistant strains of Bradyrhizobium for Desmodium intortum
cv. Greenleaf. Soil Biol. Biochem. 24, 33-39.
Davis, B.D., Chen L.L., Tai, P.C., 1986. Misread protein creates membrane channels:
an essential step in the bactericidal action of aminoglycosides. Proc. Natl. Acad. Sci.
USA 83, 6164-6168.
Davison, J., 1988. Plant beneficial bacteria (review). Biotechnology 6, 282-286.
Davison, J., 1999. Genetic exchange between bacteria in the environment. Plasmid 42,
73-91.
Dondrup, M., Goesmann, A., Bartels, D., Kalinowski, J, Krause L., Linke, B., Rupp, O.,
Sczyrba, A., Pühler, A., Meyer, F., 2003. EMMA: a platform for consistent storage
and efficient analysis of microarray data. J. Biotechnol. 106, 135-146.
Galibert, F., Finan, T.M., Long, S.R., Pühler, A., Abola, P., Ampe, F., Barloy-Hubler,
F., Barnett, M.J., Becker, A., Boistard, P., Bothe, G., Boutry, M., Bowser,
L., Buhrmester, J., Cadieu, E., Capela, D., Chain, P., Cowie, A., Davis, R.W.,
Dreano, S., Federspiel, N.A., Fisher, R.F., Gloux, S., Godrie, T., Goffeau,
114
A., Golding, B., Gouzy, J., Gurjal, M., Hernandez-Lucas, I., Hong, A., Huizar, L.,
Hyman, R.W., Jones, T., Kahn, D., Kahn, M.L., Kalman, S., Keating, D.H., Kiss,
E., Komp, C., Lelaure, V., Masuy, D., Palm, C., Peck, M.C., Pohl, T.M., Portetelle,
D., Purnelle, B., Ramsperger, U., Surzycki, R., Thebault, P., Vandenbol, M.,
Vorhölter, F.J., Weidner, S., Wells, D.H., Wong, K., Yeh, K.C., Batut J., 2001. The
composite genome of the legume symbiont Sinorhizobium meliloti. Science 293,
668-672.
Gebhard, F., Smalla, K., 1998. Transformation of Acinetobacter sp. strain BD413 by
transgenic sugar beet DNA. Appl. Environ. Microbiol. 64, 1550-1554.
Gogarten, J.P., Townsend, J.P., 2005. Horizontal gene transfer, genome innovation and
evolution. Nat. Rev. Microbiol .3, 679-687.
Frost, L.S., Leplae, R., Summers, A.O., Toussaint, A., 2005. Mobile genetic elements:
the agents of open source evolution. Nat. Rev. Microbiol. 3, 722-732.
Inoue, H., Nojima, H., Okayama, H., 1990. High efficiency transformation of
Escherichia coli with plasmids. Gene, 96, 23-28.
Josey, D.P., Beynon, J.L., Johnston, A.W.B., Beringer, J.E., 1979. Strain identification
of Rhizobium using intrinsic antibiotic resistance. J. Appl. Bacteriol. 46, 343-350.
Kaneko, T., Nakamura, Y., Sato, S., Asamizu, E., Kato, T., Sasamoto, S., Watanabe, A.,
Idesawa, K., Ishikawa, A., Kawashima, K., Kimura, T., Kishida, Y., Kiyokawa, C.,
Kohara, M., Matsumoto, M., Matsuno, A., Mochizuki, Y., Nakayama, S., Nakazaki,
N., Shimpo, S., Sugimoto, M., Takeuchi, C., Yamada, M., Tabata, S., 2000.
Complete genome structure of the nitrogen-fixing symbiotic bacterium
Mesorhizobium loti. DNA Res. 7, 331-338.
Kirchner, O., Tauch, A., 2003. Tools for genetic engineering in the amino acid-
producing bacterium Corynebacterium glutamicum. J. Biotechnol. 104, 287-299.
Laguerre, G., Allard, M.R., Revoy, F., Amarger, N., 1994. Rapid identification of
Rhizobia by Restriction Fragment Length Polymorphism analysis of PCR-amplified.
Appl. Environ. Microbiol. 60, 56-63.
Lewis, D.M., Bromfield, E.S.P., Barran, L.R., 1987. Effect of rifampicin resistance on
nodulating competitiveness of Rhizobium meliloti. Can. J. Microbiol. 33, 343-345.
Mahillon, J., Chandler, M., 1998. Insertion sequences. Microbiol. Mol. Biol. Rev. 62,
725-774.

115
McClelland, M., Jones, R., Patel, Y. Nelson, M., 1987. Restriction endonuclease for
pulsed field mapping of bacterial genomes. Nucleic Acids Res. 15, 5985-6005.
Meade, H.M., Signer, E.R., 1977.genetic mapping of rhizobium meliloti. Proc. Natl.
Acad. Sci. USA 74, 2076-2078.
Mollen, M., Benbrook, C., Benbrook, K., 2001. Hogging It: Estimates of Antimicrobial
Abuse in Livestock. Cambridge, MA: Union of concerted Scientists (UCS)
Publications.
Moschetti, G., Peluso, A.L., Protopapa, A., Anastasio, M., Pepe, O., Defez, R., 2005.
Use of nodulation pattern, stress tolerance, nodC gene amplification, RAPD-PCR
and RFLP-16S rDNA analysis to discriminate genotypes of Rhizobium
leguminosarum biovar viciae, Syst. Appl. Microbiol. 28, 619-631.
Nemergut, D.R., Martin, A.P., Schmidt, S.K., 2004. Integron diversity in heavy-metal-
contaminated mine tailings and inferences about integron evolution. Appl. Environ.
Microbiol. 70, 1160-1168.
Pankhurst, C.E., 1977. Symbiotic effectiveness of antibiotic-resistant mutants of fast-
and slow- growing strains of Rhizobium nodulating Lotus sp. Can. J. Microbiol. 23,
1026-1033.
Pearson, A.J., Bruce, K.D., Osborn, A.M., Ritchie, D.A., Strike, P., 1996. Distribution
of class II transposase and resolvase genes in soil bacteria and their association with
mer genes. Appl. Environ. Microbiol. 62, 2961-2965.
Piepersberg, W., 1997. Molecular Biology. Biochemistry, and fermentation of
aminoglycoside antibiotics. In: Biotechnology of industrial antibiotics. Strohl W.,
Ed., Marcel Dekker, New York, p. 81-163.
Priefer, U.B., Auag, J., Boesten, B., Bouhmouch, I., Defez, R., Filali-Maltouf, A.,
Miklis, M., Moawad, H., Mouhsne, B., prel, J., Schluter, A., Senatore, B., 2001.
Characterization of Phaseolus symbionts isolated from Mediterranean soils and
analysis of genetic factors related to pH tolerance. J. Bacteriol. 91, 223-236.
Ramirez, M.E., Israel, D.W., Wollum, A.G., 1998. Using spontaneous antibiotic
resistant mutants to assess competitiveness of bradyrhizobial inoculants for
nodulation of soybean. Can. J. Microbiol. 44, 753-758.
Rüberg, S., Tian, Z.X., Krol, E., Linke, B., Meyer, F., Wang, Y., Pühler, A., Weidner,
S., Becker, A., 2003. Construction and validation of a Sinorhizobium meliloti whole
116
genome DNA microarray: genome- wide profiling of osmoadaptive gene expression.
J. Biotechnol. 106, 255-268.
Rynne, F.G., Dilworth, M.J., Glenn, A.R., 1991. The effect of chloramphenicol
resistance mutations on the nodulation competitiveness of Rhizobium leguminosarum
bv. trifolii. Soil Biol. Biochem. 23, 903-905.
Rysz, M., Alvarez, P.J.J., 2004. Amplification and attenuation of tetracycline resistance
in soil bacteria: aquifer column experiments. Water Res. 38, 3707-3712.
Sambrook, J., Fritsch, E.F., Maniatis, T., 1989. Molecular cloning: a laboratory
manual. Cold Spring Harbor Laboratory Press, Cold Spring Harbor, N.Y.
Schäfer, A., Tauch, A., Jäger, W., Kalinowski, J., Thierbach, G., Pühler, A., 1994.
Small mobilizable multi-purpose cloning vectors derived from the Escherichia coli
plasmids pK18 and pK19: selection of defined deletions in the chromosome of
Corynebacterium glutumicum. Gene 145, 69-73.
Schwinghamer, E.A., 1967. Effectiveness of Rhizobium as modified by mutation for
resistance to antibiotics. Antonie van Leeuwenhoek 33, 121-136.
Sharma, P.K., Anand, R.C., Lakshminarayana, K., 1991. Construction of Tn5 tagged
mutants of Rhizobium spp. (Cicer) for ecological studies. Soil Biol. Biochem. 23,
881-885.
Simon, T., Kalalova, S., 1996. Preparation of antibiotic resistant mutants of rhizobia and
their use. Rostlinna Vyroba 42, 385-389.
Sindhu, S.S., Dadarwal, K.R., 2001. Symbiotic effectiveness of spontaneous antibiotic-
resistant mutants of Rhizobium sp. Cicer nodulating chickpea (Cicer arietinum).
Microbiol. Res. 155, 325-329.
Thomas, C.M., Nielsen, K.M., 2005. Mechanisms of, and barriers to, horizontal gene
transfer between bacteria. Nat. Rev. Microbiol. 3, 711-721.
van Veen, J.A., van Overbeek, L.S., van Elsas, J.D., 1997. Fate and activity of
microorganisms introduced into soil. Microbiol. Mol. Biol. Rev. 61, 121-135.
Ventorino, V., Chiurazzi, M., Moschetti, G., 2007. Dati preliminari sulla
caratterizzazione di un mutante di Sinorhizobium meliloti 1021 kanamicina resistente
e sale sensibile. Proc. of the XII Giornate Scientifiche-Polo delle Scienze e
Tecnologie per la Vita, Napoli, 15-16 Giugno, p. 480.

117
Ventorino, V., Chiurazzi, M., Aponte, M., Pepe, O., Moschetti, G., 2007. Genetic
Diversity of a natural population of Rhizobium leguminosarum bv. viciae nodulating
plants of Vicia faba in the Vesuvian area. Curr. Microbiol. 55, 512-517.
Vincent, J.M., 1970. A manual for the Practical Study of Root. Nodule Bacteria. IBP
handbook 15, Oxford, Blackwell.
Weisburg, W.G., Barns, S.M., Pelletier, D.A., Lane, D.J.,1991. 16S ribosomal DNA
amplification for phylogenetic study. J. Bacteriol. 173, 697-703.
Wilson, M., Lindow, S.E.,1993. Release of recombinant microorganisms. Annu. Rev.
Microbiol. 47, 913-944.
Wright G.D., Thompson, P.R., 1999. Aminoglycoside phosphotransferases: proteins,
structure, and mechanism. Front Biosci. 4, D9-21.
Xavier, G.R., Martins, L.M.V., Neves, M.C.P., Rumjanek, N.G., 1998. Edaphic factors
as determinants for the distribution of intrinsic antibiotic resistance in a cowpea
rhizobia population. Biol. Fertil. Soils 27, 386-392.

118
II.6. FIGURES
Figure 1. Agarose gel electrophoresis of 16S rDNA-RFLP products by using CfoI, HinfI, MspI, and NdeII endonucleases restriction enzymes. (a) S. meliloti 1021, (b) GM42, (c) E. coli S17-1, (d) R. phaseoli 163, (e) negative control. M, 1 kb DNA Ladder Plus (Invitrogen) used as molecular weight marker.

119
Figure 2. Agarose gel electrophoresis of RAPD-PCR products by using CC1 primer. (a) S. meliloti 1021, (b) GM42, (c) R. phaseoli 163, (d) negative control. M, 1 kb DNA Ladder Plus (Invitrogen) used as molecular weight marker.

120
Figure 3. REA-PFGE using XbaI endonucleases restriction enzyme. (a) S. meliloti 1021, (b) GM42, (c) E. coli S17-1, (d) R. phaseoli 163. M, 8-48 kb DNA Ladder (Bio-Rad) used as molecular weight marker.

121
Figure 4. Agarose gel electrophoresis of: smc03094 RT-PCR-products from S. meliloti 1021 (a) and GM42 (b); nodL gene RT-PCR-products from S. meliloti 1021 (c) and GM42 (d); 16S rDNA gene RT-PCR-products from S. meliloti 1021 (e) and GM42 (f). M, 1 kb DNA Ladder Plus (Invitrogen)used as molecular weight marker.

122
Figure 5. Western-blotting. The anti-Neomycin Phosphotransferase II was used as primary antibody. a, E. coli S17-1 pSup 1021; b, E. coli DH5α; c-e, GM42; f-h, S. meliloti 1021. M, precision plus protein standard Dual Color (BioRad).

123
Figu
re 6
.D
NA
-mic
roar
rays
ana
lysi
s. Ex
pres
sion
pro
files
of t
he
open
read
ing
fram
e se
quen
ces
in
GM
42 v
ersu
s S. m
elilo
ti10
21. G
reen
spot
, up-
regu
late
d ge
ne; b
lack
spot
, wild
type
exp
ress
ion
leve
l; re
d sp
ot, d
own-
regu
late
d ge
ne.

124
Figu
re 7
. D
NA
-mic
roar
rays
ana
lysi
s. Ex
pres
sion
pro
files
of t
he
open
read
ing
fram
e se
quen
ces
and
inte
rgen
ic re
gion
s in
GM
42 v
ersu
s S.
mel
iloti
1021
. Gre
en sp
ot, u
p-
regu
late
d ge
ne; b
lack
spot
, wild
type
exp
ress
ion
leve
l; re
d sp
ot, d
own-
regu
late
d ge
ne.

125
Figure 8. Promoter probe vector pGvig. PF, promoter fragment.

126
Figure 9. Promoter probe vector pRSPP18. PF, promoter fragment; aacC1, gentamicin resistance gene.

127
Figure 10. Plasmid vector pK18mobsac. Upstream-5’, upstream chromosomal region of gene and 5’-end of gene (insert I), 3’-downstream, 3’-end of gene and downstream chromosomal region of gene (insert II).

128
II.7. TABLES
Table 1. Metabolic fingerprints of S. meliloti 1021 and GM42. The + and - symbols correspond to the ability or not to metabolize a particular carbon source, respectively. Only the differences are reported.
Carbon Source S. meliloti 1021 GM42
Dextrin - +N-Acetyl-D-glucosamine - +
D-Arabitol - +
D-Fructose - +
L-Fucose - +Gentiobiose - +
-D-Glucose - +
-D-Lactose - +Maltose + -
D-Mannitol + -
Xylitol - +
Formic Acid - +D-Galactonic-Acid Lactone + -
D-Gluconic Acid + -
-Hydroxy Butyric Acid - +
- Hydroxy Butyric Acid - +
Itaconic Acid + -
-Keto Valeric Acid - +
D,L-Lactic Acid - +Propionic Acid - +
Quinic Acid + -
L-Phenylalanine + -L-Pyroglutamic Acid + -
D,L-Carnitine + -
Inosine + -Uridine + -
Thymidine + -
Phenythylamine + -
D,L--Glycerol Phosphate + -

129
Table 2. Nmax and µmax values measured by Gompertz’s function in S. meliloti 1021 and GM42 grown in minimal medium with mannitol or maltose as carbon source.
STRAIN / CARBON SOURCE Nmax (OD) µmax (h-1)
S.meliloti 1021 / Mannitol 1.67 0.89
GM42 / Mannitol 0.47 0.03
S.meliloti 1021 / Maltose 1.52 0.2
GM42 / Maltose 1.29 0.06
Table 3. Number of nodules per plants (20 plants) obtained after 40 d of growth on hydroponic conditions.
Strain Number nodules
S.meliloti 1021 57.0 9.5
GM42 55.3 8.6