CRISI ECONOMICA ED EFFETTI SULL’OCCUPAZIONE NEI PAESI OCSE Stefano Scarpetta Deputy Director...
24
CRISI ECONOMICA ED EFFETTI SULL’OCCUPAZIONE NEI PAESI OCSE Stefano Scarpetta Deputy Director Directorate for Employment, Labour and Social Affairs OECD VI IBM Rotating Chair in Studi del Lavoro Milan, Italy 24 November, 2012
-
Upload
keith-moring -
Category
Documents
-
view
214 -
download
0
Transcript of CRISI ECONOMICA ED EFFETTI SULL’OCCUPAZIONE NEI PAESI OCSE Stefano Scarpetta Deputy Director...

CRISI ECONOMICA ED EFFETTI SULL’OCCUPAZIONE NEI PAESI OCSE
Stefano Scarpetta
Deputy Director
Directorate for Employment, Labour and Social AffairsOECD
VI IBM Rotating Chair in Studi del LavoroMilan, Italy
24 November, 2012
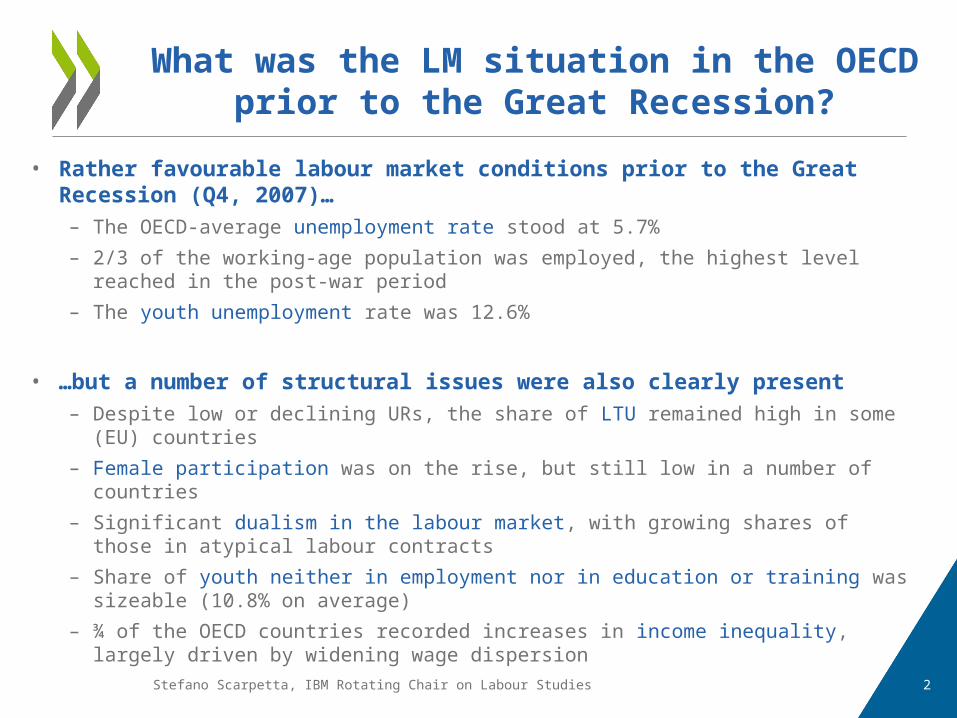
• Rather favourable labour market conditions prior to the Great Recession (Q4, 2007)…– The OECD-average unemployment rate stood at 5.7%
– 2/3 of the working-age population was employed, the highest level reached in the post-war period
– The youth unemployment rate was 12.6%
• …but a number of structural issues were also clearly present– Despite low or declining URs, the share of LTU remained high in some (EU) countries
– Female participation was on the rise, but still low in a number of countries
– Significant dualism in the labour market, with growing shares of those in atypical labour contracts
– Share of youth neither in employment nor in education or training was sizeable (10.8% on average)
– ¾ of the OECD countries recorded increases in income inequality, largely driven by widening wage dispersion
What was the LM situation in the OECD prior to the Great Recession?
2Stefano Scarpetta, IBM Rotating Chair on Labour Studies
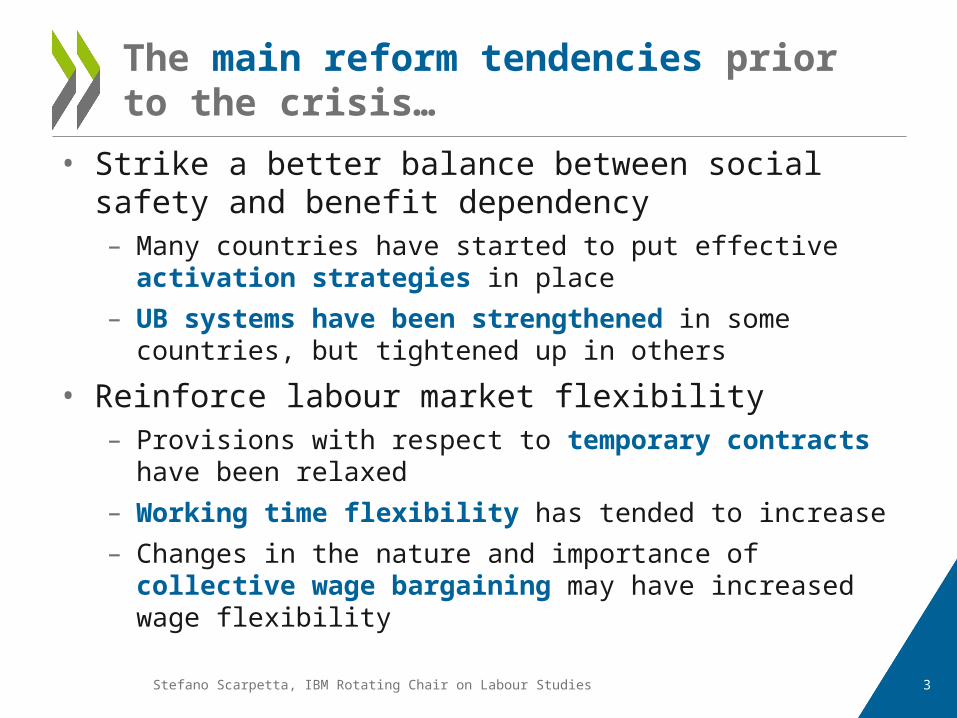
• Strike a better balance between social safety and benefit dependency– Many countries have started to put effective activation
strategies in place
– UB systems have been strengthened in some countries, but tightened up in others
• Reinforce labour market flexibility– Provisions with respect to temporary contracts have
been relaxed
– Working time flexibility has tended to increase
– Changes in the nature and importance of collective wage bargaining may have increased wage flexibility
3
The main reform tendencies prior to the crisis…
Stefano Scarpetta, IBM Rotating Chair on Labour Studies
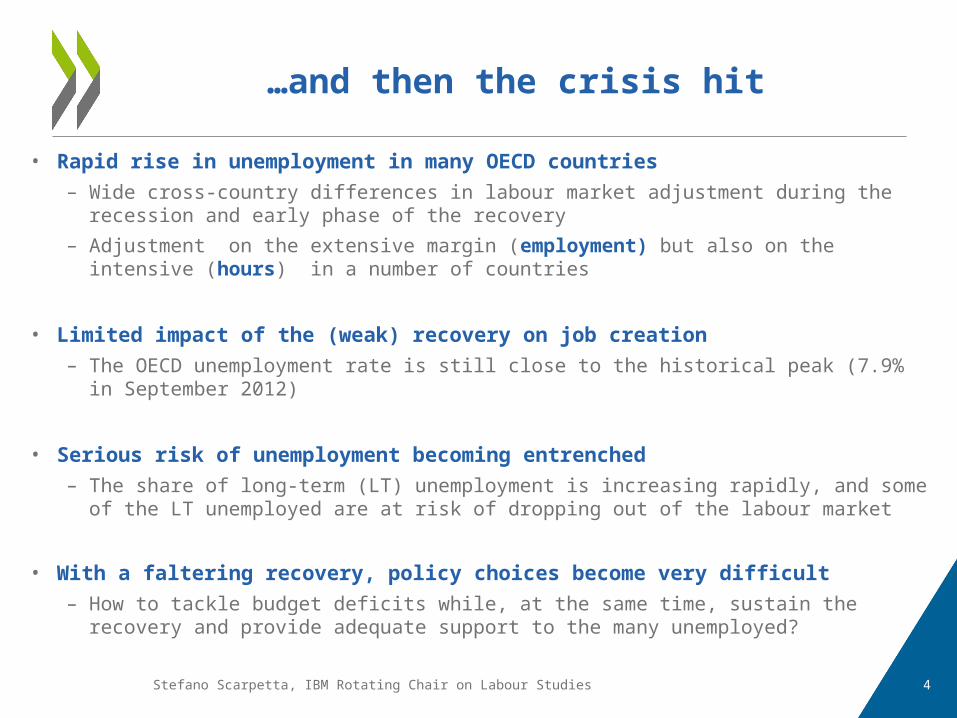
• Rapid rise in unemployment in many OECD countries
– Wide cross-country differences in labour market adjustment during the recession and early phase of the recovery
– Adjustment on the extensive margin (employment) but also on the intensive (hours) in a number of countries
• Limited impact of the (weak) recovery on job creation
– The OECD unemployment rate is still close to the historical peak (7.9% in September 2012)
• Serious risk of unemployment becoming entrenched
– The share of long-term (LT) unemployment is increasing rapidly, and some of the LT unemployed are at risk of dropping out of the labour market
• With a faltering recovery, policy choices become very difficult
– How to tackle budget deficits while, at the same time, sustain the recovery and provide adequate support to the many unemployed?
…and then the crisis hit
4Stefano Scarpetta, IBM Rotating Chair on Labour Studies
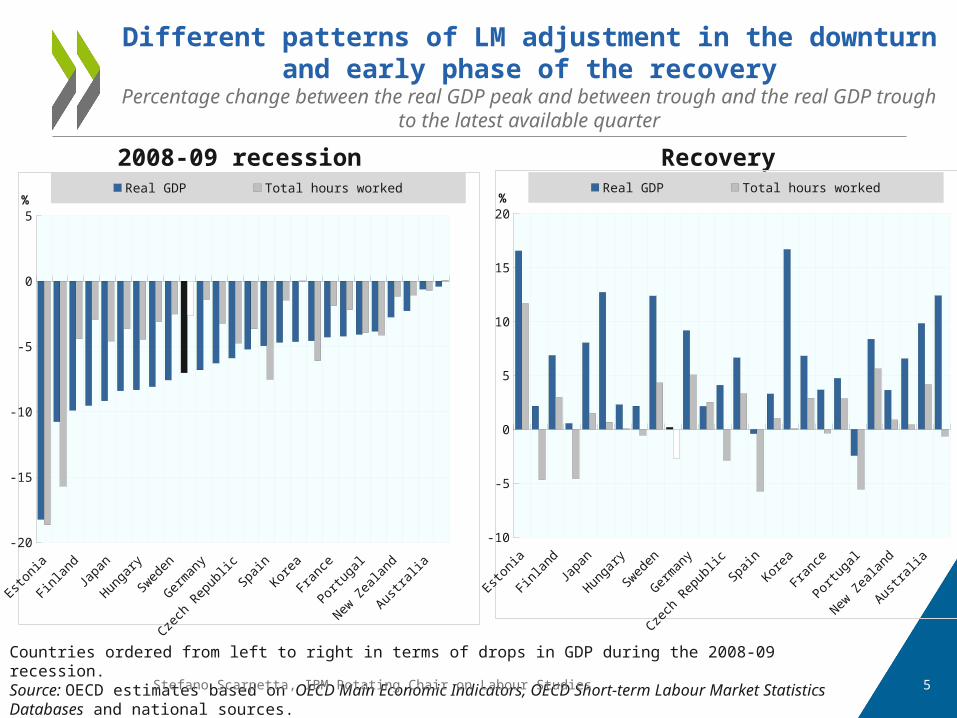
Different patterns of LM adjustment in the downturn and early phase of the recovery
Percentage change between the real GDP peak and between trough and the real GDP trough to the latest available quarter
2008-09 recession Recovery
Countries ordered from left to right in terms of drops in GDP during the 2008-09 recession.Source: OECD estimates based on OECD Main Economic Indicators, OECD Short-term Labour Market Statistics Databases and national sources.
-20
-15
-10
-5
0
5
Real GDP Total hours worked%
-10
-5
0
5
10
15
20
Real GDP Total hours worked%
5Stefano Scarpetta, IBM Rotating Chair on Labour Studies
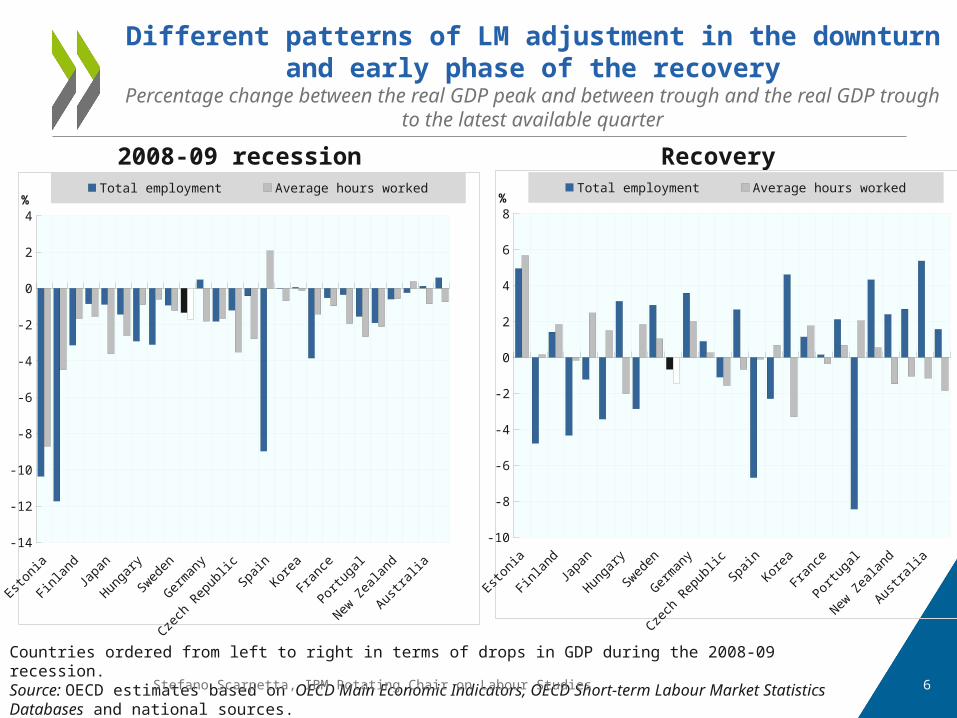
Different patterns of LM adjustment in the downturn and early phase of the recovery
Percentage change between the real GDP peak and between trough and the real GDP trough to the latest available quarter
2008-09 recession Recovery
Countries ordered from left to right in terms of drops in GDP during the 2008-09 recession.Source: OECD estimates based on OECD Main Economic Indicators, OECD Short-term Labour Market Statistics Databases and national sources.
-14
-12
-10
-8
-6
-4
-2
0
2
4
Total employment Average hours worked%
-10
-8
-6
-4
-2
0
2
4
6
8
Total employment Average hours worked%
6Stefano Scarpetta, IBM Rotating Chair on Labour Studies
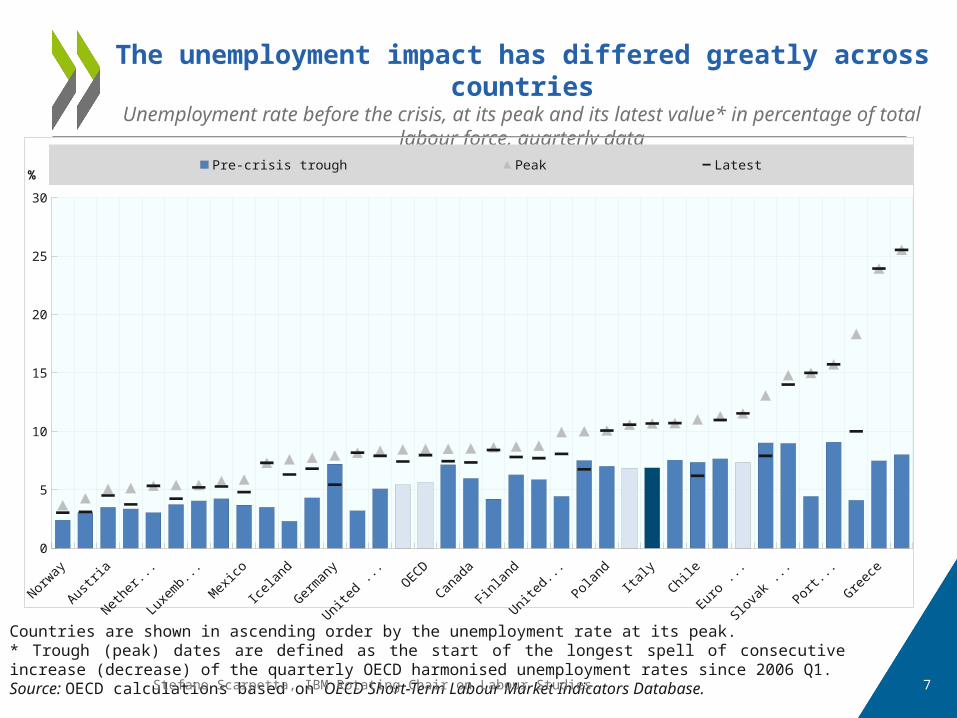
The unemployment impact has differed greatly across countries
Unemployment rate before the crisis, at its peak and its latest value* in percentage of total labour force, quarterly data
Countries are shown in ascending order by the unemployment rate at its peak.* Trough (peak) dates are defined as the start of the longest spell of consecutive increase (decrease) of the quarterly OECD harmonised unemployment rates since 2006 Q1. Source: OECD calculations based on OECD Short-Term Labour Market Indicators Database.
0
5
10
15
20
25
30
Pre-crisis trough Peak Latest%
7Stefano Scarpetta, IBM Rotating Chair on Labour Studies
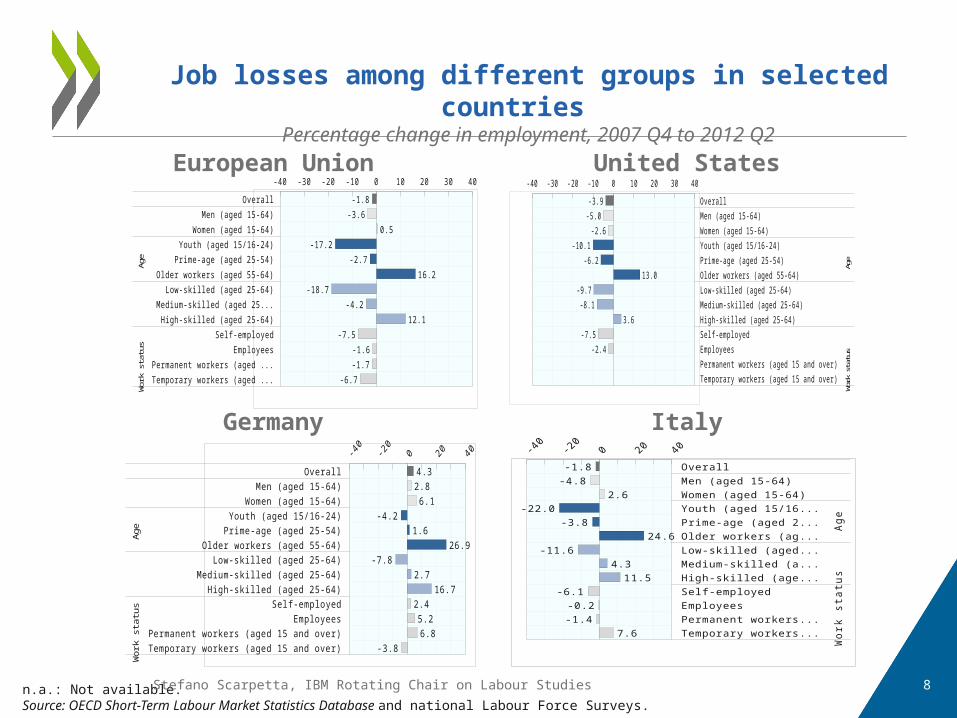
Job losses among different groups in selected countries
Percentage change in employment, 2007 Q4 to 2012 Q2European Union United States
Germany Italy
n.a.: Not available.Source: OECD Short-Term Labour Market Statistics Database and national Labour Force Surveys.
Overall
Men (aged 15-64)
Women (aged 15-64)
Youth (aged 15/16-24)
Prime-age (aged 25-54)
Older workers (aged 55-64)
Low-skilled (aged 25-64)
Medium-skilled (aged 25-64)
High-skilled (aged 25-64)
Self-employed
Employees
Permanent workers (aged 15 and over)
Temporary workers (aged 15 and over)
Sex
Age
Educ
ation
Work
statu
s
-40 -30 -20 -10 0 10 20 30 40
-1.8
-3.6
0.5
-17.2
-2.7
16.2
-18.7
-4.2
12.1
-7.5
-1.6
-1.7
-6.7
OverallMen (aged 15-64)Women (aged 15-64)Youth (aged 15/16-24)Prime-age (aged 25-54)Older workers (aged 55-64)Low-skilled (aged 25-64)Medium-skilled (aged 25-64)High-skilled (aged 25-64)Self-employedEmployeesPermanent workers (aged 15 an...Temporary workers (aged 15 an...
Sex
Age
Educ
atio
nW
ork
stat
us
-40 -30 -20 -10 0 10 20 30 40
-1.8-4.8
2.6-22.0
-3.824.6
-11.64.3
11.5-6.1
-0.2-1.4
7.6
OverallMen (aged 15-64)Women (aged 15-64)Youth (aged 15/16-24)Prime-age (aged 25-54)Older workers (aged 55-64)Low-skilled (aged 25-64)Medium-skilled (aged 25-64)High-skilled (aged 25-64)Self-employedEmployeesPermanent workers (aged 15 and over)Temporary workers (aged 15 and over)
Sex
Age
Educ
ation
Work
status
-40 -30 -20 -10 0 10 20 30 40
-3.9-5.0
-2.6-10.1
-6.213.0
-9.7-8.1
3.6-7.5
-2.4
OverallMen (aged 15-64)
Women (aged 15-64)Youth (aged 15/16-24)
Prime-age (aged 25-54)Older workers (aged 55-64)
Low-skilled (aged 25-64)Medium-skilled (aged 25-64)
High-skilled (aged 25-64)Self-employed
EmployeesPermanent workers (aged 15 and over)Temporary workers (aged 15 and over)
Sex
Age
Educ
atio
nW
ork
stat
us
-40 -30 -20 -10 0 10 20 30 40
4.32.8
6.1-4.2
1.626.9
-7.82.7
16.72.4
5.26.8
-3.8
8Stefano Scarpetta, IBM Rotating Chair on Labour Studies
Martin_S
The OECD average is not available for this quarter (I have to update all the non-EU countries for that.At this point I replace the OECD average with Germany.
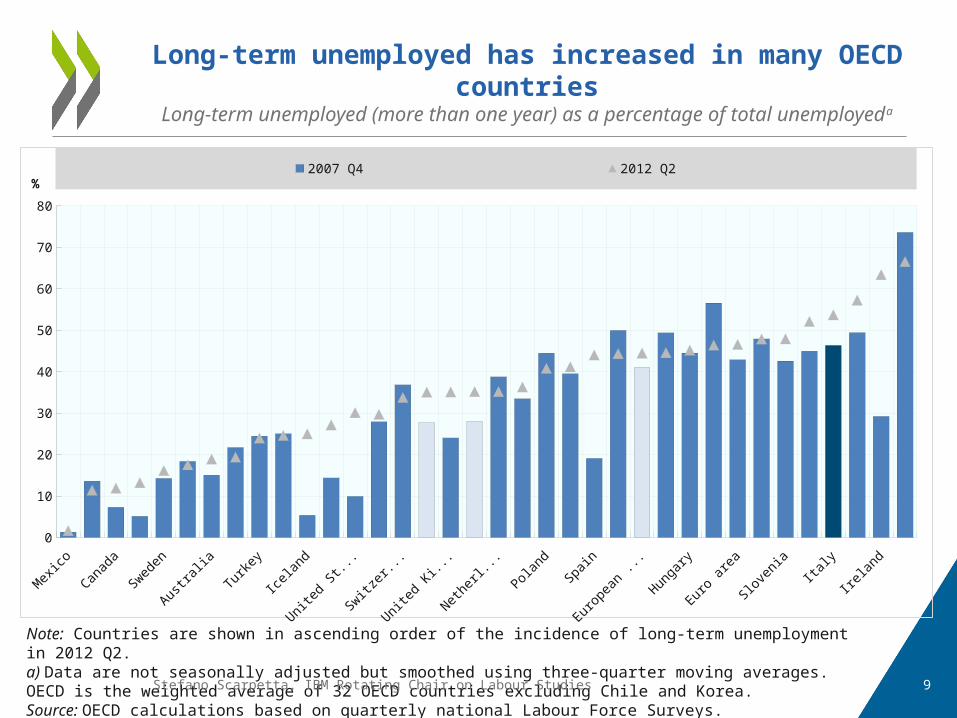
Note: Countries are shown in ascending order of the incidence of long-term unemployment in 2012 Q2. a) Data are not seasonally adjusted but smoothed using three-quarter moving averages. OECD is the weighted average of 32 OECD countries excluding Chile and Korea.Source: OECD calculations based on quarterly national Labour Force Surveys.
Long-term unemployed has increased in many OECD countries
Long-term unemployed (more than one year) as a percentage of total unemployeda
Mexico
Israe
l*
Canad
a
New Zea
land
Sweden
Norway
Austral
ia
Finland
Turkey
Austria
Icelan
d
Denmark
United S
tates
Luxem
bourg
Switzerla
ndOECD
United K
ingdo
m G7
Netherl
ands
Japan
Poland
France
Spain
Czech R
epub
lic
Europe
an Unio
n
Belgium
Hunga
ry
German
y
Euro ar
ea
Portug
al
Sloven
ia
Estonia Ita
ly
Greece
Irelan
d
Slovak
Repub
lic0
10
20
30
40
50
60
70
80
2007 Q4 2012 Q2%
9Stefano Scarpetta, IBM Rotating Chair on Labour Studies
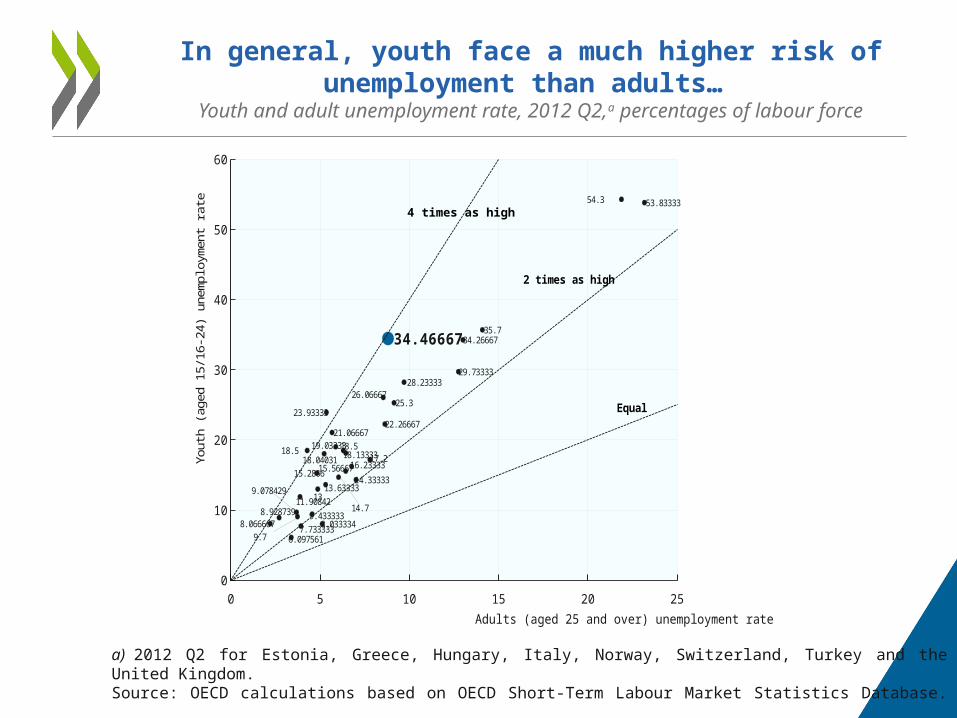
In general, youth face a much higher risk of unemployment than adults…
Youth and adult unemployment rate, 2012 Q2,a percentages of labour force
a) 2012 Q2 for Estonia, Greece, Hungary, Italy, Norway, Switzerland, Turkey and the United Kingdom.Source: OECD calculations based on OECD Short-Term Labour Market Statistics Database.
0 5 10 15 20 250
10
20
30
40
50
60
11.90842
9.7
18.13333
14.7
15.2866
19.03333
14.33333
22.26667
18.5
25.3
8.033334
54.3
28.23333
13
34.26667
13.63333
34.46667
7.733333
8.928739
18.5
9.078429
9.433333
18.04031
8.066667
26.06667
35.7
29.73333
17.2
53.83333
23.93333
6.097561
15.56667
21.06667
16.23333
Adults (aged 25 and over) unemployment rate
Yout
h (a
ged
15/1
6-24
) une
mplo
ymen
t rat
e
2 times as high
Equal
4 times as high
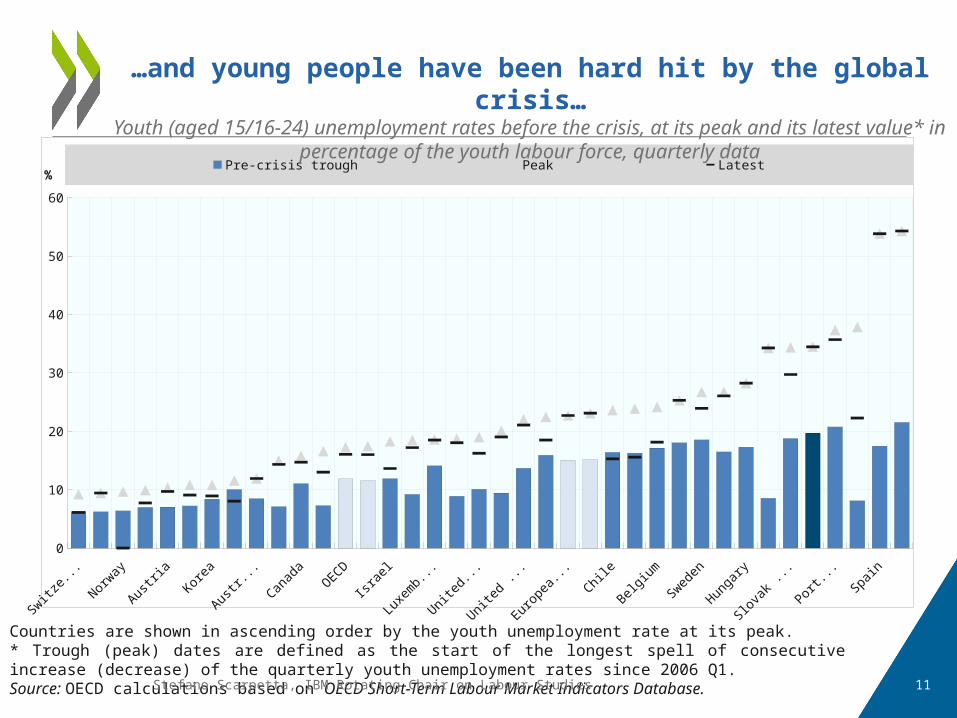
Countries are shown in ascending order by the youth unemployment rate at its peak.* Trough (peak) dates are defined as the start of the longest spell of consecutive increase (decrease) of the quarterly youth unemployment rates since 2006 Q1. Source: OECD calculations based on OECD Short-Term Labour Market Indicators Database.
0
10
20
30
40
50
60
Pre-crisis trough Peak Latest%
…and young people have been hard hit by the global crisis…
Youth (aged 15/16-24) unemployment rates before the crisis, at its peak and its latest value* in percentage of the youth labour force, quarterly data
11Stefano Scarpetta, IBM Rotating Chair on Labour Studies
12
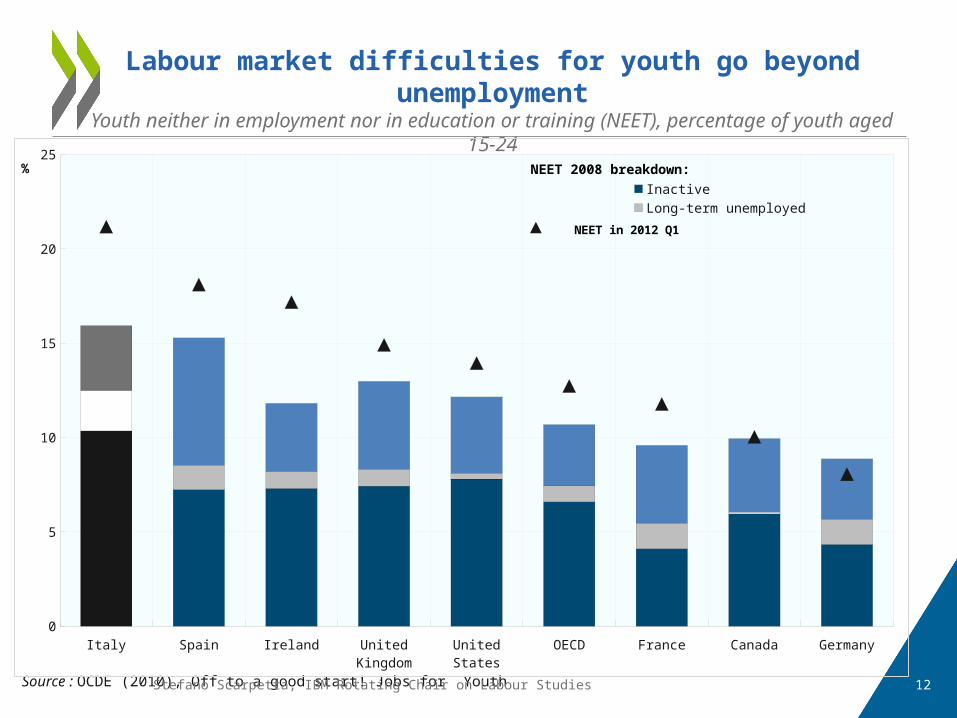
Labour market difficulties for youth go beyond unemployment
Youth neither in employment nor in education or training (NEET), percentage of youth aged 15-24
Source : OCDE (2010), Off to a good start! Jobs for Youth
Italy Spain Ireland United Kingdom United States OECD France Canada Germany0
5
10
15
20
25
Inactive Long-term unemployed Short-term unemployed
% NEET 2008 breakdown:
NEET in 2012 Q1
Stefano Scarpetta, IBM Rotating Chair on Labour Studies
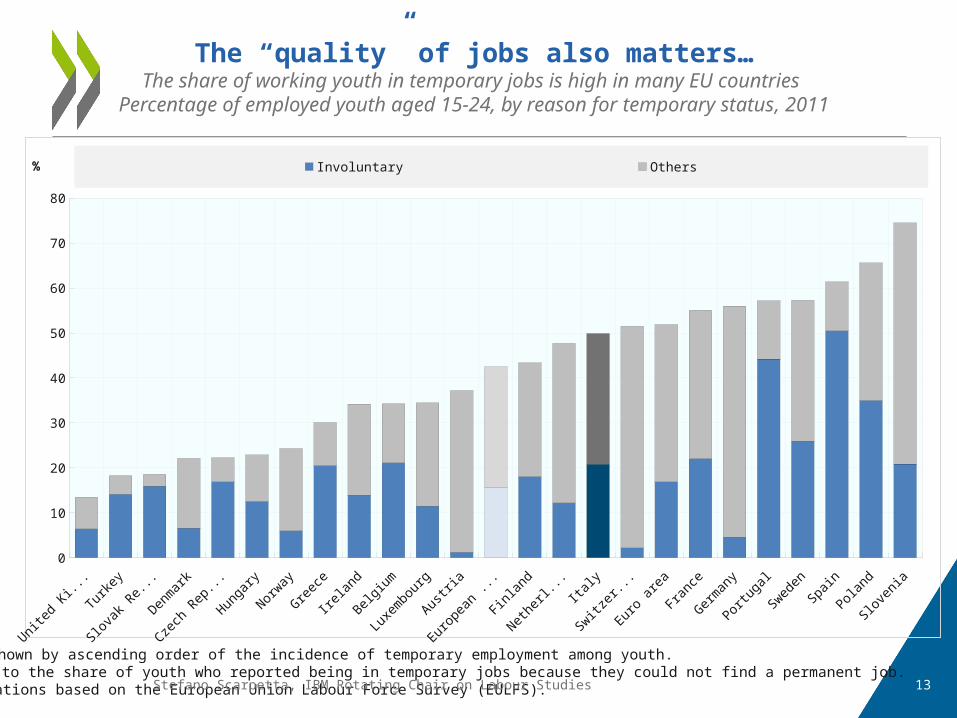
The “quality” of jobs also matters…The share of working youth in temporary jobs is high in many EU countries
Percentage of employed youth aged 15-24, by reason for temporary status, 2011
Note: Countries are shown by ascending order of the incidence of temporary employment among youth. a) The figures refer to the share of youth who reported being in temporary jobs because they could not find a permanent job.Source: OECD calculations based on the European Union Labour Force Survey (EULFS).
United K
ingdo
mTurk
ey
Slovak
Repub
lic
Denmark
Czech R
epub
lic
Hunga
ry
Norway
Greece
Irelan
d
Belgium
Luxem
bourg
Austria
Europe
an Unio
n
Finland
Netherl
ands Ita
ly
Switzerla
nd
Euro ar
eaFran
ce
German
y
Portug
al
Sweden
Spain
Poland
Sloven
ia0
10
20
30
40
50
60
70
80
Involuntary Others%
13Stefano Scarpetta, IBM Rotating Chair on Labour Studies
• Temporary measures in response to the jobs crisis– Increased resources for active labour market policies
– Measures to encourage short-time working
• Structural labour market reforms spurred by the fiscal crisis– Employment protection for regular workers has been
reduced and collective bargaining decentralised
14
Policy developments since the start of the crisis
Stefano Scarpetta, IBM Rotating Chair on Labour Studies
15
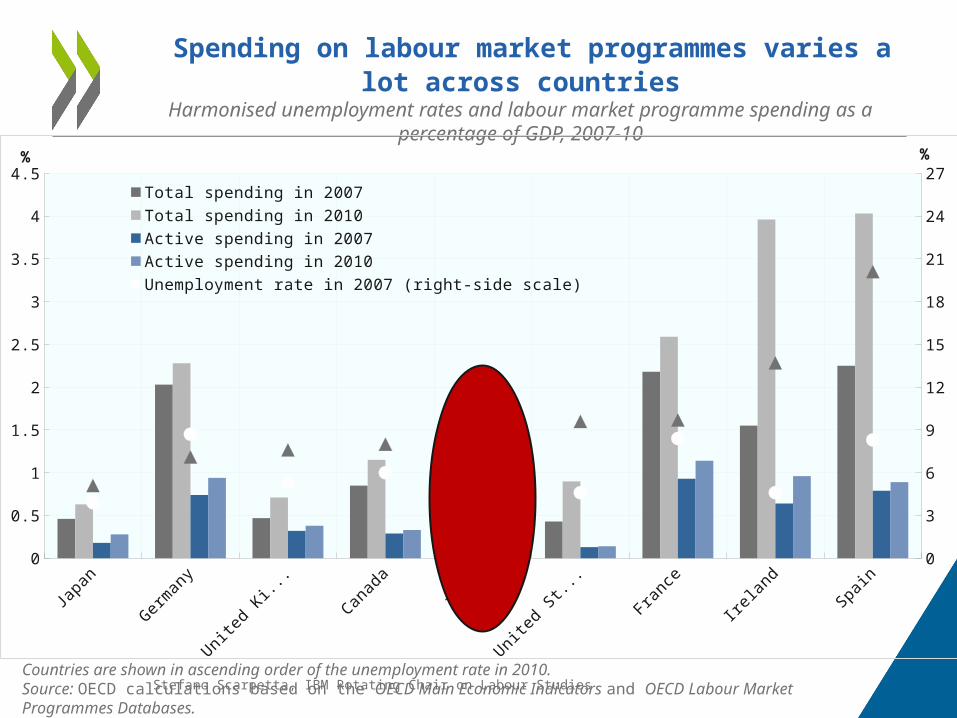
Spending on labour market programmes varies a lot across countries
Harmonised unemployment rates and labour market programme spending as a percentage of GDP, 2007-10
Countries are shown in ascending order of the unemployment rate in 2010.Source: OECD calculations based on the OECD Main Economic Indicators and OECD Labour Market Programmes Databases.
Japa
n
German
y
United
Kingdo
mCan
ada
Italy
United
States
France
Irelan
dSpa
in0
0.5
1
1.5
2
2.5
3
3.5
4
4.5
0
3
6
9
12
15
18
21
24
27
Total spending in 2007 Total spending in 2010
Active spending in 2007 Active spending in 2010
Unemployment rate in 2007 (right-side scale) Unemployment rate in 2010 (right-side scale)
% %
Stefano Scarpetta, IBM Rotating Chair on Labour Studies
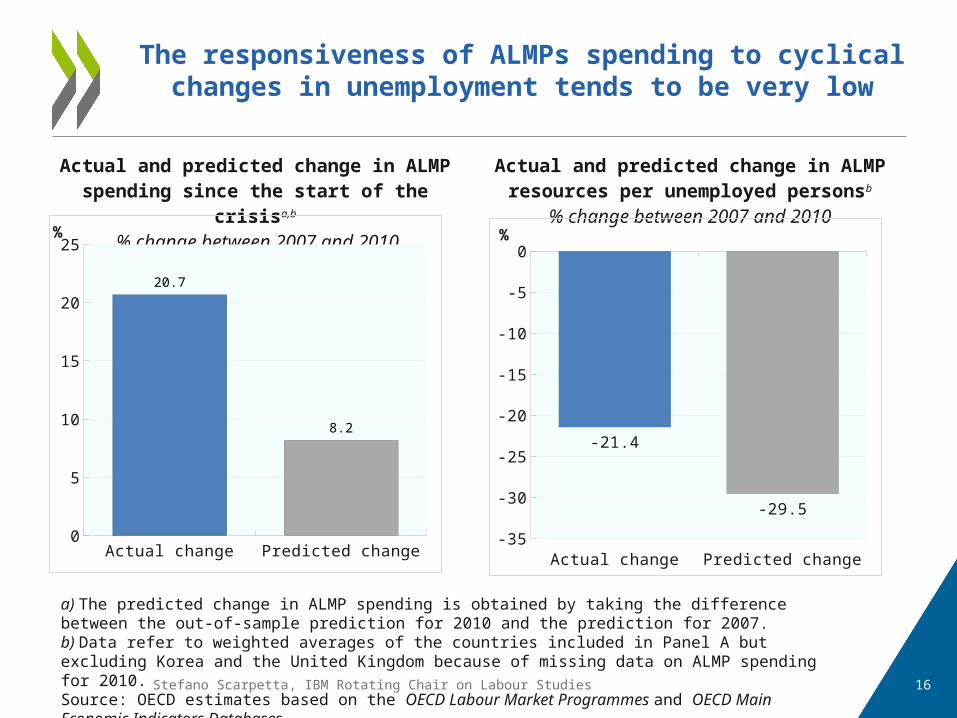
The responsiveness of ALMPs spending to cyclical changes in unemployment tends to be very low
a) The predicted change in ALMP spending is obtained by taking the difference between the out-of-sample prediction for 2010 and the prediction for 2007.b) Data refer to weighted averages of the countries included in Panel A but excluding Korea and the United Kingdom because of missing data on ALMP spending for 2010.Source: OECD estimates based on the OECD Labour Market Programmes and OECD Main Economic Indicators Databases.
Actual and predicted change in ALMP spending since the start of the crisisa,b
% change between 2007 and 2010
Actual and predicted change in ALMP resources per unemployed personsb
% change between 2007 and 2010
Actual change Predicted change0
5
10
15
20
25
20.7
8.2
%
Actual change Predicted change-35
-30
-25
-20
-15
-10
-5
0
-21.4
-29.5
%
16Stefano Scarpetta, IBM Rotating Chair on Labour Studies
17
• The jobs crisis led to longer average unemployment spells – Where unemployment benefit durations are short, temporary extension during the crisis
helps reducing the poverty risk among the long-term unemployed. Extension of benefits in e.g. Canada and especially the United States (with some changes also in Finland, Japan, Portugal)
• Increasing numbers of ineligible jobseekers due to the increase in non-standard work in some countries– Some countries have extended coverage, e.g. Finland, France, Italy, Japan
• Extensions should be temporary and targeted to the most vulnerable with enforcement of job-search requirements
• The crisis can also be an opportunity to reform unemployment benefits to provide a more adequate safety nets to vulnerable groups, conditional on job search, and participation in ALMPs
Providing an adequate safety nets while minimising benefit dependency
18
• Threats to previously successful strategies:– While generally launched to combat high unemployment, their recent
successes in the context of buoyant LD activation is facing a hard test
– Risk for intensity of interventions in the unemployment spell (job search controls; in-depth interviews; action plan follow-up…) to decrease
– Vacancy flows decline, resulting in a lower number of direct referrals.
• Overriding goal: prevent job losers from becoming disconnected from the labour market. Consequently:– Administrative capacity to scale up LM programmes and possible role
of private providers
– How to reach out those who are not (no longer) eligible for first-tier income support schemes
– Automatic vs. discretionary adjustments: while spending for passive LM policies increases automatically in downturns, this is not the case for ALMPs, with a few exceptions.
How to adjust activation strategy during the crisis
19
• Many countries have introduced measures to support labour demand during the crisis:
– Subsidies for the reduction in working time (e.g., 22 OECD countries);
– Reductions in non-wage labour costs (e.g., 16 OECD countries);
– Hiring subsidies and work experience, generally targeted at disadvantaged groups (e.g. 15 OECD countries).
• In the (very weak) recovery with high and persistent unemployment important to shift from STWs to (net) hiring subsidies
– By protecting job matches, STWs have reduced socially and economically inefficient job losses …
– …but risk increasing dualism (U highly concentrated on already disadvantaged groups and new entrants)...
– ….and slow-down efficiency-enhancing labour reallocation
– Hiring subsidies may help promoting employment for disadvantaged groups, but have to be well targeted and with strict conditions for employers.
Supporting labour demand: from protecting existing jobs to boosting job
creation
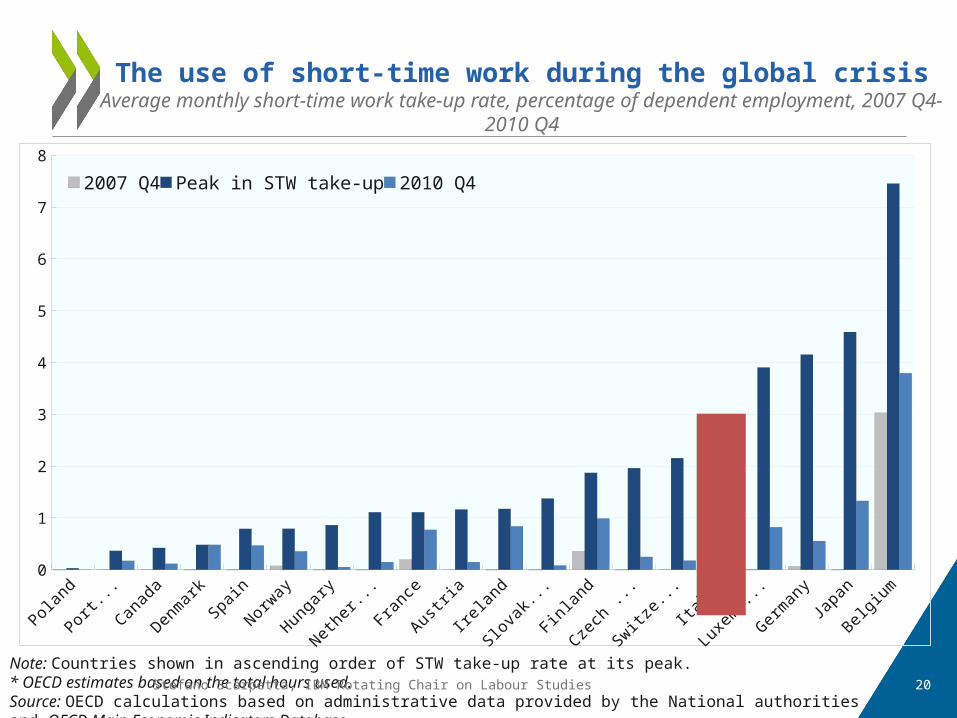
The use of short-time work during the global crisisAverage monthly short-time work take-up rate, percentage of dependent employment, 2007 Q4-2010 Q4
Note: Countries shown in ascending order of STW take-up rate at its peak. * OECD estimates based on the total hours used.Source: OECD calculations based on administrative data provided by the National authorities and OECD Main Economic Indicators Database.
Poland
Portug
al
Canad
a
Denmark
Spain
Norway
Hunga
ry
Netherl
ands
France
Austria
Irelan
d
Slovak
Rep.
Finland
Czech
Rep.
Switzerl
and
Italy*
Luxe
mbourg
German
yJa
pan
Belgium
0
1
2
3
4
5
6
7
8
2007 Q4 Peak in STW take-up 2010 Q4
20Stefano Scarpetta, IBM Rotating Chair on Labour Studies
Martin_S
Data for Italy have been revised with the hours used provided by INPS instead of authorized hours. Consequently the STW take-up rate for Italy is divided by a factor of 2.
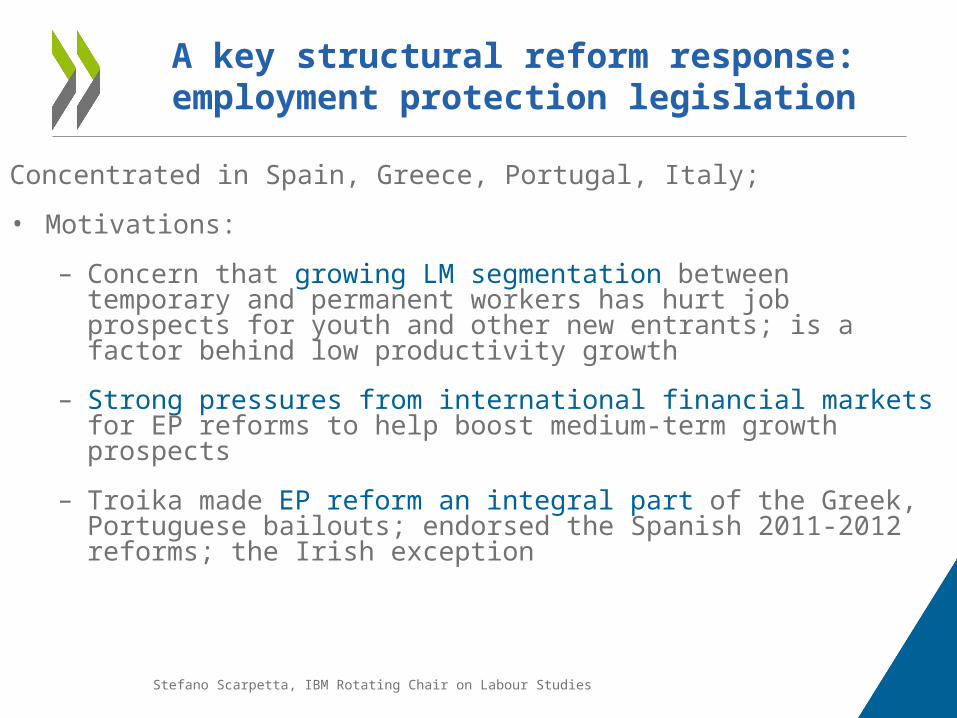
Concentrated in Spain, Greece, Portugal, Italy;
• Motivations:
– Concern that growing LM segmentation between temporary and permanent workers has hurt job prospects for youth and other new entrants; is a factor behind low productivity growth
– Strong pressures from international financial markets for EP reforms to help boost medium-term growth prospects
– Troika made EP reform an integral part of the Greek, Portuguese bailouts; endorsed the Spanish 2011-2012 reforms; the Irish exception
21
A key structural reform response: employment protection legislation
Stefano Scarpetta, IBM Rotating Chair on Labour Studies
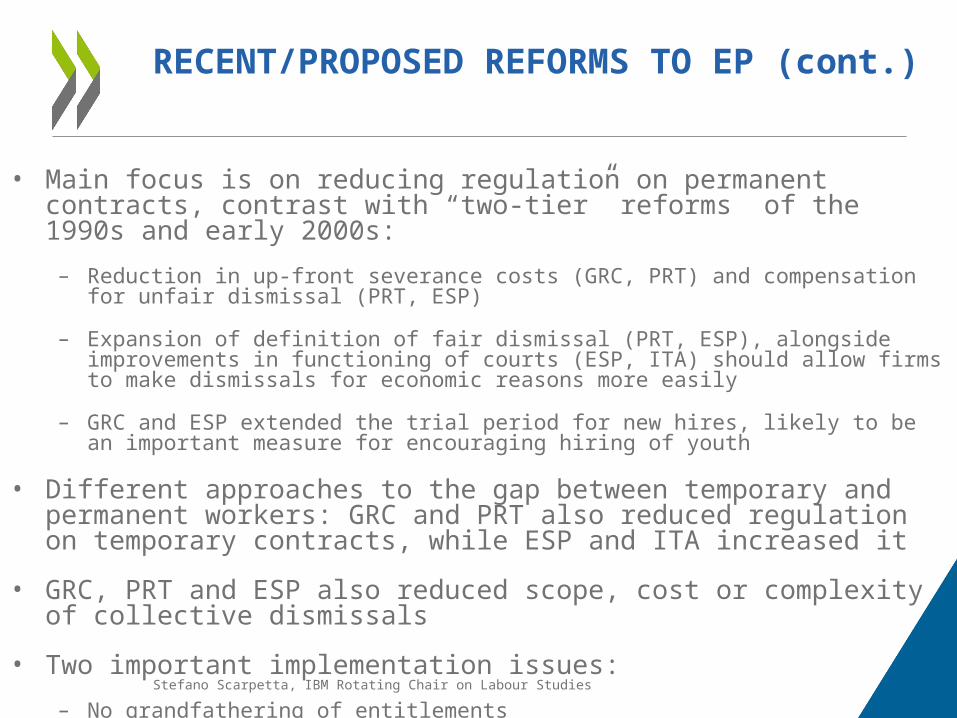
• Main focus is on reducing regulation on permanent contracts, contrast with “two-tier” reforms of the 1990s and early 2000s:
– Reduction in up-front severance costs (GRC, PRT) and compensation for unfair dismissal (PRT, ESP)
– Expansion of definition of fair dismissal (PRT, ESP), alongside improvements in functioning of courts (ESP, ITA) should allow firms to make dismissals for economic reasons more easily
– GRC and ESP extended the trial period for new hires, likely to be an important measure for encouraging hiring of youth
• Different approaches to the gap between temporary and permanent workers: GRC and PRT also reduced regulation on temporary contracts, while ESP and ITA increased it
• GRC, PRT and ESP also reduced scope, cost or complexity of collective dismissals
• Two important implementation issues:
– No grandfathering of entitlements
– Depends on how courts interpret the new rules (ITA, ESP).
22
RECENT/PROPOSED REFORMS TO EP (cont.)
Stefano Scarpetta, IBM Rotating Chair on Labour Studies
23
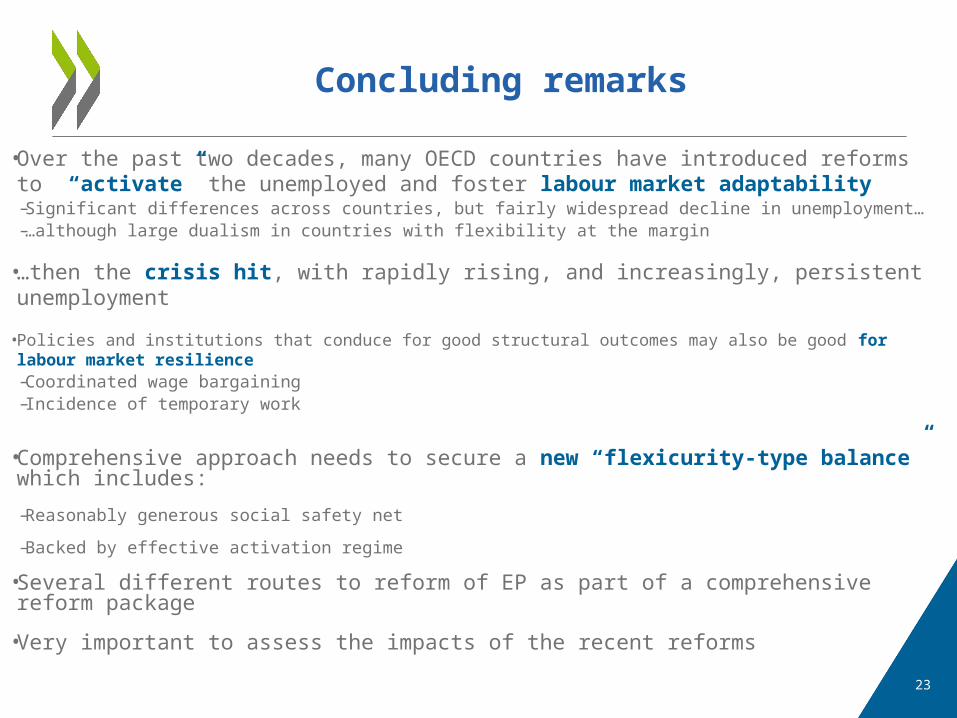
• Over the past two decades, many OECD countries have introduced reforms to “activate” the unemployed and foster labour market adaptability
– Significant differences across countries, but fairly widespread decline in unemployment…– …although large dualism in countries with flexibility at the margin
• …then the crisis hit, with rapidly rising, and increasingly, persistent unemployment
• Policies and institutions that conduce for good structural outcomes may also be good for labour market resilience– Coordinated wage bargaining– Incidence of temporary work
• Comprehensive approach needs to secure a new “flexicurity-type balance” which includes:
– Reasonably generous social safety net
– Backed by effective activation regime
• Several different routes to reform of EP as part of a comprehensive reform package
• Very important to assess the impacts of the recent reforms
Concluding remarks
Thank you
[email protected]://www.oecd.org/els/
24Stefano Scarpetta, IBM Rotating Chair on Labour Studies