12 anni di esperienza nel trattamento dello STEMI a Villa ... Rubartelli STEMI... · 12 anni di...
30
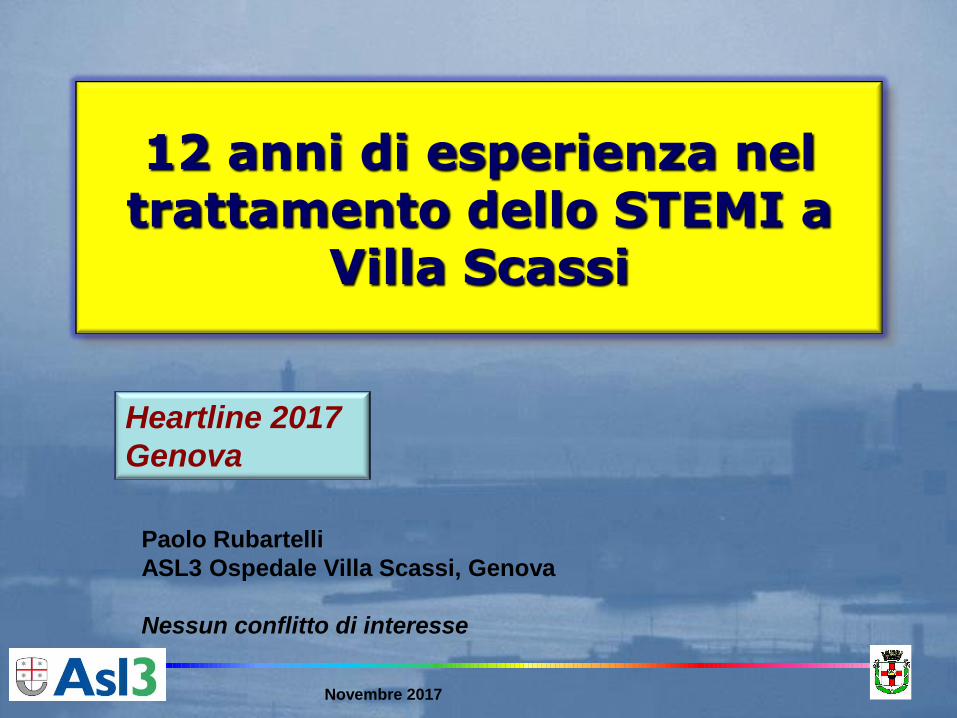
Novembre 2017 12 anni di esperienza nel trattamento dello STEMI a Villa Scassi Paolo Rubartelli ASL3 Ospedale Villa Scassi, Genova Nessun conflitto di interesse Heartline 2017 Genova
Transcript of 12 anni di esperienza nel trattamento dello STEMI a Villa ... Rubartelli STEMI... · 12 anni di...
Novembre 2017
12 anni di esperienza nel trattamento dello STEMI a
Villa Scassi
Paolo Rubartelli
ASL3 Ospedale Villa Scassi, Genova
Nessun conflitto di interesse
Heartline 2017
Genova

Novembre 2017
ASL3 Villa Scassi: accesso alla terapia riperfusiva
No riperfusione nel BLITZ 4: 10.3%
Olivari Z, Eur Heart J Acute CV Care 2012
1810; 88%
245; 12%
Entro 12 h (24 h con ischemia)
Presentazione tardiva
48; 3% 12; 1%
1673; 92%
75; 4%
No riperfusione Fibrinolisi
Coro->PCI Coro no PCI
Anni 2006-2016

Novembre 2017
Percorsi di afferenza
Anni 2006-2017
N=1900
42%
28%
24%
5%
1%
Automedica 118 (ecg preosp)
PS Villa Scassi
Transfer da spoke
Già in ospedale
Altro

Novembre 2017
Percorsi per anno
0%
20%
40%
60%
80%
100%
2006 2007 2008 2009 2010 2011 2012 2013 2014 2015 2016 2017
Transfer altri PS
PS Villa Scassi
Automedica 118
ASL3
Genovese
Novembre 2017
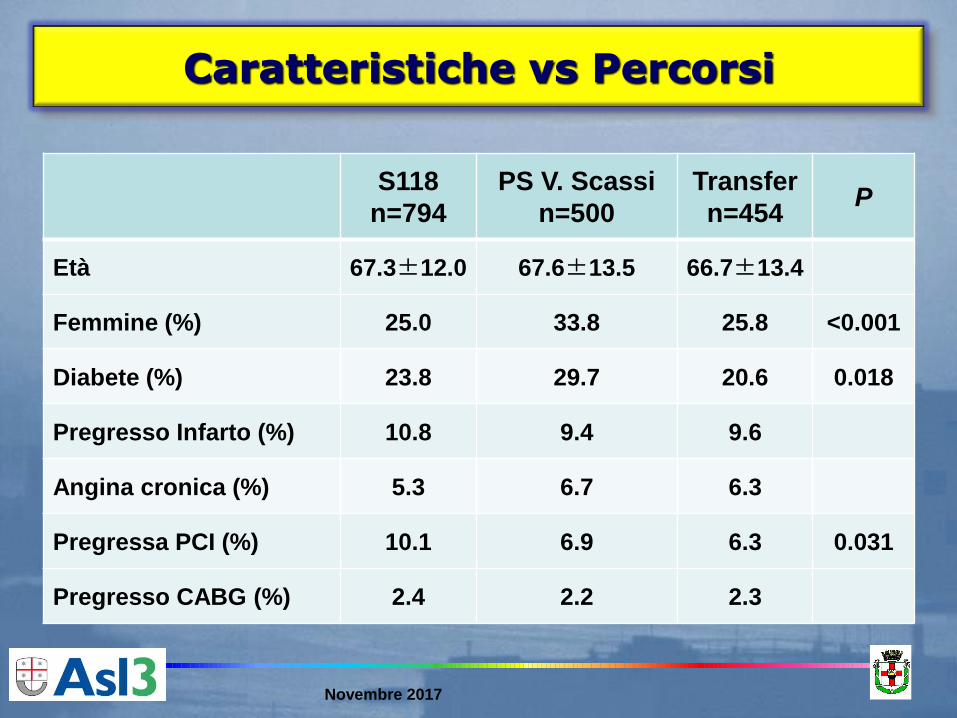
S118
n=794
PS V. Scassi
n=500
Transfer
n=454 P
Età 67.3±12.0 67.6±13.5 66.7±13.4
Femmine (%) 25.0 33.8 25.8 <0.001
Diabete (%) 23.8 29.7 20.6 0.018
Pregresso Infarto (%) 10.8 9.4 9.6
Angina cronica (%) 5.3 6.7 6.3
Pregressa PCI (%) 10.1 6.9 6.3 0.031
Pregresso CABG (%) 2.4 2.2 2.3
Caratteristiche vs Percorsi
Novembre 2017
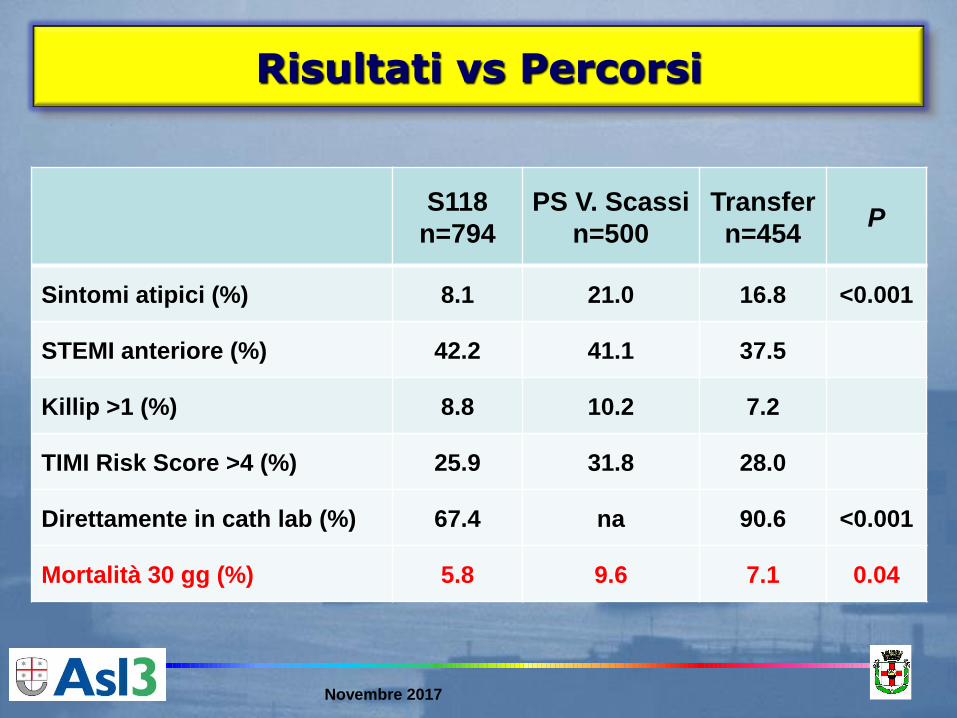
S118
n=794
PS V. Scassi
n=500
Transfer
n=454 P
Sintomi atipici (%) 8.1 21.0 16.8 <0.001
STEMI anteriore (%) 42.2 41.1 37.5
Killip >1 (%) 8.8 10.2 7.2
TIMI Risk Score >4 (%) 25.9 31.8 28.0
Direttamente in cath lab (%) 67.4 na 90.6 <0.001
Mortalità 30 gg (%) 5.8 9.6 7.1 0.04
Risultati vs Percorsi

Novembre 2017

Novembre 2017
74
125
122 51
40
22
33
82
30
0 60 120 180 240
118 (n=741)
PS VS (n=473)
Transfer (n=424)
Minuti (mediana)
Sintomi-1° contatto medico Door in - Door out
Trasporto Door finale-balloon
Tempistica STEMI ASL3 Villa Scassi
Anni 2006-2017

Novembre 2017
Andamento tempistica
68
76
87
67
80
90
54
92
62
65
56
88
38
37
38
40
38
41
41
44
43
49
42
43
33
34
33
30
32
39
35
42
35
34
24
23
0 60 120 180 240
2017
2016
2015
2014
2013
2012
2011
2010
2009
2008
2007
2006
Minuti (mediana)
Sintomi-1° Cont. Med. Trasporto Door finale-balloon
S118

Novembre 2017
Andamento tempistica
158
122
159
126
133
107
127
119
115
120
180
120
71
79
83
86
82
90
84
76
84
84
66
77
0 60 120 180 240
2017
2016
2015
2014
2013
2012
2011
2010
2009
2008
2007
2006
Minuti (mediana)
Sintomi-Triage Triage-balloon
PS Villa Scassi

Novembre 2017
Andamento tempistica
120
141
175
97
162
98
115
148
103
110
144
119
52
51
43
53
48
47
50
57
53
52
55
56
21
22
24
22
22
22
19
22
22
19
19
22
31
31
30
27
28
39
32
29
32
30
21
24
0 60 120 180 240 300
2017
2016
2015
2014
2013
2012
2011
2010
2009
2008
2007
2006
Minuti (mediana)
Sintomi-1° Osp Door in - Door out Trasporto Door finale-balloon
Transfer

Novembre 2017
Mortality vs Symptom Onset-to-Balloon
3,45%
6,81% 8,09%
6,20%
11,34%
14,65%
30-day mortality One-year mortality
P=0.003 P<0.001

Novembre 2017
Mortality vs Symptom Onset-to-FMC
5,58% 6,70%
8,21% 9,41%
10,71%
14,34%
Symptoms-FMC<64' Symptoms-FMC 64'-157'
Symptoms-FMC >157'
30-day mortality One-year mortality
P=NS P=0.026
Novembre 2017
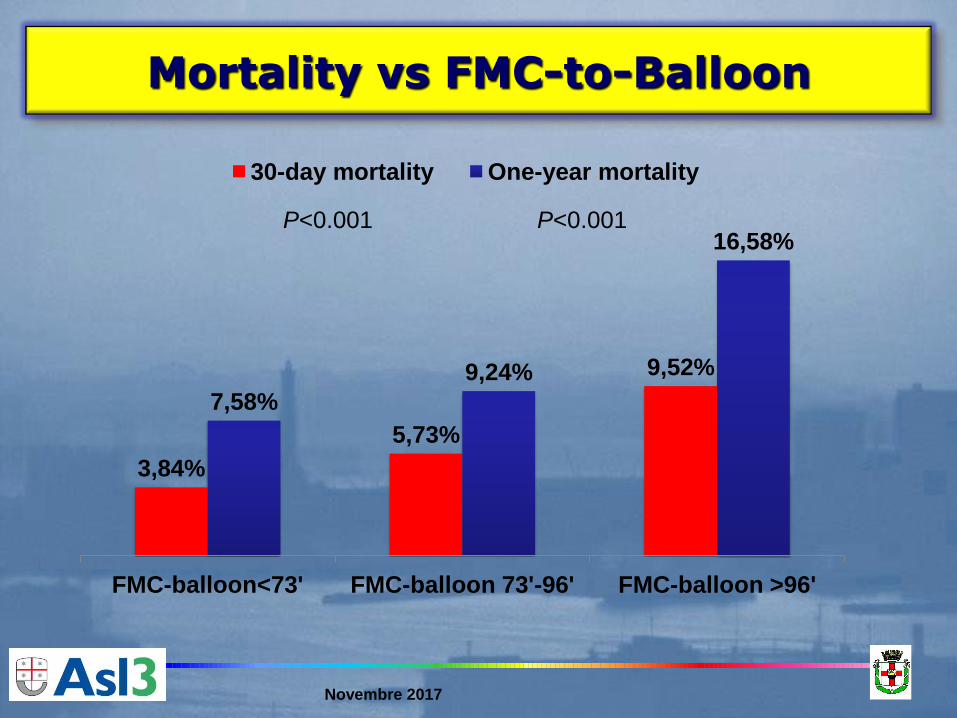
Mortality vs FMC-to-Balloon
3,84%
5,73%
9,52%
7,58%
9,24%
16,58%
FMC-balloon<73' FMC-balloon 73'-96' FMC-balloon >96'
30-day mortality One-year mortality
P<0.001 P<0.001

Novembre 2017
Quali sono le cause del ritardo alla pPCI?
Definizione ritardo
Arrivo diretto a Villa Scassi: FMC-to-Balloon >90’
Con trasporto interospedaliero: FMC-to-Balloon >120’
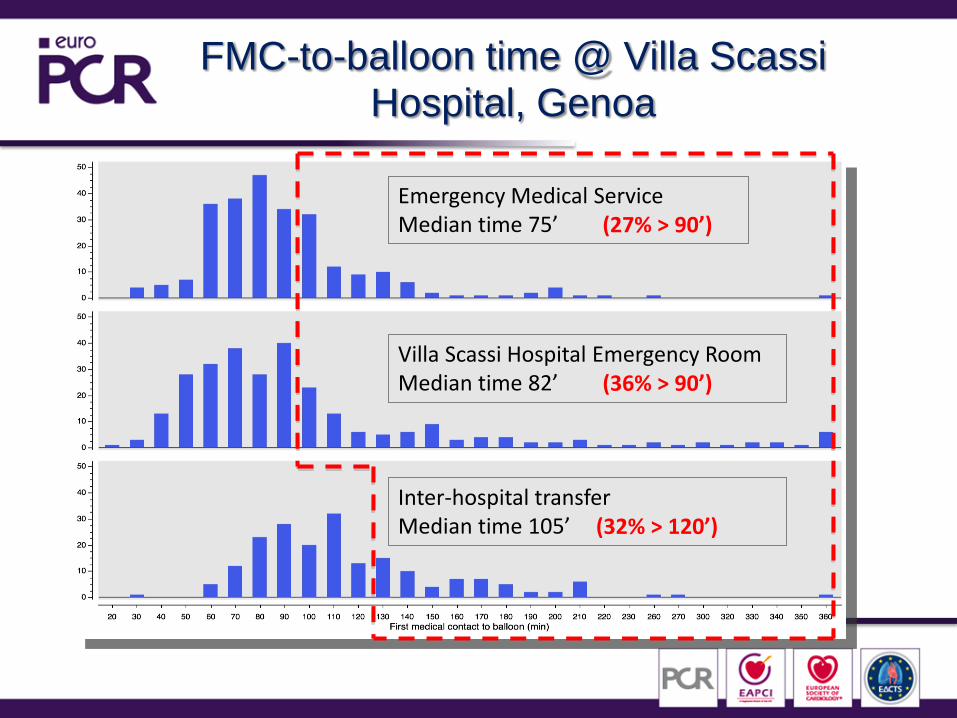
FMC-to-balloon time @ Villa Scassi Hospital, Genoa
Emergency Medical Service Median time 75’
Villa Scassi Hospital Emergency Room Median time 82’
Inter-hospital transfer Median time 105’
(27% > 90’)
(36% > 90’)
(32% > 120’)

Baseline characteristics
Variable TIMELY pPCI
N=484 (66.1 %)
DELAYED pPCI
N=248 (33.9%)
p-value
Age (years); median (IQR) 65 (57 – 75) 71 (61 – 79) 0.001
Female gender (%) 17 30 0.001
Diabetes mellitus (%) 24.2 30.6 0.02
Prior CABG (%) 1.0 4.4 0.004
Atypical symptoms – dyspnoea (%) 9.2 25.4 0.001
Prior stroke (%) 2.1 6.8 0.006
Killip class > 1 (%) 3.9 8.8 0.01
Emergency tracheal intubation (%) 1.0 3.4 0.05
TIMI risk score; mean ± SD 2.8 ± 2.2 3.5 ± 2.3 0.001
May 2011

Logistic Regression
Covariate Wald coefficient Odds Ratio p-value
Atypical symptoms 11.5 2.5 0.0007
Symptoms onset-to-FMC time (10 ‘) 9.4 1.01 0.0023
Killip class > 2 4.4 2.77 0.04
Prior CABG 3.4 2.8 0.07
Prior Stroke 3.7 2.6 0.06
Age (10 years) 2.9 1.12 0.09
Posterior – lateral IMA 3.2 1.56 0.07
Diabetes mellitus 1.0 1.22 0.30
May 2011

Other factors that may
have caused delay
• Borderline significant ECG (34%)
• Relevant comorbidities including bleeding, anaemia,
acute renal failure, stroke (12%)
• Misdiagnosed ECG (8%)
• Cath lab not immediately available (4%)
• Delayed patient consent (3%)
Factors considered responsible of the delay were
prospectively collected in all delayed pPCIs
May 2011

Novembre 2017
Cosa succede di notte e nei giorni festivi?
Novembre 2017
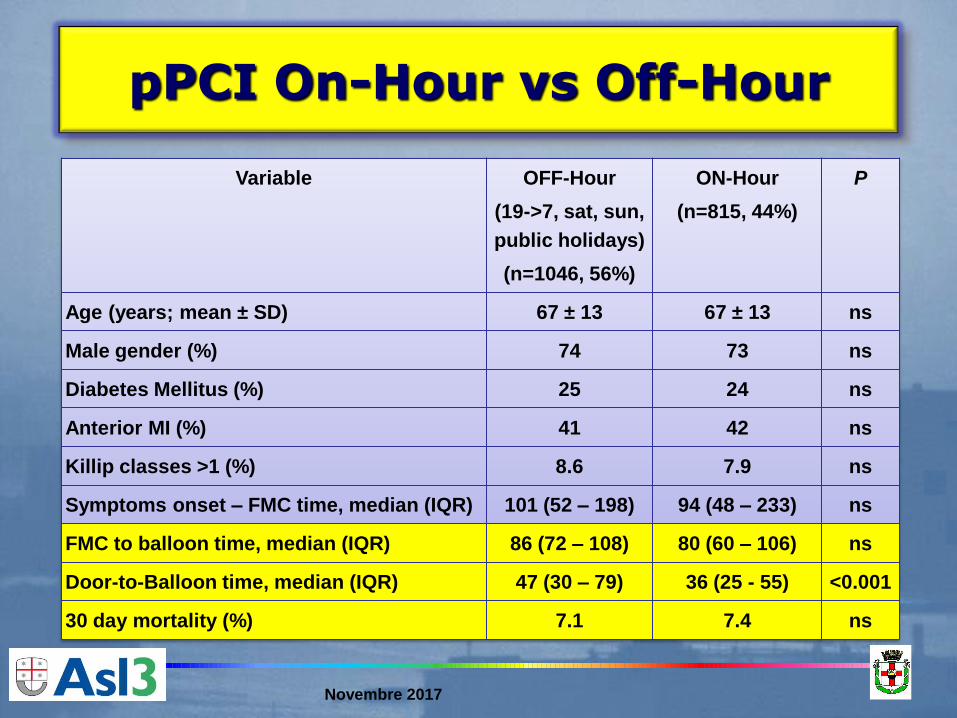
Variable OFF-Hour
(19->7, sat, sun,
public holidays)
(n=1046, 56%)
ON-Hour
(n=815, 44%)
P
Age (years; mean ± SD) 67 ± 13 67 ± 13 ns
Male gender (%) 74 73 ns
Diabetes Mellitus (%) 25 24 ns
Anterior MI (%) 41 42 ns
Killip classes >1 (%) 8.6 7.9 ns
Symptoms onset – FMC time, median (IQR) 101 (52 – 198) 94 (48 – 233) ns
FMC to balloon time, median (IQR) 86 (72 – 108) 80 (60 – 106) ns
Door-to-Balloon time, median (IQR) 47 (30 – 79) 36 (25 - 55) <0.001
30 day mortality (%) 7.1 7.4 ns
pPCI On-Hour vs Off-Hour

Novembre 2017
L’accesso radiale per la pPCI

Novembre 2017
0%
20%
40%
60%
80%
100%
2006 (169)
2007 (144)
2008 (156)
2009 (148)
2010 (150)
2011 (179)
2012 (99)
An
nu
al ra
te o
f T
R-p
PC
I
Overall
Op 1
Op 2
Op 3
Op 4
Year
(N)
Temporal trend in radial access for pPCI
Novembre 2017
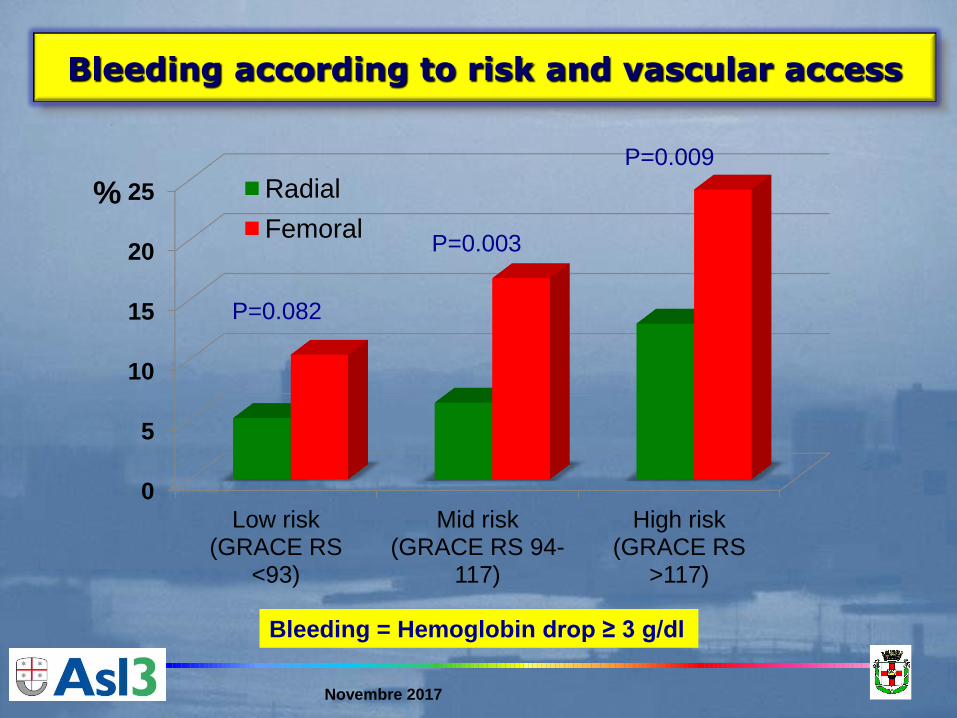
0
5
10
15
20
25
Low risk (GRACE RS
<93)
Mid risk (GRACE RS 94-
117)
High risk (GRACE RS
>117)
% Radial
Femoral
P=0.082
P=0.003
P=0.009
Bleeding = Hemoglobin drop ≥ 3 g/dl
Bleeding according to risk and vascular access

Is upstream heparin useful in patients with STEMI undergoing
primary intervention?
Dr. Paolo Rubartelli
Cardiology Dept.
Ospedale Villa Scassi
Genoa, Italy
I have no conflict of interest

Upstream heparin
(n=425)
Procedural
heparin (n=411)
Age 67.3±13.3 68.0±13.2
Females 30.1% 31.4%
Hypertension * 56.3% 65.9%
Current smokers 39.8% 38.7%
Diabetes mellitus 22.1% 26.8%
Prior myocardial infarction 11.1% 12.7%
Prior percutaneous coronary intervention 8.9% 8.3%
Prior coronary surgery 2.1% 2.9%
Systolic blood pressure (mmHg) 138±32 137±33
Heart rate (bpm) 75±18 76±21
Killip Class II-IV 10.4% 7.5%
Anterior STEMI § 40.5% 33.8%
Multivessel disease 42.3% 42.1%
Baseline characteristics
* P=0.0044 § P=0.0467

Upstream heparin
(n=425)
Procedural
heparin (n=411)
Time interval heparin-arterial access 70’ (59’-92’) -
Symptoms onset-to-balloon time (min) 198 [133-301] 213 [134, 365]
1st med contact-to-balloon time (min) 83 [69-104] 78 [60-101]
TIMI flow grade 2-3 before pPCI 35.2% 29.7%
TIMI flow grade 3 after pPCI 85.2% 83.0%
Unplanned use of abciximab * 50% 59%
Peak CKMB (ng/ml) 192±182 170±169
Pre-discharge ejection fraction (%) 50±11 50±13
30-day mortality § 24 (5.7%) 46 (11.2%)
Procedural and 30-day results
* P=0.0089 § P=0.0039

Results: multivariate analysis
Variables associated to 30-day mortality
RR 95% CL P
Age (per 5 years) 1.61 1.27-2.02 < 0.001
Diabetes mellitus 2.48 1.00-6.15 0.050
SBP (per 5 mmHg) 0.92 0.86-0.98 0.016
Killip Class II-IV 3.17 1.11-9.00 0.033
TIMI flow grade 2-3 before pPCI 0.30 0.12-0.72 0.009
Peak CKMB (per 50 ng/ml) 1.14 1.02-1.26 0.015
Pre-discharge EF (per 10 unit) 0.44 0.28-0.68 < 0.001
Upstream heparin 0.37 0.15-0.91 0.026

Novembre 2017
Conclusioni (1)
• Monitoriamo sistematicamente i dati clinici, procedurali e di
outcome dei pazienti con STEMI per controllare la qualità della
nostra organizzazione
• La maggior parte dei pazienti viene trattata con pPCI in tempi
ragionevoli ma migliorabili
• Sono stati identificati i fattori associati ad un trattamento ritardato
rispetto agli obiettivi raccomandati dalle linee guida
• Ciononostante, nell’ultimo decennio non è stato possibile ottenere
un ulteriore miglioramento dei tempi di trattamento
• Il sistema mantiene la stessa performance di notte e nei festivi
• La pPCI viene eseguita per via radiale nel 90% dei pazienti
• Il pretrattamento con eparina è associato ad un miglior outcome
Nel nostro centro

Novembre 2017
Conclusioni (2)
• Tempi migliorabili nei pazienti afferenti al nostro Pronto
Soccorso e nei pazienti trasferiti
• Mancata/ritardata diagnosi ecg in una quota non
trascurabile di pazienti
• ECG preospedaliero in meno della metà dei pazienti
• I risultati sono stati ottenuti con una ampia disponibilità
nell’area genovese di cath lab (3, 1 ogni 250´000 abitanti)
superiore agli standard previsti dall’attuale normativa (1
ogni 300´000 - 600´000 abitanti, DM 70 del 2/4/2015)
Criticità