
Università degli Studi di Padova Respiratory Motion Compensation ...
77
Università degli Studi di Padova Dipartimento di Ingegneria dell'Informazione Corso di Laurea Magistrale in Bioingegneria tesi di laurea Respiratory Motion Compensation in Coronary Magnetic Resonance Angiography: Analysis and Optimization of Self-Navigation Relatore interno: Prof. Alfredo Ruggeri Relatori esterni: Prof. Matthias Stuber Ing. Davide Piccini Ing. Gabriele Bonanno Laureanda: Giulia Ginami Matricola: 1014573 Anno Accademico 2012/2013
Transcript of Università degli Studi di Padova Respiratory Motion Compensation ...

Università degli Studi di Padova
Dipartimento di Ingegneria dell'Informazione
Corso di Laurea Magistrale in Bioingegneria
tesi di laurea
Respiratory Motion Compensation in Coronary Magnetic Resonance Angiography: Analysis and Optimization of
Self-Navigation
Relatore interno:Prof. Alfredo Ruggeri
Relatori esterni:Prof. Matthias StuberIng. Davide PicciniIng. Gabriele Bonanno
Laureanda:Giulia Ginami
Matricola: 1014573
Anno Accademico 2012/2013


CONTENTS
Abstract 1
Prefazione 3
CHAPTER 1 – Introduction 5
1.1 Coronary Artery Disease . . . . . . . . . . . . . . . . . . . . . . . . . . . 51.2 Imaging techniques for CAD diagnosis . . . . . . . . . . . . . . . . . . . . . 81.3 Effect of motion in coronary MRI . . . . . . . . . . . . . . . . . . . . . . . 9
1.3.1 Cardiac-induced motion . . . . . . . . . . . . . . . . . . . . . . 101.3.2 Respiratory-induced motion . . . . . . . . . . . . . . . . . . . . 101.3.3 Bulk motion . . . . . . . . . . . . . . . . . . . . . . . . . . 14
1.4 Thesis purpose . . . . . . .. . . . . . . . . . . . . . . . . . . . . . . . 151.5 Thesis outline . . . . . . . . . . . . . . . . . . . . . . . . . . . . . . . 15
CHAPTER 2 - State of the art coronary MRI 17
2.1 Preliminary technical solutions in coronary MRI . . . . . . . . . . . . . . . . 172.2 Motion compensation in coronary MRI . . . . . . . . . . . . . . . . . . . . 18
2.2.1 Compensation of cardiac-induced motion . . . . . . . . . . . . . . . 19 2.2.2 Compensation of respiratory-induced motion . . . . . . . . . . . . . . 20
2.3 Fully integrated 1D respiratory self-navigation for whole heart coronary MRI . . . . . 24 2.3.1 Data acquisition . . . . . . . . . . . . . . . . . . . . . . . . 25 2.3.2 Isolation and segmentation of the blood pool . . . . . . . . . . . . . . 29 2.3.3 Motion detection and compensation . . . . . . . . . . . . . . . . . 34
2.4 Image quality evaluation in coronary MRI: “Soap-Bubble” . . . . . . . . . . . . . 34
CHAPTER 3 - Optimized respiratory reference position for 3D self-navigated whole heart MRA 39
3.1 Introduction . . . . . . . . . . . . . . . . . . . . . . . . . . . . . . . . 393.2 Methods . . . . . . . . . . . . . . . . . . . . . . . . . . . . . . . . 40
3.2.1 Data acquisition . . . . . . . . . . . . . . . . . . . . . . . . . 40 3.2.2 Data processing . . . . . . . . . . . . . . . . . . . . . . . . . 40
3.3 Results . . . . . . . . . . . . . . . . . . . . . . . . . . . . . . . . . . 453.4 Discussion and conclusion . . . . . . . . . . . . . . . . . . . . . . . . . 46
i

CHAPTER 4 - Iterative approach to self navigation 53
4.1 Introduction . . . . . . . . . . . . . . . . . . . . . . . . . . . . . . . . 534.2 Methods . . . . . . . . . . . . . . . . . . . . . . . . . . . . . . . . . 53
4.1.1 Algorithm design . . . . . . . . . . . . . . . . . . . . . . . . . 534.2.1 Data acquisition . . . . . . . . . . . . . . . . . . . . . . . . . 604.3.1 Data processing . . . . . . . . . . . . . . . . . . . . . . . . . . 60
4.3 Results . . . . . . . . . . . . . . . . . . . . . . . . . . . . . . . . . 604.4 Discussion and conclusion . . . . . . . . . . . . . . . . . . . . . . . . . . 62
CHAPTER 5 – Conclusions . . . . . . . . . . . . . . . . . . . . . . . . . . 65
Acknowledgments . . . . . . . . . . . . . . . . . . . . . . . . . . . . . . 67
Bibliogaphy . . . . . . . . . . . . . . . . . . . . . . . . . . . . . . . . 69
ii


ABSTRACT
Cardiovascular diseases are the leading cause of death in the western world; in particular, coronary artery diseases result in the most important impact in terms of mortality of the population. Therefore, there is the need of an imaging technique for the diagnosis and the monitoring of this type of diseases in the course of time. Magnetic Resonance Imaging is a valid possibility, since it represents a safe and economic technique; both the patient and the clinical personnel are not exposed to ionizing radiations. In addition, it provides the possibility of obtaining 3-dimensional diagnostic images characterized by a high contrast between tissues. However, this technique requires prolonged acquisition times, and, for this reasons, physiological movements of the heart have a great impact on the final image quality, that can be compromised by visible motion artifacts. This impact is even bigger if we consider the fact that coronaries are tortuous and small in diameter if compared to the amplitude of physiological movements. Therefore, there is the need of designing methods to compensate both the cardiac induced motion of the myocardium and the respiratory motion.The aim of this thesis is to analyze and optimize possible techniques to compensate the respiratory movement of the heart, which is characterized by the highest physiological amplitude. The “self-navigation” approach represents the most promising technique to compensate respiratory movement; it allows the possibility of directly extracting motion information from the acquired data themselves. A respiratory reference position is acquired at the very beginning of the examination and the correction of the subsequently acquired image data is performed relative to this original reference position.
In the first part of this work, the influence of the respiratory reference position on the final image quality has been demonstrated. Data acquired in 11 volunteers were reconstructed and corrected by using different respiratory reference positions; subsequently, the quality of the reconstructed volumes was assessed by computing the percentage “vessel-sharpness” of a target portion of coronary artery. After the image quality evaluation, it has been concluded that the choice of end-expiration as respiratory reference position provides a final image quality that is statistically superior if compared to the case where end-inspiration is taken as reference, and superior on average if compared to the case where mean or random are taken as respiratory reference position. Therefore, a first possibility for improving the performances of the state of the art technique to perform self-navigation was presented; it is possible to start the free-breathing self-navigated acquisition with a short breath-hold in end-expiration. This easy solution ensures both optimal image quality and inline motion detection and reconstruction of the dataset.
Subsequently, a new method to perform self-navigation was introduced; it is an iterative approach which leads to a progressive levelling of the acquired image data. An index representing the global alignment is optimized in every iteration. It has been demonstrated that using this algorithm it is
1

Abstract
possible to obtain volumes characterized by a quality which is statistically comparable to the image quality of volumes reconstructed by using the state of the art self-navigation technique and end-expiration as respiratory reference position. The required computational effort is low and, for this reason, it is possible to reconstruct the motion compensated volume as soon as the data acquisition has been completed.
In conclusion, two different modalities for improving the performances of the implemented self-navigation technique were identified in this thesis; the first one, allows the possibility of optimizing the current technique by conveniently choosing the respiratory reference position. The second one introduces the possibility of performing self-navigation without the need of selecting a respiratory reference position and it assures a final image quality that is comparable to the image quality of volumes reconstructed by using the self-navigation technique already optimized.
The thesis has been carried out at the Centre Hospitalier Universitaires Vaudois (CHUV) [1] in Lausanne, within the CadioVascular Magnetic Resonance (CVMR) group [2], which is affiliated to the Centre for Biomedical Imaging (CIBM) [3]. The whole work has been performed in the period August 2012 – February 2013.
2

PREFAZIONE
Al giorno d’oggi, le malattie cardiache costituiscono la principale causa di decesso nei paesi industrializzati; in particolare, le patologie che colpiscono le arterie coronarie risultano avere il maggiore impatto sulla popolazione in termini di mortalità. Di conseguenza, è necessario disporre di una tecnica che permetta di diagnosticare e monitorare nel tempo questo tipo di patologie. La risonanza magnetica costituisce una valida possibilità a tal proposito, trattandosi di una tecnica che non richiede l’esposizione a radiazioni da parte del paziente e del personale clinico, economica, e che, allo stesso tempo, permette di ottenere immagini in 3 dimensioni caratterizzate da elevato contrasto tra i tessuti. Tuttavia, gli elevati tempi di acquisizione richiesti da questa tecnica fanno sì che i movimenti cui il cuore è fisiologicamente soggetto abbiano un grande impatto sulla qualità diagnostica delle immagini ricostruite, che risultano spesso affette da artefatti da movimento. Tale effetto è ancora più evidente considerando il fatto che le coronarie, oggetto di interesse, sono estremamente piccole in diametro se paragonate all’ampiezza dei movimenti cui il cuore stesso risulta soggetto. Pertanto, affinché la risonanza magnetica possa essere un valido ausilio alla pratica clinica, è necessario progettare metodi che permettano di compensare sia il movimento dovuto alla periodica contrazione del miocardio sia alla respirazione.Questa tesi è dedicata all’analisi delle tecniche che possono essere impiegate per compensare il movimento indotto sul cuore dalla respirazione. Tale movimento è, fisiologicamente, il movimento di ampiezza maggiore. L’approccio di tipo “self-navigation” costituisce, al giorno d’oggi, la tecnica più promettente per compensare il movimento respiratorio. Tale metodo permette di estrarre informazioni sulla posizione del cuore direttamente dai dati acquisiti per ricostruire il volume di interesse. Una posizione respiratoria di riferimento (“reference”) viene acquisita all’inizio dell’esame; la correzione dei dati successivamente raccolti avviene riferendosi a tale posizione inizialmente rilevata.
La prima parte del lavoro condotto per questa tesi ha permesso di ottimizzare una particolare implementazione dell’approccio self-navigation; i dati acquisiti in 11 volontari sono stati ricostruiti impiegando references corrispondenti a diverse fasi respiratorie. E’ stato dimostrato che la scelta di end-expiration come reference garantisce una qualità del volume ricostruito (misurata in termini di “vessel sharpness” percentuale in un tratto di coronaria assunto come riferimento) statisticamente migliore rispetto alla scelta di end-inspiraton, e mediamente migliore rispetto alla scelta di mean e random. Pertanto, una prima possibilità di ottimizzazione è stata proposta e consiste nel realizzare una breve acquisizione breath-hold in end-expiration prima di procedere all’acquisizione dei dati, in modo da poter attuare una correzione real-time rispetto a una reference in end-expiration.
Successivamente, un metodo nuovo per realizzare self-navigation è stato presentato; tale metodo sfrutta un approccio di tipo iterativo che porta al complessivo allineamento dell’insieme di dati, ottimizzando progressivamente un indice che indichi il grado di globale livellamento raggiunto. E’
3

Prefazione
stato dimostrato che tale metodo permette di ottenere volumi di qualità diagnostica statisticamente comparabile con volumi corretti impiegando l’approccio self-navigation standard ed end-expiration come reference. Tale approccio iterativo non richiede uno sforzo computazionale elevato ed è pertanto possibile eseguire la ricostruzione del dataset corretto non appena l’acquisizione dei dati è conclusa.
In conclusione, l’intero lavoro svolto in questa tesi ha permesso di identificare e proporre due differenti strategie di ottimizzazione dell’approccio self-navigation; la prima, permette di ottimizzare la tecnica corrente suggerendo una opportuna scelta della reference, mentre la seconda possibilità definisce un approccio nuovo, indipendente dalla scelta di una reference e che garantisce una qualità delle immagini comparabile con quella ottenuta impiegando la tecnica standard già ottimizzata.
Il lavoro di tesi è stato svolto presso il Centre Hospitalier Universitaires Vaudois (CHUV) [1] di Losanna, all’interno del gruppo di ricerca denominato CadioVascular Magnetic Resonance (CVMR) [2], a sua volta affiliato al Centre for Biomedical Imaging (CIBM) [3]. Il lavoro di tesi si è svolto nel periodo Agosto 2012 – Febbraio 2013.
4
CHAPTER 1
INTRODUCTION
1.1 Coronary Artery Disease
Coronary artery disease (CAD) is a pathology that occurs when atherosclerosis plaques build up in the vessels that supply oxygenated blood to the heart, called coronary arteries; these plaques are mostly composed by cholesterol deposits, and release chemical substance that promote the process of healing [4]. At the same time, the inner wall of the blood vessels becomes sticky. Then, other substances, such as inflammatory cells, lipoproteins and calcium, travelling in the blood stream, start sticking to the lumen (see 2, 3, 4 in Figure 1.2). Therefore, the narrowing of the vessel lumen occurs as a result (such as in 6, 7 in Figure 1.2), a reduced perfusion of the cardiac tissue is determined. This disease can remain unnoticed for a long time, without showing obvious symptoms,
since the human body normally tries to compensate this kind of physiological imbalances. For instance, a narrowed coronary artery may develop new blood vessels around the blockage, but new arteries may not be able to supply enough oxygenated blood to the heart muscle. In more severe case, CAD manifests itself as chest pain (angina pectoris), difficulty in breathing, and pain or discomfort in areas of the upper body. If a plaque completely blocks the blood flow, myocardial
5
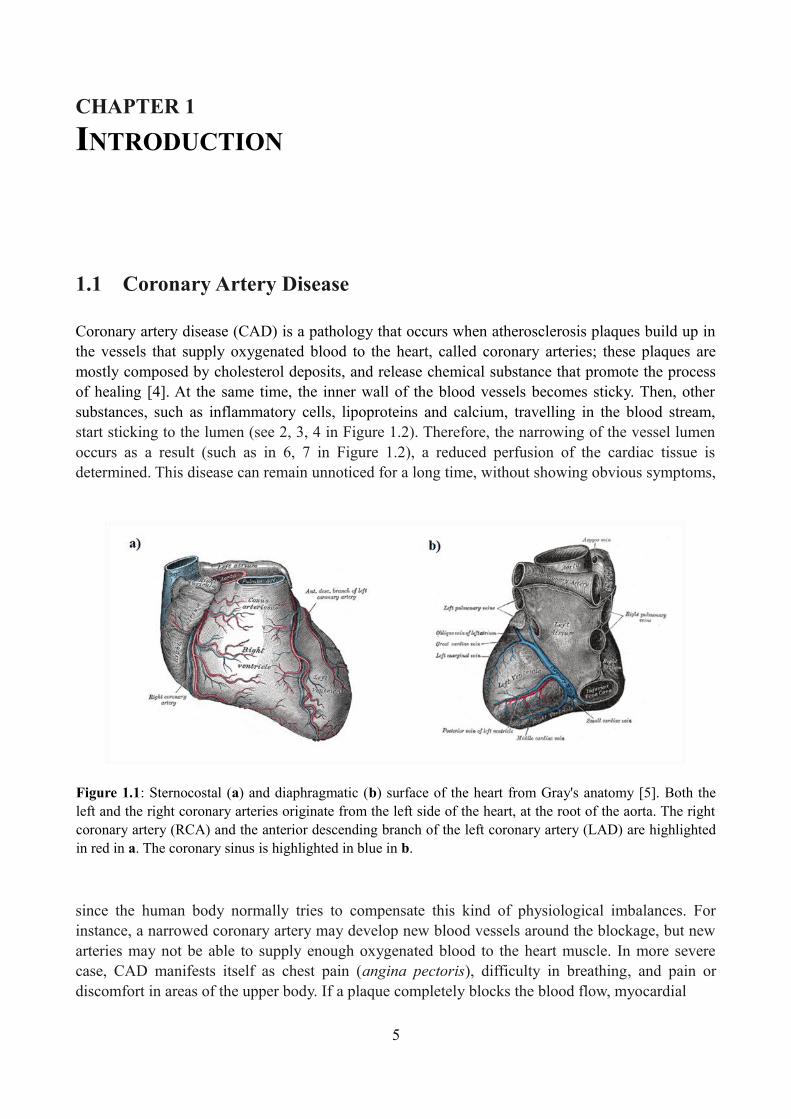
Figure 1.1: Sternocostal (a) and diaphragmatic (b) surface of the heart from Gray's anatomy [5]. Both the left and the right coronary arteries originate from the left side of the heart, at the root of the aorta. The right coronary artery (RCA) and the anterior descending branch of the left coronary artery (LAD) are highlighted in red in a. The coronary sinus is highlighted in blue in b.

Introduction
infarction or fatal rhythm disturbance may occur. A thrombotic stenosis of the coronary lumen may be caused if an atherosclerotic plaque ruptures (see 5 in Figure 1.2); this fact could also lead to myocardial infarction. By the migration of the plaque trough the blood flow, arteries which supply oxygen to the brain could be occluded; in this case, a cerebral infarction can also occur. Cardiovascular diseases are the underlying cause of death in the western world. According to the 2011 update of the American Heart Association statistics [6] on the basis of 2007 mortality rate data, more than 2.200 Americans died of cardiovascular disease each day, an average of one death every 39 seconds, 1 of every 6 deaths. It is estimated that approximately 1 of every 3 Americans have one or more type of cardiovascular diseases, and CAD constitutes half of them (see Figure 1.3). In comparison to data from 1997, it could be noticed that the death rate from heart diseases declined from 27.8 percent; however, during the same period, the total number of inpatients cardiovascular operations and procedure increased 27 percent. The estimated total cost
6
Figure 1.2: Initiation, progression and complication of human coronary atherosclerotic plaque. The longitudinal section of the artery shows the growing of occlusion along time. In 1, a normal artery is shown. 2, endothelial cells are activated by risk factors and inflammatory leukocytes are recluted; this phase characterizes the lesion initiation. Extracellular lipids begin to accumulate in intima. 3, inflammatory cytokines and growth factors are secreted by leucocytes and local cells. 4, lesion progress causes expression of tissue factors and matrix-degrading proteinases that weaker the fibrous cap of plaque. 5, if fibrous cap ruptures at the point of weakening, a thrombosis or non occlusive atherosclerotic plaque may be caused. 6, when thrombosis resorbs, collagen accumulation and smooth muscle cells growth may occur. The lesion can revolve into advanced fibrous or calcified plaque, producing symptoms of stable angina pectoris. 7, occlusive thrombi may also origin from a superficial erosion of endothelial layer. This is not necessarily dependent from a fibrous cap rupture. This image is from [4].

Introduction
7
Figure 1.3: In this figure, the graph a indicates cardiovascular diseases and other major causes of death for all males and females (United States: 2007). The graph b represents the percentage breakdown of deaths due to Cardiovascular diseases during the same year. Total may not add to 100 because of rounding. Data are from reference [6].
Introduction
from heart diseases in the United States for 2007, including health expenditures and lost productivity, was $286 billion, higher than any other diagnostic group. Therefore, despite the fact that mortality rate going down is a good news, prevention, diagnosis and therapy of cardiovascular diseases and CAD is still a current goal in the western world.
1.2 Imaging techniques for CAD diagnosis
Presently, several imaging modalities are employed for diagnosis and study of CAD. Two-dimensional (2D) x-ray angiography performed in the catheter lab represents the current standard technique for the diagnosis of CAD in the clinical practice. On the other hand, Magnetic Resonance (MR) is emerging as the most promising complementary imaging modality for detection of these diseases [7]; these techniques provide the possibility of identifying flow-limiting coronary stenoses, calcified plaques and directly image atherosclerotic lesions. Together, they provide information for predicting cardiovascular risk and facilitate further studies of the
mechanisms of atherosclerosis progression. However, differences between the two methods should be underlined. 2D x-ray angiography offers high spatial (up to 0.3 mm) and temporal (15-30 frame/second) resolutions; due to this fact, x-ray angiography is widely used for the evaluation of the degree of vessels obstruction. Information about coronary artery lesions and plaques presence can be provided by the administration of intravenous contrast, such as iodine
8
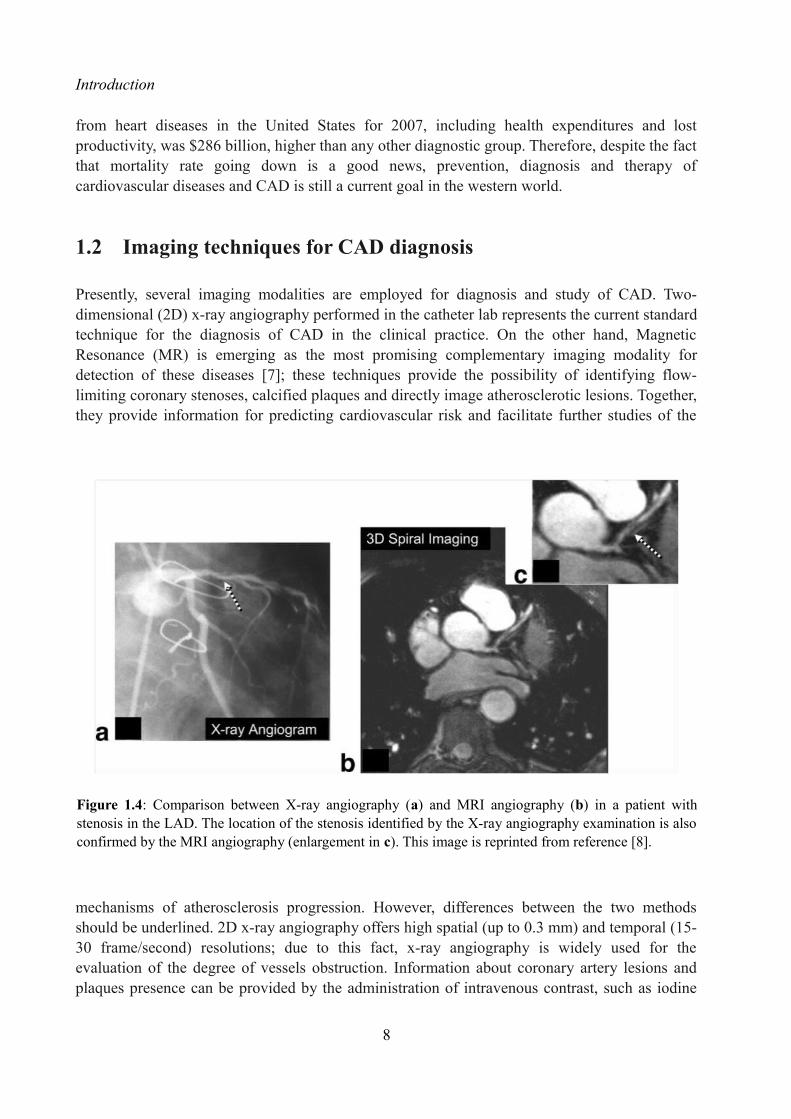
Figure 1.4: Comparison between X-ray angiography (a) and MRI angiography (b) in a patient with stenosis in the LAD. The location of the stenosis identified by the X-ray angiography examination is also confirmed by the MRI angiography (enlargement in c). This image is reprinted from reference [8].

Introduction
which is injected up to the coronary tree by using a catheter, introduced at the level of the femoral vein. This technique requires continuous x-ray radiation during the whole examination, for both patients and clinical personnel; this fact makes x-ray angiography an intrinsically invasive procedure and, for this reason, a small risk of complication still exists. In addition, x-ray angiography is an expensive technique. Due to the fact that x-ray angiography can provide only the visualization of the lumen of the vessel, early stage of arteriosclerosis are not visible. Compared to x-ray angiography, MR angiography (MRA) can provide spatial resolution of 1 mm3 voxel size for the identification of coronary lesions and plaques, and 100 ms acquisition time per heartbeat, at best. MR is non-invasive, cost-effective and the spatial resolution provided by this technique can be still considered high. In addition, it provides high soft-tissue contrast without the use of any contrast agent and the possibility of generate any image plan in three dimensions. The diagnostic ability of coronary MRA to detect coronary artery stenosis on X-ray angiography on patients with suspected CAD has been assessed in clinical trials [9, 10]. Coronary MRA showed good image quality with high sensitivity and negative predictive value (NPV); however it showed to be characterized by a low specificity. Therefore, coronary MRA can be important to rule out acute CAD. Young patients in particular can benefit from a radiation-free exam for the assessment of congenital CAD. At the same time, the specificity of the technique should be increased in order to be comparable to the specificity of 2D x-ray. MR is a unique medical imaging modality, since it is safe and it operates without exposing patients and clinical personnel to ionizing radiation. Since each year 785.000 Americans have a new coronary attack and approximately 200.000 of them do not present warning symptoms, there is a clinical need of a diagnostic imaging system for the prevention of these attacks which should be safe. At the same time, a method with this requirement is preferable for monitoring patients with congenital heart diseases constantly and for measuring disease progression or regression. Its several advantages make coronary MRA a promising technique compared to X-ray angiography. However, it is not yet the state of the art technique since the image resolution is still lower in comparison to X-ray angiography. MRI requires higher acquisition time than X-ray; the effect of motion on this technique is higher as well as the possibility of obtaining blurring effects in the reconstructed volumes. Therefore, there is a strong need of developing compensation techniques for avoiding the effect of motion. In the following section, physiological movements that has a great influence on MRA are described.
1.3 Effect of motion in coronary MRI
In order to obtain adequate image quality, the effect of motion should be avoided when diagnostic exams are performed. Indeed, motion can seriously lead to blurring in the images, affecting their diagnostic quality [11]. To avoid the adverse effect of motion, the content of an imaged volume should be rigid and motionless while image data are acquired. Coronaries are tortuous and small in diameter, in comparison to the magnitude of physiological movements which cause their displacement along time. Therefore, avoiding the effect of motion, when coronary imaging is performed, is a challenging task from a technical point of view. Three main types of motion can compromise the image quality and diagnostic value in cardiovascular MR
9

Introduction
imaging (MRI). These are:
1. The cardiac-induced motion, which is due to the contraction of the myocardium during beating.
2. The respiratory-induced motion, which is due to the movements of the diaphragm and chest during the respiratory cycle.
3. The bulk motion, which caused by the body movements of the subject inside the scanner
during the examination.
1.3.1 Cardiac-induced motion
The cardiac cycle can be considered as a repeating pattern of contraction and relaxation. The heart beats between 50 and 100 times per minute in healthy subjects at rest [12]. The periodic contraction of the myocardium is regulated by an electrical signal, triggered by the cells of the sinoatrial node. This electrical activity can be measured and quantified by using an electrocardiograph; by means of electrodes placed in correspondence to the outher surface of the skin, the electrocardiogram signal (ECG) can be measured (see Figure 1.5). The pattern of heart contraction consists in two principal phases: systole and diastole. Systole consists of the contraction of the heart muscle, while diastole consists of the relaxation of the myocardium and a subsequence period of rest, of which the length depends on the heart rate. In general, the duration of systole can be considered heart-rate invariant; if the heart rate increases, it is generally the diastole that shortens. The ventricular muscles contraction starts at the beginning of the systolic phase, indicated by the R-wave in the ECG signal. The beginning of the diastolic phase is indicated by the T-wave in the ECG signal; in this phase, ventricles start to relax without modifying their volume. Secondly, during the mid-diastolic phase, ventricles are partially refilled. Finally, the atrial contraction characterizes the end-diastolic phase and the complete filling of the ventricles. The motion of the left ventricle (LV) has been extensively studied as an indicator of the motion of the coronaries and motion parameters have been evaluated [13, 14]. The global displacement of the LV throughout the cardiac cycle has a significant amplitude (see Table 1); however, two periods of minimal velocity of the ventricle can be observed (see Figure 1.6). These periods correspond to the cardiac phases of end-systole and end-diastole, and are characterized by the minimal movement of the coronaries.
1.3.2 Respiratory-induced motion
The respiratory cycle lasts around 5 seconds at rest, and consists of the tidal movement of respiratory structures such as chest wall and diaphragm, which directly affect thoracic and abdominal motion. It was proved that the heart moves with respiration approximately half as much as the diaphragm along the superior-inferior (SI) direction [12]. The magnitude of this displacement (in average about 15 mm) makes respiratory motion one of the major challenges in cardiovascular MRI.
10

Introduction
11
Figure 1.5 : Referring to the electrocardiogram (ECG) signal (a), the systolic phase (green square) begins in correspondence to the R-wave. The diastolic phase (azure square), consisting in the relaxation of the myocardium after the ejection of the blood from the heart, fills the duration of the RR interval.. In addition, a series of 12 out of 24 retrospectively reconstructed cine frames of the heart in a short axis orientation throughout the cardiac cycle of a healthy young volunteer is shown (b). Frames 1-5 represent systole, frames 6-12 represent diastole. A quick contraction of the heart can be observed after the R-wave, followed by a period when the heart is approximately quiescent (frames 4-5). It can also be observed that the heart remain approximately stationary during the mid-diastolic phase (frames 9-11). The white arrows in frame 8 indicate the cross-sections of the left anterior descending (LAD) coronary artery and the right coronary artery (RCA) (bright dots above and below the myocardium respectively). This image is adapted with permission from reference [16].

Introduction
Wang et al. [15] reported that the respiratory motion of the heart is approximately a global translation in superior-inferior (SI) direction linearly related to the SI motion of the diaphragm. For the Right Coronary Artery (RCA) and the Left Anterior Descending (LAD) coronary artery correction factors respectively of 0.57 and 0.7 were estimated, but a wide variation of these values among subjects was also found [17]. Later similar correlation factors were found by Nerhke et al. [18]. However, a relatively complex relationship between respiration induced diaphragm and heart motion was also found that includes hysteresis with different paths for inspiration and expiration and not only SI but also left-right and anterior-posterior motion of the heart (see Figure 1.5). McLeish at al. [19] studied the respiratory-induced motion of the heart with both rigid and non rigid transformation parameters generated at various breathold positions; although the larger component of movement was in the SI during expiration, large standard deviations suggest high inter-subject variability (see Table 3).
12
Figure 1.6: Velocity of lateral, anterior, inferior, and septal region of LV in the long-axis direction throughout the cardiac cycle, measured in a healthy volunteer. Velocity in (a) reports changing from ellipsoid to spherical shape of the heart. (b) precedes the relatively stationary isovolumic contraction of the heart. Systole happens in (c), and diastole in (d). The cardiac cycle is then concluded in (e). This image is from reference [12].

Introduction
13
Table 2: Maximum displacement (± standard deviation) of Coronary Arteries in the Cardiac Cycle during Breath Holding in eight healthy volunteers [19].
Table 3: Whole-heart rigid transformation parameters and respective point displacements between end-expiration and end-inspiration (± standard deviation). Positive displacement is toward the left, posterior or inferior direction [20].
Table 1: Motion of LV in Healthy Volunteers throughout the Cardiac Cycle. Positive values indicate base-to-apex movement, radially inward movements, or counter-clockwise rotation [12, 13].

Introduction
1.3.3 Bulk motion
Bulk motion consists of the rigid translation and rotation of the part of the body that has to be examined, and it is mostly caused by voluntary or involuntary patient movement. Bulk motion does not imply the deformation of the object of interest and has not a relevant impact when the required imaging time is short. However, it has to be taken into account and compensated when MR imaging of coronaries is performed, because of the long scanning time. Bulk motion can be avoided in motivated patients by allowing a comfortable position during the examination and reducing the scan time. This type of motion has great impact in high-resolution brain imaging and in functional MRI for which compensation schemes have been developed [21]. Conversely, in cardiovascular MRI, the clinical personnel asks for the cooperation of the patient and this is typically sufficient to avoid motion adverse effects. Therefore, more detailed information will be not presented in this thesis.
14
Figure 1.7: Graphs show SI induced respiratory motion of LV versus that of right hemidiaphragm in two volunteers, one with mild hysteresis (a) and one with substantially more (b). Darker squares indicate that this result measurement was more common. The direction of hysteresis was found to be counterclokwise (arrows). cf = correction factor, r = correlation coefficient. This image is from [18].

Introduction
1.4 Thesis purpose
Motion is a major issue in cardiovascular MRI that adversely affects image quality and constrains spatial resolution, as explained in the previous sections. In this thesis, state-of-the-art motion compensation strategies are described for the MRI of the coronary arteries with an emphasis on respiratory motion. This is considered as a major challenge because of its wide
displacement ranges. Current solutions for respiratory motion compensation are therefore analysed in a wider scenario and improvements for robustness are presented. New solutions for respiratory motion correction are also proposed together with their design development. The proposed approaches were quantitative evaluated on a wide number of volunteers and dataset such that statistically significant results could be obtained.
1.5 Thesis outline
In this section, a brief chapter-wise overview of the structure of the thesis is purposed.
• Chapter 2
In the second chapter a brief review on motion compensation in coronary MRI is provided, with respect to both cardiac-induced motion and respiratory-induced motion. State of the art solutions for respiratory motion compensation like diaphragmatic navigators are presented and discussed. A comprehensive introduction on the current solutions for respiratory motion follows. This comprises one-dimensional self-navigation
15
Figure 1.8: Thesis purpose definition
Introduction
techniques that increase scanning efficiency and have the potential for more complex motion correction schemes. Afterwards, a three-dimensional acquisition strategy for whole-heart imaging is presented that is well suited for coronary MRI. This radial acquisition strategy is indeed robust against motion and can be easily adapted for self-navigation.
• Chapter 3
In this chapter, technical improvements on the 1D self-navigation approach that increase the performance and robustness of this technique are presented and validated. It will be shown that there is a relation between final image quality and the respiratory state used as reference in the self-navigation motion correction. This first part of work has been summarized in an abstract accepted to be presented at the 21st annual meeting exhibition of the International Society for Magnetic Resonance in Medicine – ISMRM (Salt Lake City, Utah, USA, 20-26 April 2013) [22].
• Chapter 4
In this chapter, a new method to perform self-navigation is introduced; it consists in an iterative approach to the problem of levelling the projections. In this scenario, the need of selecting a specific reference to perform respiratory motion detection and correction is avoided. This fact represents an important result since, as demonstrated in Chapter 3, the influence of the respiratory position of the reference has a great impact on the final image quality. The purposed algorithm operates by iteratively optimizing a specific index, which indicates the global reached alignment of the projections. It is also demonstrated that this algorithm permits to obtain corrected images characterized by an image quality that is statistically comparable to the image quality of the dataset reconstructed by using the standard self-navigation already optimized. In conclusion, it is possible to obtain optimal image quality in individual cases by avoiding the need of selecting a specific respiratory reference position.
• Chapter 5
In this chapter, results gained in this thesis are summarized. Future improvements of the proposed technique and open points are discussed.
16

CHAPTER 2
STATE OF THE ART CORONARY MRI
Imaging of the coronaries is a very challenging task. Indeed, coronaries are small in diameter, tortuous, and extended. Moreover, they are subjected to continuous motion with intensity even bigger than the diameter of the vessels. In addition, they are surrounded by different types of tissues. Therefore, what would be ideally needed to make MR clinically relevant for coronary imaging is to provide the following aspects:
1. High resolution. 2. High contrast between the lumen and the surrounding tissues3. Large volume coverage. 4. Fast and motion corrected images.
In this chapter, some of the state of the art techniques for coronary MR angiography are described, with particular attention on motion compensation strategies.
2.1 Preliminary technical solutions in coronary MRI
Different acquisition and post-processing technique have been recently developed in order to reach sufficient diagnostic quality of the coronaries images. Firstly, high and isotropic resolution of the acquired images (approximately 1 mm or less) is desirable to observe such small and tortuous
17
Figure 2.1: One of the MR scanners used for coronary MRI at the CHUV/CIBM, the Siemens Trio 3T. Image from the website [2].

State of the art coronary MRI
vessels. In order to perform high resolution MRI examinations, full sampling of the k-space domain [23] is generally required. Hence, the amount of data that needs to be acquired is significant. State of the art solution to provide high resolution of the acquired volumes is parallel imaging. This technique exploits the multiple elements of the phased-array coil, that is used to detect the signal, to reduce acquisition time and produce detailed images of the heart; it is based on the possibility of combining signal information recorded by different radiofrequency channel, and, simultaneously, on the possibility of reducing the k-space lines that have to be acquired. The k-space undersampling requires the use of specific post-processing algorithms to reconstruct the global image; these algorithms can operate either in the frequency domain (SMASH, GRAPPA) or in the image domain (SENSE, mSENSE). For more details on parallel imaging techniques, see reference [24]. At the same time, high constrast between the lumen, the sourronding fat and the myocardium should be provided. This aspect can be satisfied by using specific imaging sequences, such as balanced SSFP [25], and preparatory pulses sequences to excite the region of interest, like T2-preparation [26, 27]. In addition, fat signal can be suppressed by using specific frequency-selective pre-pulse, called fat-saturation pulses [28]. In order to image the whole length of the coronaries, a sufficient imaging volume has to be acquired in order to encompass the targeted vessels. A possible approach for imaging the coronaries is the so-called volume-targeting approach. Before performing the high-resolution acquisition, a low-resolution scout scanning is acquired. Subsequently, volume targeting of the coronaries is obtained by using targeted scan approach [29] or a three-point planscan tool [30]. In this scenario, scanning time is reduced but, at the same time, it is highly operator-dependent. In this context, several measurements are needed in order to image the major coronary segments and, as consequence, the total duration of the clinical examination is long. Recently, the whole-heart imaging approach has been introduced [31]; in this case, a whole acquisition of the cardiac organ is performed. Then, the localization of the coronaries is obtained by post-processing the acquired data volume with a specific software tool. This procedure is operator-independent, since no scout scanning steps for localizing the target vessels are required. In addition, specific software tools allow the possibility of asses the whole length of the coronaries and vessels diameter. For these reasons, whole-heart 3D coronary MRI is nowadays considered more advantageous.
2.2 Motion compensation in coronary MRI
As seen in Section 1.3, physiological movements have a great impact on coronary MRI. The hardware limitations of the current clinical MR scanners do not allow to perform a complete 3D high-resolution acquisition as fast as a single heartbeat. The relatively long measurement times of MR imaging require splitting the coronary acquisition into several heart-beats, in what is commonly referred to as segmented acquisition. As the amount of data needed for a whole heart segmented acquisition is also usually too large even for a single breath-hold, the examination is commonly performed in free breathing. In these conditions, both cardiac and respiratory motion have to be considered in the acquisition planning; indeed, inconsistencies in position or motion state of k-space lines belonging to the same acquisition result in heavy artifacts in the image domain, such as ghosting, blurring and streaking. In the following sections, state of the art
18

State of the art coronary MRI
solutions for motion compensation will be examined, with particular attention to respiratory motion compensation.
2.2.1 Compensation of cardiac-induced motion
The heart behaves like a double pump, which can provides the entire body with oxygenated blood supply. It is assumed that cardiac cycles are regular and highly repetitive and also that periods of minimal motion of the coronaries can be observed within the cardiac cycle. By measuring an MR compatible ECG signal, indirect information about the cardiac motion can be extrapolated while data acquisition is performed. The period of minimal cardiac motion is generally inspected by a cine scan performed before coronary MRA; this is a 2D time resolved acquisition, segmented over multiple heart beat and performed in breath-hold, which provides information on the motion state of the heart in all phases of the cardiac cycle. The time window with minimal cardiac motion can be visually estimated from cine images. A trigger delay is then applied after the detection of the R-wave recorded, in order to perform data collection during such period of minimal motion. Data acquisition is usually performed in end-diastole; however, in pediatric patients or patients with a high heart-rate, end-systolic imaging could lead to better diagnostic quality [32]. In general, at least 300 subsequent heart-beats (interleaves) are required in order to complete the k-space sampling with this strategy to contrast cardiac induced motion [33]. The concept of segmented acquisition and ECG triggering is graphically explained in Figure 2.2.
19
Figure 2.2: In this figure, the concept of segmented acquisition and ECG triggering is shown. After the R-wave detection (red triangles), a trigger delay determines the starting time of data acquisition. As only a limited amount of data can be acquired during a single heart phase, multiple consecutive cardiac cycles are required in order to complete the k-space sampling. As soon as the complete k-space sampling is performed, the final image can be reconstructed by computing the Fourier Transform.

State of the art coronary MRI
2.2.2 Compensation of respiratory-induced motion
The simplest approach for compensating the respiratory-induced motion is to perform the acquisition during breath hold (BH). In this scenario, the patient is asked to hold the breath for a time interval of approximately 10-30 s. As the time needed for the acquisition of a whole heart scan usually exceeds the breath hold capabilities of both patients and volunteers, the data might be collected over multiple successive BHs. In this case, however, a high consistency in the respiratory position of all BHs is required to avoid misregistration errors. BH acquisitions also require a strong patient’s cooperation and the ability of maintaining a constant position during the breath-hold. Although this approach tends to be successful with motivated volunteers, it often fails when applied in a clinical setting. On the other hand, free breathing (FB) acquisitions are preferable for a number of reasons. First, this kind of acquisition is more suitable for patients with cardiac problems as well as for pediatric patients, who can have serious difficulties in maintaining even very short BHs. In addition, FB acquisitions are considered more relevant from a clinical point of view. As the consistency of the respiratory position during the segmented acquisition is no longer guaranteed during, motion compensation strategies for respiratory-induced motion must be applied.Since the SI displacement is the main component of the respiratory-induced motion of the heart, this type of motion can be compensated with a 1-dimensional (1D) measure. Two different family of strategies exist to compensate respiratory induced motion, as reported as follows:
• Navigator-gating: The most diffused “state of the art” techniques for respiratory-induced motion compensation are represented by the so-called navigator-gating (NAV) techniques. These approaches aim at monitoring the SI displacement of a moving structure in real time, by using a fast preparation pulse, right before or after the actual data acquisition. In general, a respiratory navigator [34] is positioned on the dome of the right hemi-diaphragm before the start of the actual acquisition. As a there is usually a high contrast at the level of the liver-lung interface, the position of the diaphragm along the major direction of the respiratory motion can be extracted from the navigator signal. Such navigator signal is usually acquired right before the actual acquisition of each k-space segment, thus providing a real-time feedback on the respiratory phase associated to each of the segments. A narrow acceptance window is applied to the signal of the NAV, and only the k-space segments acquired within the same respiratory phase (e.g. end-expiration level of the respiratory curve) are accepted and processed for reconstructing the final image. If the navigator signal falls outside the range defined by such acceptance window, the image data are rejected and the k-space segments need to be re-acquired. The acquisition process continues until the k-space is completely sampled. Graphical explanation of how the NAV works is provided in Figure 2.3.The possibility of using the navigator approach in a clinical setting is strongly limited by several reasons. Firstly, the acceptance rate provided by the navigator gating is less than 40% in many cases. Secondly, the duration of the data acquisition can not be planned, since irregularities on the respiratory pattern of the patient can lead to unpredictable examination times. The need of combining data acquisition process during both a specific respiratory phase and a short time window within the cardiac cycle, leads to a very poor scan efficiency when coronary MR
20

State of the art coronary MRI
21
Figure 2.3: Schematic representation of a navigator-gated acquisition. In 1a, the position of the field of view (FOV) of the navigator (red rectangle) and the position of the imaging FOV (green square) are shown. In this example, whole-heart imaging is performed and the navigator signal is acquired right before data acquisition (1b). In correspondence to every single heart-beat, the position of the liver-lung interface, where the FOV of the navigator is placed, is determined by an automatic algorithm. In 2, a schematic representation of the acceptance window concept is provided. The blue line represents the respiratory pattern. A small acceptance window (light green rectangle) is defined in correspondence to a specific respiratory phase. Hence, the k-space segments acquired when the navigator signal falls inside the acceptance window (green circles) are accepted and processed for obtaining the final image. On the contrary, the segments acquired when the navigator signal falls outside the acceptance window (red circles) are discarded and re-acquired.

State of the art coronary MRI
angiography is performed; indeed, since approximately the 50% of the breathing cycle and the 10% of the cardiac cycle are maintained for the reconstruction, the total efficiency is below 5%. In addition, temporal delays between the navigator signal and the actual image acquisition may compromise the evaluation of the correlation between information from the navigator and the current position of the heart; indeed, even if the NAV reports a specific respiratory phase, the real data acquisition happens a little bit later. Errors can also increase due to hysteresis [18]; this point can be avoided by reducing the amplitude of the acceptance window. However, this fact can lead to a even lower scan efficiency. In addition, the NAV operates by assuming a linear relationship with a fixed factor [15] between the respiratory motion of the liver and the motion of the heart. This is an approximation and a direct measurement of the movement of the heart is not provided. In order to avoid all these drawbacks, a more efficient approach for compensating the respiratory motion should be defined.
• Self-navigation: In order to overcome some of the drawbacks of navigator-gated acquisitions, self-navigation techniques for respiratory motion compensation have been recently introduced [35, 36]. In this scenario, the information about the respiratory motion is extracted directly from the data acquired for imaging. Thus, the need of an external respiratory navigator is avoided. This results in several theoretical advantages. First of all, information on the
22
Figure 2.4: Example of technical solutions to improve image quality in cardiovascular MRI. In 1, no motion suppression and contrast enhancement have been applied. In 2, an ECG-triggered acquisition has been realized in order to constrast the movement of the myocardium. In 3, an additional respiratory motion compensation based on the NAV approach has been added. In 4, T2 preparation was also performed in addition. A significant improvement in image quality from 1 to 4 can be visually noticed. These images are curtesy of Prof. Matthias Stuber.

State of the art coronary MRI
23
Figure 2.5: Schematic representation of a self-navigated acquisition. As shown in 1a, no additional navigators are required. The very first readout of each k-space segment is acquired along the SI direction. Its 1D FFT represents the projection of the entire imaging volume onto the SI direction (orange line). As for the navigator approach, data acquisition is performed during the period of minimal heart motion within every cardiac cycle (1b). 2, During the acquisition, the relative displacement of the heart between each SI projection (orange dotted line) and the reference acquired at the very beginning of the scan (light blue line) is evaluated. The two curved azure lines represent the computed motion detection. Finally, the respiratory motion compensation is performed directly in k-space.
# SI projection
pixe
l

State of the art coronary MRI
respiratory-induced motion of the heart is extracted directly from the object of interest, without using indirect measurements or motion models that relate the displacement of the heart to that of the diaphragm. Secondly, the detection of the respiratory position is more accurate, since no delay subsists between NAV signal and data imaging acquisition. The advantage of measuring the heart itself allows the possibility of correcting for the motion instead of only tracking it. Therefore, no interleaves are discarded and the whole amount of acquired data can be processed to obtain the final image, thus conducting to a 100% of scan efficiency. The scout scanning for placing the NAV can be also avoided. In details, these techniques try to extract information on the position of the heart along the principal direction of the respiratory motion, by acquiring one or more additional readout, that is the signal detection portion in a MRI measurement, oriented along the SI direction at the very beginning of each k-space segment. From a theoretical point of view, the 1D Fourier transform of these readouts, which will be referred to as SI projection, can be intended as projections of the imaging volume onto the SI direction. The SI projection associated to each data segment is compared to a reference SI projection, acquired within the very first data segment. Thus, the relative displacement (or offset) between the positions of the heart in each SI projection and in the one taken as reference is determined. Such respiratory offset can be determined either using a centre of mass approach [35] or a cross-correlation approach [37]. The calculated displacement is used to perform respiratory motion correction directly in k-space, before the final image reconstruction [38]. Graphical explanation of how a self-navigated acquisition is realized is provided in Figure 2.5.
The work developed in this thesis is based on a specific implementation of the self-navigation approach, described in [37, 39]. This implementation has demonstrated the fact of being very robust in comparison to conventional NAV approach in terms of both final image quality and scan efficiency [37]. In the continuation of the chapter, this implementation is presented and described
2.3 Fully integrated 1D respiratory self-navigation for whole heart
coronary MRI
As already introduced, the self-navigation approach for compensating respiratory-induced motion in coronary MRI is one of the most promising techniques nowadays. Possible solutions for realizing an implementation of this type of approach should consider two important aspects. Firstly, a k-space trajectory for sampling the frequency domain while data acquisition is performed has to be chosen. Secondly, a robust method for extracting motion information from the readouts has to be defined. In this section, a proposed solution [37] to perform a whole-heart self-navigated 3D coronary MRI is presented.
24

State of the art coronary MRI
2.3.1 Data acquisition
While MR acquisition is performed, a series of k-space lines is acquired until the data collection is completed. The k-space sampling can be performed in various ways, and the most important are:• Cartesian acquisition: in a normal Cartesian scan, each k-space line is acquired within a Cartesian grid. The k-space is uniformly sampled and the interval between two different samples is constant (Figure 2.7.1).• Radial acquisition: in a radial scan, each readout cross the centre of the k-space. In this scenario, the centre of k-space is always more densely sampled if compared to the peripheral regions (Figure 2.7.2). This oversampling of the centre of k space provides more information on contrast and general shape of structures. For each readout, the motion that happens perpendicular to the readout itself is not resolved; however, motion sensitivity can be globally reduced by
25
Figure 2.6: Scheme of the proposed self-navigation algorithm. Each block is explained in this following section.

State of the art coronary MRI
changing the orientation of every single readout [41]. These aspects make radial acquisitions more robust against motion artifacts than Cartesian scans.
One of the drawbacks of using radial trajectories for MR imaging concerns the process of image reconstruction. Since the data points acquired along each radial readout do not fall onto the regular Cartesian grid in k-space, the usual uniform FFT can not be straightforwardly applied. For this reason, an appropriate reconstruction technique, i.e. gridding, is needed. The gridding technique consists in relating each data sample to a specific neighbourhood within the Cartesian grid. In synthesis, each acquired sample is convolved with a specific Kernel function, in order to distribute its contribution among some of the neighbouring points on the grid (see Figure 2.8). One of the most used kernel function is the Kaiser-Bessel function of the first type [42]. In addition, the disparity in sample distribution between the centre and the periphery of k-space requires the use of a density compensation function [43, 44]. The compensation is usually performed before the gridding procedure; the complexity of this procedure is significantly reduced if the radial readouts are uniformly distributed.
In coronary MRI, the k-space has to be segmented and acquired in multiple heart-beats. For a 3D segmented 3D radial trajectory two important requirements need to be satisfied:
• Overall uniform coverage of k-space has to be provided. When data acquisition is completed, the k-space points on the external surface of the sphere and, therefore, on the whole sphere, need to be uniformly distributed; in this scenario, the density compensation function can
26
Figure 2.7: 2D representation of Cartesian (1) and radial (2) acquisition. In a Cartesian scan, k-space lines are acquired within a Cartesian grid. The distance between two consecutive samples (blue circles) is constant. In radial scan, all the k-space lines cross the centre of k-space. Therefore, the centre of k-space is more densely sampled and the distance between every two samples is not constant.

State of the art coronary MRI
27
Figure 2.8: Scheme of the gridding procedure for a 2D acquisition. (a) The contribution of each sample point on an arbitrary trajectory through k-space (dashed line) is distributed among its neighbouring points on the Cartesian grid, according to the width and shape of the kernel used for the convolution. The red dot represents the presently convolved sample. (b) From this 2D visualization of the k-space, it is clearly visible the fact that the centre of the domain is more densely sampled.

State of the art coronary MRI
28
Figure 2.9: K-space sampling in an Archimedean acquisition (column a) and in a spiral phyllotaxis pattern (column b). In row 1, a single interleave is depicted for both the trajectory. Red lines represent the distance between two consecutive samples. The whole length of the readout is represented by a black line. In row 2, a top-view of sample distribution in 3 consecutive interleaves is shown. Blue dots represent the beginning of each readout. In row 3, the final k-space coverage is shown for both cases. In all the figures, half 3D k-space is depicted. The trajectories are symmetrical respect to the origin of k-space.

State of the art coronary MRI
be easily applied.
• Optimal interleaving properties are desirable, in order to avoid rapid changes in gradient moments. These have to be avoided, since they can entail eddy current effects which degrade the inal image quality. Indeed, inducted currents in the conducting part of the magnet can produce additional changing magnetic field, thus resulting imperfections of the final image. be easily applied.
A 3D segmented 3D radial trajectory based on a spiral phyllotaxis pattern [40] can be a solution to satisfy these requirements, since:
• Uniform sampling of k-space is provided.
• If the number of readouts within a single interleave is a Fibonacci number, the distance between successive readouts within the same interleave is significantly reduced and the interleaves self-arrange thus significantly avoiding the eddy current effects.
Moreover, each segmented portion of this trajectory can be easily integrated with an additional readout, starting at the top of the sphere and oriented along the SI direction. This readout can be acquired at the very beginning of the interleave itself. This fact has minimal impact in terms of eddy current effects. In addition, it provides the possibility of extracting motion information along the principal direction of the respiratory motion. Due to all these reasons, this trajectory is intrinsically prepared for self-navigated cardiac MRI. Figure 2.9 highlights the different sample distribution between 3D segmented 3D radial trajectory based on spiral phyllotaxis pattern and a conventional Archimedean spiral pattern [45]. In both cases, the overall sampling of k-space is highly uniform. However, the spiral phyllotaxis pattern shows a more optimized distribution of readouts.
2.3.2 Isolation and segmentation of the blood pool
The application of bSSFP sequence and T2-preparation when image data are acquired should provide adequate contrast between the blood signal and the myocardium; therefore, the projection of the volume of the FOV onto a line should provide the possibility of detecting the blood pool as a bright signal on a darker background (Figure 2.8.1). However, when 3D radial MRI examination is performed, the acquisition of the signal is non-selective; indeed, the whole volume in the scanner is excited and even the volume outside the FOV is part of the measured signal. Therefore, the signal converging to the radial readouts originate from different structures (e.g. chest wall, liver, arms, etc) can be visible in the projections (Figure 2.8.2). In this scenario, pulses programming strategies, such as fat-signal suppression and T2 preparation, are usually insufficient to produce an adequate contrast between the blood-pool and the surrounding tissue. As a consequence, these several additional sources of bright signal can degrade the input data used for the self-navigation. Therefore, a post-processing operation is needed, in order to suppress unwanted signal from other bright structures and to permit an adequate comparison
29
State of the art coronary MRI
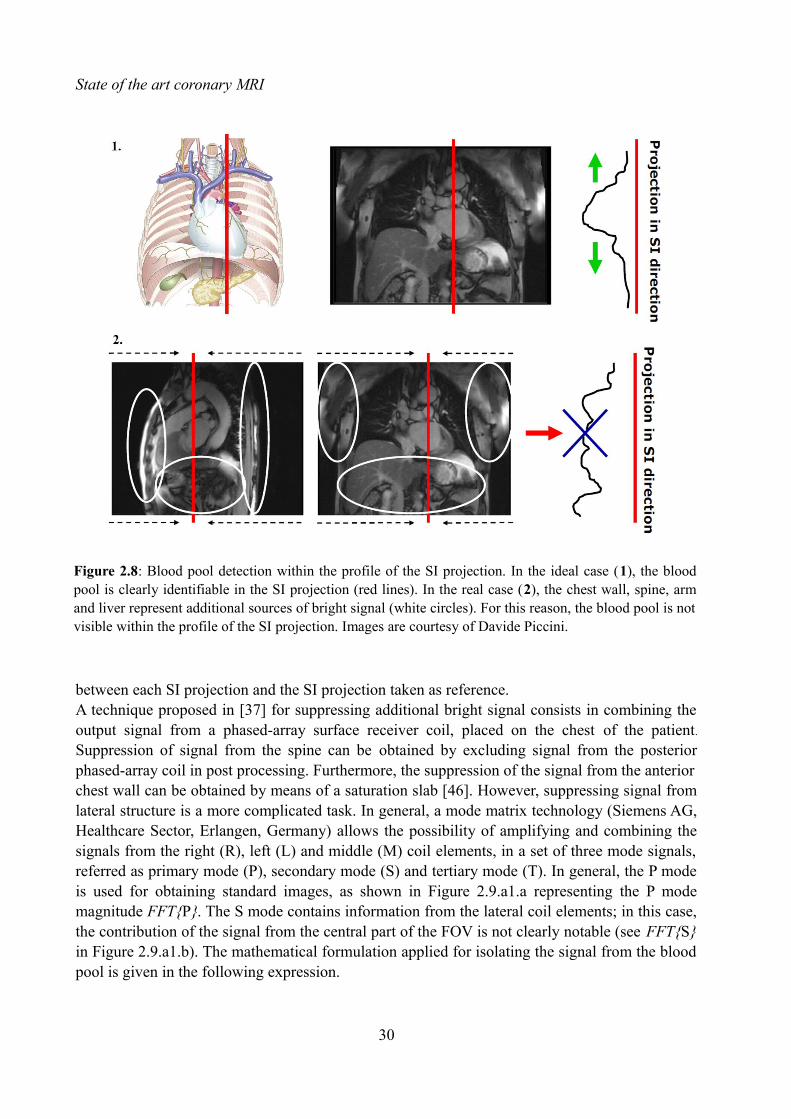
between each SI projection and the SI projection taken as reference.A technique proposed in [37] for suppressing additional bright signal consists in combining the output signal from a phased-array surface receiver coil, placed on the chest of the patient.
Suppression of signal from the spine can be obtained by excluding signal from the posterior phased-array coil in post processing. Furthermore, the suppression of the signal from the anterior chest wall can be obtained by means of a saturation slab [46]. However, suppressing signal from lateral structure is a more complicated task. In general, a mode matrix technology (Siemens AG, Healthcare Sector, Erlangen, Germany) allows the possibility of amplifying and combining the signals from the right (R), left (L) and middle (M) coil elements, in a set of three mode signals, referred as primary mode (P), secondary mode (S) and tertiary mode (T). In general, the P mode is used for obtaining standard images, as shown in Figure 2.9.a1.a representing the P mode magnitude FFT{P}. The S mode contains information from the lateral coil elements; in this case, the contribution of the signal from the central part of the FOV is not clearly notable (see FFT{S} in Figure 2.9.a1.b). The mathematical formulation applied for isolating the signal from the blood pool is given in the following expression.
30
Figure 2.8: Blood pool detection within the profile of the SI projection. In the ideal case (1), the blood pool is clearly identifiable in the SI projection (red lines). In the real case (2), the chest wall, spine, arm and liver represent additional sources of bright signal (white circles). For this reason, the blood pool is not visible within the profile of the SI projection. Images are courtesy of Davide Piccini.

State of the art coronary MRI
Psi and Ssi represent the complex readouts corresponding to SI orientation obtained, respectively, from the P and the S modes. Rsi, Lsi, and Msi represent the complex readouts from the R, L, and M coil elements. The symbol j represent the imaginary unity and, by using the operator | · |, the absolute value of the signal pixel-wise is computed. The final isolation of the signal from the blood-pool is shown in Figure 2.9.a1.c.
31
Figure 2.9: Example of suppression of additional signal from lateral structure by the combination of the mode signals from the anterior phased array coil. Along the top row, three different 2D slices are shown; each one of them is obtained with standard Cartesian acquisition from a volunteer. Along the bottom row, a three series of 50 SI projections, acquired in 50 consecutive heart-beats of the same volunteer, are shown. In this case, a 3D radial trajectory has been used. The magnitude of the signal reconstructed with the P mode (column a) is affected by the brightness of the lateral structures (white arrows in a.a1); therefore, the blood-pool is not clearly isolated from the background signal, as can be noticed in the SI projections series in a.b1. The contribute of the lateral structures on the S mode is clearly highlighted in column b. In column c, a convenient combination between the signals from the P and S mode is shown. The bright signal form the lateral structures is efficiently suppressed (a1.c) and the blood-pool is clearly visible as the most bright structure in the series of the SI projections (b1.c). This image is from [37].
Csi=∣FFT {Psi }∣−∣FFT {Ssi }∣=∣FFT {( Rsi−Lsi)2
− j⋅(Msi√2 )}∣−∣{FFT
(Rsi+Lsi)
√2 }∣

State of the art coronary MRI
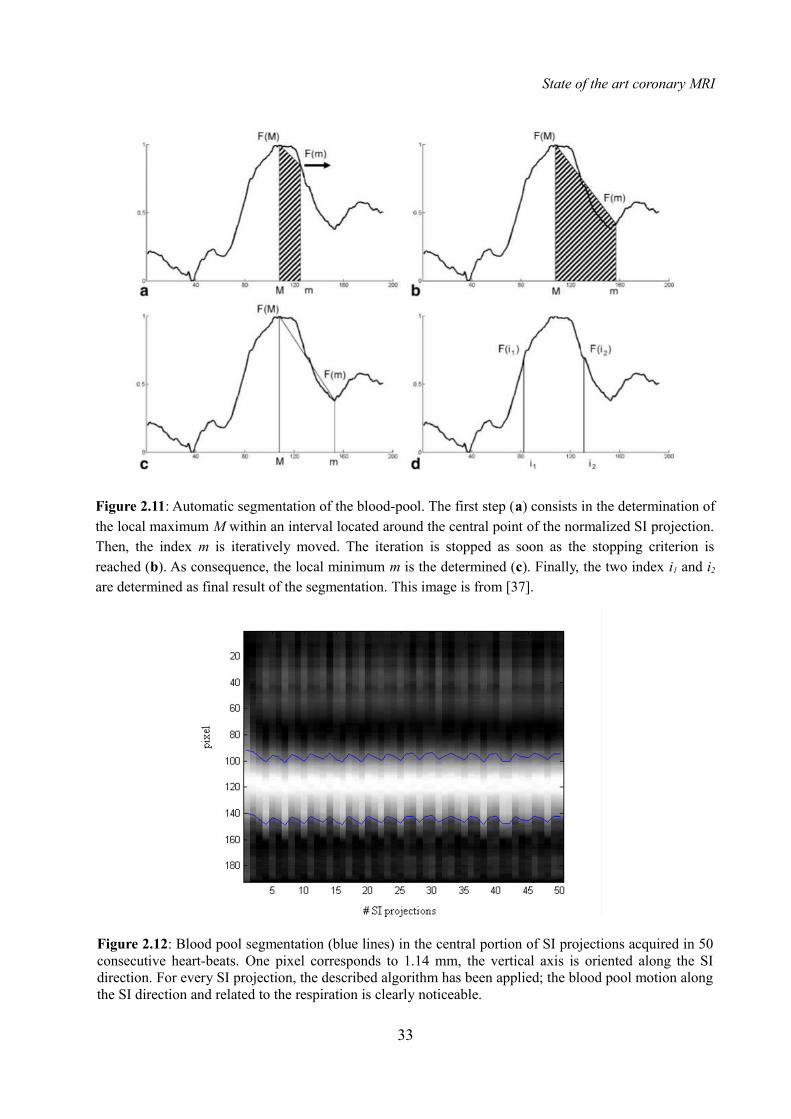
The presented method for suppressing the additional lateral signal does not totally assure that the blood-pool will be the only structure visible in each SI projections. Therefore, a robust method for identifying this structure within every single SI projection should be defined. A method for the automatic segmentation of the blood-pool in four steps is presented. The algorithm is based on the assumption that the FOV is placed such that the blood pool is located in its middle. This
algorithm is applied to the SI projection after its intensity normalization. Graphical explanation is provided in Figure 2.11. The four steps are: 1) The index of local maximum, M, within the blood-pool is determined. An initial search range, equal to one-eight of the total length of the SI projection, is fixed around its central point. Subsequently, an index m identifying the candidate local minimum is iteratively moved outward. 2) At each iteration, two different areas, A1 and A2
are computed. A1 the area of the trapezoid delimited by the vertices F(M) and F(m) on the projections (see Figure 2.11.b), once that M and m have been determined along the ascissa. A2 is the area under the projection, spanned from index M to index m. The stopping criterion is defined in the following equation.
3) Then, m is assigned to index corresponding to the found local minimum within the current [M, m] interval. 4) The final result of the segmentation is represented by the indices i 1 and i2, corresponding to F(ik)≈0.5∙(F(m)-F(m)), where k=1,2 and the symbol ≈ refers to the closest pixel.
32
Figure 2.10: Example of isolated bright blood-pool in a volunteer. The central portion of 50 SI projections acquired in 50 consecutive heart-beats is shown. One pixel corresponds to 1.14 mm, the vertical axis is oriented along the SI direction. Before performing the proposed combination of the coil elements, the bright signal from the blood-pool is hidden by several other sources of signal (1). Subsequently, an appropriate coil channel combination makes the blood-pool clearly visible (2).
A1=(F (M )+F (m))⋅∣m−M∣
2>∑
i=M
m
F (i )=A2
State of the art coronary MRI
33
Figure 2.11: Automatic segmentation of the blood-pool. The first step (a) consists in the determination of the local maximum M within an interval located around the central point of the normalized SI projection. Then, the index m is iteratively moved. The iteration is stopped as soon as the stopping criterion is reached (b). As consequence, the local minimum m is the determined (c). Finally, the two index i1 and i2
are determined as final result of the segmentation. This image is from [37].
Figure 2.12: Blood pool segmentation (blue lines) in the central portion of SI projections acquired in 50 consecutive heart-beats. One pixel corresponds to 1.14 mm, the vertical axis is oriented along the SI direction. For every SI projection, the described algorithm has been applied; the blood pool motion along the SI direction and related to the respiration is clearly noticeable.

State of the art coronary MRI
2.3.3 Motion detection and compensation
The segmentation of the blood pool allows for the possibility of computing the respiratory shift in SI direction. Firstly, the segmentation of the blood pool pool is computed on the first SI projection, taken as reference. Then, the respiratory motion of the heart is calculated for every heart beat by maximizing the result of the cross-correlation between the result of the segmentation and all the successive SI projections. Finally, the estimated offset is applied to the original readouts by multiplication of a linear-phase in k-space, according to the Fourier shift theorem [38].
2.4 Image quality evaluation in coronary MRI: “Soap-Bubble”
Nowadays, a large number of scanning methods and post-processing reconstruction algorithms are studied and applied in coronary MRI. Therefore, scanning methods suitability and algorithms performances should be evaluated. Different datasets should be compared by assuring an adequate visualization of the imaged coronaries. For this reason, an objective quantitative comparison between images is desirable. A software tool called “Soap-Bubble” has been developed [47] in order to satisfy these requirements. Indeed, this tool allows several important possibilities;
• Coronaries reformatting: the visualization of the entire coronary anatomy within a single
34
Figure 2.13: Comparison between uncorrected (a) and corrected (b) dataset. SI projections acquired in 50 consecutive heart-beats are shown; blue lines represent respiratory motion detection of the blood-pool realized by applying the segmentation algorithm. Red lines represent motion detection realized by maximizing the cross correlation between the blood-poll segmented in the very first SI projection and all the others. One pixel corresponds to 1.14 mm, the vertical axis is oriented along the SI direction.

State of the art coronary MRI
slide of the 3D imaged volume is typically prevented. By using this tool, multiplanar reformatting (MPR) and maximum intensity projection (MIPs) of the vessels can be obtained. It is assumed that the coronary anatomy within the acquired 3D volume V can correspond to a 3D surface D; this surface is relatively smooth and can be ideally compared to the surface of a soap bubble. By manipulating this surface, thus obtaining D’, its projection on a plane perpendicular to the normal vector N = (0, 0, 1) can be obtained. The Soap-Bubble tool is provided with a user-interface, which allows the possibility of selecting a series of points Pi = (Pix, Piy, Piz) on the
coronary vessels included in V. The manipulated surface D’ is then defined by applying a 3D Delaunay triangulation algorithm [48] to the selected points. Each pixel belonging to D’ is then projected to the plan perpendicular to N. Then, a volume characterized by a thickness ds can be defined by the user; subsequently, a MIP parallel to N is performed. Finally, a 2D image of the coronaries anatomy is obtained; in this image, real distances are not maintained but the whole vessel length can be visualized. The selected points in V, Pi ... Pn Pi = (Pix, Piy, Piz), are presented in equal number in the reformatted representation of the coronary anatomy as a series of 2D projection P’i ... P’n Pi’ = (P’ix, P’iy, P’iz).
• Vessel length evaluation: the tool is provided with a “Length Measurement” mode, which allows the possibility of measuring the length of a portion of a coronary artery. The tool allows the possibility for the user of selecting a subset of points P’i ... P’k belonging to the series P’1 ... P’n, thus identifying a portion of the coronary segment of which the length measurement will be computed. The 3D representation Pi ... Pk of P’i ... P’k is easily obtained; therefore, a realistic
35
Figure 2.14: Soap-Bubble coronary reformatting. The surface D is defined by the user selected series of points Pi; then, the convex manipulated surface D’ is obtained by 3D Delaunay triangulation. A parallel MIP of the manipulated surface is then performed parallel to the direction N. The thickness ds define the volume that encompasses the coronary tree. This image is from [47].
State of the art coronary MRI
length of the selected portion of vessel can be evaluated.
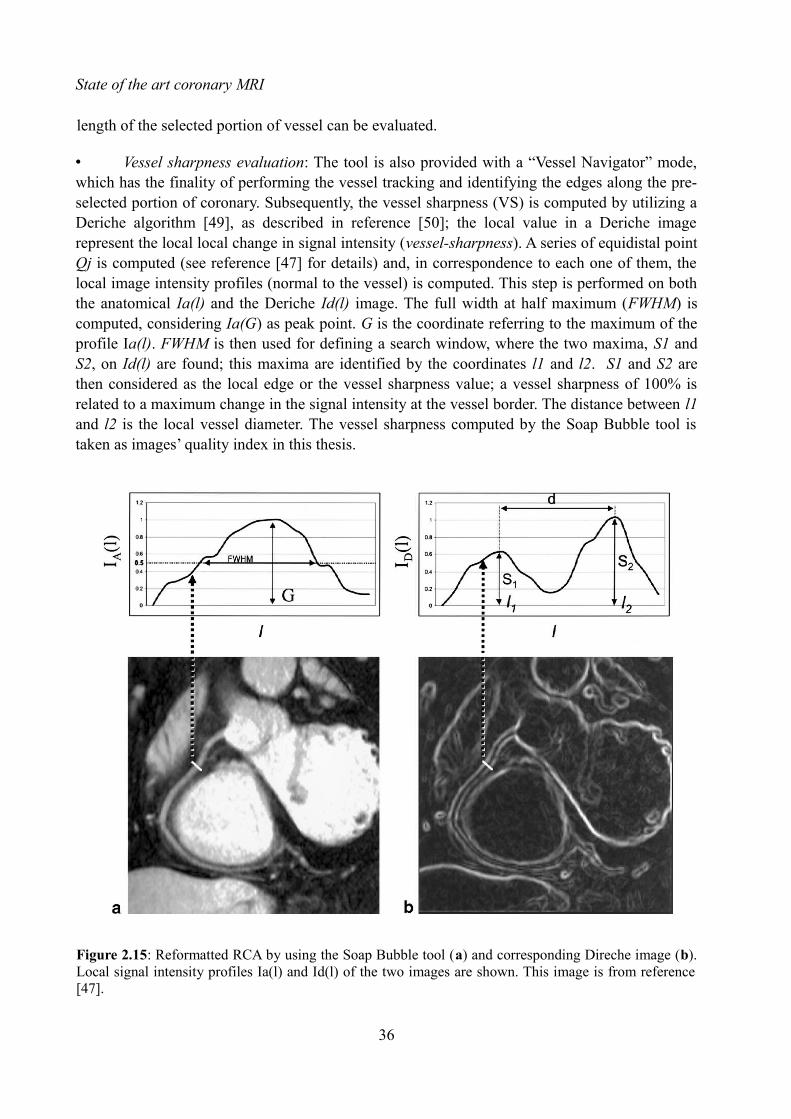
• Vessel sharpness evaluation: The tool is also provided with a “Vessel Navigator” mode, which has the finality of performing the vessel tracking and identifying the edges along the pre-selected portion of coronary. Subsequently, the vessel sharpness (VS) is computed by utilizing a Deriche algorithm [49], as described in reference [50]; the local value in a Deriche image represent the local local change in signal intensity (vessel-sharpness). A series of equidistal point Qj is computed (see reference [47] for details) and, in correspondence to each one of them, the local image intensity profiles (normal to the vessel) is computed. This step is performed on both the anatomical Ia(l) and the Deriche Id(l) image. The full width at half maximum (FWHM) is computed, considering Ia(G) as peak point. G is the coordinate referring to the maximum of the profile Ia(l). FWHM is then used for defining a search window, where the two maxima, S1 and S2, on Id(l) are found; this maxima are identified by the coordinates l1 and l2. S1 and S2 are then considered as the local edge or the vessel sharpness value; a vessel sharpness of 100% is related to a maximum change in the signal intensity at the vessel border. The distance between l1 and l2 is the local vessel diameter. The vessel sharpness computed by the Soap Bubble tool is taken as images’ quality index in this thesis.
36
Figure 2.15: Reformatted RCA by using the Soap Bubble tool (a) and corresponding Direche image (b). Local signal intensity profiles Ia(l) and Id(l) of the two images are shown. This image is from reference [47].

State of the art coronary MRI
• Signal to noise (SNR) and Contrast to noise (CNR) evaluation; see reference [47] for details.
37
Figure 2.16: User interface of the Soap Bubble tool. After loading the MR dicom dataset, three different perpendicular reformat of the acquired volume are shown (1, 2, 3). The user has the possibility of manually selecting points (orange dots in 1, 2, 3) within the examined volume by using a mouse click of the left button. The user can selectively navigate in the 3D dataset, and points can be clicked in all the three reformat. Points can be also saved for further analysis. The possibility of zooming the dataset or moving the display planes is also provided by dedicated buttons (orange rectangle). Then, the skin thickness ds can be also selected by the user (green rectangle). The reformatted image is proposed in 4; in this case, LAD, RCA, left main coronary artery (LM), circumflex branch of the left coronary artery (LCX) are visible. The reformatted image can be saved in .jpeg or .tiff format. The vessel length has been computed on a segment of the RCA (blue rectangle); by selecting the “Vessel Navigator” modality, the Deriche image is shown in 5; distance between borders is computed (red lines), and finally vessel diameter and vessel sharpness are calculated. Results are automatically saved in a separate .txt file.


CHAPTER 3
OPTIMIZED RESPIRATORY REFERENCE POSITION FOR 3D SELF-NAVIGATED WHOLE HEART MRA
3.1 Introduction
As already introduced in the previous Chapter, self-navigation is one of the most promising techniques for performing respiratory motion compensation in whole heart 3D coronary MRI. Among the advantages of such technique there are: the ease-of-use, robustness, and shorter scanning time. These advantages are especially relevant if self-navigation is compared to more traditional navigator-based approaches. In this scenario, the SI projection acquired at the very beginning of the clinical examination is used as reference for the motion detection algorithm. In this case, as the reference position of the blood pool is known since the first data segment of the acquisition, it becomes possibile to perform online motion detection and correction of all subsequently acquired image data. Although good results have been obtained, the influence of the choice of the reference position on the final image quality has, to our best knowledge, not yet been evaluated. Therefore, the purpose of this work is to investigate the relationship between the choice of the reference position for self navigated coronary MRA and objective image quality. Major parts of this chapters are published as a conference abstract in [22]. The submitted abstract is provided at the end of the this chapter.The effect of choosing one of the following respiratory reference positions on the final image quality was assessed:
• End-inspiration (end-insp) and end-expiration (end-exp): these respiratory references position could be suitable candidates since they represent a pause of the respiration, thus implying a lower velocity of the heart movement.
• Average value of all detected respiratory positions (mean): this respiratory position could be advantageous since corrections over large distances and the related non-linear effects can be avoided.
• The respiratory position occurring in the first cardiac cycle (random): the choice of this reference represents the current solution to perform self-navigation with the selected technique.
In addition, the most frequent respiratory phase within the respiratory pattern was identify, in order
39

Optimized respiratory reference position for 3D self-navigated whole heart MRA
to investigate a possible relation between the final image quality and the occurrence of the respiratory position chosen as reference.
3.2 Methods
3.2.1 Data acquisition
Free-breathing self-navigated coronary MRA was performed in N=11 healthy volunteers, after informed consent was obtained and with approval of the institutional review board. Two different 1.5 T clinical MRI scanners (MAGNETOM Avanto and MAGNETOM Aera, Siemens AG, Healthcare Sector, Erlangen, Germany) were used. Data acquisition was performed by using the 3D radial trajectory implementing an interleaved spiral phyllotaxis pattern described in [40] and introduced in Section 2.3.1; as already described, this trajectory is highly suitable for self-navigation since an additional readout oriented along the SI direction can be acquired at the very beginning of each interleave. All measurements were segmented and ECG triggered. The trigger delay of the acquisition window was placed to target the most quiescent mid-diastolic period and minimize cardiac-induced motion. The protocol parameters of the non-slice selective, T2-prepared, fat-saturated, balanced steady-state free precession imaging sequence were set as follow: TR/TE 3.0-3.1/1.51-1.56 ms, FOV (220mm)3, voxel size (1.15 mm)3, radio-frequency excitation angle 90°, receiver bandwidth 898 Hz/Pixel, and acquisition window ~100 ms. In all cases, a total number of 11687 readouts were acquired in 377 heart-beats.
3.2.2 Data processing
During post-processing, the algorithm for the segmentation of the blood pool described in Section 2.3.2 was applied to every SI projection in order to define the respiratory position of the blood pool for each data segment of each dataset. The indexes i1 and i2, representing the final result of the segmentation, were computed for every SI projection. The obtained series of i1
indexes was stored in a specific vector i1_vec. Identically, the obtained series of i2 indexes was stored in the vector i2_vec. The mean between these two vector was computed; this resulting vector mean_vec was used as reference vector to define the respiratory position of the centre of the blood pool in the SI readout acquired at the very beginning of each interleave. Graphical explanation of mean_vec computation is provided in Figure 3.1.Firstly, the computed mean_vec was used to perform a preliminary analysis of the respiratory positions of the blood pool in the 11 volunteers. The mean (µi) and the standard deviation (бi) of the respiratory position were calculated for all the volunteers (i = 1... N). All the respiratory positions above the value µi + 0.5∙бi were intended as end-exp, and all the respiratory positions under the value µi + 0.5∙бi were intended as end-insp. All the others respiratory position were intended as mean phase. The occurrence of each respiratory phase was calculated for each volunteer. An example of the identified respiratory phases in one volunteer is provided in Figure 3.2.
40

Optimized respiratory reference position for 3D self-navigated whole heart MRA
41
Figure 3.1: Segmentation and identified respiratory position of the blood pool in one of the 11 volunteers. In this figure, the central portion of SI projections acquired in 50 consecutive heart-beats are shown. One pixel corresponds to 1.14 mm, and the vertical axes is oriented along the SI direction. The two borders of the blood pool, i1_vec and i2_vec, were computed (blue lines); then, the mean between these two vectors (purple line) was calculated in order defining the respiratory position of the blood pool along time.
Figure 3.2: Respiratory phase identification in one of the 11 volunteers. The position of the centre of the blood pool along time is represented by the purple signal. For each SI projection, the respiratory phase were identified. Red crosses represent end-exp, yellow crosses represent mean and light blue crosses represent end-insp.

Optimized respiratory reference position for 3D self-navigated whole heart MRA
42
Figure 3.3: Histogram representation of respiratory positions of the centre of the blood pool in one of the volunteers and example of choice of the reference positions (a). The two extremes of the histogram were used for identifying the end-expiration (red rectangle in a) and the end-inspiration (blue rectangle in a) references. The bin in the yellow rectangle in (a) represents the position of the occurrences that are closest to µi. The first temporal occurrence in these bins was chosen, as represented in (b). End-expiration is indicated by the red cross, end-inspiration by the light blue cross, and mean by the yellow cross. The green cross indicates the position of the centre of the blood pool in the very first acquired readout. The red dotted line represents the mean value of the all positions of the centre of the blood pool.

Optimized respiratory reference position for 3D self-navigated whole heart MRA
The vector containing the blood pool positions was stored into a 50-bin histogram (see Figure 3.3.a) and analyzed with Matlab (The MathWorks Inc., Natick, MA). Four respiratory reference positions were selected from the histogram according to the following definitions (see Figure 3.3.b):
• End-expiration: this reference was chosen from the extreme of the histogram close to the head position. When the corresponding bin included more than one SI projection, the first temporal occurrence was chosen.
• End-inspiration: this reference was chosen from the extreme of the histogram close to the feet position. When the corresponding bin included more than one SI projection, the first temporal occurrence was chosen.
• Mean: the readout in which the position of the blood pool was closer to µ i was chosen as reference.
43
Figure 3.4: Manual segmentation of the target portion of vessel in one dataset using Soap-Bubble.

Optimized respiratory reference position for 3D self-navigated whole heart MRA
• Random: this reference is represented by the very first acquired SI readout, as in the standard approach.
Offline motion detection, motion correction and reconstruction were performed for all datasets as described in chapter 2, by using each of the four selected reference positions. In addition, all datasets were reconstructed without performing motion correction, for comparison. After every reconstruction, a quantitative analysis of image quality was performed by computing the percentage vessel sharpness (% VS) using Soap-Bubble. A 2 cm segment of the mid portion of the left anterior descending coronary artery (LAD) was chosen as target for all the reconstructed volumes (Figure 3.4). This specific portion of vessel is approximately perpendicular to the SI direction; due to this fact, it is very sensitive to artifacts caused by motion along that direction. Statistical comparisons of % VS values in all the reconstructed volumes were performed by means of a paired two-tailed Student’s t-test with Bonferroni correction for multiple comparisons.
44
Figure 3.5: Detected motion of the blood pool using the four selected reference respiratory positions (the SI projection taken as reference is marked with the dotted line in all the boxes); random (1), end-insp (2), end-exp (3), mean (4). In all the boxes, 50 SI projections contiguous to the reference and acquired in consecutive heartbeats are shown.
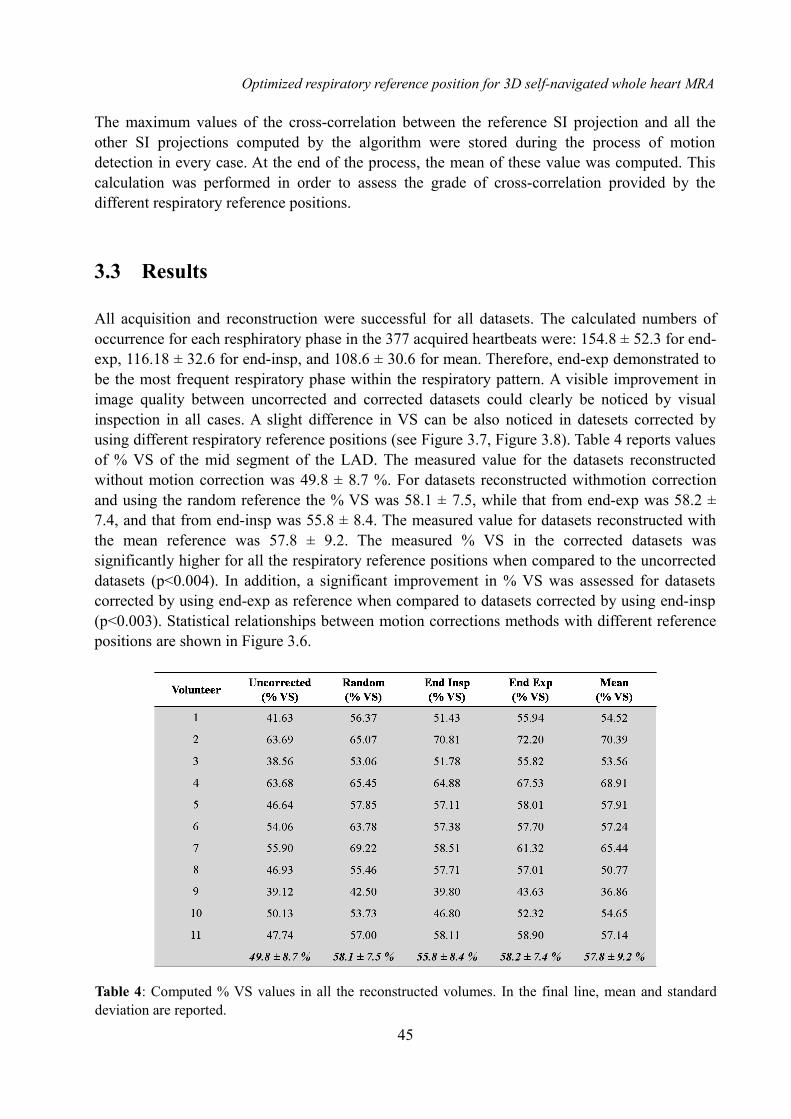
Optimized respiratory reference position for 3D self-navigated whole heart MRA
The maximum values of the cross-correlation between the reference SI projection and all the other SI projections computed by the algorithm were stored during the process of motion detection in every case. At the end of the process, the mean of these value was computed. This calculation was performed in order to assess the grade of cross-correlation provided by the different respiratory reference positions.
3.3 Results
All acquisition and reconstruction were successful for all datasets. The calculated numbers of occurrence for each resphiratory phase in the 377 acquired heartbeats were: 154.8 ± 52.3 for end-exp, 116.18 ± 32.6 for end-insp, and 108.6 ± 30.6 for mean. Therefore, end-exp demonstrated to be the most frequent respiratory phase within the respiratory pattern. A visible improvement in image quality between uncorrected and corrected datasets could clearly be noticed by visual inspection in all cases. A slight difference in VS can be also noticed in datesets corrected by using different respiratory reference positions (see Figure 3.7, Figure 3.8). Table 4 reports values of % VS of the mid segment of the LAD. The measured value for the datasets reconstructed without motion correction was 49.8 ± 8.7 %. For datasets reconstructed withmotion correction and using the random reference the % VS was 58.1 ± 7.5, while that from end-exp was 58.2 ± 7.4, and that from end-insp was 55.8 ± 8.4. The measured value for datasets reconstructed with the mean reference was 57.8 ± 9.2. The measured % VS in the corrected datasets was significantly higher for all the respiratory reference positions when compared to the uncorrected datasets (p<0.004). In addition, a significant improvement in % VS was assessed for datasets corrected by using end-exp as reference when compared to datasets corrected by using end-insp (p<0.003). Statistical relationships between motion corrections methods with different reference positions are shown in Figure 3.6.
45
Table 4: Computed % VS values in all the reconstructed volumes. In the final line, mean and standard deviation are reported.

Optimized respiratory reference position for 3D self-navigated whole heart MRA
The global cross-correlation between the reference and all the other SI projection results higher when end-expiration is taken as respiratory reference position, in comparison to the case of end-inspiration (correlation coefficient for end-exp = 0.862 ± 0.102, for end-insp = 0.795 ± 0.118, p<0.05).
3.4 Discussion and conclusion
This work was intended as an important preliminary step to:
• Accurately evaluate the described approach to perform self-navigation.
• Evaluate the influence of the choice of the reference respiratory position for self-navigated motion correction on the final image. This evaluation was performed for the first time.
• Provide a possible solution to improve the performances of the initially described technique in individual cases.
A statistically significant improvement was identified when end expiration was chosen over end inspiration as reference respiratory phase. This improvement is clearly visible in many cases (see Figure 3.7 and Figure 3.8). Relative similar findings between end-exp, random and mean references may be justifiable by the fact that end-exp is the more frequent phase in a regular
46
Figure 3.6: Mean and standard deviation of the measured vessel-sharpness in all 11 volunteers. The increase in vessel sharpness was statistically significant for all the datasets reconstructed by performing motion correction with respect to the non corrected dataset († p<0.004). In addition, a statistically significant difference in %VS between datasets reconstructed by using end-insp as reference and datasets reconstructed by using end-exp was assessed (* p<0.003).

Optimized respiratory reference position for 3D self-navigated whole heart MRA
47
Figure 3.7: Example of image quality using different reference respiratory position in one of the 11 volunteers. An improvement in the vessel sharpness can be observed by visually comparing the uncorrected dataset (a), the dataset corrected using end-insp as reference (b) and the dataset corrected using end-exp as reference (c). A clearly visible improvement can be noticed from the uncorrected a to b, and from a to c. The zoomed sections provide the possibility of observing a significant improvement also from b to c.
Figure 3.8: Another example of image quality using different reference respiratory position in one of the 11 volunteers. As in Figure 3.7 in a motion compensation was not performed. End-insp was used as reference in b, end-exp was used as reference in c. Also in this case, the image quality increases from a to b and c; in addition, a significant improvement can be also noticed from b to c.

Optimized respiratory reference position for 3D self-navigated whole heart MRA
respiratory pattern; therefore, both the random choice and the mean of the respiratory position may be biased towards end-exp. This result suggests the possibility of improving the image quality of the acquired volumes in individual cases. As described earlier, the choice of the first acquired interleave (random) as reference position allows the possibility of performing inline motion detection and compensation. However, this does not guarantee to obtain the highest possible image quality. A possible compromise could be that of starting the free-breathing self-navigated acquisition with a short breath-hold in end-expiration. Such easy solution could ensure both increased image quality and inline motion detection and reconstruction of the dataset at the same time.
A possible cause of the different image quality obtained by using different phases as respiratory reference positions may be related to the initial segmentation of the blood pool within the SI projection taken as reference. Indeed, the heart tends to rotate slightly when it moves along the SI direction. Therefore, the projection of the blood pool along the SI direction can be different in different respiratory phases (see Figure 3.9). This aspect may influence the segmentation of the blood pool in the reference SI projection and, as a consequence, the whole process of motion detection. The global cross-correlation between the reference and all the other SI projection results higher when the most frequent respiratory phase (end-expiration) is taken as respiratory reference position. The respiratory pattern in healthy volunteer is highly regular, but this characteristic is not necessarily ensured in patients. Therefore, the choice of end-exp as reference could not be always the most advantageous. In the standard self-navigation approach, only the cross correlation between all the SI projections and the reference is evaluated; the cross correlation between every single SI projection is not investigated. Therefore, the applied shift to compensate the respiratory motion may be not the one that realize the optimal respiratory motion compensation. If the detection algorithm is successful, the position of the blood pool within each corrected SI projection should be the same. In other words, if all SI projections are displayed in a single matrix, after motion correction has been applied, the position of the blood pool along the SI direction should be practically constant in the whole series. Looking at the problem form a different angle, it is possible to state that a good motion correction algorithm is one which provides a series of corrected SI projections in which the blood pool position has minimal variations, regardless of the reference chosen.
Due to these considerations, an approach to perform self-navigation without the need of a reference position would be desirable. This solution should guarantee the minimal variation of the position of the blood pool in all the SI projections; this concept can be intended as the achievement of an optimal global alignment of the SI projection themselves. The alignment of the SI projections ideally corresponds to a minimal variation of the position of the blood pool in all SI projections (see Figure 3.10). In this scenario, non-linear effects related to the correction along the SI direction can be averaged. Therefore, there is the desire of developing a method to evaluate and the quantify the degree of the alignment of the SI projections. In addition, an algorithm to obtain the optimal global alignment of the SI projection should be designed. At the same time, this approach should be independent from the segmentation of the blood pool, thus
48

Optimized respiratory reference position for 3D self-navigated whole heart MRA
avoiding non-linear effect related to the specific phase within the respiratory cycle. A possible implementation of an approach that is independent from the choice of a specific reference will be provided in the next chapter.
With this work, a complete database of whole-heart self-navigated volumes was created. Each dataset was reconstructed in 5 different ways and each reconstruction was graded using a quantitative and objective image quality index (% VS). Hence, this database will be used as reference that allows the possibility of comparing new developed methods to perform self-
49
Figure 3.9: Influence of non-linear effects on the blood pool segmentation. In 1, an intuitive representation of this effect is provided. Different rotation of the blood pool may provide a different projection of the blood pool itself along the SI direction (as in case 1a, 1b, and 1c). In 2, an individual case is provided as example. Two different SI projection used as reference for the self-navigated motion correction in one volunteer are represented. The blue profile indicates end-expiration, and the purple profile indicates end-expiration. The extremes of the segmented blood pool are represented (red dots for end-expiration, light blue dots for end-inspiration). A significant difference in the SI projections and, thus, in the segmented regions is visible.

Optimized respiratory reference position for 3D self-navigated whole heart MRA
navigation with the described technique; it will be used to test the algorithm developed in the next chapter and to compare its performances to the used technique to perform self-navigation and that technique already optimized.
50
Figure 3.10: The concept of optimal alignment of the SI projection. Two different SI projections series are presented in 1 and 2. In 1, a variation of the position of the blood pool leads to a not defined reconstruction of the image of the heart. In 2, the alignment of the SI projections is reached; it ideally corresponds to a minimal variation of the position of the blood pool in all SI projections. The final image reconstruction benefits from this situation.

Figure 1: Example of image quality using different reference respiratory positions for the self-navigation algorithm. The image quality increases from the uncorrected reconstruction (a) to the corrected datasets using end-inspiratory (b) and end-expiratory (c) reference positions. A slight, but significant, improvement from (b) to (c) can also be noticed in the zoomed section of the mid LAD.
Figure 2: Mean and standard deviation of the vessel sharpness for all 11 volunteers. The increased sharpness with respect to the non-corrected reconstruction was statistically significant using all choices of the reference († p<0.004). Among the different reference positions, a significant difference in %VS was only found between the end-inspiration and end-expiration (* p<0.003).
3793Optimized Respiratory Reference Position for 3D Self-Navigated Whole Heart Coronary MRA
Davide Piccini12, Gabriele Bonanno2, Giulia Ginami23, Arne Littmann4, Michael O. Zenge4, and Matthias Stuber2
1Advanced Clinical Imaging Technology, Siemens Healthcare IM S AW, Lausanne, Switzerland, 2Department of Radiology, University Hospital (CHUV) and University of Lausanne (UNIL) / Center for Biomedical Imaging (CIBM), Lausanne, Switzerland, 3Department of Information Engineering, University of Padova,
Padova, Italy, 4MR Application and Workflow Development, Healthcare Sector, Siemens AG, Erlangen, Bayern, Germany
INTRODUCTION: As demonstrated in several recent publications, respiratory self-navigation (SN) improves the ease-of-use, scanning time and temporal resolution in whole heart coronary MRA when compared to more conventional navigator-based approaches [1]. Using SN, respiratory motion information is directly extracted from the image data in k-space and used to suppress respiratory motion artifacts during image reconstruction. Similar to conventional navigator techniques, a respiratory reference position is selected at the very beginning of the image data acquisition [2, 3]. Correction of the subsequently acquired image data is then always performed relative to this original reference position. This setup allows inline motion detection and correction, thus providing both a real-time feedback on the performances of the SN algorithm [3] and an inline reconstruction of the dataset. Although good results have been reported with this standard methodology, the influence of the choice of the reference position on the final image quality has, to our best knowledge, not yet been ascertained. Respiratory reference positions from end-expiration or end-inspiration may be more suitable candidates since such respiratory phases represent pauses of the respiration and are characterized by a lower velocity of the heart. In addition, end-expiratory positions occur more frequently and less overall motion correction is needed as a result. Furthermore, the average or mean respiratory position may be advantageous as well, since respiratory motion correction over larger distances and related non-linear effects can be avoided. In this work, the relationship between the choice of the reference position for SN coronary MRA and objective image quality was investigated.
METHODS: Free breathing self-navigated whole-heart coronary MRA was performed in N=11 healthy volunteers, after informed consent was obtained and with approval of the institutional review board. Two different 1.5T clinical MRI scanners (MAGNETOM Avanto and Aera, Siemens AG, Healthcare Sector, Erlangen, Germany) were used in this study. Data acquisition was performed with a 3D radial trajectory implementing an interleaved spiral phyllotaxis pattern [4], which was adapted to self-navigation through an additional readout oriented along the superior inferior (SI) direction at the beginning of each interleave [3]. All measurements were segmented and ECG triggered. The acquisition window (~100ms) was placed in mid-diastole. The protocol parameters of the non slice-selective, T2-prepared, fat-saturated, balanced steady state free precession (bSSFP) imaging sequence were set as follows: TR/TE 3.0-3.1/1.51-1.56ms, FOV (220mm) 3, matrix 1923, voxel size (1.15mm)3, radio frequency (RF) excitation angle 90°, and receiver bandwidth 898 Hz/Pixel. In all cases, a total of 11687 radial readouts were acquired in 377 heartbeats, with an overall Nyquist undersampling ratio of 20%. During post-processing, the algorithm for the automatic segmentation of the blood pool described in [3] was applied to all SI readouts to define all respiratory positions of the blood pool for each dataset. The vector containing the positions was sorted into a 50-bin histogram and analyzed in Matlab (The MathWorks Inc., Natick, MA). Mean (µi) and standard deviation (σi) of the respiratory positions vector were computed for each volunteer (i = 1... N). Offline motion detection, motion correction and reconstruction of all datasets were performed using four different reference respiratory positions: random, end-inspiration (end-insp), end-expiration (end-exp), and mean. Furthermore, one dataset was reconstructed without motion correction, for comparison. To represent the random respiratory reference position, the very first acquired SI readout of the scan was selected as in the standard SN approach [3]. The reference readouts for end-insp and end-exp were selected from the two extreme bins of the histogram, whereas the readout in which the position of the blood pool was closest to µi was chosen to represent the mean reference respiratory position. Using these reference positions, image reconstruction incorporating motion correction was performed prior to visual and quantitative image quality assessment. For this quantitative image analysis, a 2 cm segment of the mid portion of the left anterior descending coronary artery (LAD) was selected from all the reconstructed volumes. Percentage vessel sharpness (%VS) of each coronary segment was then computed using an approach similar to that described in [5]. Statistical comparisons were performed by means of a paired two-tailed Student’s t-test with Bonferroni correction for multiple comparisons.
RESULTS: All acquisitions and reconstructions were successful for all datasets. A clear improvement in image quality could be observed in all motion corrected datasets with respect to those where correction was not performed (Fig. 1,a). In general, major differences in image quality among the corrected datasets (Fig. 1,b-c) could not be identified by visual assessment. The %VS of the mid-LAD (Fig. 2) reconstructed without motion correction was 49.8 ± 8.7 %. With motion correction and using the random reference, 58.1 ± 7.5 %VS was measured, while that from end-insp amounted to 55.8 ± 8.4 %VS, and that from end-exp to 58.2 ± 7.4 %VS, respectively. Using the mean value as a reference level, %VS was measured as 57.8 ± 9.2 %. The improvement in %VS of the mid LAD was significant for all the selected respiratory reference positions when compared to the datasets that were obtained without motion correction (worst case, end-insp: p <0.004). The selection of an end-expiratory reference position led to a significantly improved %VS when compared to that of end-inspiration (p<0.003).
DISCUSSION AND CONCLUSIONS: In the context of respiratory self-navigation for coronary MRA, a direct influence of the choice of the reference respiratory position on the final image quality was identified. However, a statistically significant difference in vessel sharpness was only measured between end-insp and end-exp. As the end-expiratory phase occurs more frequently, both the random choice and the mean of the reference position will be biased towards end-exp. This may explain the relative similarity of the findings. In conclusion, although the performances of the standard approach, where the reference respiratory position is chosen at the beginning of the measurement, are on average satisfactory, the choice of an end-exp reference could significantly improve image quality in individual cases. Starting the free-breathing SN acquisition with a short breathhold in end-expiration could thus be an easy solution to ensure both optimal image quality and inline feedback and reconstruction of the dataset.
REFERENCES: [1] Stuber M, et al, Radiology 1999; 212:579-587; [2] Stehning C, et al, MRM 2005; 54:476-480; [3] Piccini D, et al, MRM 2012; 68:571-579; [4] Piccini D, et al, MRM 2011; 66:1049-1056; [5] Etienne A, et al, MRM 2002; 48:658-666.
This work was supported by CIBM of the UNIL, UNIGE, HUG, CHUV, EPFL and the Leenaards and Jeantet Foundations.


CHAPTER 4 ITERATIVE APPROACH TO SELF NAVIGATION
4.1 Introduction
In the previous chapter, the influence of the choice of the reference respiratory position on the final image quality has been assessed and a first possibility to optimize the selected self-navigation technique has been purposed. At the same time, limitations of the technique have been underlined. Firstly, the respiratory pattern have a great intra-variability in patients and, for this reason, it is difficult to stay that end-expiration is widely the more frequent respiratory phase. In addition, the segmented blood pool within the reference SI projection may be different in end-expiration and in end-inspiration; this fact may be caused by non-linear effect related to the movement of the heart along the SI direction. Due to all these consideration, an approach to perform self-navigation without the need of a respiratory reference position is desirable. In addition, this new approach should be independent from the initial segmentation of the blood pool. Therefore, the aim of this chapter is to propose a solution to perform respiratory self-navigated motion compensation:
• Independent from the need of a specific SI projection as reference. Good results reached by applying this first way to improve the performances of the current technique are justified by the fact that end-expiration is the most frequent phase in a regular respiratory pattern. However, this may be not guaranteed in less standard paths, which usually characterize clinical patients.
• Independent from the segmentation of the blood pool.
4.2 Methods
4.2.1 Algorithm design
The purposed solution consists in an iterative approach to the problem of aligning the SI projections. In this scenario, the need of a reference position is avoided. To our best knowledge, this type of approach has not yet been developed. Some basic aspects have been defined before achieving the global implementation.
• Firstly, there is the need of a quality index (Q) to quantify the alignment of the SI projections in every dataset. This index has to be iteratively optimized in order to reach the best
53

Iterative approach to self navigation
global alignment of the SI projections.
• Secondly, a region of interest, where the Q index is computed at each iterative step, needs to be defined. The optimization of Q on the whole length of the SI projections may be inappropriate, since there is the risk of including the motion component of structures other than the heart. This can lead to a reduction of the precision of the respiratory motion compensation on the heart itself, which can be averaged with contributions from other structure (i.e. the liver).
• Finally, a stop-criterion has to be defined in order to establish when the optimized alignment of the projections is reached.
In the proposed approach, the SI projections are not considered individually, but as a whole. By aligning all SI projections acquired during the scan form the first to the last data segment, an SI projection matrix is obtained (see Figure 4.1). The dimensions of such matrix are: base resolution x number of acquired interleaves. The proposed implementation, realized in Matlab, tries to address these problems as discussed as follows.
54
Figure 4.1: The SI projection matrix in one volunteer. All the SI projections acquired during the scan are displayed from the first to the last data segment. The whole length of every single SI projection is displayed. The vertical axes is oriented along the SI direction, one pixel corresponds to 1.14 mm.

Iterative approach to self navigation
• Definition of a global quality index Q.
In this work, two different indexes Q to quantify the alignment of the SI projections were designed and tested.The two global quality indexes were defined as follows:
– Index for the evaluation of the standard deviation of the brightness of pixels along the rows of the SI projections matrix (Qsd). A low value of that standard deviation is indicative of the global alignment of the SI projections and assess the levelling of the blood pool along the profiles. Qsd was defined es the inverse value of the standard deviation of the brightness of pixels along the rows of the SI projections matrix.
– Index for the evaluation of the global cross-correlation (Qcc). This index calculates the cross-correlation sequences for all combinations of the SI projections. The obtained values are subsequently averaged. As discussed in chapter 3, a higher cross-correlation seems to correspond to a higher image quality. Thus, the global cross-correlation of the whole SI projection matrix may be indicative of the global alignment.
Both the two indexes have to be maximize in order to improve the grade of alignement of the SI projections (see Figure 4.2). The pseudo-code implementing the two indexes is provided in Figure 4.3. The iterative algorithm was developed independently on the considered quality measure. The two quality measures were computed using independent functions at every iteration.
55
Figure 4.2: Computation of a global quality index Q as indicator of the alignment of a series of SI projections. Two different SI projections series are presented in 1 and 2. In 1, the variation of the position of the blood pool along the SI direction is higher than in 2; therefore, the value of the Q’, expressing the alignment of the SI projection series in 1, should be lower than Q’’, that express the alignment of the SI projection series in 2.

Iterative approach to self navigation
56
Figure 4.3: Pseudo code of the implementation of the described quality measures Qcc (1) and Qsd (2). The two functions have the series of SI projections (ChNormalize) and the region of interest (window) as input. Both the function are implemented in the way that they will be maximized in the iterative implementation.
Figure 4.4: Schematic representation of the algorithm for the detection of the centre of the blood pool and the definition of the window of interest in one volunteer. The whole series of SI projections is stored as an SI projection matrix (1). The mean SI profile (2) is calculated along the rows of the matrix. After the filtering of the signal (red line in 2), the centre of the blood pool is identified within the mean projection (red dot in 3, and red dotted line in 4). Finally, the region of interest is identified as the 20% of the FOV (green lines in 4).

Iterative approach to self navigation
• Definition of a region of interest to maximize the global quality index.
As second step, an algorithm for the automatic detection of a region of interest, comprising the blood pool, was implemented. This algorithm operates as follows (Figure 4.4). First, the calculation of the mean projection (or profile) of all SI projections is computed along the whole length of the FOV. Subsequently, the frequency content of such mean profile is calculated by computing its 1D FFT. The mean profile is then filtered by using a Finite Impulsive Response (FIR) low-pass filter, which preserves only the first two lower frequencies of the signal. Subsequently, peaks detection in the filtered signal is performed. The peak corresponding to the centre of the blood pool is isolated; the selected peak subtends the segment which better approximates the length of the projection of the blood pool along the SI direction (approximately 10 cm [5]). Finally, the peak is taken as central point of a window corresponding to the 20% of the entire FOV. The selected lenght of the window along the SI direction can fully include the blood pool. This algorithm is totally automatic.
• Algorithm execution
The original unaligned series of the SI projection is used to compute the window where the index Q will be calculated. This window will be maintained for the whole computation of the algorithm. An empty vector best_shift is created, with a dimension equal to the number of the SI projections. The index Q that express the global alignment of the initial series of the SI projection is computed and stored as initial Qmax. Every single iteration involves the shifting of every single SI projection. The aim of every iteration is to improve the stored value of Qmax. At the beginning of the iteration, the first SI projection is shifted within a predefine range of shifts. For each shift, the value of Q is computed. The shift that provides the best value of Q is applied to the SI projection if the computed value of Q improves the value of the stored Qmax. At the same time, the shift value is memorized in best_shift, in correspondence to the index equal to the progressive number of the SI projection within the SI projection matrix. In this case, the stored value of Qmax is replaced with the computed Q. If the value of Q does not improve when the SI projection is shifted, the SI projection is maintained in its initial position for the current iteration. The iteration continues with the application of this described procedure to all the acquired SI projections. At the end of every iteration, a control is performed in order to assess if the stop criterion has been reached. In that case, the execution of the algorithm stops. Conversely, a new iteration starts. At the end of the iterative process, an updated vector of the applied shifts is returned. It will be used to perform motion correction in k-space. The pseudo-code implementation of the algorithm is provided in Figure 4.6.
• Stop criterion
The iterative process continues until the stop criterion is reached; the process is considered concluded when additional shifts of the SI projections do not introduce improvement of the Q index. Therefore, at the end of each iteration throughout the whole series of the SI projections, the amplitude of the introduced shifts is monitored. If the current iteration has not introduced an improvement in the Q value, or rather no additional shifts have been applied, the global iteration is stopped. The stored shifts vector is subsequently used for the motion correction of the analyzed dataset.
57

Iterative approach to self navigation
58
Figure 4.5: Example of automatic identification of the region of interest in different volunteers. The mean projection (blue line), the filtered signal (red line) and the identified blood pool peak (red circle) for each volunteer are shown in column a. In column b, the window of interest (green rectangle) along the SI projections series is shown. The centre of the blood pool is represented by the red dotted line. Signals and SI projections series in the same row refer to the same volunteer.
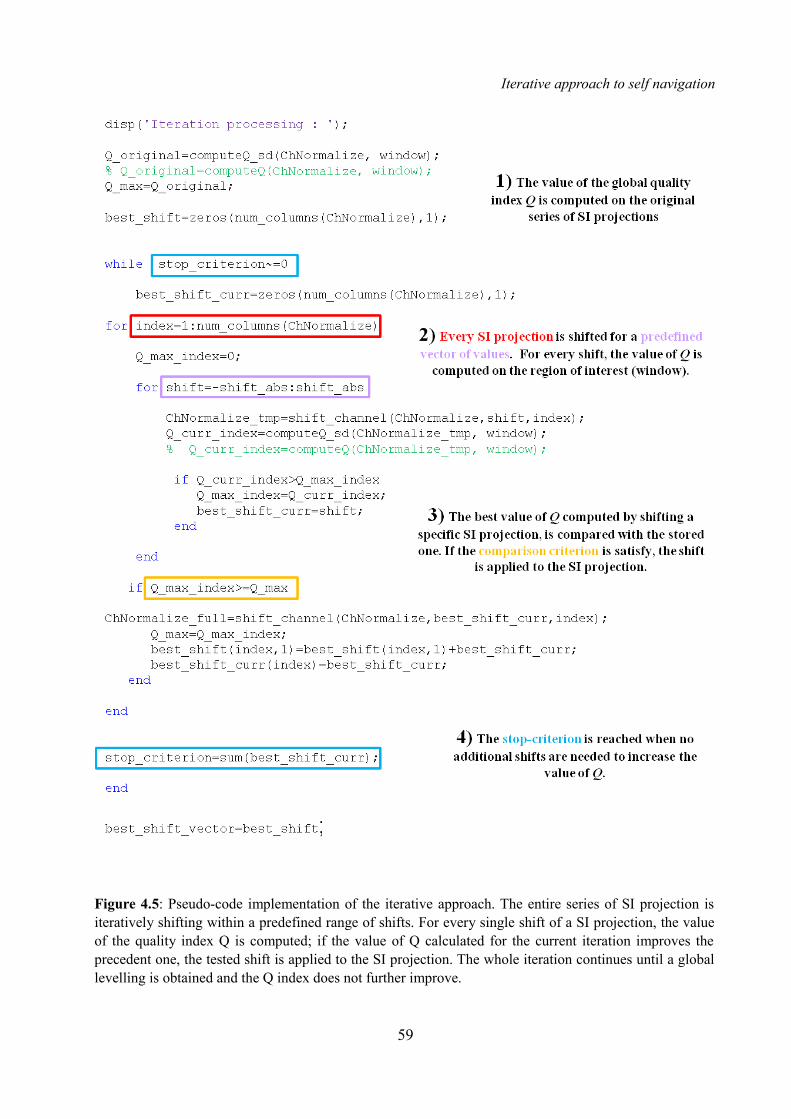
Iterative approach to self navigation
59
Figure 4.5: Pseudo-code implementation of the iterative approach. The entire series of SI projection is iteratively shifting within a predefined range of shifts. For every single shift of a SI projection, the value of the quality index Q is computed; if the value of Q calculated for the current iteration improves the precedent one, the tested shift is applied to the SI projection. The whole iteration continues until a global levelling is obtained and the Q index does not further improve.

Iterative approach to self navigation
4.2.2 Data acquisition
The proposed algorithm was tested by using the data of the 11 volunteers acquired for Chapter 3 (see Section 3.2.2 for details on acquisition).
4.2.3 Data processing
The iterative algorithm was used for motion correction in all datasets using both quality measures and the two resulting volumes where added to the existing database. First, for each volunteer, the vectors of shifts obtained using the iterative algorithms were compared to the vector computed by the standard implementation with end-expiration as reference. The Pearson coefficient [51] between the two cases were calculated in order to establish the correlation between the computed vectors of shifts. In addition, a linear regression [52] was estimated between the two vector for each volunteer in order to establish the rate of change in one vector as the other changes. As in the previous chapter, the analysis of image quality was performed by computing the % VS of the first 2 cm segment of the mid portion of the LAD using Soap-Bubble. The comparison in % VS was also performed between the iterative approach and the standard implementation using end-expiration as reference, in order to establish a direct comparison between the new algorithm and the selected modality in its already optimized form. In addition, a comparison in %VS between volumes reconstructed by applying the iterative approach to self-navigation and the volumes reconstructed without motion correction was performed.
4.3 Results
All reconstructions were successful for all datasets. The execution time of the algorithm for the calculation of the shifts vector was always less than 6 minutes. For every calculation of the shifts vector, a minimum number of 3 iterations were needed; the maximum number of iterations was 7. The computed values for the Pearson coefficient and the coefficients of the linear regression are reported in Table 5, where P indicates the Pearson coefficient, m the slope of the identified line and q indicates the intercept. The average values were 0.847 ± 0.151 for P, 0.854 ± 0.248 for m, and 1.543 ± 0.845 for q, in the case of Qcc taken as index. In the case using Qsd, 0.686 ± 0.338 was the average for P, 0.558 ± 0.341 for m, and 1.223 ± 0.959 for q.The computed % VS values are reported in Table 6. The % VS of the mid LAD in volumes reconstructed by using Qcc as index was 58.5 ± 7.2 %, while that from Qsd as index was 54.9 ± 7.2 %. The improvement in % VS of the mid-LAD was significant for both the two different implementations of the iterative algorithm when compared to the dataset that were obtained without motion correction (p<0.004 for Qsd as index, p<0.003 for Qcc as index). A statistical similarity between Qcc and end-expiration was also assessed (p>0.700). However, this statistical similarity was not assessed in the comparison between Qsd and end-expiration (p<0.020). Statistical relationships between the different cases are shown in Figure 4.6.
60

Iterative approach to self navigation
61
Table 5: Calculated values for the Pearson coefficient (P), the slope of the line (m), and the intercept (q) in the estimated linear regression in the 11 volunteers. Yellow columns show results for the case when Qcc was used as index in the iterative implementation. Violet columns report the results for the case when Qsd was used as index. This table shows the higher correlation existing between the vectors of shifts calculated by the standard implementation with end-expiration as reference and by the iterative implementation with Qcc as index.
Table 6: Computed VS % values in the 11 volunteers by using the iterative approach implemented with both Qcc (yellow column) and Qsd (violet column) as indexes. In the first white column from the right, %
VS was calculated by using the standard approach with end-expiration as reference are reported for comparison.
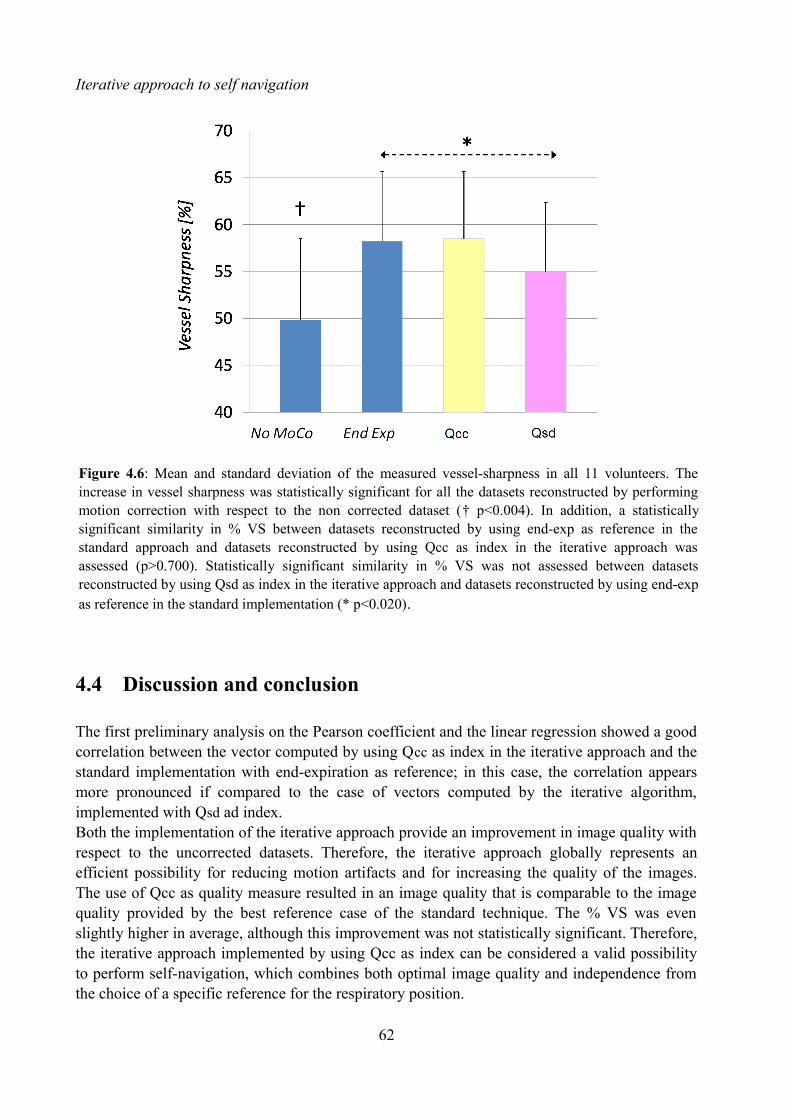
Iterative approach to self navigation
4.4 Discussion and conclusion
The first preliminary analysis on the Pearson coefficient and the linear regression showed a good correlation between the vector computed by using Qcc as index in the iterative approach and the standard implementation with end-expiration as reference; in this case, the correlation appears more pronounced if compared to the case of vectors computed by the iterative algorithm, implemented with Qsd ad index. Both the implementation of the iterative approach provide an improvement in image quality with respect to the uncorrected datasets. Therefore, the iterative approach globally represents an efficient possibility for reducing motion artifacts and for increasing the quality of the images. The use of Qcc as quality measure resulted in an image quality that is comparable to the image quality provided by the best reference case of the standard technique. The % VS was even slightly higher in average, although this improvement was not statistically significant. Therefore, the iterative approach implemented by using Qcc as index can be considered a valid possibility to perform self-navigation, which combines both optimal image quality and independence from the choice of a specific reference for the respiratory position.
62
Figure 4.6: Mean and standard deviation of the measured vessel-sharpness in all 11 volunteers. The increase in vessel sharpness was statistically significant for all the datasets reconstructed by performing motion correction with respect to the non corrected dataset († p<0.004). In addition, a statistically significant similarity in % VS between datasets reconstructed by using end-exp as reference in the standard approach and datasets reconstructed by using Qcc as index in the iterative approach was assessed (p>0.700). Statistically significant similarity in % VS was not assessed between datasets reconstructed by using Qsd as index in the iterative approach and datasets reconstructed by using end-exp as reference in the standard implementation (* p<0.020).

Iterative approach to self navigation
The performances of the iterative approach implemented by using Qsd as reference were not statistically comparable to the performances of the standard approach with end-expiration as reference. Although this approach improved the image quality and VS with respect to the non corrected version, VS was significantly lower when compared with the standard approach.
The fact of performing self-navigation by using the described iterative approach seems to be very promising. The iterative approach implemented with Qcc as index provided the same results in terms of image quality as the standard technique optimized in the previous chapter. In addition, this approach in totally independent from the choice of a specific respiratory reference position. The approach is also independent from the segmentation, thus non linear effects related to the motion of the heart along the SI direction may be averaged. Therefore, the expectation is that this algorithm may provide good performances in less regular respiratory pattern as well. In addition, the low computational time required by the algorithm allows the possibility of performing motion detection and compensation after data acquisition quickly. A future purpose is to investigate the performances of the iterative approach to self-navigation in clinical patients.Future prospective in this scenario could be integrating the contribute of different indexes to evaluate the global alignment of the SI projection. In addition, the robustness of the index Qsd should be improved; a possibility could be to associate each SI projection to a specific respiratory phase and, subsequently, to perform the motion compensation in separated groups of projections.
63

CHAPTER 5
CONCLUSIONS
The aim of this thesis was to investigate possible strategies to compensate the respiratory-induced motion of the heart in coronary MRI. The self-navigation approach was pointed out as the most promising methods in this scenario. It allows the possibility of extracting motion information from the acquired data themselves, thus providing scan efficiency and avoiding the need of indirect measurements or models to quantify the motion of the heart. Subsequently, a possible implementation to perform self-navigation was chosen as ground truth for the development of the thesis. In this implementation, the segmentation of the blood pool is computed on the first SI projection, taken as reference. Then, the respiratory motion of the heart is calculated for every subsequently acquired image data by maximizing the result of the cross-correlation between the segmented blood pool and all the successive SI projections. Finally, the estimated offset is applied to the original readouts by multiplication of a linear-phase in k-space. This setup allows inline motion detection and correction, thus providing both a real-time feedback on the performances of the self-navigation algorithm and an online reconstruction of the dataset. This implementation demonstrated to improve the detection of coronaries if compared to the NAV approach in previous studies.
In conventional self-navigated scan, a respiratory position is selected at the very beginning of image data acquisition. Although good results have been reported with this standard methodology, the influence of the choice of the reference position on the final image quality has not yet been ascertained. In Chapter 3, the relationship between the choice of the reference position for self-navigated coronary MRA and objective image quality was investigated for the first time. A statistically significant improvement in % VS was identified when end expiration was chosen over end inspiration as reference respiratory phase. This result suggests the possibility of improving the image quality of the acquired volumes in individual cases. A possible solution could be that of starting the free-breathing self-navigated acquisition with a short breath-hold in end-expiration. Such easy solution could ensure both increased image quality and inline motion detection and reconstruction of the dataset at the same time. A possible cause of the different image quality obtained by using different phases as respiratory reference positions may be related to the initial segmentation of the blood pool within the SI projection taken as reference. Since the heart tends to rotate slightly when it moves along the SI direction, the projection of the blood pool along the SI direction can change in different respiratory phases. This aspect may influence the segmentation of the blood pool in the reference SI projection and, as a consequence, the whole process of motion detection. The fact that the choice of a specific respiratory reference position can affect the result of the initial segmentation and the image quality in reconstructed volumes, makes an approach to perform self-navigation without the need of a reference position desirable.
In Chapter 4, a new approach to perform self-navigation was presented. The purposed solution
65

Conclusions
consisted in an iterative approach to the problem of aligning the SI projections. The iterative approach was designed in order to be independent from both the need of a reference positions and from the segmentation of the blood pool. Two quality index (Qcc and Qsd) to quantify the alignment of the SI projections were implemented. Each index has to be iteratively optimized in order to reach the best global alignment of the SI projections in a dataset. The implementation of the iterative approach involved the progressive optimization of the quality index until a certain grade of alignment is reached. Both the implementation of the iterative approach provided an improvement in image quality with respect to the uncorrected datasets. The use of Qcc as quality measure resulted in an image quality that was comparable to the image quality provided by the best reference case of the standard technique. Therefore, the iterative approach implemented by using Qcc as index can be considered a valid possibility to perform self-navigation, which combines optimal image quality, and independence from the choice of a specific reference for the respiratory position and from the segmentation of the blood pool. The performance of the iterative approach implemented by using Qsd as reference was not statistically comparable to the performances of the standard approach with end-expiration as reference. This approach improved the image quality and VS with respect to the non corrected version, but VS was significantly lower when compared with the standard approach. The possibility of performing self-navigation without referring to a specific SI projection as reference and without computing the segmentation of the blood pool seems to be very promising. The iterative approach implemented with Qcc as index provided the same results in terms of image quality as the standard technique optimized in Chapter 3. The expectation is that this algorithm may provide good performances in less regular respiratory pattern as well. In addition, the low computational time required by the algorithm allows the possibility of performing motion detection and compensation after data acquisition quickly.
Two different methods were purposed to improve the performances of the selected self-navigation technique in this thesis. The first method consists in conveniently chose the respiratory reference position to perform motion detection and compensation. This choice can lead to optimal image quality in individual cases. The second method, the iterative approach, provides the possibility of performing self-navigation without the need of a specific respiratory reference position and the segmentation of the blood pool. This method seems to reduce non-linear effects related to the movement of the heart along the SI direction.
A purpose for the future is to assess the performances of the developed algorithms in clinical patients, who are typically characterized by less regular respiratory pattern respect to healthy volunteers. In addition, possibilities to improve the performances of the iterative approach should be investigated. For example, it would be interesting to integrate the developed algorithm with different quality indexes simultaneously. The possibility of dividing the whole SI projections matrix in group of readouts belonging to the same respiratory phase would be desirable; in this way, non linear effect related to the rotation of the heart in different respiratory phases may be further reduced.
66

ACKNOWLEDGMENTS
This work has been carried out entirely at the Centre for Biomedical Imaging in Lausanne, within the Cardiovascular Magnetic Resonance Group.
I would like to thank Professor Matthias Stuber for having accepted me in his Group as Master Student. This experience has been a great opportunity for me. Thanks to all the members of his group for the highly stimulating environment which they created for my curiosity. A really special thank to Davide Piccini and Gabriele Bonanno for their constant supervision, their interesting ideas and their useful advices. My interest in this topic would not have been the same without them.
I would like also to thank Professor Alfredo Ruggeri for mentoring my thesis and for the useful contacts he gave me to perform my Master thesis abroad.
Thanks to my Family which has always supported me and my dreams. Thanks for making my home the best place where to come back.
Thanks to all my Friends who helped me to become the person I am today, for never forgetting me also if I am always abroad.
Finally, thank you Andrea. Thank you for taking care of me every single day. No words can express what you mean to me.
67


BIBLIOGAPHY
1. www.chuv.ch
2. www.unil.ch/cvmr
3. www.cibm.it
4. Libby P, Current Concepts of the Pathogenesis of the Acute Coronary Syndromes, Circulation 2001; 104: 365 - 372
5. Gray H, Anatomy of the human body, Philadelphia: Lea & Febiger; 1918.
6. Roger VL et al., Heart diseases and stroke statistics – 2011 update, American Heart Association, 2011.
7. Botnar RM, Stuber M, Kissinger KV, Spuentrup E, Manning WJ, Non invasive coronary vessel wall and plaque imaging with magnetic resonance angiography, Circulation 2000, 102(21): 2582-2587
8. Stuber M, Weiss RG, Coronary magnetic resonance angiography, J Magn Reson Imaging 2007, 26: 219-234.
9. Kim WY, Darias PG, Stuber M et al., Coronary magnetic resonance angiography for the detection of coronary stenosis, New England Journal of Medicine 345, 26: 1863 – 1869.
10. Kyoto S et al., Assessment of coronary artery diseases using magnetic resonance coronary angiography – a national multicentre trial, Journal of American College of cardiology 2010, 56: 12.
11. Ginami G, Analysis of elaboration techniques in magnetic resonance imaging, Bachelor Thesis, Padova University 2010.
12. Scott AD, Keegan J, Firmin DN, Motion in cardiovascular magnetic resonance imaging, Radiology 2009, 250: 331-351.
13. McLeish K, Hill DL, Atkinson D, Blackall JM, Razavi R. A study of the motion and deformation of the heart due to respiration. IEEE Trans Med Imaging 2002; 21: 1142– 1150.
14. Shechter G, Ozturk C, Resar JR, McVeigh ER. Respiratory motion of the heart from free breathing coronary angiograms. IEEE Trans Med Imaging 2004; 23: 1046 –1056.
15. Wang
16. Van Heeswijk RB, Bonanno G, Coppo S, Coristine A, Kober T, Stuber M. Motion compensation strategies in magnetic resonance imaging, Critical Reviews in Biomedical Engineering 2012, 40(2): 99-119.
17. Taylor AM, Jhooti P, Firmin DN, Pennell DJ. Automated monitoring of diaphragm end expiratory position for real-time navigator echo MR coronary angiography. J Magn Reson Imaging 1999; 9: 395–401.
18. Nehrke K, Bornert P, Manke D, Bock JC. Free-breathing cardiac MR imaging: study of implications of respiratory motion-initial results. Radiology 1999; 220: 810–815.
19. Al-Kwifi O, Stainsby J, Foltz WD, Sussman MS, Huang Y, Wright GA. Characterizing
69

Bibliogaphy
coronary motion and its effect on MR coronary angiography: initial experience. J Magn Reson Imaging 2006, 24: 842– 850.
20. Petitjean C, Rougon N, Cluzel P. Assessment of myocardial function: a review of quantification methods and results using tagged MRI. J Cardiovasc Magn Reson 2005, 7: 501–516.
21. Bernstein MA, King KF, Zhou XJ. Basics of physiologic gating, triggering and monitoring. Handbook of MRI pulse sequences. New York: Academic Press; 2004.
22. Piccini D, Bonanno G, Ginami G, Littmann A, Zenge MO, and Stuber M; Optimized Respiratory Reference Position for 3D Self-Navigated Whole Heart Coronary MRA; Proceedings of the 21st ISMRM, Salt Lake City, Utah, USA, 2013, p. 1316.
23. Mark Haacke E, Brown RW, Thompson MR, Venkatesan R, Magnetic Resonance Imaging: Physical Principles and Sequence Design, John Wiley & Sons; 1999
24. Glockner JF et al., Parallel imaging: a user guide, Radiographics 2009, 25: 1279 – 1297.
25. Scheffler K et al., Principles and applications of balanced SSFP techniques, Euro Radiology 2003, 13: 2409 – 2418.
26. Brittain JH et al., Coronary angiography with magnetization-prepared T2 contrast, Magnetic Resonance in Medicine 1995, 33: 689.
27. Nezefat R et al., B1-insensitive T2 preparation for improved coronary magnetic resonance angiography at 3T, Magnetic Resonance in Medicine 2005, 55: 858 – 864.
28. Delfaut EM et al., Fat suppression in magnetic resonance imaging; techniques and pitfalls, Radiographics 1999, 19: 373 – 382.
29. Wielopolski PA, van Geuns RJ, de Feyter PJ, Oudkerk M. Breathhold coronary MR angiography with volume targeted imaging. Radiology 1998;209(1): 209–219.
30. Stuber M, Botnar RM, Danias PG, et al. Double-oblique freebreathing high resolution three dimensional coronary magnetic resonance angiography. J Am Coll Cardiol 1999;34(2): 524–531.
31. Weber OM, Martin AJ, Higgins CB. Whole-heart steady-state free precession coronary artery magnetic resonance angiography. Magn Reson Med 2003;50(6):1223–1228.
32. Duerinckx A, Atkinson DP. Coronary MR angiography during peak-systole: work in progress. J Magn Reson Imaging 1997;7(6): 979–986.
33. Edelman RR, Manning WJ, Burstein D, Paulin S, Coronary arteries: breath-hold MR angiography. Radiology 1991;181(3):641–643.
34. Ehman RL, Felmlee JP. Adaptive technique for high-definition MR imaging of moving structures. Radiology 1989;173(1):255–263.
35. Stehning C, Börnet P, Nehrke K, Eggers H, Stuber M. Free-breathing whole-heart coronary MRA with 3D radial SSFP and self-navigated image reconstruction. Magn Reson Med 2005; 54: 476–480.
36. Lai P, Larson AC, Bi X, Jerecic R, Li D. A dual-projection respiratory selfgating technique for whole heart coronary MRA. J Magn Reson Imaging 2008;28:612–620.
37. Piccini D, Littmann A, Nielles-Vallespin S, Zenge MO, Respiratory self-navigation for
70

Bibliogaphy
whole-heart bright-blood coronary MRI: methods for robust isolation and automatic segmentation of the blood pool, Magn Reson Med 2012; 68(2): 571–579.
38. Oppenheim AV, Schefer RW, Elaborazione numerica dei segnali, Italian edition by Braccieri C and Gambardella G, 117.
39. Piccini D, Littman A, Nielles-Vallespin S, Zenge MO, Robust and Fully Integrated One Dimensional Respiratory Self-Navigation for Whole-Heart Coronary MRI, Proceedings of the 19st ISMRM, Montreal, Québec, Canada, 2011, p. 1259.
40. Piccini D, Littmann A, Nielles-Vallespin S, Zenge MO. Spiral phyllotaxis: the natural way to construct a 3D radial trajectory in MRI. Magn Reson Med 2011; 66: 1049–1056.
41. Stehning C, Bornet P, Nehrke K, Eggers H, Dossel O, Fast isotropic volumetric coronary MR angiography using free-breathing 3D radial balanced FFE acquisition, Magn Reson Med 2004; 52: 197 – 203.
42. Yan H, Signal processing for Magnetic Resonance, CRC Press 2012, 70.
43. Stehning C, Börnet P, Nehrke K, Eggers H, Dössel O. Fast isotropic volumetric coronary MR angiography using free-breathing 3D radial balanced FFE acquisition. Magn Reson Med 2004; 52: 197–203.
44. Lauzon ML, Rutt BK. Effects of polar sampling in k-space. Magn Reson Med 1996; 36: 940–949.
45. Wong STS, Roos MS. A strategy for sampling on a sphere applied to 3D selective RF pulse design. Magn Reson Med 1994; 32: 778–784.
46. Stuber M, Botnar RM, Danias PG, Sodickson DK, Kissinger KV, Van Cauteren M, De Becker J, Manning WJ. Double-oblique free-breathing high resolution three-dimensional coronary magnetic resonance angiography. J Am Coll Cardiol 1999; 34:524–531.
47. Etienne A, Botnar RM, van Muiswinkel AMC, Boesinger P, Manning WJ, Stuber M, “Soap-Bubble” Visualization and quantitative analysis of 3D coronary magnetic resonance angiograms, Magn Reson Med 2002, 48: 658–666.
48. Wrazidlo W, Brambs HJ, Lederer W, Schneider S, Geiger B, Fischer C. An alternative method of three-dimensional reconstruction from two dimensional CT and MR data sets. Eur J Radiol 1991; 12: 11–16.
49. Deriche R. Fast algorithms for low-level vision. IEEE Trans Pattern Anal Machine Intel 1990; PAMI 12: 78–87.
50. Botnar RM, Stuber M, Danias PG, Kissinger KV, Manning WJ. Improved coronary artery definition with T2-weighted, free-breathing, three dimensional coronary MRA. Circulation 1999; 99: 3139–3148.
51. Rodgers JL, Nicewander WA, Thirteen ways to look at the correlation coefficient, Am Stat 1988; 42: 59 – 66.
52. Neter J, MH Kunter, CJ Nachtsheim, Wasserman W, Applied linear regression models, Third edition, McGraw-Hill Companies, 1996.
71