Pierce, GENETICA, Zanichelli editore S.p.A. Copyright © 2005 · Pierce, GENETICA, Zanichelli...
97
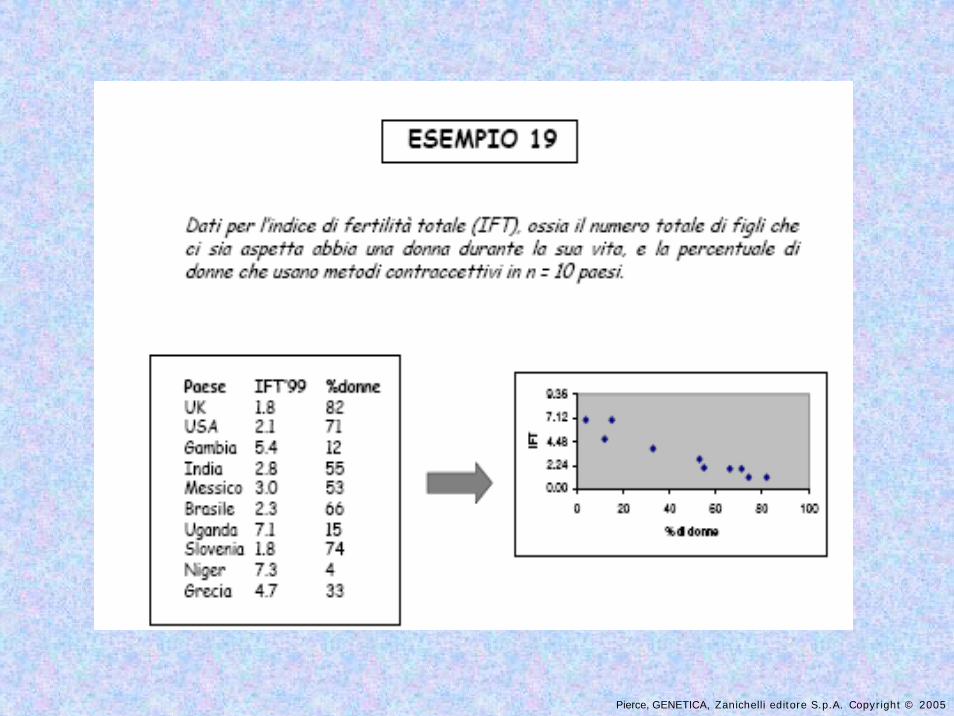
Pierce, GENETICA, Zanichelli editore S.p.A. Copyright © 2005 Il miglioramento genetico delle piante Varietà pre-esistente Varietà migliorata, cioè con caratteri nuovi più favorevoli Incrocio e selezione manipolazione indiretta e grossolana del patrimonio genetico Forme selvatiche Altre varietà e/o specie affini Mutagenesi Fonti di geni utili:
Transcript of Pierce, GENETICA, Zanichelli editore S.p.A. Copyright © 2005 · Pierce, GENETICA, Zanichelli...
Pierce, GENETICA, Zanichelli editore S.p.A. Copyright © 2005
Il miglioramento genetico delle piante
Varietà pre-esistente
Varietà migliorata, cioè con caratteri
nuovi più favorevoli
Incrocio e selezione manipolazione indiretta e grossolana del patrimonio
genetico
Forme selvatiche Altre varietà e/o specie affiniMutagenesi
Fonti di geni utili:
Pierce, GENETICA, Zanichelli editore S.p.A. Copyright © 2005
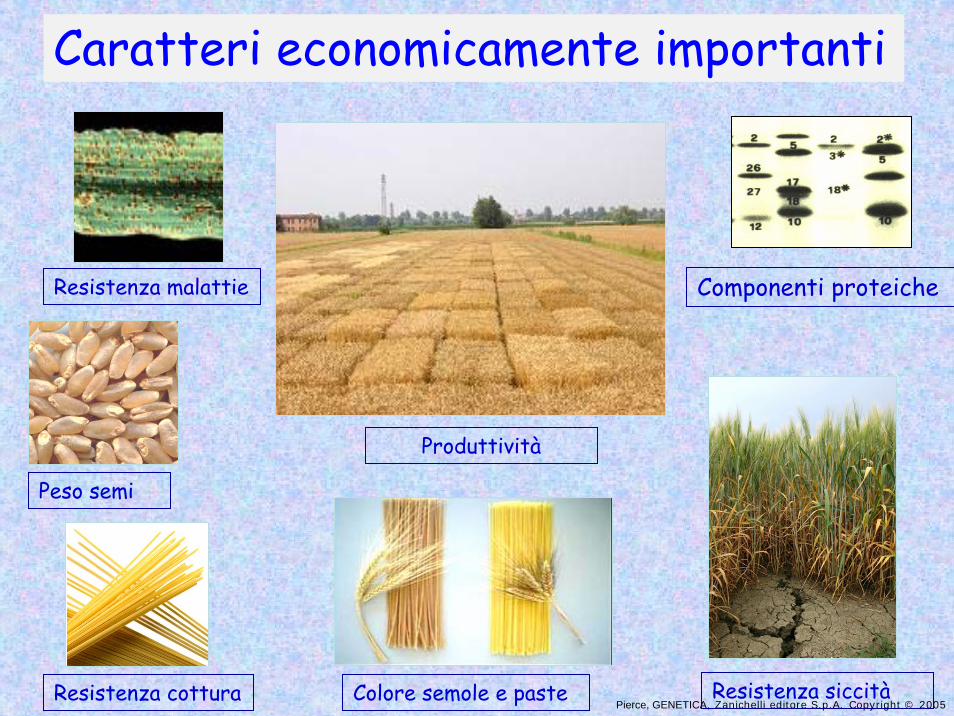
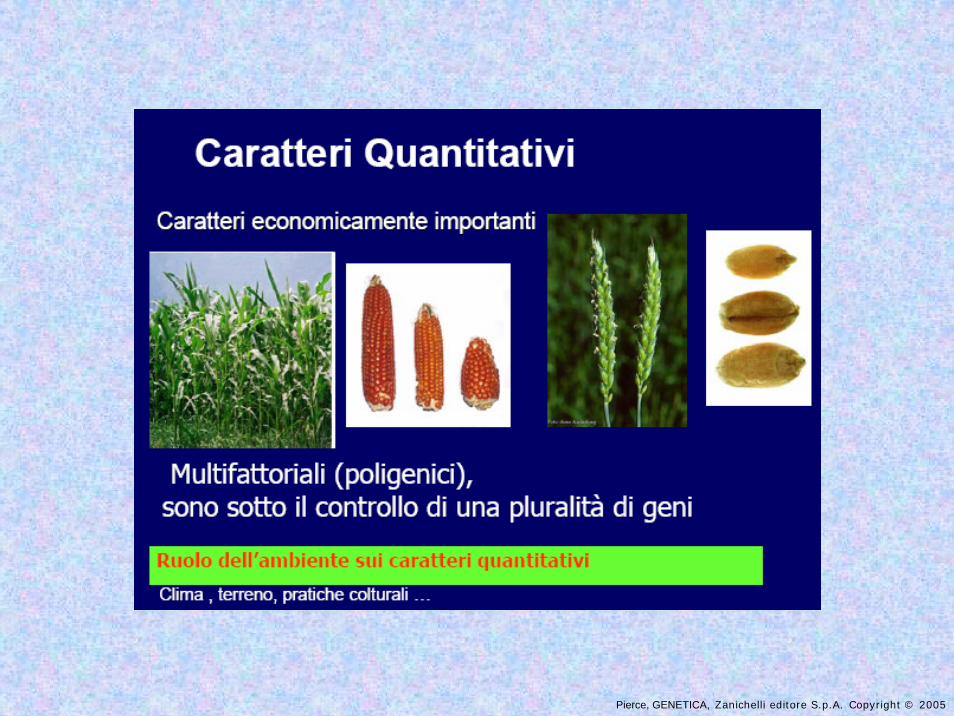
Caratteri economicamente importanti
Peso semi
Resistenza cottura Colore semole e paste
Resistenza malattie
Resistenza siccità
Produttività
Componenti proteiche
Pierce, GENETICA, Zanichelli editore S.p.A. Copyright © 2005
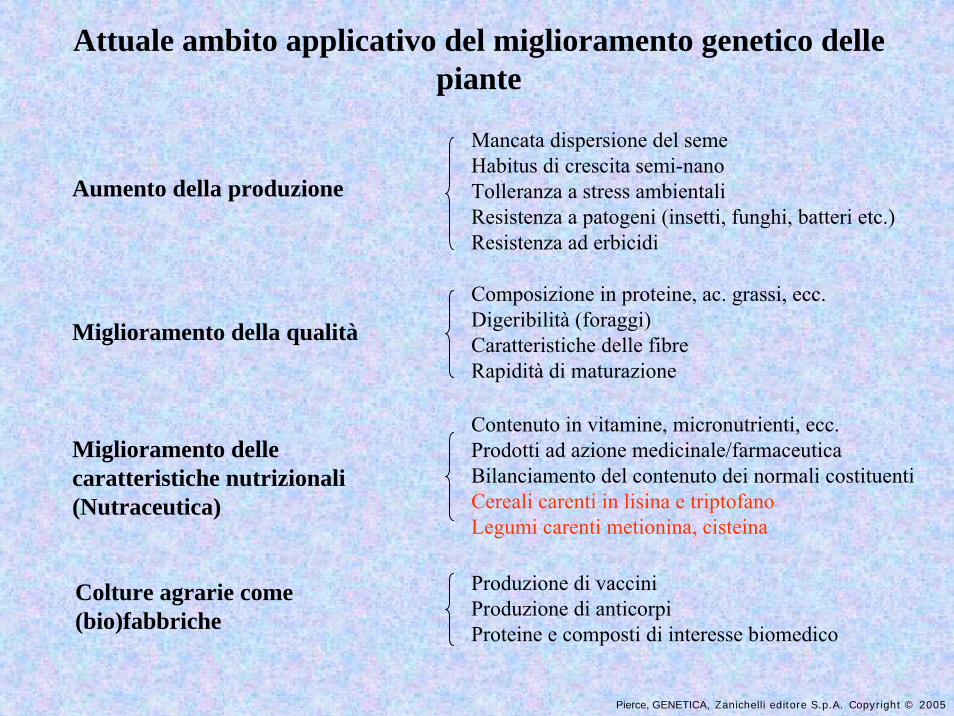
Attuale ambito applicativo del miglioramento genetico delle piante
Aumento della produzione
Miglioramento della qualità
Miglioramento delle caratteristiche nutrizionali (Nutraceutica)
Colture agrarie come (bio)fabbriche
Mancata dispersione del semeHabitus di crescita semi-nanoTolleranza a stress ambientaliResistenza a patogeni (insetti, funghi, batteri etc.)Resistenza ad erbicidi
Composizione in proteine, ac. grassi, ecc.Digeribilità (foraggi)Caratteristiche delle fibreRapidità di maturazione
Contenuto in vitamine, micronutrienti, ecc.Prodotti ad azione medicinale/farmaceuticaBilanciamento del contenuto dei normali costituentiCereali carenti in lisina e triptofanoLegumi carenti metionina, cisteina
Produzione di vacciniProduzione di anticorpiProteine e composti di interesse biomedico
Pierce, GENETICA, Zanichelli editore S.p.A. Copyright © 2005
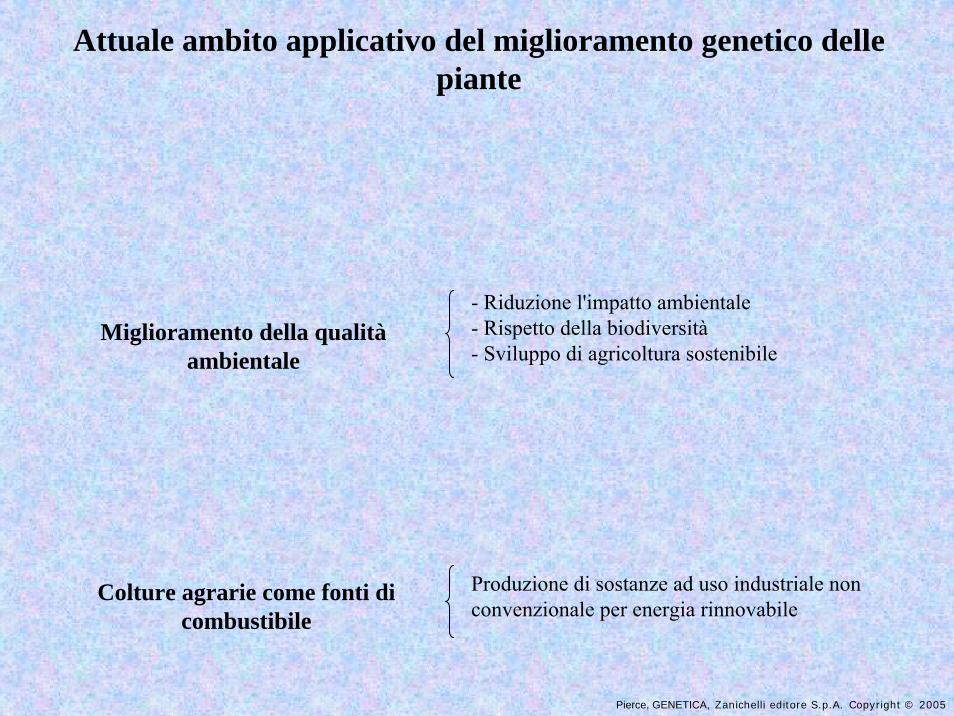
Attuale ambito applicativo del miglioramento genetico delle piante
Miglioramento della qualitàambientale
Colture agrarie come fonti di combustibile
- Riduzione l'impatto ambientale- Rispetto della biodiversità- Sviluppo di agricoltura sostenibile
Produzione di sostanze ad uso industriale nonconvenzionale per energia rinnovabile
Pierce, GENETICA, Zanichelli editore S.p.A. Copyright © 2005
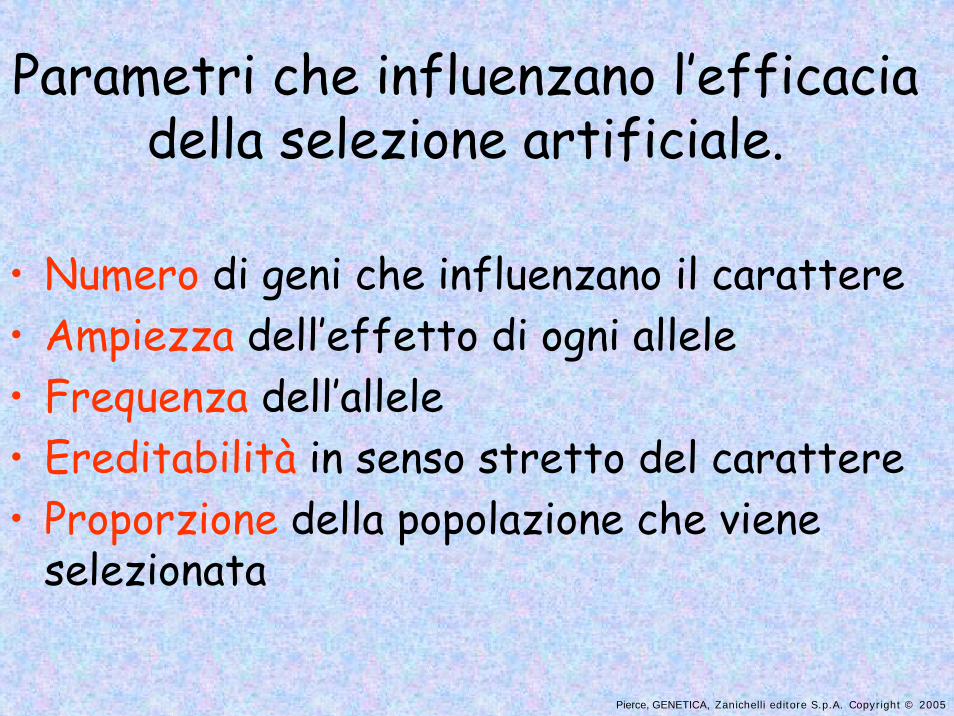
Parametri che influenzano l’efficacia della selezione artificiale.
• Numero di geni che influenzano il carattere• Ampiezza dell’effetto di ogni allele• Frequenza dell’allele• Ereditabilità in senso stretto del carattere• Proporzione della popolazione che viene
selezionata
Pierce, GENETICA, Zanichelli editore S.p.A. Copyright © 2005
Pierce, GENETICA, Zanichelli editore S.p.A. Copyright © 2005
Pierce, GENETICA, Zanichelli editore S.p.A. Copyright © 2005
Pierce, GENETICA, Zanichelli editore S.p.A. Copyright © 2005
Pierce, GENETICA, Zanichelli editore S.p.A. Copyright © 2005
Pierce, GENETICA, Zanichelli editore S.p.A. Copyright © 2005
Pierce, GENETICA, Zanichelli editore S.p.A. Copyright © 2005
Pierce, GENETICA, Zanichelli editore S.p.A. Copyright © 2005
Pierce, GENETICA, Zanichelli editore S.p.A. Copyright © 2005
Pierce, GENETICA, Zanichelli editore S.p.A. Copyright © 2005
Pierce, GENETICA, Zanichelli editore S.p.A. Copyright © 2005
Pierce, GENETICA, Zanichelli editore S.p.A. Copyright © 2005
Pierce, GENETICA, Zanichelli editore S.p.A. Copyright © 2005
Pierce, GENETICA, Zanichelli editore S.p.A. Copyright © 2005
Pierce, GENETICA, Zanichelli editore S.p.A. Copyright © 2005
Pierce, GENETICA, Zanichelli editore S.p.A. Copyright © 2005
Pierce, GENETICA, Zanichelli editore S.p.A. Copyright © 2005
Pierce, GENETICA, Zanichelli editore S.p.A. Copyright © 2005
Pierce, GENETICA, Zanichelli editore S.p.A. Copyright © 2005
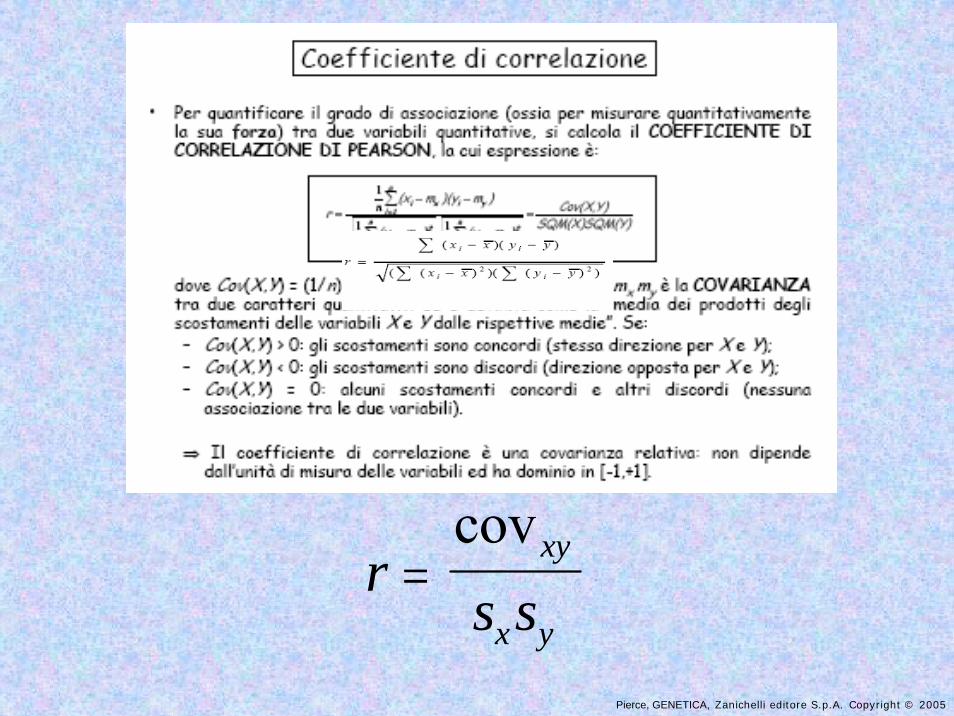
rs s
xy
x y=
cov
Pierce, GENETICA, Zanichelli editore S.p.A. Copyright © 2005
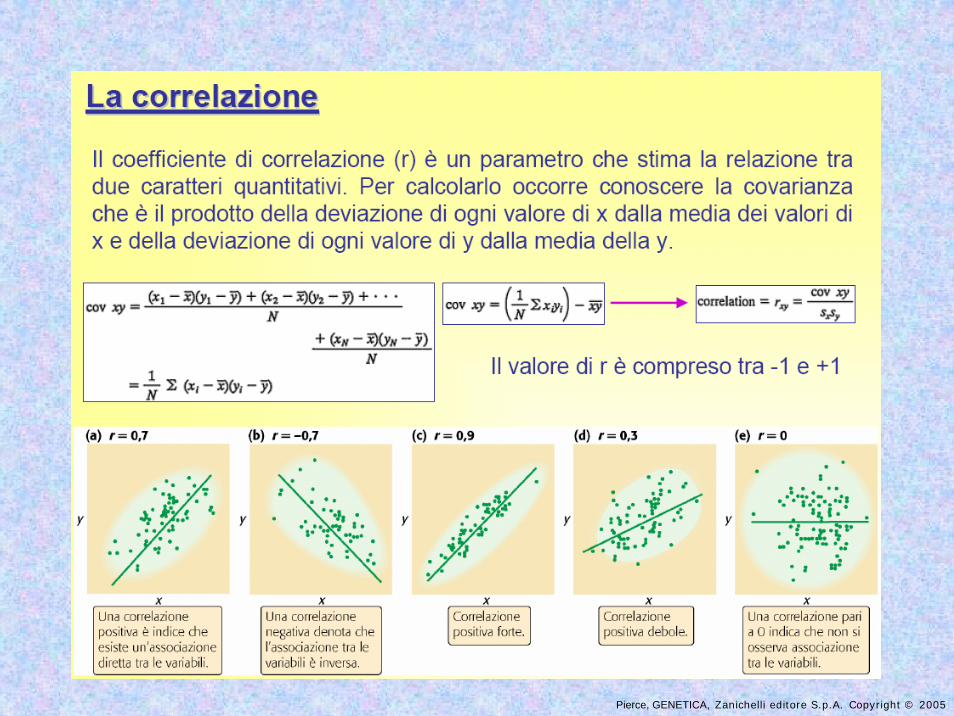
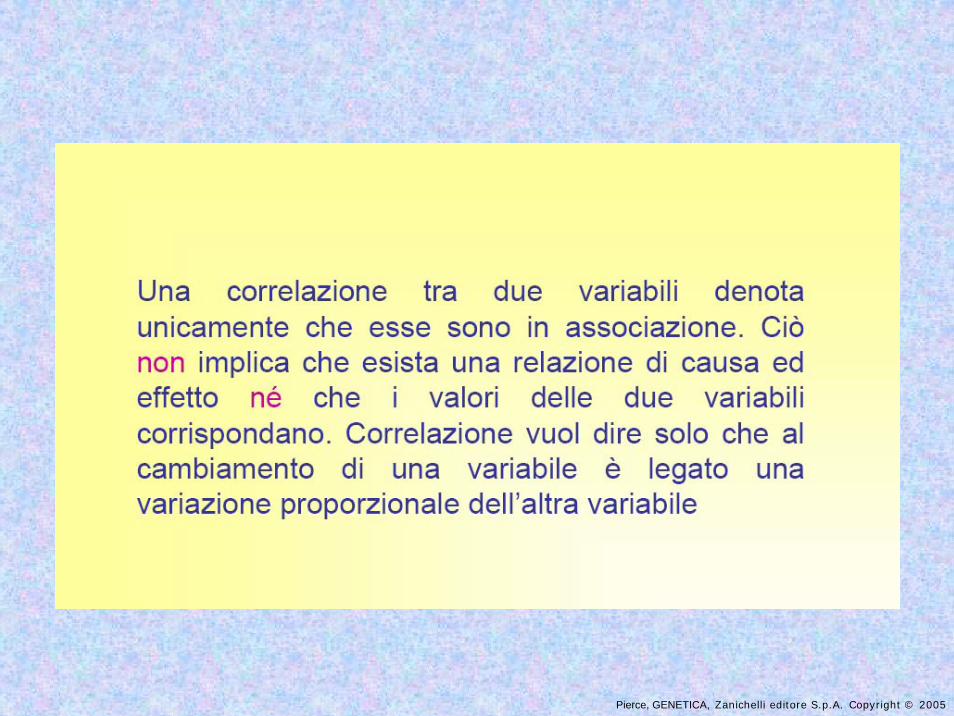
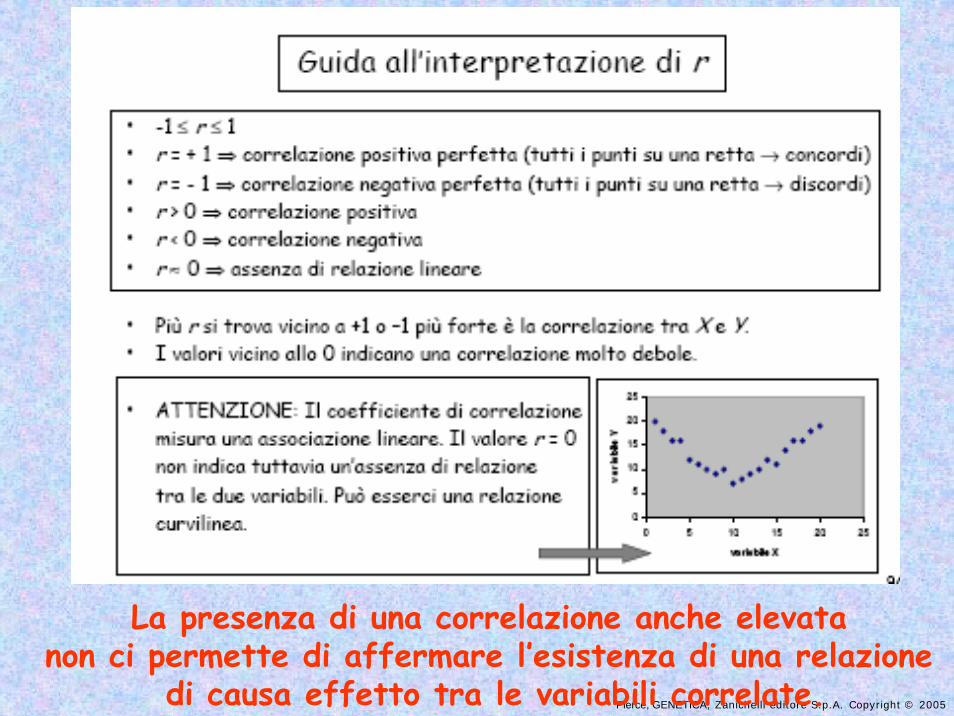
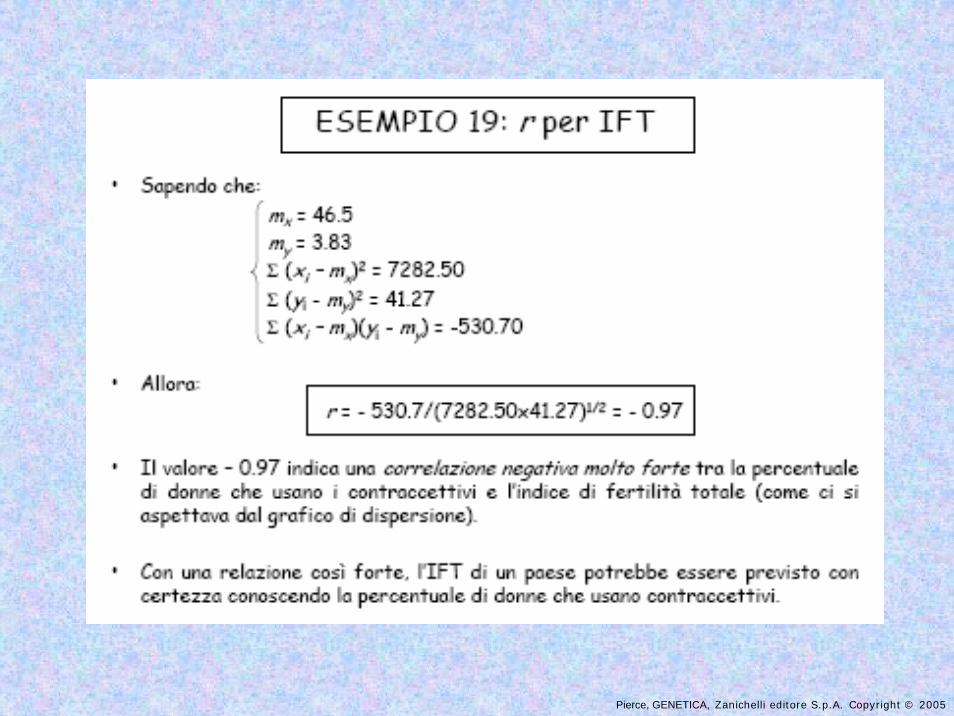
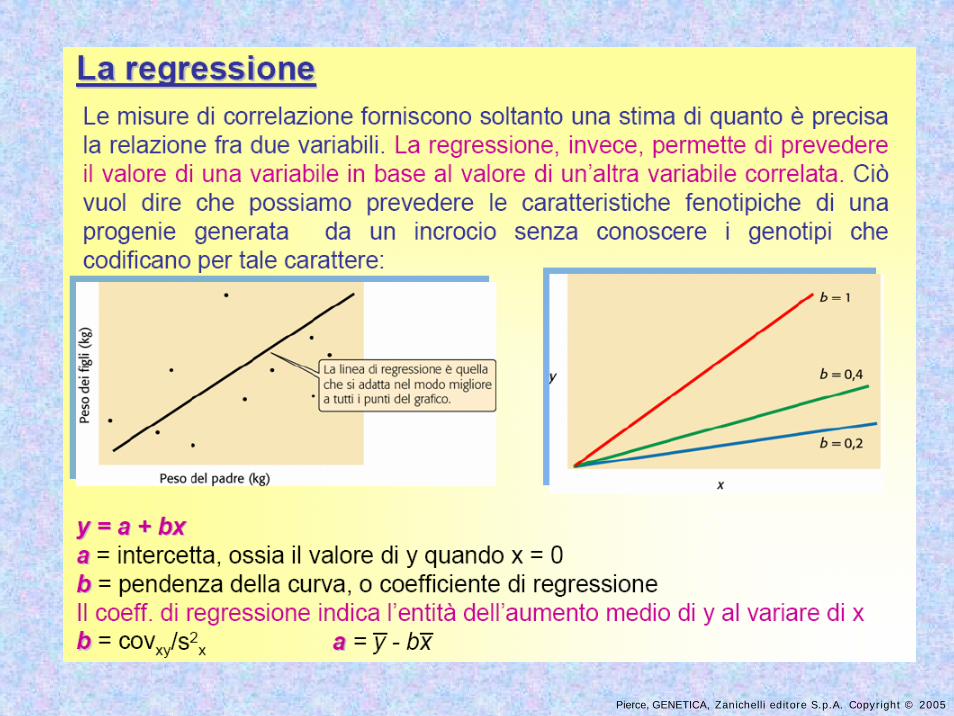
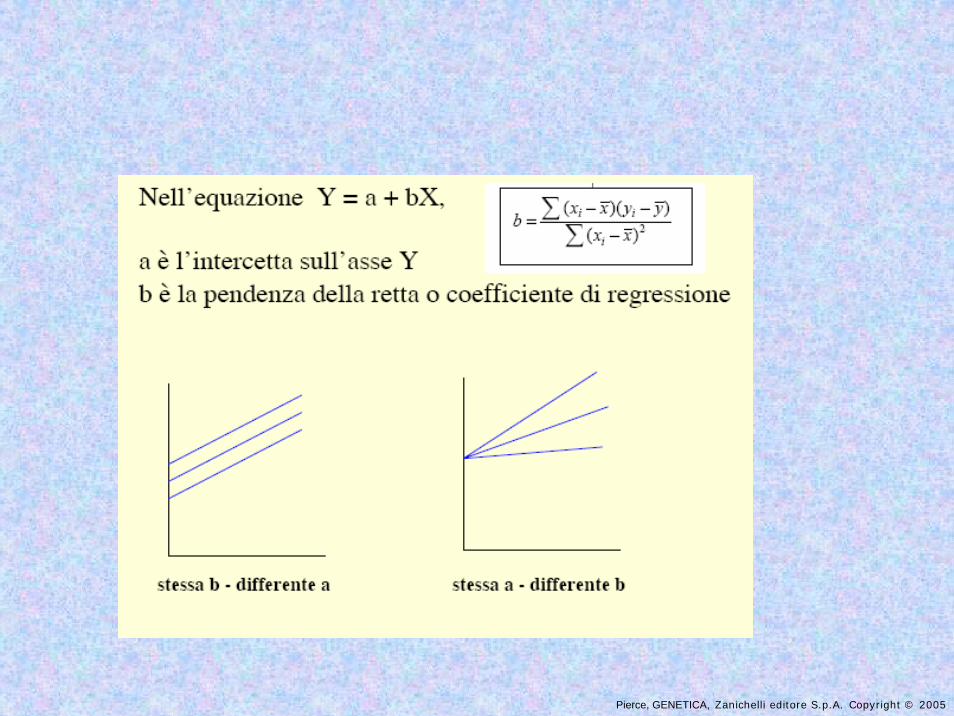
La presenza di una correlazione anche elevata non ci permette di affermare l’esistenza di una relazione
di causa effetto tra le variabili correlate.
Pierce, GENETICA, Zanichelli editore S.p.A. Copyright © 2005
Pierce, GENETICA, Zanichelli editore S.p.A. Copyright © 2005
Pierce, GENETICA, Zanichelli editore S.p.A. Copyright © 2005
Pierce, GENETICA, Zanichelli editore S.p.A. Copyright © 2005
Pierce, GENETICA, Zanichelli editore S.p.A. Copyright © 2005
Pierce, GENETICA, Zanichelli editore S.p.A. Copyright © 2005
Pierce, GENETICA, Zanichelli editore S.p.A. Copyright © 2005
Pierce, GENETICA, Zanichelli editore S.p.A. Copyright © 2005
Pierce, GENETICA, Zanichelli editore S.p.A. Copyright © 2005
Pierce, GENETICA, Zanichelli editore S.p.A. Copyright © 2005
Pierce, GENETICA, Zanichelli editore S.p.A. Copyright © 2005
Pierce, GENETICA, Zanichelli editore S.p.A. Copyright © 2005
Pierce, GENETICA, Zanichelli editore S.p.A. Copyright © 2005
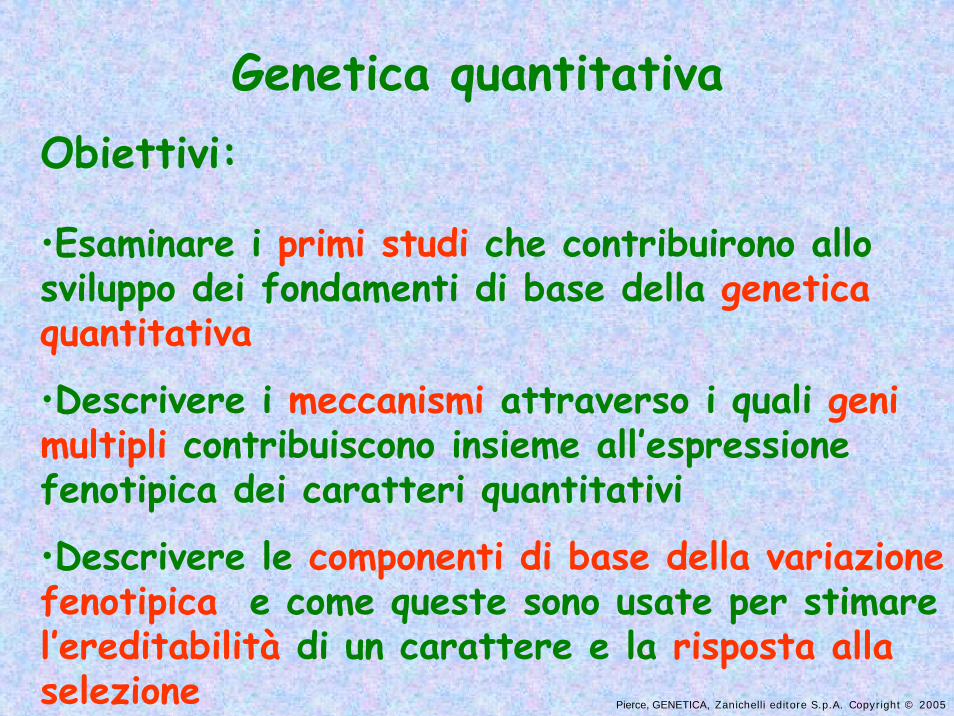
Genetica quantitativaObiettivi:
•Esaminare i primi studi che contribuirono allo sviluppo dei fondamenti di base della genetica quantitativa
•Descrivere i meccanismi attraverso i quali geni multipli contribuiscono insieme all’espressione fenotipica dei caratteri quantitativi
•Descrivere le componenti di base della variazione fenotipica e come queste sono usate per stimare l’ereditabilità di un carattere e la risposta alla selezione
Pierce, GENETICA, Zanichelli editore S.p.A. Copyright © 2005
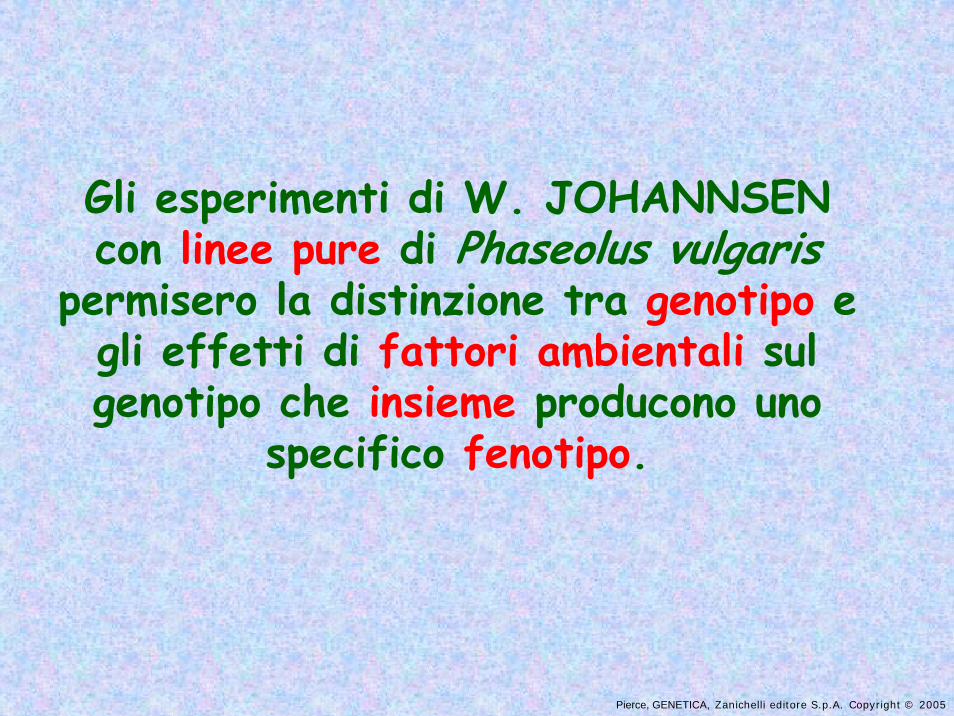
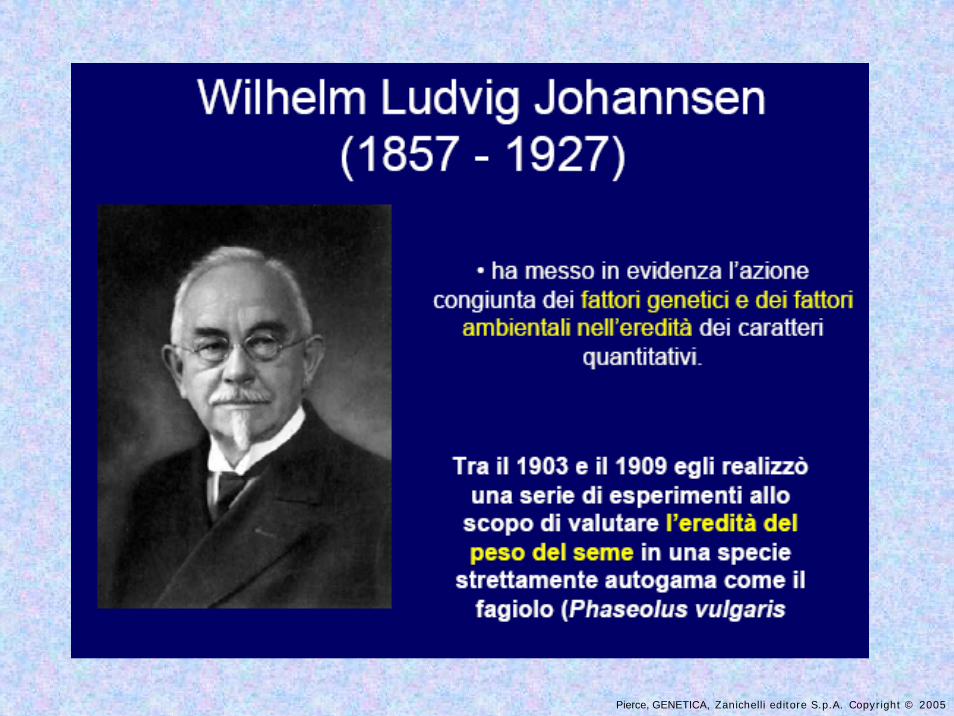
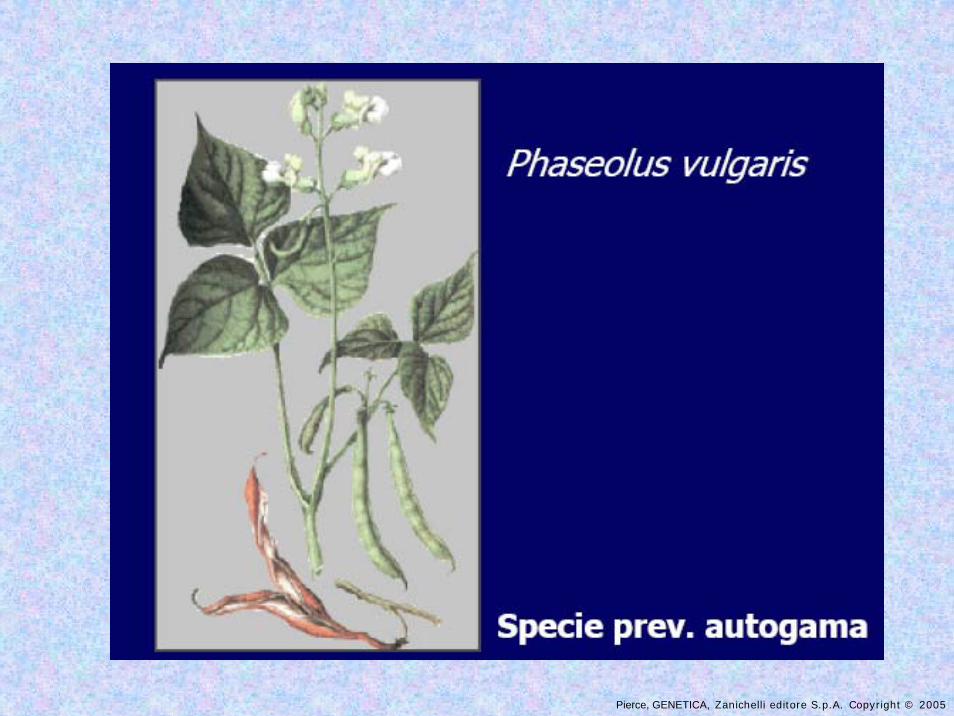
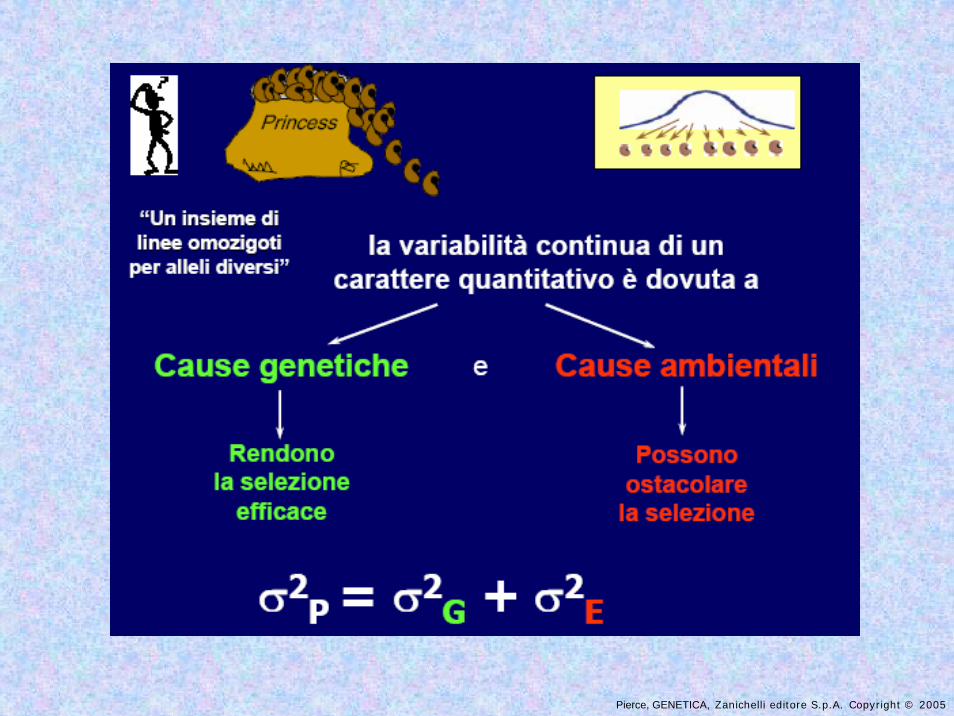
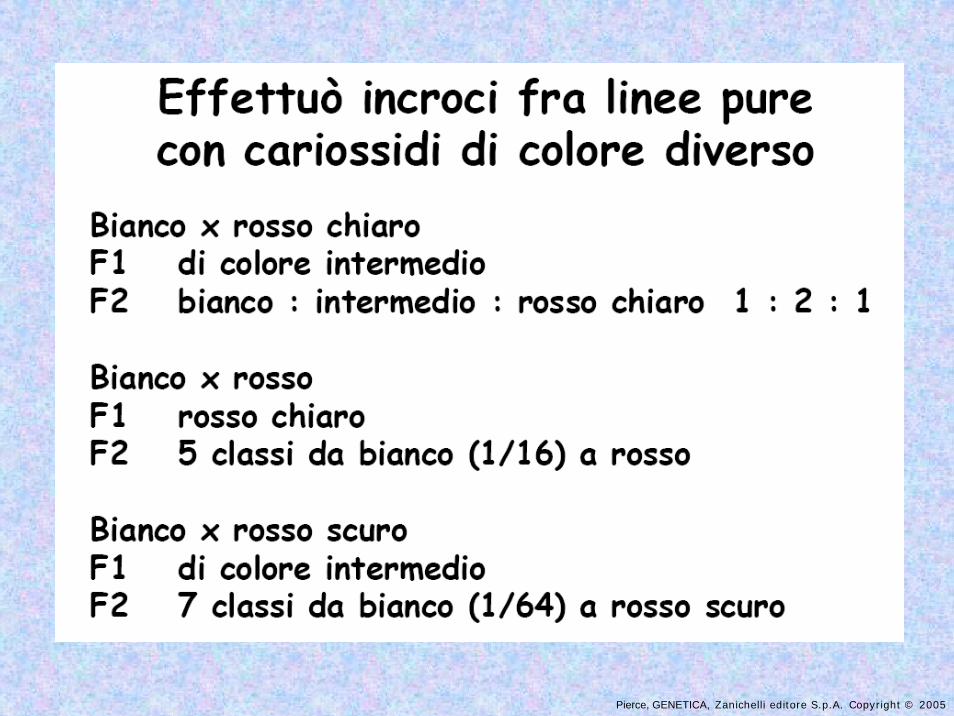
Gli esperimenti di W. JOHANNSEN con linee pure di Phaseolus vulgaris
permisero la distinzione tra genotipo e gli effetti di fattori ambientali sul genotipo che insieme producono uno
specifico fenotipo.
Pierce, GENETICA, Zanichelli editore S.p.A. Copyright © 2005
Pierce, GENETICA, Zanichelli editore S.p.A. Copyright © 2005
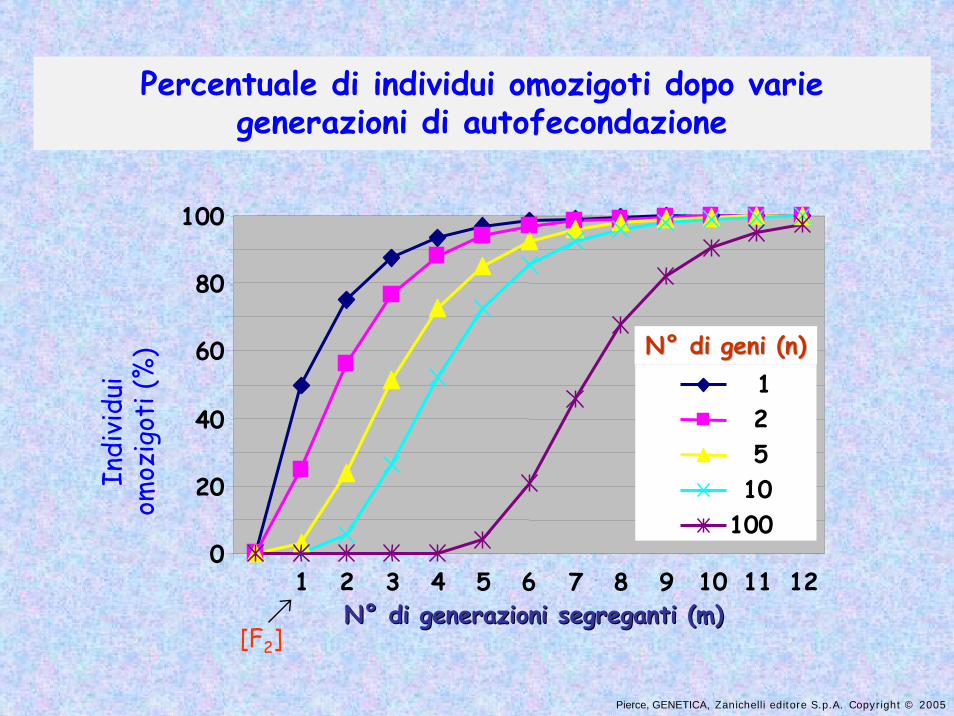
0
20
40
60
80
100
1 2 3 4 5 6 7 8 9 10 11 12
125
10100
NN°° di geni (n)di geni (n)
NN°° di generazioni segreganti (m)di generazioni segreganti (m)[F2]
Percentuale di individui omozigoti dopo varie generazioni di autofecondazioneIn
divi
dui
omoz
igot
i (%
)
Pierce, GENETICA, Zanichelli editore S.p.A. Copyright © 2005
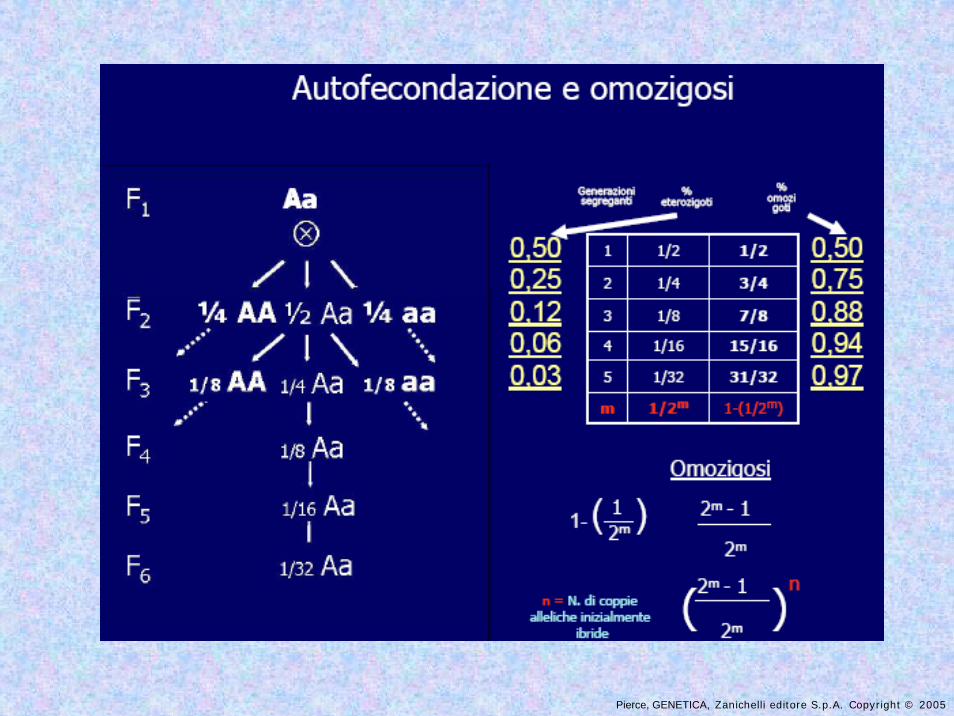
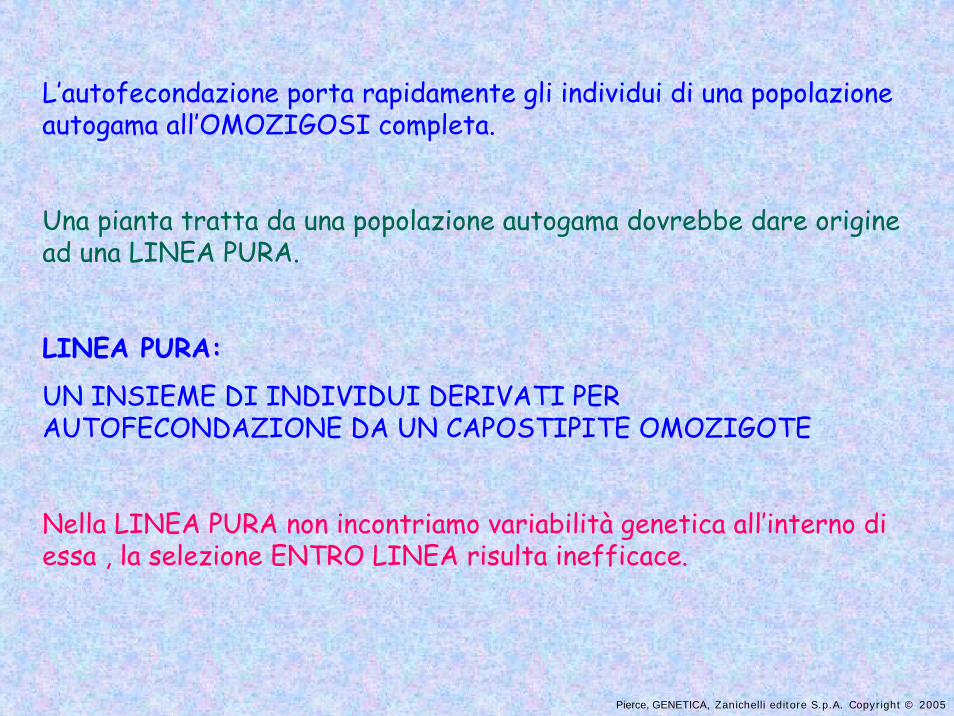
L’autofecondazione porta rapidamente gli individui di una popolazione autogama all’OMOZIGOSI completa.
Una pianta tratta da una popolazione autogama dovrebbe dare origine ad una LINEA PURA.
LINEA PURA:
UN INSIEME DI INDIVIDUI DERIVATI PER AUTOFECONDAZIONE DA UN CAPOSTIPITE OMOZIGOTE
Nella LINEA PURA non incontriamo variabilità genetica all’interno di essa , la selezione ENTRO LINEA risulta inefficace.
Pierce, GENETICA, Zanichelli editore S.p.A. Copyright © 2005
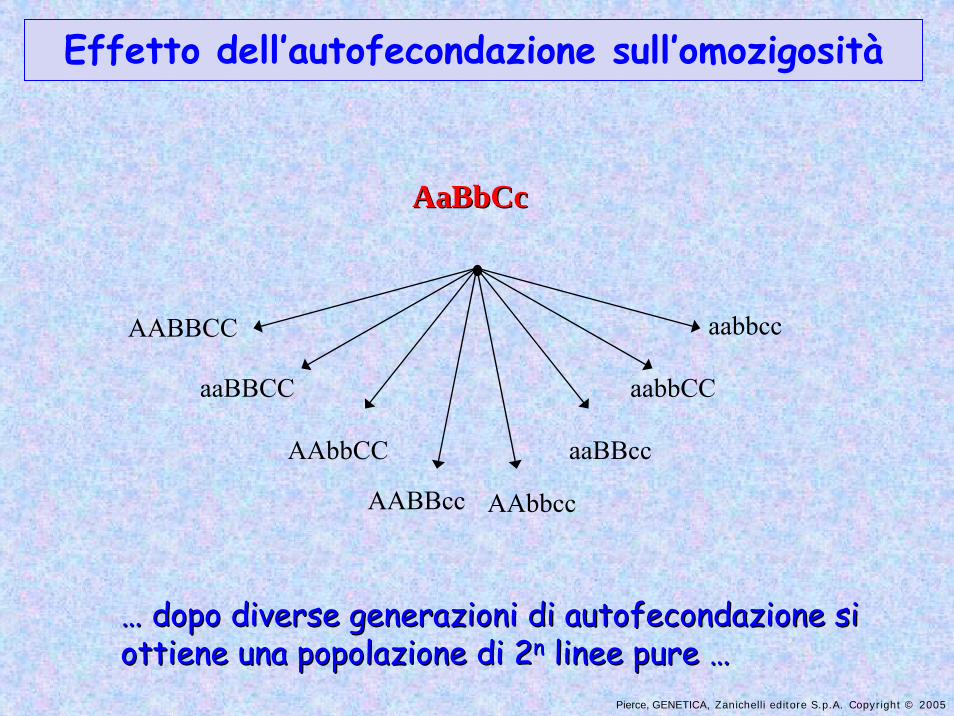
AaBbCcAaBbCc
AAbbcc
AABBCC aabbcc
AABBcc
AAbbCC
aaBBCC
aaBBcc
aabbCC
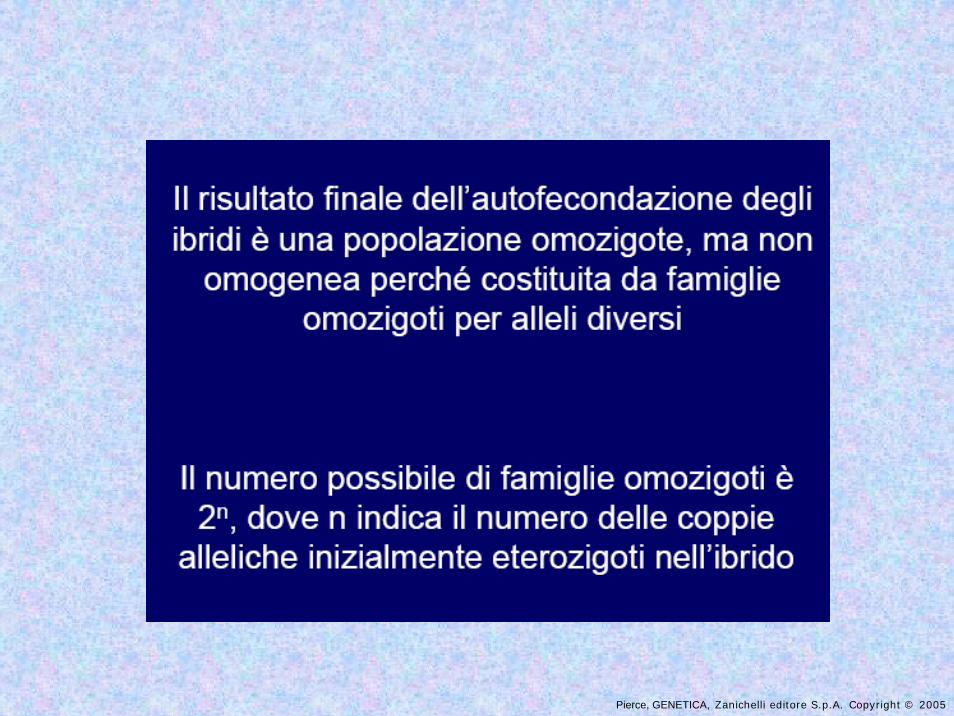
…… dopo diverse generazioni di autofecondazione si dopo diverse generazioni di autofecondazione si ottiene una popolazione di 2ottiene una popolazione di 2nn linee pure linee pure ……
Effetto dell’autofecondazione sull’omozigosità
Pierce, GENETICA, Zanichelli editore S.p.A. Copyright © 2005
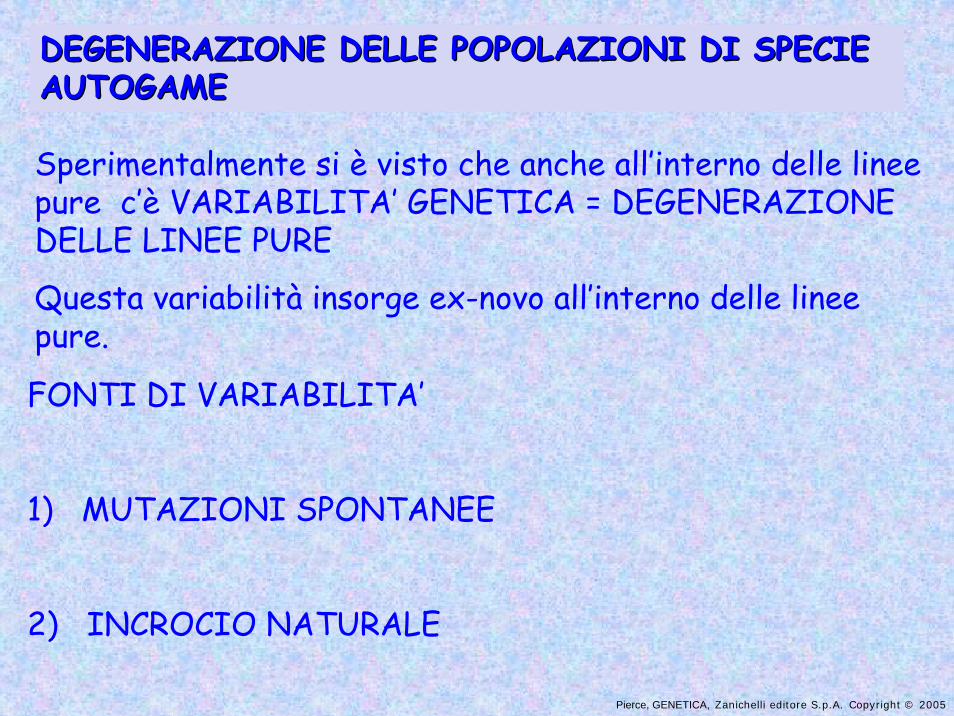
DEGENERAZIONE DELLE POPOLAZIONI DEGENERAZIONE DELLE POPOLAZIONI DIDI SPECIE SPECIE AUTOGAMEAUTOGAME
Sperimentalmente si è visto che anche all’interno delle linee pure c’è VARIABILITA’ GENETICA = DEGENERAZIONE DELLE LINEE PURE
Questa variabilità insorge ex-novo all’interno delle linee pure.
FONTI DI VARIABILITA’
1) MUTAZIONI SPONTANEE
2) INCROCIO NATURALE
Pierce, GENETICA, Zanichelli editore S.p.A. Copyright © 2005
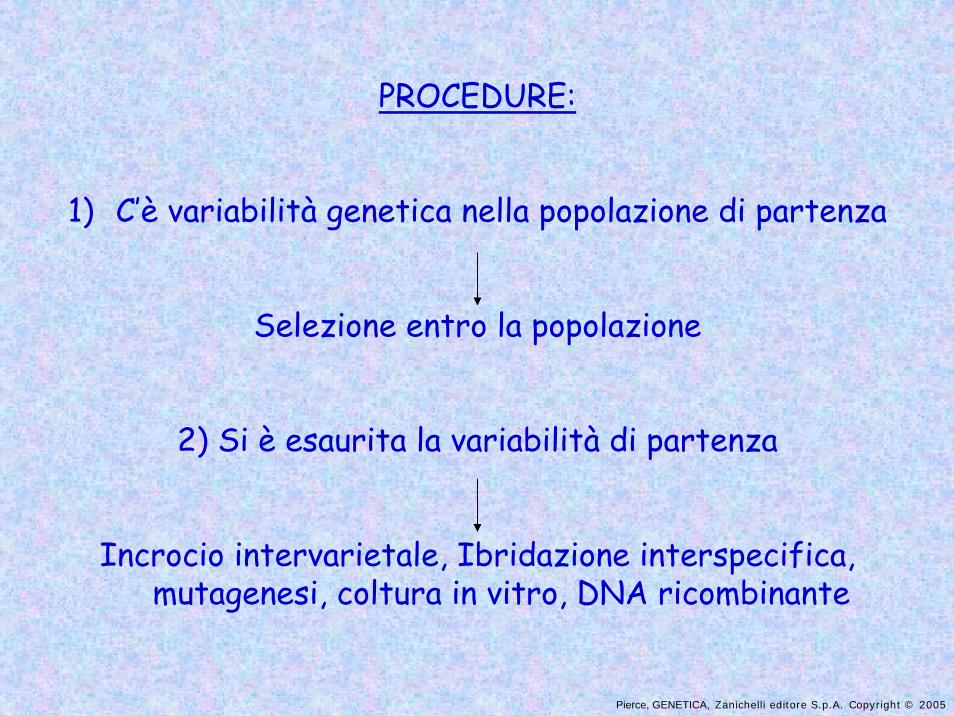
PROCEDURE:
1) C’è variabilità genetica nella popolazione di partenza
Selezione entro la popolazione
2) Si è esaurita la variabilità di partenza
Incrocio intervarietale, Ibridazione interspecifica, mutagenesi, coltura in vitro, DNA ricombinante
Pierce, GENETICA, Zanichelli editore S.p.A. Copyright © 2005
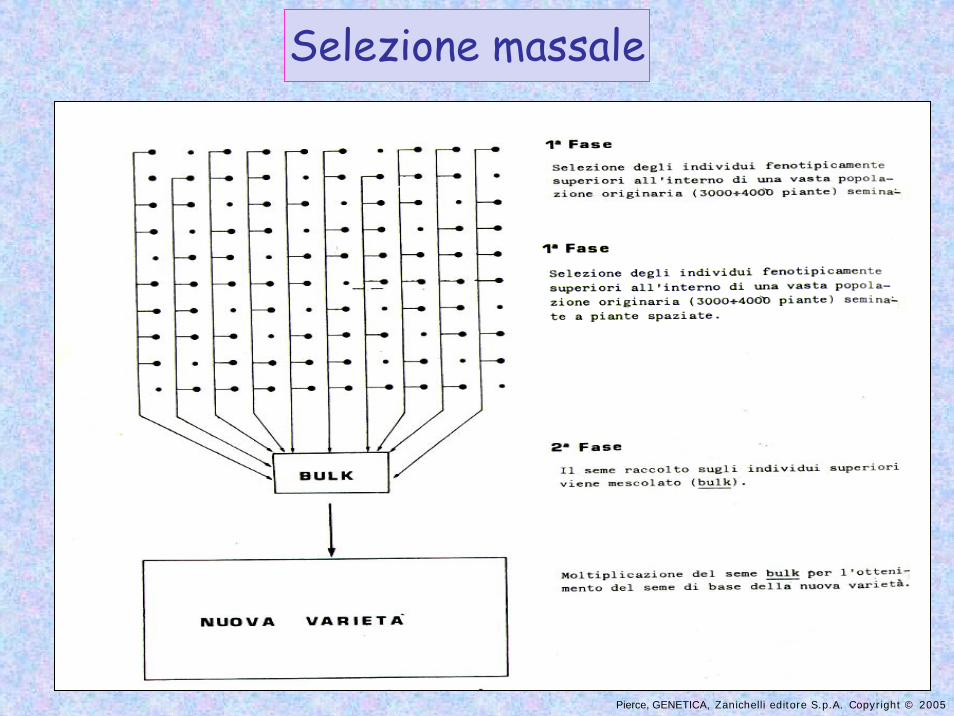
Selezione massale
Pierce, GENETICA, Zanichelli editore S.p.A. Copyright © 2005
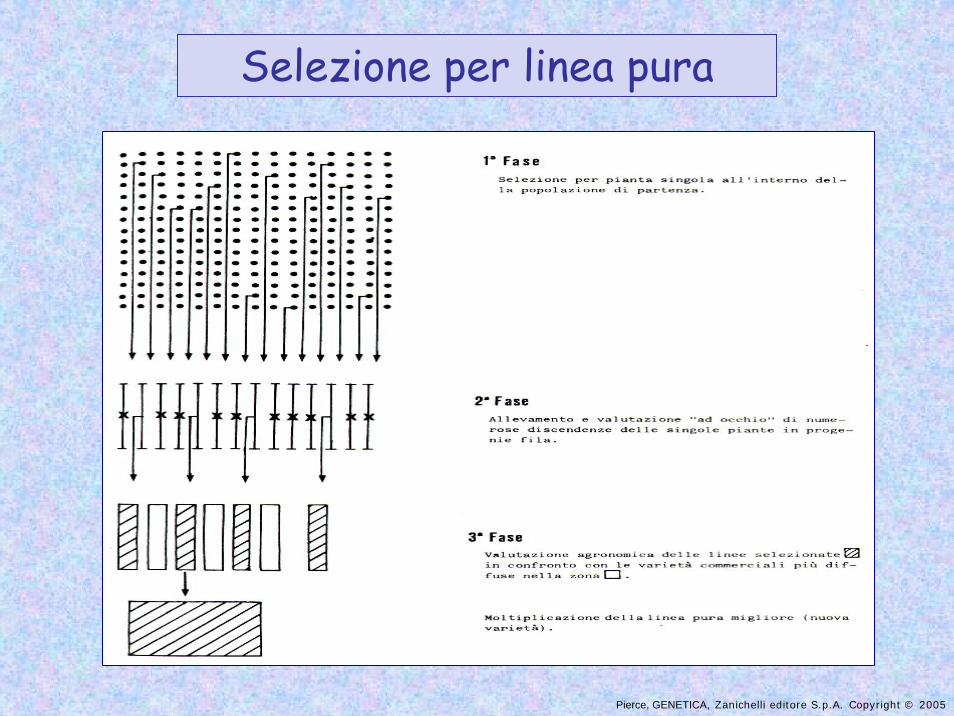
Selezione per linea pura
Pierce, GENETICA, Zanichelli editore S.p.A. Copyright © 2005
Pierce, GENETICA, Zanichelli editore S.p.A. Copyright © 2005
Pierce, GENETICA, Zanichelli editore S.p.A. Copyright © 2005
Pierce, GENETICA, Zanichelli editore S.p.A. Copyright © 2005
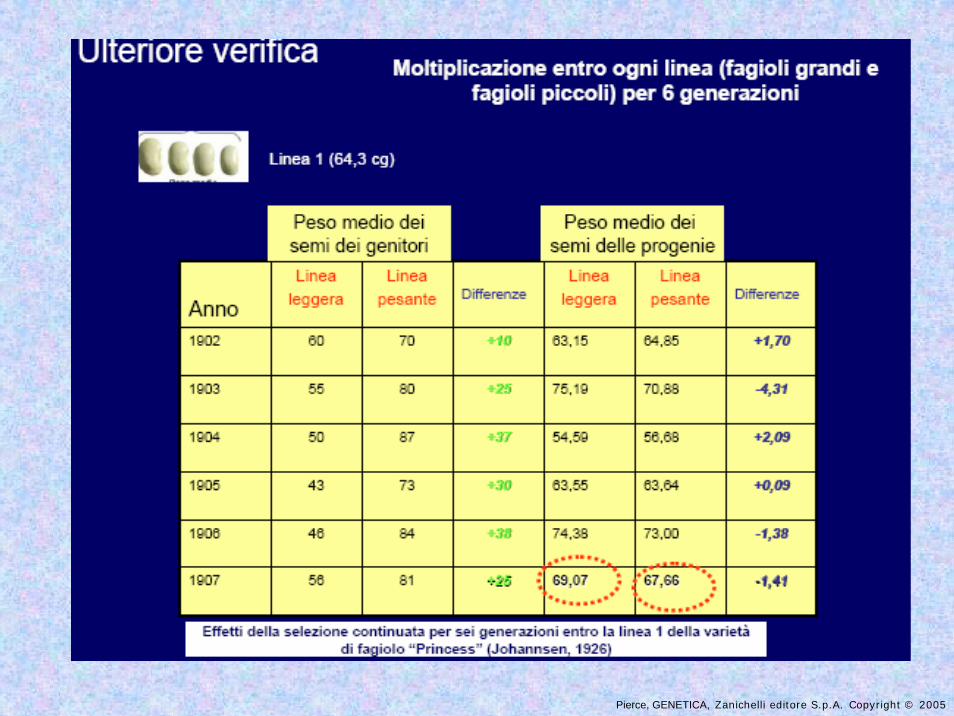
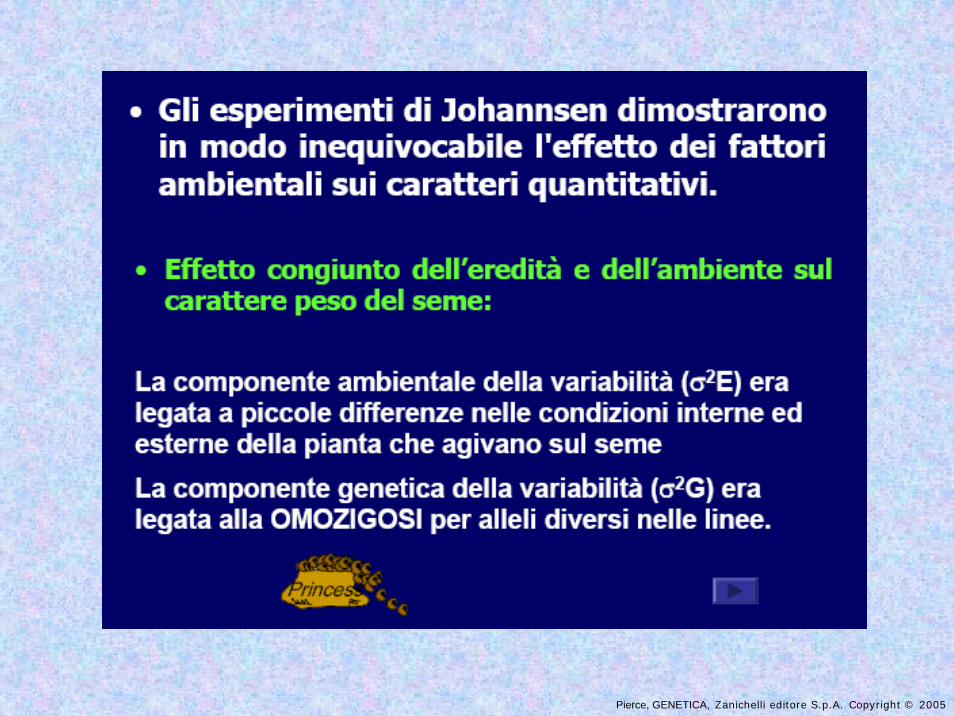
In questa varietà auto-impollinante obbligata ci sono numerose linee pure che differiscono per certe caratteristiche come il peso mediodei semi.
Queste differenze sono determinate geneticamente, ma per per una serie di ragioni, come per esempio la posizione del baccello sulla pianta e le risultanti differenze nell’acquisizione di nutrienti, ogni pianta produce semi di diverso peso.
Pierce, GENETICA, Zanichelli editore S.p.A. Copyright © 2005
Pierce, GENETICA, Zanichelli editore S.p.A. Copyright © 2005
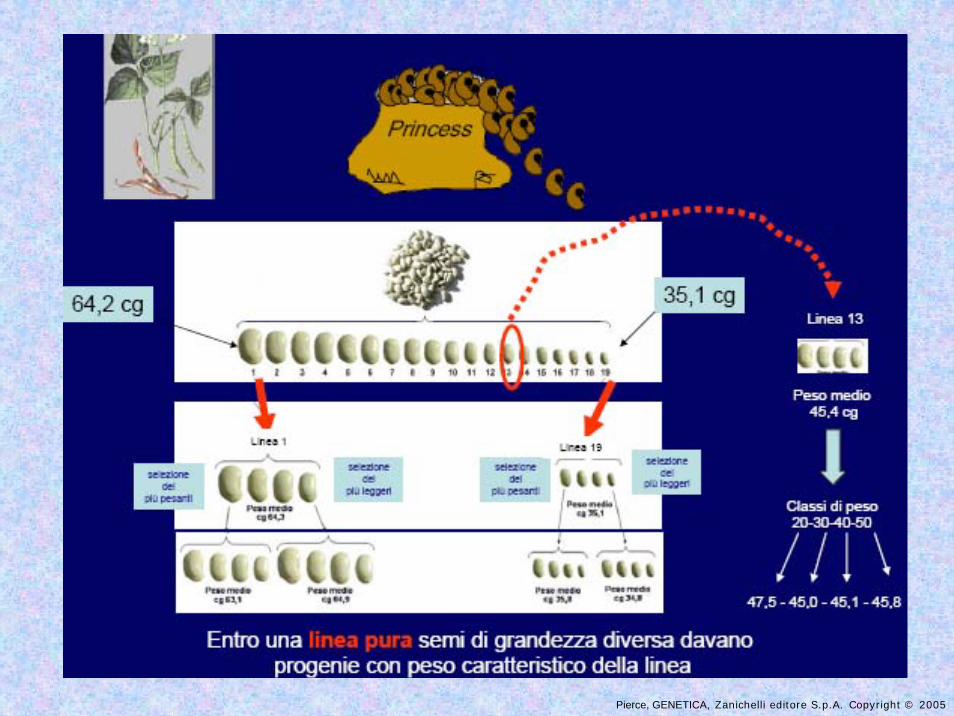
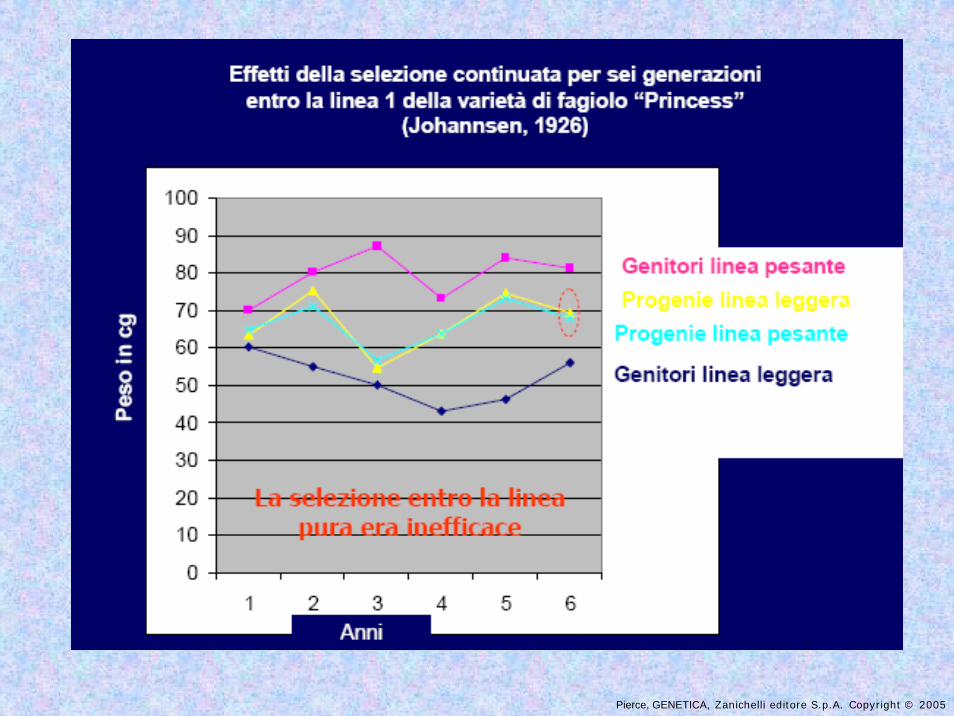
JOHANNSEN scelse per la coltivazione i semi più leggeri e più pesanti nell’ambito della variazione fenotipica di linee pure per alcune generazioni successive senza ottenere un cambiamento del peso medio dei semi.
Una selezione entro linee pure è perciò senza effetto.
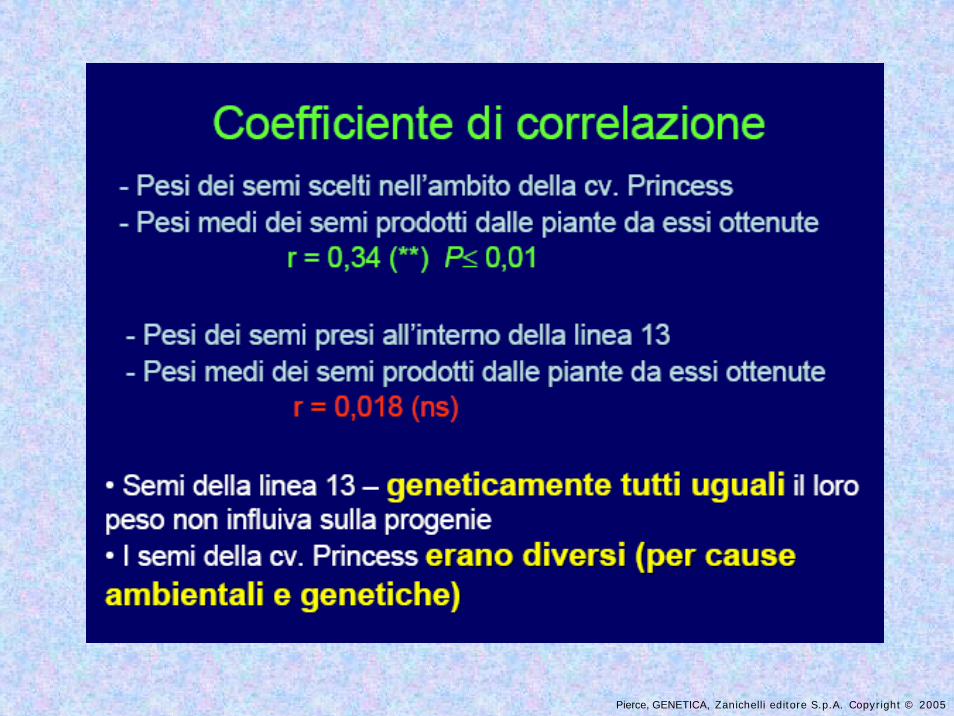
Sulla base di queste osservazioni JOHANNSEN coniò i termini genotipo e
fenotipo.
Pierce, GENETICA, Zanichelli editore S.p.A. Copyright © 2005
Pierce, GENETICA, Zanichelli editore S.p.A. Copyright © 2005
Pierce, GENETICA, Zanichelli editore S.p.A. Copyright © 2005
Pierce, GENETICA, Zanichelli editore S.p.A. Copyright © 2005
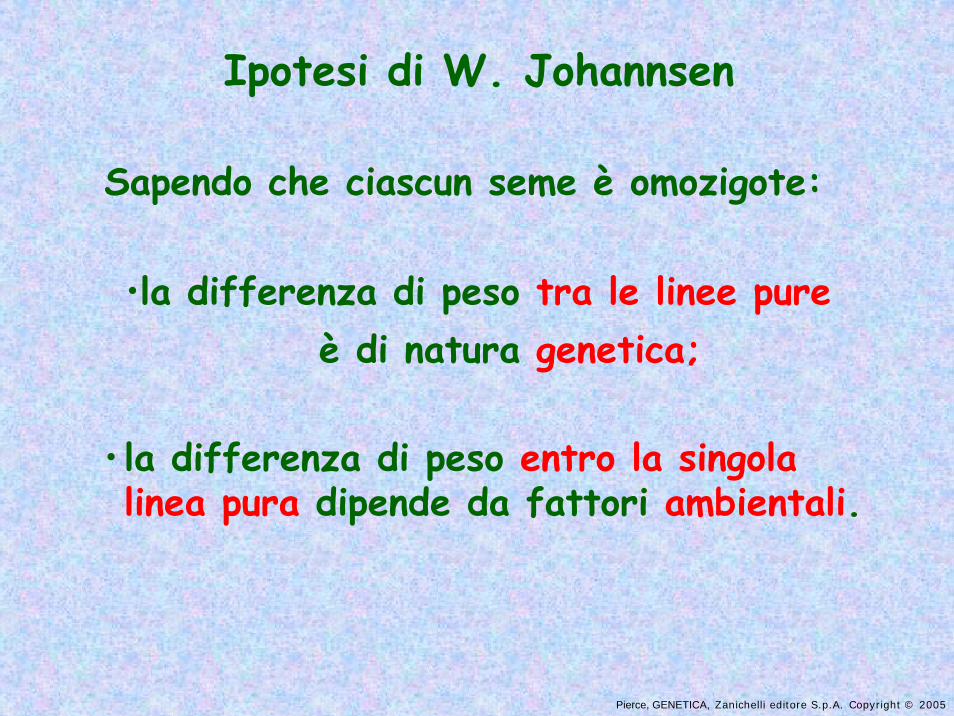
Ipotesi di W. Johannsen
Sapendo che ciascun seme è omozigote:
•la differenza di peso tra le linee pureè di natura genetica;
• la differenza di peso entro la singola linea pura dipende da fattori ambientali.
Pierce, GENETICA, Zanichelli editore S.p.A. Copyright © 2005
Pierce, GENETICA, Zanichelli editore S.p.A. Copyright © 2005
Pierce, GENETICA, Zanichelli editore S.p.A. Copyright © 2005
Pierce, GENETICA, Zanichelli editore S.p.A. Copyright © 2005
Pierce, GENETICA, Zanichelli editore S.p.A. Copyright © 2005
Pierce, GENETICA, Zanichelli editore S.p.A. Copyright © 2005
Pierce, GENETICA, Zanichelli editore S.p.A. Copyright © 2005
Pierce, GENETICA, Zanichelli editore S.p.A. Copyright © 2005
Pierce, GENETICA, Zanichelli editore S.p.A. Copyright © 2005
Pierce, GENETICA, Zanichelli editore S.p.A. Copyright © 2005
Pierce, GENETICA, Zanichelli editore S.p.A. Copyright © 2005
Pierce, GENETICA, Zanichelli editore S.p.A. Copyright © 2005
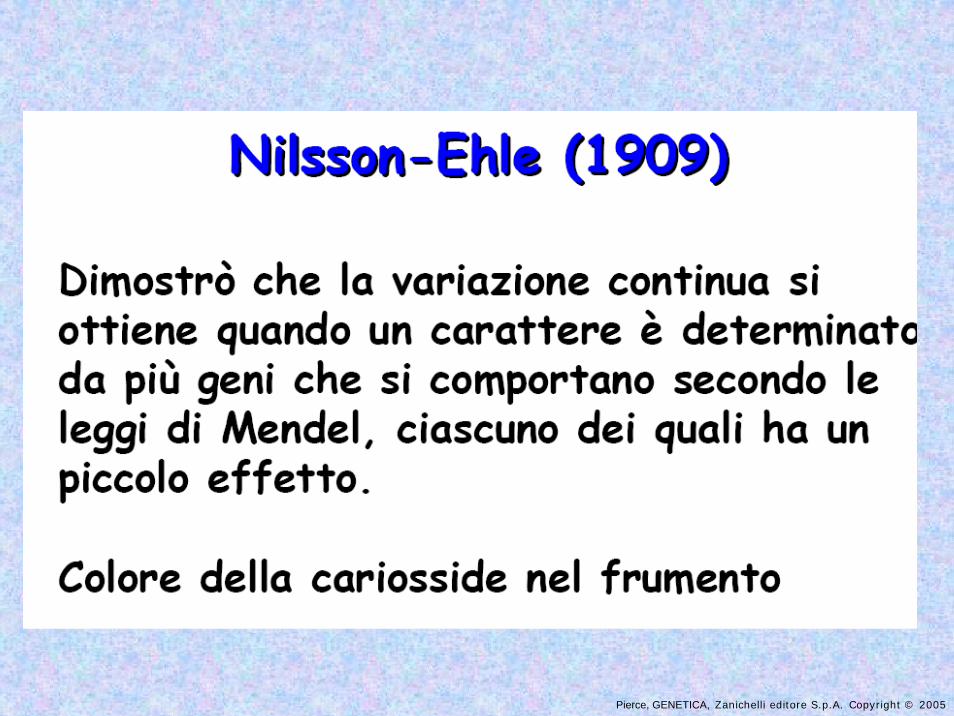
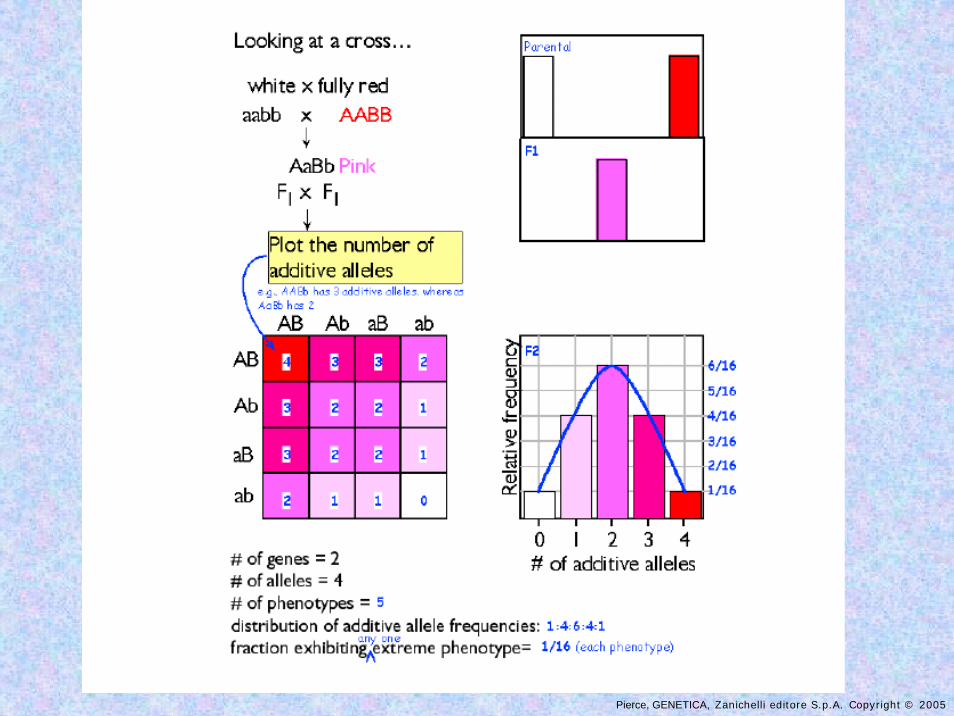
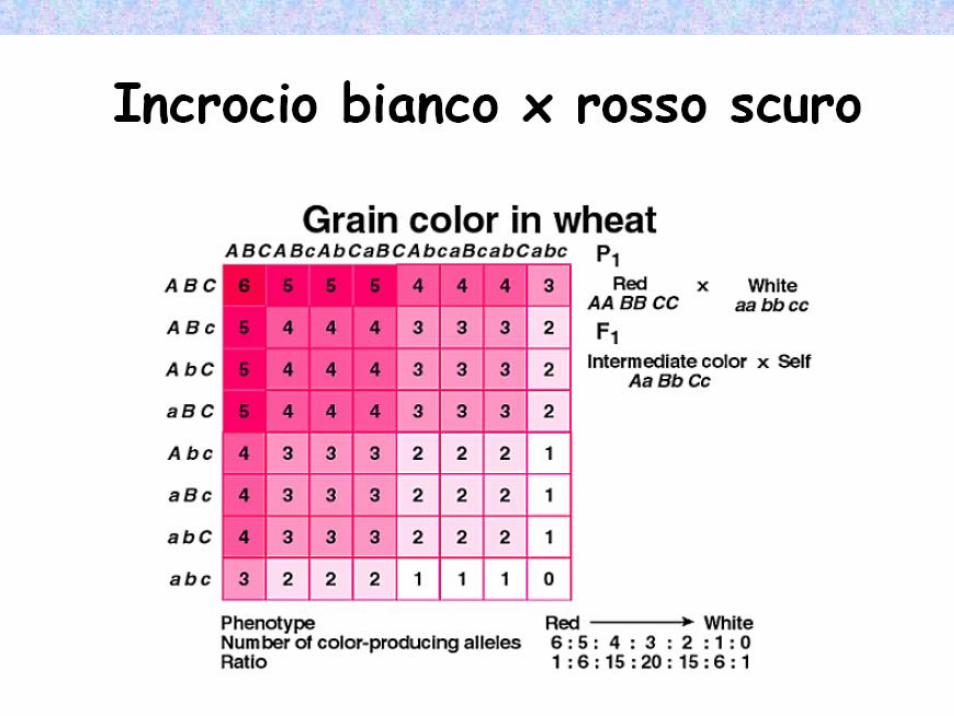
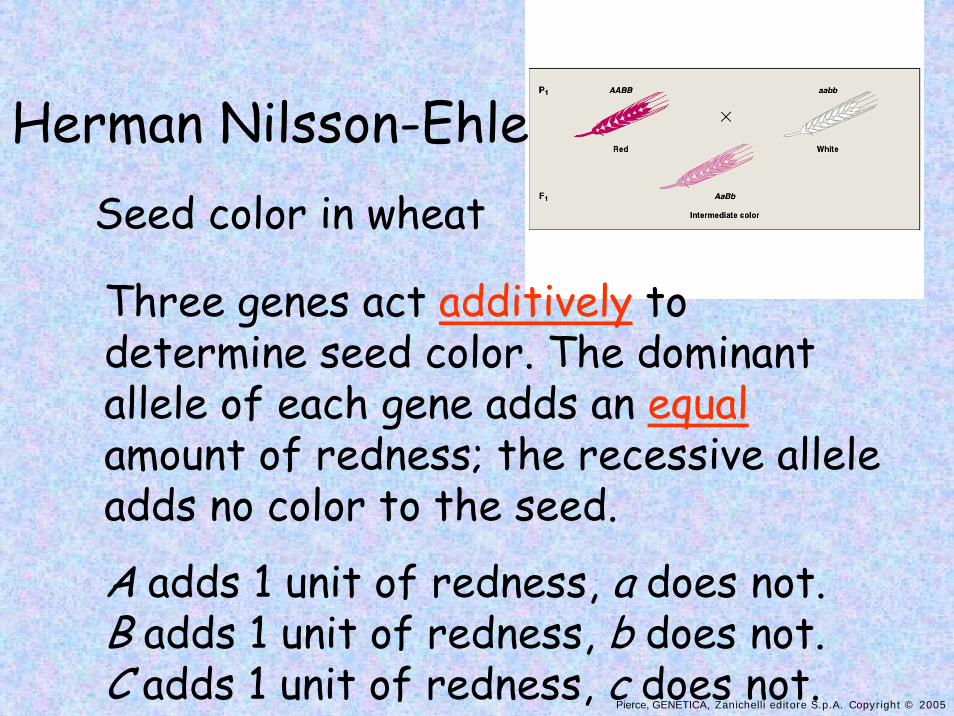
Herman Nilsson-EhleSeed color in wheat
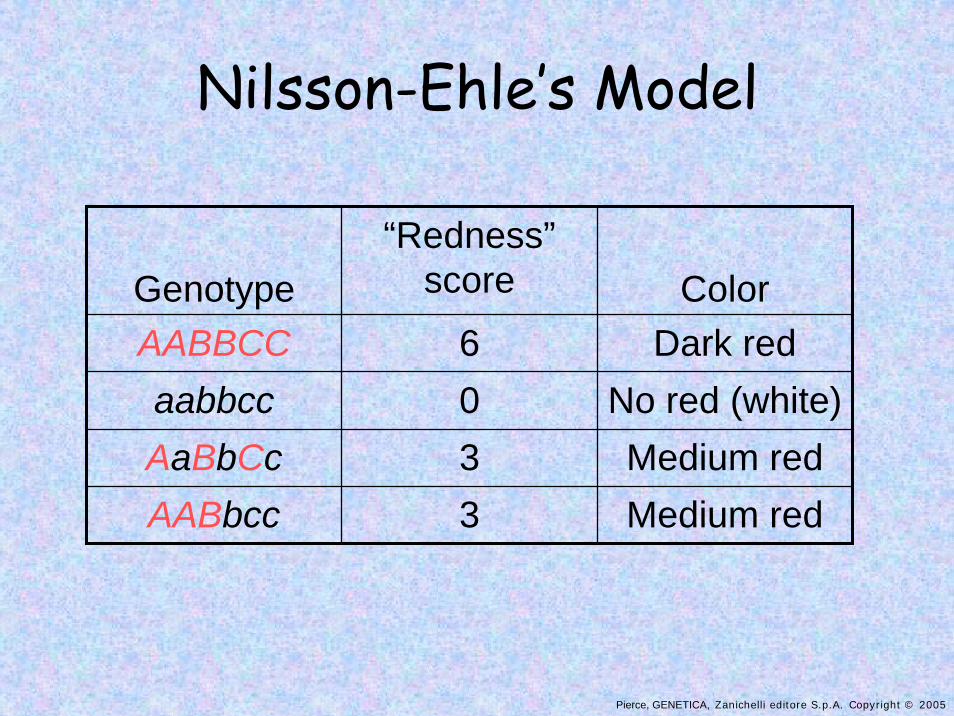
Three genes act additively to determine seed color. The dominant allele of each gene adds an equalamount of redness; the recessive allele adds no color to the seed.
A adds 1 unit of redness, a does not.B adds 1 unit of redness, b does not.C adds 1 unit of redness, c does not.
Pierce, GENETICA, Zanichelli editore S.p.A. Copyright © 2005
Nilsson-Ehle’s Model
Medium red3AABbccMedium red3AaBbCc
No red (white)0aabbccDark red6AABBCC
Color“Redness”
scoreGenotype
Pierce, GENETICA, Zanichelli editore S.p.A. Copyright © 2005
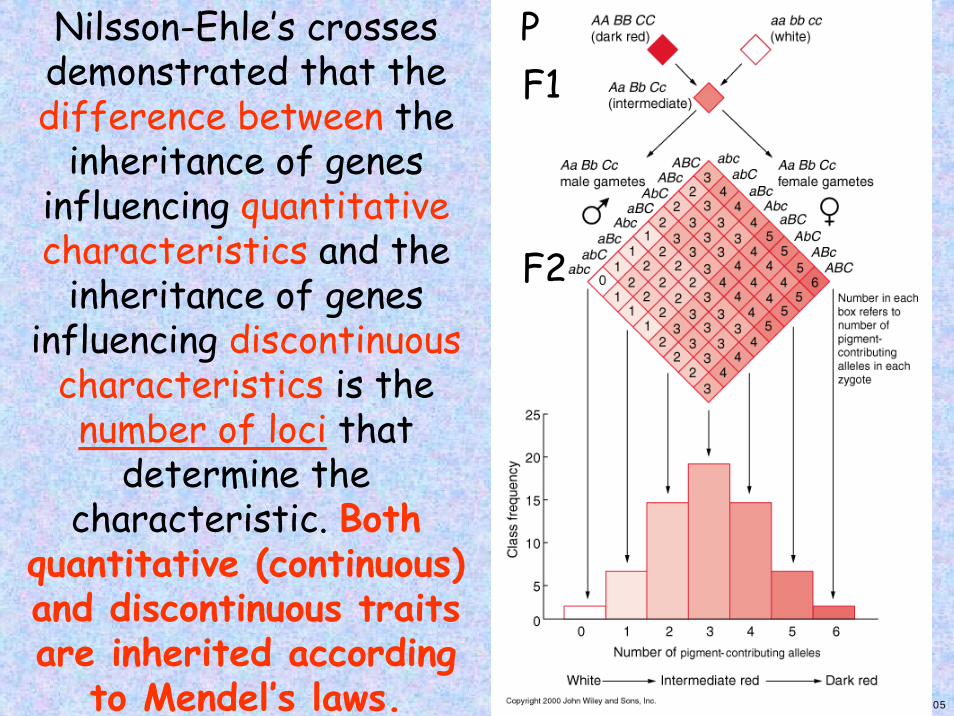
PF1
F2
Nilsson-Ehle’s crosses demonstrated that the difference between the
inheritance of genesinfluencing quantitative characteristics and the
inheritance of genes influencing discontinuous
characteristics is the number of loci that
determine the characteristic. Both
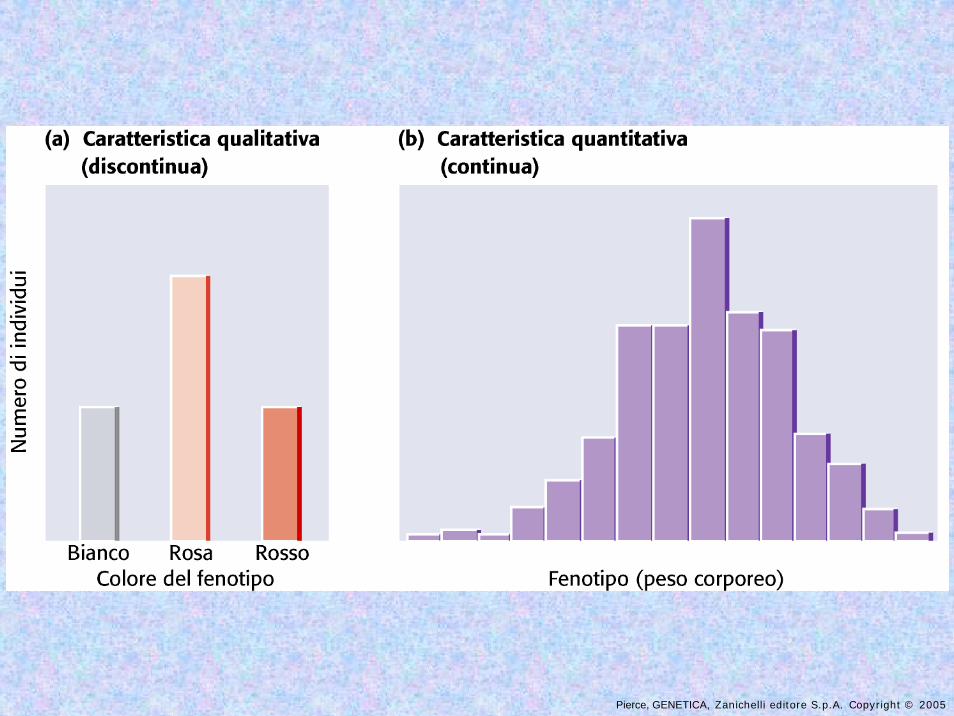
quantitative (continuous) and discontinuous traits are inherited according
to Mendel’s laws.
Pierce, GENETICA, Zanichelli editore S.p.A. Copyright © 2005
•Quantitative traits are influenced by the combined effects of numerous genes. These are called polygenic or multifactorial traits.
•The genes follow Mendelian laws of inheritance; however, multifactorial traits have numerous possible phenotypic categories.
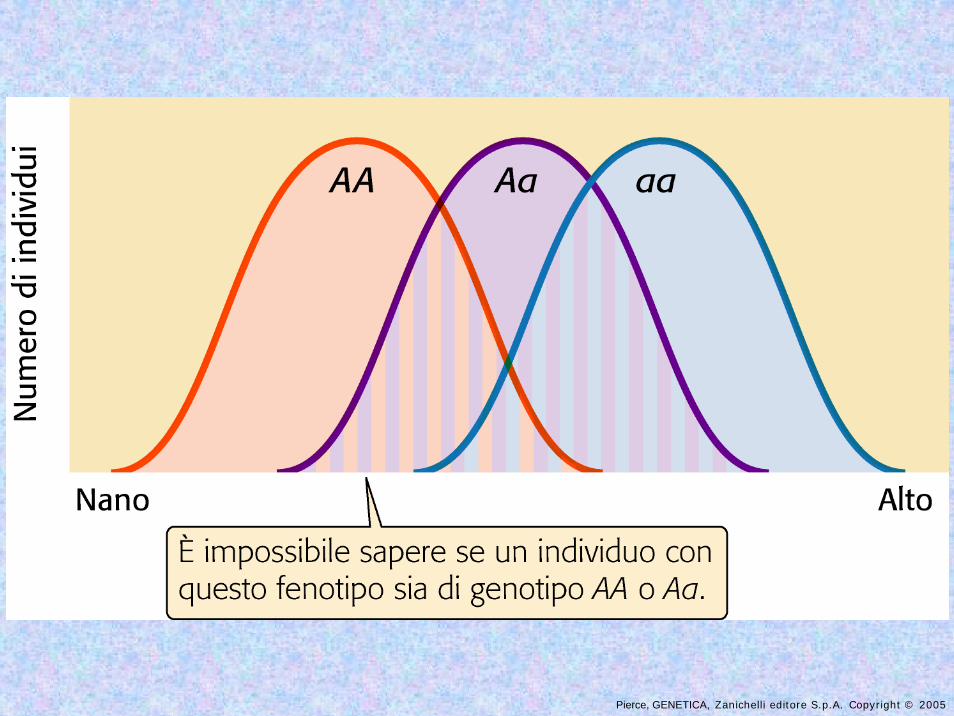
•Environmental influences blur the phenotypic differences between adjacent genotypes.
Pierce, GENETICA, Zanichelli editore S.p.A. Copyright © 2005
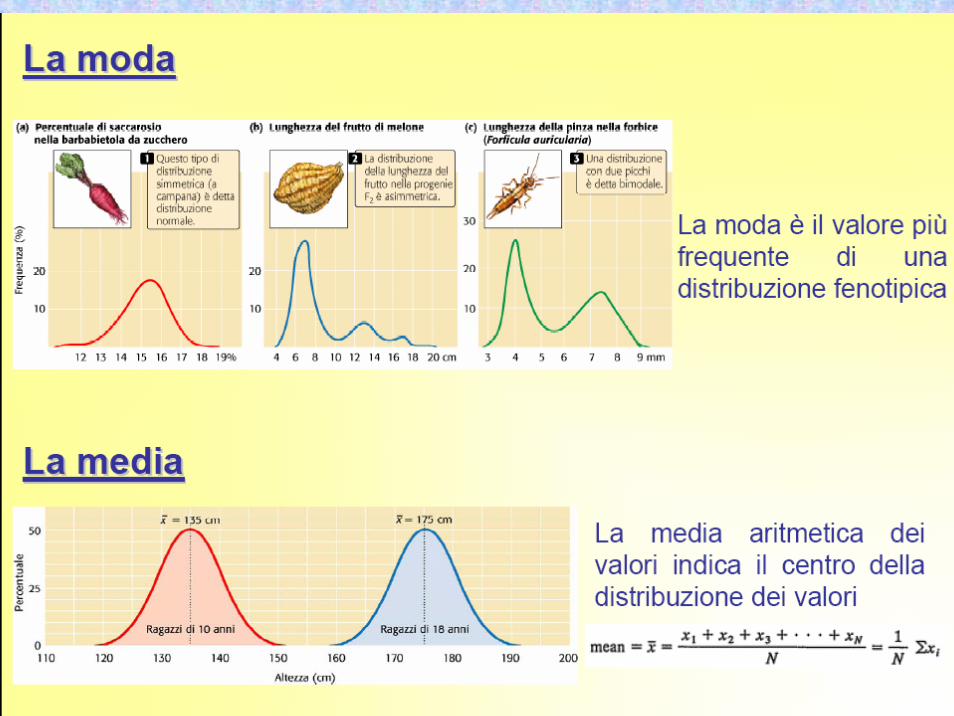
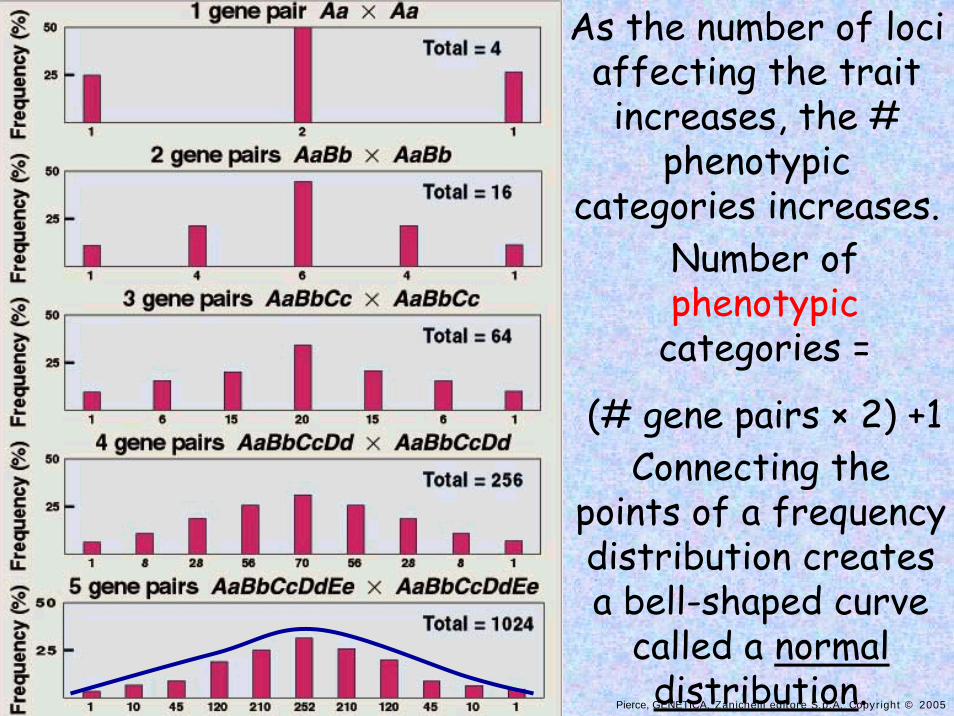
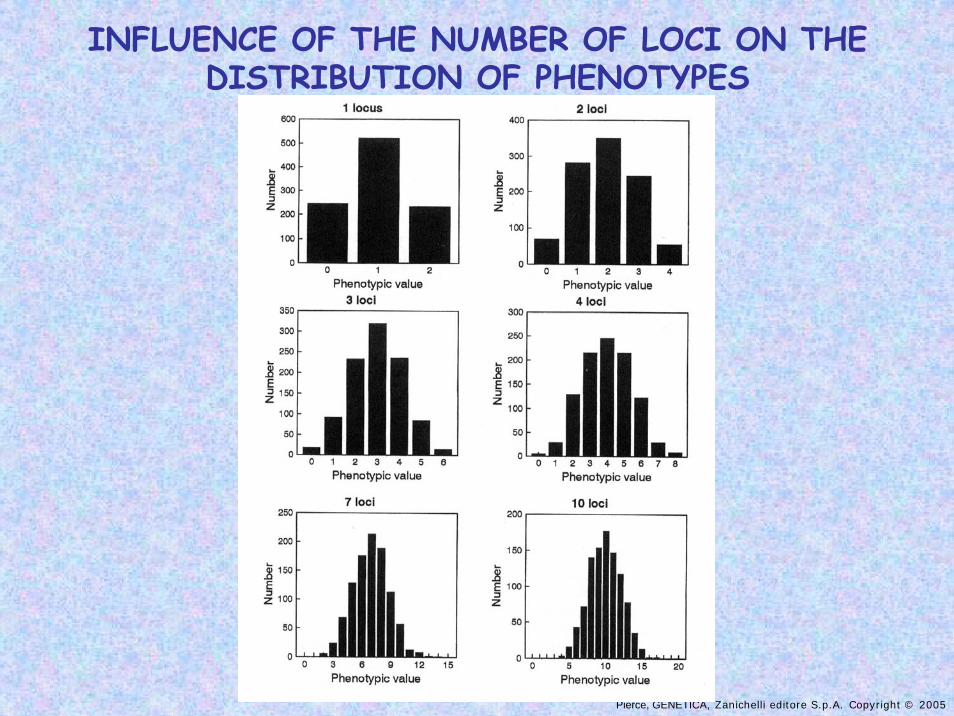
Number of phenotypic
categories =
(# gene pairs × 2) +1Connecting the
points of a frequency distribution creates a bell-shaped curve
called a normal distribution.
As the number of loci affecting the trait increases, the #
phenotypic categories increases.
Pierce, GENETICA, Zanichelli editore S.p.A. Copyright © 2005
INFLUENCE OF THE NUMBER OF LOCI ON THE DISTRIBUTION OF PHENOTYPES
Pierce, GENETICA, Zanichelli editore S.p.A. Copyright © 2005
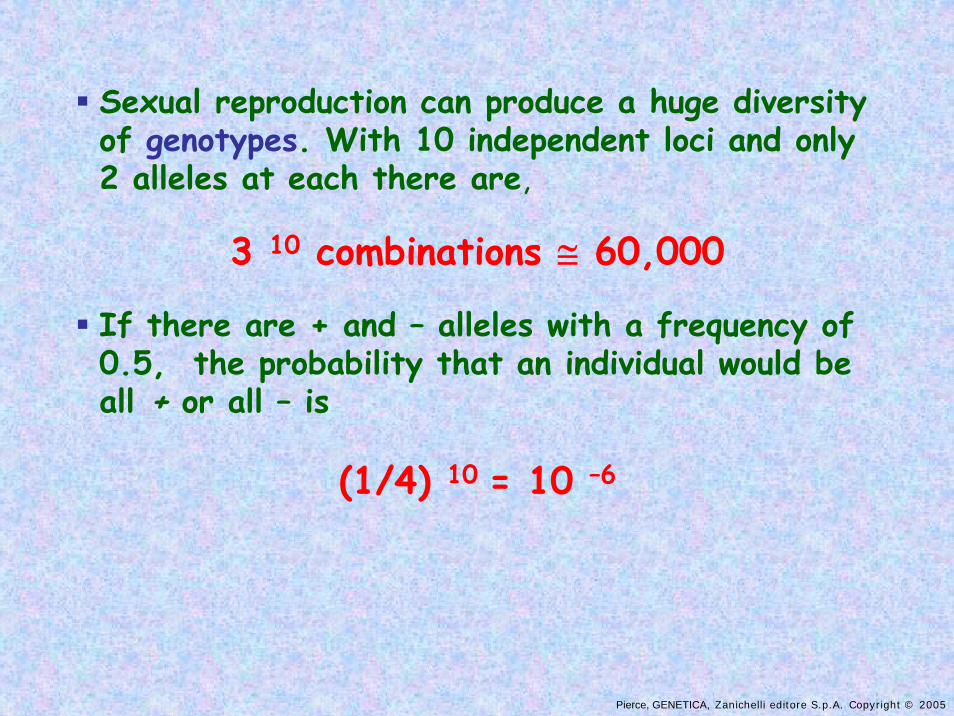
Sexual reproduction can produce a huge diversity of genotypes. With 10 independent loci and only 2 alleles at each there are,
3 10 combinations ≅ 60,000
If there are + and – alleles with a frequency of 0.5, the probability that an individual would be all + or all – is
(1/4) 10 = 10 –6
Pierce, GENETICA, Zanichelli editore S.p.A. Copyright © 2005
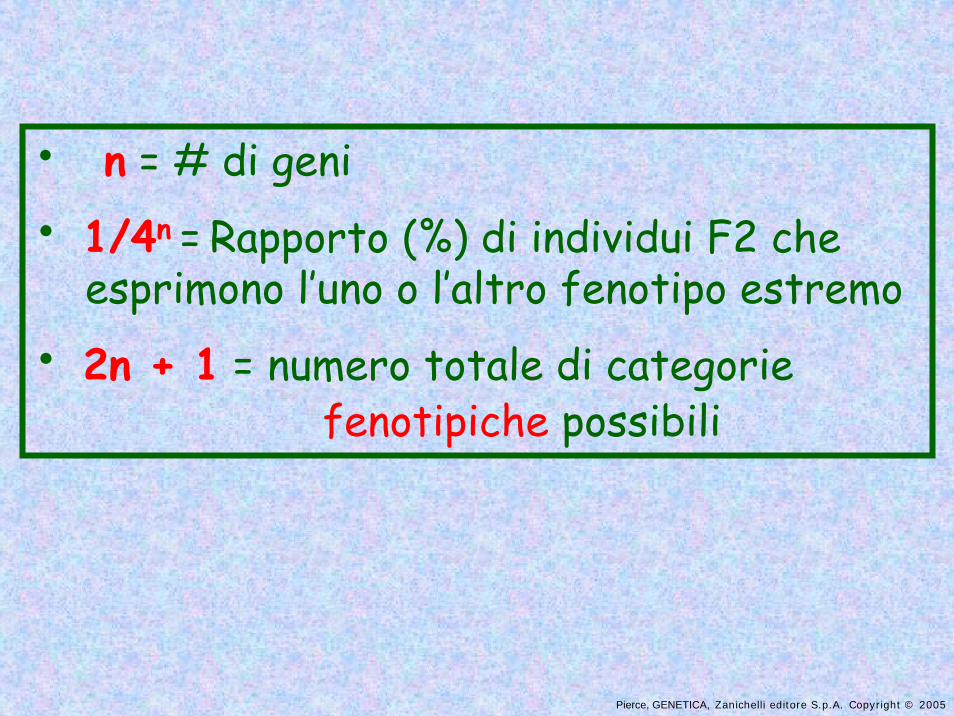
• n = # di geni
• 1/4n = Rapporto (%) di individui F2 che esprimono l’uno o l’altro fenotipo estremo
• 2n + 1 = numero totale di categorie fenotipiche possibili
Pierce, GENETICA, Zanichelli editore S.p.A. Copyright © 2005
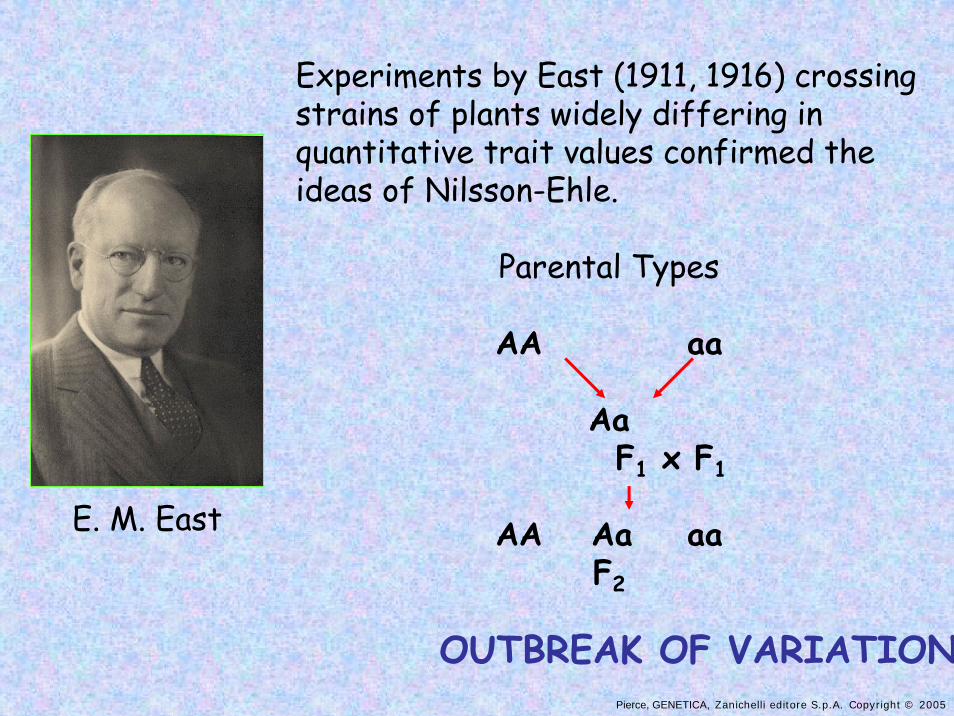
E. M. East
Experiments by East (1911, 1916) crossing strains of plants widely differing in quantitative trait values confirmed the ideas of Nilsson-Ehle.
Parental Types
AA aa
AaF1 x F1
AA Aa aaF2
OUTBREAK OF VARIATION
Pierce, GENETICA, Zanichelli editore S.p.A. Copyright © 2005
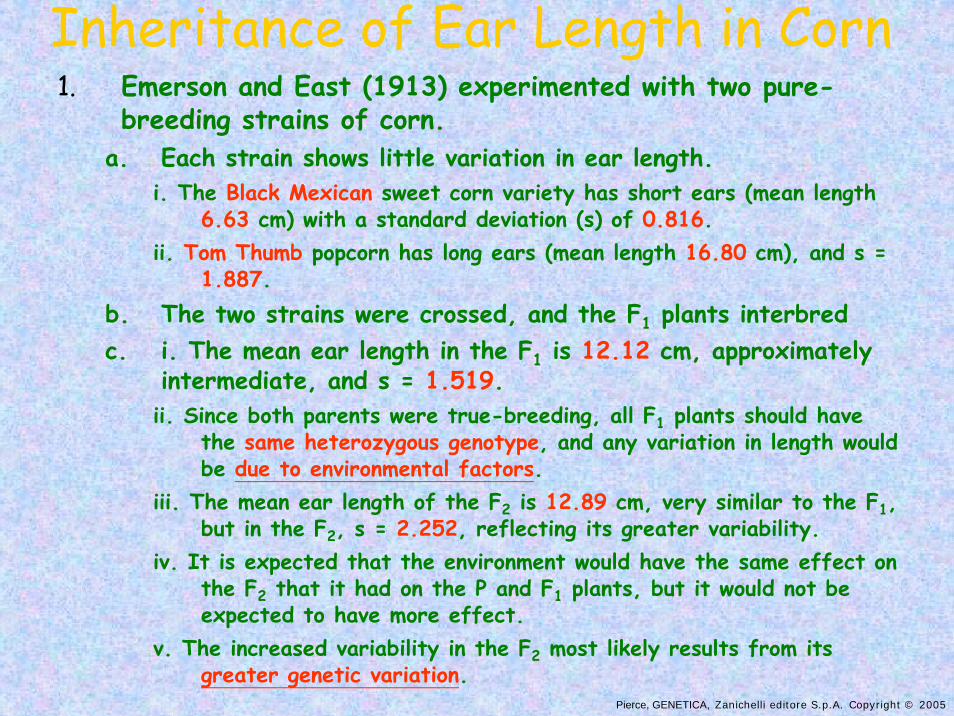
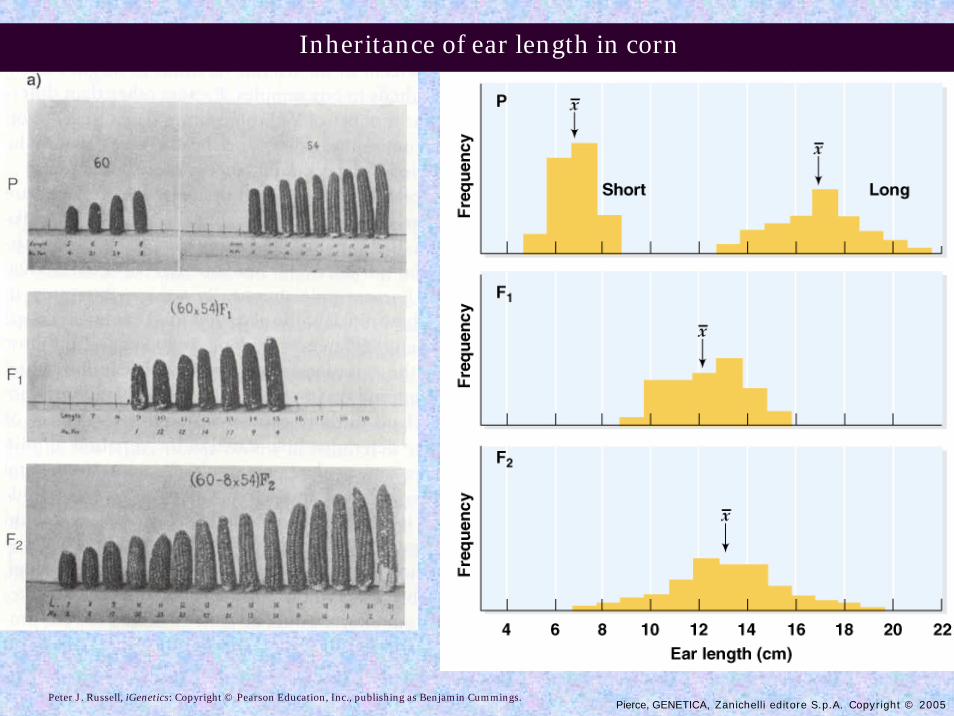
Inheritance of Ear Length in Corn1. Emerson and East (1913) experimented with two pure-
breeding strains of corn.a. Each strain shows little variation in ear length.
i. The Black Mexican sweet corn variety has short ears (mean length 6.63 cm) with a standard deviation (s) of 0.816.
ii. Tom Thumb popcorn has long ears (mean length 16.80 cm), and s = 1.887.
b. The two strains were crossed, and the F1 plants interbredc. i. The mean ear length in the F1 is 12.12 cm, approximately
intermediate, and s = 1.519.ii. Since both parents were true-breeding, all F1 plants should have
the same heterozygous genotype, and any variation in length would be due to environmental factors.
iii. The mean ear length of the F2 is 12.89 cm, very similar to the F1, but in the F2, s = 2.252, reflecting its greater variability.
iv. It is expected that the environment would have the same effect on the F2 that it had on the P and F1 plants, but it would not be expected to have more effect.
v. The increased variability in the F2 most likely results from its greater genetic variation.
Pierce, GENETICA, Zanichelli editore S.p.A. Copyright © 2005Peter J. Russell, iGenetics: Copyright © Pearson Education, Inc., publishing as Benjamin Cummings.
Inheritance of ear length in corn
Pierce, GENETICA, Zanichelli editore S.p.A. Copyright © 2005
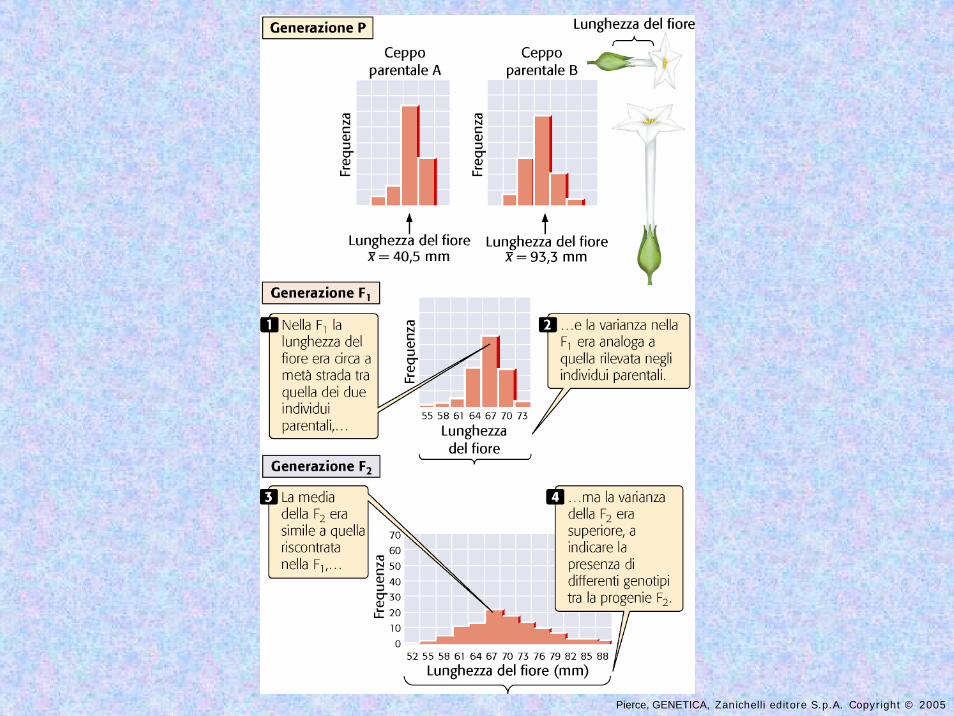
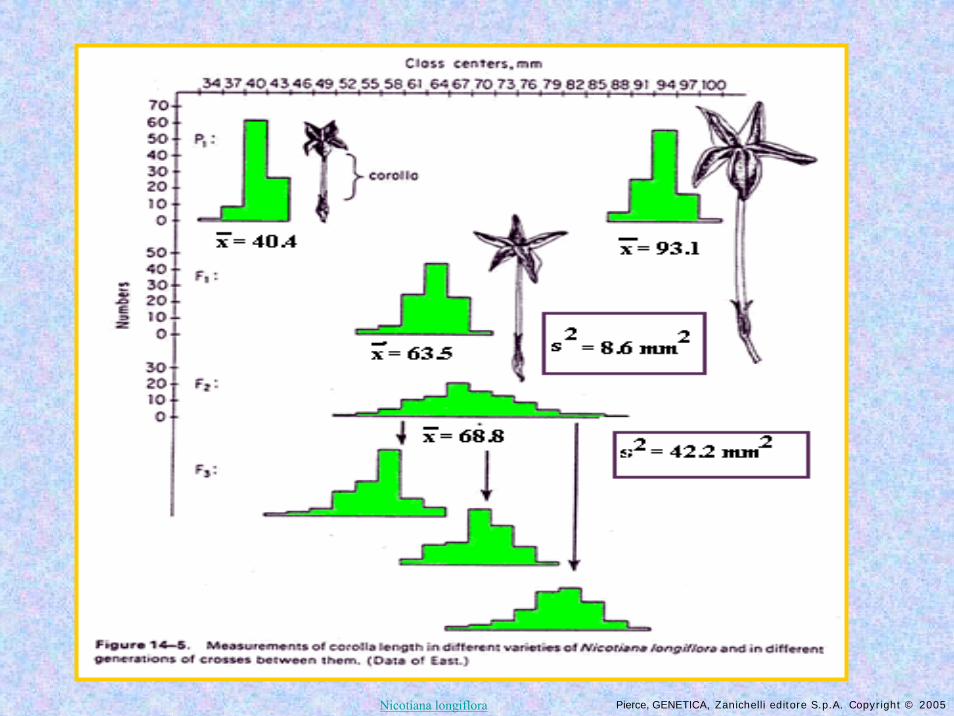
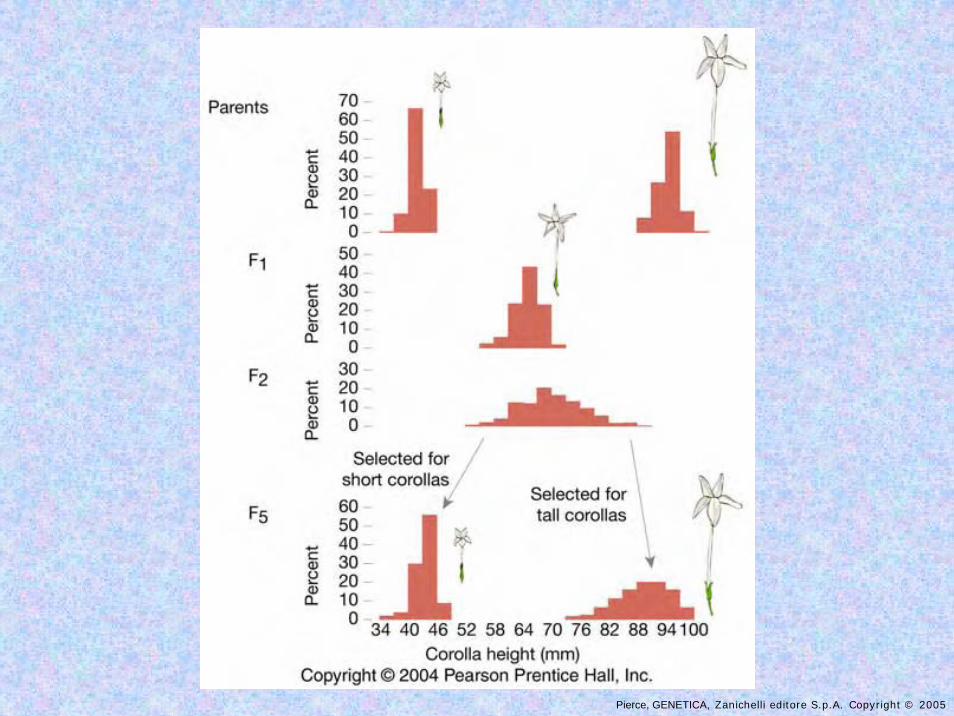
Another example is East’s study of Nicotiana longifloraflower length in genetic crosses.
a. He crossed a short-flowered strain (mean length of 40.4 mm) with a long-flowered strain (mean length of 93.1mm).b. The F1 progeny (173 plants) had a mean flower length of 63.5 mm, intermediate to the parents.
c. The F2 had a mean of 68.8 mm, very similar to the F1. But the F2 had a variance of 42.2 mm2, while F1 variance was only 8.6 mm2, indicating that more phenotypes occur among the F2 than among the F1.
Pierce, GENETICA, Zanichelli editore S.p.A. Copyright © 2005
Pierce, GENETICA, Zanichelli editore S.p.A. Copyright © 2005Nicotiana longiflora
Pierce, GENETICA, Zanichelli editore S.p.A. Copyright © 2005
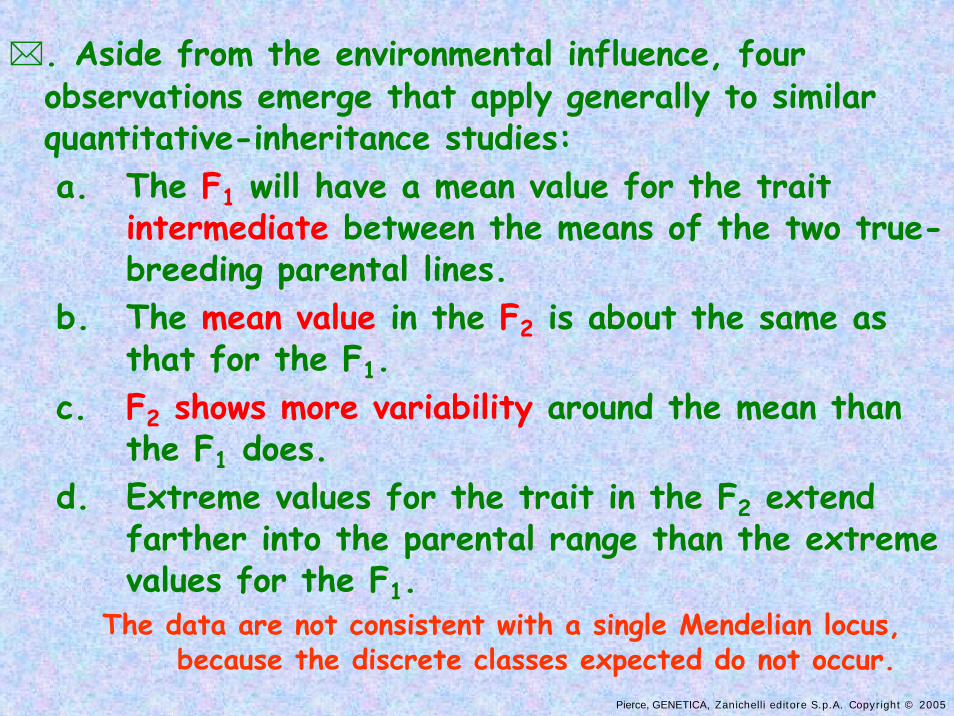
. Aside from the environmental influence, four observations emerge that apply generally to similar quantitative-inheritance studies:a. The F1 will have a mean value for the trait
intermediate between the means of the two true-breeding parental lines.
b. The mean value in the F2 is about the same as that for the F1.
c. F2 shows more variability around the mean than the F1 does.
d. Extreme values for the trait in the F2 extend farther into the parental range than the extreme values for the F1.
The data are not consistent with a single Mendelian locus, because the discrete classes expected do not occur.
Pierce, GENETICA, Zanichelli editore S.p.A. Copyright © 2005
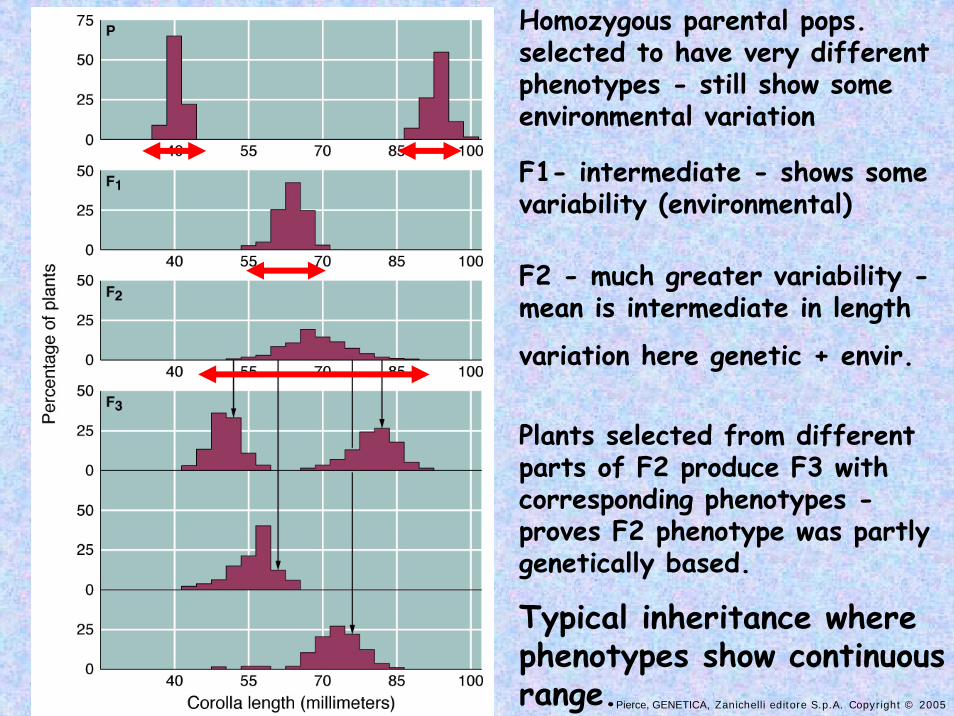
Homozygous parental pops. selected to have very different phenotypes - still show some environmental variation
Plants selected from different parts of F2 produce F3 with corresponding phenotypes -proves F2 phenotype was partly genetically based.
F2 - much greater variability -mean is intermediate in length
variation here genetic + envir.
F1- intermediate - shows some variability (environmental)
Typical inheritance where phenotypes show continuous range.
Pierce, GENETICA, Zanichelli editore S.p.A. Copyright © 2005
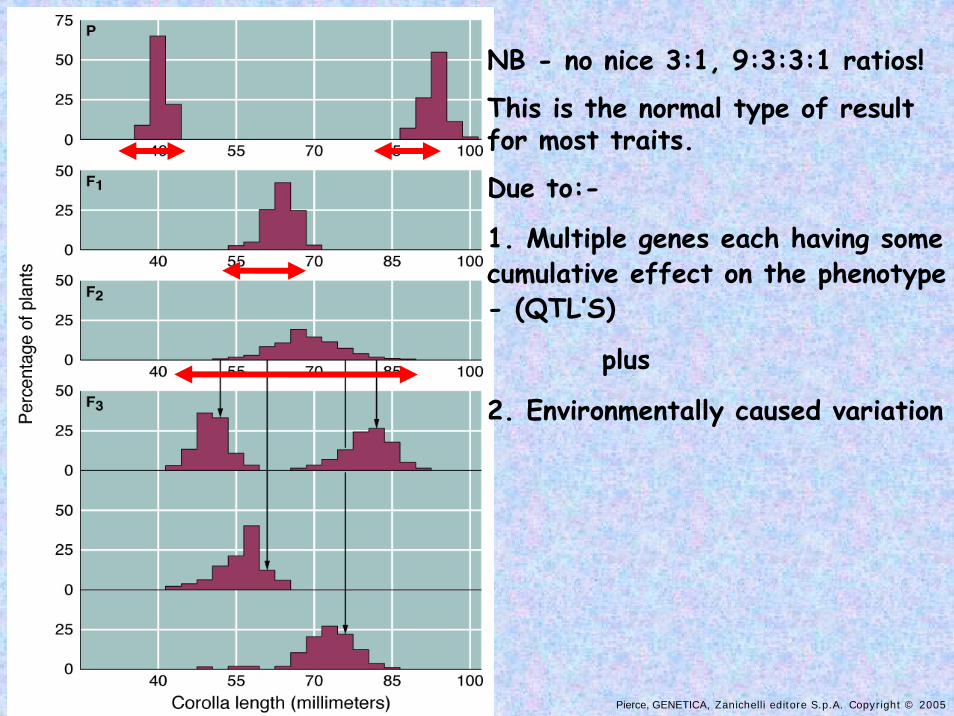
NB - no nice 3:1, 9:3:3:1 ratios!
This is the normal type of result for most traits.
Due to:-
1. Multiple genes each having some cumulative effect on the phenotype - (QTL’S)
plus
2. Environmentally caused variation
Pierce, GENETICA, Zanichelli editore S.p.A. Copyright © 2005
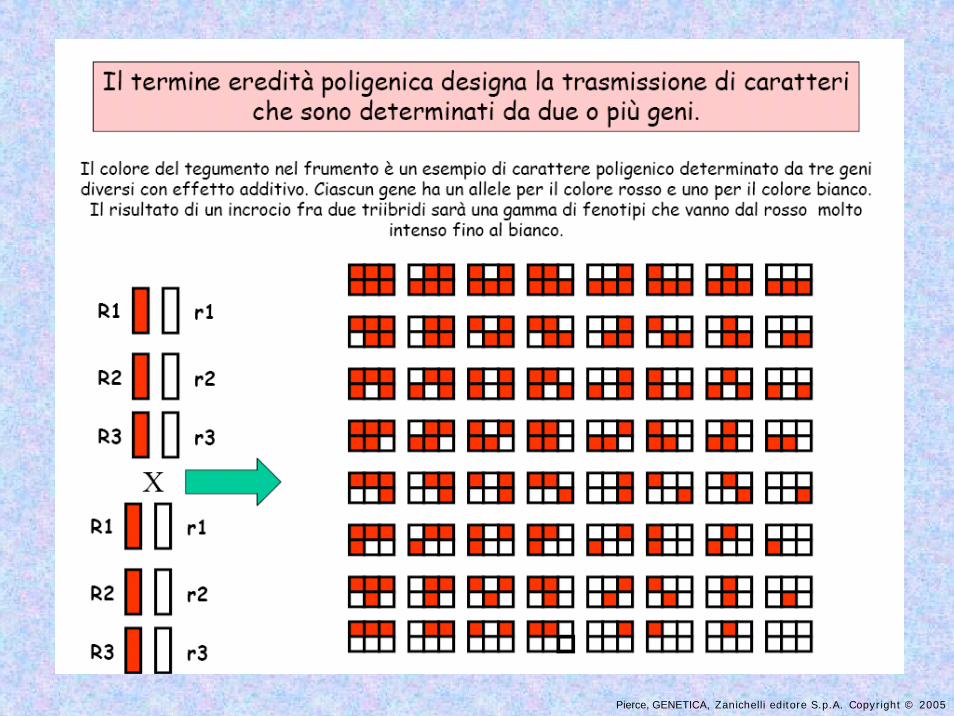
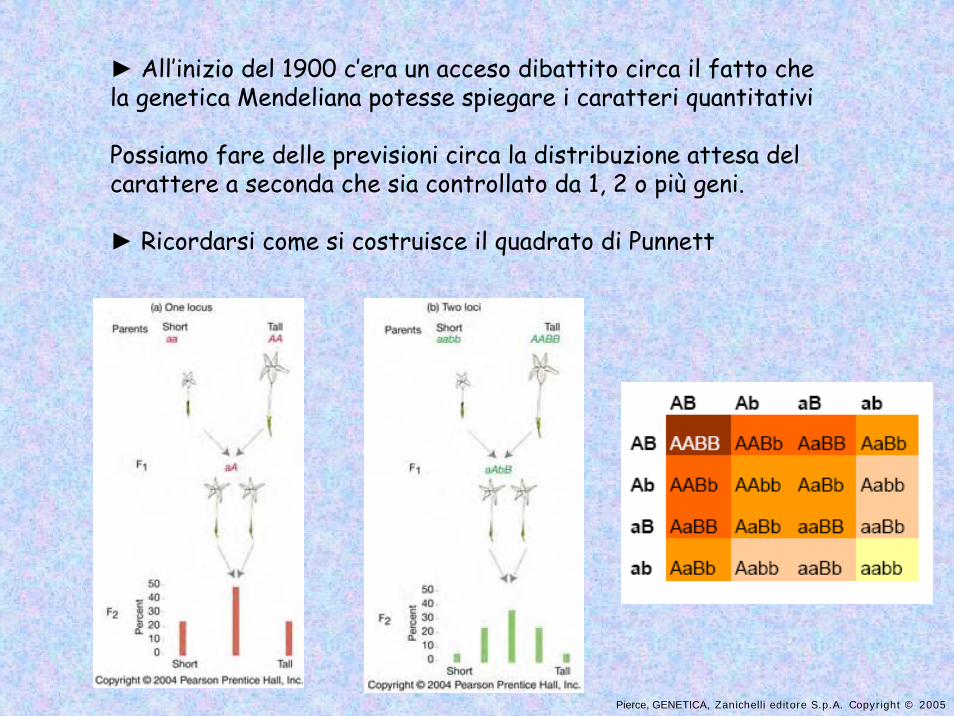
► All’inizio del 1900 c’era un acceso dibattito circa il fatto che la genetica Mendeliana potesse spiegare i caratteri quantitativi
Possiamo fare delle previsioni circa la distribuzione attesa delcarattere a seconda che sia controllato da 1, 2 o più geni.
► Ricordarsi come si costruisce il quadrato di Punnett
Pierce, GENETICA, Zanichelli editore S.p.A. Copyright © 2005
Pierce, GENETICA, Zanichelli editore S.p.A. Copyright © 2005
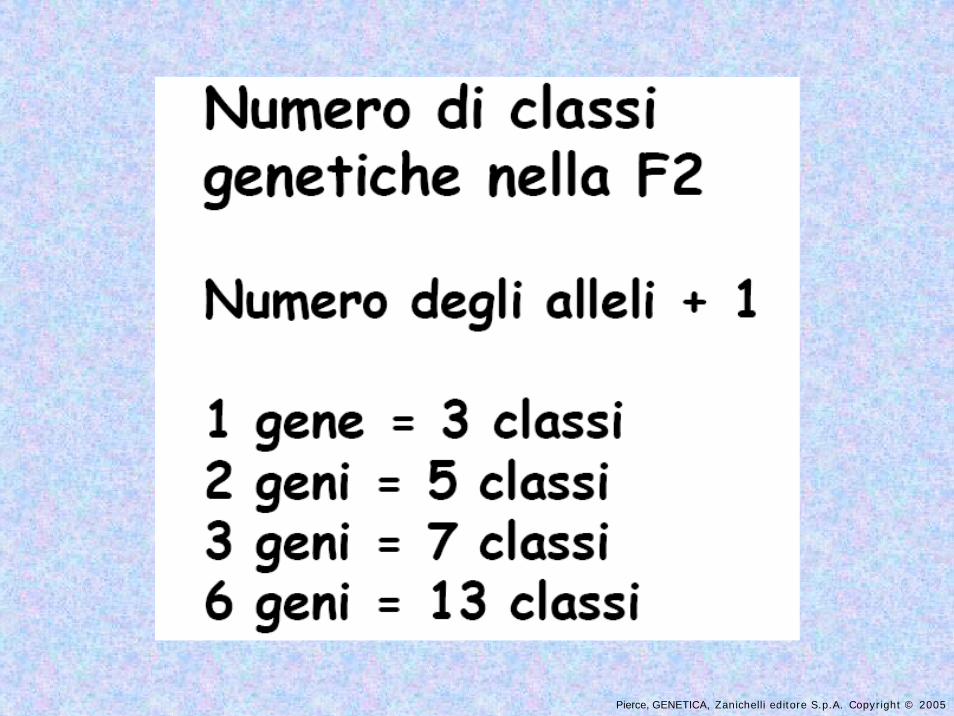
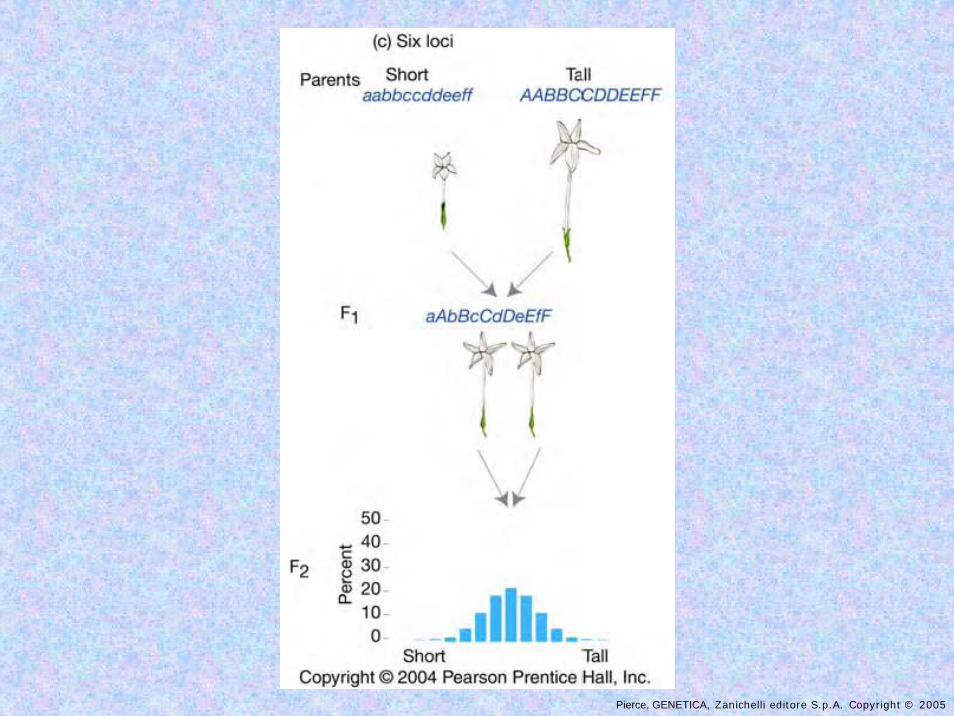
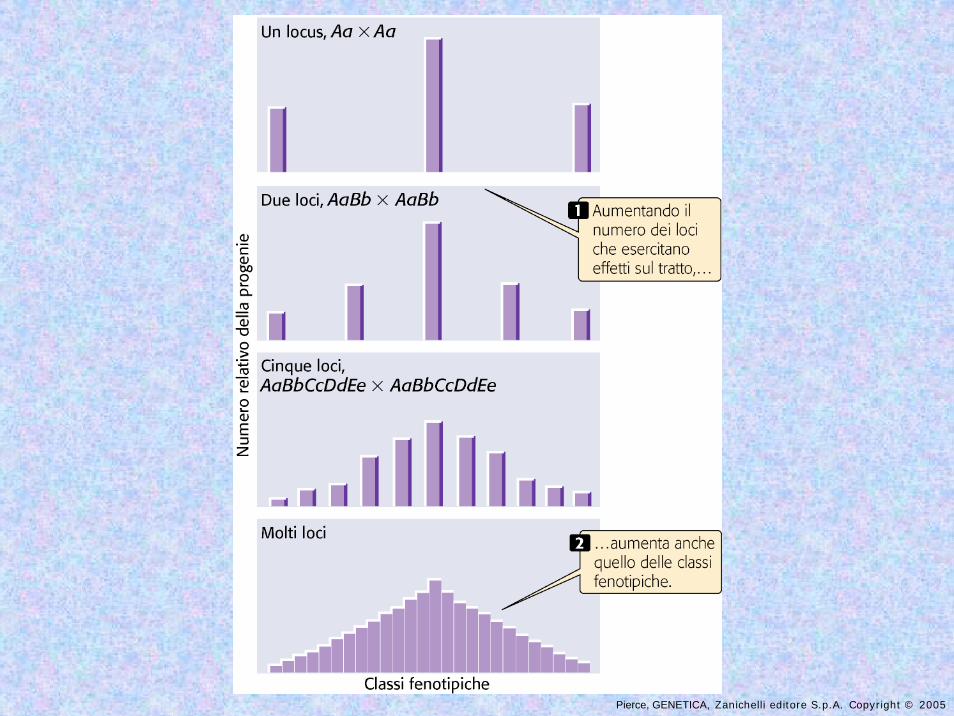
►A seconda del numero di geni, imodelli genetici predicono un numerodiverso di fenotipi
►Un gene: 3 fenotipi
►Due geni: 5 fenotipi
►Sei geni: 13 fenotipi
Pierce, GENETICA, Zanichelli editore S.p.A. Copyright © 2005
►Come si stabilisce se un caratterequantitativo è controllato da più geni?►Nel modello con uno o due geni moltiindividui della F2 hanno un fenotipouguale a quello parentale►Questo non succede nel caso delmodello con 6 loci. In questo casosolo 1 individuo su 4096 ha genotipoaabbccddeeff.
Pierce, GENETICA, Zanichelli editore S.p.A. Copyright © 2005
► Se il modello mendeliano è correttodovremmo essere in grado di ritornare alfenotipo parentale attraverso una selezionemirata► East in effetti riuscì a selezionare duepopolazioni di piante: una con petali cortied una con petali lunghi.► In 5 generazioni la maggior parte delle piante di queste due popolazioni avevano unalunghezza dei petali del tutto analoga a quella dei parentali
Pierce, GENETICA, Zanichelli editore S.p.A. Copyright © 2005
Pierce, GENETICA, Zanichelli editore S.p.A. Copyright © 2005
►Ovviamente le piante della generazione F5 non avevano corolle esattamente delle stessa dimensione dei parentali sebbene fosserogeneticamente identici
►Perchè?
Pierce, GENETICA, Zanichelli editore S.p.A. Copyright © 2005
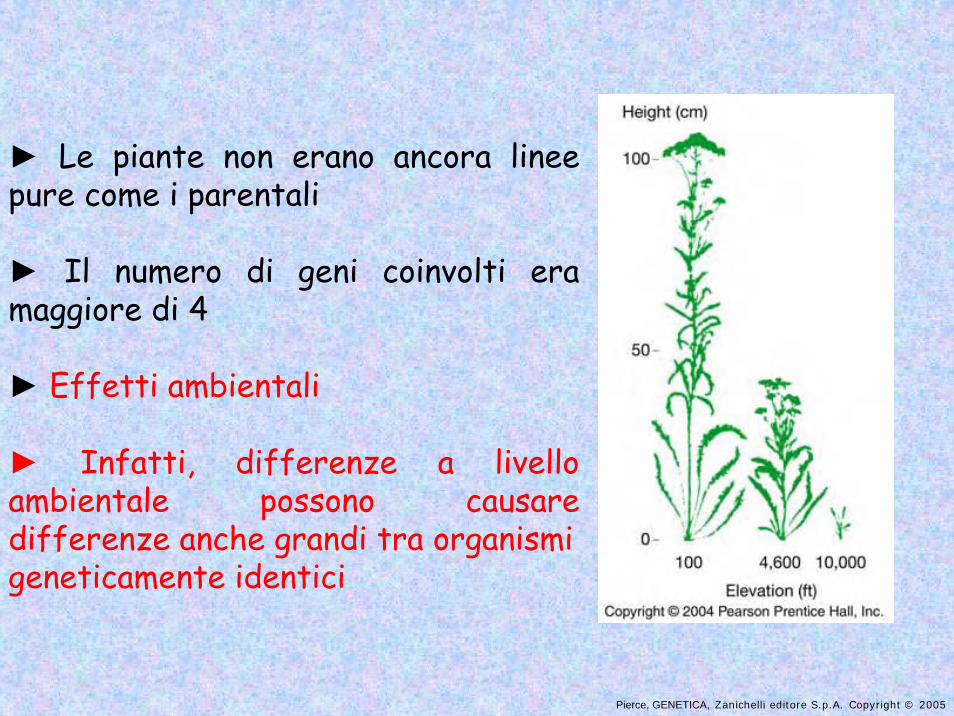
► Le piante non erano ancora linee pure come i parentali
► Il numero di geni coinvolti era maggiore di 4
► Effetti ambientali
► Infatti, differenze a livello ambientale possono causare differenze anche grandi tra organismigeneticamente identici
Pierce, GENETICA, Zanichelli editore S.p.A. Copyright © 2005
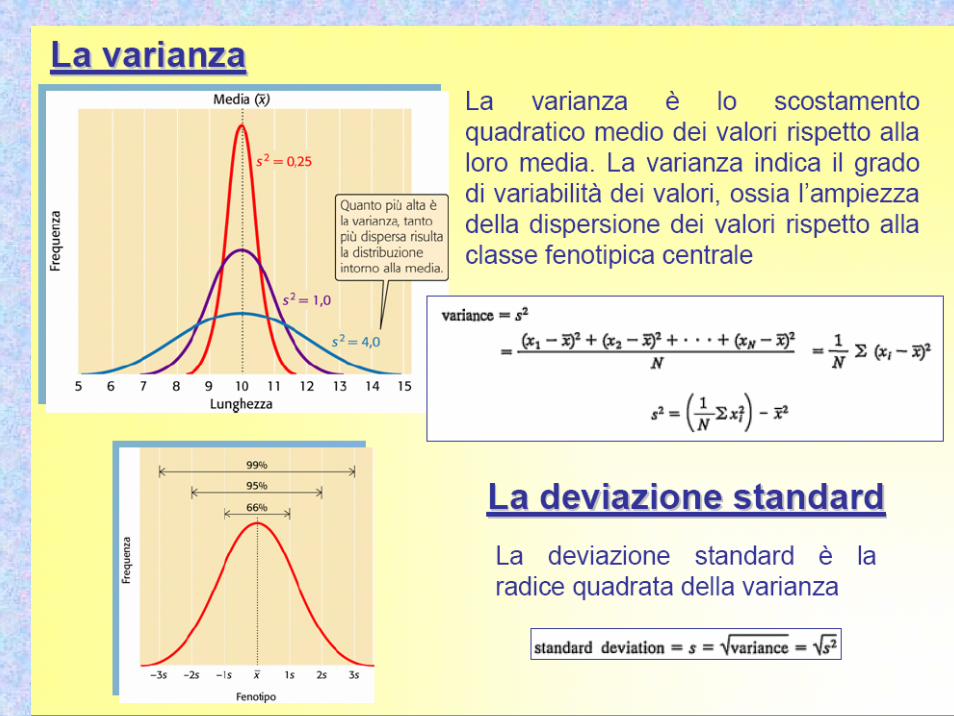
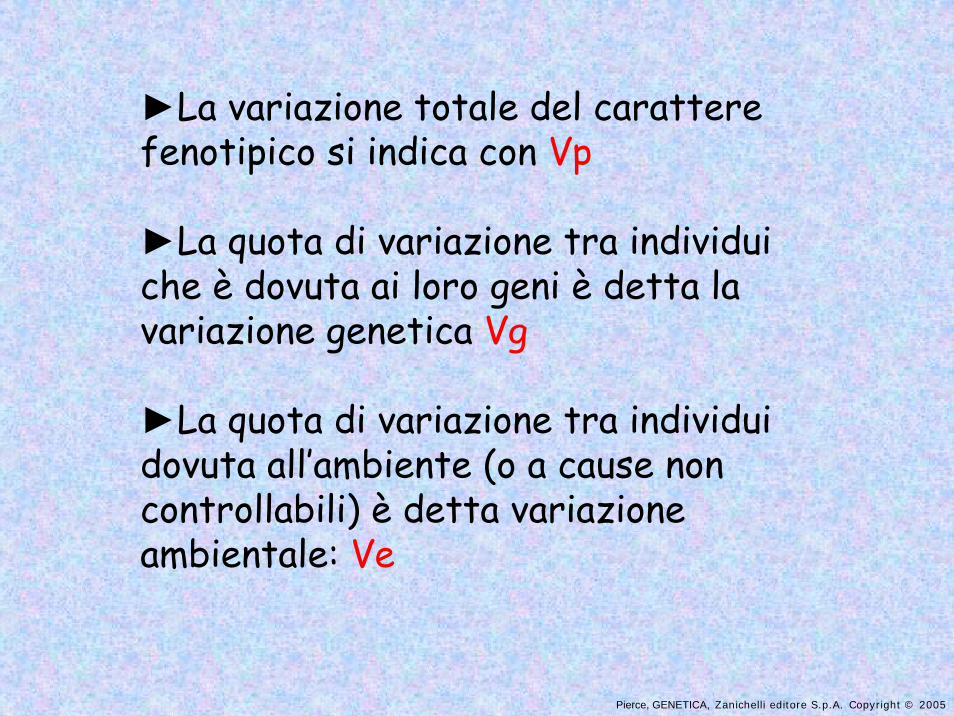
►La variazione totale del caratterefenotipico si indica con Vp
►La quota di variazione tra individuiche è dovuta ai loro geni è detta lavariazione genetica Vg
►La quota di variazione tra individuidovuta all’ambiente (o a cause noncontrollabili) è detta variazioneambientale: Ve
Pierce, GENETICA, Zanichelli editore S.p.A. Copyright © 2005
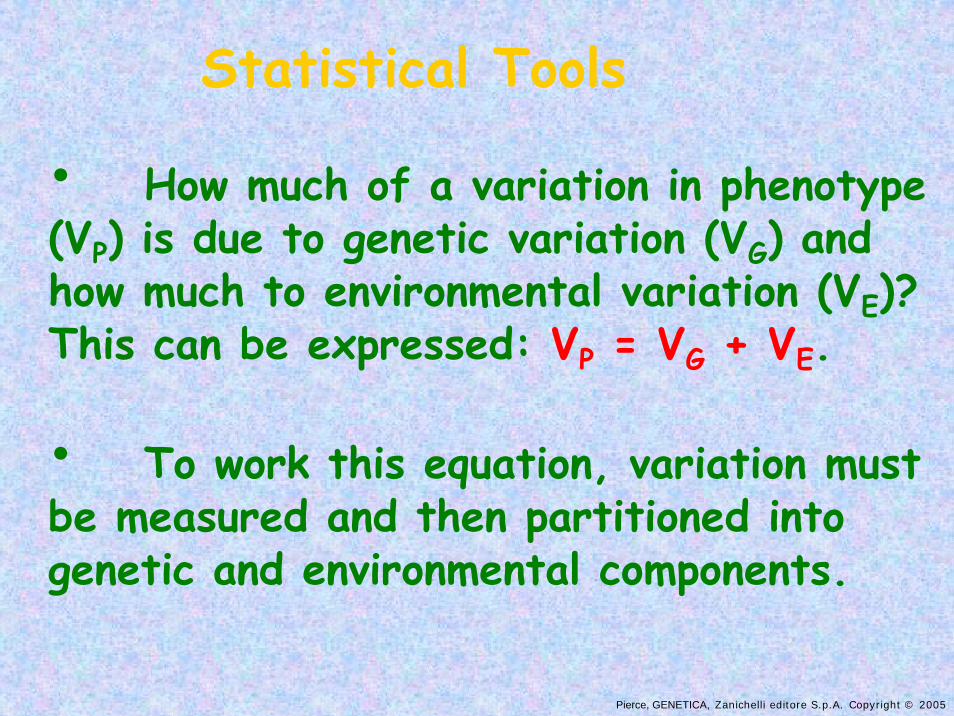
• How much of a variation in phenotype (VP) is due to genetic variation (VG) and how much to environmental variation (VE)? This can be expressed: VP = VG + VE.
• To work this equation, variation must be measured and then partitioned into genetic and environmental components.
Statistical Tools
Pierce, GENETICA, Zanichelli editore S.p.A. Copyright © 2005
Pierce, GENETICA, Zanichelli editore S.p.A. Copyright © 2005


![Glossario Di Genetica [Dispense Genetica Biologia]](https://static.fdocumenti.com/doc/165x107/5460bdb1af795949708b53b0/glossario-di-genetica-dispense-genetica-biologia.jpg)