Nicola Nicolai Screening - Over Group Provider ECM · Lo screening di popolazione per il carcinoma...
57
Lo screening di popolazione per il carcinoma della prostata Nicola Nicolai Urologia Fondazione IRCCS Istituto Nazionale Tumori Milano
Transcript of Nicola Nicolai Screening - Over Group Provider ECM · Lo screening di popolazione per il carcinoma...

Lo screening dipopolazione per il carcinoma della prostata
Nicola Nicolai
Urologia
Fondazione IRCCS Istituto Nazionale Tumori Milano

Criteri per l’applicazione dello screening
Criteri Applicazione per CaPMalattia frequente e con prognosi Sì. Primo tumore per incidenza, Malattia frequente e con prognosi severa
Sì. Primo tumore per incidenza, secondo per mortalità
Tests semplici di facile impiego in grado di far porre diagnosi in fasi di malattia precoci e asintomatiche
Sì. PSA
(DRE?)
Il trattamento della malattia in fasi più precoci comporta una riduzione della morbilità e mortalità
Probabile riduzione della mortalità
morbilità e mortalità Aumento della morbilità
Favorevole rapporto costo/beneficio: costo dell’esame, dei trattamenti, delle complicazioni
Non provato

Studi di screening per CaP
• Aspetti metodologici
• I biases legati all’applicazione dello screening• I biases legati all’applicazione dello screening
• I limiti del PSA
• Dati disponibili

Aspetti clinici e metodologici di un programma di
screening
Reclutamento coerente Periodo, età ed aree geografiche omogenee
Randomizzazione
e mascheramento
Non influenze sul gruppo di controllo:
Evitare “contaminazione” (che soggetti controle mascheramento Evitare “contaminazione” (che soggetti control
effettuino uno screening opportunistico)
Distorsione derivata
dalla tipologia della malattia
rilevata con lo screening
Lead bias e Length bias
Metodo diagnostico Frequenza, strumenti (DRE, PSA, n° bx)
Elevato numero di malattie
apparentemente o di fatto
meno aggressive
Entità del rilievo di malattie
nei periodi di intervallo (interval cancers)
Sovradiagnosi
(diagnosi di malattia che non
avrebbe condizionato la vita)
Sovratrattamento
(trattamento della malattia sovradiagnosticata:
Effetti collaterali da trattamento non giustificati)

Aspetti clinici e metodologici che condizionano
un programma di screeningReclutamento coerente Periodo, età ed aree geografiche omogenee
Randomizzazione
e mascheramento
Non influenze sui gruppi (selection bias)
Evitare “contaminazione” (che soggetti controle mascheramento Evitare “contaminazione” (che soggetti control
effettuino uno screening opportunistico)
Aggressività della malattiaLength bias e proporzione del numero di malattie
diagnosticate nei periodi di intervallo (interval cancers)
Prolungamento apparenteAnticipazione diagnostica (lead bias)
Metodo diagnostico Strumenti (DRE, PSA, n° bx) e frequenza (ogni quanto)
Prolungamento apparente
della storia naturaleAnticipazione diagnostica (lead bias)
Rischio di sovradiagnosi e quindi sovratrattamentoAumento delle diagnosi
NO � Effetto nullo dello screening
Riduzione della mortalità?SI � Effetto favorevole dello screening

Cancer death
Distant Mets
Lenght bias
Nodal Mets
ExtraorganExtent
OrganOrganConfined
Tumourinitation
Time
Interval btw screening

Cancer death
Distant Mets
Lenght bias
Nodal Mets
ExtraorganExtent
Organ
Area of curable diseases
OrganConfined
Tumourinitation
Time
Interval btw screening

Cancer death
Distant Mets
Lenght bias
INTERVAL
CANCER
Nodal Mets
ExtraorganExtent
Organ
Area of screen detectable
diseases
OrganConfined
Tumourinitation
Time
Interval btw screening

Screening tends to detect more slowly progressive cancer than aggressive ones

Length time bias
Zone of DIAGNOSTIC detection
Sotto screening è più facile fare diagnosi di malattie a storia clinica più lunga; le malattie più aggressive tendono a “scappare dalle maglie” dello screening

Lead time bias
Lo screening anticipa la diagnosi di malattia fornendo l’apparenza diintervalli di sopravvivenza più lunghi

Effetti dell’anticipazione diagnostica e della terapia
Diagnosi clinica di malattia Exitus da cause competitive
Exitus da malattia
Anticipazione diagnostica
Lead time
Effetto dei trattamenti
Diagnosi di malattia
Allo screening
Exitus da malattiaAllungamento a sinistra è lead time
In questo segmento ci sono le forme
meno aggressive


Studio
Screening CaP
Tipo, end point Tot
Screen/Control
Commenti
QuebecLabrie et Al.
R DSS 46486S 31133
Quebec city area (R 2:1)
q 1 anno; DRE-PSA-(TRUS)
Prostatic cancer: screening trials
Labrie et Al. Prostate
2004;59(3):311-8
S 31133
C15353q 1 anno; DRE-PSA-(TRUS)
Bx: sestanti ± mirateNorkoppingSandblom et Al. Eur Urol
2004;46:717-24
Non R non mascherato
DSS
9026S 1494 C7532
Norrköping (R 1:6)
q 3 anni; DRE (MMG e Urol, poi solo MMG per 2 rounds) e PSA (dopo)
Bx: sestanti
PCLO R 76693 10 centri USA (R 1:1)PCLOAndriole et Al. NEngl J Med
2009;360:1310-9.
R
mascherato
DSS
76693S 38343
C 38350
10 centri USA (R 1:1)
q 1 anno: PSA (per 6 a) + DRE (per 4 a)
ERSPCSchröder et Al. NEngl J Med
2009;360:1320-8.
R
mascherato
DSS
162243S 72890
C 89353
8 paesi europei (R 1:1)
q 4 anni; PSA
Bx: sestanti

22 settembre 2012, h. 10.00 – 13.00
Cfr tra screen Vs no screen
effettivo nei 2 bracci
(24%) (93%)
62% di riduzione di rischio
di morte

22 settembre 2012, h. 10.00 – 13.00Voci pOrgan Confined .001M1 .001HG <.005
20 (51.3%) scr
97 (56.7%) no
No difference in DSSNo difference in DSS
5.7%
3.9%

BMJ 2011;342:d1539
After 20 years of follow-up the rate of deathfrom prostate cancer did not differsignificantly between men in the screening group and those in the control group

22 settembre 2012, h. 10.00 – 13.00
Sistematic Screening

92% followed to 10 years
52% of contamination!Screening PSA/yr for 6 + DRE/yr for 4VsUsual Care
92% followed to 10 years57% followed to 13 years
J Natl Cancer Inst 2012;104:125–132
cumulative PCa mortality intervention arm: 3.7 x 10000 person/yearscontrol arm: 3.4 x 10000 person/years
non-statistically significant difference s (RR = 1.09, 95% CI = 0.87 to 1.36)No statistically significant interactions for age (P interaction = .81)
pretrial PSA testing (P interaction = .52)comorbidity (P interaction = .68).
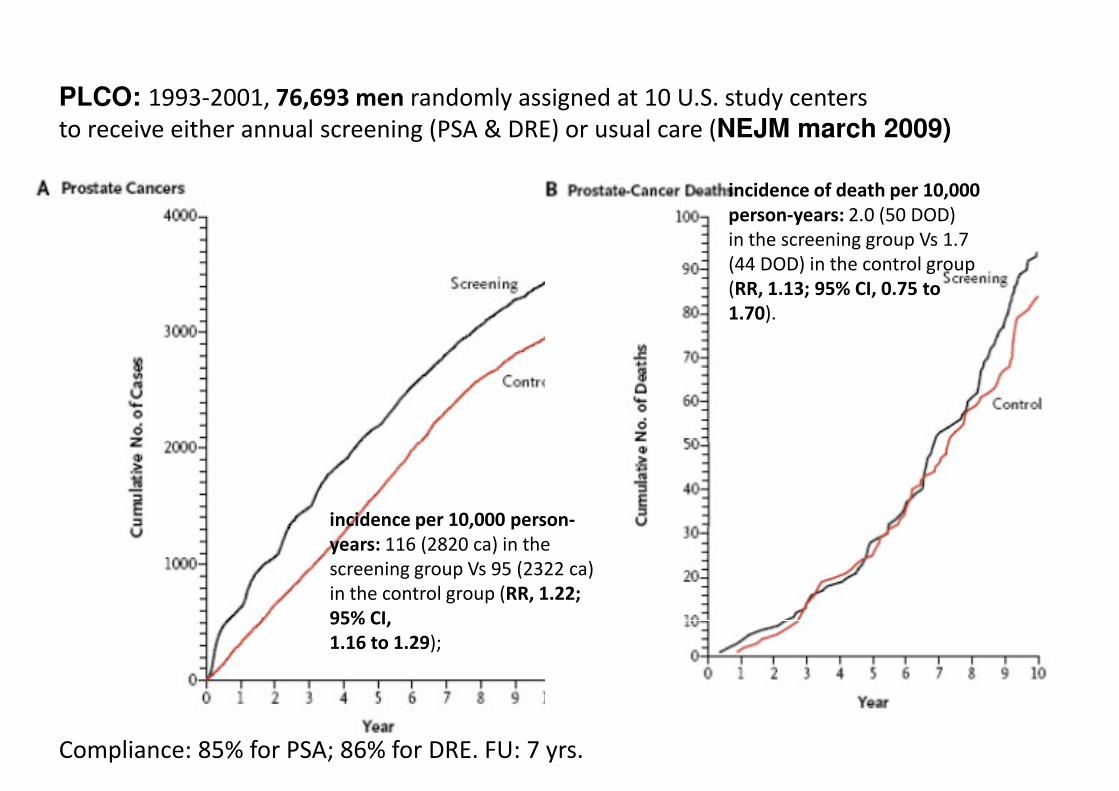
PLCO: 1993-2001, 76,693 men randomly assigned at 10 U.S. study centersto receive either annual screening (PSA & DRE) or usual care (NEJM march 2009)
incidence of death per 10,000
person-years: 2.0 (50 DOD) in the screening group Vs 1.7 (44 DOD) in the control group
incidence per 10,000 person-
(44 DOD) in the control group (RR, 1.13; 95% CI, 0.75 to
1.70).
Compliance: 85% for PSA; 86% for DRE. FU: 7 yrs.
incidence per 10,000 person-
years: 116 (2820 ca) in the screening group Vs 95 (2322 ca) in the control group (RR, 1.22;
95% CI,
1.16 to 1.29);

• ERSPC
• 182,000 men
• PSA screening every 4 yearsVs control
• Compliance: 82% accepted
• median FU: 9years
• cumulative incidence of prostate cancer was 8.2% in the screening group and 4.8% in the control group
• PLCO
• 76,693 men
• annual PSA testing for 6 years and DRE for 4 years Vs control
• Compliance: 85% PSA and 86% DRE
• Median FU: 7 years
• incidence rate ratio: 1.22 for screened arm (95% CI, 1.16 to 1.29) group and 4.8% in the control group
• rate ratio for death from PC in the screening group: 0.80 (95% CI, 0.65 to 0.98)
• The absolute risk difference: 0.71 death per 1000 men
• 1410 men would need to be screened and 48 additional cases of prostate cancer would need to be treated to prevent one death from prostate cancer
screened arm (95% CI, 1.16 to 1.29)• rate ratio for death from PC in the
screened group: 1.13; 95% (CI, 0.75 to 1.70)
• The data at 10 years were 67% complete and consistent with theseoverall findings
• Death from PC was very low and didnot differ significantly between the two study groups
prostate cancer• PSA-based screening reduced the
rate ofdeathfrom PC by 20% butassociatedwith a high risk of overdiagnosis

92% followed to 10 years
52% of contamination!Screening PSA/yr for 6 + DRE/yr for 4VsUsual Care
92% followed to 10 years57% followed to 13 years
J Natl Cancer Inst 2012;104:125–132
cumulative PCa mortality intervention arm: 3.7 x 10000 person/yearscontrol arm: 3.4 x 10000 person/years
non-statistically significant difference s (RR = 1.09, 95% CI = 0.87 to 1.36)No statistically significant interactions for age (P interaction = .81)
pretrial PSA testing (P interaction = .52)comorbidity (P interaction = .68).

7408 in the intervention group (SA)
The rate ratio (SA/CA)1·91 (95% CI 1·83–1·99) at 9 years, 1·66 (1·60–1·73) at 11 years, 1·57 (1·51–1·62) after 13 years.
rate ratio of PCa mortality0·85 (0·70–1·03) at 9 years0·78 (0·66–0·91) at 11 years,0·79 (0·69–0·91) at 13 years
absolute risk reduction at 13 yrs: 0·11 per 1000 person-yearsor 1·28 per 1000 men randomised� one PCa death averted per 781 men
invited for screening� one per 27 additional prostate cancer
7408 in the intervention group (SA)6107 in the control group (CA)
� one per 27 additional prostate cancerdetected
Rate ratio of PCa mortality in men screened was 0·73 (95% CI 0·61–0·88), after adjustment for non-participationwww.thelancet.com Published online August 7, 2014
http://dx.doi.org/10.1016/S0140-6736(14)60525-0

The main weakness of screening is a high rate of overdiagnosis and overtreatment.
We conclude that the time for population-based screening has notarrived.
www.thelancet.com Published online August 7, 2014
http://dx.doi.org/10.1016/S0140-6736(14)60525-0
In the present situation, earlydiagnosis cannot be refused to men who are well informed and requestto be tested.

ERSPC: NEJM march 2009

Lo screening opportunistico
• Lo screening effettuato individualmente
• È oramai talmente diffuso che surroga la condizione dello screening di massa

Fonte dati: Nsis - Flusso di specialistica ambulatoriale Art 50 (Legge 326/2003) – Anno 2011 e 2012
Totale popolazione ed esami eseguiti
Courtesy Dott. Massimo Gion

2011 2012
Tot. marcatori prescritti 13.693.468 13.207.289
PSA 6.340.326 6.205.532
Tot. CEA, CA125, CA19.9, CA15.3
5.779.421 5.834.167
AFP 1.010.223 964.768AFP 1.010.223 964.768
Altri (esoterici) 203.931 190.278
Courtesy Dott. Massimo Gion

2011 2012
PSA/1000 PSA/1000 abitanti PSA
PSA/1000 abitanti
abitanti PSA PSA/1000 abitanti
totale 28.730.886 6.340.326 221 28.871.641 6.205.532 215
età 45-75 10.868.443 6.340.326 583 11.050.960 6.205.532 562
Courtesy Dott. Massimo Gion

Incidenza*Incidenza* del del tumore della prostata tumore della prostata in Italia e per in Italia e per area area geograficageografica nel temponel tempo
100
120
Nord-ovest
Nord-est
40
60
80
100
Tass
i d
i in
cid
en
za s
tan
da
rdiz
zati
Centro
Sud
Italia
0
20
1960 1970 1980 1990 2000 2010 2020 2030
Tass
i d
i in
cid
en
za s
tan
da
rdiz
zati
Anni
* Tassi standardizzati per 100.000 persone/anno (popolazione standard europea), età 0-99 anni

Incidenza del tumore della prostata in Europa e nel mondo Incidenza del tumore della prostata in Europa e nel mondo nel tempo nel tempo -- tassi standardizzati (popolazione mondiale)tassi standardizzati (popolazione mondiale)
* Dati regionali
NORDCAN (www.ancr.nu)
ECO (eco.iarc.fr)
England: www.ons.gov.uk
CI5.iarc.fr
Australia: www.aihw.gov.au
New Zealand: www.health.govt.nz
USA: seer.cancer.gov


Prostatic cancer: general overview and specific findings
General overview
1 yr RS 95%5 yr RS 83%5 yrs CondS 88%
Specific findings
5-yr RS decreased with increasing age, 55–64 yrs � 90% 75-85 yrs � 77%> 85 yrs � 54%
Trama A et al EJC 2015:51;2206–2216

Prostatic cancer: geographic variations
> 90% age-standardised 5-year RS in non-eastern European patients (except: Denmark, (except: Denmark, 69%; Croatia 71%, Slovenia 74%).
72% 5-yrs RS forthose from Eastern Europe (Bulgaria, Europe (Bulgaria, 50%; except Lithuania 83%)

Prostatic cancer: survival trends
Survival improved from 73% to 82% �+ 18% in Eastern Europe +
11% in UK/Ireland and Northern Europe
+ 8% in Southern Europe
+ 6% in Central Europe
Trama A et al EJC 2015:51;2206–2216

Prostatic cancer: relationship btw age-std incidence and
age-std 5 RS
Incidence is
correlated with
RS (R: 0.74)
In almost all
countries
incidence and 5
yr RS increase
In Italy, Germany,
Finland, Austria,
Switzerland, Switzerland,
incidence in the
3rd trienniium
decreased, while
RS still increased
Trama A et al EJC 2015:51;2206–2216

Prostatic cancer: analysis
PCA incidence increased
since the early 1900 as
a consequence of PSA
testing diffusion which
UStesting diffusion which
is followed by a
reduction
Mortality is slightly
decreasing
60
80
100
120
Tass
i d
i in
cid
en
za
sta
nd
ard
izza
ti
30
40
50
60
70
80
90
100
Ta
ssi
sta
nd
ard
izza
ti
pe
r 1
00
.00
0
(po
p.
Eu
ro
pe
a)
Ita
0
20
40
1960 1980 2000 2020 2040
Tass
i d
i in
cid
en
za
sta
nd
ard
izza
ti
Anni
Nord-ovest
Nord-est
Centro
* Tassi standardizzati per 100.000 persone/anno (popolazione standard
europea), età 0-99 anni
0
10
20
19
70
19
72
19
74
19
76
19
78
19
80
19
82
19
84
19
86
19
88
19
90
19
92
19
94
19
96
19
98
20
00
20
02
20
04
20
06
20
08
20
10
20
12
20
14
Ta
ssi
sta
nd
ard
izza
ti
pe
r 1
00
.00
0
(po
p.
Eu
ro
pe
a)
anno di calendario
incidenza mortalità
Fonte: Rossi et al; Estimates of cancer burden in Italy, Tumori 2013; 99: 416-424
Ita
Courtesy Dr. A. Trama

80
100
120
Tass
i d
i in
cid
en
za s
tan
da
rdiz
zati
60
70
80
90
100
Ta
ssi
sta
nd
ard
izza
ti
pe
r 1
00
.00
0
Prostate Prostate ccancerancer iincidencencidence and and mortalitymortalityestimatesestimates in Italyin Italy
PSA made the difference!
0
20
40
60
1960 1970 1980 1990 2000 2010 2020 2030
Tass
i d
i in
cid
en
za s
tan
da
rdiz
zati
Anni
Nord-ovest
Nord-est
Centro
Sud
* Standardised rates per 100.000 persons/year
0
10
20
30
40
50
60
19
70
19
72
19
74
19
76
19
78
19
80
19
82
19
84
19
86
19
88
19
90
19
92
19
94
19
96
19
98
20
00
20
02
20
04
20
06
20
08
20
10
20
12
20
14
Ta
ssi
sta
nd
ard
izza
ti
pe
r 1
00
.00
0
(po
p.
Eu
rop
ea
)
anno di calendario
incidenza mortalità
Rossi et al; Estimates of cancer burden in Italy, Tumori 2013; 99: 416-424* Standardised rates per 100.000 persons/year(standard european population), age 0-99 years
Rossi et al; Estimates of cancer burden in Italy, Tumori 2013; 99: 416-424
New cases DOD Prevalent cases
1990 12,295 5,567 36,307
2020 32,661 7,155 347,554
STIME project analysis (courtesy Dr. A. Trama)

22 settembre 2012, h. 10.00 – 13.00
Carcinoma della prostata in Italia
NUMERO DI CASI
anno morti casi incidenti casi prevalenti
1990 5660 12600 36500
1999 6960 25900 93500
2005 9200 43000 1740002005 9200 43000 174000
Fonte: stime MIAMOD, ISS, Roma

22 settembre 2012, h. 10.00 – 13.00
NUMERO DI CASI
Ca di Polmone e di Prostata in Italia
(proiezioni al 2005)(proiezioni al 2005)
tumore morti casi incidenti casi prevalenti
prostata 9200 44000 174000
polmone 22000 26000 55000polmone 22000 26000 55000
Fonte: stime MIAMOD, ISS, Roma

Stime di incidenza e mortalità Stime di incidenza e mortalità per tumore della prostata in Italiaper tumore della prostata in Italia
40
50
60
70
80
90
100
Tass
i st
and
ard
izza
ti p
er
10
0.0
00
(po
p. E
uro
pe
a)
0
10
20
30
40
1970
1972
1974
1976
1978
1980
1982
1984
1986
1988
1990
1992
1994
1996
1998
2000
2002
2004
2006
2008
2010
2012
2014Ta
ssi
stan
dar
diz
zati
pe
r 1
00
.00
0
(po
p. E
uro
pe
a)
anno di calendario
incidenza mortalità
15,00
20,00
25,00
Nord-ovest
Nord-est
0,00
5,00
10,00
1960 1980 2000 2020 2040Anni
Nord-est
Centro
Sud
Italia
Courtesy Dott. Annalisa Trama

Il progetto “Prostate Il progetto “Prostate cancercancer survivalsurvival patientspatients in Italyin Italy”
Obiettivi:Obiettivi:
• descrivere le pratiche diagnostico-terapeutiche per il tumore della prostata nella popolazione italiana e nel tempo (1996-1999 vs 2005-2007)
• analizzare ed interpretare la diversa sopravvivenza • analizzare ed interpretare la diversa sopravvivenza per tumore della prostata in alcune popolazioni residenti in diverse regioni italiane
Courtesy Dott. Annalisa Trama

Incidenza*Incidenza* del del tumore della prostata tumore della prostata in Italia e per in Italia e per area area geograficageografica nel temponel tempo
100
120
Nord-ovest
Nord-est
40
60
80
100
Tass
i d
i in
cid
en
za s
tan
da
rdiz
zati
Centro
Sud
Italia
0
20
1960 1970 1980 1990 2000 2010 2020 2030
Tass
i d
i in
cid
en
za s
tan
da
rdiz
zati
Anni
* Tassi standardizzati per 100.000 persone/anno (popolazione standard europea), età 0-99 anni
Courtesy Dott. Annalisa Trama

AnalisiAnalisi e e RegistriRegistri coinvolticoinvolti
100
120
Tass
i d
i in
cid
en
za
Nord-ovest
0
20
40
60
80
1960 1970 1980 1990 2000 2010 2020 2030
Tass
i d
i in
cid
en
za
sta
nd
ard
izza
ti
Anni
ovest
Courtesy Dott. Annalisa Trama

ClasseClasse di di rischiorischio allaalla diagnosidiagnosi: 1996: 1996--1999 1999 vsvs 20052005--2007 2007
1996-1999 2005-2007Classe di rischio
1996-1999 2005-2007
No % No %
bassa 338 16 830 34
intermedia 387 18 626 26
alta 997 47 807 33alta 997 47 807 33
non nota 418 19 175 7
Totale 2,140 100 2,438 100
Courtesy Dott. Annalisa Trama

Classe di rischio per età (< 75 vs Classe di rischio per età (< 75 vs ≥75≥75 anni) per anni) per periodoperiodo
1996-1999 2005-2007
<75 ≥75 Total <75 ≥75 Total<75 ≥75 Totalbassa 236 103 339
% 19 12 16
intermedia 264 130 394
% 21 15 18alta 558 442 1,000
% 44 50 47non noto 206 201 407
<75 ≥75 Total
bassa 597 233 830
% 40 25 34
intermedia 386 253 639
% 26 27 26
alta 412 382 794
% 27 41 33
non noto 112 63 175non noto 206 201 407% 16 23 19Total 1,264 876 2,140
% 100 100 100
non noto 112 63 175
% 7 7 7
Total 1,507 931 2,438
% 100 100 100
Courtesy Dott. Annalisa Trama

PSA alla diagnosiPSA alla diagnosi
1996-1999 2005-2007
No. % No. %No. % No. %
<6 155 13 472 26
6-10 175 15 487 2710-20 254 22 428 23
>20 565 49 451 25>20 565 49 451 25Total 1149 100 1838 100
Courtesy Dott. Annalisa Trama

GleasonGleason score alla biopsiascore alla biopsia
1996-1999 2005-2007
No. % No. %No. % No. %
2 28 3 12 1
3 60 5 20 1
4 110 10 80 4
5 209 19 312 17
6 220 20 603 34
7 281 25 512 28
8 113 10 161 98 113 10 161 9
9 76 7 84 5
10 19 2 14 1
Total 1116 100 1798 100
Courtesy Dott. Annalisa Trama

1
1,2
Classe di rischio bassa
1996- 1
1,2
Classe di rischio intermedia
Sopravvivenza relativa a 5 e 10 anni, per periodo e classe di Sopravvivenza relativa a 5 e 10 anni, per periodo e classe di rischiorischio
Courtesy Dott. Annalisa Trama
1Metastatici
1
Classe di rischio alta *
0
0,2
0,4
0,6
0,8
1
0 1 2 3 4 5 6 7 8 9
1996-1999
2005-2007
0
0,2
0,4
0,6
0,8
1
0 1 2 3 4 5 6 7 8 9
0
0,2
0,4
0,6
0,8
0 1 2 3 4 5 6 7 8 9
0
0,2
0,4
0,6
0,8
0 1 2 3 4 5 6 7 8 9
*statisticamente significativa

22 settembre 2012, h. 10.00 – 13.00
“Prostate cancer is a serious health problem that affects thousands of men and their families. But before getting a PSA test, all men deserve to know what the science tells us about PSA screening: there is a very small potential benefit and significant potential harms. Weencourage clinicians to consider this evidence and not screen their patients with a PSA test unless the individual being screened understands what is known about PSA screening and makes the personal decision that even a small possibility of benefit outweighs the known risk
May 22nd 2012
makes the personal decision that even a small possibility of benefit outweighs the known risk of harms.” Based on this work, the Task Force concludes that many men are harmed as a result of
prostate cancer screening and few, if any, benefit.A better test and better treatment options
are needed. Until these are available, the USPSTF has recommended against
screening for prostate cancer.

1. No < 40 anni1. No < 40 anni
2. Not recommended 40-54
but high risk
3. Individualized 55-69
4. Every 2 yrs4. Every 2 yrs
5. Not recommended > 70
but excellent health

There is currently no evidence for introducing widespread
population-based screening programmes for early PCa
detection in all men [8] (LE: 2).

ScreeningScreening e PSAe PSAChe fare di fronte ad una richiesta individuale di un
soggetto asintomatico?
Fattori di rischio IndividuoMMG e specialistaFattori di rischio
Familiarità ed etàRisk Calculators
IndividuoMMG e specialista
MotivazioneInformazione
Screening

Come comportarsi?Medico
• Considerare il paziente – Morbilità e attesa di vita
Paziente
• Approccio deliberativo e – Morbilità e attesa di vita
• Considerare rischio di malattia ad alto grado– Se il rischio è < 5%, valutare i rischi della procedura
(es: rischio infezione severa (US) è tra 2 e 4%
• Considerare il rapporto tra rischio di malattia a basso grado e di malattia ad alto grado– Se il rapporto è nettamente sfavorevole (es: 10
volte maggiore la p di basso rischio), valutare l’impatto negativo sulla vita del paziente di tale
deliberativo e multidisciplinare
• Enpowerment
del pz
• Decisione che rispetta la persona e la sua
l’impatto negativo sulla vita del paziente di tale diagnosi (costi, rischi di overtreatment, spese assicurative)
persona e la sua volontà