Corso di Laurea in Ingegneria Gestionale -...
31
THE THE BOSTON CONSULTING GROUP BOSTON CONSULTING GROUP UNIVERSITÀ UNIVERSITÀ DI DI GENOVA GENOVA Corso di Laurea in Ingegneria Gestionale Corso di Laurea in Ingegneria Gestionale 31 Gennaio 2003 31 Gennaio 2003
Transcript of Corso di Laurea in Ingegneria Gestionale -...
THE THE BOSTON CONSULTING GROUPBOSTON CONSULTING GROUPUNIVERSITÀUNIVERSITÀ DI DI GENOVAGENOVA
Corso di Laurea in Ingegneria GestionaleCorso di Laurea in Ingegneria Gestionale
31 Gennaio 200331 Gennaio 2003

Experience curve e la Experience curve e la matrice BCGmatrice BCG
-2-UniGenova-January2003
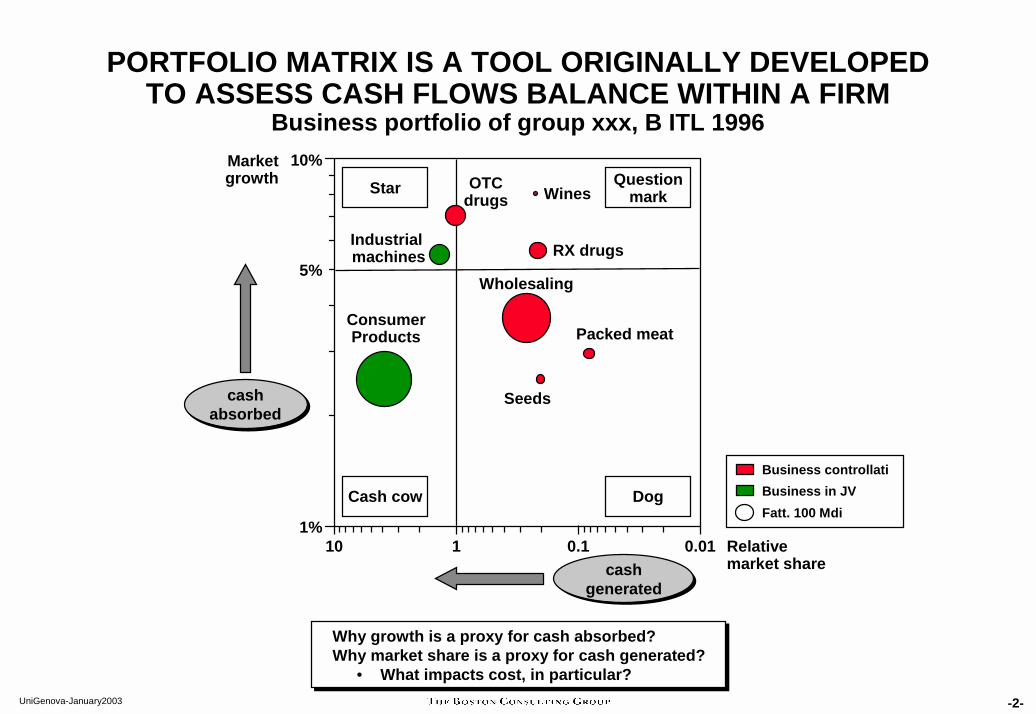
PORTFOLIO MATRIX IS A TOOL ORIGINALLY DEVELOPED TO ASSESS CASH FLOWS BALANCE WITHIN A FIRM
Business portfolio of group xxx, B ITL 1996
Why growth is a proxy for cash absorbed? Why market share is a proxy for cash generated?
• What impacts cost, in particular?
Why growth is a proxy for cash absorbed? Why market share is a proxy for cash generated?
• What impacts cost, in particular?
1%
10%
10 1 0.1 0.01
ConsumerProducts
OTCdrugs
RX drugs
Wholesaling
Seeds
Wines
Packed meat
Industrial machines
Market growth
Relative market share
Star Questionmark
Cash cow Dog
5%
Fatt. 100 Mdi
Business controllatiBusiness in JV
cashabsorbed
cashabsorbed
cashgenerated
cashgenerated
-3-UniGenova-January2003
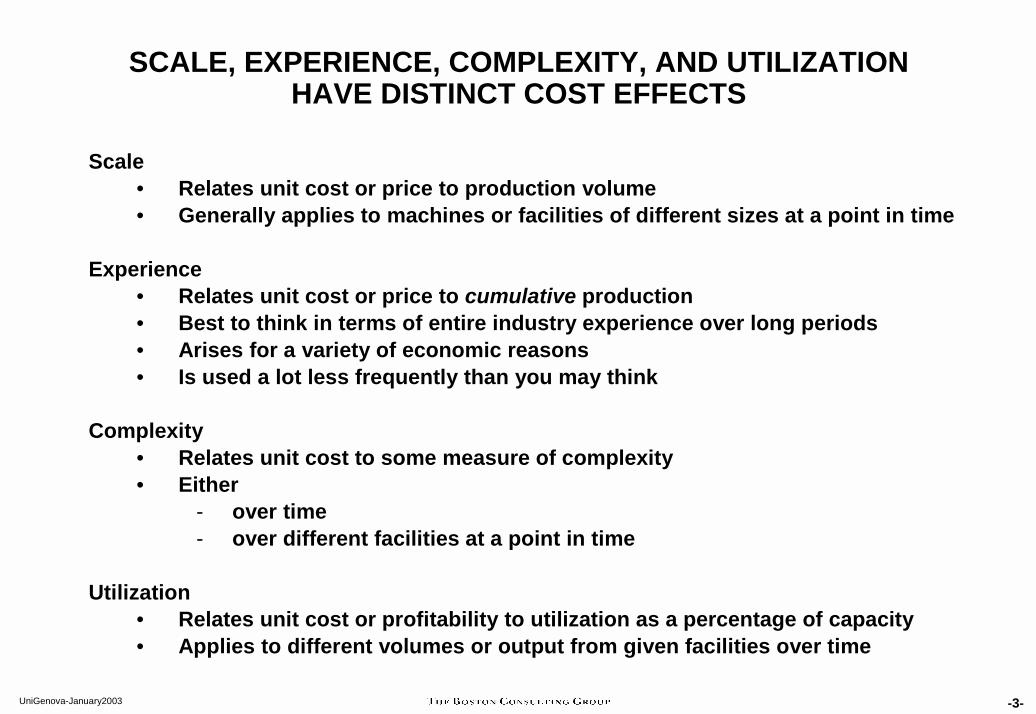
SCALE, EXPERIENCE, COMPLEXITY, AND UTILIZATIONHAVE DISTINCT COST EFFECTS
Scale• Relates unit cost or price to production volume• Generally applies to machines or facilities of different sizes at a point in time
Experience• Relates unit cost or price to cumulative production• Best to think in terms of entire industry experience over long periods• Arises for a variety of economic reasons• Is used a lot less frequently than you may think
Complexity• Relates unit cost to some measure of complexity• Either
- over time- over different facilities at a point in time
Utilization• Relates unit cost or profitability to utilization as a percentage of capacity• Applies to different volumes or output from given facilities over time

-4-UniGenova-January2003
SOMETIMES UNIT COSTS HAVE A “CONSTANT ELASTICITY”
y
x
log y
log x
Which examples follow this behaviour?• Under which circumstances?
Which examples follow this behaviour?• Under which circumstances?
-5-UniGenova-January2003
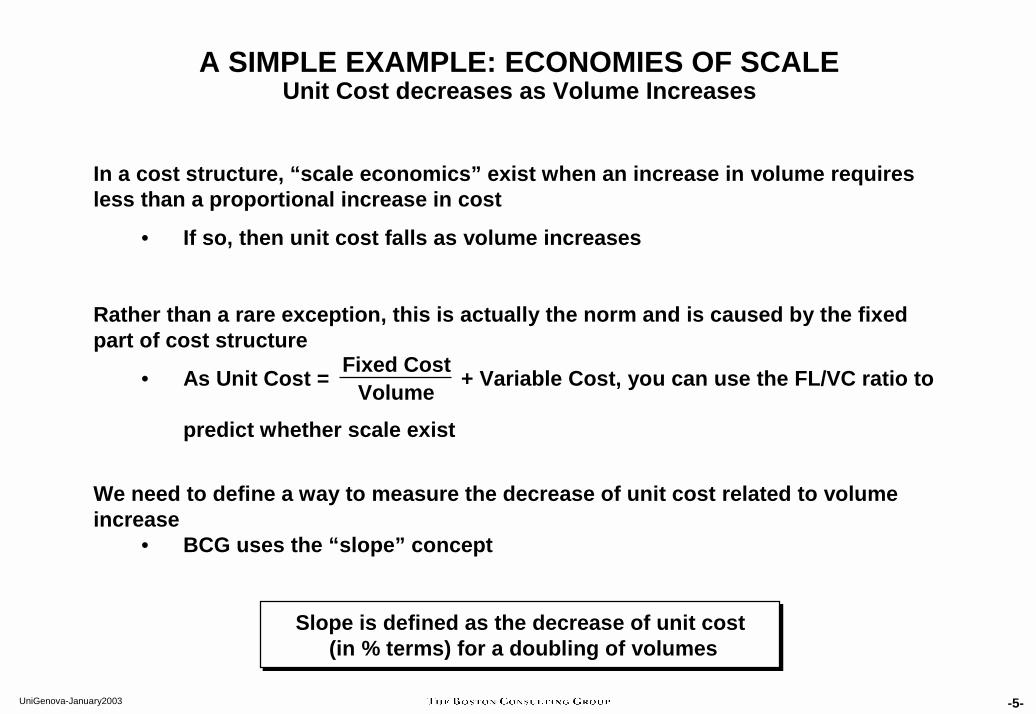
A SIMPLE EXAMPLE: ECONOMIES OF SCALEUnit Cost decreases as Volume Increases
In a cost structure, “scale economics” exist when an increase in volume requires less than a proportional increase in cost
• If so, then unit cost falls as volume increases
Rather than a rare exception, this is actually the norm and is caused by the fixed part of cost structure
• As Unit Cost = + Variable Cost, you can use the FL/VC ratio to
predict whether scale exist
We need to define a way to measure the decrease of unit cost related to volume increase
• BCG uses the “slope” concept
Volume
Slope is defined as the decrease of unit cost(in % terms) for a doubling of volumes
Slope is defined as the decrease of unit cost(in % terms) for a doubling of volumes
Fixed Cost
BCGBCG slopeslope

-7-UniGenova-January2003
BCG SLOPE IS DEFINED AS THE NEW UNIT COSTAT EVERY DOUBLING OF THE VOLUME
( ) ( )Volumelogcoslog ·+= batunit
log Unit Cost
log Volumelog(old volume)
log(2* old volume)
log (old cost)
log (slope* old cost)
b2slope=
2log=log slope
b
12
12logloglog
--
= VVUCLogUC
b
-8-UniGenova-January2003
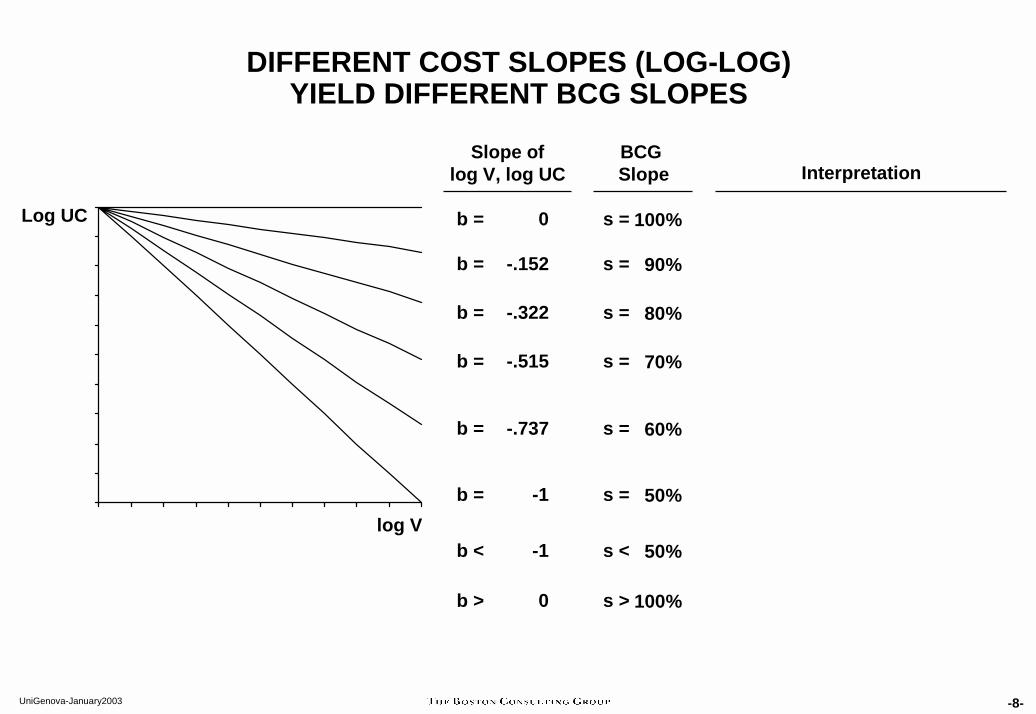
DIFFERENT COST SLOPES (LOG-LOG)YIELD DIFFERENT BCG SLOPES
InterpretationBCGSlope
100%
90%
80%
70%
60%
50%
50%
100%
s =
s >
s <
s =
s =
s =
s =
s =
Slope oflog V, log UC
0
-.152
0
-.322
-.515
-.737
-1
-1
b =
b >
b <
b =
b =
b =
b =
b =log V
Log UC
-9-UniGenova-January2003
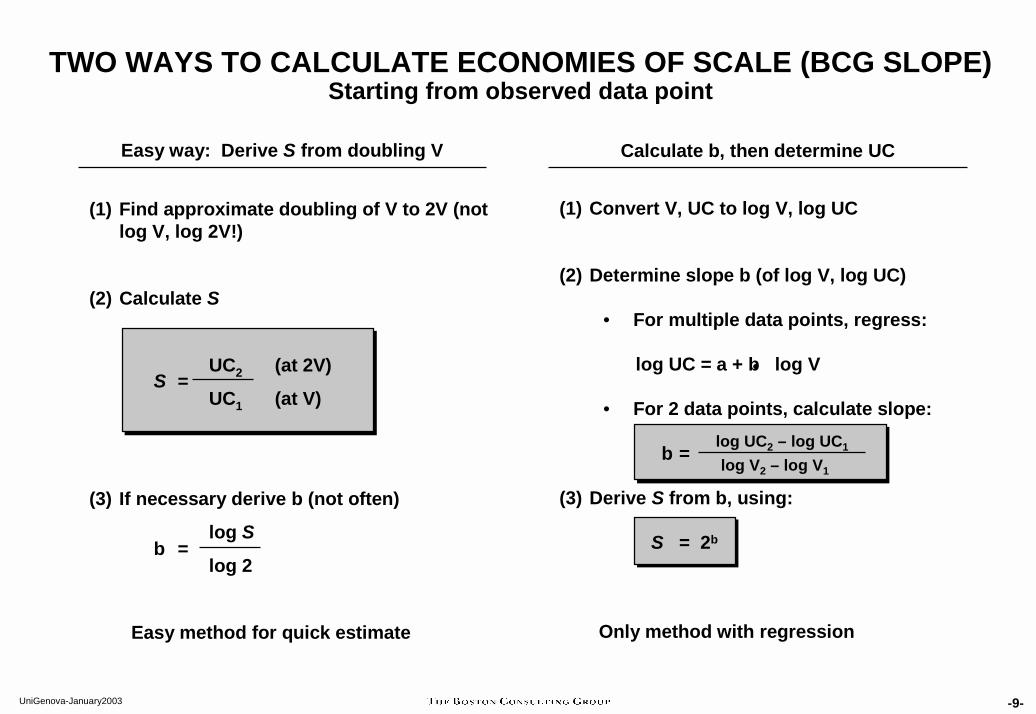
TWO WAYS TO CALCULATE ECONOMIES OF SCALE (BCG SLOPE) Starting from observed data point
(1) Find approximate doubling of V to 2V (not log V, log 2V!)
(2) Calculate S
UC2 (at 2V)
UC1 (at V)
(3) If necessary derive b (not often)
log S
log 2
Easy method for quick estimate
Easy way: Derive S from doubling V Calculate b, then determine UC
b =
S =
(1) Convert V, UC to log V, log UC
(2) Determine slope b (of log V, log UC)
• For multiple data points, regress:
log UC = a + b log V
• For 2 data points, calculate slope:
b =
(3) Derive S from b, using:
S = 2b
Only method with regression
log UC2 – log UC1
log V2 – log V1
•
-10-UniGenova-January2003
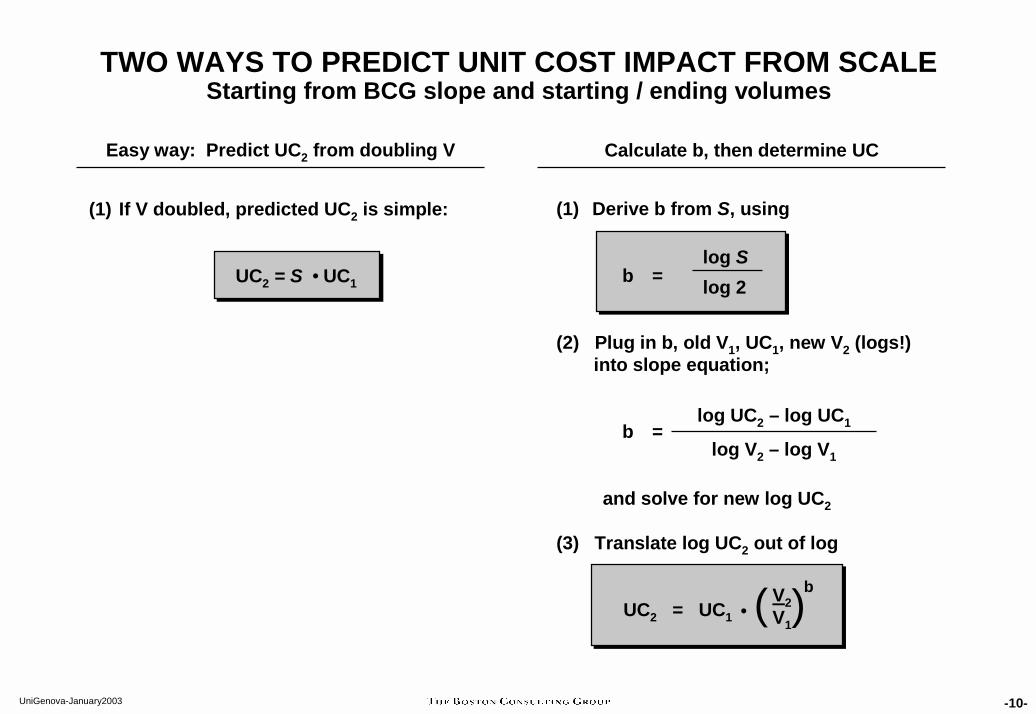
TWO WAYS TO PREDICT UNIT COST IMPACT FROM SCALEStarting from BCG slope and starting / ending volumes
(1) If V doubled, predicted UC2 is simple:
UC2 = S UC1
(1) Derive b from S, using
b =
(2) Plug in b, old V1, UC1, new V2 (logs!)into slope equation;
b =
and solve for new log UC2
(3) Translate log UC2 out of log
UC2 = UC1
Easy way: Predict UC2 from doubling V Calculate b, then determine UC
log Slog 2
log UC2 – log UC1
log V2 – log V1
( (V2V1
b•
•
-11-UniGenova-January2003
AN APPLICATION OF SCALE ANALYSIS
Problem: You are reviewing the 3-year business plan of a Telco operator
They are aiming at move from a target of 120 000 customer for next year, to 900 000 the year after and reach a total of 1.8m in the third
The Marketing director, asked to project customer acquisition costs over the entire period, expects them to half
The Sales director thinks he is crazy
ExerciseExercise
-12-UniGenova-January2003
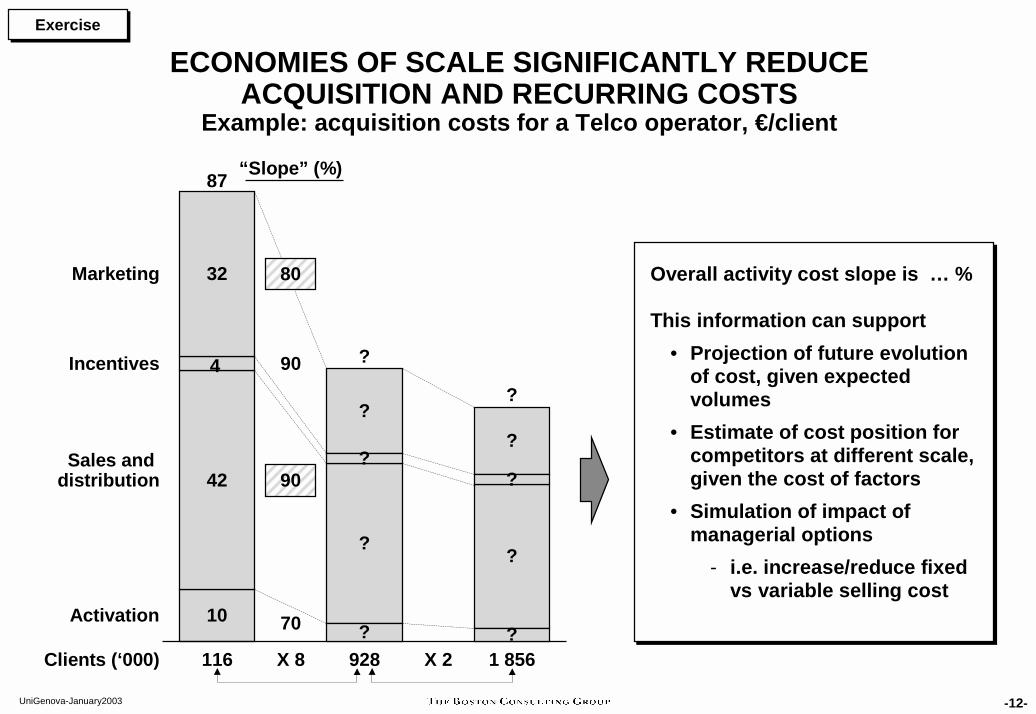
ECONOMIES OF SCALE SIGNIFICANTLY REDUCE ACQUISITION AND RECURRING COSTS
Example: acquisition costs for a Telco operator, €/client
ExerciseExercise
10
42
32
Activation
Sales and distribution
Incentives
Marketing
70
90
87
?
?
X 2Clients (‘000) X 8116 1 856928
90
80
?
?
?
?
?
??
“Slope” (%)
?
Overall activity cost slope is … %
This information can support• Projection of future evolution
of cost, given expected volumes
• Estimate of cost position for competitors at different scale, given the cost of factors
• Simulation of impact of managerial options
- i.e. increase/reduce fixedvs variable selling cost
4

-13-UniGenova-January2003
WARNING: WHEN LOOKING FOR SCALE, LOOK THE RIGHT WAYFind the meaningful scale relation
Illustration: tissue manufacturing
No economies of scale ?No economies of scale ? Sure, but only by machine sizeSure, but only by machine size
•
•
•
•
•
•
P1
P2
P3
P6
P4
P5
Costper ton
($/t)
Plant size000 tonn/ year
Costper ton
($/t)
Machine size000 ton/ year
•
• •
••
•
P6
P1 P3
P4
P2
P5
Px : plant x

-14-UniGenova-January2003
DOES SIGNIFICANT SCALE EXIST?
Think carefully about the product, customer and processThink carefully about the product, customer and process
ProcessProcess
Manufacturing
Marketing
Sales
Manufacturing
Marketing
Sales
High fixed Cost !!!! steep slope (60-70%)
High fixed Cost !!!! steep slope (60-70%)
Truck production line
Television advertising campaign
Trading on-line
Truck production line
Television advertising campaign
Trading on-line
High variable cost!!!! flat slope (90-95%)
High variable cost!!!! flat slope (90-95%)
Hermes tie production
Discount coupon
Phone sales of books
Hermes tie production
Discount coupon
Phone sales of books
-15-UniGenova-January2003
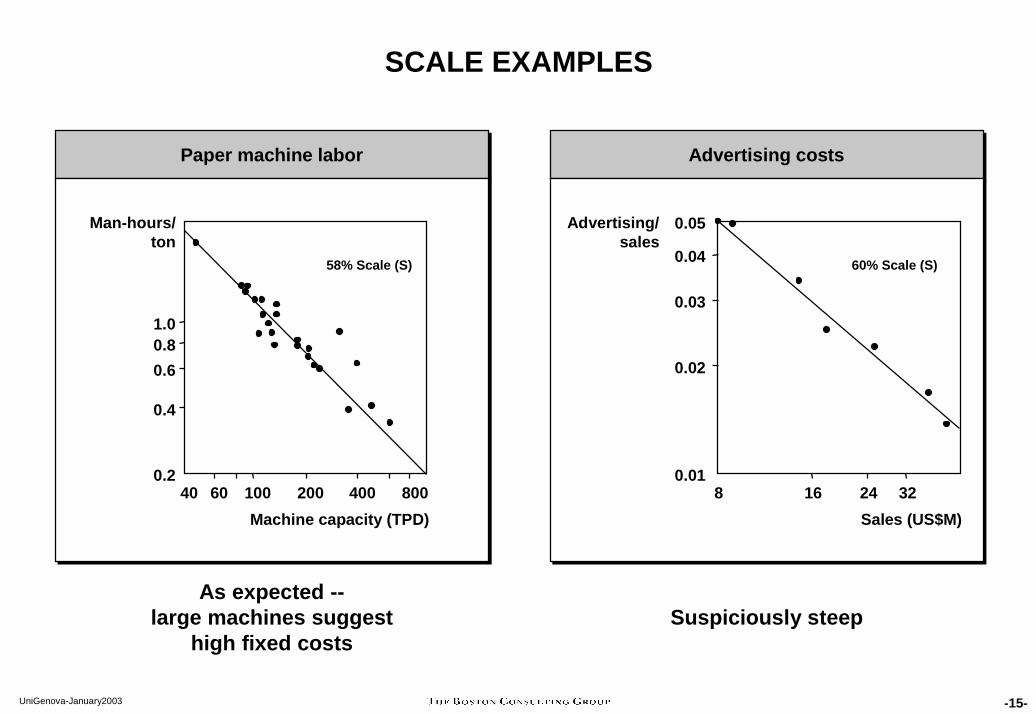
SCALE EXAMPLES
Paper machine laborPaper machine labor Advertising costsAdvertising costs
Man-hours/ton
1.00.80.6
0.4
0.240 60 100 200 400 800
58% Scale (S)
Advertising/sales
0.05
0.04
0.03
0.02
0.018 16 24 32
Machine capacity (TPD) Sales (US$M)
As expected --large machines suggest
high fixed costsSuspiciously steep
60% Scale (S)
-16-UniGenova-January2003
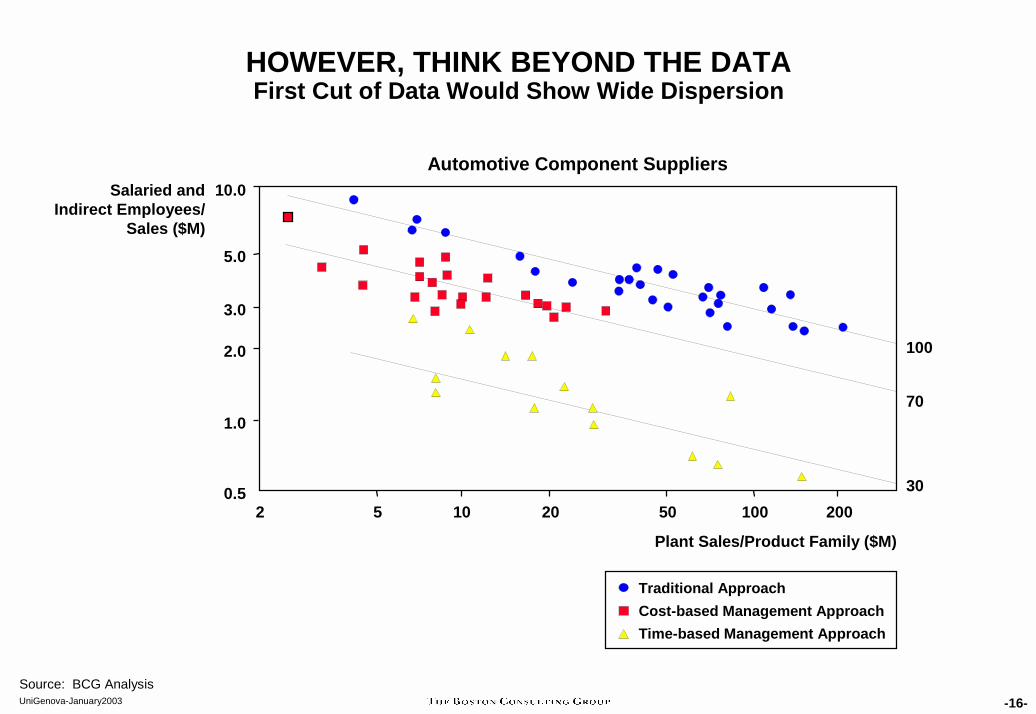
HOWEVER, THINK BEYOND THE DATAFirst Cut of Data Would Show Wide Dispersion
Salaried andIndirect Employees/
Sales ($M)
10.0
5.0
3.0
2.0
1.0
0.52 5 10 20 50 100 200
100
30
Plant Sales/Product Family ($M)
Traditional ApproachCost-based Management ApproachTime-based Management Approach
70
Automotive Component Suppliers
Source: BCG Analysis
-17-UniGenova-January2003
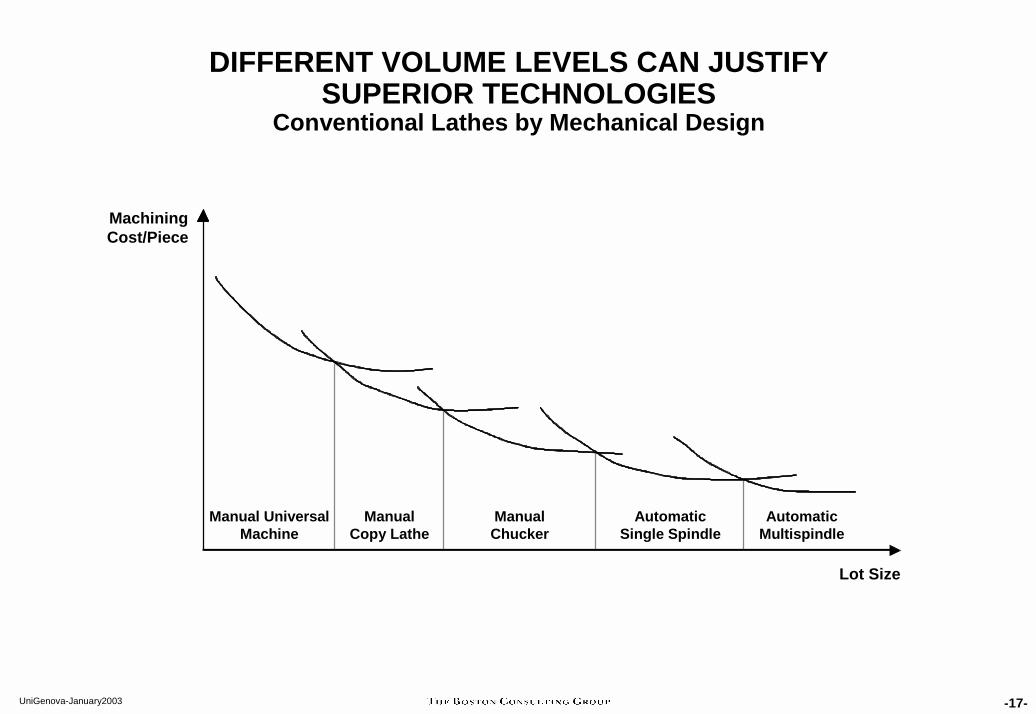
DIFFERENT VOLUME LEVELS CAN JUSTIFYSUPERIOR TECHNOLOGIES
Conventional Lathes by Mechanical Design
MachiningCost/Piece
Manual Universal Machine
ManualCopy Lathe
ManualChucker
AutomaticSingle Spindle
AutomaticMultispindle
Lot Size

-18-UniGenova-January2003
NOT ONLY SCALE HAS AN IMPACT ON COSTS: EXPERIENCE CURVE (I)
Learning restricted within companies
Direct Cost/ MW
380
340
300
2605 15 50
Allis-Chalmers
Westinghouse General Electric
Firm Cumulative Megawatts (M)
Direct Costs Per Megawatt Steam Turbine Generators 1946-1963
-19-UniGenova-January2003
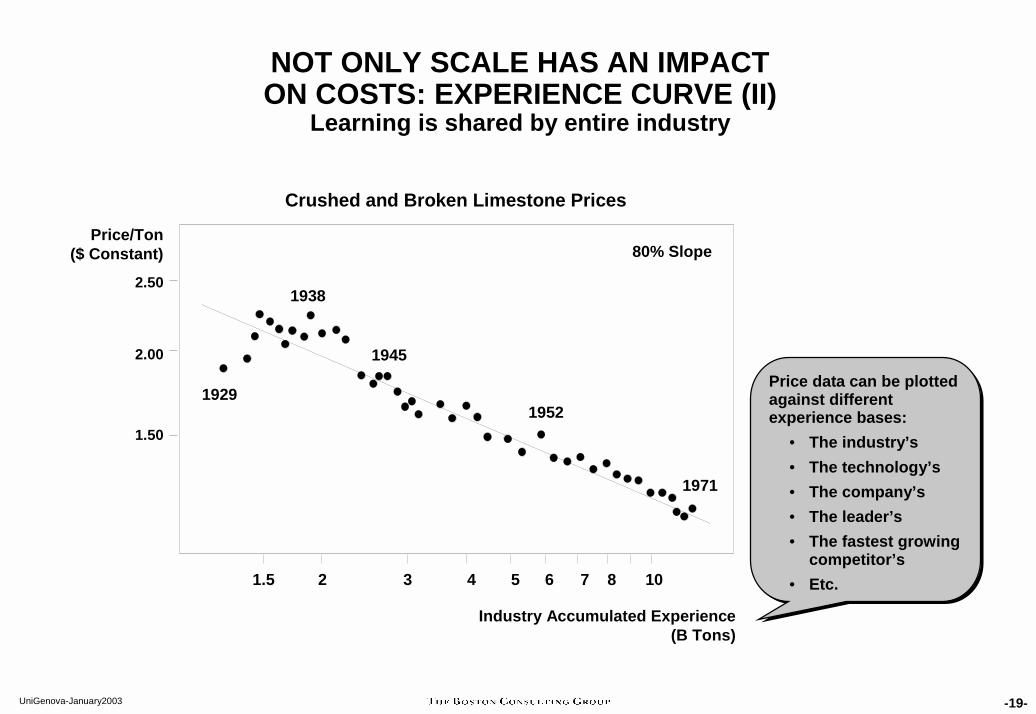
Crushed and Broken Limestone Prices
1.5 2 3 4 5 6 7 8 10
Industry Accumulated Experience (B Tons)
1929
1938
1945
1952
1971
80% Slope
2.50
2.00
1.50
Price/Ton($ Constant)
Price data can be plotted against different experience bases:
• The industry’s• The technology’s• The company’s• The leader’s• The fastest growing
competitor’s• Etc.
Price data can be plotted against different experience bases:
• The industry’s• The technology’s• The company’s• The leader’s• The fastest growing
competitor’s• Etc.
NOT ONLY SCALE HAS AN IMPACTON COSTS: EXPERIENCE CURVE (II)
Learning is shared by entire industry
-20-UniGenova-January2003
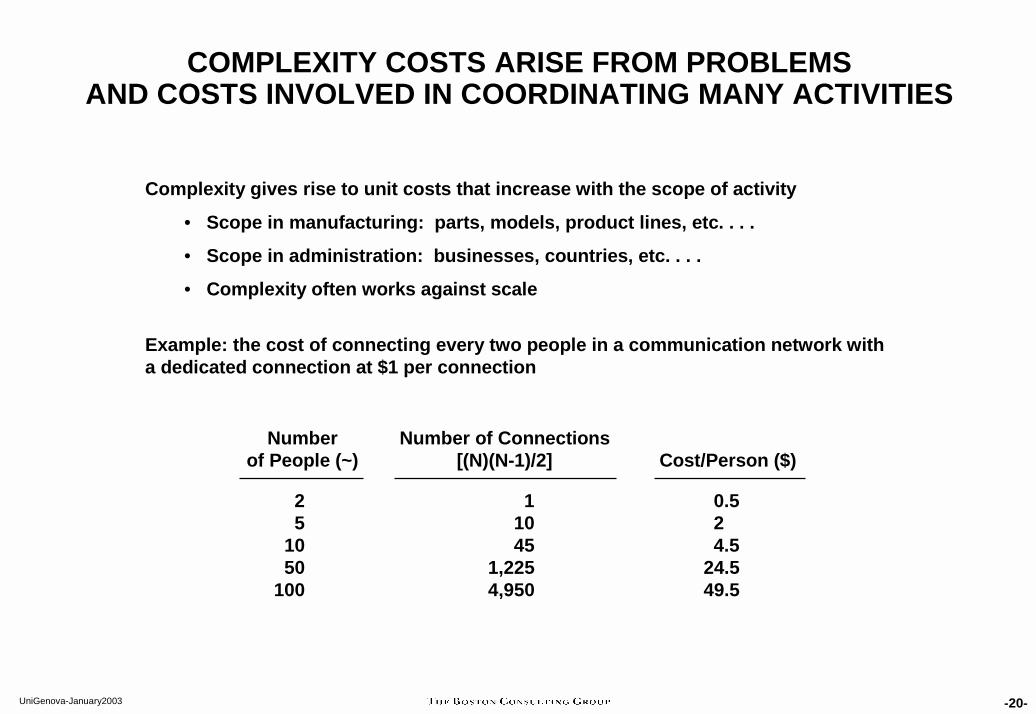
Complexity gives rise to unit costs that increase with the scope of activity
• Scope in manufacturing: parts, models, product lines, etc. . . .
• Scope in administration: businesses, countries, etc. . . .
• Complexity often works against scale
Example: the cost of connecting every two people in a communication network with a dedicated connection at $1 per connection
2 1 0.55 10 2
10 45 4.550 1,225 24.5
100 4,950 49.5
COMPLEXITY COSTS ARISE FROM PROBLEMSAND COSTS INVOLVED IN COORDINATING MANY ACTIVITIES
Number Number of Connections of People (~) [(N)(N-1)/2] Cost/Person ($)
-21-UniGenova-January2003
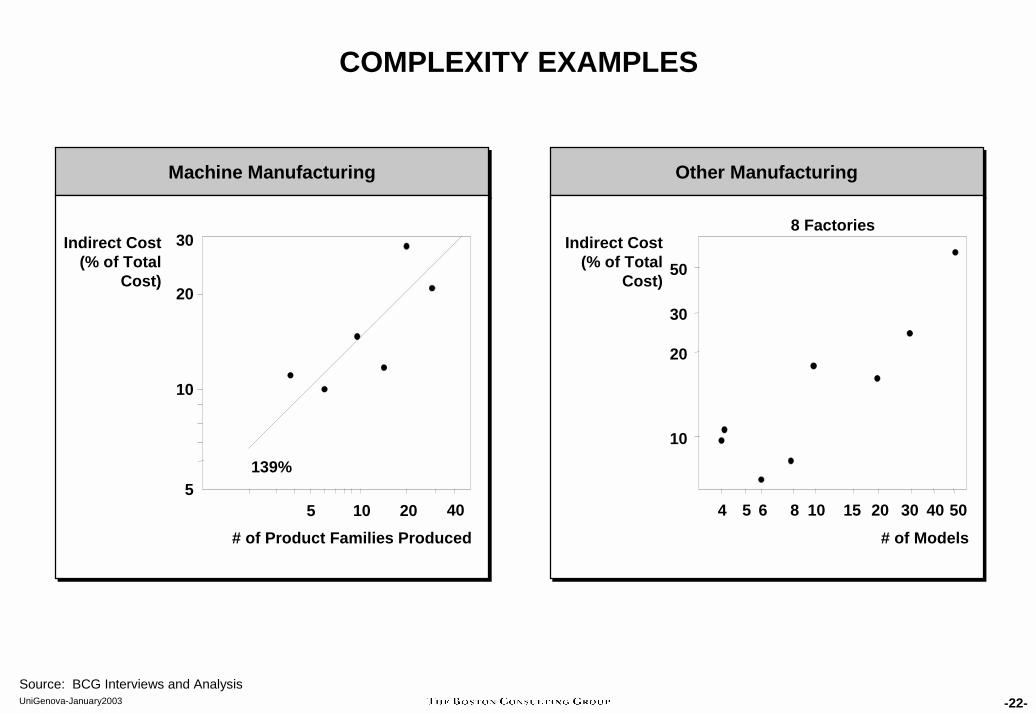
COMPLEXITY ARISES IN INDUSTRY DUE TO MANY FACTORS
Plant makes so many products that machines spend substantial time changing over between products
Salesmen sell too many products to master any one of them properly
Multiproduct plant has high administrative costs of coordination and tracking
-22-UniGenova-January2003
Machine ManufacturingMachine Manufacturing Other ManufacturingOther Manufacturing
COMPLEXITY EXAMPLES
Indirect Cost(% of Total
Cost)
139%
Indirect Cost(% of Total
Cost)
30
20
10
55 10 20 40
50
30
20
10
4 5 6 8 10 15 20 30 40 50# of Product Families Produced # of Models
8 Factories
Source: BCG Interviews and Analysis

-23-UniGenova-January2003
Health Care ServicesHealth Care Services Printing PressesPrinting Presses
UTILIZATION IS ANOTHER FACTOR IMPACTING COSTS
0.55 0.60 0.65 0.70 0.75 0.80 0.85 0.90 0.95 1.0068
69
70
71
72
73
74
75
76
77
78Cost/Procedure
($)
140
40
80
60
100
2016
122 3 4 5 20
Number of Professionals/Office
FullyLoaded
Cost($/1,000
32s)
DailyProcedures/Professional
New Technology
Standard Gravure
Aggressive Gravure
Utilization is important when• Capital intensity is high• Energy consumption is major part of costs• Startup costs are high• Labor force is not flexible
Different from scale• Frequently the two phenomena interact
Utilization is important when• Capital intensity is high• Energy consumption is major part of costs• Startup costs are high• Labor force is not flexible
Different from scale• Frequently the two phenomena interact
Note: Assumes 2,000,000 Run Length
5
10
15
20
-24-UniGenova-January2003
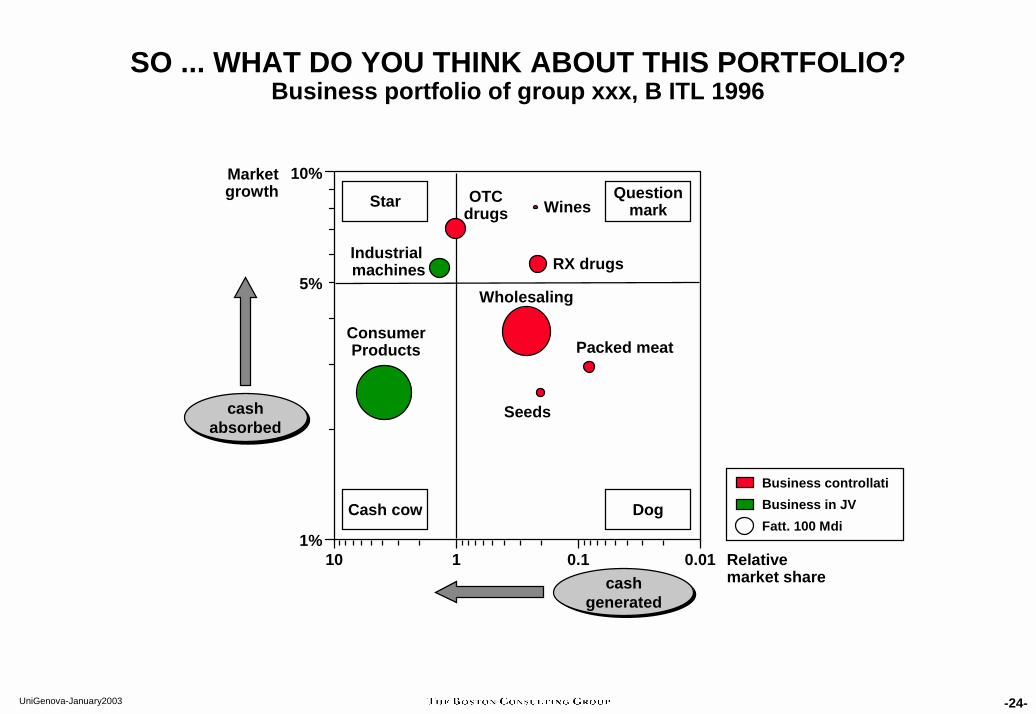
SO ... WHAT DO YOU THINK ABOUT THIS PORTFOLIO?Business portfolio of group xxx, B ITL 1996
1%
10%
10 1 0.1 0.01
ConsumerProducts
OTCdrugs
RX drugs
Wholesaling
Seeds
Wines
Packed meat
Industrial machines
Market growth
Relative market share
Star Questionmark
Cash cow Dog
5%
Fatt. 100 Mdi
Business controllatiBusiness in JV
cashabsorbed
cashabsorbed
cashgenerated
cashgenerated

-25-UniGenova-January2003
Automation 1,3
Tractors* 9,4
Insurances 3,1
Automotive 24,1Engines 1,4
Trucks 7,4
Foundry 1,7
Components 4,1
-5%
0%
5%
10%
15%
20%
25%
0,11,010,0
... AND THIS ONE?Business portfolio of group yyy (1999, B €)
Market growth, avg last three
years, (%)
€ 1 B salesIntercompany share
cashabsorbed
cashabsorbed
cashgenerated
cashgenerated
Relative market share

An An excerciseexcercise
-27-UniGenova-January2003
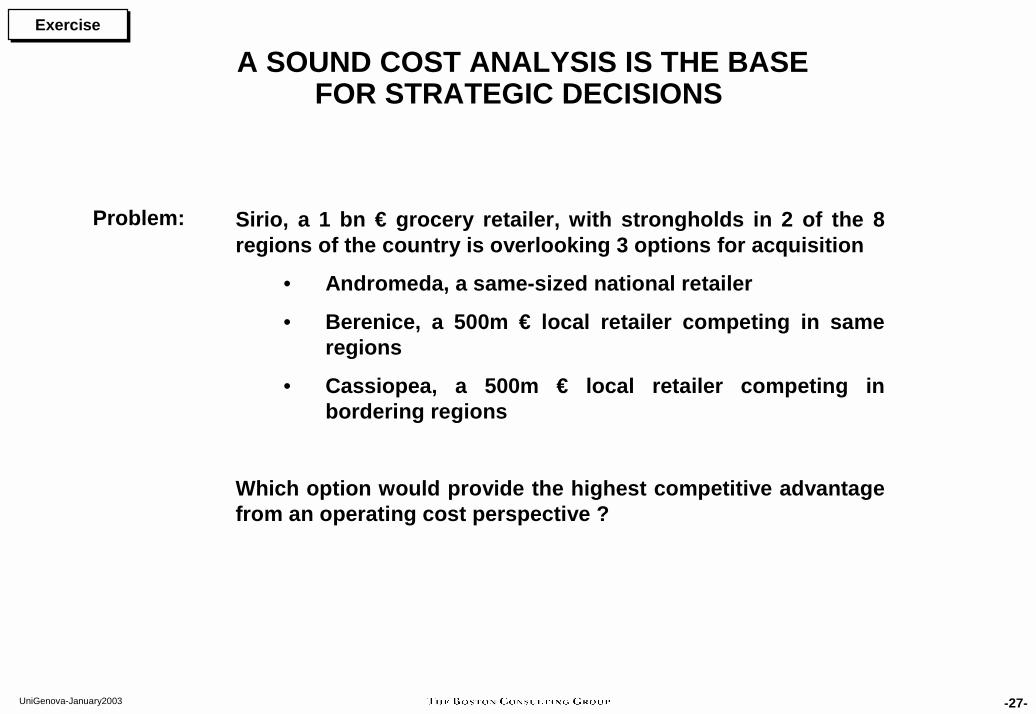
A SOUND COST ANALYSIS IS THE BASE FOR STRATEGIC DECISIONS
Problem: Sirio, a 1 bn € grocery retailer, with strongholds in 2 of the 8 regions of the country is overlooking 3 options for acquisition
• Andromeda, a same-sized national retailer
• Berenice, a 500m € local retailer competing in same regions
• Cassiopea, a 500m € local retailer competing in bordering regions
Which option would provide the highest competitive advantage from an operating cost perspective ?
ExerciseExercise
-28-UniGenova-January2003
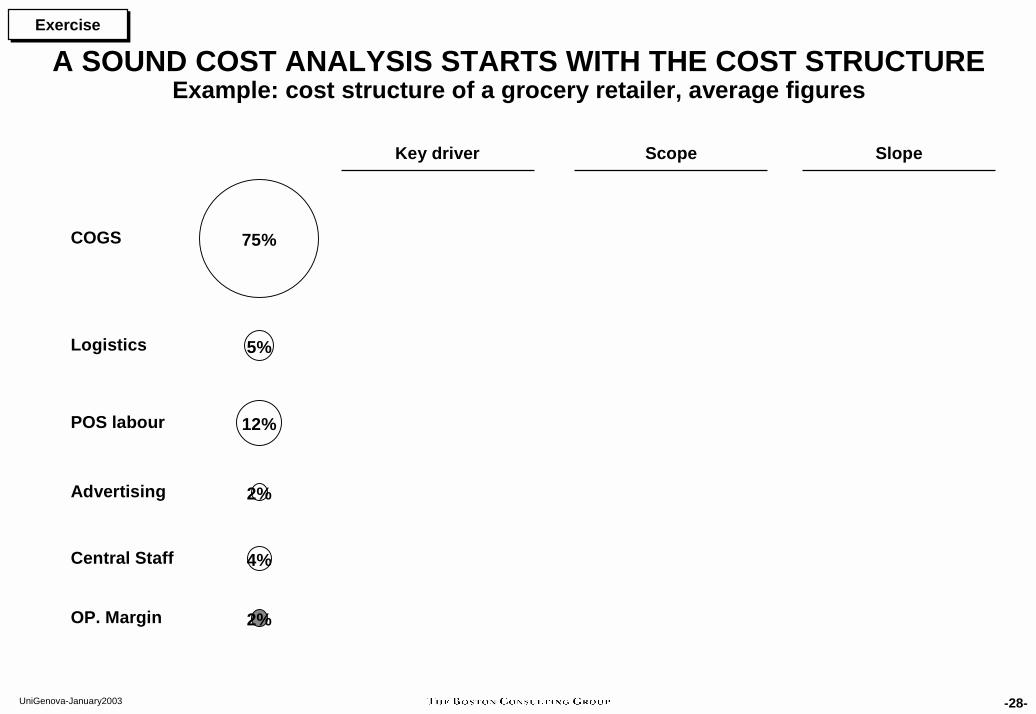
A SOUND COST ANALYSIS STARTS WITH THE COST STRUCTUREExample: cost structure of a grocery retailer, average figures
ExerciseExercise
COGS
Logistics
POS labour
Advertising
Central Staff
OP. Margin
5%
12%
2%
75%
2%
4%
Key driver Scope Slope

-29-UniGenova-January2003
Overheadcost/unit
Volume
Combined impact= f (v, p)
Complexity impact = f (p)
Scale impact = f (v)
1 10 100 1,000
Managing complexity reduces costManaging complexity reduces cost
SCALE AND COMPLEXITY TYPICALLY WORK AGAINST EACH OTHER
Measured in the same way
-30-UniGenova-January2003
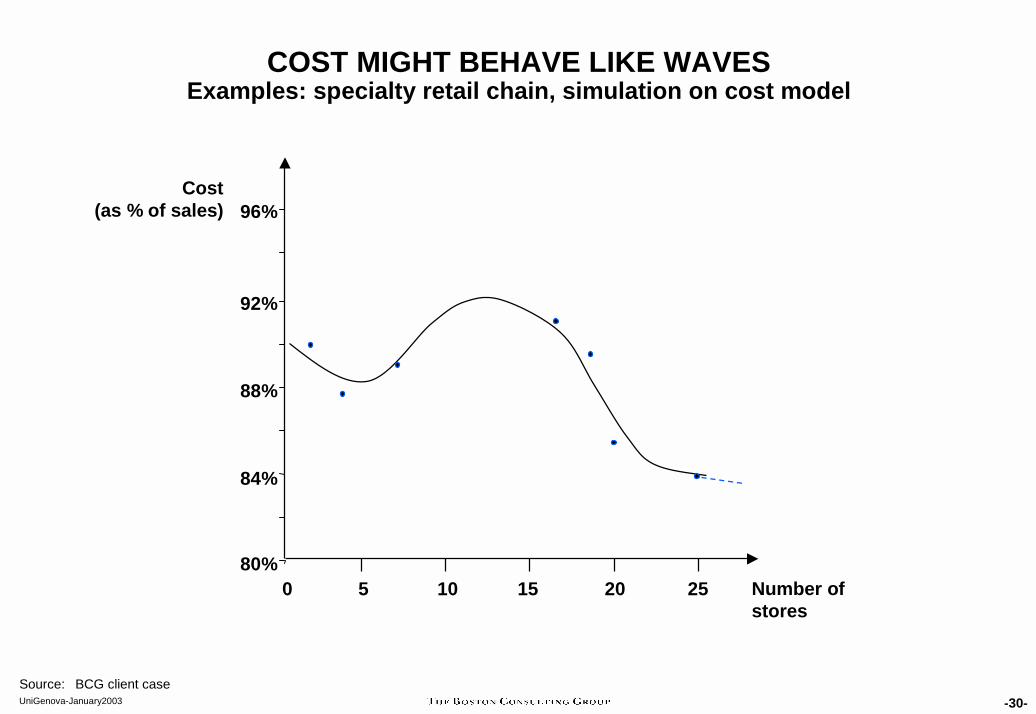
COST MIGHT BEHAVE LIKE WAVESExamples: specialty retail chain, simulation on cost model
80%
84%
88%
92%
96%
50 10 15 20 25
Source: BCG client case
Number of stores
Cost(as % of sales)