Cuore · Attivazione elettrica del cuore 186 forrás: BioLabor Biofizikai és Laboratóriumi Szolg....
39
Cuore Materiale grafico di supporto alla lezione Estratto da: “Bioelectromagnetism” cap. 6,15,19
Transcript of Cuore · Attivazione elettrica del cuore 186 forrás: BioLabor Biofizikai és Laboratóriumi Szolg....

CuoreMateriale grafico di supporto alla lezione
Estratto da: “Bioelectromagnetism” cap. 6,15,19

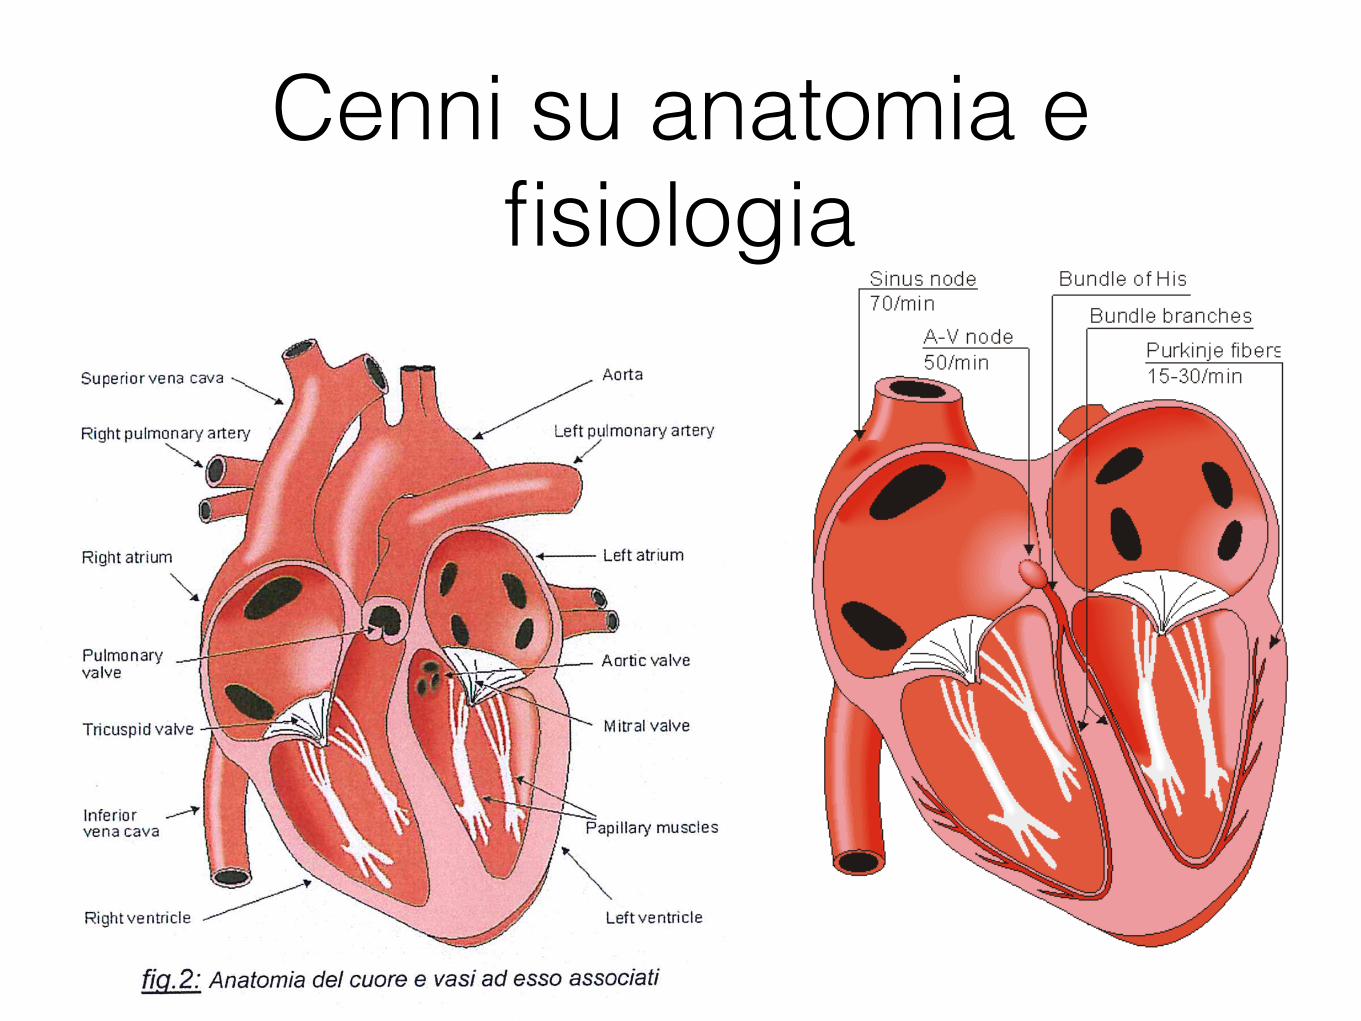
Cenni su anatomia e fisiologia
• Situato nel torace, dietro lo sterno e davanti ai polmoni
• Circondato dal pericardio
• Dimensioni di un pugno chiuso, peso250-300g
• Parte superiore: grandi vasi (vena cava superiore inferiore, arteria e vena polmonare, aorta)
Cenni su anatomia e fisiologia
189 forrás: BioLabor Biofizikai és Laboratóriumi Szolg. Kft. www.biolabor.hu
Fig. 6.6. The conduction system of the heart.
Because the intrinsic rate of the sinus node is the greatest, it sets the activation frequency of the whole heart. If the connection from the atria to the AV node fails, the AV node adopts its intrinsic frequency. If the conduction system fails at the bundle of His, the ventricles will beat at the rate determined by their own region that has the highest intrinsic frequency. The electric events in the heart are summarized in Table 6.1. The waveforms of action impulse observed in different specialized cardiac tissue are shown in Figure 6.7.

Cenni su anatomia e fisiologia

Propagazione
190 forrás: BioLabor Biofizikai és Laboratóriumi Szolg. Kft. www.biolabor.hu
Table 6.1. Electric events in the heart
Location in the heart
Event Time [ms] ECG- terminology
Conduction velocity [m/s]
Intrinsic frequency [1/min]
SA node atrium, Right Left AV node
bundle of His bundle branches Purkinje fibers endocardium Septum Left ventricle
epicardium Left ventricle Right ventricle
epicardium Left ventricle Right ventricle
endocardium Left ventricle
impulse generated depolarization *) depolarization arrival of impulse departure of impulse activated activated activated
depolarization depolarization
depolarization depolarization
repolarization repolarization
repolarization
0 5
85 50
125 130 145 150
175 190
225 250
400
600
P P
P-Q interval
QRS
T
0.05 0.8-1.0 0.8-1.0
0.02-0.05
1.0-1.5 1.0-1.5 3.0-3.5
0.3 (axial) -
0.8 (transverse)
0.5
70-80 20-40
*) Atrial repolarization occurs during the ventricular depolarization; therefore, it is not normally seen in the electrocardiogram.
191 forrás: BioLabor Biofizikai és Laboratóriumi Szolg. Kft. www.biolabor.hu
Fig. 6.7. Electrophysiology of the heart.The different waveforms for each of the specialized cells found in the heart are shown. The latency shown approximates that normally found in the healthy heart.
A classical study of the propagation of excitation in human heart was made by Durrer and his co-workers (Durrer et al., 1970). They isolated the heart from a subject who had died of various cerebral conditions and who had no previous history of cardiac diseases. The heart was removed within 30 min post mortem and was perfused. As many as 870 electrodes were placed into the cardiac muscle; the electric activity was then recorded by a tape recorder and played back at a lower speed by the ECG writer; thus the effective paper speed was 960 mm/s, giving a time resolution better than 1 ms.
Figure 6.8 is redrawn from these experimental data. The ventricles are shown with the anterior wall of the left and partly that of the right ventricle opened. The isochronic surfaces show clearly that ventricular activation starts from the inner wall of the left ventricle and proceeds radially toward the epicardium. In the terminal part of ventricular activation, the excitation wavefront proceeds more tangentially. This phenomenon and its effects on electrocardiogram and magnetocardiogram signals are discussed in greater detail later.

Attivazione elettrica del cuore
186 forrás: BioLabor Biofizikai és Laboratóriumi Szolg. Kft. www.biolabor.hu
The only exception is the boundary between the atria and ventricles, which the activation wave normally cannot cross except along a special conduction system, since a nonconducting barrier of fibrous tissue is present..
DEPOLARIZATION REPOLARIZATION RESTORATION OF IONIC BALANCE
Fig. 6.4. Electrophysiology of the cardiac muscle cell.

Attivazione elettrica del cuore
muscolo scheletrico
cuore

Genesi elettrocardiogramma

Confronto con neurone
143 forrás: BioLabor Biofizikai és Laboratóriumi Szolg. Kft. www.biolabor.hu
peak of Vm), the capacitive current is zero (dV/dt = 0) and the membrane current is totally an ionic current.
6. The terminal phase of activation is governed by the potassium conductance which, through the outflowing potassium current, causes the membrane voltage to become more negative. Because the potassium conductance is elevated above its normal value, there will be a period during which the membrane voltage is more negative than the resting voltage - that is, the membrane is hyperpolarized.
7. Finally, when the conductances reach their resting value, the membrane voltage reaches its resting voltage..
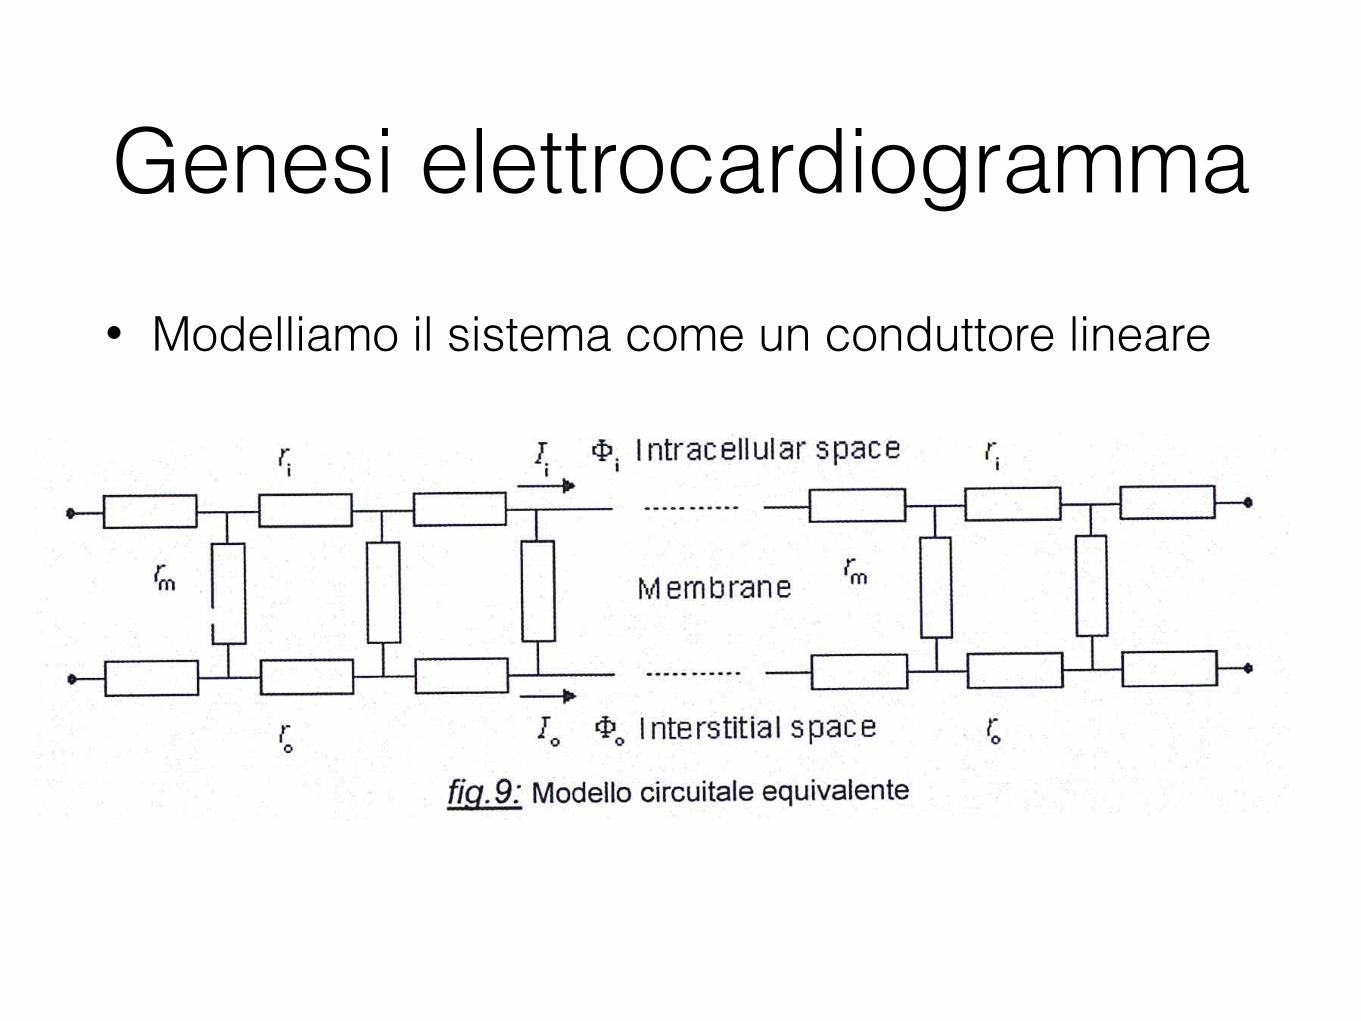
Genesi elettrocardiogramma• Modelliamo il sistema come un conduttore lineare

Genesi elettrocardiogramma
391 forrás: BioLabor Biofizikai és Laboratóriumi Szolg. Kft. www.biolabor.hu
Fig. 15.2. The signal produced by the propagating activation front between a pair of extracellular electrodes.
391 forrás: BioLabor Biofizikai és Laboratóriumi Szolg. Kft. www.biolabor.hu
Fig. 15.2. The signal produced by the propagating activation front between a pair of extracellular electrodes.

393 forrás: BioLabor Biofizikai és Laboratóriumi Szolg. Kft. www.biolabor.hu
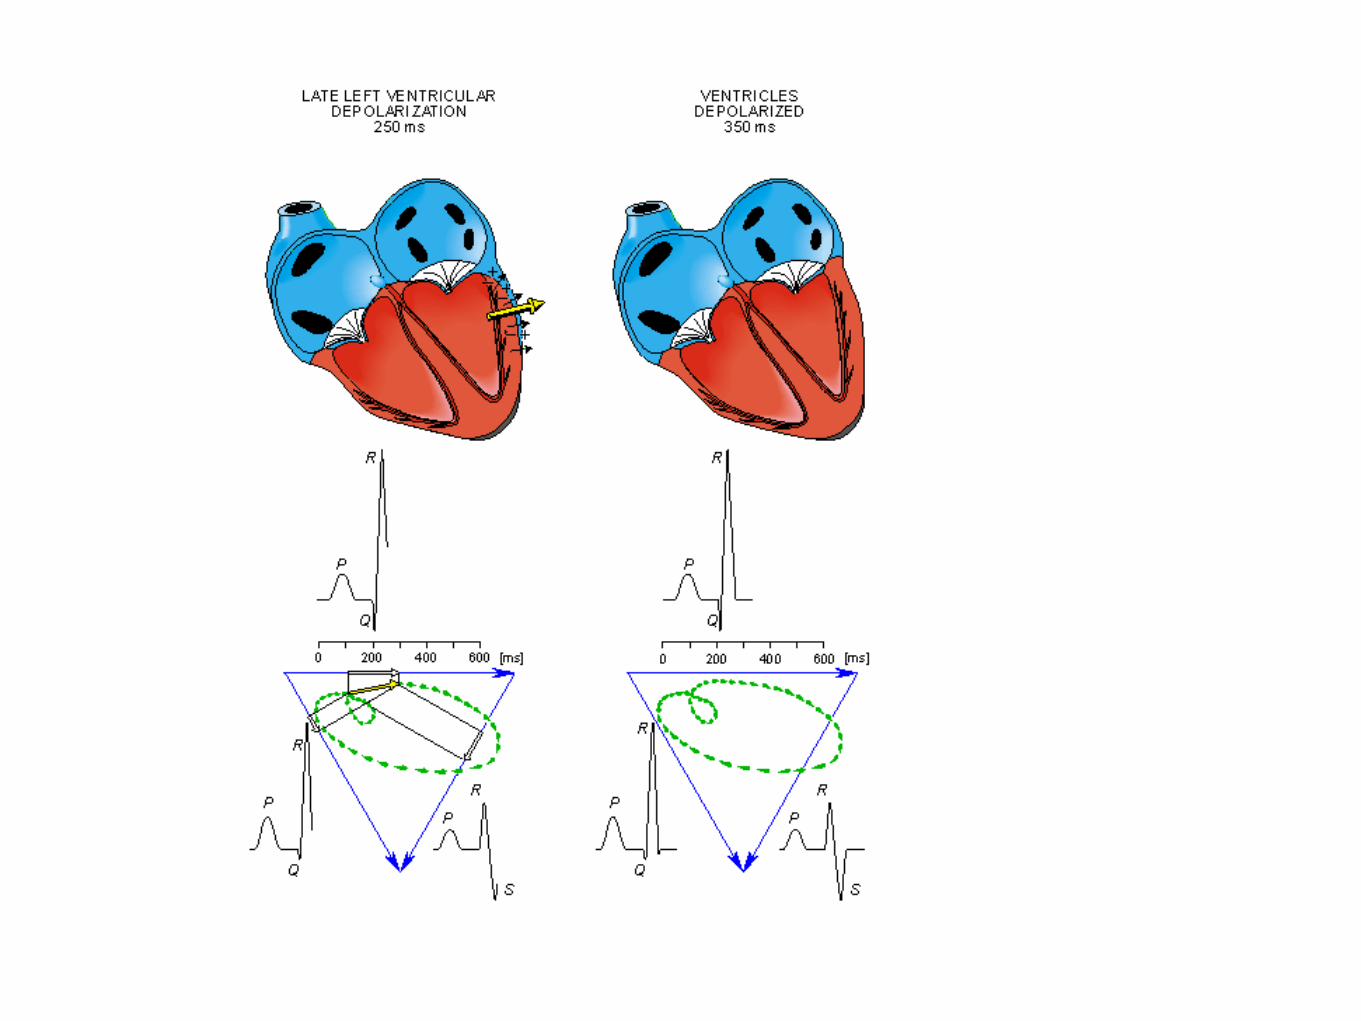
Once activation has reached the ventricles, propagation proceeds along the Purkinje fibers to the inner walls of the ventricles. The ventricular depolarization starts first from the left side of the interventricular septum, and therefore, the resultant dipole from this septal activation points to the right. Figure 15.3 shows that this causes a negative signal in leads I and II.
In the next phase, depolarization waves occur on both sides of the septum, and their electric forces cancel. However, early apical activation is also occurring, so the resultant vector points to the apex.

394 forrás: BioLabor Biofizikai és Laboratóriumi Szolg. Kft. www.biolabor.hu
395 forrás: BioLabor Biofizikai és Laboratóriumi Szolg. Kft. www.biolabor.hu

396 forrás: BioLabor Biofizikai és Laboratóriumi Szolg. Kft. www.biolabor.hu
Fig. 15.3. The generation of the ECG signal in the Einthoven limb leads. (After Netter, 1971.)
After a while the depolarization front has propagated through the wall of the right ventricle; when it first arrives at the epicardial surface of the right-ventricular free wall, the event is called breakthrough. Because the left ventricular wall is thicker, activation of the left ventricular free wall continues even after depolarization of a large part of the right ventricle. Because there are no compensating electric forces on the right, the resultant vector reaches its maximum in this phase, and it points leftward. The depolarization front continues propagation along the left ventricular wall toward the back. Because its surface area now continuously decreases, the magnitude of the resultant vector also decreases until the whole ventricular muscle is depolarized. The last to depolarize are basal regions of both left and right ventricles. Because there is no longer a propagating activation front, there is no signal either.
Ventricular repolarization begins from the outer side of the ventricles and the repolarization front "propagates" inward. This seems paradoxical, but even though the epicardium is the last to depolarize, its action potential durations are relatively short, and it is the first to recover. Although recovery of one cell does not propagate to neighboring cells, one notices that recovery generally does move from the epicardium toward the endocardium. The inward spread of the repolarization front generates a signal with the same sign as the outward depolarization front, as pointed out in Figure 15.2 (recall that both direction of repolarization and orientation of dipole sources are opposite). Because of the diffuse form of the repolarization, the amplitude of the signal is much smaller than that of the depolarization wave and it lasts
397 forrás: BioLabor Biofizikai és Laboratóriumi Szolg. Kft. www.biolabor.hu
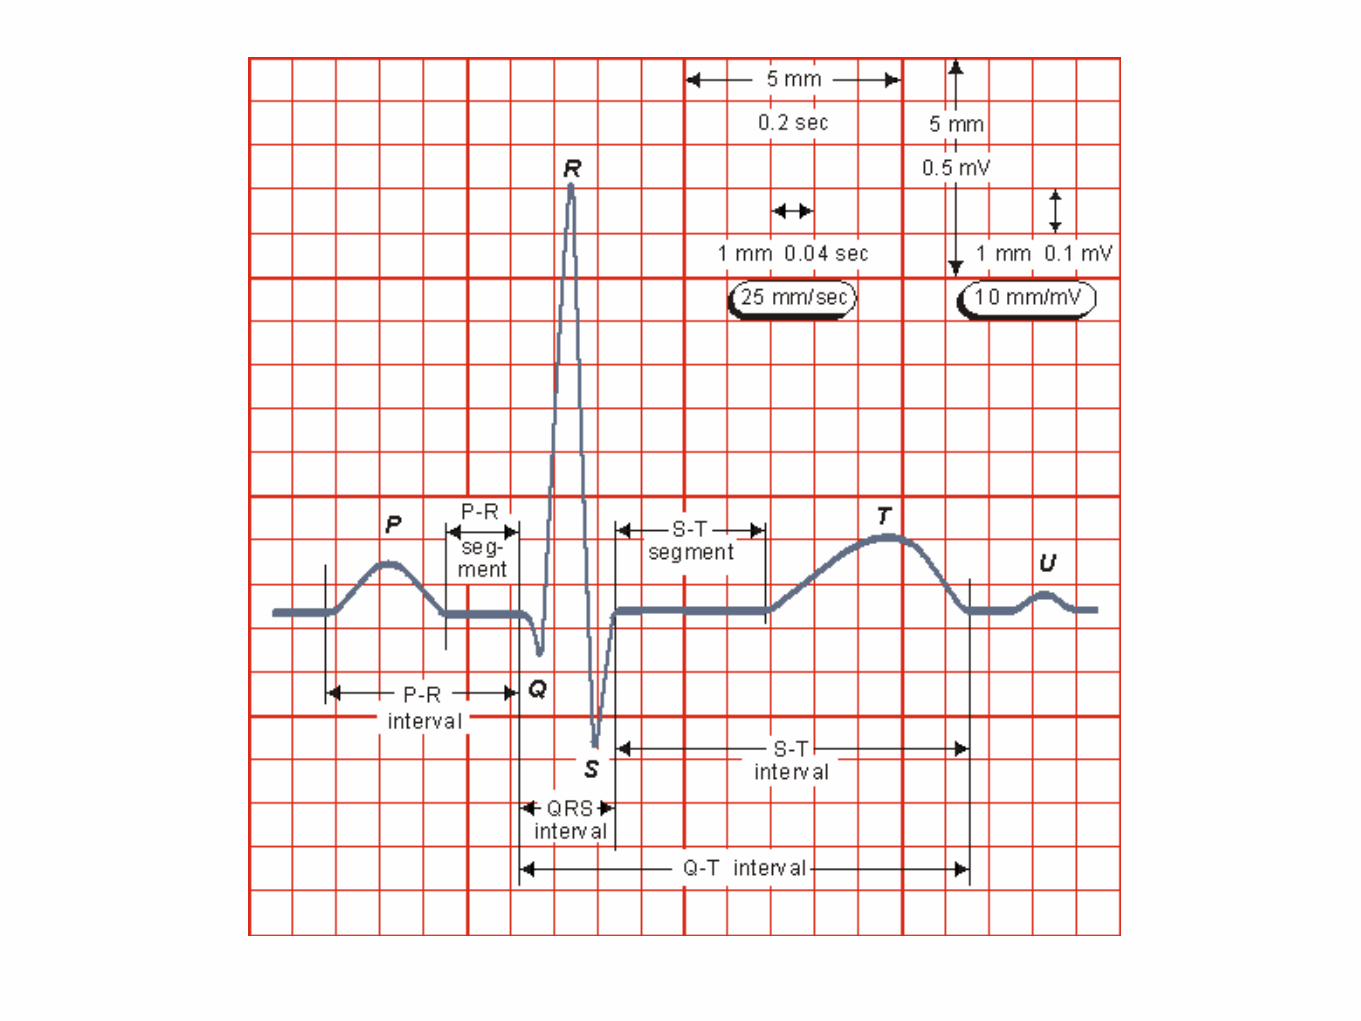
longer. The normal electrocardiogram is illustrated in Figure 15.4. The figure also includes definitions for
various segments and intervals in the ECG. The deflections in this signal are denoted in alphabetic order starting with the letter P, which represents atrial depolarization. The ventricular depolarization causes the QRS complex, and repolarization is responsible for the T-wave. Atrial repolarization occurs during the QRS complex and produces such a low signal amplitude that it cannot be seen apart from the normal ECG.
Fig. 15.4. The normal electrocardiogram.
15.3 WILSON CENTRAL TERMINAL
Frank Norman Wilson (1890-1952) investigated how electrocardiographic unipolar potentials could be defined. Ideally, those are measured with respect to a remote reference (infinity). But how is one to achieve this in the volume conductor of the size of the human body with electrodes already placed at the extremities? In several articles on the subject, Wilson and colleagues (Wilson, Macleod, and Barker, 1931; Wilson et al., 1934) suggested the use of the central terminal as this reference. This was formed by connecting a 5 kΩ resistor from each terminal of the limb leads to a common point called the central terminal, as shown in Figure 15.5. Wilson suggested that unipolar potentials should be measured with respect to this terminal which approximates the potential at infinity.
Actually, the Wilson central terminal is not independent of but, rather, is the average of the limb potentials. This is easily demonstrated by noting that in an ideal voltmeter there is no lead current. Consequently, the total current into the central terminal from the limb leads must add to zero to satisfy the conservation of current (see Figure 15.5). Accordingly, we require that
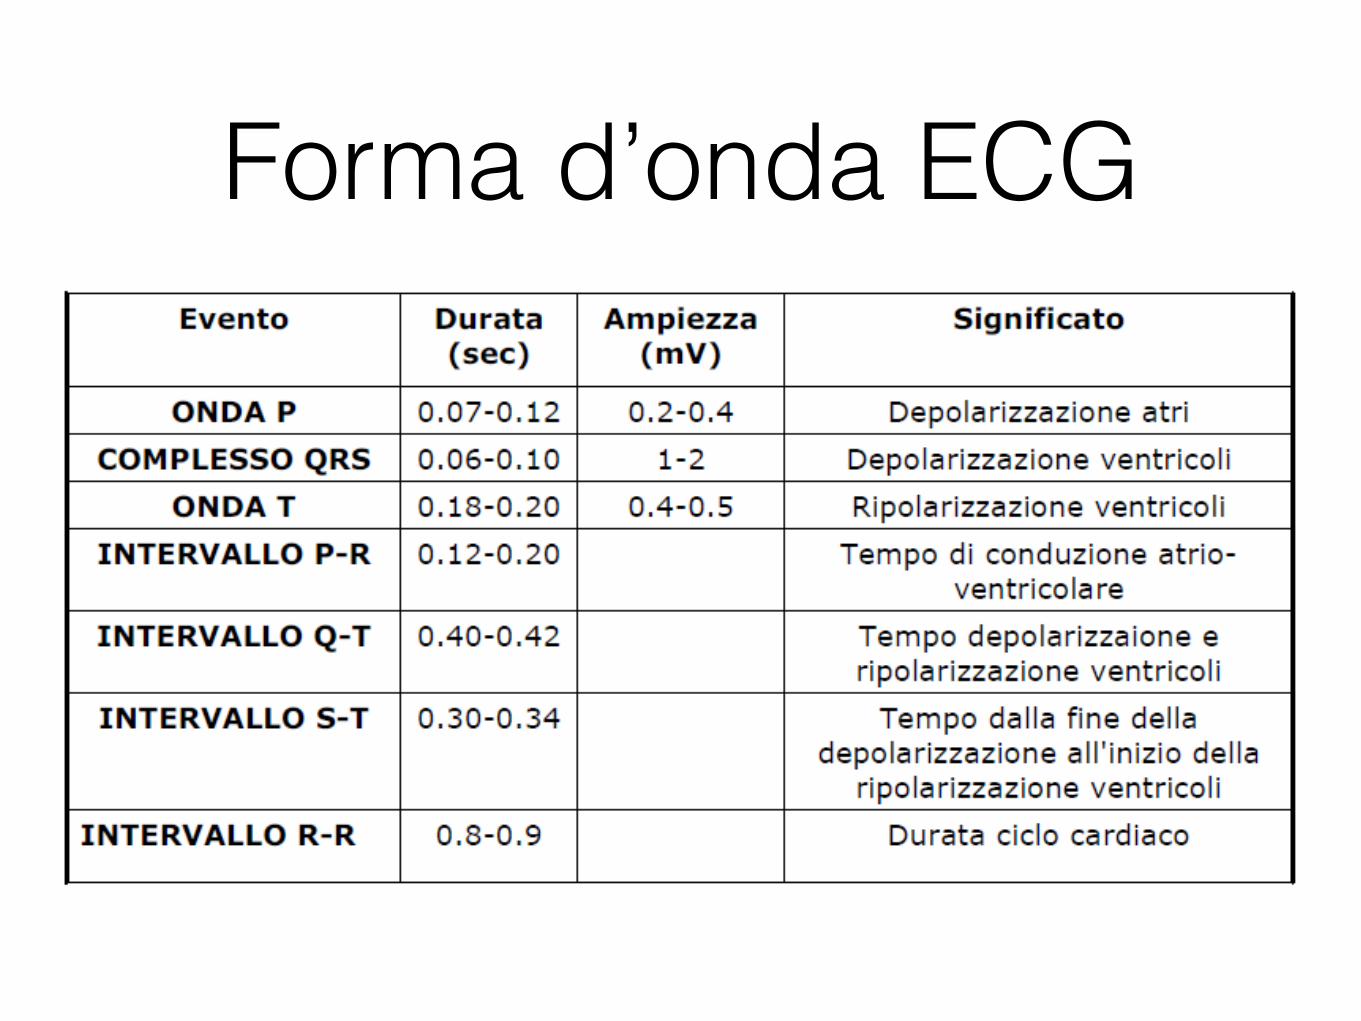
Forma d’onda ECG

401 forrás: BioLabor Biofizikai és Laboratóriumi Szolg. Kft. www.biolabor.hu
Fig. 15.8. Precordial leads.
15.6 MODIFICATIONS OF THE 12-LEAD SYSTEM
The 12-lead system as described here is the one with the greatest clinical use. There are also some other modifications of the 12-lead system for particular applications.
In exercise ECG, the signal is distorted because of muscular activity, respiration, and electrode artifacts due to perspiration and electrode movements. The distortion due to muscular activation can be minimized by placing the electrodes on the shoulders and on the hip instead of the arms and the leg, as suggested by R. E. Mason and I. Likar (1966). The Mason-Likar modification is the most important modification of the 12-lead system used in exercise ECG.
The accurate location for the right arm electrode in the Mason-Likar modification is a point in the infraclavicular fossa medial to the border of the deltoid muscle and 2 cm below the lower border of the clavicle. The left arm electrode is located similarly on the left side. The left leg electrode is placed at the left iliac crest. The right leg electrode is placed in the region of the right iliac fossa. The precordial leads are located in the Mason-Likar modification in the standard places of the 12-lead system.
In ambulatory monitoring of the ECG, as in the Holter recording, the electrodes are also placed on the surface of the thorax instead of the extremities.
400 forrás: BioLabor Biofizikai és Laboratóriumi Szolg. Kft. www.biolabor.hu
Fig. 15.7. (A) The circuit of the Goldberger augmented leads.
(B) The location of the Goldberger augmented lead vectors in the image space.
15.5 PRECORDIAL LEADS
PRECONDITIONS:
SOURCE: Dipole in a fixed location
CONDUCTOR: Infinite, homogeneous volume conductor or homogeneous sphere with the dipole in its center (the trivial solution)
For measuring the potentials close to the heart, Wilson introduced the precordial leads (chest leads) in
1944 (Wilson et al., 1944). These leads, V1-V6 are located over the left chest as described in Figure 15.8.
The points V1 and V2 are located at the fourth intercostal space on the right and left side of the sternum;
V4 is located in the fifth intercostal space at the midclavicular line; V3 is located between the points V2
and V4; V5 is at the same horizontal level as V4 but on the anterior axillary line; V6 is at the same
horizontal level as V4 but at the midline. The location of the precordial leads is illustrated in Figure 15.8.
399 forrás: BioLabor Biofizikai és Laboratóriumi Szolg. Kft. www.biolabor.hu
Fig. 15.6. (A) The circuit of the Wilson central terminal (CT). (B) The location of the Wilson central terminal in the image space (CT'). It is located in the
center of the Einthoven triangle.
15.4 GOLDBERGER AUGMENTED LEADS
Three additional limb leads, VR, VL, and VF are obtained by measuring the potential between each limb electrode and the Wilson central terminal. (Note that V in Roman denotes a lead and V in italics a lead voltage.) For instance, the measurement from the left leg (foot) gives
(15.6)
In 1942 E. Goldberger observed that these signals can be augmented by omitting that resistance
from the Wilson central terminal, which is connected to the measurement electrode (Goldberger, 1942a,b). In this way, the aforementioned three leads may be replaced with a new set of leads that are called augmented leads because of the augmentation of the signal (see Figure 15.7). As an example, the equation for the augmented lead aVF is:
(15.7)
A comparison of Equation 15.7 with Equation 15.6 shows the augmented signal to be 50% larger
than the signal with the Wilson central terminal chosen as reference. It is important to note that the three augmented leads, aVR, aVL, and aVF, are fully redundant with respect to the limb leads I, II, and III. (This holds also for the three unipolar limb leads VR, VL, and VF.)
398 forrás: BioLabor Biofizikai és Laboratóriumi Szolg. Kft. www.biolabor.hu
(15.4)
from which it follows that
(15.5)
Since the central terminal potential is the average of the extremity potentials it can be argued that it
is then somewhat independent of any one in particular and therefore a satisfactory reference. In clinical practice good reproducibility of the measurement system is vital. Results appear to be quite consistent in clinical applications.
Wilson advocated 5 kΩ resistances; these are still widely used, though at present the high-input impedance of the ECG amplifiers would allow much higher resistances. A higher resistance increases the CMRR and diminishes the size of the artifact introduced by the electrode/skin resistance.
It is easy to show that in the image space the Wilson central terminal is found at the center of the Einthoven triangle, as shown in Figure 15.6..
Fig. 15.5. The Wilson central terminal (CT) is formed by connecting a 5 kΩ resistance to each limb electrode and interconnecting the free wires; the CT is the common point. The Wilson central terminal represents the average of the limb potentials. Because no current flows through a high-impedance voltmeter, Kirchhoff's law requires that IR + IL + IF = 0.

403 forrás: BioLabor Biofizikai és Laboratóriumi Szolg. Kft. www.biolabor.hu
Fig. 15.9. The projections of the lead vectors of the 12-lead ECG system in three orthogonal planes when one assumes the volume conductor to be spherical homogeneous and the cardiac source centrally located.
REFERENCES
Ader C (1897): Sur un nouvel appareil enregistreur pour cables sousmarins. Compt. rend. Acad. Sci. (Paris) 124: 1440-2. Durrer D, van Dam RT, Freud GE, Janse MJ, Meijler FL, Arzbaecher RC (1970): Total excitation of the isolated human heart.
Circulation 41:(6) 899-912. Einthoven W (1908): Weiteres über das Elektrokardiogram. Pflüger Arch. ges. Physiol. 122: 517-48. Einthoven W, Fahr G, de Waart A (1913): Über die Richtung und die Manifeste Grösse der Potentialschwankungen im
mennschlichen Herzen und über den Einfluss der Herzlage auf die form des Elektrokardiogramms. Pflüger Arch. ges. Physiol. 150: 275-315.
Einthoven W, Fahr G, de Waart A (1950): On the direction and manifest size of the variations of potential in the human heart and on the influence of the position of the heart on the form of the electrocardiogram. Am. Heart J. 40:(2) 163-211. (Reprint 1913, translated by HE Hoff, P Sekelj).
Geselowitz DB (1964): Dipole theory in electrocardiography. Am. J. Cardiol. 14:(9) 301-6. Goldberger E (1942a): The aVL, aVR, and aVF leads; A simplification of standard lead electrocardiography. Am. Heart J. 24:
378-96. Goldberger E (1942b): A simple indifferent electrocardiographic electrode of zero potential and a technique of obtaining
augmented, unipolar extremity leads. Am. Heart J. 23: 483-92. Mason R, Likar L (1966): A new system of multiple leads exercise electrocardiography. Am. Heart J. 71:(2) 196-205. Netter FH (1971): Heart, Vol. 5, 293 pp. The Ciba Collection of Medical Illustrations, Ciba Pharmaceutical Company, Summit,
N.J. Scher AM, Young AC (1957): Ventricular depolarization and the genesis of the QRS. Ann. N.Y. Acad. Sci. 65: 768-78.

439 forrás: BioLabor Biofizikai és Laboratóriumi Szolg. Kft. www.biolabor.hu
6. Myocardial ischemia and infarction . Ischemia
a. Infarction 7. Drug effect . Digitalis
a. Quinidine 8. Electrolyte imbalance
. Potassium a. Calcium
9. Carditis . Pericarditis
a. Myocarditis 10. Pacemaker monitoring
Most of these application areas of ECG diagnosis are discussed in this chapter. Items 7, 8, and 9 - drug
effect, electrolyte imbalance, and carditis - are not included in this discussion because their effects on the ECG signal cannot readily be explained with the methods included in this textbook.
Fig. 19.1 Application areas of ECG diagnosis.
Diagnosi ECG

Ritmi sopraventricolari (generati agli atri o al nodo AV) - ritmi sinusali
(generati nodo SA - complessi normali)
441 forrás: BioLabor Biofizikai és Laboratóriumi Szolg. Kft. www.biolabor.hu
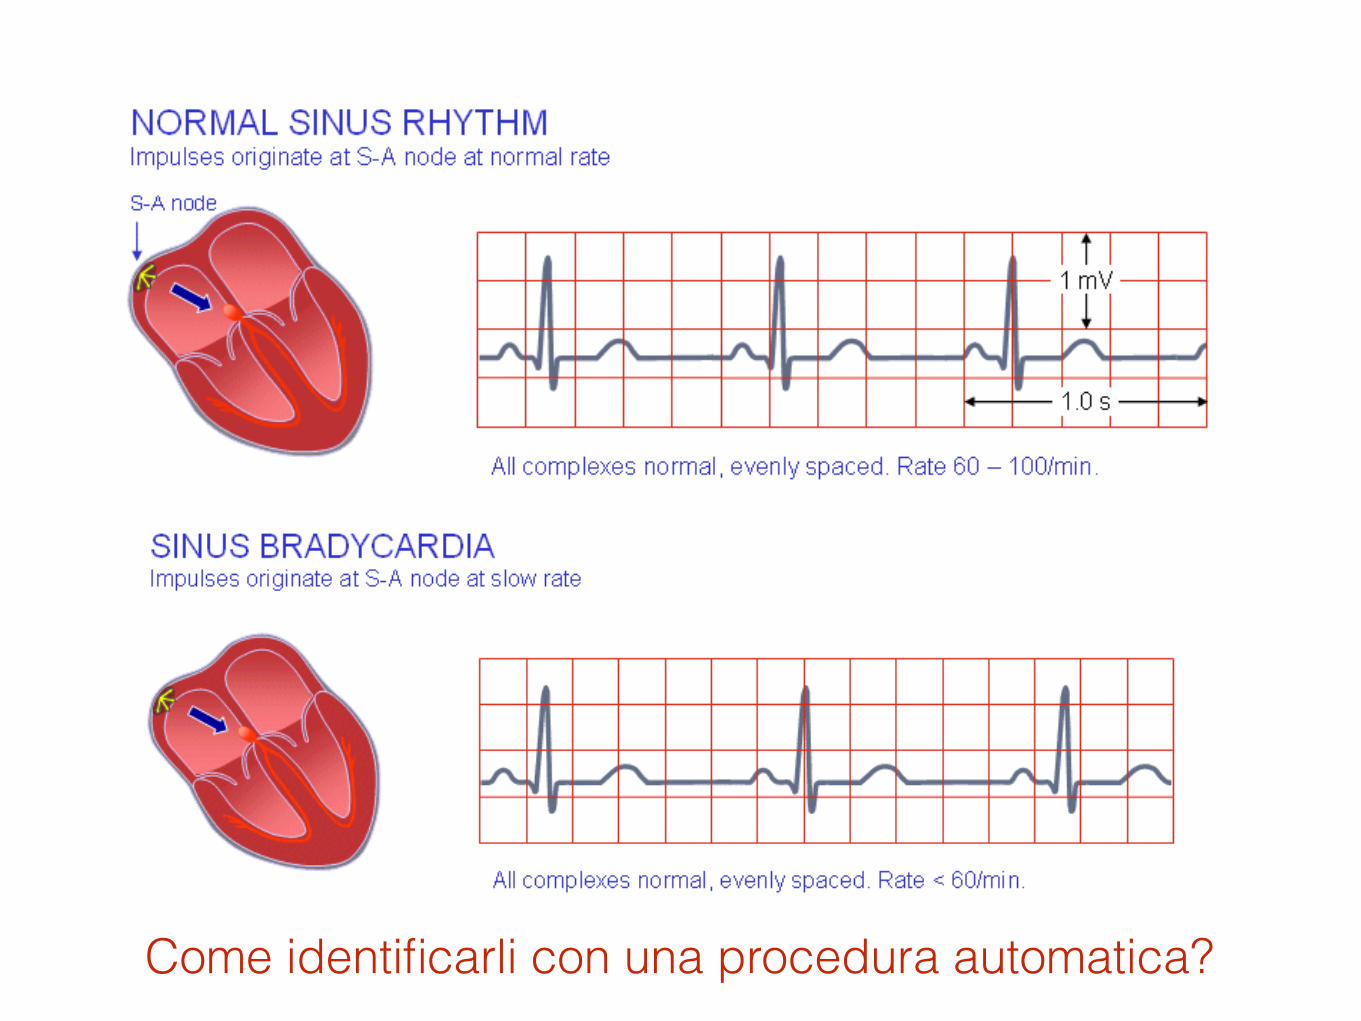
Normal sinus rhythm Normal sinus rhythm is the rhythm of a healthy normal heart, where the sinus node triggers the cardiac activation. This is easily diagnosed by noting that the three deflections, P-QRS-T, follow in this order and are differentiable. The sinus rhythm is normal if its frequency is between 60 and 100/min.<
Fig. 19.2.A Normal sinus rhythm.
Sinus bradycardia A sinus rhythm of less than 60/min is called sinus bradycardia. This may be a consequence of increased vagal or parasympathetic tone.
Fig. 19.2.B Sinus bradycardia.
Sinus tachycardia A sinus rhythm of higher than 100/min is called sinus tachycardia. It occurs most often as a physiological response to physical exercise or psychical stress, but may also result from congestive heart failure. 441 forrás: BioLabor Biofizikai és Laboratóriumi Szolg. Kft. www.biolabor.hu
Normal sinus rhythm Normal sinus rhythm is the rhythm of a healthy normal heart, where the sinus node triggers the cardiac activation. This is easily diagnosed by noting that the three deflections, P-QRS-T, follow in this order and are differentiable. The sinus rhythm is normal if its frequency is between 60 and 100/min.<
Fig. 19.2.A Normal sinus rhythm.
Sinus bradycardia A sinus rhythm of less than 60/min is called sinus bradycardia. This may be a consequence of increased vagal or parasympathetic tone.
Fig. 19.2.B Sinus bradycardia.
Sinus tachycardia A sinus rhythm of higher than 100/min is called sinus tachycardia. It occurs most often as a physiological response to physical exercise or psychical stress, but may also result from congestive heart failure.
Come identificarli con una procedura automatica?

442 forrás: BioLabor Biofizikai és Laboratóriumi Szolg. Kft. www.biolabor.hu
Fig. 19.2.C Sinus tachycardia.
Sinus arrhythmia If the sinus rhythm is irregular such that the longest PP- or RR-interval exceeds the shortest interval by 0.16 s, the situation is called sinus arrhythmia. This situation is very common in all age groups. This arrhythmia is so common in young people that it is not considered a heart disease. One origin for the sinus arrhythmia may be the vagus nerve which mediates respiration as well as heart rhythm. The nerve is active during respiration and, through its effect on the sinus node, causes an increase in heart rate during inspiration and a decrease during expiration. The effect is particularly pronounced in children.
Note, that in all of the preceding rhythms the length of the cardiac activation cycle (the P-QRS-T-waves together) is less than directly proportional to the PP-time. The main time interval change is between the T-wave and the next P-wave. This is easy to understand since the pulse rate of the sinus node is controlled mainly by factors external to the heart while the cardiac conduction velocity is controlled by conditions internal to the heart.
443 forrás: BioLabor Biofizikai és Laboratóriumi Szolg. Kft. www.biolabor.hu
Fig. 19.2.D Sinus arrhythmia.
Nonsinus atrial rhythm The origin of atrial contraction may be located somewhere else in the atria other than the sinus node. If it is located close to the AV node, the atrial depolarization occurs in a direction that is opposite the normal one. An obvious consequence is that in the ECG the P-wave has opposite polarity..
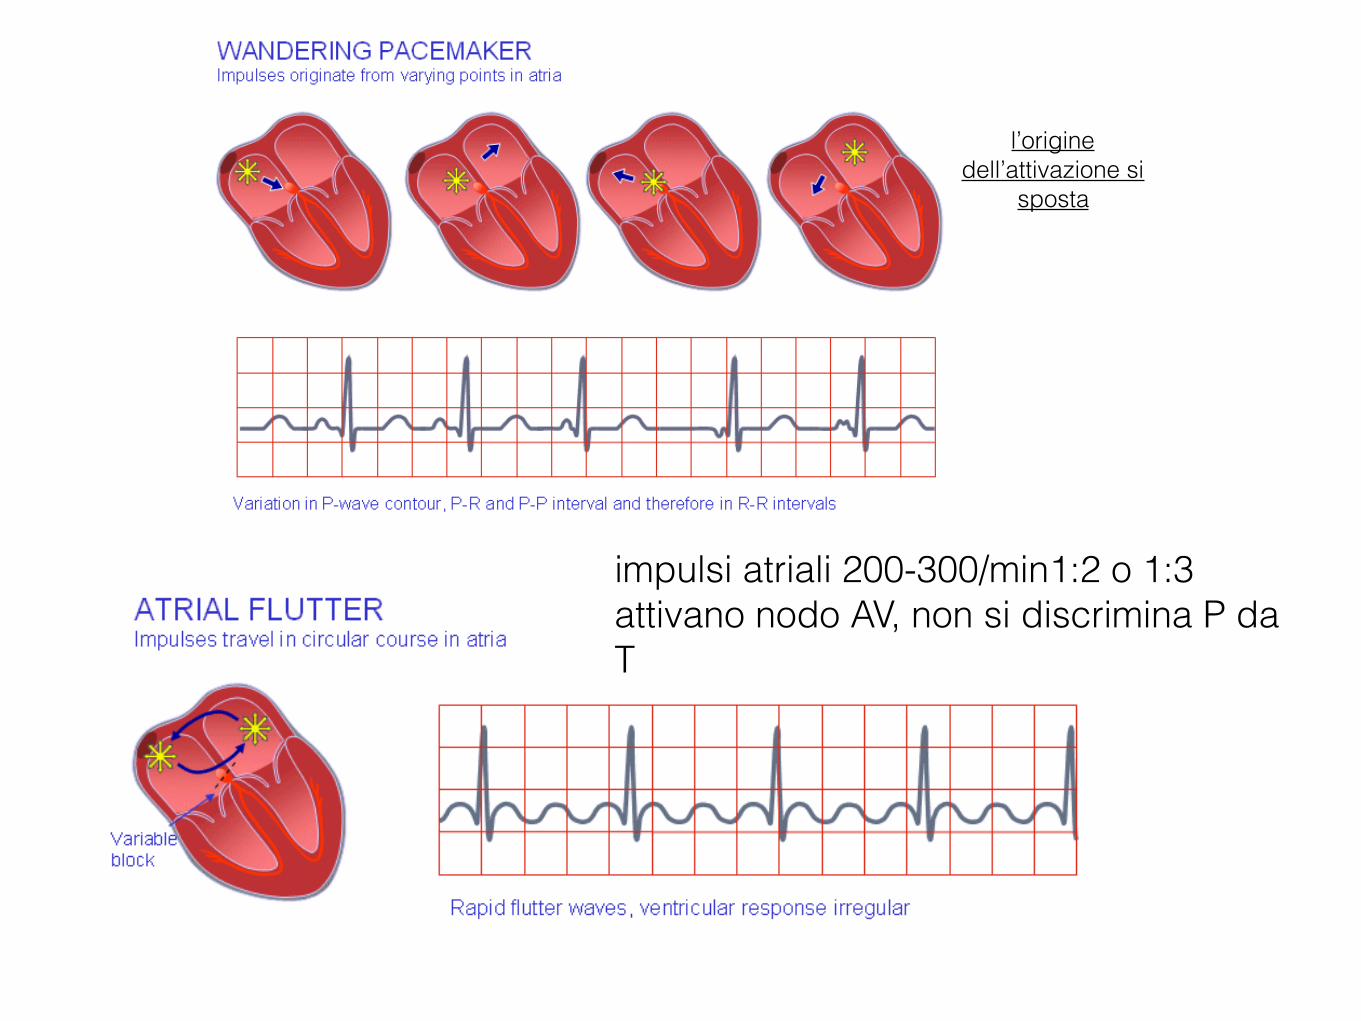
Wandering pacemaker The origin of the atrial contraction may also vary or wander. Consequently, the P-waves will vary in polarity, and the PQ-interval will also vary.

Ritmi sopraventricolari - ritmi non-sinusali
(non generati nel nodo SA - se vicini ad AV direzione opposta e segno onda P opposto - in generale onde P -
complessi QRS normali anche se non spaziati regolarmente)
444 forrás: BioLabor Biofizikai és Laboratóriumi Szolg. Kft. www.biolabor.hu
Fig. 19.2.E Wandering pacemaker.
Paroxysmal atrial tachycardia (PAT) Paroxysmal atrial tachycardia (PAT) describes the condition when the P-waves are a result of a reentrant activation front (circus movement) in the atria, usually involving the AV node. This leads to a high rate of activation, usually between 160 and 220/min. In the ECG the P-wave is regularly followed by the QRS-complex. The isoelectric baseline may be seen between the T-wave and the next P-wave.
Atrial flutter When the heart rate is sufficiently elevated so that the isoelectric interval between the end of T and beginning of P disappears, the arrhythmia is called atrial flutter. The origin is also believed to involve a reentrant atrial pathway. The frequency of these fluctuations is between 220 and 300/min. The AV-node and, thereafter, the ventricles are generally activated by every second or every third atrial impulse (2:1 or 3:1 heart block).
Fig. 19.2.F Atrial flutter.
impulsi atriali 200-300/min1:2 o 1:3 attivano nodo AV, non si discrimina P da T
l’origine dell’attivazione si
sposta

445 forrás: BioLabor Biofizikai és Laboratóriumi Szolg. Kft. www.biolabor.hu
Atrial fibrillation The activation in the atria may also be fully irregular and chaotic, producing irregular fluctuations in the baseline. A consequence is that the ventricular rate is rapid and irregular, though the QRS contour is usually normal. Atrial fibrillation occurs as a consequence of rheumatic disease, atherosclerotic disease, hyperthyroidism, and pericarditis. (It may also occur in healthy subjects as a result of strong sympathetic activation.)
Fig. 19.2.G Atrial fibrillation.
Junctional rhythm If the heart rate is slow (40-55/min), the QRS-complex is normal, the P-waves are possibly not seen, then the origin of the cardiac rhythm is in the AV node. Because the origin is in the juction between atria and ventricles, this is called junctional rhythm. Therefore, the activation of the atria occurs retrograde (i.e., in the opposite direction). Depending on whether the AV-nodal impulse reaches the atria before, simultaneously, or after the ventricles, an opposite polarity P-wave will be produced before, during, or after the QRS-complex, respectively. In the second case the P-wave will be superimposed on the QRS-complex and will not be seen.
Fig. 19.2.H Junctional rhythm.
19.4.3 Ventricular arrhythmias
Definition In ventricular arrhythmias ventricular activation does not originate from the AV node and/or does not proceed in the ventricles in a normal way. If the activation proceeds to the ventricles along the conduction system, the inner walls of the ventricles are activated almost simultaneously and the activation front proceeds mainly radially toward
origine nel nodo AV -> frequenza attivazione più bassa (onda P può sovrapporsi a QRS)
Aritmie ventricolari L’attivazione non si origina dal nodo AV e non si propaga nei ventricoli in modo normale (in generale complessi QRS di forma anomala)
Se l’attivazione procede ai ventricoli dal sistema di conduzione: pareti interne attivate simultaneamente e il fronte procede radialmente verso le pareti esterne (QRS di durata breve)
Se il sistema di conduzione è danneggiato o l’attivazione inizia lontano dal nodo AV: più tempo necessario al fronte di attivazione per attraversare tutta la massa ventricolare (QRS di durata lunga).
Normale attivazione ventricolare: durata QRS < 0.1 sec

446 forrás: BioLabor Biofizikai és Laboratóriumi Szolg. Kft. www.biolabor.hu
the outer walls. As a result, the QRS-complex is of relatively short duration. If the ventricular conduction system is broken or the ventricular activation starts far from the AV node, it takes a longer time for the activation front to proceed throughout the ventricular mass.
The criterion for normal ventricular activation is a QRS-interval shorter than 0.1 s. A QRS-interval lasting longer than 0.1 s indicates abnormal ventricular activation. Ventricular arrhythmias are presented in Figure 19.3.
Premature ventricular contraction A premature ventricular contraction is one that occurs abnormally early. If its origin is in the atrium or in the AV node, it has a supraventricular origin. The complex produced by this supraventricular arrhythmia lasts less than 0.1 s. If the origin is in the ventricular muscle, the QRS-complex has a very abnormal form and lasts longer than 0.1 s. Usually the P-wave is not associated with it.
Fig. 19.3.A Premature ventricular contraction.
Idioventricular rhythm If the ventricles are continuously activated by a ventricular focus whose rhythm is under 40/min, the rhythm is called idioventricular rhythm. The ventricular activity may also be formed from short (less than 20 s) bursts of ventricular activity at higher rates (between 40 and 120/min). This situation is called accelerated idioventricular rhythm.
The origin of the ventricular rhythm may be located by observing the polarity in various leads. The direction of the activation front is, of course, the direction of the lead vector in that lead where the deflection is most positive. The origin of the activation is, of course, on the opposite side of the heart when one is looking from this electrode.
Ventricular tachycardia A rhythm of ventricular origin may also be a consequence of a slower conduction in ischemic ventricular muscle that leads to circular activation (re-entry). The result is activation of the ventricular muscle at a high rate (over 120/min), causing rapid, bizarre, and wide QRS-complexes; the arrythmia is called ventricular tachycardia. As noted, ventricular tachycardia is often a consequence of ischemia and myocardial infarction.
Unico complesso di forma anomala, non è correlato con onda P, ha durata lunga se si genera nel muscolo ventricolare
447 forrás: BioLabor Biofizikai és Laboratóriumi Szolg. Kft. www.biolabor.hu
Fig. 19.3.B Ventricular tachycardia.
Ventricular fibrillation When ventricular depolarization occurs chaotically, the situation is called ventricular fibrillation. This is reflected in the ECG, which demonstrates coarse irregular undulations without QRS-complexes. The cause of fibrillation is the establishment of multiple re-entry loops usually involving diseased heart muscle. In this arrhythmia the contraction of the ventricular muscle is also irregular and is ineffective at pumping blood. The lack of blood circulation leads to almost immediate loss of consciousness and death within minutes. The ventricular fibrillation may be stopped with an external defibrillator pulse and appropriate medication.
Fig. 19.3.C Ventricular fibrillation.
Pacer rhythm A ventricular rhythm originating from a cardiac pacemaker is associated with wide QRS-complexes because the pacing electrode is (usually) located in the right ventricle and activation does not involve the conduction system. In pacer rhythm the ventricular contraction is usually preceded by a clearly visible pacer impulse spike. The pacer rhythm is usually set to 72/min..
spesso conseguenza di ischemia e infarto miocardico (l’attivazione circolare, torna indietro -> attivazione ventricolare a alta frequenza 100-200 battiti/min). Può portare alla fibrillazione
ventricolare

447 forrás: BioLabor Biofizikai és Laboratóriumi Szolg. Kft. www.biolabor.hu
Fig. 19.3.B Ventricular tachycardia.
Ventricular fibrillation When ventricular depolarization occurs chaotically, the situation is called ventricular fibrillation. This is reflected in the ECG, which demonstrates coarse irregular undulations without QRS-complexes. The cause of fibrillation is the establishment of multiple re-entry loops usually involving diseased heart muscle. In this arrhythmia the contraction of the ventricular muscle is also irregular and is ineffective at pumping blood. The lack of blood circulation leads to almost immediate loss of consciousness and death within minutes. The ventricular fibrillation may be stopped with an external defibrillator pulse and appropriate medication.
Fig. 19.3.C Ventricular fibrillation.
Pacer rhythm A ventricular rhythm originating from a cardiac pacemaker is associated with wide QRS-complexes because the pacing electrode is (usually) located in the right ventricle and activation does not involve the conduction system. In pacer rhythm the ventricular contraction is usually preceded by a clearly visible pacer impulse spike. The pacer rhythm is usually set to 72/min..
Causata da multipli cicli di attivazione retrograda dovuti al muscolo cardiaco danneggiato Contrazione irregolare con non sufficiente pompaggio di sangue Conseguenze mortali

Disordini alla sequenza di attivazione
(blocchi AV - blocchi fascio HIS dx o sx)

448 forrás: BioLabor Biofizikai és Laboratóriumi Szolg. Kft. www.biolabor.hu
Fig. 19.3.D Pacer rhythm.
19.5 DISORDERS IN THE ACTIVATION SEQUENCE
19.5.1 Atrioventricular conduction variations
Definition As discussed earlier, if the P-waves always precede the QRS-complex with a PR-interval of 0.12-0.2 s, the AV conduction is normal and a sinus rhythm is diagnosed. If the PR-interval is fixed but shorter than normal, either the origin of the impulse is closer to the ventricles (see Section 19.4.2) or the atrioventricular conduction is utilizing an (abnormal) bypass tract leading to pre-excitation of the ventricles. The latter is called the Wolff-Parkinson-White syndrome and is discussed below. The PR-interval may also be variable, such as in a wandering atrial pacemaker and multifocal atrial tachycardia. Atrioventricular blocks are illustrated in Figure 19.4.
First-degree atrioventricular block When the P-wave always precedes the QRS-complex but the PR-interval is prolonged over 0.2 s, first-degree atrioventricular block is diagnosed.
Fig. 19.4.A First-degree atrioventricular block.
449 forrás: BioLabor Biofizikai és Laboratóriumi Szolg. Kft. www.biolabor.hu
Second-degree atrioventricular block If the PQ-interval is longer than normal and the QRS-complex sometimes does not follow the P-wave, the atrioventricular block is of second-degree. If the PR-interval progressively lengthens, leading finally to the dropout of a QRS-complex, the second degree block is called a Wenkebach phenomenon.
Fig. 19.4.B Second-degree atrioventricular block.
Third-degree atrioventricular block Complete lack of synchronism between the P-wave and the QRS-complex is diagnosed as third-degree (or total) atrioventricular block. The conduction system defect in third degree AV-block may arise at different locations such as:
• Over the AV-node • In the bundle of His • Bilaterally in the upper part of both bundle branches • Trifascicularly, located still lower, so that it exists in the right bundle-branch and in the two fascicles of the
left bundle-branch.
Fig. 19.4.C Third-degree atrioventricular block.

451 forrás: BioLabor Biofizikai és Laboratóriumi Szolg. Kft. www.biolabor.hu
Fig. 19.5.A Right bundle-branch block.
Left bundle-branch block The situation in left bundle-branch block (LBBB) is similar, but activation proceeds in a direction opposite to RBBB. Again the duration criterion for complete block is 0.12 s or more for the QRS-complex. Because the activation wavefront travels in more or less the normal direction in LBBB, the signals' polarities are generally normal. However, because of the abnormal sites of initiation of the left ventricular activation front and the presence of normal right ventricular activation the outcome is complex and the electric heart vector makes a slower and larger loop to the left and is seen as a broad and tall R-wave, usually in leads I, aVL, V5, or V6.
durata QRS > 0.12sec
vettore P finale diretto verso RV (larga onda S in VI)
doppia onda R in V1
403 forrás: BioLabor Biofizikai és Laboratóriumi Szolg. Kft. www.biolabor.hu
Fig. 15.9. The projections of the lead vectors of the 12-lead ECG system in three orthogonal planes when one assumes the volume conductor to be spherical homogeneous and the cardiac source centrally located.
REFERENCES
Ader C (1897): Sur un nouvel appareil enregistreur pour cables sousmarins. Compt. rend. Acad. Sci. (Paris) 124: 1440-2. Durrer D, van Dam RT, Freud GE, Janse MJ, Meijler FL, Arzbaecher RC (1970): Total excitation of the isolated human heart.
Circulation 41:(6) 899-912. Einthoven W (1908): Weiteres über das Elektrokardiogram. Pflüger Arch. ges. Physiol. 122: 517-48. Einthoven W, Fahr G, de Waart A (1913): Über die Richtung und die Manifeste Grösse der Potentialschwankungen im
mennschlichen Herzen und über den Einfluss der Herzlage auf die form des Elektrokardiogramms. Pflüger Arch. ges. Physiol. 150: 275-315.
Einthoven W, Fahr G, de Waart A (1950): On the direction and manifest size of the variations of potential in the human heart and on the influence of the position of the heart on the form of the electrocardiogram. Am. Heart J. 40:(2) 163-211. (Reprint 1913, translated by HE Hoff, P Sekelj).
Geselowitz DB (1964): Dipole theory in electrocardiography. Am. J. Cardiol. 14:(9) 301-6. Goldberger E (1942a): The aVL, aVR, and aVF leads; A simplification of standard lead electrocardiography. Am. Heart J. 24:
378-96. Goldberger E (1942b): A simple indifferent electrocardiographic electrode of zero potential and a technique of obtaining
augmented, unipolar extremity leads. Am. Heart J. 23: 483-92. Mason R, Likar L (1966): A new system of multiple leads exercise electrocardiography. Am. Heart J. 71:(2) 196-205. Netter FH (1971): Heart, Vol. 5, 293 pp. The Ciba Collection of Medical Illustrations, Ciba Pharmaceutical Company, Summit,
N.J. Scher AM, Young AC (1957): Ventricular depolarization and the genesis of the QRS. Ann. N.Y. Acad. Sci. 65: 768-78.

452 forrás: BioLabor Biofizikai és Laboratóriumi Szolg. Kft. www.biolabor.hu
Fig. 19.5.B Left bundle-branch block.
19.5.3 Wolff-Parkinson-White syndrome One cause for a broad QRS-complex that exceeds over 0.12 s, may be the Wolff-Parkinson-White syndrome (WPW syndrome). In the WPW syndrome the QRS-complex initially exhibits an early upstroke called the delta wave. The interval from the P-wave to the R spike is normal, but the early ventricular excitation forming the delta wave shortens the PQ-time.
The cause of the WPW syndrome is the passage of activation from the atrium directly to the ventricular muscle via an abnormal route, called the bundle of Kent, which bypasses the AV junctions. This activates part of the ventricular muscle before normal activation reaches it via the conduction system (after a delay in the AV junction). The process is called pre-excitation, and the resulting ECG depends on the specific location of the accessory pathway.
durata QRS > 0.12sec
polarità normale (impulso viaggia in direzione normale)
più lento e vettore più spostato a Sx (VI, aVL, V5, V6).
403 forrás: BioLabor Biofizikai és Laboratóriumi Szolg. Kft. www.biolabor.hu
Fig. 15.9. The projections of the lead vectors of the 12-lead ECG system in three orthogonal planes when one assumes the volume conductor to be spherical homogeneous and the cardiac source centrally located.
REFERENCES
Ader C (1897): Sur un nouvel appareil enregistreur pour cables sousmarins. Compt. rend. Acad. Sci. (Paris) 124: 1440-2. Durrer D, van Dam RT, Freud GE, Janse MJ, Meijler FL, Arzbaecher RC (1970): Total excitation of the isolated human heart.
Circulation 41:(6) 899-912. Einthoven W (1908): Weiteres über das Elektrokardiogram. Pflüger Arch. ges. Physiol. 122: 517-48. Einthoven W, Fahr G, de Waart A (1913): Über die Richtung und die Manifeste Grösse der Potentialschwankungen im
mennschlichen Herzen und über den Einfluss der Herzlage auf die form des Elektrokardiogramms. Pflüger Arch. ges. Physiol. 150: 275-315.
Einthoven W, Fahr G, de Waart A (1950): On the direction and manifest size of the variations of potential in the human heart and on the influence of the position of the heart on the form of the electrocardiogram. Am. Heart J. 40:(2) 163-211. (Reprint 1913, translated by HE Hoff, P Sekelj).
Geselowitz DB (1964): Dipole theory in electrocardiography. Am. J. Cardiol. 14:(9) 301-6. Goldberger E (1942a): The aVL, aVR, and aVF leads; A simplification of standard lead electrocardiography. Am. Heart J. 24:
378-96. Goldberger E (1942b): A simple indifferent electrocardiographic electrode of zero potential and a technique of obtaining
augmented, unipolar extremity leads. Am. Heart J. 23: 483-92. Mason R, Likar L (1966): A new system of multiple leads exercise electrocardiography. Am. Heart J. 71:(2) 196-205. Netter FH (1971): Heart, Vol. 5, 293 pp. The Ciba Collection of Medical Illustrations, Ciba Pharmaceutical Company, Summit,
N.J. Scher AM, Young AC (1957): Ventricular depolarization and the genesis of the QRS. Ann. N.Y. Acad. Sci. 65: 768-78.

Incremento spessore pareti o dimensioni di atri e/o ventricoli
(sovraccarico)

454 forrás: BioLabor Biofizikai és Laboratóriumi Szolg. Kft. www.biolabor.hu
Fig. 19.6 Atrial hypertrophy.
19.6.3 Ventricular hypertrophy
Right ventricular hypertrophy Right ventricular hypertrophy is a consequence of right ventricular overload. This is caused by pulmonary valve stenosis, tricuspid insufficiency, or pulmonary hypertension (see above). Also many congenital cardiac abnormalities, such as a ventricular septal defect, may cause right ventricular overload.
Right ventricular hypertrophy increases the ventricular electrical forces directed to the right ventricle - that is, to the right and front. This is seen in lead V1 as a tall R-wave of 0.7 mV.
onda P>=25mV
doppio picco onda p
(impulso generato ASx)
valvola tricuspide valvola polmonare ipertensione polmonare
valvola mitrale ipertensione sistemica
403 forrás: BioLabor Biofizikai és Laboratóriumi Szolg. Kft. www.biolabor.hu
Fig. 15.9. The projections of the lead vectors of the 12-lead ECG system in three orthogonal planes when one assumes the volume conductor to be spherical homogeneous and the cardiac source centrally located.
REFERENCES
Ader C (1897): Sur un nouvel appareil enregistreur pour cables sousmarins. Compt. rend. Acad. Sci. (Paris) 124: 1440-2. Durrer D, van Dam RT, Freud GE, Janse MJ, Meijler FL, Arzbaecher RC (1970): Total excitation of the isolated human heart.
Circulation 41:(6) 899-912. Einthoven W (1908): Weiteres über das Elektrokardiogram. Pflüger Arch. ges. Physiol. 122: 517-48. Einthoven W, Fahr G, de Waart A (1913): Über die Richtung und die Manifeste Grösse der Potentialschwankungen im
mennschlichen Herzen und über den Einfluss der Herzlage auf die form des Elektrokardiogramms. Pflüger Arch. ges. Physiol. 150: 275-315.
Einthoven W, Fahr G, de Waart A (1950): On the direction and manifest size of the variations of potential in the human heart and on the influence of the position of the heart on the form of the electrocardiogram. Am. Heart J. 40:(2) 163-211. (Reprint 1913, translated by HE Hoff, P Sekelj).
Geselowitz DB (1964): Dipole theory in electrocardiography. Am. J. Cardiol. 14:(9) 301-6. Goldberger E (1942a): The aVL, aVR, and aVF leads; A simplification of standard lead electrocardiography. Am. Heart J. 24:
378-96. Goldberger E (1942b): A simple indifferent electrocardiographic electrode of zero potential and a technique of obtaining
augmented, unipolar extremity leads. Am. Heart J. 23: 483-92. Mason R, Likar L (1966): A new system of multiple leads exercise electrocardiography. Am. Heart J. 71:(2) 196-205. Netter FH (1971): Heart, Vol. 5, 293 pp. The Ciba Collection of Medical Illustrations, Ciba Pharmaceutical Company, Summit,
N.J. Scher AM, Young AC (1957): Ventricular depolarization and the genesis of the QRS. Ann. N.Y. Acad. Sci. 65: 768-78.

455 forrás: BioLabor Biofizikai és Laboratóriumi Szolg. Kft. www.biolabor.hu
Fig. 19.7.A Right ventricular hypertrophy.
Left ventricular hypertrophy Left ventricular hypertrophy is a consequence of left ventricular overload. It arises from mitral valve disease, aortic valve disease, or systemic hypertension. Left ventricular hypertrophy may also be a consequence of obstructive hypertrophic cardiomyopathy, which is a sickness of the cardiac muscle cells.
Left ventricular hypertrophy increases the ventricular electric forces directed to the left ventricle - that is, to the left and posteriorly. Evidence of this is seen in lead I as a tall R-wave and in lead III as a tall S-wave ( 2.5 mV). Also a tall S-wave is seen in precordial leads V1 and V2 and a tall R-wave in leads V5 and V6, ( 3.5 mV).
stenosi valvola polmonare ipertensione polmonare insufficienza v. tricuspide
onda R>=0.7mV
403 forrás: BioLabor Biofizikai és Laboratóriumi Szolg. Kft. www.biolabor.hu
Fig. 15.9. The projections of the lead vectors of the 12-lead ECG system in three orthogonal planes when one assumes the volume conductor to be spherical homogeneous and the cardiac source centrally located.
REFERENCES
Ader C (1897): Sur un nouvel appareil enregistreur pour cables sousmarins. Compt. rend. Acad. Sci. (Paris) 124: 1440-2. Durrer D, van Dam RT, Freud GE, Janse MJ, Meijler FL, Arzbaecher RC (1970): Total excitation of the isolated human heart.
Circulation 41:(6) 899-912. Einthoven W (1908): Weiteres über das Elektrokardiogram. Pflüger Arch. ges. Physiol. 122: 517-48. Einthoven W, Fahr G, de Waart A (1913): Über die Richtung und die Manifeste Grösse der Potentialschwankungen im
mennschlichen Herzen und über den Einfluss der Herzlage auf die form des Elektrokardiogramms. Pflüger Arch. ges. Physiol. 150: 275-315.
Einthoven W, Fahr G, de Waart A (1950): On the direction and manifest size of the variations of potential in the human heart and on the influence of the position of the heart on the form of the electrocardiogram. Am. Heart J. 40:(2) 163-211. (Reprint 1913, translated by HE Hoff, P Sekelj).
Geselowitz DB (1964): Dipole theory in electrocardiography. Am. J. Cardiol. 14:(9) 301-6. Goldberger E (1942a): The aVL, aVR, and aVF leads; A simplification of standard lead electrocardiography. Am. Heart J. 24:
378-96. Goldberger E (1942b): A simple indifferent electrocardiographic electrode of zero potential and a technique of obtaining
augmented, unipolar extremity leads. Am. Heart J. 23: 483-92. Mason R, Likar L (1966): A new system of multiple leads exercise electrocardiography. Am. Heart J. 71:(2) 196-205. Netter FH (1971): Heart, Vol. 5, 293 pp. The Ciba Collection of Medical Illustrations, Ciba Pharmaceutical Company, Summit,
N.J. Scher AM, Young AC (1957): Ventricular depolarization and the genesis of the QRS. Ann. N.Y. Acad. Sci. 65: 768-78.

456 forrás: BioLabor Biofizikai és Laboratóriumi Szolg. Kft. www.biolabor.hu
Fig. 19.7.B Left ventricular hypertrophy.
19.7 MYOCARDIAL ISCHEMIA AND INFARCTION
If a coronary artery is occluded, the transport of oxygen to the cardiac muscle is decreased, causing an oxygen debt in the muscle, which is called ischemia. Ischemia causes changes in the resting potential and in the repolarization of the muscle cells, which is seen as changes in the T-wave. If the oxygen transport is terminated in a certain area, the heart muscle dies in that region. This is called an infarction. These are illustrated in Figure 19.8.
An infarct area is electrically silent since it has lost its excitability. According to the solid angle theorem (Section 11.2.2) the loss of this outward dipole is equivalent to an electrical force pointing inward. With this principle it is possible to locate the infarction. (Of course, the infarct region also affects the activation sequence and the volume conductor so the outcome is more complicated.)
valvola mitrale valvola aortica ipertensione sistemica
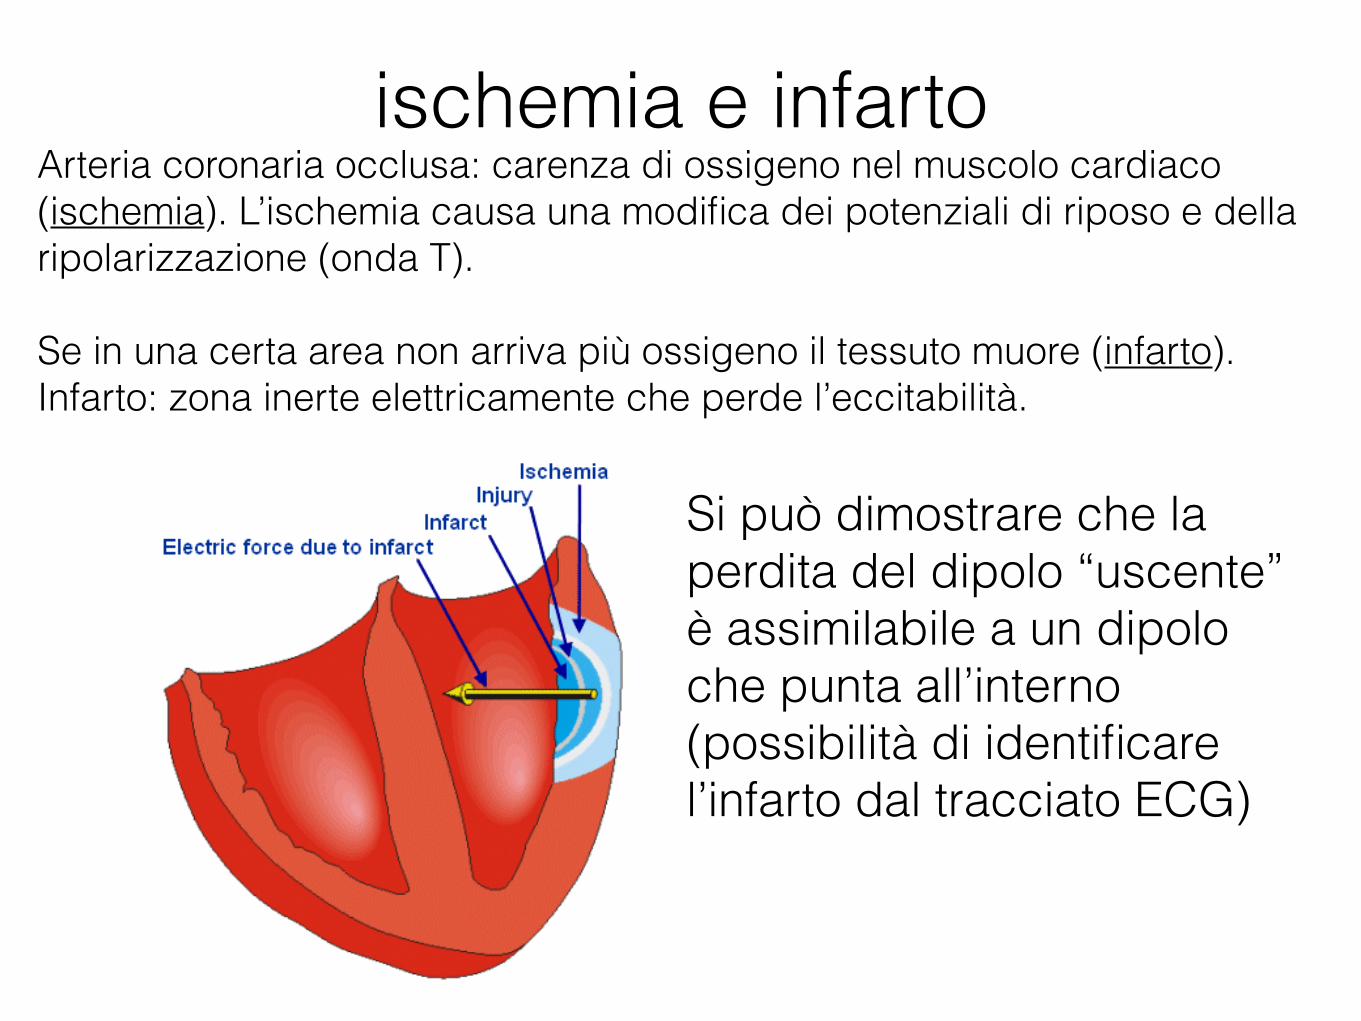
ischemia e infartoArteria coronaria occlusa: carenza di ossigeno nel muscolo cardiaco (ischemia). L’ischemia causa una modifica dei potenziali di riposo e della ripolarizzazione (onda T).
Se in una certa area non arriva più ossigeno il tessuto muore (infarto). Infarto: zona inerte elettricamente che perde l’eccitabilità.
457 forrás: BioLabor Biofizikai és Laboratóriumi Szolg. Kft. www.biolabor.hu
Figure 19.8 Myocardial ischemia and infarction.
REFERENCES
Goldman MJ (1986): Principles of Clinical Electrocardiography, 12th ed., 460 pp. Lange Medical Publications, Los Altos, Cal.
Macfarlane PW, Lawrie TDV (eds.) (1989): Comprehensive Electrocardiology: Theory and Practice in Health and Disease, 1st ed., Vols. 1, 2, and 3, 1785 pp. Pergamon Press, New York.
Netter FH (1971): Heart, Vol. 5, 293 pp. The Ciba Collection of Medical Illustrations, Ciba Pharmaceutical Company, Summit, N.J.
Scheidt S (1983): Basic Electrocardiography: Leads, Axes, Arrhythmias, Vol. 2/35, 32 pp. Ciba Pharmaceutical Company, Summit, N.J.
Scheidt S (1984): Basic Electrocardiography: Abnormalities of Electrocardiographic Patterns, Vol. 6/36, 32 pp. Ciba Pharmaceutical Company, Summit, N.J.
http://www.bem.fi/book/19/19.htm
Si può dimostrare che la perdita del dipolo “uscente” è assimilabile a un dipolo che punta all’interno (possibilità di identificare l’infarto dal tracciato ECG)

Utilizzo di database
• Il database Physionet contiene tracciati ECG registrati sotto le più disparate condizioni: http://www.physionet.org/physiobank/database/#ecg
• ECG con aritmie: http://www.physionet.org/physiobank/database/mitdb/