
QUADERNI DELL’ISTITUTO DI ECONOMIA E …€™ CATTOLICA DEL SACRO CUORE - Milano - QUADERNI...
30
UNIVERSITA’ CATTOLICA DEL SACRO CUORE - Milano - QUADERNI DELL’ISTITUTO DI ECONOMIA E FINANZA Stock-bond correlation and the bond quality ratio: Removing the discount factor to generate a “deflated” stock index Andrea Terzi Giovanni Verga n. 67 - luglio 2006
Transcript of QUADERNI DELL’ISTITUTO DI ECONOMIA E …€™ CATTOLICA DEL SACRO CUORE - Milano - QUADERNI...
UNIVERSITA’ CATTOLICA DEL SACRO CUORE - Milano -
QUADERNI DELL’ISTITUTO DI ECONOMIA E FINANZA
Stock-bond correlation and the bond quality ratio: Removing the discount factor to generate a “deflated” stock index
Andrea Terzi Giovanni Verga
n. 67 - luglio 2006

Quaderni dell’Istituto di Economia e Finanza numero 67 luglio 2006
Stock-bond correlation and the bond quality ratio: Removing the discount factor to generate a “deflated” stock index
Andrea Terzi (*) Giovanni Verga (**)
(*) Area of Economics and Finance, Franklin College Switzerland, Via Ponte Tresa 29, CH 6924 Lugano, e-mail: [email protected] ; and Istituto di Economia e Finanza, Università Cattolica del Sacro Cuore (**) Dipartimento di Economia, Università degli Studi di Parma, Via Kennedy 6 – 43100 Parma, e-mail: [email protected]

Comitato Scientifico Redazione Dino Piero Giarda Istituto di Economia e Finanza Michele Grillo Università Cattolica del S. Cuore Pippo Ranci Via Necchi, 5 Giacomo Vaciago 20123 Milano tel.: 0039.02.7234.2976 fax: 0039.02.7234.2781 e-mail: [email protected] * La Redazione ottempera agli obblighi previsti dell’art. 1 del D.L.L. 31.8.1945, n. 660 e successive modifiche. * I quaderni sono disponibili on-line all’indirizzo dell’Istituto http://www.unicatt.it/istituti/EconomiaFinanza * I Quaderni dell’Istituto di Economia e Finanza costituiscono un servizio atto a fornire la tempestiva divulgazione di ricerche scientifiche originali, siano esse in forma definitiva o provvisoria. L’accesso alla collana è approvato dal Comitato Scientifico, sentito il parere di un referee.

Abstract
This paper investigates the cyclical co-movements between US stocks and interest rates
by testing a simple model where divergence between stock and bond price behavior is
explained by “stock market strength,” where the latter depends on the market climate
about future corporate profits—as captured by the corporate bond quality ratio—and an
unexplained stock market sentiment. Using two different regression techniques to check
for robustness, we find evidence of a statistically significant cyclical correlation
between stocks and bonds. On the basis of this finding, we then present a methodology
to “deflate” a stock price index such that we can compare stock market strength over
time. This is obtained by removing the effect of a changing discount rate—as measured
by our regressions—on stock prices. For example, viewed in this light, the past five
years in the US stock market reveal a wider fluctuation in stock market strength than we
can observe on the basis of stock price indices alone.
JEL classification: D84, G12, G14
Keywords: Stock-bond correlation, Market sentiment, Stock price.
1
1. INTRODUCTION
Empirical research on the correlation of the movements of bond and stock prices dates
at least from the pioneering work of Frederick Macaulay, and has drawn renewed
attention over the past twenty years in the light of the theoretical development of
general equilibrium asset pricing models, with special reference to the question of
optimal portfolio diversification. Financial analysts observe co-movements between
stocks and bonds closely, as these have a bearing on portfolio risk. In a strategic asset
allocation perspective, a higher stock-bond positive correlation increases overall
portfolio risk.
A well-known theoretical account of the relation between bond and stock prices
begins with the statement that both bonds and stocks are claims to future cash flows, as
they both consist of an exchange of money today for an expectation of money flows in
the future. Thus, their price should reflect a market assessment of the present value of
the expected future cash stream, and—in a partial equilibrium setting—any change in
the market capitalization rate (i.e., a market-consensus estimate of the appropriate
discount rate for future cash flows) should equally affect both bond and stock prices. If
market participants, lowered (raised) their capitalization rate, both bond and stock prices
should rise (fall).
Not surprisingly, however, feedback effects in a general equilibrium setting blur
the underlying relationship between bonds and stocks. If, in a recession, a drop in
corporate profit and dividend expectations is linked to lower rates, then the correlation
between stocks and bonds may show statistically weaker; and, in the event that the
impact of lower expectations more than offsets that of a lower capitalization rate,
correlation may even turn negative. This is the case when US Treasury bonds rally
when stock prices dive, a phenomenon, called “decoupling”, that characterized financial
markets in the past few years, when correlation between US stocks and bonds has
turned from moderately positive to moderately or strongly negative, and diversification
opportunities have been comparatively improved.
Reversals of the stock-bond correlation have fueled interest on the determinants
of the changing relation between stocks and bonds, an important question for long-term
asset allocation decisions. It is now generally understood that the co-movement of

2
stocks and bonds is time varying, although authors differ in indicating the factors that
best forecast the stock-bond correlation. Gulko (2002) showed evidence that stock-bond
correlation switches sign during stock market crashes, thus bonds offer a safe heaven to
investors “at the time diversification is needed most.” Li (2002) stresses uncertainty
about expected inflation as the primary explanatory variable of the trends in stock-bond
correlation, and concludes that “diversification opportunities are least available when
they are most needed”, i.e., when inflation risk is higher. Stivers and Sun (2002) find
that stocks and bonds co-movements are higher during periods of lower stock market
uncertainty that they measure with the implied volatility from equity index options.
Ilmanen (2003) finds that a negative correlation is more likely with low inflation, slow
growth, and when safe-heaven uncertainties overwhelm discount rate and inflation
uncertainties. Baur and Lucey (2006) find that higher stock market volatility (and lower
bond market volatility) decrease stock-bond correlation, reflecting “flight to quality”.
The search for the ultimate determinants of the time-varying nature of the stock-
bond correlation, relevant for strategic asset allocation, is one, though not the primary
object of this study. From Macaulay’s work we draw the idea that the cyclical
movements of stock and bond prices are much more closely related than the long-term
trends. Focusing on the cyclical stock-bond relation we aim to verify empirically the
robustness of this cyclical correlation, and use our results to suggest an interpretation of
stock market behavior.
Indeed, we notice that a number of market commentators and financial analysts
seem not to fully appreciate a consequence of the cyclical correlation between bond and
stock prices. Although it is well understood that stock prices are influenced by interest
rates it is a common attitude to scrutinize stock market behavior on the basis of outright
comparisons of absolute stock price levels over time, when interest rates normally
fluctuate. An example of outright comparisons in press commentaries has emerged after
the Dow Jones Industrial Average (DJIA) passed the 10,000 mark for the first time in
1999 only to sag back in 2000 and fluctuate within a not too broad range since then.
Supposition has been made that investors see the round number mark as a
“psychological barrier”: see, for example, Mitchell (2001). In the same fashion, some
commentators had explained the fluctuations of the DJIA around the round number of
1,000 in the 60s and 70s. Irrespective of what our readers think of this supposition, it is

3
a fact that we all tend to read stock market behavior by comparing the absolute level of
stock prices at different dates. All absolute price level comparisons miss the important
point that the meaning of the absolute value of a stock price index at any given date is
strongly shaped by the level of the current capitalization rate at that date. In other
words, a 10,000 Dow-Jones average when the market capitalization rate is 10% reflects
stronger market expectations of future cash flows as compared with the same absolute
level at a different date when the capitalization rate is 2%.
This character of stock prices is equally overlooked by analysts who discuss
“resistance levels” to detect peaks, troughs, and bull and bear cycles, as if a given level
of the stock market index meant the same set of expectations with any capitalization
rate. Comparison of historical price-earnings ratios as a reference to determine whether
current ratios are “high” or “low” is also flawed when one considers that the price of a
stock must reflect very different expectations depending on the capitalization rate of the
expected cash stream. In other words, a price-earnings ratio of 10 implies a different set
of expectations when the market capitalization rate is 10% as opposed to 2%.
Market analysts who choose not to ignore this problem resort to measures that
compare stock and bond returns, such as the difference between earnings/price ratios
and long-term Treasury yields. Interpretation of such comparison, however, is far from
straightforward, given the time-varying character of the correlation between stocks and
bonds. Macauley (1938, p. 135) thought “a (hypothetical) stock ‘yield’ is not an animal
of the same species, or even genus, as a (hypothetical) bond yield”. We believe that
studying stock-bond cyclical correlation may help throwing light on the significance of
the stock-bond yields differential, as well.
In two previous studies (Terzi-Verga 1992, 1993), we had considered the
cyclical character of the correlation between stocks and government bond yields in the
US and other five countries, and had explored the possibility to generating a
“sentiment” indicator that would estimate stock market investors’ confidence
independently of the level of interest rates. This paper extends those results to provide
evidence of a cyclical correlation between stock prices and bond yields, and recommend
a simple tool to measure the strength of the stock market independent of the level of
interest rates as well as to assess the information content of the stock-bond yield
4
differential.
We begin by formulating a simple model where stocks depend on bond yields
and a stock-specific factor that we generally call “stock market strength”. This, on its
turn, has two components: market expectations of future corporate profits and a
separate, unexplained element that we describe as “stock market sentiment”. We then
test for the cyclical correlation between long-term government bond yields (that we use
as a proxy for investors’ capitalization rates) and stock prices, using the bond quality
ratio as a proxy for the market climate about future corporate profits.1
Having found evidence of a statistically significant cyclical correlation, we then
propose a methodology to “deflate” a stock price index that mirrors that of deflating
nominal GDP to find a “real” measure of output. In the same way as a 10 trillion dollar
GDP at current prices measures different amounts of output depending on the average
price level, a 10,000 Dow-Jones Industrial Average measures different market
expectations depending on what the market-consensus capitalization rate is.
When deflating nominal GDP, we use the purchasing power of money with
respect to currently produced goods and services, compared to a base year. To deflate
the stock market index we use the purchasing power of money with respect to future
cash flow streams, i.e., the rate of interest, compared to a reference level. The aim is to
remove the effect of a changing capitalization rate over stock prices, and thus unveil
stock market strength in such a way that it can legitimately be compared across time. By
further removing the effect of the bond quality ratio from stock prices, one can attempt
to measure “stock market sentiment” as the residual element explaining stock market
behavior.
The paper is organized as follows. In the next section, we discuss our theoretical
framework. In section 3 we present our data sample and discuss our empirical analysis,
using two different methodologies to check for robustness, and explain our results. In
section 4, we discuss the “deflated” stock market index and construct a stock market
confidence indicator after removing the cyclical capitalization rate effect.
1 We interpret the bond quality ratio as combining information about market expectations as well as risk considerations.

5
2. THEORETICAL BACKGROUND
We begin by assuming that stocks embody an exchange of present money for an
expectation of future cash flows, and their price is the present value of an expected
future payment stream, discounted with an appropriate capitalization rate. This means
that a change in the capitalization rate causes an inverse movement in the present value
of future expected streams. Although the degree of sensitivity of stock prices to changes
in the capitalization rate must be determined empirically, the inverse relation between
price and the capitalization rate is illustrated in the Gordon (1962) constant growth
formula: the formula explaining the price of a stock whose dividends are expected to
grow at a constant rate takes the form of a ratio between the next expected dividend and
the difference between the capitalization rate and the expected dividends growth rate.
More in general, and without formulating the constant dividend growth
hypothesis, we assume that stock prices (PS) depend on the expected payment stream of
stocks (ES), a market capitalization rate of expected streams from stocks (RS), and a risk
factor (ρS) that will influence stock prices through the evaluation of the risk-free ES
equivalent:
(1) ),,( SSSSS REPP ρ= .
The market capitalization rate used for pricing stocks is not directly observable,
and we assume that it is the same as the market capitalization rate used for pricing
default-free long-term bonds. The intuition here is that the yield on the bonds with long
maturity (RB) is the best observable indicator of the capitalization rate (not including a
risk factor) for cash streams (such as those from stocks) that extend into the indefinite
future. We thus explain stock prices with the following:
(2) ),,( SBSSS REPP ρ= ,
where we expect a positive sign for the ES coefficient and a negative sign for both the
RB and the ρS coefficient.
A problem with estimating the parameters of this equation is that regressors are
not independent. One would therefore not necessarily expect to find a stable, negative
relationship between the capitalization rate and stock prices, as implied by the
theoretical, inverse correlation between PS and RB. Changes in the other two regressors
6
(ES and ρS) may empirically obscure the underlying relationship between PS and RB if
such changes are not independent of changes in RB. During an economic slowdown, for
example, we are likely to observe a drop in ES and a drop in RB, simultaneously. If a
drop of cash flow expectations from corporate stocks is being concurrent with a drop of
the long-term rate, then the downward revision of ES will push stock prices down at a
time when the drop in RB is pushing prices up. While the effect on bonds is a rise in
prices, the net effect on stocks is ambiguous, as it depends on which factor
predominates. If the effect of worsening profit expectations outweighs the effect of
lower rates, stock prices fall while bond prices rise. This means that if we empirically
observe a low (or even negative) correlation between stock and bond prices, this does
not necessarily mean that stocks do not respond to changes in the capitalization rate;
rather, a negative correlation may be consistent with the hypothesis that lower profit
expectations (and possibly a rising risk factor) predominate.
Macaulay (1938) had already recognized this characteristic of the relation
between stocks and bonds. Comparing American Railroad stock and bond prices, he
observed “no real similarity between the long-term trends of the time series,” but found
that “the ‘cyclical’ movement of the two series are much more closely related than are
the long term trends” (p.156). The findings for our sample, discussed in the empirical
section of this paper, provide more evidence of this statement, and provide the ground
for constructing a stock market strength indicator.
There is one additional theoretical point that should be discussed before
considering the empirical evidence. If we believe that the correlation between stock
prices and bond yields is obscured by varying expectations and risk factors, our
empirical correlation should improve if we account for some measure of expectations
and risk. This procedure follows Macaulay’s consideration of a “prosperity index” as an
explanatory factor of changes in stock prices.
It is therefore reasonable to explain divergence between the behavior of stock
prices as that of the default-free long-term interest rate with a stock-specific factor, that
we call “stock market strength”, with two components: a) confidence in future expected
corporate profits as captured by an observable market indicator of expected business
prosperity, such as a ratio between high-grade and low-grade bonds; and b) an
7
unexplained “stock market sentiment”.
3. EMPIRICAL ANALYSIS
3.1. Data sample and methodology
The empirical analysis that follows aims at bringing to the fore the underlying, or
“hidden”, correlation between stocks and the capitalization rate. Within our theoretical
framework, this will be accomplished by employing three daily time series:
a) the daily S&P 500, a value-weighted broad market index of 500 leading US
companies, is our stock price index (SP500);
b) the daily US Treasury 10-year constant maturity annual yield is our long-term
government bond yield (R10); and
c) the daily average Moody’s seasoned corporate Baa yield for companies with medium
investment grade is our yield for corporate bonds with a comparatively lower grade
(RBAA) that we weigh against R10 to obtain a bond quality ratio.
Our sources are Yahoo-Finance for stock prices and the US Federal Reserve for
bond yields. The period runs from 2 January 1986 through 31 December 2005. The
starting point is imposed by one of our series (the Baa corporate bond yield) not being
available on a daily basis for prior years, so the period chosen could hardly extend
further in the past. The period, nevertheless, fits appropriately our scope, as it includes
sharp fluctuations in stock prices (such as the 1987 crash) while it does not include
times of highly variable inflation rates that might pose additional questions.
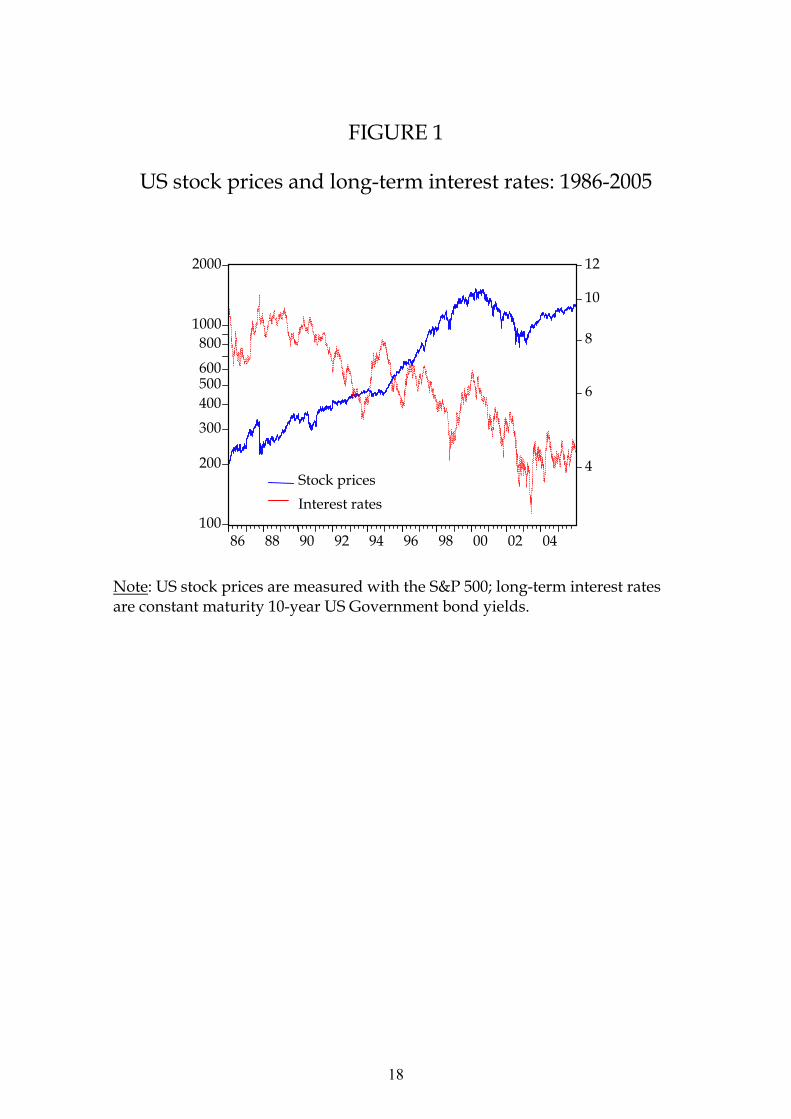
The stock price series and the US government bond yield series are shown in
Figure 1 for the 1986-2005 period. Visual inspection suggests that for most of the
period until 1998 the two series have moved predominantly in opposite fashion (falling
yields with rising stocks) whilst occasionally (before 1998), and for most of the period
after 1998, movements of these two series appear less clearly associated, and are some
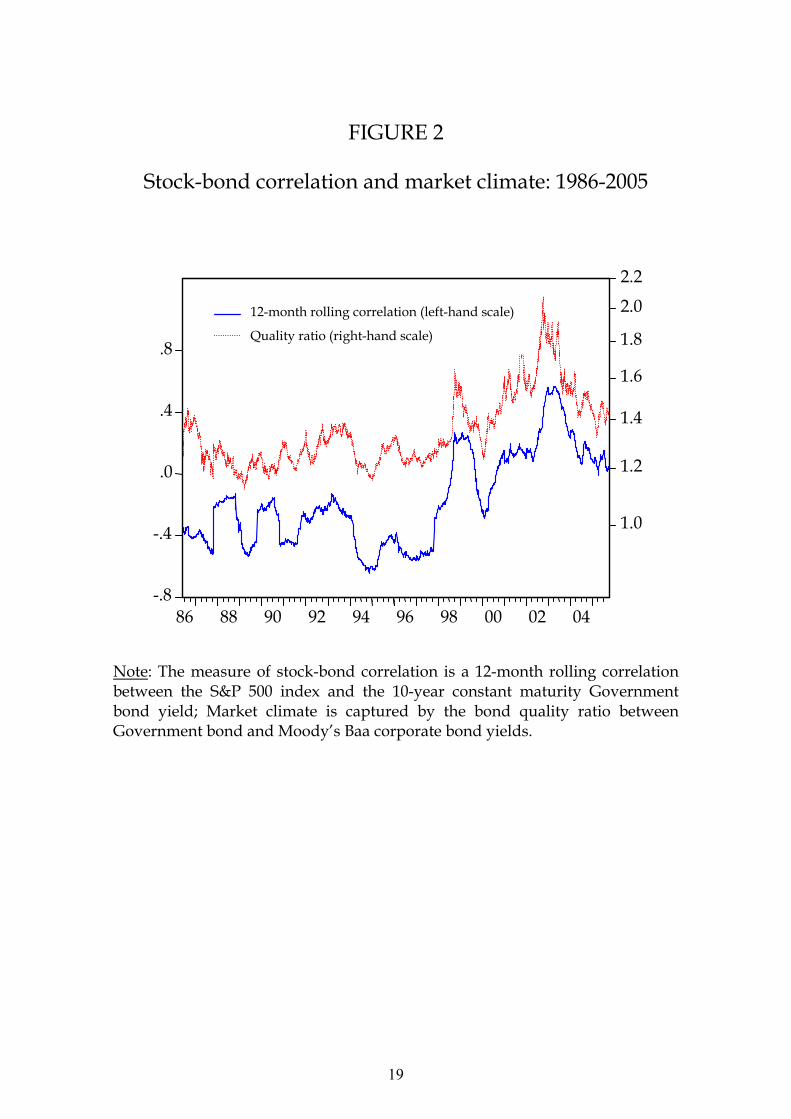
time parallel rather than opposite. Figure 2 confirms and clarifies the visual impression.
It shows the 12-month rolling correlation between SP500 and R10, predominantly
negative in our sample before 1998, and positive for most of the period afterwards. The
latter is equivalent to the negative correlation between bond and stock returns often

8
referred to as “decoupling.” On the same chart, we show the bond quality ratio, i.e., the
ratio between RBAA and R10.2 Visual comparison with the rolling correlation gives the
insight that the correlation between stock returns and bond yields is not extraneous, and
often coincident, with the quality ratio. The correlation coefficient between the two
series in Figure 2 is 0.86. This suggests that consideration of the bond “quality ratio” in
our coefficient regressions should improve the quality of our statistics.
The empirical analysis that follows is thus aimed at testing the validity and the
significance of the following linear equation:
(3) tBAAS RRRESP εβββα ++⋅++= )/( 1021010500 ,
where the stock price index is explained by the expected stream of cash flows,
the capitalization rate, the quality ratio, and a residual, unexplained stock market
sentiment component.
To check for robustness, statistical analysis is carried on using two alternative
techniques: a conventional regression analysis of first differences, and a segmented-
trend approach. If the underlying phenomenon is strong enough, these two methods
should generate similar results. Both aim at testing for cyclical correlation. With the
first approach, the use of first differences eliminates the trend effect; with the second
approach, a segmented trend technique attains the same scope.
3.2. Regression of first differences
We specify our first model using a first differences approach, based on weekly changes
of daily data,3 where long-term corporate profit expectations can be eliminated.4 Thus,
we explain stock price movements with changes in long-term interest rates (with
coefficient β2), and changes in the bond quality ratio (with coefficient β3).
On its turn, coefficient β2 may be seen as a function of the bond quality ratio, on
2 The ratio is intuitively a better indicator than the difference: when, for example, yields differ by 100 basis points, the corresponding difference in price is bigger when they quote at 2% and 1%, respectively, as compared to when they quote 11% and 10%. 3 We use weekly changes to avoid the problems raised by the non-contemporaneous collection of stock prices and bond yields at any given market day. 4 Since expected earnings and interest rate first differences can be considered independent, the absence of expected earnings in the regression is not distorting coefficients.

9
the basis of the observation above regarding the co-movement of the stock-bond
correlation with the bond quality ratio. In other words, not only we expect that an
increase (decrease) of the bond quality ratio is correlated with a decrease (increase) of
stock prices, but also that a low (high) bond quality ratio is correlated with a high (low)
β2 coefficient, such that:
(4) )/( 10111 RRBAA⋅″+′= βββ .
We thus estimate the following equation:
(5)
tBAABAA RRRRRRSP εβββα +∆⋅+∆⋅⋅″+∆⋅′+=∆ )/ln(ln)/ln(lnln 105210510110515005
where ∆5 is the weekly variation based on daily data, and εt is the unexplained factor
component.
We expect a negative sign for all coefficients: both the long-term interest and the
bond quality ratio should move inversely with stock prices; in addition, the bond quality
ratio should negatively affect the β2 coefficient: a higher product of the change in the
long-term interest rate and the level of the quality ratio means a bigger (negative)
impact on stock prices.
Table 1 shows our estimated equation. The estimated coefficients have the
expected signs and statistically highly significant: stock prices are found to move
inversely with changes in government yields, the quality ratio, and the product of the
change in interest rates with the level of the quality ratio. This means that the coefficient
describing the relation between stocks and Government bonds is influenced by the level
of the quality ratio. The direct elasticity of stock price changes with respect to changes
in the quality ratio is approximately 73%, while the direct elasticity of stock price
changes with respect to changes in the long-term interest rate is computed as the means
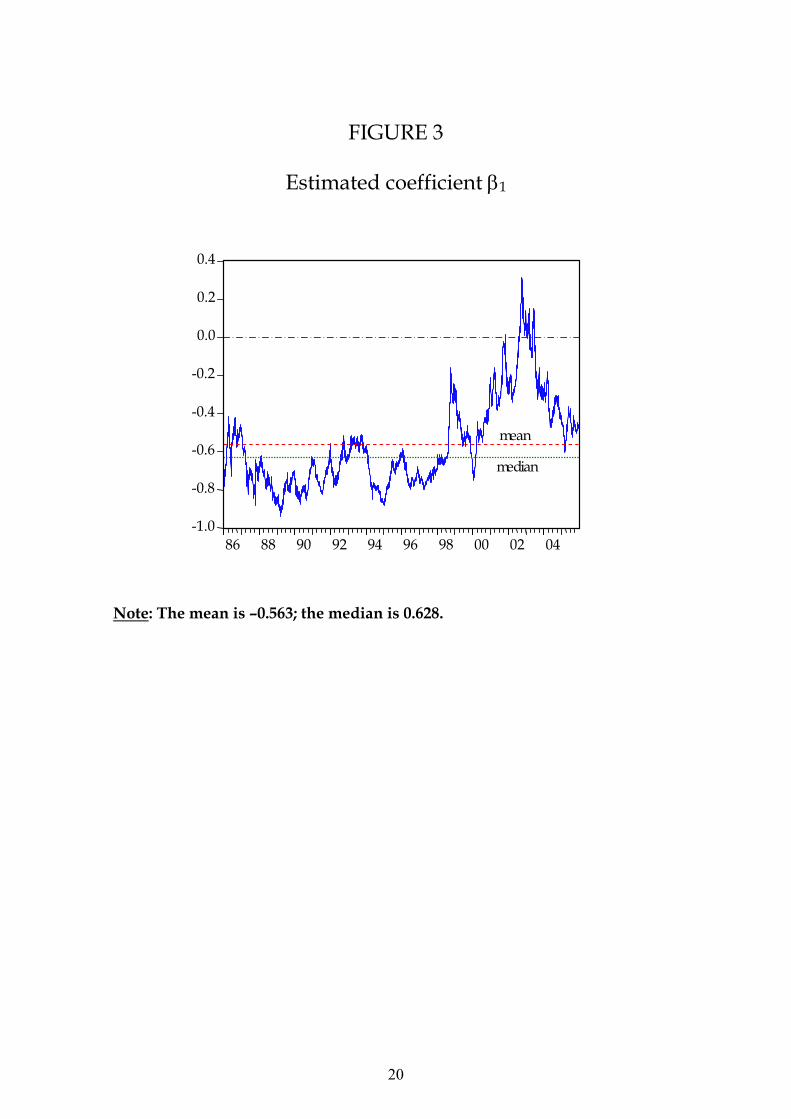
of the β2 coefficient, which equals –0.563.
Table 1 – Regression of first differences: statistical results
Variable Coefficient t-Statistic Prob.
10
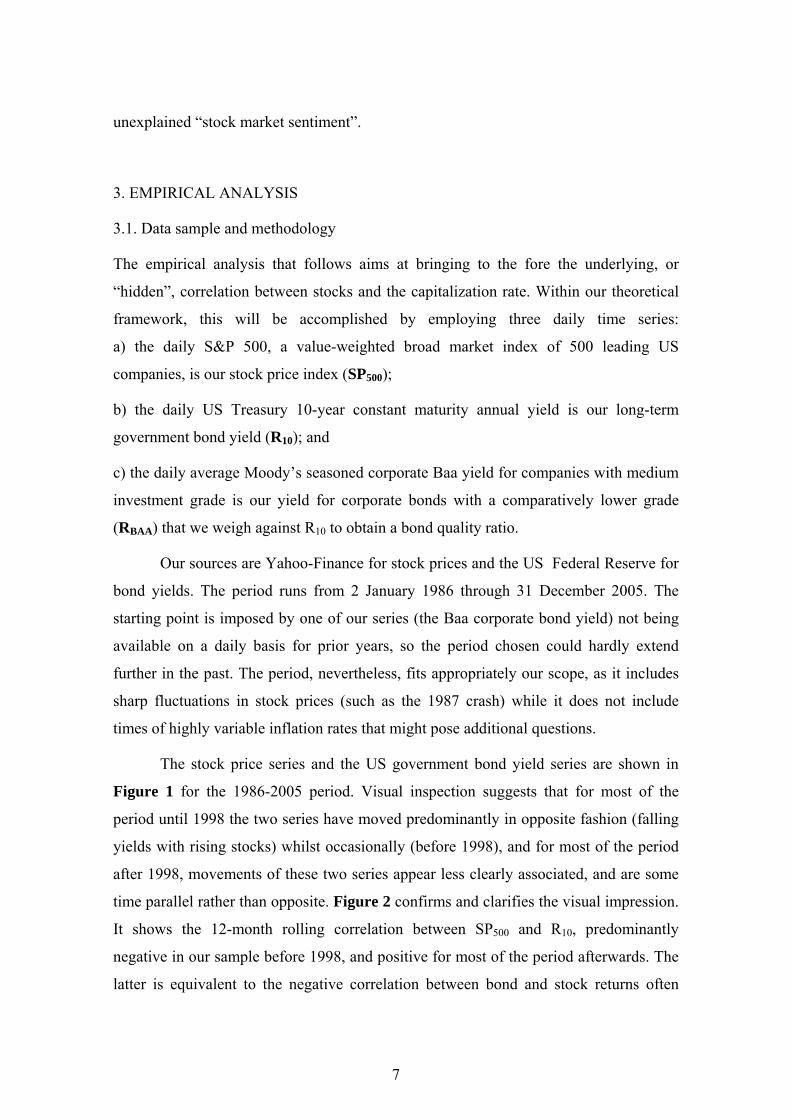
α [Constant] 0.002 3.09 0.002
β1′ [∆5 ln (R10)] -0.174 -14.77 0.000
β1″ [ln(RBAA/R10) ∆5 ln (R10)] -2.035 7.71 0.000
β2 [∆5 ln (RBAA/R10) ] -0.726 -4.30 0.000
Method: Least Squares with Newey-West HAC Standard Errors & Covariance (lag
truncation=9); Sample (adjusted): 9/01/1986 - 31/12/2005; R-squared: 0.149; S.E. of
regression: 0.021. Calculation with Eviews 5.1. Our results will also pass a CUSUM
stability test (within the standard 5% band).
Figure 3 shows the β1 coefficient varying with the bond quality ratio: the higher the
latter, the greater the tendency to flight to quality, which weakens the correlation
between stock prices and long-term interest rates, and may even change its sign.
3.3. The segmented linear trend regression
We specify our second model using a segmented trend approach: we explain stock
prices with long-term interest rates (with coefficient β1), the bond quality ratio (with
coefficient β2), and a segmented linear trend (with a number of additional coefficients as
many as there are trends) aimed to capture the effect of long-term expectations on the
expected cash stream.
The segmented trend technique allows for several structural breaks in long-term
expectations. To identify possible structural breaks in the trend of stock prices we first
use a smoothing filter to generate a smoothed series of the S&P 500 index (generated by
a 2-year centered moving average with triangular weights) and find the local maximum
points in the smoothed S&P 500 series.
Our segmented trend is obtained by combining subsequent trends: the first trend
is a standard linear trend; the second trend equals zero until the first maximum point in
the smoothed series, and from that point on it becomes a standard linear trend; the third
trend equals zero until the second maximum and from that point on it becomes a

11
standard linear trend. This generates a segmented trend, whose corners correspond to
the peaks of the smoothed stock price series. Within each trend, we then study the
cyclical relationship between the stock price index and appropriate yields to capture the
underlying correlation between stock prices and yields over each cycle.
We then estimate the following equation:
(6) t
n
iiiBAA TyyySP εαββα ++⋅+⋅+= ∑
=1102101 )/ln(ln500ln ,
where Ti is the segmented trend.
A problem inherent in this technique is that, except for a truly remarkable
coincidence, the series does not end with a turning point. This may affect the
significance of the statistical results on the last segment of the trend. To prevent this
problem affect the quality of our estimates, we limit our statistical test following this
technique to those segments of the trends that are clearly defined by our smoothing
technique and thus fall within the series period, i.e., from June 1987 (i.e., the first local
maximum in our smoothed stock index series) through March 2000 (i.e., the last local
maximum).
Table 2 shows the statistical results. The segmented trend approach confirms the
robustness of the link: stock prices are found to move inversely with cyclical changes in
government yields and the quality ratio. The signs of the estimated coefficients are as
expected and coefficients are highly significant. Changes in yields again explain a
significant portion of stock price movements.
12
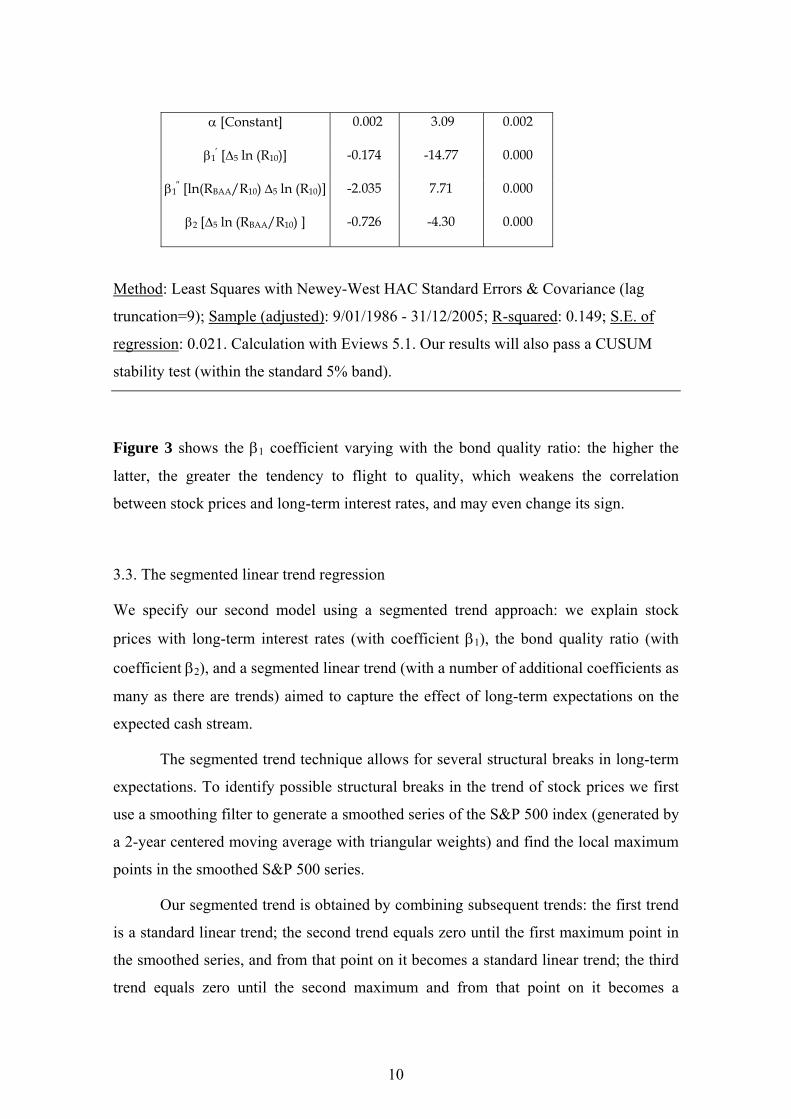
Table 2 – Segmented trends regression: statistical results
Variable Coefficient t-Statistic Prob.
α - Constant 6.94 45.29 0.000
β1 - ln (R10) -0.60 -10.11 0.000
β2 - ln (RBAA / R10) -0.41 -3.66 0.000
T1 0.36 6.92 0.000
T2 (Dec 89) -0.26 -4.53 0.037
T3 (Dec 93) -0.62 39.30 0.000
Method: Least Squares with Newey-West HAC Standard Errors & Covariance (lag
truncation=8); Sample (adjusted): 15/06/1987 - 15/03/2000; R-squared: 0.985; S.E. of
regression: 0.062. Calculation with Eviews 5.1.
Under both techniques, coefficients have the expected sign, and have the same
order of magnitude, which suggests a good quality of our estimates. Coefficient sizes
from the segmented trend approach are close to coefficients obtained through the
regression of first differences: the sensitivity of stock prices to the long-term Treasury
yield varies is a negative 0.60, close to the means (-0.56) of the same coefficient when
calculated through first differences, while sensitivity to the quality ratio is a negative
0.41, not far from the same coefficient when calculated through first differences (-0.73).
4. UNVEILING STOCK MARKET STRENGTH
The empirical analysis developed in the previous section will now be used to devise a
methodology to “deflate” stock prices. This may be paralleled to the technique of
deflating nominal GDP to obtain real GDP: in the same fashion as nominal GDP means
a different level of output depending on the general price index, stock prices mean a
different level of stock market strength, depending on the level of interest rates. This

13
amounts to calculating an interest-deflated stock market index, or a stock price index
appropriately modified to remove the capitalization rate effect from stocks, and aimed
to capture market expectations of future cash flows at a given, invariant capitalization
rate.
Following this, and based on the evidence that the bond quality ratio partially
explains stock movements, we attempt a further step: the stock price movements that
remain unexplained when considering the effects of the capitalization rate and the bond
quality ratio can be seen as a measure of stock market sentiment. This should be a gauge
based on comparison of the actual stock price series with the theoretical series
explained, in the previous statistical section, by the Treasury yields and the quality ratio.
We thus proceed to calculate each and suggest future possible applications.
4.1. An interest-deflated stock market index
In section 3 we found that a significant component of the cyclical variations of stock
prices is explained by changes in the long-term interest rate. This is coherent with the
theoretical interpretation of stock prices as the present value of an expected cash
streams. By removing the capitalization rate effect from a given stock price series one
should obtain a modified stock price series where the estimated effect of changes in the
capitalization rate is eliminated. This modified stock price series is an indicator of stock
market strength, independent of the current capitalization rate. It shows, in other words,
how would a stock price series have moved, had the capitalization rate been fixed at a
pre-assigned level.5 We thus use the following transformation:
(7) )ln(lnln *1010500500 yySPSP D ÷+= δ ,
and
(8) ( )DD SPSP 500500 lnexp= ,
where SP500D, obtained with reference to a pre-assigned and invariant long-term rate
(R10*), is the interest-deflated stock price index; and δ is the means (-0.58) of the β1
5 In the same way as the choice of the base year is irrelevant to the rate of change of real GDP, the choice of the pre-assigned level of the long-term rate is irrelevant to the rate of change of the stock price series.

14
coefficient as generated by our regressions.
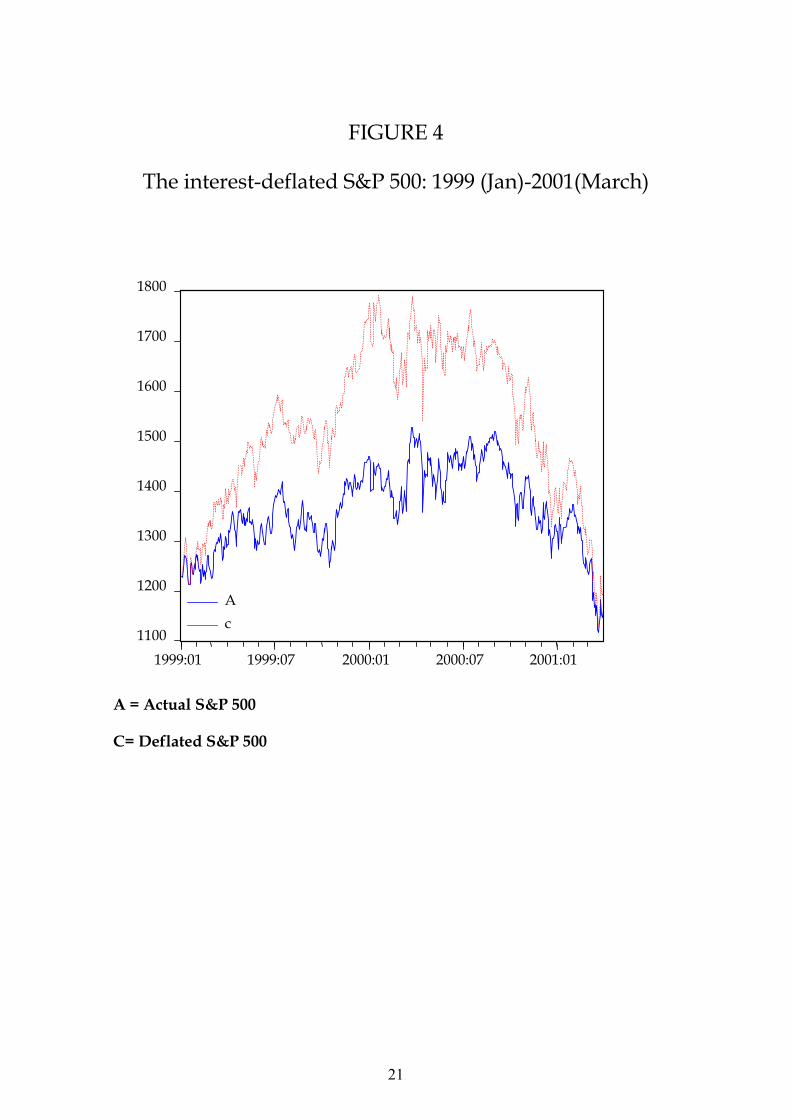
Figure 4 shows an application for the January 1999 - March 2001 period. While
the solid line is the actual S&P500 index series, the dotted line is our estimate of what
the value of stocks would have been at any given point in time had the capitalization
rate remained constant at the same level as of the beginning of period (1 Jan 1999 =
4.65%). A rather fascinating finding here is that when we observe the interest-deflated
stock price index we see an even stronger rise in expectations during the last phase of
what many have dubbed the “New Economy bubble”, indicating an even stronger wave
of optimism than could be observed on market prices alone. Notice, also, that the
interest-deflated stock price series peaks before the actual series, indicating a reversal of
expectations that could not be directly observed through market prices. Indeed, a reason
why we believe the interest-deflated series is interesting is that it should indicate
reversals of expectations more clearly than can be seen in the actual stock price series.
The obvious counterpart of all this is that long-term interest rates had a stabilizing role
in the US stock market between 1999 and 2001, and beyond.
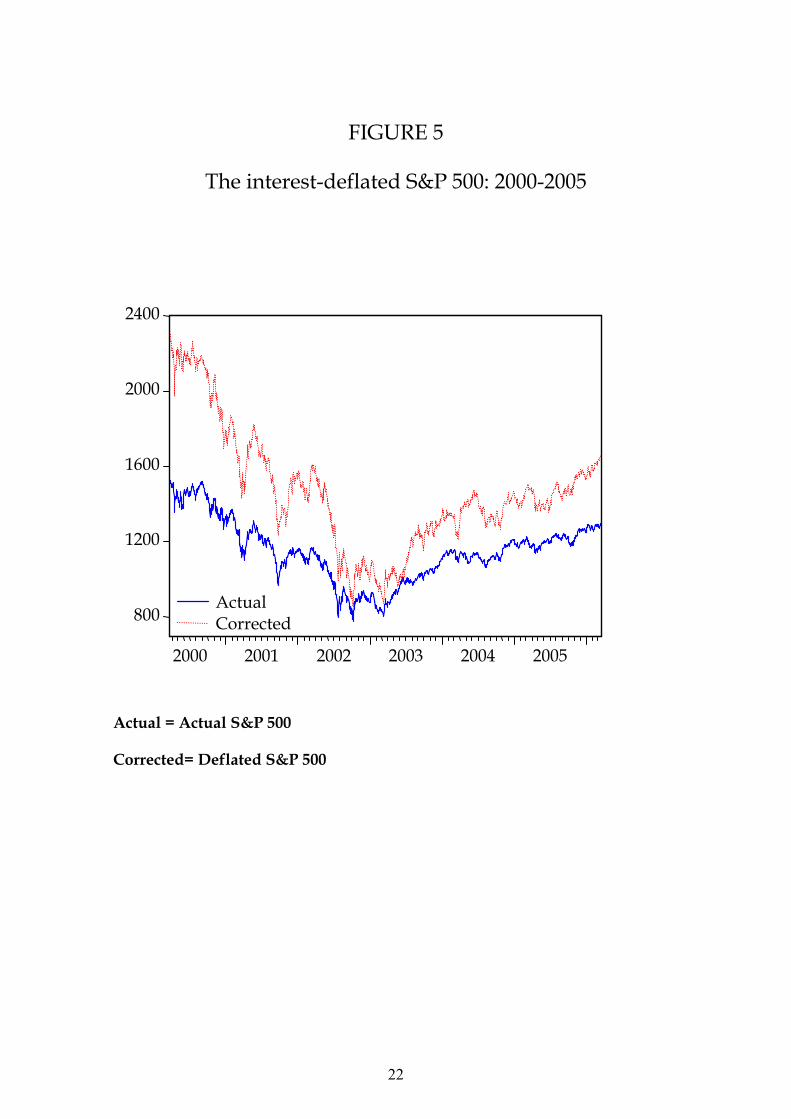
Figure 5 shows an application for the January 2000-December 2005 period. The
downward movement of the interest-deflated stock index between 2000 and 2002 was
considerably wider than what has been observed on the basis of absolute price indices
alone, for the index fall has been partially softened by falling long-term interest rates.
Equivalently, the stock market recovery following 2002 was more significant in size
than what is observed on prices alone, thus indicating a “hidden” higher volatility of
stock market strength.6 Notice how on both circumstances illustrated in Figures 4 and 5,
the long-term interest rate has played a stabilizing influence on stock prices. We believe
financial analysts may benefit from adding an interest-deflated stock index to the set of
tools they use to investigate the strength of stock markets.
4.2. A stock market sentiment indicator
We call “market sentiment” the unexplained component in our regressions. We do not
attempt here to explain this component, nor it is our intention to test for rationality.
Following Macaulay, we prefer to “trust the opinion of the market” (p.98) and limit our
15
inquiry to suggesting the view that this sentiment indicator is a better signal of stock
market-specific confidence than the absolute level of the index. It may be a question for
future research to explore whether variations in the sentiment index are more or less
“rational”.
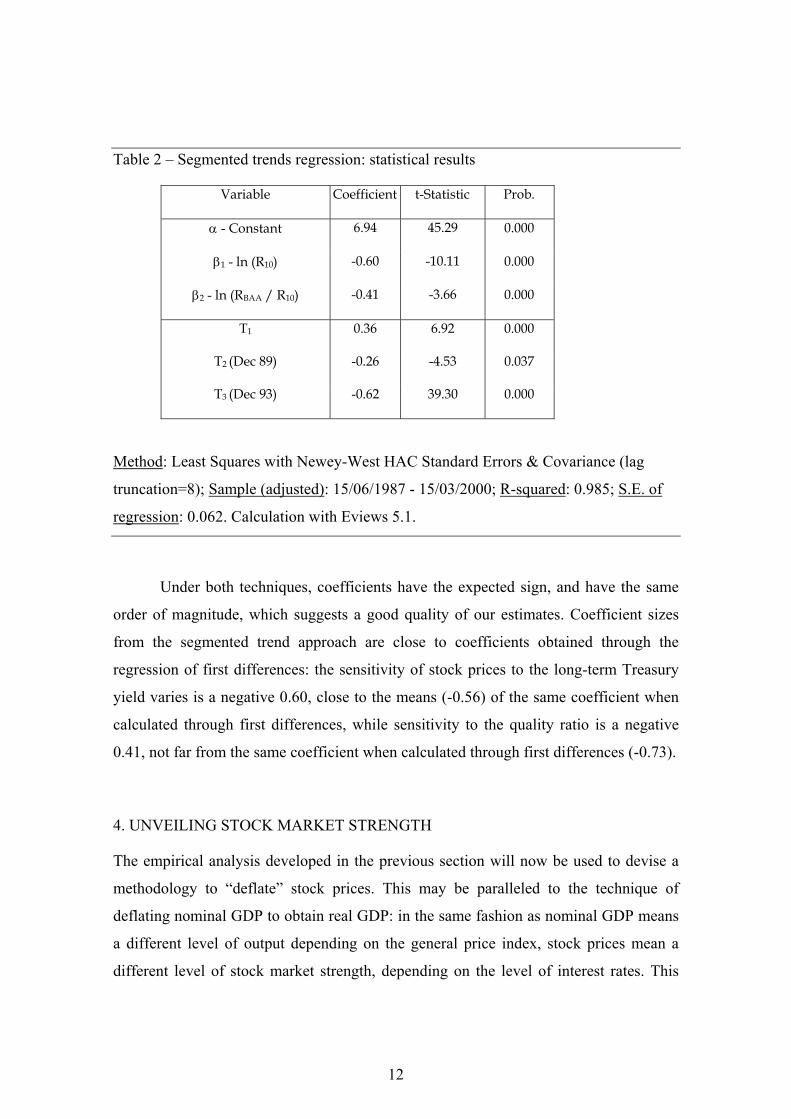
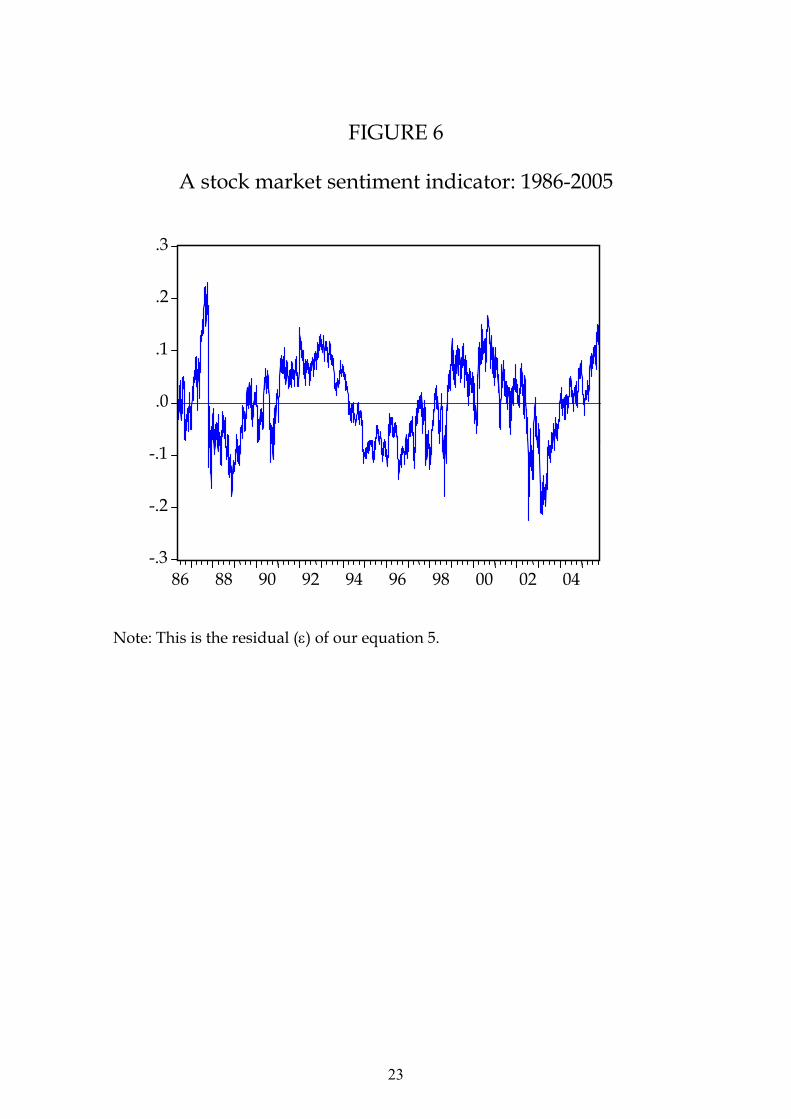
Figure 6 shows the residuals of the estimated equation from 3.1 above that we
venture to call a stock market sentiment indicator, or the component of the S&P500
index that cannot be explained in our model with a varying capitalization rate or a
varying bond quality ratio. In other words, if this indicator is rising, it is not because of
a declining capitalization rate, nor because of an improving market climate as captured
by a falling bond quality ratio. This “unexplained” component of stocks reflects stock
market-specific sentiment that is not captured in our models. When it deviates above an
upper bound, it signals particularly buoyant stock prices, higher than the capitalization
rate and the quality ratio would justify. When it deviates below a lower bound, it signals
gloomy stock prices, lower than the capitalization rate and the quality ratio would
justify. It behaves in a very similar fashion as the differential between the stock yield (or
earnings/price ratio) and the long-term interest rate.7
5. CONCLUSIONS
The fascinating work by Macauley (1938) on interest rates can still provide inspiration
for studying the behavior of stock prices with reference to interest rate movements. In
this paper, we have tested a simple hypothesis about stock market behavior: that stock
price deviations from their trend are significantly correlated with the default-free long-
term interest rate, when a good proxy for market climate is included in the regression.
Stock prices are found to respond to the long-term interest rate (a proxy for the
capitalization rate of corporate earnings and dividends), and the bond quality ratio (a
proxy for the market climate about the future of corporate earnings). The component of
stock price movements that remains unexplained may be seen as a residual stock-
specific market sentiment.
6 Remind that stock market strength combines stock market expectations and market sentiment. 7 Notice that, different from the stock-bond yield differential, our residual “sentiment” does not require information on corporate earnings.
16
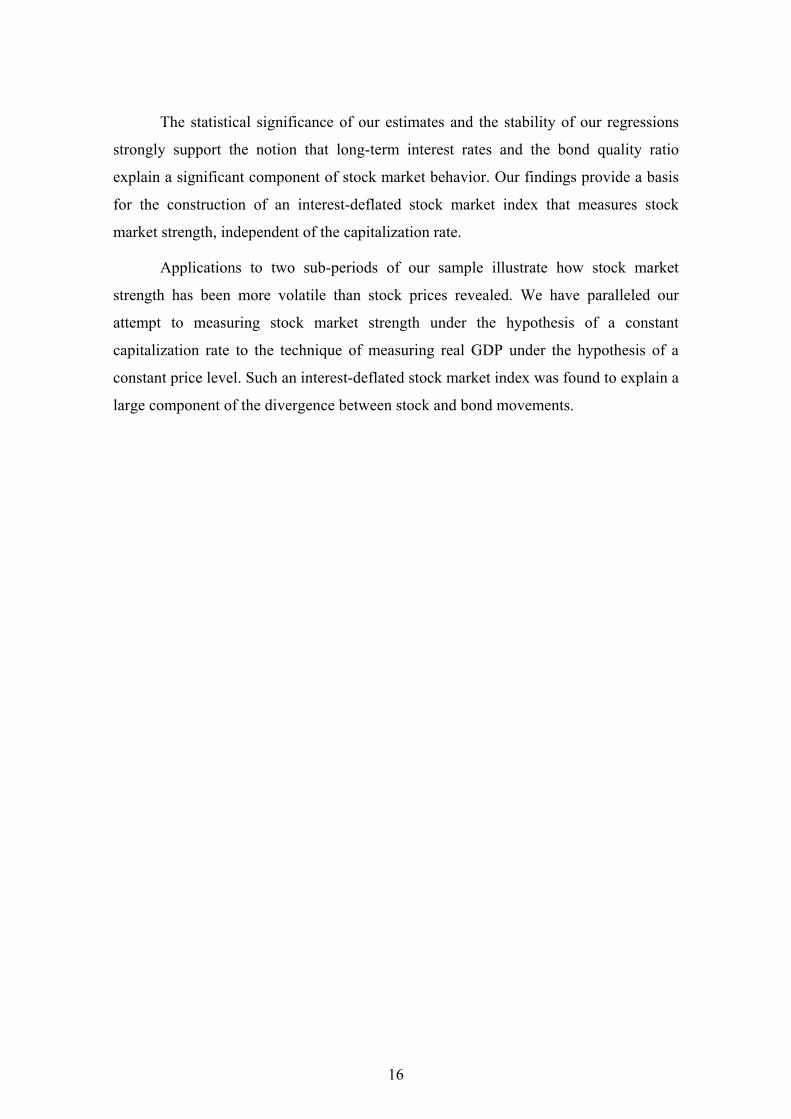
The statistical significance of our estimates and the stability of our regressions
strongly support the notion that long-term interest rates and the bond quality ratio
explain a significant component of stock market behavior. Our findings provide a basis
for the construction of an interest-deflated stock market index that measures stock
market strength, independent of the capitalization rate.
Applications to two sub-periods of our sample illustrate how stock market
strength has been more volatile than stock prices revealed. We have paralleled our
attempt to measuring stock market strength under the hypothesis of a constant
capitalization rate to the technique of measuring real GDP under the hypothesis of a
constant price level. Such an interest-deflated stock market index was found to explain a
large component of the divergence between stock and bond movements.

17
REFERENCES
Baur, Dirk and Brian M. Lucey, 2006. Flight-to-quality or Contagion? An empirical
analysis of Stock-bond correlations, Institute for International Integration
Studies Discussion Paper Series, No. 122, March.
Gordon, Myron J., 1962. The Investment, Financing, and Valuation of the
Corporation, Homewood, Ill., Irwin
Gulko, Les, 2002. Decoupling, The Journal of Portfolio Management, Spring.
Ilmanen, Antti, 2003. Stock-Bond Correlations, The Journal of Fixed Income,
September.
Li, Lingfeng, 2004. Macroeconomic factors and the correlation of stock and bond
returns, Yale International Center for Finance Working Paper, No. 2,
November.
Macaulay, Frederick R., 1938. Some theoretical problems suggested by the
movements of interest rates, bond yields and stock prices in the U. S. since
1856, New York: NBER.
Mitchell, Jason, 2001. Clustering and psychological barriers: The importance of
numbers, Journal of Futures Markets, Volume 21, Issue 5 , Pages 395 – 428.
Stivers, Chris and Licheng Sun, 2002. Stock market uncertainty and bond returns:
Evidence of flight-to-quality. Working Paper Series, Federal Reserve Bank of
Atlanta, March.
Terzi, Andrea and Giovanni Verga, 1992. Indice azionario e tassi d'interesse:
Un'analisi del mercato statunitense negli anni '80, Rapporto IRS sul Mercato
Azionario, Milano, il Sole 24 Ore Libri, pp. 187-97.
Terzi, Andrea and Giovanni Verga, 1993. Mercato azionario e tassi d'interesse:
Un'analisi empirica di sei mercati, Rapporto IRS sul Mercato Azionario, Milano: il
Sole 24 Ore Libri, pp. 177-87.
18
FIGURE 1
US stock prices and long-term interest rates: 1986-2005
Note: US stock prices are measured with the S&P 500; long-term interest rates are constant maturity 10-year US Government bond yields.
100
200
300
400500600
8001000
2000
4
6
8
10
12
86 88 90 92 94 96 98 00 02 04
Stock prices Interest rates
19
FIGURE 2
Stock-bond correlation and market climate: 1986-2005
Note: The measure of stock-bond correlation is a 12-month rolling correlation between the S&P 500 index and the 10-year constant maturity Government bond yield; Market climate is captured by the bond quality ratio between Government bond and Moody’s Baa corporate bond yields.
-.8
-.4
.0
.4
.8
1.0
1.2
1.4
1.6
1.8
2.0
2.2
86 88 90 92 94 96 98 00 02 04
12-month rolling correlation (left-hand scale)
Quality ratio (right-hand scale)
20
FIGURE 3
Estimated coefficient β1
Note: The mean is –0.563; the median is 0.628.
-1.0
-0.8
-0.6
-0.4
-0.2
0.0
0.2
0.4
86 88 90 92 94 96 98 00 02 04
median
mean
21
FIGURE 4
The interest-deflated S&P 500: 1999 (Jan)-2001(March)
A = Actual S&P 500
C= Deflated S&P 500
1100
1200
1300
1400
1500
1600
1700
1800
1999:01 1999:07 2000:01 2000:07 2001:01
Ac
22
FIGURE 5
The interest-deflated S&P 500: 2000-2005
Actual = Actual S&P 500
Corrected= Deflated S&P 500
800
1200
1600
2000
2400
2000 2001 2002 2003 2004 2005
ActualCorrected
23
FIGURE 6
A stock market sentiment indicator: 1986-2005
Note: This is the residual (ε) of our equation 5.
-.3
-.2
-.1
.0
.1
.2
.3
86 88 90 92 94 96 98 00 02 04

Elenco Quaderni già pubblicati
1. L. Giuriato, Problemi di sostenibilità di programmi di riforma strutturale, settembre 1993. 2. L. Giuriato, Mutamenti di regime e riforme: stabilità politica e comportamenti accomodanti, settembre 1993. 3. U. Galmarini, Income Tax Enforcement Policy with Risk Averse Agents, novembre 1993. 4. P. Giarda, Le competenze regionali nelle recenti proposte di riforma costituzionale, gennaio 1994. 5. L. Giuriato, Therapy by Consensus in Systemic Transformations: an Evolutionary Perspective, maggio 1994. 6. M. Bordignon, Federalismo, perequazione e competizione fiscale. Spunti di riflessione in merito alle ipotesi di riforma della finanza regionale in Italia, aprile 1995. 7. M. F. Ambrosanio, Contenimento del disavanzo pubblico e controllo delle retribuzioni nel pubblico impiego, maggio 1995. 8. M. Bordignon, On Measuring Inefficiency in Economies with Public Goods: an Overall Measure of the Deadweight Loss of the Public Sector, luglio 1995. 9. G. Colangelo, U. Galmarini, On the Pareto Ranking of Commodity Taxes in Oligopoly, novembre 1995. 10. U. Galmarini, Coefficienti presuntivi di reddito e politiche di accertamento fiscale, dicembre 1995. 11. U. Galmarini, On the Size of the Regressive Bias in Tax Enforcement, febbraio 1996. 12. G. Mastromatteo, Innovazione di Prodotto e Dimensione del Settore Pubblico nel Modello di Baumol, giugno 1996. 13. G. Turati, La tassazione delle attività finanziarie in Italia: verifiche empiriche in tema di efficienza e di equità, settembre 1996. 14. G. Mastromatteo, Economia monetaria post-keynesiana e rigidità dei tassi bancari, settembre 1996. 15. L. Rizzo, Equalization of Public Training Expenditure in a Cross-Border Labour Market, maggio 1997. 16. C. Bisogno, Il mercato del credito e la propensione al risparmio delle famiglie: aggiornamento di un lavoro di Jappelli e Pagano, maggio 1997.
17. F.G. Etro, Evasione delle imposte indirette in oligopolio. Incidenza e ottima tassazione, luglio 1997.
18. L. Colombo, Problemi di adozione tecnologica in un’industria monopolistica, ottobre 1997.
19. L. Rizzo, Local Provision of Training in a Common Labour Market, marzo 1998. 20. M.C. Chiuri, A Model for the Household Labour Supply: An Empirical Test On
A Sample of Italian Household with Pre-School Children, maggio 1998. 21. U. Galmarini, Tax Avoidance and Progressivity of the Income Tax in an
Occupational Choice Model, luglio 1998. 22. R. Hamaui, M. Ratti, The National Central Banks’ Role under EMU. The Case
of the Bank of Italy, novembre 1998.

23. A. Boitani, M. Damiani, Heterogeneous Agents, Indexation and the Non Neutrality of Money, marzo 1999. 24. A. Baglioni, Liquidity Risk and Market Power in Banking, luglio 1999. 25. M. Flavia Ambrosanio, Armonizzazione e concorrenza fiscale: la politica della Comunità Europea, luglio 1999. 26. A. Balestrino, U. Galmarini, Public Expenditure and Tax Avoidance, ottobre 1999. 27. L. Colombo, G. Weinrich, The Phillips Curve as a Long-Run Phenomenon in a Macroeconomic Model with Complex Dynamics, aprile 2000. 28. G.P. Barbetta, G. Turati, L’analisi dell’efficienza tecnica nel settore della sanità. Un’applicazione al caso della Lombardia, maggio 2000. 29. L. Colombo, Struttura finanziaria delle imprese, rinegoziazione del debito Vs. Liquidazione. Una rassegna della letteratura, maggio 2000. 30. M. Bordignon, Problems of Soft Budget Constraints in Intergovernmental Relationships: the Case of Italy, giugno 2000. 31. A. Boitani, M. Damiani, Strategic complementarity, near-rationality and coordination, giugno 2000. 32. P. Balduzzi, Sistemi pensionistici a ripartizione e a capitalizzazione: il caso cileno e le implicazioni per l’Italia, luglio 2000. 33. A. Baglioni, Multiple Banking Relationships: competition among “inside”
banks, ottobre 2000. 34. A. Baglioni, R. Hamaui, The Choice among Alternative Payment Systems: The
European Experience, ottobre 2000. 35. M.F. Ambrosanio, M. Bordignon, La concorrenza fiscale in Europa: evidenze,
dibattito, politiche, novembre 2000. 36. L. Rizzo, Equalization and Fiscal Competition: Theory and Evidence, maggio
2001. 37. L. Rizzo, Le Inefficienze del Decentramento Fiscale, maggio 2001. 38. L. Colombo, On the Role of Spillover Effects in Technology Adoption Problems,
maggio 2001. 39. L. Colombo, G. Coltro, La misurazione della produttività: evidenza empirica e
problemi metodologici, maggio 2001. 40. L. Cappellari, G. Turati, Volunteer Labour Supply: The Role of Workers’
Motivations, luglio 2001. 41. G.P. Barbetta, G. Turati, Efficiency of junior high schools and the role of
proprietary structure, ottobre 2001. 42. A. Boitani, C. Cambini, Regolazione incentivante per i servizi di trasporto
locale, novembre 2001. 43. P. Giarda, Fiscal federalism in the Italian Constitution: the aftermath of the
October 7th referendum, novembre 2001. 44. M. Bordignon, F. Cerniglia, F. Revelli, In Search for Yardstick Competition:
Property Tax Rates and Electoral Behavior in Italian Cities, marzo 2002. 45. F. Etro, International Policy Coordination with Economic Unions, marzo 2002. 46. Z. Rotondi, G. Vaciago, A Puzzle Solved: the Euro is the D.Mark, settembre
2002. 47. A. Baglioni, Bank Capital Regulation and Monetary Policy Transmission: an
heterogeneous agents approach, ottobre 2002. 48. A. Baglioni, The New Basle Accord: Which Implications for Monetary Policy
Transmission?, ottobre 2002.

49. F. Etro, P. Giarda, Redistribution, Decentralization and Constitutional Rules, ottobre 2002.
50. L. Colombo, G. Turati, La Dimensione Territoriale nei Processi di Concentrazione dell’Industria Bancaria Italiana, novembre 2002.
51. Z. Rotondi, G. Vaciago, The Reputation of a newborn Central Bank, marzo 2003.
52. M. Bordignon, L. Colombo, U. Galmarini, Fiscal Federalism and Endogenous Lobbies’ Formation, ottobre 2003.
53. Z. Rotondi, G. Vaciago, The Reaction of central banks to Stock Markets, novembre 2003.
54. A. Boitani, C. Cambini, Le gare per i servizi di trasporto locale in Europa e in Italia: molto rumore per nulla?, febbraio 2004.
55. V. Oppedisano, I buoni scuola: un’analisi teorica e un esperimento empirico sulla realtà lombarda, aprile 2004.
56. M. F. Ambrosanio, Il ruolo degli enti locali per lo sviluppo sostenibile: prime valutazioni, luglio 2004.
57. M. F. Ambrosanio, M. S. Caroppo, The Response of Tax Havens to Initiatives Against Harmful Tax Competition: Formal Statements and Concrete Policies, ottobre 2004.
58. A. Monticini, G. Vaciago, Are Europe’s Interest Rates led by FED Announcements?, dicembre 2004.
59. A. Prandini, P. Ranci, The Privatisation Process, dicembre 2004. 60. G. Mastromatteo, L. Ventura, Fundamentals, beliefs, and the origin of money: a
search theoretic perspective, dicembre 2004. 61. A. Baglioni, L. Colombo, Managers’ Compensation and Misreporting,
dicembre 2004. 62. P. Giarda, Decentralization and intergovernmental fiscal relations in Italy: a
review of past and recent trends, gennaio 2005. 63. A. Baglioni, A. Monticini, The Intraday price of money: evidence from the e-
MID market, luglio 2005. 64. A. Terzi, International Financial Instability in a World of Currencies
Hierarchy, ottobre 2005. 65. M. F. Ambrosanio, A. Fontana, Ricognizione delle Fonti Informative sulla
Finanza Pubblica Italiana, gennaio 2006. 66. L. Colombo, M. Grillo, Collusion when the Number of Firms is Large, marzo
2006. 67. A. Terzi, G. Verga, Stock-bond correlation and the bond quality ratio:
Removing the discount factor to generate a “deflated” stock index, luglio 2006.