
The mitochondrial chaperone TRAP1 promotes neoplastic...
79
Sede Amministrativa: Università degli Studi di Padova Dipartimento di Biologia SCUOLA DI DOTTORATO DI RICERCA IN : BIOSCIENZE E BIOTECNOLOGIE INDIRIZZO: BIOLOGIA CELLULARE CICLO: XXV The mitochondrial chaperone TRAP1 promotes neoplastic growth by inhibiting succinate dehydrogenase Direttore della Scuola: Ch.mo Prof. Giuseppe Zanotti Coordinatore d’indirizzo: Ch.mo Prof. Paolo Bernardi Supervisore: Dr. Andrea Rasola Co-supervisore: Ch.mo Prof. Paolo Bernardi Dottorando : GIULIA GUZZO Dicembre 2012
Transcript of The mitochondrial chaperone TRAP1 promotes neoplastic...

Sede Amministrativa: Università degli Studi di Padova
Dipartimento di Biologia
SCUOLA DI DOTTORATO DI RICERCA IN : BIOSCIENZE E BIOTECNOLOGIE
INDIRIZZO: BIOLOGIA CELLULARE
CICLO: XXV
The mitochondrial chaperone TRAP1 promotes neoplastic growth by inhibiting succinate dehydrogenase
Direttore della Scuola: Ch.mo Prof. Giuseppe Zanotti
Coordinatore d’indirizzo: Ch.mo Prof. Paolo Bernardi
Supervisore: Dr. Andrea Rasola
Co-supervisore: Ch.mo Prof. Paolo Bernardi
Dottorando : GIULIA GUZZO
Dicembre 2012

1
Index Index 1
Summary 3
1.Introduction 5
1.1 Hallmarks of cancer 5
1.1.1 Cell sufficiency in growth signals 5
1.1.2 Insensitivity to growth inhibitory signals 6
1.1.3 Evasion of programmed cell death (Apoptosis) 7
1.1.4 Limitless replicative potential 7
1.1.5 Sustained angiogenesis 8
1.1.6 Tissue invasion and metastasis 9
1.1.7 Enabling Characteristic: Tumor promoting inflammation 12
1.1.8 Enabling Characteristic: Genome instability and mutations 14
1.1.9 Emerging Hallmark: Evading immune destruction 14
1.1.10 Emerging Hallmark: Reprogramming energy metabolism 15
1.2 Metabolic Alterations in cancer 15
1.2.1 The pentose phosphate pathway 17
1.2.2 Fatty acid synthesis 17
1.2.3 Glutaminolysis 17
1.3 Mitochondria and tumor 18
1.4 Hypoxia inducible factors and cancer 20
1.5 Chaperones in cancer 23
2 Matherials and methods 28
3 Results 36
4. Discussion 62
5 References 64

3
Summary
Cancer is a highly heterogeneous and complex disease, whose development requires a
reorganization of cell metabolism. Most tumor cells downregulate mitochondrial oxidative
phosphorylation and increase the rate of glucose consumption and lactate release, independently of
oxygen availability (the Warburg effect). This metabolic rewiring is believed to favour tumor
growth and survival. However the molecular mechanisms that inhibit oxidative phosphorylation
(OXPHOS) during neoplastic progression are only partially understood.
Within this context, we studied TRAP1, a conserved chaperone of the Heat Shock Protein 90
(HSP90) family, localized mainly in the mitochondrial matrix and whose expression is induced in
the majority of tumor types.
We found that TRAP1 is associated to succinate dehydrogenase (SDH), the Complex II of the
respiratory chain. We observed in different tumor cell models that TRAP1 diminished in vivo tumor
cell respiration by inhibiting the succinate:coenzyme Q reductase (SQR) activity of Complex II.
This Complex II inhibition was further enhanced in TRAP1-expressing cells that progressed
through a focus forming assay (in vitro tumorigenesis assay), causing an accumulation of succinate
that led to the stabilization of the pro-neoplastic transcription factor HIF1α, thus favouring the
metabolic switch necessary for tumor growth and progression. In fact, we observe in vitro e in vivo
tumorigenesis only in TRAP1 expressing cells.

4
Riassunto
Il cancro è una malattia altamente complessa ed eterogenea, il cui sviluppo richiede una
riorganizzazione del metabolismo cellulare. La maggior parte delle cellule tumorali diminuisce la
fosforilazione ossidativa mitocondriale e aumenta invece la quantità di glucosio consumato e di
produzione di lattato, in maniera completamente indipendente dalla disponibilità di ossigeno.
Questo fenomeno è noto come Effetto Warburg. Si pensa che questa riprogrammazione metabolica
favorisca la crescita e la sopravvivenza del tumore. Comunque sono solo parzialmente noti i
meccanismi molecolari che inibiscono la fosforilazione ossidativa (OXPHOS) durante la
trasformazione neoplastica.
In questo contesto, abbiamo deciso di studiare TRAP1, uno sciaperone appartenente alla famiglia
delle Heat Shock Protein 90 (HSP90), che si trova principalmente nella matrice mitocondriale e la
cui espressione è indotta nella maggior parte dei tumori.
I risultati che abbiamo ottenuto mostrano l’associazione di TRAP1 alla succinato deidrogenasi
(SDH), il Complesso II della catena respiratoria. Abbiamo osservato in diversi modelli cellulari
tumorali che TRAP1 diminuisce la respirazione delle cellule tumorali in vivo inibendo l’attività
succinato:coenzima Q reduttasi (SQR) del Complesso II. L’inibizione del Complesso II aumenta
ulteriormente nelle cellule esprimenti TRAP1 durante il saggio di tumorigenesi in vitro, provocando
l’accumulo di succinato. Questo aumento di succinato induce la stabilizzazione del fattore di
trascrizione pro-neoplastico HIF1α, favorendo lo switch metabolico necessario per la crescita e la
progressione tumorale. Infatti, si osserva tumorigenesi in vitro e in vivo solo nelle cellule esprimenti
TRAP1.

5
1.1 Hallmarks of cancer
Cancer is a highly heterogeneous and complex disease characterized by several alterations in
basic homeostatic processes. In 2000, Hanahan and Weinberg defined some biological
processes that lead to the transformation of normal cells into malignant ones. A small number
of molecular , biochemical, and cellular traits (acquired capabilities) are shared by most or
probably all types of human cancers. The essential alterations that hallmark cancer and
regulate malignant growth (Hanahan and Weinberg, 2000) are:
1. Self-sufficiency in growth signals
2. Insensitivity to growth inhibitory signals
3. Evasion of programmed cell death (Apoptosis)
4. Limitless replicative potential
5. Sustained angiogenesis
6. Tissue invasion and metastasis
Genetic mutations leading to neoplastic transformation can occur either in oncogenes
(dominant gain of function mutations) or in tumor suppressor genes (recessive loss of
function mutations); products of these genes include protein involved in the regulation of
diverse biological processes, such as growth, proliferation, apoptosis, metabolism, and DNA
repair.
From what we know so far, we can affirm that tumor development proceeds via a process
formally analogous to Darwinian evolution, in which a succession of genetic changes, each
conferring a specific advantage to the carrier cell, leads to the progressive process of
neoplastic transformation, i.e. the conversion of normal cells into cancer cells (Hanahan and
Weinberg 2000), allowing them to overstep all bounds posed by the surrounding environment
to tumor formation.
1.1.1 Self sufficiency in growth signals
Normal cells require growth factors (GF) in order to move from a quiescent state into a
proliferative one. GF are diffusible protein, which bind cognate receptors on the cell surface
thus transmitting into the internal space of cells a plethora of signals. Indeed, following
activation of multiple intracellular signalling cascades, GF control metabolism, entry into the

6
cell cycle and motility, both through regulation of gene expression and through post-
translational modulation of protein function. Conversely, cancer cells acquire autonomy from
exogenous GFs in several ways: they can (i) become capable to synthesize the GFs they need,
e.g., sarcomas produce TGFα (Fedi et al., 1994); (ii) overexpress GF-binding receptors, e.g.
EGF-R /erbB in breast cancer (Slamon et al., 1987); (iii)to structurally change GF receptors
in order to obtain constitutively active signals, example.g. with truncated versions of EGF
receptor lacking much of its cytoplasmic domain (Fedi et al., 1994); (iv) switch the isoform
of the extracellular receptor, in order to express those that are more prone to transmit growth
signals. Oncogenic mutations can also occur on downstream cytosolic components of GFs
signaling: a classical example is hyper-activation of the MAP kinase cascade, observed in the
majority of cancers and caused by mutations in several components of this signaling pathway
(Dhillon et al., 2007).
1.1.2 Insensitivity to growth inhibitory signals
Multiple anti-proliferative stimuli operate to counteract growth signals and maintain tissue
homeostasis. These type of signals include both soluble factors and immobilized inhibitors
embedded in the extracellular matrix. Antigrowth signals block proliferation, prompting cell
exit from the cycle, in the G0 quiescent state, which frequently preludes to the acquisition of
specific differentiation traits. Cancer cells evade these stimuli by modulating components that
govern the transit of cells through the G1 phase of the cell cycle. A classical pathway altered
in cancer cells is the one controlled by the protein pRb, encoded by the retinoblastoma tumor
suppressor gene Rb1. The protein pRB blocks proliferation, because it sequesters the E2F1
transcription factor, a master switch that controls the transition from G1 into S phase.
Disruption of this cascade leads to forced proliferation (Goodrich et al., 2006), and
mutational inactivation of the two Rb1 alleles causes pediatric retinoblastoma and is involved
in many tumor types.
Another important player in avoiding post mitotic differentiation is the proto-oncogenic
transcription factor c-Myc (Dang, Cell, 22, 149, 2012). The resting cell normally expresses
little c-Myc, whereas cells stimulated by growth factors dramatically increase c-Myc
expression as an immediate early response gene. c-Myc is constitutively expressed in a wide
spectrum of cancers and it is associated with aggressive, poor differentiated neoplasias. c-
Myc, in association with the transcription factor Max, activates the expression of genes that

7
directly induce proliferation, such as those encoding Cyclin D2 or CDK4 (Pelengaris et al.,
2002). Cell differentiation is controlled by Mad-Max transcription factor complexes: c-Myc
over-expression disrupt Mad-Max interaction in several tumors favoring formation of c-Myc-
Max complexes (Pelengaris et al., 2002). Recent works have established a role for c-Myc also
in cell cycle progression, metabolism, apoptosis and genomic instability (Dang, 2012).
1.1.3 Evasion of programmed cell death (Apoptosis)
Tumors are characterized by a high proliferation rate that is sustained also by the
development of a robust anti-apoptotic platform. During apoptosis, lipid asymmetry of
cellular membranes is disrupted, the cytoplasmic and nuclear skeletons are broken down, the
cytosol is extruded, the chromosomes are degraded, and the nucleus is fragmented.
Eventually, the shriveled cell corpses are engulfed by macrophages.
Signals that elicit apoptosis converge on mitochondria, which respond to stimuli by releasing
cytochrome c which in turn activates intracellular protease called caspases (this feature will
be discussed in detail in paragraph 1.4).
1.1.4 Limitless replicative potential
Mammalian cells carry an intrinsic, cell autonomous program that limits their multiplication,
independently of cell-to-cell signaling. Once cells have progressed through a certain number
of doublings, they stop growing and enter a state called senescence. Cellular senescence is
characterized by a cell cycle arrest that can be triggered by many types of intrinsic and
extrinsic stress, including telomere malfunction, oncogene activation and tumor suppressor
gene inactivation (Prieur and Peeper, 2008; Kuilman et al., 2010). Ultimately, most signals
that induce senescence converge on p53 and pRB, which have been proposed to act as gate-
keeper tumor suppressors (Prieur and Peeper, 2008). From the first description of Oncogene-
Induced cellular Senescence (OIS) over a decade ago (Serrano et al., 1997), many subsequent
studies have confirmed that OIS prevents cells from undergoing oncogenic transformation in
vitro. However, it has long been debated whether any in vivo correlate does exist. It is only
since recent years that evidence has been accumulating indicating that OIS in vivo is a major
protective mechanism against cancer (Prieur and Peeper, 2008). One strategy used by
malignancies to replicate in a limitless way is the maintenance of telomeres. The ends of
chromosomes, called telomeres and characterized by repeats of 6 bp sequence elements,

8
control the number of duplications in a cell life. Each doubling passage leads to a loss of 50-
100 bp of telomeric DNA. When telomeres reach a critical minimal length, their protective
structure is disrupted. This triggers a DNA damage response (DDR) that can induce a
transient proliferation arrest, allowing cells to repair their damage. However, if the DNA
damage exceeds a certain threshold, cells are destined to undergo either apoptosis or
senescence (Kuilman et al., 2010). Telomeric DNA can be replicated: this process requires
telomerase, a specialized cellular ribonucleoprotein RNP reverse transcriptase (Blackburn,
2005). Malignancies, in order to avoid senescence induced by telomeres erosion, upregulate
telomerases which add hexanucleotide repeats onto the end of telomeric DNA, regenerating
them continuously (Hanahan and Weinberg, 2000; Blackburn, 2005).
1.1.5 Sustained angiogenesis
Physiological angiogenesis is the spreading of capillary venules from pre-existing vessels.
Ischemia and oxygen decrease initiate a cascade of events that stimulates new vessel
formation in order to increase nutrient and oxygen supply. This complex process requires
interactions among different cell types, extracellular matrix, growth factors, several
cytokines. The process of cancer angiogenesis relies on many of the same processes involved
in the physiological angiogenesis, with the difference that these processes are constitutively
active in cancer. When the primary tumor mass reaches 1-2 mm of diameter, the tumor
demand for oxygen and nutrients exceeds the local supply capability and the internal tumor
regions undergo ischemia. Cancer cells respond to these hypoxic microenvironments with the
induction of HIF transcription factors, which strongly boost angiogenesis, . In addition to
hypoxia, other factors can aberrantly upregulate HIF family expression under normoxic
conditions in tumors, for example inactivating mutations in the tumor suppressor gene von
Hippel Lindau (VHL), which encodes a protein involved in proteasomal degradation of
HIF1α (Denko, 2008).
The ability of cancer to stimulate new angiogenesis is a pre requisite for the rapid cell
expansion that preludes to the formation of macroscopic solid tumors (Hanahan and
Weinberg, 2000; Ellis et al., 2008; Chung et al., 2010). There are many instances in which
cancer cells upregulate signals that initiate angiogenesis, such as vascular endothelial growth
factors (VEGF) fibroblast growth factors (FGF 1/2), and down regulate the endogenous
angiogenesis inhibitors such as β-interferon or thrombospondin-1. New vessels induced by

9
cancer cells are quite different from normal ones because they are tortuous and disorganized.
Moreover they are leakier than normal: this both contributes to the generation of an
interstitial hypertension that limits the delivery of anti-neoplastic drugs, and favors the
spreading of metastases.
1.1.6 Tissue invasion and metastasis
The capability of neoplastic cells to trespass tissue boundaries, to colonize both adjacent
districts (invasion) and distant areas, utilizing in this case the blood or the lymph flux
(metastasis), are characteristic of tumors. The pathological importance of these processes is
highlighted by the observation that cancer lethality is caused in the vast majority of cases by
invasive or metastatic tumor masses. Invasion and metastasis are complex events and their
genetic and biochemical determinants remain not completely understood.
Epithelial tissues, representing the origins of most solid tumors, are formed by relatively rigid
sheets of cells. These are separated from the stroma by a basement membrane and are highly
organized by lateral belts of cell–cell adhesion complexes. During the progression from an in
situ tumor to an invasive carcinoma, epithelial tumor cells are released from their neighbors
and breach the basement membrane barrier. This phenomenon requires a complex
reorganization of tumor cell features, called EMT (Epithelial to Mesenchymal transition;
Geiger and Peeper, 2009). EMT is an evolutionarily conserved developmental process.
Indeed during embryonic development, certain differentiated polarized epithelial cells, on
extracellular cues, undergo profound morphogenetic changes, collectively referred as EMT.
This is typified by the dissolution of cell–cell junctions and loss of apico–basolateral polarity,
resulting in the formation of migratory mesenchymal cells with invasive properties (Singh
and Settleman, 2010) The changes in cell adhesion and migration during tumor invasion are
reminiscent of EMT developmental process and has an active role in different stages of the
metastatic cascade such as intravasation. It has been reported that transforming growth factor
β (TGFβ) acts as a major player in the metastatic process. In non neoplastic cells TGFβ
mediates growth arrest and apoptosis, but recently Adorno et al. (2009) have identified for
TGFβ an oncogenic role which would promote mutant p53-mediated suppression of the
related p63 protein, thus uncovering a new role for p63 in the negative regulation of
metastasis (Clohessy and Pandolfi, 2009).

10
Several classes of proteins are involved in tethering cells to their surroundings in a tissue, and
many of these are altered when cells acquire metastatic capacity. Proteins affected include
cell-cell adhesion molecules (CAMs, for instance E-cadherin) but also integrins that regulate
interactions between cells and the extracellular matrix and extracellular proteases (Geiger and
Peeper, 2009). Recently it was proposed that metastasis can evolve following two different
models and this is crucial under a therapeutic point of view (fig.1).
Figure 1. Late and early metastatic cascade model. The late dissemination model postulates that the expansion of
metastatic clones occurs into the primary tumor, these aggressive cells would have a genetic profile similar to that of primary
tumor cells. The early dissemination model proposes that mutations accumulate at distant sites, where metastatic cells
genetically diverge from primary tumor cells (From Klein, 2008).
The first one is the linear progression model, also called the late dissemination model. In this
model, cancer cells undergo genetic and epigenetic alterations, multiple successive rounds of
mutations and selections for competitive fitness in the context of primary tumors. After a
number of such rounds, cells that can proliferate leave the primary accrual site to seed and
grow in secondary loci. Therefore, this clonal expansion is strictly related to tumor size and,
more importantly, metastases are genetically similar to primary tumors.
The second model is the parallel or early dissemination model. This type of progression
predicts an early dissemination of metastatic founder cells, with no need of accumulating
mutations in the primary tumor mass. So, a great genetic disparity exists between cells
derived from the metastatic founder and those grown in the primary tumor, as
microenvironment becomes the limiting factor in the gathering of site-specific genetic and
epigenetic mutations (Klein, 2008; Klein, 2009). When tumor cells lose contact with the
basement membrane they must face another anti-tumor barrier: anoikis. It is a form of

11
programmed cell death which is induced by anchorage-dependent cells detaching from the
surrounding extracellular matrix. In this way detaching cells are deprived of essential signal
for growth or survival and die. Tumor cells are capable of evading anoikis. This mechanism
is achieved through the involvement of constitutive activity of survival pathways that include
integrin-dependent activation of FAK and subsequent ERK phosphorylation. In addition,
FAK associates with RIP, thereby inhibiting the association of RIP with Fas and the ensuing
formation of a death-inducing signalling complex (DISC), thus favoring cell survival. Up-
regulation of CD44 also contributes to survival signals and promotes anoikis resistance
(Bunek et al., 2011). Moreover amorphosis, or cell death caused by changes in cell shape,
could hamper metastasis by inducing apoptosis when tumor cells enter “foreign”
environments. Suppression of this type of cell death is a prerequisite for tumor cells to
successfully metastasize to distant sites (Geiger and Peeper, 2009).
Figure 2. Principal classes of tumor antigens recognized by CTL CD8+ cells. Some proteins expressed or mutated in
cancer (oncoproteins, mutated self proteins or oncogenic viruses) can be recognized by the immune system if associated to
MHC I and destroyed by CTL cells (from Kumar et al., 2009)
After a decade of intensive oncological research and in the light of new observations and
evidences, Hanahan and Weinberg in 2011 added two new emerging hallmark capabilities
and two enabling characteristics, crucial to the acquisition of the six hallmark capabilities:
12
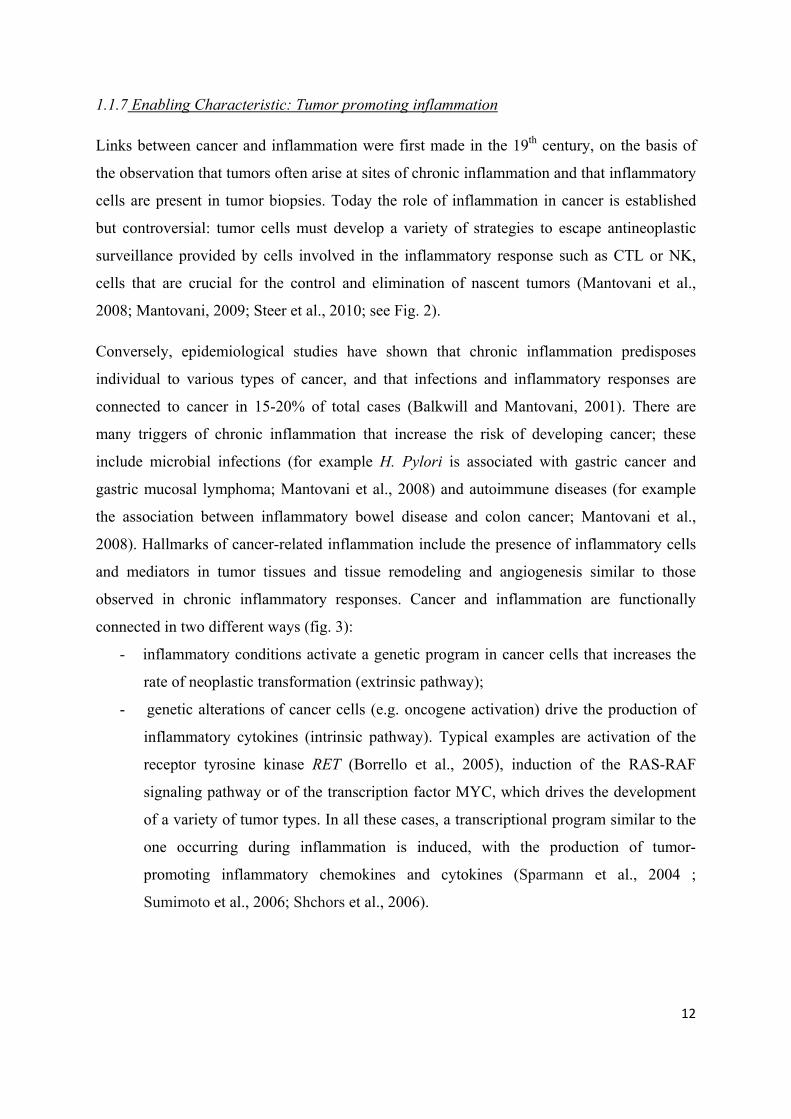
1.1.7 Enabling Characteristic: Tumor promoting inflammation
Links between cancer and inflammation were first made in the 19th century, on the basis of
the observation that tumors often arise at sites of chronic inflammation and that inflammatory
cells are present in tumor biopsies. Today the role of inflammation in cancer is established
but controversial: tumor cells must develop a variety of strategies to escape antineoplastic
surveillance provided by cells involved in the inflammatory response such as CTL or NK,
cells that are crucial for the control and elimination of nascent tumors (Mantovani et al.,
2008; Mantovani, 2009; Steer et al., 2010; see Fig. 2).
Conversely, epidemiological studies have shown that chronic inflammation predisposes
individual to various types of cancer, and that infections and inflammatory responses are
connected to cancer in 15-20% of total cases (Balkwill and Mantovani, 2001). There are
many triggers of chronic inflammation that increase the risk of developing cancer; these
include microbial infections (for example H. Pylori is associated with gastric cancer and
gastric mucosal lymphoma; Mantovani et al., 2008) and autoimmune diseases (for example
the association between inflammatory bowel disease and colon cancer; Mantovani et al.,
2008). Hallmarks of cancer-related inflammation include the presence of inflammatory cells
and mediators in tumor tissues and tissue remodeling and angiogenesis similar to those
observed in chronic inflammatory responses. Cancer and inflammation are functionally
connected in two different ways (fig. 3):
- inflammatory conditions activate a genetic program in cancer cells that increases the
rate of neoplastic transformation (extrinsic pathway);
- genetic alterations of cancer cells (e.g. oncogene activation) drive the production of
inflammatory cytokines (intrinsic pathway). Typical examples are activation of the
receptor tyrosine kinase RET (Borrello et al., 2005), induction of the RAS-RAF
signaling pathway or of the transcription factor MYC, which drives the development
of a variety of tumor types. In all these cases, a transcriptional program similar to the
one occurring during inflammation is induced, with the production of tumor-
promoting inflammatory chemokines and cytokines (Sparmann et al., 2004 ;
Sumimoto et al., 2006; Shchors et al., 2006).

13
Figure 3. Pathways that connect inflammation and cancer. Cancer and inflammation are connected by two pathways: the
intrinsic one activated by genetic events and the extrinsic one due to infectious conditions and inflammation. Both pathways
converge in the activation of transcription factors (NF-kΒ, STAT3, HIF1α ) that coordinate the production of chemokines
and cytokines. (from Mantovani et al. 2008)
Tumor suppressor proteins (e.g. VHL, TGFβ and the phosphatase PTEN) can also regulate
the production of inflammatory mediators.
Both intrinsic and extrinsic pathways converge on the activation of endogenous transcription
factors, which elicit cytokine synthesis. Inflammatory pathways are also involved in
migration, invasiveness and ectopic survival. As an example, the chemokine receptor CXCR4

14
is expressed in tumors, and its expression correlates with the metastasis of colorectal, breast,
liver and esophageal cancer (Mantovani, 2008).
1.1.8 Enabling Characteristic: Genome instability and mutations
Cancer cells often increase the rate of mutation in order to obtain mutant genes whose protein
products contribute to the tumorigenic process. In other words, genome instability is inherent
to the great majority of human cancer cells because it accelerates the rate of accumulation of
favorable genotypes (Hanahan and Weinberg, 2011). There are two ways by which tumors
can do that: through an increase in the sensitivity to mutagenic agents (due to mutations in
genes whose products are involved in the inactivation of mutagenic molecules before they
damage DNA), or through a breakdown in one or several components of the genomic
maintenance machinery (genes codifying for proteins involved in detecting DNA damage and
activating the repair machinery, or enzymes directly repairing damaged DNA), or both
(Negrini et al., 2010). The molecular genetic analysis of cancer cell genomes has provided
compelling evidences of gain and loss of gene copy numbers, finding recurrences of specific
aberration patterns at particular sites in the genome.
1.1.9 Emerging Hallmark: Evading immune destruction
Cells and tissues are constantly monitored by the immune system and this surveillance is
responsible for recognizing and eliminating the vast majority of incipient cancer cells and
thus nascent tumors. Oncogenic mutations can be recognized also by the immune system. In
particular cytotoxic T Lymphocytes (CTL) and Natural Killer (NK) cells can efficiently discover and
destroy cells the express novel or aberrant antigens associated to MHC class I proteins or that do not
express MHC class I proteins (Kumar et al. 2009, Fig. 2). In order to avoid detection and to limit
eradication, solid tumors must escape the immune system, both the innate and the adaptative
arms. This is achieved by the malignant cell through a variety of strategies: for example,
cancer cells may block the activity of infiltrating CTLs and NK cells by secreting TGF-β or
other immunosuppressive factors (Yang et al., 2010; Shields et al., 2010).

15
1.1.10 Emerging Hallmark: Reprogramming energy metabolism
Many observations made during the early period of modern cancer biology identified
metabolic changes as a common feature of cancerous tissues. One of these features is the
prevalent use of glycolysis as source of energy, independently of the oxygen availability.
This phenomenon was discovered by Otto Warburg at the beginning of 20th century (Warburg
et al., 1927; Warburg, 1956) and cancer glucose avidity is currently used in clinical practice
to diagnose cancer and dissemination of micro-metastases with the PET (positron electron
tomography) technique. Today we know that cancer cells are characterized by several
metabolic alterations, which will be discussed in the next paragraph.
1.2 Metabolic alterations in cancer
Tumor cells have a remarkably different metabolism from that of the tissues which they are
derived from. Indeed, the metabolism of neoplastic cells mustsustain higher proliferative
rates and resist oxygen paucity found in the inner tumor mass; at the same time, neoplasms
are continuously exposed to oxidative insults (Tennant et al., 2010).
In the third decade of the last century, Warburg measured oxygen consumption and lactate
production in tumor slices, either in the presence or absence of oxygen. He found that the
rapidly growing tumor cells consumed glucose at a surprisingly high rate compared to normal
cells in the presence of oxygen, and most of the glucose-derived carbon was secreted by
neoplasmsin the form of lactate (Warburg, 1927). Warburg later postulated that this
phenomenon, termed ‘aerobic glycolysis’, was provoked by mitochondrial impairment and
was the origin of cancer cell transformation (Warburg, 1956). His observations were almost
forgotten for almost a century, and metabolic alterations of tumors were simply considered an
epiphenomenon of changes elicited in the neoplastic cells by mutations in oncogenes and
tumor suppressor genes.
In the same period, Crabtree observed that increased glucose availability boosts glycolysis in
cancer and normal proliferating cells, while inhibiting respiration, an observation now known
as the ‘Crabtree effect’ (Crabtree, 1928). He further suggested that this observation is
sufficient to explain the decrease in oxidative phosphorylation-derived ATP in cancer, which
argues against Warburg’s initial hypothesis that defects in respiration are the cause for
increased glycolysis. Years later it was suggested that respiration inhibition by glycolysis was

16
caused by glycolysis competing with oxidative phosphorylation for Pi and ADP. However,
the Crabtree effect does not provide an explanation for the actual cause of the observed
increased aerobic glycolysis in cancer (Frezza and Gottlieb, 2009).
Subsequent work showed that mitochondrial function is not impaired in most cancer cells,
suggesting that the shift towards glycolysis during neoplastic transformation occurs as a
consequence of regulatory mechanisms.
We still do not understand exactly what is the advantage obtained by tumor cells in moving
their metabolic demand towards glucose usage (Fig. 4). The current model postulates that the
preferential use of aerobic glycolysis offers the following advantages to highly proliferative
cells. First, it focuses cells on the use of glucose, which is the most abundant extracellular
nutrient; second, the flux of ATP derived from glycolysis can exceed the one produced
during OXPHOS, despite the low efficiency of glycolysis, when glucose is provided at a
sufficiently high concentration; third, glucose utilization provides essential metabolic
intermediates for the biosynthesis of diverse macromolecules (lipids, proteins and nucleic
acids) and for anti-oxidative defenses, with the production of NADPH (Vander Heiden et al.
2009).
Figure 4. ATP yield of oxidative phosphorylation, anaerobic glycolysis and aerobic glycolysis (Warburg Effect). (from
Vander Heiden et al., 2009)
Cancer cells need biosynthetic precursors to sustain rapid proliferation, so it is not surprising
that metabolic activities in cancer cells are very different from those in non-proliferating

17
cells. So, as well as aerobic glycolysis, there are other core fluxes, such as the pentose
phosphate pathway, the de novo fatty acid synthesis and glutamine-dependent anaplerosis,
that cancer cells need for their high rate of replication.
1.2.1 The pentose phosphate pathway:
In order to sustain the rapid proliferation that is a characteristic of tumours, there must be an
increase in the synthesis of both fatty acids and nucleotide precursors. Cells divert the
glycolytic intermediates into the Pentose Phosphate Pathway (PPP), either from glucose 6-
phosphate (using the oxidative arm of PPP) or from fructose 6-phosphate (using the non-
oxidative arm of PPP). These intermediates can then be used to reduce nicotinamide adenine
dinucleotide phosphate (NADP+) to NADPH (from the oxidative arm only) and synthesize
ribose 5-phosphate, a nucleotide precursor (Tennant et al, 2009).
1.2.2 Fatty acid synthesis:
Proliferating cells in general and cancer cells in particular require de novo synthesis of lipids
for membrane assembly. Under conditions where pyruvate dehydrogenase (PDH) is not
inhibited, pyruvate is converted into acetyl-CoA and enters the trycarboxylic acid (TCA)
cycle by condensing with oxaloacetate to form citrate (Figure 3A). Citrate is mostly oxidized
in the TCA cycle to produce reducing potential for the mitochondrial electron transport chain
(ETC), but it can also be used for fatty acid synthesis in the cytosol. Cytosolic citrate is
converted back into oxaloacetate and acetyl-CoA by the action of ATP citrate lyase. This
further supports the anabolic reprogramming observed in tumorigenesis, boosting
proliferation of tumor cells.
1.2.3 Glutaminolysis:
There are two major sources of energy and carbon for cancer cells: glucose and glutamine. It
has been recently proposed that glucose accounts mainly for lipid and nucleotide synthesis,
whereas glutamine is responsible for anaplerotic re-feeding of the TCA cycle, for amino acid
synthesis and for nitrogen incorporation into purine and pyrimidine for nucleotide synthesis
(DeBerardinis et al., 2007).
Once in the cell, glutamine is initially deaminated to form glutamate, a process catalysed by
the enzyme glutaminase. Glutamate in turn can be converted into α-ketoglutarate either by a
second deamination process catalyzed by the enzyme glutamate dehydrogenase or through

18
transamination. On entering the TCA cycle, a-ketoglutarate is metabolized to eventually
generate oxaloacetate, an important anabolic precursor that will condense with the acetyl-
CoA generated from glycolysis or glutaminolysis to produce citrate (Fig. 5).
The importance of glutaminolysis in cancer metabolism is evident from the considerable
release of ammonium in the venous effluent of cancer patients, and by the fact that, with
time, the majority of patients develop glutamine depletion. In fact, glutaminase has been
found to be over-expressed in a variety of tumor models and human malignancies, and the
rate of glutaminase activity correlates with the rate of tumor growth.
Figure 5. Pathways of glutamine metabolism.The interconnection between glutamine metabolism and glucose metabolism
is highlighted. Inhibition of glutaminase by compound 968 suppresses oncogenic transformation induced by Rho GTPases.
GLS, glutaminase; TCA cycle, tricarboxylic acid cycle; MRC, mitochondrial respiratory chain; V, mitochondrial respiratory
complex V; OAA, oxaloacetate; Asp, aspartate; a-KG, a-ketoglutarate, miR=micro RNA (from Lu et al., 2010).
1.3 Mitochondria and tumor The molecular mechanisms responsible for the metabolic shift are under intense scrutiny, and
their unraveling will allow to understand how changes in the metabolic profile can provide
tumors with a growth advantage (Denko 2008). There are two main mechanisms explored by
researchers:
1) Mutations that alter metabolism. Oncogenic mutations, both in oncogenes and in tumor
suppressor genes can directly influence metabolism. For example, Ras and Akt mutations
increase glycolytic flux at different levels (Hsu and Sabatini 2008), whereas p53 inhibits
glycolysis by inducing the expression of TIGAR, which decreases fructose 2-6-biphosphate
levels (Hsu and Sabatini 2008; Cairns et al. 2011).
19
2) Environmental stresses. A variety of signals reaching the tumor from the surrounding
environment can modulate the metabolism of the neoplastic cell; these signals include
hypoxia, acidosis and interstitial pressure.
The first evidences of a direct, causative role of mitochondrial alterations in the tumorigenic
process were only discovered a decade ago when mutations in succinate dehydrogenase
(SDH) (Baysal et al., 2000) or fumarate hydratase (FH) (Tomlinson et al., 2002), both
enzymes of the TCA cycle, were found to be the initiating events of familial paraganglioma
or leiomyoma and of papillary renal cell cancer, respectively. Soon after the discovery of
SDH mutations it was proposed that the HIF pathway is activated in the associated tumors
(Gimenez-Roqueplo et al., 2001) but only four years later it was demonstrated that impaired
HIFα degradation due to the inhibition of its hydroxylation by PHDs is at the heart of the
pathology of these tumours.
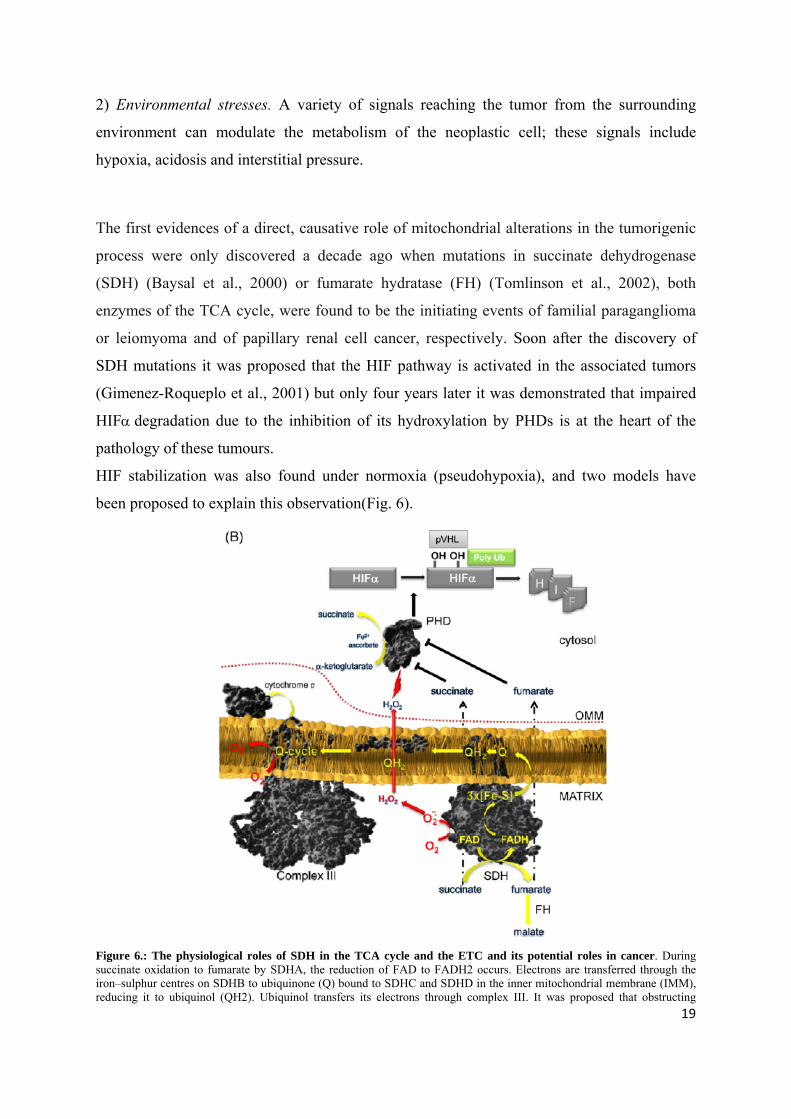
HIF stabilization was also found under normoxia (pseudohypoxia), and two models have
been proposed to explain this observation(Fig. 6).
Figure 6.: The physiological roles of SDH in the TCA cycle and the ETC and its potential roles in cancer. During succinate oxidation to fumarate by SDHA, the reduction of FAD to FADH2 occurs. Electrons are transferred through the iron–sulphur centres on SDHB to ubiquinone (Q) bound to SDHC and SDHD in the inner mitochondrial membrane (IMM), reducing it to ubiquinol (QH2). Ubiquinol transfers its electrons through complex III. It was proposed that obstructing

20
electron flow within complex II might support a single electron reduction of oxygen at the FAD site. Superoxide is dismutated to hydrogen peroxide which can then leave the mitochondria and inhibit PHD in the cytosol, leading to HIFα stabilization. Succinate which accumulate in SDH-deficient tumors, can also leave the mitochondria and inhibit PHD activity in the cytosol (From Frezza and Gottlieb, 2009).
The first model proposes that reactive oxygen species (ROS), generated from an impaired
complex II, inhibit HIFα hydroxylation by PHDs. ROS oxidate iron and ascorbate, that are
cofactors of PHDs, inactivating them. However, there are controversial data regarding ROS
production in SDH deficient cells (Ishii et al, 2005; Selak et al., 2006).
The second model proposes that succinate, whose concentration increases in SDH-deficient
mitochondria, can serve as a mitochondria-to-cytosol messenger that inhibits PHD activity
through a feedback mechanism (Selak et al., 2005). Moreover, it was reported that, similar to
succinate, the increased fumarate levels observed in FH-deficient HLRCC (Hereditary
leiomyomatosis and renal cell cancer) tumors also inhibit PHD activity and consequently HIFα
degradation (Isaacs et al., 2005).
These two models of pseudo-hypoxic HIF1α stabilization are not necessarily mutually
exclusive and it is possible that in vivo both ROS and succinate cooperate to inhibit PHD
activity in SDH-deficient tumors (Frezza and Gottlieb, 2009).
1.4 Hypoxia-inducible factors and cancer
In cancer, the combination of dysregulated cell proliferation and of abnormal blood vessels
result in severe hypoxia. To adapt to this hostile environment, cancer cells exploit
physiological responses to hypoxia. Cells respond to hypoxic conditions by activating
hypoxia-inducible factors (HIFs), which regulate the delivery and consumption of oxygen
(Semenza, 2012).Cells can increase oxygen consumption in physiological conditions, such as
in response to proliferation stimuli. The ensuing hypoxic conditions activate HIFs, leading to
transcription of the VEGF gene, which encodes vascular endothelial growth factor that
stimulates angiogenesis and increases oxygen delivery.
HIF is a heterodimeric protein formed by a constitutively expressed subunit (HIFβ, also
called ARNT) and an oxygen-regulated subunit (HIFα; Boulahbel, 2009). HIF activity is
regulated by oxygen through proline and asparagine hydroxylation. The hydroxylation of two
proline residues (Pro 402 and Pro 564) in the ODDD (oxygen-dependent degradation
domain) in HIF-1α and in HIF-2α is mediated by prolyl hydroxylase domain protein 2
(PHD2). In humans, the PHD family is composed of three different 2-oxoglutarate (α-
21
ketoglutarate) dioxygenases (PHD1, PHD2 and PHD3) that require iron and ascorbate as
cofactors. This hydroxylation allows the interaction of the ODDD with the pVHL (von
Hippel–Lindau protein)–ubiquitin E3 ligase, promoting the ubiquitination and subsequent
proteasomal degradation of HIFα. Under low oxygen, the hydroxylation does not occur, as
the required oxygen atoms are obtained from molecular oxygen, whereas 2-oxoglutarate
provides electrons and is then decarboxylated to succinate. Thus, the interaction between
HIF1α and pVHL is prevented. As a result, HIFα is stabilized, forms a heterodimer with
HIFβ and promotes the expression of target genes. The number of direct HIF target genes is
currently greater than 800 (Semenza, 2012).
HIFs play key roles in many crucial aspects of cancer biology including angiogenesis, stem
cell maintenance, metabolic reprogramming, autocrine growth factor signaling, epithelial-
mesenchymal transition, invasion, metastasis, and resistance to radiation therapy and
chemotherapy. This is achieved through modulation of several specific HIF-regulated genes
(Fig 7):
- Metabolic reprogramming: HIF-1 mediates the expression of genes encoding glucose
transporters (GLUT1 and GLUT3), glycolytic enzymes (Hexokinase 1 and 2, lactate
dehydrogenase, pyruvate kinase M2).
- Angiogenesis: HIF-1 controls the expression of several genes encoding angiogenic
growth factor, as VEGF, stromal-derived factor 1 (SDF1) or placental growth factor
(PGF).
- Epithelial–mesenchymal transition: HIF-1 induces the transcription of genes that
block the expression of E-cadherin and other proteins that are responsible for the
architecture of the cytoskeleton, for cell-cell adhesion or other features of epithelial
cells.
- Invasion and metastasis: HIF activates also the transcription of genes which encode
for proteases that degrade or remodel the extracellular matrix and that favor
extravasation of cancer cells at metastatic sites.

22
Figure 7 HIF target genes encode proteins involved in crucial aspects of cancer progression. (a) HIF target genes that promote cell immortalization, stem cell self-renewal, and autocrine growth and survival include those encoding adrenomedullin (ADM), endothelin 1 (EDN1). (b) HIF-1 target genes involved in metabolic reprogramming include glucose transporter 1 and 3 (GLUT1, GLUT3), hexokinase 1 and 2 (HK1, HK2), glycolytic enzymes aldolase A (ALDOA), enolase 1 (ENO1), glyceraldehyde-3-phosphate dehydrogenase (GAPDH), phosphofructokinase L (PFKL), phosphoglycerate kinase 1 (PGK1), pyruvate kinase M2 (PKM2), and lactate dehydrogenase A (LDHA). (c) HIFs stimulate tumor vascularization by activating transcription of the genes encoding VEGF, stromal-derived factor 1 (SDF1), placental growth factor (PGF), platelet-derived growth factor B (PDGFB), and angiopoietin 1 and 2 (ANGPT1, ANGPT2). (d) HIF target genes that promote epithelial–mesenchymal transition include those encoding inhibitor of differentiation 2 (ID2), snail 1 and 2 (SNAI1, SNAI2), transcription factor 3 (TCF3), TGFA, vimentin (VIM), and zinc finger E-box-binding homeobox 1 and 2 (ZEB1, ZEB2). (e) HIF target genes promoting invasion and metastasis include those encoding autocrine motility factor (AMF; also known as GPI), angiopoietin-like 4 (ANGPTL4), cathepsin C (CTSC), lysyl oxidase (LOX), LOX-like 2 and 4 (LOXL2, LOXL4), L1 cell adhesion molecule (L1CAM), Met proto-oncogene/hepatocyte growth factor receptor (MET), matrix metalloproteinase 2, 9, and 14 (MMP2, MMP9, MMP14), and the urokinase plasminogen activator receptor (PLAUR) (From Semenza, 2012).

23
1.5 Chaperones in cancer In cancer cells, the aberrant stimulation of a variety of biological routines, which encompass
proliferation, growth, motility and survival, in the presence of several mutant proteins and
under the constitutive pressure of hyperactivated kinase signalling, requires a highly efficient
process of protein quality control. This is carried out by molecular chaperones, which are
involved in the correct folding of nascent polypeptides and in the productive assembly of
multimeric protein complexes, while minimizing the danger of aggregation in the protein-rich
intracellular environment. These proteins also control the conformational changes associated
to molecular dynamics, as in the case of propagation of signals through reversible
phosphorylations, and in the regulation of protein degradation and turn-over (Akerfelt et al.,
2010; Liberek et al., 2008). The mechanism that cells use to ensure the quality of intracellular
proteins is the selective destruction of misfolded or damaged polypeptides. In eukaryotic
cells, a large ATP-dependent proteolytic machine, the 26S proteasome (Ravid and
Hochstrasser, 2008) prevents the accumulation of non-functional, potentially toxic proteins.
This process is of particular importance in protecting cells against harsh conditions (for
example, heat shock or oxidative stress) and in a variety of diseases (for example, cystic
fibrosis and the major neurodegenerative diseases).
Heat shock proteins (HSP) are an important protein family of intracellular chaperones. The
heat shock response is a highly conserved mechanism in all organisms from yeast to humans
that is induced by extreme proteotoxic insults such as heat, oxidative stress, heavy metals,
toxins and bacterial infections. To face these and many other stress conditions, HSPs regulate
protein-protein interactions in several conditions, maintaining the correct polypeptide folding
in a plethora of dynamic situations, assisting in the establishment of proper protein
conformational changes, also preventing unwanted protein aggregations. HSPs also
contribute to the stabilization of partially unfolded proteins, and to the transport of proteins
across cell membranes, and are also involved in protein degradation and in the control of
signaling activation. Their conservation among different eukaryotes suggests that heat shock
proteins are essential for cell survival (Richter et al., 2010; Hishiya and Takayama, 2008).
The 90-kDa heat shock proteins (HSP90) are crucially involved in cell signaling,
proliferation, and survival, and are ubiquitously expressed in cells. Many proteins in tumor
cells are dependent upon the HSP90 protein folding machinery for their stability, refolding,
and maturation (Landriscina et al., 2009).

24
HSP90 is an evolutionarily conserved molecular chaperone that participates in stabilizing and
activating more than 200 proteins —referred to as HSP90 ‘clients’- many of which are
essential for constitutive cell signaling and adaptive responses to stress. To accomplish this
task, HSP90, the chaperone HSP70, and additional proteins termed co-chaperones form a
dynamic complex known as the HSP90 chaperone machine (Taipale et al., 2010; Neckers et
al., 2009). Cancer cells use the HSP90 chaperone machinery to protect an array of mutated
and over-expressed oncoproteins from misfolding and degradation. Therefore, HSP90 is
recognized as a crucial facilitator of oncogene addiction and cancer cell survival. For all these
features HSP-90 is an important therapeutic target in cancer (Whitesell and Lindquist, 2005).
The first HSP90 inhibitor, 17-AAG (tanespimycin), entered clinical trials in 1999. In 2004, a
second HSP90 inhibitor, 17-DMAG (alvespimycin), entered in clinical experimentation.
Owing to extensive efforts in rational drug design and discovery, HSP90 inhibitors are
currently undergoing clinical evaluation in cancer patients (Trepel et al., 2010; see Table 1).
Table 1. TRAP1 antagonists under preclinical/clinical evaluation (Landriscina et al, 2009)
HSP90 is characterized by a unique ATP-binding pocket. The conserved chaperone structure
consists of three domains: an amino terminal region (N domain) that contains an ATP and

25
drug-binding site and co-chaperone-interacting motifs; a middle (M) domain that provides
docking sites for client proteins and co-chaperones, and that participates in forming the active
ATPase; and a carboxy-terminal (C) domain that contains a dimerization motif, a second
drug-binding region and interaction sites for other co-chaperones. Dimerization of two
HSP90 protomers through their C domains is necessary for chaperone function. Although
HSP90 is primarily a cytoplasmic protein, it was also found in organelles such as
mitochondria (Trepel et al. 2010).
Mammalian cells also express two compartmentally restricted HSP90 homologues:
- Glucose-regulated protein 94 (GRP94) found in the endoplasmic reticulum (ER);
- Tumour necrosis factor receptor-associated protein 1 (TRAP1) localized into mitochondria.
Like other HSP90 proteins, both GRP94 and TRAP1 possess ATPase activity but both lack
known co-chaperones. Recent studies suggest that GRP94 is essential for the maturation and
secretion of insulin-like growth factors, which are autocrine mitogens that have a key role in
transformation. ATP binding and hydrolysis are essential for the chaperone activity of
GRP94, and a comparison of the nucleotide-binding pocket of GRP94 with that of HSP90
suggests that GRP94-specific inhibitors can be designed. In light of these recent findings,
GRP94 should be evaluated as a bona fide anticancer target. (Trepel et al. 2010).
The mitochondrial chaperone TRAP1
TRAP1 (also known as HSP75) is a molecular chaperone of 75 kDa, homologous to HSP90
(Chen et al., 2005). TRAP1 was first identified as a HSP90-like chaperone while screening
for proteins associated with the cytoplasmic domain of the type 1 Tumor Necrosis Factor
Receptor-1 (TNFR-1), using the yeast two-hybrid system. A positive clone bound to the
NH2-terminal domain of TNFR-1 in vitro was designated as TNFR1-Associated Protein-1
(TRAP1; Song et al., 1995). The interaction between TNFR-1 and TRAP1 turned out to be an
artifact. Indeed, translation of the TRAP-1 mRNA generates a precursor protein of 704 amino
acids, containing a mitochondrial import sequence of 59 amino acids, which is removed upon
organelle import (see Fig. 8), and TRAP1 expression is restricted to mitochondria.

26
Figure 8. TRAP1 structure (Sturlese and Mammi, unpublished structure)
TRAP1 displays a higher ATP binding affinity than HSP90, with a typical ATPase cycle
(Felts et al., 2000), but it does not bind the classical HSP90 co-chaperones (p23 and Hop),
even if this does not exclude the possibility that TRAP1 binds other co-chaperones, not yet
identified. . See Table 2 for a comparison between TRAP1 and HSP90.
Table 2. Comparison between TRAP1 and HSP90 (Altieri et al., 2011).
The expression of TRAP1 is low or absent in the mitochondria of normal tissues (with the
exception of the brain and testis) but is markedly increased in tumor mitochondria (Kang et
al., 2007). Accordingly, microarray analyses identified TRAP1 as one of the target genes

27
upregulated by the Myc oncogene (Coller et al., 2000). Many chaperones are endowed with a
protective role against acute and chronic stress, and an anti-apoptotic function is emerging for
TRAP1 as well. Indeed, in natural killer cells TRAP1 protects from Granzyme M-mediated
generation of ROS and by the ensuing apoptosis (Hua et al., 2007) It was proposed a general
function of TRAP1 in the protection of mitochondria from oxidative stress. Accordingly,
TRAP1 was also found to be a substrate of the serine/threonine kinase PINK-1, whose
mutations cause an autosomal recessive form of Parkinson’s disease, whose pathogenesis
largely involve oxidative stress of dopaminergic neurons. TRAP1 phosphorylation by PINK1
protects cells from apoptosis (Pridgeon et al., 2007). This finding supports the notion that
TRAP1 plays a role in Parkinson’s disease, but also suggests that Ser phosphorylation may be
an important regulatory mechanism in TRAP1 function. An anti-oxidant role of TRAP1
could also be important in tumorigenesis. In human osteosarcoma SAOS-2 cells and colon
carcinoma cells high TRAP1 levels elicit resistance to oxidants and chemotherapeutics
(Costantino et al., 2009). TRAP1 overexpressing cells become more resistant to
chemotherapeutics, suggesting a role for the anti-apoptotic effect of TRAP1 in tumorigenesis.
Consistently, Fluorouracil (FU) resistant colon carcinoma cells and other tumor cells
upregulate TRAP1 protein levels (Montesano Gesualdi et al., 2007). The importance of
TRAP1 in neoplastic transformation is further supported by the finding that mitochondria
from tumor cells contain TRAP1 in a complex with HSP90, and that disabling the ATPase
activity of these chaperones leads to the selective death of neoplastic cells (Kang et al., 2007).
Moreover TRAP1 silencing in prostate cancer cell lines caused apoptosis, as did its targeting
with mitochondria-specific HSP90 inhibitors (Leav et al., 2009), and TRAP1 inhibition leads
to the collapse of mitochondrial integrity, cytochrome c release, and caspase activation in
several tumor cell lines and in several murine tumor models with little effect on non-
transformed cells and minimal in vivo toxicity (Kang et al., 2009; Kang et al., 2007). Notably,
TRAP1 could also have a role as a cancer biomarker, as its expression is increased in 62% of
all colorectal carcinomas, and in 100% of metastatic colorectal carcinomas (Landriscina et
al., 2009).
Taken together, these observations indicate that TRAP1 displays a relevant role in
tumorigenesis, and that it may inhibit some key apoptogenic events in mitochondria, whose
loss of regulation could contribute to the process of neoplastic transformation.

28
2. Materials and Methods
Cell cultures and transfections
Human SAOS-2 osteosarcoma cells, human cervical cancer HeLa cells and human HCT-116
colorectal carcinoma cells were purchased from ATCC. MEF cells, obtained from C57BL/6J
mice through SV40-immortalization, were a generous gift of Dr R. Stein, Tel Aviv
University. All these cells were grown in Dulbecco’s modified Eagle’s medium (DMEM)
supplemented with 10% fetal bovine serum (Invitrogen). RWPE-1 normal prostate epithelial
cells (transfected with a single copy of the human papilloma virus 18) and RWPE-2 cell line,
which was obtained by ( transformation of RWPE-1 cells with Ki-Ras , were grown in
keratinocyte medium (Gibco) supplemented with EGF and bovine pituitary extract; 100
units/ml penicillin and 100 μg/ml streptomycin were added to all media, and cells were kept
in a humidified atmosphere of 5% CO2/95% air at 37°C.
TRAP1 stable interference was achieved by transfecting cells with a panel of TRAP1
shRNAs from Sigma: CCGGTCCCTGTACTCAGAA;
CCGGCAGAGCACTCACCCTACTATGCTCGAGCATAGTAGGGTGAGTGCTCTGTTT
TTG;
CCGGTGGTTCTGGAGTGTTTGAAATCTCGAGATTTCAAACACTCCAGAACCATTT
TTG.
HIF1α stable interference was achieved with the following HIF1α shRNAs from Sigma:
CCGGCCAGTTATGATTGTGAAGTTACTCGAGTAACTTCACAATCATAACTGGTTT
TT;
CCGGTGCTCTTTGTGGTTGGATCTACTCGAGTAGATCCAACCACAAAGAGCATTT
TT). Scrambled shRNAs were used as negative controls. Stable interfered cells were selected
in 0.8 μg/ml puromycin (Sigma). TRAP1 mutant lacking the mitochondrial import sequence
(ΔN TRAP1) was a Δ1–59-Myc construct (generated as in Amoroso et al., 2012). For the
expression of TRAP1 cDNA (cloned in a pCMV6 vector, Origene), MEF cells were
transfected with Lipofectamine 2000 (Invitrogen) and selected in G418 (0.5 mg/ml; Sigma).
The rate of cell growth was measured with a ScepterTM cell counter (Millipore).

29
Tissue samples
Specimens from both tumor and normal, non-infiltrated peritumoral mucosa were obtained
from patients with colorectal carcinoma during surgical cancer removal, after an expressed
written informed consent to use biological specimens for investigational procedures was
obtained from all patients. Samples were cut into 125 mm3 pieces and one specimen was
fixed in formalin to confirm the histopathological diagnosis, while the others were frozen in
liquid nitrogen for further analyses. TRAP1 expression was increased in all samples from
metastatic neoplasias and in the majority of initial, non-metastatic tumors with respect to the
non-infiltrated surrounding mucosa. For ETC complex II evaluations, at least three samples
with increased TRAP1 expression and three samples without any TRAP1 expression changes
were analyzed.
In vitro tumorigenesis assays
For the focus forming assay, 106 cells were plated in 10 cm Petri dishes (BD Falcon) in
Dulbecco’s modified Eagle’s (DMEM) medium supplemented with 10% fetal bovine serum
(Gibco). When cells reached sub-confluence, serum concentration was decreased to the
reported values, which did not induce cell death per se, and changed every 4th day.
Mitochondria utilized for the determination of ETC complex enzymatic activities or cell
lysates used for Western immunoblot assays were obtained at the 15th day after serum
decrease, i.e. 1-2 days before cells that did not form foci started a massive death process (see
below for sample preparation). 25 days after serum decrease foci appeared as thick masses
and cords of cells. Plates were washed in PBS, fixed in methanol for 30 min and foci colored
with GIEMSA solution for 1 h. After washing in deionized water, size and number of foci
was analyzed with an Image Analyzer custom software (Rasola et al., 2007). For the soft agar
assay, cells were grown in 6 cm Petri dishes covered by a bottom layer composed by DMEM
medium mixed with low melting point agarose (Promega) at a final concentration of 1.0%,
and by a top layer of DMEM medium supplemented with 0.5% serum and mixed with low
melting point agarose at a final concentration of 0.6%. Cells (3x10⁵) were added during the
preparation of the upper layer, where they remained embedded. Dishes were then maintained

30
in a humidified atmosphere of 5% CO2-95% air at 37°C for three weeks, adding medium
(DMEM 0.5% serum) on the top of the two layers every 7th day. At the 25th day, dishes were
washed in PBS and colonies were stained with Crystal Violet 0.05% and analyzed with
Image Analyzer software.
In vivo tumorigenesis assays
Experiments were performed in 5-week-old female CD1 nude mice (Charles River
Laboratories) treated in accordance with the European Community guidelines. Twelve mice
were injected subcutaneously bilaterally in the flanks with 1.5x10⁷ SAOS-2 mock or
shTRAP1 cells in 200 μl of serum-free sterile PBS. In a subset of animals, tumor growth was
favored by injecting cells in PBS mixed with Matrigel in a 1:1 ratio. Tumor growth was
evaluated on alternate days by calliper measuring. After three weeks, mice were sacrificed
and tumors stored at -80°C or fixed in formaldehyde and maintained in 70% ethanol for
immunohistochemical analyses.
Cytofluorimetric analyses
Flow cytometry recordings were performed to determine cell death, as described (Fassetta et
al., 2006; Gramaglia et al., 2004), and mitochondrial mass. Briefly, cells were incubated at
37°C in 135 mM NaCl, 10 mM HEPES, 5 mM CaCl2 with FITC-conjugated Annexin-V
(Boehringer Mannheim) and propidium iodide (PI, 1 μg/ml; Sigma), to detect phosphatidyl-
serine exposure on the cell surface (increased FITC-conjugated Annexin-V staining) and loss
of plasma membrane integrity (PI permeability and staining). N-acrydine orange (NAO 20
μM, Invitrogen), which binds to cardiolipin in mitochondrial membranes, was utilized to
evaluate mitochondrial mass. Samples were analyzed on a FACS Canto II flow cytometer
(Becton Dickinson). Data acquisition and analysis were performed using FACSDiva
software.

31
Mitochondria purification and quantification
Mitochondria were isolated after cell disruption with a glass-Teflon or electrical potter
(Sigma) in a buffer composed by 250 mM sucrose, 10 mM Tris-HCl, 0.1 mM EGTA-Tris,
pH 7.4. Nuclei and plasma membrane fractions were separated by a first mild centrifugation
(700g, 10 min); mitochondria were then spinned down at 7000g, 10 min, and washed twice
(7000g, 10 min each). All procedures were carried out at 4°C. In order to define
submitochondrial protein localization, isolated mitochondria were digested with trypsin at
different concentrations at 4°C for 1h. Where indicated, 0.1% SDS was added before trypsin.
Trypsin was then inactivated with a protease inhibitor cocktail (Sigma). Mitochondria were
quantified using a BCA Protein Assay Kit (Thermo Scientific-Pierce).
Western immunoblots, immunoprecipitations and crosslinkings
For Western immunoblots analyses, cells were lysed at 4°C in a buffer composed by 140 mM
NaCl, 20 mM Tris-HCl pH 7.4, 5 mM EDTA, 10% glycerol, 1% Triton X-100, in the
presence of phosphatase and protease inhibitors (Sigma). Lysates were then cleared with a
centrifugation at 13000g for 30 min at 4°C, and proteins were quantified using a BCA Protein
Assay Kit (Thermo Scientific-Pierce).
Protein immunoprecipitations were carried out on 3 mg of total cellular extracts. Lysates
were pre-cleared with an incubation with protein A-Sepharose (Sigma) for 1 h at 4°C and
then incubated in agitation for 18 h at 4°C with the antibody conjugated to fresh protein A-
Sepharose beads. Where indicated, an anti mouse IgG was added as a negative isotype
control. Beads were then washed several times in lysis buffer.
For the crosslinking assays, isolated mitochondria were suspended in PBS buffer and
incubated with dimethyl 3,3-dithiobis-propionimidate (DTBP, Sigma, 1 mM), a membrane-
permeable, homo-bifunctional reagent that reacts with the primary amines of two interacting
proteins at an average distance of about 8 Å (Giorgio et al., 2009), for 15 minutes at room
temperature and then spinned at 7000 rcf for 5 minutes. Pellet was then lysed as above, and
32
lysates were ultracentrifuged at 100000 rcf for 25 minutes at 4°C prior to TRAP1
immunoprecipitation.
Proteins extracted from total cell lysates or from immunoprecipitations were then boiled for 5
min in Laemmli sample buffer, separated in reducing conditions on SDS-polyacrylamide gels
and transferred onto Hybond-C Extra membranes (Amersham) following standard methods.
Primary antibodies were incubated 16 h at 4°C, and horseradish peroxidase-conjugated
secondary antibodies were added for 1 h. Proteins were visualized by enhanced
chemiluminescence (Millipore). Anti TRAP1 (sc-13557), anti SDHA (sc-166947), anti
SDHB (sc-59688) mouse monoclonal antibodies and anti actin (sc-1615) goat polyclonal
antibody were all from Santa Cruz; anti HIF1α (610959) mouse monoclonal antibody was
from Becton Dickinson; anti GAPDH (MAB374) mouse monoclonal antibody was from
Chemicon; anti Bcl-X (54H6) rabbit polyclonal antibody was from Cell Signaling; anti Cyp-
D (AP1035) mouse monoclonal antibody was from Calbiochem; the anti mouse IgG was
from Thermofisher; anti COXII (12C4F12) mouse monoclonal antibody was from
MitoSciences (Total OXPHOS Human Antibody Cocktail, MS601); anti Hsp90 (610418)
mouse monoclonal antibody was from BD Transduction Laboratories; mouse monoclonal
anti Complex II imunocapture antibody was from MitoSciences.
Blue native polyacrylamide gel electrophoresis (BN-PAGE)
BN-PAGE experiments were performed on mitochondria isolated as described. ETC
complexes and super-complexes were extracted from 200 μg of mitochondria in a buffer
composed by 1M aminocaproic acid, 50 mM Bis Tris pH 7, in the presence of 1% digitonin
at 4°C for 2 min. After extraction mitochondria were spinned at 100000 rcf for 30 min and
supernatants were collected and loaded on polyacrylamide 3-12% Bis Tris pre-cast gradient
gels (Invitrogen) after addition of sample buffer added of G250 (Invitrogen). Bands were then
visualized with a 18 h Coomassie Blue staining. Bands corresponding to ETC complex II and
IV were cut and run on a normal SDS PAGE, in order to separate single protein components
and to identify them by Western immunoblotting.
33
ETC complex II and IV activity assays
To measure the enzymatic activity of respiratory chain complex II, cells or biopsies were
homogenized with an electric potter (Sigma) in a buffer composed by 250 mM sucrose, 10
mM Tris-HCl, 0.1 mM EGTA-Tris, pH 7.4, Percoll 10%, protease and phosphatase inhibitors
and mitochondria isolated as described above. Mitochondrial enriched fractions (40 μg per
trace) were used for spectrophotometric recordings (600 nm, 30°C) of the reduction of 2-6
dichlorophenolindophenol (DCPIP). Mitochondria are preincubated for 10 min at 30°C in a
buffer composed by potassium phosphate 25 mM pH 7.2, sodium succinate 20 mM,
alamethicin 5 μM. After the pre-incubation time, sodium azide (500 μM), antimycin A (1
μM), rotenone (1 μM) and DCPIP (50 μM) were added for 1 min to the medium. Reaction
started after the addition of an intermediate electron acceptor (Coenzyme Q1, 6.5 μM; 25).
Each measurement of ETC complex II activity was normalized for citrate synthase (CS)
activity.
To measure CS activity, citrate formation is determined with a spectrophotometer as an
increase in absorbance at 420 nm, 37°C. Reaction buffer was composed by 100 mM Tris-HCl
pH 8, 100 μM DTNB, 300 μM Acetyl -CoA, 500 μM Oxaloacetate.
To measure the enzymatic activity of respiratory chain Complex IV, cells were subjected to
three cycles of freezing and thawing in liquid nitrogen. These cellular homogenates were
used for spectrophotometric recordings (550 nm, 37°C) of the oxidation of reduced
cytochrome c, nm (ε=18.5 mM−1 cm−1) in a buffer composed by potassium phosphate 100
mM pH 7, water and laurel-maltoside 10% p/v. The reaction started by the addition of
cellular homogenates and the decrease in absorbance was followed for 3 min. Reduced
cytochrome c was prepared immediately before use by adding a few grains of sodium
dithionite. Each measurement of ETC complex IV activity was normalized for protein
amount and for CS activity, as above.

34
Oxygen consumption rate (OCR) experiments
The rate of oxygen consumption was assessed in real-time with the XF24 Extracellular Flux
Analyzer (Seahorse Biosciences), which allows to measure OCR changes on adherent cells,
after up to four sequential additions of compounds. Cells (5x10⁴/well) were plated the day
before the experiment in a DMEM/10% serum medium; experiments were carried out on
confluent monolayers. Before starting measurements, cells were placed in a running DMEM
medium (supplemented with 25 mM glucose, 2mM glutamine, 1mM sodium pyruvate,
without serum and sodium bicarbonate) and pre-incubated for 30 min at 37°C in atmospheric
CO2. OCR values were then normalized for the protein content of each sample. An accurate
titration with the uncoupler FCCP was performed for each cell type, in order to utilize the
FCCP concentration (20-300 nM, depending on the cell type) that maximally increases OCR.
To exclude that OCR differences between mock and shTRAP1 cells were caused by changes
in succinate availability inside mitochondria, the cell-permeable analogue methyl-succinate
was used, and no appreciable difference was recorded.
Immunohistochemical analyses
Four thick serial sections of paraffin-embedded tumor samples were stained with
haematoxylin-eosin (H&E) and Azan-Mallory. For immunohistochemistry analysis with
TRAP1, HIF1α and MIB1/Ki67, briefly after dewaxing and hydration, sections were
incubated in EDTA buffer at pH 8.0 or in citrate buffer 5 mM at pH 6.0, respectively, in a
microwave oven for antigen retrieval. Afterward, sections were treated with ULTRA V Block
for 5 min (Thermo Scientific) and incubated for 60 min with the primary antibody (anti-
HIF1α monoclonal antibody, 1:50, was from BD Biosciences and anti- MIB-1/Ki67
GTX73546 monoclonal antibody, 1:100, was from GeneTex). Sections were subsequently
incubated with rabbit Primary Antibody Amplifier Quanto for 10 min (Thermo Scientific).
Then, after the buffer wash step, sections were treated with HRP Polymer Quanto for 10 min.
Immunoreactivity was visualized with 3-30-diaminobenzidine (DAKO).

35
Immuno-electron microscopy analyses
To perform immuno-electron microscopy experiments, cells were fixed with a mixture of 4%
paraformaldehyde and 0.05% glutaraldehyde, antibody-labeled using the gold-enhanced
protocol, embedded in Epon-812, and cut. EM images were acquired from thin sections using
a FEI Tecnai-12 electron microscope equipped with an ULTRA VIEW CCD digital camera
(FEI).
Determination of intracellular succinate level
To determine the intracellular succinate level, cells were first washed three times in PBS at
room temperature and then quickly scraped in a buffer composed by 30% acetonitrile, 50%
methanol and 20% water on ice. Lysates were collected and frozen in a cold solution with
methanol and dry ice for 5 min in order to favor the metabolic quenching needed for
metabolites extraction. The insoluble material was immediately spun down in a cooled
centrifuge at 16000 g for 15 min at 0°C and the supernatant was collected for subsequent
analysis. Metabolites were separated using a liquid chromatography (LC) system and
analyzed by mass spectrometry (MS). A ZIC-HILIC column (4.6 mm×150 mm, guard
column 4.6 mm×10 mm, Merck, Germany) was used for LC separation using formic acid,
water acetonitrile as component of the mobile phase. Results were normalized to protein
concentration, measured from parallel cell culture using BCA kit as described above.
Intracellular ATP determination
Intracellular ATP was quantified by the luciferin/luciferase method using the ATP
determination kit by Invitrogen/Molecular Probes following manufacturer’s instructions.
Cells were kept for two hours in the different experimental conditions, washed in PBS, lysed
in boiling water to avoid ATPase activity. 2.5 μg of proteins were analyzed in a 100 μl final
volume. Each experiment was performed in triplicate.

36
3. Results
3.1 Mitochondrial TRAP1 promotes neoplastic transformation
We found that TRAP1 is localized in mitochondria of cancer cell models, as expected (Altieri et al.,
2011). In fact, when we analyzed the subcellular distribution of the chaperone TRAP1 in tumor cell
models, we found it into mitochondria, both with immuno-electron microscopy inspection (Fig. 9A) or
with mitochondrial fractionation (Fig. 9B).
A
B
trypsinSDS
5
-10
-20
-20+
Bcl-X
CyP-D
TRAP1
Figure 9. TRAP1 localization. (A) Immuno-electron microscopy inspection shows most of TRAP1 along the inner mitochondrial membranes (arrows). (B) Trypsin treatment of isolated mitochondria shows that TRAP1 is partially cleaved at the highest trypsin concentration, but it displays a pattern similar to that of the matrix protein cyclophilin D (CyP-D), thus indicating that most of TRAP1 is found in the internal mitochondrial compartments Blots were probed for Bcl-X as a marker of the outer mitochondrial membrane and for CyP-D as a matrix marker.
37
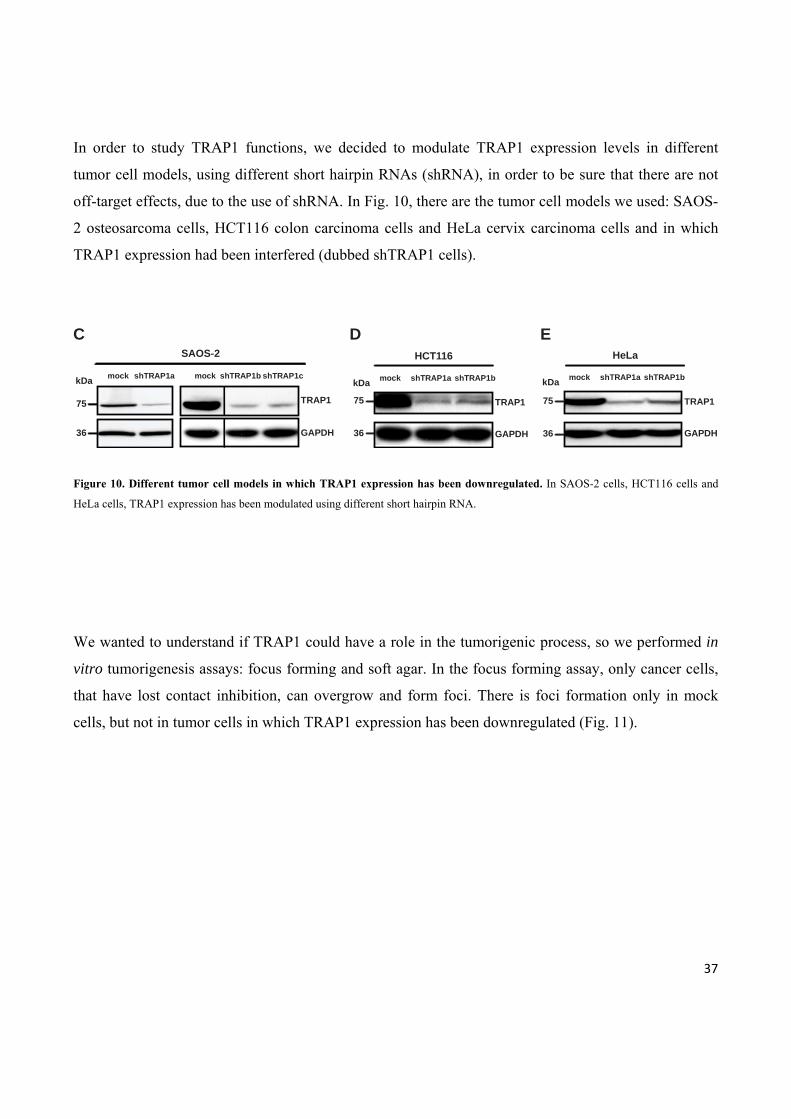
In order to study TRAP1 functions, we decided to modulate TRAP1 expression levels in different
tumor cell models, using different short hairpin RNAs (shRNA), in order to be sure that there are not
off-target effects, due to the use of shRNA. In Fig. 10, there are the tumor cell models we used: SAOS-
2 osteosarcoma cells, HCT116 colon carcinoma cells and HeLa cervix carcinoma cells and in which
TRAP1 expression had been interfered (dubbed shTRAP1 cells).
CSAOS-2
shTRAP1amockkDa shTRAP1b shTRAP1cmock
75 TRAP1
36 GAPDH
DHCT116
kDa shTRAP1a shTRAP1bmock
75 TRAP1
36 GAPDH
EHeLa
kDa shTRAP1a shTRAP1bmock
75 TRAP1
36 GAPDH
Figure 10. Different tumor cell models in which TRAP1 expression has been downregulated. In SAOS-2 cells, HCT116 cells and
HeLa cells, TRAP1 expression has been modulated using different short hairpin RNA.
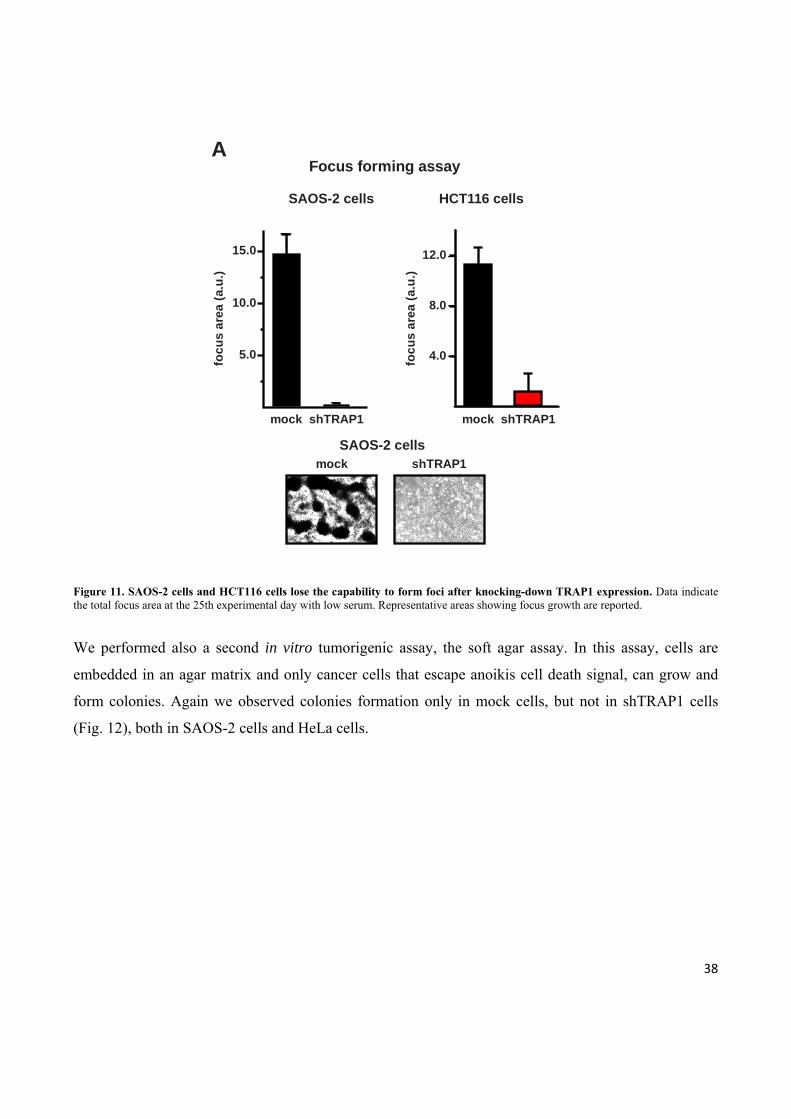
We wanted to understand if TRAP1 could have a role in the tumorigenic process, so we performed in
vitro tumorigenesis assays: focus forming and soft agar. In the focus forming assay, only cancer cells,
that have lost contact inhibition, can overgrow and form foci. There is foci formation only in mock
cells, but not in tumor cells in which TRAP1 expression has been downregulated (Fig. 11).
38
AFocus forming assay
5.0
10.0
15.0
focu
s ar
ea (a
.u.)
HCT116 cells
focu
s ar
ea (a
.u.)
4.0
8.0
12.0
mock shTRAP1mock shTRAP1
SAOS-2 cells
mock shTRAP1SAOS-2 cells
Figure 11. SAOS-2 cells and HCT116 cells lose the capability to form foci after knocking-down TRAP1 expression. Data indicate the total focus area at the 25th experimental day with low serum. Representative areas showing focus growth are reported. We performed also a second in vitro tumorigenic assay, the soft agar assay. In this assay, cells are
embedded in an agar matrix and only cancer cells that escape anoikis cell death signal, can grow and
form colonies. Again we observed colonies formation only in mock cells, but not in shTRAP1 cells
(Fig. 12), both in SAOS-2 cells and HeLa cells.

39
BSoft agar assay
colo
ny a
rea
(a.u
.)
3.0
6.0
9.0
12.0
15.0
mock shTRAP1
SAOS-2 cells
colo
ny a
rea
(a.u
.)
3.0
6.0
9.0
mock shTRAP1
HeLa cells
mock shTRAP1SAOS-2 cells
Figure 12. SAOS-2 cells lose the capability to form colonies in soft agar after knocking-down TRAP1 expression. Data indicate the total colony area at the 20th experimental day with low serum. Representative areas showing colony growth are reported. From these in vitro tumorigenesis assays, we can conclude that the down-regulation of TRAP1
expression by RNA interference abrogate any transforming potential. In fact, shTRAP cells became
unable both to form foci and to grow in soft agar (Fig. 11 and 12).
The absence of growth of foci or colonies in shTRAP cells is not due to differences in the growth rate
between mock cells and shTRAP cells, as it is possible to see in Fig. 13. TRAP1 modulation has no
effect on cell growth rate.

40
time (hours)
2.0
4.0
6.0
cell
num
ber (
106 )
0 24 48 72 96
shTRAPmock
SAOS-2 cells
Rate of cell growth
time (hours)
1.0
2.0
cell
num
ber (
106 )
0 24 48 72 96
shTRAPmock
HCT116 cells
time (hours)
1.0
2.0
3.0
cell
num
ber (
106 )
0 24 48 72 96
shTRAPmock
HeLa cells
C
Figure 13. Rate of cell growth in different tumor cell modes, with or without TRAP1 downregulation. There is no difference in the rate of cell growth in different tumor cell models (SAOS-2 cells, HCT116 cells and HeLa cells) in which TRAP1 expression has been downregulated.
From the experiments performed so far, we can conclude that TRAP1 is necessary for in vitro
tumorigenesis. We decided to understand which is the role of TRAP1 in vivo. So we decided to
perform in vivo tumorigenesis. We injected mock and shTRAP SAOS cells in nude mice (Fig. 14) and
notably, shTRAP1 tumor cells lost the ability to develop tumor masses when injected, both with or
without matrigel, that is used to mimics the extracellular matrix.
Tumor growth in nude miceSAOS-2 cells
No matrigel
mock
shTRAP1
days
mea
n tu
mor
dia
met
er (m
m)
1
4
3
4
7
8
5
6
2
7 10 14 17 21days
mock
shTRAP1
mea
n tu
mor
dia
met
er (m
m)
2
4
6
8
14
10
12
4
7 10 14 17 21
Matrigel
mock shTRAP1
D
Figure 14. Kinetics of tumor growth in nude mice after injection of SAOS-2 cells without or with a Matrigel bolus (left and right,
respectively); representative tumors grown with Matrigel are shown on the right. All along the Figure, data are reported as mean±SD
values (n≥3).

41
Conversely, when the TRAP1 cDNA was expressed in non-transformed cells, either RWPE-1
prostate epithelial cells or fibroblasts (Mouse Embryonic Fibroblasts), these acquired the capacity to
form colonies in soft agar (Fig.15).
TRAP1
colo
ny a
rea
(a.u
.)
0.4
0.8
1.2
mock
Soft agar assayRWPE-1 cells
mockTRAP1
TRAP1
GAPDH
kDa75
36
A
Soft agar assayRWPE-2 cells
colo
ny a
rea
(a.u
.)
1.0
2.0
3.0
4.0
mock shTRAP1a shTRAP1b
B
75
36
kDa shTRAP1a
shTRAP1b
mock
TRAP1
GAPDH
D
3.0
6.0
9.0
Soft agar assayMEF cells
colo
ny a
rea
(a.u
.)
ΔNTRAP1TRAP1 mock
TRAP1
ΔNTRAP1
mock
TRAP1
actin
75
42
kDa
Soft agar assaySAOS-2 cells
E
colo
ny a
rea
(a.u
.)
shTRAP1 ΔNTRAP1
3.0
6.0
9.0
12.0
15.0
mock
shTRAP1
ΔNTRAP1mock
TRAP1
GAPDH
75
36
kDa
Figure 15. Figure 2. Mitochondrial TRAP1 confers transforming potential to cells. (A) Soft agar tumorigenesis assays were performed both in non-transformed cells, i.e. human epithelial prostate RWPE-1 cells and mouse embryo fibroblasts (MEF; D), stably transfected with either a TRAP1 cDNA or with a scrambled shRNA (mock); and in transformed cells, i.e. human epithelial prostate RWPE-2 cells obtained by v-Ki-Ras expression in RWPE-1 cells (B) and human osteosarcoma SAOS-2 cells (E) stably transfected with either a scrambled shRNA (mock) or with TRAP1 shRNAs (shTRAP1). Growth of colonies in soft agar was also assessed in MEF cells (D) or in SAOS-2 shTRAP1 cells (E) stably transfected with a TRAP1 construct lacking the mitochondrial import sequence (ΔNTRAP1). All along the Figure, Western immunoblots show TRAP1 expression levels in the different cell types; GAPDH or actin are shown as loading controls. Data are reported as mean±SD values (n≥3).

42
While when we down-regulate TRAP1 expression in RWPE-2 prostate cells, which are transformed by
expression of v-Ki-Ras in RWPE-1 cells (Rasola et al., 2010a), abolished their tumorigenic features
(Fig. 15). Mitochondrial localization of TRAP1 was essential for its pro-neoplastic activity, as
expression of a TRAP1 construct devoid of its mitochondrial targeting sequence was not tumorigenic
either in cancer or in non-transformed cells (Fig. 15).
3.2 TRAP1 binds SDH and inhibits its succinate:coenzyme Q reductase (SQR) enzymatic activity
We then asked whether TRAP1 promotes transformation by acting on mitochondrial metabolism, thus
contributing to the Warburg phenotype. This could occur through an inhibitory effect on respiration.
We observed that TRAP1 interacts with ETC complex IV (Figure 16A), but without affecting its
cytochrome oxidase enzymatic activity (Figure 16C).
A
CII
CIV
kDa
720
146
242
480
mocksh
TRAP1
BN-PAGE SDS-PAGE oncut BN bands
SDHB(36 kDa)
TRAP1(75 kDa)
mocksh
TRAP1
COXII(25 kDa)
TRAP1(75 kDa)
C
Com
plex
IV a
ctiv
ity ra
tio
0.5
1.0
1.5
2.0
mock shTRAP1
SAOS-2
Figure 16. TRAP1 interacts with Complex IV of the respiratory chain complexes but it does not affects its activity. (A) TRAP1 interacts with subunit COXII of Complex IV. This interaction is seen with a blue native gel and then the bands of the BNG were cut and loaded into a second dimension. (C) TRAP1 does not influences CIV activity. Complex IV activity was measured with a spectrophotometric assay.

43
TRAP1 also associated with ETC complex II, which couples the Krebs cycle to oxidative
phosphorylation (OXPHOS) by oxidizing succinate to fumarate and then transferring electrons to
coenzyme Q; hence, the enzyme is called either succinate dehydrogenase (SDH) or
succinate:coenzyme Q reductase (SQR; Cecchini, 2003; Lemarie and Grimm, 2011). We found that
TRAP1 interacts with SDH (Fig. 17), using different approaches. We performed a Blue Native Gel
(Fig. 15 A) and we cut the bands corresponding to Complex II and we loaded them into a normal
A
CII
CIV
kDa
720
146
242
480
mocksh
TRAP1
BN-PAGE SDS-PAGE oncut BN bands
SDHB(36 kDa)
TRAP1(75 kDa)
mocksh
TRAP1
COXII(25 kDa)
TRAP1(75 kDa)
SDS-PAGE onwhole BN-PAGE
mocksh
TRAP1
mocksh
TRAP1
mocksh
TRAP1
mocksh
TRAP1
COXII TRAP1
TRAP1SDHA
B

44
C
IP TRAP1Neg.CtrkDa
input
SDHA70
TRAP175
IP CIINeg.CtrkDa
input
SDHA70
TRAP175
Immunoprecipitations
D
IP TRAP1
75
250
150
250
150
70
TRAP1DTBP DTBP
SDHA
kDa kDa
Immunoprecipitationafter cross-linking
Figure 17. TRAP1 binds ETC complex II. (A) Blue native gel electrophoresis. Bands corresponding to complex II were cut, run on a SDS PAGE and probed with an anti TRAP1 and with an anti SDHB antibody. (B) SDS PAGE on whole Blue Native Gel was performed and TRAP1 interactions with Complex II and Complex IV were confirmed. (C) Crosslinking experiments on mitochondria from mock SAOS-2 cells. TRAP1 was immunoprecipitated after mitochondrial treatment with the crosslinker DTBP, loaded in parallel on separate lanes of a SDS-PAGE and probed with either an anti TRAP1 or with an anti SDHA antibody. (D) Complex II and TRAP1 immunoprecipitations (IP) on lysates of SAOS-2 mock cells. The interaction between TRAP1 and SDHA is shown by co-IP. IgG are used in negative isotype controls.
sodium dodecyl sulphate poliacrilamide gel (SDS-PAGE) and we found that TRAP1 interacts also with
subunit B of Succinate dehydrogenase. To confirm that TRAP1 interacts only with Complex II and
Complex IV of the respiratory chain complexes, we performed a SDS-PAGE on the whole Blue Native
Gel and again we confirm that TRAP1 interacts only with Complex II and Complex IV of the
respiratory chain complexes. There is also a possibility that TRAP1 interacts with Complex I, but it’s
not so clear from the experiments performed so far.
So we found an interaction between TRAP1 and Complex II and we decided to investigate if this
interaction has also a functional meaning, so we measured Complex II activity (SQR activity). We
found that the SQR enzymatic activity was increased in mitochondria from shTRAP1 cells relative to
those derived from control cells (Fig. 18). Complex II activity was measured with a spectrophotometric

45
assay, using isolated mitochondria. shTRAP cells have a complex II activity that is double compare to
mocks cells.
A
Abs
(600
nm
, a.u
.)
0.25
0.5
0.75
1.0
1.25
Complex II SQR activity
time (min)
CoQ1
2 4 6 8 10
shTRAP1
mock
SAOS-2mitochondria
A
Com
plex
II a
ctiv
ity ra
tio
2.5
0.5
1.0
1.5
2.0
17AAG1 μM
17AAG1 μM
**
SQR activity
shTRAP1mockSAOS-2 mitochondria
Figure 18. Analysis of the succinate:coenzyme Q reductase (SQR) enzymatic activity of complex II in mitochondria from SAOS-2 cells. Analysis is performed on mitochondria from cultured cells; Mock indicates SAOS-2 cells stably transfected with a scrambled shRNA; shTRAP1 indicates SAOS-2 cells stably transfected with a TRAP1 shRNA. Enzyme activity values are compared to those of SAOS-2 mock cells in culture. On the right there is a representative experiment and on the left there is mean of nine different experiments.
17-allylamino-17-demethoxygeldanamycin (17-AAG), an inhibitor of TRAP1/Hsp90 ATPase activity
(Felts et al., 2000) whose availability to mitochondria was recently shown in situ (Xie et al., 2011),
specifically increased SQR activity in control mitochondria, whereas shTRAP1 mitochondria were
insensitive to the drug (Fig. 18). The effect of 17-AAG was unrelated to Hsp90, as Hsp90 protein levels
were the same in mock and shTRAP1 cells (Fig 19).

46
FSAOS-2
shTRAP1
mockkDa
90 Hsp90
75 TRAP1
26 Bcl-X
Figure 19. Blot for Hsp90 levels. A western blot for the level of Hsp90 was performed in SAOS-2 cells. The levels of Hsp90 are the same for mock and shTRAP cells, so the effects of 17AAG is due to its action on TRAP1.
The difference in Complex II activity between shTRAP cells and mock cells is real and it is not due to
other factors. In fact there is no change in complex II protein levels (Fig. 20D) or in mitochondrial
mass (Fig. 20E). The mitochondrial mass was measured with NAO staining, that binds to cardiolipin.
In this way it is possible to have a measure of the mitochondrial mass in the cells. SAOS-2 cells have
the same mitochondrial mass and also the same amount of Complex II.
DSAOS-2
shTRAP1
mocksh
TRAP1
mock
FF assay
SDHB
GAPDH
kDa
32
36
E
NA
O s
tain
ing
(a.u
.)
8000
16000
24000
32000
mock shTRAP1
SAOS-2
Figure 20. No change in Complex II levels or mitochondrial mass. (D) Western immunoblot showing that no changes in SDHB protein expression occur during the focus forming assay (FF samples were obtained a the 15th experimental day). GAPDH is used as a loading control. (E) N-acrydine orange (NAO) cytofluorimetric analyses indicate that no change in mitochondrial mass occur between SAOS-2 mock and shTRAP1 cells. All along the Figure, bar graphs report mean±SD values (n≥3). Asterisks indicate a significant difference (p<0.01 with a Student's t test analysis). Cells are dubbed as in previous figures.
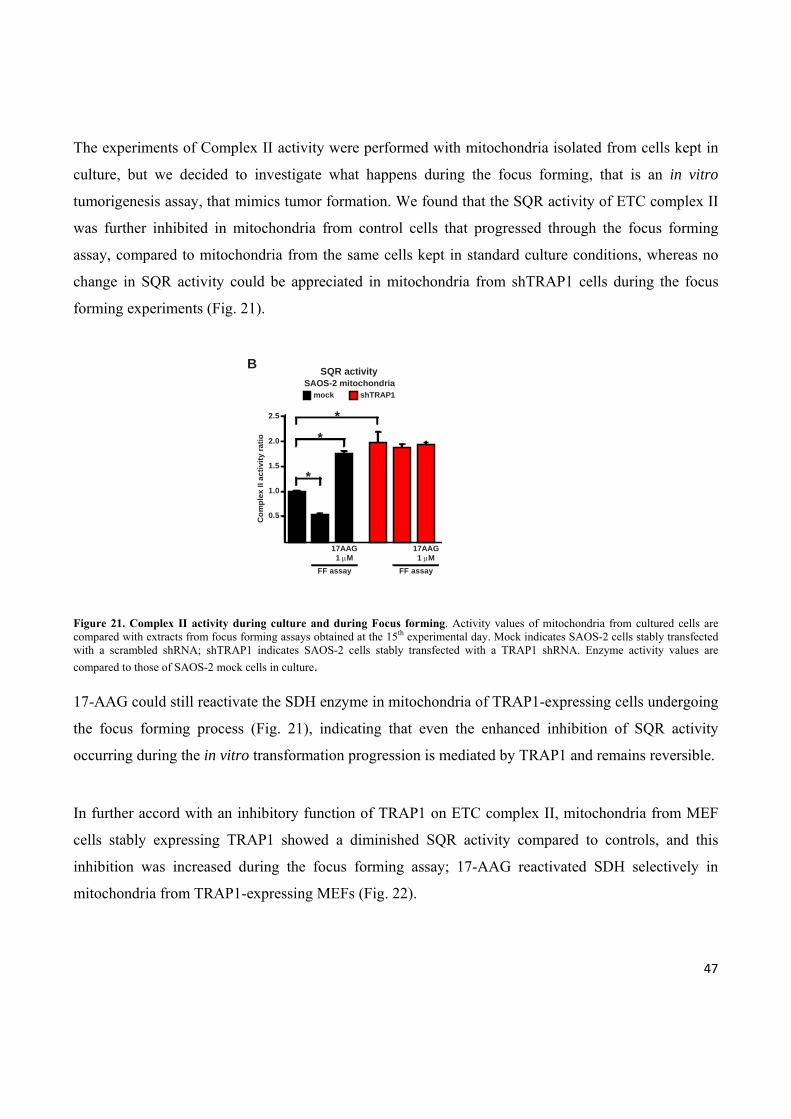
47
The experiments of Complex II activity were performed with mitochondria isolated from cells kept in
culture, but we decided to investigate what happens during the focus forming, that is an in vitro
tumorigenesis assay, that mimics tumor formation. We found that the SQR activity of ETC complex II
was further inhibited in mitochondria from control cells that progressed through the focus forming
assay, compared to mitochondria from the same cells kept in standard culture conditions, whereas no
change in SQR activity could be appreciated in mitochondria from shTRAP1 cells during the focus
forming experiments (Fig. 21).
Com
plex
II a
ctiv
ity ra
tio
FF assay FF assay
2.5
0.5
1.0
1.5
2.0
17AAG1 μM
17AAG1 μM
*
**
SQR activity
shTRAP1mockSAOS-2 mitochondria
B
Figure 21. Complex II activity during culture and during Focus forming. Activity values of mitochondria from cultured cells are compared with extracts from focus forming assays obtained at the 15th experimental day. Mock indicates SAOS-2 cells stably transfected with a scrambled shRNA; shTRAP1 indicates SAOS-2 cells stably transfected with a TRAP1 shRNA. Enzyme activity values are compared to those of SAOS-2 mock cells in culture. 17-AAG could still reactivate the SDH enzyme in mitochondria of TRAP1-expressing cells undergoing
the focus forming process (Fig. 21), indicating that even the enhanced inhibition of SQR activity
occurring during the in vitro transformation progression is mediated by TRAP1 and remains reversible.
In further accord with an inhibitory function of TRAP1 on ETC complex II, mitochondria from MEF
cells stably expressing TRAP1 showed a diminished SQR activity compared to controls, and this
inhibition was increased during the focus forming assay; 17-AAG reactivated SDH selectively in
mitochondria from TRAP1-expressing MEFs (Fig. 22).

48
C
FFassay
FFassay
SQR activityMEF mitochondria
mockTRAP1
Com
plex
II a
ctiv
ity ra
tio
2.5
0.5
1.0
1.5
2.0 **
*
*
17AAG1 μM
17AAG1 μM
Figure 22. SQR activity is measured on mitochondria from mouse embryo fibroblasts (MEF) kept in culture or undergoing a focus forming assay (15th day). TRAP1 indicates cells stably transfected with the TRAP1-containing vector; cells stably transfected with a control vector are dubbed mock. Enzyme activity values are compared to those of mitochondria from TRAP1-expressing MEFs in culture. All along the Figure, the TRAP1 inhibitor 17-allylamino-17-demethoxygeldanamycin (17-AAG) was added 5 min before starting recordings. Bar graphs report mean±SD values (n≥3); asterisks indicate significant differences (p<0.01 with a Student's t test analysis).
3.3 TRAP1 induction inhibits complex II enzymatic activity in human colorectal cancers
TRAP1 expression was shown to be increased in a variety of tumor types (Kang et al., 2007 and
http://www.proteinatlas.org/). We compared the SQR activity of ETC complex II between colorectal
cancers and the surrounding non-transformed mucosae obtained from a set of human patients. In all
colorectal cancer samples at stage IV, characterized by metastases to lymph nodes and to distant sites,
and in the majority of samples of stage I-III, characterized by absence of distant metastases, TRAP1
was upregulated relative to normal mucosa, and this up-regulation was paralleled by a decrease in SQR
activity, which could be partially rescued by 17-AAG (Fig. 23E). In a small subset of stage I-III
colorectal cancers TRAP1 expression was not induced relative to surrounding non-tumor tissues. In
these samples we could not detect any difference in SQR activity between samples from tumor and
normal mucosa (Fig. 23F), strengthening the link between TRAP1 and the regulation of complex II
activity.

49
E
tumor mucosa
Com
plex
II a
ctiv
ity ra
tio
1
2
3
4
5
17AAG1 μM
17AAG1 μM
CRC patient 10C
tumor
mucosa
TRAP1
GAPDH
Com
plex
II a
ctiv
ity ra
tio
1
2
3
4
5
tumor mucosa
17AAG1 μM
17AAG1 μM
CRC patient 21C
tumor
mucosa
TRAP1
GAPDH
4.3 7.61.0 1.0
FCRC patient 41C
tumor
mucosa
TRAP1
GAPDH
tumor mucosa
Com
plex
II a
ctiv
ity ra
tio
1
2
3
4
5
17AAG1 μM
17AAG1 μM
Com
plex
II a
ctiv
ity ra
tio
1
2
3
4
5
tumor mucosa
17AAG1 μM
17AAG1 μM
CRC patient 33C
tumor
mucosa
TRAP1
GAPDH
1.5 1.81.0 1.0
Figure 23. Complex II enzymatic activity in human colorectal cancer samples. Representative analyses of SQR activity on human colorectal cancer (CRC) samples are carried out as in Figure 3E-F and compared to surrounding non-cancerous mucosae. As shown in the insets, samples reported in (E), which were obtained from metastatic CRC tumors, display an increase of TRAP1 expression in tumors with respect to mucosae; samples reported in (F), which were obtained from non-metastatic CRC tumors, do not show any increase of TRAP1 expression. GAPDH is shown as a loading control.
3.4 TRAP1 inhibits cell oxygen consumption rate and ATP production by OXPHOS
The SQR assays described so far measure the maximal enzymatic activity of complex II, as the
complex is made accessible in permeabilized mitochondria and exposed to an excess of substrates. We
next analyzed whether TRAP1 also affects the oxygen consumption rate (OCR) of living cells, in order
to have a more physiological situation. We measured the oxygen consumption rate using the

50
Extracellular Flux Analyzer (Seahorse Bioscience), that allows to measure the oxygen consumption on
adherent cells. Down-regulation of TRAP1 markedly increased mitochondrial-dependent respiration in
SAOS-2 cells (Fig. 24).
Oligomycin1 μM
FCCP20 nM
Rotenone1 μM
Antimycin1 μM
mock
OC
R (p
mol
es/m
in/μ
g)
time (min)
shTRAP1
100
200
300
400
500
100806040200
600
700
800SAOS-2 cells
Figure 24. Oxygen consumption rate are decreased by TRAP1 expression. Representative traces of oxygen consumption rate (OCR) experiments performed on monolayers of living SAOS-2 cells. Subsequent additions of the ATP synthase inhibitor oligomycin, of the uncoupler FCCP, of the ETC complex I inhibitor rotenone and of the ETC complex III inhibitor antimycin A were carried out.
In shTRAP1 cells the extra OCR was used to make ATP, as it was inhibited by the ATP synthase
blocker oligomycin; moreover, addition of the uncoupler FCCP increased respiration well above the
basal level, indicating an increased respiratory capacity that remained fully sensitive to ETC inhibition
by rotenone (Fig. 24). The comparison with control cells is striking, because unlike shTRAP1 cells they
already utilize their maximal respiratory capacity under basal conditions, as shown by the lack of OCR
increase with FCCP (Fig. 24), an arrangement implying that any additional ATP requirement must be
provided by glycolysis.

51
The down-modulation of cell respiration by TRAP1 is a general phenomenon, because in all cancer cell
models we tested, we obtained the same results (Fig. 25). We used as cell models: HeLa cells, MEF
cells and RWPE-2 cells.
A
OC
R (p
mol
es/m
in/μ
g)
time (min)
HeLa cells
shTRAP1b
mock
shTRAP1c
100
200
300
400
500
100806040200
600
700
800
Oligomycin1 μM
FCCP250 nM
Rotenone1 μM
Antimycin1 μM
900
B
OC
R (p
mol
es/m
in/μ
g)
time (min)
Oligomycin1 μM
FCCP300 nM
Rotenone1 μM
Antimycin1 μM
RWPE-2 cells
shTRAP1b
mock
shTRAP1c
50
100
150
200
250
100806040200
300
350
400
450
COligomycin
1 μMFCCP
300 nMRotenone
1 μMAntimycin
1 μM
time (min)
OC
R (p
mol
es/m
in/μ
g)
100806040200
50
100
150
200
250
MEF cellsmock
TRAP1
Figure 25. Oxygen consumption rate are decreased by TRAP1 expression in different tumor cell models. Representative traces of oxygen consumption rate (OCR) experiments performed on monolayers of living HeLa cells (A), or RWPE-2 cells (B), or MEFs (C). Subsequent additions of the ATP synthase inhibitor oligomycin, of the uncoupler FCCP, of the ETC complex I inhibitor rotenone and of the ETC complex III inhibitor antimycin A were carried out.

52
Moreover, expression of the TRAP1 cDNA in non-transformed fibroblasts markedly inhibited basal
OCR, and abolished any respiratory reserve (Fig. 25C), mimicking the respiratory pattern of TRAP1-
expressing tumor cells.
In full accord with the effect of the drug on SQR activity (see Fig. 21), the TRAP1 inhibitor 17-AAG
increased OCR only in TRAP1-expressing cells (Fig. 26).
OC
R ra
tio
0.5
1.0
2.0
1.5
17AAG1 μM, 30’
17AAG1 μM, 30’
**
shTRAP1
mock
SAOS-2 cells
Oxygen consumption rate
Figure 26. 17AAG is able to abolish the inhibitory effect of TRAP1 in basal respiration. The TRAP1 inhibitor 17-allylamino-17-demethoxygeldanamycin (17-AAG) was added 30 min before starting experiments. Bar graphs report mean±SD values (n≥3); asterisks indicate significant differences (p<0.01 with a Student's t test analysis).
Consistently we found that OXPHOS marginally contributes to ATP synthesis in mock cells, whereas a
high proportion of the intracellular ATP content is provided by glycolysis, with a marked increase of
glycolytic ATP during the in vitro tumorigenic process; instead, in shTRAP1 cells most of the ATP
comes from OXPHOS (Fig. 27).

53
B
5TG5 mM
ATP
(nm
oles
/μg
prot
ein)
FF assay (15th day)
600
800
200
400
OLIGO1 μM
OLIGO1 μM
5TG5 mM
SAOS-2 mock cells
FF assay (15th day)
ATP
(nm
oles
/μg
prot
ein) 600
200
400
OLIGO1 μM
OLIGO1 μM
5TG5 mM
5TG5 mM
SAOS-2 shTRAP1 cells
Figure 27. ATP levels were measured in mock (left) or in shTRAP1 (right) SAOS-2 cells. Cells are kept in standard culture conditions (bars on the left) or in a focus forming assay for 15 days (bars on the right). Where indicated, cells were treated for 2 hours with the ATP synthase inhibitor oligomycin or with the hexokinase inhibitor 5-thio-glucose (5TG) in a no glucose medium to discriminate between ATP produced by OXPHOS and by glycolysis. Bar graphs report mean±SD values (n≥3).
3.5 SDH inhibitors selectively affect respiration, survival and soft agar growth in shTRAP1 cells
A low concentration of the ETC complex II inhibitors 3-nitro-propionic acid (3-NP), which inactivates
SDH after covalent binding with an Arg residue in the catalytic core of SDHA (Huang et al., 2006), or
thenoyltrifluoroacetone (TTFA), which blocks electron transfer from succinate to coenzyme Q at the
quinone-binding site in subunits B and D (Huang et al., 2006), inhibited OCR in shTRAP1 cells but
were inactive in the presence of TRAP1 (Fig. 28), paralleling the down-modulation of the SQR activity
induced by 3-NP only in TRAP1-expressing mitochondria (Fig. 28).

54
0
mockSAOS-2 cells
time (min)
OC
R (p
mol
es/m
in/μ
g)
Oligomycin1 μM
FCCP20 nM
Rotenone1 μM
Antimycin1 μM
shTRAP1
mock+3NP 1 mM
shTRAP1+3NP 1 mM
10080604020
100
200
300
400
500
600
700
800
900
C
OC
R (p
mol
es/m
in/μ
g)
time (min)
100
200
300
400
500
100806040200
600
700
800
Oligomycin1 μM
FCCP20 nM
Rotenone1 μM
Antimycin1 μM
900
SAOS-2 cells
shTRAP1
mock
mock+TTFA 1 mM
shTRAP1+TTFA 1 mM
Com
plex
II a
ctiv
ity ra
tio
2.5
0.5
1.0
1.5
2.0
1 mM 10 mM 1 mM 10 mM
**
SQR activity
shTRAP1mockSAOS-2 mitochondria
3NP 3NP
Figure 28. TRAP1-induced down-modulation of SDH activity decreases cell oxygen consumption rate Representative traces of oxygen consumption rate (OCR) experiments performed on monolayers of living SAOS-2 cells. Subsequent additions of the ATP synthase inhibitor oligomycin, of the uncoupler FCCP, of the ETC complex I inhibitor rotenone and of the ETC complex III inhibitor antimycin A were carried out. The SDH inhibitors 3-nitro propionic acid (3-NP; left) and thenoyltrifluoroacetone (TTFA; right) were added to cell monolayers 15 min before starting the experiments. (Bottom) Analysis of the effect of 3-NP on the succinate:coenzyme Q reductase (SQR) enzymatic activity of complex II in mitochondria from SAOS-2 cells. 3-NP was added 5 min before starting recordings; 3-NP 10 mM was used to fully inhibit the SDH enzyme.
These data indicate that TRAP1 limits maximal respiration by acting at ETC complex II. We also
found that 3-NP inhibits in a dose-dependent fashion death in shTRAP1, but not in mock SAOS-2 cells
placed in conditions of long-term starvation that mimic the paucity of nutrients found in the inner
tumor mass during the phases of its rapid accrual (Fig. 29). Moreover, treatment with 3-NP partially

55
restored the ability of shTRAP1 cells to form colonies in soft agar, whereas it was ineffective on the
colonies formed by control cells (Fig. 29).
3NP
Viab
le c
ells
(%)
100 μM 200 μM 500 μM
100
20
40
60
80
Serum depletion, 96hSAOS-2 cells
shTRAP1mock
* *
co
lony
are
a (fo
ld in
crea
se)
3-NP100 μM
1
3
2
colo
ny a
rea
(fold
incr
ease
)
3-NP100 μM
1
3
2
*
Soft agar assaySAOS-2 cells
shTRAP1mock
Figure 29. TRAP1-induced down-modulation of SDH activity prompts resistance to stress stimuli. (Left) Cytofluorimetric cell death analysis of SAOS-2 cells starved in a medium without serum for 96 h with or without the reported concentrations of 3-NP. Viable cells are identified as double negative for propidium iodide and Annexin V–FITC. (Right) Soft agar assay on SAOS-2 cells. Data are reported as fold increase of colony area of mock cells grown with 3-NP compared with mock cells kept without the drug (left) and, separately, as fold increase of colony area of shTRAP1 cells grown with 3-NP compared with shTRAP1 cells kept without the drug (right). All along the Figure, in SAOS-2 experiments mock indicates cells stably transfected with a scrambled shRNA; shTRAP1 indicates cells stably transfected with a TRAP1 shRNA. All bar graphs report mean±SD values (n≥3). Asterisks indicate a significant difference (p<0.01 with a Student's t test analysis).
The use of 3 nitropropionic acid allows us to mimics the inhibitory effect of TRAP1 on Complex II, so
we can conclude that TRAP1 and 3 nitropropionic acid share the same binding site on Complex II
(presumably subunit A). Moreover, reproducing the inhibitory effect of TRAP1 on Complex II activity,
we can partially restored the ability of shTRAP1 cells to form colonies in soft agar, suggesting that the
inhibition of Complex II is important for tumorigenesis.
3.6 TRAP1 induces succinate accumulation and HIF1α stabilization
It was shown that succinate accumulation induces HIF1 by inhibiting PHDs, the enzymes that
hydroxylate HIF1α allowing its subsequent ubiquitin-dependent degradation (Selak et al., 2005). We
observed that during the focus forming assay, the in vitro tumorigenesis assay that mimics tumor

56
formation, the intracellular level of succinate increased only in TRAP1-expressing cells (Fig. 30),
matching the down-modulation of their SDH enzymatic activity (Fig. 21).
ASuccinate
shTRAP1mockSAOS-2 cells*
Rat
io o
f suc
cina
te le
vel
FF assay
0.5
1.0
1.5
2.0 *
Figure 30. TRAP1 induces succinate accumulation. Bar graphs showing LC-MS measurements of intracellular succinate level. Values are compared with cultured mock SAOS-2 cells.
We decided to investigate if succinate accumulation corresponds to HIF stabilization. In keeping with
the succinate results, during the focus forming process HIF1α was detectable exclusively in TRAP1-
expressing cells (Fig. 31) and not in other conditions.
B
125 HIF1α
42 Actin
kDa mock mock+
CoCl 2sh
TRAP1
mocksh
TRAP1FF assay
SAOS-2 cells
Figure 31. TRAP1 induces stabilization of HIF1α. Western immunoblot showing HIF1α expression in cultured cells and on extracts from focus forming assays obtained a the 15th experimental day. CoCl2 is used as a positive control for HIF1α stabilization. Blots were probed with an anti-actin antibody to check for protein load.
We confirmed that HIF1α is not degraded in mock cells during focus forming experiment. In fact,
HIF1α is hydroxilated (at the level of Pro402 and Pro564) in shTRAP cells, both in basal condition or

57
during the focus forming. In mock cells, HIF1α is hydroxilated only in basal condition and not during
focus forming (Fig. 32). HIF1α hydroxilation by PHD2 is followed by proteasomal degradation.
C
125 HIF1αPro402
36 GAPDH
kDa mock mock+
CoCl 2sh
TRAP1
mocksh
TRAP1FF assay
SAOS-2 cells
125 HIF1αPro564
36 GAPDH
Figure 32. Hydroxilation of HIF1α in SAOS-2 cells in basal condition and in focus forming. Western immunoblot showing HIF1α hydroxylation in cultured cells and on extracts from focus forming assays obtained a the 15th experimental day. CoCl2 is used as a positive control. Blots were probed with an anti-GAPDH antibody to check for protein load.
We exclude the involvement of HIF2α in our model, in fact we do not see his stabilization during the
focus forming experiment (Fig 33).
D
125 HIF2α
36 GAPDH
kDa mock mock+
CoCl 2sh
TRAP1
mocksh
TRAP1FF assay
SAOS-2 cells
Figure 33. TRAP1 does not induce stabilization of HIF2α. Western immunoblot showing HIF2α expression in cultured cells and on extracts from focus forming assays obtained a the 15th experimental day. CoCl2 is used as a positive control for HIF2α stabilization. Blots were probed with an anti-actin antibody to check for protein load.

58
HIF1a can be stabilized or by the increase in succinate levels (Selak et al., 2005) or by hypoxia (Ishii et
al, 2005). To verify what happens during focus forming in mock cells, we used pimonidazole
(Hypoxyprobe-1). Pimonidazole hydrochloride is reductively activated in hypoxic cells and forms
stable adducts with thiol (sulphydryl) groups in proteins, peptides and amino acids. MAb1 antibody
binds to these adducts allowing their detection by immunochemical means. We performed again a
focus forming with preincubation of pimonidazole and then performed a western blot (Fig. 34). We
found that there is not hypoxia during focus forming assay, so HIF1α is effectively stabilized by the
increase in succinate levels.
kDa 15th day
hypoxic
cham
ber
10th day
FF assay
SAOS-2 mock cells
250150100
37
75
50
125
75
36
TRAP1
HIF1α
GAPDH
Pimonidazole-protein adducts
Figure 34. Pimonidazole-protein adducts. Pimonidazole (200μM) was added during the focus forming for 2 hours and then the cells were lysated. Cells kept for 24 hours in hypoxic chamber and treated in the same way with pimonidazole are used as positive control.

59
Consistently, in tumor samples obtained from nude mice xenografted with TRAP1-expressing SAOS-2
cells (see Fig. 14), which were characterized by densely packed cells amidst which fibrotic and necrotic
areas could be observed (marked as F and N, respectively, in the panels of Fig. 35), HIF1α was clearly
detected in the majority of cells, the signal being particularly strong in the nuclei of cells where
proliferation markers were also evident (compare the MIB/Ki67 and the HIF1α staining in Fig. 35). In
these samples, cells displayed a punctuate TRAP1 signal that well fits with its mitochondrial
localization (see the high magnification TRAP1 staining in Fig. 35).
F
F
SAOS-2 tumors
Azan/Mallory, 25x
F
N
TRAP1, 100x
HIF1α, 100x
Hematoxylin/Eosin, 25x
N
TRAP1, 6.25x
HIF1α, 6.25x
F
MIB-1/Ki67, 25x
N
F
TRAP1, 25x
N
F
HIF1α, 25x
N
F
Figure 35. Immunohistochemical inspections of tumors formed by SAOS-2 control cells after injection in nude mice (see Figure 14). Hematoxylin/eosin and Azan/Mallory staining reveal tumors rich of densely packed cells, with few fibrotic areas (F) and a large number of necrotic regions (N). TRAP1 is visible in most cells (see the 6.25x magnification) as a punctuate signal (100x magnification), which is compatible with its mitochondrial localization. HIF1α expression is evident all along the samples (see the 6.25x magnification), mainly in the nuclear compartment of cells (100x magnification), and the signal is particularly strong in the perinecrotic areas, where also the proliferation marker MIB-1/Ki67 is found (25x magnifications).

60
3.7 TRAP1 induces succinate accumulation and HIF1α stabilization, which is required for tumor
cell growth
We found that dimethyl succinate induce the stabilization of HIF1α, without any differences between
shTRAP cells and mock cells, both in basal or during focus forming (Fig. 2A). Moreover, the addition
of dimethyl succinate induce colonies formation in soft agar assay only in shTRAP cells and not in
other condition. So the increase in cytosolic succinate in our model is responsible for colonies
formation (Fig.2B).
SAOS-2 cellsFocus forming assay
B
shTRAP1
focu
s ar
ea (a
.u.)
5.0
10.0
15.0
20.0
mock
DMS DMS
125 HIF1α
36 GAPDH
kDa mockmock
shTRAP1
mocksh
TRAP1
FF assaydimethyl succinate
SAOS-2 cells
CoCl2A
Figure 36. Dimethylsuccinate induces HIF1α stabilization and growth of colonies in soft agar assay. In (A) dimethyl succinate 20mM was added for 48 h and then cells were lisated for western blot analysis. Clorure Cobalte is used as positive control. In (B) dimethyl succinate 5mM was added all along the soft agar assay.
HIF1α inhibition with a cell-permeable esterified form of α-ketoglutarate (1-trifluoromethyl benzyl-α-
ketoglutarate, TaKG), which reverses HIF1α stabilization by restoring PHDs enzymatic activity
(MacKenzie et al., 2007; Tennant et al., 2009) fully abolished formation of foci in TRAP1-expressing
tumor cells (left) and in MEFs transfected with a TRAP1 cDNA (right). In fact this compound compete
with succinate for the binding site on PHDs, so these enzymes are activated and they induce HIF1α
degradation (Fig. 37).

61
shTRAP1
focu
s ar
ea (a
.u.)
5.0
10.0
15.0
20.0
focu
s ar
ea (a
.u.)
5.0
10.0
15.0
20.0
mock mock
TaKG TaKG
TRAP1
TaKG TaKG
SAOS-2 cellsFocus forming assay
MEF cellsFocus forming assay
Figure 37. Focus forming assay on SAOS-2 cells or MEFs grown with or without 1-trifluoromethyl benzyl-α-ketoglutarate (TaKG). This compound was added during all along the experiment of focus forming. All along the Figure, bar graphs report mean±SD values (n≥3). Asterisks indicate a significant difference (p<0.01 with a Student's t test analysis). Cells are dubbed as in previous figures.
We tried to establish the importance of HIF1α stabilization not only with a chemical approach, but also
with short hairpin RNAs. We performed interference on HIF1α (Fig. 38, left) or on HIF1β (Fig. 38,
right), using different short hairpin RNAs. In both cases, we fully abolished formation of foci in
TRAP1-expressing tumor cells.
ESAOS-2 cells
Focus forming assay
kDa
36
125 HIF1α
GAPDH
mock 1 2
shHIF1α
CoCl2
focu
s ar
ea (a
.u.)
5.0
10.0
15.0
20.0
mock 1 2
shHIF1α
SAOS-2 cellsFocus forming assay
kDa
36
125 HIF1β
GAPDH
mock shHIF1β
focu
s ar
ea (a
.u.)
5.0
10.0
15.0
20.0
mock shHIF1β
Figure 38. Focus forming assay on SAOS-2 cells where HIF1α (left) and HIF1β (right) expression had been knocked-down by RNA interference. In the inset the maximal HIF1α expression is reported after CoCl2 treatment. All along the Figure, bar graphs report mean±SD values (n≥3). These last experiments show the importance of HIF1a for our cell models. In fact when HIF is not
stabilized, we do not observe in vitro tumorigenesis.

62
4. Discussion
Tumor cells tend to increase their glycolytic activity without a matching increase of oxidative
phosphorylation (Warburg, 1927; Warburg, 1956). Inhibition of the tumor suppressor p53 or
activation of the transcription factor HIF1 curtail OXPHOS by inducing the autophagic
degradation of respiratory complexes and by abrogating the synthesis of some of their
subunits (such as SDHB) or assembly factors (Denko, 2008; Semenza, 2010; Vousden,
2009). Conversely, OXPHOS inhibition can play a causal role in tumorigenesis. Inactivating
mutations in mtDNA genes encoding for subunits of ETC complex I and III were found
associated with renal oncocytomas (Gasparre, 2008), as well as thyroid and prostate cancers
(Abu-Amero, 2005; Petros, 2005). However, these mutations are confined to a small set of
neoplasms, and the lack of clear-cut molecular mechanisms hampers the definition of
whether OXPHOS inhibition as such can play a general tumorigenic role. Key findings of the
present work are the demonstration that the mitochondrial chaperone TRAP1, which is
widely expressed in tumors, but not in highly proliferating, non-transformed cells
(http://www.proteinatlas.org/), is a component of the molecular machinery that decreases
mitochondrial respiration; and that this event is crucial for neoplastic progression. Indeed, we
find that TRAP1 behaves as an oncogene, since (i) without TRAP1 tumorigenesis is blunted
both in vitro and in vivo; and (ii) TRAP1 expression confers tumorigenic potential to non-
transformed cells. We observe that TRAP1-mediated inhibition of SDH limits the maximal
rate of respiration and leads to succinate accumulation, followed by HIF1α stabilization.
HIF1 induction elicits a pseudohypoxic response which can boost neoplasm evolution
promoting angiogenesis, epithelial/mesenchymal transition and the glycolytic switch
(Brahimi-Horn, 2011; Semenza, 2010) accordingly, we observe that promoting HIF1α
degradation abolishes the neoplastic potential of TRAP1-expressing cells. In our model,
HIF1α stabilization emerges after several days of in vitro transformation, when SDH is more
strongly inhibited by TRAP1. This suggests that a threshold SDH inhibition must be reached
to allow for succinate accumulation, which is not at all surprising given the multiple
pathways through which excess succinate can be utilized including increased heme synthesis
(Frezza, 2011). Despite a partial respiratory inhibition, TRAP1-expressing cells fully utilize
their residual respiratory capacity to produce ATP, as shown by OCR experiments, but

63
reorient their metabolism towards glycolysis to meet any energy demand that exceeds
respiratory capacity, in complete accord with Warburg’s observations.
TRAP1 is likely to begin a feed-forward loop, as it inhibits SDH and respiration (hence
OXPHOS) and induces HIF1, which in turn further inhibits OXPHOS (Denko, 2008;
Semenza, 2010) and directly down-regulates SDH by induction of miR-210 (Puissegur,
2011). The complete block of the SDH enzyme caused by loss-of-function mutations would
be an extreme case only seen in specific subsets of tumors (Bardella, 2011); whereas the
partial and reversible SDH inhibition caused by TRAP1 and its increased expression levels ,
would mediate a general pro-neoplastic function of TRAP1, which fits its identification as a
bona fide hypoxia- and c-Myc-inducible gene (Coller, 2000; Ruiz-Romero, 2010).
Tumor cells could be endowed with a multi-chaperone mitochondrial complex, as TRAP1
interacts with cyclophilin D, Hsp90 and Hsp60 (Ghosh, 2010; Kang, 2009). Notably, TRAP1
is involved in the inhibition of the mitochondrial permeability transition pore (Kang, 2007),
whose opening irreversibly commits cells to death (Rasola, 2007; Rasola, 2010), and we have
observed that keeping the pore locked can be used by tumor cells to evade apoptosis (Rasola,
2010). Thus, TRAP1 could take part in several mitochondrial changes that crucially
contribute to the neoplastic phenotype. Targeting its chaperone activity and molecular
interactors could dismantle the metabolic and survival adaptations of neoplastic cells, paving
the way to the development of highly selective mitochondriotropic anti-neoplastic drugs.

64
5. References
Acín-Pérez R, Fernández-Silva P, Peleato ML, Pérez-Martos A, Enriquez JA. Respiratory
active mitochondrial supercomplexes. Mol Cell. 2008. 32(4):529-39
Adorno M, Cordenonsi M, Montagner M, Dupont S, Wong C, Hann B, Solari A,
Bobisse S, Rondina MB, Guzzardo V, Parenti AR, Rosato A, Bicciato S, Balmain
A, Piccolo S. A Mutant-p53/Smad complex opposes p63 to empower TGFbeta-
induced metastasis. Cell. 2009. 137(1):87-98.
Akerfelt M, Morimoto RI, Sistonen L. Heat shock factors: integrators of cell stress,
development and lifespan. Nat Rev Mol Cell Biol. 2010. 11(8):545-55.
Altieri, D.C., Stein, G.S., Lian, J.B., and Languino, L.R.. TRAP-1, the
mitochondrial Hsp90. Biochim. Biophys. Acta (2011),1823, 767-773.
Balkwill, F. & Mantovani, A. Inflammation and cancer: back to Virchow? Lancet. 2001.
357,539–545.
Baracca A, Chiaradonna F, Sgarbi G, Solaini G, Alberghina L, Lenaz G. Mitochondrial
Complex I decrease is responsible for bioenergetic dysfunction in K-ras transformed
cells. Biochim Biophys Acta. 2010. 1797(2):314-23
Baysal BE, Ferrell RE, Willett-Brozick JE, Lawrence EC, Myssiorek D, Bosch A,
et al. Mutations in SDHD, a mitochondrial complex II gene, in hereditary
paraganglioma. Science, 2000;287(5454):848–51.
Bello D, Webber MM, Kleinman HK, Wartinger DD, Rhim JS. Androgen
responsive adult human prostatic epithelial cell lines immortalized by human
papillomavirus 18. Carcinogenesis. 1997. 18(6):1215-23.
Bhamra GS, Hausenloy DJ, Davidson SM, Carr RD, Paiva, M, Wynne AM,
Mocanu MM, Yellon, DM. Metformin protects the ischemic heart by the Akt-
mediated inhibition of mitochondrial permeability transition pore opening. Basic
Res. Cardiol. 2008. 103, 274–284.

65
Blackburn EH. Telomeres and telomerase: their mechanisms of action and the
effects of altering their functions. FEBS Lett. 2005. 579(4):859-62.
Blume-Jensen P, Hunter T. Oncogenic kinase signalling. Nature. 2001.
411(6835):355-65
Borrello MG, Alberti L, Fischer A, Degl'innocenti D, Ferrario C, Gariboldi M, Marchesi
F, Allavena P, Greco A, Collini P, Pilotti S, Cassinelli G, Bressan P, Fugazzola L,
Mantovani A, Pierotti MA. Induction of a proinflammatory program in normal human
thyrocytes by the RET/PTC1 oncogene. Proc. Natl Acad. Sci. USA. 2005. 102, 14825–
14830
Brenner C, Grimm S. The permeability transition pore complex in cancer cell death.
Oncogene. 2006. 25:4744–4756
Budas, GR, Mochly-Rosen, D. Mitochondrial protein kinase C epsilon (PKC epsilon):
emerging role in cardiac protection from ischaemic damage. Biochem. Soc. Trans. 2007.
35, 1052–1054.
Buday L, Downward J. Many faces of Ras activation. Biochim Biophys Acta.
2008. 1786(2):178-87
Cairns RA, Harris IS, Mak TW. Regulation of cancer cell metabolism. Nat. Rev.
Cancer. 2011. 11(2):85-95.
Caro AA, Cederbaum AI. Role of phosphatidylinositol 3-kinase/AKT as a
survival pathway against CYP2E1-dependent toxicity. J. Pharmacol. Exp. Ther.
2006. 318, 360–372.
Crabtree HG (1928). "The carbohydrate metabolism of certain pathological
overgrowths.". Biochem J. 22 (5): 1289–98
Chandra J, Mansson E, Gogvadze V, Kaufmann SH, Albertioni F, Orrenius S. Resistance
of leukemic cells to 2-chlorodeoxyadenosine is due to a lack of calcium-dependent
cytochrome c release. Blood. 2002. 99:655–663

66
Chen B, Piel WH, Gui L, Bruford E, Monteiro A. The HSP90 family of genes in
the human genome: insights into their divergence and evolution. Genomics. 2005.
86(6):627-37
Chiara F, Rasola A. Apoptosis and disease: unbalancing the survival equilibrium.
New Developments in Cell Apoptosis Research, Nova Editorial ed. 2007.
Chiara F, Castellaro D, Marin O, Petronilli V, Brusilow WS, Juhaszova M, Sollott SJ,
Forte M, Bernardi P, Rasola A. Hexokinase II detachment from mitochondria triggers
apoptosis through the permeability transition pore independent of voltage-dependent
anion channels. PLoS ONE .2008. 3,e1852
Chipuk JE, Moldoveanu T, Llambi F, Parsons MJ, Green DR. The BCL-2 family reunion.
Mol Cell. 2010. 37(3):299-310
Choi YK, Kim YS, Choi IY, Kim SW, and Kim WK. 25-hydroxycholesterol induces
mitochondria-dependent apoptosis via activation of glycogen synthase kinase-3beta in
PC12 cells. Free Radic. Res. 2008 .42, 544–553.
Chung AS, Lee J, Ferrara N. Targeting the tumour vasculature: insights from
physiological angiogenesis. Nat Rev Cancer .2010. 10(7):505-14
Clarke SJ, McStay GP, Halestrap AP Sanglifehrin A acts as a potent inhibitor of the
mitochondrial permeability transition and reperfusion injury of the heart by binding to
cyclophilin-D at a different site from cyclosporin A. J Biol Chem. 2002. 277: 34793-
34799
Clohessy JG, Pandolfi PP. beta-tting on p63 as a metastatic suppressor. Cell.
2009. 137(1):28-30.
Coller H.A., Grandori C., Tamayo P., Colbert T., Lander E.S., Eisenman R.N.,
Golub T.R., Expression analysis with oligonucleotide microarrays reveals that
MYC regulates genes involved in growth, cell cycle, signaling, and adhesion,
Proc. Natl. Acad. Sci. 97 (2000) 3260–3265.

67
Costa AD, Garlid KD. Intra mitochondrial signaling: interactions among
mitoKATP, PKC epsilon, ROS, and MPT. Am. J. Physiol. Heart Circ. Physiol.
2008. 295, H874–882.
Costantino E, Maddalena F, Calise S, Piscazzi A, Tirino V, Fersini A, Ambrosi A,
Neri V, Esposito F, Landriscina M. TRAP1, a novel mitochondrial chaperone
responsible for multi-drug resistance and protection from apoptotis in human
colorectal carcinoma cells. Cancer Lett. 2009. 279(1):39-46
Crompton M, Costi A. Kinetic evidence for a heart mitochondrial pore activated
by Ca2+, inorganic phosphate and oxidative stress. A potent mechanism for
mitochondrial dysfunction during cellular Ca2+ overload. Eur J Biochem. 1988.
178:489-501
Dang C V, MYC on the Path to Cancer. Cell. 2012. 149., 22-35.
Datta SR, Dudek H, Tao X, Masters S, Fu H, Gotoh Y, Greenberg ME. Akt
phosphorylation of BAD couples survival signals to the cell-intrinsic death
machinery. Cell. 1997. 91(2):231-41.
D'Autréaux B, Toledano MB. ROS as signalling molecules: mechanisms that generate
specificity in ROS homeostasis. Nat Rev Mol Cell Biol. 2007. 8(10):813-24.
DeBerardinis, R.J., Mancuso A., Daikhin E., Nissim I., Yudkoff M., Wehrli S., Thompson C. B., Beyond aerobic glycolysis: transformed cells can engage in glutamine metabolism that exceeds the requirement for protein and nucleotide synthesis. Proc. Natl Acad. Sci. USA, 2007, 104, 19345–19350.
De Bacco F,Fassetta M, Rasola A. Receptor Tyrosine kinase as target for cancer
therapy. Cancer therapy . 2004. 2:317-328
Denko NC. Hypoxia, HIF1 and glucose metabolism in the solid tumors. Nat Rev Cancer
2008. 8, 705-713
Dhillon AS, Hagan S, Rath O, Kolch W. MAP kinase signalling pathways in
cancer. Oncogene. 2007. 26(22):3279-90.

68
Ding Q, Xia W, Liu JC, Yang JY, Lee DF, Xia J, Bartholomeusz G, Li Y, Pan Y, Li Z,
Bargou RC, Qin J, Lai CC, Tsai FJ, Tsai CH, Hung MC. Erk associates with and primes
GSK-3beta for its inactivation resulting in upregulation of beta-catenin. Mol Cell. 2005.
19(2):159-70.
Eferl R, Ricci R, Kenner L, Zenz R, David JP, Rath M, Wagner EF. Liver tumor
development. c-Jun antagonizes the proapoptotic activity of p53. Cell. 2003. 112(2):181-
92
Eickholt BJ, Walsh FS, Doherty P.J An inactive pool of GSK-3 at the leading edge of
growth cones is implicated in Semaphorin 3A signaling .Cell Biol. 2002 157(2):211-7.
Ellis LM, Hicklin DJ. VEGF-targeted therapy: mechanisms of anti-tumour activity. Nat
Rev Cancer. 2008. 8(8):579-91
Fassetta M, D'Alessandro L, Coltella N, Di Renzo MF, Rasola A. Hepatocyte growth
factor installs a survival platform for colorectal cancer cell invasive growth and
overcomes p38 MAPK-mediated apoptosis. Cell Signal. 2006. 18:1967-76
Fedi, P., Tronick, S.R. and Aaronson, S.A. Growth factors. In Cancer Medicine, J.F.
Holland, R.C. Bast, D.L. Morton, E. Frei, D.W. Kufe, and R.R. Weichselbaum, eds.
(Baltimore, MD: Williams and Wilkins). 1994. pp. 41–64.
Felts SJ, Owen BA, Nguyen P, Trepel J, Donner DB, Toft DO. The hsp90-related
protein TRAP1 is a mitochondrial protein with distinct functional properties. J
Biol Chem. 2000 . 275(5):3305-12
Franke TF. PI3K/Akt: getting it right matters. Oncogene. 2008. 27(50):6473-88
Frezza C., Gottlieb E., Mitochondria in cancer: Not just innocent bystanders,
Seminars in Cancer Biology 19, (2009) 4–11
Frezza, C., Zheng, L., Folger, O., Rajagopalan, K.N., MacKenzie, E.D., Jerby, L.,
Micaroni, M., Chaneton, B., Adam, J., Hedley, A., et al. (2011). Haem oxygenase
is synthetically lethal with the tumour suppressor fumarate hydratase. Nature 477,
225-228.
69
Fritz V, Fajas L. Metabolism and proliferation share common regulatory pathways
in cancer cells. Oncogene. 2010. 29,4369-4377
Galli S, Jahn O, Hitt R, Hesse D, Opitz L, Plessmann U, Urlaub H, Poderoso JJ,
Jares-Erijman EA, Jovin TM. A new paradigm for MAPK: structural interactions
of hERK1 with mitochondria in HeLa cells. PLoS One. 2009. 4(10):e7541
Gao P, Tchernyshyov I, Chang TC, Lee YS, Kita K, Ochi T, Zeller KI, De Marzo
AM, Van Eyk JE, Mendell JT, Dang CV. c-Myc suppression of miR-23a/b
enhances mitochondrial glutaminase expression and glutamine metabolism.
Nature. 2009. 458(7239):762-5
Geiger TR, Peeper DS. Metastasis mechanisms. Biochim Biophys Acta. 2009.
1796(2):293-308.
Gimenez-Roqueplo AP, Favier J, Rustin P, Mourad JJ, Plouin PF, Corvol P, et
al.The R22X mutation of the SDHD gene in hereditary paraganglioma
abolishesthe enzymatic activity of complex II in the mitochondrial respiratory
chain andactivates the hypoxia pathway. Am J Hum Genet 2001;69(6):1186–97.
Gomez, L., Paillard, M., Thibault, H., Derumeaux, G. and Ovize, M. Inhibition of
GSK3beta by post conditioning is required to prevent opening ofthe mitochondrial
permeability transition pore during reperfusion. Circulation. 2008. 117, 2761–
2768.
Goodrich DW. The retinoblastoma tumor-suppressor gene, the exception that
proves the rule. Oncogene. 2006. 25(38):5233-43
Göthel SF, Marahiel MA. Peptidyl-prolyl cis-trans isomerases, a superfamily of
ubiquitous folding catalysts. Cell Mol Life Sci. 1999 .55(3):423-3
Gramaglia D, Gentile A, Battaglia M, Ranzato L, Petronilli V, Fassetta M, Bernardi P,
Rasola A. Apoptosis to necrosis switching downstream of apoptosome formation requires
inhibition of both glycolysis and oxidative phosphorylation in a BCL-XL and PKB/AKT-
independent fashion. Cell Death Differ. 2004. 11: 342-53

70
Grek CL, Townsend DM, Tew KD. The impact of redox and thiol status on the bone
marrow: Pharmacological intervention strategies. Pharmacol Ther. 2011. 129(2):172-84
Griffiths EJ, Halestrap AP. Protection by Cyclosporin A of ischemia/reperfusion-
induced damage in isolated rat hearts. J Mol Cell Cardiol. 1993. 25:1461–1469
Grimes CA, Jope RS. The multifaceted roles of glycogen synthase kinase 3b in
cellular signaling. Prog. Neurobiol. 2001. 65, 391–426
Hammerman PS, Fox CJ, Thompson CB. Beginnings of a signal-transduction
pathway for bioenergetic control of cell survival. Trends Biochem. Sci. 2004. 29,
586–592.
Hanahan D, Weinberg RA. The hallmarks of cancer. Cell. 2000. 100(1):57-70
Hanahan, D., and Weinberg, R.A. Hallmarks of cancer: the next generation. Cell,
2011, 144, 646-674.
Hancock JF. Ras proteins: different signals from different locations. Nat Rev Mol Cell
Biol. 2003. 4:373-384
Haouzi D, Cohen I, Vieira HL, Poncet D, Boya P, Castedo M, Vadrot N, Belzacq AS,
Fau D, Brenner C, Feldmann G, Kroemer G. Mitochondrial permeability transition as a
novel principle of hepatorenal toxicity in vivo. Apoptosis. 2002. 7:395–405
Hausenloy DJ, Yellon DM. Reperfusion injury salvage kinase signalling: taking a RISK
for cardioprotection. Heart Fail. Rev. 2007. 12, 217–234
Hishiya A, Takayama S. Molecular chaperones as regulators of cell death. Oncogene.
2008. 27(50):6489-506
Hsu PP, Sabatini DM. Cancer cell metabolism: Warburg and beyond. Cell . 2008.
134.703-707

71
Hua G, Zhang Q, Fan Z. Heat shock protein 75 (TRAP1) antagonizes reactive oxygen
species generation and protects cells from granzyme M-mediated apoptosis. J Biol Chem.
2007. 282(28):20553-60
Hunter T. Signaling-2000 and beyond. Cell. 2000. 100. 113-127
Ip YT, Davis RJ. Signal transduction by the c-Jun N-terminal kinase (JNK)--from
inflammation to development. Curr Opin Cell Biol. 1998. 10(2):205-19.
Isaacs JS, Jung YJ, Mole DR, Lee S, Torres-Cabala C, Chung YL, et al. HIF
overexpression correlates with biallelic loss of fumarate hydratase in renal cancer:
novel role of fumarate in regulation of HIF stability. Cancer Cell 2005;8(2):143–
53.
Ishii T, Yasuda K, Akatsuka A, Hino O, Hartman PS, Ishii N. A mutation in the
SDHC gene of complex II increases oxidative stress, resulting in apoptosis and
tumorigenesis. Cancer Res 2005;65(1):203–9.
Ivery MT. Immunophilins: switched on protein binding domains? Med Res Rev. 2000.
20(6):452-84.
Iyoda K, Sasaki Y, Horimoto M, Toyama T, Yakushijin T, Sakakibara M et al.
Involvement of p38 mitogen-activated protein kinase cascade in hepatocellular
carcinoma. Cancer. 2003. 97: 3017-3026
Jope RS, Johnson GV. The glamour and gloom of glycogen synthase kinase-3.
Trends Biochem Sci. 2004. 29(2):95-102
Juhaszova M, Zorov DB, Yaniv Y, Nuss HB, Wang S, Sollott SJ. Role of glycogen
synthase kinase-3 beta in cardioprotection. Circ. Res. 2009. 104, 1240–1252
Kang BH, Plescia J, Dohi T, Rosa J, Doxsey SJ, Altieri DC. Regulation of tumor
cell mitochondrial homeostasis by an organelle-specific Hsp90 chaperone
network. Cell. 2007. 131(2):257-70

72
Kang BH, Plescia J, Song HY, Meli M, Colombo G, Beebe K, Scroggins B, Neckers L,
Altieri DC. Combinatorial drug design targeting multiple cancer signaling networks
controlled by mitochondrial Hsp90. J. Clin. Invest. 2009. 119, 454–464
Karnoub AE, Weinberg RA. Ras oncogenes: split personalities. Nat Rev Mol Cell
Biol. 2008. 9(7):517-31
Keep M, Elmer E, Fong KS, Csiszar K. Intrathecal cyclosporine prolongs survival of late-
stage ALS mice. Brain Res . 2001. 894:327–331
Kennedy NJ, Sluss HK, Jones SN, Bar-Sagi D, Flavell RA, Davis RJ. Suppression of
Ras-stimulated transformation by the JNK signal transduction pathway. Genes Dev. 2003.
17(5):629-37
Kim W, Yoon JH, Jeong JM, Cheon GJ, Lee TS, Yang JI, Park SC, Lee HS. Apoptosis-
inducing antitumor efficacy of hexokinase II inhibitor in hepatocellular carcinoma. Mol.
Cancer Ther. 2007. 6, 2554–2562
King A, Selak MA, Gottlieb E. Succinate dehydrogenase and fumarate hydratase: linking
mitochondrial dysfunction and cancer. Oncogene. 2006. 25(34):4675-82
Klein CA. Cancer. The metastasis cascade. Science. 2008. 321(5897):1785-7
Klein CA. Parallel progression of primary tumours and metastases. Nat Rev Cancer.
2009. 9(4):302-12
Klohn PC, Soriano ME, IrwinW, Penzo D, Scorrano L, Bitsch A, Neumann HG, Bernardi
P. Early resistance to cell death and to onset of the mitochondrial permeability transition
during hepatocarcinogenesis with 2-acetylaminofluorene. Proc Natl Acad Sci USA . 2003.
100:10014–10019
Knight ZA, Lin H, Shokat KM. Targeting the cancer kinome through
polypharmacology. Nat Rev Cancer. 2010. 10(2):130-7.
Kobayashi H, Miura T, Ishida H, Miki T, Tanno M, Yano T, Sato T, Hotta H,
Shimamoto K. Limitation of infarct size by erythropoietin is associated with

73
translocation of Akt to the mitochondria after reperfusion. Clin. Exp. Pharmacol.
Physiol. 2008. 35, 812–819.
Kuilman T, Michaloglou C, Mooi WJ, Peeper DS. The essence of senescence.
Genes Dev. 2010. 24(22):2463-79.
Kumar V, Abbas AK, Fausto N, Aster JC. Pathologic basis of disease, 8th edition,
Elsevier. 2009.
Labi V, Grespi F, Baumgartner F, Villunger A. Targeting the Bcl-2-regulated apoptosis
pathway by BH3 mimetics: a breakthrough in anticancer therapy? Cell Death Differ.
2008. 15(6):977-87
Larizza L, Gervasini C, Natacci F, Riva P. Developmental abnormalities and
cancer predisposition in neurofibromatosis type 1. Curr Mol Med. 2009. 9(5):634-
53
Leav I, Plescia J, Goel HL, Li J, Jiang Z, Cohen RJ, Languino LR, Altieri DC.
Cytoprotective mitochondrial chaperone TRAP-1 as a novel molecular target in localized
and metastatic prostate cancer. Am. J. Pathol. 2009. 176,393–401
Li PA, Uchino H, Elmer E, Siesjo BK .Amelioration by cyclosporin A of brain damage
following 5 or 10 min of ischemia in rats subjected to preischemic hyperglycemia. Brain
Res. 1997. 753:133–140
Liberek K, Lewandowska A, Zietkiewicz S. Chaperones in control of protein
disaggregation. EMBO J. 2008. 27(2):328-35
Lu W, Pelicano H, Huang P. Cancer metabolism: is glutamine sweeter than glucose?
Cancer Cell. 2010.18(3):199-200
Lu, G, Ren S, Korge, P, Choi, J, Dong, Y, Weiss J, Koehler C, Chen JN, Wang, Y. A
novel mitochondrial matrix serine/threonine protein phosphatase regulates the
mitochondria permeability transition pore and isessential for cellular survival and
development. Genes Dev. 2007. 21, 784–796.

74
Machida K, Ohta Y, Osada H. Suppression of apoptosis by cyclophilin D via stabilization
of hexokinase II mitochondrial binding in cancer cells. J. Biol. Chem. 2006. 281, 14314–
14320
Mantovani A. Cancer: Inflaming metastasis. Nature. 2009. 457, 36-37
Mantovani A, Allavena P, Sica A, Balkwill F. Cancer-related inflammation. Nature.
2008. 454(7203):436-44
Majewski N, Nogueira V, Robey RB, Hay N. Akt inhibits apoptosis downstream of BID
cleavage via a glucose-dependent mechanism involving mitochondrial hexokinases. Mol.
Cell Biol. 2004. 24, 730–740
Mayo LD, Donner DB. The PTEN, Mdm2, p53 tumor suppressor–oncoprotein network.
Trends Biochem. Sci. 2002. 27, 462–467.
McKay MM, Morrison DK. Integrating signals from RTKs to ERK/MAPK. Oncogene. 2007. 26(22):3113-21
Miyamoto S, Murphy AN, Brown JH. Akt mediates mitochondrial protection in
cardiomyocytes through phosphorylation of mitochondrial hexokinase-II. Cell Death
Differ. 2008. 15, 521–529
Montesano Gesualdi N, Chirico G, Pirozzi G, Costantino E, Landriscina M,
Esposito F. Tumor necrosis factor-associated protein 1 (TRAP-1) protects cells
from oxidative stress and apoptosis. Stress. 2007. 10(4):342-50
Morfini G, Szebenyi G, Brown H, Pant HC, Pigino G, DeBoer S, Beffert U,
Brady ST. A novel CDK5-dependent pathway for regulating GSK3 activity and
kinesin-driven motility in neurons. EMBO J. 2004. 23(11):2235-45
Neckers L, Mollapour M, Tsutsumi S. The complex dance of the molecular chaperone
Hsp90. Trends Biochem Sci. 2009. 34(5):223-6
Okada H, Mak TW. Pathways of apoptotic and non-apoptotic death in tumour
cells. Nat Rev Cancer. 2004. 4(8):592-603

75
Pap M, Cooper GM. Role of glycogen synthase kinase-3 in the
phosphatidylinositol 3-kinase/Akt cell survival pathway. J. Biol.Chem. 1998. 273,
19929–19932
Pelengaris S, Khan M, Evan G. c-MYC: more than just a matter of life and death.
Nat Rev Cancer. 2002. 2(10):764-76
Pridgeon, J. W., Olzmann, J. A., Chin, L. S. & Li, L. PINK1 protects against oxidative
stress by phosphorylating mitochondrial chaperone TRAP1. PLoS Bio. 2007. 5,e172
Prieur A, Peeper DS. Cellular senescence in vivo: a barrier to tumorigenesis. Curr
Opin Cell Biol. 2008. 20(2):150-5.
Puc J, Keniry M, Li HS, Pandita TK, Choudhury AD, Memeo L, Mansukhani M,
Murty VV, Gaciong Z, Meek SE, Piwnica-Worms H, Hibshoosh H, Parsons R.
Lack of PTEN sequesters CHK1 and initiates genetic instability. Cancer Cell.
2005. 7(2):193-204
Rasola A, Geuna M. A flow cytometry assay simultaneously detects independent
apoptotic parameters. Cytometry. 2001. 45: 151-7
Rasola A, Bernardi P. The mitochondrial permeability transition pore and its
involvement in cell death and in disease pathogenesis. Apoptosis. 2007.
12(5):815-33
Ravid T, Hochstrasser M. Diversity of degradation signals in the ubiquitin-
proteasome system. Nat Rev Mol Cell Biol. 2008. 9(9):679-90.
Richter K, Haslbeck M, Buchner J. The heat shock response: life on the verge of
death. Mol Cell. 2010. 40(2):253-66
Robey RB, Hay N. Mitochondrial hexokinases, novel mediators of the antiapoptotic
effects of growth factors and Akt. Oncogene. 2006. 25, 4683–4696

76
Rotem R, Heyfets A, Fingrut O, Blickstein D, ShaklaiM, Flescher E. Jasmonates: novel
anticancer agents acting directly and selectively on human cancer cell mitochondria.
Cancer Res. 2005. 65:1984–1993
Schubert A, Grimm S. Cyclophilin D, a component of the permeability transition-pore, is
an apoptosis repressor. Cancer Res. 2004. 64(1):85-93.
Schubbert S, Shannon K, Bollag G. Hyperactive Ras in developmental disorders
and cancer. Nat Rev Cancer. 2007. 7(4):295-308
Sebolt-Leopold JS, Herrera R. Targeting the mitogen-activated protein kinase
cascade to treat cancer. Nat Rev Cancer. 2004. 4(12):937-47.
Selak MA, Duran RV, Gottlieb E. Redox stress is not essential for the
pseudohypoxic phenotype of succinate dehydrogenase deficient cells. Biochim
Biophys Acta 2006;1757(5–6):567–72.
Semenza G. L., Trends in Pharmacological Sciences, April 2012, Vol. 33, No. 4
Serrano M, Lin AW, McCurrach ME, Beach D, Lowe SW. Oncogenic ras
provokes premature cell senescence associated with accumulation of p53 and
p16INK4a. Cell 1997. 88:593-602.
Shaw RJ, Cantley LC. Ras, PI(3)K and mTOR signalling controls tumour cell growth. Nature. 2006. 441(7092):424-30
Shchors K, Shchors E, Rostker F, Lawlor ER, Brown-Swigart L, Evan GI. The Myc-
dependent angiogenic switch in tumors is mediated by interleukin 1β. Genes Dev. 2006.
20, 2527–2538
Shulga N, Wilson-Smith R, Pastorino JG.Sirtuin-3 deacetylation of cyclophilin D
induces dissociation of hexokinase II from the mitochondria. J Cell Sci. 2010.
123(Pt 6):894-902.

77
Siemion IZ, Pedyczak A, Trojnar J, Zimecki M, Wieczorek Z.
Immunosuppressive activity of antamanide and some of its analogues. Peptides.
1992. 13(6):1233-7.
Singh A, Settleman J. EMT, cancer stem cells and drug resistance: an emerging
axis of evil in the war on cancer. Oncogene. 2010. 29(34):4741-51.
Slamon, D.J., Clark, G.M., Wong, S.G., Levin, W.J., Ullrich, A., and McGuire, W.L.
Human breast cancer: correlation of relapse and survival with amplification of the HER-
2/neu oncogene. Science. 1987. 235, 177–182.
Soriano ME, Nicolosi L, Bernardi P. Desensitization of the permeability transition pore
by cyclosporin a prevents activation of the mitochondrial apoptotic pathway and liver
damage by tumor necrosis factor-alpha. J Biol Chem . 2004. 279:36803–36808
Sparks CA, Guertin DA. Targeting mTOR: prospects for mTOR complex 2 inhibitors in
cancer therapy. Oncogene. 2010. 29, 3733-3744
Sparmann A, Bar-Sagi, D. Ras-induced interleukin-8 expression plays a critical role
intumor growth and angiogenesis. Cancer Cell. 2004. 6, 447–458
Steer HJ, Lake RA, Nowak AK, Robinson BW. Harnessing the immune response
to treat cancer. Oncogene. 2010. 29(48):6301-13.
Sumimoto, H., Imabayashi, F., Iwata, T. & Kawakami, Y. The BRAF–MAPK
signalingpathway is essential for cancer-immune evasion in human melanoma cells. J.
Exp. Med. 2006. 203, 1651–1656
Taipale M, Jarosz DF, Lindquist S.HSP90 at the hub of protein homeostasis: emerging
mechanistic insights .Nat Rev Mol Cell Biol. 2010. 11(7):515-28.
Taylor RC, Cullen SP, Martin SJ. Apoptosis: controlled demolition at the cellular level.
Nat Rev Mol Cell Biol. 2008. 9(3):231-41.
Tomlinson IP, Alam NA, Rowan AJ, Barclay E, Jaeger EE, Kelsell D, Leigh I, Gorman P, Lamlum H, Rahman S, Roylance RR, Olpin S, Bevan S, Barker K, Hearle N, Houlston RS, Kiuru M, Lehtonen R, Karhu A, Vilkki S, Laiho P, Eklund C, Vierimaa O, Aittomäki K, Hietala M, Sistonen P, Paetau A, Salovaara

78
R, Herva R, Launonen V, Aaltonen LA, Germline mutations in FH predispose to dominantly inherited uterine fibroids, skin leiomyomata and papillary renal cell cancer. Nat Genet 2002;30(4): 406–10.
Trachootham D, Alexandre J, Huang P. Targeting cancer cells by ROS-mediated
mechanisms: a radical therapeutic approach? Nat Rev Drug Discov. 2009.
8(7):579-91.
Trepel J, Mollapour M, Giaccone G, Neckers L. Targeting the dynamic HSP90
complex in cancer. Nat Rev Cancer. 2010. 10(8):537-49
Vander Heiden MG, Cantley LC, Thompson CB. Understanding the Warburg effect: the
metabolic requirement of cell proliferation. Science. 2009. 324, 1029-1033
Vogler M, Dinsdale D, Dyer MJ, Cohen GM. Bcl-2 inhibitors: small molecules with a big
impact on cancer therapy. Cell Death Differ. 2009.16(3):360-7
Vousden KH, Lane DP. p53 in health and disease. Nat Rev Mol Cell Biol. 2007.
8(4):275-83.
Vousden KH. Alternative fuel-another role for p53 in the regulation of
metabolism. Proc Natl Acad Sci U S A. 2010. 107(16):7117-8
Verrier F, Deniaud A, Lebras M, Metivier D, Kroemer G, Mignotte B, Jan G, Brenner C.
Dynamic evolution of the adeninenucleotide translocase interactome during
chemotherapy-induced apoptosis. Oncogene. 2004. 23:8049–8064
Wan PT, Garnett MJ, Roe SM, Lee S, Niculescu-Duvaz D, Good VM, Jones CM,
Marshall CJ, Springer CJ, Barford D, Marais R; Cancer Genome Project.
Mechanism of activation of the RAF-ERK signaling pathway by oncogenic
mutations of B-RAF. Cell. 2004. 116(6):855-67
Wang JB, Erickson JW, Fuji R, Ramachandran S, Gao P, Dinavahi R, Wilson KF,
Ambrosio AL, Dias SM, Dang CV, Cerione RA. Targeting mitochondrial
glutaminase activity inhibits oncogenic transformation. Cancer Cell. 2010.
18(3):207-19

79
Warburg O, Wind F, Negelein E. The metabolism of tumors in the body. J Gen
Physiol. 1927. 8(6):519-30
Warburg O. On the origin of cancer cells. Science. 1956. 123(3191):309-14
Weston CR, Davis RJ. The JNK signal transduction pathway. Curr Opin Genet Dev.
2002. 12(1):14-21
Watcharasit P, Bijur GN, Zmijewski JW, Song L, Zmijewska A, Chen X, Johnson GV,
Jope RS. Direct, activating interaction between glycogen synthase kinase-3beta and p53
after DNA damage. Proc Natl Acad Sci U S A. 2002. 99(12):7951-5.
Whitesell L, Lindquist SL.HSP90 and the chaperoning of cancer. Nat Rev Cancer. 2005.
5(10):761-72.
Wittig, I., and Schagger, H. (2008). Features and applications of blue-native and
clear-native electrophoresis. Proteomics 8, 3974-3990.
Yecies JL, Manning BD. Chewing the fat on tumor cell metabolism. Cell. 2010.
140(1):28-30.
Xie, Q., Wondergem, R., Shen, Y., Cavey, G., Ke, J., Thompson, R., Bradley, R.,
Daugherty-Holtrop, J., Xu, Y., Chen, E., et al. (2011). Benzoquinone ansamycin
17AAG binds to mitochondrial voltage-dependent anion channel and inhibits cell
invasion. Proc. Natl. Acad. Sci. USA 108, 4105-4110.