sperimentazione LENR: ALCUNE QUESTIONI FONDAMENTALI · • Calorimetria: adiabatica, isoperibolica,...
12
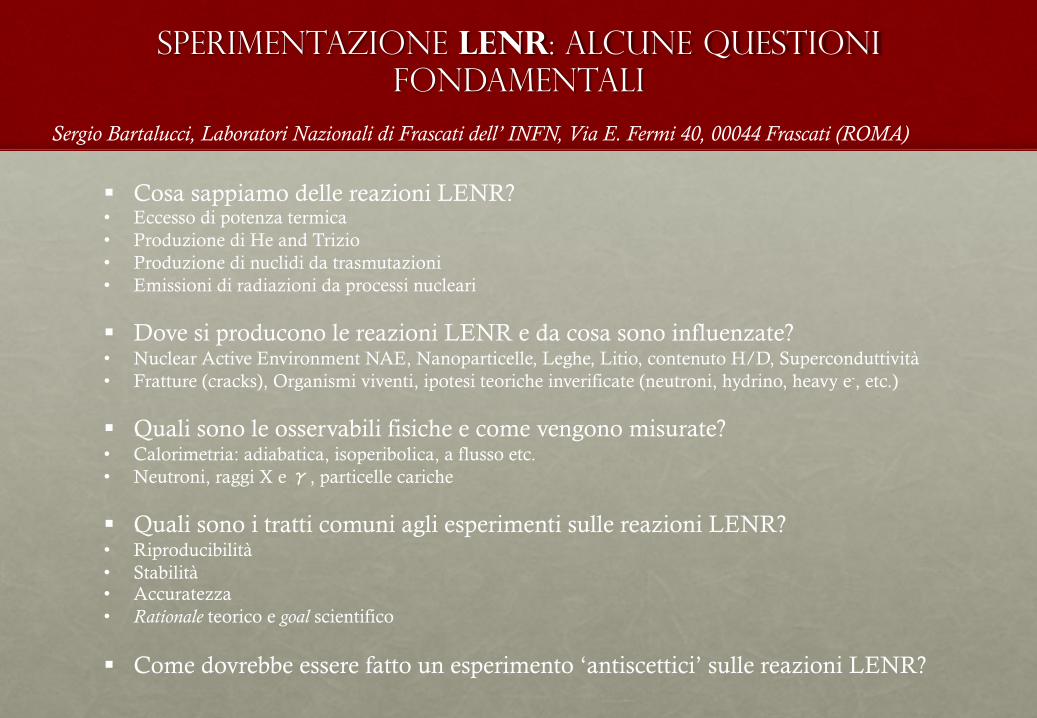
sperimentazione LENR: ALCUNE QUESTIONI FONDAMENTALI Sergio Bartalucci, Laboratori Nazionali di Frascati dell’ INFN, Via E. Fermi 40, 00044 Frascati (ROMA) Cosa sappiamo delle reazioni LENR? • Eccesso di potenza termica • Produzione di He and Trizio • Produzione di nuclidi da trasmutazioni • Emissioni di radiazioni da processi nucleari Dove si producono le reazioni LENR e da cosa sono influenzate? • Nuclear Active Environment NAE, Nanoparticelle, Leghe, Litio, contenuto H/D, Superconduttività • Fratture (cracks), Organismi viventi, ipotesi teoriche inverificate (neutroni, hydrino, heavy e - , etc.) Quali sono le osservabili fisiche e come vengono misurate? • Calorimetria: adiabatica, isoperibolica, a flusso etc. • Neutroni, raggi X e γ, particelle cariche Quali sono i tratti comuni agli esperimenti sulle reazioni LENR? • Riproducibilità • Stabilità • Accuratezza • Rationale teorico e goal scientifico Come dovrebbe essere fatto un esperimento ‘antiscettici’ sulle reazioni LENR?
Transcript of sperimentazione LENR: ALCUNE QUESTIONI FONDAMENTALI · • Calorimetria: adiabatica, isoperibolica,...
sperimentazione LENR: ALCUNE QUESTIONI FONDAMENTALI
Sergio Bartalucci, Laboratori Nazionali di Frascati dell’ INFN, Via E. Fermi 40, 00044 Frascati (ROMA)
§ Cosa sappiamo delle reazioni LENR? • Eccesso di potenza termica • Produzione di He and Trizio • Produzione di nuclidi da trasmutazioni • Emissioni di radiazioni da processi nucleari
§ Dove si producono le reazioni LENR e da cosa sono influenzate? • Nuclear Active Environment NAE, Nanoparticelle, Leghe, Litio, contenuto H/D, Superconduttività • Fratture (cracks), Organismi viventi, ipotesi teoriche inverificate (neutroni, hydrino, heavy e-, etc.)
§ Quali sono le osservabili fisiche e come vengono misurate? • Calorimetria: adiabatica, isoperibolica, a flusso etc. • Neutroni, raggi X e γ, particelle cariche
§ Quali sono i tratti comuni agli esperimenti sulle reazioni LENR? • Riproducibilità • Stabilità • Accuratezza • Rationale teorico e goal scientifico
§ Come dovrebbe essere fatto un esperimento ‘antiscettici’ sulle reazioni LENR?
Eccesso di potenza
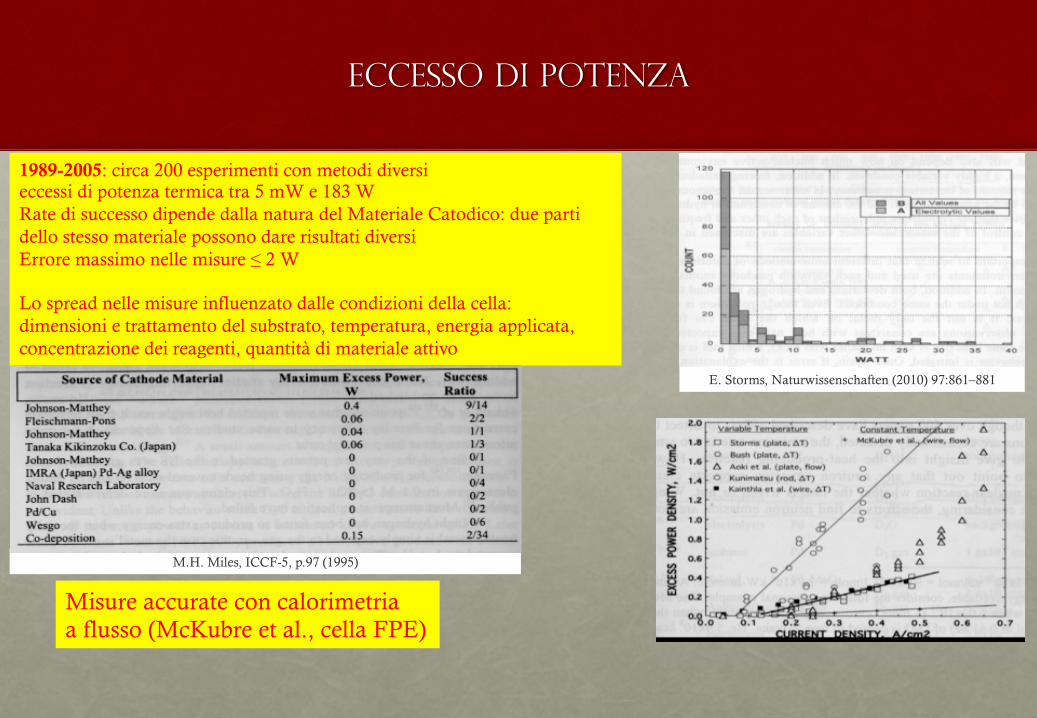
Misure accurate con calorimetria a flusso (McKubre et al., cella FPE)
E. Storms, Naturwissenschaften (2010) 97:861–881
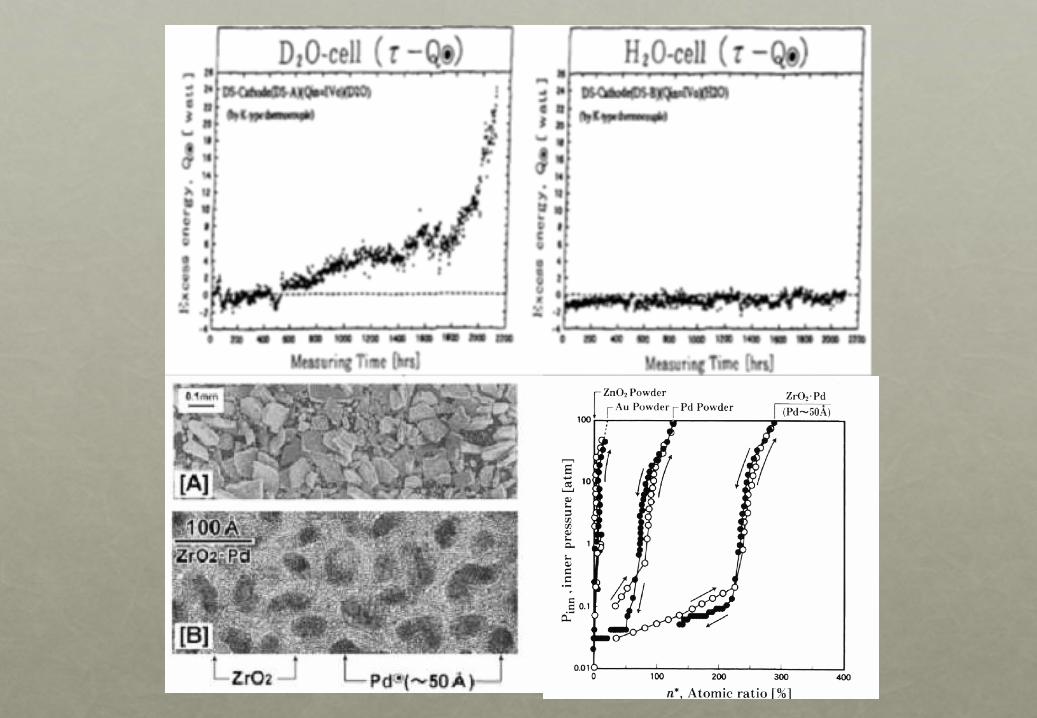
1989-2005: circa 200 esperimenti con metodi diversi eccessi di potenza termica tra 5 mW e 183 W Rate di successo dipende dalla natura del Materiale Catodico: due parti dello stesso materiale possono dare risultati diversi Errore massimo nelle misure ≤ 2 W Lo spread nelle misure influenzato dalle condizioni della cella: dimensioni e trattamento del substrato, temperatura, energia applicata, concentrazione dei reagenti, quantità di materiale attivo
M.H. Miles, ICCF-5, p.97 (1995)
ELIO e TRIZIO
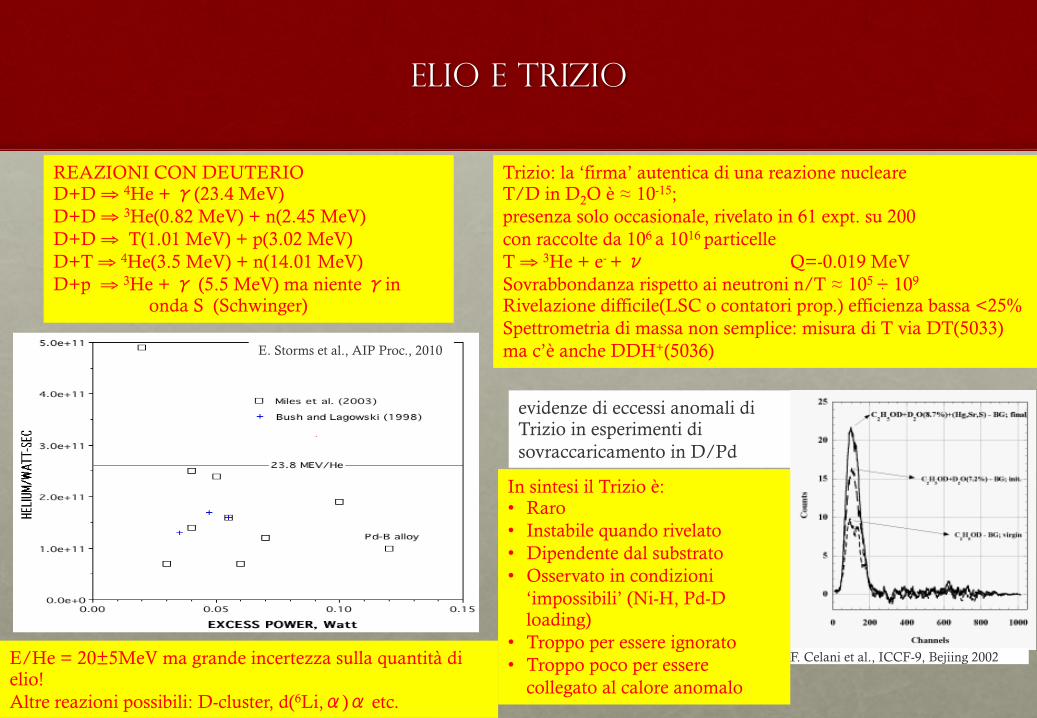
REAZIONI CON DEUTERIO D+D ⇒ 4He + γ(23.4 MeV) D+D ⇒ 3He(0.82 MeV) + n(2.45 MeV) D+D ⇒ T(1.01 MeV) + p(3.02 MeV) D+T ⇒ 4He(3.5 MeV) + n(14.01 MeV) D+p ⇒ 3He + γ (5.5 MeV) ma niente γin
onda S (Schwinger)
E/He = 20±5MeV ma grande incertezza sulla quantità di elio! Altre reazioni possibili: D-cluster, d(6Li,α)α etc.
Submitted for publication in AIP Proceedings, 2010.
4
TABLE 1. Reactions resulting from fusion involving deuterons
d + d = 3He(0.82 MeV) + n(2.45 MeV) d + t = n(14.01 MeV) + 4He(3.5 MeV)d + d = p(3.02 MeV) + t(1.01 MeV) d + p = 3He + gamma (5.5 MeV)d + d = 4He + gamma (23.5 MeV)
Helium
Helium has been detected on many occasions in cold fusion cells, in both the gasand the palladium cathode, and shown to have a relationship to the amount of heatmeasured. Two independent measurements are compared in Fig. 2. Many other studiesshow a clear correlation between heat and helium production, but without givingquantitative values. To properly understand these measurements, a few qualificationsmust be accepted. Only the amount of He released into the gas stream is measured.McKubre et al.[13] and Matsunaka et al.[14] show that this quantity represents onlypart of the total amount of He produced since it omits any helium captured in the solidPd cathode. Although the amount captured can be variable, depending on how deepinto the surface helium forms, the round number value is about 50%. Both studiescompared in Fig. 2 are consistent with this 50% value within expected uncertainty.Taking all measurements into account and applying this potential loss of helium,Storms[2] proposed a value of 20±5 MeV for the energy produced by formation ofeach helium nucleus, which is consistent with the expected energy produced by a d-dfusion reaction.
Alternative explanations have been suggested that involve addition of deuterons,protons, or neutrons to isotopes of lithium to generate helium. None of these reactionsproduce enough energy per He atom to be consistent with the measurements.
FIGURE 2. Helium atoms/Joule vs Excess power. Two independent studies are compared.
E. Storms et al., AIP Proc., 2010
Trizio: la ‘firma’ autentica di una reazione nucleare T/D in D2O è ≈ 10-15; presenza solo occasionale, rivelato in 61 expt. su 200 con raccolte da 106 a 1016 particelle T ⇒ 3He + e- + ν Q=-0.019 MeV Sovrabbondanza rispetto ai neutroni n/T ≈ 105 ÷ 109 Rivelazione difficile(LSC o contatori prop.) efficienza bassa <25% Spettrometria di massa non semplice: misura di T via DT(5033) ma c’è anche DDH+(5036)
— 10 —
Fig. 7 – Raw data. Measurement of final solution at the end of one experiment using light ethyl alcohol andwater. Added 12 cc of salts and acids in H2O (Hg, Sr, S).
Fig. 8 – Final data with background subtraction (20 channels “binning”), showing an increase of Tritiumpeak after electrolysis. In fact, the lower curve corresponds to virgin heavy alcohol, the middle one representsthe initial electrolyte solution, the higher curve has been obtained after the end of the electrolysis process.
F. Celani et al., ICCF-9, Bejiing 2002
evidenze di eccessi anomali di Trizio in esperimenti di sovraccaricamento in D/Pd
In sintesi il Trizio è: • Raro • Instabile quando rivelato • Dipendente dal substrato • Osservato in condizioni
‘impossibili’ (Ni-H, Pd-D loading)
• Troppo per essere ignorato • Troppo poco per essere
collegato al calore anomalo
TRASMUTAZIONI
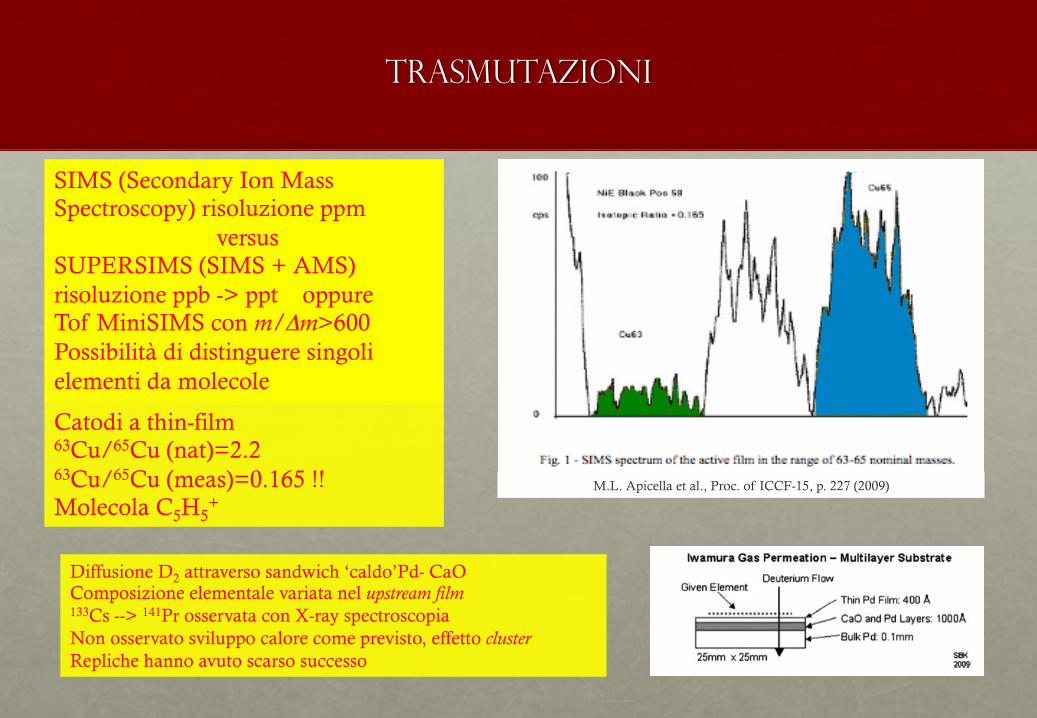
SIMS (Secondary Ion Mass Spectroscopy) risoluzione ppm
versus SUPERSIMS (SIMS + AMS) risoluzione ppb -> ppt oppure Tof MiniSIMS con m/Δm>600 Possibilità di distinguere singoli elementi da molecole
M.L. Apicella et al., Proc. of ICCF-15, p. 227 (2009)
Catodi a thin-film
63Cu/65Cu (nat)=2.2 63Cu/65Cu (meas)=0.165 !! Molecola C5H5
+
Diffusione D2 attraverso sandwich ‘caldo’Pd- CaO Composizione elementale variata nel upstream film 133Cs --> 141Pr osservata con X-ray spectroscopia Non osservato sviluppo calore come previsto, effetto cluster Repliche hanno avuto scarso successo
Radiazioni da processi nucleari
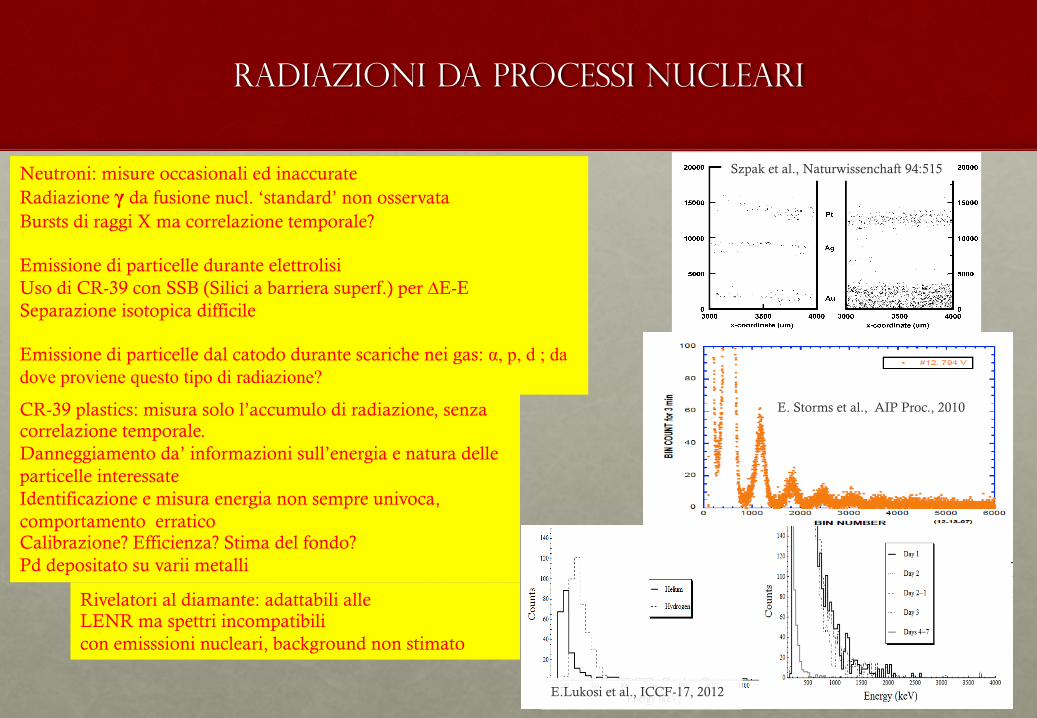
CR-39 plastics: misura solo l’accumulo di radiazione, senza correlazione temporale. Danneggiamento da’ informazioni sull’energia e natura delle particelle interessate Identificazione e misura energia non sempre univoca, comportamento erratico Calibrazione? Efficienza? Stima del fondo? Pd depositato su varii metalli
reveal release of some energy as energetic particles. Stillunknown is the relationship of this radiation to heat+heliumproduction.
Radiation with unexpected properties has been detected,which adds another curiosity to the process (Lochak andUrutskoev 2004; Matsumoto 1993; Oriani and Fisher 2004;Savvatimova and Dash 2002). These claims raise a questionabout how much of the detected radiation is a new kind orsimply results from changes in conventional radiation. Forexample, if the emitted nuclei are not missing their electronsas is normally the case, i.e. are neutral, they will interact withdetectors in unexpected ways. These possibilities need to beconsidered when studies are made of the radiation.
Theory and explanations
If the observations described above are basically correct, howcan they be explained? Since 1989, hundreds of attempts havebeen published (toomany to discuss in detail here). At the riskof ignoring clever and potentially important insight, only themost general ideas are included. The first step is to identifythe basic requirements a useful mechanism must have. Theserequirements allow some proposed explanations to berejected outright while others can be explored in more detail.
To participate in a nuclear reaction within a solid, adeuteron must appear to have a greatly reduced nuclearcharge when viewed from the nucleus of another element.Many ways have been proposed to achieve this condition.For example, electrons might concentrate between thenuclei to hide the charge, local energy might push thenuclei through the barrier (tunneling); wave-like behaviormight lower the effective nuclear charge; an electron might
enter the deuteron to make a dineutron; Bose–Einsteincondensates of nuclei might form, thereby allowing thestrong force to operate between the nuclei; or clusters ofatoms might form in which the bonding electrons couldhide the nuclear charge. If transmutation is accepted, themechanism must be able to cause fusion to make helium aswell as react with other elements. This requirement placessevere limits on proposed mechanisms unless severalindependent mechanisms occur, which, in view of theunique requirements, seems unlikely. But, this requirementis only part of the problem.
When a deuteron reacts with a target nucleus, considerableenergy is released and only one nuclear product can be clearlyidentified, i.e. the resulting new element. Since a singleproduct is not able to carry away the resulting energy andmomentum, this momentum and energy must be communi-cated to other particles. The energy of these particles must bein range limited by the measured values and by energy toosmall to make detectable secondary reactions, as evaluated byHagelstein (2010). Details are provided by Hagelstein in Vol.3 of JCMNS (http://www.iscmns.org/CMNS/publications.htm). Secondary reactions, if they occur, can be detectedbecause the reaction products have enough energy to leavethe system and become visible to conventional radiationdetectors. These requirements mean that the 23.8 MeVgenerated by formation of helium must be communicated tomany atoms immediately upon its release. Mechanisms todirectly communicate energy to the lattice have been suggested(Chubb 2009; Chubb and Chubb 1991; Hagelstein andChaudhary 2008), but clearly, these processes do not transferall energy because some energetic particles are detected. It isstill too early to know how much of the resulting energy isemitted as particles, many of which might defy presentdetection methods. Nevertheless, clearly, the energy resultingfrom helium formation is distributed, not as gamma emissionas produced during hot fusion but as disturbances within theNAE and as ejected energetic particles. Just how this processoperates remains to be discovered.
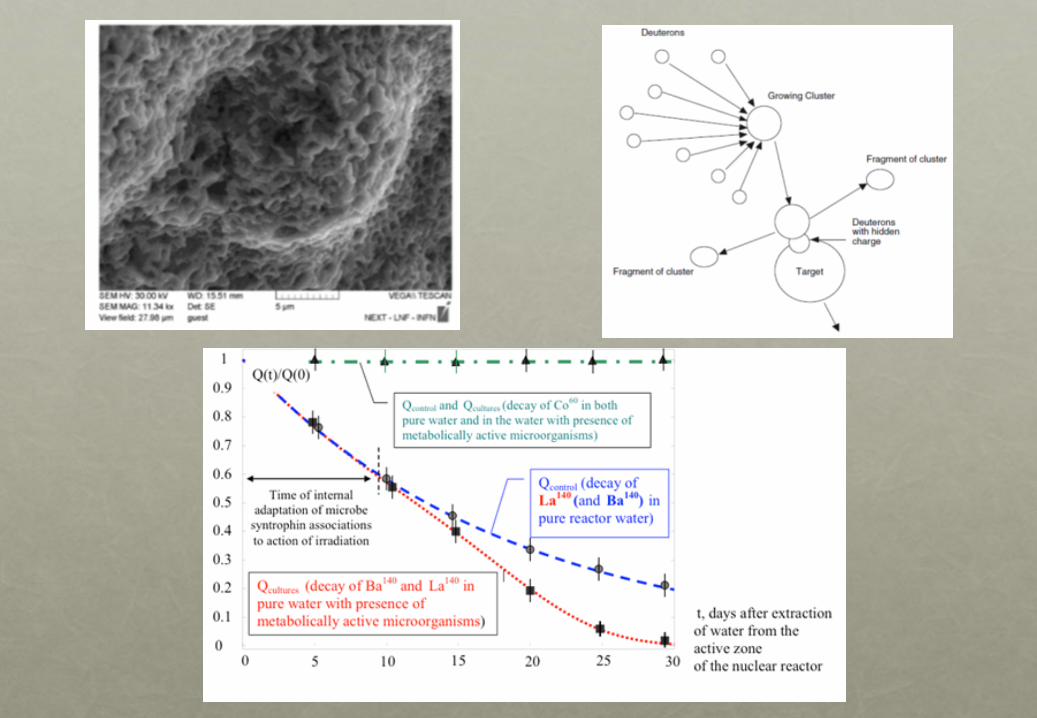
If clusters are involved, how might they reduce the energyof emitted particles and couple energy to the lattice? Stormsand Scanlan (2010) and Toimela (2004, 2007) providesimilar answers that require assumptions be made about thesize of the cluster and its characteristics. If the clustercontains more deuterons than are able to react with the target,the remaining deuterons might participate in release ofenergy by being accelerated away from the reaction site, asshown in Fig. 12, by a mini-explosion. Each additionaldeuteron would carry away its fraction of the nuclear energyand momentum either as an ion or neutral fragment of theoriginal cluster. While this mechanism has not been exploredin detail, it is consistent with the observations and allowsclusters to be involved in the entire process from loweringthe Coulomb barrier at the start of process, as described
Fig. 11 Front side (a) and back side (b) of CR-39 exposed to anelectrolytic cell while palladium is plated on different metal wires. Theradiation produced at the silver cathode did not penetrate through theplastic. The images were made by computer analysis of the surface.The front-side tracks in some areas were too copious for computerrecognition
Naturwissenschaften (2010) 97:861–881 873 Author's personal copy
Szpak et al., Naturwissenchaft 94:515
E. Storms et al., AIP Proc., 2010
Neutroni: misure occasionali ed inaccurate Radiazione γ da fusione nucl. ‘standard’ non osservata Bursts di raggi X ma correlazione temporale? Emissione di particelle durante elettrolisi Uso di CR-39 con SSB (Silici a barriera superf.) per ∆E-E Separazione isotopica difficile Emissione di particelle dal catodo durante scariche nei gas: α, p, d ; da dove proviene questo tipo di radiazione?
Rivelatori al diamante: adattabili alle LENR ma spettri incompatibili con emisssioni nucleari, background non stimato
IV. RESULTS The spectra obtained in this experiment are shown in
Fig. 4. The background spectra for helium and hydrogen, taken for one hour each, are shown together in part a). The background spectra for each of the process gases give the general shape. The Ortec 142PC preamplifier has a sensitivity with diamond at its input of 80 mV/MeV and for the helium run this indicates that the peak of the noise lies around 16 mV. For the hydrogen run the noise seems
to be shifted by a channel number (energy is shown but this is only a one channel difference). This is given as an option because of the similar shape between the two even though this could be a coincidence. However, the fact that the spectrum ends at a channel number higher for hydro-gen than helium when the lower level discriminator was set to the same value between the two experiments raises questions. The true reason for the differences in the ob-served spectra between hydrogen and helium is currently unknown.
Figure 4. Experimental results obtained in the gas loading palladium electrode on a diamond sensor. Here the results are shown for a) the background spectra obtained for hydrogen and helium, b) and c) the low-energy spectra from the deuterium run, and d) the count rate of
pulsees observed in the diamond sensor over time for the deuterium run.
In part b) the low-energy spectrum obtained for the deuterium gas loading experiment is shown. This run was conducted for approximately seven days and was periodi-cally checked to produce spectra obtained at different time intervals. Each spectrum was scaled by the appropri-ate factor to take into account differing exposure times so that the plots could be compared. It can be seen that the run using deuterium process gas differs from the back-ground runs by a tail of pulses that extends into higher energies. This can be seen clearly in part c). The energy of the pulses seen are distributed and do not match what is expected for a nuclear reaction, such as a narrow peak from alpha decay. Further, the data obtained for day three clearly shows a massive jump in counts versus the other spectra obtained at the location of the peak of all spectra shown. The actual peak of this spectrum was 209,775 counts at channel number 6, corresponding to 225 keV.
Only one spectrum was obtained after day three and it was conducted for three days. There is an interesting ef-fect in this spectrum in that the location of the peak is now pushed against the lowest channels, as if it has been shifted to lower energies even though there is no cause for this shift due to equipment changes or faults and was verified with other sensors. This result is puzzling be-cause one could argue that this change could be due to the same unknown reason seen for the pulse height spectrum shift by one channel between the hydrogen and helium runs. The high-energy spectra are not shown here because no high energy counts were registered in any of the ex-perimental runs at any time.
To compare the obtained spectra, the rate of counts registered per five minute period during all acquisition times in the deuterium runs is displayed in part d). It can be clearly seen that the count rate is very low for about
E.Lukosi et al., ICCF-17, 2012
Nuclear active environment
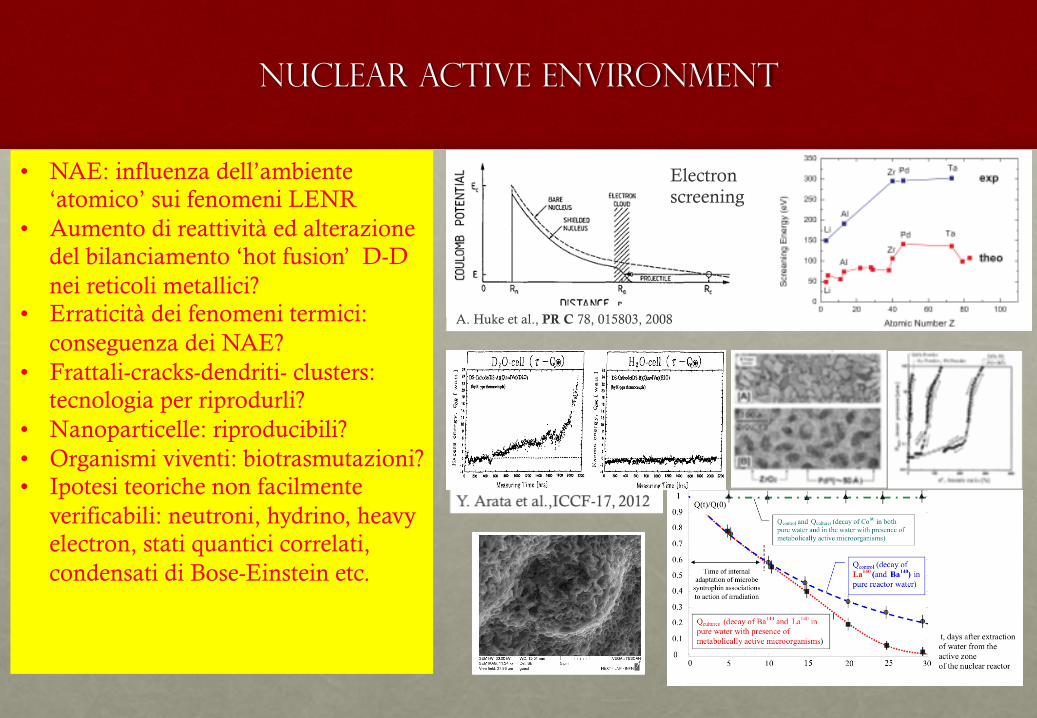
• NAE: influenza dell’ambiente ‘atomico’ sui fenomeni LENR
• Aumento di reattività ed alterazione del bilanciamento ‘hot fusion’ D-D nei reticoli metallici?
• Erraticità dei fenomeni termici: conseguenza dei NAE?
• Frattali-cracks-dendriti- clusters: tecnologia per riprodurli?
• Nanoparticelle: riproducibili? • Organismi viventi: biotrasmutazioni? • Ipotesi teoriche non facilmente
verificabili: neutroni, hydrino, heavy electron, stati quantici correlati, condensati di Bose-Einstein etc.
studied in deeper details, although we spent a lot of time (and money) to investigate such key aspects.
Our studies, very exploratory, were devoted to finding
simple and reliable/reproducible procedures to get these
kinds of structures. Experiments with the selected
material were operated for time as long as possible:
II. SAMPLES PREPARATION (PROCEDURES USED FOR THE EXPERIMENT UP TO MAY 2012, GENERATION ONE
SIMILAR COMPOSITION MATERIALS, TRUE NANOMETRIC, DEVELOPED INDEPENDENTLY IN JAPAN
In our exploratory preparations/tests we used
Initial values of weight (e.g. 307.4mg), diameter (+-and resistance (e.g. 17.16 Ohm) were carefully measured.
We point out that, although very promising (expected) results with pure Constantan, in our explorative test (2-3 days of operations each, time span from February to June 2011) under H2 atmosphere, we NEVER got any type of anomalies (like changing of resistance) on wires with applied temperatures as large as 900°C under the following status:
1. as obtained from the Company (we call them ultra-virgin);
2. with the surface cleaned-up from the enamel protection (enamel completely removed by burning up to 600°C in air) and stress released;
3. Acid etching of wire after burning at 600°C. The wires, point 2), at the beginning, were just
-insulating layer (as provided by Isabellenhutte) by Joule heating, in air, at current as large as 2000mA, time 5m.
Figure 1. Wire surface after enhanced heat treatments, generation one experiments.
In such conditions the power dissipated was about
70W and the resistance ratio, in respect to the reference value (at 100mA of current injected) increased of only 1%, as expected for such kind of material (commercial name is Constantan, i.e. constant resistance). After first thermal treatment, the weight decreased of about 13mg, the resistance decreased from 17.16 to 17.02 Ohm.
We found that increasing both the current (up to 2500-
3000mA) and the time at high power (5-1000s), decreasing the cooling speed (from 100s down to <1s)
had dramatic effects on the growing of nano-
microstructures and their dimensions (see F ig. 1, as
example). The role of O2, because free air treatment, is
quite important. The wire temperature, in some tests, was
even larger than 1000°C (rough evaluation by colour
temperature; the melting points of pure Cu is 1083°C , of constantan about 1200°C in inert gas).
The quality of wire produced by this method was
evaluated by SEM observations. According to us, as smaller were the particles at the surface and larger the total fraction in respect to the whole wire (i.e. the core), as better was the procedure of preparation.
the end of July 2011, using thermal treatments were put in our (high resolution) flow calorimeter.
As previously noted, such material was extensively studied, both in H2 and D2 atmosphere using a very accurate flow calorimeter (indetermination <2%). The total times of experiments were really long (over 10 months) and only at the end the damages were so heavy to prevent further reliable interpretation of the experimental results. They were discussed, very deeply,
on last April 2012 [Ref. 2]. We were very happy to know that also Akito Takahashi
and Akira Kitamura (and Colleagues), respectively from Osaka and Kobe University (Japan), studied in secret (like us), an alloy of Ni-Cu (at true nanometric size, i.e. 5-20nm) dispersed in an inert matrix of ZrO2. Such work was performed among collaboration with the Research Group of a Toyota Company (Technova). We got some information, by A. Takahashi and A. Kitamura, since January 2012, about promising results by a specific (Ni85-Cu15)35%-(ZrO2)65% alloy [Ref. 4].
We recall that such material is a further development of the nanomaterial Pd_35%-ZrO2_65% developed by Yoshiaki Arata (Osaka Univ., Japan) since 2005.
-Cu-ZrO2 came because I was invited to give a Review talk, on Anomalous E ffects in LENR Studies, at the WSEC2012 Conference (World Sustainable Energy Conference 2012) organized by the ISEO (International Sustainable Energy Organization). The ISEO is an ONG linked to several not-connected to United Nations at Geneva. Obviously, I requested that everybody involved in LENR studies, worldwide, communicate the most recent and interesting results to include in my Review. A similar talk, with even more technical/scientific details, was given even at CERN (Geneva) on March 22, 2012 in the framework of the (prestigious) CERN Colloquium. Under my specific request, it was added also a talk (by Y. Srivastava, Univ. Perugia, Italy) related to overview of theories in LENR.
The overall behaviours of Ni-Cu alloys although at different ratios of two main elements, in respect to H2 and D2 absorption, and the amount of anomalous heat
Electron screening
A. Huke et al., PR C 78, 015803, 2008
calorimetria
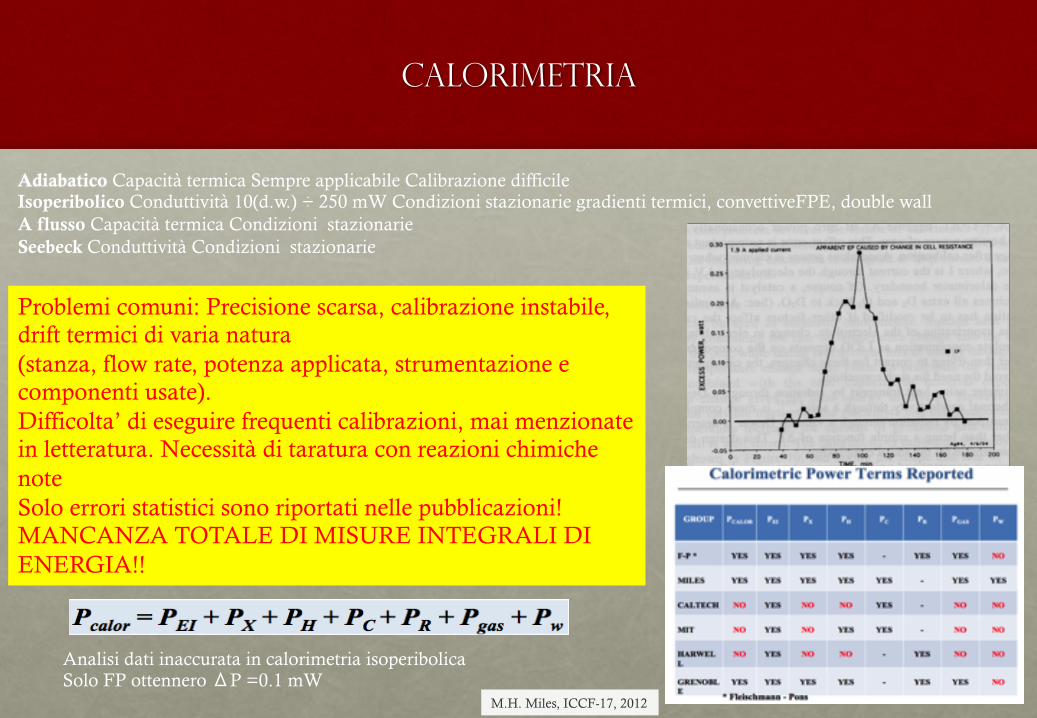
Problemi comuni: Precisione scarsa, calibrazione instabile, drift termici di varia natura (stanza, flow rate, potenza applicata, strumentazione e componenti usate). Difficolta’ di eseguire frequenti calibrazioni, mai menzionate in letteratura. Necessità di taratura con reazioni chimiche note Solo errori statistici sono riportati nelle pubblicazioni! MANCANZA TOTALE DI MISURE INTEGRALI DI ENERGIA!!
Adiabatico Capacità termica Sempre applicabile Calibrazione difficile Isoperibolico Conduttività 10(d.w.) ÷ 250 mW Condizioni stazionarie gradienti termici, convettiveFPE, double wall A flusso Capacità termica Condizioni stazionarie Seebeck Conduttività Condizioni stazionarie
Analisi dati inaccurata in calorimetria isoperibolica Solo FP ottennero ΔP =0.1 mW
M.H. Miles, ICCF-17, 2012
I tratti comuni
• (Ir)riproducibilità
• (In)stabilità
• (In)accuratezza: solo errori statistici sono riportati nelle pubblicazioni e non sempre!
• Assenza di un rationale teorico e di un goal sperimentale
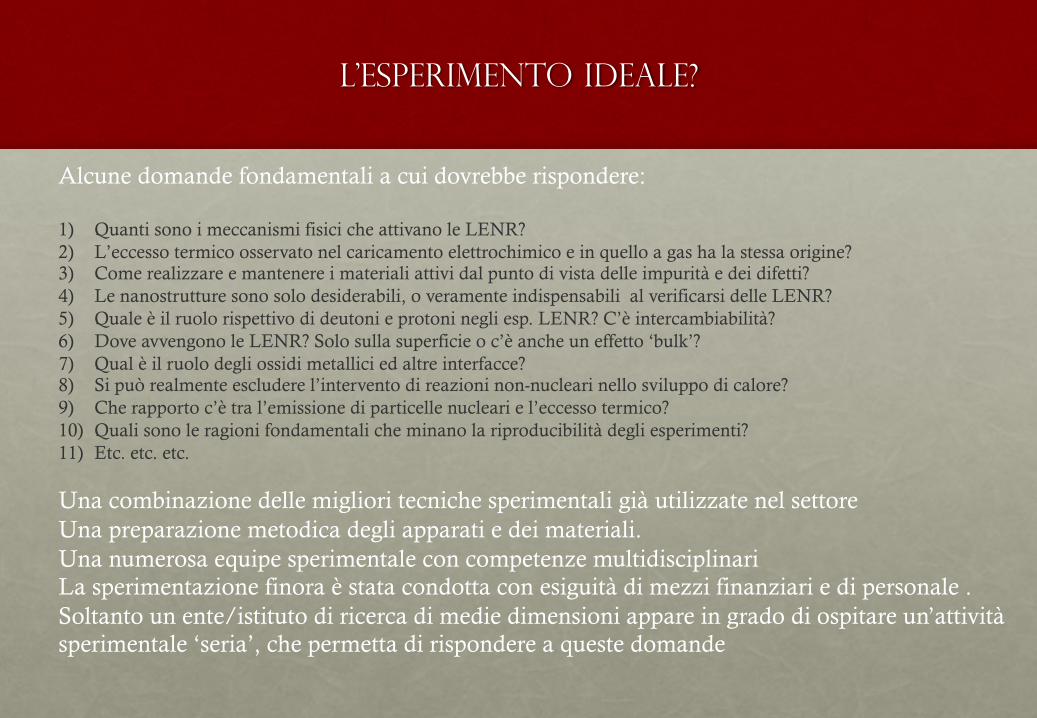
L’esperimento ideale?
Alcune domande fondamentali a cui dovrebbe rispondere: 1) Quanti sono i meccanismi fisici che attivano le LENR? 2) L’eccesso termico osservato nel caricamento elettrochimico e in quello a gas ha la stessa origine? 3) Come realizzare e mantenere i materiali attivi dal punto di vista delle impurità e dei difetti? 4) Le nanostrutture sono solo desiderabili, o veramente indispensabili al verificarsi delle LENR? 5) Quale è il ruolo rispettivo di deutoni e protoni negli esp. LENR? C’è intercambiabilità? 6) Dove avvengono le LENR? Solo sulla superficie o c’è anche un effetto ‘bulk’? 7) Qual è il ruolo degli ossidi metallici ed altre interfacce? 8) Si può realmente escludere l’intervento di reazioni non-nucleari nello sviluppo di calore? 9) Che rapporto c’è tra l’emissione di particelle nucleari e l’eccesso termico? 10) Quali sono le ragioni fondamentali che minano la riproducibilità degli esperimenti? 11) Etc. etc. etc.
Una combinazione delle migliori tecniche sperimentali già utilizzate nel settore Una preparazione metodica degli apparati e dei materiali. Una numerosa equipe sperimentale con competenze multidisciplinari La sperimentazione finora è stata condotta con esiguità di mezzi finanziari e di personale . Soltanto un ente/istituto di ricerca di medie dimensioni appare in grado di ospitare un’attività sperimentale ‘seria’, che permetta di rispondere a queste domande
Grazie dell’attenzione! [email protected] [email protected]