
SCIENZE DEGLI ALIMENTI, NUTRIZIONE ANIMALE E...
178
Alma Mater Studiorum – Università di Bologna DOTTORATO DI RICERCA IN SCIENZE DEGLI ALIMENTI, NUTRIZIONE ANIMALE E SICUREZZA ALIMENTARE - SANASA Ciclo XXIV Settore Concorsuale di afferenza: 07/H2 Settore Scientifico Disciplinare: VET/04 PERFLUOROALKYLATED SUBSTANCES IN FOOD MATRICES: DEVELOPMENT OF MASS SPECTROMETRY BASED ANALYTICAL METHODS AND PRELIMINARY MONITORING Presentata da: Dott. Andrea Barbarossa Coordinatore Dottorato Relatore Prof. Roberto Rosmini Prof. Giampiero Pagliuca Esame finale anno 2012
-
Upload
vuongtuong -
Category
Documents
-
view
219 -
download
1
Transcript of SCIENZE DEGLI ALIMENTI, NUTRIZIONE ANIMALE E...

Alma Mater Studiorum – Università di Bologna
DOTTORATO DI RICERCA IN
SCIENZE DEGLI ALIMENTI, NUTRIZIONE ANIMALE E SICUREZZA ALIMENTARE - SANASA
Ciclo XXIV
Settore Concorsuale di afferenza: 07/H2
Settore Scientifico Disciplinare: VET/04
PERFLUOROALKYLATED SUBSTANCES IN FOOD MATRICES: DEVELOPMENT OF MASS SPECTROMETRY BASED
ANALYTICAL METHODS AND PRELIMINARY MONITORING
Presentata da: Dott. Andrea Barbarossa Coordinatore Dottorato Relatore Prof. Roberto Rosmini Prof. Giampiero Pagliuca
Esame finale anno 2012


Ci tengo ad esprimere tutta la mia riconoscenza al Prof. Giampiero Pagliuca, per aver
riposto fiducia in me dandomi la possibilità di lavorare presso il laboratorio CABA-Lab in
questi tre anni, coinvolgendomi in tutte le attività e rendendo possibile la positiva
esperienza che si è dimostrata essere questo progetto di ricerca, durante il quale mi ha
costantemente seguito, consigliato e supportato.
Voglio anche esprimere la mia gratitudine alle Dott.sse Teresa Gazzotti ed Elisa Zironi,
sempre pronte ad ascoltarmi, confrontarsi con me su ogni questione ed aiutarmi, molto
più che semplici colleghe del CABA-Lab.
Je tiens à remercier très sincèrement Monsieur Bruno Le Bizec, pour m’avoir accueilli au
sein du laboratoire LABERCA et m’avoir donné l’opportunité de vivre une expérience
très intéressante, qui m’a permis de m’enrichir d’un point de vue professionnel ainsi
que humain.
Je tiens à exprimer ma reconnaissance à Messieurs Jean-Philippe Antignac et Bruno
Veyrand, pour m’avoir suivi tout au long de la partie française du projet, tout en étant
toujours très disponibles pour me conseiller et me donner le support nécessaire.
Je remercie également l’ensemble du personnel du LABERCA, en particulier Mlle
Frédérique Courant, M. Fabrice Monteau, Mme Emmanuelle Bichon, M. Ronan Cariou et
Mme Florance Radmin, ainsi que Mlle Hanane Kadar pour leur collaboration, disponibilité
et professionnalité.
Je tiens finalement à remercier MM. Sébastien Anizan, Vincent Vacher, Sylvain
Chereau, Charles Pollono, Zied Kaabia et Marc Bourgin pour leur amitié et pour le
babyfoot de la pause-déjeuner.


I
Contents
Appendix
List of abbreviations
1 Introduction ………………………………………………………………………………………………..… 1
1.1 Perfluorinated compounds ………………………………………………………………………....... 3
1.1.1 Chemical identity ……………………………………………………………………………………. 3
1.1.2 Production ……………………………………………………………………………………………… 7
1.1.3 Applications ……………………………………………………………………………………………. 9
1.1.4 Occurrence …………………………………………………………………………………………….. 11
1.2 Exposure ………………..….…………………………………………………………………………………… 20
1.2.1 Food sources ………..………………………………………………………………………………… 21
1.2.2 Non-food sources …………………………………………………………………………………… 34
1.2.3 Occurrence in humans .…………………………………………………………………………… 41
1.3 Toxicity …………………………………………………………………………………………………………… 47
1.3.1 Toxicokinetics …….…………………………………………………………………………………… 49
1.3.1.1 PFOS …….…….…………………………………………………………………………………… 49
1.3.1.2 PFOA …………………….….…………………………………………………………………….. 50
1.3.2 Mechanism of action …….………………………………………………………………………… 52
1.3.3 Toxicity of PFOS …….…………..…………………………………………………………………… 53
1.3.3.1 Effects on animals …...……………………………………………………………………… 53
1.3.3.2 Effects on humans ……………………………………....…………………………………. 55
1.3.4 Toxicity of PFOA ……….……..……………………………………………………………………… 57
1.3.4.1 Effects on animals …...……………………………………………………………………… 57
1.3.4.2 Effects on humans .…...……………………………………………………………………… 59
1.3.5 Other PFCs and precursors toxicity ……….………………………………………………… 60
1.4 Legislation ……………………………………………………………………………………………………… 61
1.5 Methods of analysis ……………..…………………………………………………………………………. 64
1.5.1 PFCs determination in milk .……………………………………………………………………. 67
1.5.1 Analysis of PFCs volatile precursors ……..…………………………………………………. 69
2 Objectives of the experiment ………………………………………………………………………... 71

II
3 Material and methods …………………………………………..………………………………………. 73
3.1 PFCs analysis at LABERCA …………………………………………………………………….…......… 73
3.1.1 Material …………………………………………………………………………………………………. 74
3.1.2 Equipment ……………………………………………….…………………………………………….. 77
3.1.3 Instrumental conditions …………………………………….…………………………………... 78
3.1.4 Extraction procedure ……………………………………………………………………………… 82
3.1.5 Method validation ………………………………………………………………………………….. 84
3.1.6 Samples quantification …………………………………………………………………………... 88
3.2 PFCs analysis at CABA-Lab ……………………………………………….…………………………….. 89
3.2.1 Material …………………………………………………………………………………………………. 89
3.2.2 Equipment …….………………………………………………………….……………………………. 93
3.2.3 Instrumental conditions ……………………………………………………………………….... 94
3.2.4 Extraction procedure ….………………………………………………………………………….. 95
3.2.5 Performances of the transferred method ………..…………………………………….. 96
3.2.6 Samples quantification ……….………………………………………………………………….. 96
3.3 PFCs precursors analysis at LABERCA ……..……………………………….…….………………. 97
3.3.1 Material …………………………………………………………………………………………………. 98
3.3.2 Equipment ………………………………………………………………………………….………….. 99
3.3.3 Instrumental conditions …………………………………………………………………………. 100
3.3.4 Extraction procedure ….……………………………………………………………………….…. 101
3.3.5 Performances of the method ……………………………………………………………….... 103
4 Results and discussion …………………………………………………………………………………... 105
4.1 PFCs analysis at LABERCA ………………………………………………………………………………. 105
4.1.1 Instrumental analysis ….……….……….………………………………………………………… 105
4.1.2 Extraction procedure ….………………………………………………………………………….. 111
4.1.3 Method validation ………………………………………………………………………………….. 112
4.1.4 Samples analysis ………………………………….…………………………………………………. 122
4.1.4.1 Human breast milk from France …..…………………………………………………. 123
4.1.4.2 Cow milk from France …….…..…….……………………………………………………. 123
4.1.4.3 Powder milk from France ………………………………………………………………... 124
4.2 PFCs analysis at CABA-Lab ……..………………………………………………………………………. 125
4.2.1 Method transfer ……………………………….……………………………………………………. 125
4.2.1.1 Instrumental analysis ………….…….……………………………………………………. 125
4.2.1.2 Extraction procedure ……….………………………..……………………………………. 126
4.2.1.3 Performances of the transferred method …..……………………………………. 126
4.2.2 Samples analysis ……….……………………………………………………………………………. 128
4.2.2.1 Human breast milk from Italy …………………………………………………………. 129

III
4.2.2.2 Cow milk from Italy ……………..…….……………………………………………………. 131
4.3 Data interpretation ………..…….…………………….…………………………………………………. 132
4.3.1 Human breast milk ………………..………….……………………………………………………. 132
4.3.2 Cow milk ……………….………………………….……………………………………………………. 136
4.3.3 Powder milk …………….……………………….……………………………………………………. 137
4.4 PFCs precursors analysis at LABERCA ……….……………………………………………………. 139
4.4.1 Instrumental analysis ………………….…….……………………………………………………. 139
4.4.2 Optimization of the extraction procedure ………………………………………………. 142
4.4.3 Performances of the method …………………………………………………………………. 143
5 Conclusions ……………………………………………………………………………………………..……. 147
Bibliography ……………………………………………………………………………………………………… 149
Appendix
The following scientific publications derived from the work presented in this thesis:
Veyrand B, Kadar H, Barbarossa A, Durand S, Marchand P, Antignac JP, Pagliuca G, Le Bizec B “Compared analytical development and validation based on liquid chromatography coupled to tandem or high resolution mass spectrometry for measuring perfluorinated compounds in milk” Organohalogen Compounds (2010), 72, 968-971
Kadar H, Veyrand B, Barbarossa A, Pagliuca G, Legrand A, Bosher C, Boquien CY, Durand S, Monteau F, Antignac JP, Le Bizec B “Development of analytical strategy on liquid chromatography-high resolution mass spectrometry for measuring perfluorinated compounds in human breast milk: Application to the generation of preliminary data regarding perinatal exposure in France” Chemosphere (2011), 85 (3), 473-480
Pollono C, Veyrand B, Barbarossa A, Durand S, Marchand P, Antignac JP, Pagliuca G, Le Bizec B “Analysis of perfluoroalkyl precursors in fish samples: challenge and first application” Organohalogen Compounds, in press
Barbarossa A, Masetti R, Gazzotti T, Biagi C, Astolfi A, Veyrand B, Pagliuca G, Pession A “Perfluorooctane sulfonate (PFOS) and perfluorooctanoic acid (PFOA) in human breast milk: results of an Italian study” Journal of Pediatrics, submitted manuscript
During the three years as PhD student, Dr. Barbarossa took part in several other
research projects, which led to these scientific publications:
Lugoboni B, Gazzotti T, Zironi E, Barbarossa A, Piva A, Pagliuca G “Dati preliminari sulla presenza di Fumonisine in fegato suino” Rivista dell’Associazione Italiana Veterinari Igienisti, vol 6.4, 33-36 (2009)
Gazzotti T, Lugoboni B, Zironi E, Barbarossa A, Serraino A, Pagliuca G “Determination of fumonisin B1 in bovine milk by LC-MS/MS” Food Control (2009), 20 (12), 1171-1174
Gazzotti T, Zironi E, Lugoboni B, Barbarossa A, Piva A, Pagliuca G “Analysis of fumonisins B1, B2 and their hydrolysed metabolites in pig liver by LC–MS/MS” Food Chemistry (2011), 125 (4), 1379-1384
Zironi E, Gazzotti T, Lugoboni B, Barbarossa A, Pagliuca G “Development of a rapid LC–MS/MS method for ribavirin determination in rat brain” Journal of Pharmaceutical and Biomedical Analysis (2011), 54 (4), 889-892
Lugoboni B, Gazzotti T, Zironi E, Barbarossa A, Pagliuca G “Development and validation of a liquid chromatography/tandem mass spectrometry method for quantitative determination of amoxicillin in bovine muscle” Journal of Chromatography B (2011), 879 (21), 1980-1986
Lugoboni B, Barbarossa A, Gazzotti T, Zironi E, Pagliuca G “Development and validation of a liquid chromatography/tandem mass spectrometry method for quantitative determination of flunixin in bovine muscle” Manuscript
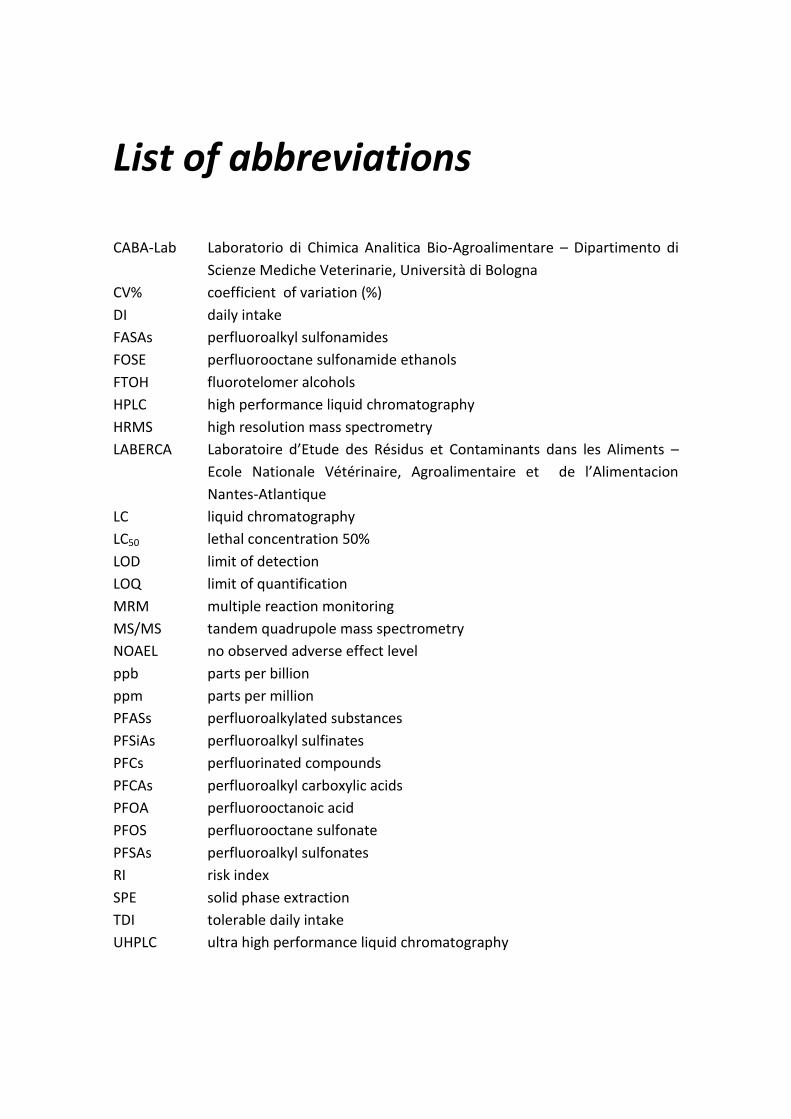
List of abbreviations
CABA-Lab Laboratorio di Chimica Analitica Bio-Agroalimentare – Dipartimento di
Scienze Mediche Veterinarie, Università di Bologna
CV% coefficient of variation (%)
DI daily intake
FASAs perfluoroalkyl sulfonamides
FOSE perfluorooctane sulfonamide ethanols
FTOH fluorotelomer alcohols
HPLC high performance liquid chromatography
HRMS high resolution mass spectrometry
LABERCA Laboratoire d’Etude des Résidus et Contaminants dans les Aliments –
Ecole Nationale Vétérinaire, Agroalimentaire et de l’Alimentacion
Nantes-Atlantique
LC liquid chromatography
LC50 lethal concentration 50%
LOD limit of detection
LOQ limit of quantification
MRM multiple reaction monitoring
MS/MS tandem quadrupole mass spectrometry
NOAEL no observed adverse effect level
ppb parts per billion
ppm parts per million
PFASs perfluoroalkylated substances
PFSiAs perfluoroalkyl sulfinates
PFCs perfluorinated compounds
PFCAs perfluoroalkyl carboxylic acids
PFOA perfluorooctanoic acid
PFOS perfluorooctane sulfonate
PFSAs perfluoroalkyl sulfonates
RI risk index
SPE solid phase extraction
TDI tolerable daily intake
UHPLC ultra high performance liquid chromatography

1
1. Introduction
Perfluoroalkylated substances (PFASs) is the name of a vast and complex group of
compounds consisting of a hydrophobic alkyl chain, whose length varies from C4 to
C16, and a hydrophilic end group.
The hydrophobic part may be partially or fully fluorinated: if fully fluorinated, meaning
that all hydrogen atoms have been replaced by fluorine atoms, molecules are called
perfluorinated compounds (PFCs) (EFSA, 2011).
Depending on the charge of the hydrophilic group, which can be neutral, or negatively
or positively charged, these amphiphilic compounds are non-ionic, anionic or cationic
surface active agents.
PFASs manufacturing is mainly based on two processes, electrochemical fluorination
and telomerisation, the latter becoming the most employed after the announcement
by the major world producer of the termination of electrochemical fluorination
production process by 2002 (EFSA, 2008).
The beginning of PFASs manufacturing dates back to the late 40s and from then on
these molecules have been used in a wide range of industrial and commercial
applications due to their chemical and physical properties. In fact, the chemical and
thermal stability given to the perfluoroalkyl moiety by carbon-fluorine bounds,
together with its hydrophobic and lipophobic nature, give these compounds useful and
enduring features. Examples of their applicability include packaging, fire-fighting
foams, insecticide formulations, impregnation agents for textiles, cleaning agents and
floor polishes (EFSA, 2008; Buck et al., 2011).
The extensive use of PFASs led to their wide distribution into the environment,
including animals and humans, as substances of anthropogenic origin. They hardly
exist in nature: monofluorinated compounds can be produced by some moulds, as well
as various perfluorinated compounds can be originated during some geochemical
processes (such as volcanic activities), but in negligible amounts.

2
These contaminants have been detected in several environmental matrices, even in
regions without anthropogenic activities as the arctic environment, due to the global
ocean and atmospheric circulation (Butt et al., 2010; Schiavone et al., 2009).
Because of their amphiphilic properties, PFASs don’t accumulate in fatty tissues, as
other persistent halogenated compounds, but rather bind to proteins. They
accumulate in the food chain and have been frequently found in human and plasma:
diet is considered the main exposure route for the population, especially through
seafood consumption, but also exposure via drinking water and inhalation must be
taken into account.
The effects of these substances on human health haven’t been fully ascertained yet,
but the increasing interest of the scientific community for these emerging
contaminants during the last ten years led to important discoveries on their toxic
potential. Several animal studies proved that PFASs can be related to a wide range of
pathologies in the exposed organisms, such as hepatotoxicity, developmental toxicity,
neurobehavioral toxicity, immunotoxicity, reproductive toxicity, lung toxicity and
hormonal effects (EFSA, 2011).
An important subset of PFASs is constituted by the perfluorinated organic surfactants,
to which perfluorooctanoic acid (PFOA) and perfluorooctane sulfonate (PFOS) belong.
Due to their large employment, these two compounds are the most investigated
PFASs, and their salts and precursors have been found in the environment, fish, birds
and mammals. Furthermore, PFOS was recently added to the Stockholm Convention
list of persistent organic pollutants.
The concern about potential PFASs impact on environmental and human health has led
various authorities all over the world to launch research programs to better
understand their fate in the environment and to evaluate their presence in food,
collecting useful data for an accurate estimation of human exposure.
3
1.1 Perfluorinated compounds (PFCs)
1.1.1 Chemical identity
Perfluorinated compounds are PFASs presenting a fully fluorinated carbon chain; this
can be linear or branched and its length generally varies between 4 and 16 carbon
atoms.
The hydrophilic part can give the molecule negative, positive or neutral charge. Anionic
end groups are, for example, the carboxylates (-COO-, including PFOA), the sulfonates
(-SO3-, to which PFOS belongs) and the phosphates (-OPO3
-). Many among the neutral
PFASs (thus considering not only perfluorinated but also partially fluorinated
compounds) can be potential precursors of PFOA, for example 8:2 fluorotelomer
alcohol, or PFOS, for example perfluorooctane sulfonamide and perfluorooctane
sulfonamido ethanols.
Due to the high energy of the covalent carbon-fluorine bonds, PFCs are resistant to
hydrolysis, photolysis and biological degradation; they are hardly metabolized,
polymers can eventually degrade to lower molecular weight PFCs, such as PFOS (EFSA,
2008; Buck et al., 2011).
Since the names of perfluorinated compounds are quite long and complex, it is
common to refer to them with abbreviations, deriving from the chemical structure of
the molecule:
- type of molecule (“PF”, which stands for “PerFluoro”)
- number of fluorinated carbons (e.g. “O” when chain is made of 8 carbon atoms)
- hydrophilic end group (e.g. “A” for carboxylic acid, or “S” for sulfonate)
So, “PerFluoroOctanoic Acid” is also known as “PFOA” and “PerFluoroOctane
Sulfonate” is rather called “PFOS”.
As previously described, PFOA and PFOS are the most important and widespread PFCs
and the final degradation products of most of fluorinated compounds: for this reason
this chapter will be focused mainly on these two molecules.

4
PFOA
Molecular formula: C8HF15O2
It’s a completely fluorinated organic acid, constituted by an eight carbons alkyl chain
and a carboxylate group (see Figure 1.1).
Figure 1.1 PFOA, perfluorooctanoic acid
In water, the free acid dissociates almost completely, while the perfluoroalkyl chain
remains on the surface and the anionic carboxylate in the water; PFOA molecules are
reported to associate on the water surface partitioning between the air/water
interface (US EPA, 2005).
Some studies also reported water solubility for PFOA, but it’s unclear whether it’s due
to a microdispersion of micelles rather than true solubility (3M, 2003a).
According to Prevedouros et al., the dissociated acid (PFO) has negligible vapor
pressure, high solubility in water and moderate sorption to solids, thus being expected
to accumulate in surface waters.
PFOA presence in the environment can derive directly from its production and use, or
indirectly from degradation of related compounds: the transformation pathways
include biodegradation, reaction with OHx, ozonolysis (EFSA, 2008).
Property Value
Appearance at normal P and T° White powder / waxy white solid
Molecular weight 414.07 g/mol
Vapour pressure 0.1 kPa (20 °C)
Water solubility (at 20 °C) 3.4 g/L
Melting point 45-50 °C
Boiling point 189-192 °C
pKa 2.5
Table 1.1 Physical and chemical properties of PFOA
5
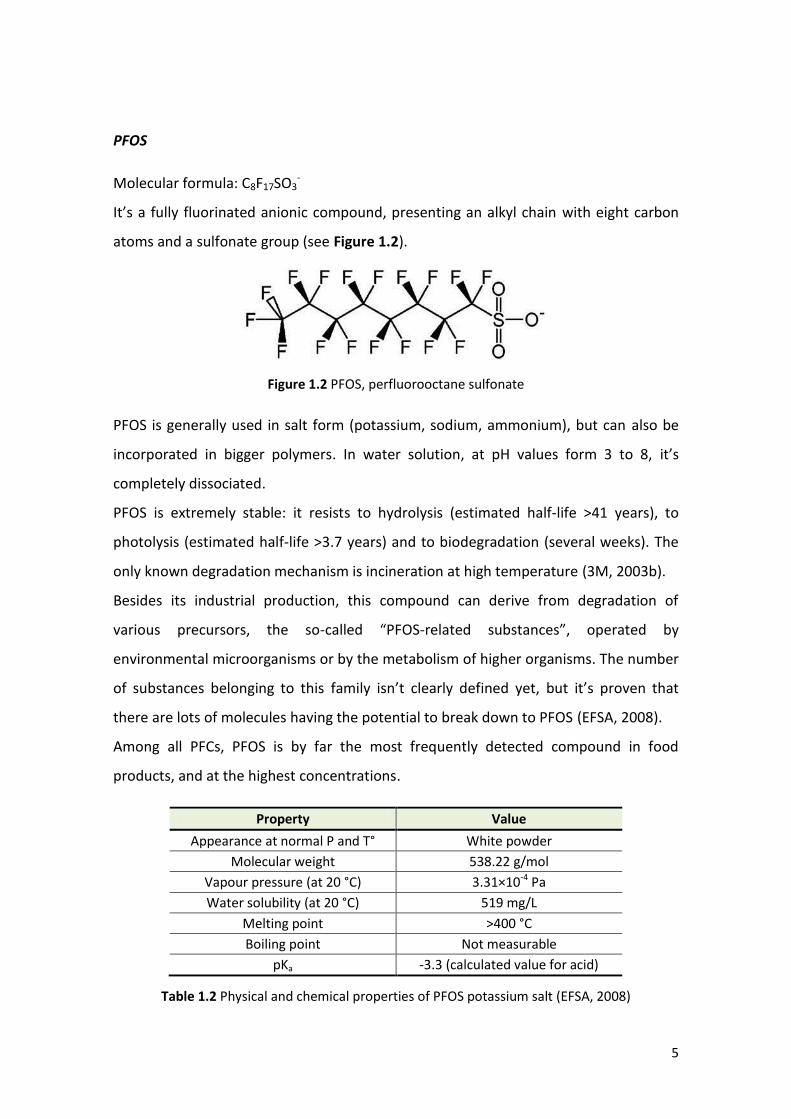
PFOS
Molecular formula: C8F17SO3-
It’s a fully fluorinated anionic compound, presenting an alkyl chain with eight carbon
atoms and a sulfonate group (see Figure 1.2).
Figure 1.2 PFOS, perfluorooctane sulfonate
PFOS is generally used in salt form (potassium, sodium, ammonium), but can also be
incorporated in bigger polymers. In water solution, at pH values form 3 to 8, it’s
completely dissociated.
PFOS is extremely stable: it resists to hydrolysis (estimated half-life >41 years), to
photolysis (estimated half-life >3.7 years) and to biodegradation (several weeks). The
only known degradation mechanism is incineration at high temperature (3M, 2003b).
Besides its industrial production, this compound can derive from degradation of
various precursors, the so-called “PFOS-related substances”, operated by
environmental microorganisms or by the metabolism of higher organisms. The number
of substances belonging to this family isn’t clearly defined yet, but it’s proven that
there are lots of molecules having the potential to break down to PFOS (EFSA, 2008).
Among all PFCs, PFOS is by far the most frequently detected compound in food
products, and at the highest concentrations.
Property Value
Appearance at normal P and T° White powder
Molecular weight 538.22 g/mol
Vapour pressure (at 20 °C) 3.31×10⁻⁴ Pa
Water solubility (at 20 °C) 519 mg/L
Melting point >400 °C
Boiling point Not measurable
pKa -3.3 (calculated value for acid)
Table 1.2 Physical and chemical properties of PFOS potassium salt (EFSA, 2008)

6
PFCs precursors
Since perfluorinated compounds presence in food has become of public concern,
increasing attention is being given also to their precursors, as Recommendation
2010/161/EU demonstrates. With this document, issued on March 17 2010, the
European Commission expresses the need to investigate also compounds like
perfluorooctane sulfonamide (FOSA), N-ethyl perfluorooctane sulfonamido ethanol
(N-EtFOSE) and 8:2 fluorotelomer alcohol (FOET).
FOSA (perfluorooctane sulfonamide)
Molecular formula: C8F17S02NH2; Molecular weight: 499.15
FOSA can enter the environment both being synthesized and as a metabolic by-
product of perfluorooctane sulfonamido ethanols (Lehmler, 2005).
Oxidation of FOSA can result in the formation of PFOS.
FOSEs (perfluorooctane sulfonamido ethanols)
The end group bound to the nitrogen atom can be a methyl or an ethyl, thus giving:
N-MeFOSE (N-Methylperfluorooctane sulfonamido ethanol)
Molecular formula: C8F17S02N(CH3)CH2CH2OH; Molecular weight: 557.23
N-EtFOSE (N-Ethylperfluorooctane sulfonamido ethanol):
Molecular formula: C8F17S02N(CH2CH3)CH2CH2OH; Molecular weight: 571.25
PFOS is the final product of FOSEs degradation.
Figure 1.3 N-EtFOSE can degrade to FOSA, and then to PFOS
FOSA
N-EtFOSE
PFOS
7
FTOHs (fluorotelomer alcohols)
They are fluorotelomers presenting an alcohol functional group.
Depending on the length of the fluorinated carbon chain, the resulting compounds
can be, for example:
FHET (6:2 fluorotelomer alcohol, also called Perfuorohexyl ethanol)
Molecular formula: C6F13CH2CH2OH; Molecular weight 364.11
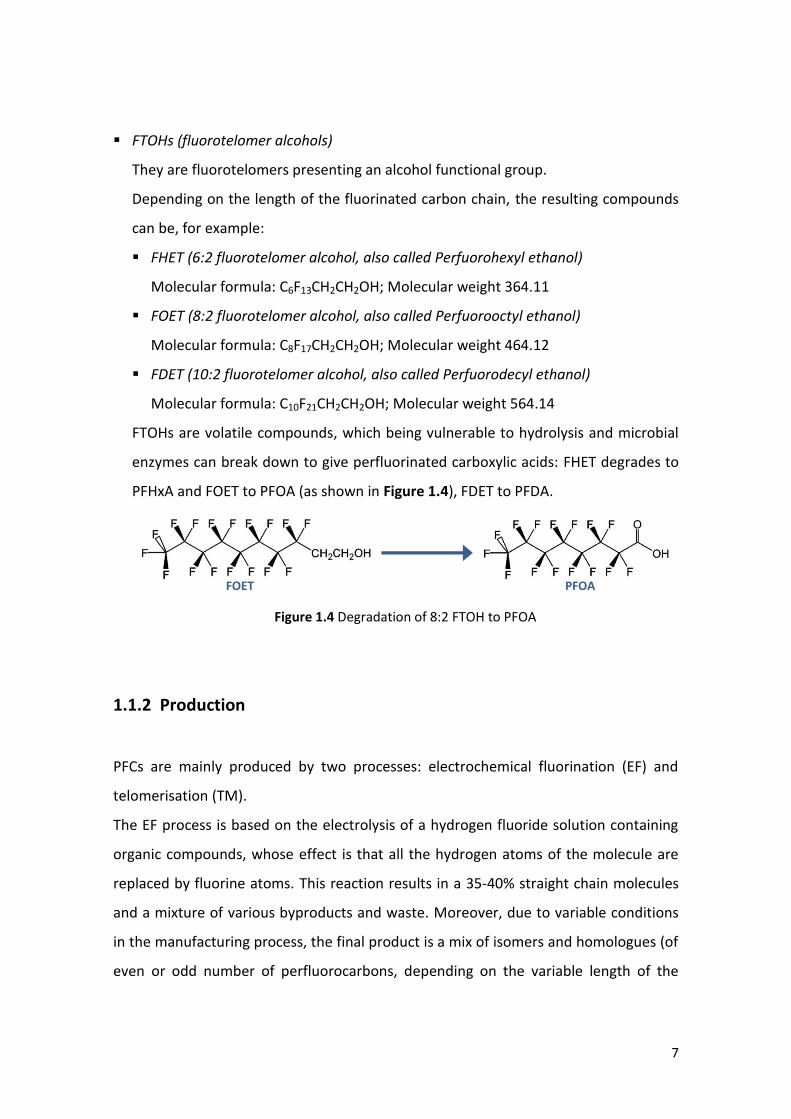
FOET (8:2 fluorotelomer alcohol, also called Perfuorooctyl ethanol)
Molecular formula: C8F17CH2CH2OH; Molecular weight 464.12
FDET (10:2 fluorotelomer alcohol, also called Perfuorodecyl ethanol)
Molecular formula: C10F21CH2CH2OH; Molecular weight 564.14
FTOHs are volatile compounds, which being vulnerable to hydrolysis and microbial
enzymes can break down to give perfluorinated carboxylic acids: FHET degrades to
PFHxA and FOET to PFOA (as shown in Figure 1.4), FDET to PFDA.
Figure 1.4 Degradation of 8:2 FTOH to PFOA
1.1.2 Production
PFCs are mainly produced by two processes: electrochemical fluorination (EF) and
telomerisation (TM).
The EF process is based on the electrolysis of a hydrogen fluoride solution containing
organic compounds, whose effect is that all the hydrogen atoms of the molecule are
replaced by fluorine atoms. This reaction results in a 35-40% straight chain molecules
and a mixture of various byproducts and waste. Moreover, due to variable conditions
in the manufacturing process, the final product is a mix of isomers and homologues (of
even or odd number of perfluorocarbons, depending on the variable length of the
FOET PFOA

8
initial compound’s chain), consisting of approximately 70% linear and 30% branched
molecules (3M, 1999; Brooke et al., 2004).
PFOS production is based on EF process (see Figure 1.5): octanesulfonyl fluoride reacts
giving perfluorooctanesulfonyl fluoride (POSF), which is the intermediate product in
the synthesis of PFOS and two PFOS-related substances, FOSA and N-EtFOSE (EFSA,
2008).
Figure 1.5 Electrochemical fluorination process
Similarly, electrochemical fluorination was employed also in PFOA manufacturing,
mainly in the ammonium salt form. The process yields to a mixture of four to nine long
carbon chains including linear and branched isomers (Prevedouros et al., 2006).
Introduced in the late 40’s, EF has been widely employed during the following decades
for the synthesis of perfluorinated compounds, also thanks to its low costs;
nevertheless, the major world producers using this technique recently announced its
termination, thus making telomerisation the main alternative.
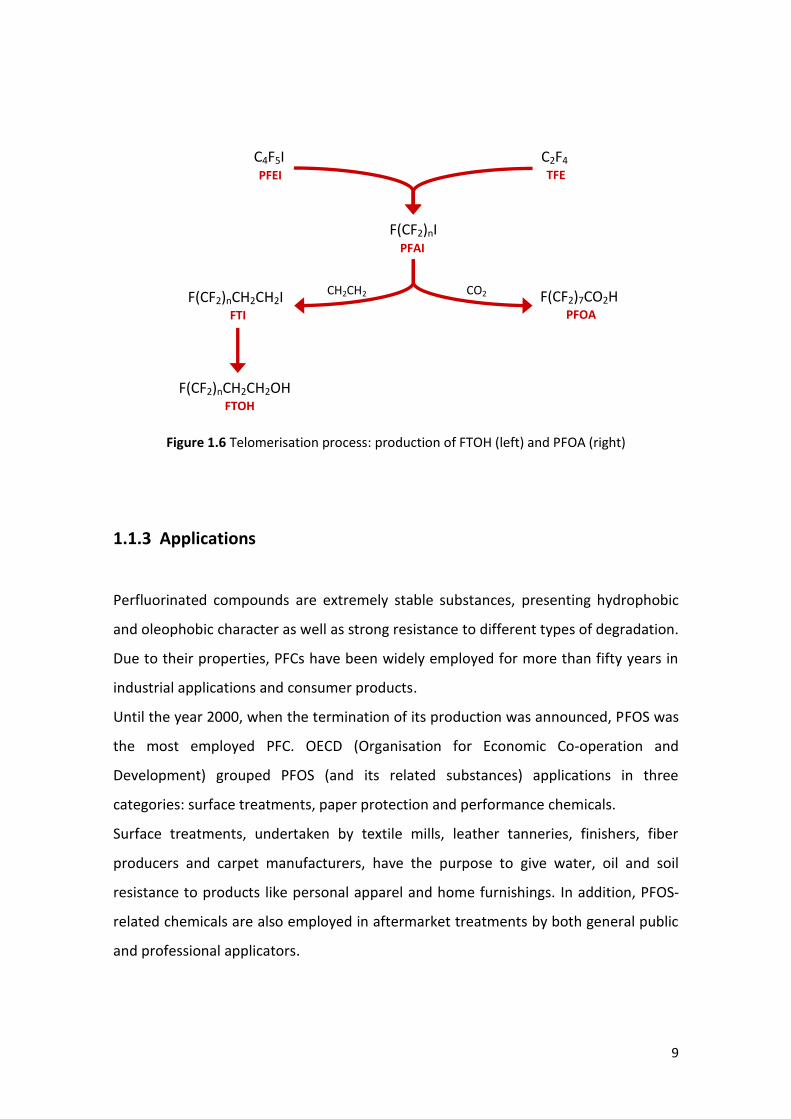
Telomerisation is a process based on the reaction between tetrafluoroethylene (TFE)
and iodine pentafluoroethyl iodide (PFEI), which produces perfluoroalkyl iodide (PFAI).
This is often further reacted with the insertion of an ethylene, giving fluorotelomer
iodide (FTI), which is characterized by a linear and even numbered chain. PFAI and FTI
are intermediate products in the synthesis of fluorotelomer-based surfactants and
polymers (Buck et al., 2011) (see Figure 1.6).
As far as PFOS and PFOA are concerned, this process can be only applied for the
synthesis of the latter, but the advantage in comparison with EF is that the high purity
of the starting material results in extremely pure (≥99%) linear PFOA (EFSA, 2008).
POSF
PFOS N-EtFOSE FOSA
C8H17SO2F
C8F17SO2F
C8F17SO2NH2 C8F17SO2N(Et)CH2CH2OH
e-, HF
C8F17SO3X
9
Figure 1.6 Telomerisation process: production of FTOH (left) and PFOA (right)
1.1.3 Applications
Perfluorinated compounds are extremely stable substances, presenting hydrophobic
and oleophobic character as well as strong resistance to different types of degradation.
Due to their properties, PFCs have been widely employed for more than fifty years in
industrial applications and consumer products.
Until the year 2000, when the termination of its production was announced, PFOS was
the most employed PFC. OECD (Organisation for Economic Co-operation and
Development) grouped PFOS (and its related substances) applications in three
categories: surface treatments, paper protection and performance chemicals.
Surface treatments, undertaken by textile mills, leather tanneries, finishers, fiber
producers and carpet manufacturers, have the purpose to give water, oil and soil
resistance to products like personal apparel and home furnishings. In addition, PFOS-
related chemicals are also employed in aftermarket treatments by both general public
and professional applicators.
TFE
C2F4
FTOH
F(CF2)nCH2CH2OH
PFOA
F(CF2)7CO2H
CH2CH2
CO2
FTI
PFEI
PFAI
C4F5I
F(CF2)nI
F(CF2)nCH2CH2I

10
Concerning paper protection treatments, these chemicals are included in sizing agent
formulations providing grease, water and oil repellency to paper and paperboard,
which are used in food contact products (such as plates, food containers, bags and
wraps) as well as in other applications (like folding cartons, containers, carbonless
forms and masking papers).
The third category includes several PFOS salts that are commercialized as finished
products in a variety of applications, like fire fighting foams, mining and oil well
surfactants, acid mist suppressants for metal plating and electronic etching baths,
photolithography, electronic chemicals, hydraulic fluid additives, alkaline cleaners,
floor polishes, photographic film, denture cleaners, shampoos, chemical intermediates,
coating additives, carpet spot cleaners and insecticides (OECD, 2002).
PFOA has many applications too, mainly as a chemical intermediate. Its ammonium
salt is mainly employed for the emulsion polymerization of fluoropolymers like
polytetrafluoroethylene (PFTE) (whose most known brand name is Teflon) and
ployvinilydene fluoride (PVDF), due to the high surface activity of fluorinated
surfactants (Lehmler, 2005).
PFTE has an extremely low coefficient of friction and is very non-reactive: for these
reasons this molecule is used for several applications, as non-stick coating, lubricant,
water-resistant coatings for fabrics and many more.
Other PFOA applications include its use in the manufacturing of electronic
components, as extraction agent in ion-pair reversed-phased liquid chromatography,
as additive in oil and moisture resistant paper coatings used for food packaging, (EFSA,
2008; US EPA, 2002).
Concerning some PFCs precursors specific applications, fluorotelomer alcohols are
involved in the production of acrylate polymers and fluorosurfactants, while FOSA was
mainly used as a key ingredient in the original 3M’s Scotchgard formulation. FOSA was
also extensively employed for its water and oil repellent properties, as well as
N-MeFOSE, mainly used on carpets and textiles, and N-EtFOSE, mainly used on paper
(Boulanger et al., 2005; Martin et al., 2009; Rhoads et al., 2008).
11
1.1.4 Occurrence
During the second half of 20th century PFCs have been used in an ever larger number
of applications, subsequently their production has continuously increased.
According to OECD, the manufacturing of PFOS and PFOS-related substances (almost
entirely in Europe, United States and Japan) prior to the year 2000 amounted to
around 4500 t per year, of which 50% for surface treatment applications and 30% for
paper protection applications. Few information is available on PFOS production
wastes; however, data collected by 3M on its biggest manufacturing plant (located in
Alabama, USA) were used to make an estimation, expressed as PFOS equivalents (i.e.
the amount of PFOS that could derive from the breakdown of fluorochemical products
and residuals). Considering that about 90% of wastes were in solid form and that two
thirds of this solid matter were disposed through incineration while the remaining
fraction was sent to waste landfills, given an estimated total production of 96000 t
between 1970 and 2002, global wastes were quantified in 26500 t, of which 24500 t
solid, 435-575 t released to air and 230-1450 t to water (Paul et al., 2009).
With regard to PFOA, the estimated global production during the period 1951-2004
was around 3600-5700 t, with a value of 260 t in 1999. The majority of PFOA
production (80-90% in 2000) derived from electronic fluorination process, while the
remaining 10-20% was synthesized from about 1975 to present by telomerisation
(Prevedouros et al., 2006).
At the beginning of the new millennium the major global producer of PFCs (3M
Company) voluntarily decided to stop using the electrochemical fluorination process
by 2002, thus phasing out the production of perfluoroalkyl sulfonate substances.
As a consequence of this decision and of the restrictions laid down by the European
Union, the use of PFOS has significantly decreased and in some areas even ceased,
being replaced by alternative substances providing the same functions or by other
technologies (Brooke et al., 2004). Figure 1.7 shows a comparison between PFOS
equivalents production trends between 1970 and 2002 reported by four different
studies.

12
Figure 1.7 Estimated total global PFOS equivalents production volumes
(Paul et al., 2009)
The termination of the electrochemical fluorination process led also to an increase in
the production of PFOA by telomerisation, with the result that global direct emissions
due to its manufacturing decreased from about 45 t in 1999 to about 15 t in 2004, with
prospect of further reduction in the following years.
However, when talking about emissions to the environment, also indirect sources must
be considered. In fact, in the case of perfluoroalkyl carboxylic acids (PFCAs, to which
PFOA belongs), their presence in the environment is not only a consequence of their
manufacture, use and disposal, but it’s also partly due to the fact that PFCAs impurities
are contained in perfluorooctyl sulfonyl-based products made by EF process, as well as
they can be present at trace levels in fluorotelomer-based products as unintended
reaction by-products. Degradation of these two groups of products and of relative raw
materials is a further potential indirect source of PFCAs in the environment. More in
details, estimated global PFCAs emissions in the year 2000 amounted to around 237 t,
of which 200 consisting of PFOA (Prevedouros et al., 2006).
Degradation of perfluorooctyl sulfonyl-based products is an indirect source for PFOS
too, as well as the synthesis of perfluorooctane sulfonyl fluoride itself. According to
Paul et al., 85% of PFOS indirect emissions are associated to losses during use and
disposal of consumer products, while the remaining 15% results from manufacturing
13
releases during secondary applications, such as start-up and shutdown operations or
losses from production wastes.
The extensive use of perfluorinated compounds caused their global diffusion: PFCs are
present in both urban areas with high population density and industrialization and
regions far from anthropogenic activities, including the Arctic environment. Recent
studies proved the presence of PFOS and PFOA (as well as their salts and precursors) in
water, air and soil in many different geographical areas (Recommendation
161/2010/EU).
These substances can contaminate waters in many ways and virtually everywhere,
thus their presence can involve also waters directed to human consumption: for this
reason monitoring is important in order to prevent potential exposure due to
contaminated drinking water.
Twelve PFCs have been investigated in surface waters collected by Skutlarek et al. from
the rivers Moehne, Ruhr, Rhine and some of their tributaries, in Germany. PFOA was
the compound detected at the highest concentrations, but, depending on the point
where samples had been collected, other components were found as well and at
different concentrations. The sum of the seven most detected PFCs didn’t exceed 100
ng/L for the Rhine river and the lower reaches of the Ruhr river, but levels of
contamination increased significantly in the upper part of the Ruhr and the Moehne
river (which is an affluent of the Ruhr), reaching values of 446 and 4385 ng/L,
respectively. Surveys on the causes of this situation proved that the widespread use of
contaminated organic and inorganic material as fertilizer in various agricultural areas
around the river Moehne was the source of its waters contamination. Also, further
investigations reported high concentrations of PFCs in plasma samples collected from
the local population (Skutlarek et al., 2006).
In light of the above, it’s clear how PFCs presence in the soil can represent a source for
contamination of surface waters. A later program of analysis carried out on 916 field
samples collected in that area indicated levels of contamination between 100 and 500
µg/kg in just 8% of the processed samples, but in two farms (which have been
subsequently sanitized) measured values exceeded 1500 µg/kg. The analysis of 199
14
samples collected in a non-contaminated area (Bavaria, Germany) showed PFOS
concentrations always lower than 10 µg/kg.
In similar circumstances, increased PFOS soil concentrations were reported in Alabama
in a 2007 study. Anyway, data on PFCs presence in soil are lacking to this day,
therefore some Authors suggest the importance of monitoring soil and surface waters
sampled in the same locations, in order to better understand the transfer of these
contaminants (van Asselt et al., 2011).
In a recent study, Awad et al. focused the attention on the long-term persistence of
PFOS following an accidental release of fire fighting foams which happened in 2000 in
the area nearby Toronto airport. They collected samples of sediment, water and fish
from 10 different locations between Etobicoke and Spring Creeks in 2003, 2006 and
2009. Even after ten years, PFOS levels were relevant in Spring Creek, but only in a
confined area, due to Etobicoke’s diluting action and to the pond’s storm water
management nature. In 2003 PFOS concentration in fish samples had decreased by
70%; in 2009 contamination levels had declined by 85% in fish and by >99.99% in
waters collected downstream of Spring Creek. This drop was probably a consequence
of the interruption of PFOS production and of the regulations on the use of this
compound in fire fighting foams, resulting in a reduction of PFOS introduction in the
environment. Anyway, the 2009 levels were 2-10 times higher than values measured in
upstream locations, likely because of both the urbanization and the long-term
consequences of the spill (Awad et al., 2011).
In order to verify the impact of fluorochemical producing facilities on measured
environmental PFCs levels, Hansen et al. analyzed 40 samples collected in a stretch of
the Tennessee river close to a manufacturing site. Mean PFOS concentrations were
found significantly higher downstream the plant, increasing from around 30 to around
110 ng/L, thus confirming the effects of effluent from manufacturing on waters
contamination (Hansen e al., 2002).
As reported by van Asselt et al., in samples collected in the Yodo River, next to Osaka
airport (Japan), PFOS concentrations resulted relevant, reaching in 2004 the value of

15
526 ng/L. This was probably due to the closeness of a local source of contamination,
presumably constituted by the use of aqueous film-forming foams (AFFF).
In a monitoring on the presence of PFOS and PFOA in the water environment of
Singapore, the analysis of more than a hundred samples from coastal waters, rivers,
reservoirs and wastewater treatment plants (WWTPs) reported significant variations
between the different areas of the city. PFOS concentrations in the coastal area and in
surface waters were in the range of 1.9-8.9 and 2.2-87.3 ng/L respectively, while for
PFOA they were between 2.4-17.8 and 5.7-91.5 ng/L, respectively; wastewaters
showed considerably higher values, ranging from 5.8 to 532 ng/L for PFOS and from
7.9 to 1060 ng/L for PFOA, with the highest levels given by effluents released by two
WWTPs. This study remarked the role of WWTPs as key point in PFCs access to the
oceans (Hu et al., 2011).
Data collected in the Netherlands, Germany, Sweden, Norway, Italy and other
European locations showed levels of contaminations in surface water ranging from
0.02 to 56 ng/L for PFOS and from 0.65 to 57 ng/L for PFOA. The most relevant
concentrations of PFOA were found in samples collected in Germany and the
Netherlands, while Italian Alpine river and spring waters were the less contaminated;
as for PFOS, Loos et al. reported close to non-detectable values (up to 0.1 ng/L) in
Italian Alpine rivers, whereas in nearby Lake Maggiore its presence was in the range
7.2-8.6 ng/L (EFSA, 2008).
PFCs have been detected in different kinds of animals, including fish, mammals and
birds. High concentrations of PFOS have been measured in apex predators of the food
chain (including polar bears, seals and eagles) as well as in the lowest levels of the
trophic chain, regardless of the distance from sources related to human activities.
A study published by Giesy and Kannan in 2001 investigated the presence of various
PFCs (PFOS, FOSA, PFOA and PFHxS) in a wide number of wild animal species, including
bald eagles, albatrosses, polar bears, seals and various species of fish. Samples were
collected in multiple areas of the globe, from urbanized locations, such as the Great
Lakes region and other coastal areas and rivers in North America and Europe, to less
anthropized zones, like North Pacific Oceans and the Arctic. PFOS proved to be globally
16
present, while the other PFCs were detected less frequently and at minor
concentrations. In more detail, it was observed that measured values of PFOS in serum
depended on the area of origin, being significantly higher in animals living close to
populated and industrialized locations than in those living in remote places far from
human activities (10-230 against 5-50 ng/mL). Moreover, PFOS was present at
different levels of concentration in fish from all the monitored areas, as well as in
several bird species, but the highest values were detected in fish eating predators as
minks (970-3680 ng/g wet weight of liver), bald eagles (1-2560 ng/mL of plasma), river
otters (34-990 ng/g wet weight of liver) and polar bears (180-680 ng/g wet weight of
liver). These results suggest that this contaminant is likely to accumulate in the highest
food chain’s levels (Giesy and Kannan, 2001).
This trend was confirmed also by a more recent study on PFCs presence in animals
belonging to the food chain of the Great Lakes area. The monitoring indicated first of
all a BCF (bioconcentration factor) for benthic invertebrates of around 1000, meaning
that PFOS contamination in these animals was about 1000 times higher compared to
that measured in the surrounding water. These invertebrates showed concentrations
2-4 times lower than those of fishes preying on them, which, in turn, were 10-20 lower
than values measured in predator fishes, as lake whitefish and Chinook salmon. Also,
PFOS was detected in minks and bald eagles at levels 5-10 times greater than their fish
prey. These results confirmed the existence of PFOS biomagnification in liver and blood
of higher trophic-level animals; as for PFOA, it was found in water as well, but showed
a significantly lower biomagnification potential (Kannan et al., 2005).
Furthermore, in another study carried out in the New York State area, concentrations
of various perfluorinated compounds, including PFOS and PFOA, were measured in a
number of lake waters, in two species of sport fish and in ten species of waterfowl.
While PFOA was detected in waters at higher levels of contamination (up to 173 ng/L)
than PFHxS and PFOS (around 30 ng/L), this latter was more abundant in all fish and
bird livers sampled. In addition, PFOS concentrations in birds reached 882 ng/g wet
weight, up to 3-fold greater than fish, and piscivorous birds showed values around 2.5
times higher than those of the non-piscivorous species (Sinclair et al., 2006).

17
Perfluorinated compounds have been measured also in the air during several studies in
different areas of the world. The range of monitored compounds often included,
besides PFOS and PFOA, their volatile precursors fluorotelomer alcohols (FTOHs) and
perfluorooctane sulfonamido ethanols (FOSEs). Because of the methyl groups present
in their chain, these molecules are more vulnerable than perfluorinated compounds,
thus representing a potential PFCs source when subjected to degradation in the
atmosphere, as well as after inhalation or ingestion. According to the so called
“precursors hypothesis”, the extreme volatility of these precursors would allow
indirect wide-range PFCs transport towards even the most remote areas of the planet,
to be added to directly released perfluorinated compounds globally spread by oceanic
currents (Jahnke et al., 2009; Barber et al., 2007; Ellis et al., 2004).
In a study conducted in 2007, PFCs presence was monitored in outdoor air samples
collected in four different locations in the United Kingdom, Ireland and Norway. PFOA
was generally the mainly detected compound in the particulate, with values ranging
between 1-818 pg/m3, while in the gas phase the highest levels were reported for
fluorotelomer alcohols, in particular 8:2 FTOH (5-243 pg/m3) and 6:2 FTOH (5-189
pg/m3). Also, some perfluorooctane sulfonamido ethanols were found, mainly
N-MeFOSE and N-EtFOSE, with concentrations ranging between 36-54 pg/m3 and
16-33 pg/m3, respectively. Even if the obtained data were significantly lower than
those reported in literature for indoor air, the Authors underlined that, for some
compounds, levels of contamination exceeded usual measured values of POPs
(Persistent Organic Pollutants) (Barber et al., 2007).
This aspect was confirmed also by Jahnke et al., who measured neutral volatile
perfluoroalkylated substances in environmental air samples collected in Hamburg and
Waldhof, comparing contamination levels in respectively a metropolitan location and a
rural site in northern Germany. Collected data were in-line, sometimes exceeding, with
those found in the same area for POPs. More in details, 8:2 FTOH and 6:2 FTOH were
reported to be the major pollutant ever measured in Waldhof, with the total measured
values for fluorotelomer alcohols in that site varying between 64-311 pg/m3 and
between 150-456 pg/m3 in Hamburg’s urban area. Similarly, the highest FOSEs
18
concentrations were reported in the most anthropized environment, with values in the
range of 29 to 151 pg/m3 against 12 to 54 pg/m3 of the rural area (Jahnke et al., 2007).
In another 14 months survey carried out in the Hamburg area, high concentrations
were observed in air coming from highly populated and industrialized areas south of
the town. 8:2 FTOH was the contaminant most found in the air, reaching
concentrations of 600 pg/m3, while PFOS was detected at a maximum of 13 pg/m3 in
the particle phase. In addition, higher concentrations in the gas phase were reported in
summer compared to winter, probably due to temperature-dependent emissions of
these volatile substances (Dreyer et al., 2009).
Stock et al. investigated volatile PFASs in North America, monitoring the environmental
air of six big cities in the United States and Canada. Both fluorotelomer alcohols and
perfluorinated sulfonamido ethanols were detected, with measured values ranging
between 11-165 pg/m3 for FTOHs and up to 359 and 199 pg/m3 for N-MeFOSE and
N-EtFOSE, respectively. Such high values were observed in only two towns, presumably
because of the release of these substances by industrial plants in the nearby areas,
suggesting the relevant role of point sources for their global diffusion (Stock et al.,
2004).
The same Authors reported in a 2007 study the presence of fluorotelomer alcohols
also in air samples from three arctic lakes in Canada, with mean concentrations
between 2.8 and 29 pg/m3 (Stock et al., 2007).
Another comparison between volatile PFASs presence in urban and rural environments
was presented by Martin et al., who measured FTOHs and FOSEs in Toronto (highly
populated area) and in Long Point (less anthropized zone). Reported environmental
concentrations were 2 to 3 times higher in samples collected in the metropolis, with a
maximum concentration of 87 pg/m3 for 6:2 FTOH (Martin et al., 2002).
In Japan, an air sampling carried out in 33 different locations during 3 months for a
monitoring of fluorotelomer alcohols proved that 8:2 FTOH was the dominant
compound (up to 2466 pg/m3, with a mean of 241 pg/m3), followed by 6:2 FTOH (up to
768 pg/m3, mean value 52 pg/m3) and 10:2 FTOH (up to 113 pg/m3, mean value
27 pg/m3) (Oono et al., 2008).
19
Volatile PFCs concentrations have been measured also in a comparative study between
samples coming from the Okinawa Island (Japan) and samples collected in Oregon
(United States). Once more, fluorotelomer alcohols were the most detected
contaminants, but with significantly greater concentrations in Oregon than in Okinawa.
According to the Authors, taking into account the relative absence of high levels of
FTOHs in trans-Pacific air masses compared to the air surrounding highly urbanized
areas, this difference was due to a more relevant direct emission of pollutants from
the western US region. FOSEs were found as well in both sites, but at lower
concentrations and with minor frequency (Piekarz et al., 2007).
Harada et al. investigated PFOS and PFOA presence in air samples from Kyoto and
Iwate, in Japan. These locations were chosen on the basis of the results of previous
monitoring on serum, indicating the first as a typical extremely contaminated area and
the second as a low polluted zone. The reported annual geometric means of the
concentrations of PFOS and PFOA in the air were respectively 262.8 and 5.2 pg/m3 in
the urbanized area and respectively 2.0 and 0.7 pg/m3 in the rural region (Harada et al.
2005).
Current information regarding the environmental sources of PFCs is incomplete, but
the contamination of several different animal species and habitats suggests the
existence of multiple sources.
Given its widespread presence, persistence and toxicity, in 2009 PFOS was included as
POP (Persistent Organic Pollutant) in Annex B of the Stockholm Convention, which
means that its employment is allowed exclusively for a limited list of applications.
Although PFOS doesn’t tend to accumulate in lipids as other persistent halogenated
compounds, in general its behavior is very similar to that of POPs: its concentration in
blood is linked to its intake via food products and the measured values increase in
relation to the age of the observed subject (Haug et al., 2010b).
The estimated half-life in the environment is 41 years for PFOS and 8 years for PFOA,
therefore their presence and the subsequent contamination of multiple media will
keep being of public interest in the decades to come (D’Hollander et al., 2010).
20
1.2 Exposure
Even if their production started around sixty years ago, it’s only during the last decade
that perfluorinated compounds have become of public concern, due to their high
diffusion and persistence in the environment, resulting in multiple sources of human
exposure, and to the first discoveries on their potential toxic effects.
As previously reported, PFCs are ubiquitous contaminants, being detected in the
environment, in wildlife and in humans. However, exposure source for the population
haven’t been completely defined (EFSA, 2008).
Diet seems to be the major route of exposure, but the contribution of the different
types of food still isn’t clear (Haug et al., 2010b); according to EFSA opinion issued in
2008, data collected through the monitoring of food are insufficient and to this day it’s
not possible to characterize the levels of contaminations of the various foodstuffs.
During the recent past, different categories of food products have been investigated in
various Countries to assess the eventual presence of perfluorinated compounds.
Fish products represent an important food source for humans and, being essential
elements in various aquatic ecosystems such as rivers, lakes and seas, they are at the
same time useful bio-indicators. Chronic exposure to high levels of contaminants by
eating fish can be a risk for human health: according to Haug et al., fish consumption
has proved to be one of the major causes of PFCs intake. However, also contaminated
drinking waters can contribute to human exposure, especially in highly polluted areas
(Fromme et al., 2009).
Besides food and drinking water, as reported by some Authors, a further potential
route is represented by inhalation of outdoor air, indoor air and dust (EFSA, 2011).
PFOS is the most frequently found PFC in food, generally at higher concentrations than
others. Non-food sources contribution to total PFOS exposure is estimated to be less
than 2%, while for PFOA it could be as high as 50% compared to the predicted average
dietary intake; for both compounds these values tend to decrease when moving from
childhood into adulthood (EFSA, 2008).

21
1.2.1 Food sources
A number of studies have been carried out in the last decade on various categories of
food from different parts of the world.
An evaluation of the exposure to PFCs through the diet was conducted monitoring 36
food samples collected in the Tarragona area (Spain). PFOS, PFOA and PFHpA were the
only compounds detected; the most contaminated food resulted fish and, secondly,
meat and dairy products, contributing to around 70% of the total intake. The Authors
suggested a dietary intake of PFOS between 0.89 and 1.06 ng/kg b.w. per day (Ericson
et al., 2008).
This value is significantly lower than that previously reported by a TDS (Total Diet
Study) performed in the UK, in which PFOS and PFOA (and to a lesser extents other
PFCs) had been found only in certain samples, mainly of foods containing potatoes,
and the estimated intake of PFOS was around 100 ng/kg b.w. per day. In this survey, an
average adult daily intake was calculated also for PFOA, corresponding to 70 ng/kg
b.w. (UK Food Standard Agency, 2006).
Another survey was conducted more recently in the UK, monitoring 11 different
perfluorinated compounds in 252 samples of multiple sorts of food. PFOS, FOSA and
PFOA, were the most present contaminants, even if just in traces in almost 75% of the
samples. They were found mainly in fish, crab, liver and kidney samples, while their
presence in potato products was not reported. On the basis of the collected data, the
combined estimated dietary intake via the diet of PFOS and PFOA adults was 20 ng/kg
b.w. per day (Mortimer et al., 2009).
Tittlemier et al. analyzed 54 food samples part of a Canadian TDS, including fish,
seafood, meat, fast-food and popcorn. The predominant presence of PFOS and PFOA
was confirmed; a total dietary intake of all the detected PFCAs and PFOS equal to 250
ng/day was suggested (Tittlemier et al., 2007).
In a work by Zhang et al., the daily intake due to consumption of meat, meat products
and eggs in China was estimated. Chicken meat showed the highest level of
contamination (12.7 ng/g), followed by pork, pig liver and beef (6.38, 4.47 and 4.43

22
ng/g, respectively), while low concentrations were reported in eggs (0.38 to 1.21 ng/g).
Estimated dietary intakes of 6-9.64 ng/day for PFOS and 254-576 ng/day for PFOA
were suggested (Zhang et al., 2010).
A study evaluating the presence of perfluorinated compounds in food in the
Netherlands reported the detection at quantifiable levels of 6 different substances
(PFHpA, PFOA, PFNA, PFDA, PFHxS and PFOS). The highest total values were found in
crustaceans and lean fish (825 and 481 ng/g, respectively), while in fatty fish, butter,
eggs, flour and cheese the measured concentrations were smaller (20-100 pg/g), and
even lower in milk, pork, chicken, bakery products and vegetable (<10 pg/g). PFOS and
PFOA median dietary intake were estimated of 0.3 and 0.2 ng/kg b.w. per day
(Noorlander et al., 2011).
According to Panel CONTAM, indicative daily dietary exposure to PFOS, calculated on
the data on fish products available when the 2008 report was issued, would be around
60 ng/kg b.w. for the average population, increasing up to 200 ng/kg b.w. for high
consumers. Based on these values, the Panel suggested that daily exposure is below
the TDI (150 ng/kg b.w.), even if highly exposed subjects could reach and also exceed
this value. As for PFOA, EFSA suggested a mean daily intake of 2 ng/kg b.w., with a
maximum of 6, not statistically related to individual fish consumption (EFSA, 2008).
Observing the studies available in literature, it’s evident that there is a significant
variability between the results obtained. This can be due to various factors, such as the
area where the monitoring was conducted or the performances of the employed
analytical methods. Also, it must be considered that the importance of certain
categories of food in the diet is not constant, depending on the eating habits of the
various Countries and regions, and consequently also their contribution to the intake
of these contaminants can vary. For all these reasons it’s quite difficult to define
representative values of exposure through the diet for the population.
However, fish and sea-food seem to be the most important contributors to the total
dietary intake of these contaminants. In particular, PFOS is generally present at higher
concentrations than PFOA and has been shown to accumulate in fish with a kinetic
bioconcentration factor in the range 1000-4000, mainly in liver (EFSA, 2008).

23
In the recent past, an increasing number of works focused on the evaluation of PFCs
contamination in this category of food: based on the data collected during the 2008
and 2009 monitoring in Europe, EFSA reported that PFOS and FOSA were the two most
detected compounds in fish, being found at the highest concentrations in fish offal (47
and 15 µg/kg, respectively) but also, even if at lower levels, in fish meat (4.9 and 2.7
µg/kg, respectively). Concentrations similar to those measured in fish meat were
observed also in crustaceans and mollusks, even if only a limited number of samples
were analyzed (EFSA, 2011).
Domingo et al. reported that a survey on fish and seafood in Catalonia region (Spain)
indicated the presence of PFOS (which resulted the predominant compound,
representing 73% of the total), PFOA and PFHpA in this food item. Based on the results
obtained, they estimated a mean dietary intake for adults living in that area of about
97 ng/day, largely deriving from sardine and red mullet (31.4 and 27.4 ng/day,
respectively) (Domingo et al., 2011).
Within a recent ecological monitoring on river waters in a northern Germany region
involved in a massive PFCs release a few years ago, 37 fish filet samples belonging to 6
different species were analyzed: PFOS and PFDA were detected in all samples, at
concentrations up to 63.8 ng/g the former and 19.1 ng/g the latter. Other PFSAs and
PFCAs, including PFOA, were found only in few samples and at relatively low levels,
often close to the limits of quantification (Ehlers et al., 2011).
PFOS was the most detected compound (up to 121 ng/g) also in trout samples from
the Great Lakes, in the United States, showing correlations between measured level
and body weight. Also PFDS was present in most of cases, at a maximum of 9.8 ng/g,
while various PFCAs were found in all samples, with a highest total concentration of 19
ng/g. Based on data concerning lake waters levels of contamination, the Authors
calculated BAFs (Bio-Accumulation Factors) of 4.1 for PFOS, 3.9 for PFDA, 3.8 for FOSA
and 3.2 for PFOA (Furdui et al., 2007).
Various studies evaluated the presence of PFCs also in fish and seafood from Asia. For
example, the analysis of samples of seven types of seafood from China allowed the
identification of several PFCs, among which PFOS was the most detected in terms of
24
both frequency (it was found in all 27 samples) and concentration (with the highest
level of 13.9 ng/g measured in mantis shrimps) (Gulkowska et al., 2006).
A study focused on the occurrence of perfluorinated compounds in marine coastal
ecosystem was conducted in an estuarine area in the south of Japan. PFOS and PFOA
showed the highest frequency, but they showed different exposure and
bioaccumulation trends: while the former was the most abundant contaminant in
animals living in shallow waters, the latter was mainly detected in tidal flat species.
PFNA, FOSA and PFHpS as well were found in lots of the analyzed samples (Nakata et
al., 2006).
Even if at significantly lower concentrations, PFCs levels in seafood have been
measured also in remote and allegedly less contaminated areas such as Sri Lanka,
where the maximum concentrations measured for PFOS, PFHxS and FOSA were 0.012,
0.310 and 0.231 ng/g, respectively (Manage et al., 2005), and even the eastern Arctic,
where the reported values for PFOS didn’t exceed 1.4 ng/g and were consistently
lower for PFOA (Tomy et al., 2004).
Based on the results of a multi-site monitoring of various farmed species in Europe,
South America and Southeast Asia, van Leeuwen et al. observed interesting aspects
concerning PFCs contamination. Concentrations were sensibly higher in fish than in
shrimps, and in carnivorous species (salmon and trout) compared to omnivorous
species. In addition, concentrations found in farmed salmon and trout were greater
than those measured in lean wild marine fish, while levels detected in farmed shrimp,
tilapia and pangasius were generally lower. Finally, within the group of considered
species, salmon was believed to be responsible for 97% of human exposure to a range
of pollutants, because of the much higher contamination levels and average
consumption compared to the other species (van Leeuwen et al., 2009).
Within a study conducted in Norway on 21 samples of local foods, the highest levels of
PFCs were detected in cod, cod liver, meat, canned salmon and mackerel. This
underlines once more the importance of fish as source of exposure for the population,
which is even more significant considering the wide fish consumption in this Country.
On the basis of the collected data, a rough total PFCs average dietary intake of 100
25
ng/day was suggested, higher in male subjects compared to females (Haug et al.,
2010a). A further survey by the same Authors investigated the relations between the
consumption of certain categories of food (mainly seafood) and serum concentrations
of 19 PFCs in 175 subjects, showing that measured levels were associated with the
estimated dietary intake of these contaminants. After a 12 months monitoring, it was
proved that fish and shellfish were the main responsible for PFCs seric concentrations,
contributing to 38% and 93% of total intake, respectively for PFOA and PFOS.
Measured levels depended also on other factors, including age and place of origin of
the subject: concentrations were higher increasing the age of the observed subjects
and in those living in areas near the coast, probably due to direct fishing in more
contaminated waters. This fish, in fact, presented greater levels of contamination
compared to that caught in open sea for commercial purposes. The estimated dietary
intakes of PFOA and PFOS were 0.6 and 1.5 ng/kg b.w. per day, respectively, and were
significantly related to the corresponding serum concentrations (Haug et al., 2010b).
Various other studies had already suggested the role of diet as major route of
exposure, but in the two investigating on a potential correlation between estimated
PFCs intake through diet and seric concentrations no tendency was observed: this was
probably due to the limited period of observation (7 days in the work by Fromme et
al., 2007a; 1 day in the work by Kärmann et al., 2009), not sufficient to highlight trends
in concentrations, which are the consequence of several years of exposure.
The increasing concern on diet-related exposure to these contaminants resulted in the
production of specific investigations also for other, apparently less relevant, sources of
PFCs, which proved their wide diffusion in several food products.
A recent monitoring explored the presence of perfluorinated compounds in chicken
eggs produced in Belgium, highlighting that home-produced eggs contained higher
levels of contaminants than commercially produced eggs. Considering that the average
egg consumption of people who own chickens is about twice the mean value reported
for the Belgian population (20.3 and 10.0 g/day, respectively), the Authors estimated a
median intake for home-produced eggs consumers of 142 ng/kg b.w. per day, but this
26
value was higher for those subjects living near a perfluorochemical production site
(D’Hollander et al., 2011).
PFCs have been detected also in tomatoes and grown lettuce, with higher
concentrations in the roots compared to leaves and fruits, and it was observed that
short-chain compounds were better transferred from the roots to the leaves compared
to longer molecules (Felizeter et al., 2011).
Even game animals have been recently indicated by EFSA as significantly contaminated
by perfluorinated compounds. High concentrations of PFOS (up to 216 ng/g), PFNA (up
to 10.3 ng/g), PFOA (up to 7.1 ng/g), PFDA (up to 6.0 ng/g) and PFDoA (up to 3.7 ng/g)
were measured in edible offal of these species, while lower levels of PFOS and PFOA
were observed in their meat. These matrices resulted significantly more contaminated
in game animals, both birds and mammals, compared to farmed ones. However, from
the dietary exposure point of view, it must be considered that they represent a not
very significant component of the diet for the general population. Moreover, analysis
were conducted only on a small number of samples, so it’s difficult to make firm
deductions on the real contamination levels in this food (EFSA, 2011).
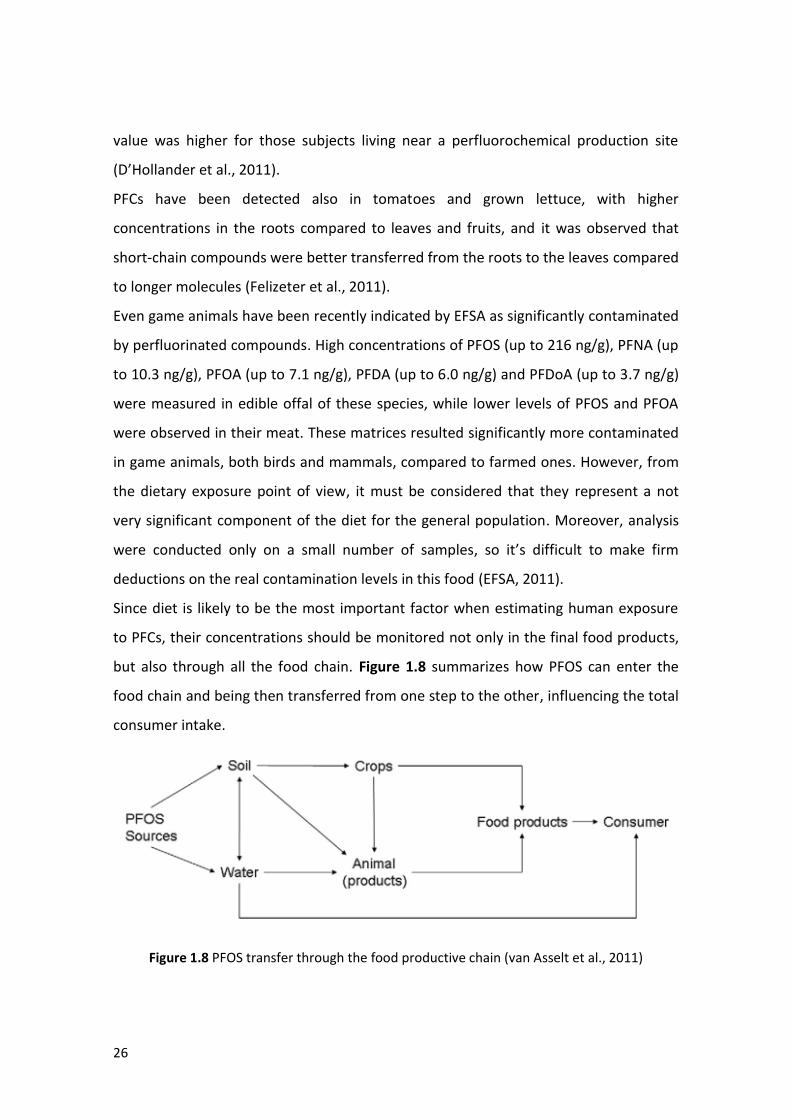
Since diet is likely to be the most important factor when estimating human exposure
to PFCs, their concentrations should be monitored not only in the final food products,
but also through all the food chain. Figure 1.8 summarizes how PFOS can enter the
food chain and being then transferred from one step to the other, influencing the total
consumer intake.
Figure 1.8 PFOS transfer through the food productive chain (van Asselt et al., 2011)

27
Moreover, it must be considered that food products, even at the end of the food chain,
can be contaminated by the same packaging in which they are contained, as well as by
the cookware in which they are prepared. In fact, grease and water repellent coatings
applied on these items are often manufactured using PFCs precursors, which can
transfer to food and then, through degradation, contribute to increase human body
burdens of substances like PFOS (Fromme et al., 2009).
In a total diet study carried out in Canada during the 1992-2004 period, individual
perfluorooctane sulfonamides were detected in food contained in treated paper
packaging, such as pizza and French fries. However, concentrations of these molecules
in food are reported to have decreased during the sampling period, being replaced in
these applications by fluorotelomer alcohols after the termination of perfluorooctyl
sulfonyl compounds production (Tittlemier et al., 2006).
A recent survey on fluorinated and perfluorinated compounds in food contact
materials from the Munich area, in Germany, proved the high FTOHs content in these
items. After analyzing 47 paper-based packaging samples previously identified as
containing fluorine, the Authors observed fluorotelomer alcohols (6:2, 8:2, 10:2 FTOH)
concentrations ranging from 9 to 29500 ng/g, as well as lower levels of contamination
for PFCAs, mainly PFNA (up to 1500 ng/g), PFOA (up to 619 ng/g) and PFDA (up to 390
ng/g) (Wolz et al., 2010).
A study conducted in 2009 by Jogsten et al. tried to assess the effects of some food
processing and packaging on the exposure to perfluorinated compounds through the
diet: PFOS and PFHxA were detected in various food items, but the obtained data were
not sufficient to understand if these factors can actually influence human exposure.
An investigation on potential migration from PTFE containing items reported a PFOA
concentration in cookware in the range 4-75 ng per g of coating (Begley et al., 2005).
Perfluoroalkyl surfactants and fluorotelomer alcohols contained in nonstick cookware
and food packaging can also be released to the air while cooking. Testing 4 different
nonstick pans, it has been measured a pan-to-gas-phase transfer for PFOA of up to
337 ng, detecting also 6:2 FTOH and 8:2 FTOH; a decrease of PFOA and FTOH release
was observed after the fist use. Moreover, high amounts of 6:2 FTOH (up to 223 ng per

28
bag) and 8:2 FTOH (up to 258 ng), as well as lower quantities of PFOA (5-34 ng) were
found in the vapors produced by microwave popcorn bags and on the packaging
internal surface. According to the Authors, these results indicate that residues of the
cited contaminants remained on the surface of treated coatings may migrate to the
gas phase at normal cooking temperatures (Sinclair et al., 2007).
The French Food Safety Agency (AFSSA) investigated the potential risks for the
population associated to the residual PFOA presence in cookware provided with non-
stick coatings, concluding that this represents a minor route of exposure for the
consumers (EFSA, 2011).
Milk
Milk has been treated in this specific sub-section, being the matrix investigated in the
present work and representing a particular issue when it comes to perfluorinated
compounds exposure through the diet. In fact, milk and dairy products (mostly from
cow, buffalo, sheep and goat but, in certain areas, also from other animal species such
as camel) are important components of the diet for adults and particularly for children,
while human breast milk represents virtually the only source of nutrition for newborns.
Based on the above aspects, the importance of evaluating the role of PFCs as potential
contaminants also in this matrix is evident.
PFOS has been reported to have strong affinity, as well as for albumin, also for
β-lactoglobulin, therefore contaminated milk and dairy products constitute a possible
source of exposure (Wang et al., 2010).
A first multi-city monitoring performed by 3M in 2001 on a wide range of food
products (with a LOQ of 0.5 ng/g) reported PFOS presence only in 4 milk and 1 ground
beef samples, with concentrations reaching 0.85 ng/g (EFSA, 2008).
During the following years a number of works have been published, using more
sensitive methods and providing data on a larger number of samples.
According to EFSA’s report on the 2008-2009 monitoring of PFCs in food, including 121
milk samples, 87 fermented milk samples and 43 cheese samples, PFOS
contaminations was observed only in 2 (out of 18) sheep milk samples, with
29
concentrations of 140 and 260 pg/mL (LOQ 20 pg/mL). However, it was highlighted
that the animals from which milk was collected were usually grazing near an industrial
settlement (EFSA, 2011).
Within the previously mentioned survey on food products available on the Catalan
market conducted by Ericson et al., also milk and dairy products were monitored.
More specifically, whole milk, semi-skimmed milk, 3 kinds of cheese, yogurt, creamy
yogurt, cream caramel and custard samples were analyzed, reporting PFOS presence
mainly in dairy products, at mean concentration of 121 pg/g. PFOA and PFHpA were
detected in two samples of whole milk, at mean levels of 56 and 15 pg/g, respectively,
and at even lower levels in the other products. Based on the collected data, the
Authors estimated the daily intake of PFOS for the local population: it was suggested a
value ranging between 1.3-3.7 ng/day for milk and from 8.4 to 16.5 ng/day for dairy
products, depending on the age and sex of the subjects (Ericson et al., 2008a).
A monitoring performed in the United Kingdom on a wide range of food products
included also 11 milk samples, showing PFOS and PFOA concentrations below the limit
of detection, which corresponded to 1 ng/g (Mortimer et al., 2009).
Wang et al. recently evaluated the presence of 9 perfluorinated compounds in milk,
milk powder and yogurt from China. PFHpA and PFNA were found in 68% of the 84
milk samples at mean concentrations of 54 and 67 pg/g respectively, while PFOS and
PFOA were present at lower frequencies (<50%) and concentrations (24 and 26 pg/g).
Concerning milk powder, PFOA was found in 12 of the 36 samples with a mean level of
46 pg/g, while PFOS and PFNA were less frequently detected (mean concentrations 22
and 30 pg/g respectively). As for yogurt, only PFOA was significantly present, with a
mean concentration of 32 pg/g. Considering a mean milk and dairy products
consumption for a Chinese adult of 59.2 g/day, the Authors calculated a daily intake
for PFOS and total PFCs of 23 and 167 pg/kg b.w., assuming that milk was the only
contributor (this value would decrease if also dairy products were considered as
contributors to the daily consumption) (Wang et al., 2010).
Eleven different brands of milk (12 total samples) purchased in retail stores from the
United States were analyzed, showing concentrations below the limits of detection for
30
all the PFCs investigated a part for 8 sample presenting extremely low levels of PFHXs
(up to 4 pg/mL); similarly, among 21 samples of 5 different infant formula brands
collected in the same Country, in only few cases low concentrations of PFOS (up to 11
pg/mL) and PFHxS (up to 4 pg/mL) were found (Tao et al., 2008a).
Among the samples included in their mentioned monitoring conducted in Norway,
Haug et al. analyzed also 1 sample of milk and 1 sample of cheese, detecting only few
of the 12 target compounds. The most abundant in milk was PFOS (7 pg/g), followed
by PFOA (5 pg/g) and PFDA (4 pg/g); in cheese, PFNA showed the highest
concentration (16 pg/g) and slightly lower levels were measured for PFOS (13 pg/g)
and PFOA (0.012 ng/g). A total intake through milk and dairy products was estimated
of 4.7 ng/day for PFOS and of 4.4 ng/day for PFOA and PFNA (Haug et al., 2010a).
The data available so far on milk are not many; however they seem to prove that this
food doesn’t represent a significant source of PFCs for the population, even if it must
be considered that, in general, milk consumption is sensibly higher in children. In this
context, the risk of exposure is even more relevant for breastfed infants, whose major
source of food is human breast milk.
Several works have demonstrated the presence of various PFCs in blood and milk of
breastfeeding women and, even if the transfer mechanism from the former to the
latter isn’t clear, it has been reported that PFOS levels in milk are about 100 times
lower compared to blood (Kärrman et al., 2007). This is probably due to the fact that
these compounds have great affinity for the protein fraction of blood, which is higher
compared to the lactalbumin and casein content of breast milk, resulting in limited
migration and accumulation into milk (Völkel et al., 2008; Fromme et al., 2009).
The risk that persistent contaminants can reach a newborn through breastfeeding,
after the in-utero exposure due to transplacental passage, has raised the concern on
the topic, leading to a number of studies on PFCs presence in human breast milk.
Kärrman et al. analyzed 12 breast milk samples collected from as many Swedish
mothers during the third week after delivery. PFOS was present in all the samples with
concentrations between 60 and 470 pg/mL (median 166 pg/mL), showing a positive
association with values measured in the corresponding serum. Also PFHxS was
31
detected (range 31-172 pg/mL, median 70 pg/mL), while FOSA, PFNA and PFOA were
present in 8, 2 and 1 samples, respectively. A total PFCs intake by lactation of around
200 ng/day was estimated (Kärrman et al., 2007).
Völkel et al. analyzed 57 human breast milk samples from Germany and 13 from
Hungary, detecting PFOS in all 70 samples but at significantly different levels between
the two Countries. In fact, while samples from Germany showed concentrations
between 28-309 pg/mL (median 119 pg/mL), those from Hungary presented levels of
contaminations ranging from 96 to 639 pg/mL (median 330 pg/mL). As for PFOA, it was
detected less frequently, with only 11 German samples showing concentrations
between 201 and 460 pg/mL. The Authors calculated a PFOS mean daily intake through
breast milk of 100 ng for 5 kg infants, based on the data from Germany (Völkel et al.,
2008).
Another study conducted in Germany monitored 203 human breast milk samples from
women living in the North Rhine-Westphalia region, where a soil improver containing
highly contaminated PFCs industrial waste had been previously used by local farmers
on their fields. PFOS was found in 99 samples, with median and maximum
concentrations of 82 and 284 pg/mL, respectively; PFOA was detected in 120 samples,
with median and maximum levels of 137 and 610 pg/mL. PFHxS was present only in
two cases, at low concentrations (Bernsmann and Fürst, 2008).
Fromme et al. collected breast milk samples from German women during the first 5
months of newborn’s life (201 samples in total) to investigate PFCs presence. PFOS
showed the highest frequency (72%), with concentrations in the range <30-110 pg/mL
(median 40 pg/mL); PFOA and PFHxS were found in 2 and 3% of samples, respectively,
with maximum concentrations of 25 pg/mL for the former and 30 pg/mL for the latter.
In addition, 4 infant formulas were analyzed as well, but none of the compounds was
measured above its correspondent LOQ (Fromme et al., 2010).
A monitoring conducted in Barcelona (Spain) included 20 breast milk samples and 3
powder milk-based infant formulas. PFOS was found in 95% of breast milk samples,
with concentrations generally between 28 and 865 pg/mL ; PFOA was detected in only
40% of samples, but often presented high concentrations (up to 907 pg/mL).

32
Concerning powder milk, PFDA showed the highest concentrations, ranging from 693
to 1289 pg/kg, followed by PFOS, PFOA and PFNA (Llorca et al., 2010).
Tao et al. measured the concentrations of 9 PFCs in 45 breast milk samples from
Massachusetts. The mean levels of PFOS and PFOA (the two predominant substances)
were 131 and 438 pg/mL, respectively, and a total average daily PFCs intake of 23.5
ng/kg b.w. was estimated (highest intake = 87.1 ng/kg b.w. per day). Comparing the
ratio PFOS/PFOA resulting from the analysis of these samples with that reported for
human serum in the US female population, the Authors suggested a preferential
transfer of PFOA to milk. Also, it was observed that PFOA concentrations were greater
in samples originating from primiparous mothers (Tao et al., 2008b).
Various surveys have been carried out in Asian Countries as well. The results of a
monitoring performed in China on 19 primiparous mothers revealed that PFOS and
PFOA were the most present PFCs, with concentration ranging from 45 to 360 pg/mL
for PFOS and from 47 to 210 pg/mL for PFOA. Other PFCs were detected at lower
levels, with maximum measured levels of 100 ng/mL for PFHxS, 62 pg/mL for PFNA, 56
pg/mL for PFUnA and 15 pg/mL for PFDA (So et al., 2006).
A Japanese study reported PFOS presence in all the human breast milk samples
analyzed (51), with concentrations ranging between 8 and 401 pg/g, evidencing how
these outcomes suggest an important exposure for infants. Even if only in certain
samples, also PFOA, PFNA and PFHxS were detected, at maximum concentrations of
339, 150 and 25 pg/mL, respectively (Nakata et al., 2007).
The analysis of a large number of breast milk samples from 7 different Asian Countries
was carried out by Tao et al. in 2008. PFOS was present in 178 of the 184 samples (only
in 6 out of 39 samples from India it was not detected), showing significant variability in
the mean concentrations between the different Countries: the lower value was
reported for India (461 pg/mL) while the highest for Japan (232 pg/mL). PFOA was
detected in almost all samples from Japan (mean 777 pg/mL), but rarely in breast milk
coming from the other 6 Countries. Great variability was reported for PFHxS frequency,
whose levels didn’t exceed 158 pg/mL (Tao et al., 2008a).

33
Another monitoring was recently performed in China on 24 pools originating from
1237 individual human breast milk samples. A mean concentration of 46 pg/mL was
reported for both PFOS and PFOA, but a significant variability depending on the area of
sampling was observed: Samples from subjects living in the Shanghai region resulted
the most contaminated, with PFOA concentrations up to 814 pg/mL. The Authors
estimated mean and highest dietary intakes of total PFCs of 178 and 129 pg/kg per
day, respectively; moreover, they highlighted that their estimated PFOA intake of
88.4 ng/kg b.w. per day resulted close to some proposed TDIs (Liu et al., 2010).
Human milk contamination by PFCs was investigated in pooled milk samples from 19
developing Countries as part of a WHO project. PFOS was detected in almost all
samples, with the highest concentrations measured in Moldova (65 pg/mL). PFOA was
found less frequently, with the highest concentration equal to 192 pg/mL and obtained
from Antigua, but it must be observed that this compound had a sensibly higher LOD
(80 pg/mL) (Kärrman et al., 2011).
Some Authors investigated the trends of PFCs content in human breast milk and serum
during lactation. Thomsen et al. observed that PFOA and PFOS concentrations in milk
decreased by 94 and 37%, respectively, during 12 months of breastfeeding (Thomsen
et al., 2010). Similarly, Haug et al. indicated that breastfeeding for a period longer than
4 months considerably reduced levels of various PFCs in serum (Haug et al., 2010b). In
the light of the above, lactation history can represent a useful instrument in studies on
both mother and child exposure.
An interesting study recently published by Haug et al. presented further interesting
aspects. After monitoring PFCs presence in milk and serum of 19 Norwegian women,
they investigated the partitioning between the two media, observing positive
correlations: PFOS and PFOA mean concentrations were 1.4% and 3.8%, respectively,
of the corresponding values measured in serum. This suggested that PFOA migration
from blood to milk is about two times greater than that of PFOS, which is in agreement
with what previously reported by Thomsen et al. Moreover, considering also the
potential exposure of infants through house dust inhalation, the Authors calculated
that maximum estimated intakes were quite close to proposed TDIs (even if it must be
34
observed that these TDIs are set for lifelong exposure) and demonstrated that breast
milk consumption contributes to more than 94 and 83% of total exposure to PFOS and
PFOA, respectively (Haug et al., 2011a).
Based on the above information, it’s clear that postnatal exposure to these pollutants
can have a relevant impact on health, therefore further surveys employing more
sensitive and precise analytical techniques are needed to assess the risks for infants
deriving from lactation.
1.2.2 Non-food sources
In a wide perspective, to produce accurate estimations of global exposure to these
contaminants it’s important to evaluate, other than diet, also significant sources
related to the environment where humans live. These include drinking water, indoor
air and house dust (Haug et al., 2010b).
Although drinking water is subjected to many controls on various contaminants, there
are no regulations concerning perfluorinated compounds, thus it may represent a
relevant route of exposure for the population.
Drinking water is estimated to contribute to less than 16% of total PFOA intake and to
a more modest extent (<0.5%) of PFOS exposure (EFSA, 2008).
Even if activated carbon adsorption is a promising technique for the removal of PFOS
from dilute aqueous streams, this treatment is not so common (van Asselt et al., 2011);
the slight differences found by Loos et al. between PFCs levels in drinking water
generated from Lake Maggiore (Italy) and those measured directly in the lake indicated
the inefficiency of chlorination and sand filtration processes operated by the local
waterworks. Therefore, surveys are required to detect possible drinking waters
contaminations.
A number of studies on drinking water contamination by perfluorinated compounds in
Europe reported values in the range 0.4-9.7 ng/L for PFOS and between 1-4 ng/L for
PFOA (EFSA, 2008).
35
A survey conducted in Spain to assess the role of drinking water as contributor to
dietary intake of perfluorinated compounds for the population of Tarragona revealed
the presence of various compounds belonging to this family. In tap water samples
PFOA was the most detected analyte, with levels in the range 0.32-6.28 ng/L; PFOS was
also detected (between 0.39 and 0.87 ng/L), as well as PFHxA, PFHpA and PFNA.
Concentrations were sensibly lower in bottle water, with reported values for PFOA
<1 ng/L and PFOS not detected at all. Assuming a water consumption of 2 L per day,
the Authors calculated a potential intake of around 12.6 ng/day for PFOA and of 0.78-
1.74 ng/day for PFOS (Ericson et al., 2008b).
Similarly, after analyzing several drinking waters from public fountains in Catalonia
region (Spain) Domingo et al. identified water consumption as one of the predominant
PFCs source for people living in that area. Various PFCs were identified: PFOA and PFOS
showed the greatest mean concentrations (2.42 and 1.95 ng/L, respectively), with
samples from the highly populated and industrialized Barcelona resulting 3-4 times
more contaminated than those from the other observed areas, reaching peak
concentrations of 9.60 ng/L for PFOA and 6.20 ng/L for PFOS (Domingo et al., 2011).
In the previously mentioned monitoring in the Ruhr river area, Skutlarek et al. reported
the presence of various PFCs also in local drinking water. PFOA and PFOS were
detected at maximum concentrations of 519 and 22 ng/L respectively, but also PFPA
(up to 77 ng/L), PFHxA (up to 56 ng/L) and PFBS (up to 56 ng/L) were found. The
relevance of these results is evident when compared to data collected from the
analysis of drinking waters outside the Ruhr area, in which maximum PFOS and PFOA
concentrations were in the order of 5 ng/L (Skutlarek et al., 2006).
3M Company investigated PFOS and PFOA levels in drinking water in four American
cities where these compounds were produced or industrially employed (Columbus,
Decatur, Mobile and Pensacola) and in two other cities, used as control (Cleveland and
Port St. Lucie). Data indicated PFOS and PFOA contamination only in Columbus (up to
59 and 27 ng/L, respectively) and in Pensacola (only PFOS detected, with
concentrations ranging between 0-45 ng/L) (EFSA, 2008).

36
A monitoring on drinking water treatment facility samples from different locations in
the United States was performed by Quiñones and Snyder. Depending on the sampling
site, total detected PFCs concentrations and profile were variable. The highest global
concentration reported was around 80 ng/L, with measured levels of PFOS and PFOA
of 29 and 25 ng/L respectively; in some cases significant amounts were observed for
some other PFCs as well, including PFHxA (up to 29 ng/L) and PFHxS (up to 12 ng/L)
(Quiñones and Snyder, 2009).
Perfluorinated compounds have been measured also in drinking waters from the Rio
de Janeiro area, in southeast Brazil, showing profiles different from those commonly
reported. PFOS levels were in fact comparable, or even higher, to those of PFOA and a
relevant contribution to total PFCs contamination was given by PFHxS: these three
compounds were detected in all the analyzed samples, at concentrations ranging
between 0.58-6.70, 0.35-2.82 and 0.15-1.00 ng/L, respectively for PFOS, PFOA and
PFHxS (Quinete et al., 2009).
Mak et al. performed between 2006 and 2008 a large-scale investigation on drinking
water sampled in the United States, Canada, China, Japan and India in order to
evaluate levels of contamination by 20 PFCs. Samples from China showed the highest
concentrations of PFOA (mean value in Shanghai water was 78.4 ng/L) and PFOS (mean
value in Shenzhen was 10.6 ng/L, while in Chinese tap water in general it was 3.9 ng/L),
as well as the presence of various short-chain perfluoroalkyl carboxylic acids, which
might have been employed as replacements for PFOS and PFOA. In all the other
Countries measured concentrations were lower than those from China and certain
compounds were not detected at all. However, also in the United States and Canada
the composition profiles of PFCs was dominated by PFOS and PFOA (Mak et al., 2009).
A monitoring on tap water and bottle water samples collected in Örebro (Sweden),
Vancouver and Calgary (Canada), and various Asian locations was conducted by Tanaka
et al. in 2006. The Authors reported tap water PFOS and PFOA average concentrations
in Sweden equal to 1 and 0.4 ng/L, respectively, while in samples from Canada PFOS
was not detected and PFOA mean concentration was around 0.2 ng/L. Measured
values in Malaysia, Thailand and Singapore were in the range between 0 and 2.5 ng/L
37
for both contaminants, while in Vietnam they weren’t detected at all. PFOA was
detected at a mean of 7 ng/L in two Japanese towns, while the highest values were
observed in China, with average concentrations of 6.3 ng/L for PFOS and 3 ng/L for
PFOA (Tanaka et al., 2006).
In a work published in 2003, Harada et al. measured PFOS concentrations in drinking
waters in four cities treating fresh water from the Tama river (Japan), which had
proved to be contaminated by sewage plant discharges, into drinking water: in most of
cases PFOS levels were lower than 4 ng/L, but in one case it was measured at 50.9 ng/L
(Harada et al., 2003).
A research conducted in the Osaka area (Japan) to evaluate PFCs contaminations in
drinking water reported the presence of PFOA at concentrations in the range 5.4-40.0
ng/L and of PFOS with values up to 12 ng/L (Saito et al., 2004).
In another study in the same town, a comparison between raw and treated tap waters
collected from 14 different drinking water treatment plants was performed. PFOA
concentrations were in the range 5.2-92.0 ng/L in raw waters, decreasing to values
between 2.3-84.0 ng/L after being treated; measured levels of PFOS were in the range
0.26-22.0 ng/L before treatment and between 0.16-22.0 after. On the basis of the
observed correlations between PFCs levels in raw and tap waters, the Authors
highlighted the inefficiency of the removal treatment applied, even if no risks were
expected in relation to such a limited PFOA contamination (Takagi et al., 2008).
Qiu et al. monitored 8 different PFCs in tap water from 12 locations near Lake Taihu, in
the eastern part of China. Again, PFOA and PFOS were the dominant PFCs in all
samples, but a significant difference was reported in their concentrations depending
on the sampling location: in fact, measured levels in Shanghai area (22-260 ng/L for the
former and 0.62-14.0 ng/L for the latter) were on average around 10 times higher than
in Nanjing (2.1-2.4 and 0.33-0.38 ng/L, respectively) (Qiu et al., 2010).
A survey was recently carried out in order to estimate for the first time human
exposure to PFCs through drinking water in Australia, by the analysis of 62 samples
collected from 34 different locations across the Country. PFOS and PFOA were
detected in about half of the samples and also PFHxS was often detected (27% of the
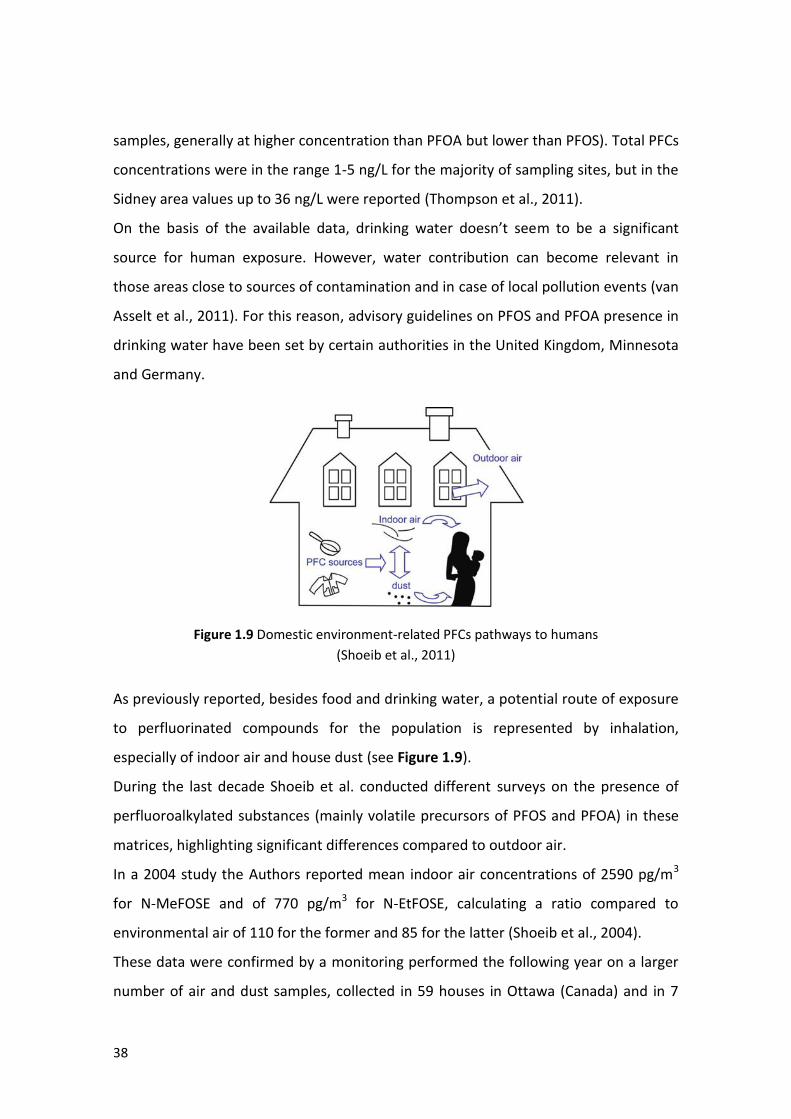
38
samples, generally at higher concentration than PFOA but lower than PFOS). Total PFCs
concentrations were in the range 1-5 ng/L for the majority of sampling sites, but in the
Sidney area values up to 36 ng/L were reported (Thompson et al., 2011).
On the basis of the available data, drinking water doesn’t seem to be a significant
source for human exposure. However, water contribution can become relevant in
those areas close to sources of contamination and in case of local pollution events (van
Asselt et al., 2011). For this reason, advisory guidelines on PFOS and PFOA presence in
drinking water have been set by certain authorities in the United Kingdom, Minnesota
and Germany.
Figure 1.9 Domestic environment-related PFCs pathways to humans
(Shoeib et al., 2011)
As previously reported, besides food and drinking water, a potential route of exposure
to perfluorinated compounds for the population is represented by inhalation,
especially of indoor air and house dust (see Figure 1.9).
During the last decade Shoeib et al. conducted different surveys on the presence of
perfluoroalkylated substances (mainly volatile precursors of PFOS and PFOA) in these
matrices, highlighting significant differences compared to outdoor air.
In a 2004 study the Authors reported mean indoor air concentrations of 2590 pg/m3
for N-MeFOSE and of 770 pg/m3 for N-EtFOSE, calculating a ratio compared to
environmental air of 110 for the former and 85 for the latter (Shoeib et al., 2004).
These data were confirmed by a monitoring performed the following year on a larger
number of air and dust samples, collected in 59 houses in Ottawa (Canada) and in 7
39
outdoor locations in the same town. Measured levels of contaminations for FOSEs in
indoor air were around 10-20 times higher than outdoor concentrations, with mean
values of 1490 and 740 pg/m3 for N-MeFOSE and N-EtFOSE respectively. Concerning
indoor dust, reported geometric mean concentrations were of 110 ng/g for N-MeFOSE
and 120 ng/g for N-EtFOSE (Shoeib et al., 2005).
In a recent study the same group performed an even more accurate investigation,
simultaneously monitoring PFOS, PFOA and their volatile neutral precursors, including
FOTHs and FOSEs, in 152 houses in Vancouver (Canada). Between neutral compounds,
8:2 FTOH was widely the most present in air samples, with a mean concentration of
2900 pg/m3, while N-MeFOSE was found at a mean concentration of 380 pg/m3. PFOA
was measured in all indoor air samples (mean value 28 pg/m3), while PFOS was not
detected. On the contrary, high concentrations were reported for ionic PFCs in house
dust, reaching 4700 ng/g for PFOS and 1400 ng/g for PFOA. Concerning their
precursors, 8:2 FTOH was the most abundant in house dust as well, with a geometric
mean of 88 ng/g. According to the Authors, while inhalation of contaminated air
represents a more relevant route of exposure in adults, dust ingestion (e.g. by contact
with hands) can be a consistent source of PFCs for children (Shoeib et al., 2011).
A Norwegian study estimated the contribution of various routes of exposure in a group
of 41 women, proving the role of the indoor environment as a relevant source to be
added to diet. In fact, if on the one hand diet was responsible for 88-99% and 67-84%
of the total intake of PFOS and PFOA, on the other hand for certain subjects the
contribution of indoor environment reached about 50% of the total. The highest values
in house dust were reported for PFHxA (28 ng/g), PFNA (27 ng/g), PFDoA (19 ng/g) and
PFOS (18 ng/g), while fluorotelomer alcohols were the most detected in the air, with
concentrations of 5173, 2822 and 933 pg/m3, respectively for 8:2, 10:2 and 6:2 FTOH.
Also, the Authors observed correlations between levels of contamination of house dust
and corresponding concentrations in blood, as well as between the age of the house
and measured values in both indoor air and dust (Haug et al., 2011a and b).
An interesting research compared the presence of several perfluoroalkylated
substances in air samples collected in residential and non-residential indoor
40
environments. Data obtained reported great variability between the different samples,
with total concentrations ranging between 8.2-458 ng/m3, but a deeper analysis
highlighted that the highest concentrations (both individual and total) were found in
shops selling outdoor equipment, furniture and carpets (Langer et al., 2010).
A recent study investigated the content of PFOA and FTOHs in various consumer
products which can be employed in households, suggesting that impregnating sprays
for shoes and textiles, generating inhalable aerosols, can contribute to the
environmental distribution of these contaminants, thus resulting an additional source
for people using them (Schramm et al. 2010).
Fromme et al. produced an exposure assessment collecting data on all the significant
media for human exposure: food (which confirmed to be the most relevant source),
drinking water, indoor air and house dust. Average and upper daily intake values of 1.6
and 8.8 ng/kg b.w. for PFOS and of 2.9 and 12.6 ng/kg b.w. for PFOA were reported. In
addition, they estimated mean global dietary and non-dietary intakes of volatile
precursors equal to 0.14 ng/kg b.w. per day for FTOHs and 1.6 ng/kg b.w. per day for
FOSEs (Fromme et al., 2009).
Also Haug et al. estimated total intakes for PFCs within the previously cited study on 41
Norwegian women, including all the potential sources of exposure, i.e. food, water,
dust and air; dermal uptake was discarded, having been reported to be a negligible
route. Three different scenarios were used to estimate house dust intake, since there’s
still little information on the real contribution of this route and on volatile precursors
biotransformation. PFOS median total intakes varied, depending on the scenario,
between 0.64 and 0.77 ng/kg b.w. per day; similarly, those of PFOA ranged from 0.27
to 0.36 ng/kg b.w. per day (Haug et al., 2011a).
In order to obtain more representative and consistent data, there’s need for further
monitoring on perfluorinated compounds, extending the variety of products and
matrices examined and investigating a wider range of analytes, including as well their
precursors.

41
1.2.3 Occurrence in humans
Following the increasing interest towards the global spread of perfluorinated
compounds and the related risks for health, several studies have been conducted in
order to evaluate human exposure to these contaminants measuring their levels in
blood, plasma or serum.
If on the one hand it has been demonstrated that PFCs concentrations in plasma and
serum are comparable, on the other hand reported ratios between those two media
and whole blood levels are not consistent. According to some Authors, the median
plasma to whole blood ratios for PFOS and PFOA are 2.3 and 2.0, respectively, while
lower values (1.2 and 1.4, respectively) have been suggested by others (Fromme et al.,
2009).
Various studies suggested sex-related differences in blood levels of PFOA and PFOS:
higher concentrations were observed in male compared to women, even if measured
levels in women seemed to increase with age. However, other experiments didn’t
confirm this aspect. Some works reported also differences in PFOA and PFOS serum
levels related with the place of origin of the donor, but it’s difficult to ascertain if this
variability was due to ethnic differences or rather to a combination of factors,
including also lifestyle and diet (Fromme et al., 2009; EFSA, 2008).
Kannan et al. conducted an extended investigation, monitoring the presence of PFOS,
PFOA, FOSA and PFHxS in 473 human blood, serum and plasma samples from Italy,
Belgium, Poland, United States, Brazil, Colombia, India, Malaysia and Korea. PFOS
resulted the predominant substance, with the highest concentrations found in samples
from the United States and Poland (>30 ng/mL) and the lowest in those from India
(<3 ng/mL, in only 51% of which at levels >1 ng/mL). The other analytes showed
smaller frequencies and concentrations. PFOA, the second most abundant compound,
was generally found at levels 2-7 times lower than PFOS; however, in lots of serum
samples from Korea it resulted the most detected analyte, suggesting the existence of
specific sources of exposure in that area. The highest concentrations of PFHxS were
found in samples from the United States, Japan and Korea, ranging between 1.5 and 3
42
ng/mL in these Countries; a significant variability of the ratios between PFHxS serum
levels and those measured for PFOS was observed among the various Countries
(Kannan et al., 2004).
60 human blood samples collected in the Gulf of Gdañsk area (Poland) were analyzed
by Falandysz et al. within a monitoring on exposure for people living on the Baltic
Coast. The results evidenced that PFOS and PFOA had the highest concentrations, in
the range 5.2-84.0 and 1.2-8.7 ng/g, respectively, but also other PFCs were present,
even if at lower concentrations (for PFHxS between 0.2 and 3.7 ng/mL; for PFNA
between 0.16 and 3.8 ng/mL) (Falandysz et al., 2006).
A survey carried out in Germany evaluated concentrations of PFOS and PFOA in 105
plasma samples, reporting median concentrations of 22.3 ng/mL for the former and
6.8 ng/mL for the latter. Higher levels were observed in men compared to women
(Midasch et al., 2006).
Slightly lower values were obtained analyzing 356 samples of human plasma collected
in southern Bavaria (Germany), whose PFOS concentrations were between 2.5 and
30.7 ng/mL (median 10.9 ng/mL) and those of PFOA between 1.5 and 16.2 ng/mL
(median 4.8 ng/mL). Again, the Authors reported higher concentrations in male
subjects (Fromme et al., 2007b).
Hölzer et al. evaluated the levels of PFCs in 170 children, 317 women and 204 men
who had been exposed to PFCs through contaminated drinking water in the Arnsberg
area (Germany). The Authors reporting PFOA levels in plasma 4.5-8.3 times greater
than concentrations measured in the reference population. One year after this
monitoring, a follow-up survey was conducted on a large portion of the subjects,
showing a slow decline of PFOA levels: mean concentrations decreased by around
21.3% in children, 19.7% in women and 7.5% in men (Hölzer et al., 2008 and 2009).
During a monitoring conducted by Kärrman et al. in Sweden, 12 different PFCs were
investigated in 66 whole blood samples collected from the local population. PFOS,
PFOA, FOSA, PFHxS and PFNA were present in 92-100% of cases and showed higher
concentrations in men compared to women; PFOS showed the highest concentrations,
ranging between 1.7-37.0 ng/mL (median 17.1 ng/mL). PFDA and PFUnA were found in

43
65% of the samples, while the other analytes were detected sporadically. Assuming a
plasma to whole blood ratio of 2, the Authors suggested that calculated plasma
concentrations of PFOS and PFOA based on their data were similar to those reported in
other studies (Kärrman et al., 2004).
Ericson et al. tried to investigate potential correlations between PFCs levels in blood of
48 people living in Catalonia (Spain) and their age and gender. PFOS showed the
highest mean concentration (7.6 ng/mL), but significant levels were observed also for
PFHxS and PFOA (mean concentrations 3.6 and 2.8 ng/mL, respectively). Once again,
samples collected from male subjects resulted more contaminated; PFHxS levels
presented age-related differences, being higher in the 25±5 years group (Ericson et al.,
2007).
Both PFOS and PFOA were found in 56 serum samples collected in Athens (Greece), at
median concentrations of 13.7 ng/mL in males and 7.0 ng/mL in females the former
and of 3.1 and 1.7 ng/mL the latter. PFOS values were significantly higher in samples
belonging to the “over 40” group, while no age-related trend was observed for PFOA
(Vassiliadou et al., 2009).
An increase of PFOS seric levels with age was indicated as well by Ingelido et al., who
highlighted the same situation also for PFOA after the analysis of 230 serum samples
from two Italian cities, Brescia and Rome. More precisely, measured concentrations of
both PFOS (range 0.06-29.6 ng/g, median 6.3 ng/g) and PFOA (range 0.2-51.9 ng/g,
median 3.6 ng/g) were higher in the 36-50 and 51-65 years ranges, with a significant
increase in females belonging to the 51-65 years group. Moreover, PFOS and PFOA
levels showed a strong correlation, with the former always significantly more present
than the latter (Ingelido et al., 2010).
The previously mentioned survey by Haug et al. on 175 serum samples from Norway
reported the presence of PFOA, PFNA, PFDA, PFUnA, PFHxS and PFOS in all samples;
PFHxS and FOSA were almost always detected as well. PFOS was the most found
(mean 32 ng/mL, significantly higher than any other analyte; maximum 133 ng/mL),
followed by PFOA, PFHxS and PFNA (means 4.1, 2.2 and 1.1 ng/mL, respectively) (Haug
et al., 2010b).
44
In 2001, Hansen et al. performed a monitoring on 65 serum samples collected in the
United States, detecting PFOS in all the samples, while PFOA and PFHxS in 52% and
47% of cases, respectively. Mean and maximum measured concentrations were
respectively 28.4 and 81.5 ng/mL for PFOS, 4.8 and 35.2 ng/mL for PFOA, 5.1 and 21.4
ng/mL for PFHxS (Hansen et al., 2001).
The analysis of 20 serum samples collected in Atlanta (United States) reported
comparable values: PFOS ranged between 3.6 and 164.0 ng/mL, PFOA between 0.2
and 10.4 ng/mL, PFHxS between 0.4 and 11.2 ng/mL (Kuklenyik et al., 2004).
A number of surveys have been presented by Olsen et al. on PFCs presence in serum of
the Unites States population. A monitoring on 645 Red Cross blood donors from six
different centers showed PFOS mean concentration of 34.9 ng/mL (maximum value
1626 ng/mL), while other detected PFCs were present at 10-fold lower levels (Olsen et
al., 2003a). Similar values were reported in a survey on 238 aged subjects (65-96 years
old) from Seattle: PFOS mean concentration was 31 ng/mL, with a maximum level of
175 ng/mL. No sex-related differences were observed (Olsen et al., 2004). In a more
recent work, the Authors analyzed 100 serum samples collected in Minneapolis in
2000 and 40 plasma samples collected in the same town in 2005, in order to evaluate if
PFCs levels had decreased after the termination of the electrochemical fluorination
process by 3M Company. The mean concentration decreased from 33.1 to 15.1 ng/mL
for PFOS and from 4.5 to 2.2 ng/mL for PFOA (Olsen et al., 2007a).
The same Authors have also conducted investigations on the levels of PFCs in
occupationally exposed workers from various production sites, highlighting extremely
higher concentrations in these subjects compared to the general population. A
monitoring on 263 3M Company employees from the Decatur (United States) plant
and 255 from the Antwerp (Belgium) plant showed 2 times higher concentrations in
subjects working in the American site, with PFOS and PFOA concentrations ranging
between 60-10060 and 40-12700 ng/mL, respectively, and mean values of 1320 ng/mL
for PFOS and 1780 ng/mL for PFOA (Olsen et al., 2003b). Another survey on 126
workers reported mean concentrations of 941 ng/mL (range 787-1126 ng/mL) for PFOS
and 899 ng/mL (722-1220 ng/mL) for PFOA (Olsen et al., 2003c). The analysis of other
45
506 serum samples from exposed subjects showed PFOA levels between 7 and 92030
ng/mL, with a mean concentration of 2210 ng/mL (Olsen and Zobel, 2007).
Two survey projects have been carried out by Calafat et al. on serum samples collected
from United States residents belonging to three major ethnic groups (non-Hispanic
whites, non-Hispanic blacks and Mexican Americans), in order to evaluate potential
ethnicity-depending differences in PFCs levels. The analysis of 54 pooled samples (from
1832 donors) collected between 2001-2002 reported significantly higher mean
concentrations of PFOS in non-Hispanic white subjects (40.2 ng/mL in males and 24.0
ng/mL in females) compared to non-Hispanic black subjects (18.3 and 18.0 ng/mL,
respectively); as for Mexican Americans, mean levels were even lower, being
13.7 ng/mL in men and 10.4 ng/mL in women. Similar trends were observed for PFHxS
as well (Calafat et al., 2006a). In a similar investigation, 1562 samples collected
between 1999-2000 showed the constant presence of PFOS, PFOA, PFHxS and FOSA,
with significantly lower levels in Mexican American donors. Sex-related trends were
observed, while no age-related variations resulted (Calafat et al., 2007). In another
research by the same Authors, serum samples collected in the United States were
compared to serum samples from Peru, which showed extremely lower PFCs
frequencies and concentrations. In particular, PFOS and PFOA were detected in all the
US samples while in only 20 and 25%, respectively, of the Peruvian samples; also,
median concentrations of PFOS and PFOA were 31.1 ng/mL and 11.6 ng/mL for the US
residents, while 0.7 mg/mL and 0.1 ng/mL for the Peruvians (Calafat et al., 2006b).
A preliminary monitoring in Canada on 56 serum samples showed results similar to
those of the majority of studies, with PFOS detected in all samples with concentrations
between 3.7 and 65.1 ng/mL (mean 28.8 ng/mL). PFOA was present at significantly
lower concentrations and only in 29% of cases (Kubwabo et al., 2004).
An extended survey, involving 3802 serum samples collected in Australia between
2002-2003, reported the highest mean concentrations for PFOS, PFOA, PFHxS, PFNA
and FOSA (20.8, 7.6, 6.2, 1.1 and 0.7 ng/mL, respectively). Increase of PFOS levels with
age was highlighted in both genders; curiously, PFNA showed higher values in female
pools (Kärrman et al., 2006).
46
Another huge monitoring was conducted in Australia between 2006-2007 collecting
2420 serum samples, subsequently pooled based on donor’s age. The most detected
PFCs were, in descending order, PFOS (mean concentration 15.2 ng/mL), PFOA
(6.4 ng/mL), PFHxS (3.1 ng/mL) and PFNA (0.8 ng/mL). Gender differences were
observed (men concentrations were higher compared to those of women) except for
the <12 years pool; an interesting difference was observed between PFOS, which
showed the highest concentrations in adults >60 years, and PFOA, PFNA, PFDA and
PFHxS, which on the contrary were higher in children <15 years (Toms et al., 2009).
More recently, Toms et al. integrated the results of these two studies with further
samples collected in Australia between 2008-2009, in order to evaluate PFCs trends in
the population during an 8 years period. Based on the data obtained, concentrations
had significantly decreased during that span of time in both adults and children.
Moreover, some interesting trend differences were observed: no age-related trend
was found in the earlier data for PFOS, while the most recent samples indicated that its
level increases with age; at the same time, the early samples suggested a decrease of
PFOA from youngest age groups towards oldest age groups, which was absent in the
2008-2009 samples. According to the Authors, these differences may be due to a faster
response to changing exposure profiles in younger subjects (Toms et al., 2010).
Concerning Asian Countries, a monitoring carried out in the Tokyo area on 10 whole
blood samples indicated a mean concentration of PFOS of 8.3 ng/mL, while PFHxS and
PFBS were not detected (Taniyasu et al., 2003).
Again in Japan, Harada et al. observed significant differences between serum levels
measured in Miyagi (lowest), Akita and Kyoto (highest): mean levels of PFOS were in
the range 5.7-28.1 ng/mL in males and 3.5-13.8 ng/mL in females; as for PFOA, ranges
were 3.3-12.4 and 2.5-7.1 ng/mL, respectively (Harada et al., 2004).
Within a wide monitoring in China, 1437 serum samples were collected from different
locations. PFOS and PFOA showed correlated mean concentrations, equal to 4.3 and
3.6 ng/mL, respectively; however, a significant zone-related variability was observed:
PFOS mean levels varied from 0.3 ng/mL in a rural area to 18.8 ng/mL in a big town;
similarly, PFOA ranged between 0.5 and 25.4 ng/mL (Jin et al., 2011).

47
1.3 Toxicity
Several investigations have been conducted during the last decade in order to deepen
the knowledge on the toxic effects caused by perfluorinated compounds.
Most of the available information concerns PFOS and PFOA, which have been reported
to have a rather long half-life and to accumulate in liver and blood. Studies on these
substances proved their immunotoxicity and hepatotoxicity, negative effects on
reproductive, respiratory and nervous systems, as well as potential to cause
development and hormonal alterations (OECD, 2002; EFSA, 2011).
Adverse effects have been studied mainly on rats, but some data are available also on
rabbits and non-human primates. Moreover, in a recent study Sonne observed a
negative impact on health related to exposure to this these contaminants also in
animals from the Arctic Circle, such as polar bears, sled dogs and arctic foxes (Sonne,
2010).
Some epidemiological studies have been conducted on exposed populations, such as
workers from plants producing fluorinated substances, but collected data are still
fragmented and incomplete.
OECD published in 2002 a hazard assessment on PFOS and its salts, concluding that it’s
a persistent and bioaccumulative pollutant, with toxic potential towards mammals.
Consequently, a NOAEL (No Observed Adverse Effect Level) was set at 0.1 mg/kg/day,
based on the results of a 2-generation reproductive toxicity study performed on rats
(OECD, 2002).
In 2003, the United States Environmental Protection Agency (US EPA) issued a
preliminary evaluation on the toxic effects on development associated with exposure
to PFOA and its salts, declaring a NOAEL for females and males of 10 and 3 mg/kg/day,
respectively.
EFSA’s Panel on Contaminants in the Food Chain (CONTAM) in the 2008 report
indicated the lowest NOAEL value for PFOS at 0.03 mg/kg b.w. per day and for PFOA at
0.06 mg/kg b.w. per day. Concerning PFOA, the Panel observed also that in various
48
studies in rats the 95% lower confidence limit of the values for the benchmark dose for
a 10% increase in effects on the liver (BMDL10) was in the range 0.3-0.7 mg/kg b.w.
per day. Based on these values, Tolerable Daily Intakes (TDIs) for these substances
were estimated, resulting of 150 and 1500 ng/kg b.w., respectively for PFOS and PFOA
(EFSA, 2008).
Based on the available data, CONTAM panel concluded that there’s little likelihood
that adverse effects due to these compounds are occurring in the population, but
more data are needed to ascertain this statement (EFSA, 2008).
This opinion was shared also by other authorities. The Bundensinstitut für
Risikobewertung (BfR, the German Federal Institute for Risk Assessment) expert panel
estimated a provisional TDI of 100 ng/kg b.w. for both compounds and confirmed that
PFCs exposure through diet is very low, adding that suggested intake levels could be
indicated for those groups of people living in highly contaminated areas (BfR, 2010).
The UK Committee on Toxicity of Chemicals in Food, Consumer Products and the
Environment, based on the effects on liver, kidney, hematological and immune
systems, recommended a TDI of 3000 ng/kg b.w. for PFOA and 300 ng/kg b.w. for PFOS
(Committee on Toxicity, 2009 and 2010).
According to data reported by Haug et al., dietary exposure to PFOS and PFOA is
respectively 100 and 2500 times lower than their relative TDIs indicated by EFSA, but
this margin could be smaller for people consuming high amounts of fish products; it
must also be highlighted that these values didn’t take into account non-food sources
(Haug et al., 2010b).
Fromme et al. (2007a), who referred to both food and non-food sources, assessed that
global daily intakes are significantly lower than even the lowest recommended TDI
values, at least for adults, since children exposure profile isn’t well defined yet.
However, it must be noticed that most of the epidemiological studies on humans
available in literature have been conducted by the major manufacturer of fluorinated
chemicals and may thus report tendentious results. Further studies will clarify the
potential correlations between PFCs exposure and risks for human health.

49
1.3.1 Toxicokinetics
1.3.1.1 PFOS
In animals
PFOS kinetics has been evaluated through oral administration of PFOS-14C in rats. After
48 h, around 5% of the radioactivity was found in the feces and the intestine, therefore
it was assumed that 95% was absorbed. Measured PFOS concentrations after 89 days
reported significant levels only in liver (20.6 μg/g, corresponding to 25.21% of the
dose) and plasma (2.2 μg/g, corresponding to 2.81% of the dose); less significant
amounts were found in kidney (1.1 ng), lung (1.1 ng) and other tissues, and they were
probably due to residual blood in these organs when homogenized (OECD, 2002; EFSA,
2008).
Seacat et al. demonstrated, through daily repeated PFOS administration to rats, that it
tends to accumulate, showing 31-42% higher serum levels in female rats and no
relevant differences as regards values measured in the liver (Seacat et al., 2003).
Several studies in mice and rats reported PFOS transfer from dam to fetus during
pregnancy and indicated that fetal liver content of PFOS was about 50% compared to
maternal liver, while serum levels were similar (EFSA, 2008).
PFOS is not metabolized, after absorption it binds to serum proteins (mainly albumin)
and distributes in serum and liver; on the contrary, precursors N-MeFOSE and
N-EtFOSE are reported to be metabolized to PFOS (3M, 1999).
PFOS is mainly eliminated through the kidney and partially in the feces; its half-life was
estimated of >90 days in male rats after a single oral dose and of around 200 days in
monkeys after a 183 days administration (EFSA, 2008; OECD, 2002).
In humans
A 2004 study on Japanese pregnant women proved that PFOS can partially transfer
from maternal to fetal circulation; more recently, it was demonstrated that it can
reach the fetus also slowly crossing the placenta (EFSA, 2008).

50
Renal elimination has been demonstrated to be negligible in humans; several studies
evaluated the elimination half-life of PFOS, with quite variable results. According to 3M
Company survey on 3 former workers, it would be almost 4 years, while an
investigation on other 9 former employees reported a value of 8.67 years, with a
relevant variability between the subjects. According to EFSA Panel, the most reliable
estimation is that proposed by Olsen et al., suggesting a value of 5.44 years (EFSA,
2008, Olsen et al., 2007b).
1.3.1.2 PFOA
In animals
Also to determinate PFOA kinetics a single oral dose of radioactive-labeled molecule
on rats was used, which resulted in absorption of 93% after 24 h. Similarly to PFOS, it
mainly distributed in serum, due to its interaction with albumin, and in liver (in female
rats also in kidneys), due to its affinity for liver fatty acid-binding protein (L-FABP).
PFOA is not metabolized, but precursors 8:2 FTOH can metabolize to PFOA, which has
the potential to accumulate (EFSA, 2008; Luebker et al., 2002).
It was reported that PFOA can be transferred to the fetus via the placenta, with
measured concentrations in fetal plasma around 50% of those in maternal plasma; also
dam-to-pup transfer by lactation was proved, reporting PFOA levels in milk
corresponding to about 10% of the plasmatic concentrations (Hinderliter et al., 2005).
A significant difference concerning the urinary elimination of this compound was
observed in rats depending on the gender: during the first 24 h after administration, in
fact, female rats eliminated 91% of the dose, while male rats only 6%. These resulted
in sex-related elimination half-life values, calculated in less than 1 day for female rats
and 15 days for male rats (Vanden Heuvel et al., 1991).
This difference was due to a hormone-depending secretory mechanism involving
organic anion transporters, which testosterone was supposed to competitively inhibit.
A demonstration was given by the fact that in castrated male rats and female rats renal

51
elimination was comparable and, if they were all treated with testosterone, it was
reduced in both genders (Kudo et al., 2002).
A Butenhoff et al. study on monkeys feed a 26 weeks diet containing PFOA reported
high variability in measured levels in liver; however, estimated half-life was around 30
days for female monkeys and 21 for male monkeys (EFSA, 2008).
In humans
As for animals, also in humans PFOA rapidly distributes in serum (according to Han et
al., 2003, more than 90% is transported by albumin), but in this case its renal excretion
is irrelevant compared to rats and monkeys. Also, it was observed that PFOA plasmatic
concentrations in 20-50 years old people were more significant in males, while in >50
years old subjects there was no difference between genders, but it must noticed that
the reported Japanese study was conducted on a small number of people and
therefore its statistical values is not certain. Although only little information is
available, PFOA can cross the placenta and bioaccumulate in the fetus (EFSA, 2008).
A study concerning serum half-life of PFOA reported highly discordant values (between
1.5 and 13.5 years), with a mean of 4.37 years (EFSA, 2008). With less variability on the
26 subjects in his survey, Olsen et al. calculated a half-life for elimination from serum
equal to 3.8 years (Olsen et al., 2007b). According to a monitoring on 138 subjects who
had been exposed to PFOA contaminated drinking water few years ago in Arnsberg
(Germany), mean half-life of this contaminant in plasma would be 3.26 years. Also, a
recent study investigated PFOA trends in the serum of 200 subjects from two highly
contaminated locations in Ohio and West Virginia, after the beginning of activated
carbon water filtration: the obtained data allowed the Authors to estimate a PFOA
half-life of 2.3 years (Bartell et al., 2010).
52
1.3.2 Mechanisms of action
Even if the mechanisms by which PFCs generate toxic effects are not well known, these
compounds have been proved to be responsible for adverse effects such as
peroxisome proliferation and changes in enzymatic activity.
Various Authors indicated that PFOS and PFOA are capable of activating peroxisome
proliferator-activated receptors α (PPARα), which are ligand dependent transcription
factors acting on genes implicated in lipid metabolism, lipid and glucose homeostasis,
inflammation, cell proliferation and differentiation. In animals exposed to these
contaminants, also production of cytokines, reduction of lymphoid organs weight,
altered inflammatory response and antibody synthesis were observed. Some of these
effects have been demonstrated to be PPARα independent (Shipley et al., 2004; De
Witt et al., 2009).
PFCs can affect the metabolism of fat acids interfering with their β-oxidation, probably
due to their chemical structure being very similar to that of endogenous fat acids. It
has been shown that PFCs cause alterations in some hepatic enzymes activities,
including acyl-CoA oxidases and dehydrogenases, resulting also in decreased amounts
of triglycerides and cholesterol in the blood circle and in oxidative DNA damage. (Hu et
al., 2005; EFSA, 2008).
PFOS and PFOA are suspected endocrine disruptors, whose interference on sexual
hormones causes increased levels of oestradiol and decreased levels of testosterone;
PFCs have shown oestrogenic effects on cell cultures (Jensen and Leffers, 2008).
It has been also observed in some tests, performed in vitro on rat liver and dolphin
kidney epithelial cell lines and in vivo on rats treated with PFCs, that they can be
incorporated into the cellular membrane and reversibly inhibit gap junction
intercellular communication (Hu et al., 2002).
Since no genotoxicity for these compounds has been reported by neither in vivo nor in
vitro studies, it’s probable that their carcinogenicity is related to an indirect
mechanism (EFSA, 2008).
53
1.3.3 Toxic effects of PFOS
1.3.3.1 Effects on animals
Acute toxicity
Acute studies have been observed by various studies in rats and rabbits.
In a 1979 work, a lethal concentration (LC50, i.e. the dose causing the death of half the
treated animals) of 5.2 mg/L was estimated administering PFOS through inhalation to
several groups of rats, generating also signs of toxicity, as emaciation, breathing
problems and nasal secretion; moreover, post-mortem examination showed a variable
liver discoloration. In another study rats were treated with a single dose through
feeding tube, showing alterations in the nervous system and a LD50 of 271 and 251
ng/kg, respectively for male and female rats. Skin and eye irritation possibly caused by
PFOS was investigated on rabbits, but without significant results (OECD, 2002).
Subacute toxicity
During administration of PFOS through a 14 weeks diet, significantly increased
glycemia and liver weight (mainly in male rats) were observed; histological analysis
highlighted hypertrophy and vacuolization of the hepatocytes (Seacat et al., 2003).
Other studies on rats showed also a reduction in body weight, as well as, in some
cases, decreased levels of cholesterol and tryglicerides in blood.
Monkeys appeared to be more sensitive to PFOS than rats: they seemed to present a
steep dose-response curve, which in some cases led them to death if treated with
doses of few mg/kg/day. Alterations in thyroid hormones were also observed in these
animals (EFSA, 2008).
Chronic toxicity
A study on male and female rats being given PFOS in the diet for 104 weeks reported
hepatotoxicity in both genders within the highest doses groups (but in male rats also at
lower administered concentrations) and carcinogenicity, being responsible for raised
incidence of hepatocellular and thyroid follicular cells adenomas. Also for mammary

54
adenomas and fibroadenomas increased incidences were observed, but the obtained
data were not sufficient to ascertain if this was due to PFOS exposure (EFSA, 2008).
Based on the results concerning liver toxicity, a NOAEL for PFOS was estimated of 0.5
and 2 ppm for male and female rats, respectively (OECD, 2002).
Developmental and reproductive toxicity
Experiments conducted on rodents evaluated the effects of exposure to PFOS on dam,
fetus and newborn. Female rats and mice received PFOS at different doses via feeding
tube during the entire gestation, resulting in a dose-dependent maternal weight gain
decline and in a decrease of T3 and T4 in plasma after the first week. PFOS levels in
maternal circulation increased with dosage and were around 25% of the hepatic
concentrations, which in turn were twice higher than those measured in fetal liver. At
the highest doses (10 mg/kg b.w. per day in rat, 20 mg/kg b.w. per day in mouse), the
Authors observed reduction of fetal body weight and higher incidence of anasarca,
heart defects and cleft palate, with pups becoming pale and inactive after birth and
dying in 4-6 h. Subjects whose dams had been treated with lower concentrations
survived for a longer time (8-12 h). PFOS plasmatic concentrations in newborns were
comparable to those in dams at day 21, decreasing in the following days. In surviving
pups, persistent growth and eye-opening delays were observed, as well as
hypothyroxinemia (Thibodeaux et al., 2003; Lau et al., 2003).
In another study, reduced duration of the gestation and pup viability were observed in
female rats treated with PFOS from 6 weeks before mating till the fourth day of
lactation (Luebker et al., 2005).
Delays in physical development were observed also in rabbits, as well as in both
generations during a two-generation reproductive study in rats (EFSA, 2008).
Neurotoxicity
One dose of PFOS (of 0.75 or 11.3 mg/kg) was given by gavage to a group of 10 days
old male mice, in order to evaluate its neurotoxic potential. Alterations of the
behavior, mainly resulting in hyperactivity, were observed during experiments carried

55
out when they were 2 and 4 months old: further tests proved that these alterations
were due to the involvement of the cholinergic system (Johansson et al., 2008).
1.3.3.2 Effects on humans
Developmental toxicity
Due to PFOS wide diffusion, capacity to cross the placenta and long half-life in humans,
and to the outcomes concerning its adverse effects on the development in animals, a
number of studies have been conducted in order to verify the occurrence of similar
alterations in the population.
In a 2009 review by Olsen et al., the results of different epidemiological studies on
general population and on occupationally exposed population were summarized.
Potential correlations were studied in the general population between PFOS presence
in maternal blood or umbilical cord and anthropometric parameters of the newborns,
such as birth weight, birth length, head circumference and ponderal index. The
investigations conducted on occupationally exposed population focused on
associations between PFOS exposure of female workers from a perfluorochemical
production facility and the birth weight of their sons. According to the Authors, the
results of the mentioned works were inconsistent and, due also to the weakness of the
epidemiological analysis (relevant factors as sex of the newborn or mother’s age often
weren’t taken in account), couldn’t prove the real existence of any of these
associations (Olsen et al., 2009a).
Data collected by the Danish National Birth Cohort (DNBC) during a 1996-2002
monitoring were used to verify whether PFOS exposure could influence fecundity in
humans. Blood concentrations of this contaminant were measured in 1240 women in
early pregnancy and compared to their TTP (time to pregnancy, a commonly used
surrogate of follow-up studies to estimate fecundity), defining infertility as a reported
TTP of at least 12 months. Based on the results obtained, PFOS exposure at levels
commonly found in the developed Countries seemed to reduce fertility (Fei et al.,
2009).
56
A recent work on 123 paired samples of maternal and cord blood from Norwegian
women showed the presence of various PFCs. Concentrations in cord blood
corresponded to 30-79% of those in maternal blood, proving placental passage;
however, a more efficient transfer to the fetus was observed for short-chain
compounds and non sulfonated molecules, but also for branched PFOS isomers
(Gützkow et al., 2011).
Other effects on health
A monitoring on 2083 3M Company workers in Alabama suggested that those whose
job implied a relevant exposure to PFOS based substances had higher risk of death
from bladder cancer, but this assertion was grounded on only 3 cases. A further follow-
up study on those subjects identified 11 cases of bladder cancer, but without any
significant correlations with PFOS exposure. Occupationally exposed employees were
also subjected to cross-sectional analysis, which showed a positive correlation
between exposure to these substance and increased serum T3 and triglycerides
concentrations. Moreover, episodes of medical care in that plant had been more
frequent in the most exposed workers. However, it’s quite difficult to make firm
deductions, due to various shortcomings of these investigations, related for example
to the low number of participants and the lack of information on potential concurrent
exposure to other compounds (EFSA, 2008).
The consequences of fetal exposure to PFCs on atopic dermatitis (AD) and levels of
immunoglobulin E (IgE) were recently evaluated in Taiwan. Data were collected from
several 2 years old children, correlating their serum IgE and PFCs levels and the
potential development of AD with previously measured cord blood IgE and PFCs
concentrations. A relation between pre-natal PFOS exposure and cord blood levels of
IgE was observed, while it seemed not to have significant association with AD (Wang et
al., 2011).

57
1.3.4 Toxic effects of PFOA
1.3.4.1 Effects on animals
Acute toxicity
Studies conducted in rats suggested a lethal concentration (LC50) by inhalation of 980
mg/m3, as well as an oral LD >500 mg/kg for male rats and >250 mg/kg for female rats,
causing moderate acute toxicity. Symptoms observed after 4 h of exposure to PFOA via
inhalation included increased liver size and opacity of the cornea; upon prolonged
treatment (10 days), increased liver weight and reduction of body weight gain were
observed. A feeble skin irritation was reported in rabbits, which resulted more
sensitive than rats (EFSA, 2008).
Subacute toxicity
PFOA concentrations of 30 mg/kg through diet and of 50 mg/kg through drinking water
during 28 days resulted in increased liver weight and limited body weight gain (and
sometimes death) in rats and mice. In more extended studies, increased activity of
hepatic palmitoyl CoA oxidase (marker for peroxisome proliferation) was reported
after a 90 days oral administration of PFOA. At the histological level, hepatocellular
hypertrophy and necrosis of liver cells were observed (EFSA, 2008).
An investigation was conducted on the different responses of mice and rats exposed to
linear (now in use), 80% linear/20% branched (used in the past) and branched
(synthesized for this study) PFOA via feeding tube during 14 days. The three forms
showed similar toxicity, even if completely branched PFOA resulted less potent
compared to the others (Loveless et al., 2006).
In monkeys, oral PFOA administration of up to 30 mg/kg b.w. per day for 26 weeks
(during which weight loss and decreased food consumption were observed) caused
dose-dependent increases in liver weight, resulting from mitochondrial proliferation,
and the death of two subjects; no further macroscopic nor microscopic alterations
were observed (Butenhoff et al, 2002).

58
Chronic toxicity
Two different 2 years-long studies were carried out on rats to evaluate chronic toxicity
of PFOA. A first test on 50 male rats and 50 female rats, treated with doses of up to
14.2 and 16.1 mg/kg b.w. per day, respectively, showed dose-related decrease in body
weight gain in both sexes (but more relevant in male rats) and increase in ataxia in
female rats. Blood analysis showed decreased hematocrit, red blood cells count and
hemoglobin values in the high-dose subjects, as well as increased levels of some
enzymes in male rats. From the histological point of view, lesions and nodules were
mainly observed in the liver (including also hepatomegalocytosis, hepatocellular
necrosis, portal mononuclear cell infiltration and hepatic cystoids degeneration), testis
(with a remarkably increased incidence of Leydig cell adenomas), mammary tissue and
ovary. Based on the collected data, NOAELs of 1.3 and 1.6 mg/kg b.w. per day were
calculated for male and female rats, respectively (US EPA, 2005).
A second experiment, involving 153 male rats subjected to a dietary exposure to PFOA
of 14 mg/kg b.w. per day, confirmed the higher incidence of Leydig cell adenomas but
highlighted also a significant rise in the incidence of liver adenomas and pancreatic
acinar cell tumors. Concerning this last aspect, further investigations on pancreatic
acinar cells revealed that PFOA was responsible for increasing the incidence of
hyperplasia but not of tumor onset (EFSA, 2008).
Developmental and reproductive toxicity
Pregnant mice treated by oral gavage with PFOA doses of up to 40 mg/kg b.w. per day
during the entire gestation showed increased liver weight; dams exposed to the
highest concentration reabsorbed their litters, while those receiving medium or low
concentrations had decreased percentage of live fetuses. These latter, in turn, showed
reduced postnatal survival and body weight, as well as dose-dependent growth deficits
and delayed eyes opening (Lau et al., 2006).
Later works by other Authors reported the same results and indicated that, in addition
to intrauterine exposure, also lactation can contribute to the occurrence of the
symptoms described in newborns. NOAELs were calculated of 30 mg/kg b.w. for
59
reproductive function, 10 mg/kg b.w. for pup mortality, birth weight and sexual
maturation, <1 mg/kg b.w. for male body weight and organ weight changes (EFSA,
2008).
Neurotoxicity
In the previously mentioned study by Johansson et al. on PFOS neurotoxicity, also a
single dose of PFOA (of 0.58 or 8.7 mg/kg) was administered to 10 days old mice,
monitoring the effects when they were 2 and 4 months old. Observed symptoms
included hyperactivity and lack of habituation; tests on the response to nicotine
showed that these alterations were mediated by the cholinergic system (Johansson et
al., 2008).
1.3.4.2 Effects on humans
PFOA effects on the population were investigated at the same time as PFOS in all the
previously described works concerning the toxicity of this last. Lots of these studies
were conducted on 3M Company workers occupationally exposed to PFOA, reporting,
as for PFOS, potential correlations of this contaminant with the occurrence of various
symptoms, sometimes inconsistent with each other and often quite poor in terms of
statistical relevance.
However, similarly to PFOS, PFOA may be responsible for reduced fecundity in subjects
exposed to average environmental levels and to increased levels of IgE in cord blood
(Fei et al., 2009; Wang et al., 2011).
Also, PFOA showed a more efficient transfer to cord blood than PFOS during the study
conducted by Gützkow et al. in Norway, which results in a more relevant fetal
exposure to this compound.
Examining potential correlations of PFOA and PFOS concentrations in cord blood with
gestional age and anthropometric parameters of the newborn in 293 subjects,
Apelberg et al. suggested an association between these substances and birth weight
and birth size (Apelberg et al., 2007).
60
According to EFSA, further investigations are needed to ascertain the actual
responsibilities of PFOA and other PFCs for the described adverse effects on human
health, since other factors may contribute significantly (EFSA, 2008).
1.3.5 Other PFCs and precursors toxicity
Besides PFOS and PFOA, other PFSAs (perfluoroalkyl sulfonates) and PFCAs (carboxylic
acids) were included by some Authors in the range of analytes investigated but, due to
their less relevant presence compared to the two most found PFCs, the scientific
community has given minor attention to the potential adverse effects of these
compounds. However, in many cases they have been associated to the same effects
observed for PFOS and PFOA.
Half-life time is a specific parameter for each individual compound and, according to
various Authors, in all the species it resulted sensibly shorter in shorter-chain
molecules: therefore, PFBS and PFBA (whose chain is made of 4 carbon atoms) showed
much shorter half-lives than those of the correspondent perfluorooctane-compounds,
as well as values reported for PFNA and PFDA (9 and 10 carbon atoms, respectively)
were higher than those observed for PFOA (Ohmori et al., 2003; Olsen et al., 2009b;
Wilhelm et al., 2010).
This aspect was reflected also on the expression of the toxic potential: the longer the
chain of the molecule, the greater were the effects observed. Experiments on rats
indicated that PFBS and PFHxS, similarly to PFOS, increase the acyl CoA oxidase
activity, even if a 50 times higher concentration of PFBS compared to the other two
compounds was needed to generate similar effects; it was proved that PFHxA (only on
male rats), PFNA and PFDA induce peroxisomal β-oxidation and hepatomegaly,
depending on their concentrations in the liver (Lau et al., 2007).
Probably due to the fact that precursors FTOHs and FOSEs can be metabolized,
representing a further source of PFCAs and PFSAs, respectively, only few studies
investigated the direct toxicity of these compounds.
61
Some studies proved that 8:2 FTOH is a peroxisome proliferator and produces the
same alterations as PFOA on the hepatic metabolism and enzymatic activity; FTOHs
seem to interact with estrogen receptors. An in vitro research on hepatocytes showed
that FTOHs are extensively metabolized in rats and mice, while clearance rate is
significantly lower in humans (EFSA 2008; Harrad, 2009). In addition, assays performed
on daphnia suggested that intermediate metabolites of their degradation are up to
10000 times more toxic than the correspondent PFCAs.
FOSA resulted more toxic than other PFCs, significantly suppressing DNA production
and causing cellular oxidative stress. Its higher toxicity may be due to its potential to
easily cross cell membranes, being more hydrophobic than other compounds. Similarly
to certain PFCs, FOSA was found to inhibit gap junctional intercellular communication
(Fields, 2007; Hu et al., 2002).
Toxic effects on development and enzymatic activity in animals were reported also for
N-EtFOSE but, unlike PFOS, it doesn’t apparently induce peroxisome proliferation.
Moreover, according to in vivo and in vitro studies, also the carcinogenic activity of
FOSEs seems related to an indirect (non-genotoxic) mechanism (Xie et al., 2009; EFSA
2008).
1.4 Legislation
An assessment made by OECD (Organization for Economic Cooperation and
Development) in 2002 according to information available at that time concluded that
PFOS is a persistent contaminant, presenting bioaccumulative potential and toxic
effects on mammals.
On the basis of these statements, confirmed also by SCHER (Scientific Committee on
Health and Environmental Risks), in order to safeguard human health and the
environment the European Union decided to establish restrictions in the use and
marketing of PFOS, issuing on December 12, 2006, Directive 2006/122/EC. The
62
measures contained in this document, which is a modification of Council Directive
76/769/EEC concerning restrictions that must be applied to various dangerous
substances and preparations, should have been applied by Member States starting
from June 27, 2008. These restrictions concern all those non-food products to which
PFOS is added on purpose (also considering that it could have been used only in
singular parts of a finished item) and refer exclusively to new products. More in details,
it’s not allowed to sell or use this compound in concentrations greater than 0.005% by
mass; also, it’s not allowed to place on the market semi-finished items, or parts,
containing concentrations of PFOS higher than 0.1% by mass. However, some minor
uses of PFOS are not subjected to these limitations, because they don’t seem to be a
risk and since no alternative substances are available: these applications include
coatings for photolithography processes, photographic coatings, plating processes
(which should anyway be minimized) and hydraulic fluids for aviation. In addition, the
use of existing stocks of fire-fighting foams containing PFOS was allowed until June 27,
2011. Lastly, this Directive pointed out the need to focus the attention also on PFOA
and its salts, which are believed to have a risk potential similar to PFOS.
What reported above was subsequently included in Commission Regulation (EC) No
552/2009 of June 22, 2009, on the Registration, Evaluation, Authorization and
Restriction of Chemicals (REACH).
There are currently no restrictions set by the European Community on PFCs presence
in food and their use in plastic and paper used for food packaging is allowed in
Germany and the Netherlands.
After issuing a first opinion on PFOA ammonium salt food contamination deriving from
non-stick cookware, in 2008 EFSA (European Food Safety Authority) published a
scientific opinion on PFOS and PFOA. This document, besides being a complete and
updated source of information on perfluorinated compounds, reported the
conclusions drawn by the CONTAM Panel: the risk for humans related to exposure to
these contaminants was considered moderate, but potential effects on the
development aren’t clear yet. Moreover, it was recommended to collect further data
on PFCs concentrations in food and in the population.

63
In 2009 PFOS and its salts were included in Annex B of the Stockholm Convention,
which lists persistent organic pollutants (POPs) subjected to restrictions in use and
production.
All these factors induced the European Commission to call Member States (through
Recommendation 2010/161/EU, released on March 17, 2010) to monitor during 2010
and 2011 the presence of perfluoroalkylated substances in a wide variety of foodstuffs
of both animal and plant origin, in order to allow a reliable estimation of human
exposure. The monitoring should be directed towards PFOS and PFOA and, when
possible, their precursors (including FOSA, N-EtFOSE and 8:2 FTOH) and similar
compounds, such as homologues with different chain length and PAPS (polyfluoroalkyl
phosphate surfactants). Member States are also recommended to periodically provide
the collected data to EFSA, including available monitoring from previous years, in order
to expand the European database.
In January 2011, EFSA published an intermediate report on the monitoring,
summarizing the collected data and making recommendations to adjust current
investigations. The final report will be available in 2012.
Concerning the United States, in 2002, after the termination of PFOS manufacturing by
3M Company, the Environmental Protection Agency (US EPA) issued two SNURs
(Significant New Use Rules) in order to limit production or importation of 88
PFOS-related chemicals. 183 additional compounds were added to the list in 2007.
Similarly to European Directive 2006/122/EC, these regulations permitted the
continuation of a limited number of extremely technical applications of these
substances, resulting in very low volumes and negligible releases, since no alternatives
exist. In the event of any other use, manufacturers and importers are required to
notify the US EPA a minimum of 90 days before it occurs (US EPA, 2010).
In Canada, after the insertion of PFOS and its related substances in the list of toxic
compounds of the 1999 Canadian Environmental Protection Act (whose purpose was
to prevent pollution and protect the environment), a regulation of 2009 added these
molecules to the Virtual Elimination List. This means that Canada is the first Country
proposing a complete ban of PFOS (SOR/2009-15).

64
“Kashinhou” is the name of the in use regulation law for chemicals and dangerous
substances in Japan. Being hazardous compounds for human health, based on this law
PFOS and PFOA were designated as Type II Monitoring Chemicals, therefore
manufacturers and importers need to annually report their production or import
volume. However, after the insertion of PFOS in Annex B of the Stockholm Convention,
it has been classified as Class I Specified Chemical: as a consequence, similarly to what
happens in Europe and in the United States, its manufacturing and use is prohibited
except for specific essential uses (Yamazaki, 2009).
1.5 Methods of analysis
Perfluoroalkylated substances may significantly differ from each other concerning their
chemical and physical features, therefore multiple analytical methods exist for their
determination.
When performing analysis on these substances, the adoption of few simple but
effective measures it’s suggested in order to reduce the risk of contaminations or
losses and to guarantee the reliability of the results. During sample processing,
laboratory equipment made of glass or Teflon should not be used, since the former can
absorb PFASs while the latter represents a source of contamination (Hansen et al.,
2001); polypropylene is thus preferable, being a non-interacting material. Similarly,
contamination can occur during instrumental analysis, for this reason it’s advisable to
use also polypropylene vials and, if PTFE (polytetrafluoroethylene) tubing are mounted
on the LC system, to replace them with PEEK (polyether ether ketone) or stainless steel
tubing (Tittlemier and Braekevelt, 2011).
Samples are usually stored in refrigerators and, when performing analysis of volatile
compounds such as some PFCs precursors, it’s suggested to place them in completely
filled tubes and then in freezers, as to prevent evaporation. Fresh or thawed samples

65
are generally analyzed, but in some studies food have been freeze-dried prior to
extraction, without causing analyte losses.
To reduce the matrix-effect, complex samples are often pretreated: protein
precipitation, for example, can be achieved through the addition of acetonitrile, formic
acid or trifluoroacetic acid, followed by centrifugation.
Sample extraction can be performed in many ways, including solid phase extraction
(SPE), liquid-liquid extraction (LLE), pressurized liquid extraction (PLE), ion pairing
extraction (IPE) and solid phase microextraction (SPME, only for gas chromatography
analysis). It may be followed by a further purification of the extract, generally involving
SPE cartridges or SPE dispersive phase, aimed at the elimination of residual
interferents.
Neutral volatile perfluoroalkylated substances, presenting high vapor pressures, can be
measured with gas chromatography (GC) using medium or high polarity columns, while
anionic PFCs need to be derivatized prior to analysis with this technique. Some of the
anionic compounds have low vapor pressure and their derivatization proved to be
poorly reproducible, therefore liquid chromatography (LC) resulted a better choice for
these substances (EFSA, 2008). LC separation is performed in most cases on reversed
phase C18 columns, using a mixture of an organic solvent (such as methanol or
acetonitrile) and an aqueous solvent (typically ammonium acetate, at concentrations
between 1-20 mM) as mobile phase (de Voogt and Sáez, 2006).
Mass spectrometry (MS) has allowed relevant improvement in the analysis of
perfluoroalkylated substances, in particular since the introduction of triple quadrupole
mass spectrometers (MS/MS), which are considered the most suitable detectors for
this purpose. For PFASs detection in LC-MS(MS) systems, the most commonly used
interface is electrospray ionization (ESI), working in negative mode to generate the
pseudomolecular ions [M-H]-. In GC-MS instruments, depending on the molecules,
electronic impact (EI) as well as chemical ionization (CI) sources can be employed, in
both positive and negative mode, with methane or ammonia as reagent gas; however,
negative chemical ionization is the most widespread configuration, due to its
sensitivity.

66
Other detectors have been tested with both LC (time of flight, ion trap, fluorescence
and conductometric detectors) and GC (flame ionization and electron capture
detectors), but triple quadrupole mass spectrometer was preferred in most of cases.
Besides mass spectrometry, also other analytical techniques have been used for PFASs
analysis, including combustion methods, neutron activation and x-ray fluorescence (all
three proving to be non-specific), and later nuclear magnetic resonance (quite
unreliable in quantifications), ion exclusion chromatography (only on PFCAs) and
Fourier transform infrared spectroscopy (EFSA, 2008; de Voogt and Sáez, 2006).
To this day, not many methods have been specifically developed for the determination
of these substances in food; however, most of the techniques employed for the
analysis of biological samples can generally be used also with food items (Tittlemier et
al., 2007). One of the most frequently applied is the ion pairing extraction into methyl
tert-butyl ether (MTBE) proposed by Hansen et al. (2001), which showed great
flexibility in terms of matrices analyzed (liver, muscle, egg and others), but results
laborious and requires considerable time. Also SPE cartridges (often weak anion
exchange type) are employed in many studies; Powley et al. (2005) proposed a time
saving alternative for the detection of PFCAs based on dispersive solid phase extraction
with graphitized carbon, significantly reducing matrix-effect and maintaining good
recovery values. Taniyasu et al. (2005a) introduced the extraction by alkaline digestion
with potassium hydroxide (KOH), later modified by other Authors employing, for
example, sodium hydroxide (NaOH) (Haug et al., 2010b). A simple and rapid
pretreatment technique using pressurized liquid extraction was recently introduced by
Llorca et al. (2009): the Authors suggested that this method improves LOQs and at the
same time allows to easily process a large number of samples. Lastly, Luque et al.
(2010) developed a new approach based on solvent microextraction, which allows
simple and fast PFCs extraction with reduced solvent consumption.
LC-MS/MS resulted the analytical technique of choice for the detection of anionic PFCs
in food matrices, working in MRM (multiple reaction monitoring) mode and using
negative electrospray ionization, due to the strong electronegative character of the
fluorinated chain (Tittlemier et al, 2007).
67
1.5.1 PFCs determination in milk
Most of the works available in literature investigating the presence of perfluorinated
compounds in milk referred to human breast milk rather than milk from cow, goat or
other animals. This is easily understandable considering what described in the previous
sections: given their long half-life, PFCs enter the body through multiple routes
accumulating for years and, during lactation, migrate in relevant amounts to breast
milk, which therefore represents an alarming source of exposure for infants.
All the proposed methods were able to detect PFOS and PFOA, being the two most
found and studied molecules of the group, but in many cases other perfluoroalkyl
sulfonates (mainly PFHxS and PFDS) and carboxylic acids (in particular PFHxA, PFNA
and PFDA) were monitored as well. Moreover, also FOSA (PFOS precursor) is often
included among the target analytes, due to its recurrent non-negligible presence in
food matrices.
Various techniques have been used for the extraction of these analytes from milk.
Several methods employed weak anion exchange SPE cartridges, preceded by a
protein precipitation step through formic acid (So et al., 2006; Nakata et al., 2006;
Kärrman et al., 2007 and 2011; Tao et al., 2008a and b; Liu et al., 2010; Wang et al.,
2010), acetonitrile (Völkel et al., 2008; Thomsen et al., 2010) or methanol (Bernsmann
and Fürst, 2008; Ericson et al., 2008 Haug et al., 2010a). Some Authors performed also
a final clean up by dispersive solid phase extraction with EnviCarb (Ericson et al., 2008;
Haug et al., 2010a). Moreover, others among the cited methods included initial
enzymatic digestion through lipase and protease addition and overnight incubation at
37°C (Bernsmann and Fürst, 2008; Mosch et al., 2010) or alkaline digestion (Haug et al.,
2010a; Llorca et al., 2010).
The ion pairing extraction technique, introduced by Hansen et al., has been used for
the detection of PFOS and PFOA in human breast milk samples by Guerranti et al.
(2011).

68
A recently proposed approach employs an extraction with formic acid, acetonitrile,
magnesium sulfate and sodium chloride, followed by the already mentioned clean up
with dispersive EnviCarb (Lacina et al., 2011).
All the existing methods employ LC systems: more in particular, HPLC (high
performance liquid chromatography) results the standard equipment for this kind of
analysis being used in most of cases, even if few of the most recent works the method
was optimized for UHPLC (ultra high performance liquid chromatography) instruments,
significantly reducing the time of analysis (Haug et al., 2010a; Liu et al., 2010; Kärrman
et al., 2011; Lacina et al., 2011).
Separation was generally achieved through C18 columns, due to their versatility and
efficiency; the only exception is the method proposed by Lacina et al., which employed
a T3 column, specifically conceived for the retention of polar organic compounds.
Also the choice of the mobile phase is a common point between the various
techniques: a mixture of methanol and ammonium acetate aqueous buffer (at
different concentrations, generally in the range 1-20 mM) was used by all the Authors
except for Nakata et al., who chose acetonitrile as organic phase.
As for the detector, triple quadrupole mass spectrometer (equipped with ESI source in
negative mode) working in MRM mode was the shared choice in almost all cases.
Some Authors employed quadrupole-linear ion trap (Q-LIT) mass spectrometers as
well, but always working in MRM mode; however Llorca et al. (2010) tested also the
enhanced production ion (EPI) and MS3 modes that this kind of instrument offers,
reporting its limitation given by the low stability of fragment ions in the LIT.
Concerning the performances of the different approaches, various Authors reported
limits of detection in the range of 0,01-0,1 ng/mL, depending on the compound; few
works declared even better performances, with limits of detection <0,01 ng/mL
(Thomsen et al., 2010; Liu et al., 2010; Lacina et al., 2011).
69
1.5.2 Analysis of PFCs volatile precursors
FOSES and FTOHs are more difficult to ionize than PFCs and tend to form adducts
easily, therefore their analysis in LC-MS/MS it’s quite difficult and requires all buffers
to be removed from the system (Taniyasu et al., 2005b; Szostek et al., 2006).
Perfluorooctane sulfonamido ethanols (N-MeFOSE and N-EtFOSE) have been
investigated mainly in air (Martin et al., 2002; Barber et al., 2007; Jahnke et al., 2007;
Loewen et al., 2008) and house dust samples (Shoeib et al., 2005; Haug et al., 2011b),
while no studies on food matrices have been performed. Analytes extraction was
obtained using glass/quartz-fiber filters and XAD-2 resin inserted between
polyurethane foam plugs or through Isolute ENV+ solid phase extraction cartridges.
GC-MS/MS systems, equipped with chemical ionization sources, were employed for
the analysis.
Fluorotelomer alcohols have often been investigated in air and house dust samples
together with FOSEs by the previously cited Authors. However, FTOHs have been
analyzed also in other matrices, such as water (Taniyasu et al., 2005b; Szostek et al.,
2006; Motegi et al., 2010), soil (Ellington et al., 2009), plants (Yoo et al., 2011), food
contact materials (Fengler et al., 2011) and biological matrices including plasma, liver,
muscle and egg (Szostek and Prickett, 2004; Taniyasu et al., 2005b; Chu and Letcher,
2008). Different types of SPE cartridges (often Oasis® WAX and Oasis® HLB) were used
for the extraction, while Szostek and Prickett, as well as Ellington et al., employed
methyl tert-butil ether (MTBE). Gas chromatography was generally chosen for the
analysis, but in some cases they were performed in LC-MS/MS systems; in particular,
Chu and Letcher reported very good results employing a LC-APPI-MS/MS system
(atmospheric pressure photoionization), which showed increased ionization capability
and decreased matrix-effect, resulting in higher sensitivity and linearity compared to
ESI (Chu and Letcher, 2008).

71
2. Objectives of the experiment
Perfluorinated compounds are a group of chemicals that have been largely employed
during the last 60 years in several applications, widely spreading and accumulating in
the environment due to their extreme resistance to degradation. As a consequence,
they have been found also in various types of food as well as in drinking water, proving
that they can easily reach humans through the diet. The available information
concerning their adverse effects on health has recently increased the interest towards
these contaminants and highlighted the importance of investigating all the potential
sources of human exposure, among which diet was proved to be the most relevant.
This need has been underlined by the European Union through Recommendation
2010/161/EU: in this document, Member States were called to monitor the presence
of perfluoroalkylated substances in food, in order to produce accurate estimations of
exposure.
In consideration of the above, the purpose of the research presented in this thesis was
to develop efficient tools for the analysis of these pollutants in food, to be used for
generating useful data on potentially contaminated matrices.
This work is the result of a partnership between two laboratories: CABA-Lab –
Laboratorio di Chimica Analitica e Bio-Agroalimentare (Department of Veterinary
Medical Sciences, University of Bologna, Italy) and LABERCA – Laboratoire d’Etude des
Résidus et Contaminants dans les Aliments (Oniris Nantes Atlantique, France).
The first phase of the project consisted of a 3 months period at LABERCA, during which
an analytical method for the quantification of several perfluorinated compounds in
cow milk, human breast milk and powder milk by means of liquid chromatography
(HPLC) coupled to tandem mass spectrometry (MS/MS) and high resolution mass
spectrometry (HRMS) was optimized and validated in compliance with European
Regulations. Moreover, within this experiment, data on PFCs presence in some French
72
milk samples were collected in order to be compared to those from other countries
and also to estimate the risk of exposure for breastfed infants.
The second work package was carried out in the following months at CABA-Lab and its
purpose was to transfer the previously developed method to the instrumentation
available in the Italian laboratory, an ultra high performance liquid chromatography
(UHPLC)-tandem mass spectrometry (MS/MS) system. Then, the same technique was
used for the quantification of the two most important and frequently found PFCs
(PFOS and PFOA) in a number of cow and human breast milk samples from Italy, in
order to obtain data on these matrices also for this country.
The third part of the activity was conducted during another 3 months at LABERCA and
was focused not on the already investigated substances, but rather on their
precursors. In fact, as reported by the previously mentioned European Commission
Recommendation 2010/161/EU, in order to make complete and reliable evaluations of
the presence of PFCs in food matrices also other molecules, which can break down to
give PFCs, should be considered. Therefore, preliminary tests were conducted for the
detection of these precursors in fish (which is indicated as the most contaminated food
by perfluoroalkylated substances), leading to the development of one of the first
methods ever for their analysis in food matrices.
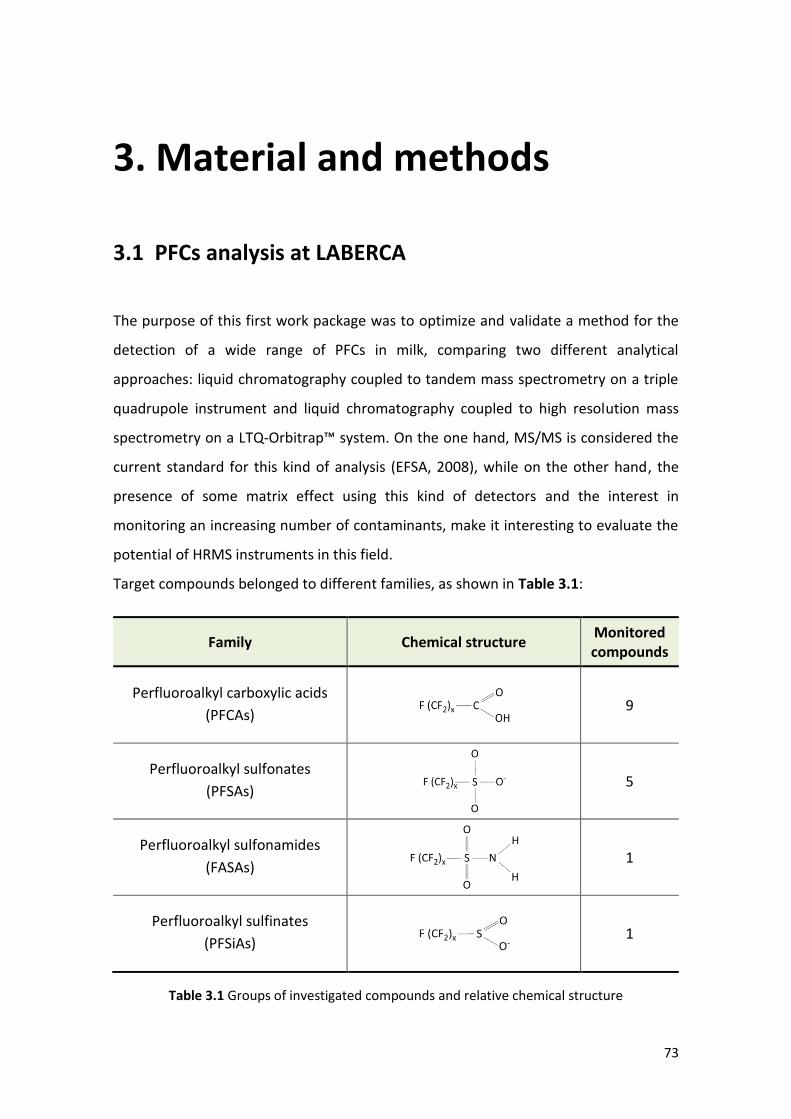
73
3. Material and methods
3.1 PFCs analysis at LABERCA
The purpose of this first work package was to optimize and validate a method for the
detection of a wide range of PFCs in milk, comparing two different analytical
approaches: liquid chromatography coupled to tandem mass spectrometry on a triple
quadrupole instrument and liquid chromatography coupled to high resolution mass
spectrometry on a LTQ-Orbitrap™ system. On the one hand, MS/MS is considered the
current standard for this kind of analysis (EFSA, 2008), while on the other hand, the
presence of some matrix effect using this kind of detectors and the interest in
monitoring an increasing number of contaminants, make it interesting to evaluate the
potential of HRMS instruments in this field.
Target compounds belonged to different families, as shown in Table 3.1:
Family Chemical structure Monitored compounds
Perfluoroalkyl carboxylic acids
(PFCAs)
9
Perfluoroalkyl sulfonates
(PFSAs)
5
Perfluoroalkyl sulfonamides
(FASAs)
1
Perfluoroalkyl sulfinates
(PFSiAs)
1
Table 3.1 Groups of investigated compounds and relative chemical structure

74
The analysis of various cow milk, human breast milk and powder milk samples from
France, carried out during method development and validation, provided also
preliminary data on PFCs contamination of these three matrices in this country.
3.1.1 Material
Standards
All standards employed were from Wellington Laboratories (Wellington, Canada) with
a purity grade >98% in methanol. Standards of the following PFCs were used:
PFBA Perfluoro-n-butanoic acid a
PFPA Perfluoro-n-pentanoic acid a
PFHxA Perfluoro-n-hexanoic acid a
PFHpA Perfluoro-n-heptanoic acid a
PFOA Perfluoro-n-octanoic acid a
PFNA Perfluoro-n-nonanoic acid a
PFDA Perfluoro-n-decanoic acid a
PFUnA Perfluoro-n-undecanoic acid a
PFDoA Perfluoro-n-dodecanoic acid a
PFBS Potassium perfluoro-1-butanesulfonate b
PFHxS Sodium perfluoro-1-hexanesulfonate b
PFHpS Sodium perfluoro-1-heptanesulfonate b
PFOS Sodium perfluoro-1-octanesulfonate b
PFDS Sodium perfluoro-1-decanesulfonate b
FOSA Perfluoro-1-octane sulfonamide c
PFOSi Sodium perfluoro-1-octanesulfinate acid c
a in “PFC-MXA” mixture solution in methanol at a concentration of 2 μg/mL (1.2 mL)
b in “PFS-MXA” mixture solution in methanol at a concentration of 2 μg/mL (1.2 mL)
c in individual solution in methanol at a concentration of 50 μg/mL (1.2 mL)
75
As internal standards, these 13C-labeled compounds in individual methanol solutions
(50 μg/mL, 1.2 mL) were purchased:
M-PFBA Perfluoro-n-[1,2,3,4-13C4]butanoic acid
M-PFOA Perfluoro-n-[1,2,3,4-13C4]octanoic acid
M-PFNA Perfluoro-n-[13C9]nonanoic acid
M-PFDA Perfluoro-n-[1,2-13C2]decanoic acid
M-PFUnA Perfluoro-n-[1,2,3,4,5,6,7-13C7]undecanoic acid
M-PFDoA Perfluoro-n-[1,2-13C2]dodecanoic acid
M-PFHxS Sodium perfluoro-1-[18O2]hexanesulfonate
M-PFOS Sodium perfluoro-1-[1,2,3,4-13C4]octanesulfonate
M-FOSA Perfluoro-1-[13C8]octane sulfonamide
M-PFOSi Sodium perfluoro-1-[1,2,3,4-13C4]octanesulfinate
After preparing 10 μg/mL stock solutions for all the compounds, the following working
solutions were obtained by dilution:
o MIX PFC 10 ng/mL and MIX PFC 1 ng/mL, containing all the 16 PFCs listed above
o MIX M-PFC 10 ng/mL, containing the 10 M-PFCs listed above
A fluorometholone solution in methanol, at 10 μg/mL, was used as external standard.
All solutions were stored in the refrigerator at 4 °C and away from light.
Reagents and chemicals
Solvents employed for sample preparation and LC analysis:
Methanol Picograde® (Promochem)
Acetone Picograde® (Promochem)
Ammonium acetate, Reag. Ph Eur (Merck)
Ammonia solution 32%, extrapure (Merck)
Glacial acetic acid (SDS)
Formic acid, reagent grade (Sigma Aldrich)
Ultrapure water (produced directly in the laboratory)
76
To extract the analytes from milk, two different solid phase extraction (SPE) cartridges
were used:
Oasis® HLB cartridges: 6 cc, 500 mg, 60 µm (Waters, Milford MA, USA)
Supelclean™ ENVI-Carb™ cartridges: 6 cc, 500 mg, 120-400 mesh (Supelco,
Bellefonte PA, USA)
Prepared solutions
o Ammonium acetate solution 20 mM: 1.54 g of ammonium acetate was
dissolved in 1 L of ultrapure water and shaken vigorously
o Formic acid 0.1 M: 3.8 mL of formic acid and 996.2 mL of pure water were
mixed in a 1 L bottle and shaken vigorously
Samples
Milk samples employed for method development and validation included:
Human breast milk: 11 samples, obtained from a hospital in Nantes
Cow milk: 9 commercial samples, purchased from various large retailers in the
area of Nantes
Powder milk: 4 samples, purchased from large retailers in the Nantes area
(diluted 1:3 in ultrapure water)
Collected samples were transferred into polypropylene bottles, in order to prevent the
risk of PFCs contamination caused by the original packaging material, and then stored
in a freezer at -18 °C until analysis.
77
3.1.2 Equipment
HPLC-MS/MS system
An Agilent HP 1200 series HPLC pump (Agilent Technologies, Santa Clara CA, USA),
provided with binary LC-pump (G1312B), vacuum degasser (G1379B), temperature
controlled autosampler (G1367D) and thermostated column compartment (G1316B),
was interfaced with an Agilent 6410 triple quadrupole mass spectrometer, equipped
with ESI interface (Agilent Technologies, Santa Clara CA, USA).
A Phenomenex Gemini® reversed-phase C18 column (50 x 2.0 mm, 3.0 µm), fitted with
a Phenomenex guard column with the same packing (10 x 2.0 mm, 3.0 µm)
(Phenomenex, Torrance CA, USA), was employed for chromatographic separation.
Agilent Mass Hunter Workstation software was used for data acquisition and
processing (Agilent Technologies, Santa Clara CA, USA).
A Schmidlin N2-Mistral-4 generator (Schmidlin Labor & Service, Neuheim, Switzerland)
supplied the nitrogen needed for the ion source and used as collision gas.
HPLC-HRMS system
The HPLC system was an Agilent HP 1200 binary pump (Agilent Technologies, Santa
Clara CA, USA), equipped with binary LC-pump (G1312B), vacuum degasser (G1379B),
temperature controlled autosampler (G1367D) and thermostated column
compartment (G1316B). This separation module was interfaced with a Thermo LTQ-
Orbitrap™ Discovery system, consisting of a linear ion trap coupled with an orbital
trap, equipped with an ESI ion source (Thermo Fisher Scientific, Bremen, Germany).
Chromatographic separation was achieved using a Phenomenex Gemini® reversed-
phase C18 column (50 x 2.0 mm, 3.0 µm), fitted with a Phenomenex guard column
with the same packing (10 x 2.0 mm, 3.0 µm) (Phenomenex, Torrance CA, USA).
Data were acquired and processed using Thermo Xcalibur™ 2.0 software (Thermo
Fisher Scientific, Bremen, Germany).
78
Nitrogen required for instrument operation was produced by a Schmidlin N2-Mistral-4
generator (Schmidlin Labor & Service, Neuheim, Switzerland).
Other equipment
The following equipment was used during the development of the method and for
samples preparation:
Solid phase extraction manifold (Supelco, Bellefonte PA, USA)
Centrifuge (Jouan, Winchester VA, USA)
Microcentrifuge (Thermo Fisher Scientific, Bremen, Germany)
Water purification system (Barnstead, Germany)
Nitrogen sample concentrator
Thermostated dry bath (Fisher Scientific, Illkirch, France)
Automatic pipettes (Eppendorf, Hamburg, Germany)
Vortex mixer
Ultrasonic bath
3.1.3 Instrumental conditions
LC conditions
The mobile phase consisted of:
Phase A: ammonium acetate solution 20 mM
Phase B: methanol
Analysis were carried out under programmed conditions, at flow rate of 0.6 mL/min.
After 2 min at 70% A and 30% B, the gradient switched linearly to 0% A and 100% B
over 5 min, remained in this conditions for 4 min and then returned to 30% A and 70%
B in 4 min. A further 5 min at the starting conditions were needed to equilibrate the
column before the following injection.
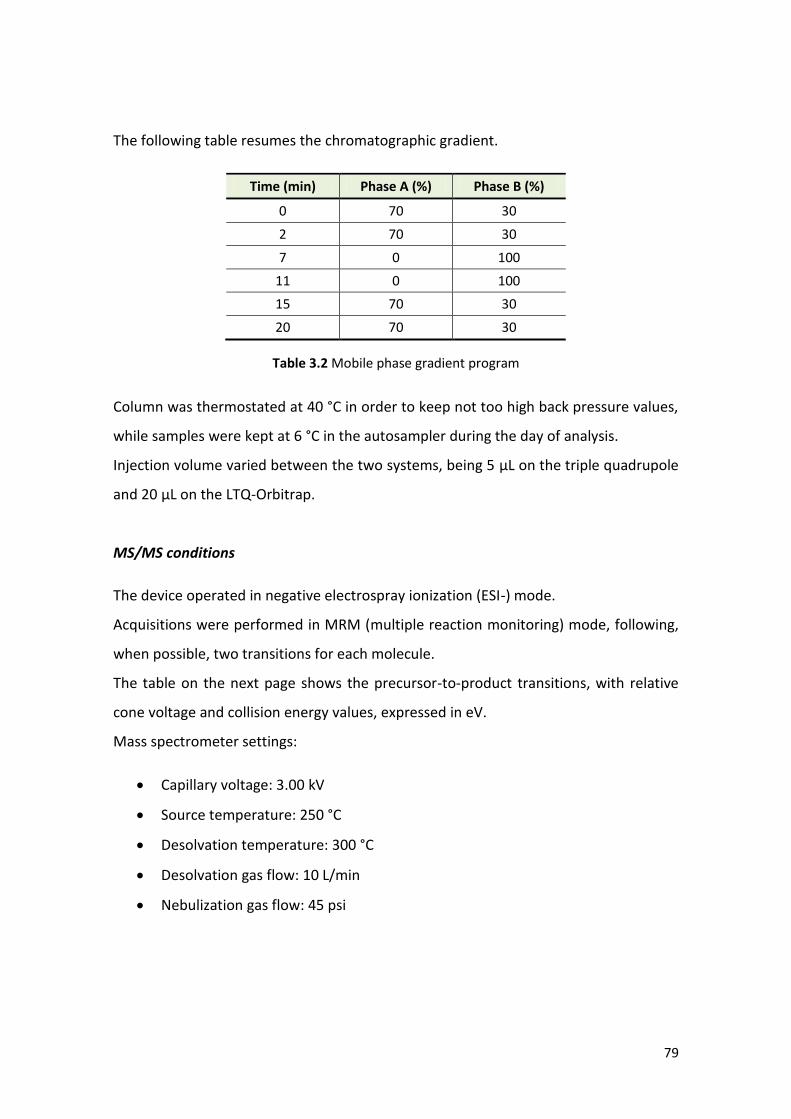
79
The following table resumes the chromatographic gradient.
Time (min) Phase A (%) Phase B (%)
0 70 30
2 70 30
7 0 100
11 0 100
15 70 30
20 70 30
Table 3.2 Mobile phase gradient program
Column was thermostated at 40 °C in order to keep not too high back pressure values,
while samples were kept at 6 °C in the autosampler during the day of analysis.
Injection volume varied between the two systems, being 5 µL on the triple quadrupole
and 20 µL on the LTQ-Orbitrap.
MS/MS conditions
The device operated in negative electrospray ionization (ESI-) mode.
Acquisitions were performed in MRM (multiple reaction monitoring) mode, following,
when possible, two transitions for each molecule.
The table on the next page shows the precursor-to-product transitions, with relative
cone voltage and collision energy values, expressed in eV.
Mass spectrometer settings:
Capillary voltage: 3.00 kV
Source temperature: 250 °C
Desolvation temperature: 300 °C
Desolvation gas flow: 10 L/min
Nebulization gas flow: 45 psi

80
Analyte Transition 1
(m/z) Cone
voltage Collision energy
Transition 2 (m/z)
Cone voltage
Collision energy
PFBA 212.9 > 168.9 60 5
M-PFBA 216.9 > 171.9 60 5
PFPA 262.9 > 218.9 60 5
PFHxA 312.9 > 268.9 60 5 268.9 > 118.9 100 15
PFHpA 362.9 > 318.9 70 5 318.9 > 168.9 100 10
PFOA 412.9 > 368.9 80 5 412.9 > 169.1 80 15
M-PFOA 416.9 > 371.9 80 5
PFNA 462.9 > 418.9 90 5 418.9 > 168.9 120 15
M-PFNA 471.9 > 426.9 90 5
PFDA 512.9 > 468.9 90 5 468.9 > 218.9 130 15
M-PFDA 514.9 > 469.9 90 5
PFUnA 562.9 > 518.9 80 5 562.9 > 268.9 120 15
M-PFUnA 569.9 > 524.9 80 5
PFDoA 612.9 > 568.9 100 5 612.9 > 168.9 120 25
M-PFDoA 614.9 > 569.9 100 5
PFBS 298.9 > 99.0 120 40 298.9 > 80.0 120 40
PFHxS 398.9 > 99.0 80 50 398.9 > 80.0 80 50
M-PFHxS 402.9 > 84.0 80 50
PFHpS 448.9 > 99.0 60 45 448.9 > 80.0 60 45
PFOS 498.9 > 80.0 60 45 498.9 > 99.0 60 45
M-PFOS 502.9 > 502.9 60 15
PFDS 598.9 > 80.0 80 50 598.9 > 99.00 80 50
FOSA 497.9 > 78.1 150 35 497.9 > 219.0 150 25
M-FOSA 506.0 > 78.1 150 35
PFOSi 483.0 > 419.0 80 15 483.0 > 219.0 80 5
M-PFOSi 487.0 > 423.0 80 15
Table 3.3 Monitored transitions and their individual parameters

81
HRMS conditions
The instrument operated in negative electrospray ionization mode (ESI-), recording
mass spectra from 200 to 900 m/z in full scan mode, with a resolution of 15000 FWHM
at 400 m/z in centroid mode.
For each analyte and the corresponding internal standard, the pseudomolecular ion
[M-H]- at its exact mass was extracted from full scan recording, using the m/z values
reported in Table 3.4.
Mass spectrometer parameters:
Capillary voltage: 4.00 kV
Cone voltage: -14 V
Nebulization gas temperature: 280 °C
Sheath gas flow (nitrogen): 6 (arbitrary unit)
Tube lens voltage: -85 V
Analyte [M-H]- exact mass
(m/z) Analyte
[M-H]- exact mass (m/z)
PFBA 212.9792 PFDoA 612.9536
M-PFBA 216.9926 M-PFDoA 614.9603
PFPA 262.9760 PFBS 298.9429
PFHxA 312.9728 PFHxS 398.9366
PFHpA 362.9696 M-PFHxS 402.9450
PFOA 412.9664 PFHpS 448.9334
M-PFOA 416.9798 PFOS 498.9302
PFNA 462.9632 M-PFOS 502.9302
M-PFNA 471.9934 PFDS 598.9238
PFDA 512.9600 FOSA 497.9462
M-PFDA 514.9667 M-FOSA 505.9730
PFUnA 562.9568 PFOSi 482.9353
M-PFUnA 569.9803 M-PFOSi 486.9487
Table 3.4 Pseudomolecular ions HRMS diagnostic signals
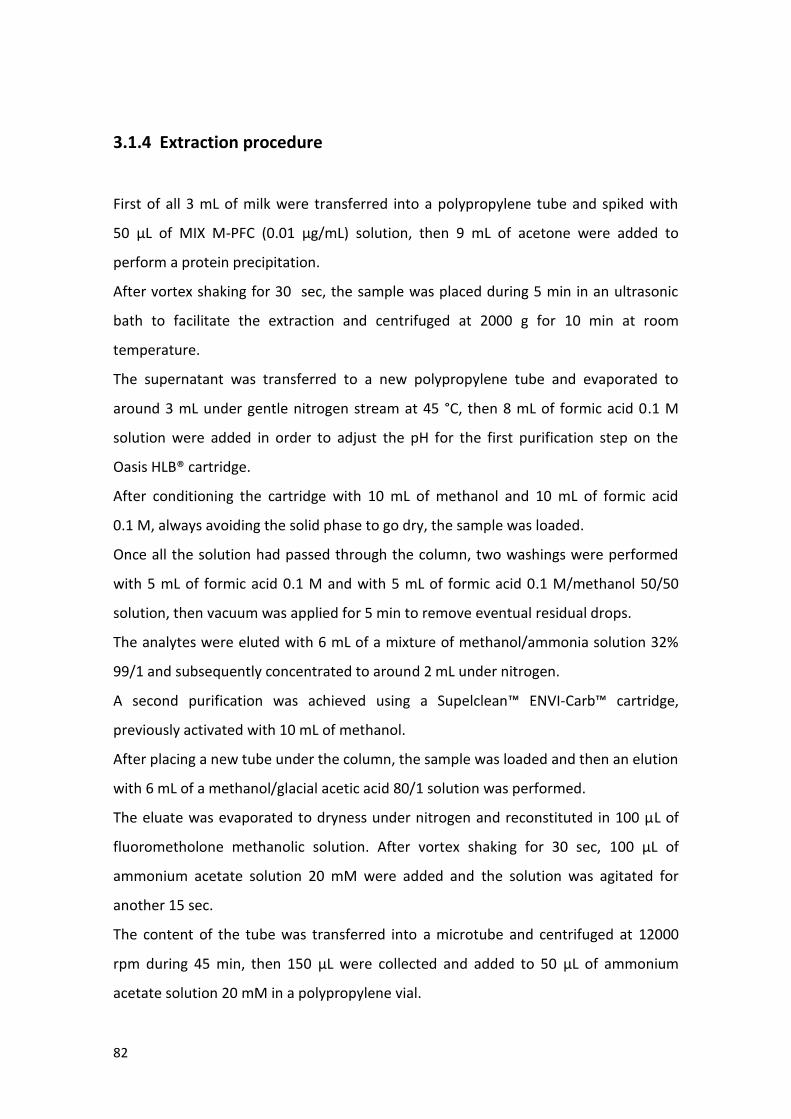
82
3.1.4 Extraction procedure
First of all 3 mL of milk were transferred into a polypropylene tube and spiked with
50 μL of MIX M-PFC (0.01 μg/mL) solution, then 9 mL of acetone were added to
perform a protein precipitation.
After vortex shaking for 30 sec, the sample was placed during 5 min in an ultrasonic
bath to facilitate the extraction and centrifuged at 2000 g for 10 min at room
temperature.
The supernatant was transferred to a new polypropylene tube and evaporated to
around 3 mL under gentle nitrogen stream at 45 °C, then 8 mL of formic acid 0.1 M
solution were added in order to adjust the pH for the first purification step on the
Oasis HLB® cartridge.
After conditioning the cartridge with 10 mL of methanol and 10 mL of formic acid
0.1 M, always avoiding the solid phase to go dry, the sample was loaded.
Once all the solution had passed through the column, two washings were performed
with 5 mL of formic acid 0.1 M and with 5 mL of formic acid 0.1 M/methanol 50/50
solution, then vacuum was applied for 5 min to remove eventual residual drops.
The analytes were eluted with 6 mL of a mixture of methanol/ammonia solution 32%
99/1 and subsequently concentrated to around 2 mL under nitrogen.
A second purification was achieved using a Supelclean™ ENVI-Carb™ cartridge,
previously activated with 10 mL of methanol.
After placing a new tube under the column, the sample was loaded and then an elution
with 6 mL of a methanol/glacial acetic acid 80/1 solution was performed.
The eluate was evaporated to dryness under nitrogen and reconstituted in 100 μL of
fluorometholone methanolic solution. After vortex shaking for 30 sec, 100 μL of
ammonium acetate solution 20 mM were added and the solution was agitated for
another 15 sec.
The content of the tube was transferred into a microtube and centrifuged at 12000
rpm during 45 min, then 150 μL were collected and added to 50 μL of ammonium
acetate solution 20 mM in a polypropylene vial.
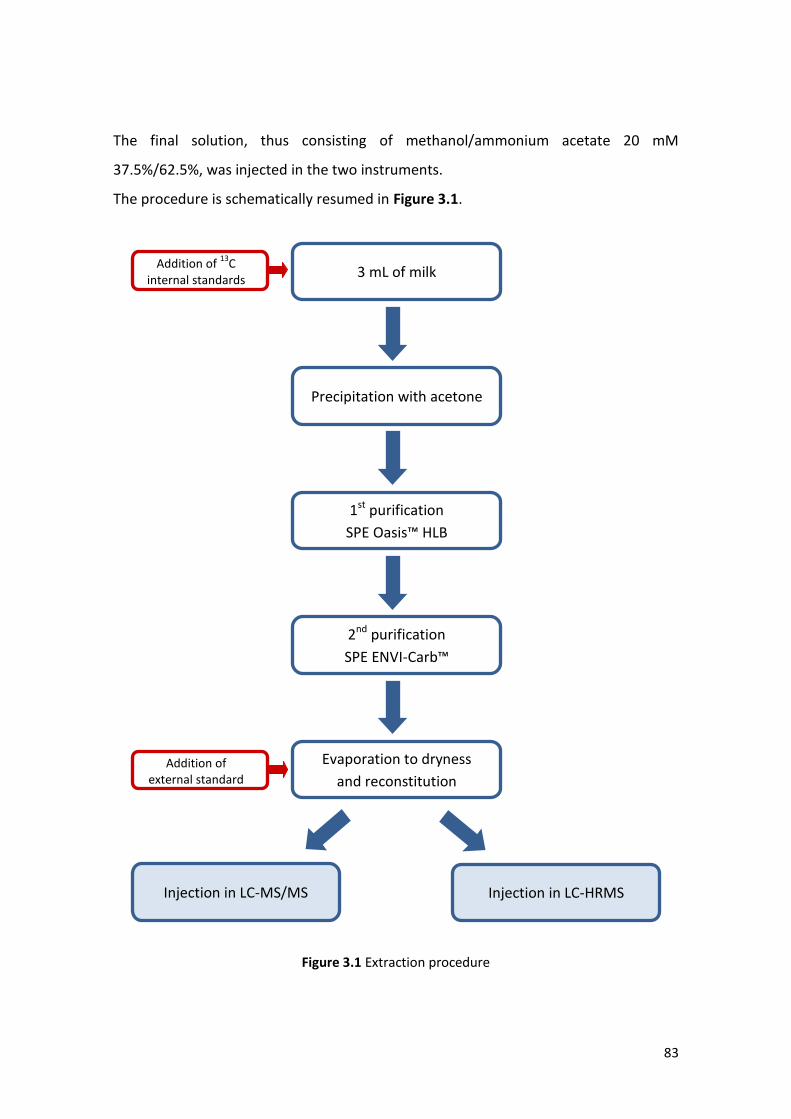
83
1st purification
SPE Oasis™ HLB
2nd purification
SPE ENVI-Carb™
Evaporation to dryness
and reconstitution Addition of
external standard
Injection in LC-HRMS
Precipitation with acetone
Addition of 13
C internal standards
The final solution, thus consisting of methanol/ammonium acetate 20 mM
37.5%/62.5%, was injected in the two instruments.
The procedure is schematically resumed in Figure 3.1.
Figure 3.1 Extraction procedure
3 mL of milk
Injection in LC-MS/MS
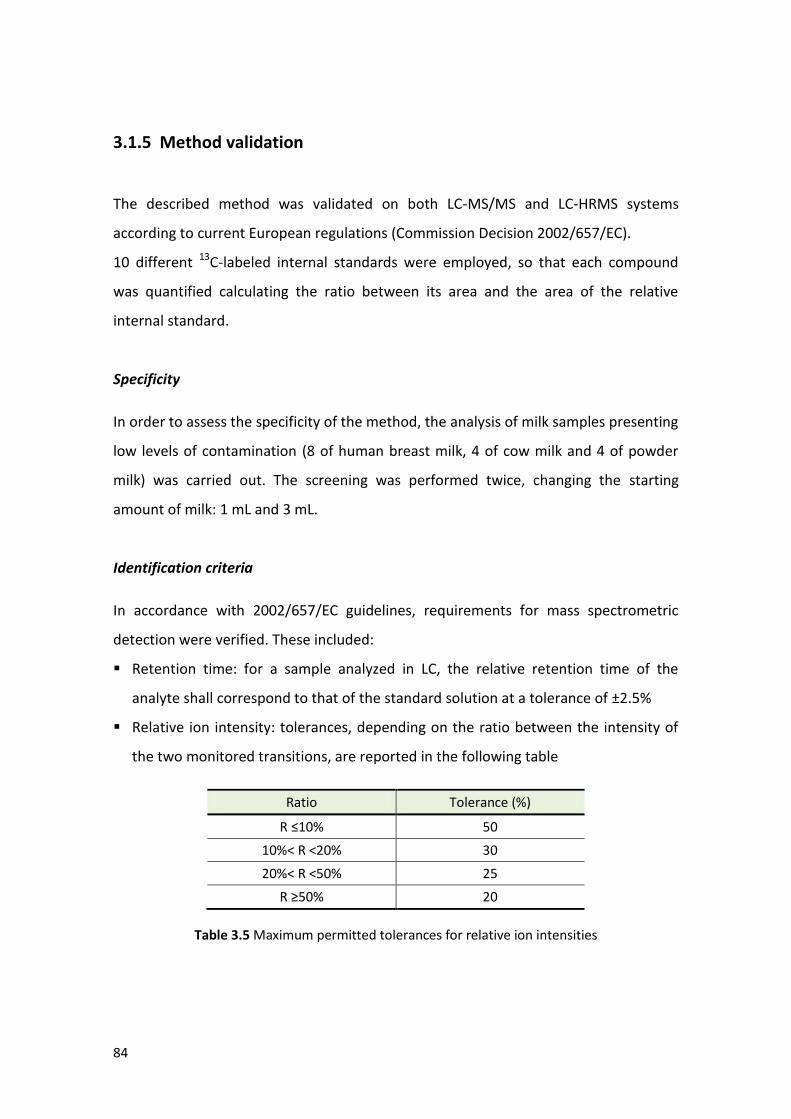
84
3.1.5 Method validation
The described method was validated on both LC-MS/MS and LC-HRMS systems
according to current European regulations (Commission Decision 2002/657/EC).
10 different 13C-labeled internal standards were employed, so that each compound
was quantified calculating the ratio between its area and the area of the relative
internal standard.
Specificity
In order to assess the specificity of the method, the analysis of milk samples presenting
low levels of contamination (8 of human breast milk, 4 of cow milk and 4 of powder
milk) was carried out. The screening was performed twice, changing the starting
amount of milk: 1 mL and 3 mL.
Identification criteria
In accordance with 2002/657/EC guidelines, requirements for mass spectrometric
detection were verified. These included:
Retention time: for a sample analyzed in LC, the relative retention time of the
analyte shall correspond to that of the standard solution at a tolerance of ±2.5%
Relative ion intensity: tolerances, depending on the ratio between the intensity of
the two monitored transitions, are reported in the following table
Ratio Tolerance (%)
R ≤10% 50
10%< R <20% 30
20%< R <50% 25
R ≥50% 20
Table 3.5 Maximum permitted tolerances for relative ion intensities

85
Linearity
Linearity was evaluated on each matrix through the analysis of calibration curves,
prepared during three different days: 1 mL milk samples were spiked at 7 different
levels of concentration (plus blank), following the scheme reported in Table 3.6.
A linear regression model was applied, associating the relative response of target
compound to the concentration.
Name Concentration (ng/mL = ppb)
µL MIX M-PFC (10 ng/mL)
µL MIX PFC (1 ng/mL)
µL MIX PFC (10 ng/mL)
G 0 0 50 - -
G 0.025 0.025 50 25 -
G 0.05 0.05 50 50 -
G 0.1 0.1 50 100 -
G 0.2 0.2 50 200 -
G 0.5 0.5 50 - 50
G 1 1 50 - 100
G 2 2 50 - 200
Table 3.6 Calibration curve preparation
Limits of detection
Limits of detection were determined for both systems taking into account the
chromatograms resulting from the analysis of cow milk’s calibration curve.
For LC-MS/MS system, limits were calculated as the concentration giving a signal-to-
noise ratio of 3; for LC-HRMS system, being important that no noise is observed in the
chromatograms, limits were evaluated on the basis of the differences between peaks
areas.
Recovery
To verify the recovery of the analytical procedure, for each matrix two samples spiked
at 0.5 ng/mL, one before extraction and the other immediately after, were compared.
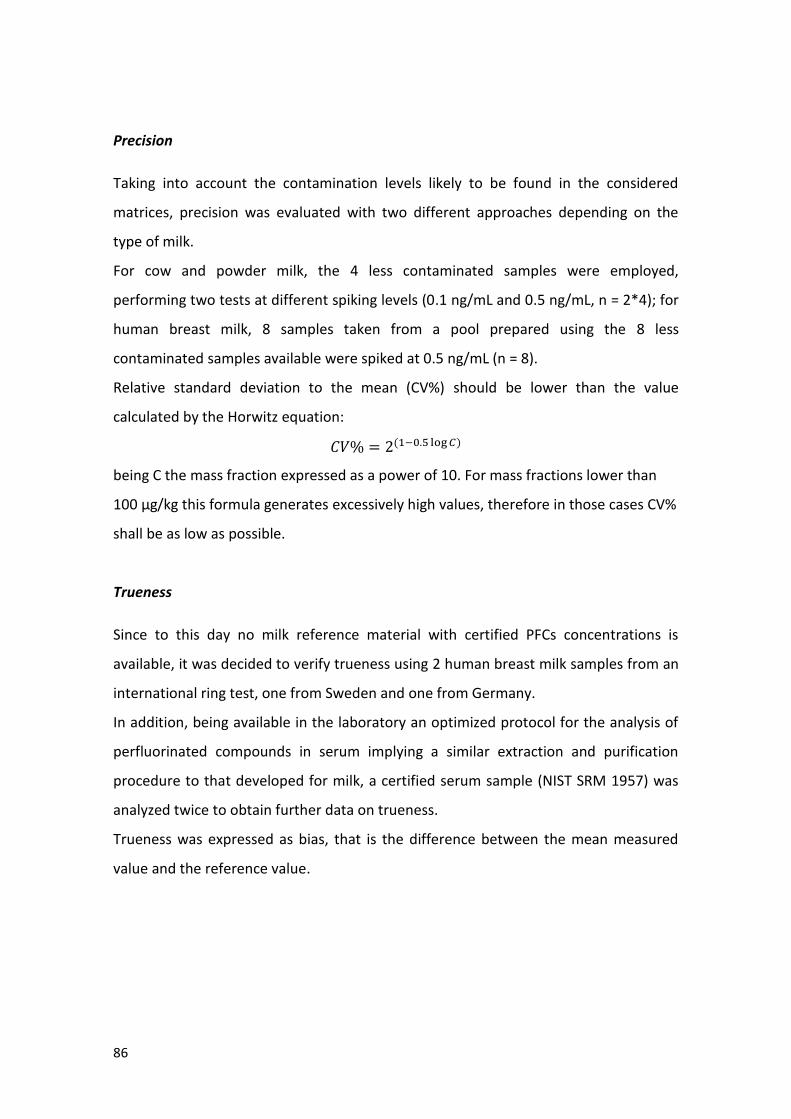
86
Precision
Taking into account the contamination levels likely to be found in the considered
matrices, precision was evaluated with two different approaches depending on the
type of milk.
For cow and powder milk, the 4 less contaminated samples were employed,
performing two tests at different spiking levels (0.1 ng/mL and 0.5 ng/mL, n = 2*4); for
human breast milk, 8 samples taken from a pool prepared using the 8 less
contaminated samples available were spiked at 0.5 ng/mL (n = 8).
Relative standard deviation to the mean (CV%) should be lower than the value
calculated by the Horwitz equation:
being C the mass fraction expressed as a power of 10. For mass fractions lower than
100 µg/kg this formula generates excessively high values, therefore in those cases CV%
shall be as low as possible.
Trueness
Since to this day no milk reference material with certified PFCs concentrations is
available, it was decided to verify trueness using 2 human breast milk samples from an
international ring test, one from Sweden and one from Germany.
In addition, being available in the laboratory an optimized protocol for the analysis of
perfluorinated compounds in serum implying a similar extraction and purification
procedure to that developed for milk, a certified serum sample (NIST SRM 1957) was
analyzed twice to obtain further data on trueness.
Trueness was expressed as bias, that is the difference between the mean measured
value and the reference value.

87
Uncertainty
Measurement uncertainty for PFOA and PFOS was evaluated on the LC-HRMS system,
considering precision, trueness and standards purity.
Uncertainty in precision (Uprecision) was calculated on the basis of the repeatability
data obtained from the analyzed samples and from three further series of eight
human breast milk samples (spiked at 0.1, 0.25 and 0.75 ng/mL), added to increase
the statistical significance of the value. To calculate CV% the following formula was
used:
For trueness, uncertainty (Utrueness) was evaluated as a ratio between the bias and
the certified value (in this case, the mean of the values obtained for the 2 ring test’s
human breast milk samples was used):
Uncertainty related to standard solutions purity (Upurity) was calculated through this
formula:
Combining the obtained factors, relative combined uncertainty (URC) resulted from this
equation:
Then, final uncertainty (UF), with a 95% confidence interval, was calculated as twice
the relative combined uncertainty:
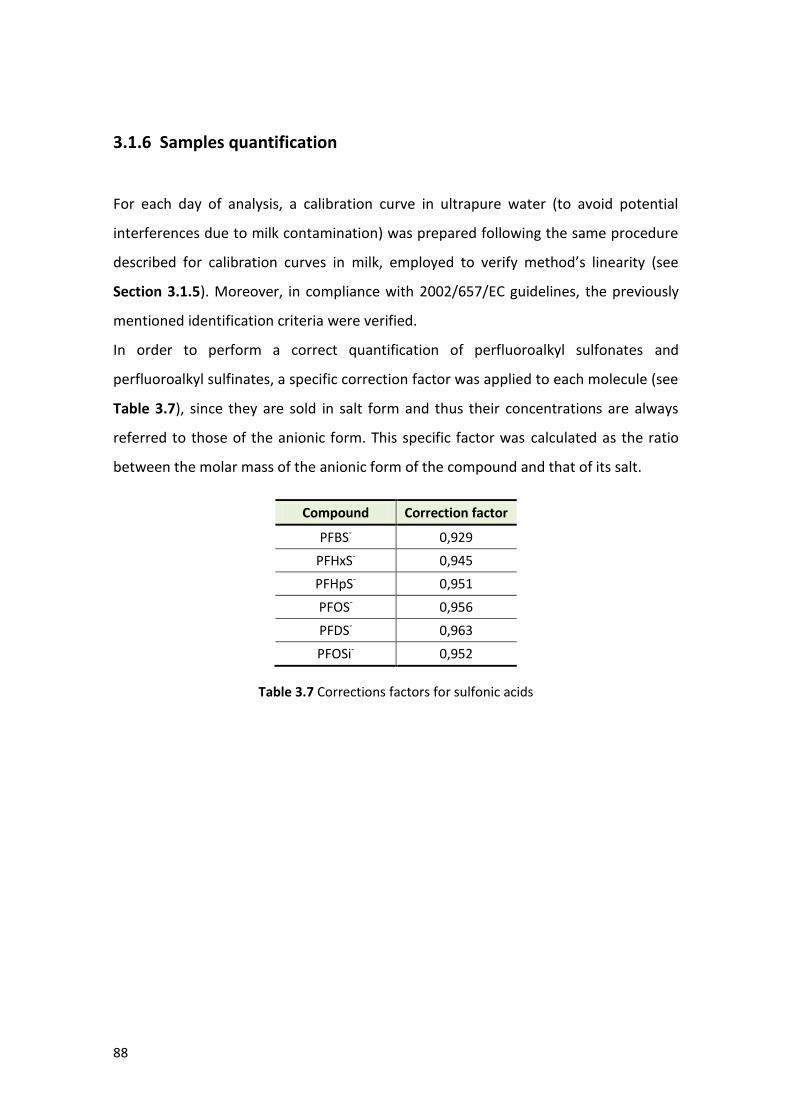
88
3.1.6 Samples quantification
For each day of analysis, a calibration curve in ultrapure water (to avoid potential
interferences due to milk contamination) was prepared following the same procedure
described for calibration curves in milk, employed to verify method’s linearity (see
Section 3.1.5). Moreover, in compliance with 2002/657/EC guidelines, the previously
mentioned identification criteria were verified.
In order to perform a correct quantification of perfluoroalkyl sulfonates and
perfluoroalkyl sulfinates, a specific correction factor was applied to each molecule (see
Table 3.7), since they are sold in salt form and thus their concentrations are always
referred to those of the anionic form. This specific factor was calculated as the ratio
between the molar mass of the anionic form of the compound and that of its salt.
Compound Correction factor
PFBS- 0,929
PFHxS- 0,945
PFHpS- 0,951
PFOS- 0,956
PFDS- 0,963
PFOSi- 0,952
Table 3.7 Corrections factors for sulfonic acids
89
3.2 PFCs analysis at CABA-Lab
During this second work package the method developed at LABERCA was transferred
to CABA-Lab to verify its performances in the analysis of PFOA and PFOS in milk, being
the two most important molecules of this group, using the UHPLC-MS/MS system
available in the laboratory.
Once the efficiency of the method had been ascertained, it was employed for the
analysis of several cow milk and human breast milk samples from Italy, in order to
obtain some preliminary data on PFCs contamination also for this country. Moreover,
taking into account the available information on such samples, the monitoring tried to
reveal potential correlations between the characteristics of each kind of milk and its
level of contamination.
3.2.1 Material
Standards
To verify the method performance and for samples quantification, PFOA, PFOS and
relative 13C4-labeled M-PFOA e M-PFOS standards (employed as internal standards)
were used.
All standards solutions were purchased from Wellington Laboratories (Guelph, Canada)
with a purity grade >98% in methanol:
PFOA Perfluoro-n-octanoic acid: 50 μg/mL, 1.2 mL
PFOS Sodium perfluoro-1-octanesulfonate: 50 μg/mL, 1.2 mL
M-PFOA Perfluoro-n-[1,2,3,4-13C4]octanoic acid: 50 μg/mL, 1.2 mL
M-PFOS Sodium perfluoro-1-[1,2,3,4-13C4]octanesulfonate: 50 μg/mL, 1.2 mL
90
Starting from these products, the following standard solutions were prepared:
o Stock solutions: for each compound a 5 μg/mL solution was prepared diluting
1:10 in methanol the relative 50 μg/mL standard
o PFC stock solution (0.5 μg/mL): 20 μL of PFOS (50 μg/mL) and 20 μL of PFOA (50
μg/mL) were dissolved in 2 mL of methanol.
Thereafter, diluting this PFC stock solution in methanol, the following working
solutions were obtained:
o PFC working solution (50 ng/mL)
o PFC working solution (5 ng/mL)
o M-PFC working solution (50 ng/mL): 100 μL of M-PFOA tune solution (5 μg/mL)
and 100 μL of M-PFOS tune solution (5 μg/mL) were dissolved in 10 mL of
methanol
All solutions were stored in refrigerator at 4 °C and away from light.
Reagents and chemicals
All solvents used for mass spectrometry analysis were LC-MS grade:
Methanol (Sigma Aldrich)
Ammonium acetate (Fluka)
Ultrapure water (produced directly in the laboratory)
Solvents employed during sample treatment were all analytical grade:
Acetone (VWR)
Ammonia solution 33% (Sigma Aldrich)
Methanol (Sigma Aldrich)
Glacial acetic acid (Sigma Aldrich)
Formic acid (Sigma Aldrich)
Pure water (produced directly in the laboratory)
91
Two different solid phase extraction (SPE) cartridges were used to extract the analytes
from milk:
Oasis® HLB cartridges: 6 cc, 500 mg, 60 μm (Waters, Milford MA, USA)
Supelclean™ ENVI-Carb™ cartridges: 6 cc, 500 mg, 120-400 mesh (Supelco,
Bellefonte PA, USA)
Prepared solutions
o Ammonium acetate solution 20 mM: 1.54 g of ammonium acetate was
dissolved in 1 L of ultrapure water and shaken vigorously
o Formic acid 0.1 M: 3.8 mL of formic acid and 996.2 mL of pure water were
mixed in a 1 L bottle and shaken vigorously
Samples
To test and optimize at CABA-Lab the previously developed method, milk purchased in
a store located in the province of Bologna was used, being stored in the refrigerator
for a limited number of hours prior to analysis.
The preliminary monitoring included cow and human breast milk:
Human breast milk: 13 samples, provided by the Department of Gynecology,
Obstetrics and Pediatrics of Bologna University. Sampling was authorized by the
Independent Ethics Committee of Bologna University Hospital Authority
Sant’Orsola-Malpighi Polyclinic (clinical trial # 49/2011/U/Tess).
Cow milk: 22 samples, including 16 different varieties of milk purchased from
large retailers in the province of Bologna, 1 raw milk purchased at a vending
machine in the province of Bologna and 5 milk samples provided by the
experimental farm of Ozzano dell’Emilia (Bologna, Italy), owned by the Faculty
of Veterinary Medicine of Bologna University.
Collected samples were transferred into polypropylene bottles, in order to prevent the
risk of PFCs contamination caused by the original packaging material, and then stored
in freezer at -18 °C until analysis.
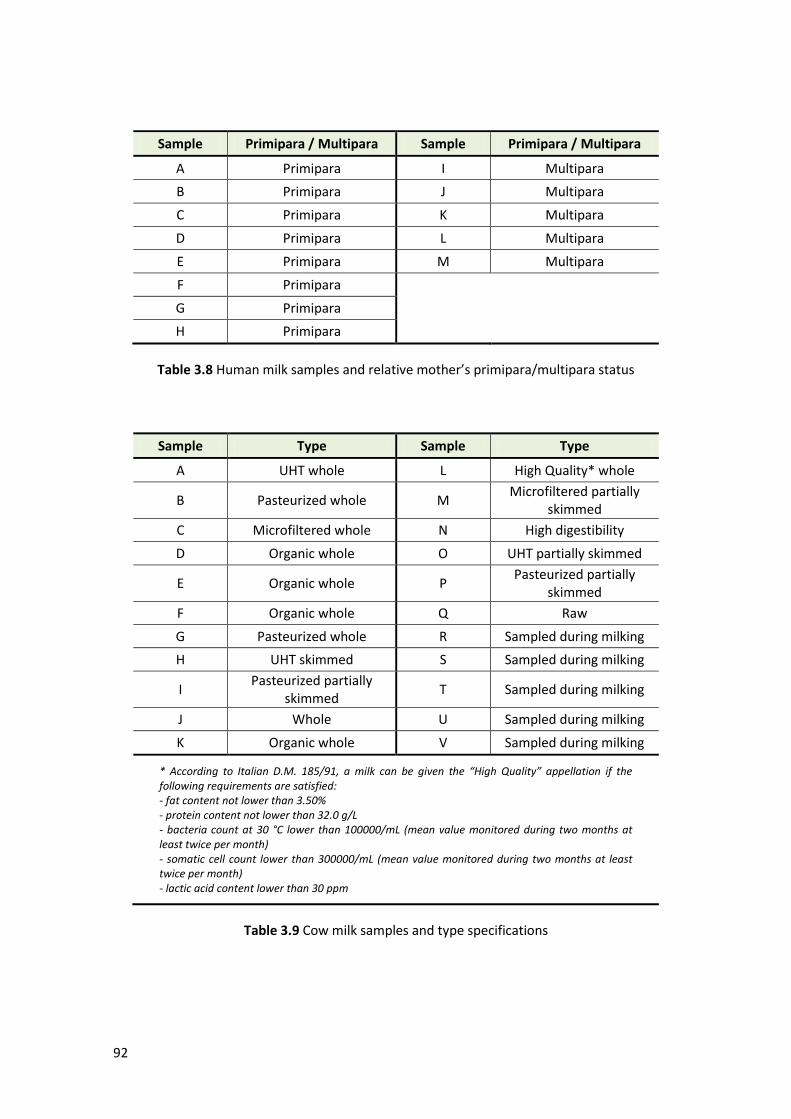
92
Sample Primipara / Multipara Sample Primipara / Multipara
A Primipara I Multipara
B Primipara J Multipara
C Primipara K Multipara
D Primipara L Multipara
E Primipara M Multipara
F Primipara
G Primipara
H Primipara
Table 3.8 Human milk samples and relative mother’s primipara/multipara status
Sample Type Sample Type
A UHT whole L High Quality* whole
B Pasteurized whole M Microfiltered partially
skimmed
C Microfiltered whole N High digestibility
D Organic whole O UHT partially skimmed
E Organic whole P Pasteurized partially
skimmed
F Organic whole Q Raw
G Pasteurized whole R Sampled during milking
H UHT skimmed S Sampled during milking
I Pasteurized partially
skimmed T Sampled during milking
J Whole U Sampled during milking
K Organic whole V Sampled during milking
* According to Italian D.M. 185/91, a milk can be given the “High Quality” appellation if the following requirements are satisfied: - fat content not lower than 3.50% - protein content not lower than 32.0 g/L - bacteria count at 30 °C lower than 100000/mL (mean value monitored during two months at least twice per month) - somatic cell count lower than 300000/mL (mean value monitored during two months at least twice per month) - lactic acid content lower than 30 ppm
Table 3.9 Cow milk samples and type specifications
93
3.2.2 Equipment
UHPLC-MS/MS system
The system employed for PFCs analysis consisted of a Waters Acquity UPLC® binary
pump (provided with degasser, thermostated autosampler and column compartment),
coupled with a Waters Quattro Premier XE™ triple quadrupole mass spectrometer
equipped with an ESCi™ Multi-Mode Ionization Source (Waters Corporation, Milford
MA, USA).
Chromatographic separation was achieved using a Waters Acquity UPLC® BEH C18
reversed-phase column (50 x 2.1 mm, 1.7 µm), fitted with a Waters VanGuard™ guard
column with the same packing (5 x 2.1 mm, 1.7 µm) (Waters Corporation, Milford MA,
USA).
Data were acquired and processed using Waters MassLynx™ 4.1 software (Waters
Corporation, Milford MA, USA).
The nitrogen needed for the operation of mass spectrometer’s interface was produced
by a DBS N2-Mistral-4 generator (DBS Strumenti Scientifici, Padova, Italy).
Other equipment
During method transfer and milk samples preparation, the following equipment was
employed:
Solid phase extraction manifold (Waters Corporation, Milford MA, USA)
Centrifuge (Hettich, Kirchlengern, Germany)
Water purification system (Human Corporation, Seoul, Korea)
Nitrogen sample concentrator
Waterbath (Grant Instruments, Cambridge, GB)
Automatic pipettes (Gilson, Middleton WI, USA)
Vortex mixer (Velp Scientifica, Monza e Brianza, Italy)
Ultrasonic bath (AGE Elettronica, Milano, Italy)
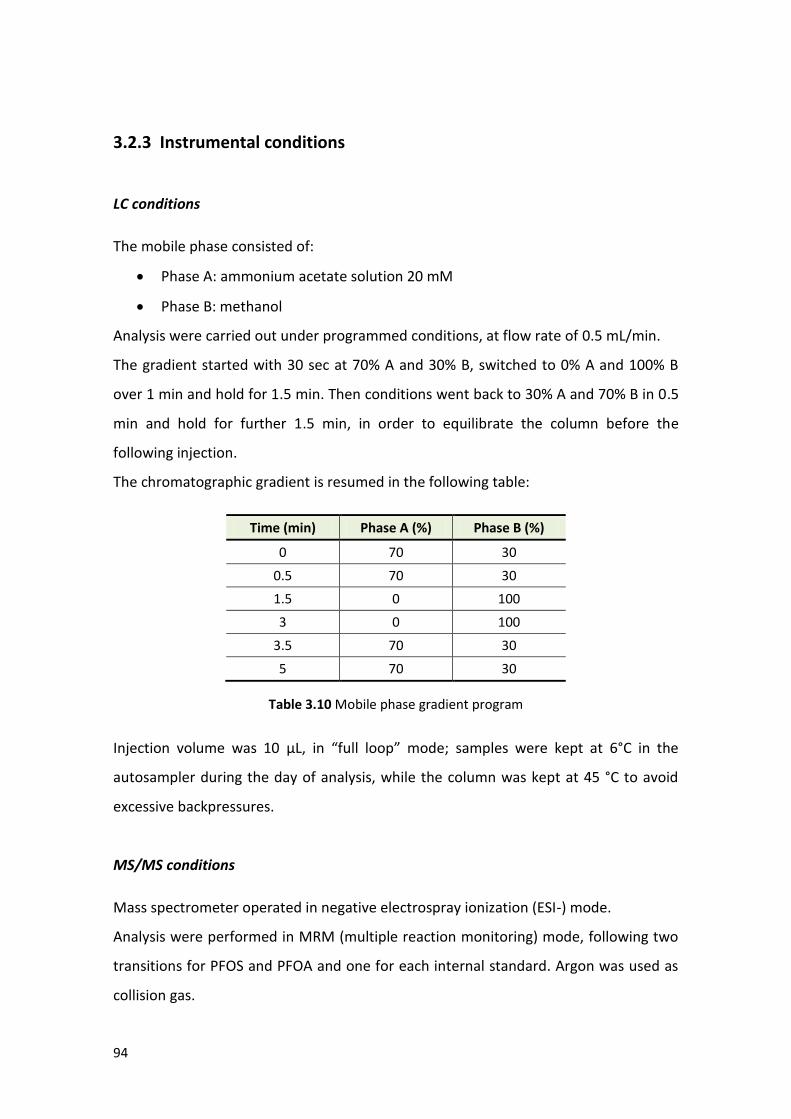
94
3.2.3 Instrumental conditions
LC conditions
The mobile phase consisted of:
Phase A: ammonium acetate solution 20 mM
Phase B: methanol
Analysis were carried out under programmed conditions, at flow rate of 0.5 mL/min.
The gradient started with 30 sec at 70% A and 30% B, switched to 0% A and 100% B
over 1 min and hold for 1.5 min. Then conditions went back to 30% A and 70% B in 0.5
min and hold for further 1.5 min, in order to equilibrate the column before the
following injection.
The chromatographic gradient is resumed in the following table:
Time (min) Phase A (%) Phase B (%)
0 70 30
0.5 70 30
1.5 0 100
3 0 100
3.5 70 30
5 70 30
Table 3.10 Mobile phase gradient program
Injection volume was 10 µL, in “full loop” mode; samples were kept at 6°C in the
autosampler during the day of analysis, while the column was kept at 45 °C to avoid
excessive backpressures.
MS/MS conditions
Mass spectrometer operated in negative electrospray ionization (ESI-) mode.
Analysis were performed in MRM (multiple reaction monitoring) mode, following two
transitions for PFOS and PFOA and one for each internal standard. Argon was used as
collision gas.
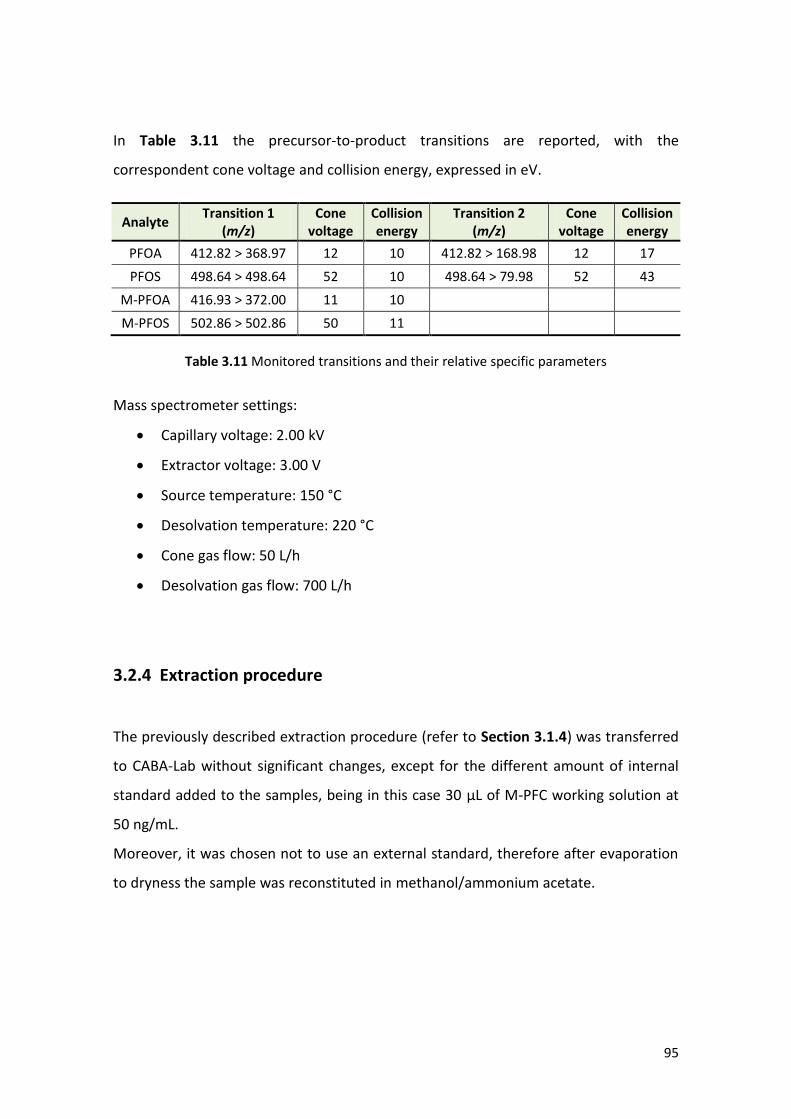
95
In Table 3.11 the precursor-to-product transitions are reported, with the
correspondent cone voltage and collision energy, expressed in eV.
Analyte Transition 1
(m/z) Cone
voltage Collision energy
Transition 2 (m/z)
Cone voltage
Collision energy
PFOA 412.82 > 368.97 12 10 412.82 > 168.98 12 17
PFOS 498.64 > 498.64 52 10 498.64 > 79.98 52 43
M-PFOA 416.93 > 372.00 11 10
M-PFOS 502.86 > 502.86 50 11
Table 3.11 Monitored transitions and their relative specific parameters
Mass spectrometer settings:
Capillary voltage: 2.00 kV
Extractor voltage: 3.00 V
Source temperature: 150 °C
Desolvation temperature: 220 °C
Cone gas flow: 50 L/h
Desolvation gas flow: 700 L/h
3.2.4 Extraction procedure
The previously described extraction procedure (refer to Section 3.1.4) was transferred
to CABA-Lab without significant changes, except for the different amount of internal
standard added to the samples, being in this case 30 µL of M-PFC working solution at
50 ng/mL.
Moreover, it was chosen not to use an external standard, therefore after evaporation
to dryness the sample was reconstituted in methanol/ammonium acetate.

96
3.2.5 Performances of the transferred method
An apparently not contaminated cow milk sample was employed for the preparation of
an 8 levels matrix-matched calibration curve, in order to assess linearity and limits of
detection of the transferred method.
To this purpose, starting with 3 mL fractions of milk, 30 µL of M-PFC working solution
were added as internal standard, followed by increasing amounts of the two PFC
working solutions according to the scheme reported in Table 3.12.
The 8 solutions obtained, with concentrations from 0 to 2 ng/mL, were then injected in
the UHPLC-MS/MS system.
Name Concentration (ng/mL = ppb)
µL M-PFC (50 ng/mL)
µL PFC (5 ng/mL)
µL PFC (50 ng/mL)
C 0 0 30 - -
C 0.025 0.025 30 15 -
C 0.05 0.05 30 30 -
C 0.1 0.1 30 60 -
C 0.2 0.2 30 120 -
C 0.5 0.5 30 - 30
C 1 1 30 - 60
C 2 2 30 - 120
Table 3.12 Calibration curve preparation
3.2.6 Samples quantification
As well as during the analysis carried out at LABERCA, quantification at CABA-Lab was
performed in accordance with 2002/657/EC criteria (see Section 3.1.6).
An 8 levels calibration curve in ultrapure water was prepared each day of analysis to
quantify samples, following the above scheme used for the linearity test.
To perform a correct quantification, a correction factor was applied to PFOS.
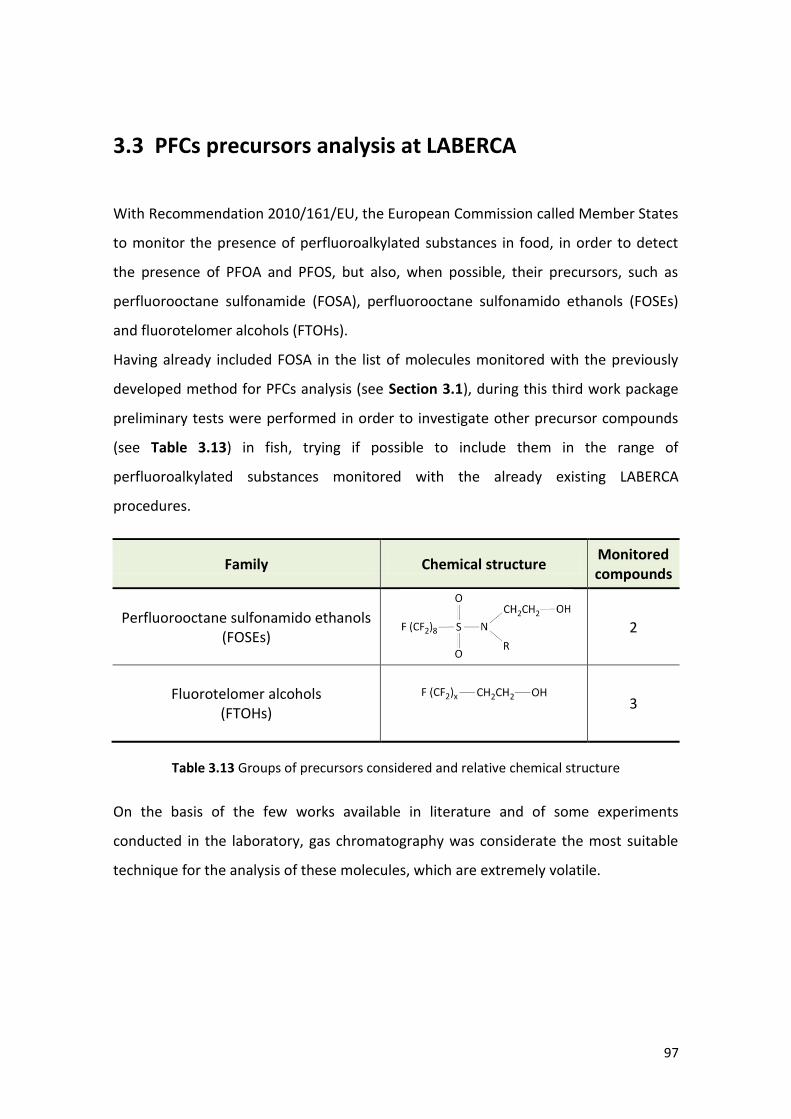
97
3.3 PFCs precursors analysis at LABERCA
With Recommendation 2010/161/EU, the European Commission called Member States
to monitor the presence of perfluoroalkylated substances in food, in order to detect
the presence of PFOA and PFOS, but also, when possible, their precursors, such as
perfluorooctane sulfonamide (FOSA), perfluorooctane sulfonamido ethanols (FOSEs)
and fluorotelomer alcohols (FTOHs).
Having already included FOSA in the list of molecules monitored with the previously
developed method for PFCs analysis (see Section 3.1), during this third work package
preliminary tests were performed in order to investigate other precursor compounds
(see Table 3.13) in fish, trying if possible to include them in the range of
perfluoroalkylated substances monitored with the already existing LABERCA
procedures.
Family Chemical structure Monitored compounds
Perfluorooctane sulfonamido ethanols (FOSEs)
2
Fluorotelomer alcohols (FTOHs)
3
Table 3.13 Groups of precursors considered and relative chemical structure
On the basis of the few works available in literature and of some experiments
conducted in the laboratory, gas chromatography was considerate the most suitable
technique for the analysis of these molecules, which are extremely volatile.

98
3.3.1 Material
Standards
The employed standards solutions of FOSEs and FTOHs were from Wellington
Laboratories (Wellington, Canada), with a concentration of 50 μg/mL in ethanol and a
purity grade >98%:
N-MeFOSE 2-(N-methylperfluoro-1-octanesulfonamido)-ethanol
N-EtFOSE 2-(N-ethylperfluoro-1-octanesulfonamido)-ethanol
FHET 2-Perfuorohexyl ethanol (6:2 FTOH)
FOET 2-Perfuorooctyl ethanol (8:2 FTOH)
FDET 2-Perfuorodecyl ethanol (10:2 FTOH)
As internal standards, one labeled standard for FOSEs and one for FTOHs (50 μg/mL in
methanol, purity grade >98%) were purchased from Wellington Laboratories
(Wellington, Canada):
d7-N-MeFOSE 2-(N-deuteriomethylperfluoro-1-octanesulfonamido)-1,1,2,2-
tetradeuterioethanol
M-FOET 2-Perfuorooctyl-[1,1,-2H2]-[1,1,-13C2]-ethanol (M-8:2 FTOH)
Stock solutions at 10 μg/mL of all the compounds were prepared in methanol; the
following working solutions were obtained by dilution:
o FOSE+FTOH 1 μg/mL, FOSE+FTOH 0.1 μg/mL and FOSE+FTOH 0.01 μg/mL,
containing the all the 5 analytes investigated
o IS FOSE+FTOH 0.1 μg/mL, containing both internal standards employed
All solutions were stored in the refrigerator at 4 °C and away from light.
Reagents and chemicals
In addition to solvents already described in Section 3.1.1, Dichloromethane Picograde®
(Promochem) was employed.
99
Other chemicals needed for sample extraction:
Supelclean™ ENVI-Carb™ SPE bulk packing 120-400 mesh (Supelco)
Silica gel 70-230 mesh (Fluka)
Preparation of silica column
The required hydrated silica (1.5%) was obtained shaking several times during one day,
each time for 5 min, a flask containing 98.5 g of silica gel and 1.5 mL of water.
After placing a thick layer of glass wool on the bottom of the column, previously
positioned on the manifold, two washings with 5 mL of acetone and 5 mL of
dichloromethane were performed, then 4 g of hydrated silica were added.
3.3.2 Equipment
GC-MS/MS system
FOSE and FTOH analysis were performed using a system composed of an Agilent 7890
gas chromatographer coupled to an Agilent 7000 triple quadrupole mass spectrometer
(equipped with chemical ionization interface) and provided with an Agilent 7693
autosampler (Agilent Technologies, Santa Clara CA, USA).
A Varian CP-WAX 57CB capillary column (25 m, 0.25 mm I.D., 0.20 µm film thickness)
(Varian, Palo Alto CA, USA) was used for chromatographic separation.
Data were acquired and processed with Agilent Mass Hunter Workstation software
(Agilent Technologies, Santa Clara CA, USA).
Other equipment
The same equipment described in Section 3.1.2 was employed, with the addition of:
Grinder
Horizontal mechanical shaker
100
3.3.3 Instrumental conditions
GC-MS/MS conditions
A volume of 2 µL was injected in pulsed splitless mode at a temperature of 225 °C, with
helium as carrier gas (1 mL/min flow).
The oven temperature gradient started with 4 min at 60 °C, increased to 70 °C in 2 min
and then to 200 °C at 15 °C/min, held for 6 min, as resumed in the following table:
Time (min) Temperature (°C) Ramp (°C/min)
0 60 -
4 60 0
6 70 5
14.7 200 15
20.7 200 0
Table 3.14 Oven temperature gradient program
The detector operated in positive chemical ionization (CI+), with source temperature
set at 200 °C and methane employed as reagent gas.
Acquisition was performed in MRM (multiple reaction monitoring) mode; collision gas
consisted of a mixture of nitrogen and helium, at a flow of 1.5 and 2.25 mL/min
respectively. In Table 3.15 the monitored transitions and the relative collision energy
values, expressed in eV, are reported.
Analyte Transition 1
(m/z) Collision energy
Transition 2 (m/z)
Collision energy
N-EtFOSE 571.7 > 553.7 10 571.7 > 571.7 1
N-MeFOSE 557.7 > 539.7 10 557.7 > 557.7 1
d7-N-MeFOSE 564.7 > 546.7 10 564.7 > 564.7 1
6:2 FTOH 364.6 > 326.7 10 364.6 > 364.6 1
8:2 FTOH 464.6 > 426.7 10 464.6 > 464.6 1
10:2 FTOH 564.6 > 526.7 10 564.6 > 564.6 1
M-8:2 FTOH 468.6 > 430.7 10 468.6 > 468.6 1
Table 3.15 Monitored transitions and corresponding collision energy
101
3.3.4 Extraction procedure
1 g of freeze-dried fish was transferred to a polypropylene tube, added of 100 µL of IS
FOSE+FTOH solution and 15 mL of methanol, then mechanically shaken for 15 min and
centrifuged at 4000 g during 15 min.
In a new tube, 800 mg of ENVI-Carb™ phase were activated with 1 mL of glacial acetic
acid, then the supernatant was transferred and the tube agitated for 1 min and
centrifuged at 4000 g for 5 min.
After transferring the extract into another tube, it was reduced to around 500 µL being
heated at 35 °C under gentle nitrogen stream and added of 3 mL of dichloromethane.
The solution was then loaded onto a self-prepared silica column (see Section 3.3.1),
previously activated with 10 mL of dichloromethane.
Then, a washing with 15 mL of dichloromethane was performed and the analytes were
eluted with 30 mL of acetone.
The eluate was placed into a dry bath at 35 °C and carefully evaporated to 200 µL by a
delicate nitrogen stream, then transferred to a microtube and centrifuged at 12000
rpm during 45 min.
Finally, 150 µL were transferred into a polypropylene GC vial and injected.
A scheme resuming the whole procedure is presented on next page.

102
1st purification
SPE dispersive ENVI-Carb™
2nd purification
Hydrated silica gel column
Evaporation and
centrifugation
Liquid-solid extraction
with methanol
Addition of internal standards
Injection in GC-MS/MS
Figure 3.2 Extraction procedure
1 g of freeze-dried fish

103
3.3.5 Performances of the method
After optimizing the detection of all the target compounds, some preliminary tests
were performed to assess the performances of the method.
Concerning linearity and limits of detection, a 6 points matrix-matched calibration
curve ranging from 0 to 50 μg/kg of dry matter was prepared, as reported in the
following table:
Name Concentration (μg/kg d.m.)
μL IS FOSE+FTOH (0.1 μg/mL)
μL FOSE+FTOH
(0.01 μg/mL)
μL FOSE+FTOH (0.1 μg/mL)
μL FOSE+FTOH (1 μg/mL)
F 0 0 100 - - -
F 0.5 0.5 100 50 - -
F 1 1 100 100 - -
F 5 5 100 - 50 -
F 10 10 100 - 100 -
F 50 50 100 - - 50
Table 3.16 Calibration curve preparation
In order to evaluate absolute extraction recovery for FOSEs, two samples were
prepared with the addition of 50 µL of FOSE+FTOH 1 µg/mL solution, the first being
spiked at the beginning of the extraction procedure and the other being spiked at the
end, during the final evaporation prior to injection.


105
4. Results and discussion
4.1 PFCs analysis at LABERCA
A method based on liquid chromatography coupled to two different mass
spectrometry detectors for the quantification of perfluorinated compounds in milk was
optimized and fully validated in accordance with European regulations (2002/657/EC).
This technique allows to simultaneously measure 16 different analytes at ultra-trace
levels and is currently under evaluation for ISO 17025 accreditation.
LC-MS/MS is nowadays the technique of election for the analysis of these substances,
but the LC-HRMS system resulted even more performing in terms of sensitivity and
specificity for some compounds. This instrument thus represents a useful alternative
for both quantitative and confirmatory purposes, especially considering the low
concentrations at which these analytes are often measured.
4.1.1 Instrumental analysis
Chromatographic separation
The chromatographic part was in common between the two systems and the choice of
the column fell on a reversed phase C18 Gemini column, due to its high stability and
efficiency at variable gradients and pH. The interactions between the silica phase and
target analytes allowed to successfully separate the latter, whose retention time
increased with increasing polarity.
The mobile phase, as well, has a major role when trying to obtain a good
chromatographic separation and the choice of its components must take into account
both the characteristics of the compounds investigated and the detector’s interface.

106
Similarly to what indicated in previous works on PFCs analysis, in order to improve the
elution of the molecules and their ionization, ammonium acetate was added to the
methanol/water mobile phase: the concentration of 20 mM in aqueous solution was in
line with various studies, however also lower concentrations (between 2 and 20 mM)
have been reported as well. This salt interacts with target compounds to form ion-
pairs, helping their passage through the column; at the same time it facilitates their
deprotonation, and consequently the formation of pseudo-molecular ions.
From the initial methanol/ammonium acetate 30%/70% mixture, mobile phase
gradually switched to 100% methanol and held like that for 4 min, in order to let all the
compounds elute from the column.
These conditions allowed to satisfactorily separate 26 different molecules (16
perfluorinated compounds and 10 relative internal standards) with a 20 min
chromatographic run, including column re-equilibration.
Ionization
Once they have been eluted from the column and before they enter the detector,
target analytes undergo ionization, which can be operated by different types of
sources. Concerning perfluorinated compounds, the most employed technique is
electrospray ionization, which is based on the effects of a strong electric field (at kV
levels) applied to the chromatography eluate exiting from a capillary at controlled flow
and atmospheric pressure. By means of a nebulization gas (nitrogen), the mixture of
mobile phase and produced ions is transformed into spray droplets, which move
towards the entrance cone of the detector being simultaneously hit by the desolvation
gas (again, nitrogen). This causes a progressive evaporation of the solvent, until the
droplets explode releasing the highly charged molecules, which finally enter the
detector. Depending on the polarity of the applied potential difference, positive or
negative ions can be generated: in the case of perfluorinated compounds, negative
ionization is generally used, since they tend to give up protons forming pseudo-
molecular ions [M-H]-. Thus, ESI- was employed on both systems.
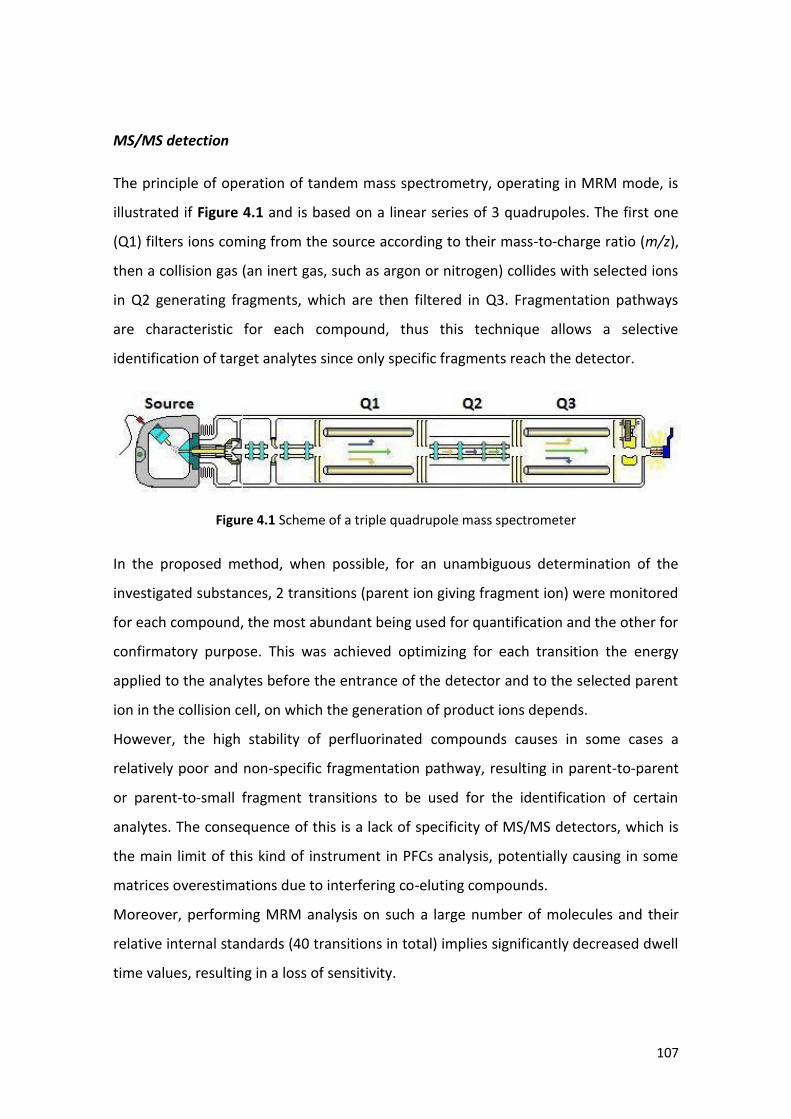
107
MS/MS detection
The principle of operation of tandem mass spectrometry, operating in MRM mode, is
illustrated if Figure 4.1 and is based on a linear series of 3 quadrupoles. The first one
(Q1) filters ions coming from the source according to their mass-to-charge ratio (m/z),
then a collision gas (an inert gas, such as argon or nitrogen) collides with selected ions
in Q2 generating fragments, which are then filtered in Q3. Fragmentation pathways
are characteristic for each compound, thus this technique allows a selective
identification of target analytes since only specific fragments reach the detector.
Figure 4.1 Scheme of a triple quadrupole mass spectrometer
In the proposed method, when possible, for an unambiguous determination of the
investigated substances, 2 transitions (parent ion giving fragment ion) were monitored
for each compound, the most abundant being used for quantification and the other for
confirmatory purpose. This was achieved optimizing for each transition the energy
applied to the analytes before the entrance of the detector and to the selected parent
ion in the collision cell, on which the generation of product ions depends.
However, the high stability of perfluorinated compounds causes in some cases a
relatively poor and non-specific fragmentation pathway, resulting in parent-to-parent
or parent-to-small fragment transitions to be used for the identification of certain
analytes. The consequence of this is a lack of specificity of MS/MS detectors, which is
the main limit of this kind of instrument in PFCs analysis, potentially causing in some
matrices overestimations due to interfering co-eluting compounds.
Moreover, performing MRM analysis on such a large number of molecules and their
relative internal standards (40 transitions in total) implies significantly decreased dwell
time values, resulting in a loss of sensitivity.

108
In more detail, 4 different families of perfluorinated compounds were considered in
this study, each of them showing a characteristic fragmentation pathway depending
on the chemical structure. The analysis of their product ions mass spectrum provided
useful information about the fragments generated after precursor ion’s break up.
Perfluoroalkyl carboxylic acids fragmentation is easily obtained even at relatively low
collision energy values, producing mainly the loss of a CO2 group and secondly parts of
the chain constituted by 3 or 4 fluorinated carbons (see Figure 4.2).
Figure 4.2 Product ions scan for PFOA, applying a collision energy of 15 eV
Perfluoroalkyl sulfonates showed higher stability than PFCAs, having the sulfonate
group a stronger interaction with the alkyl chain, due to its greater electronegativity.
Applying high collision energy, [SO3]- and [FSO3]- are the two most detected product
ions, proving that PFSAs fragmentations lacks in specificity (see Figure 4.3).
Figure 4.3 Product ions scan for PFOS, applying a collision energy of 45 eV
[M-H]-
[SO3]-
[FSO3]-
[CF3-CF2]-
[CF3-CF2-CF2]-
[M-H]-
[CF3-CF2-CF2-CF2]
-
[CF3-CF2-CF2]-
[M-CO2-H]-
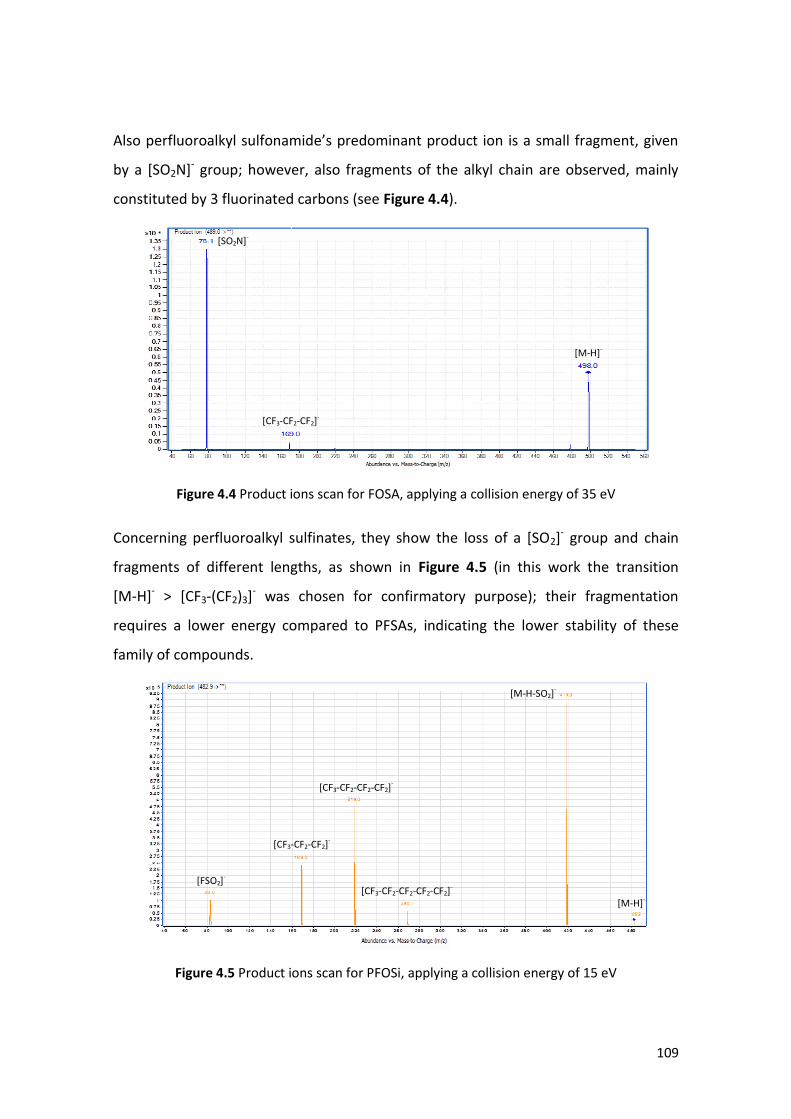
109
Also perfluoroalkyl sulfonamide’s predominant product ion is a small fragment, given
by a [SO2N]- group; however, also fragments of the alkyl chain are observed, mainly
constituted by 3 fluorinated carbons (see Figure 4.4).
Figure 4.4 Product ions scan for FOSA, applying a collision energy of 35 eV
Concerning perfluoroalkyl sulfinates, they show the loss of a [SO2]- group and chain
fragments of different lengths, as shown in Figure 4.5 (in this work the transition
[M-H]- > [CF3-(CF2)3]- was chosen for confirmatory purpose); their fragmentation
requires a lower energy compared to PFSAs, indicating the lower stability of these
family of compounds.
Figure 4.5 Product ions scan for PFOSi, applying a collision energy of 15 eV
[M-H]-
[CF3-CF2-CF2]-
[SO2N]-
[M-H]-
[M-H-SO2]-
[CF3-CF2-CF2-CF2]-
[CF3-CF2-CF2]-
[CF3-CF2-CF2-CF2-CF2]
-
[FSO2]-
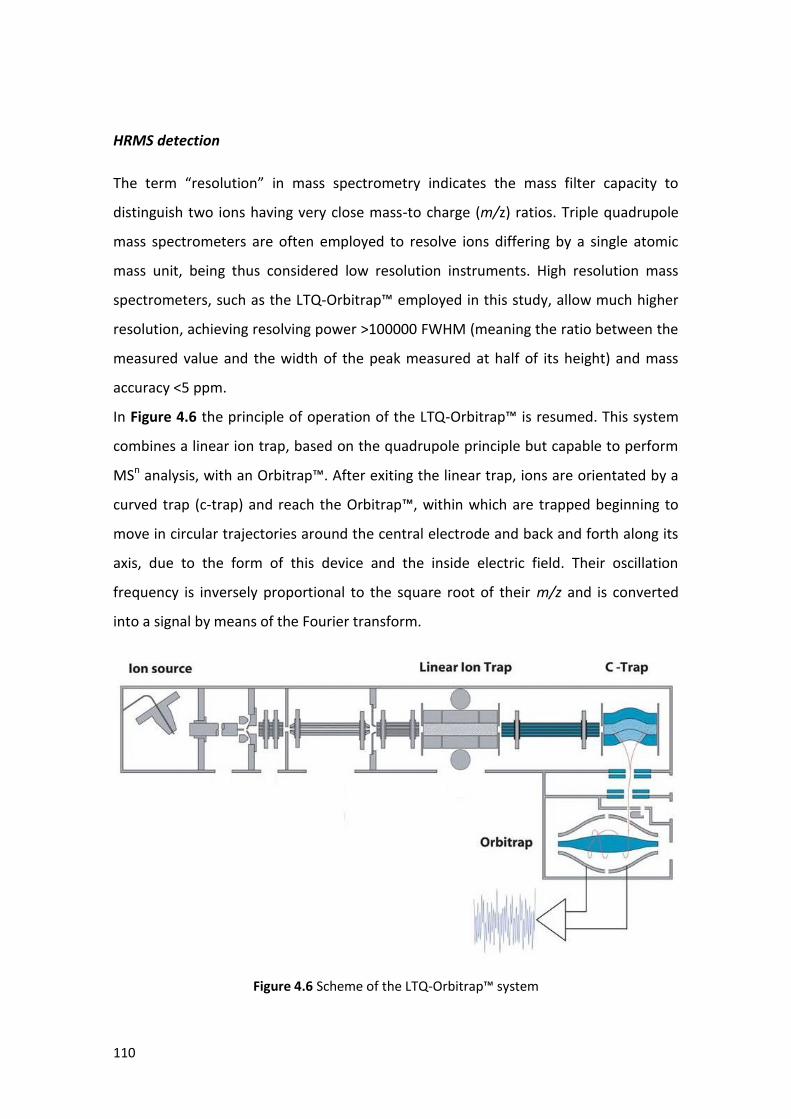
110
HRMS detection
The term “resolution” in mass spectrometry indicates the mass filter capacity to
distinguish two ions having very close mass-to charge (m/z) ratios. Triple quadrupole
mass spectrometers are often employed to resolve ions differing by a single atomic
mass unit, being thus considered low resolution instruments. High resolution mass
spectrometers, such as the LTQ-Orbitrap™ employed in this study, allow much higher
resolution, achieving resolving power >100000 FWHM (meaning the ratio between the
measured value and the width of the peak measured at half of its height) and mass
accuracy <5 ppm.
In Figure 4.6 the principle of operation of the LTQ-Orbitrap™ is resumed. This system
combines a linear ion trap, based on the quadrupole principle but capable to perform
MSn analysis, with an Orbitrap™. After exiting the linear trap, ions are orientated by a
curved trap (c-trap) and reach the Orbitrap™, within which are trapped beginning to
move in circular trajectories around the central electrode and back and forth along its
axis, due to the form of this device and the inside electric field. Their oscillation
frequency is inversely proportional to the square root of their m/z and is converted
into a signal by means of the Fourier transform.
Figure 4.6 Scheme of the LTQ-Orbitrap™ system
111
After optimizing ionization parameters for the detection of the various target
compounds, analysis were performed in full scan mode. From the acquired mass
spectrum, the exact masses of the pseudo-molecular ions [M-H]- were extracted with a
resolution of 15000 FWHM at 400 m/z. The high mass accuracy of this instrument
provided a great specificity, allowing extremely selective identification even in this kind
of complex multi-residue analysis.
4.1.2 Extraction procedure
The extraction procedure is essentially based on a LLE (liquid-liquid extraction)
followed by two purifications on SPE (solid phase extraction).
The LLE step is very important when analyzing milk samples, since perfluorinated
compounds tend to bind to proteins, whose content in this matrix is relevant. In order
to separate them, an extraction with acetone was performed, denaturing proteins and
causing their precipitation. This could have been achieved in many ways, but acetone
was chosen due to its low boiling point, which is an advantage considering that
samples should be concentrated before being loaded on the SPE cartridge.
Waters Oasis® HLB was the first SPE cartridge employed for sample purification
because of the macroporous copolymer constituting its stationary phase, which
combines hydrophilic and lipophilic properties, providing strong interactions with PFCs.
The mechanisms underlying their retention are both dipole-dipole and cation exchange
interactions, the latter being facilitated by sample acidification obtained through
addition of formic acid solution before loading.
The second SPE step is a modification of the technique proposed by Powley et al.
(2005), but instead of using dispersive graphitized carbon phase, in this case
purification was carried out on columns containing the same sorbent.
For both types of cartridges, elution profiles were studied to optimize sample
preparation, decreasing as much as possible the amount of eluting solutions
employed. In more detail, 2mL fractions of formic acid/methanol mixture (for Waters
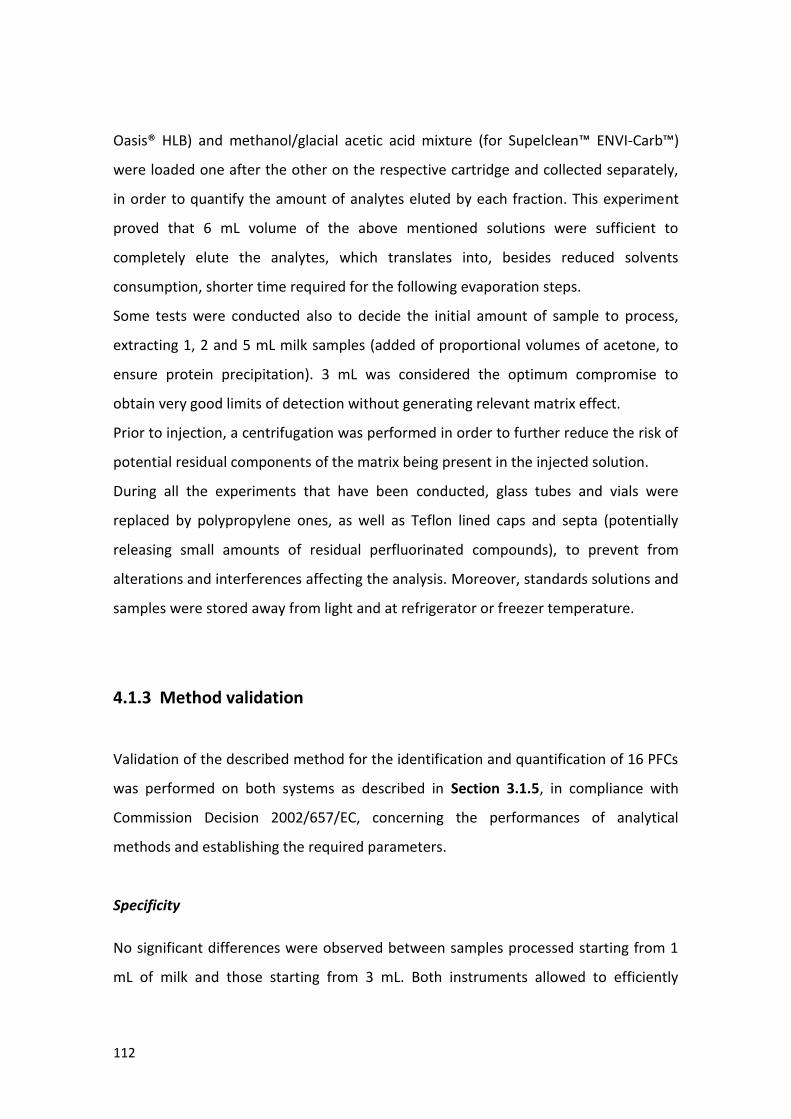
112
Oasis® HLB) and methanol/glacial acetic acid mixture (for Supelclean™ ENVI-Carb™)
were loaded one after the other on the respective cartridge and collected separately,
in order to quantify the amount of analytes eluted by each fraction. This experiment
proved that 6 mL volume of the above mentioned solutions were sufficient to
completely elute the analytes, which translates into, besides reduced solvents
consumption, shorter time required for the following evaporation steps.
Some tests were conducted also to decide the initial amount of sample to process,
extracting 1, 2 and 5 mL milk samples (added of proportional volumes of acetone, to
ensure protein precipitation). 3 mL was considered the optimum compromise to
obtain very good limits of detection without generating relevant matrix effect.
Prior to injection, a centrifugation was performed in order to further reduce the risk of
potential residual components of the matrix being present in the injected solution.
During all the experiments that have been conducted, glass tubes and vials were
replaced by polypropylene ones, as well as Teflon lined caps and septa (potentially
releasing small amounts of residual perfluorinated compounds), to prevent from
alterations and interferences affecting the analysis. Moreover, standards solutions and
samples were stored away from light and at refrigerator or freezer temperature.
4.1.3 Method validation
Validation of the described method for the identification and quantification of 16 PFCs
was performed on both systems as described in Section 3.1.5, in compliance with
Commission Decision 2002/657/EC, concerning the performances of analytical
methods and establishing the required parameters.
Specificity
No significant differences were observed between samples processed starting from 1
mL of milk and those starting from 3 mL. Both instruments allowed to efficiently
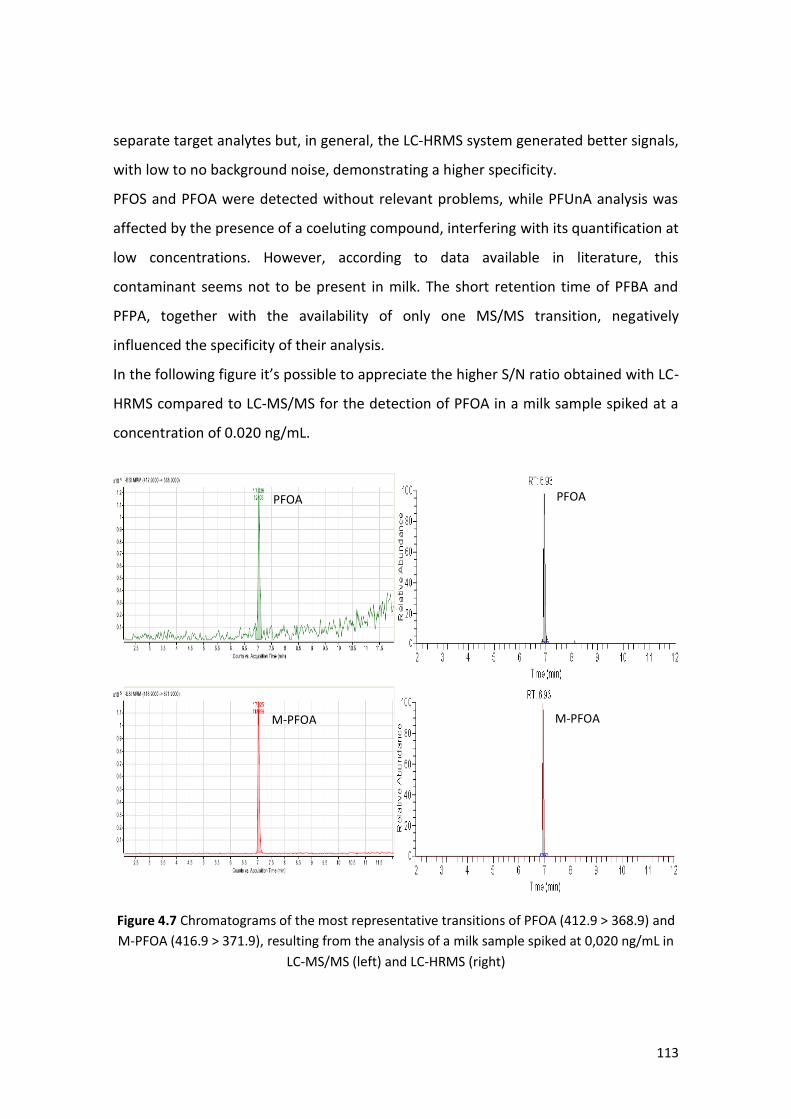
113
separate target analytes but, in general, the LC-HRMS system generated better signals,
with low to no background noise, demonstrating a higher specificity.
PFOS and PFOA were detected without relevant problems, while PFUnA analysis was
affected by the presence of a coeluting compound, interfering with its quantification at
low concentrations. However, according to data available in literature, this
contaminant seems not to be present in milk. The short retention time of PFBA and
PFPA, together with the availability of only one MS/MS transition, negatively
influenced the specificity of their analysis.
In the following figure it’s possible to appreciate the higher S/N ratio obtained with LC-
HRMS compared to LC-MS/MS for the detection of PFOA in a milk sample spiked at a
concentration of 0.020 ng/mL.
Figure 4.7 Chromatograms of the most representative transitions of PFOA (412.9 > 368.9) and
M-PFOA (416.9 > 371.9), resulting from the analysis of a milk sample spiked at 0,020 ng/mL in
LC-MS/MS (left) and LC-HRMS (right)
PFOA
M-PFOA
PFOA
M-PFOA
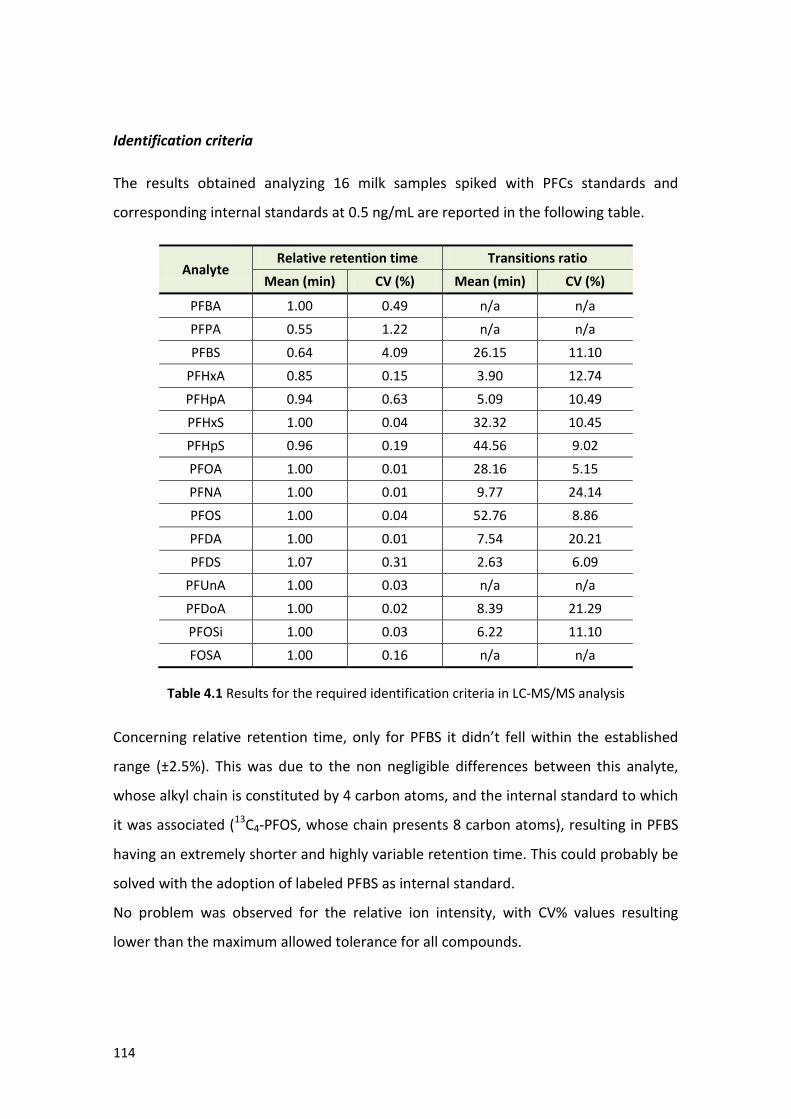
114
Identification criteria
The results obtained analyzing 16 milk samples spiked with PFCs standards and
corresponding internal standards at 0.5 ng/mL are reported in the following table.
Analyte Relative retention time Transitions ratio
Mean (min) CV (%) Mean (min) CV (%)
PFBA 1.00 0.49 n/a n/a
PFPA 0.55 1.22 n/a n/a
PFBS 0.64 4.09 26.15 11.10
PFHxA 0.85 0.15 3.90 12.74
PFHpA 0.94 0.63 5.09 10.49
PFHxS 1.00 0.04 32.32 10.45
PFHpS 0.96 0.19 44.56 9.02
PFOA 1.00 0.01 28.16 5.15
PFNA 1.00 0.01 9.77 24.14
PFOS 1.00 0.04 52.76 8.86
PFDA 1.00 0.01 7.54 20.21
PFDS 1.07 0.31 2.63 6.09
PFUnA 1.00 0.03 n/a n/a
PFDoA 1.00 0.02 8.39 21.29
PFOSi 1.00 0.03 6.22 11.10
FOSA 1.00 0.16 n/a n/a
Table 4.1 Results for the required identification criteria in LC-MS/MS analysis
Concerning relative retention time, only for PFBS it didn’t fell within the established
range (±2.5%). This was due to the non negligible differences between this analyte,
whose alkyl chain is constituted by 4 carbon atoms, and the internal standard to which
it was associated (13C4-PFOS, whose chain presents 8 carbon atoms), resulting in PFBS
having an extremely shorter and highly variable retention time. This could probably be
solved with the adoption of labeled PFBS as internal standard.
No problem was observed for the relative ion intensity, with CV% values resulting
lower than the maximum allowed tolerance for all compounds.

115
Linearity
Coefficient of determination (R2) and slope (a) values obtained from the injection of
calibration curves prepared for each type of milk are shown in Tables 4.2, 4.3 and 4.4.
Results were very satisfying, with R2 values >0.99 in almost all cases; in particular, for
PFOS and PFOA they were generally around 0.999 even in LC-MS/MS.
As for FOSA, significantly lower values were observed in LC-MS/MS compared to LC-
HRMS. Also in this case, the reason was that the labeled internal standard 13C4-FOSA
wasn’t available in the laboratory at the time when this experiment was conducted.
Analyte LC-MS/MS signal 1 LC-MS/MS signal 2 LC-HRMS
R² a R² a R² a
PFBA 0.9989 2.00 n/a n/a 0.9988 1.81
PFPA 0.9996 0.48 n/a n/a 0.9988 3.20
PFBS 0.9791 0.01 0.9995 0.06 0.9914 1.55
PFHxA 0.9998 0.81 0.9961 0.03 0.9962 1.75
PFHpA 0.9982 1.68 0.9952 0.08 0.9975 1.78
PFHxS 0.9971 1.00 0.9920 3.69 0.9999 2.33
PFHpS 0.9996 0.04 0.9968 0.09 0.9988 1.73
PFOA 0.9979 2.98 0.9963 0.80 0.9997 2.01
PFNA 0.9996 1.60 0.9982 0.12 0.9999 1.60
PFOS 0.9963 0.09 0.9996 0.05 0.9998 1.98
PFDA 0.9993 1.65 0.9933 0.06 0.9998 1.44
PFDS 0.9950 0.06 0.9950 0.03 0.9323 0.73
PFUnA 0.9968 0.16 n/a n/a 0.9979 1.59
PFDoA 0.9978 1.56 0.9987 0.13 1.000 1.52
PFOSi 0.9996 7.08 0.9950 0.40 0.9999 2.29
FOSA 0.9758 0.02 n/a n/a 0.9998 4.22
Table 4.2 Regression parameters of calibration curves in cow milk
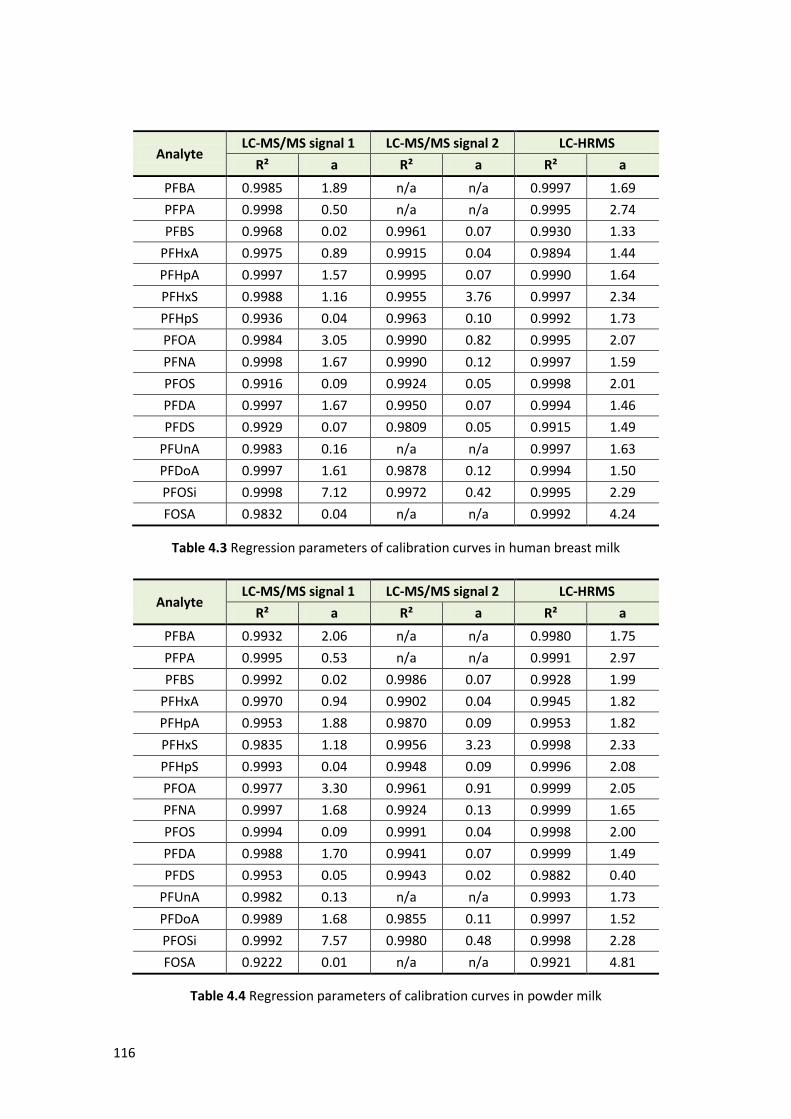
116
Analyte LC-MS/MS signal 1 LC-MS/MS signal 2 LC-HRMS
R² a R² a R² a
PFBA 0.9985 1.89 n/a n/a 0.9997 1.69
PFPA 0.9998 0.50 n/a n/a 0.9995 2.74
PFBS 0.9968 0.02 0.9961 0.07 0.9930 1.33
PFHxA 0.9975 0.89 0.9915 0.04 0.9894 1.44
PFHpA 0.9997 1.57 0.9995 0.07 0.9990 1.64
PFHxS 0.9988 1.16 0.9955 3.76 0.9997 2.34
PFHpS 0.9936 0.04 0.9963 0.10 0.9992 1.73
PFOA 0.9984 3.05 0.9990 0.82 0.9995 2.07
PFNA 0.9998 1.67 0.9990 0.12 0.9997 1.59
PFOS 0.9916 0.09 0.9924 0.05 0.9998 2.01
PFDA 0.9997 1.67 0.9950 0.07 0.9994 1.46
PFDS 0.9929 0.07 0.9809 0.05 0.9915 1.49
PFUnA 0.9983 0.16 n/a n/a 0.9997 1.63
PFDoA 0.9997 1.61 0.9878 0.12 0.9994 1.50
PFOSi 0.9998 7.12 0.9972 0.42 0.9995 2.29
FOSA 0.9832 0.04 n/a n/a 0.9992 4.24
Table 4.3 Regression parameters of calibration curves in human breast milk
Analyte LC-MS/MS signal 1 LC-MS/MS signal 2 LC-HRMS
R² a R² a R² a
PFBA 0.9932 2.06 n/a n/a 0.9980 1.75
PFPA 0.9995 0.53 n/a n/a 0.9991 2.97
PFBS 0.9992 0.02 0.9986 0.07 0.9928 1.99
PFHxA 0.9970 0.94 0.9902 0.04 0.9945 1.82
PFHpA 0.9953 1.88 0.9870 0.09 0.9953 1.82
PFHxS 0.9835 1.18 0.9956 3.23 0.9998 2.33
PFHpS 0.9993 0.04 0.9948 0.09 0.9996 2.08
PFOA 0.9977 3.30 0.9961 0.91 0.9999 2.05
PFNA 0.9997 1.68 0.9924 0.13 0.9999 1.65
PFOS 0.9994 0.09 0.9991 0.04 0.9998 2.00
PFDA 0.9988 1.70 0.9941 0.07 0.9999 1.49
PFDS 0.9953 0.05 0.9943 0.02 0.9882 0.40
PFUnA 0.9982 0.13 n/a n/a 0.9993 1.73
PFDoA 0.9989 1.68 0.9855 0.11 0.9997 1.52
PFOSi 0.9992 7.57 0.9980 0.48 0.9998 2.28
FOSA 0.9222 0.01 n/a n/a 0.9921 4.81
Table 4.4 Regression parameters of calibration curves in powder milk

117
Limits of detection
Predictably, due to its higher sensitivity, the LC-HRMS system showed lower limits of
detection, varying between 0.002 and 0.025 ng/mL (see Table 4.5).
Concerning PFOS and PFOA, LOD resulted identical with the two instruments for the
former (0.005 ng/mL), while for the latter it was slightly lower with the LTQ-Orbitrap™
system (0.002 ng/mL against 0.010 ng/mL). These values are extremely significant in
consideration of the levels of contamination likely to be found in milk.
For some compounds the obtained values were not so good, as for PFUnA, whose limit
of detection is affected by the presence of an interferent with the same retention
time, as previously mentioned.
Analyte LC-MS/MS LC-HRMS
Analyte LC-MS/MS LC-HRMS
ng/mL ng/mL ng/mL ng/mL
PFBA 0.040 0.015 PFNA 0.010 0.005
PFPA 0.100 0.025 PFOS 0.005 0.005
PFBS 0.050 0.002 PFDA 0.010 0.010
PFHxA 0.025 0.015 PFDS 0.025 0.010
PFHpA 0.025 0.010 PFUnA 0.040 0.025
PFHxS 0.020 0.003 PFDoA 0.050 0.025
PFHpS 0.010 0.002 PFOSi 0.010 0.002
PFOA 0.010 0.002 FOSA 0.050 0.025
Table 4.5 Limits of detection of the two instruments
Recovery
Although the use of internal standards significantly increases the reliability of the
results, extraction recoveries were evaluated to assess the efficiency of the extraction
procedure, giving satisfying results.
Measured values were between 30 and 111%, with mean recoveries varying from 69
to 87%. Concerning PFOS and PFOA, the obtained values were in the ranges 56-95%
and 69-89%, respectively.
The results for each of the 3 matrices are reported in the table presented on the next
page.

118
Analyte Cow milk (%) Human breast milk (%) Powder milk (%)
LC-MS/MS LC-HRMS LC-MS/MS LC-HRMS LC-MS/MS LC-HRMS
PFBA 75 73 92 97 68 66
PFPA 85 82 85 97 83 87
PFBS 92 90 99 106 87 92
PFHxA 91 88 85 96 81 88
PFHpA 89 81 74 84 81 89
PFHxS 82 89 83 87 101 96
PFHpS 92 92 69 76 86 90
PFOA 84 86 69 77 88 89
PFNA 84 86 58 61 82 85
PFOS 95 89 56 57 91 89
PFDA 83 86 61 55 92 87
PFDS 89 78 38 30 88 86
PFUnA 85 86 48 51 93 85
PFDoA 87 82 59 51 83 83
PFOSi 86 81 58 56 74 90
FOSA 57 54 69 35 111 48
Table 4.6 Extraction recoveries in milk, expressed as percentages
Precision
Coefficients of variation were globally very good on both systems (see Table 4.7, for
the LC-MS/MS instrument the most abundant transition was considered).
In particular, for PFOS and PFOA they ranged between 1.1-20.8% and 1.0-5.5%,
respectively. Moreover, except for PFDS and FOSA, all compounds showed values
lower than 20.4% in samples fortified at 0.5 ng/mL and up to 30.3% in milk spiked at
0.1 ng/mL.
As it can be observed, compounds which were associated to the correspondent
labeled internal standard generally presented very low CV%, proving that the use of
molecules with highly similar characteristics and behaviors allows to significantly
reduce response variability.
This aspect explains the poor results shown by the previously mentioned PFDS and
FOSA, whose internal standards were not available at the time of validation; however,
the LC-HRMS system demonstrated good repeatability even for FOSA.
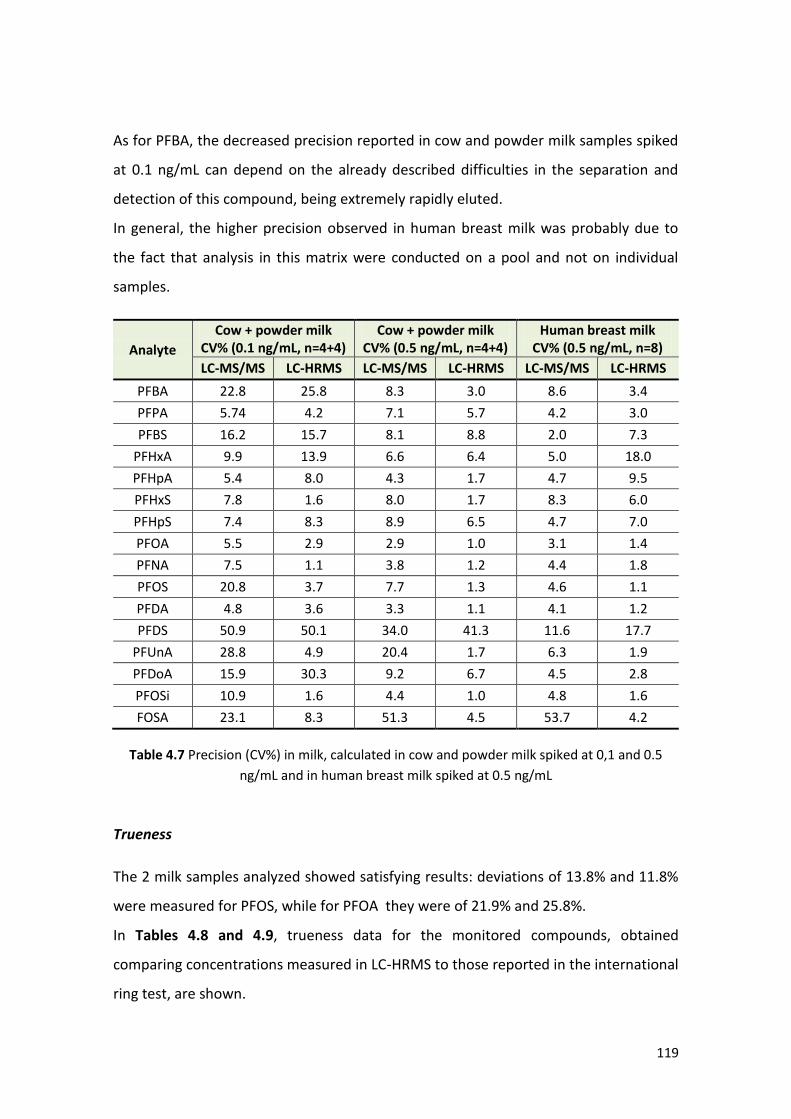
119
As for PFBA, the decreased precision reported in cow and powder milk samples spiked
at 0.1 ng/mL can depend on the already described difficulties in the separation and
detection of this compound, being extremely rapidly eluted.
In general, the higher precision observed in human breast milk was probably due to
the fact that analysis in this matrix were conducted on a pool and not on individual
samples.
Analyte
Cow + powder milk CV% (0.1 ng/mL, n=4+4)
Cow + powder milk CV% (0.5 ng/mL, n=4+4)
Human breast milk CV% (0.5 ng/mL, n=8)
LC-MS/MS LC-HRMS LC-MS/MS LC-HRMS LC-MS/MS LC-HRMS
PFBA 22.8 25.8 8.3 3.0 8.6 3.4
PFPA 5.74 4.2 7.1 5.7 4.2 3.0
PFBS 16.2 15.7 8.1 8.8 2.0 7.3
PFHxA 9.9 13.9 6.6 6.4 5.0 18.0
PFHpA 5.4 8.0 4.3 1.7 4.7 9.5
PFHxS 7.8 1.6 8.0 1.7 8.3 6.0
PFHpS 7.4 8.3 8.9 6.5 4.7 7.0
PFOA 5.5 2.9 2.9 1.0 3.1 1.4
PFNA 7.5 1.1 3.8 1.2 4.4 1.8
PFOS 20.8 3.7 7.7 1.3 4.6 1.1
PFDA 4.8 3.6 3.3 1.1 4.1 1.2
PFDS 50.9 50.1 34.0 41.3 11.6 17.7
PFUnA 28.8 4.9 20.4 1.7 6.3 1.9
PFDoA 15.9 30.3 9.2 6.7 4.5 2.8
PFOSi 10.9 1.6 4.4 1.0 4.8 1.6
FOSA 23.1 8.3 51.3 4.5 53.7 4.2
Table 4.7 Precision (CV%) in milk, calculated in cow and powder milk spiked at 0,1 and 0.5
ng/mL and in human breast milk spiked at 0.5 ng/mL
Trueness
The 2 milk samples analyzed showed satisfying results: deviations of 13.8% and 11.8%
were measured for PFOS, while for PFOA they were of 21.9% and 25.8%.
In Tables 4.8 and 4.9, trueness data for the monitored compounds, obtained
comparing concentrations measured in LC-HRMS to those reported in the international
ring test, are shown.

120
Analyte Reported values Measured values
Median (ng/mL)
SD (ng/mL)
Conc. (ng/mL)
Bias (%)
PFHpA 0.007 0.006 0.005 28.6
PFOA 0.146 0.137 0.114 21.9
PFHxS 0.086 0.042 0.116 34.9
PFOS 0.094 0.102 0.081 13.8
Table 4.8 Comparison between measured values and other labs median values in the human
breast milk sample from Sweden
Analyte Median values Measured values
Median (ng/mL)
SD (ng/mL)
Conc. (ng/mL)
Bias (%)
PFOA 0.066 0.080 0.049 25.8
PFOS 0.051 0.245 0.045 11.8
Table 4.9 Comparison between measured values and other labs median values in the human
breast milk sample from Germany
As for the analysis of the certified serum, the deviations of the mean measured
concentrations fell in the range indicated by InterCal. In particular, PFOS and PFOA
showed a bias of 0.7% and 15.7%, respectively.
Analyte Reported values Measured values
Mean (ng/mL)
SD (ng/mL)
Mean (ng/mL)
Bias (%)
PFHpA 0.318 0.405 0.544 71.1
PFOA 2.976 0.634 0.114 15.7
PFNA 0.815 0.233 0.116 10.9
PFDA 0.225 0.078 0.116 9.0
PFHxS 3.281 0.804 0.116 13.9
PFOS 9.952 3.294 0.081 0.7
Table 4.10 Comparison between measured values and reported concentrations of the certified
serum sample (NIST SRM 1957)
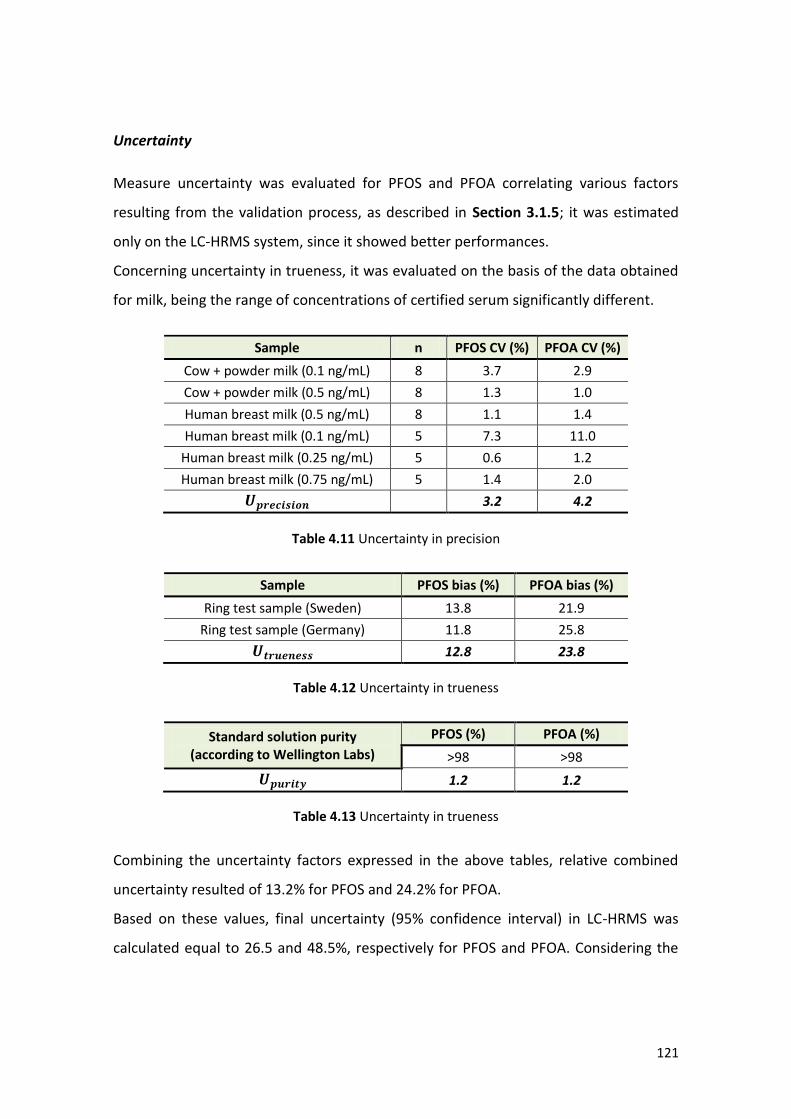
121
Uncertainty
Measure uncertainty was evaluated for PFOS and PFOA correlating various factors
resulting from the validation process, as described in Section 3.1.5; it was estimated
only on the LC-HRMS system, since it showed better performances.
Concerning uncertainty in trueness, it was evaluated on the basis of the data obtained
for milk, being the range of concentrations of certified serum significantly different.
Sample n PFOS CV (%) PFOA CV (%)
Cow + powder milk (0.1 ng/mL) 8 3.7 2.9
Cow + powder milk (0.5 ng/mL) 8 1.3 1.0
Human breast milk (0.5 ng/mL) 8 1.1 1.4
Human breast milk (0.1 ng/mL) 5 7.3 11.0
Human breast milk (0.25 ng/mL) 5 0.6 1.2
Human breast milk (0.75 ng/mL) 5 1.4 2.0
3.2 4.2
Table 4.11 Uncertainty in precision
Sample PFOS bias (%) PFOA bias (%)
Ring test sample (Sweden) 13.8 21.9
Ring test sample (Germany) 11.8 25.8
12.8 23.8
Table 4.12 Uncertainty in trueness
Standard solution purity (according to Wellington Labs)
PFOS (%) PFOA (%)
>98 >98
1.2 1.2
Table 4.13 Uncertainty in trueness
Combining the uncertainty factors expressed in the above tables, relative combined
uncertainty resulted of 13.2% for PFOS and 24.2% for PFOA.
Based on these values, final uncertainty (95% confidence interval) in LC-HRMS was
calculated equal to 26.5 and 48.5%, respectively for PFOS and PFOA. Considering the
122
extremely low levels at which these compounds are found in milk (<1 ng/mL), results
were judged satisfying.
In conclusion, the described method for the analysis of 16 different PFCs was
successfully validated in compliance with current European guidelines, demonstrating
very good performances with both LC-MS/MS and LC-HRMS systems. However, the
latter showed higher sensitivity and specificity, and resulted more suitable for those
compounds presenting a difficult and unspecific fragmentation, since the extracted
mass signal corresponds unambiguously to that of the target analyte while MS/MS
transitions can be common to those of interfering substances.
PFOS and PFOA, the two most important analytes of the group, showed extremely
good results in all the considered parameters, but also for the majority of the other
target molecules the obtained values were satisfying.
In particular, the very low limits of detection measured for most of the compounds are
suitable with the concentrations that are generally measured in milk and comparable
to those reported by the most performing methods described in literature.
Finally, the adoption of a wider range of specific internal standards (when available)
could lead to a further improvement of the performances of the method.
4.1.4 Samples analysis
All the available samples at the time of validation were processed applying the
developed method, in order to assess perfluorinated compounds contamination in the
three types of milk.
The choice of preparing for each day of analysis a calibration curve in ultrapure water
was due to the difficulty in finding milk containing negligible PFCs levels: instead of
risking to affect quantifications with an unreliable matrix-matched calibration curve, it
was preferred to prepare one processing a non-milk solution, spiked at the same
previously described levels, after verification of its non-contamination.

123
4.1.4.1 Human breast milk from France
The analysis of the 11 samples available at the time of validation highlighted the
predominance of PFOS and PFOA in human breast milk. They were found in all the
samples, with mean concentrations of 139 pg/mL (median 127 pg/mL) for PFOS and of
121 pg/mL (median 116 pg/mL) for PFOA. Measured levels ranged from 32 to 433
pg/mL for the former, and from 43 to 297 pg/mL for the latter.
Even if at lower concentrations, PFHxS and PFNA were detected at quantifiable levels
with a frequency of 91% and 82%, respectively. PFHxS highest concentration was 77
pg/mL, while for PFNA it was 69 pg/mL.
PFBA, PFPA and PFDA were found in some samples at trace levels: in one case PFBA
was quantified at 33 pg/mL and PFDA at 20 pg/mL.
These data were obtained with the LC-HRMS system, but comparing PFOS and PFOA
concentrations with those resulting from the analysis in LC-MS/MS a strong correlation
was observed (0.91 and 0.87, respectively).
4.1.4.2 Cow milk from France
PFCs levels observed in the analyzed cow milk samples resulted significantly lower
compared to those found in human breast milk.
PFOS was quantified in 4 out of 9 samples, with the highest measured concentration
equal to 40 pg/mL, and detected at trace levels in 2 cases; slightly lower values were
reported for PFOA, which was quantifiable in only 3 samples, at a maximum
concentration of 23 pg/mL, and detected with just a weak signal in 1 further sample.
The higher sensitivity of LC-HRMS allowed to detect PFOA at levels that couldn’t
otherwise have been observed with the LC-MS/MS instrument.
In addition, PFHxS and PFNA were detected in few cases, at levels up to 11 and 24
pg/mL, respectively. All the other target analytes weren’t found, except for one sample
presenting trace levels of PFDA.
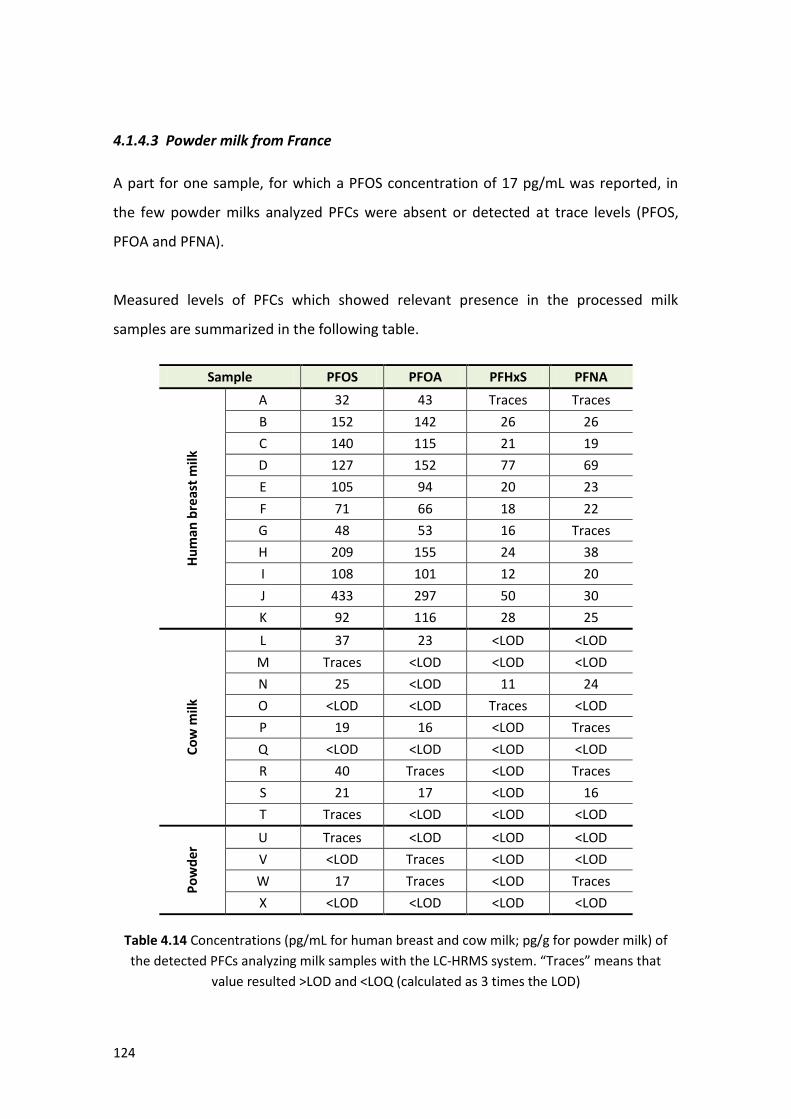
124
4.1.4.3 Powder milk from France
A part for one sample, for which a PFOS concentration of 17 pg/mL was reported, in
the few powder milks analyzed PFCs were absent or detected at trace levels (PFOS,
PFOA and PFNA).
Measured levels of PFCs which showed relevant presence in the processed milk
samples are summarized in the following table.
Sample PFOS PFOA PFHxS PFNA
Hu
man
bre
ast
milk
A 32 43 Traces Traces
B 152 142 26 26
C 140 115 21 19
D 127 152 77 69
E 105 94 20 23
F 71 66 18 22
G 48 53 16 Traces
H 209 155 24 38
I 108 101 12 20
J 433 297 50 30
K 92 116 28 25
Co
w m
ilk
L 37 23 <LOD <LOD
M Traces <LOD <LOD <LOD
N 25 <LOD 11 24
O <LOD <LOD Traces <LOD
P 19 16 <LOD Traces
Q <LOD <LOD <LOD <LOD
R 40 Traces <LOD Traces
S 21 17 <LOD 16
T Traces <LOD <LOD <LOD
Po
wd
er U Traces <LOD <LOD <LOD
V <LOD Traces <LOD <LOD
W 17 Traces <LOD Traces
X <LOD <LOD <LOD <LOD
Table 4.14 Concentrations (pg/mL for human breast and cow milk; pg/g for powder milk) of
the detected PFCs analyzing milk samples with the LC-HRMS system. “Traces” means that
value resulted >LOD and <LOQ (calculated as 3 times the LOD)

125
4.2 PFCs analysis at CABA-Lab
The developed method for PFCs detection in milk was transferred to the CABA-Lab
laboratory, adapting it to the UHPLC-MS/MS system of which that structure is
provided. During this first experiment, it was chosen to reduce the range of target
compounds to PFOS and PFOA, being the two most important PFCs.
The good performances obtained after the optimization of the analytical procedure
allowed to conduct a preliminary monitoring on the levels of contamination by these
pollutants in several cow milk and human breast milk samples collected in Italy.
4.2.1 Method transfer
4.2.1.1 Instrumental analysis
The most critical aspect of the transfer concerned the liquid chromatography system.
The method was in fact initially developed on a HPLC (high performance liquid
chromatography) instrument, while analysis at CABA-Lab were conducted on a UHPLC
(ultra high performance liquid chromatography) system. The latter is the result of the
recent technological implementations in liquid chromatography, which led to produce
stationary phases containing much smaller particles and mechanical components able
to operate at higher pressure, allowing a more efficient chromatographic separation
and significantly reduced injected volume and analysis time.
In order to reproduce as much as possible the chromatographic conditions, a Waters
Acquity BEH C18 column was chosen, having very similar properties to the column
used for HPLC separation at LABERCA; moreover, the same column was employed also
in most of the few available studies on PFCs detection in milk through UHPLC
instruments (Haug et al., 2010a; Liu et al., 2010; Kannan et al., 2011).
Ammonium acetate 20 mM (A) and methanol (B) were kept as mobile phases, with a
gradient that similarly started from 70% A and 30% B, switching to 100% B and then
126
going back to the initial conditions. Thanks to the performances of the UHPLC system,
the analysis time was significantly reduced from 20 to 5 min: in this way it’s thus
possible to process a larger number of samples, which can be useful in case of large
scale monitoring.
Concerning the detector part, negative electrospray ionization was employed and all
the parameters of the mass spectrometer were optimized using the standard solutions
of the two analytes and of their corresponding labeled compounds.
For PFOS, the parent-to-parent transition (498.64 > 498.64 m/z) was chosen for
quantification, since on this instrument it showed a slightly better signal compared to
the 498.64 > 80.00 m/z transition previously used.
4.2.1.2 Extraction procedure
Concerning samples extraction, the developed procedure was reproduced following all
the steps and critical points previously underlined.
To reduce potential interferences, polypropylene tubes and vials were preferred to
glass-made ones, and Teflon septa and caps were avoided.
In order to prevent alterations, all collected samples were stored in the freezer at
-18 °C before processing; similarly, prior to injection vials were stored away from light
in the refrigerator at 4 °C and kept at 6 °C during analysis.
A slightly higher amount of internal standards was added when preparing both
standard solutions and samples, without affecting the results in any way.
Unlike previously described for the analysis conducted at LABERCA, it wasn’t employed
the external standard (fluorometholone, added just before sample injection) since it
was not considered necessary.
4.2.1.3 Performances of the transferred method
Some tests were performed to verify the performances of the transferred procedure
before employing it for the analysis of milk samples.
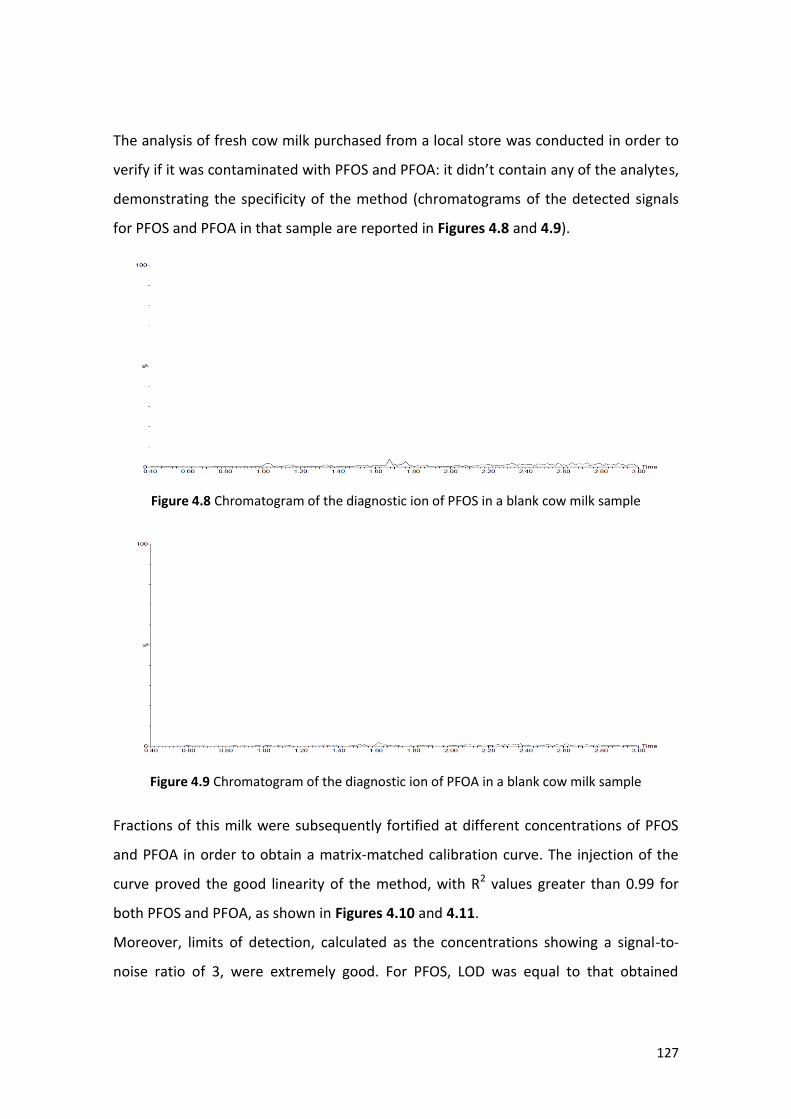
127
The analysis of fresh cow milk purchased from a local store was conducted in order to
verify if it was contaminated with PFOS and PFOA: it didn’t contain any of the analytes,
demonstrating the specificity of the method (chromatograms of the detected signals
for PFOS and PFOA in that sample are reported in Figures 4.8 and 4.9).
Figure 4.8 Chromatogram of the diagnostic ion of PFOS in a blank cow milk sample
Figure 4.9 Chromatogram of the diagnostic ion of PFOA in a blank cow milk sample
Fractions of this milk were subsequently fortified at different concentrations of PFOS
and PFOA in order to obtain a matrix-matched calibration curve. The injection of the
curve proved the good linearity of the method, with R2 values greater than 0.99 for
both PFOS and PFOA, as shown in Figures 4.10 and 4.11.
Moreover, limits of detection, calculated as the concentrations showing a signal-to-
noise ratio of 3, were extremely good. For PFOS, LOD was equal to that obtained
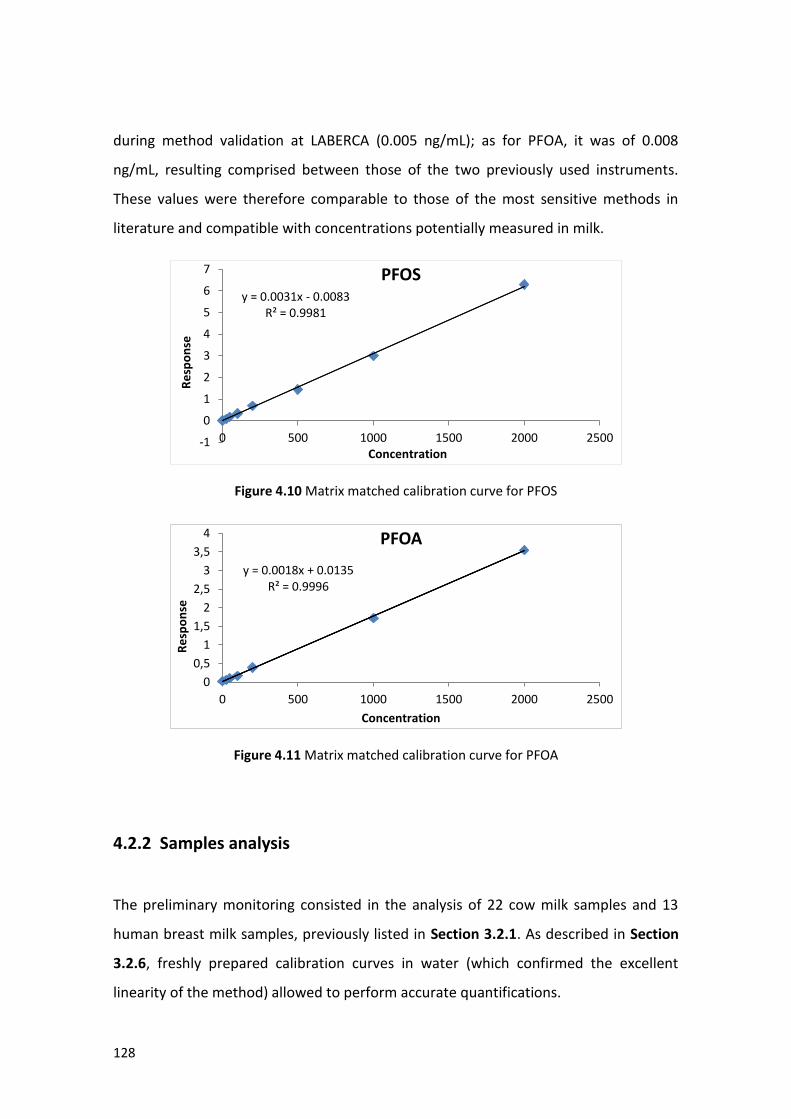
128
during method validation at LABERCA (0.005 ng/mL); as for PFOA, it was of 0.008
ng/mL, resulting comprised between those of the two previously used instruments.
These values were therefore comparable to those of the most sensitive methods in
literature and compatible with concentrations potentially measured in milk.
Figure 4.10 Matrix matched calibration curve for PFOS
Figure 4.11 Matrix matched calibration curve for PFOA
4.2.2 Samples analysis
The preliminary monitoring consisted in the analysis of 22 cow milk samples and 13
human breast milk samples, previously listed in Section 3.2.1. As described in Section
3.2.6, freshly prepared calibration curves in water (which confirmed the excellent
linearity of the method) allowed to perform accurate quantifications.
y = 0.0031x - 0.0083 R² = 0.9981
-1
0
1
2
3
4
5
6
7
0 500 1000 1500 2000 2500
Re
spo
nse
Concentration
PFOS
y = 0.0018x + 0.0135 R² = 0.9996
0
0,5
1
1,5
2
2,5
3
3,5
4
0 500 1000 1500 2000 2500
Re
spo
nse
Concentration
PFOA

129
4.2.2.1 Human breast milk from Italy
Table 4.15 shows the concentrations of PFOS and PFOA found in human breast milk.
Both compounds were detected at quantifiable levels (≥15 pg/mL for PFOS, ≥24 pg/mL
for PFOA) in all the analyzed samples.
Sample PFOS (pg/mL) PFOA (pg/mL)
A 44 25
B 98 103
C 102 65
D 86 94
E 68 84
F 76 50
G 63 33
H 143 181
I 40 63
J 92 57
K 106 77
L 60 62
M 42 24
Table 4.15 PFOS and PFOA concentrations in human breast milk samples from Italy
PFOS mean concentration was 78 pg/mL (median 76 pg/mL), with values comprised
between 40 and 143 pg/mL.
In Figure 4.12 the chromatograms of the most representative transition of PFOS
(498.64 > 498.64 m/z) and of the internal standard M-PFOS (502.86 > 502.86 m/z) in a
human breast milk sample are presented.
As for PFOA, measured levels were in the range 24-281 pg/mL, with a mean
concentration of 71 pg/mL (median 63 pg/mL).
Figure 4.13 shows the signals obtained for the diagnostic ions of PFOA (412.82 >
368.97 m/z) and of its correspondent internal standard M-PFOA (416.93 > 372.00 m/z)
analyzing a human breast milk sample.
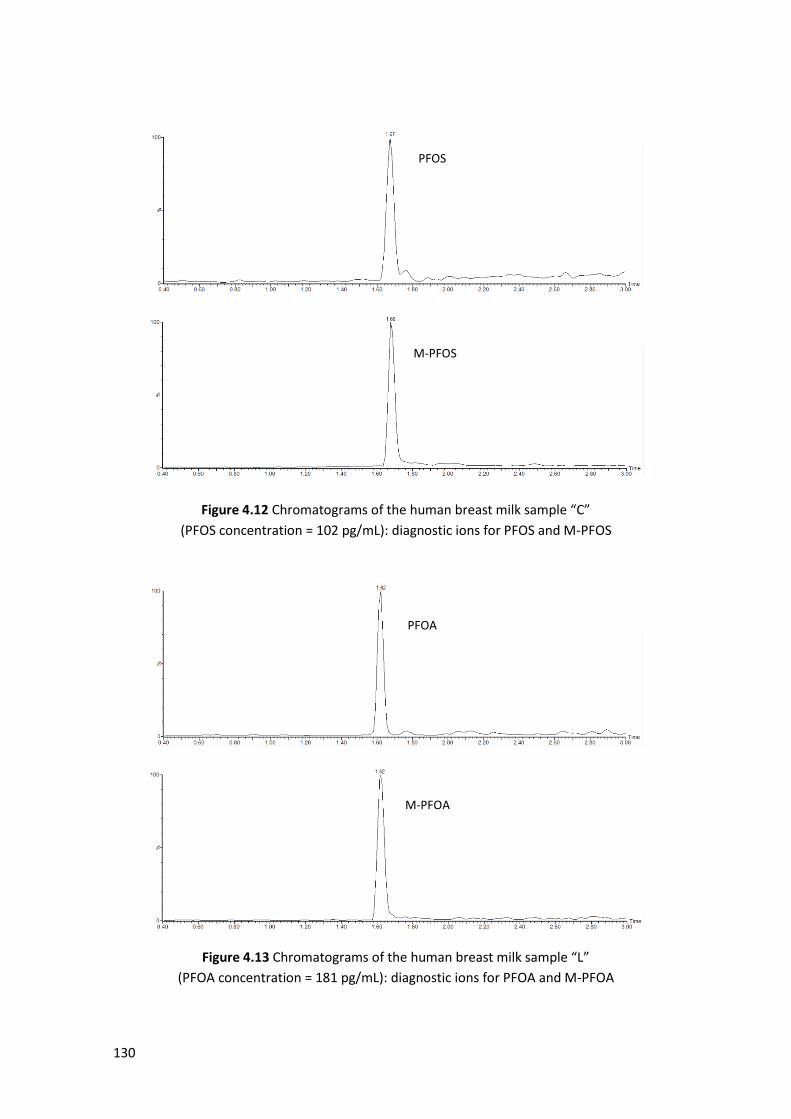
130
Figure 4.12 Chromatograms of the human breast milk sample “C”
(PFOS concentration = 102 pg/mL): diagnostic ions for PFOS and M-PFOS
Figure 4.13 Chromatograms of the human breast milk sample “L”
(PFOA concentration = 181 pg/mL): diagnostic ions for PFOA and M-PFOA
PFOS
M-PFOS
PFOA
M-PFOA
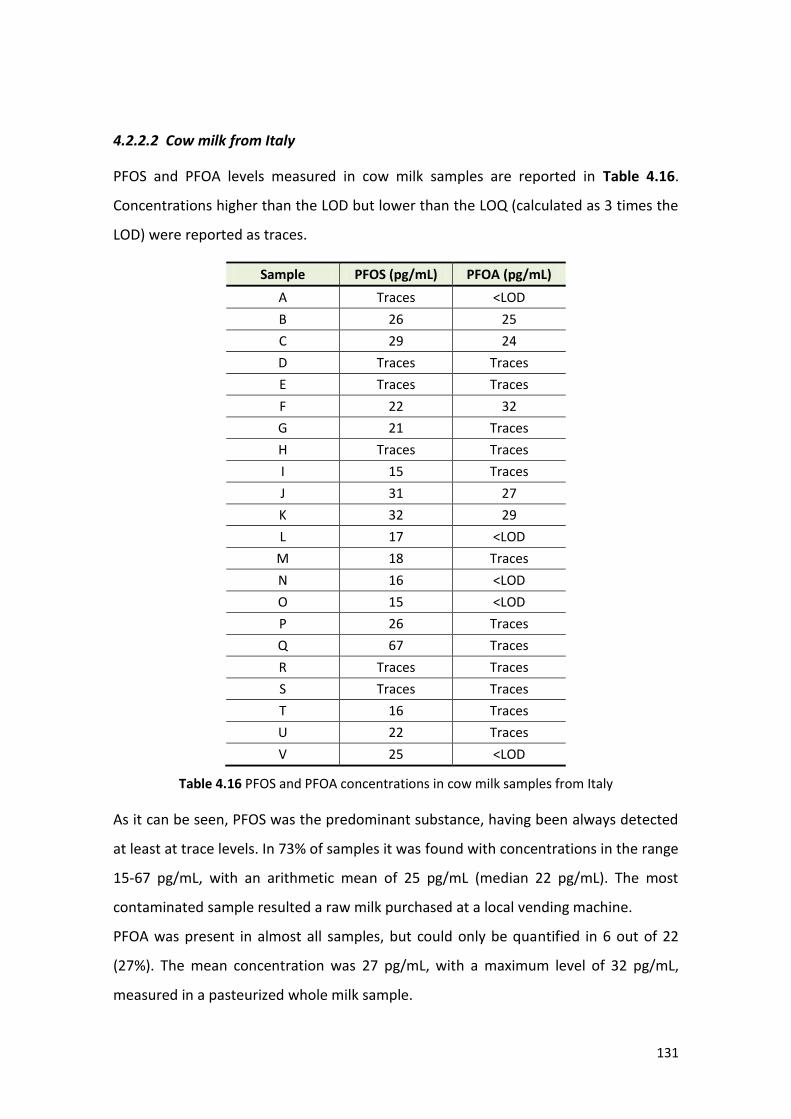
131
4.2.2.2 Cow milk from Italy
PFOS and PFOA levels measured in cow milk samples are reported in Table 4.16.
Concentrations higher than the LOD but lower than the LOQ (calculated as 3 times the
LOD) were reported as traces.
Sample PFOS (pg/mL) PFOA (pg/mL)
A Traces <LOD
B 26 25
C 29 24
D Traces Traces
E Traces Traces
F 22 32
G 21 Traces
H Traces Traces
I 15 Traces
J 31 27
K 32 29
L 17 <LOD
M 18 Traces
N 16 <LOD
O 15 <LOD
P 26 Traces
Q 67 Traces
R Traces Traces
S Traces Traces
T 16 Traces
U 22 Traces
V 25 <LOD
Table 4.16 PFOS and PFOA concentrations in cow milk samples from Italy
As it can be seen, PFOS was the predominant substance, having been always detected
at least at trace levels. In 73% of samples it was found with concentrations in the range
15-67 pg/mL, with an arithmetic mean of 25 pg/mL (median 22 pg/mL). The most
contaminated sample resulted a raw milk purchased at a local vending machine.
PFOA was present in almost all samples, but could only be quantified in 6 out of 22
(27%). The mean concentration was 27 pg/mL, with a maximum level of 32 pg/mL,
measured in a pasteurized whole milk sample.

132
4.3 Data interpretation
4.3.1 Human breast milk
A comparison between PFCs levels in the human breast milk samples processed during
the present study (collected in 2010) and those reported in other works available in
literature so far is presented in the table on the next page.
Even if the various analytes gave a variable contribution to total PFCs content, PFOS
was the most detected compound, being found in almost all samples, with median
concentrations around 100 pg/mL but reaching also values in the order of ng/mL in
some cases. PFOA was measured at levels generally slightly lower compared to PFOS
and showed great variability in terms of frequency among the different studies,
probably partially due to the fact that also limits of detection for this analyte varied
significantly. In particular, in the case of the present work, the high sensitivity of the
employed instruments allowed to confirm its presence in all the samples, even at very
low concentrations. PFHxS was often detected as well, in some cases even in a greater
percentage of samples and at higher concentrations than PFOA. No correlation was
observed between the concentrations of the various compounds.
Although during this research project only a limited number of samples were analyzed,
these data are among the first information available on the presence of these
contaminants in human breast milk from France and Italy.
A research group at LABERCA laboratory recently analyzed 30 samples of French
human breast milk employing the analytical method here described and performing
analysis in LC-HRMS, reporting the presence of PFOS and PFOA in 100% of the samples
and at levels in line with previous data (Kadar et al., 2011).
In Italy, Guerranti et al. reported in 2011 the results of an investigation on PFOS and
PFOA presence in human breast milk form the Siena area (Italy), which gave out of
average results: PFOS concentrations ranged between the LOD of 0.5 ng/mL and 4.28
ng/mL, while PFOA was found in 1 case at 7.78 ng/mL.

133
Country # PFOS
(pg/mL) PFOA
(pg/mL) PFHxS
(pg/mL) PFNA
(pg/mL) Reference
France 11 32-433(127)
[100%] 43-297(116)
[100%] <12-77(22.5)
[91%] <19-69(25)
[82%] Present study
Italy 13 40-143(76)
[100%] 24-281(63)
[100%] - -
France 30 24-171(74)
[100%] 18-102(57)
[100%] 0
[0%] -
Kadar et al. (2011)
Spain 20 <28-865(84)
[95%] <21-907(nd)
[40%] -
0 [0%]
Llorca et al. (2010)
Germany 203 <50-284(82)
[55%] <80-610(137)
[56%] <160-180(nd)
[1%] 0
[0%] Bernsmann and
Fürst (2008)
Germany 57 28-309(119)
[100%] <201-460(nd)
[19%] - -
Völkel et al. (2008)
Germany 201 <30-110(40)
[72%] <150-250(nd)
[2%] <20-30(nd)
[3%] -
Fromme et al. (2010)
Hungary 13 96-639(330)
[100%] 0
[0%] - -
Völkel et al. (2008)
Sweden 12 60-470(166)
[100%] <209-492(nd)
[6%] 31-172(70)
[100%] <5-20(nd)
[17%] Kärrman et al.
(2007)
USA 45 <32-617(106)
[96%] <30-161(36)
[89%] <12-64(12)
[51%] <5-18(7)
[64%] Tao et al. (2008b)
China 19 45-360(110)
[100%] 47-210(110)
[100%] 4-100(11)
[100%] 6-62(18) [100%]
So et al. (2006)
China 24* 6-137(49)
[100%] <LOQ-814(35)
[88%] <LOQ-15(6)
[83%] 6-76(13) [100%]
Liu et al. (2010)
Japan 51 8-401(nd)
[100%] <LOQ-339(nd)
[44%] <LOQ-25(nd)
[64%] <LOQ-150(nd)
[86%] Nakata et al.
(2007)
Japan 24 140-523(196)
[100%] <43-170(67)
[92%] <2-18(6)
[92%] <9-24(nd)
[13%] Tao et al. (2008a)
Malaysia 13 49-350(111)
[100%] <43-90(nd)
[23%] <2-13(7)
[85%] <9-15(nd)
[8%] Tao et al. (2008a)
Philippines 24 27-208(104)
[100%] <43-183(nd)
[29%] <2-59(13)
[92%] <9-25(nd)
[17%] Tao et al. (2008a)
Indonesia 20 25-256(67)
[100%] 0
[0%] <2-6(nd)
[45%] <9-135(nd)
[5%] Tao et al. (2008a)
Vietnam 40 17-393(59)
[100%] <43-89(nd)
[3%] <2-27(4)
[73%] <9-11(nd)
[5%] Tao et al. (2008a)
Cambodia 24 17-327(40)
[100%] <43-132(nd)
[4%] <2-19(nd)
[13%] <9-12(nd)
[13%] Tao et al. (2008a)
India 39 <11-120(39)
[85%] <43-335(nd)
[8%] <2-13(nd)
[36%] 0
[0%] Tao et al. (2008a)
Developing countries
19 <9-65(nd)
[84%] <80-192(nd)
[31%] <9-14(nd)
[11%] <25-55(nd)
[21%] Kärrman et al.
(2011)
Table 4.17 Comparison between measured levels of the most found PFCs in human breast milk
samples and other published data: range, (median) and [frequency]
* 24 pooled samples, consisting of 1237 individual samples
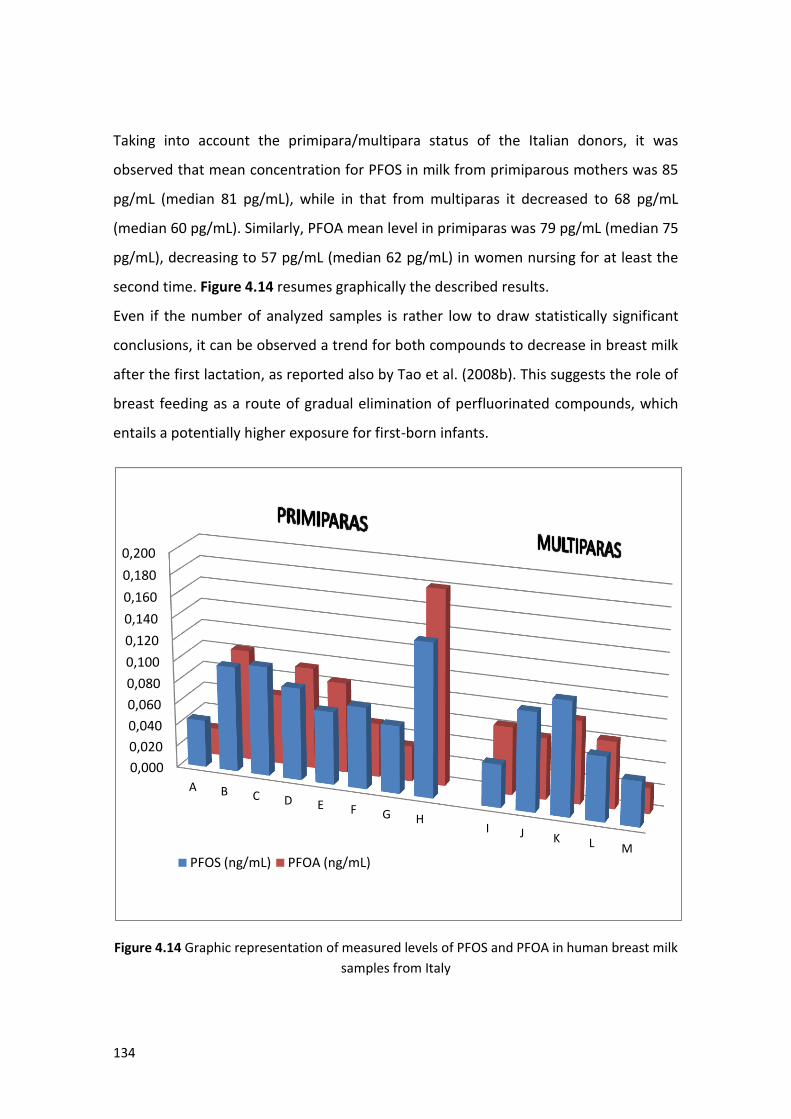
134
Taking into account the primipara/multipara status of the Italian donors, it was
observed that mean concentration for PFOS in milk from primiparous mothers was 85
pg/mL (median 81 pg/mL), while in that from multiparas it decreased to 68 pg/mL
(median 60 pg/mL). Similarly, PFOA mean level in primiparas was 79 pg/mL (median 75
pg/mL), decreasing to 57 pg/mL (median 62 pg/mL) in women nursing for at least the
second time. Figure 4.14 resumes graphically the described results.
Even if the number of analyzed samples is rather low to draw statistically significant
conclusions, it can be observed a trend for both compounds to decrease in breast milk
after the first lactation, as reported also by Tao et al. (2008b). This suggests the role of
breast feeding as a route of gradual elimination of perfluorinated compounds, which
entails a potentially higher exposure for first-born infants.
Figure 4.14 Graphic representation of measured levels of PFOS and PFOA in human breast milk
samples from Italy
0,000
0,020
0,040
0,060
0,080
0,100
0,120
0,140
0,160
0,180
0,200
A B C D E F G H I J K L M
PFOS (ng/mL) PFOA (ng/mL)

135
Based on the data obtained for France and Italy, PFOS and PFOA daily intakes (DIs) for
newborns, whose diet consists almost exclusively of breast milk, were calculated using
this formula (expressed as ng/kg b.w./day):
The resulting values, considering an average milk consumption of 780 mL/day during
the first 6 months of infant’s life, with a mean body weight of 5 kg (SCF, 2003), are
reported in Table 4.18. For each compound, DIs were calculated on the basis of the
lowest, highest and mean concentrations measured in the two Countries.
Country PFOS PFOA
Min DI Max DI Mean DI Lower DI Upper DI Mean DI
France 4.99 67.5 21.53 6.71 46.33 18.88
Italy 6.24 22.31 12.17 3.74 43.84 11.08
Table 4.18 PFOS and PFOA daily intake (ng/kg b.w./day)
Daily intakes were then related to TDIs suggested by EFSA (150 ng/kg b.w. for PFOS,
1500 ng/kg b.w. for PFOA) in order to estimate the risk index (RI) for newborns:
Country PFOS PFOA
Min RI Max RI Mean RI Lower RI Upper RI Mean RI
France 0.03 0.45 0.14 <0.01 0.03 0.01
Italy 0.04 0.15 0.08 <0.01 0.03 0.01
Table 4.19 Risk index for PFOS and PFOA
Higher risk index values were observed for PFOS, but even the maximum RIs were
significantly lower than 1, meaning that no toxicological risk should be expected to
derive from PFOS and PFOA intake through breastfeeding. At the same time, it must be
also observed that RIs are based on TDIs, which for these contaminants have not yet
been defined, existing rather different values suggested by various authorities and
referred to adult population. Therefore, what the preliminary results of this study
bring out is that the daily intake of these substances for infants via breast milk seems
to be several times higher than those reported for adults through diet.
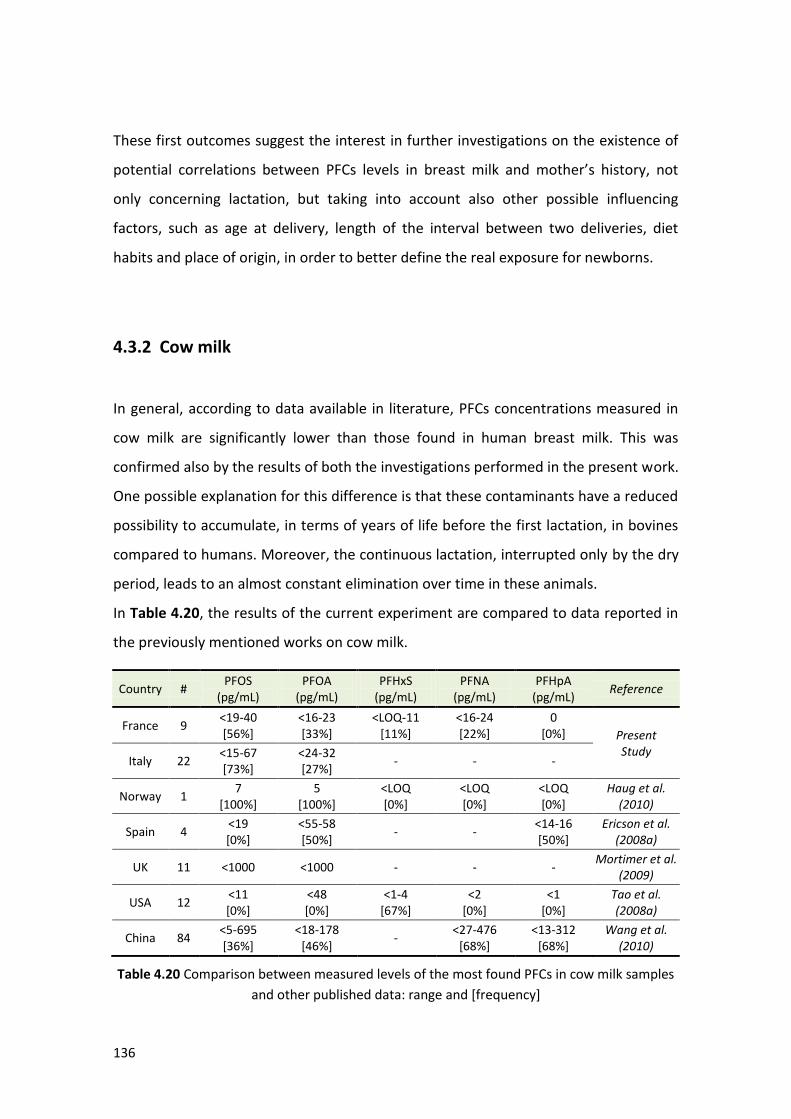
136
These first outcomes suggest the interest in further investigations on the existence of
potential correlations between PFCs levels in breast milk and mother’s history, not
only concerning lactation, but taking into account also other possible influencing
factors, such as age at delivery, length of the interval between two deliveries, diet
habits and place of origin, in order to better define the real exposure for newborns.
4.3.2 Cow milk
In general, according to data available in literature, PFCs concentrations measured in
cow milk are significantly lower than those found in human breast milk. This was
confirmed also by the results of both the investigations performed in the present work.
One possible explanation for this difference is that these contaminants have a reduced
possibility to accumulate, in terms of years of life before the first lactation, in bovines
compared to humans. Moreover, the continuous lactation, interrupted only by the dry
period, leads to an almost constant elimination over time in these animals.
In Table 4.20, the results of the current experiment are compared to data reported in
the previously mentioned works on cow milk.
Country # PFOS
(pg/mL) PFOA
(pg/mL) PFHxS
(pg/mL) PFNA
(pg/mL) PFHpA
(pg/mL) Reference
France 9 <19-40 [56%]
<16-23 [33%]
<LOQ-11 [11%]
<16-24 [22%]
0 [0%] Present
Study Italy 22
<15-67 [73%]
<24-32 [27%]
- - -
Norway 1 7
[100%] 5
[100%] <LOQ [0%]
<LOQ [0%]
<LOQ [0%]
Haug et al. (2010)
Spain 4 <19 [0%]
<55-58 [50%]
- - <14-16 [50%]
Ericson et al. (2008a)
UK 11 <1000 <1000 - - - Mortimer et al.
(2009)
USA 12 <11 [0%]
<48 [0%]
<1-4 [67%]
<2 [0%]
<1 [0%]
Tao et al. (2008a)
China 84 <5-695 [36%]
<18-178 [46%]
- <27-476
[68%] <13-312
[68%] Wang et al.
(2010)
Table 4.20 Comparison between measured levels of the most found PFCs in cow milk samples
and other published data: range and [frequency]

137
Measured levels show a certain variability, depending on the Country but often also on
the sensitivity of the employed methods.
Although also other PFCs were detected in some cases (PFHxA and PFDA, Haug et al.;
PFDA and PFUnA, Wang et al.), the global cow milk contamination by these pollutants
appears negligible. This was recently confirmed also by EFSA, on the basis of the
results of the European monitoring on perfluoroalkylated substances in food, reporting
PFOS presence in only 2 sheep milk samples out of 121 analyzed samples (including
cow, sheep and goat milk). However, in the cited work Mortimer et al. estimated a
total PFASs upper bound concentration of 11 ng/g. Therefore, further investigations
are needed in order to ascertain the potential risks deriving from the consumption of
different types of milk in the various Countries.
Moreover, surveys should include also cheese and other dairy products, since they
represent an important component of the diet for most of the population and are
likely to concentrate PFCs, which seem to have high affinity for proteins.
Within the monitoring of Italian cow milk samples, no significant correlations were
observed between the type of milk and its level of contamination by perfluorinated
compounds.
4.3.3 Powder milk
The importance of evaluating potential PFCs contaminations in powder milk is evident
considering the fact that, sometimes by choice but most of the times by necessity (in
case of mothers unable to produce milk), it can have a major role in newborns diet.
Among all the surveys that have been conducted on the presence of these
contaminants in food, only three included powder milk in the monitored matrices,
reporting extremely different results.
After analyzing 21 samples (diluted 1:1 in water) from 5 different brands available in
the United States, representing 99% of the US market, Tao et al. (2008a) reported
PFOS presence above the LOQ (10 pg/mL) with a frequency of 24% and a maximum

138
concentration of 11 pg/mL; PFHxS was found in 48% of samples, with measured levels
lower than 4 pg/mL.
Higher levels were observed by Wang et al. (2010) within a monitoring on 36 Chinese
powder milk samples, reporting the presence of PFOS, PFOA and PFNA with
frequencies of 33, 25 and 22%, respectively. Mean concentration in quantifiable
samples was 46 pg/g (range <36-482 pg/g) for PFOS, 22 pg/g (<10-175 pg/g) for PFOA
and 30 pg/g (<54-192 pg/g) for PFNA.
In the 4 powder milk samples processed in the presented work, only PFOS was
quantified in one sample (at 17 pg/g), while it was present in some cases at trace
levels, as well as PFOA and PFNA.
Comparing the above data, even if a certain variability in the presence of the various
analytes can be observed, PFCs concentrations result globally about an order of
magnitude lower than those likely to be found in human breast milk. Therefore, purely
in terms of exposure for newborns, these results suggest that powder milk may be
potentially less dangerous for newborns.
Nevertheless, in the study conducted by Llorca et al. (2010) 3 infant formulas were
analyzed, showing surprisingly high PFCs concentrations. PFDA was the predominant
substance, with concentrations between 693 and 1289 pg/g; also PFOS and PFOA
(ranges 229-1098 and 374-723 pg/g, respectively) were found at relevant levels.
On the contrary, Fromme et al. could not quantify any of the PFCs monitored in the 4
different infant formula samples included in their study (Fromme et al., 2010).
It’s difficult to explain the reasons for such big differences, however when comparing
this kind of food products, it must be considered that the various items can be
extremely different from each other in terms of composition (e.g. milk- or soy-based),
state of conservation (e.g. powder or concentrated liquid) and packaging material (e.g.
glass, plastic, cardboard). All these factors can therefore translate into different
amounts of contaminants deriving from various sources.
However, further data, on a wider range of samples, are needed to draw reliable
conclusions on perfluorinated compounds presence in this matrix.

139
4.4 PFCs precursors analysis at LABERCA
As previously reported, fluorotelomer alcohols and perfluorooctane sulfonamido
ethanols have been mainly analyzed in air and house dust, few Authors investigated
their presence in water as well, but little information is available to this day concerning
their potential contamination of food items. For this reason, in compliance with what
expressed by Recommendation 2010/161/EU, a method for the detection of some of
these PFCs precursors in fish (which is considered the most affected food item by
perfluoroalkylated substances) was developed.
Within this work package, various tests were performed also on another group of
perfluorinated compounds precursors, the so-called PAPS (polyfluoroalkyl phosphate
surfactants), which were mentioned in the above EU Recommendation as well. These
compounds were detected in LC-MS/MS, but various problems have been encountered
trying to optimize their extraction, which needs further experiments, and for this
reason they will not be discussed in this thesis.
4.4.1 Instrumental analysis
Some initial experiments were conducted to detect FOSEs and FTOHs on the
LC-MS/MS system in negative electrospray mode. Even after the removal of all the
buffer solutions, acetate adducts were the only detected signals for N-MeFOSE and
N-EtFOSE, and neither specificity nor sensitivity were satisfying; as for fluorotelomer
alcohols, they are known to be difficult to ionize in ESI and weren’t detected at all.
Optimization on GC-MS/MS was therefore preferred.
The initial tests were performed using a medium-high polarity column (50% phenyl /
50% dimethylpolysiloxane), but it showed a lack of retention for FTOHs, whose peaks
overlapped with the solvent front. For this reason it was replaced by a Varian CP-WAX
57CB column: the extreme inertness of this highly polar column, made of 100%
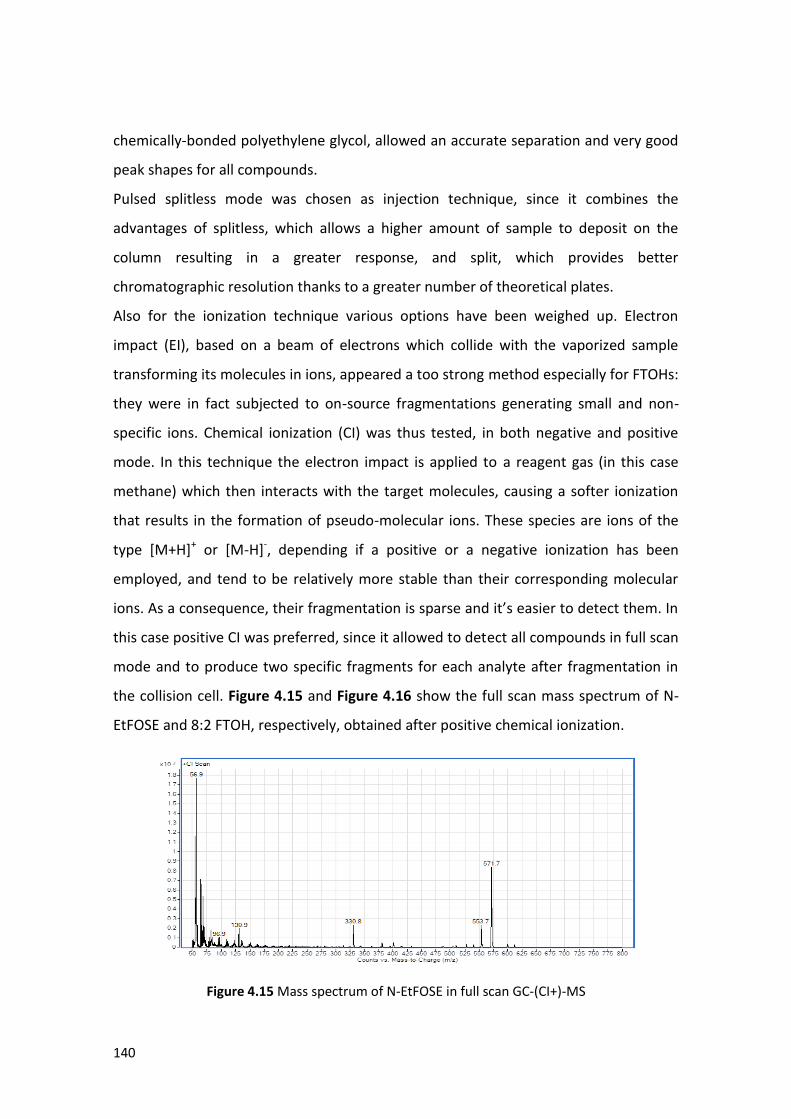
140
chemically-bonded polyethylene glycol, allowed an accurate separation and very good
peak shapes for all compounds.
Pulsed splitless mode was chosen as injection technique, since it combines the
advantages of splitless, which allows a higher amount of sample to deposit on the
column resulting in a greater response, and split, which provides better
chromatographic resolution thanks to a greater number of theoretical plates.
Also for the ionization technique various options have been weighed up. Electron
impact (EI), based on a beam of electrons which collide with the vaporized sample
transforming its molecules in ions, appeared a too strong method especially for FTOHs:
they were in fact subjected to on-source fragmentations generating small and non-
specific ions. Chemical ionization (CI) was thus tested, in both negative and positive
mode. In this technique the electron impact is applied to a reagent gas (in this case
methane) which then interacts with the target molecules, causing a softer ionization
that results in the formation of pseudo-molecular ions. These species are ions of the
type [M+H]+ or [M-H]-, depending if a positive or a negative ionization has been
employed, and tend to be relatively more stable than their corresponding molecular
ions. As a consequence, their fragmentation is sparse and it’s easier to detect them. In
this case positive CI was preferred, since it allowed to detect all compounds in full scan
mode and to produce two specific fragments for each analyte after fragmentation in
the collision cell. Figure 4.15 and Figure 4.16 show the full scan mass spectrum of N-
EtFOSE and 8:2 FTOH, respectively, obtained after positive chemical ionization.
Figure 4.15 Mass spectrum of N-EtFOSE in full scan GC-(CI+)-MS

141
Figure 4.16 Mass spectrum of 8:2 FTOH in full scan GC-(CI+)-MS
For the unambiguous identification of the compounds, two transitions were monitored
in MRM mode. The most intense signal was given for all the analytes by a big fragment
obtained applying a relatively low collision energy (10 V): for example, for N-EtFOSE
and 8:2 FTOH the observed transitions were 571.7 > 554.0 m/z and 464.6 > 426.7 m/z,
respectively. Parent-to-parent transitions (obtained with the lowest collision energy,
equal to 1 V) were used for confirmatory purposes, being preferred to the significantly
less intense secondary fragments produced with a high collision energy (30 V).
The following picture shows the peak of the most representative transition and its
retention time for each compound, analyzed in gas chromatography (using the
previously mentioned column) coupled to tandem mass spectrometry, operating
positive chemical ionization and acquiring in multiple reaction monitoring mode.
Figure 4.17 Separation of the diagnostic ions of the 3 FTOHs and the 2 FOSEs monitored. 0.02
ng injected in GC-(CI+)-MS/MS

142
4.4.2 Optimization of the extraction procedure
The performed preliminary tests aimed at the inclusion of these substances in the
range of analytes extracted through an already existing procedure developed at
LABERCA for PFCs in fish. This method is basically an evolution of that proposed by
Powley et al. (2005), which was based on an extraction with methanol followed by
graphitized carbon clean up. Here, a further purification through hydrated silica gel
was added, followed by centrifugation.
In order to balance the effects of the natural variability deriving from the different
phases of the extraction procedure, an internal standard for each family was added at
the beginning of the procedure. In particular, being extremely similar molecules, both
FOSEs were associated to deuterated N-MeFOSE, while labeled 8:2 FTOH was used for
the 3 FTOHs.
Due to the extreme volatility of both FTOHs and FOSEs, it resulted impossible to
extract them from the samples with this technique without causing their almost total
evaporation, therefore some changes have been made to try to reduce losses during
the various concentration steps. Instead of evaporating to dryness, the volume of the
extracts were just reduced to around 500 µL after the ENVI-Carb™ purification and to
200 µL before the injection. In addition, decreasing the temperature of the dry bath
from 45 to 35 °C and applying a more gentle nitrogen flow significantly increased the
recovery for N-MeFOSE and N-EtFOSE; as for FTOHs, even after these preventive
measures the efficiency of the extraction remained unsatisfactory.
To reduce fluorotelomer alcohols losses, some tests using a keeper solvent were
performed as well, but without improvements.
The extraction procedure previously described for PFCs in milk was tested on these
molecules as well but, even if elution profile assays seemed encouraging, the analytical
results were poor and thus the method was discarded.
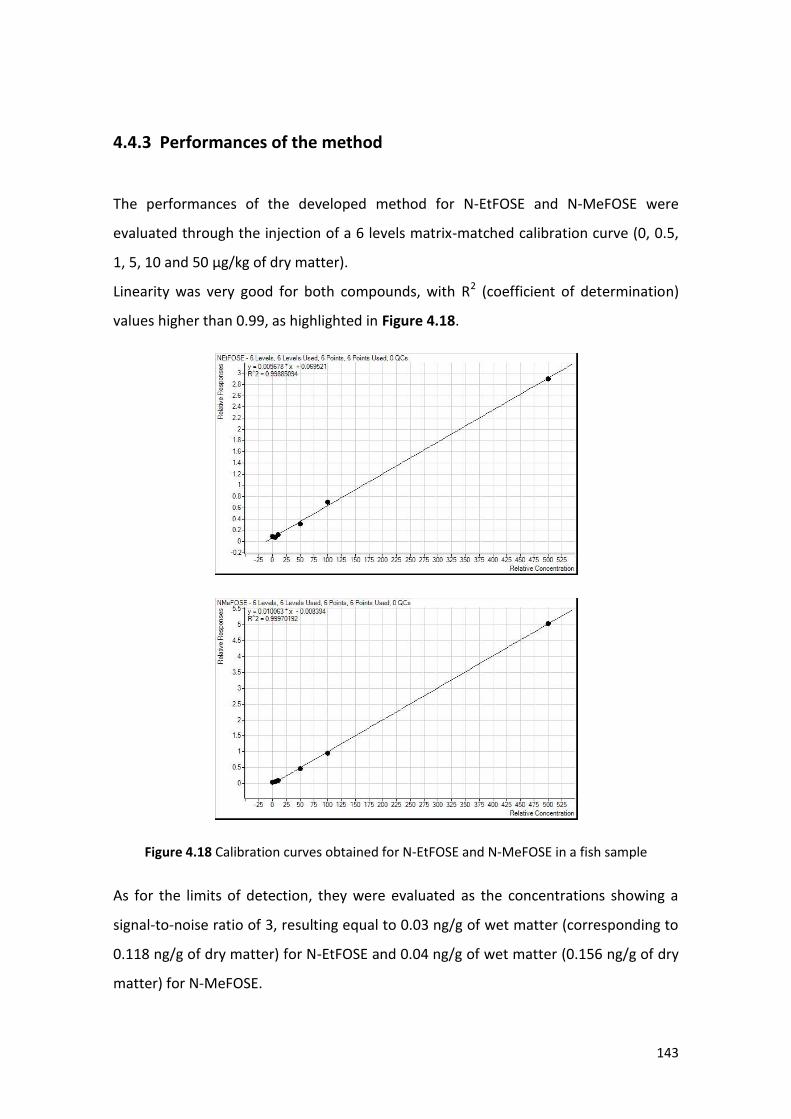
143
4.4.3 Performances of the method
The performances of the developed method for N-EtFOSE and N-MeFOSE were
evaluated through the injection of a 6 levels matrix-matched calibration curve (0, 0.5,
1, 5, 10 and 50 μg/kg of dry matter).
Linearity was very good for both compounds, with R2 (coefficient of determination)
values higher than 0.99, as highlighted in Figure 4.18.
Figure 4.18 Calibration curves obtained for N-EtFOSE and N-MeFOSE in a fish sample
As for the limits of detection, they were evaluated as the concentrations showing a
signal-to-noise ratio of 3, resulting equal to 0.03 ng/g of wet matter (corresponding to
0.118 ng/g of dry matter) for N-EtFOSE and 0.04 ng/g of wet matter (0.156 ng/g of dry
matter) for N-MeFOSE.
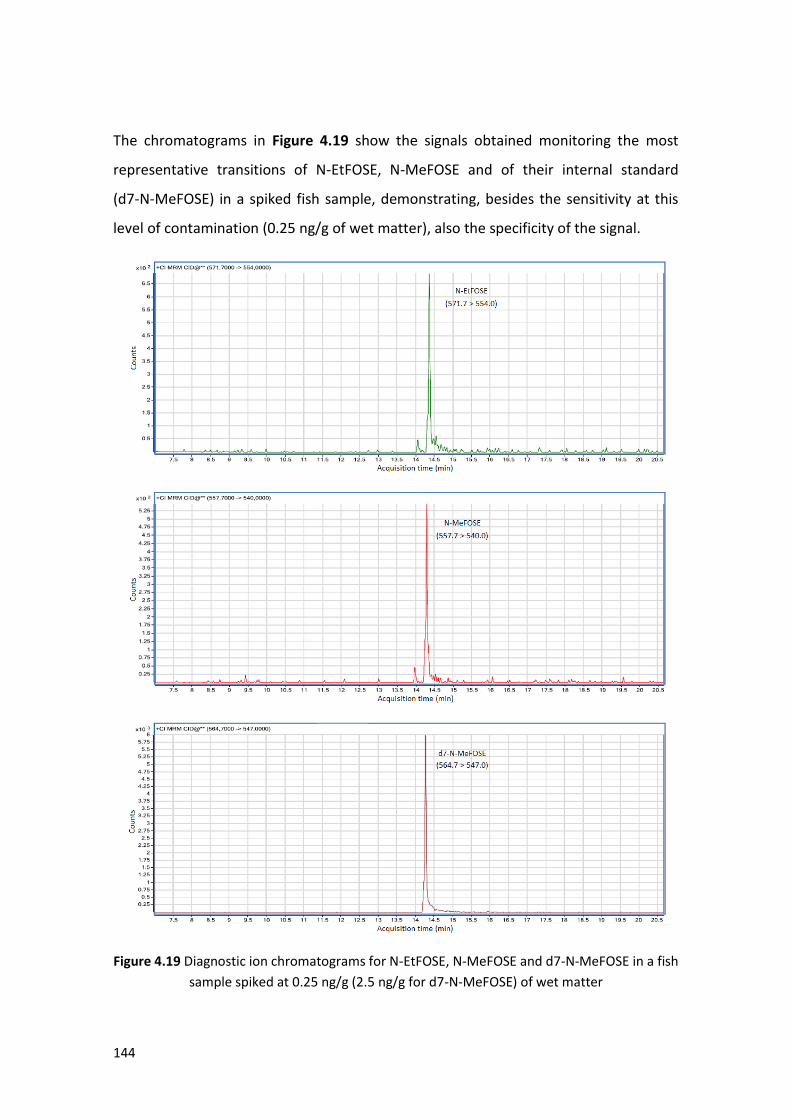
144
The chromatograms in Figure 4.19 show the signals obtained monitoring the most
representative transitions of N-EtFOSE, N-MeFOSE and of their internal standard
(d7-N-MeFOSE) in a spiked fish sample, demonstrating, besides the sensitivity at this
level of contamination (0.25 ng/g of wet matter), also the specificity of the signal.
Figure 4.19 Diagnostic ion chromatograms for N-EtFOSE, N-MeFOSE and d7-N-MeFOSE in a fish
sample spiked at 0.25 ng/g (2.5 ng/g for d7-N-MeFOSE) of wet matter

145
Absolute extraction recoveries were calculated comparing two samples processed in
parallel, of which one had been spiked at the beginning and the other at the end of the
extraction procedure, and resulted between 40 and 50% for both compounds.
Further tests are needed to confirm the reliability of the method and to evaluate all
the parameters required for its complete validation. However, a preliminary
monitoring on 15 fish samples using the described technique has been recently
performed by Pollono et al. (2011), who reported the presence of N-EtFOSE in certain
samples at concentrations up to 5 ng/g of wet matter.
In conclusion, a promising method for perfluorooctane sulfonamido ethanols detection
in fish was developed, allowing to monitor the presence of these PFOS precursors even
at trace levels in what is considered the most relevant contributor to perfluoroalkyl
substances dietary intake. This is a further achievement meeting the requests
expressed by Commission Recommendation 2010/161/EU on the monitoring of these
substances in food.

147
5. Conclusions
An efficient method based on liquid chromatography-mass spectrometry for the
detection of 16 different perfluorinated compounds in milk has been validated in
accordance with current European regulation guidelines (2002/657/EC) and is
currently under evaluation for ISO 17025 accreditation.
The analytical part was optimized at the French laboratory LABERCA and was
developed in parallel on a HPLC-MS/MS system, which is considered the standard
solution for PFCs measurement, and on a HPLC-HRMS instrument (the Thermo
Scientific LTQ-Orbitrap™), which proved to be a good alternative, providing in some
cases even better performances in terms of specificity and sensitivity. In fact, the
accurate extracted mass signal obtained with this high resolution detector allowed
ultra trace level quantification of such a large number of analytes despite their difficult
and unspecific fragmentation.
The described method represents a useful instrument for large-scale surveys on the
contamination of this matrix and was applied to cow, powder and human breast milk
samples from France to produce a limited and preliminary monitoring. Subsequently,
the procedure was successfully transferred to the Italian laboratory CABA-Lab and
employed for a similar pilot survey on PFOS and PFOA levels in cow and human breast
milk samples collected in Italy.
The obtained data, among the first produced in these two Countries, resulted in line
with those of most of the studies available in literature, proving the presence of PFOS
and PFOA in all the human breast milk samples analyzed, at concentrations (range 30-
400 pg/mL) several times higher than those measured in cow milk. These early results
thus confirmed the importance of breastfeeding as a major route of exposure for
infants and were used to perform an evaluation of the risk index, calculated as the
ratio between the daily intake and the TDI (tolerable daily intake) suggested by EFSA,
for 0-6 months old subjects, whose diet is constituted almost exclusively by breast

148
milk. Calculated risk indices suggested that there’s apparently no risk related to PFCs
intake via breastfeeding for newborns, but it must be noticed that a number of
different TDIs have been proposed for these contaminants and they all referred to the
adult population.
Moreover, the analysis of the Italian milk samples, for which the primipara/multipara
status of the donor was known, suggested that milk produced by mothers
breastfeeding for the first time was more contaminated, highlighting the role of
lactation as elimination route.
In consideration of the above, further investigations on larger numbers of samples are
needed to completely understand health risks for infants deriving from breast milk
consumption and to define potential correlations between measured PFCs levels and
individual parameters related to the mother.
In accordance with the recent European Commission Recommendation 2010/161/EU
on the monitoring of perfluoroalkylated substances in food, in which Member States
are required to focus not only on PFOS and PFOA but as well on their precursors, this
project led also to the development of a promising technique for the quantification on
N-MeFOSE and N-EtFOSE (perfluorooctane sulfonamido ethanols, precursors of PFOS)
in fish. This method showed extremely satisfying performances in terms of linearity
and limits of detection, allowing to measure these two contaminants at ultra trace
levels in this matrix, and will be a useful tool for future surveys.
The increasing interest on these emerging contaminants and on their adverse effects
on human health has led to the need for extensive monitoring of their presence in
food, in order to enable an accurate hazard evaluation deriving from dietary exposure.
The research project presented in this thesis is in line with this aim, providing some
preliminary data and reliable methods to be employed for further investigations.
149
Bibliography
3M
“The science of organic fluorochemistry”
(1999)
3M
“Perfluorooctanoic acid - physicochemical properties and environmental fate data”
(2003a)
3M
“Environmental and health assessment of perfluorooctane sulfonic acid and its salts”
(2003b)
Abbott BD, Wolf CJ, Schmid JE, Das KP, Zehr RD, Helfant L, Nakayama S, Lindstrom AB, Strynar MJ, Lau C
“Perfluorooctanoic acid-induced developmental toxicity in the mouse is dependent on expression of
peroxisome proliferator-activated receptor-alpha”
Toxicological Sciences (2007), 98 (2), 571-581
Apelberg BJ, Witter FR, Herbstman JB, Calafat AM, Halden RU, Needham LL, Goldman LR
“Cord serum concentrations of perfluorooctane sulfonate (PFOS) and perfluorooctanoate (PFOA) in
relation to weight and size at birth”
Environmental Health Perspectives (2007), 115 (11), 1670-1676
Awad E, Zhang X, Bhavsar SP, Petro S, Crozier PW, Reiner EJ, Fletcher R, Tittlemier SA, Braekevelt E
“Long-term environmental fate of perfluorinated compounds after accidental release at Toronto airport”
Environmental Science & Technology (2011), 45 (19), 8081-8089
Bakke T, Boitsov S, Brevik EM, Gabrielsen GW, Green N, Helgason LB, Klungsøyr J, Leknes H, Miljeteig C,
Måge A, Rolfsnes BE, Savinova T, Schlabach M, Skaare BB, Valdersnes S
“Mapping selected organic contaminants in the Barents Sea 2007”
Report 1021 (2008)
http://www.klif.no/publikasjoner/2400/ta2400.pdf (last accessed: 23 January 2012)
Barber JL, Berger U, Chaemfa C, Huber S, Jahnke A, Temme C, Jones KC
“Analysis of per- and polyfluorinated alkyl substances in air samples from Northwest Europe”
Journal of Environmental Monitoring (2007), 9 (6), 530-541
Bartell SM, Calafat AM, Lyu C, Kato K, Ryan PB, Steenland K
“Rate of decline in serum PFOA concentrations after granular activated carbon filtration at two public
water systems in Ohio and West Virginia”
Environmental Health Perspectives (2010), 118 (2), 222-228

150
Begley TH, White K, Honigfort P, Twaroski ML, Neches R, Walker RA
“Perfluorochemicals: potential sources of and migration from food packaging”
Food Additives and Contaminants (2005), 22 (10), 1023-1031
Bernsmann T and Fürst P
“Determination of perfluorinated compounds in human milk”
Organohalogen Compounds (2008), 70, 718-721
BfR (Bundensinstitut für Risikobewertung)
“Expert panel confirms: PFC exposure of consumers through foodstuffs is very low”
BfR Information Nr. 015 (2010)
http://www.bfr.bund.de/cm/349/expert_panel_confirms_pfc_exposure_of_consumers_through_foodst
uffs_is_very_low.pdf (last accessed: 23 January 2012)
Boulanger B, Vargo JD, Schnoor JL, Hornbuckle KC
“Evaluation of perfluorooctane surfactants in a wastewater treatment system and in a commercial
surface protection product”
Environmental Science & Technology (2005), 39 (15), 5524-5530
Brede E, Wilhelm M, Göen T, Müller J, Rauchfuss K, Kraft M, Hölzer J
“Two-year follow-up biomonitoring pilot study of residents’ and controls’ PFC plasma levels after PFOA
reduction in public water system in Arnsberg, Germany”
International Journal of Hygiene and Environmental Health (2010), 213 (3), 217-223
Brooke D, Footitt A, Nwagou TA
“Environmental risk evaluation report: perfluorooctanesulphonate (PFOS)”
(2004)
http://www.pops.int/documents/meetings/poprc/submissions/Comments_2006/sia/pfos.uk.risk.eval.re
port.2004.pdf (last accessed: 23 January 2012)
Buck RC, Franklin J, Berger U, Conder JM, Cousins IT, de Voogt P, Jensen AA, Kannan K, Mabury SA,
van Leeuwen SPJ
“Perfluoroalkyl and polyfluoroalkyl substances in the environment: terminology, classification and
origins”
Integrated Environmental Assessment and Management (2011), 7 (4), 513-541
Butenhoff J, Costa G, Elcombe C, Farrar D, Hansen K, Iwai H, Jung R, Kennedy G, Lieder P, Olsen G,
Thomford P
“Toxicity of ammonium perfluorooctanoate in male Cynomolgus monkeys after oral dosing for 6 months”
Toxicological Sciences (2002), 69 (1), 244-257
Butt CM, Berger U, Bossi R, Tomy GT
“Levels and trends of poly- and perfluorinated compounds in the arctic environment”
Science of The Total Environment (2010), 408 (15), 2936-2965

151
Calafat AM, Kuklenyik Z, Caudill SP, Reidy JA, Needham LL
“Perfluorochemicals in pooled serum samples from United States residents in 2001 and 2002”
Environmental Science & Technology (2006a), 40 (7), 2128-2134
Calafat AM, Needham LL, Kuklenyik Z, Reidy JA, Tully JS, Aguilar-Villalobos M, Naeher LP
“Perfluorinated chemicals in selected residents of the American continent”
Chemosphere (2006b), 63 (3), 490-496
Calafat AM, Kuklenyik Z, Reidy JA, Caudill SP, Tully JS, Needham LL
“Serum concentrations of 11 polyfluoroalkyl compounds in the U.S. population: data from the National
Health and Nutrition Examination Survey (NHANES) 1999-2000”
Environmental Science & Technology (2007), 41 (7), 2237-2242
Chu S and Letcher RJ
“Analysis of fluorotelomer alcohols and perfluorinated sulfonamides in biotic samples by liquid
chromatography-atmospheric pressure photoionization mass spectrometry”
Journal of Chromatography A (2008), 1215, 92-99
Commission Regulation (EC) No 552/2009 of 22 June 2009, amending Regulation (EC) No 1907/2006 of
the European Parliament and of the Council on the Registration, Evaluation, Authorisation and
Restriction of Chemicals (REACH) as regards Annex XVII
Official Journal of the European Union (26.6.2009), L164, 7-31
Committee on Toxicity
“COT statement on the tolerable daily intake for perfluorooctane sulfonate”
(2009)
http://cot.food.gov.uk/pdfs/cotstatementpfos200609.pdf (last accessed: 23 January 2012)
Committee on Toxicity
“COT statement on the tolerable daily intake for perfluorooctanoic acid”
(2010)
http://cot.food.gov.uk/pdfs/cotstatementpfoa200610.pdf (last accessed: 23 January 2012)
de Voogt P and Sáez M
“Analytical chemistry of pefluoroalkylated substances”
Trends in Analytical Chemistry (2006), 25 (4), 326-342
De Witt JC, Shnyra A, Badr MZ, Loveless SE, Hoban D, Frame SR, Cunard R, Anderson SE, Meade BJ,
Peden-Adams MM, Luebke RW, Luster MI
“Immunotoxicity of perfluorooctanoic acid and perfluorooctane sulfonate and the role of peroxisome
proliferator-activated receptor alpha”
Critical Reviews in Toxicology (2009), 39 (1), 76-94
D’Hollander W, de Voogt P, De Cohen W, Bervoets L
“Perfluorinated substances in human food and other sources of human exposure”
Reviews of Environmental Contamination and Toxicology (2010), 208, 179-215

152
D’Hollander W, de Voogt P, Bervoets L
“Accumulation of perfluorinated chemicals in Belgian home-produced chicken eggs”
Organohalogen Compounds (2011), 73, 917-920
Directive 2006/122/EC of the European Parliament and of the Council of 12 December 2006, amending
for the 30th
time Council Directive 76/769/EEC on the approximation of the laws, regulations and
administrative provisions of the Member States relating to restrictions on the marketing and use of
certain dangerous substances and preparations (perfluorooctane sulfonates)
Official Journal of the European Union (27.12.2006), L372, 32-34
Domingo JL, Ericson-Jogsten I, Nadal M, Perelló G, Bigas E, Llebaria X, van Bavel B
“Exposure to perfluorinated compounds through drinking water, and fish and seafood by the population
of Catalonia (Spain)”
Organohalogen Compounds (2011), 73, 969-972
Dreyer A, Matthias V, Temme C, Ebinghaus R
“Annual time series of air concentrations of polyfluorinated compounds”
Environmental Science & Technology (2009), 43 (11), 4029-4036
EFSA (European Food Safety Authority)
“Perfluorooctane sulfonate (PFOS), perfluorooctanoic acid (PFOA) and their salts – Scientific Opinion of
the Panel on Contaminants in the Food Chain”
The EFSA Journal (2008), 653, 1-131
EFSA (European Food Safety Authority)
“Results of the monitoring of perfluoroalkylated substances in food in the period 2000-2009”
The EFSA Journal (2011), 9(2):2016, 1-34
Ehlers S, Bernsmann T, Fürst P
“Perfluorinated compounds in fish – An ecological monitoring in rivers from North Rhine Westphalia -
Germany”
Organohalogen Compounds (2011), 73, 227-229
Ellington JJ, Washington JW, Evans JJ, Jenkins TM, Hafner SC, Neill MP
“Analysis of fluorotelomer alcohols in soils: optimization of extraction and chromatography”
Journal of Chromatography A (2009), 1216 (28), 5347-5354
Ellis DA, Martin JW, De Silva AO, Mabury SA, Hurley MD, Sulbaek Andersen MP, Wallington TJ
“Degradation of fluorotelomer alcohols: a likely atmospheric source of perfluoroalkyl carboxylic acids”
Environmental Science & Technology (2004), 38 (12), 3316-3321
Ericson I, Gómez M, Nadal M, van Bavel B, Lindström G, Domingo JL
“Perfluorinated chemicals in blood of residents in Catalonia (Spain) in relation to age and gender: a pilot
study”
Environmental International (2007), 33 (5), 616-623
153
Ericson I, Martí-Cid R, Nadal M, van Bavel B, Lindström G, Domingo JL
“Human exposure to perfluorinated chemicals through the diet: intake of perfluorinated compounds in
foods from the Catalan (Spain) market”
Journal of Agricultural and Food Chemistry (2008a), 56 (5), 1787-1794
Ericson I, Nadal M, van Bavel B, Lindström G, Domingo JL
“Levels of perfluorochemicals in water samples from Catalonia, Spain: is drinking water a significant
contribution to human exposure?”
Environmental Science and Pollution Research (2008b), 15 (7), 614-619
Falandysz J, Taniyasu S, Gulkowska A, Yamashita N, Schulte-Oehlmann U
“Is fish a major source of fluorinated surfactants and repellents in humans living on the Baltic Coast?”
Environmental Science & Technology (2006), 40 (3), 748-751
Fei C, McLaughlin JK, Lipworth L, Olsen J
“Maternal levels of perfluorinated chemicals and subfecundity”
Human Reproduction (2009), 24 (5), 1200-1205
Felizeter S, McLachlan M, De Voogt P
“Uptake of perfluorinated alkyl substances by hydroponically grown lettuce (Lactuca sativa) and tomato
(Solanum lycopersicum)”
Organohalogen Compounds (2011), 73, 947-948
Fengler R, Schlummer M, Gruber L, Fielder D, Weise N
“Migration of fluorinated telomer alcohols (FOTH) from food contact materials into food at elevated
temperatures”
Organohalogen Compounds (2011), 73, 939-942
Fields S
“Brain effects stick around: PFCs and neural cell development”
Environmental Health Perspectives (2007), 116 (6), A258-A259
Fromme H, Schlummer M, Möller A, Gruber L, Wolz G, Ungewiss J, Böhmer S, Dekant W, Mayer R,
Liebl B, Twardella D
“Exposure of an adult population to perfluorinated substances using duplicate diet portions and
biomonitoring data”
Environmental Science & Technology (2007a), 41 (22), 7928-7933
Fromme H, Midasch O, Twardella D, Angerer J, Boehmer S, Liebl B
“Occurrence of perfluorinated substances in an adult German population in southern Bavaria”
International Archives of Occupational and Environmental Health (2007b), 80 (4), 313-319
Fromme H, Tittlemier SA, Völkel W, Wilhelm M, Twardella D
“Pefluorinated compounds – Exposure assessment for the general population in western countries”
International Journal of Hygiene and Environmental Health (2009), 212 (3), 239-270
154
Fromme H, Mosch C, Morovitz M, Alba-Alejandre I, Boehmer S, Kiranoglu M, Faber F, Hannibal I, Genzel-
Boroviczény O, Koletzko B, Völkel W
“Pre- and postnatal exposure to perfluorinated compounds (PFCs)”
Environmental Science & Technology (2010), 44 (18), 7123-7129
Furdui VI, Stock NL, Ellis DA, Butt CM, Whittle DM, Crozier PW, Reiner EJ, Muir DC, Mabury SA
“Spatial distribution of perfluoroalkyl contaminants in lake trout from the Great Lakes”
Environmental Science & Technology (2007), 41 (5), 1554-1559
Giesy JP and Kannan K
“Global distribution of perfluorooctane sulfonate in wildlife”
Environmental Science & Technology (2001), 35 (7), 1339-1342
Guerranti C, Perra G, Corsolini S, Focardi SE
“Preliminary results on levels of perfluorinated compounds in human milk samples from central Italy”
Organohalogen Compounds (2011), 73, 957-959
Gulkowska A, Jiang Q, So MK, Taniyasu S, Lam PKS, Nobuyoshi Y
“Persistent perfluorinated acids in seafood collected from two cities of China”
Environmental Science & Technology (2006), 40 (12), 3736-3741
Gützkow KB, Haug LS, Thomsen C, Sabaredzovic A, Becher G, Brunborg G
“Placental transfer of perfluorinated compounds is selective – A Norwegian mother and child sub-cohort
study”
International Journal of Hygiene and Environmental Health (2011), in press
Han X, Snow TA, Kemper RA, Jepson GW
“Binding of perfluorooctanoic acid to rat and human plasma proteins”
Chemical Research in Toxicology (2003), 16 (6), 775-781
Hansen KJ, Clemen LA, Ellefson ME, Johnson HO
“Compound-specific, quantitative characterization of organic fluorochemicals in biological matrices”
Environmental Science & Technology (2001), 35 (4), 766-770
Hansen KJ, Johnson HO, Elridge JS, Buthenhoff JL, Dick LA
“Quantitative characterization of trace levels of PFOS and PFOA in the Tennessee river”
Environmental Science & Technology (2002), 36 (8), 1681-1685
Harada K, Saito N, Sasaki K, Inoue K, Koizumi A
“Perfluorooctane sulfonate contamination of drinking water in the Tama River, Japan: estimated effects
on resident serum levels”
Bulletin of Environmental Contamination and Toxicology (2003), 71 (1), 31-36

155
Harada K, Saito N, Inoue K, Yoshinaga T, Watanabe T, Sasaki S, Kamiyama S, Koizumi A
“The influence of time, sex and geographic factors on levels of perfluorooctane sulfonate and
perfluorooctanoate in human serum over the last 25 years”
Journal of Occupational Health (2004a), 46 (2), 141-147
Harada K, Nakanishi S, Saito N, Tsutsui T, Koizumi A.
“Airborne perfluorooctanoate may be a substantial source contamination in Kyoto area, Japan”
Bulletin of Environmental Contamination and Toxicology. 2005;74(1):64-9
Harrad S
“Persistent organic pollutants”
ISBN: 978-1-4051-6930-1
John Wiley & Sons Ltd, Chichester, West Sussex, United Kingdom (2009), 288 pages
Haug LS, Salihovic S, Jogsten IE, Thomsen C, van Bavel B, Lindström G, Becher G
“Levels in food and beverages and daily intake of perfluorinated compounds in Norway”
Chemosphere (2010a), 80 (10), 1137-1143
Haug LS, Thomsen C, Brantsaeter AL, Kvalem HE, Haugen M, Becher G, Alexander J, Meltzer HM,
Knutsen HK
“Diet and particularly seafood are major sources of perfluorinated compounds in humans”
Environment International (2010b), 36 (7), 772-778
Haug LS, Huber S, Becher G, Thomsen C
“Characterisation of human exposure pathways to perfluorinated compounds - Comparing exposure
estimates with biomarkers of exposure”
Environment International (2011a), 37 (4), 687-693
Haug LS, Huber S, Schlabach M, Becher G, Thomsen C
“Investigation on per- and polyfluorinated compounds in paired samples of house dust and indoor air
from Norwegian homes”
Environmental Science & Technology (2011b), 45 (19), 7991-7998
Hinderliter PM, Mylchreest E, Gannon SA, Butenhoff JL, Kennedy GL Jr.
“Perfluorooctanoate: placental and lactational transport pharmacokinetics in rats”
Toxicology (2005), 211 (1-2), 139-148
Hölzer J, Midasch O, Rauchfuss K, Kraft M, Reupert R, Angerer J, Kleeschulte P, Marschall N, Wilhelm M
“Biomonitoring of perfluorinated compounds in children and adults exposed to perfluorooctanoate-
contaminated drinking water”
Environmental Health Perspectives (2008), 116 (5); 651-657
Hölzer J, Göen T, Rauchfuss K, Kraft M, Angerer J, Kleeschulte P, Wilhelm M
“One-year follow-up of perfluorinated compounds in plasma of German residents from Arnsberg
formerly exposed to PFOA-contaminated drinking water”
International Journal of Hygiene and Environmental Health (2009), 212 (5), 499-504

156
Hu W, Jones PD, Upham BL, Trosko JE, Lau C, Giesy JP
“Inhibition of gap junctional intercellular communication by perfluorinated compounds in rat liver and
dolphin kidney epithelial cell lines in vitro and Sprague-Dawley rats in vivo”
Toxicological Sciences (2002), 68 (2), 429-436
Hu W, Jones PD, Celius T, Giesy JP
“Identification of genes responsive to PFOS using gene expression profiling”
Environmental Toxicology and Pharmacology (2005), 19 (1), 57-70
Hu J, Yu J, Tanaka S, Fujii S
“Perfluorooctane Sulfonate (PFOS) and Perfluorooctanoic acid (PFOA) in water environment of
Singapore”
Water, Air and Soil Pollution (2011), 216 (1-4), 179-191
Ingelido AM, Marra V, Abballe A, Valentini S, Iacovella N, Barbieri P, Porpora MG, di Domenico A, De
Felip E
“Perfluorooctanesulfonate and perfluorooctanoic acid exposures of the Italian general population”
Chemosphere (2010), 80 (10), 1125-1130
Jahnke A, Ahrens L, Ebinghaus R, Temme C
“Urban versus remote air concentrations of Fluorotelomer alcohols and other polyfluorinated alkyl
substances in Germany”
Environmental Science & Technology (2007), 41 (3), 745-752
Jahnke A, Barber JL, Jones KC, Temme C
“Quantitative trace analysis of polyfluorinated alkyl substances (PFAS) in ambient air samples from Mace
Head (Ireland): A method intercomparison”
Atmospheric Environment (2009), 43 (4), 844-850
Jensen AA and Leffers H
“Emerging endocrine disrupters: perfluoroalkylated substances”
International Journal of Andrology (2008), 31 (2), 161-169
Jin Y, Bao J, Liu W, Zhang J
“Regional and rural-urban differences of PFOS and PFOA in blood of the general populations in China”
Organohalogen Compounds (2011), 73, 953-956
Jogsten IE, Perelló G, Llebaria X, Bigas E, Martí-Cid R, Kärrman A, Domingo JL
“Exposure to perfluorinated compounds in Catalonia, Spain, through consumption of various raw and
cooked foodstuffs, including packaged food”
Food and Chemical Toxicology (2009), 47 (7), 1577-1583
Johansson N, Fredriksson A, Eriksson P
“Neonatal exposure to perfluorooctane sulfonate (PFOS) and perfluorooctanoic acid (PFOA) causes
neurobehavioural defects in adult mice”
Neurotoxicology (2008), 29 (1), 160-169
157
Kadar H, Veyrand B, Barbarossa A, Pagliuca G, Legrand A, Bosher C, Boquien CY, Durand S, Monteau F,
Antignac JP, Le Bizec B
“Development of an analytical strategy based on liquid chromatography-high resolution mass
spectrometry for measuring perfluorinated compounds in human breast milk: application to the
generation of preliminary data regarding perinatal exposure in France”
Chemosphere (2011), 85 (3), 473-480
Kannan K, Corsolini S, Falandysz J, Fillmann G, Kumar KS, Loganathan BG, Mohd MA, Olivero J, Van
Wouwe N, Yang JH, Aldoust KM
“Perfluorooctanesulfonate and related fluorochemicals in human blood from several countries”
Environmental Science & Technology (2004), 38 (17), 4489-4495
Kannan K, Tao L, Sinclair E, Pastva SD, Jude DJ, Giesy JP
“Perfluorinated compounds in aquatic organisms at various trophic levels in a Great Lakes food chain”
Archives of Environmental Contamination and Toxicology (2005), 48 (4), 559-566
Kärrman A, van Bavel B, Järnberg U, Hardell L, Lindström G
“Levels of perfluoroalkylated compounds in whole blood from Sweden”
Organohalogen Compounds (2004), 66, 4008-4012
Kärrman A, Mueller JF, van Bavel B, Harden F, Toms LML, Lindström G
“Levels of 12 perfluorinated chemicals in pooled Australian serum, collected 2002-2003, in relation to
age, gender, and region”
Environmental Science & Technology (2006), 40 (12), 3742-3748
Kärrman A, Ericson I, van Bavel B, Darnerud PO, Aune M, Glynn A, Lignell S, Lindström G
“Exposure of perfluorinated chemicals through lactation: levels of matched human milk and serum and a
Temporal Trend, 1996–2004, in Sweden”
Environmental Health Perspectives (2007), 115 (2), 226-230
Kärrman A, Harada KH, Inoue K, Takasuga T, Ohi E, Koizumi A
“Relationship between dietary exposure and serum perfluorochemical (PFC) levels – A case study”
Environment International (2009), 35 (4), 712-717
Kärrman A, Mattioli L, Malisch R, Magulova K, van Bavel B, Fiedler H
“Perfluorinated compounds in pooled human milk from developing countries”
Organohalogen compounds (2011), 73, 803-805
Kubwabo C, Vais N, Benoit FM
“A pilot study on the determination of perfluorooctanesulfonate and other perfluorinated compound in
blood of Canadians”
Journal fo Environmental Monitoring (2004), 6 (6), 540-545
Kudo N, Katamura M, Sato Y, Kawashima Y
“Sex hormone-regulated renal transport of perfluorooctanoic acid”
Chemico-biological Interactions (2002), 139 (3), 301-316
158
Kuklenyik Z, Reich JA, Tully JS, Needham LL, Calafat AM
“Automated Solid-Phase Extraction and Measurement of Perfluorinated Organic Acids and Amides in
Human Serum and Milk”
Environmental Science & Technology (2004), 38 (13), 3698-3704
Lacina O, Hradkova P, Pulkrabova J, Hajslova J
“Simple, high throughput ultra-high performance liquid chromatography/tandem mass spectrometry
trace analysis of perfluorinated alkylated substances in food of animal origin: Milk and fish”
Journal of Chromatography A (2011), 1218 (28), 4312-4321
Langer V, Dreyer A, Ebinghaus R
“Polyfluorinated compounds in residential and nonresidential indoor air”
Environmental Science & Technology (2010), 44 (21), 8075-8081
Lau C, Thibodeaux JR, Hanson RG, Rogers JM, Grey BE, Stanton ME, Butenhoff JL, Stevenson LA
“Exposure to perfluorooctanesulfonate during pregnancy in rat and mouse. II: Postnatal evaluation”
Toxicological Sciences (2003), 74 (2), 382-392
Lau C, Thibodeaux JR, Hanson RG, Narotsky MG, Rogers JM, Lindstrom AB, Strynar MJ
“Effects of perfluorooctanoic acid exposure during pregnancy in the mouse”
Toxicological Sciences (2006), 90 (2), 510-518
Lau C, Anitole K, Hodes C, Lai D, Pfhales-Hutchens A, Seed J
“Perfluoroalkyl acids: a review of monitoring and toxicological findings”
Toxicological Sciences (2007), 99 (2), 366-394
Lehmler HJ
“Synthesis of environmentally relevant fluorinated surfactants – A review”
Chemosphere (2005), 58 (11), 1471-1496
Liu J, Li J, Zhao Y, Wang Y, Zhang L, Wu Y
“The occurrence of perfluorinated alkyl compounds in human milk from different regions of China”
Environment International (2010), 36 (5), 433-438
Llorca M, Farré M, Picó Y, Teijón ML, Alvarez JC, Barceló D
“Infant exposure of perfluorinated compounds: levels in breast milk and commercial baby food”
Environment International (2010), 36 (6), 584-592
Loveless SE, Finlay C, Everds NE, Frame SR, Gillies PJ, O’Connor JC, Powley CR, Kennedy GL
“Comparative responses of rats and mice exposed to linear/branched, linear, or branched ammonium
perfluorooctanoate (APFO)”
Toxicology (2006), 220 (2-3), 203-217
Loewen M, Wania F, Wang F, Tomy G
“Attitudinal transect of atmospheric and aqueous fluorinated organic compounds in western Canada”
Environmental Science & Technology (2008), 42 (7), 2374-2379

159
Luebker DJ, Hansen KJ, Bass NM, Butenhoff JL, Seacat AM
“Interactions of flurochemicals with rat liver fatty acid-binding protein”
Toxicology (2002), 176 (3), 175-185
Luebker DJ, York RG, Hansen KJ, Moore JA, Butenhoff JL
“Neonatal mortality from in utero exposure to perfluorooctanesulfonate (PFOS) in Sprague-Dawley rats:
dose-response, and biochemical and pharamacokinetic parameters”
Toxicology (2005), 215 (1-2), 149-169
Luque N, Ballesteros-Gómez A, van Leeuwen S, Rubio S
“Analysis of perfluorinated compounds in biota by microextraction with tetrahydrofuran and liquid
chromatography/ion isolation-based ion-trap mass spectrometry”
Journal of Chromatography A (2010), 1217 (24), 3774-3782
Mak YL, Taniyasu S, Yeung LW, Lu G, Jin L, Yang Y, Lam PK, Kannan K, Yamashita N
“Perfluorinated compounds in tap water from China and several other countries”
Environmental Science & Technology (2009), 43 (13), 4824-4829
Mosch C, Kiranoglu M, Fromme H, Völkel W
“Simultaneous quantitation of perfluoroalkyl acids in human serum and breast milk using on-line sample
preparation by HPLC column switching coupled to ESI-MS/MS”
Journal of Chromatography B (2010), 878 (27), 2652-2658
Manage PM, Guruge K, Taniyasu S, Yamashita N, Galbada Arachchige SP
“Accumulation of perfluorooctanesulfonate and related fluorochemicals in fishes from Sri Lanka”
Organohalogen Compounds (2005), 67, 816-817
Martin JW, Muir DC, Moody CA, Ellis DA, Kwan WC, Solomon KR, Mabury SA
“Collection of airborne fluorinated organics and analysis by gas chromatography/chemical ionization
mass spectrometry”
Analytical Chemistry (2002), 74 (3), 584-590
Martin JW, Chan K, Mabury SA, O’Brien PJ
“Bioactivation of fluorotelomer alcohols in isolated rat hepatocytes”
Chemico-Biological Interactions (2009), 177 (3), 196-203
Midasch O, Schettegen T, Angerer J
“Pilot study on the perfluorooctanesulfonate and perfluorooctanoate exposure of the German general
population”
International Journal of Hygiene and Environmental Health (2006), 209 (6), 489-496
Mortimer DN, Gem M, Clarke DB, Lloyd AS, Hird S
“PFOS, PFOA and other fluorinated organic chemicals in food”
Organohalogen Compounds (2009), 71, 1343-1348

160
Motegi M, Horii Y, Hosono S, Nojiri K
“Method development of volatile perfluorinated compounds in water using purge and trap extraction-
GC/MS”
Organohalogen Compounds (2010), 72, 880-883
Nakata H, Kannan K, Nasu T, Cho HS, Sinclair E, Takemura A
“Perfluorinated contaminants in sediments and aquatic organisms collected from shallow water and
tidal flat areas of the Ariake Sea, Japan: Environmental fate of perfluorooctanesulfonate in aquatic
ecosystems”
Environmental Science & Technology (2006), 40 (16), 4916-4921
Nakata A, Katsumata T, Iwasaki Y, Ito R, Saito K, Izumi S, Makino T, Kishi R, Nakazawa H
“Measurement of perfluorinated compounds in human milk and house dust”
Organohalogen Compounds (2007), 69, 2844–2846
Noorlander CW, van Leeuwen SPJ, te Biesebeek JD, Mengelers MJB, Zeilmaker MJ
“Levels of perfluorinated compounds in food and dietary intake of PFOS and PFOA in the Netherlands”
Journal of Agricultural and Food Chemistry (2011), 59 (13), 7496-7505
O’Hagan D
“Understanding organofluorine chemistry. An introduction to the C-F bond”
Chemical Society Review (2008), 37, 308-319
OECD (Organisation for Economic Co-operation and Development)
“Hazard assessment of perfluorooctanesulfonate (PFOS) and its salts”
ENV/JM/RD(2002)17/FINAL (2002)
www.oecd.org/dataoecd/23/18/2382880.pdf (last accessed: 23 January 2012)
Ohmori K, Kudo N, Katayama K, Kawashima Y
“Comparison of the toxicokinetics between perfluorocarboxylic acids with different carbon chain length”
Toxicology (2003), 184 (2-3), 135-140
Olsen GW, Church TR, Miller JP, Burris JM, Hansen KJ, Lundberg JK, Armitage JB, Herron RM,
Medhdizadehkashi Z, Nobiletti JB, O’Neill EM, Mandel JH, Zobel LR
“Perfluorooctanesulfonate and other fluorochemicals in the serum of American Red Cross adult blood
donors”
Environmental Health Perspectives (2003a), 111 (16), 1892–1901
Olsen GW, Burris JM, Burlew MM, Mandel JH
“Epidemiologic assessment of worker serum perfluorooctanesulfonate (PFOS) and perfluorooctanoate
(PFOA) concentrations and medical surveillance examinations”
Journal of Occupational and Environmental Medicine (2003b), 45 (3), 260–270
161
Olsen GW, Logan PW, Hansen KJ, Simpson CA, Burris JM, Burlew MM, Vorarath PP, Venkateswarlu P,
Schumpert JC, Mandel JH
“An occupational exposure assessment of a perfluorooctane sulfonyl fluoride production site:
biomonitoring”
(2003c), 64 (5), 651–659
Olsen GW, Church TR, Larson EB, van Belle G, Lundberg JK, Hansen KJ, Burris JM, Mandel JH, Zobel LR
“Serum concentrations of perfluooctanesulfonate and other fluorochemicals in an elderly population
from Seattle, Washington”
Chemosphere (2004), 54 (11), 1599–1611.
Olsen GW, Mair DC, Reagan WK, Ellefson ME, Ehresman DJ, Butenhoff, JL, Zobel LR
“Preliminary evidence of a decline in perfluorooctanesulfonate (PFOS) and perfluorooctanoate (PFOA)
concentrations in American Red Cross blood donors”
Chemosphere (2007a), 68 (1), 105-111
Olsen GW, Burris JM, Ehresman DJ, Froehlich JW, Seacat AM, Butenhoff JL, Zobel LR
“Half-life of serum elimination of perfluorooctanesulfonate, perfluorohexanesulfonate, and
perfluorooctanoate in retired fluorochemical production workers”
Environmental Health Perspectives (2007b), 115 (9), 1298-1305
Olsen GW and Zobel LR
“Assessment of lipid, hepatic, and thyroid parameters with serum perfluorooctanoate (PFOA)
concentrations in fluorochemical production workers”
International Archives of Occupational and Environmental Health (2007), 81 (2), 231-246
Olsen GW, Butenhoff JL, Zobel LR
“Perfluoroalkyl chemicals and human fetal development: an epidemiologic review with clinical and
toxicological perspectives”
Reproductive Toxicology (2009a), 27 (3-4), 212-230
Olsen GW, Chang SC, Noker PE, Gorman GS, Ehresman DJ, Lieder PH, Butenhoff JL
“A comparison of the pharmacokinetics of perfluorobutanesulfonate (PFBS) in rats, monkeys, and
humans”
Toxicology (2009b), 256 (1-2), 65-74
Oono S, Harada KH, Mahmoud MA, Inoue K, Koizumi A
“Current levels of airborne polyfluorinated telomers in Japan”
Chemosphere (2008), 73 (6), 932-937
Paul AG, Jones KC, Sweetman AJ
“A first global production, emission and environmental inventory for perfluorooctane sulfonate”
Environmental Science & Technology (2009), 43 (2), 386-392
162
Phillips MM, Dinglasan-Panlilio MJA, Mabury SA, Solomon KR, Sibley PK
“Fluorotelomer acids are more toxic than perfluorinated acids”
Environmental Science & Technology (2007), 41 (20), 7159-7163
Piekarz AM, Primbs T, Field JA, Barofsky DF, Simonich S
“Semivolatile fluorinated organic compounds in Asian and western U.S. air masses”
Environmental Science & Technology (2007), 41 (24), 8248-8255
Pistocchi A and Loos R
“A map of European emissions and concentrations of PFOS and PFOA”
Environmental Science & Technology (2009), 43 (24), 9237-9244
Pollono C, Veyrand B, Barbarossa A, Durand S, Marchand P, Antignac JP, Pagliuca G, Le Bizec B
“Analysis of perfluoroalkyl precursors in fish samples: challenge and first application”
Organohalogen Compounds (2011), in press
Powley CR, George SW, Ryan TW, Buck RC
“Matrix effect-free analytical methods for determination of perfluorinated carboxylic acids in
environmental matrixes”
Analytical Chemistry (2005), 77 (19), 6353–6358
Prevedouros K, Cousins IT, Buck RC, Korzeniowski SH
“Sources, fate and transport of perfluorocarboxylates”
Environmental Science & Technology (2006), 40 (1), 32-44
Qiu Y, Jing H, Shi H
“Perfluorocarboxylic acids (PFCAs) and perfluoroalkyl sulfonates (PFASs) in surface and tap water around
Lake Taihu in China”
Frontiers of Environmental Science & Engineering in China (2010), 4 (3), 301-310
Qu Y, Zhang C, Zhou Q, Li Q, Wang H, Ni H, Liu W
“Adsorption mechanism of perfluorooctane sulfonate on granular activated carbon in wastewater”
2010 4th International Conference on Bioinformatics and Biomedical Engineering (iCBBE) (2010), 1-3
Quinete N, Wu Q, Zhang T, Yun SH, Moreira I, Kannan K
“Specific profiles of perfluorinated compounds in surface and drinking waters and accumulation in
mussels, fish, and dolphins from southeastern Brazil”
Chemosphere (2009), 77 (6), 863-869
Quiñones O and Snyder SA
“Occurrence of perfluoroalkyl carboxylates and sulfonates in drinking water utilities and related waters
from the United States”
Environmental Science & Technology (2009), 43 (24), 9089-9095
163
Recommendation 2010/161/EU, of 17 March 2010 on the monitoring of perfluoroalkylated substances
in food
Official Journal of the European Union (18.3.2010), L68, 22-23
Rhoads KR, Janssen EM, Luthy RG, Criddle CS
“Aerobic biotransformation and fate of N-ethyl perfluorooctane sulfonamidoethanol (N-EtFOSE) in
activated sludge”
Environmental Science & Technology (2008), 42 (8), 2873-2878
Saito N, Harada K, Inoue K, Sasaki K, Yoshinaga T, Koizumi A
“Perfluorooctanoate and perfluorooctane sulfonate concentrations in surface water in Japan”
Journal of Occupational Health (2004), 46 (1), 49-59
SCF (Scientific Committee on Food)
“Report of the Scientific Committee on Food on the revision of essential requirements of infant formulae
and follow-on formulae”
SCF/CS/NUT/IF/65 Final, (2003)
Schiavone A, Corsolini S, Kannan K, Tao L, Trivelpiece W, Torres D Jr., Focardi S
“Perfluorinated contaminants in fur seal pups and penguin eggs from South Shetland, Antarctica”
Science of the Total Environment (2009), 407 (12), 3899-3904
Schramm K-W, Fielder S, Pfister G
“Poly- and perfluorinated compounds in household consumer products”
Organohalogen Compounds (2010), 72, 372-374
Seacat AM, Thomford PJ, Hansen KJ, Clemen LA, Eldridge SR, Elcombe CR, Butenhoff JL
“Sub-chronic dietary toxicity of potassium perfluorooctanesulfonate in rats”
Toxicology (2003), 183 (1-3), 117-131
Shoeib M, Harner T, Ikonomou M, Kannan K
“Indoor and outdoor air concentrations and phase partitioning of perfluoroalkyl sulfonamides and
polybrominated diphenyl ethers”
Environmental Science & Technology (2004), 38 (), 1313-1320
Shoeib M, Harner T, Wilford BH, Jones KC, Zhu J
“Perfluorinated sulfonamides in indoor and outdoor air and indoor dust: occurrence, partitioning, and
human exposure”
Environmental Science & Technology (2005), 39 (17), 6599-6606
Shoeib M, Harner T, Webster GM, Lee SC
“Indoor sources of poly- and perfluorinated compounds (PFCs) in Vancouver, Canada: implications for
human exposure”
Environmental Science & Technology (2011), 45 (19), 7999-8005
164
Shipley JM, Hurst CH, Tanaka SS, DeRoos FL, Butenhoff JL, Seacat AM,
“trans-Activation of PPARα and induction of PPARα target genes by perfluorooctane-based chemicals”
Toxicological Sciences (2004), 80 (1), 151-160
Sinclair E, Mayack DT, Roblee K, Yamashita N, Kannan K
“Occurrence of perfluoroalkyl surfactants in water, fish, and birds from New York State”
Archives of Environmental Contamination Toxicology (2006), 50 (3), 398-410
Sinclair E, Kim SK, Akinleye HB, Kannan K
“Quantitation of gas-phase perfluoroalkyl surfactants and fluorotelomer alcohols released from nonstick
cookware and microwave popcorn bags”
Environmental Science & Technology (2007), 41 (4), 1180-1185
Skutlarek D, Exner M, Färber H
“Perfluorinated surfactants in surface and drinking water”
Environmental Science and Pollution Research (2006), 13 (5), 299-307
So MK, Yamashita N, Taniyasu S, Jiang Q, Giesy JP, Chen K, Lam PKS
“Health risks in infants associated with exposure to perfluorinated compounds in human breast milk
from Zhoushan, China”
Environmental Science & Technology (2006), 40 (9), 2924-2929
Sonne C
“Health effects from long-range transported contaminants in Arctic top predators: An integrated review
based on studies of polar bears and relevant model species”
Environment International (2010), 36 (5), 461-491
SOR/2009-15 of the Canadian Department of Justice
“Regulations adding perfluorooctane sulfonate and its salts to the virtual elimination list”
(2009)
http://laws.justice.gc.ca/PDF/SOR-2009-15.pdf (last accessed: 23 January 2012)
Stock NL, Lau FK, Ellis DA, Martin JW, Muir DCG, Mabury SA
“Polyfluorinated telomer alcohols and sulfonamides in the north American troposphere”
Environmental Science & Technology (2004), 38 (4), 991-996
Stock NL, Furdui VI, Muir DCG, Scott MA
“Perfluoroalkyl contaminants in the Canadian arctic: evidence of atmospheric transport and local
contamination”
Environmental Science & Technology (2007), 41 (10), 3529-3536
Szostek B and Prickett KB
“Determination of 8:2 fluorotelomer alcohol in animal plasma and tissues by gas chromatography–mass
spectrometry”
Journal of Chromatography B (2004), 813 (1-2), 313–321
165
Szostek B, Prickett KB, Buck RC
“Determination of fluorotelomer alcohols by liquid chromatography/tandem mass spectrometry in
water”
Rapid Communications in Mass Spectrometry (2006), 20 (19), 2837–2844
Takagi S, Adachi F, Miyano K, Koizumi Y, Tanaka H, Mimura M, Watanabe I, Tanabe S, Kannan K
“Perfluorooctanesulfonate and perfluorooctanoate in raw and treated tap water from Osaka, Japan”
Chemosphere (2008), 72 (10), 1409-1412
Tanaka S, Fujii S, Lien NPH, Nozoe M, Fukagawa H, Wirojanagud W, Anton A, Lindstrom G
“A simple pre-treatment procedure in PFOS and PFOA water analysis and its application in several
Countries”
Organohalogen Compounds (2006), 68, 527-530
Taniyasu S, Kannan K, Horii Y, Hanari N, Yamashita N
“A survey of perfluorooctane sulfonate and related perfluorinated organic compounds in water, fish,
birds, and humans from Japan”
Environmental Science & Technology (2003), 37 (12), 2634–2639
Taniyasu S, Kannan K, So MK, Gulkowska A, Sinclair E, Okazawa T, Yamashita N
“Analysis of fluorotelomer alcohols, fluorotelomer acids, and short- and long-chain perfluorinated acids
in water and biota”
Journal of Chromatography A (2005a), 1093 (1-2), 89-97
Taniyasu S, Kannan K, So MK, Gulkowska A, Sinclair E, Okazawa T, Yamashita N
“A new solid phase extraction method for short- and long-chain perfluorinated acids and fluorotelomers
in water and biota”
Organohalogen Compounds (2005b), 67, 760-763
Tao L, Ma J, Kunisue T, Libelo EL, Tanabe S, Kannan K
“Perfluorinated compounds in human breast milk from several Asian countries, and in infant formula and
dairy milk from the United States”
Environmental Science & Technology (2008a), 42 (22), 8597–8602
Tao L, Kannan K, Wong CM, Arcaro KF, Butenhoff JL
“Perfluorinated compounds in human milk from Massachusetts, U.S.A.”
Environmental Science & Technology (2008b), 42 (8), 3096-3101
Thibodeaux JR, Hanson RG, Rogers JM, Grey BE, Barbee BD, Richards JH, Butenhoff JL, Stevenson LA, Lau
C
“Exposure to perfluorooctane sulfonate during pregnancy in rat and mouse. I: Maternal and prenatal
evaluations”
Toxicological Sciences (2003), 74 (2), 369-381
166
Thompson J, Eaglesham G, Mueller J
“Concentrations of PFOS, PFOA and other perfluorinated alkyl acids in Australian drinking water”
Chemosphere (2011), 83 (10), 1320-1325
Thomsen C, Haug LS, Stigum H, Frøshaug M, Broadwell SL, Becher G
“Changes in concentrations of perfluorinated compounds, polybrominated diphenyl ethers, and
polychlorinated biphenyls in Norwegian breast-milk during twelve months of lactation”
Environmental Science & Technology (2010), 44 (24), 9550-9556
Tittlemier SA, Pepper K, Edwards L
“Concentrations of perfluorooctanesulfonamides in Canadian total diet study composite food samples
collected between 1992 and 2004”
Journal of Agricultural and Food Chemistry (2006), 54 (21), 8385-8389
Tittlemier SA, Pepper K, Seymour C, Moisey J, Bronson R, Cao XL, Dabeka RW
“Dietary exposure of Canadians to perfluorinated carboxylates and perfluorooctane sulfonate via
consumption of meat, fish, fast foods, and food items prepared in their packaging”
Journal of Agricultural and Food Chemistry (2007), 55 (8), 3203-3210
Tittlemier SA and Braekevelt E
“Analysis of polyfluorinated compounds in food”
Analytical & Bioanalytical Chemistry (2011), 399 (1), 221-227
Toms L-ML, Calafat AM, Kato K, Thompson J, Harden F, Hobson P, Sjödin A, Mueller JF
“Polyfluoroalkyl chemicals in pooled blood serum from infants, children and adults in Australia”
Environmental Science & Technology (2009), 43 (11), 4194-4199
Toms L-ML, Thompson J, Hobson P, Calafat AM, Kato K, Mueller JF
“Decline in PFOS and PFOA serum concentrations in Australian population from 2002 to 2009”
Organohalogen Compounds (2010), 72, 892-895
Tomy GT, Budakowski W, Halldorson T, Helm PA, Stern GA, Friesen K, Pepper K, Tittlemier SA, Fisk AT
“Fluorinated organic compounds in an eastern Arctic marine food web”
Environmental Science & Technology (2004), 38 (24), 6475-6481
UK Food Standard Agency
“Fluorinated chemicals: UK dietary intakes”
Food Survey Information Sheet 11/06 (2006), 1-15
http://www.food.gov.uk/multimedia/pdfs/fsis1106.pdf (last accessed: 23 January 2012)
US EPA
“Revised draft hazard assessment of perfluorooctanoic acid and its salts”
(2002), 1-107

167
US EPA
“Preliminary risk assessment of the developmental toxicity associated with exposure to
perfluorooctanoic acid and its salts”
(2003), 1-61
US EPA
“Draft risk assessment of the potential human health effects associated with exposure to
perfluorooctanoic acid and Its salts (PFOA)”
(2005), 1-117
US EPA
“EPA actions on PFAS compounds”
United States Environmental Protection Agency web site (2010)
http://www.epa.gov/oppt/pfoa/pubs/pfas.html (last accessed: 23 January 2012)
van Asselt ED, Rietra RPJJ, Römkens PFAM, van der Fels-Klerx HJ
“Perfluorooctane sulphonate (PFOS) throughout the food production chain”
Food Chemistry (2011), 128 (1), 1-6
van Leeuwen SPJ, van Velzen MJM, Swart CP, van der Veen I, Traag WA, de Boer J
“Halogenated contaminants in farmed salmon, trout, tilapia, pangasius, and shrimp”
Environmental Science & Technology (2009), 43 (11), 4009-4015
Vanden Heuvel JP, Kuslikis BI, Van Rafelghem MJ, Peterson RE
“Tissue distribution, metabolism, and elimination of perfluorooctanoic acid in male and female rats”
Journal of Biochemical Toxicology (1991), 6 (2), 83-92
Vassiliadou I, Costopoulou D, Mylona A, Leondiadis L
“Perfluorooctane sulphonic acid (PFOS) and perfluorooctanoic acid (PFOA) in human blood samples from
Greece”
Organohalogen Compounds (2009), 71, 90-93
Völkel W, Genzel-Boroviczény O, Demmelmair H, Gebauer C, Koletzko B, Twardella D, Raab U, Fromme H
“Perfluorooctane sulphonate (PFOS) and perfluorooctanoic acid (PFOA) in human breast milk: results of a
pilot study”
International Journal of Hygiene and Environmental Health (2008), 211 (3-4), 440-446
Wang IJ, Hsieh WS, Chen CY, Fletcher T, Lien GW, Chiang HL, Chiang CF, Wu TN, Chen PC
“The effect of prenatal perfluorinated chemicals exposures on pediatric atopy”
Environmental Research (2011), 111 (6), 785-791
Wang JM, Shi YL, Pan YY, Cai YQ
“Perfluorinated compounds in milk, milk powder and yoghurt purchased from markets in China”
Chinese Science Bulletin (2010), 55 (11), 1020-1025

168
Wilhelm M, Bergmann S, Dieter HH
“Occurrence of perfluorinated compounds (PFCs) in drinking water of North Rhine-Westphalia, Germany
and new approach to assess drinking water contamination by shorter-chained C4–C7 PFCs”
International Journal of Hygiene and Environmental Health (2010), 213 (3), 224-232
Wolz G, Schlummer M, Gruber L, Fielder D
“Levels of perfluorinated carboxylic acids (PFCA), perfluorinated sulfonic acids (PFSA), and fluorinated
telomers (FTOH) identified in paper-based food contact materials from the German market”
Organohalogen Compounds (2010), 73, 1310-1313
Xie W, Wu Q, Kania-Korwel I, Tharappel JC, Telu S, Coleman MC, Glauert HP, Kannan K, Mariappan SV,
Spitz DR, Weydert J, Lehmler HJ
“Subacute exposure to N-ethyl perfluorooctanesulfonamidoethanol results in the formation of
perfluorooctanesulfonate and alters superoxide dismutase activity in female rats”
Archives of Toxicology (2009), 83 (10), 909-924
Yamazaki K
“Current regulatory activities on PFCs in Japan”
International Workshop on Managing Perfluorinated Chemicals and Transitioning to Safer Alternatives,
12-13 February 2009, Geneva, Switzerland
Yoo H, Washington JW, Jenkins TM, Ellington JJ
“Quantitative determination of perfluorochemicals and fluorotelomer alcohols in plants from biosolid-
amended fields using LC/MS/MS and GC/MS”
Environmental Science & Technology (2011), 45 (19), 7985-7990
Zhang T, Sun HW, Wu Q, Zhang XZ Yun SH, Kannan K
“Perfluorochemicals in meat, eggs and indoor dust in China: assessment of sources and pathways of
human exposure to perfluorochemicals”
Environmental Science & Technology (2010), 44 (9), 3572-3579