RELAZIONE FINANZIARIASEMESTRAL E AL 30 GIUGNO - lgh.it year... · RELAZIONE FINANZIARIASEMESTRAL E...
92
1 RELAZIONE FINANZIARIASEMESTRAL E AL 30 GIUGNO 2015 RELAZIONE FINANZIARIA HALF-YEAR CONDENSED CONSOLIDATED FINANCIAL REPORT AS AT JUNE 30, 2017
-
Upload
phungduong -
Category
Documents
-
view
222 -
download
0
Transcript of RELAZIONE FINANZIARIASEMESTRAL E AL 30 GIUGNO - lgh.it year... · RELAZIONE FINANZIARIASEMESTRAL E...

1
RELAZIONE
FINANZIARIASEMESTRALE AL
30 GIUGNO 2015
RELAZIONE FINANZIARIA
HALF -YEAR CONDENSED CONSOLIDATED FINANCIAL
REPORT AS AT JUNE 30, 2017
1
I. INTRODUCTION .............................................................................................................. 2
Activity ................................................................................................................................................................... 4
Group highlights and key financial indicators ........................................................................................................ 6
Structure and details of the companies in the LGH Group ..................................................................................... 8
IAS/IFRS accounting policies................................................................................................................................. 9
II. DIRECTORS’ BUSINESS REPORT ............................................................................................................ 10
Significant events occurring during the 1st half of 2017 ....................................................................................... 11
Summary of Group’s financial performance, equity and cash flows .................................................................... 11
Regulatory framework .......................................................................................................................................... 20
Employment .......................................................................................................................................................... 39
Corporate risk management .................................................................................................................................. 40
Other disclosures .................................................................................................................................................. 47
Significant events occurring after June 30, 2017 .................................................................................................. 50
Audit of the half-year condensed consolidated financial statements .................................................................... 50
III. CONSOLIDATED FINANCIAL STATEMENTS ............................................................................................ 52
Financial Statements ............................................................................................................................................. 53
Explanatory notes ................................................................................................................................................. 58
Accounting policy ................................................................................................................................................. 58
Explanatory notes ................................................................................................................................................. 64

2
I. INTRODUCTION
3
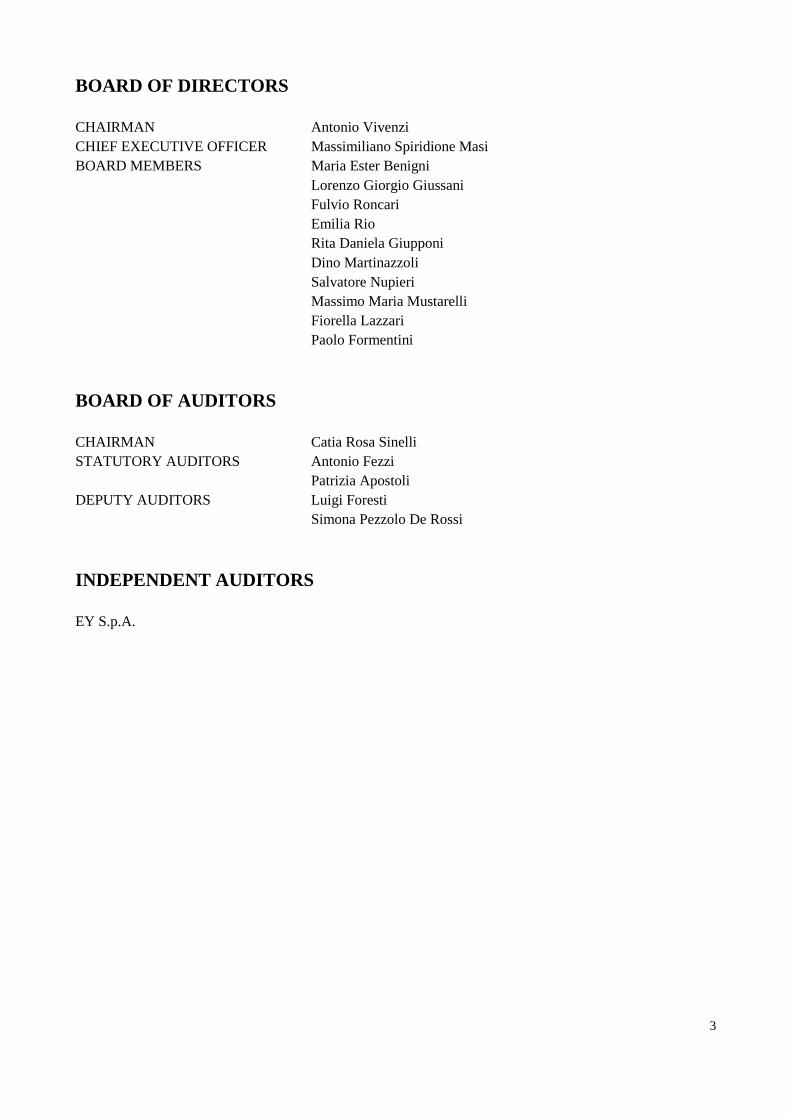
BOARD OF DIRECTORS CHAIRMAN Antonio Vivenzi CHIEF EXECUTIVE OFFICER Massimiliano Spiridione Masi BOARD MEMBERS Maria Ester Benigni Lorenzo Giorgio Giussani
Fulvio Roncari Emilia Rio Rita Daniela Giupponi Dino Martinazzoli Salvatore Nupieri Massimo Maria Mustarelli Fiorella Lazzari Paolo Formentini
BOARD OF AUDITORS CHAIRMAN Catia Rosa Sinelli STATUTORY AUDITORS Antonio Fezzi Patrizia Apostoli DEPUTY AUDITORS Luigi Foresti Simona Pezzolo De Rossi
INDEPENDENT AUDITORS EY S.p.A.
4
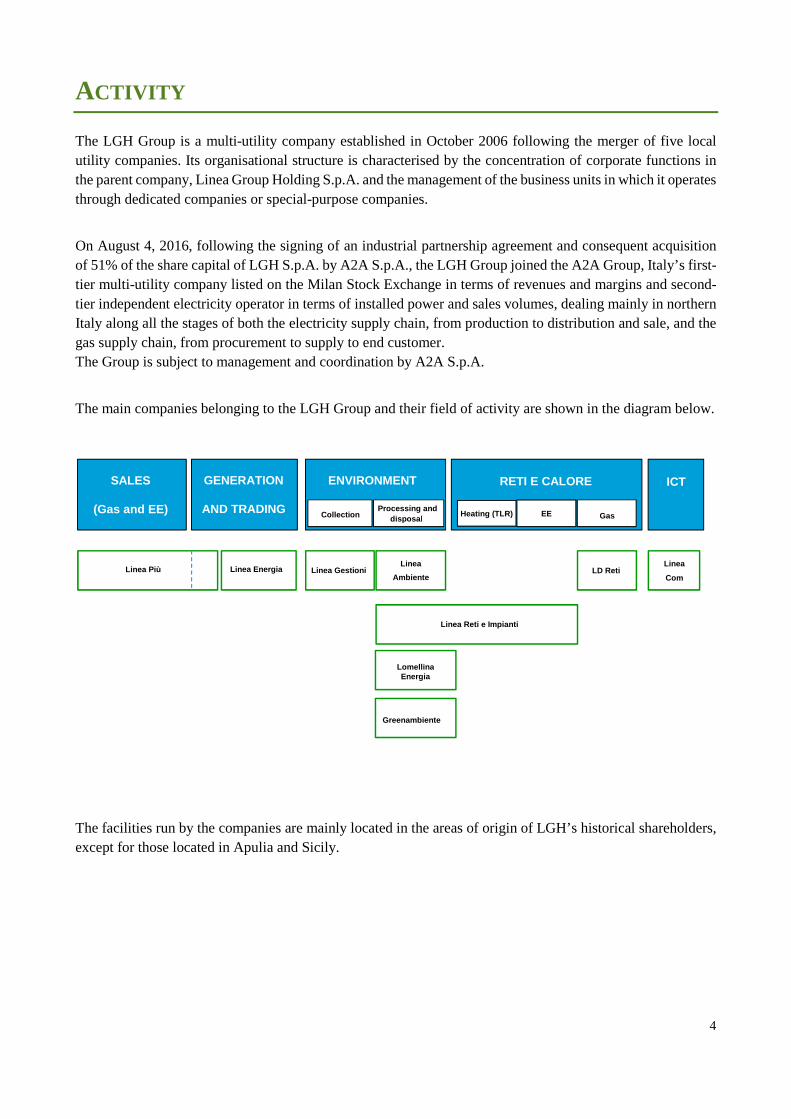
ACTIVITY The LGH Group is a multi-utility company established in October 2006 following the merger of five local utility companies. Its organisational structure is characterised by the concentration of corporate functions in the parent company, Linea Group Holding S.p.A. and the management of the business units in which it operates through dedicated companies or special-purpose companies.
On August 4, 2016, following the signing of an industrial partnership agreement and consequent acquisition of 51% of the share capital of LGH S.p.A. by A2A S.p.A., the LGH Group joined the A2A Group, Italy’s first-tier multi-utility company listed on the Milan Stock Exchange in terms of revenues and margins and second-tier independent electricity operator in terms of installed power and sales volumes, dealing mainly in northern Italy along all the stages of both the electricity supply chain, from production to distribution and sale, and the gas supply chain, from procurement to supply to end customer. The Group is subject to management and coordination by A2A S.p.A.
The main companies belonging to the LGH Group and their field of activity are shown in the diagram below.
The facilities run by the companies are mainly located in the areas of origin of LGH’s historical shareholders, except for those located in Apulia and Sicily.
Linea Reti e Impianti
Linea
Ambiente Linea Più LD Reti Linea Energia
Linea
Com
SALES
(Gas and EE)
GENERATION
AND TRADING
ENVIRONMENT RETI E CALORE
Heating (TLR) EE Gas
ICT
Collection Processing and disposal
Linea Gestioni
Lomellina Energia
Greenambiente
5
6
GROUP HIGHLIGHTS AND KEY FINANCIAL INDICATORS The tables below illustrate the main values and performance indicators of the LGH Group and quantitative data reflecting the business trend in the first six months of the year.
1. OPERATING FIGURES (€,000) 06/30/2017 % ON REVENUES 06/30/2016 % ON REVENUES
Net revenues 263,301 100.00% 246,630 100.00%
Gross operating margin - EBITDA 44,258 16.81% 37,731 15.30%
Operating result - EBIT 21,930 8.33% 15,538 6.30%
Income before taxes 11,002 4.18% 3,750 1.52%
Net result for the period 6,090 2.31% 541 0.22%
The LGH Group closed the 2017 first half year with a consolidated turnover of €263 million euro, up 16 million euro on the 2016 first half year (of which 6.8 million euro relating to the classification of the Sogir business unit, which is no longer held to sale), while the net result for the period shows an increase of 5.5 million euro. On September 9, 2015, LGH passed a resolution covering the launch of the procedure for the transfer of part of the urban hygiene business unit in the Lodi area to SOGIR, which had determined a reclassification of the values regarding assets and liabilities included in the sale and a disclosure of key economic figures in summary form. Given that more than 12 months have elapsed since the date on which the resolution was passed without any finalisation and since the conclusion of the transaction within the next 12 months seems to be unlikely, the business unit was included among ordinary assets and liabilities.
2. EQUITY DATA (€,000) 06/30/2017 12/31/2016 NIC (Net Invested Capital) 576,640 565,266 NFP (Net Financial Position) 358,370 354,932 GSE (Group Shareholders’ Equity) 200,308 178,401
MIE (Minority Interest’s Equity) 17,962 31,933
CSE (Consolidated Shareholders’ Equity) 218,270 210,334
GNR (Group Net Result) 6,993 - 11,260
MIR (Minority Interest’s Result) - 903 - 5,194
CNR (Consolidated Net Result) 6,090 - 16,454 Debt ratio = NFP/E 1,64 1,69
From a financial point of view, the Group’s net debt at June 30, 2017 increased by 3.4 million euro, from a financial position of 355 to 358 million euro. The debt ratio decreased from 1.69 to 1.64 due to the increase in shareholders’ equity.
7
3. KEY PERFORMANCE INDICATORS 06/30/2017 06/30/2016
ROE (Return On Equity) = RNG / PNG 3.49% 2.10%
ROE (Return On Equity) = RNC / PNC 2.79% 0.24%
ROI (Return On Investment) = OPERATING RESULT - EBIT / CIN 3.80% 2.58%
4. KEY QUANTITATIVE DATA
2017 2016 % CHANGE
Waste disposed of* tonnes 489,320 497,850 -7.13%
Gas distributed m3/1000 334,435 353,624 -5.43%
Gas sold m3/1000 200,458 201,282 -0.41%
Heat sold kWh/1000 140,513 134,675 4.33%
Electricity produced and fed to grid kWh/1000 215,460 210,776 2.17%
Electricity distributed kWh/1000 206,862 205,262 0.78%
Electricity sold kWh/1000 288,651 299,434 -3.60%
*including third-party plants
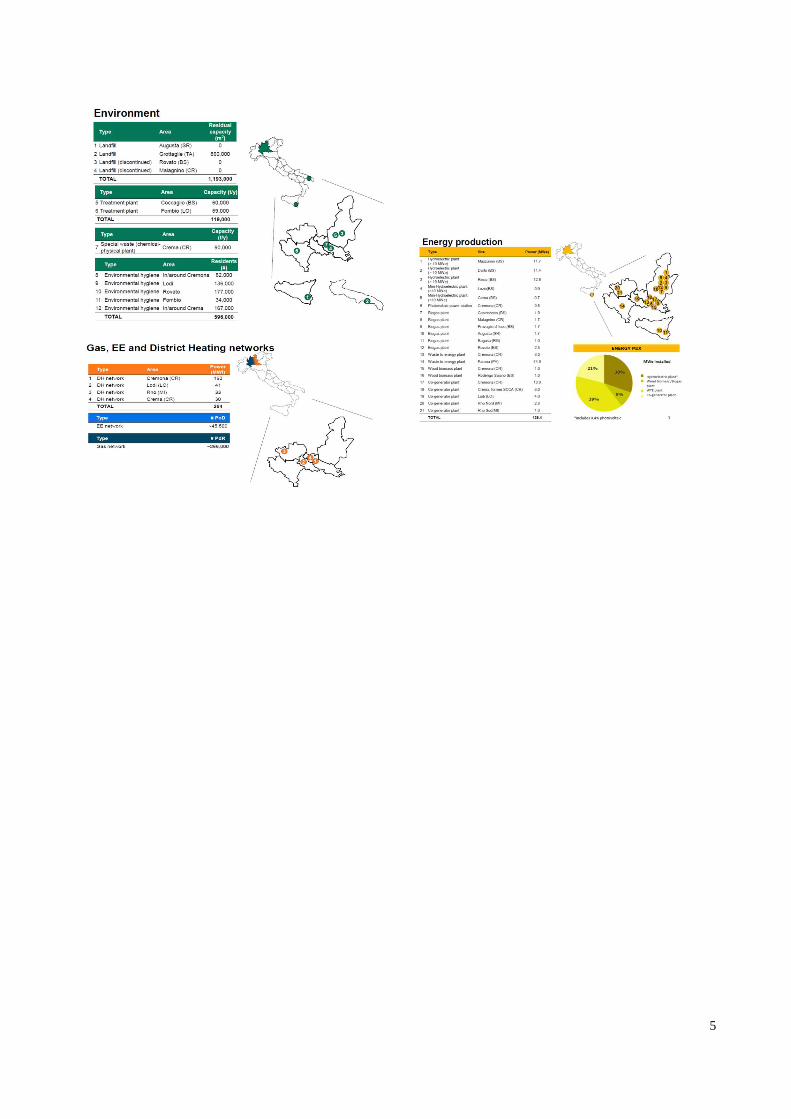
The main assets of the Group are: • waste-to-energy plants in Parona (PV) and Cremona, with an overall potential of approximately 440,000
tonnes/year; • 2 waste separation, sorting and treatment plants in Coccaglio (Brescia) and Fombio (Lodi); • landfills in Rovato (Brescia), Malagnino (Cremona), Augusta (Siracusa) at the post-management stage and
Grottaglie (Taranto); • 99 gas networks in the provinces of Cremona, Rovato, Lodi and Pavia; • hydroelectric power stations in Valle Camonica (Brescia), approximately 36 MW of installed power; • biogas electricity production plants (Brescia, Cremona and Siracusa), approximately 11 MW of installed
power; • three cogeneration power stations and district heating networks in the provinces of Cremona, Lodi and
Milan; • the Cremona electricity distribution network; • a fleet of approximately 1,170 vehicles, of which 586 for urban hygiene services and the transport of waste,
and 584 vehicles used for other technical and staff services; With all these facilities, in the first six months of 2017, the LGH Group: • handled 489,320 tonnes of mainly urban and non-hazardous special waste, and ranks among the leading
five operators in the sector at a national level, serving more than 150 local municipalities; • produced approximately 215 GWh of electricity, exclusively from renewable and assimilated sources such
as hydroelectric power, waste-to-energy processes, and the cogeneration of some biogas plants; • distributed 334 million cubic metres of gas and sold 200 million cubic metres; • produced and distributed 141 GWh of heat.
8
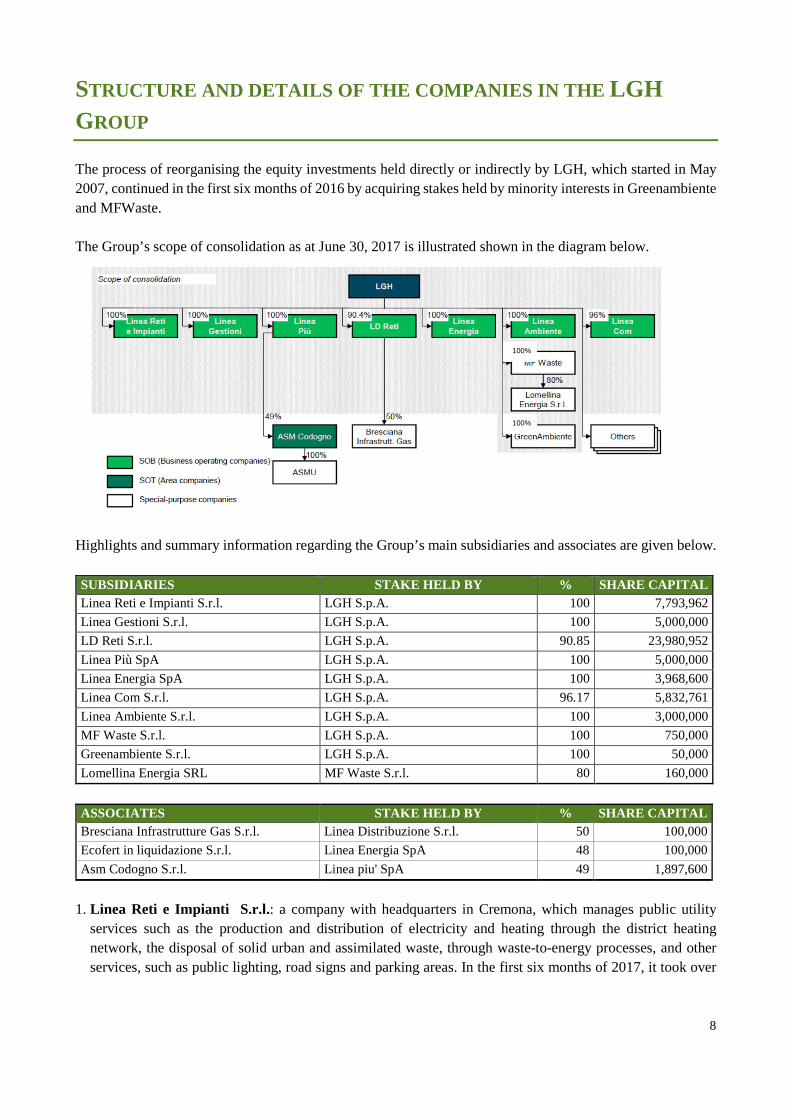
STRUCTURE AND DETAILS OF THE COMPANIES IN THE LGH
GROUP The process of reorganising the equity investments held directly or indirectly by LGH, which started in May 2007, continued in the first six months of 2016 by acquiring stakes held by minority interests in Greenambiente and MFWaste. The Group’s scope of consolidation as at June 30, 2017 is illustrated shown in the diagram below.
Highlights and summary information regarding the Group’s main subsidiaries and associates are given below. SUBSIDIARIES STAKE HELD BY % SHARE CAPITAL Linea Reti e Impianti S.r.l. LGH S.p.A. 100 7,793,962
Linea Gestioni S.r.l. LGH S.p.A. 100 5,000,000
LD Reti S.r.l. LGH S.p.A. 90.85 23,980,952
Linea Più SpA LGH S.p.A. 100 5,000,000
Linea Energia SpA LGH S.p.A. 100 3,968,600
Linea Com S.r.l. LGH S.p.A. 96.17 5,832,761
Linea Ambiente S.r.l. LGH S.p.A. 100 3,000,000
MF Waste S.r.l. LGH S.p.A. 100 750,000
Greenambiente S.r.l. LGH S.p.A. 100 50,000
Lomellina Energia SRL MF Waste S.r.l. 80 160,000
ASSOCIATES STAKE HELD BY % SHARE CAPITAL Bresciana Infrastrutture Gas S.r.l. Linea Distribuzione S.r.l. 50 100,000
Ecofert in liquidazione S.r.l. Linea Energia SpA 48 100,000
Asm Codogno S.r.l. Linea piu' SpA 49 1,897,600
1. Linea Reti e Impianti S.r.l.: a company with headquarters in Cremona, which manages public utility
services such as the production and distribution of electricity and heating through the district heating network, the disposal of solid urban and assimilated waste, through waste-to-energy processes, and other services, such as public lighting, road signs and parking areas. In the first six months of 2017, it took over
100%
100%
9
the biomass treatment business unit from Lodi Energia S.r.l. Soc. Agricola, a plant already connected to the Lodi district heating network, which belongs to the Group.
2. LD Reti S.r.l.: a company with headquarters in Lodi, which deals with natural gas distribution in the area covered by the Group for a total of 99 municipalities;
3. Linea Più S.p.A.: a company with headquarters in Pavia, which deals with the procurement, purchase and sale of raw materials and end customer management in the gas and electricity sectors;
4. Linea Energia S.p.A.: an engineering company with headquarters in Rovato, Brescia, which specialises in developing and performing activities relating to energy, from design to implementation and management of energy production plants; in 2016 it incorporated Franciacorta Rinnovabili S.r.l. and Rovato Energia Scarl;
5. Linea Com S.r.l.: a company with headquarters in Cremona, which supplies mobile and landline telephone and web services through broadband fibre optic and WiMAX networks in the cities of Cremona and Pavia and parts of the province. It also provides services and offers ICT technological support to LGH Group companies, information system service and management activities for the municipalities and deals with special projects for local authorities;
6. Linea Ambiente S.r.l.: a company with headquarters in Rovato, Brescia, which manages urban and special waste collection, transportation, treatment and disposal activities, including operations at landfills owned by the company. It carries out design activities to implement services and systems, and business management of the flows of waste generated and managed by all the companies belonging to the LGH Group;
7. Linea Gestioni S.r.l.: a company with headquarters in Crema (Cremona), which manages Environmental hygiene services for 120 municipalities in the city of Crema and other municipalities in the Franciacorta area and in the province of Lodi;
8. MF Waste S.r.l.: a company with headquarters in Rovato, Brescia, which holds 80% stake in Lomellina Energia S.r.l.;
9. Greenambiente S.r.l.: a company with headquarters in Priolo Gargallo, Siracusa, which owns and runs the waste disposal plant in Augusta, Siracusa;
10. Lomellina Energia S.r.l.: a company with headquarters in Parona, Pavia, which manages LGH Group's most important waste-to-energy plant;
11. Bresciana Infrastrutture Gas S.r.l.: a company with headquarters in Roncadelle, Brescia, which was set up in 2013 by Linea Distribuzione, which holds a 50% stake, for the management of the gas distribution network of the town of Palazzolo sull’Oglio;
12. Ecofert in liquidazione S.r.l.: an associate operating in the field of the recovery and the preparation for the recycling of urban and industrial solid waste and biomasses in San Gervasio Bresciano;
13. Asm Codogno S.r.l.: a multi-service company based in Codogno operating in the field of the environment and energy;
IAS/IFRS ACCOUNTING POLICIES
The parent company has adopted the International Financial Reporting Standards (IFRS) in drawing up its financial statements since December 31, 2009, in compliance with the procedure under art. 6 of EC Regulation no. 1606/2002 of the European Parliament and Council of July 19, 2002 on the application of the IFRS.
Since 2014, the financial statements of most of the subsidiaries and the parent company have been prepared in accordance with international accounting policies.
Further details are provided in the explanatory notes.

10
II. DIRECTORS’ BUSINESS REPORT
11
SIGNIFICANT EVENTS OCCURRING DURING THE 1ST HALF OF
2017 The following significant events occurred in the first six months of 2017:
- the takeover of the biomass treatment business unit from Lodi Energia S.r.l. Soc. Agricola, a plant already connected to the Lodi district heating network, which belongs to the Group.
- the acquisition of 49% equity stake in MF Waste S.r.l., now 100% owned;
- the acquisition of 20% equity stake in Greenambiente S.r.l., now 100% owned;
- completion of Lomellina Energia’s financing project.
SUMMARY OF GROUP’S FINANCIAL PERFORMANCE , EQUITY AND
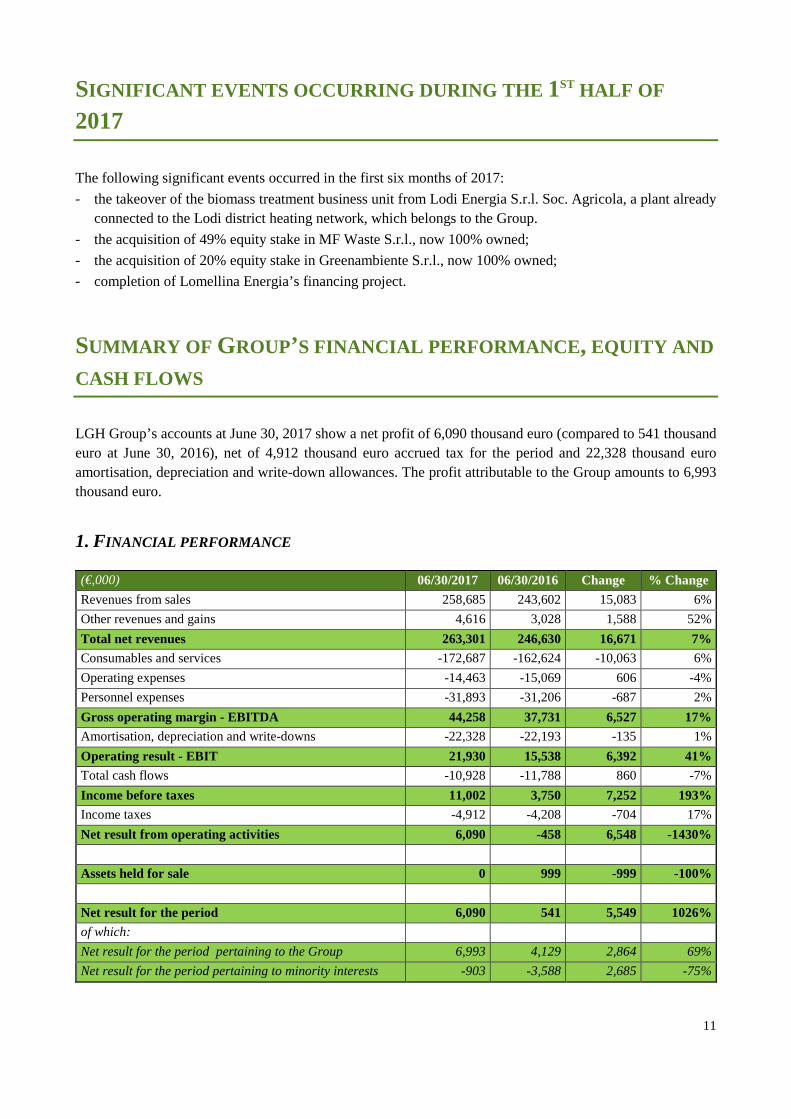
CASH FLOWS LGH Group’s accounts at June 30, 2017 show a net profit of 6,090 thousand euro (compared to 541 thousand euro at June 30, 2016), net of 4,912 thousand euro accrued tax for the period and 22,328 thousand euro amortisation, depreciation and write-down allowances. The profit attributable to the Group amounts to 6,993 thousand euro.
1. FINANCIAL PERFORMANCE
(€,000) 06/30/2017 06/30/2016 Change % Change
Revenues from sales 258,685 243,602 15,083 6%
Other revenues and gains 4,616 3,028 1,588 52%
Total net revenues 263,301 246,630 16,671 7%
Consumables and services -172,687 -162,624 -10,063 6%
Operating expenses -14,463 -15,069 606 -4%
Personnel expenses -31,893 -31,206 -687 2%
Gross operating margin - EBITDA 44,258 37,731 6,527 17%
Amortisation, depreciation and write-downs -22,328 -22,193 -135 1%
Operating result - EBIT 21,930 15,538 6,392 41%
Total cash flows -10,928 -11,788 860 -7%
Income before taxes 11,002 3,750 7,252 193%
Income taxes -4,912 -4,208 -704 17%
Net result from operating activities 6,090 -458 6,548 -1430%
Assets held for sale 0 999 -999 -100%
Net result for the period 6,090 541 5,549 1026%
of which:
Net result for the period pertaining to the Group 6,993 4,129 2,864 69%
Net result for the period pertaining to minority interests -903 -3,588 2,685 -75%
12
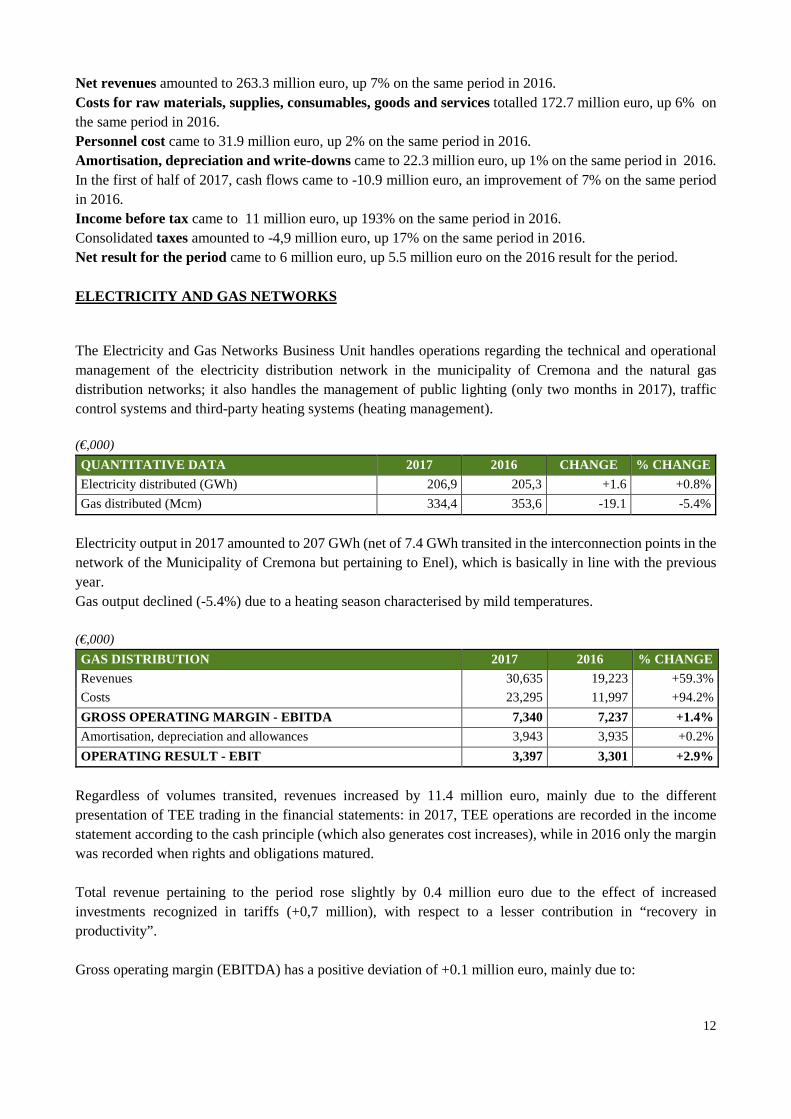
Net revenues amounted to 263.3 million euro, up 7% on the same period in 2016. Costs for raw materials, supplies, consumables, goods and services totalled 172.7 million euro, up 6% on the same period in 2016. Personnel cost came to 31.9 million euro, up 2% on the same period in 2016. Amortisation, depreciation and write-downs came to 22.3 million euro, up 1% on the same period in 2016. In the first of half of 2017, cash flows came to -10.9 million euro, an improvement of 7% on the same period in 2016. Income before tax came to 11 million euro, up 193% on the same period in 2016. Consolidated taxes amounted to -4,9 million euro, up 17% on the same period in 2016. Net result for the period came to 6 million euro, up 5.5 million euro on the 2016 result for the period. ELECTRICITY AND GAS NETWORKS
The Electricity and Gas Networks Business Unit handles operations regarding the technical and operational management of the electricity distribution network in the municipality of Cremona and the natural gas distribution networks; it also handles the management of public lighting (only two months in 2017), traffic control systems and third-party heating systems (heating management). (€,000)
QUANTITATIVE DATA 2017 2016 CHANGE % CHANGE
Electricity distributed (GWh) 206,9 205,3 +1.6 +0.8%
Gas distributed (Mcm) 334,4 353,6 -19.1 -5.4%
Electricity output in 2017 amounted to 207 GWh (net of 7.4 GWh transited in the interconnection points in the network of the Municipality of Cremona but pertaining to Enel), which is basically in line with the previous year. Gas output declined (-5.4%) due to a heating season characterised by mild temperatures. (€,000)
GAS DISTRIBUTION 2017 2016 % CHANGE
Revenues 30,635 19,223 +59.3%
Costs 23,295 11,997 +94.2%
GROSS OPERATING MARGIN - EBITDA 7,340 7,237 +1.4%
Amortisation, depreciation and allowances 3,943 3,935 +0.2%
OPERATING RESULT - EBIT 3,397 3,301 +2.9%
Regardless of volumes transited, revenues increased by 11.4 million euro, mainly due to the different presentation of TEE trading in the financial statements: in 2017, TEE operations are recorded in the income statement according to the cash principle (which also generates cost increases), while in 2016 only the margin was recorded when rights and obligations matured. Total revenue pertaining to the period rose slightly by 0.4 million euro due to the effect of increased investments recognized in tariffs (+0,7 million), with respect to a lesser contribution in “recovery in productivity”. Gross operating margin (EBITDA) has a positive deviation of +0.1 million euro, mainly due to:
13
• A decrease (-1.1 million euro) in margin resulting from the trading of energy efficiency titles (TEE) generated by the rise in market prices, as a result of late trading of purchase contracts and the resulting partial coverage by the Energy Service Provider (GSE).
• Increased total revenues due to the update of tariffs of the regulatory authority for electricity, gas and water (AEEGSI) and increased incentives (0.4 million euro) for AEEGSI Safety Recovery and reduced overhead expenses (0.6 million euro);
• Less contingent liabilities for lease payable to municipalities for previous years (+0.2 million euro). (€,000)
Despite a slight decrease in revenues, gross operating margin (EBITDA) increased by 0.8 million euro, thanks to 0.6 million less overhead expenses (ordinary maintenance, personnel and general expenses), in addition to the increase in revenues resulting “distribution constraints” for 0.2 million euro (recognition in tariffs of previous years’ investments). DISTRICT HEATING NETWORK
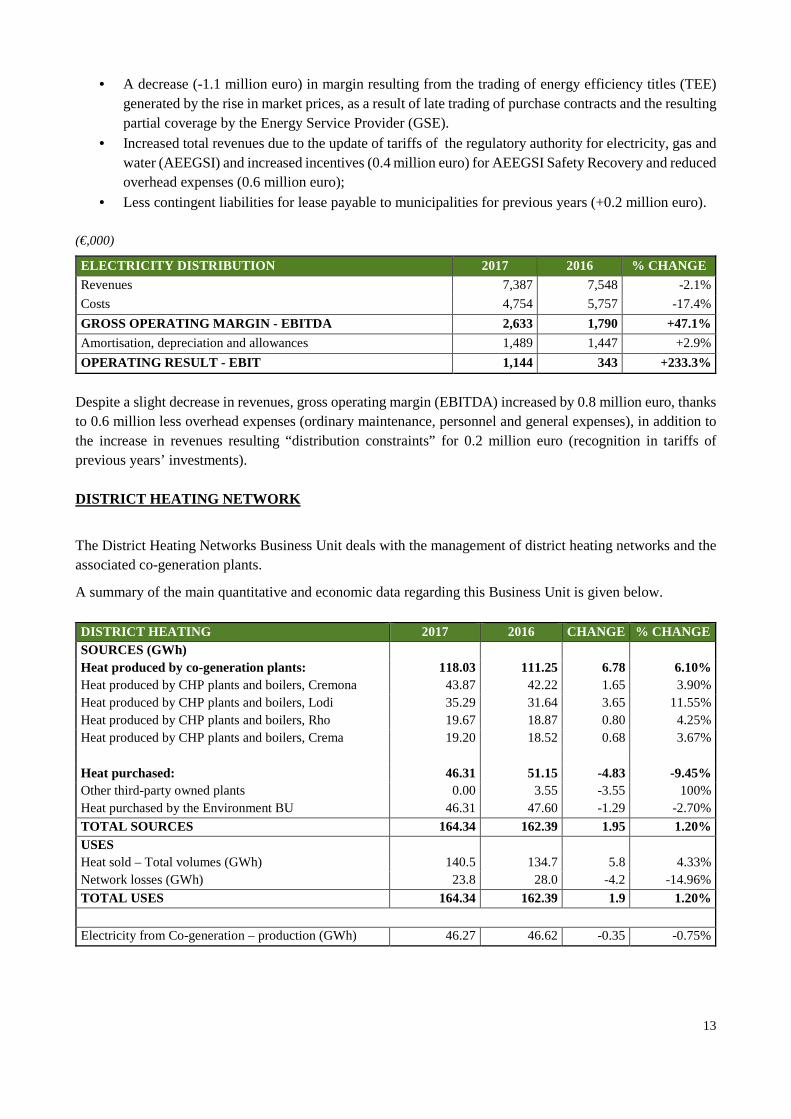
The District Heating Networks Business Unit deals with the management of district heating networks and the associated co-generation plants.
A summary of the main quantitative and economic data regarding this Business Unit is given below. DISTRICT HEATING 2017 2016 CHANGE % CHANGE SOURCES (GWh) Heat produced by co-generation plants: 118.03 111.25 6.78 6.10% Heat produced by CHP plants and boilers, Cremona 43.87 42.22 1.65 3.90% Heat produced by CHP plants and boilers, Lodi 35.29 31.64 3.65 11.55% Heat produced by CHP plants and boilers, Rho 19.67 18.87 0.80 4.25% Heat produced by CHP plants and boilers, Crema 19.20 18.52 0.68 3.67% Heat purchased: 46.31 51.15 -4.83 -9.45% Other third-party owned plants 0.00 3.55 -3.55 100% Heat purchased by the Environment BU 46.31 47.60 -1.29 -2.70%
TOTAL SOURCES 164.34 162.39 1.95 1.20% USES Heat sold – Total volumes (GWh) 140.5 134.7 5.8 4.33% Network losses (GWh) 23.8 28.0 -4.2 -14.96%
TOTAL USES 164.34 162.39 1.9 1.20%
Electricity from Co-generation – production (GWh) 46.27 46.62 -0.35 -0.75%
ELECTRICITY DISTRIBUTION 2017 2016 % CHANGE
Revenues 7,387 7,548 -2.1%
Costs 4,754 5,757 -17.4%
GROSS OPERATING MARGIN - EBITDA 2,633 1,790 +47.1%
Amortisation, depreciation and allowances 1,489 1,447 +2.9%
OPERATING RESULT - EBIT 1,144 343 +233.3%
14
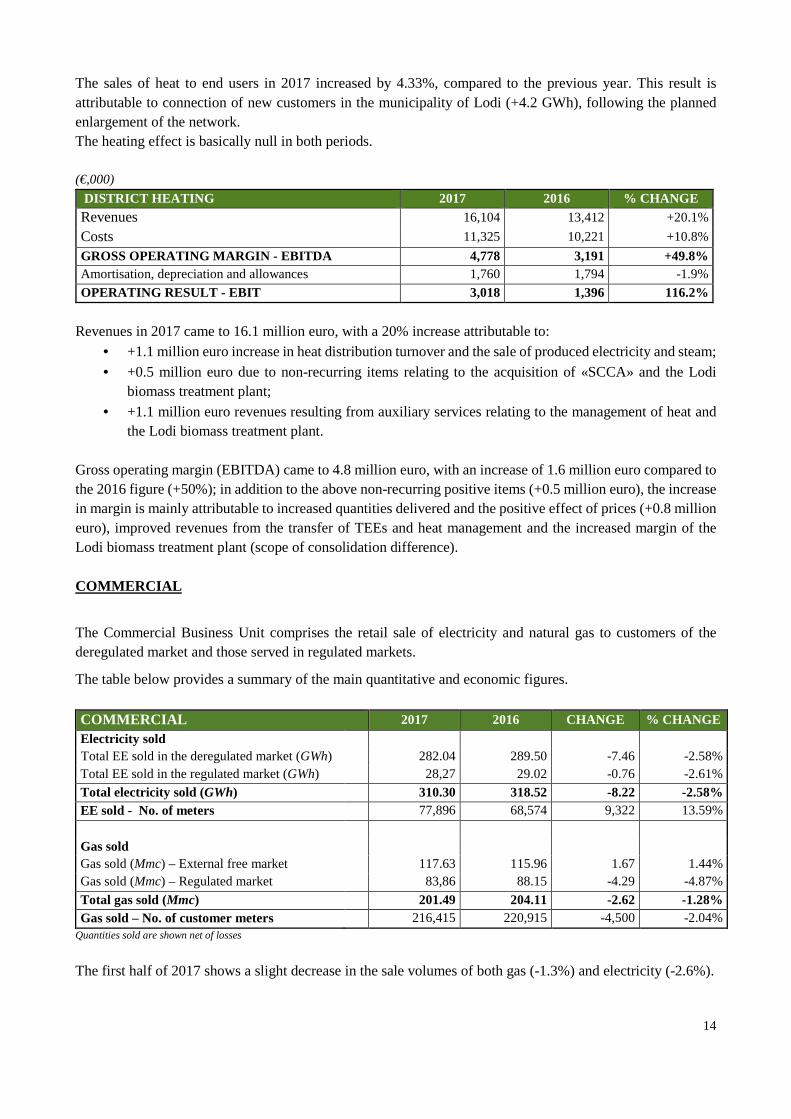
The sales of heat to end users in 2017 increased by 4.33%, compared to the previous year. This result is attributable to connection of new customers in the municipality of Lodi (+4.2 GWh), following the planned enlargement of the network. The heating effect is basically null in both periods. (€,000)
DISTRICT HEATING 2017 2016 % CHANGE Revenues 16,104 13,412 +20.1%
Costs 11,325 10,221 +10.8%
GROSS OPERATING MARGIN - EBITDA 4,778 3,191 +49.8% Amortisation, depreciation and allowances 1,760 1,794 -1.9%
OPERATING RESULT - EBIT 3,018 1,396 116.2%
Revenues in 2017 came to 16.1 million euro, with a 20% increase attributable to:
• +1.1 million euro increase in heat distribution turnover and the sale of produced electricity and steam; • +0.5 million euro due to non-recurring items relating to the acquisition of «SCCA» and the Lodi
biomass treatment plant; • +1.1 million euro revenues resulting from auxiliary services relating to the management of heat and
the Lodi biomass treatment plant. Gross operating margin (EBITDA) came to 4.8 million euro, with an increase of 1.6 million euro compared to the 2016 figure (+50%); in addition to the above non-recurring positive items (+0.5 million euro), the increase in margin is mainly attributable to increased quantities delivered and the positive effect of prices (+0.8 million euro), improved revenues from the transfer of TEEs and heat management and the increased margin of the Lodi biomass treatment plant (scope of consolidation difference). COMMERCIAL
The Commercial Business Unit comprises the retail sale of electricity and natural gas to customers of the deregulated market and those served in regulated markets.
The table below provides a summary of the main quantitative and economic figures. COMMERCIAL 2017 2016 CHANGE % CHANGE
Electricity sold Total EE sold in the deregulated market (GWh) 282.04 289.50 -7.46 -2.58% Total EE sold in the regulated market (GWh) 28,27 29.02 -0.76 -2.61%
Total electricity sold (GWh) 310.30 318.52 -8.22 -2.58% EE sold - No. of meters 77,896 68,574 9,322 13.59%
Gas sold Gas sold (Mmc) – External free market 117.63 115.96 1.67 1.44% Gas sold (Mmc) – Regulated market 83,86 88.15 -4.29 -4.87%
Total gas sold (Mmc) 201.49 204.11 -2.62 -1.28% Gas sold – No. of customer meters 216,415 220,915 -4,500 -2.04%
Quantities sold are shown net of losses The first half of 2017 shows a slight decrease in the sale volumes of both gas (-1.3%) and electricity (-2.6%).
15
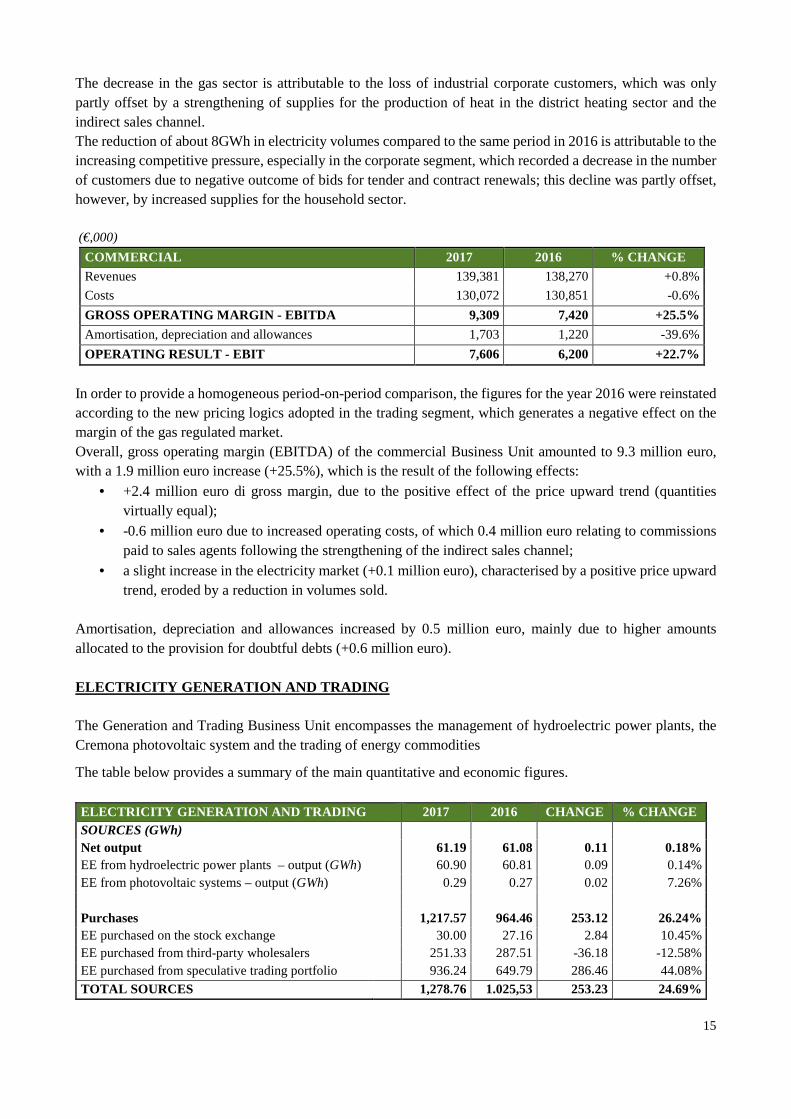
The decrease in the gas sector is attributable to the loss of industrial corporate customers, which was only partly offset by a strengthening of supplies for the production of heat in the district heating sector and the indirect sales channel. The reduction of about 8GWh in electricity volumes compared to the same period in 2016 is attributable to the increasing competitive pressure, especially in the corporate segment, which recorded a decrease in the number of customers due to negative outcome of bids for tender and contract renewals; this decline was partly offset, however, by increased supplies for the household sector. (€,000)
COMMERCIAL 2017 2016 % CHANGE
Revenues 139,381 138,270 +0.8%
Costs 130,072 130,851 -0.6%
GROSS OPERATING MARGIN - EBITDA 9,309 7,420 +25.5%
Amortisation, depreciation and allowances 1,703 1,220 -39.6%
OPERATING RESULT - EBIT 7,606 6,200 +22.7%
In order to provide a homogeneous period-on-period comparison, the figures for the year 2016 were reinstated according to the new pricing logics adopted in the trading segment, which generates a negative effect on the margin of the gas regulated market. Overall, gross operating margin (EBITDA) of the commercial Business Unit amounted to 9.3 million euro, with a 1.9 million euro increase (+25.5%), which is the result of the following effects:
• +2.4 million euro di gross margin, due to the positive effect of the price upward trend (quantities virtually equal);
• -0.6 million euro due to increased operating costs, of which 0.4 million euro relating to commissions paid to sales agents following the strengthening of the indirect sales channel;
• a slight increase in the electricity market (+0.1 million euro), characterised by a positive price upward trend, eroded by a reduction in volumes sold.
Amortisation, depreciation and allowances increased by 0.5 million euro, mainly due to higher amounts allocated to the provision for doubtful debts (+0.6 million euro). ELECTRICITY GENERATION AND TRADING The Generation and Trading Business Unit encompasses the management of hydroelectric power plants, the Cremona photovoltaic system and the trading of energy commodities
The table below provides a summary of the main quantitative and economic figures. ELECTRICITY GENERATION AND TRADING 2017 2016 CHANGE % CHANGE SOURCES (GWh) Net output 61.19 61.08 0.11 0.18% EE from hydroelectric power plants – output (GWh) 60.90 60.81 0.09 0.14% EE from photovoltaic systems – output (GWh) 0.29 0.27 0.02 7.26% Purchases 1,217.57 964.46 253.12 26.24% EE purchased on the stock exchange 30.00 27.16 2.84 10.45% EE purchased from third-party wholesalers 251.33 287.51 -36.18 -12.58% EE purchased from speculative trading portfolio 936.24 649.79 286.46 44.08%
TOTAL SOURCES 1,278.76 1.025,53 253.23 24.69%

16
ELECTRICITY GENERATION AND TRADING 2017 2016 CHANGE % CHANGE USES (GWh) EE intercompany sales (incl. network losses) 281.33 298.55 -17.22 -5.77% EE sold to other wholesalers (third-party) 61.19 58.44 2.75 4.70% EE sold on the stock exchange 0.00 18.76 -18.76 -100.00% EE sold to speculative trading portfolio 936.24 649.79 286.46 44.08%
TOTAL USES 1,278.76 1,025.53 253.23 24.69% The figures shown are inclusive of losses
During the reporting period, the production of electricity amounted to 61 GWh, to which purchases must be added for 1,217 GWh, giving an overall increase in availability of 26%. Production is in line with the previous year: the decrease in the amount of electricity generated by hydropower stations as a result of unfavourable weather conditions (less rainfalls) is offset by the additional contribution of the Mazzunno plant, which was acquired at the start of 2017. GAS TRADING 2017 2016 CHANGE % CHANGE SOURCES (Mcm) Gas purchased – Procurement 219.38 226.82 -7.45 -3.28% Gas purchased – Withdrawals from stocks 0.15 3.42 -3.27 -95.54% Gas purchased – Self-cons./GNC (gas not cont.) -0.33 -0.25 -0.07 28.28% Gas purchased – Speculative Trading Portfolio 24.81 18.62 6.19 33.27%
TOTAL SOURCES 244.01 248.60 -4.59 -1.85% USES(Mcm) Gas sold – Commercial BU 206.01 205.99 0.03 0.01% Gas sold on the stock exchange 0.00 0.00% Gas sold – Wholesalers 13.19 24.00 -10.81 -45.03% Gas sold - Speculative Trading Portfolio 24.81 18.62 6.19 33.27%
TOTAL USES 244.01 248.60 -4.59 -1.85% The quantities shown relate to standard cubic metres reported in the LHV of 38,100 MJ on re-delivery.
At the end of the first six months of 2017, the gas volumes purchased accounted for 244 Mcm, on decline (approx. -5 Mcm), compared to the 2016 figure, due to both less outsourced gas (-3%) and the considerable reduction in the use of stored gas; conversely, gas trading portfolio purchases increased (+6 Mcm), generated by an increase in exchange activities on national and international platforms. Gas sold to the Commercial Business Unit remained virtually unchanged, while sales on wholesale markets shows a significant increase in the quantities delivered (-11 Mcm). (€,000)
GENERATION AND TRADING 2017 2016 % CHANGE Revenues 83,468 89,861 -7.1%
Costs 79,013 81,692 -3.3%
GROSS OPERATING MARGIN - EBITDA 4,455 8,170 -45.6% Amortisation, depreciation and allowances -1,328 2,050 +164.8%
OPERATING RESULT - EBIT 5,784 6,120 -5.5%
17
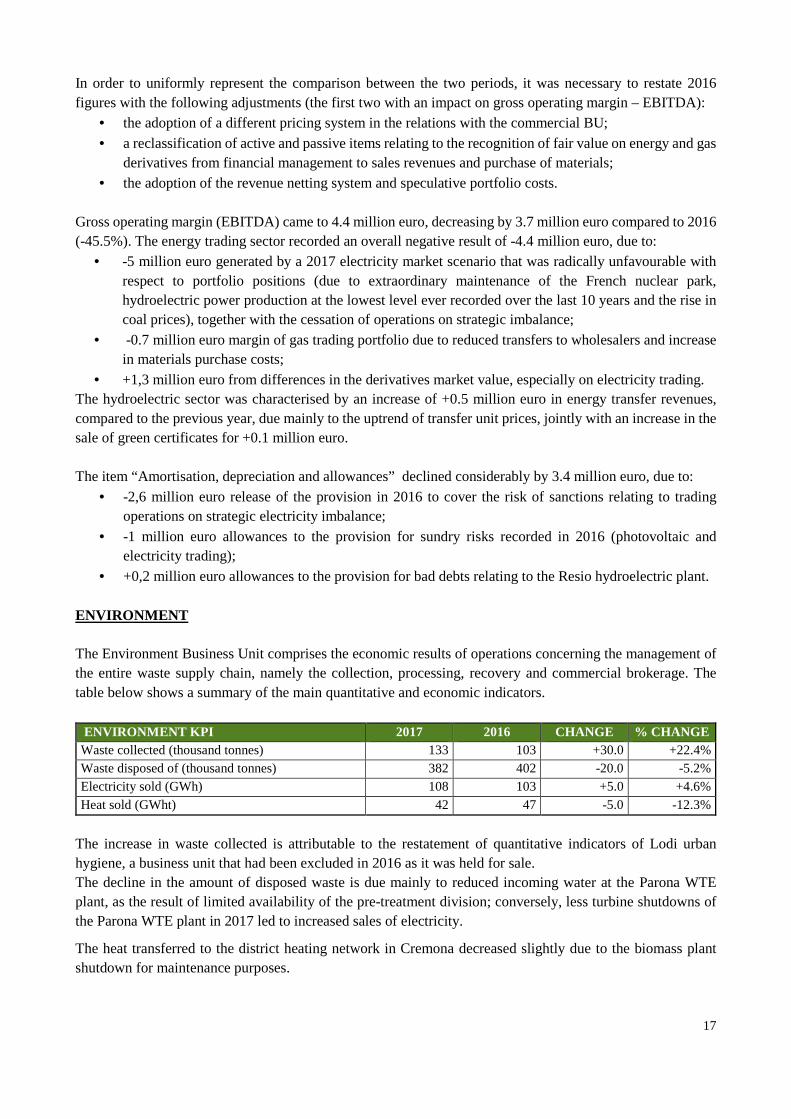
In order to uniformly represent the comparison between the two periods, it was necessary to restate 2016 figures with the following adjustments (the first two with an impact on gross operating margin – EBITDA):
• the adoption of a different pricing system in the relations with the commercial BU; • a reclassification of active and passive items relating to the recognition of fair value on energy and gas
derivatives from financial management to sales revenues and purchase of materials; • the adoption of the revenue netting system and speculative portfolio costs.
Gross operating margin (EBITDA) came to 4.4 million euro, decreasing by 3.7 million euro compared to 2016 (-45.5%). The energy trading sector recorded an overall negative result of -4.4 million euro, due to:
• -5 million euro generated by a 2017 electricity market scenario that was radically unfavourable with respect to portfolio positions (due to extraordinary maintenance of the French nuclear park, hydroelectric power production at the lowest level ever recorded over the last 10 years and the rise in coal prices), together with the cessation of operations on strategic imbalance;
• -0.7 million euro margin of gas trading portfolio due to reduced transfers to wholesalers and increase in materials purchase costs;
• +1,3 million euro from differences in the derivatives market value, especially on electricity trading. The hydroelectric sector was characterised by an increase of +0.5 million euro in energy transfer revenues, compared to the previous year, due mainly to the uptrend of transfer unit prices, jointly with an increase in the sale of green certificates for +0.1 million euro. The item “Amortisation, depreciation and allowances” declined considerably by 3.4 million euro, due to:
• -2,6 million euro release of the provision in 2016 to cover the risk of sanctions relating to trading operations on strategic electricity imbalance;
• -1 million euro allowances to the provision for sundry risks recorded in 2016 (photovoltaic and electricity trading);
• +0,2 million euro allowances to the provision for bad debts relating to the Resio hydroelectric plant. ENVIRONMENT The Environment Business Unit comprises the economic results of operations concerning the management of the entire waste supply chain, namely the collection, processing, recovery and commercial brokerage. The table below shows a summary of the main quantitative and economic indicators. ENVIRONMENT KPI 2017 2016 CHANGE % CHANGE Waste collected (thousand tonnes) 133 103 +30.0 +22.4% Waste disposed of (thousand tonnes) 382 402 -20.0 -5.2% Electricity sold (GWh) 108 103 +5.0 +4.6% Heat sold (GWht) 42 47 -5.0 -12.3%
The increase in waste collected is attributable to the restatement of quantitative indicators of Lodi urban hygiene, a business unit that had been excluded in 2016 as it was held for sale. The decline in the amount of disposed waste is due mainly to reduced incoming water at the Parona WTE plant, as the result of limited availability of the pre-treatment division; conversely, less turbine shutdowns of the Parona WTE plant in 2017 led to increased sales of electricity.
The heat transferred to the district heating network in Cremona decreased slightly due to the biomass plant shutdown for maintenance purposes.
18
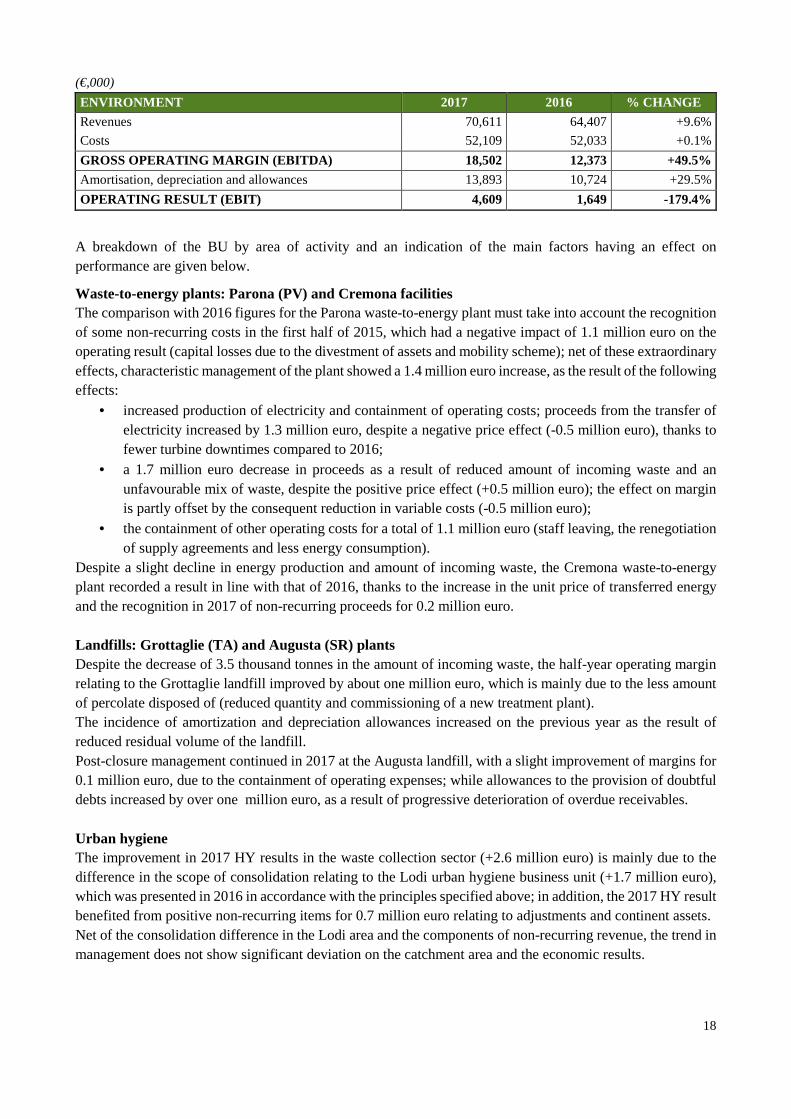
(€,000)
ENVIRONMENT 2017 2016 % CHANGE
Revenues 70,611 64,407 +9.6%
Costs 52,109 52,033 +0.1%
GROSS OPERATING MARGIN (EBITDA) 18,502 12,373 +49.5%
Amortisation, depreciation and allowances 13,893 10,724 +29.5%
OPERATING RESULT (EBIT) 4,609 1,649 -179.4%
A breakdown of the BU by area of activity and an indication of the main factors having an effect on performance are given below.
Waste-to-energy plants: Parona (PV) and Cremona facilities The comparison with 2016 figures for the Parona waste-to-energy plant must take into account the recognition of some non-recurring costs in the first half of 2015, which had a negative impact of 1.1 million euro on the operating result (capital losses due to the divestment of assets and mobility scheme); net of these extraordinary effects, characteristic management of the plant showed a 1.4 million euro increase, as the result of the following effects:
• increased production of electricity and containment of operating costs; proceeds from the transfer of electricity increased by 1.3 million euro, despite a negative price effect (-0.5 million euro), thanks to fewer turbine downtimes compared to 2016;
• a 1.7 million euro decrease in proceeds as a result of reduced amount of incoming waste and an unfavourable mix of waste, despite the positive price effect (+0.5 million euro); the effect on margin is partly offset by the consequent reduction in variable costs (-0.5 million euro);
• the containment of other operating costs for a total of 1.1 million euro (staff leaving, the renegotiation of supply agreements and less energy consumption).
Despite a slight decline in energy production and amount of incoming waste, the Cremona waste-to-energy plant recorded a result in line with that of 2016, thanks to the increase in the unit price of transferred energy and the recognition in 2017 of non-recurring proceeds for 0.2 million euro. Landfills: Grottaglie (TA) and Augusta (SR) plants Despite the decrease of 3.5 thousand tonnes in the amount of incoming waste, the half-year operating margin relating to the Grottaglie landfill improved by about one million euro, which is mainly due to the less amount of percolate disposed of (reduced quantity and commissioning of a new treatment plant). The incidence of amortization and depreciation allowances increased on the previous year as the result of reduced residual volume of the landfill. Post-closure management continued in 2017 at the Augusta landfill, with a slight improvement of margins for 0.1 million euro, due to the containment of operating expenses; while allowances to the provision of doubtful debts increased by over one million euro, as a result of progressive deterioration of overdue receivables. Urban hygiene The improvement in 2017 HY results in the waste collection sector (+2.6 million euro) is mainly due to the difference in the scope of consolidation relating to the Lodi urban hygiene business unit (+1.7 million euro), which was presented in 2016 in accordance with the principles specified above; in addition, the 2017 HY result benefited from positive non-recurring items for 0.7 million euro relating to adjustments and continent assets. Net of the consolidation difference in the Lodi area and the components of non-recurring revenue, the trend in management does not show significant deviation on the catchment area and the economic results.
19
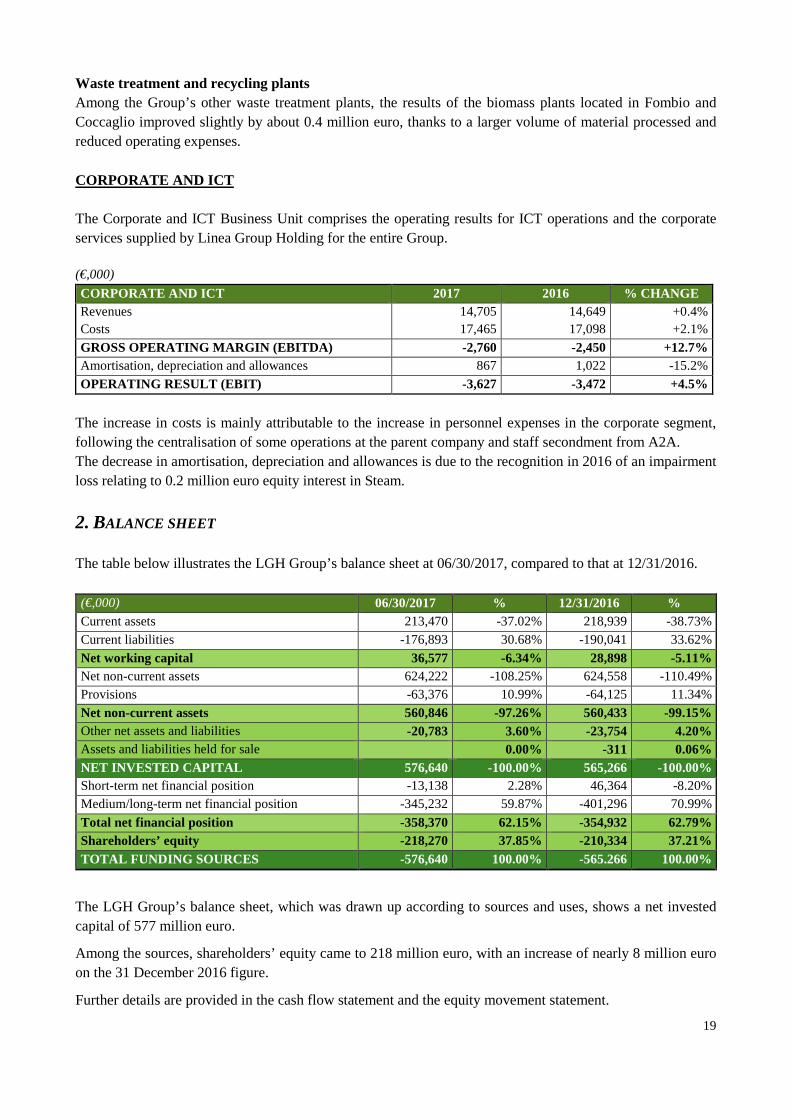
Waste treatment and recycling plants Among the Group’s other waste treatment plants, the results of the biomass plants located in Fombio and Coccaglio improved slightly by about 0.4 million euro, thanks to a larger volume of material processed and reduced operating expenses.
CORPORATE AND ICT The Corporate and ICT Business Unit comprises the operating results for ICT operations and the corporate services supplied by Linea Group Holding for the entire Group. (€,000)
CORPORATE AND ICT 2017 2016 % CHANGE Revenues 14,705 14,649 +0.4% Costs 17,465 17,098 +2.1%
GROSS OPERATING MARGIN (EBITDA) -2,760 -2,450 +12.7% Amortisation, depreciation and allowances 867 1,022 -15.2%
OPERATING RESULT (EBIT) -3,627 -3,472 +4.5%
The increase in costs is mainly attributable to the increase in personnel expenses in the corporate segment, following the centralisation of some operations at the parent company and staff secondment from A2A. The decrease in amortisation, depreciation and allowances is due to the recognition in 2016 of an impairment loss relating to 0.2 million euro equity interest in Steam.
2. BALANCE SHEET The table below illustrates the LGH Group’s balance sheet at 06/30/2017, compared to that at 12/31/2016. (€,000) 06/30/2017 % 12/31/2016 % Current assets 213,470 -37.02% 218,939 -38.73% Current liabilities -176,893 30.68% -190,041 33.62%
Net working capital 36,577 -6.34% 28,898 -5.11% Net non-current assets 624,222 -108.25% 624,558 -110.49% Provisions -63,376 10.99% -64,125 11.34%
Net non-current assets 560,846 -97.26% 560,433 -99.15% Other net assets and liabilities -20,783 3.60% -23,754 4.20% Assets and liabilities held for sale 0.00% -311 0.06% NET INVESTED CAPITAL 576,640 -100.00% 565,266 -100.00% Short-term net financial position -13,138 2.28% 46,364 -8.20% Medium/long-term net financial position -345,232 59.87% -401,296 70.99%
Total net financial position -358,370 62.15% -354,932 62.79% Shareholders’ equity -218,270 37.85% -210,334 37.21% TOTAL FUNDING SOURCES -576,640 100.00% -565.266 100.00%
The LGH Group’s balance sheet, which was drawn up according to sources and uses, shows a net invested capital of 577 million euro.
Among the sources, shareholders’ equity came to 218 million euro, with an increase of nearly 8 million euro on the 31 December 2016 figure.
Further details are provided in the cash flow statement and the equity movement statement.
20
REGULATORY FRAMEWORK ELECTRICITY GENERATION AND TRADING BUSINESS UNIT Remuneration of electricity generating capacity The production capacity-based remuneration mechanism applicable in Italy is so-called “capacity payment” scheme, introduced in 2003 by Legislative Decree no. 379, as transitional administered system, whose purpose is to ensure the appropriateness of the electricity system in the days identified by Terna and defined as critical, when the difference between supply and demand could be at the lowest levels. Effective in 2004 onwards, the Regulatory Authority has envisaged the preliminary calculation of amounts collected from electricity bills and delivered via two payments (called CAP1 and S) to facilities authorized to dispatching services. Legislative Decree no. 379 set out that, at full generating capacity, the remuneration of capacity would rest upon a market mechanism (capacity market), later defined by Authority Resolution ARG/elt 98/11. The final scheme envisages trading in the form of auctions, where awarded operators acquire the right to receive a premium (in €/MW/year) and the obligation to offer the awarded capacity on energy (MGP) and Service (MSD) markets, by returning the difference between the market and the strike price (in €/MWh) to Terna, if positive. Technically speaking, this is a “one-way contract for differences”. Initially, the capacity market envisaged three-yearly auctions with a four-year timeline planning. By Resolution 95/2015/I/eel, the Authority proposed the Ministry for Economic Development (MiSE) to reduce to one year the period elapsing between auctioning and delivery, by introducing new yearly contracts (so-called first-adoption stage). In April 2015, the European Commission launched a survey to ascertain whether the capacity-based remuneration mechanisms are compatible with the State aid rules and ensure adequate security in electricity procurement without distorting competition in the European single market. In August 2015, the Italian government informally informed the Directorate General for Competition of the capacity-based remuneration mechanism under Resolution ARG/elt 98/11. Over these two years, numerous contacts have been established between the Directorate General from Competition and Directorate General for Energy with the Ministry for Economic Development, the Regulatory Authority and Terna. In November 2016, the Commission terminated the survey and acknowledged that the remuneration of the availability in energy-only markets is required to give the system signs of long-term price for investments in new electricity generating capacity. Between October 2016 and February 2017: � Terna published 3 consultation documents (DCO) on a detailed discipline, whose main elements are:
� first adoption: access by production units of a capacity of less than 10MVA (provided they do not receive incentives from the Energy Service Provider (GSE) or they reject said incentives) to renewable generation and to application activated on Ancillary Services Market (MSD);
� steady-rate operation: in addition to the rules specified for first adoption, direct access to foreign resources, duration of the annual (not three yearly) contract, limited appreciation of the resource flexibility characteristics for access to the remuneration mechanism (at present only one selection priority of resource flexibility is provided when several bids are quoted against the marginal price auction);
� change to Terna demand curve, which is simplified and made compliant with European standards. The new curve is particularly influenced by government choices in terms of both maximum acceptable expenditure and safety level (function of the Loss of Load Expectation (LOLE) parameter, which
21
represents the maximum post-load acceptable at country level. This parameter is established by the Ministry for Economic Development);
� The Authority publishes 1 DCO on the obligations for plants under contract, where the offer of the capacity on the Day-Ahead Market (MGP) is more strongly incentivized at values less or equal to the strike price and the maximum premium ceiling (cap) is 75,000 €/MW/year.
Operators have called for solutions intended to increase both the premium cap and the strike price (acting implicitly as a price cap) and have highlighted the lack of appreciation of the flexibility characteristics of plants. In the meantime, the European Commission has approved the availability remuneration mechanisms adopted in the United Kingdom (capacity obligation), France (exchange certificates) and Germany (Network Reserve). Next steps: the Ministry for Economic Development, the Authority and Terna are working out to notify the Italian mechanism to the Commission while finalising some key aspects, including the strike price and the LOLE. Terna should call the auction for the first adoption stage at the end of 2017 for delivery in 2018. Quantification of imbalances for electricity - Period July 2012 – August 2014 (excluding June 2014)
Resolution no. 111/06 defines the rules and calculation methods for the quantification of imbalances to be applied to differences between the feed-in and consumption plans and actual production and withdrawals.
The imbalance policy has been the subject of several amendments by the Authority in order to align the regulation to the need for an efficient market configuration so as to encourage operators to always make the best production and consumption forecasts and avoid price brokerage on different markets. The containment of imbalances is desirable because it favours the reduction in the costs charged in end customer bills because Terna – with more accurate forecasts by dispatching users – uses less resources to balance the system in real time. For this reason, the imbalance policy has been subject to various changes by the Authority in order to align regulation with the need for efficient market configuration so as to drive operators to make better production and consumption forecasts, thus avoiding price arbitrage on different markets. Following the appeal filed by some operators, Resolutions no. 342/2012, no. 239/2013 and no. 285/2013 amending the above policy were annulled by the administrative judge for the period July 2012-August 2014 (excluding June 2014) on the ground of lack of motivation on the urgency and lack of consultation. Terna recalculated the imbalance prices according to the regulation in force before the annulled resolutions, and the necessary adjustment bills were directly offset at 30 June 2015, despite claims raised by A2A Group companies. In response to the requests made by some dispatching service users, the Authority initiated a process (contested by some operators) for the valorisation of the actual imbalances between 2012 and 2014, by means of resolution no. 333/2015/R/eel. After about a year of consultations, Resolution no. 333/2016/R/eel concluded the valorisation process of imbalances for the period 2012-2014, thereby arranging for Terna to return the amount offset in June 2015 to the companies by 1 November 2016. Some operators have appealed against Resolution 333/16//R/eel by invoking the precedent clause, which has been denied. The meeting of the Lombardy Regional Administrative Court, originally scheduled on 13 April 2017, was adjourned to 2018. - Definition of the new regulation effective on and after 1 August 2016
With Resolution 444/2016/R/eel, subsequently amended by resolution no. 800/2016/R/eel, the regulatory
22
framework on actual imbalances has been amended with effect on and after August 1, 2016.
The measures introduced some mechanisms aimed at providing more effective incentives to be planned with diligence, skill, prudence and foresight, and enabling, at the same time, the Authority to systematically detect any breach of this obligation (for all purposes, including the adoption of prescriptive and/or sanctioning measures). More specifically, the resolutions introduced amendments to the method of calculation of imbalances, by differentiating it in the case of production units (relevant, not relevant supplied by non-programmable renewable sources or not enabled, other than that supplied by renewable sources) or consumption units, with the application of the single price or the mix single-dual price scheme and providing different exemption thresholds. Pending the regulation of system imbalances, which will probably be implemented in 2019 and is likely to provide nodal imbalance prices, by Resolution 419/2017/R/eel, the Authority has introduced:
• effective on and after 1 July 2017 macro-zonal non-arbitrage fees, in order to eliminate distortions deriving from the determination of imbalance prices at a macro-zone level, at the presence of market prices determined at a zonal level;
• effective on and after 1 September 2017, the restoration of single price calculation of imbalances for all not enabled production units as well as a new less predictable method of calculation of the zonal sign implemented by Terna.
First opening of the Ancillary Services Market (MSD)1 to demand/accumulation systems/not yet enabled production units By resolutions 300/2017/R/eel and 372/2017/R/eel, the Authority ordered a first MSD opening through specific voluntary, demand-driven pilot projects, (non-programmable, relevant and non-relevant) FER2 programmable units not yet enabled and accumulation systems. In general, the scheme sets out:
• that PUs and CUs can participate either individually or through various types of aggregation: only production (UVAP3), only consumption (UVAC4) or mixed (UVA/UVAN5). Relevant PUs can aggregate each other and/or with other non-relevant UPs and any UCs only if they all come under the same node of the national transmission grid (UVAN). Both UVAC and UVAP may expect the presence of CU/PU in different despatching contracts with the need for explicit consent by the dispatching user (DU);
• a specific timetable for the presentation of projects by Terna to the Authority: within 30/06/17 for the UVAC pilot project and within 31/07/17 for the UVAP pilot project;
• among the main pilot project characteristics: - the possibility for operators to propose additional pilot projects to Terna for the supply of
individual services but also services which are not remunerated to date; - bidding obligations and methods in line with those currently provided for already enabled PUs; - CUs must be connected at HV, MV or LV, but processed on a hourly basis; - reduced role of distributors in this first stage; - no forms of economic incentives are envisaged in favour of pilot projects.
The first project implemented concerns the UVACs (single or multiple consumption facilities located in the same province or group of provinces) and consists of 2 activities:
1 MSD – Mercato del Servizio di Dispacciamento, Ancillary Services Market 2 FER – Fonti Energetiche Rinnovabili – Renewable Energy Sources 3 UVAP – Unità Virtuali Abilitate di Produzione – Virtual Production Enabled Units 4 UVAC – Unità Virtuali Abilitate al Consumo – Virtual Consumption Enabled Units 5 UVAN – Unità Virtuali Abilitate Nodali – Virtual Nodal Enabled Units
23
1. the participation of UVACs to the MSD for the supply of the Tertiary Replacement Reserve (RTs) and balancing from June 2017. The expected remuneration is limited to the activation of resources on MSD (€/MWh);
2. the possible participation to forward procurement of RTs by Terna and MSD balancing by enabled UVACs in North and Mid-North areas for the June-September 2017 period. This is a downward auction with fixed remuneration (base: 30,000 €/MW/year) and variable remuneration (€/MWh activated) with a strike price of 400 €/MWh. At July 1, 2017, 46 MW were assigned out of 500 MW auctioned.
In order to seize the opportunities offered by the new regulatory framework, an internal task force was set up within the A2A Group to implement UVAC and UVAP projects.
Incentives to production from renewable sources and conversion of the Green Certificate in tariffs Italian Legislative Decree no. 28/2001, implementing Directive 2009/28/EC, establishes the incentive schemes aimed at achieving the production targets from renewable sources by 2020, which were later put into force by Ministerial Decree of July 6, 2012 and June 23, 2016, for application by electric power plants supplied by renewable sources other than photovoltaic systems. The above decrees establish that production plants below a set power threshold are eligible for incentive tariffs (of the feed-in-premium type), which are accessible either directly or after entry into a dedicated registry, while an auction procedure is envisaged for plants of a higher capacity. According to the decrees, renewable energy plants that entered into operation prior to December 31, 2012 and have acquired the right to use Green Certificates (GC) are entitled to receive incentives paid by the Energy Services Operator (GSE) on net production for the remaining after-2015 period of entitlement to GC, in addition to revenues from the sales of production on the market. This incentive (I) is calculated as follows:
• I= k x (180 – Re) x 0.78; • k = technological coefficient of 1 for plants that entered into operation prior to December 31, 2007
and, for subsequent ones, the values set out by Law no. 244/2007 apply: • Re = is the sale price of electricity on the market, which was recorded in the previous year and
communicated by the Authority. The value of the incentive in 2017 amounts to 107.34 €/MWh. The same method applies to plants that benefit from green certificates for district heating (CV-TLR), the value of which is established at 84.34 €/MWh. Effective for period beginning on and after January 1, 2016, incentives are paid quarterly by the GSE by the end of the second quarter following that of reference and on the basis of the signing of an Agreement and upon registration and validation of the plants on the GSE portal. On March 25, 2016, GSE published a disclosure on the deadlines of GCs for 2014 and 2015, the collection of which can be requested to the GSE by March 31, 2017 and March 31, 2018, respectively. This clarification, which was strongly advocated by operators, is a confirmation of the bankability of the certificates and the possibility of using the storage of GCs until their expiration date. Large-scale hydroelectric concessions Despite the introduction of rules aiming to allow the conduction of tenders, the evolution of national legislative framework over the last few years, actually entails a continuation of existing large-scale concessions by the current holders, even when they are formally expired. Article 37, subsection 4, of Law no. 134/2012, converting Legislative Decree no. 83/2012, the “Growth Decree”, confirmed the term of 5 years before the expiry of the concession as the time limit for calling a tender for reassignment and, for new concessions, established a term of 20 years extendible to 30 years, depending on the extent of investments, according to criteria established by an implementing Ministerial Decree not yet
24
enacted. In addition, a special transitional (accelerating) scheme is established for calling tenders for concessions already expired or expiring by December 31, 2017 (for which it was impossible to comply with the tender-calling requirement of 5 years). These tenders shall be called within 2 years of the date on which said Ministerial Decree is enacted. The non-issuance to date of the “Ministerial Decree for Tenders” inevitably results in an extension of the management of concessions by the current concessionaires, including those falling due after 2017. As part of the formal default notice received from the European Commission affirming the opposition of Italian legislation to the rules and regulations of EU law, the Italian Government decided to propose to the Commission a future amendment to said rules, as part of an overall reorganization of the sector. At a regional legislation level, the Lombardy Regional Authority amended Regional Law no. 26/2003, first by Act no. 19/2010 and later by Act no. 35/2014, by adding article 53-bis that allowed outgoing concession-holders to temporarily continue to operate and imposed an additional fee. Lastly, with art. 62 of Law no. 221/2015 (“Collegato Ambientale”), the legislator equalized upward the unit value of the BIM supra-fee due from holders of small-scale concessions, of a nominal capacity exceeding 220 kW, making it identical to the fee due by the holders of large-scale concessions of a capacity exceeding 3 MW. Article 1, subsection 671, of the 2916 Stability Law, requires the reimbursement of additional hydroelectric fees paid to the State in the years 2006-2007 for the renewal of concessions. This provision was actually declared unconstitutional by the Constitutional Court. By Regional Council Resolution 5130-2016 of May 9, 2016, the Lombardy Regional Authority provisionally quantified the “additional fee” for hydroelectric concessions of expired large-scale concessions, which was introduced by Regional Law no. 19/2010 but have never been implemented up to now, to 20 €/kW of average nominal capacity, subject to subsequent increase (and related adjustment) if the studies being conducted by the regional authority reveal that the so-called “revenue” of expired concessions was higher. This Resolution was adopted despite the pending appeal filed by the National Government to the Constitutional Court against Lombardy Regional Law no. 22/2015. The arguments put forward by the Government are identical to those of the operators and A2A, which challenged previous regional resolutions on “temporary continuation of operations” of its concessions on the basis of the principle of homogeneity of the concession fees on the national territory as it falls under competition rules (art. 37, subsection 7, Law no. 134/2012), and as the “Bersani Decree” (Legislative Decree no. 79/99, art. 12, subsection 8bis) is clear in stating that the operation of expired concessions have continued by the outgoing concession-holder at the same terms and conditions until new assignment, without this requiring any regional measure. Instead, the regional authority justifies the additional fee on the assumption that it has already title to the hydroelectric plants and facilities by applying the former art. 25, subsection 1, of the Consolidated Act 1775/33, superseded by art. 37 of Law no. 134/2012. The additional fee would therefore represent the consideration for the enjoyment of said assets by the “former concession-holders”, on which, however, they continue to pay IMU (property tax) and other charges. It is noted that the Constitutional Court ruled in favour of the fees imposed by the Piedmont Regional Authority (Judgement no. 158, May 3, 2016) by Regional Law no. 22/2014 that is considered legitimate in the absence of Ministerial Decree provided by art. 37, subsection 7, of Law no. 134/2012, which shall set forth the general criteria for determining the maximum values of the fees of hydroelectric concessions on the part of the regional authorities, according to the principles of cost-effectiveness and reasonableness. By Council Resolution no.13993 of December 28, 2016, the Lombardy Regional Authority established, for the period January 1, 2011 to December 31, 2016, the amounts due as additional fees relating to large-scale concessions that have expired and have been authorised to temporary continue their operations, by quantifying the amounts on the basis of the unit amount of the additional fee of 20 €/kW of the average annual nominal power, previously determined in recognition of Council Resolution no. 5130 of May 9, 2016.

25
Efficient User Systems Efficient User Systems (SEU and SEESEU) are Simple Production and Consumption Systems consisting of at least one production plant and one consumption unit directly connected through a private link without obligation of connection to third parties, and connected directly or indirectly to the public network via at least one point. The awarding of the qualification as SEU or SEESEU, issued by the GSE, allows the recognition of facilitated tariff conditions on the electricity consumed and not withdrawn from the network, limited to the variable components of the system overheads, as envisaged by Legislative Decree no. 115/08. Decree Laws no. 91/14 and no. 116/14 and Authority Resolution no. 578/2013/R/eel define the regulatory framework of the SEUs that can fall within a scheme in which there is one Consumption Unit and Production Unit which, if recognized as such, allows for the payment of 5% overheads. To be eligible for this benefit as of January 1, 2014, the SEUs that commenced operations before December 31, 2014 had to be qualified by GSE, according to any of the possible types envisaged, by September 30, 2015. It is also possible to qualify the system after that date; however, the benefits will be calculated from the month following the qualification. For systems that became operational after January 1, 2015, it will be necessary to apply for the qualification after the entry into operation. In a clarification issued on June 12, 2015, the Authority specified that the generation auxiliary services are identified as ancillary services, according to Unipede (now Eurelectric) definition and therefore also plants that are ancillary to production, such as fuel handling equipment and heating, lighting and office systems directly related to power plant operations. The value of the SEUs and the clarification provided by the authority on auxiliary services is twofold because it allows:
- the plant self-consumptions to benefit from the exemption to pay 95% of system charges on self-produced and consumed energy;
- the plant to formulate investment proposals for the installation of systems generating electricity from renewable sources at industrial users.
It is also worth noting that the normative and regulatory framework is currently evolving: • by Municipal Decree DCO no. 255/2016/R/eel, the Authority proposed, pursuant to art. 3 of Legislative
Decree no. 210/2015 (so-called “Milleproroghe 2015”), effective for period beginning on and after January 1, 2016, a reform of the general charges of the electricity system applied to non-domestic customers, according to three different distribution options, namely fixed component (€/year), capacity component (€/kW) and variable component (€/kWh).
• Legislative Decree no. 244/2016 (so-called “Milleproroghe 2017”) set forth the postponement to January 1, 2018, of the reform concerning overheads and also established that “the variable components of system overheads are applied to electricity withdrawn from the public grid with mandatory third-party connection”.
By Resolution 481/17/R/eel, the Authority also set out the future mode of collection of charges differentiated into a fixed portion, a power portion and a variable portion. REMIT – European regulation on wholesale energy market integrity and transparency and start of procedures for potential market abuse European Parliament and Council Regulation no. 1227/2011/EU of October 25, 2011 (REMIT) on the integrity and transparency of the wholesale energy market, has established common rules to prevent abuse practices in wholesale electricity and natural gas markets. This regulation imposes an obligation on market operators to: a. publish inside privileged information; b. report to ACER (Agency for the Cooperation among National Energy Regulators), either directly or
indirectly, the data concerning operations carried out on wholesale energy products, both sale and purchase orders and executed transactions (reporting obligation).
As to reporting, by implementing the REMIT, the Commission adopted Regulation no. 1348/2014
26
(Implementing Acts), which established fulfilment procedures and timing. The data to be reported relates to standard contracts executed on organized markets and non-standard contracts executed bilaterally, contracts relating to the transport of electricity and gas and the key data relating to storage systems. The market operators involved are required to send the data to ACER through the organized markets where the transaction was carried out (ex. GME) or through the electricity and gas trading brokerage platforms. Effective from October 2015, the companies subject to reporting to ACER standard contracts executed on organised markets and non-standard contracts are required to be entered in the National Registry of market operators kept by the Authority (REMIT Registry). An administrative pecuniary fine of 10,000 to 200,000 euro is imposed on each non-registered operator acting in wholesale energy markets subject to this obligation. Article 22 of Law no. 61/2014 also attributes to the Authority full investigation and sanction powers for the application of the REMIT. By Resolutions no. 342/16/E/eel and 459/2016/E/eel, the Authority commenced two proceedings for the adoption of measures to promote competition and ensure proper operation of the markets, by adopting prescriptive measures or asymmetrical regulation measures against certain conduct on the part of dispatching service users in the electricity wholesale market, which may have detrimental effects on energy markets and can be potentially configured as market abuse under the REMIT. The conduct of users can be configured as: • potential market abuse, in accordance with article 5 of the REMIT – for the effects or signals sent (or
likely to be sent) – on the offer, the demand or the price of wholesale energy products; • possible breach of article 14, subsection 6, of Resolution no. 111/06, limited to programming strategies not
complying with the principles of diligence, prudence, expertise and foresight that should characterise the conduct of an operator in the dispatching service field.
By Resolution no. 813/2016/R/eel, the Authority intervened by providing for the first filing of individual proceedings implemented under Resolution 342/2016/R/eel. MIFID II (Directive 2014/65/EU) Directive 2014/65/UE – also known as MIFID II – reviews and replaces MIFID I (Directive 2004/39/EC), with the aim of developing a single market for financial services in Europe, where transparency and investor protection are guaranteed. The MIFID II extends its scope to previously unregulated financial instruments (commodities) and also applies to entities currently operating on different financial markets, including so-called over-the-counter transactions. Member States shall transpose the directive in their national law by July 3, 2017, and the MIFID II will be fully effective on and after January 1, 2018. As far as the energy market is concerned, the Directive and its regulations apply to financial instruments both on regulated markets and in OTC transactions, as well as to emission allowances (EUAs) wholesale energy products that are derivative contracts, with the exception of those envisaging physical delivery obligation. The definition of "Physical delivery obligation" is central to identifying which instruments are outside the scope of the financial instruments and therefore not subject to MIFID II obligations. In order to obtain the exemption to operate as investment firm, the companies operating on commodity derivatives shall pass the “ancillary test” to demonstrate that the trading activity is “ancillary” to the main one. The MIFID II will have an impact both at a strategic level in order not to exceed certain thresholds to be eligible for exemption and at an operational level, by requiring interventions on computer processes, procedures and infrastructures for the reporting and annual notification of the exemption.
27
COMMERCIAL BUSINESS UNIT Competition Delegated Decree, SIMILAR Protection6 and PLACET7 offer: elimination of the price protection system At the hearing held on October 7, 2015, the Parliament approved the annual draft bill for the market and competition (so-called “Competition Delegated Decree), which is still being discussed at the Senate as part of the process of conversion into Law. The section on “Energy” consists of series of articles establishing the end of gas protection and the improved protection of electricity effective from July 1, 2019, a set of rules on bid comparability, the monitoring by the Authority of the degree of liberalisation of both sectors and the creation of a list of vendors.
Numerous amendments had already been proposed in 2016 to the method of treating customers in the electricity sector (domestic and other LV utility customers) who, as of July 1, 2019, will be still served by the historical supplier. According to the current formulation of the text, as amended by the Parliament on 22 May 2017, bidding procedures are no longer envisaged by geographical area to identify suppliers for customers who have not chosen a supplier on the free market (auctions still apply – as now – for the safeguard service). The legislative measure is pending final approval by the Senate. At the same time, the Authority has pursued its own process of reform in order to promote the overcoming of the greater electricity protection scheme through increased customer capacity. By Resolution 369/2016/R/eel, the Authority introduced the price SIMILAR protection scheme (TS – similar to a supply in the Italian Retail Electricity Free Market) that is offered by sellers selected by the Sole Purchaser and can be chosen on a voluntary basis by customers still operating under the greater protection scheme via a portal operated by the same Sole Purchaser. The mechanism is characterised by contractual and economic conditions that are established by the Authority unless a one-off bonus (€/PoD) freely determined by operators is applied. Subsequently, the Authority proposed a consultation of its guidelines on the offer called “PLACET” (the acronym of Prezzo Libero A Condizioni Equiparate di Tutela, meaning an offer at free prices at conditions equivalent to those of protection), by specifying the contractual terms and conditions and the price components and structure that all free-market sellers shall apply to their domestic and non-domestic customers effective from January 1, 2018. Functional unbundling and Brand unbundling By Resolution no. 296/2015/R/com, the Authority adopted provisions on brand unbundling for vendors who operate in the free market and also under the greater protection service, by regulating:
- by June 30, 2016, as later extended to January 1, 2017, pursuant to Resolution no. 327/2016/R/eel: the use of separate communication policies and brands for the conduct of both activities, while maintaining the corporate distinctive features;
- by January 1, 2017: the conduct of commercial activities by using separate information channels, physical space and personnel.
Charge of the TV licence fee in the electricity bill Subsections 152-164, article 1, of Act no. 208/2015 on the “Provisions for the preparation of the State’s annual and multi-year budget” (so-called 2016 Stability Act), regulated the charging of the TV licence fee in the electricity bills issued by electricity companies to their customers. For the implementation of the above act, the Ministry for Economic Development (MiSE), jointly with the
6 Translator's Note: "Tutela SIMILE" is the name of an electricity delivery mechanism that offers customers protection similar to the free market. 7 Translator’s Note: a PLACET offer is an offer at free prices at conditions equivalent to those of protection.
28
Ministry of Finance, issued the Decree on "Regulation implementing article 1, subsection 154, of Act no. 208 of December 28, 2015 (TV licence fee charged in the electricity bill)", under which the companies entrusted to collect the television licence fee shall receive a reimbursement of costs sustained equivalent to 14 million euro in 2016 and a further 14 million euro in 2017. By Resolution 291/2017/R/eel, the Authority set out the criteria for the breakdown of the lump-sum contribution, by making a distinction between contributions covering investments and those covering operating costs; a fixed portion and a variable portion are envisaged according to the number of TV licence fees to be levied and taking into account the differences in the cost structure and economies of scale the characterize operators of different sizes. The amounts owed to each company will be calculated directly by the Single Buyer and communicated to the Inland Revenue agency. Economic conditions of the electricity sales service: a) Greater protection By Resolution no. 354/2016/R/eel, the Authority updated the economic conditions of the greater protection service for the third quarter of 2016, by applying a 4.3% increase, following the recognition in tariffs of so-called dispatching service extra-costs incurred by Terna and the subject of incorrect conduct on the part of operators (pursuant to Resolutions no. 342/2016/E/eel and 459/2016/E/eel). On the basis of the appeal filed with the Lombardy Regional Administrative Court (TAR) by the consumers’ associations Codacons and Comitas against Resolution no.354/2016/R/eel, by means of a monocratic precautionary decree, on July 19, the Judge suspended the tariff updating resolution, pending the hearing of the Regional Council scheduled on September 15. The Authority immediately filed a request for revocation against the monocratic precautionary decree, which was however rejected by the Regional Administrative Court (TAR), which upheld the rejection of increases in electricity tariffs effective as of July 1 onwards. In the hearing held on September 15, the Regional Administrative Court confirmed, however, the updates pursuant to Resolution no. 354/2016 until the February 16, 2017 hearing. At the same time, the Court ordered AEEGSI to adopt a measure to pre-determine the arrangements for the liquidation and automatic repayment, without the need for a specific request by end customers, in the event of a favourable outcome of the dispute. By Resolution 575/2016/R/eel, the Authority established an automatic return mechanism to users of the amounts recovered by Terna, under:
- any prescriptive measures regarding certain dispatching service users in withdrawal and feed-in (units not enabled) that already foreshadow a recovery procedure and whose outcomes will also derive from the debate at court between each operator and Terna;
- asymmetric regulation measures intended for dispatching service users in feed-in (enabled units) to be adopted.
The return mechanism envisages the inclusion of the amounts recovered in the determination of the uplift fee of the first quarter available, thus allowing their immediate recognition to dispatching service users and, through them, to the customers of both the free market and regulated market (without distinction). Pending the closing of the proceedings, the entities exercising greater protection have applied the economic conditions of the second quarter in certain periods (until July 19), and those of the third quarter in other periods (from September 15). At the hearing held on last February 16 at the Lombardy Regional Administrative Court, the applicants declared, in the light of the decisions made by the Authority by Resolution 575/2016, their lack of interest in the appeal and so the Court declared its impracticability (Codacons found that the Authority is finding overall resources to be recovered in favour of the users, by introducing mandatory measures). By Resolution no. 369/2016/R/eel, the Authority also changed the economic terms applied to the sale of electricity under greater protection effective beginning on and after January 1, 2017. This reform, which is detailed in the subsequent Resolution no. 633/2016/R/eel, established the Reformed Greater Protection Service
29
(MTR8), which is characterised as follows: - the energy price (PE) component of the energy and dispatching service fee (PED), covering the
purchasing costs of electricity supplied to greater protection customers, will be determined beforehand according to the quarterly average of the prices in the spot energy market (MGP9 and MPI), appropriately weighted with the withdrawal profile of the various types of customers in the reference quarter, the estimated operating cost of the Sole Purchaser, and taking into account the estimated financial expenses associated with the purchase and sale of electricity. The PE fee will be subject to a mechanism for the equalisation of costs, as currently envisaged;
- the dispatching service (PD) component of the energy and dispatching service fee (PED), will be determined as the quarterly average of dispatching service fees applicable pursuant to the TIS10, weighted with the withdrawal profile of the various types of customers belonging to each type of contract (except for non-domestic customers, for which the estimate is made on a monthly basis).
In implementing the provisions of Resolution no. 582/2015/R/eel, Resolution no. 782/2016/R/eel proceeded with the second step of the reform of network tariffs and tariff components to cover system overheads for electricity domestic customers. Effective from January 1, 2017, the tariff fees for (transmission, distribution and metering) network services will assume a trinomial structure, called “TD”, for all domestic customers, regardless of their registered address of residence, thus eliminating any progressivity, in accordance with a cost-consistency principle. The conditions of registered address of residence are of relevance only for the purposes of the application of the charges associated with the system and the DISPBT component. The fees covering the system overheads will ultimately be re-determined to mitigate the effect of consumer progressivity and to limit the number of rates diversified in annual consumption brackets, by introducing a flat-rate fee /€/year) only for the A3 component and for non-resident customers only. Resolution no. 816/2016/R/eel provides an update of the components covering the marketing costs (RCV) up until June 30, 2018 (in line with the current formulation of the Competition Delegated Decree), and introduced a slight increase compared to 2016 (+7.7% for domestic customers and + 9.4% for LV other utility customers in the geographical area of central and northern Italy), due to the increased level of unpaid ratio recognised to operators. The Resolution also updated the values of the DISPLV component, not only to adapt it to the above-mentioned new tariff structure but also to take into account of revenues resulting from the offset mechanisms provided by the TIV11. b) Free Market The above Resolution no. 816/2016/R/eel updated the PCV component until June 30, 2018 to cover marketing costs, and envisaged an increase of 2.92 euro for domestic customers (+5.3%, increasing from 54.87 euro/POD to 57.79 euro/POD) and 2.51 euro for LV other utility customers (+2.2%, increasing from 115.87 euro/POD to 118.38 euro/POD). Economic conditions of gas protection service: a) review of economic conditions Resolution no. 166/2016/R/gas has established the method for determining the economic conditions of the gas protection service for the period October 2016 to December 2017, as follows:
• The component covering wholesale procurement costs (Cmem) remains defined under the current updating formula, i.e. on the basis of quarterly OTC forward prices recorded at the TTF hub, maintaining the current procedures for the recognition of logistics costs.
8 Translator’s note: MTR – Servizio di Maggior Tutela Riformato [Reformed Greater Protection service] 9 Translator’s note: MGP – Mercato del Giorno Prima [Day-Ahead Market (DAM)] 10 Translator’s note: TIS – Testo Integrato Settlement [Lit. Consolidated Settlement Act] 11 Translator’s note: TIV – Testo Integrato Servizi di Vendita [Consolidated Sale service Act]
30
• The CCR component to cover costs for operations related to the wholesale procurement and the coverage of certain risks was revised upward.
• The revision of the GRAD component is extended to December 31, 2017, reformulated in order to maintain the same expected revenue.
By Resolution no. 817/2016/R/gas, the component covering marketing costs (QVD) has been updated with a slight increase compared to 2016 (+1.4% of the fixed component only), due to an increased level unpaid ratio recognised to operators. b) APR incentive mechanism for the renegotiation of long-term gas contracts By resolution 447/2013/R/gas, the Authority introduced a mechanism to promote the renegotiation of long-term contracts for the procurement of natural gas, whereby the vendors admitted to the mechanism acquire the right to the recognition of an “offsetting” amount that will be quantified at the end of 2016 and recognized on the volumes delivered to customers under the protection service with long-term contracts over the heating year 2010-2011 and 2011-2012. The initial value of the element for the promotion of the renegotiation of long-term procurement contracts (APR) was initially quantified at 0.856801 €/GJ; it was subsequently updated on an annual basis by the Authority according to the trend in the spread between Ptop (procurement cost from long-term contracts) e Cmem (spot price spot) in the 2013/2014, 2014/2015 e 2015/2016 heating years. Due to the insufficiency of the account that was opened for the purpose with CSEA12 to cover the renegotiation mechanism, which is fuelled by the CPR component paid by end users, the disbursements to the operators have slowed down considerably. c) application of a reduction coefficient to the QE component (Resolution ARG/gas 89/10) In a market scenario characterised by reduced consumption, excess of supply a downward renegotiations of take-or-pay gas contracts, with resolution ARG/gas 89/10, the Authority intended to transfer any potential benefits to end customers under the protection scheme by applying a reduction coefficient k to the QE indexed component (a variable fee to cover the procurement costs) for the heating year 2010-2011. The subsequent resolution ARG/gas 77/11 extended the application until September 30, 2012, by upward reviewing the k coefficient (from 0.925 to 0.935). Some operators filed an appeal against Resolution ARG/gas 89/10, thereby challenging the arbitrariness of the value of the k coefficient. The appeal was extended to Resolution ARG/gas 77/11. In March 2013, the Lombardy Regional Administrative Court (TAR) ruled in favour of the appealing companies by cancelling the provisions of Resolution ARG/gas 89/10 and related provisions (233/10, 77/11, 84/11 and 132/11). The judgement was later appealed before the Council of State by the Authority. With judgement no. 4825 of November 18, 2016, the Council of State confirmed the TAR’s decision. In compliance with the provisions of the administrative judges, the Authority placed in consultation, by DCO 463/2017, the recalculation of the coefficient k, which was established at 0,943 for 2010-2012. The reasons at the base of this recalculation remain, however, incomplete and there is still the need to determine how to recover the amounts recalculated in favour of the sales companies through the CSEA. Use of electronic bills By Resolution 279/2017/R/com, the Authority introduced an incentive mechanism for greater use of bills in electronic format aimed at customers served on protected markets. The data made available to the Authority during the updating of QVD13 and RCV14 components revealed the
12 Translator’s note: CSEA - Cassa per i Servizi Energetici e Ambientali [Energy and Environmental Services Fund] 13 Translator’s note: QVD – Quota Vendita al Dettaglio [Retail Sale Portion] 14 Translator’s note: RCV – Remunerazione Commercializzazione Vendita [Sales Trading Remuneration]
31
limited use of bills issued in a non-paper form on the one hand, and a reduction in costs below the discount applied on the other. Based on this evidence, the Authority introduced for the years 2016 and 2017, a voluntary mechanism aimed at encouraging sellers supplying electricity and gas to customers served on protected markets to promote the use of bills in electronic format. Access to this voluntary mechanism is conditioned upon the achievement of a minimum number of customers entitled to the discount, which entails the partial reintegration of the differential between the discount applied to customers served and the cost avoided by the service manager due to the issuing of bills in non-paper form. The amount of the reintegration increases when the minimum threshold level is exceeded, up to the achievement of the second level target of 50% of customers served in the year 2016, in which case the seller is entitled to receive full reintegration. ENVIRONMENT BUSINESS UNIT Biomethane Biomethane is a gas produced from renewable sources with at least 95% of methane: it can, in fact, be derived from the biogas produced by the anaerobic digestion of biomass crammed into a controlled environment (digester) or landfills, following the decomposition of the waste, or from gas resulting from gasification of biomass. If subjected to a process of purification and upgrading, it can acquire the same quality as natural gas, complying with the physical-chemical characteristics provided in the directives of the Authority for energy, it can be suitable to the subsequent compression phase. The issues related to the use of biomethane can be divided into two categories: A. technical standards governing: (a) connection to the grid of production plants (i.e. pressure,
measurement); (b) the quality of biomethane that producers must guarantee in order not to cause damage to the grid and users; (c) equal treatment and responsibilities with respect to the design of the market (i.e. rules on the handling of the feed-in points of the grid, the calorific value, etc.). In this regard, the transport grid Code is being updated by the Authority. The Italian Gas Committee (CIG) has recently published the technical standard, prepared within the M/475 European Mandate that specifies the biomethane characteristics for feed-in into natural gas grids;
B. incentive system that depends on the use of biomethane: 1) cogeneration 2) feed-in 3) automotive use
The Ministerial Decree on biomethane issued on December 5, 2013 (so-called Biomethane MD), which was subjected to public consultation by the Ministry for Economic Development, is currently under review. The new draft redesigns the incentive method of biomethane fed into the natural gas network by privileging the use in the transport sector in order to pursue, among other things, the 2020 targets for renewable energy consumption in transport. The this end, the Biomethane MD introduces an incentive framework based on the System of In-feed Certificates (CIC) that are issued to the biomethane producer over a period of 20 years and usable by the entities committed in the transport sector (fuel distributors) to fulfil the obligation of promoting the consumption of fuels from renewable sources. The biomethane producer shall provide for the sale of biomethane autonomously to persons holding “road and highway fuel distribution stations” or to fuel brokers/shippers. The draft Ministerial Decree also introduces the definition of advanced biomethane, i.e. biomethane obtained from the organic fraction of solid urban waste (FORSU), for which a “dedicated collection” scheme is recognised by the GSE for a period of 10 years. The biomethane producer is entitled to the physical collection of advanced biomethane produced at the market price of natural gas (average price at the PSV), reduced by 5% and the awarding of CICs of a fixed value of 375 euro. This incentive scheme applies up to a maximum annual collectable quantity on the part of the GSE, which is published annually and equal to the annual
32
requirement of the supply of advanced biofuels put into transport starting from 2018. GAS NETWORK AND HEATING BUSINESS UNITS Final reference rates for natural gas distribution and metering services for 2016 and provisional reference rates for 2017 By Resolution no. 146/2017/R/gas, the Authority approved the 2016 final reference rates (according to final investments made in 2015, divestments made in 2015 and 2015 contributions). By Resolution 220/2017/R/gas, the Authority approved provisional reference rates for 2017 (according to 2016 pre-final investments and an estimate of 2015 contributions). The new rates are influenced by the reduction of the WACC in force since 2016 (Resolution no. 583/2015/R/com-TIWACC) equal to 6.1% (6.9% in 2015) for distribution and 6.6% (7.2% in 2015) for metering. The 2017 final reference rates that will take into account final investments, divestments and actual contributions for 2016, will be published by February 2018. Intra-period update of the 2017-2019 rate regulation for natural gas distribution and metering services By resolution no. 775/2016/R/gas, the Authority defined the criteria for intra-period update, effective for the three-year period 2017-2019, of the rate regulation for natural gas distribution and metering services, by consequently updating the regulation of rates for gas distribution and metering services for 2014-2019 (RTDG), effective as of January 2017. The resolution follows the DCO 629/2016 and has updated some elements of the gas rate regulation, including: • the unit cost of metering checks set at €50 by active electronic metering group greater than class G6
(compared to previously recognised €60.33); • the 2017 standard unit costs for gas smart meters in class G4 or G6 are €135 and €170, respectively
(compared to previously recognised €120 and €160). • the extension of investments concerning gas smart meters in class G4 or G6 effected in 2016 of their integral
recognition up to 150% of the standard cost; • the postponement of the introduction of parametric components to cover the tele-management /
concentrator costs and confirmation of timely recognition – even within a certain limit – of the investments made.
The values of the efficiency recovery rates (so-called X-Factor) valid for the update of operating costs recognised for distribution activities are confirmed (1.7% for operators with more than 300,000 PDR and 2.5% for other operators), metering (0%) and marketing (0%). Under the same Resolution, the Authority also updated the amount of the unitary parametric components of the reference rates for distribution, metering and marketing activities as of 2017, by increasing marketing from 1.2 euro/PDR to 2 euro/PDR. Functional bundling and brand unbundling By Resolution no. 296/2015/R/com (RIUF), the Authority confirmed its brand unbundling guidelines by assigning the Independent Operator the responsibility for correct implementation of the relevant regulation, including the obligation to separate brand and the communication policies (including the corporate name, firm, sign and any other distinctive element) from the sales company (avoiding the risk of confusion in the end customer) and the use of information channels, physical space and personnel other than those used for the sales activity. A consultation was held in June 2017 regarding the general criteria for the recognition of costs incurred by operators to comply with legal provisions (DCO 307/2017/R/com). As a general rule, the Authority intends to take into consideration the costs incurred by operators, possibly net of costs already recognized by other
33
regulatory mechanisms. Simplified mechanisms based on parametric logics are provided for small-size operators. Assignment and performance of the natural gas distribution service Following the reform of the methods for the allocation of the natural gas distribution service, 177 “Minimal Territorial Districts” (Ambiti Territoriali Minimi15) were defined (Ministerial Decree of January 19, 2011 and Ministerial Decree of October 18, 2011), for which tenders will be called for the allocation of the service in accordance with the requirements of so-called Tender Regulation (Ministerial Decree no. 226 of November 12, 2011, as amended). Regulations have also been adopted to protect the jobs of personnel employed by the operators involved in the restructuring of the sector (Ministerial Decree of April 21, 2011). In recent years, several provisions have amended Legislative Decree no. 164/2000 and Ministerial Decree no. 226/2011, with particular reference to the method of calculation of the reimbursement to be paid to the outgoing operator (VIR16) and the timescale for calling tenders. Ministerial Decree of May 22, 2014 approved the Guidelines regarding the criteria and application methods for the calculation of the VIR, while Ministerial Decree no. 106 of May 20, 2015, amended Ministerial Decree no. 226/2011 so as to implement the new regulations on the calculation of the VIR (especially as regards the treatment of contributions), the application of the guidelines, the maximum percentage of the fee, the recognition of costs underlying energy efficiency projects to be realized in the geographical area and offered in the bid. Decree Law 210/2015 (so-called Milleproroghe 2016) granted a further extension of deadlines for the publication of calls for tender by Contracting Stations, and the penalties previously envisaged for the defaulting contractors were eliminated. As part of the tasks entrusted by the legislator to the regulator, the Authority, by Resolution no. 571/2014/R/gas, amended the standard service contract scheme for natural gas distribution (an amendment not implemented, however, by the Ministry for Economic Development in the standard contract currently in use), and lastly, by Resolution no. 407/2015/R/gas, amended the provisions adopted by Resolution no. 310/2014/R/gas in the calculation of the VIR, in relation to the methodological aspects for the identification of cases showing a greater than 10% deviation between VIR and RAB17. By Resolution 344/2017/R/gas, in line with the provisions of final approval of the Competition Law Decree18, the Authority introduced a simplified procedure for the analysis of VIR-RAB differences prior to the publication of the call for tenders, which only applies when the local administrative authority can prove the exclusive application of the April 7, 2014 Guidelines for VIR assessment purposes. In these cases, 1) the local administrative authority is not required to send a detailed documentation, rather it allows access to the documentation only at the request of the Authority; 2) the Authority shall, within the following 30 days, request the detailed documentation on a random basis. The recent Ministerial Decree containing the New Guidelines on white certificates for 2017-2020 period also partially solved the uncertainty regarding the coverage, in terms of tariff contribution, of certificates generated
15 Translator’note: ATEM: Ambiti Territoriali Minimi [Minimal Territorial Districts], are the territorial districts, normally composed by several
municipalities in the same province, where the new concessions for gas distribution service have to be tendered. 16 Translator’s note: VIR: Valore Industriale Residuo [Asset residual value] is the difference between the capital that would be needed to build the asset
anew and its depreciation due to use and obsolescence. 17 Translator’s note: RAB: Regulatory asset base - is the value of the Net Capital Invested recognized by AEEGSI for tariff purposes. 18 The Competition Law Decree, currently at the Senate for final release, provides for the adoption of measures to simplify the assessment of bidding
for gas distribution: 1) pre-notification of the call for tenders to the Authority is no longer required if: 1) the local administrative authorities certify that the VIR estimate is consistent with the Guidelines issued by the Ministry for Economic Development; 2) the difference between VIR and RAB does not exceed 8% in aggregate terms and 20% in each municipality; b) the Authority shall identify a simplified procedure for assessing invitations to tenders if they are prepared in accordance with the type, specifications and service framework contract.
34
by energy efficiency projects proposed at the bidding stage for the assignment of the management of the natural gas distribution service on an ATEM basis. More specifically, the Ministerial Decree envisaged that any certificates issued in relation to such projects and cancelled by the Regulatory Authority in the reference year would reduce in equal terms the overall savings obligations relating to subsequent year. However, there are some remaining uncertainties, including the territorial constraint of interventions offered at the bidding stage. Lastly, it should be noted that the normative standard on gas distribution tenders introduced in the remedial measure to the Code of Contracts, published in the Official Gazette on May 5, 2017, confirms the validity of the activities carried out so far by the Contracting Stations in producing tender documents. The maximum term of 12 years for tender-awarded assignments remains unchanged. The Lazio Regional Administrative Court (TAR), in judgement no. 10286 of October 14, 2016, rejected the appeal as it deemed groundless the reasons put forward regarding the non-compliance with what stated by the free will of the parties, the pricing criteria, the deduction of contributions and the reduced useful life of meters up to G6. The complaints concerning the faculty for the Municipalities to sell the grid and the scores for investments in energy efficiency were deemed inadmissible for lack of current interest. The operators have filed an appeal against that ruling before the State Council. Final reference rates for electricity distribution and metering services for 2016 and provisional reference rates for 2017 By resolutions no. 188/2017/R/eel and no. 199/2017/R/eel, the Authority approved the 2016 final reference rates for electricity distribution and metering services, while by Resolutions no. 286/2017/R/eel and no. 287/2017/R/eel, the Authority approved the 2017 provisional reference rates for the same operations, namely:
- the 2016 final reference rates take into account investments made up until 2015, including those relating to marketing activities (the costs of which had been previously recognised on a pre-final parameter basis), divestments and contributions for 2015;
- the 2017 provisional reference rates take into account pre-final investments made up until 2016, divestments and an estimate of contributions for 2016.
The rates are defined based on the WACC in force since 2016 (Resolution no. 583/2015/R/com-TIWACC) equal to 5.6%, and also according to the new regulations introduced by Resolution no. 654/2015/R/eel (TIT 2016 - 2019). The 2017 final reference rates that will take into account final investments, divestments and actual contributions for 2016, will be published by February 2018.
Electricity distribution and metering service: Electricity Quality Consolidation Act for the regulatory period 2016-2023 Resolution 646/2015/R/eel (TIQE 2016 - 2023) contains numerous provisions aimed at selective promotion of investments in distribution networks. However, almost all of these mechanisms are considered in terms of general objectives, and the guidelines regarding their operation shall be developed through appropriate roundtables attended by distributors, the Authority and Terna (including one on the resiliency of the electricity system, launched on April 1, 2016). Articles 129, 130, 131, 132 of the TIQE contain the innovative features of the medium-voltage distribution networks in areas with a high penetration of distributed generation of electricity from renewable sources: “Observation of power flows and the state of resources transmitted on medium-voltage networks and regulation of the voltage of distribution networks”. Article 134 of the TIQE envisages the key policies to implement in preparing plans for the modernisation of the obsolete risers in urban areas with plants designed according to a “future proof” logic capable of supporting any increases of the contemporary use of power, following the change of the domestic rates. The Authority also identified a possible reward/penalty mechanism applicable to this type of initiatives. In connection with smart city experiments (art. 135) with innovative features on the LV grids, distributors in
35
urban areas with at least 300,000 inhabitants will have access to the town-scale pilot projects with innovative LV grid management logics, possibly multiservice (smart water grid, integration with advanced mobility systems, etc.). Each distributor selected will be granted a contribution for the cost incurred. With Resolution 781/2016/R/eel, the Authority deemed it appropriate to analyse these last two issues through appropriate consultation (expected to be held in 2017), so as to take appropriate account of some of the issues raised by operators, as well as explore in more detail the possible synergies between the plans for entry into service of the second-generation meters and smart city experiments. By way of Resolution 127/2017/R/eel, following the inefficiency affecting Central Italy, the Authority introduced changes to quality regulation: - eliminating the limit of 300 euro/user; the indemnity will thus continue to increase for every further block
of 4 hours service discontinuity up to a maximum of 240 hours (i.e. 60 blocks of 4 hours); - providing that in the event of discontinuity caused by force majeure, after 72 hours of suspension and up
to a maximum of 240 hours, the indemnity will be paid directly by the distribution company (or by Terna) and not charged to the Exceptional Events Fund at CSEA (exclusionary clauses, though very restrictive are provided, however).
The 2016-2023 TIQE also contains initiatives aimed at increasing the resilience of the national electricity grid. In particular, it was envisaged that, by March 31, 2017, the distribution companies serving more than 50,000 users would send to the Authority a work plan aimed at the adoption of regulatory measures appropriate to achieve this target. The plan must: - contain, in addition to a technical review, cost and benefit elements in consideration of the effects of
severe and persistent weather events that have occurred over the last 15 years; - be coordinated with distribution grid development plans prepared by individual operators and
development plans of the RTN19 managed by Terna and with the underlying/interconnected distribution grids pertaining to other operators.
On completion of a first stage of works conducted by a dedicated technical workshop involving Terna, CEI, RSE and distributors with more than 50,000 POD (including Unareti S.p.A.), Decision 2/2017 DIEU was issued to approve the document entitled “Guidelines for the Presentation of Work Plans for Increasing Electricity System Resilience – Part One”. This document contains the methods envisaged to identify priorities to address the issue of grid holding and the parameters to be used to estimate costs and benefits associated with such action. Grid code (or CADE) and general system expenses By judgement no. 243 of 31.01.2017, the Lombardy Regional Administrative Court (TAR), in accepting appeals lodged by some sales companies and AIGET, declared Resolution 268/2015/R/eel (CADE) illegitimate in that it provides that guarantees that sellers are required to provide to the distributor must cover the general system expenses (OGS) in addition to transport service charges (by reiterating the reasons given by the State Council with judgement no. 2182 of 2016, which had previously annulled Resolution 612/2013/R/eel). This judgement also clarified that in the electricity supply chain the end customers are the entities required to sustain general system expenses from a legal and economic point of view, and highlighted the absence of rules governing the transfer of the end customer obligation to traders, and it did not recognise the Authority any power of integration of contracts between distributor and seller. The Authority: • by Resolution no. 79/2017/C/eel, notified its appeal against the January 31, 2017 rulings of the Lombardy
Regional Administrative Court (TAR) (the hearing is scheduled in the third quarter of 2017);
19 Translastor’s note: RTN – Rete di Trasmissione Nazionale [National Transmission Grid]
36
• by Resolution no. 109/2017/R/eel, added some transitional provisions modifying the CADE, including: - a reduction in the calculation of the guarantees presented by traders to distributors (5.6% and a further
4.9% reduction, with reference to components A only); - the launch of a procedure aimed at identifying mechanisms to recognize adequate compensation to
transport users and distributors in the event of failure to collect tariff components covering the general system expenses. This mechanism will be defined by December 2017.
The dispute relating to the general system expenses has been supplemented and, partially replaced, by GALA’s default, which has commenced composition with creditors proceedings since 03.04.17. Billing Consolidation Act (TIF) By resolution no. 463/2016/R/com, as amended, the Authority approved:
a) the Billing Consolidation Act (TIF), which defines the provisions on billing for the period for the retail sales service to end customers of electricity and gas, complemented by the provisions on closing billing (already defined by Resolution no. 100/2016/R/com);
b) specific interventions, relating to the metering and the instalment payment policy, intended to make the current regulatory provisions consistent with the new TIF policy. In particular, with reference to the electricity distribution service, the Act envisages the increase in data reading frequency for electric non-remote controlled single-hour meters, establishes an encoding requirement of the reasons for failed reading in order to ascertain how the service is performed by the distribution companies and, last but not least, it introduces a compensation scheme in favour of end customers in case of delay in the provision of metering data. In particular, in the absence of any consultation, a specific compensation of €10 is provided in case of non-provision of the actual metering data for two consecutive months by the electricity distributor in the case of withdrawal points managed by bands (art. 17). Compensation shall not apply if non-compliance with the regulation is due to fortuitous events or force majeure.
Following requests and instances received, by Resolution 738/2016/R/com, the Authority made some minor changes to the TIF in relation to the above-mentioned aspects. Further contacts with the Authority are in progress in order to clarify certain application issues, namely the scope of application of indemnities and the reasons for exclusion. New method for the quantification of unit tariff contribution to be recognised to distributors within the context of the energy efficiency title scheme White Certificates (WC), also known as Energy Efficiency Titles (EET), are negotiable attestations that certify the achievement of energy savings in the energy end use, thanks to interventions and projects to increase energy efficiency. The WC system was introduced by Ministerial Decree of July 20, 2004 as amended, and provides that electricity and natural gas distributors annually achieve set quantitative primary energy saving targets, expressed in saved oil equivalent tonnes (OET). A certificate is equivalent to the saving of one oil-equivalent tonne (OET). Electricity and gas distribution companies can fulfil their obligation by implementing energy efficiency projects that entitle them to receive WCs or by purchasing WCs from other generating entities (typically Energy Service Company – ESCO) on the market organised by the GME. The Authority sets out the method for the quantification and payment of the tariff contribution to be recognized to distributors subject to such obligations. Following the entry into force of Ministerial Decree of 11 January 2017, which sets out national energy saving targets for the years 2017-2020 and the approval of new Guidelines on WCs, in consideration of the results of the survey conducted by the Authority on the abnormal performance of WC prices between June 2016 and March 2017, by Resolution 435/2017/E/efr, the Authority reviewed the rules for the calculation of the tariff
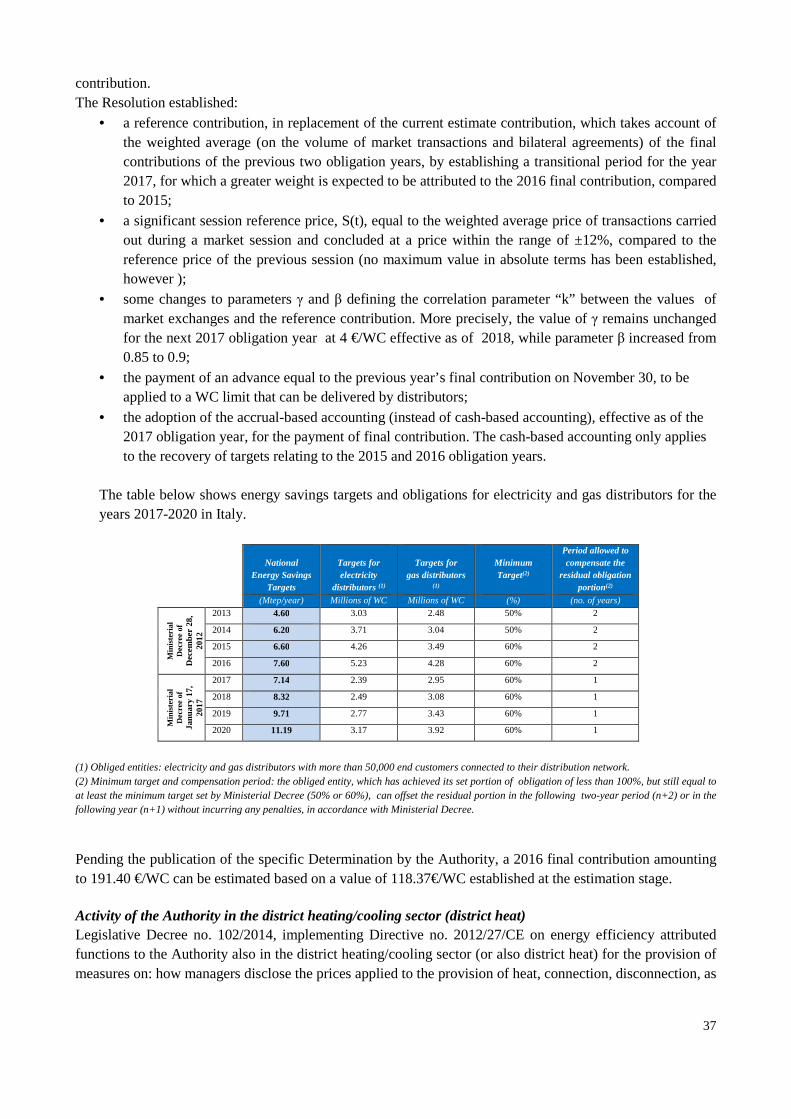
37
contribution. The Resolution established:
• a reference contribution, in replacement of the current estimate contribution, which takes account of the weighted average (on the volume of market transactions and bilateral agreements) of the final contributions of the previous two obligation years, by establishing a transitional period for the year 2017, for which a greater weight is expected to be attributed to the 2016 final contribution, compared to 2015;
• a significant session reference price, S(t), equal to the weighted average price of transactions carried out during a market session and concluded at a price within the range of ±12%, compared to the reference price of the previous session (no maximum value in absolute terms has been established, however );
• some changes to parameters γ and β defining the correlation parameter “k” between the values of market exchanges and the reference contribution. More precisely, the value of γ remains unchanged for the next 2017 obligation year at 4 €/WC effective as of 2018, while parameter β increased from 0.85 to 0.9;
• the payment of an advance equal to the previous year’s final contribution on November 30, to be applied to a WC limit that can be delivered by distributors;
• the adoption of the accrual-based accounting (instead of cash-based accounting), effective as of the 2017 obligation year, for the payment of final contribution. The cash-based accounting only applies to the recovery of targets relating to the 2015 and 2016 obligation years.
The table below shows energy savings targets and obligations for electricity and gas distributors for the years 2017-2020 in Italy.
National
Energy Savings Targets
Targets for electricity
distributors (1)
Targets for
gas distributors (1)
Minimum Target(2)
Period allowed to compensate the
residual obligation portion(2)
(Mtep/year) Millions of WC Millions of WC (%) (no. of years)
Min
iste
rial
Dec
ree
of
Dec
embe
r 28
, 20
12
2013 4.60 3.03 2.48 50% 2
2014 6.20 3.71 3.04 50% 2
2015 6.60 4.26 3.49 60% 2
2016 7.60 5.23 4.28 60% 2
Min
iste
rial
Dec
ree
of
Janu
ary
17,
2017
2017 7.14 2.39 2.95 60% 1
2018 8.32 2.49 3.08 60% 1
2019 9.71 2.77 3.43 60% 1
2020 11.19 3.17 3.92 60% 1
(1) Obliged entities: electricity and gas distributors with more than 50,000 end customers connected to their distribution network. (2) Minimum target and compensation period: the obliged entity, which has achieved its set portion of obligation of less than 100%, but still equal to at least the minimum target set by Ministerial Decree (50% or 60%), can offset the residual portion in the following two-year period (n+2) or in the following year (n+1) without incurring any penalties, in accordance with Ministerial Decree.
Pending the publication of the specific Determination by the Authority, a 2016 final contribution amounting to 191.40 €/WC can be estimated based on a value of 118.37€/WC established at the estimation stage.
Activity of the Authority in the district heating/cooling sector (district heat) Legislative Decree no. 102/2014, implementing Directive no. 2012/27/CE on energy efficiency attributed functions to the Authority also in the district heating/cooling sector (or also district heat) for the provision of measures on: how managers disclose the prices applied to the provision of heat, connection, disconnection, as
38
well as regarding safety, service continuity, commercial quality, billing of consumption, including reporting to competent authorities. After an initial recognition in 2014 (Resolution no. 411/2014/R/tlr), in 2015 the Authority effected 2 data collections relating to the creation of a Registry of operators active in the sector and methods for determining prices applied to users (Resolution no. 578/2015/R/tlr). Article 9 of Legislative Decree no. 102/2014 entrusted to the Authority the task of implementing the provisions on metering, direct accounting of individual consumption (by meters or distributors), billing and information on billing, access to consumer data for buildings connected to district heating and cooling networks in order to increase customer awareness and change consumer behaviour. In DCO 252/16, the Authority addressed these issues by considering: • the European and national reference regulatory framework, with regard to the supply meter installation
requirements, individual meters and distributors; • the classification of metering systems for thermal energy and domestic hot water and the minimum
technical and performance requirements of supply and individual meters to be installed (with remote reading, as required), also after December 31, 2016;
• the criteria for the evaluation of the technical and economic feasibility of the installation of individual heat and domestic hot water meters, which is mandatory in the event of new connections in new buildings and major renovations (with hydronic systems and horizontal configuration). In other cases, instead, the installation must be preceded by an evaluation of the technical and economic feasibility, according to criteria the definition of which is entrusted to the Authority by Legislative Decree no. 102/2014.
In a statement dated 23 September 2016, the Authority ruled that due to the amendments made to article 9, subsection 1, of Legislative Decree no. 102/2014, the definition of the technical and performance requirements of individual meters (renamed sub-meters by Legislative Decree no. 102/2014 no. 141 of July 18, 2016) and the criteria to evaluate the technical and economic feasibility of their installation in buildings with several real estate units and in multi-purpose units served by district heating and district cooling networks no longer falls under the Authority’s responsibilities. As to the supply meters, in consideration of the regulatory amendments, which prevented the completion within a reasonable term, and the forthcoming December 31, 2016, the date by which entities exercising metering activities are required to install them, the Authority considered it appropriate not to adopt regulatory measures on the minimum requirements of the meters to be installed by district heating and cooling network operators by December 31, 2016, already covered by the same DCO 252/2016/R/tlr, and adjourned the matter subject to a new consultation on the minimum requirements for the meters that must be installed, including those in replacement of existing ones, as well as remote reading requirements. In the last quarter of 2016, the Authority handled two data collections that were part of two surveys conducted in relation to Resolution no. 562/2016/R/tlr regarding information on the method and contributions for the connection of utilities to and from district heating and cooling networks and disconnection therefrom, and Resolution no. 574/2016/E/tlr regarding information on metering systems and quality of distribution, metering and selling activities. By resolution no. 617/2016/R/tlr, the Authority launched a procedure for determining the costs associated with the allocation of heating and cooling expenses in buildings with several real estate units pursuant to Legislative Decree no. 102/2014, as complemented by Legislative Decree no. 141 of July 18, 2016. The scope of application includes both the buildings connected to both district heating and cooling networks and buildings served by other centralized heating systems for air conditioning and domestic hot water. The so-called “Milleproroghe 2017" decree postponed by a further 6 months the deadline for the installation of the heating valves in blocks of flats and apartments in order to adapt the existing heating system to the provisions of European Directive on energy efficiency, i.e. from December 31, 2016 to June 30, 2017. In the first six months of 2017, the Authority published:
a) Resolution no. 282/2017/R/tlr relates to the "sub-billing" service and aims at ensuring the utmost
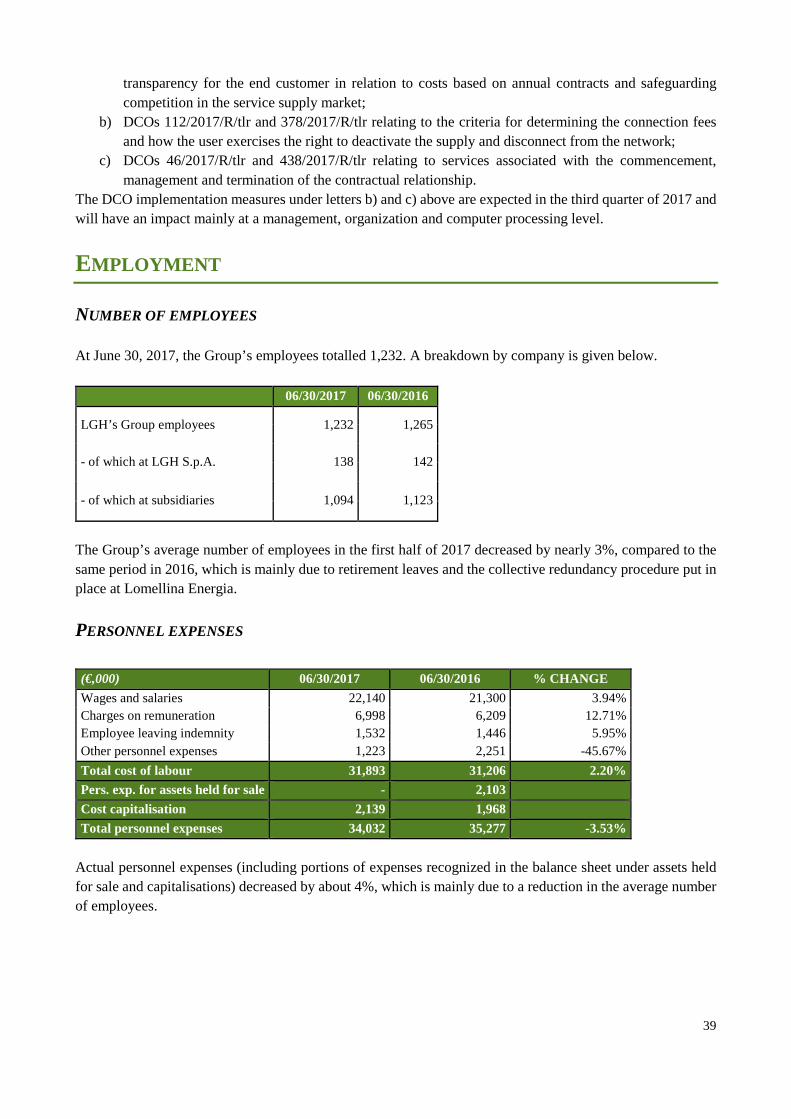
39
transparency for the end customer in relation to costs based on annual contracts and safeguarding competition in the service supply market;
b) DCOs 112/2017/R/tlr and 378/2017/R/tlr relating to the criteria for determining the connection fees and how the user exercises the right to deactivate the supply and disconnect from the network;
c) DCOs 46/2017/R/tlr and 438/2017/R/tlr relating to services associated with the commencement, management and termination of the contractual relationship.
The DCO implementation measures under letters b) and c) above are expected in the third quarter of 2017 and will have an impact mainly at a management, organization and computer processing level.
EMPLOYMENT
NUMBER OF EMPLOYEES At June 30, 2017, the Group’s employees totalled 1,232. A breakdown by company is given below. 06/30/2017 06/30/2016
LGH’s Group employees 1,232 1,265
- of which at LGH S.p.A. 138 142
- of which at subsidiaries 1,094 1,123
The Group’s average number of employees in the first half of 2017 decreased by nearly 3%, compared to the same period in 2016, which is mainly due to retirement leaves and the collective redundancy procedure put in place at Lomellina Energia.
PERSONNEL EXPENSES
(€,000) 06/30/2017 06/30/2016 % CHANGE
Wages and salaries 22,140 21,300 3.94% Charges on remuneration 6,998 6,209 12.71% Employee leaving indemnity 1,532 1,446 5.95% Other personnel expenses 1,223 2,251 -45.67%
Total cost of labour 31,893 31,206 2.20%
Pers. exp. for assets held for sale - 2,103
Cost capitalisation 2,139 1,968
Total personnel expenses 34,032 35,277 -3.53%
Actual personnel expenses (including portions of expenses recognized in the balance sheet under assets held for sale and capitalisations) decreased by about 4%, which is mainly due to a reduction in the average number of employees.
40
CORPORATE RISK MANAGEMENT
The LGH Group has completed the process of the identification and implementation of its own Integrated Enterprise Risk Management (I-ERM) model, with the aim of ensuring a thorough and comprehensive view of all business risks. In particular, the Groups seeks to achieve a consistent approach to risk management through multi-discipline methods and tools at all levels, including reference to compliance with specific regulatory provisions (e.g. Legislative Decree 231, the so-called Privacy Act, Functional Unbundling, etc.).
The reference framework adopted is based on the ERM CoSO Report indicated as reference best practice for the architecture of control systems at both a national and international level. In connection with the risk management process, the framework provides the elements (dimensions) characterising the process, a common language, the guidelines for its implementation and the criteria to evaluate its effectiveness.
As to the specific ICT field, considering the interdepartmental scope and significance of business processes handled through computerised systems, the Group has developed its own customized reference framework for the LGH Group, by identifying an ICT Risk Matrix based on the main reference frameworks (Cobit 5.0, ISO 27001, ITIL v.3) and provides a view by reference area. Similarly, while pursuing the goal of integrated vision, the mapping, evaluation and management of environmental risks and occupational health and safety are handled by dedicated organisational structures in accordance with statutory and reference standards, in addition to virtuous paths in the pursuit of best practices and points of excellence.
The Governance model implemented by the Group in connection with corporate risks comprises the following responsibilities: - the Board of Directors plays a role in guiding and assessing the adequacy of the internal risk control and
management system; - the Chairman supervises internal risk control and management activities; - the Chief Executive Officer coordinates the Risk Committee; - the Compliance and Risk Manager and the Risk Committees assist the Board of Directors and the Chief
Executive Officer in defining the guidelines of the internal risk control and management system connected with trading activities.
- the Internal Audit provides and independent, objective activity to assess and improve control, risk management and Corporate Governance processes.
Below is a description of the main risks and uncertainties to which the Group is exposed. Information Technology Risk Information systems play a crucial role in the main business processes. In general, information technology risks are one of the most relevant classes of risk in the broader universe of corporate risks, in consideration of both the increasingly pervasive presence of technology resources within the LGH Group and the growing cyber threat. The risks in this area also relate to specific interdepartmental projects with reference to the support to both business activities of immediate need and the desire to seize contextualisation in projects of the widest potential (e.g. Smart Food and Smart Agriculture), by benefiting from higher maturity in terms of experienced infrastructures, with reference, for example, to IOT technology. The impact of IT risks also depends on the Group’s organisational structure and business characteristics, and on the applicable legal/regulatory requirements applicable according to the sector of operation and the wide regulatory activity that has focused mainly to the increasing crucial role of ICT at a national and European level. Aware of the relevance of ICT processes and their overall governance, the Group has envisaged a specific in-depth analysis of their adequacy in relation to major risks. The LGH Group has implemented an important process of review and the optimisation of own ICT processes based on the same Governance.
41
Normative and Compliance Risk Among the risk factors of the parent company and its subsidiaries, a consideration needs to be made of the constant evolution of the normative and regulatory framework, with the coexistence of national, regional and provincial rules, which affect both directly on profitability or competitive environment (as in the case of tariff regulation) and indirectly through more or less costly compliance obligations. The Group operates some services based on concessions or contracts, the duration of which may be affected by changes in the law, with the risk of possible, even unpredictable, changes over time. The production of electricity from renewable energy sources is supported by various forms of incentives, which are subject to legislative changes or different interpretations of law that could reduce the economic benefit. As regards to urban hygiene and waste disposal, the Group is exposed to risks deriving from continually evolving environmental stratified disciplinary and regulatory scenario, characterised by sources of varying type and rank. In this context, European and national regulations are implemented by a diversified detailed rules contained in continually evolving national, regional and municipal sources (e.g. those governing environmental emissions and the lifecycle of waste), and regulations concerning the network of economically important public services. In accordance with the tasks related to the regulation and control of district heating, district cooling and domestic hot water operations, as assigned by Legislative Decree no. 102/14, in 2015 the Regulatory Authority initiated the first forms of regulation of these sectors. Such operations will be subject to regulation and efficient monitoring. Referring to a new pricing methodology (totex) As part of the movement towards a reform of the criteria for the determination of electricity distribution and metering tariffs, the Authority has launched a consultation process whereby it envisages the shifting to cost recognition logics based on total expenditures, intended as the sum of operating expenses and investment expenses (known as Totex methodology) in order to encourage an efficient and effective development of services, by defining and updating unitary tariff parameters. Calls for tenders for awarding gas distribution concessions Ministerial Decree no. 106 of May 20, 2015 (Official Gazette, general series no. 161 of July 14, 2015), which introduced amendments to Ministerial Decree no. 226/2011 to make it consistent with the legislative changes that have occurred since its enactment and with the tariff adjustment of the 4th tariff period (2014-2019), defines the operational procedures to be followed to comply with the tender policy regarding energy efficiency interventions in the territorial area and clarifies art. 5 on the calculation of reimbursements already provided by the Guidelines on the application criteria and procedures for the evaluation of reimbursement of natural gas distribution plants, approved by Ministerial Decree of May 22, 2014. Legislative Decree 210/2015, converted into law 21/2016 (Milleproroghe Decree) sets out the postponement of previously identified deadlines for the publication of territorial calls for tenders for the award of gas distribution service concessions, with the resulting extension of the term for executing the tenders and the suppression of the penalties previously envisaged for latecomer municipalities. The postponement of the term differs according to grouping (from 5 months for the eighth grouping to 14 months for the second grouping). It was also established that in the event of inaction on the part of municipalities, and failure on the part of the Regional Authority to exercise the substitute power to call for tenders (temporary receivership ad acta), it will be up to the Ministry of Economic Development to do it within the following 8 months. NDO
42
Repeal of regulated and greater protection market
At the hearing held on October 7, 2015, the Parliament approved the annual draft bill for the market and competition (so-called “Competition Delegated Decree), which is still being discussed at the Senate as part of the process of conversion into Law.
The section on “Energy” consists of ten articles (28 to 38) that introduce a series of measures, such as the end of gas protection and improved protection of electricity effective from July 1, 2018, rules on the comparability of bids, the promotion of purchase groups, the monitoring by the Authority on the degree of liberalisation of both sectors and the creation of a list of vendors. Numerous amendments were proposed in 2016 and 2017 to the method of treating customers in the electricity sector (domestic and other LV utility customers) who, as of July 1, 2018, will be still served by the historical supplier. At the same time, the Authority has pursued its own process of reform in order to promote the overcoming of the greater electricity protection scheme through increased customer capacity. By Resolution no. 369/2016/R/eel, the Authority introduced the price SIMILAR protection scheme (TS – similar to a supply in the Italian Retail Electricity Free Market) that is offered by sellers selected by the Sole Purchaser and can be chosen on a voluntary basis by customers still operating under the greater protection scheme. With reference to waste-to-energy plants, the process of review of the current BATs (Best Available Techniques) for waste incineration is scheduled to be completed by the European IPPC Bureau (Integrated Pollution Prevention and Control). These best practices will be used by national environmental authorities for granting permission and the release of Integrated Environmental Authorisations (AIA) and Integrated Environmental Assessments (VIA) for waste incineration plants. Current AIAs will be released according to a principle of review of business processes and the issuance values. In this context, the LGH Group, as other companies managing waste incineration plants, shall identify any adaptation areas (gap analysis) compared to the new European legislation. Following the publication of Draft 1, the Group companies have set up working groups to assess the criticalities that may arise from a possible lowering of the authorised emission limits. Regarding compliance with the Privacy policy and the process of consolidation and growth of the personal data management and protection system for data subjects involved in LGH Group’s data processing, a series of specific initiatives has been launched thanks to a timely mapping of the relevant handling, systems and processes. The model identified by the LGH Group forms an integral part of the Corporate Governance model and aims to ensure that regulatory requirements and risks in the Privacy environment are properly monitored and provide a support to the business in its specificities and added value in the organisation’s growth process. The monitoring of compliance with the regulations is also ensured by constantly arising the awareness of all business functions by all means, including educational and training activities. The Group also takes great care of compliance in terms of investments and technical assistance in the telecommunication sector, with reference to AGCOM regulations and those required by specific provisions of law (e.g. so-called wiretapping). In general, the Group adopts a policy of continuous monitoring of reference legislation in order to evaluate any implications and ensure the correct application with the support of internal coordination structures and renowned external consultants. With reference to Legislative Decree 231/01, the Group has adopted Organisational Models in compliance with applicable regulations and best practices formulated in this regard. These models are subject to constant monitoring and updating to ensure quick compliance with any corporate regulatory and organisational developments. In his context, it is worth noting that a major process of review of all Organisational Models of the Group is in progress in consideration of recent business organizational innovation. LGH and the other Group companies have set up own Supervisory Board.
43
Business discontinuity risk
The Group operates in reference businesses by managing networks and production sites that are operationally and technologically complex. The Group is subject to risks associated with the malfunctioning of plants or equipment or control systems due to accidental failure/external events (e.g. fire and explosion) that may temporarily or permanently compromise its production capacity and/or operations and generate economic losses and possible damage to the corporate image.
The risk management strategy has led to the adoption of planned maintenance policies designed to identify, monitor and prevent any criticalities. More specifically, monitoring activities and the restocking of spare parts, the forecasting of so-called “strategic warehouses” and definition of contracts with external suppliers for maintenance operations. In connection with the business continuity risk associated with possible interruption of strategic supplies, the Group benefits from being part of the A2A Group, which, for its dimensions and procurement capacity, has reduced the need to resort to other forms of risk mitigation.
With reference to the risk of discontinuity of network services, it should be noted that in the past the company had upgraded its facilities and planned interventions to rationalize the networking of its electricity grid. Specific interventions were also envisaged with reference to plants of a primary importance on the electric grid. For heat generation plants, the Group has envisaged operational protocols for routine and extraordinary maintenance and unplanned plant shutdowns. For the district heating networks of Cremona, Lodi and Rho, the shutdown of production plants entails the activation of stand-by plants. Auxiliary heat accumulation boilers are also provided for all the networks. In general, exposure to the risk of discontinuity of operations due to external events is mitigated by taking out insurance policies and adopting risk prevention, protection and monitoring procedures. Commodity price risk The technological production paradigm that characterizes some businesses of the LGH Group exposes the group to economic profitability risks associated with the possible fluctuations in the price of raw materials and productions. In previous years the Group had put in place a risk management structure and own Energy Risk Policy, which, in addition to defining the risk limits in terms of PaR and VaR (industrial portfolio and trading portfolio, respectively), outline the governance with reference to this specific risk.
In this respect, the Group set up a risk committee that monitors compliance with the Energy Risk Policies that have been duly approved by the Board of Directors of Linea Più. The Risk Committee has adopted a valuation model of the counterparties with reference to the default risk based on a rating system that defines the solvency estimate and allows for the calculation of the maximum monthly exposure.
The management of so-called industrial risk associated with the trading activity is carried out according to a performance risk logic and is subject to specific risk limits (PaR). The Group also puts in place transactions that are generally not finalised to delivery, in both physical and financial markets with the aim of making a profit on the occurrence of a favourable market expectation (so-called trading portfolio) in compliance with specific risk limits (VaR and Stop Loss). The volume risk is not the subject of a systematic management and hedging activities. The above price risk management is made through derivative instruments traded on MTF, OTF and over-the-counter (OTC) markets with underlying gas, electricity and warranties of origin. The PaR and the VaR are calculated daily according to the historical simulation method, by adopting a confidence level of 99% and a holding period of 3 days.
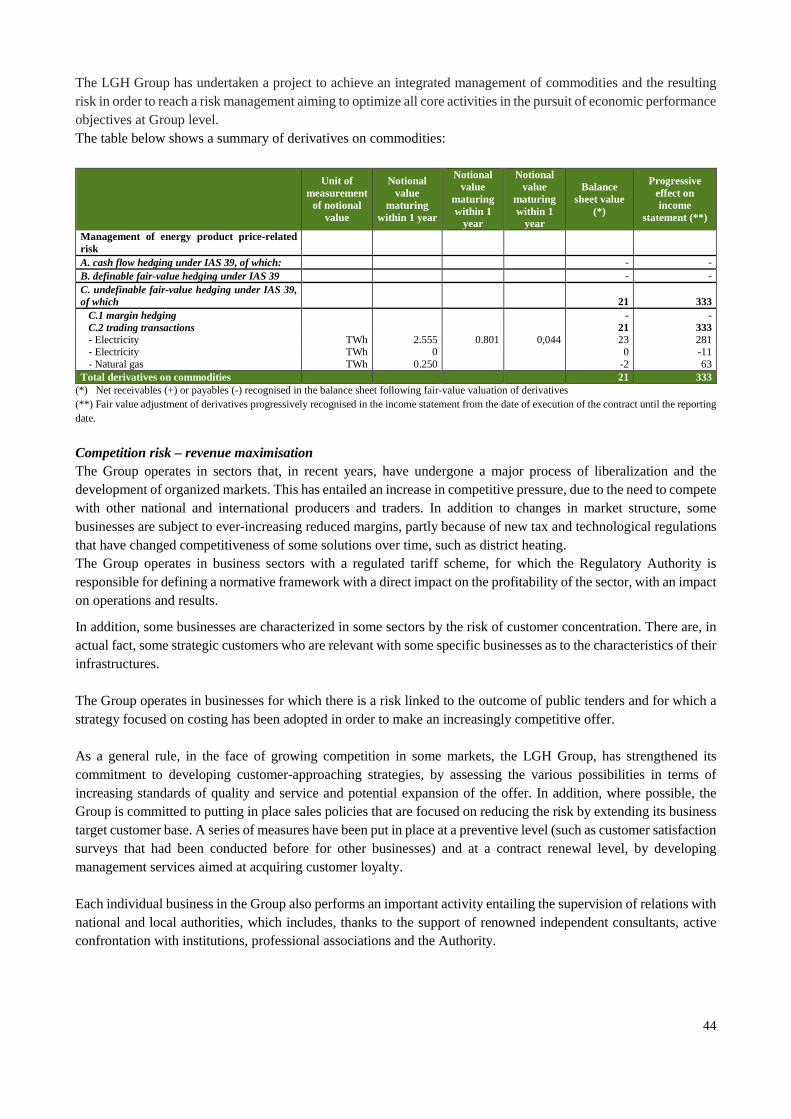
44
The LGH Group has undertaken a project to achieve an integrated management of commodities and the resulting risk in order to reach a risk management aiming to optimize all core activities in the pursuit of economic performance objectives at Group level. The table below shows a summary of derivatives on commodities:
Unit of measurement
of notional value
Notional value
maturing within 1 year
Notional value
maturing within 1
year
Notional value
maturing within 1
year
Balance sheet value
(*)
Progressive effect on income
statement (**)
Management of energy product price-related risk A. cash flow hedging under IAS 39, of which: - - B. definable fair-value hedging under IAS 39 - - C. undefinable fair-value hedging under IAS 39, of which 21 333 C.1 margin hedging - - C.2 trading transactions 21 333 - Electricity TWh 2.555 0.801 0,044 23 281 - Electricity TWh 0 0 -11 - Natural gas TWh 0.250 -2 63 Total derivatives on commodities 21 333
(*) Net receivables (+) or payables (-) recognised in the balance sheet following fair-value valuation of derivatives (**) Fair value adjustment of derivatives progressively recognised in the income statement from the date of execution of the contract until the reporting date.
Competition risk – revenue maximisation The Group operates in sectors that, in recent years, have undergone a major process of liberalization and the development of organized markets. This has entailed an increase in competitive pressure, due to the need to compete with other national and international producers and traders. In addition to changes in market structure, some businesses are subject to ever-increasing reduced margins, partly because of new tax and technological regulations that have changed competitiveness of some solutions over time, such as district heating. The Group operates in business sectors with a regulated tariff scheme, for which the Regulatory Authority is responsible for defining a normative framework with a direct impact on the profitability of the sector, with an impact on operations and results.
In addition, some businesses are characterized in some sectors by the risk of customer concentration. There are, in actual fact, some strategic customers who are relevant with some specific businesses as to the characteristics of their infrastructures. The Group operates in businesses for which there is a risk linked to the outcome of public tenders and for which a strategy focused on costing has been adopted in order to make an increasingly competitive offer. As a general rule, in the face of growing competition in some markets, the LGH Group, has strengthened its commitment to developing customer-approaching strategies, by assessing the various possibilities in terms of increasing standards of quality and service and potential expansion of the offer. In addition, where possible, the Group is committed to putting in place sales policies that are focused on reducing the risk by extending its business target customer base. A series of measures have been put in place at a preventive level (such as customer satisfaction surveys that had been conducted before for other businesses) and at a contract renewal level, by developing management services aimed at acquiring customer loyalty. Each individual business in the Group also performs an important activity entailing the supervision of relations with national and local authorities, which includes, thanks to the support of renowned independent consultants, active confrontation with institutions, professional associations and the Authority.
45
Environmental risk The Group is exposed to risks relating to external events and the environment, with particular reference to the energy sales sectors, ICT and waste brokerage/disposal, in addition to those subjected to the bidding procedure (e.g. U.I.). Exposure to risks relating the external events and the environment is mitigated by taking out insurance policies and by adopting risk prevention, protection and monitoring measures. The Group is exposed to risks associated with end-year consumption estimates, applicable rates and estimates as a result of the application of uncertain regulatory provisions. It is also exposed to the risk associated with final hedging estimates and post-closure management of final waste disposal facilities. The companies involved are therefore required to obtain duly sworn statements issued by independent experts, which must be verified at each reporting date. Credit risk Exposure to credit risk is predominantly related to the commercial activities carried out by the Group. In order to control this risk, the operational management of which is delegated to the credit management function of the holding company and the corresponding functions of some operating companies, a credit-standing assessment activity has been implemented in recent years for certain types of customers. The Group has currently no insurance policies hedging the risk of insolvency of its trade receivables, as it considers that the methods and procedures adopted for credit recovery make the insurance costs too high compared to the resulting economic benefits.
Credit exposure towards customers is therefore controlled by an improvement of the Group’s commercial and customer credit-granting policies and credit recovery, which in the previous years had led to a reduction of outstanding receivables. In some cases, customers are required to issue guarantees to cover the risk of default.
The Group also set up a dedicated provision for bad debts of an amount that is deemed adequate to cover potential future losses.
The credit risk associated with the Group’s other financial assets that include cash and cash equivalents and financial assets held for sale does not exceed the book value recognised for these assets in the event of default by the counterparty, which are generally a leading banking institutions. Interest rate risk The Group’s main financial instruments, other than derivatives, comprise short/medium/long-term bank loans, leases, and demand and short-term bank deposits. The main aim of these financial instruments is to fund the Group’s operations. The Group’s exposure to the interest rate risk mainly arises from the volatility of financial expenses related to debt bearing interest at a floating rate. The management policy of the risk associated with interest rates aims at limiting their volatility, primarily through the identification of a balanced mix of fixed interest and floating rate loans, and also by using hedging instruments that mitigate the effects of interest rate fluctuations. At June 30, 2017, the structure of loans and financial leases granted to the Group by banks and other lenders was as illustrated in the statements below.
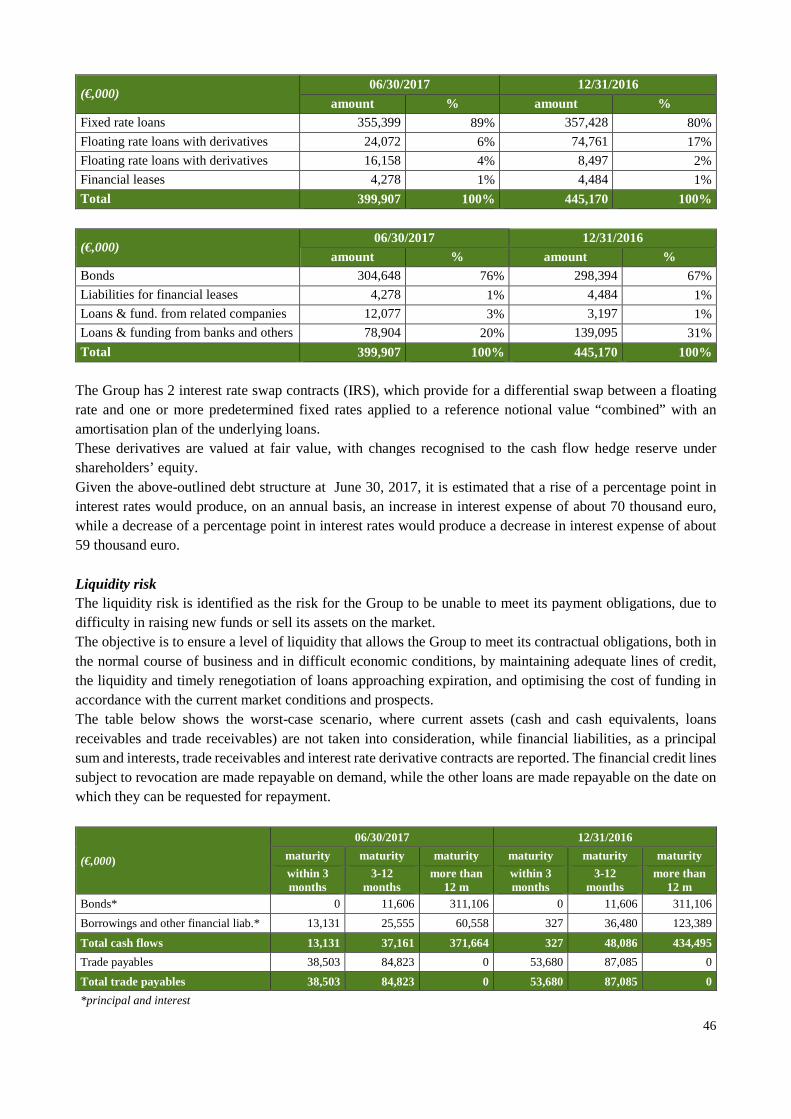
46
(€,000) 06/30/2017 12/31/2016
amount % amount % Fixed rate loans 355,399 89% 357,428 80%
Floating rate loans with derivatives 24,072 6% 74,761 17%
Floating rate loans with derivatives 16,158 4% 8,497 2%
Financial leases 4,278 1% 4,484 1%
Total 399,907 100% 445,170 100%
(€,000) 06/30/2017 12/31/2016
amount % amount % Bonds 304,648 76% 298,394 67%
Liabilities for financial leases 4,278 1% 4,484 1%
Loans & fund. from related companies 12,077 3% 3,197 1%
Loans & funding from banks and others 78,904 20% 139,095 31%
Total 399,907 100% 445,170 100% The Group has 2 interest rate swap contracts (IRS), which provide for a differential swap between a floating rate and one or more predetermined fixed rates applied to a reference notional value “combined” with an amortisation plan of the underlying loans. These derivatives are valued at fair value, with changes recognised to the cash flow hedge reserve under shareholders’ equity. Given the above-outlined debt structure at June 30, 2017, it is estimated that a rise of a percentage point in interest rates would produce, on an annual basis, an increase in interest expense of about 70 thousand euro, while a decrease of a percentage point in interest rates would produce a decrease in interest expense of about 59 thousand euro. Liquidity risk The liquidity risk is identified as the risk for the Group to be unable to meet its payment obligations, due to difficulty in raising new funds or sell its assets on the market. The objective is to ensure a level of liquidity that allows the Group to meet its contractual obligations, both in the normal course of business and in difficult economic conditions, by maintaining adequate lines of credit, the liquidity and timely renegotiation of loans approaching expiration, and optimising the cost of funding in accordance with the current market conditions and prospects. The table below shows the worst-case scenario, where current assets (cash and cash equivalents, loans receivables and trade receivables) are not taken into consideration, while financial liabilities, as a principal sum and interests, trade receivables and interest rate derivative contracts are reported. The financial credit lines subject to revocation are made repayable on demand, while the other loans are made repayable on the date on which they can be requested for repayment.
(€,000)
06/30/2017 12/31/2016
maturity maturity maturity maturity maturity maturity
within 3 months
3-12 months
more than 12 m
within 3 months
3-12 months
more than 12 m
Bonds* 0 11,606 311,106 0 11,606 311,106
Borrowings and other financial liab.* 13,131 25,555 60,558 327 36,480 123,389
Total cash flows 13,131 37,161 371,664 327 48,086 434,495
Trade payables 38,503 84,823 0 53,680 87,085 0
Total trade payables 38,503 84,823 0 53,680 87,085 0
*principal and interest
47
In order to ensure sufficient liquidity to cover financial commitments for at least the next two years (time horizon of the above worst-case scenario), at June 30, 2017, the Group had 15 million euro cash and cash equivalents, consisting of bank and postal accounts balance in the positive. Moreover, LGH entered into a dedicated service agreement with the parent A2A, thereby LGH has the possibility of obtaining short and/or long-term funding, under the cash pooling scheme, by through intergroup loans. At the end of June this account was in the negative for 12 million euro.
At June 30, 2017, the Group was characterised by a predominantly medium/long-term debt structure: 92% of loans expiring after one year and about 79% was represented by bonds repayable at the end of 2018. The average residual duration of loans is 3 years and 8 months, and 0.1% of borrowings expire beyond 5 years.
Default risk and covenants The risk lies in the possibility that executed financing contracts contain clauses that provide for the right of the lender to request early repayment of the loan when certain events occur, thus generating a potential liquidity risk. The 304.6 million euro bonded loan is not secured by collateral and provides, throughout its duration, a set of clauses in line with international practice, that impose certain constraints, including that of taking out new loans and distribute dividends when the consolidated EBITDA to gross financial expenses ratio goes below 2.50. The main clauses envisage the commitment by the Group to provide equal treatment of bonds issued with respect to other unsecured bonds (pari passu) and the commitment from bondholders not to provide better guarantees and/or privileges on its assets (negative pledge) to other subsequent lenders of the same status. The current loan taken out by Linea Energia with Unicredit is secured by collateral on the company’s real estate and facilities and, for 2017, it provides for the obligation to keep the ratio of the principal amount of the loan disbursed and not yet repaid to equity (including deferred shareholders’ loans) equal to or greater than 1.90. The EIB loan is partly secured by a bank guarantee issued by SACE and envisages the obligation on the part of the LGH Group to maintain a public rating exceeding BB+, if assigned by Standard and Poor’s Financial Services LLCo Fitch Ratings Limited, or above Ba1, if assigned by Moody’s Investors Service INC. The half-yearly financial statements closing on June 30, 2017 comply with all the above constraints and covenants. It should be noted that at the end of June the loan under the Lomellina Energia project was repaid in advance, so the contractual constraints and covenants shown in previous financial statements no longer exist. This entailed the need to terminate in advance the derivatives associated with the loan by paying the related 3,156 thousand euro negative change in the mark-to-market value. Overall, the above transaction resulted in 3,052 thousand euro financial expense recognised in the first half year of 2017 and €2,510 thousand euro in the whole 2017 financial year, compare to what would be the normal depreciation of the loan and derivatives.
OTHER DISCLOSURES
TRANSACTIONS WITH RELATED PARTIES Transactions between LGH S.p.A. and its related parties and associates, are detailed in the notes to the consolidated financial statements (Note 36).
48
TREASURY SHARES Pursuant to art. 2428, subsections 3 and 4, of the Civil Code, in 2016 the Parent did not hold nor purchase or sell any shares or stakes of controlling companies through trust companies or nominees.
LEGAL CLAIMS At a Group level the following claims are in progress:
- Following the audit performed by the Electricity and Gas Authority in July 2012 at the Parona premises, the Authority issued a resolution, in which the actual amount of net incentivized energy was contested. The Company challenged this resolution at the Lombardy Regional Administrative Court and lodged an appeal that was rejected in April 2014. Despite a further appeal was filed with the Council of State, the decision issued in December 2014 confirmed the first-instance judgement. Given the above resolution, in December 2013, the Electricity Equalisation Fund (CCSE) sent the Company formal notice to pay by the end of January 2014. The Company totally contested the decision that determined the sum requested by the CCSE and on January 30, 2014 lodged an appeal with Lombardy Regional Administrative Court (TAR), which, with judgement of December 15, 2015, stated that it had no jurisdiction in the matter and referred the case to ordinary administrative judge. On March 11, 2016, the appeal with the State Council proposed by the Energy and Environmental Service Fund (CSEA, the new name of the CCSE) was served following the provisions of the 2016 Stability Law, in order to obtain the annulment of the judgment of the Regional Administrative Court to the extent that the Court declined jurisdiction in favour of the administrative judge.
- In November 2011, Gestore Servizi Energetici S.p.A.(GSE) sent the subsidiary Lomellina Energia S.r.l. two communications concerning the two production lines, informing it, with no justification, that it had replaced the criterion for calculating discounted energy for the purpose of awarding green certificates, as provided by law, agreed on previously with the Company and applied as from 2007 production, with due issuance, collection and simultaneous payment of the green certificates requested by Lomellina Energia. This change in the criterion, applied prudentially by the Company as from 2011, led to a reduction in the number of green certificates due to it. Even the duration of the incentives for the non-biodegradable portion of line 1 waste declared by GSE in the aforesaid communications was shorter than that prescribed by law. In order to protect its rights, Lomellina Energia lodged an appeal with the Lazio Regional Administrative Court against GSE’s measures, the aim being to have them declared cancelled and receive payment of amounts due. The cautionary appeal for suspension of the measures was rejected by the Regional Administrative Court. Following the appeal against these orders, the Council of State referred the matter to the Lazio Regional Administrative Court to decide on the merits, and a hearing was held in February 2013. On April 15, 2013 the Lazio Regional Administrative Court published its judgements on the two production lines, as follows:
• for line 1, the Court upheld Lomellina Energia’s right to receive incentives for the portion of production from non-biodegradable waste up until January 19, 2014;
• for line 2, the Court rejected the company’s requests. The company lodged an appeal with the State Council which, in March 2016, issued a favourable judgment and recognised the company’s submissions. It is worth noting that the company, pending the final resolution of the dispute, in 2011 prudentially entered in the accounts only the green certificates for the electricity surplus fed into the grid from line 2.
49
In February 2017, the Company managed to secure a meeting with GSE representatives for a clarification on the scenarios related to the State Council judgements on Green Certificates; said meeting confirmed the intention of the opposite party to apply the judgements strictly and hence as favourably as possible for the Company. During the meeting the parties also discussed on the probability of reaching an agreement also with CSEA in order to make a transaction involving all three parties and finally settle all the pending issues.
- On 30/10/2015, the Tax Authority and Provincial Police served a Complaint Notice to Linea Ambiente for the non-payment of the difference of 1,861 thousand euro as special fee for the feed-in of solid urban waste into the landfill, plus 7,433 thousand euro for penalties and accrued interest, in accordance with the Council of State judgement no. 5242/2014. At the recording stage already, the Company highlighted that the reference judgement did not apply to the case in point as it could not be invoked beyond the case decided. Moreover, it is a mere interpretation of the applicable law challenged by other jurisprudential guidelines taken by the State Council in 2012. The unlawfulness of the alleged sanction was also challenged in that it was not deemed configurable with the omitted and unfaithful recording of the conferral transactions not with the activity of abusive landfill, and Linea Ambiente cannot, however, be regarded as the author of the alleged infringement. On November 17, 2016, the Company received the notice of assessment by the Puglia Regional Authority, which contested the above arguments and increased the amount of sanctions and interest to 8,303 thousand euro. In view of the above and the fact that the manager of the final storage company manager is a tax-payer with the obligation to recover from the companies that have disposed of waste into the landfill, the Company has promptly initiated all the procedures required to assert its reasons and, as things currently stand, it considers as merely potential the risk of possible surrendering and liability. It is worth noting that on January 23, 2017, the Company filed a memo, requesting the cancellation of the notice of assessment, and it is now awaiting the response by the Regional Authority.
50
SIGNIFICANT EVENTS OCCURRING AFTER JUNE 30, 2017 On the date of preparation of this document, no events of significance have occurred since the closing of the financial year, except for those detailed above under the Legal Claims.
AUDIT OF THE HALF -YEAR CONDENSED CONSOLIDATED
FINANCIAL STATEMENTS
The Group’s half-year condensed consolidated financial statements is subject to a limited review by independent auditors Ernst & Young S.p.A.in accordance with the assignment approved by the general assembly at the shareholders’ meeting and effective until 2020.
51

52
III. CONSOLIDATED FINANCIAL STATEMENTS
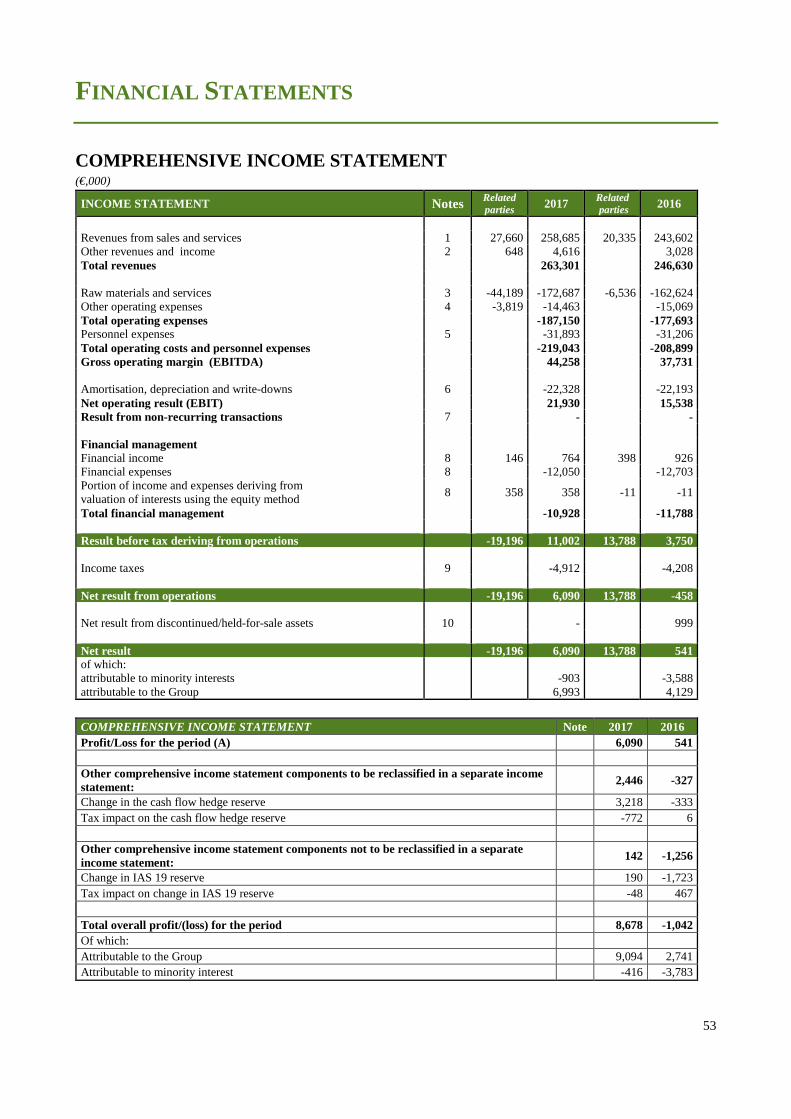
53
FINANCIAL STATEMENTS
COMPREHENSIVE INCOME STATEMENT
(€,000)
INCOME STATEMENT Notes Related parties 2017 Related
parties 2016
Revenues from sales and services 1 27,660 258,685 20,335 243,602 Other revenues and income 2 648 4,616 3,028 Total revenues 263,301 246,630 Raw materials and services 3 -44,189 -172,687 -6,536 -162,624 Other operating expenses 4 -3,819 -14,463 -15,069 Total operating expenses -187,150 -177,693 Personnel expenses 5 -31,893 -31,206 Total operating costs and personnel expenses -219,043 -208,899 Gross operating margin (EBITDA) 44,258 37,731 Amortisation, depreciation and write-downs 6 -22,328 -22,193 Net operating result (EBIT) 21,930 15,538 Result from non-recurring transactions 7 - - Financial management Financial income 8 146 764 398 926 Financial expenses 8 -12,050 -12,703 Portion of income and expenses deriving from valuation of interests using the equity method
8 358 358 -11 -11
Total financial management -10,928 -11,788 Result before tax deriving from operations -19,196 11,002 13,788 3,750 Income taxes 9 -4,912 -4,208 Net result from operations -19,196 6,090 13,788 -458 Net result from discontinued/held-for-sale assets 10 - 999 Net result -19,196 6,090 13,788 541 of which: attributable to minority interests -903 -3,588 attributable to the Group 6,993 4,129
COMPREHENSIVE INCOME STATEMENT Note 2017 2016 Profit/Loss for the period (A) 6,090 541 Other comprehensive income statement components to be reclassified in a separate income statement: 2,446 -327
Change in the cash flow hedge reserve 3,218 -333 Tax impact on the cash flow hedge reserve -772 6 Other comprehensive income statement components not to be reclassified in a separate income statement: 142 -1,256
Change in IAS 19 reserve 190 -1,723 Tax impact on change in IAS 19 reserve -48 467 Total overall profit/(loss) for the period 8,678 -1,042 Of which: Attributable to the Group 9,094 2,741 Attributable to minority interest -416 -3,783
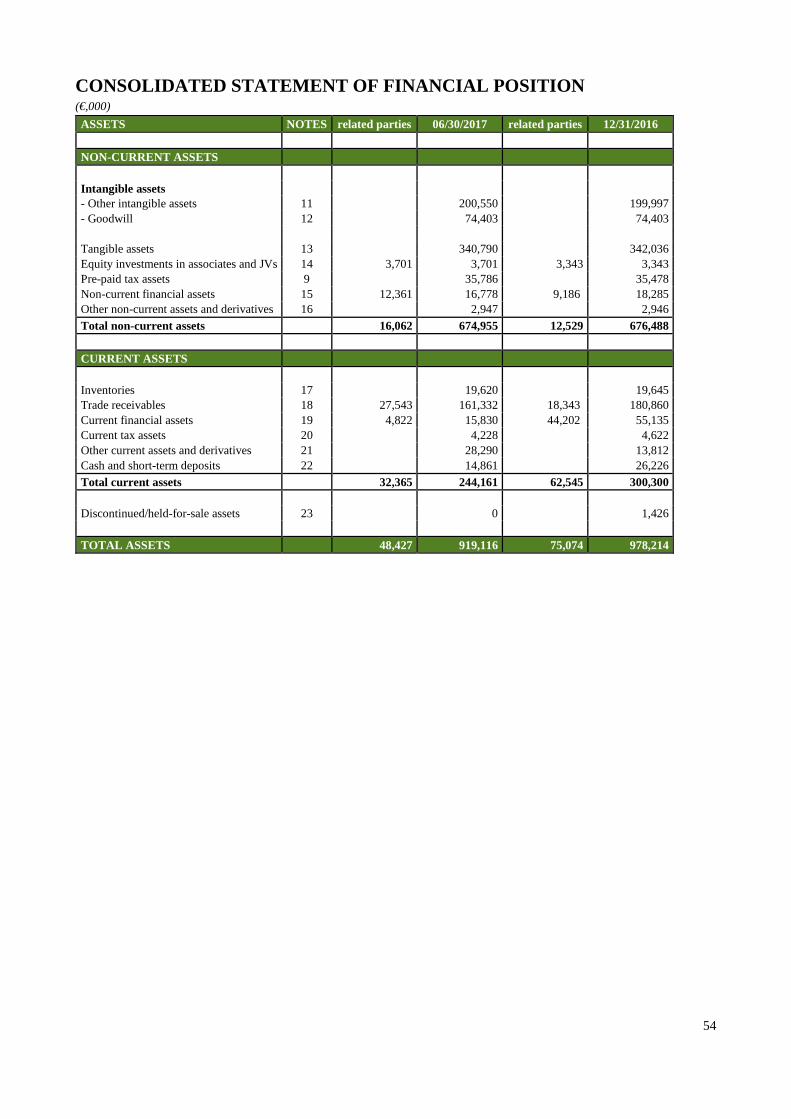
54
CONSOLIDATED STATEMENT OF FINANCIAL POSITION (€,000) ASSETS NOTES related parties 06/30/2017 related parties 12/31/2016
NON-CURRENT ASSETS Intangible assets - Other intangible assets 11 200,550 199,997 - Goodwill 12 74,403 74,403 Tangible assets 13 340,790 342,036 Equity investments in associates and JVs 14 3,701 3,701 3,343 3,343 Pre-paid tax assets 9 35,786 35,478 Non-current financial assets 15 12,361 16,778 9,186 18,285 Other non-current assets and derivatives 16 2,947 2,946
Total non-current assets 16,062 674,955 12,529 676,488
CURRENT ASSETS Inventories 17 19,620 19,645 Trade receivables 18 27,543 161,332 18,343 180,860 Current financial assets 19 4,822 15,830 44,202 55,135 Current tax assets 20 4,228 4,622 Other current assets and derivatives 21 28,290 13,812 Cash and short-term deposits 22 14,861 26,226
Total current assets 32,365 244,161 62,545 300,300 Discontinued/held-for-sale assets 23 0 1,426
TOTAL ASSETS 48,427 919,116 75,074 978,214
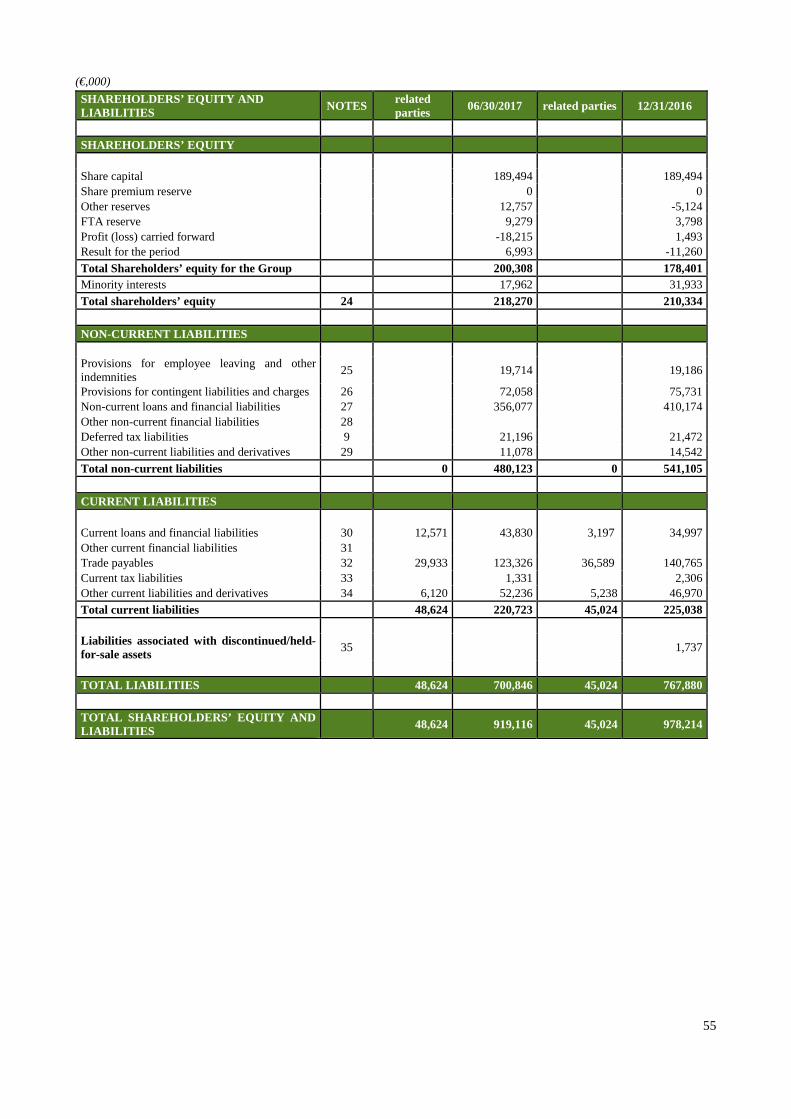
55
(€,000) SHAREHOLDERS’ EQUITY AND LIABILITIES NOTES related
parties 06/30/2017 related parties 12/31/2016
SHAREHOLDERS’ EQUITY Share capital 189,494 189,494 Share premium reserve 0 0 Other reserves 12,757 -5,124 FTA reserve 9,279 3,798 Profit (loss) carried forward -18,215 1,493 Result for the period 6,993 -11,260
Total Shareholders’ equity for the Group 200,308 178,401 Minority interests 17,962 31,933
Total shareholders’ equity 24 218,270 210,334
NON-CURRENT LIABILITIES Provisions for employee leaving and other indemnities
25 19,714 19,186
Provisions for contingent liabilities and charges 26 72,058 75,731 Non-current loans and financial liabilities 27 356,077 410,174 Other non-current financial liabilities 28 Deferred tax liabilities 9 21,196 21,472 Other non-current liabilities and derivatives 29 11,078 14,542
Total non-current liabilities 0 480,123 0 541,105
CURRENT LIABILITIES Current loans and financial liabilities 30 12,571 43,830 3,197 34,997 Other current financial liabilities 31 Trade payables 32 29,933 123,326 36,589 140,765 Current tax liabilities 33 1,331 2,306 Other current liabilities and derivatives 34 6,120 52,236 5,238 46,970 Total current liabilities 48,624 220,723 45,024 225,038 Liabilities associated with discontinued/held-for-sale assets
35 1,737
TOTAL LIABILITIES 48,624 700,846 45,024 767,880 TOTAL SHAREHOLDERS’ EQUITY AND LIABILITIES 48,624 919,116 45,024 978,214
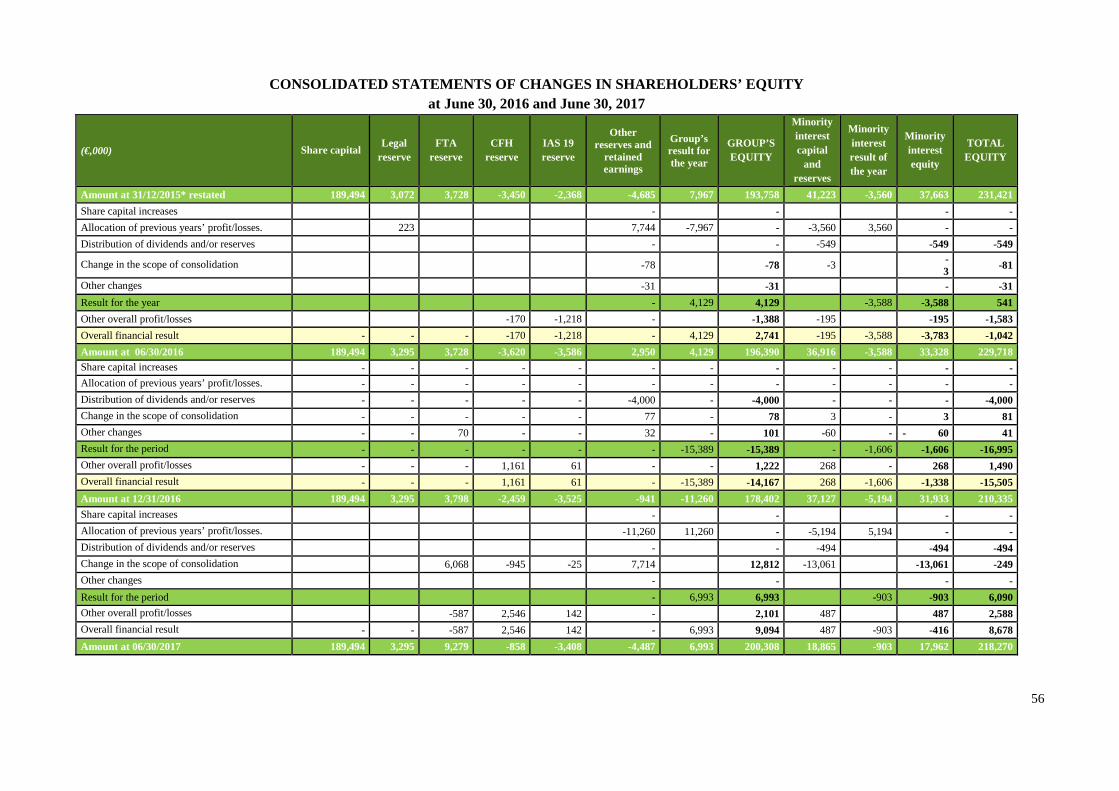
56
CONSOLIDATED STATEMENTS OF CHANGES IN SHAREHOLDERS’ EQUITY at June 30, 2016 and June 30, 2017
(€,000) Share capital Legal
reserve FTA
reserve CFH
reserve IAS 19 reserve
Other reserves and
retained earnings
Group’s result for the year
GROUP’S EQUITY
Minority interest capital
and reserves
Minority interest result of the year
Minority interest equity
TOTAL EQUITY
Amount at 31/12/2015* restated 189,494 3,072 3,728 -3,450 -2,368 -4,685 7,967 193,758 41,223 -3,560 37,663 231,421
Share capital increases - - - -
Allocation of previous years’ profit/losses. 223 7,744 -7,967 - -3,560 3,560 - -
Distribution of dividends and/or reserves - - -549 -549 -549
Change in the scope of consolidation -78 -78 -3 - 3
-81
Other changes -31 -31 - -31
Result for the year - 4,129 4,129 -3,588 -3,588 541
Other overall profit/losses -170 -1,218 - -1,388 -195 -195 -1,583
Overall financial result - - - -170 -1,218 - 4,129 2,741 -195 -3,588 -3,783 -1,042
Amount at 06/30/2016 189,494 3,295 3,728 -3,620 -3,586 2,950 4,129 196,390 36,916 -3,588 33,328 229,718 Share capital increases - - - - - - - - - - - - Allocation of previous years’ profit/losses. - - - - - - - - - - - -
Distribution of dividends and/or reserves - - - - - -4,000 - -4,000 - - - -4,000
Change in the scope of consolidation - - - - - 77 - 78 3 - 3 81
Other changes - - 70 - - 32 - 101 -60 - - 60 41
Result for the period - - - - - - -15,389 -15,389 - -1,606 -1,606 -16,995
Other overall profit/losses - - - 1,161 61 - - 1,222 268 - 268 1,490
Overall financial result - - - 1,161 61 - -15,389 -14,167 268 -1,606 -1,338 -15,505
Amount at 12/31/2016 189,494 3,295 3,798 -2,459 -3,525 -941 -11,260 178,402 37,127 -5,194 31,933 210,335
Share capital increases - - - -
Allocation of previous years’ profit/losses. -11,260 11,260 - -5,194 5,194 - -
Distribution of dividends and/or reserves - - -494 -494 -494
Change in the scope of consolidation 6,068 -945 -25 7,714 12,812 -13,061 -13,061 -249
Other changes - - - -
Result for the period - 6,993 6,993 -903 -903 6,090
Other overall profit/losses -587 2,546 142 - 2,101 487 487 2,588
Overall financial result - - -587 2,546 142 - 6,993 9,094 487 -903 -416 8,678
Amount at 06/30/2017 189,494 3,295 9,279 -858 -3,408 -4,487 6,993 200,308 18,865 -903 17,962 218,270
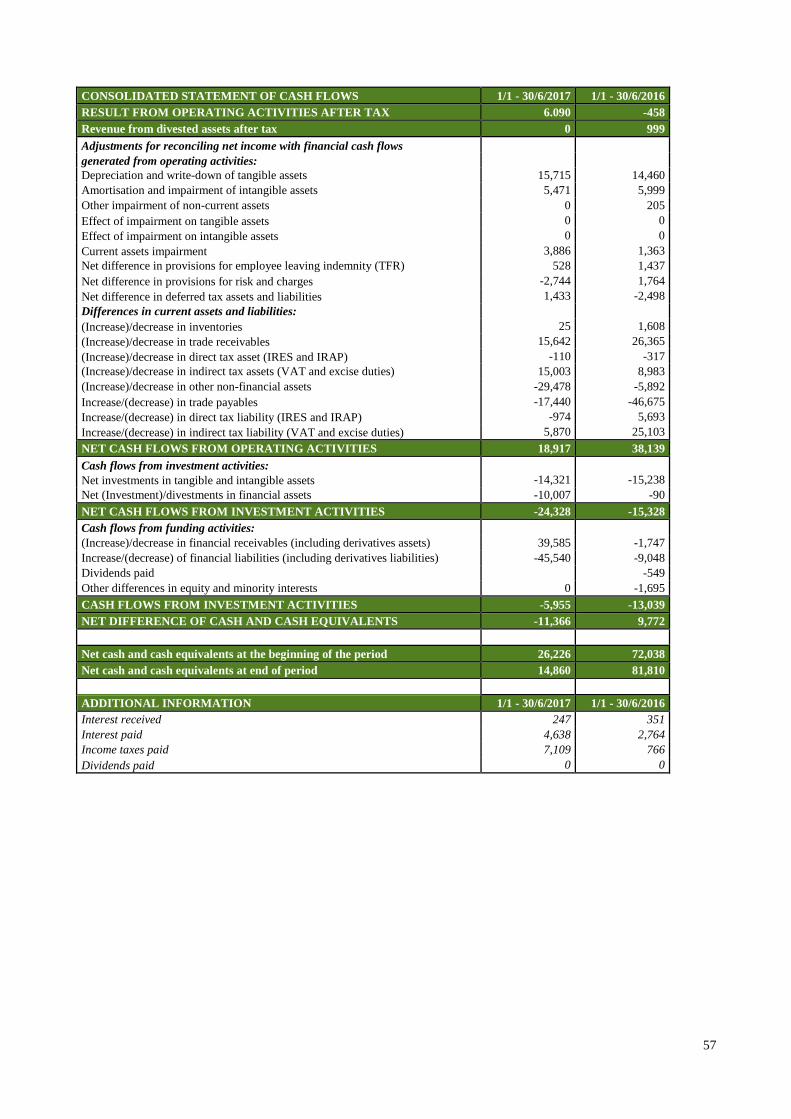
57
CONSOLIDATED STATEMENT OF CASH FLOWS 1/1 - 30/6/2017 1/1 - 30/6/2016 RESULT FROM OPERATING ACTIVITIES AFTER TAX 6.090 -458 Revenue from divested assets after tax 0 999 Adjustments for reconciling net income with financial cash flows generated from operating activities: Depreciation and write-down of tangible assets 15,715 14,460 Amortisation and impairment of intangible assets 5,471 5,999 Other impairment of non-current assets 0 205 Effect of impairment on tangible assets 0 0 Effect of impairment on intangible assets 0 0 Current assets impairment 3,886 1,363 Net difference in provisions for employee leaving indemnity (TFR) 528 1,437 Net difference in provisions for risk and charges -2,744 1,764 Net difference in deferred tax assets and liabilities 1,433 -2,498 Differences in current assets and liabilities: (Increase)/decrease in inventories 25 1,608 (Increase)/decrease in trade receivables 15,642 26,365 (Increase)/decrease in direct tax asset (IRES and IRAP) -110 -317 (Increase)/decrease in indirect tax assets (VAT and excise duties) 15,003 8,983 (Increase)/decrease in other non-financial assets -29,478 -5,892 Increase/(decrease) in trade payables -17,440 -46,675 Increase/(decrease) in direct tax liability (IRES and IRAP) -974 5,693 Increase/(decrease) in indirect tax liability (VAT and excise duties) 5,870 25,103
NET CASH FLOWS FROM OPERATING ACTIVITIES 18,917 38,139 Cash flows from investment activities: Net investments in tangible and intangible assets -14,321 -15,238 Net (Investment)/divestments in financial assets -10,007 -90
NET CASH FLOWS FROM INVESTMENT ACTIVITIES -24,328 -15,328 Cash flows from funding activities: (Increase)/decrease in financial receivables (including derivatives assets) 39,585 -1,747 Increase/(decrease) of financial liabilities (including derivatives liabilities) -45,540 -9,048 Dividends paid -549 Other differences in equity and minority interests 0 -1,695
CASH FLOWS FROM INVESTMENT ACTIVITIES -5,955 -13,039 NET DIFFERENCE OF CASH AND CASH EQUIVALENTS -11,366 9,772
Net cash and cash equivalents at the beginning of the period 26,226 72,038 Net cash and cash equivalents at end of period 14,860 81,810
ADDITIONAL INFORMATION 1/1 - 30/6/2017 1/1 - 30/6/2016 Interest received 247 351 Interest paid 4,638 2,764 Income taxes paid 7,109 766 Dividends paid 0 0
58
EXPLANATORY NOTES ACCOUNTING POLICY
1. GENERAL INFORMATION LGH S.p.A. is a company incorporated under Italian law. LGH S.p.A. and its subsidiaries (the “Group”) only operate in the domestic market. The Group mainly operates in the following sectors: • the production, sale and distribution of electricity; • the sale and distribution of gas; • the production, distribution and sale of heat through district heating networks; • waste management (from collection and street sweeping to disposal) and the construction and management of integrated waste disposal plants and systems; LGH S.p.A. is subject to the management and coordination of A2A S.p.A. The Half-Yearly Financial Report (hereinafter referred to as “Half-Yearly Report”) of the Group at June 30, 2017, is expressed in euro, which is also the functional currency of the economies in which the Group operates. The Group’s Half-Yearly Report was prepared in accordance with the International Financial Reporting Standards (IFRS) issued by the International Accounting Standard Board (IASB) and endorsed by the European Union, namely IAS 34. IFRS means all the revised international accounting standards (IAS) and all the interpretations of the International Financial Reporting Interpretations Committee (IFRIC), formerly known as the Standing Interpretation Committee (SIC). In preparing the Half-Yearly Report, the same principles used in the preparation of the consolidated annual financial report at December 31, 2016 were applied, except for the principles and interpretations adopted for the first time in the year beginning January 1, 2017 and described in detail in the paragraph below “Changes in international accounting standards”. This Half-Yearly Report at June 20, 2017 was approved by the Board of Directors on July 28, 2017, which authorized its publication.
2. FINANCIAL STATEMENTS LAYOUT The Group elected to adopt a format for the balance sheet and financial position, which presents assets and liabilities divided into current and non-current, according to subsection 60 et seq. of IAS 1. The income statement uses the low-balance method with individual entries analysed by type, which is deemed the most representative form compared to so-called presentation by cost allocation. The form elected is consistent with the method of presentation adopted by major competitors and is in line with international practice. For a clear and quick identification of the results deriving from non-recurring transactions referring to operating activities during the year, making a distinction between results from discontinued operations, the income statement shows specific items “Result from non-recurring transactions” and “Result from other equity investments (AFS)”. In particular, it is worth noting that the item “Result from non-recurring transactions” is intended to accept capital gains/losses recognized following the valuation at fair value of non-current assets (or decommissioning units), classified as “held for sale” pursuant to IFRS 5, net of selling or dismissal costs,
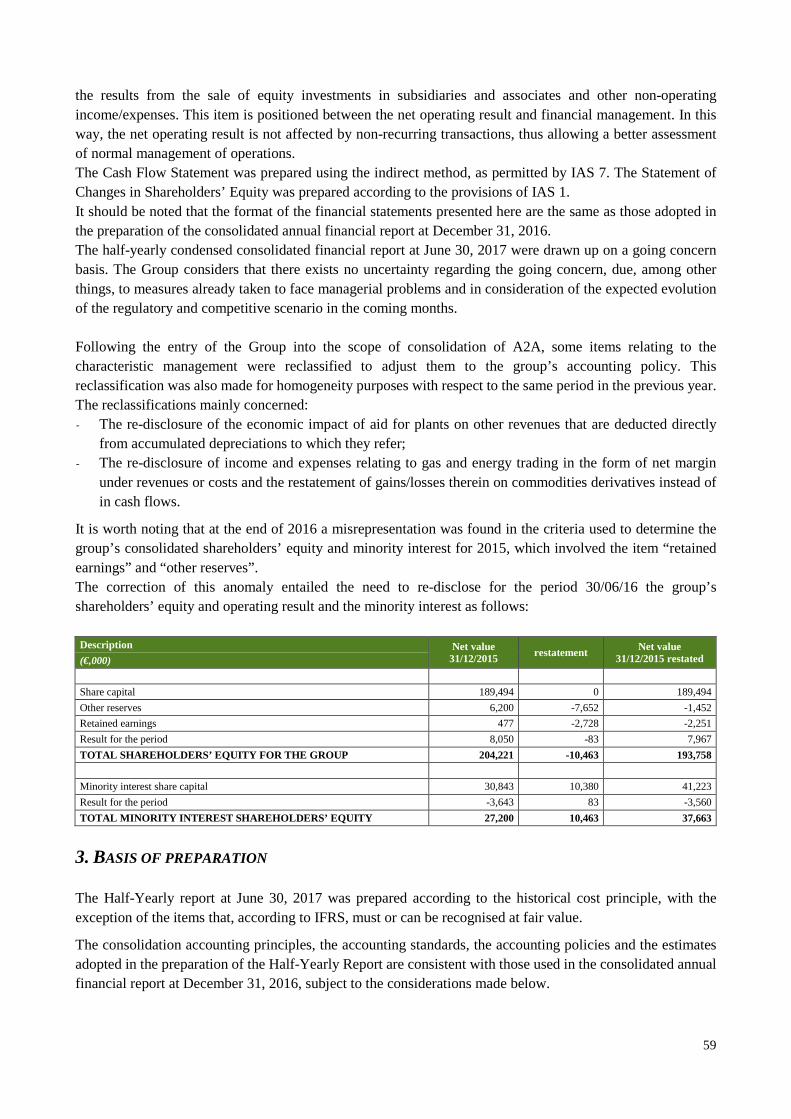
59
the results from the sale of equity investments in subsidiaries and associates and other non-operating income/expenses. This item is positioned between the net operating result and financial management. In this way, the net operating result is not affected by non-recurring transactions, thus allowing a better assessment of normal management of operations. The Cash Flow Statement was prepared using the indirect method, as permitted by IAS 7. The Statement of Changes in Shareholders’ Equity was prepared according to the provisions of IAS 1. It should be noted that the format of the financial statements presented here are the same as those adopted in the preparation of the consolidated annual financial report at December 31, 2016. The half-yearly condensed consolidated financial report at June 30, 2017 were drawn up on a going concern basis. The Group considers that there exists no uncertainty regarding the going concern, due, among other things, to measures already taken to face managerial problems and in consideration of the expected evolution of the regulatory and competitive scenario in the coming months. Following the entry of the Group into the scope of consolidation of A2A, some items relating to the characteristic management were reclassified to adjust them to the group’s accounting policy. This reclassification was also made for homogeneity purposes with respect to the same period in the previous year. The reclassifications mainly concerned: - The re-disclosure of the economic impact of aid for plants on other revenues that are deducted directly
from accumulated depreciations to which they refer; - The re-disclosure of income and expenses relating to gas and energy trading in the form of net margin
under revenues or costs and the restatement of gains/losses therein on commodities derivatives instead of in cash flows.
It is worth noting that at the end of 2016 a misrepresentation was found in the criteria used to determine the group’s consolidated shareholders’ equity and minority interest for 2015, which involved the item “retained earnings” and “other reserves”. The correction of this anomaly entailed the need to re-disclose for the period 30/06/16 the group’s shareholders’ equity and operating result and the minority interest as follows: Description Net value
31/12/2015 restatement Net value 31/12/2015 restated (€,000)
Share capital 189,494 0 189,494
Other reserves 6,200 -7,652 -1,452
Retained earnings 477 -2,728 -2,251
Result for the period 8,050 -83 7,967
TOTAL SHAREHOLDERS’ EQUITY FOR THE GROUP 204,221 -10,463 193,758
Minority interest share capital 30,843 10,380 41,223
Result for the period -3,643 83 -3,560
TOTAL MINORITY INTEREST SHAREHOLDERS’ EQUITY 27,200 10,463 37,663
3. BASIS OF PREPARATION The Half-Yearly report at June 30, 2017 was prepared according to the historical cost principle, with the exception of the items that, according to IFRS, must or can be recognised at fair value.
The consolidation accounting principles, the accounting standards, the accounting policies and the estimates adopted in the preparation of the Half-Yearly Report are consistent with those used in the consolidated annual financial report at December 31, 2016, subject to the considerations made below.

60
4. CHANGES IN INTERNATIONAL ACCOUNTING STANDARDS Accounting standards, amendments and interpretations applicable by the Group as of this financial year No standards or amendments in this financial report have been applied prior to their effective date. The accounting standards are those in force on February 28, 2017, and are effective for financial years beginning and after January 1, 2017. The standards released but not yet effective on January 1, 2017, have not been applied. As of January 1, 2017, some additions resulting from specific paragraphs of the international accounting standards already by the Group in previous years have been applied, none of which had an impact on the consolidated condensed Half-Yearly Report. The main changes are illustrated here below:
• Amendments to IAS 7 - Additional Disclosures on Financial Instruments- The amendment to this standard, which is effective for annual periods beginning on or after January 1, 2017, was released by the IASB on January 29, 2016, and requires an entity to provide information that helps investors better understand changes in the entity’s liabilities resulting from financial activities;
• Annual improvements to IFRS- Cycle 2014-2016 These improvements have been effective since February 1, 2015 and the Group adopted them for the first time in this consolidated condensed half-yearly report. They include: IFRS 12 - Disclosure of Interest in Other Entities On December 8, 2016, the IASB issued some amendments to the standards endorsed in the three-year period 2014-2016, namely IFRS 12 - Disclosure of Interest in Other Entities. The amendment to IFRS 12 requires that disclosure requirements also apply to all the cases in which the equity interests in subsidiaries, associates and joint ventures are classified under the item “Non-current assets held for sale” in accordance with IFRS 5. IAS 12 - Income taxes On January 19, 2016, the IASB issued some amendments intended to clarify how to recognise deferred tax assets concerning debt instruments measured at fair value. The amendments are effective for annual period beginning on or after January 1, 2017.
5. CONSOLIDATION PRINCIPLES AND METHODS The consolidated half-yearly financial statements comprise the half-yearly financial reports of Linea Group Holding S.p.A. and the subsidiaries at June 30, 2017, in accordance with the Group’s accounting policies. All intragroup relations and transactions, including non-realised profits resulting from relations with Group companies, have been eliminated completely. In preparing the Half-Yearly Report, assets and liabilities, revenues and expenses of the consolidated companies were taken as a whole line by line, attributing to the minority interests, in specific items under the balance sheet, cash flow statement and income statement, the portion of equity and the operating result for the period pertaining to each of them. The carrying amount of the investment in each subsidiary is written off against the corresponding portion of equity, including any adjustments to the fair value on the acquisition date; any emerging difference is treated pursuant to IFRS 3. A list of group companies at June 30, 2017 is given below:
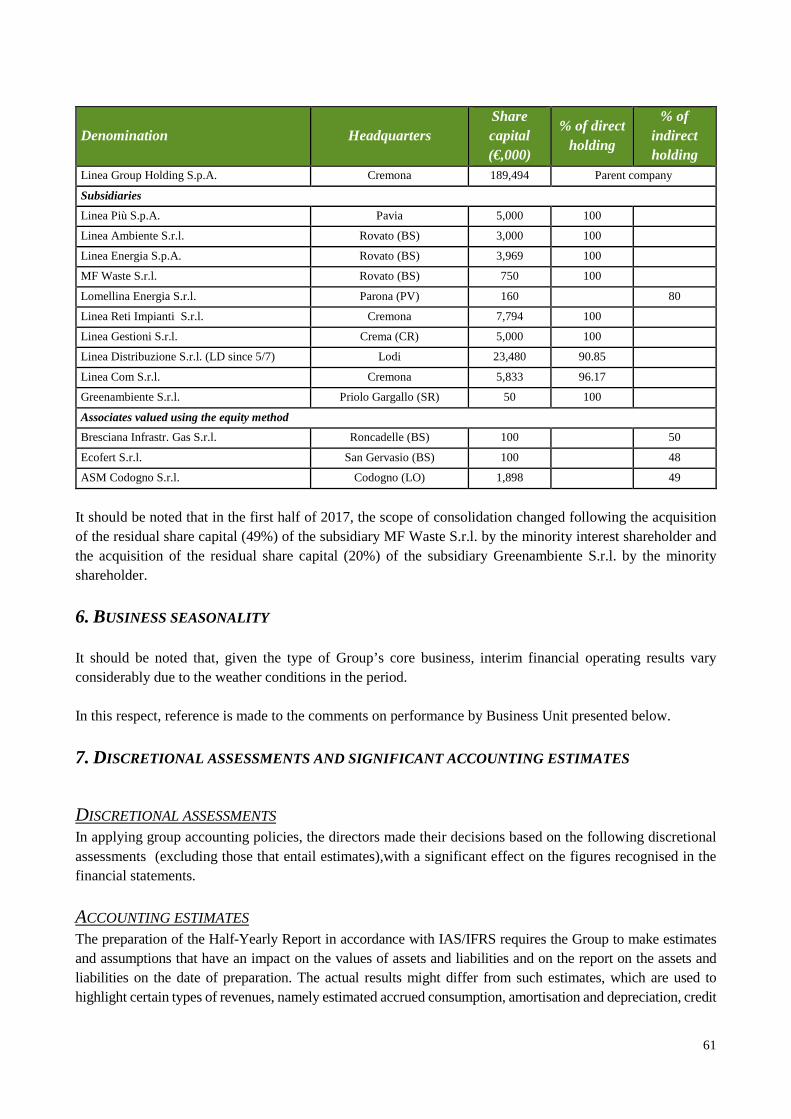
61
Denomination Headquarters Share capital (€,000)
% of direct holding
% of indirect holding
Linea Group Holding S.p.A. Cremona 189,494 Parent company
Subsidiaries
Linea Più S.p.A. Pavia 5,000 100
Linea Ambiente S.r.l. Rovato (BS) 3,000 100
Linea Energia S.p.A. Rovato (BS) 3,969 100
MF Waste S.r.l. Rovato (BS) 750 100
Lomellina Energia S.r.l. Parona (PV) 160 80
Linea Reti Impianti S.r.l. Cremona 7,794 100
Linea Gestioni S.r.l. Crema (CR) 5,000 100
Linea Distribuzione S.r.l. (LD since 5/7) Lodi 23,480 90.85
Linea Com S.r.l. Cremona 5,833 96.17
Greenambiente S.r.l. Priolo Gargallo (SR) 50 100
Associates valued using the equity method
Bresciana Infrastr. Gas S.r.l. Roncadelle (BS) 100 50
Ecofert S.r.l. San Gervasio (BS) 100 48
ASM Codogno S.r.l. Codogno (LO) 1,898 49
It should be noted that in the first half of 2017, the scope of consolidation changed following the acquisition of the residual share capital (49%) of the subsidiary MF Waste S.r.l. by the minority interest shareholder and the acquisition of the residual share capital (20%) of the subsidiary Greenambiente S.r.l. by the minority shareholder.
6. BUSINESS SEASONALITY It should be noted that, given the type of Group’s core business, interim financial operating results vary considerably due to the weather conditions in the period. In this respect, reference is made to the comments on performance by Business Unit presented below.
7. DISCRETIONAL ASSESSMENTS AND SIGNIFICANT ACCOUNTING ESTIMATES
DISCRETIONAL ASSESSMENTS In applying group accounting policies, the directors made their decisions based on the following discretional assessments (excluding those that entail estimates),with a significant effect on the figures recognised in the financial statements.
ACCOUNTING ESTIMATES
The preparation of the Half-Yearly Report in accordance with IAS/IFRS requires the Group to make estimates and assumptions that have an impact on the values of assets and liabilities and on the report on the assets and liabilities on the date of preparation. The actual results might differ from such estimates, which are used to highlight certain types of revenues, namely estimated accrued consumption, amortisation and depreciation, credit
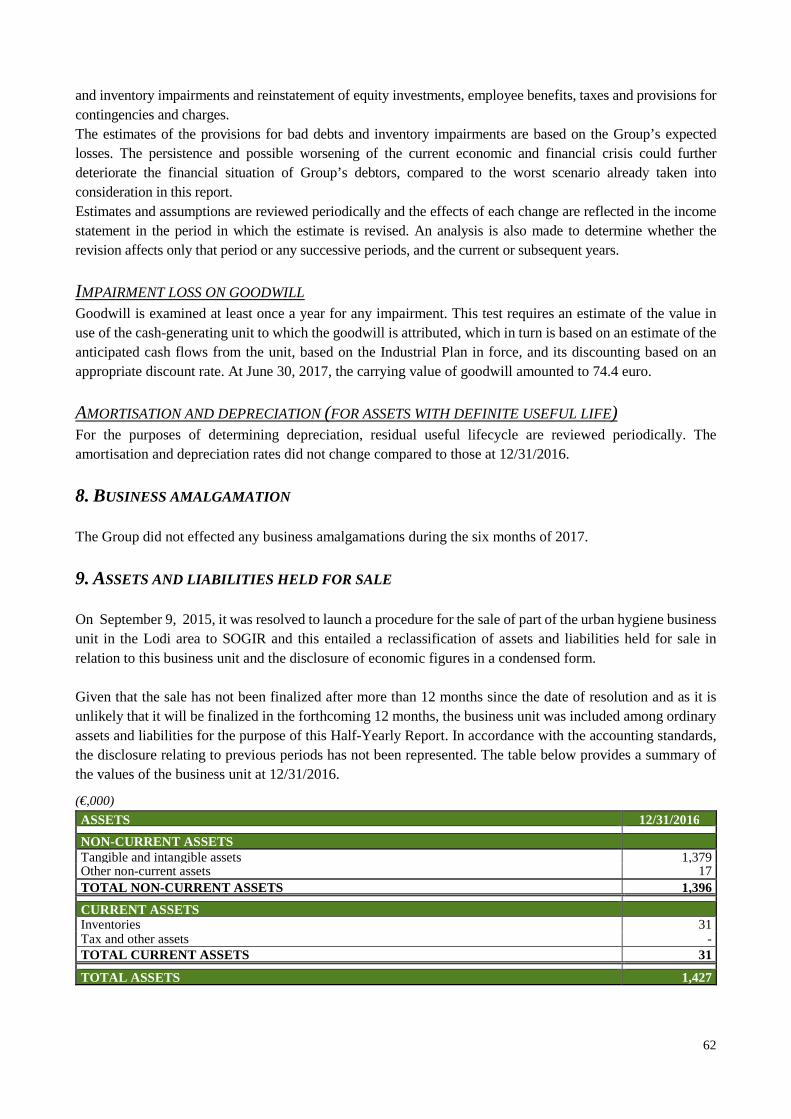
62
and inventory impairments and reinstatement of equity investments, employee benefits, taxes and provisions for contingencies and charges. The estimates of the provisions for bad debts and inventory impairments are based on the Group’s expected losses. The persistence and possible worsening of the current economic and financial crisis could further deteriorate the financial situation of Group’s debtors, compared to the worst scenario already taken into consideration in this report. Estimates and assumptions are reviewed periodically and the effects of each change are reflected in the income statement in the period in which the estimate is revised. An analysis is also made to determine whether the revision affects only that period or any successive periods, and the current or subsequent years.
IMPAIRMENT LOSS ON GOODWILL Goodwill is examined at least once a year for any impairment. This test requires an estimate of the value in use of the cash-generating unit to which the goodwill is attributed, which in turn is based on an estimate of the anticipated cash flows from the unit, based on the Industrial Plan in force, and its discounting based on an appropriate discount rate. At June 30, 2017, the carrying value of goodwill amounted to 74.4 euro.
AMORTISATION AND DEPRECIATION (FOR ASSETS WITH DEFINITE USEFUL LIFE) For the purposes of determining depreciation, residual useful lifecycle are reviewed periodically. The amortisation and depreciation rates did not change compared to those at 12/31/2016.
8. BUSINESS AMALGAMATION The Group did not effected any business amalgamations during the six months of 2017.
9. ASSETS AND LIABILITIES HELD FOR SALE On September 9, 2015, it was resolved to launch a procedure for the sale of part of the urban hygiene business unit in the Lodi area to SOGIR and this entailed a reclassification of assets and liabilities held for sale in relation to this business unit and the disclosure of economic figures in a condensed form. Given that the sale has not been finalized after more than 12 months since the date of resolution and as it is unlikely that it will be finalized in the forthcoming 12 months, the business unit was included among ordinary assets and liabilities for the purpose of this Half-Yearly Report. In accordance with the accounting standards, the disclosure relating to previous periods has not been represented. The table below provides a summary of the values of the business unit at 12/31/2016.
(€,000)
ASSETS 12/31/2016 NON-CURRENT ASSETS Tangible and intangible assets 1,379 Other non-current assets 17 TOTAL NON -CURRENT ASSETS 1,396 CURRENT ASSETS Inventories 31 Tax and other assets - TOTAL CURRENT ASSETS 31 TOTAL ASSETS 1,427

63
SHAREHOLDERS’ EQUITY AND LIABILITIES 12/31/2016 SHAREHOLDERS’ EQUITY Operating result for the period 3,663 TOTAL NET SHAREHOLDERS’ EQUITY 3,663 NON-CURRENT LIABILITIES Employee-leave indemnity (TFR) and other employee-related provisions 901 Provisions for risks and charges and liabilities for landfills - Loans and current borrowings 293 Other non-current liabilities 67 TOTAL NON-CURRENT LIABILITIES 1,261 CURRENT LIABILITIES Loans and current borrowings 103 Tax and other current liabilities 372 TOTAL CURRENT LIABILITIES 475 TOTAL LIABILITIES 1,736 TOTAL SHAREHOLDERS’ EQUITY AND LIABILITIES 5,399
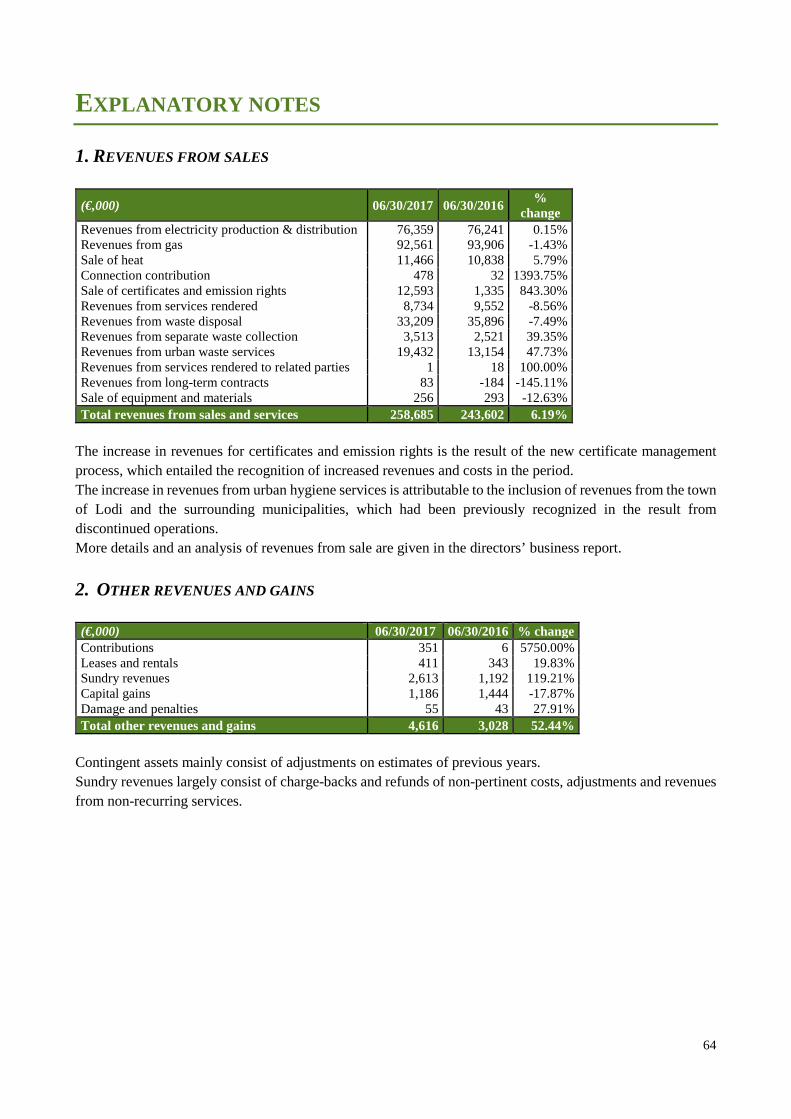
64
EXPLANATORY NOTES
1. REVENUES FROM SALES
(€,000) 06/30/2017 06/30/2016 %
change Revenues from electricity production & distribution 76,359 76,241 0.15% Revenues from gas 92,561 93,906 -1.43% Sale of heat 11,466 10,838 5.79% Connection contribution 478 32 1393.75% Sale of certificates and emission rights 12,593 1,335 843.30% Revenues from services rendered 8,734 9,552 -8.56% Revenues from waste disposal 33,209 35,896 -7.49% Revenues from separate waste collection 3,513 2,521 39.35% Revenues from urban waste services 19,432 13,154 47.73% Revenues from services rendered to related parties 1 18 100.00% Revenues from long-term contracts 83 -184 -145.11% Sale of equipment and materials 256 293 -12.63% Total revenues from sales and services 258,685 243,602 6.19%
The increase in revenues for certificates and emission rights is the result of the new certificate management process, which entailed the recognition of increased revenues and costs in the period. The increase in revenues from urban hygiene services is attributable to the inclusion of revenues from the town of Lodi and the surrounding municipalities, which had been previously recognized in the result from discontinued operations. More details and an analysis of revenues from sale are given in the directors’ business report.
2. OTHER REVENUES AND GAINS (€,000) 06/30/2017 06/30/2016 % change Contributions 351 6 5750.00% Leases and rentals 411 343 19.83% Sundry revenues 2,613 1,192 119.21% Capital gains 1,186 1,444 -17.87% Damage and penalties 55 43 27.91% Total other revenues and gains 4,616 3,028 52.44%
Contingent assets mainly consist of adjustments on estimates of previous years. Sundry revenues largely consist of charge-backs and refunds of non-pertinent costs, adjustments and revenues from non-recurring services.
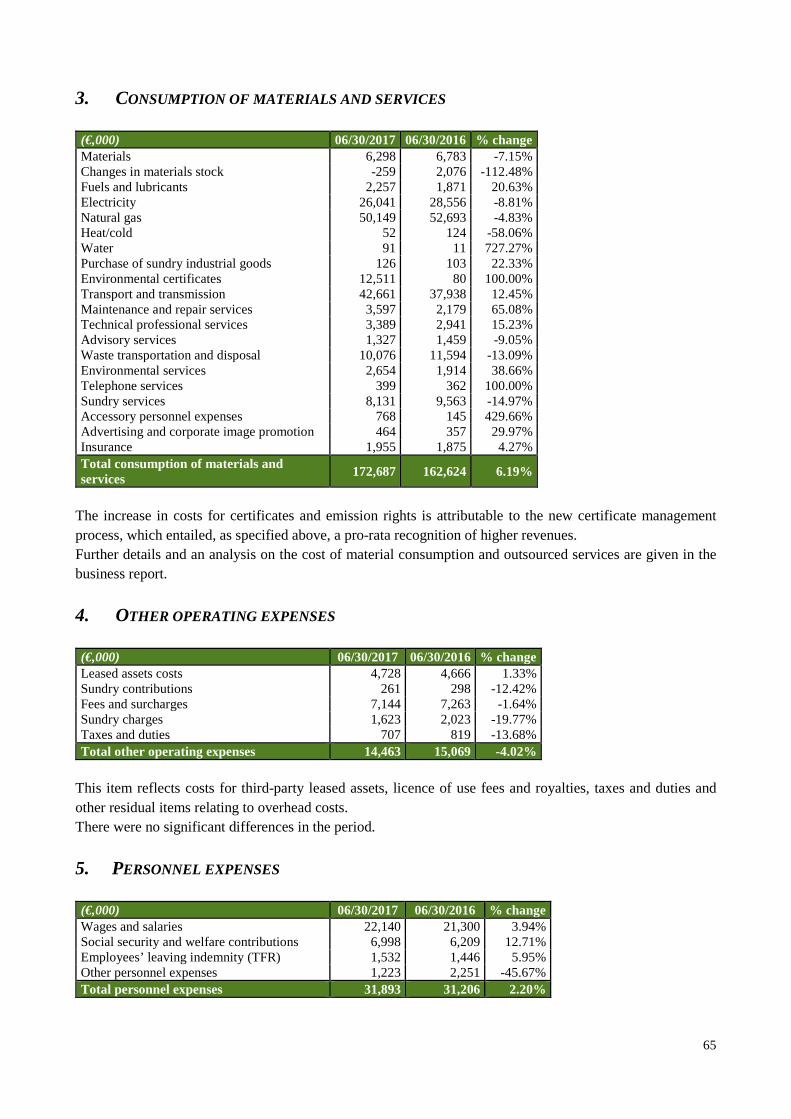
65
3. CONSUMPTION OF MATERIALS AND SERVICES (€,000) 06/30/2017 06/30/2016 % change Materials 6,298 6,783 -7.15% Changes in materials stock -259 2,076 -112.48% Fuels and lubricants 2,257 1,871 20.63% Electricity 26,041 28,556 -8.81% Natural gas 50,149 52,693 -4.83% Heat/cold 52 124 -58.06% Water 91 11 727.27% Purchase of sundry industrial goods 126 103 22.33% Environmental certificates 12,511 80 100.00% Transport and transmission 42,661 37,938 12.45% Maintenance and repair services 3,597 2,179 65.08% Technical professional services 3,389 2,941 15.23% Advisory services 1,327 1,459 -9.05% Waste transportation and disposal 10,076 11,594 -13.09% Environmental services 2,654 1,914 38.66% Telephone services 399 362 100.00% Sundry services 8,131 9,563 -14.97% Accessory personnel expenses 768 145 429.66% Advertising and corporate image promotion 464 357 29.97% Insurance 1,955 1,875 4.27% Total consumption of materials and services
172,687 162,624 6.19%
The increase in costs for certificates and emission rights is attributable to the new certificate management process, which entailed, as specified above, a pro-rata recognition of higher revenues. Further details and an analysis on the cost of material consumption and outsourced services are given in the business report.
4. OTHER OPERATING EXPENSES (€,000) 06/30/2017 06/30/2016 % change Leased assets costs 4,728 4,666 1.33% Sundry contributions 261 298 -12.42% Fees and surcharges 7,144 7,263 -1.64% Sundry charges 1,623 2,023 -19.77% Taxes and duties 707 819 -13.68% Total other operating expenses 14,463 15,069 -4.02%
This item reflects costs for third-party leased assets, licence of use fees and royalties, taxes and duties and other residual items relating to overhead costs. There were no significant differences in the period.
5. PERSONNEL EXPENSES (€,000) 06/30/2017 06/30/2016 % change Wages and salaries 22,140 21,300 3.94% Social security and welfare contributions 6,998 6,209 12.71% Employees’ leaving indemnity (TFR) 1,532 1,446 5.95% Other personnel expenses 1,223 2,251 -45.67% Total personnel expenses 31,893 31,206 2.20%

66
The increase in personnel expenses in the first six months of 2017, compared to the same period of 2016, is partly attributable to the recognition of personnel expenses relating to the business unit disclosed in 2016 as held for sale and hence not included in the disclosure of the cost. Net of this effect, there is a decline in costs, attributable to a decrease in the number of employees, as shown in the business report, to which reference is made. It should also be noted that the provision for employee leaving indemnities (TFR) and pension funds were determined using the actuarial method. The amount of employees’ benefits accrued during the year was recognised in the income statement under the relevant item, and the figurative financial charge the company would sustain if it took out a loan on the market of an amount equal to the TFR is recognised in net financial income (expenses). Actuarial profit and losses that reflect the effects of changes in the actuarial assumptions adopted are recognised in shareholders’ equity, as shown in the comprehensive income statement, taking into account the employees’ average working lives.
6. AMORTISATION, DEPRECIATION AND WRITE-DOWNS
(€,000) 06/30/2017 06/30/2016 % change Amortisation of intangible assets 5,471 5,586 -2.06% Depreciation of tangible assets 15,715 14,179 10.83% Tangible and intangible asset write-downs - 205 100.00% Trade and other receivables write-downs 3,886 1,363 185.11% Allocation to provisions for risks - 2,744 860 -419.07%
Total amortisation, depreciation and write-downs 22,328 22,193 0.61% The movement of this item, which is substantially balanced, shows an increase of allocations hedging the credit-related risk mainly due to adjustments made to align the calculation parameters with those used by the A2A Group, counter-balanced by the release of the excess of 2,638 thousand euro, part of the provision for contingencies, as a result of the update of the estimated impact of retroactive mandatory measures and sanctions levied by the Regulatory Authority for Electricity, Gas and Water (AEEGSI), regarding Terna’s request to return minor net charges incurred on actual energy imbalances, as defined by the change in the precautionary hypothesis on the basis of Resolution no. 342/2016 and adapted to subsequent provisions envisaged under Resolution no. 159/2017 and DSAI 10/2017.
7. RESULT FROM NON-RECURRING TRANSACTIONS The Group had no income or expenses resulting from non-recurring transactions.
8. FINANCIAL MANAGEMENT
(€,000) 06/30/2017 06/30/2016 %
change Financial income 764 926 -17.49% Financial expenses -12,050 -12,703 -5.14%
Portion of gains and losses resulting from the valuation of investments using the equity method
358 -11 -
3354.55%
Total financial management -10,928 -11,788 -7.30%
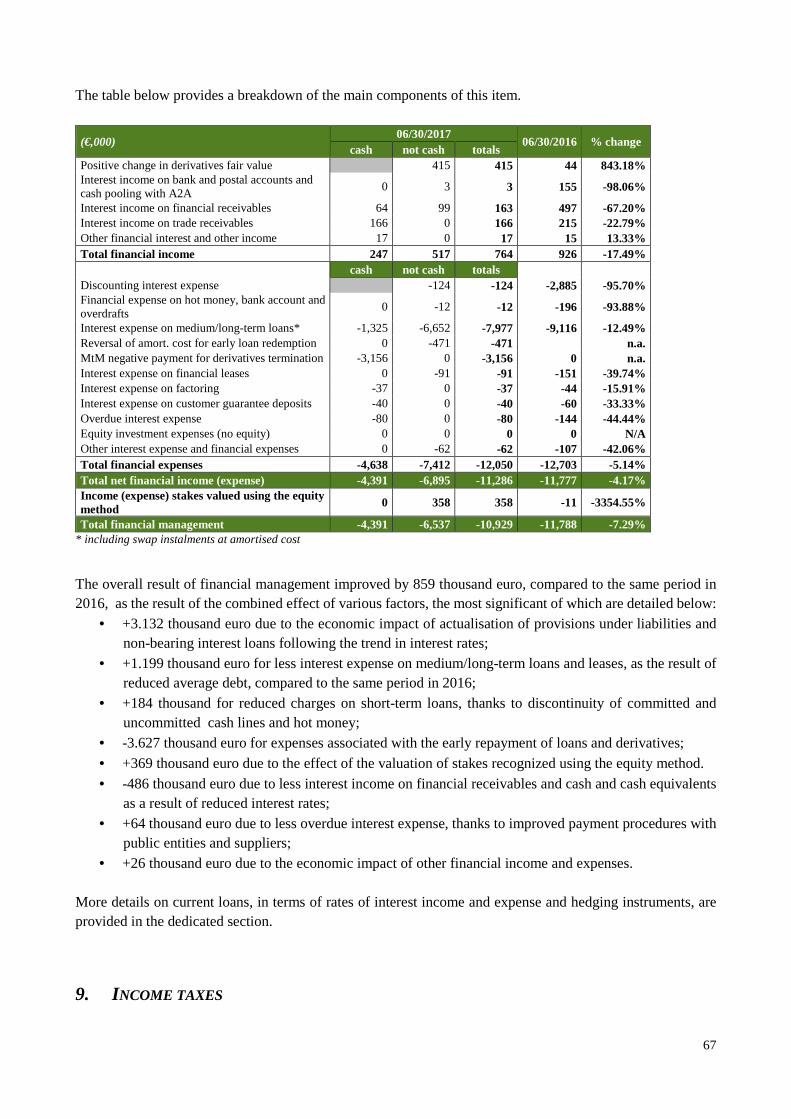
67
The table below provides a breakdown of the main components of this item.
(€,000) 06/30/2017
06/30/2016 % change cash not cash totals
Positive change in derivatives fair value 415 415 44 843.18% Interest income on bank and postal accounts and cash pooling with A2A
0 3 3 155 -98.06%
Interest income on financial receivables 64 99 163 497 -67.20% Interest income on trade receivables 166 0 166 215 -22.79% Other financial interest and other income 17 0 17 15 13.33% Total financial income 247 517 764 926 -17.49% cash not cash totals Discounting interest expense -124 -124 -2,885 -95.70% Financial expense on hot money, bank account and overdrafts
0 -12 -12 -196 -93.88%
Interest expense on medium/long-term loans* -1,325 -6,652 -7,977 -9,116 -12.49% Reversal of amort. cost for early loan redemption 0 -471 -471 n.a. MtM negative payment for derivatives termination -3,156 0 -3,156 0 n.a. Interest expense on financial leases 0 -91 -91 -151 -39.74% Interest expense on factoring -37 0 -37 -44 -15.91% Interest expense on customer guarantee deposits -40 0 -40 -60 -33.33% Overdue interest expense -80 0 -80 -144 -44.44% Equity investment expenses (no equity) 0 0 0 0 N/A Other interest expense and financial expenses 0 -62 -62 -107 -42.06% Total financial expenses -4,638 -7,412 -12,050 -12,703 -5.14% Total net financial income (expense) -4,391 -6,895 -11,286 -11,777 -4.17% Income (expense) stakes valued using the equity method 0 358 358 -11 -3354.55%
Total financial management -4,391 -6,537 -10,929 -11,788 -7.29% * including swap instalments at amortised cost
The overall result of financial management improved by 859 thousand euro, compared to the same period in 2016, as the result of the combined effect of various factors, the most significant of which are detailed below:
• +3.132 thousand euro due to the economic impact of actualisation of provisions under liabilities and non-bearing interest loans following the trend in interest rates;
• +1.199 thousand euro for less interest expense on medium/long-term loans and leases, as the result of reduced average debt, compared to the same period in 2016;
• +184 thousand for reduced charges on short-term loans, thanks to discontinuity of committed and uncommitted cash lines and hot money;
• -3.627 thousand euro for expenses associated with the early repayment of loans and derivatives; • +369 thousand euro due to the effect of the valuation of stakes recognized using the equity method. • -486 thousand euro due to less interest income on financial receivables and cash and cash equivalents
as a result of reduced interest rates; • +64 thousand euro due to less overdue interest expense, thanks to improved payment procedures with
public entities and suppliers; • +26 thousand euro due to the economic impact of other financial income and expenses.
More details on current loans, in terms of rates of interest income and expense and hedging instruments, are provided in the dedicated section.
9. INCOME TAXES
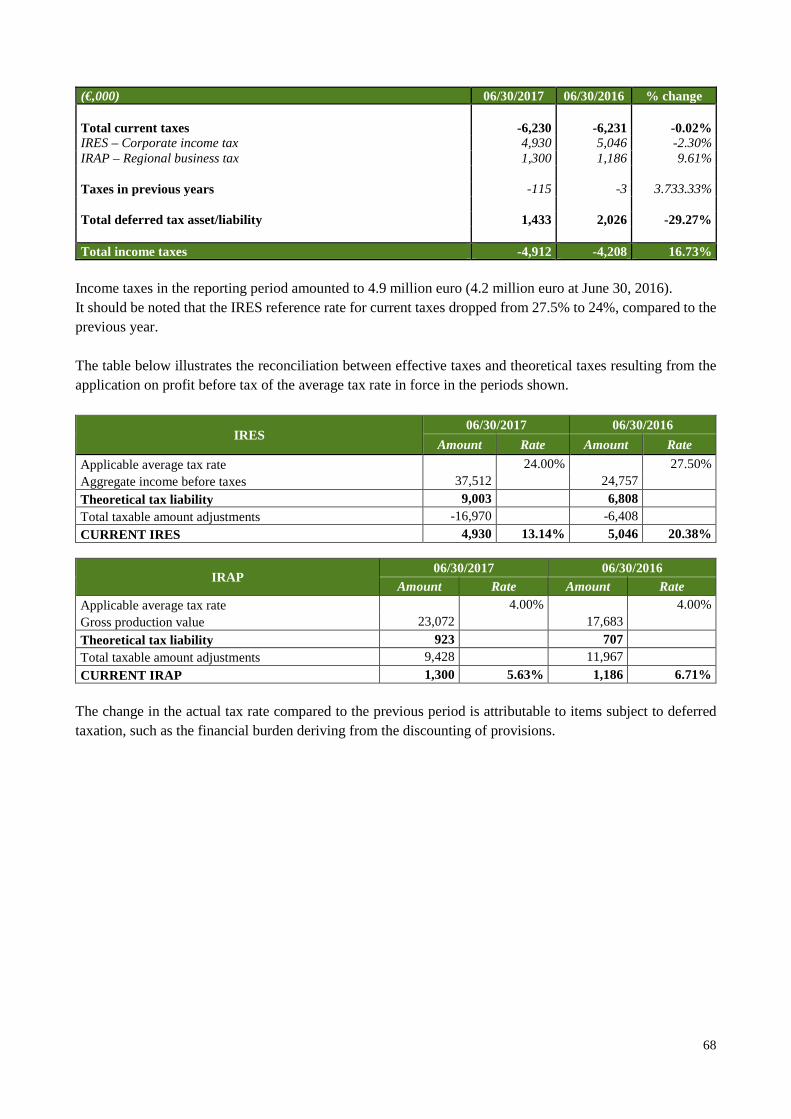
68
(€,000) 06/30/2017 06/30/2016 % change Total current taxes -6,230 -6,231 -0.02% IRES – Corporate income tax 4,930 5,046 -2.30% IRAP – Regional business tax 1,300 1,186 9.61% Taxes in previous years -115 -3 3.733.33% Total deferred tax asset/liability 1,433 2,026 -29.27% Total income taxes -4,912 -4,208 16.73%
Income taxes in the reporting period amounted to 4.9 million euro (4.2 million euro at June 30, 2016). It should be noted that the IRES reference rate for current taxes dropped from 27.5% to 24%, compared to the previous year. The table below illustrates the reconciliation between effective taxes and theoretical taxes resulting from the application on profit before tax of the average tax rate in force in the periods shown.
IRES 06/30/2017 06/30/2016
Amount Rate Amount Rate
Applicable average tax rate 24.00% 27.50% Aggregate income before taxes 37,512 24,757 Theoretical tax liability 9,003 6,808 Total taxable amount adjustments -16,970 -6,408 CURRENT IRES 4,930 13.14% 5,046 20.38%
IRAP 06/30/2017 06/30/2016
Amount Rate Amount Rate Applicable average tax rate 4.00% 4.00% Gross production value 23,072 17,683 Theoretical tax liability 923 707 Total taxable amount adjustments 9,428 11,967 CURRENT IRAP 1,300 5.63% 1,186 6.71%
The change in the actual tax rate compared to the previous period is attributable to items subject to deferred taxation, such as the financial burden deriving from the discounting of provisions.
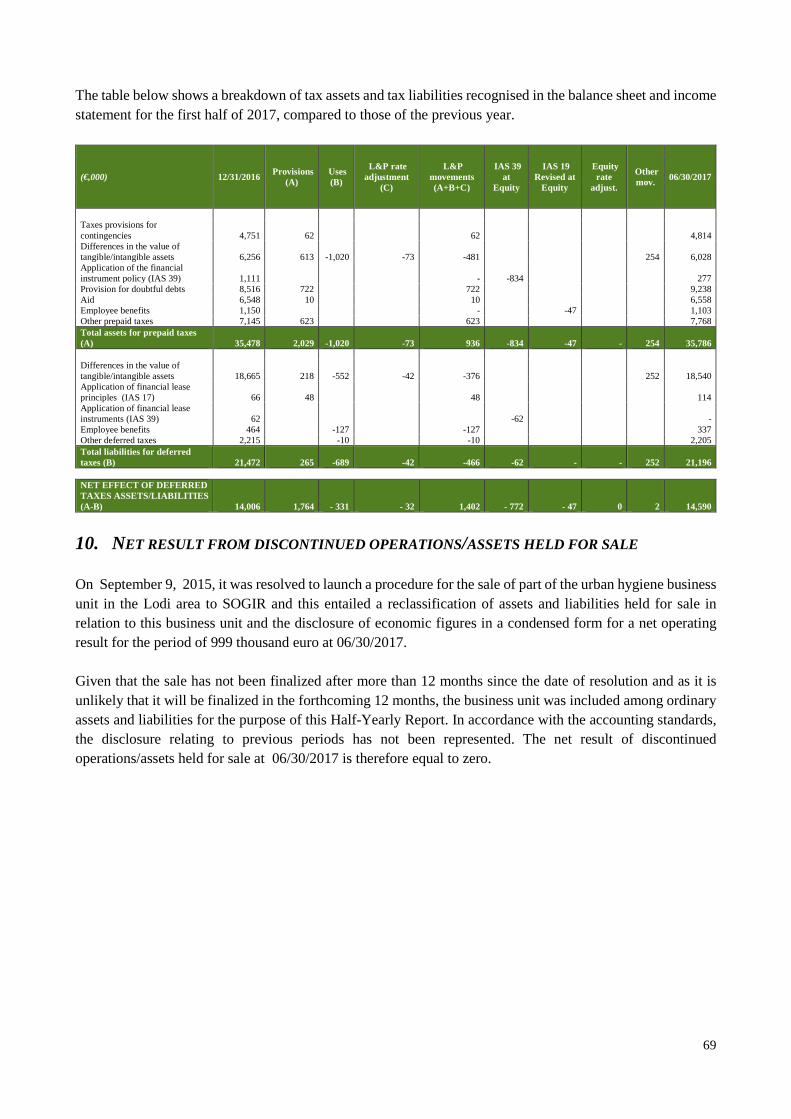
69
The table below shows a breakdown of tax assets and tax liabilities recognised in the balance sheet and income statement for the first half of 2017, compared to those of the previous year.
(€,000) 12/31/2016 Provisions
(A) Uses (B)
L&P rate adjustment
(C)
L&P movements (A+B+C)
IAS 39 at
Equity
IAS 19 Revised at
Equity
Equity rate
adjust.
Other mov. 06/30/2017
Taxes provisions for contingencies 4,751 62 62 4,814 Differences in the value of tangible/intangible assets 6,256 613 -1,020 -73 -481 254 6,028 Application of the financial instrument policy (IAS 39) 1,111 - -834 277 Provision for doubtful debts 8,516 722 722 9,238 Aid 6,548 10 10 6,558 Employee benefits 1,150 - -47 1,103 Other prepaid taxes 7,145 623 623 7,768 Total assets for prepaid taxes (A) 35,478 2,029 -1,020 -73 936 -834 -47 - 254 35,786 Differences in the value of tangible/intangible assets 18,665 218 -552 -42 -376 252 18,540 Application of financial lease principles (IAS 17) 66 48 48 114 Application of financial lease instruments (IAS 39) 62 -62 - Employee benefits 464 -127 -127 337 Other deferred taxes 2,215 -10 -10 2,205 Total liabilities for deferred taxes (B) 21,472 265 -689 -42 -466 -62 - - 252 21,196 NET EFFECT OF DEFERRED TAXES ASSETS/LIABILITIES (A-B) 14,006 1,764 - 331 - 32 1,402 - 772 - 47 0 2 14,590
10. NET RESULT FROM DISCONTINUED OPERATIONS/ASSETS HELD FOR SALE On September 9, 2015, it was resolved to launch a procedure for the sale of part of the urban hygiene business unit in the Lodi area to SOGIR and this entailed a reclassification of assets and liabilities held for sale in relation to this business unit and the disclosure of economic figures in a condensed form for a net operating result for the period of 999 thousand euro at 06/30/2017. Given that the sale has not been finalized after more than 12 months since the date of resolution and as it is unlikely that it will be finalized in the forthcoming 12 months, the business unit was included among ordinary assets and liabilities for the purpose of this Half-Yearly Report. In accordance with the accounting standards, the disclosure relating to previous periods has not been represented. The net result of discontinued operations/assets held for sale at 06/30/2017 is therefore equal to zero.
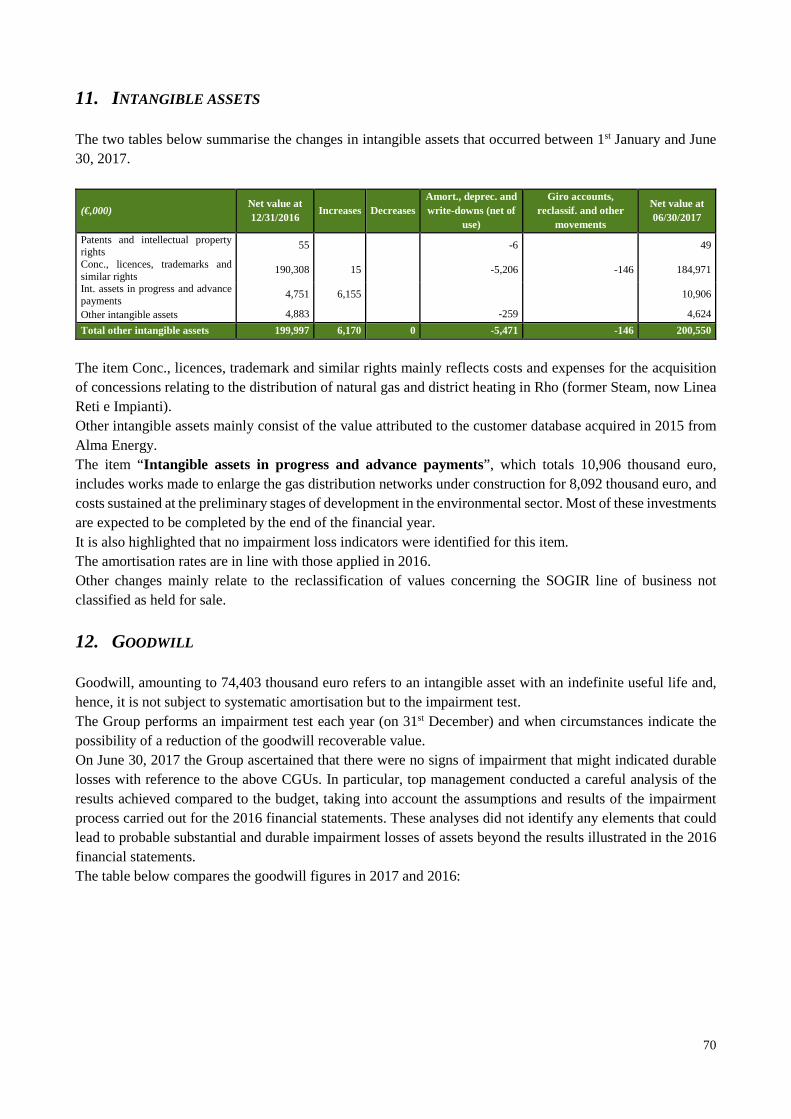
70
11. INTANGIBLE ASSETS The two tables below summarise the changes in intangible assets that occurred between 1st January and June 30, 2017.
(€,000) Net value at 12/31/2016
Increases Decreases Amort., deprec. and write-downs (net of
use)
Giro accounts, reclassif. and other
movements
Net value at 06/30/2017
Patents and intellectual property rights
55 -6 49
Conc., licences, trademarks and similar rights
190,308 15 -5,206 -146 184,971
Int. assets in progress and advance payments
4,751 6,155 10,906
Other intangible assets 4,883 -259 4,624
Total other intangible assets 199,997 6,170 0 -5,471 -146 200,550
The item Conc., licences, trademark and similar rights mainly reflects costs and expenses for the acquisition of concessions relating to the distribution of natural gas and district heating in Rho (former Steam, now Linea Reti e Impianti). Other intangible assets mainly consist of the value attributed to the customer database acquired in 2015 from Alma Energy. The item “Intangible assets in progress and advance payments”, which totals 10,906 thousand euro, includes works made to enlarge the gas distribution networks under construction for 8,092 thousand euro, and costs sustained at the preliminary stages of development in the environmental sector. Most of these investments are expected to be completed by the end of the financial year. It is also highlighted that no impairment loss indicators were identified for this item. The amortisation rates are in line with those applied in 2016. Other changes mainly relate to the reclassification of values concerning the SOGIR line of business not classified as held for sale.
12. GOODWILL Goodwill, amounting to 74,403 thousand euro refers to an intangible asset with an indefinite useful life and, hence, it is not subject to systematic amortisation but to the impairment test. The Group performs an impairment test each year (on 31st December) and when circumstances indicate the possibility of a reduction of the goodwill recoverable value. On June 30, 2017 the Group ascertained that there were no signs of impairment that might indicated durable losses with reference to the above CGUs. In particular, top management conducted a careful analysis of the results achieved compared to the budget, taking into account the assumptions and results of the impairment process carried out for the 2016 financial statements. These analyses did not identify any elements that could lead to probable substantial and durable impairment losses of assets beyond the results illustrated in the 2016 financial statements. The table below compares the goodwill figures in 2017 and 2016:
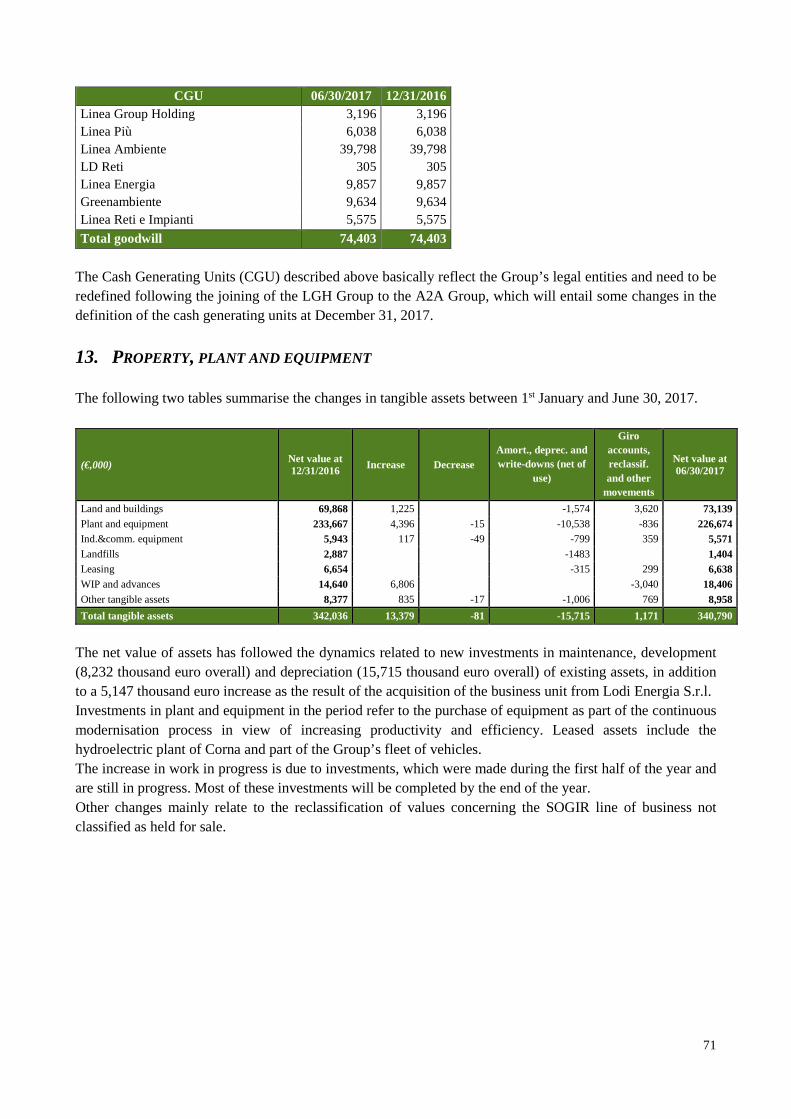
71
CGU 06/30/2017 12/31/2016 Linea Group Holding 3,196 3,196 Linea Più 6,038 6,038 Linea Ambiente 39,798 39,798 LD Reti 305 305 Linea Energia 9,857 9,857 Greenambiente 9,634 9,634 Linea Reti e Impianti 5,575 5,575
Total goodwill 74,403 74,403
The Cash Generating Units (CGU) described above basically reflect the Group’s legal entities and need to be redefined following the joining of the LGH Group to the A2A Group, which will entail some changes in the definition of the cash generating units at December 31, 2017.
13. PROPERTY, PLANT AND EQUIPMENT The following two tables summarise the changes in tangible assets between 1st January and June 30, 2017.
(€,000) Net value at 12/31/2016 Increase Decrease
Amort., deprec. and write-downs (net of
use)
Giro accounts, reclassif. and other
movements
Net value at 06/30/2017
Land and buildings 69,868 1,225 -1,574 3,620 73,139 Plant and equipment 233,667 4,396 -15 -10,538 -836 226,674 Ind.&comm. equipment 5,943 117 -49 -799 359 5,571 Landfills 2,887 -1483 1,404 Leasing 6,654 -315 299 6,638 WIP and advances 14,640 6,806 -3,040 18,406 Other tangible assets 8,377 835 -17 -1,006 769 8,958
Total tangible assets 342,036 13,379 -81 -15,715 1,171 340,790
The net value of assets has followed the dynamics related to new investments in maintenance, development (8,232 thousand euro overall) and depreciation (15,715 thousand euro overall) of existing assets, in addition to a 5,147 thousand euro increase as the result of the acquisition of the business unit from Lodi Energia S.r.l. Investments in plant and equipment in the period refer to the purchase of equipment as part of the continuous modernisation process in view of increasing productivity and efficiency. Leased assets include the hydroelectric plant of Corna and part of the Group’s fleet of vehicles. The increase in work in progress is due to investments, which were made during the first half of the year and are still in progress. Most of these investments will be completed by the end of the year. Other changes mainly relate to the reclassification of values concerning the SOGIR line of business not classified as held for sale.
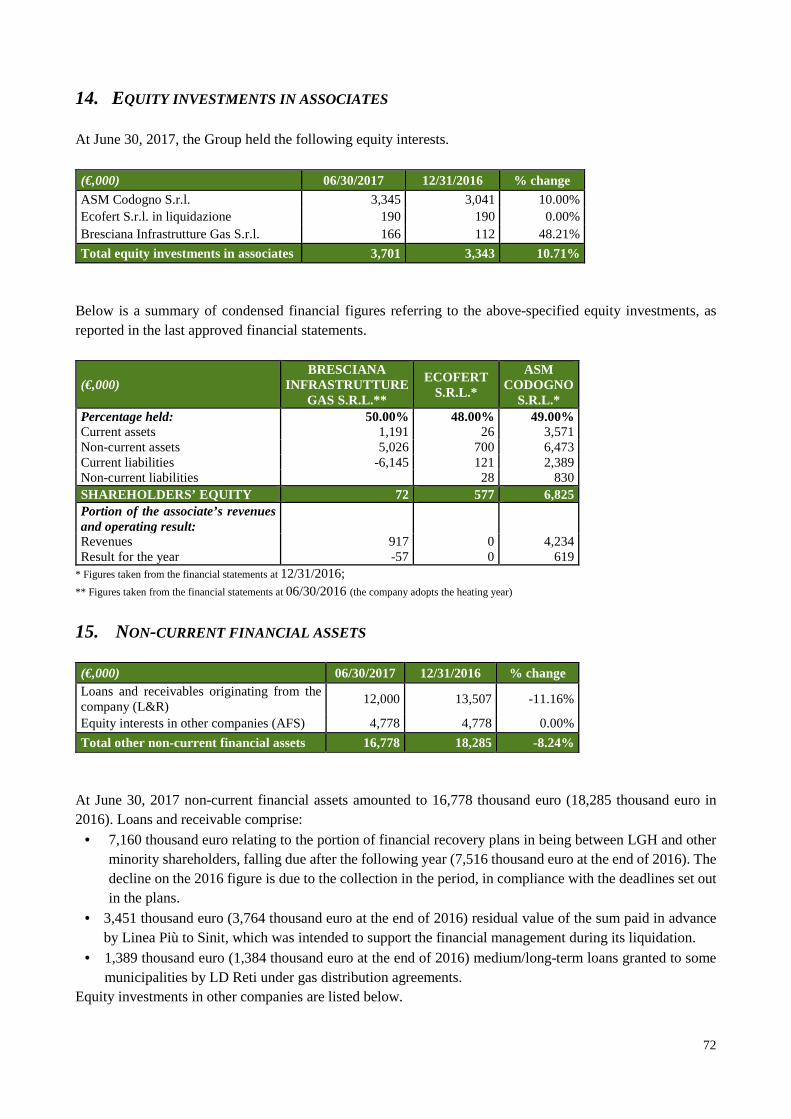
72
14. EQUITY INVESTMENTS IN ASSOCIATES At June 30, 2017, the Group held the following equity interests.
(€,000) 06/30/2017 12/31/2016 % change ASM Codogno S.r.l. 3,345 3,041 10.00% Ecofert S.r.l. in liquidazione 190 190 0.00% Bresciana Infrastrutture Gas S.r.l. 166 112 48.21%
Total equity investments in associates 3,701 3,343 10.71% Below is a summary of condensed financial figures referring to the above-specified equity investments, as reported in the last approved financial statements.
(€,000) BRESCIANA
INFRASTRUTTURE GAS S.R.L.**
ECOFERT S.R.L.*
ASM CODOGNO
S.R.L.* Percentage held: 50.00% 48.00% 49.00% Current assets 1,191 26 3,571 Non-current assets 5,026 700 6,473 Current liabilities -6,145 121 2,389 Non-current liabilities 28 830 SHAREHOLDERS’ EQUITY 72 577 6,825 Portion of the associate’s revenues and operating result:
Revenues 917 0 4,234 Result for the year -57 0 619
* Figures taken from the financial statements at 12/31/2016; ** Figures taken from the financial statements at 06/30/2016 (the company adopts the heating year)
15. NON-CURRENT FINANCIAL ASSETS
(€,000) 06/30/2017 12/31/2016 % change Loans and receivables originating from the company (L&R)
12,000 13,507 -11.16%
Equity interests in other companies (AFS) 4,778 4,778 0.00%
Total other non-current financial assets 16,778 18,285 -8.24% At June 30, 2017 non-current financial assets amounted to 16,778 thousand euro (18,285 thousand euro in 2016). Loans and receivable comprise:
• 7,160 thousand euro relating to the portion of financial recovery plans in being between LGH and other minority shareholders, falling due after the following year (7,516 thousand euro at the end of 2016). The decline on the 2016 figure is due to the collection in the period, in compliance with the deadlines set out in the plans.
• 3,451 thousand euro (3,764 thousand euro at the end of 2016) residual value of the sum paid in advance by Linea Più to Sinit, which was intended to support the financial management during its liquidation.
• 1,389 thousand euro (1,384 thousand euro at the end of 2016) medium/long-term loans granted to some municipalities by LD Reti under gas distribution agreements.
Equity investments in other companies are listed below.
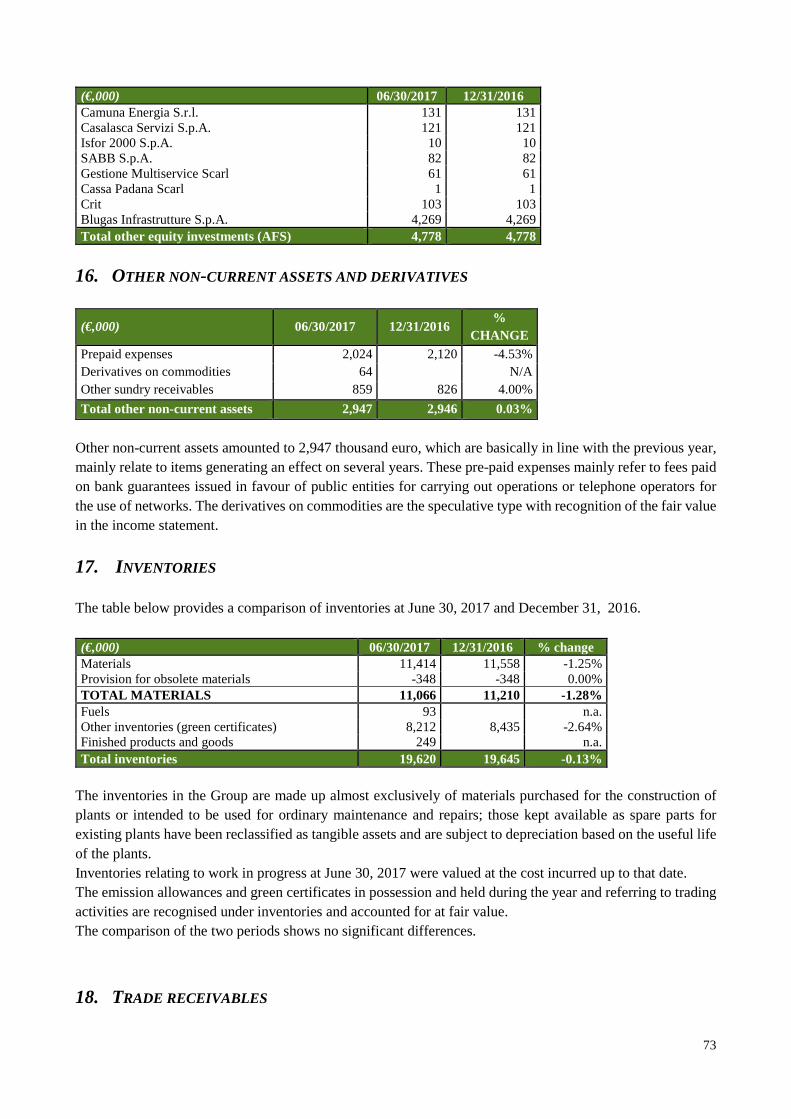
73
(€,000) 06/30/2017 12/31/2016 Camuna Energia S.r.l. 131 131 Casalasca Servizi S.p.A. 121 121 Isfor 2000 S.p.A. 10 10 SABB S.p.A. 82 82 Gestione Multiservice Scarl 61 61 Cassa Padana Scarl 1 1 Crit 103 103 Blugas Infrastrutture S.p.A. 4,269 4,269 Total other equity investments (AFS) 4,778 4,778
16. OTHER NON-CURRENT ASSETS AND DERIVATIVES
(€,000) 06/30/2017 12/31/2016 %
CHANGE Prepaid expenses 2,024 2,120 -4.53% Derivatives on commodities 64 N/A Other sundry receivables 859 826 4.00%
Total other non-current assets 2,947 2,946 0.03%
Other non-current assets amounted to 2,947 thousand euro, which are basically in line with the previous year, mainly relate to items generating an effect on several years. These pre-paid expenses mainly refer to fees paid on bank guarantees issued in favour of public entities for carrying out operations or telephone operators for the use of networks. The derivatives on commodities are the speculative type with recognition of the fair value in the income statement.
17. INVENTORIES The table below provides a comparison of inventories at June 30, 2017 and December 31, 2016. (€,000) 06/30/2017 12/31/2016 % change Materials 11,414 11,558 -1.25% Provision for obsolete materials -348 -348 0.00% TOTAL MATERIALS 11,066 11,210 -1.28% Fuels 93 n.a. Other inventories (green certificates) 8,212 8,435 -2.64% Finished products and goods 249 n.a. Total inventories 19,620 19,645 -0.13%
The inventories in the Group are made up almost exclusively of materials purchased for the construction of plants or intended to be used for ordinary maintenance and repairs; those kept available as spare parts for existing plants have been reclassified as tangible assets and are subject to depreciation based on the useful life of the plants. Inventories relating to work in progress at June 30, 2017 were valued at the cost incurred up to that date. The emission allowances and green certificates in possession and held during the year and referring to trading activities are recognised under inventories and accounted for at fair value. The comparison of the two periods shows no significant differences.
18. TRADE RECEIVABLES
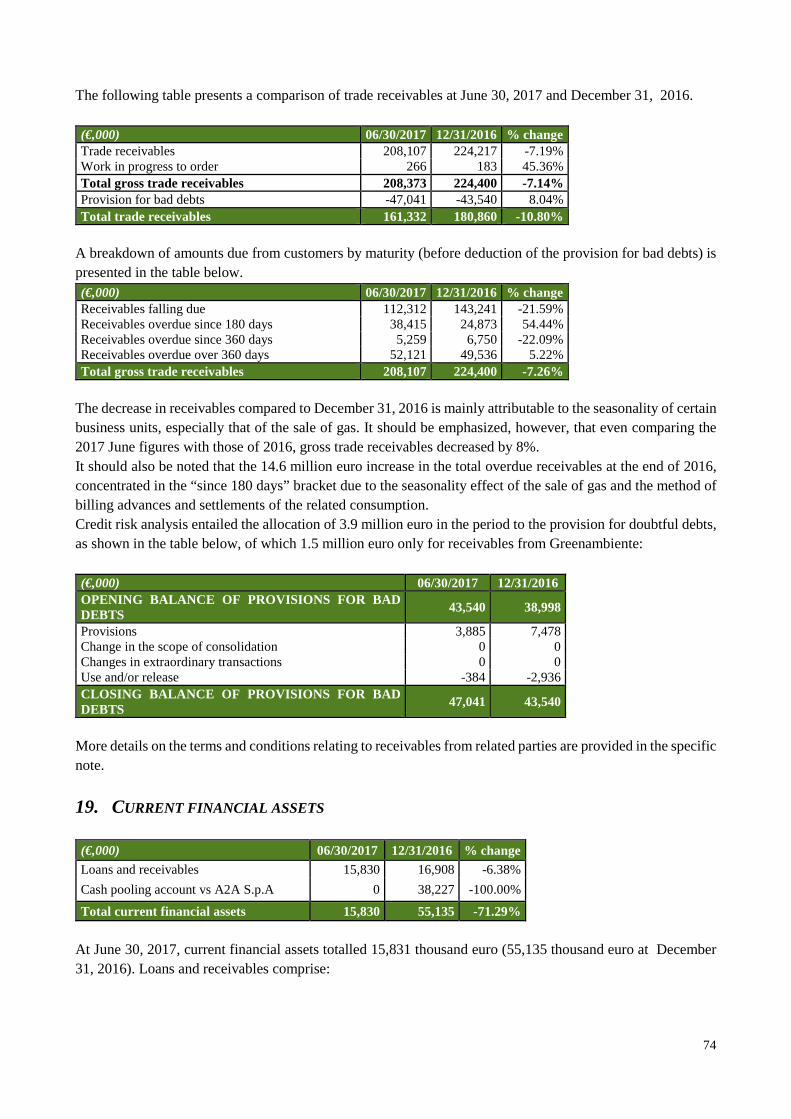
74
The following table presents a comparison of trade receivables at June 30, 2017 and December 31, 2016. (€,000) 06/30/2017 12/31/2016 % change Trade receivables 208,107 224,217 -7.19% Work in progress to order 266 183 45.36% Total gross trade receivables 208,373 224,400 -7.14% Provision for bad debts -47,041 -43,540 8.04% Total trade receivables 161,332 180,860 -10.80%
A breakdown of amounts due from customers by maturity (before deduction of the provision for bad debts) is presented in the table below. (€,000) 06/30/2017 12/31/2016 % change Receivables falling due 112,312 143,241 -21.59% Receivables overdue since 180 days 38,415 24,873 54.44% Receivables overdue since 360 days 5,259 6,750 -22.09% Receivables overdue over 360 days 52,121 49,536 5.22% Total gross trade receivables 208,107 224,400 -7.26%
The decrease in receivables compared to December 31, 2016 is mainly attributable to the seasonality of certain business units, especially that of the sale of gas. It should be emphasized, however, that even comparing the 2017 June figures with those of 2016, gross trade receivables decreased by 8%. It should also be noted that the 14.6 million euro increase in the total overdue receivables at the end of 2016, concentrated in the “since 180 days” bracket due to the seasonality effect of the sale of gas and the method of billing advances and settlements of the related consumption. Credit risk analysis entailed the allocation of 3.9 million euro in the period to the provision for doubtful debts, as shown in the table below, of which 1.5 million euro only for receivables from Greenambiente: (€,000) 06/30/2017 12/31/2016 OPENING BALANCE OF PROVISIONS FOR BAD DEBTS
43,540 38,998
Provisions 3,885 7,478 Change in the scope of consolidation 0 0 Changes in extraordinary transactions 0 0 Use and/or release -384 -2,936 CLOSING BALANCE OF PROVISIONS FOR BAD DEBTS
47,041 43,540
More details on the terms and conditions relating to receivables from related parties are provided in the specific note.
19. CURRENT FINANCIAL ASSETS
(€,000) 06/30/2017 12/31/2016 % change Loans and receivables 15,830 16,908 -6.38%
Cash pooling account vs A2A S.p.A 0 38,227 -100.00%
Total current financial assets 15,830 55,135 -71.29% At June 30, 2017, current financial assets totalled 15,831 thousand euro (55,135 thousand euro at December 31, 2016). Loans and receivables comprise:
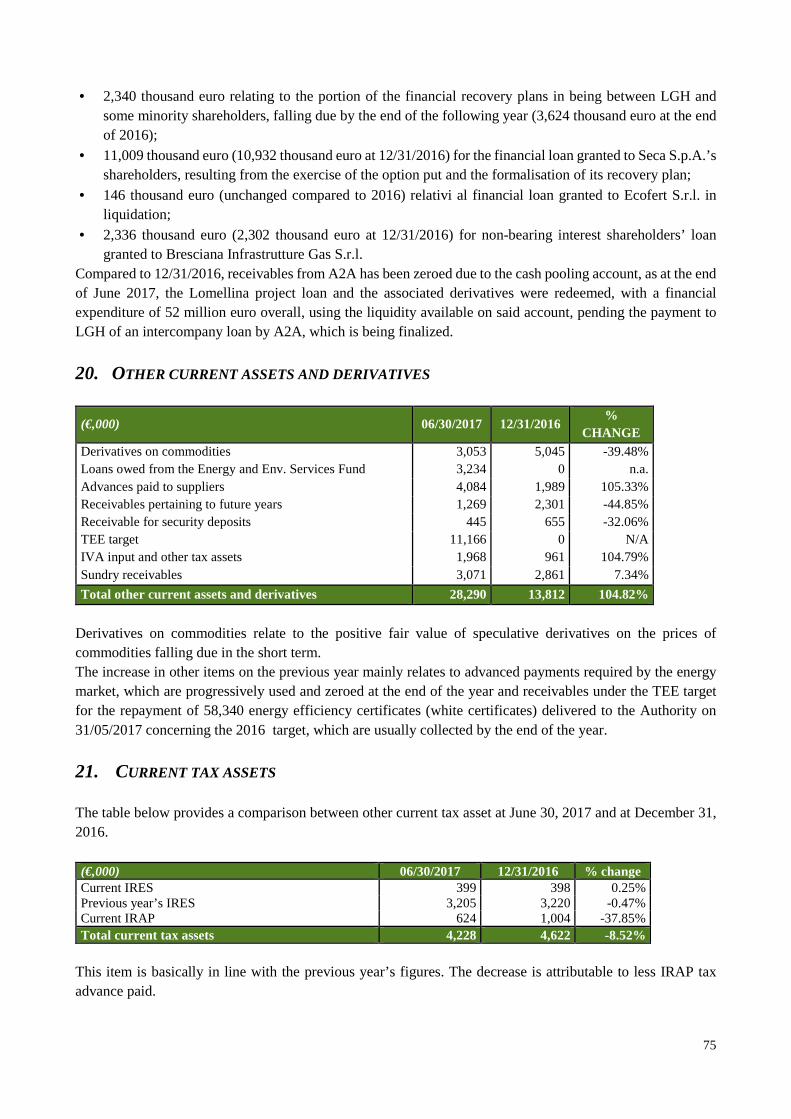
75
• 2,340 thousand euro relating to the portion of the financial recovery plans in being between LGH and some minority shareholders, falling due by the end of the following year (3,624 thousand euro at the end of 2016);
• 11,009 thousand euro (10,932 thousand euro at 12/31/2016) for the financial loan granted to Seca S.p.A.’s shareholders, resulting from the exercise of the option put and the formalisation of its recovery plan;
• 146 thousand euro (unchanged compared to 2016) relativi al financial loan granted to Ecofert S.r.l. in liquidation;
• 2,336 thousand euro (2,302 thousand euro at 12/31/2016) for non-bearing interest shareholders’ loan granted to Bresciana Infrastrutture Gas S.r.l.
Compared to 12/31/2016, receivables from A2A has been zeroed due to the cash pooling account, as at the end of June 2017, the Lomellina project loan and the associated derivatives were redeemed, with a financial expenditure of 52 million euro overall, using the liquidity available on said account, pending the payment to LGH of an intercompany loan by A2A, which is being finalized.
20. OTHER CURRENT ASSETS AND DERIVATIVES
(€,000) 06/30/2017 12/31/2016 %
CHANGE Derivatives on commodities 3,053 5,045 -39.48% Loans owed from the Energy and Env. Services Fund 3,234 0 n.a. Advances paid to suppliers 4,084 1,989 105.33% Receivables pertaining to future years 1,269 2,301 -44.85% Receivable for security deposits 445 655 -32.06% TEE target 11,166 0 N/A IVA input and other tax assets 1,968 961 104.79% Sundry receivables 3,071 2,861 7.34%
Total other current assets and derivatives 28,290 13,812 104.82%
Derivatives on commodities relate to the positive fair value of speculative derivatives on the prices of commodities falling due in the short term. The increase in other items on the previous year mainly relates to advanced payments required by the energy market, which are progressively used and zeroed at the end of the year and receivables under the TEE target for the repayment of 58,340 energy efficiency certificates (white certificates) delivered to the Authority on 31/05/2017 concerning the 2016 target, which are usually collected by the end of the year.
21. CURRENT TAX ASSETS The table below provides a comparison between other current tax asset at June 30, 2017 and at December 31, 2016. (€,000) 06/30/2017 12/31/2016 % change Current IRES 399 398 0.25% Previous year’s IRES 3,205 3,220 -0.47% Current IRAP 624 1,004 -37.85% Total current tax assets 4,228 4,622 -8.52%
This item is basically in line with the previous year’s figures. The decrease is attributable to less IRAP tax advance paid.
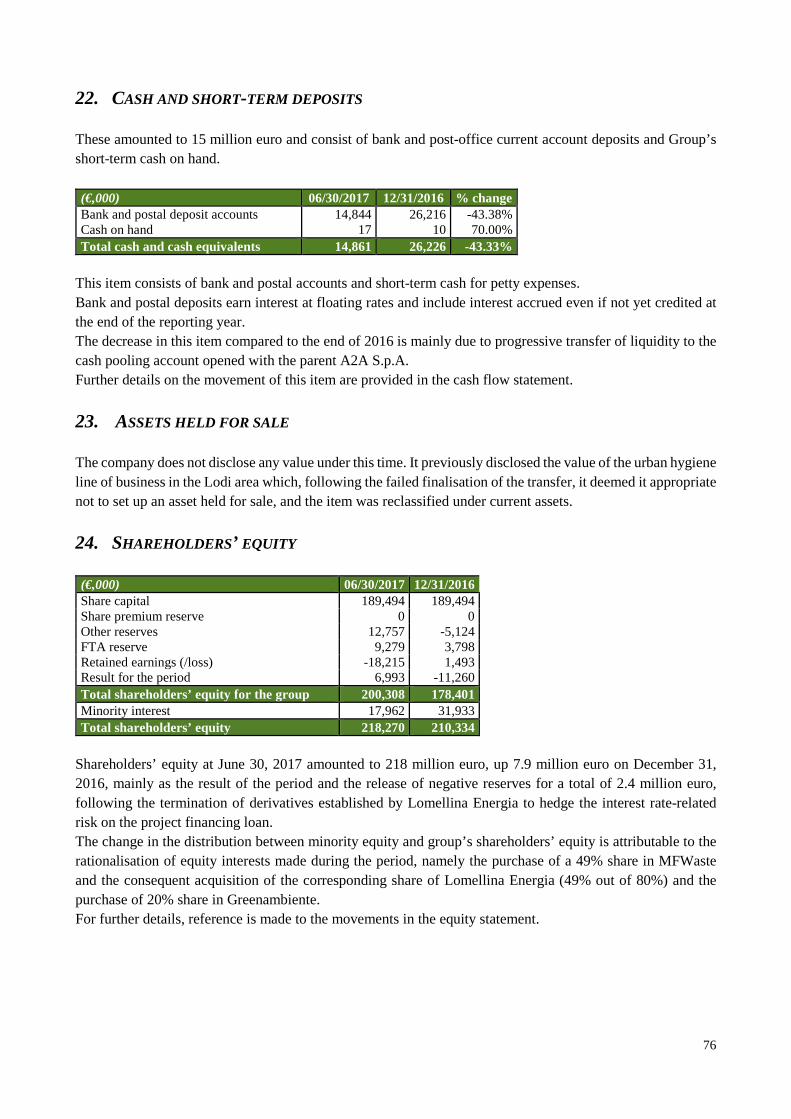
76
22. CASH AND SHORT-TERM DEPOSITS These amounted to 15 million euro and consist of bank and post-office current account deposits and Group’s short-term cash on hand. (€,000) 06/30/2017 12/31/2016 % change Bank and postal deposit accounts 14,844 26,216 -43.38% Cash on hand 17 10 70.00% Total cash and cash equivalents 14,861 26,226 -43.33%
This item consists of bank and postal accounts and short-term cash for petty expenses. Bank and postal deposits earn interest at floating rates and include interest accrued even if not yet credited at the end of the reporting year. The decrease in this item compared to the end of 2016 is mainly due to progressive transfer of liquidity to the cash pooling account opened with the parent A2A S.p.A. Further details on the movement of this item are provided in the cash flow statement.
23. ASSETS HELD FOR SALE The company does not disclose any value under this time. It previously disclosed the value of the urban hygiene line of business in the Lodi area which, following the failed finalisation of the transfer, it deemed it appropriate not to set up an asset held for sale, and the item was reclassified under current assets.
24. SHAREHOLDERS’ EQUITY (€,000) 06/30/2017 12/31/2016 Share capital 189,494 189,494 Share premium reserve 0 0 Other reserves 12,757 -5,124 FTA reserve 9,279 3,798 Retained earnings (/loss) -18,215 1,493 Result for the period 6,993 -11,260 Total shareholders’ equity for the group 200,308 178,401 Minority interest 17,962 31,933 Total shareholders’ equity 218,270 210,334
Shareholders’ equity at June 30, 2017 amounted to 218 million euro, up 7.9 million euro on December 31, 2016, mainly as the result of the period and the release of negative reserves for a total of 2.4 million euro, following the termination of derivatives established by Lomellina Energia to hedge the interest rate-related risk on the project financing loan. The change in the distribution between minority equity and group’s shareholders’ equity is attributable to the rationalisation of equity interests made during the period, namely the purchase of a 49% share in MFWaste and the consequent acquisition of the corresponding share of Lomellina Energia (49% out of 80%) and the purchase of 20% share in Greenambiente. For further details, reference is made to the movements in the equity statement.
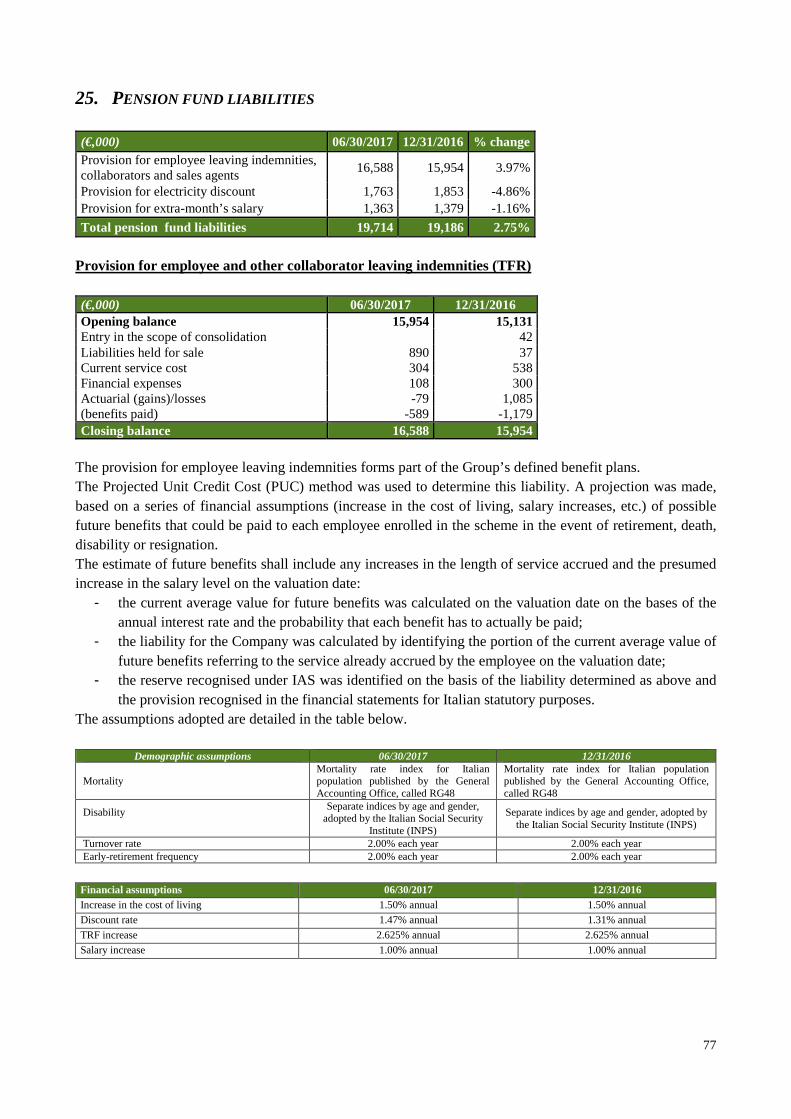
77
25. PENSION FUND LIABILITIES
(€,000) 06/30/2017 12/31/2016 % change Provision for employee leaving indemnities, collaborators and sales agents
16,588 15,954 3.97%
Provision for electricity discount 1,763 1,853 -4.86% Provision for extra-month’s salary 1,363 1,379 -1.16%
Total pension fund liabilities 19,714 19,186 2.75%
Provision for employee and other collaborator leaving indemnities (TFR) (€,000) 06/30/2017 12/31/2016 Opening balance 15,954 15,131 Entry in the scope of consolidation 42 Liabilities held for sale 890 37 Current service cost 304 538 Financial expenses 108 300 Actuarial (gains)/losses -79 1,085 (benefits paid) -589 -1,179 Closing balance 16,588 15,954
The provision for employee leaving indemnities forms part of the Group’s defined benefit plans. The Projected Unit Credit Cost (PUC) method was used to determine this liability. A projection was made, based on a series of financial assumptions (increase in the cost of living, salary increases, etc.) of possible future benefits that could be paid to each employee enrolled in the scheme in the event of retirement, death, disability or resignation. The estimate of future benefits shall include any increases in the length of service accrued and the presumed increase in the salary level on the valuation date:
- the current average value for future benefits was calculated on the valuation date on the bases of the annual interest rate and the probability that each benefit has to actually be paid;
- the liability for the Company was calculated by identifying the portion of the current average value of future benefits referring to the service already accrued by the employee on the valuation date;
- the reserve recognised under IAS was identified on the basis of the liability determined as above and the provision recognised in the financial statements for Italian statutory purposes.
The assumptions adopted are detailed in the table below.
Demographic assumptions 06/30/2017 12/31/2016
Mortality Mortality rate index for Italian population published by the General Accounting Office, called RG48
Mortality rate index for Italian population published by the General Accounting Office, called RG48
Disability
Separate indices by age and gender, adopted by the Italian Social Security
Institute (INPS)
Separate indices by age and gender, adopted by the Italian Social Security Institute (INPS)
Turnover rate 2.00% each year 2.00% each year Early-retirement frequency 2.00% each year 2.00% each year
Financial assumptions 06/30/2017 12/31/2016 Increase in the cost of living 1.50% annual 1.50% annual
Discount rate 1.47% annual 1.31% annual
TRF increase 2.625% annual 2.625% annual
Salary increase 1.00% annual 1.00% annual
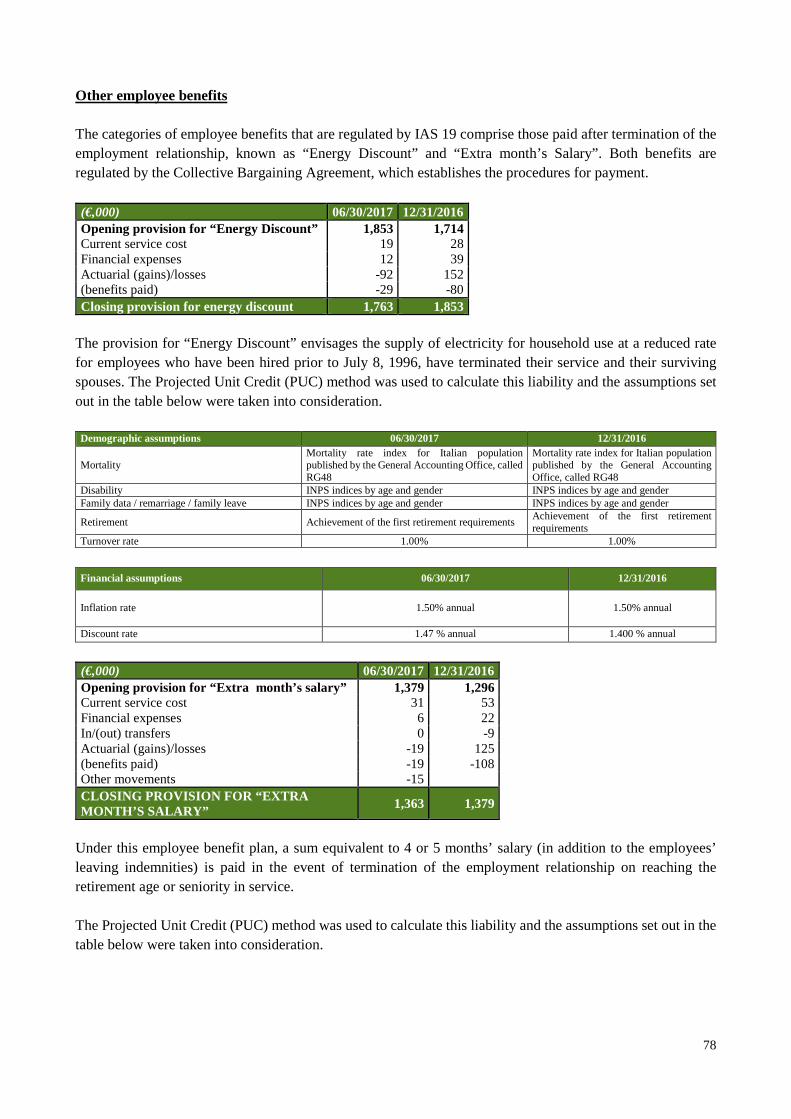
78
Other employee benefits The categories of employee benefits that are regulated by IAS 19 comprise those paid after termination of the employment relationship, known as “Energy Discount” and “Extra month’s Salary”. Both benefits are regulated by the Collective Bargaining Agreement, which establishes the procedures for payment. (€,000) 06/30/2017 12/31/2016 Opening provision for “Energy Discount” 1,853 1,714 Current service cost 19 28 Financial expenses 12 39 Actuarial (gains)/losses -92 152 (benefits paid) -29 -80 Closing provision for energy discount 1,763 1,853
The provision for “Energy Discount” envisages the supply of electricity for household use at a reduced rate for employees who have been hired prior to July 8, 1996, have terminated their service and their surviving spouses. The Projected Unit Credit (PUC) method was used to calculate this liability and the assumptions set out in the table below were taken into consideration. Demographic assumptions 06/30/2017 12/31/2016
Mortality Mortality rate index for Italian population published by the General Accounting Office, called RG48
Mortality rate index for Italian population published by the General Accounting Office, called RG48
Disability INPS indices by age and gender INPS indices by age and gender Family data / remarriage / family leave INPS indices by age and gender INPS indices by age and gender
Retirement Achievement of the first retirement requirements Achievement of the first retirement requirements
Turnover rate 1.00% 1.00%
Financial assumptions 06/30/2017 12/31/2016
Inflation rate 1.50% annual 1.50% annual
Discount rate 1.47 % annual 1.400 % annual
(€,000) 06/30/2017 12/31/2016 Opening provision for “Extra month’s salary” 1,379 1,296 Current service cost 31 53 Financial expenses 6 22 In/(out) transfers 0 -9 Actuarial (gains)/losses -19 125 (benefits paid) -19 -108 Other movements -15 CLOSING PROVISION FOR “EXTRA MONTH’S SALARY”
1,363 1,379
Under this employee benefit plan, a sum equivalent to 4 or 5 months’ salary (in addition to the employees’ leaving indemnities) is paid in the event of termination of the employment relationship on reaching the retirement age or seniority in service.
The Projected Unit Credit (PUC) method was used to calculate this liability and the assumptions set out in the table below were taken into consideration.
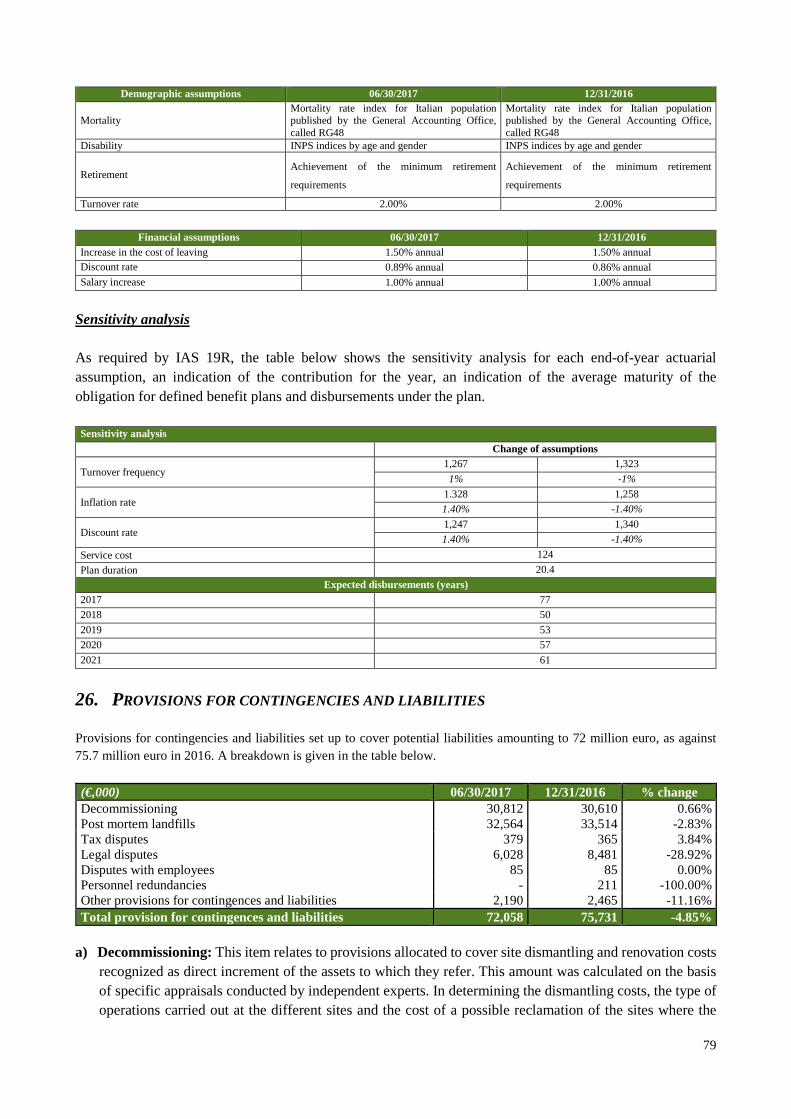
79
Demographic assumptions 06/30/2017 12/31/2016
Mortality Mortality rate index for Italian population published by the General Accounting Office, called RG48
Mortality rate index for Italian population published by the General Accounting Office, called RG48
Disability INPS indices by age and gender INPS indices by age and gender
Retirement Achievement of the minimum retirement
requirements Achievement of the minimum retirement
requirements Turnover rate 2.00% 2.00%
Financial assumptions 06/30/2017 12/31/2016
Increase in the cost of leaving 1.50% annual 1.50% annual Discount rate 0.89% annual 0.86% annual Salary increase 1.00% annual 1.00% annual
Sensitivity analysis As required by IAS 19R, the table below shows the sensitivity analysis for each end-of-year actuarial assumption, an indication of the contribution for the year, an indication of the average maturity of the obligation for defined benefit plans and disbursements under the plan. Sensitivity analysis Change of assumptions
Turnover frequency 1,267 1,323
1% -1%
Inflation rate 1.328 1,258
1.40% -1.40%
Discount rate 1,247 1,340
1.40% -1.40%
Service cost 124
Plan duration 20.4
Expected disbursements (years) 2017 77
2018 50
2019 53
2020 57
2021 61
26. PROVISIONS FOR CONTINGENCIES AND LIABILITIES Provisions for contingencies and liabilities set up to cover potential liabilities amounting to 72 million euro, as against 75.7 million euro in 2016. A breakdown is given in the table below.
(€,000) 06/30/2017 12/31/2016 % change Decommissioning 30,812 30,610 0.66% Post mortem landfills 32,564 33,514 -2.83% Tax disputes 379 365 3.84% Legal disputes 6,028 8,481 -28.92% Disputes with employees 85 85 0.00% Personnel redundancies - 211 -100.00% Other provisions for contingences and liabilities 2,190 2,465 -11.16% Total provision for contingences and liabilities 72,058 75,731 -4.85%
a) Decommissioning: This item relates to provisions allocated to cover site dismantling and renovation costs recognized as direct increment of the assets to which they refer. This amount was calculated on the basis of specific appraisals conducted by independent experts. In determining the dismantling costs, the type of operations carried out at the different sites and the cost of a possible reclamation of the sites where the
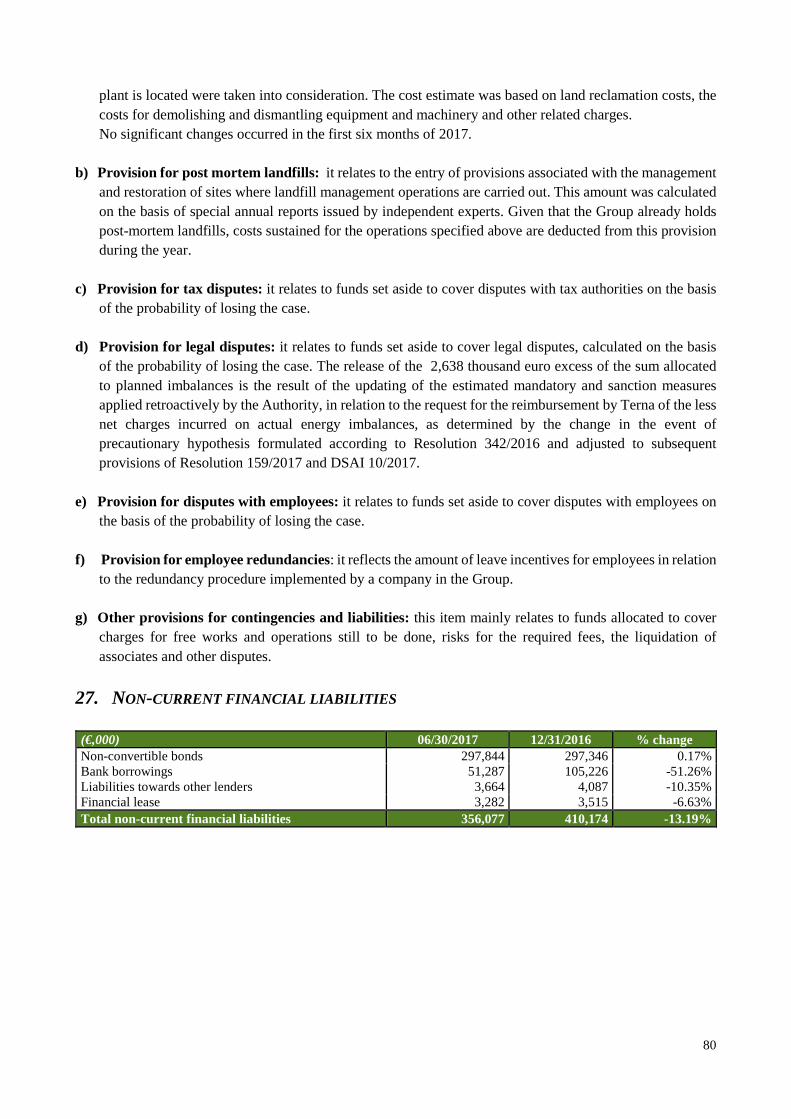
80
plant is located were taken into consideration. The cost estimate was based on land reclamation costs, the costs for demolishing and dismantling equipment and machinery and other related charges. No significant changes occurred in the first six months of 2017.
b) Provision for post mortem landfills: it relates to the entry of provisions associated with the management and restoration of sites where landfill management operations are carried out. This amount was calculated on the basis of special annual reports issued by independent experts. Given that the Group already holds post-mortem landfills, costs sustained for the operations specified above are deducted from this provision during the year.
c) Provision for tax disputes: it relates to funds set aside to cover disputes with tax authorities on the basis
of the probability of losing the case.
d) Provision for legal disputes: it relates to funds set aside to cover legal disputes, calculated on the basis of the probability of losing the case. The release of the 2,638 thousand euro excess of the sum allocated to planned imbalances is the result of the updating of the estimated mandatory and sanction measures applied retroactively by the Authority, in relation to the request for the reimbursement by Terna of the less net charges incurred on actual energy imbalances, as determined by the change in the event of precautionary hypothesis formulated according to Resolution 342/2016 and adjusted to subsequent provisions of Resolution 159/2017 and DSAI 10/2017.
e) Provision for disputes with employees: it relates to funds set aside to cover disputes with employees on
the basis of the probability of losing the case.
f) Provision for employee redundancies: it reflects the amount of leave incentives for employees in relation to the redundancy procedure implemented by a company in the Group.
g) Other provisions for contingencies and liabilities: this item mainly relates to funds allocated to cover charges for free works and operations still to be done, risks for the required fees, the liquidation of associates and other disputes.
27. NON-CURRENT FINANCIAL LIABILITIES (€,000) 06/30/2017 12/31/2016 % change Non-convertible bonds 297,844 297,346 0.17% Bank borrowings 51,287 105,226 -51.26% Liabilities towards other lenders 3,664 4,087 -10.35% Financial lease 3,282 3,515 -6.63% Total non-current financial liabilities 356,077 410,174 -13.19%
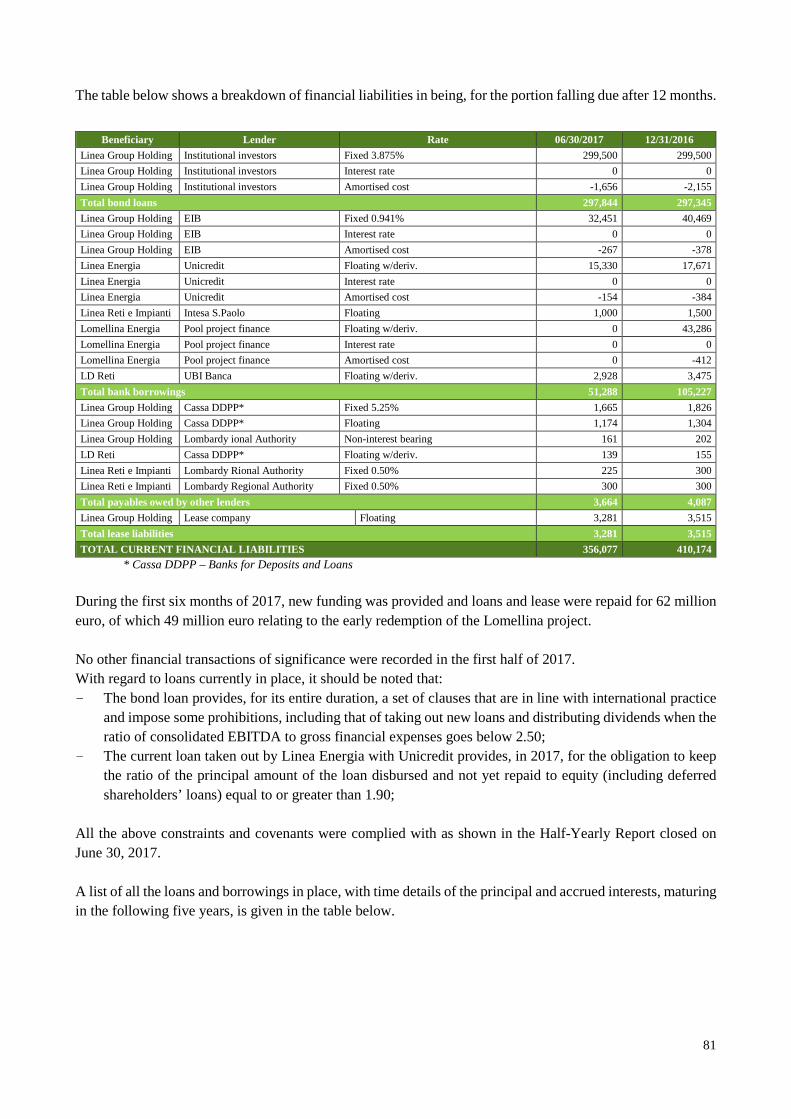
81
The table below shows a breakdown of financial liabilities in being, for the portion falling due after 12 months.
Beneficiary Lender Rate 06/30/2017 12/31/2016
Linea Group Holding Institutional investors Fixed 3.875% 299,500 299,500
Linea Group Holding Institutional investors Interest rate 0 0
Linea Group Holding Institutional investors Amortised cost -1,656 -2,155
Total bond loans 297,844 297,345
Linea Group Holding EIB Fixed 0.941% 32,451 40,469
Linea Group Holding EIB Interest rate 0 0
Linea Group Holding EIB Amortised cost -267 -378
Linea Energia Unicredit Floating w/deriv. 15,330 17,671
Linea Energia Unicredit Interest rate 0 0
Linea Energia Unicredit Amortised cost -154 -384
Linea Reti e Impianti Intesa S.Paolo Floating 1,000 1,500
Lomellina Energia Pool project finance Floating w/deriv. 0 43,286
Lomellina Energia Pool project finance Interest rate 0 0
Lomellina Energia Pool project finance Amortised cost 0 -412
LD Reti UBI Banca Floating w/deriv. 2,928 3,475
Total bank borrowings 51,288 105,227
Linea Group Holding Cassa DDPP* Fixed 5.25% 1,665 1,826
Linea Group Holding Cassa DDPP* Floating 1,174 1,304
Linea Group Holding Lombardy ional Authority Non-interest bearing 161 202
LD Reti Cassa DDPP* Floating w/deriv. 139 155
Linea Reti e Impianti Lombardy Rional Authority Fixed 0.50% 225 300
Linea Reti e Impianti Lombardy Regional Authority Fixed 0.50% 300 300
Total payables owed by other lenders 3,664 4,087
Linea Group Holding Lease company Floating 3,281 3,515
Total lease liabilities 3,281 3,515
TOTAL CURRENT FINANCIAL LIABILITIES 356,077 410,174
* Cassa DDPP – Banks for Deposits and Loans
During the first six months of 2017, new funding was provided and loans and lease were repaid for 62 million euro, of which 49 million euro relating to the early redemption of the Lomellina project. No other financial transactions of significance were recorded in the first half of 2017. With regard to loans currently in place, it should be noted that: - The bond loan provides, for its entire duration, a set of clauses that are in line with international practice
and impose some prohibitions, including that of taking out new loans and distributing dividends when the ratio of consolidated EBITDA to gross financial expenses goes below 2.50;
- The current loan taken out by Linea Energia with Unicredit provides, in 2017, for the obligation to keep the ratio of the principal amount of the loan disbursed and not yet repaid to equity (including deferred shareholders’ loans) equal to or greater than 1.90;
All the above constraints and covenants were complied with as shown in the Half-Yearly Report closed on June 30, 2017. A list of all the loans and borrowings in place, with time details of the principal and accrued interests, maturing in the following five years, is given in the table below.
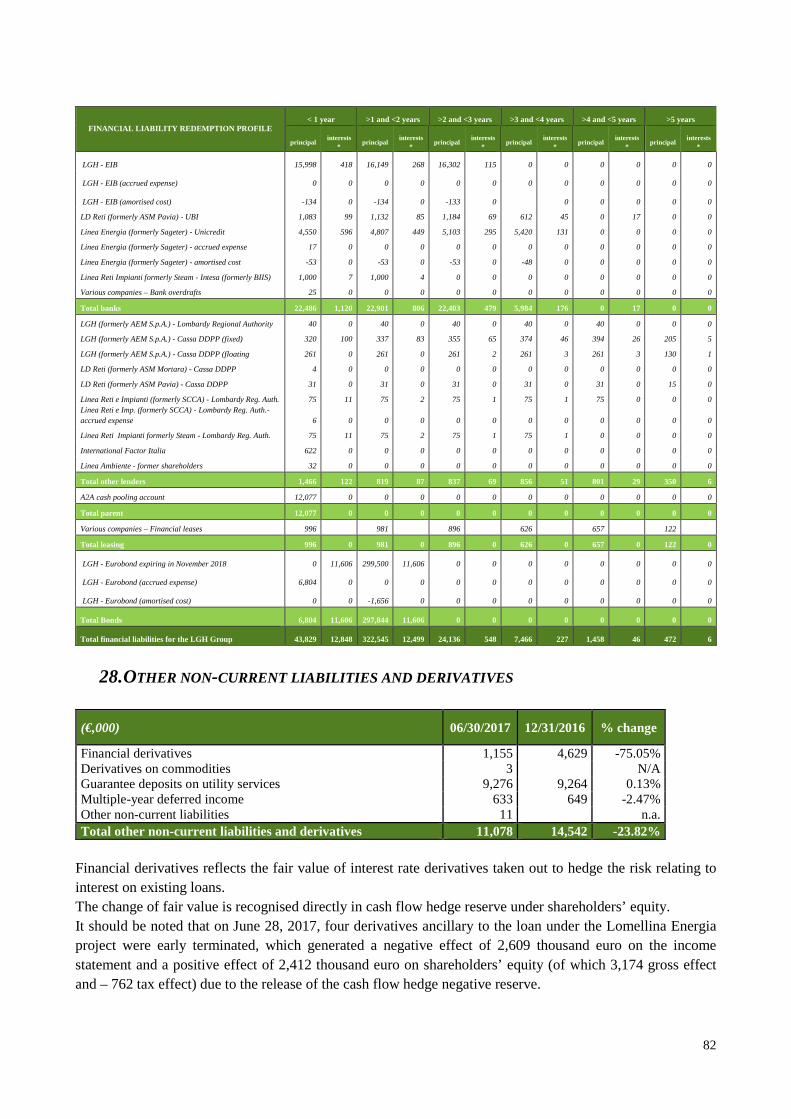
82
FINANCIAL LIABILITY REDEMPTION PROFILE < 1 year >1 and <2 years >2 and <3 years >3 and <4 years >4 and <5 years >5 years
principal interests
* principal
interests*
principal interests
* principal
interests*
principal interests
* principal
interests*
LGH - EIB 15,998 418 16,149 268 16,302 115 0 0 0 0 0 0
LGH - EIB (accrued expense) 0 0 0 0 0 0 0 0 0 0 0 0
LGH - EIB (amortised cost) -134 0 -134 0 -133 0 0 0 0 0 0
LD Reti (formerly ASM Pavia) - UBI 1,083 99 1,132 85 1,184 69 612 45 0 17 0 0
Linea Energia (formerly Sageter) - Unicredit 4,550 596 4,807 449 5,103 295 5,420 131 0 0 0 0
Linea Energia (formerly Sageter) - accrued expense 17 0 0 0 0 0 0 0 0 0 0 0
Linea Energia (formerly Sageter) - amortised cost -53 0 -53 0 -53 0 -48 0 0 0 0 0
Linea Reti Impianti formerly Steam - Intesa (formerly BIIS) 1,000 7 1,000 4 0 0 0 0 0 0 0 0
Various companies – Bank overdrafts 25 0 0 0 0 0 0 0 0 0 0 0
Total banks 22,486 1,120 22,901 806 22,403 479 5,984 176 0 17 0 0
LGH (formerly AEM S.p.A.) - Lombardy Regional Authority 40 0 40 0 40 0 40 0 40 0 0 0
LGH (formerly AEM S.p.A.) - Cassa DDPP (fixed) 320 100 337 83 355 65 374 46 394 26 205 5
LGH (formerly AEM S.p.A.) - Cassa DDPP (floating 261 0 261 0 261 2 261 3 261 3 130 1
LD Reti (formerly ASM Mortara) - Cassa DDPP 4 0 0 0 0 0 0 0 0 0 0 0
LD Reti (formerly ASM Pavia) - Cassa DDPP 31 0 31 0 31 0 31 0 31 0 15 0
Linea Reti e Impianti (formerly SCCA) - Lombardy Reg. Auth. 75 11 75 2 75 1 75 1 75 0 0 0 Linea Reti e Imp. (formerly SCCA) - Lombardy Reg. Auth.- accrued expense 6 0 0 0 0 0 0 0 0 0 0 0
Linea Reti Impianti formerly Steam - Lombardy Reg. Auth. 75 11 75 2 75 1 75 1 0 0 0 0
International Factor Italia 622 0 0 0 0 0 0 0 0 0 0 0
Linea Ambiente - former shareholders 32 0 0 0 0 0 0 0 0 0 0 0
Total other lenders 1,466 122 819 87 837 69 856 51 801 29 350 6
A2A cash pooling account 12,077 0 0 0 0 0 0 0 0 0 0 0
Total parent 12,077 0 0 0 0 0 0 0 0 0 0 0
Various companies – Financial leases 996 981 896 626 657 122
Total leasing 996 0 981 0 896 0 626 0 657 0 122 0
LGH - Eurobond expiring in November 2018 0 11,606 299,500 11,606 0 0 0 0 0 0 0 0
LGH - Eurobond (accrued expense) 6,804 0 0 0 0 0 0 0 0 0 0 0
LGH - Eurobond (amortised cost) 0 0 -1,656 0 0 0 0 0 0 0 0 0
Total Bonds 6,804 11,606 297,844 11,606 0 0 0 0 0 0 0 0
Total financial liabilities for the LGH Group 43,829 12,848 322,545 12,499 24,136 548 7,466 227 1,458 46 472 6
28. OTHER NON-CURRENT LIABILITIES AND DERIVATIVES
(€,000) 06/30/2017 12/31/2016 % change
Financial derivatives 1,155 4,629 -75.05% Derivatives on commodities 3 N/A Guarantee deposits on utility services 9,276 9,264 0.13% Multiple-year deferred income 633 649 -2.47% Other non-current liabilities 11 n.a. Total other non-current liabilities and derivatives 11,078 14,542 -23.82%
Financial derivatives reflects the fair value of interest rate derivatives taken out to hedge the risk relating to interest on existing loans. The change of fair value is recognised directly in cash flow hedge reserve under shareholders’ equity. It should be noted that on June 28, 2017, four derivatives ancillary to the loan under the Lomellina Energia project were early terminated, which generated a negative effect of 2,609 thousand euro on the income statement and a positive effect of 2,412 thousand euro on shareholders’ equity (of which 3,174 gross effect and – 762 tax effect) due to the release of the cash flow hedge negative reserve.
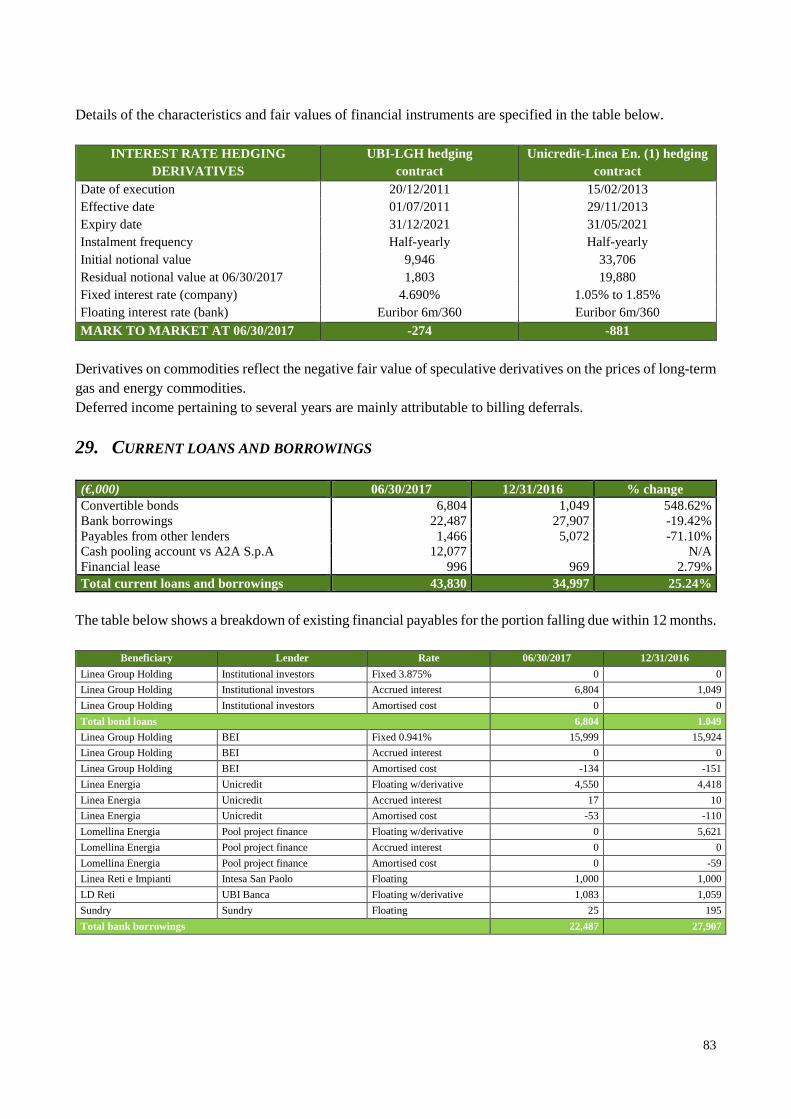
83
Details of the characteristics and fair values of financial instruments are specified in the table below.
INTEREST RATE HEDGING DERIVATIVES
UBI-LGH hedging contract
Unicredit-Linea En. (1) hedging contract
Date of execution 20/12/2011 15/02/2013 Effective date 01/07/2011 29/11/2013 Expiry date 31/12/2021 31/05/2021 Instalment frequency Half-yearly Half-yearly Initial notional value 9,946 33,706 Residual notional value at 06/30/2017 1,803 19,880 Fixed interest rate (company) 4.690% 1.05% to 1.85% Floating interest rate (bank) Euribor 6m/360 Euribor 6m/360
MARK TO MARKET AT 06/30/2017 -274 -881
Derivatives on commodities reflect the negative fair value of speculative derivatives on the prices of long-term gas and energy commodities. Deferred income pertaining to several years are mainly attributable to billing deferrals.
29. CURRENT LOANS AND BORROWINGS (€,000) 06/30/2017 12/31/2016 % change Convertible bonds 6,804 1,049 548.62% Bank borrowings 22,487 27,907 -19.42% Payables from other lenders 1,466 5,072 -71.10% Cash pooling account vs A2A S.p.A 12,077 N/A Financial lease 996 969 2.79% Total current loans and borrowings 43,830 34,997 25.24%
The table below shows a breakdown of existing financial payables for the portion falling due within 12 months.
Beneficiary Lender Rate 06/30/2017 12/31/2016
Linea Group Holding Institutional investors Fixed 3.875% 0 0
Linea Group Holding Institutional investors Accrued interest 6,804 1,049
Linea Group Holding Institutional investors Amortised cost 0 0
Total bond loans 6,804 1.049
Linea Group Holding BEI Fixed 0.941% 15,999 15,924
Linea Group Holding BEI Accrued interest 0 0
Linea Group Holding BEI Amortised cost -134 -151
Linea Energia Unicredit Floating w/derivative 4,550 4,418
Linea Energia Unicredit Accrued interest 17 10
Linea Energia Unicredit Amortised cost -53 -110
Lomellina Energia Pool project finance Floating w/derivative 0 5,621
Lomellina Energia Pool project finance Accrued interest 0 0
Lomellina Energia Pool project finance Amortised cost 0 -59
Linea Reti e Impianti Intesa San Paolo Floating 1,000 1,000
LD Reti UBI Banca Floating w/derivative 1,083 1,059
Sundry Sundry Floating 25 195
Total bank borrowings 22,487 27,907
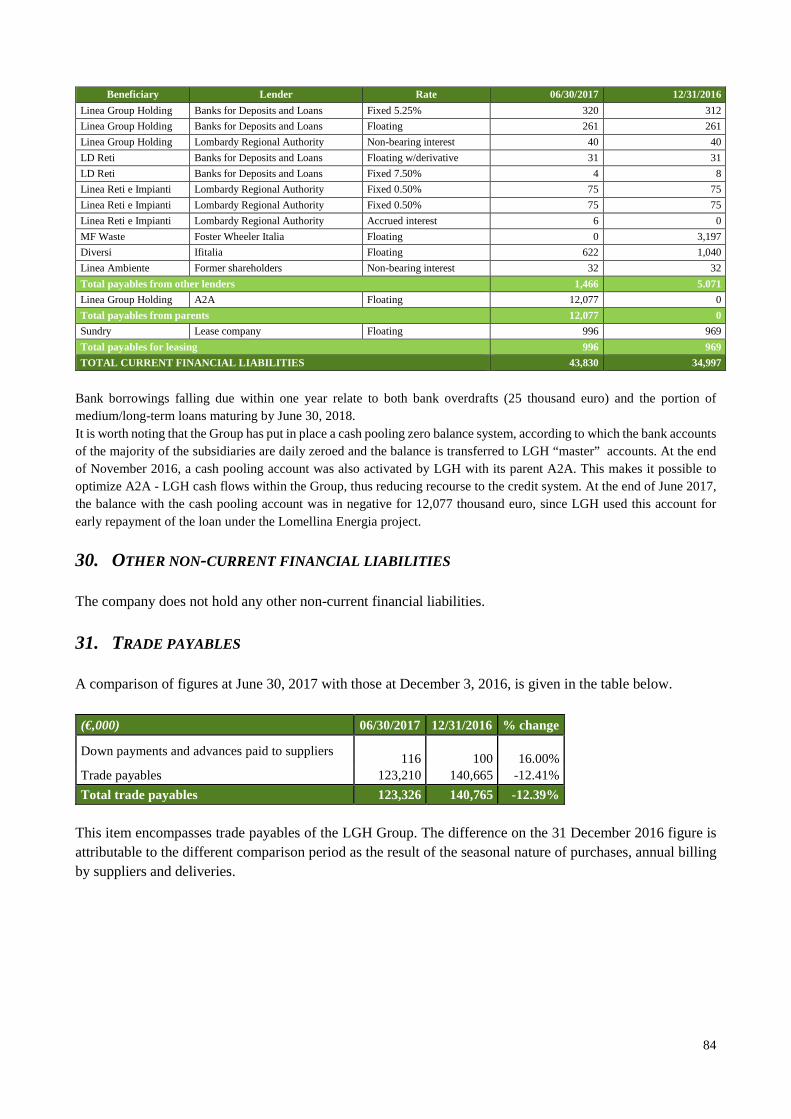
84
Beneficiary Lender Rate 06/30/2017 12/31/2016
Linea Group Holding Banks for Deposits and Loans Fixed 5.25% 320 312
Linea Group Holding Banks for Deposits and Loans Floating 261 261
Linea Group Holding Lombardy Regional Authority Non-bearing interest 40 40
LD Reti Banks for Deposits and Loans Floating w/derivative 31 31
LD Reti Banks for Deposits and Loans Fixed 7.50% 4 8
Linea Reti e Impianti Lombardy Regional Authority Fixed 0.50% 75 75
Linea Reti e Impianti Lombardy Regional Authority Fixed 0.50% 75 75
Linea Reti e Impianti Lombardy Regional Authority Accrued interest 6 0
MF Waste Foster Wheeler Italia Floating 0 3,197
Diversi Ifitalia Floating 622 1,040
Linea Ambiente Former shareholders Non-bearing interest 32 32
Total payables from other lenders 1,466 5.071
Linea Group Holding A2A Floating 12,077 0
Total payables from parents 12,077 0
Sundry Lease company Floating 996 969
Total payables for leasing 996 969
TOTAL CURRENT FINANCIAL LIABILITIES 43,830 34,997
Bank borrowings falling due within one year relate to both bank overdrafts (25 thousand euro) and the portion of medium/long-term loans maturing by June 30, 2018. It is worth noting that the Group has put in place a cash pooling zero balance system, according to which the bank accounts of the majority of the subsidiaries are daily zeroed and the balance is transferred to LGH “master” accounts. At the end of November 2016, a cash pooling account was also activated by LGH with its parent A2A. This makes it possible to optimize A2A - LGH cash flows within the Group, thus reducing recourse to the credit system. At the end of June 2017, the balance with the cash pooling account was in negative for 12,077 thousand euro, since LGH used this account for early repayment of the loan under the Lomellina Energia project.
30. OTHER NON-CURRENT FINANCIAL LIABILITIES The company does not hold any other non-current financial liabilities.
31. TRADE PAYABLES A comparison of figures at June 30, 2017 with those at December 3, 2016, is given in the table below.
(€,000) 06/30/2017 12/31/2016 % change
Down payments and advances paid to suppliers
116
100 16.00% Trade payables 123,210 140,665 -12.41%
Total trade payables 123,326 140,765 -12.39% This item encompasses trade payables of the LGH Group. The difference on the 31 December 2016 figure is attributable to the different comparison period as the result of the seasonal nature of purchases, annual billing by suppliers and deliveries.
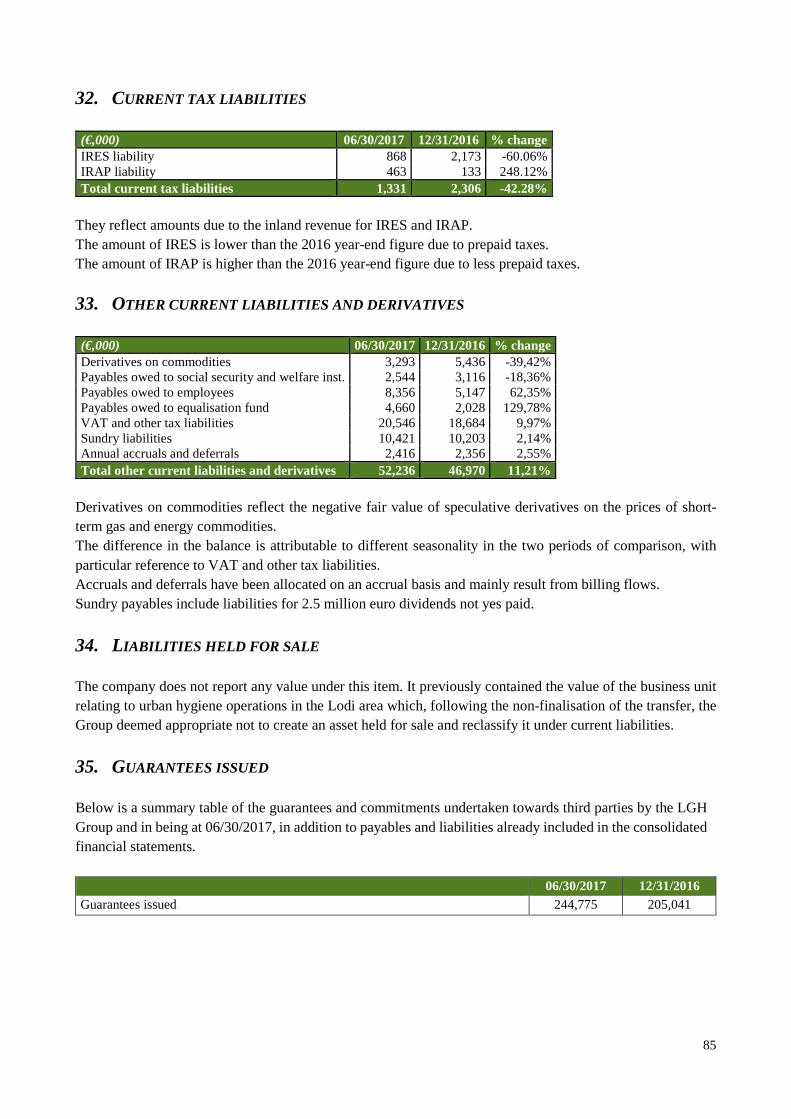
85
32. CURRENT TAX LIABILITIES (€,000) 06/30/2017 12/31/2016 % change IRES liability 868 2,173 -60.06% IRAP liability 463 133 248.12% Total current tax liabilities 1,331 2,306 -42.28%
They reflect amounts due to the inland revenue for IRES and IRAP. The amount of IRES is lower than the 2016 year-end figure due to prepaid taxes. The amount of IRAP is higher than the 2016 year-end figure due to less prepaid taxes.
33. OTHER CURRENT LIABILITIES AND DERIVATIVES (€,000) 06/30/2017 12/31/2016 % change Derivatives on commodities 3,293 5,436 -39,42% Payables owed to social security and welfare inst. 2,544 3,116 -18,36% Payables owed to employees 8,356 5,147 62,35% Payables owed to equalisation fund 4,660 2,028 129,78% VAT and other tax liabilities 20,546 18,684 9,97% Sundry liabilities 10,421 10,203 2,14% Annual accruals and deferrals 2,416 2,356 2,55% Total other current liabilities and derivatives 52,236 46,970 11,21%
Derivatives on commodities reflect the negative fair value of speculative derivatives on the prices of short-term gas and energy commodities. The difference in the balance is attributable to different seasonality in the two periods of comparison, with particular reference to VAT and other tax liabilities. Accruals and deferrals have been allocated on an accrual basis and mainly result from billing flows. Sundry payables include liabilities for 2.5 million euro dividends not yes paid.
34. LIABILITIES HELD FOR SALE The company does not report any value under this item. It previously contained the value of the business unit relating to urban hygiene operations in the Lodi area which, following the non-finalisation of the transfer, the Group deemed appropriate not to create an asset held for sale and reclassify it under current liabilities.
35. GUARANTEES ISSUED Below is a summary table of the guarantees and commitments undertaken towards third parties by the LGH Group and in being at 06/30/2017, in addition to payables and liabilities already included in the consolidated financial statements. 06/30/2017 12/31/2016 Guarantees issued 244,775 205,041
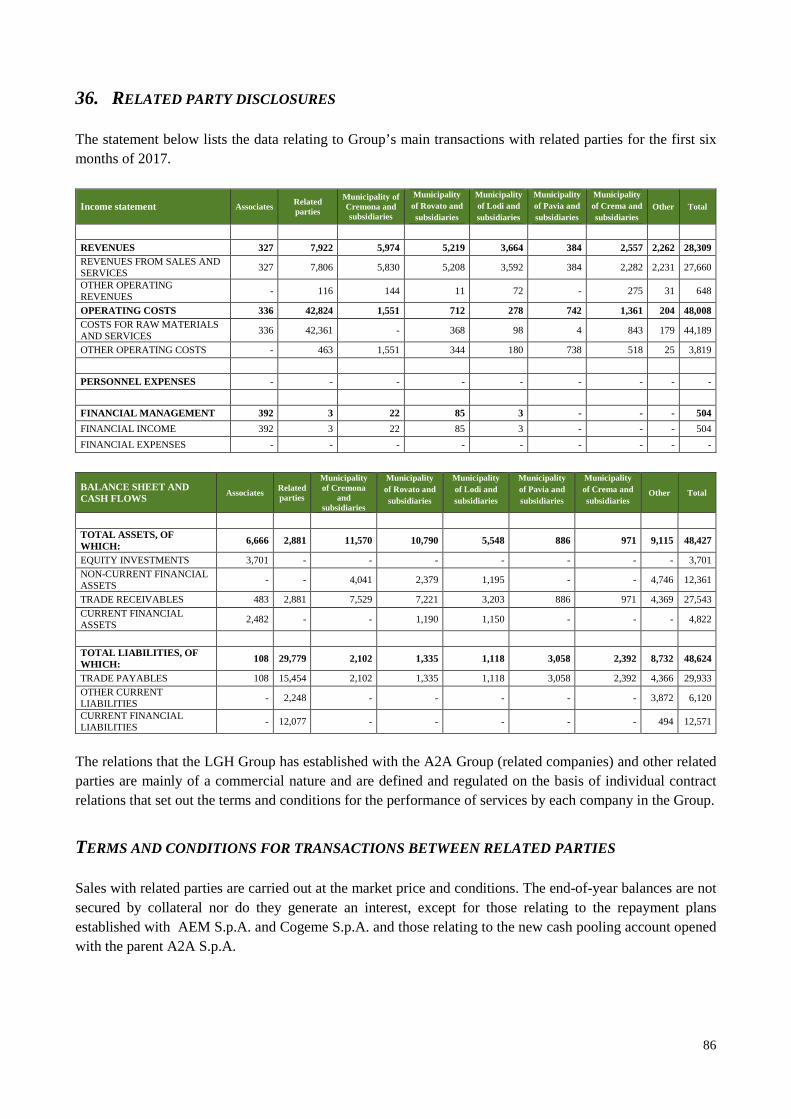
86
36. RELATED PARTY DISCLOSURES The statement below lists the data relating to Group’s main transactions with related parties for the first six months of 2017.
Income statement Associates Related parties
Municipality of Cremona and subsidiaries
Municipality of Rovato and subsidiaries
Municipality of Lodi and subsidiaries
Municipality of Pavia and subsidiaries
Municipality of Crema and subsidiaries
Other Total
REVENUES 327 7,922 5,974 5,219 3,664 384 2,557 2,262 28,309 REVENUES FROM SALES AND SERVICES
327 7,806 5,830 5,208 3,592 384 2,282 2,231 27,660
OTHER OPERATING REVENUES
- 116 144 11 72 - 275 31 648
OPERATING COSTS 336 42,824 1,551 712 278 742 1,361 204 48,008 COSTS FOR RAW MATERIALS AND SERVICES
336 42,361 - 368 98 4 843 179 44,189
OTHER OPERATING COSTS - 463 1,551 344 180 738 518 25 3,819
PERSONNEL EXPENSES - - - - - - - - -
FINANCIAL MANAGEMENT 392 3 22 85 3 - - - 504
FINANCIAL INCOME 392 3 22 85 3 - - - 504
FINANCIAL EXPENSES - - - - - - - - -
BALANCE SHEET AND CASH FLOWS
Associates Related parties
Municipality of Cremona
and subsidiaries
Municipality of Rovato and subsidiaries
Municipality of Lodi and subsidiaries
Municipality of Pavia and subsidiaries
Municipality of Crema and subsidiaries Other Total
TOTAL ASSETS, OF WHICH: 6,666 2,881 11,570 10,790 5,548 886 971 9,115 48,427
EQUITY INVESTMENTS 3,701 - - - - - - - 3,701 NON-CURRENT FINANCIAL ASSETS
- - 4,041 2,379 1,195 - - 4,746 12,361
TRADE RECEIVABLES 483 2,881 7,529 7,221 3,203 886 971 4,369 27,543
CURRENT FINANCIAL ASSETS
2,482 - - 1,190 1,150 - - - 4,822
TOTAL LIABILITIES, OF WHICH: 108 29,779 2,102 1,335 1,118 3,058 2,392 8,732 48,624
TRADE PAYABLES 108 15,454 2,102 1,335 1,118 3,058 2,392 4,366 29,933 OTHER CURRENT LIABILITIES
- 2,248 - - - - - 3,872 6,120
CURRENT FINANCIAL LIABILITIES
- 12,077 - - - - - 494 12,571
The relations that the LGH Group has established with the A2A Group (related companies) and other related parties are mainly of a commercial nature and are defined and regulated on the basis of individual contract relations that set out the terms and conditions for the performance of services by each company in the Group.
TERMS AND CONDITIONS FOR TRANSACTIONS BETWEEN RELATED PARTIES Sales with related parties are carried out at the market price and conditions. The end-of-year balances are not secured by collateral nor do they generate an interest, except for those relating to the repayment plans established with AEM S.p.A. and Cogeme S.p.A. and those relating to the new cash pooling account opened with the parent A2A S.p.A.
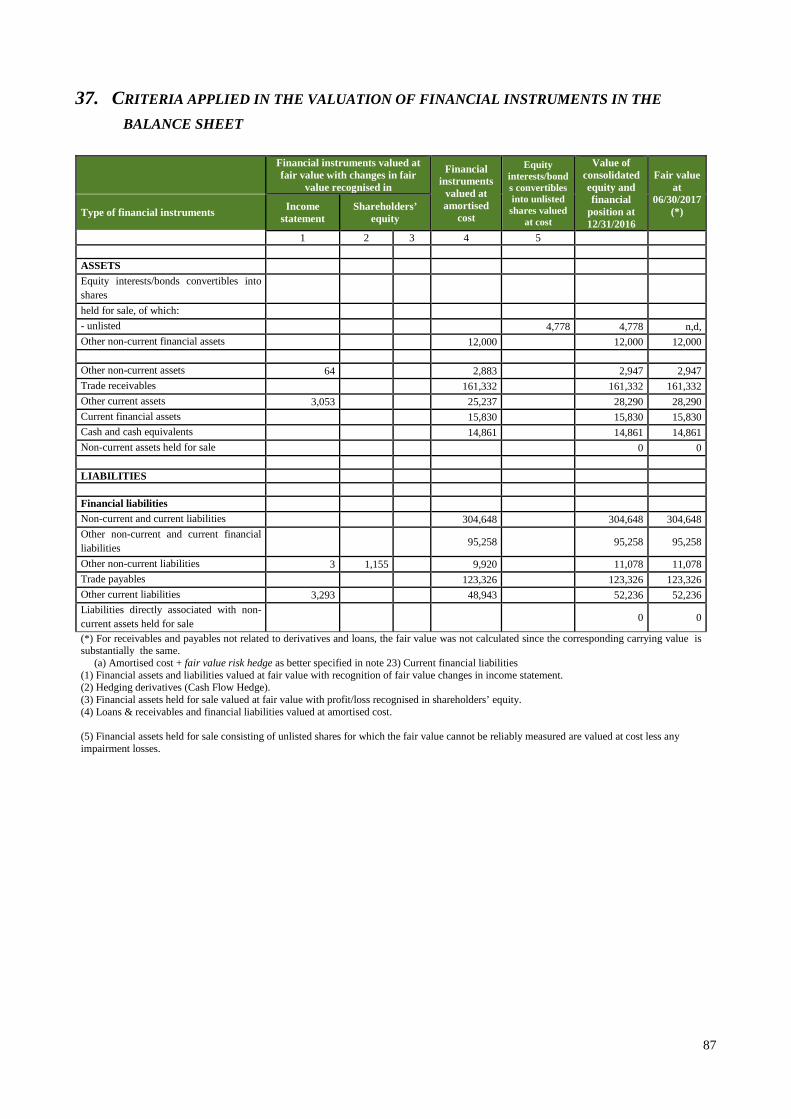
87
37. CRITERIA APPLIED IN THE VALUATION OF FINANCIAL INSTR UMENTS IN THE
BALANCE SHEET
Financial instruments valued at fair value with changes in fair
value recognised in
Financial instruments
valued at amortised
cost
Equity interests/bonds convertibles into unlisted shares valued
at cost
Value of consolidated equity and financial
position at 12/31/2016
Fair value at
06/30/2017 (*) Type of financial instruments Income
statement Shareholders’
equity
1 2 3 4 5
ASSETS Equity interests/bonds convertibles into shares
held for sale, of which: - unlisted 4,778 4,778 n,d, Other non-current financial assets 12,000 12,000 12,000 Other non-current assets 64 2,883 2,947 2,947 Trade receivables 161,332 161,332 161,332 Other current assets 3,053 25,237 28,290 28,290 Current financial assets 15,830 15,830 15,830 Cash and cash equivalents 14,861 14,861 14,861 Non-current assets held for sale 0 0 LIABILITIES Financial liabilities Non-current and current liabilities 304,648 304,648 304,648 Other non-current and current financial liabilities
95,258 95,258 95,258
Other non-current liabilities 3 1,155 9,920 11,078 11,078 Trade payables 123,326 123,326 123,326 Other current liabilities 3,293 48,943 52,236 52,236 Liabilities directly associated with non-current assets held for sale
0 0
(*) For receivables and payables not related to derivatives and loans, the fair value was not calculated since the corresponding carrying value is substantially the same. (a) Amortised cost + fair value risk hedge as better specified in note 23) Current financial liabilities (1) Financial assets and liabilities valued at fair value with recognition of fair value changes in income statement. (2) Hedging derivatives (Cash Flow Hedge). (3) Financial assets held for sale valued at fair value with profit/loss recognised in shareholders’ equity. (4) Loans & receivables and financial liabilities valued at amortised cost. (5) Financial assets held for sale consisting of unlisted shares for which the fair value cannot be reliably measured are valued at cost less any impairment losses.
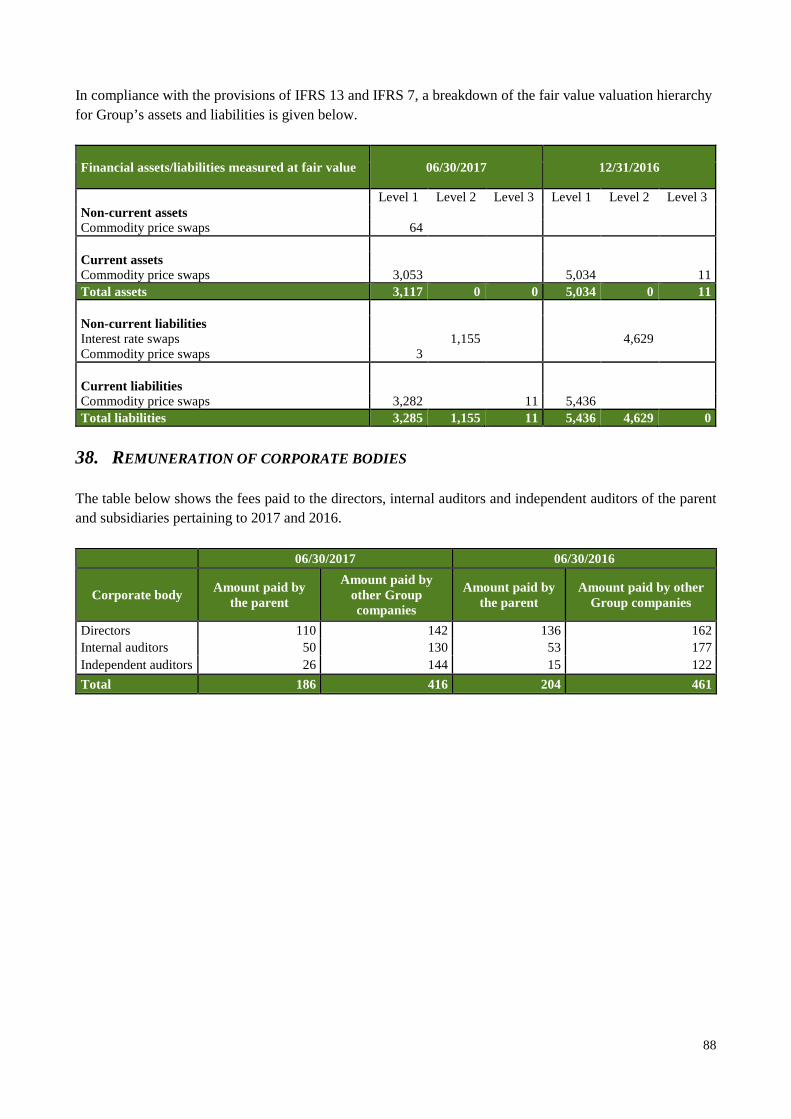
88
In compliance with the provisions of IFRS 13 and IFRS 7, a breakdown of the fair value valuation hierarchy for Group’s assets and liabilities is given below.
Financial assets/liabilities measured at fair value 06/30/2017 12/31/2016
Level 1 Level 2 Level 3 Level 1 Level 2 Level 3 Non-current assets Commodity price swaps 64 Current assets Commodity price swaps 3,053 5,034 11 Total assets 3,117 0 0 5,034 0 11 Non-current liabilities Interest rate swaps 1,155 4,629 Commodity price swaps 3 Current liabilities Commodity price swaps 3,282 11 5,436 Total liabilities 3,285 1,155 11 5,436 4,629 0
38. REMUNERATION OF CORPORATE BODIES The table below shows the fees paid to the directors, internal auditors and independent auditors of the parent and subsidiaries pertaining to 2017 and 2016.
06/30/2017 06/30/2016
Corporate body Amount paid by
the parent
Amount paid by other Group companies
Amount paid by the parent
Amount paid by other Group companies
Directors 110 142 136 162 Internal auditors 50 130 53 177 Independent auditors 26 144 15 122
Total 186 416 204 461
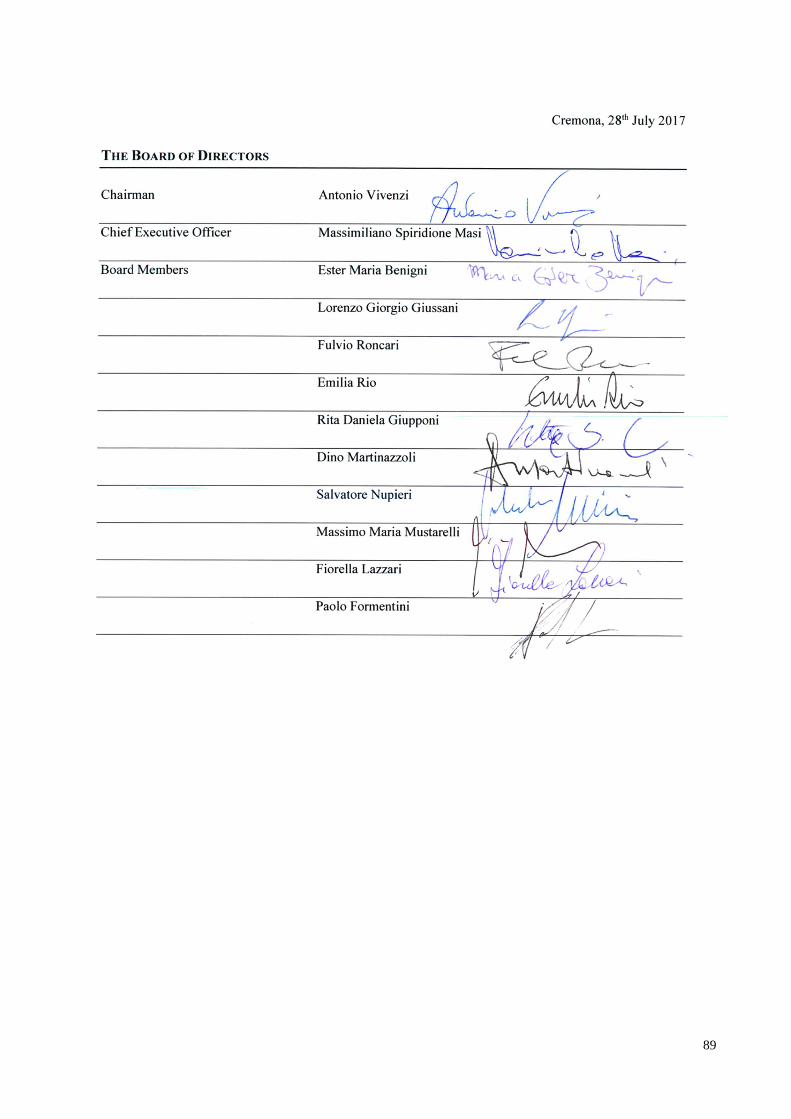
89


![Clinical Study Effect of Capacitive Radiofrequency …downloads.hindawi.com/journals/drp/2013/715829.pdfof grade and cellulite (according to Curri s classi cation) [ ], located in](https://static.fdocumenti.com/doc/165x107/5f4f9bb089b3ba5aec5c0f71/clinical-study-effect-of-capacitive-radiofrequency-of-grade-and-cellulite-according.jpg)