IL “ CATEGORY “ PER IL MERCATO INGLESE D r i nk i ng w at er Pu b l i c tr ans por t BS E GM M...
26
IL “ CATEGORY “ PER IL MERCATO INGLESE di David Buck
Transcript of IL “ CATEGORY “ PER IL MERCATO INGLESE D r i nk i ng w at er Pu b l i c tr ans por t BS E GM M...

IL “ CATEGORY “PER IL MERCATO INGLESE
di David Buck

La filieraLa filieraPrima del Category ManagementPrima del Category Management
SUPERMERCATO FORNITORE
DISTRIBUTORE

Consumatore
Supermercato Fornitore
Distributore
Category ManagementCategory Management

Ruolo del Supermercato
• Ruolo del compratore è cambiato ed è rivolto con maggiori attenzioni verso il consumatore e a ciò che accade nei negozi
• Marketing Research• Focus Group
• Dati statistici per la valutazione dei fornitori, KPI (Key Performance Indicators) Tabelle e Grafici
• Dà responsabilità al distributore
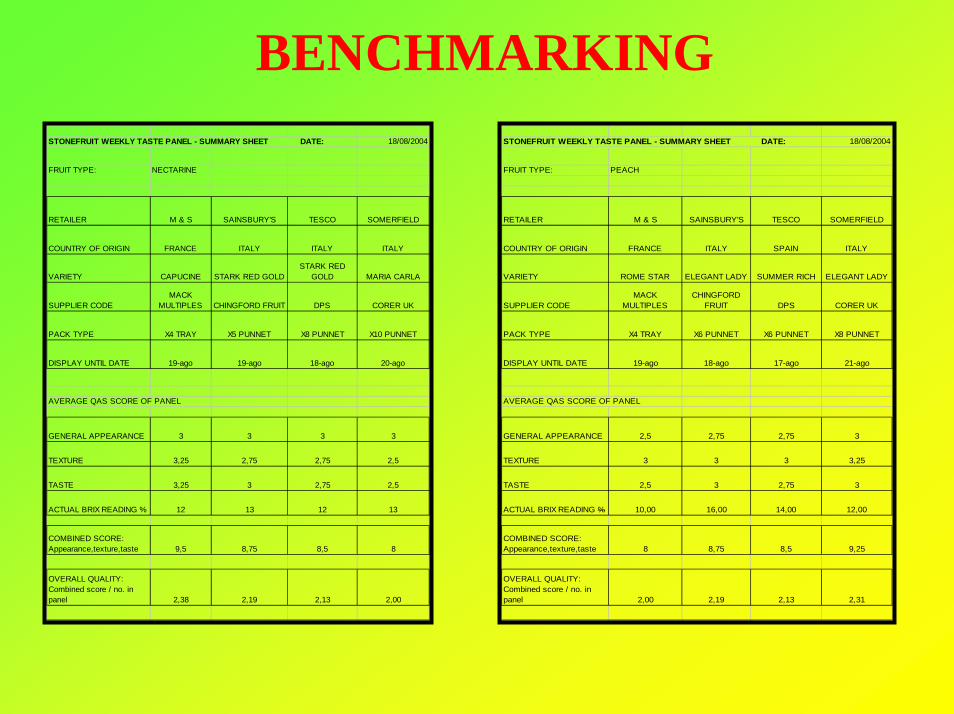
BENCHMARKINGSTONEFRUIT WEEKLY TASTE PANEL - SUMMARY SHEET DATE: 18/08/2004
FRUIT TYPE: NECTARINE
RETAILER M & S SAINSBURY'S TESCO SOMERFIELD
COUNTRY OF ORIGIN FRANCE ITALY ITALY ITALY
VARIETY CAPUCINE STARK RED GOLDSTARK RED
GOLD MARIA CARLA
SUPPLIER CODEMACK
MULTIPLES CHINGFORD FRUIT DPS CORER UK
PACK TYPE X4 TRAY X5 PUNNET X8 PUNNET X10 PUNNET
DISPLAY UNTIL DATE 19-ago 19-ago 18-ago 20-ago
AVERAGE QAS SCORE OF PANEL
GENERAL APPEARANCE 3 3 3 3
TEXTURE 3,25 2,75 2,75 2,5
TASTE 3,25 3 2,75 2,5
ACTUAL BRIX READING % 12 13 12 13
COMBINED SCORE: Appearance,texture,taste 9,5 8,75 8,5 8
OVERALL QUALITY: Combined score / no. in panel 2,38 2,19 2,13 2,00
STONEFRUIT WEEKLY TASTE PANEL - SUMMARY SHEET DATE: 18/08/2004
FRUIT TYPE: PEACH
RETAILER M & S SAINSBURY'S TESCO SOMERFIELD
COUNTRY OF ORIGIN FRANCE ITALY SPAIN ITALY
VARIETY ROME STAR ELEGANT LADY SUMMER RICH ELEGANT LADY
SUPPLIER CODEMACK
MULTIPLESCHINGFORD
FRUIT DPS CORER UK
PACK TYPE X4 TRAY X6 PUNNET X6 PUNNET X8 PUNNET
DISPLAY UNTIL DATE 19-ago 18-ago 17-ago 21-ago
AVERAGE QAS SCORE OF PANEL
GENERAL APPEARANCE 2,5 2,75 2,75 3
TEXTURE 3 3 3 3,25
TASTE 2,5 3 2,75 3
ACTUAL BRIX READING % 10,00 16,00 14,00 12,00
COMBINED SCORE: Appearance,texture,taste 8 8,75 8,5 9,25
OVERALL QUALITY: Combined score / no. in panel 2,00 2,19 2,13 2,31
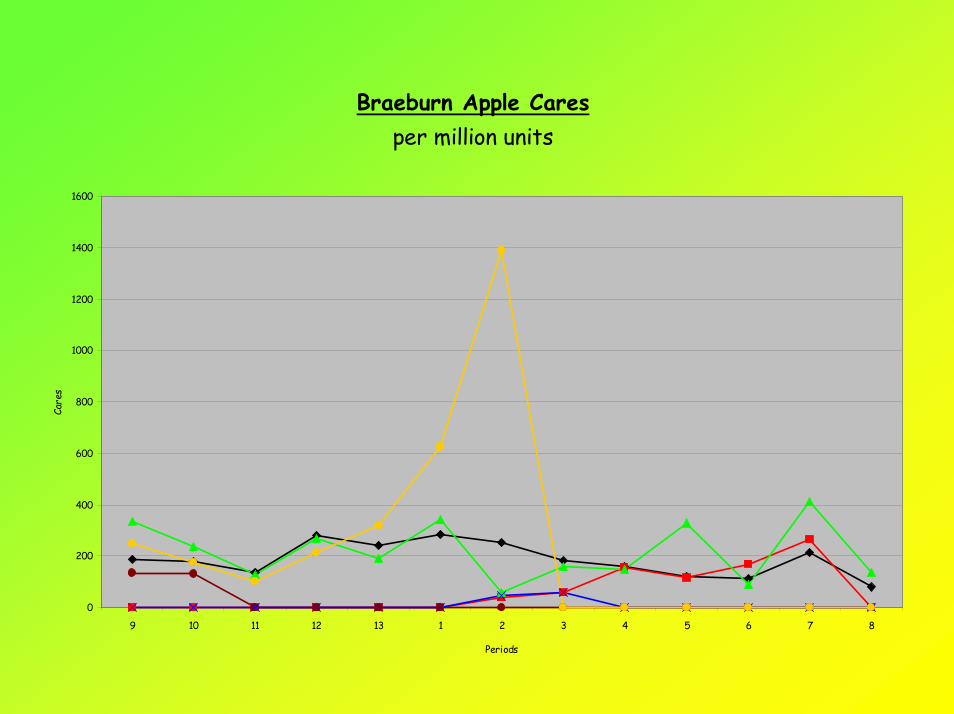
Braeburn Apple Caresper million units
0
200
400
600
800
1000
1200
1400
1600
9 10 11 12 13 1 2 3 4 5 6 7 8
Periods
Care
s

Golden Delicious Apple Caresper million units
0
100
200
300
400
500
600
700
800
900
1000
9 10 11 12 13 1 2 3 4 5 6 7 8
Periods
Care
s

Granny Smith Apple Caresper million units
0
100
200
300
400
500
600
700
9 10 11 12 13 1 2 3 4 5 6 7 8
Periods
Care
s

Tot Stonefruit Tot Peach Tot NectarineTrade % cge yr on yr (Expenditure) -4,47 20,10 -19,19
Cash value (000's) £46.259 £7.614 £16.273Cash value of yr on yr growth (000's) -£2.164 £1.274 -£3.864% contribution to Total Stone Fruit 16,46% 35,18%
Sainsbury Market Share 2004 18,07 12,06 18,48Market Share 2003 18,91 9,09 19,49% cge yr on yr (Expenditure) -8,73 59,31 -23,41Cash value (000's) £8.358 £918 £3.006Cash value of yr on yr growth (000's) -£799 £342 -£919% contribution to Total Stone Fruit 10,99% 35,97%
Tesco Market Share 2004 22,77 21,56 23,62Market Share 2003 23,79 20,74 24,90% cge yr on yr (Expenditure) -8,56 24,84 -23,32Cash value (000's) £10.533 £1.641 £3.844Cash value of yr on yr growth (000's) -£986 £327 -£1.169% contribution to Total Stone Fruit 15,58% 36,50%
Safeway Market Share 2004 6,59 8,57 6,95Market Share 2003 8,79 10,00 9,41% cge yr on yr (Expenditure) -28,31 2,93 -40,36Cash value (000's) £3.050 £653 £1.130Cash value of yr on yr growth (000's) -£1.204 £19 -£765% contribution to Total Stone Fruit 21,40% 37,07%
Morrisons Market Share 2004 5,08 7,77 6,19Market Share 2003 3,99 4,64 4,48% cge yr on yr (Expenditure) 21,49 100,88 11,76Cash value (000's) £2.350 £591 £1.008Cash value of yr on yr growth (000's) £416 £297 £106% contribution to Total Stone Fruit 25,16% 42,89%
Asda Market Share 2004 10,24 12,27 11,78Market Share 2003 9,09 13,03 10,24% cge yr on yr (Expenditure) 7,69 13,07 -7,01Cash value (000's) £4.738 £934 £1.917Cash value of yr on yr growth (000's) £338 £108 -£144% contribution to Total Stone Fruit 19,71% 40,46%
M & S Market Share 2004 8,32 3,67 7,15Market Share 2003 8,49 7,16 5,60% cge yr on yr (Expenditure) -6,35 -38,41 3,17Cash value (000's) £3.849 £279 £1.163Cash value of yr on yr growth (000's) -£261 -£174 £36% contribution to Total Stone Fruit 7,26% 30,22%
Waitrose Market Share 2004 4,23 5,07 3,39Market Share 2003 3,15 4,44 2,89% cge yr on yr (Expenditure) 28,23 37,19 -5,25Cash value (000's) £1.957 £386 £551Cash value of yr on yr growth (000's) £431 £105 -£31% contribution to Total Stone Fruit 19,74% 28,18%
MARKET SHARE
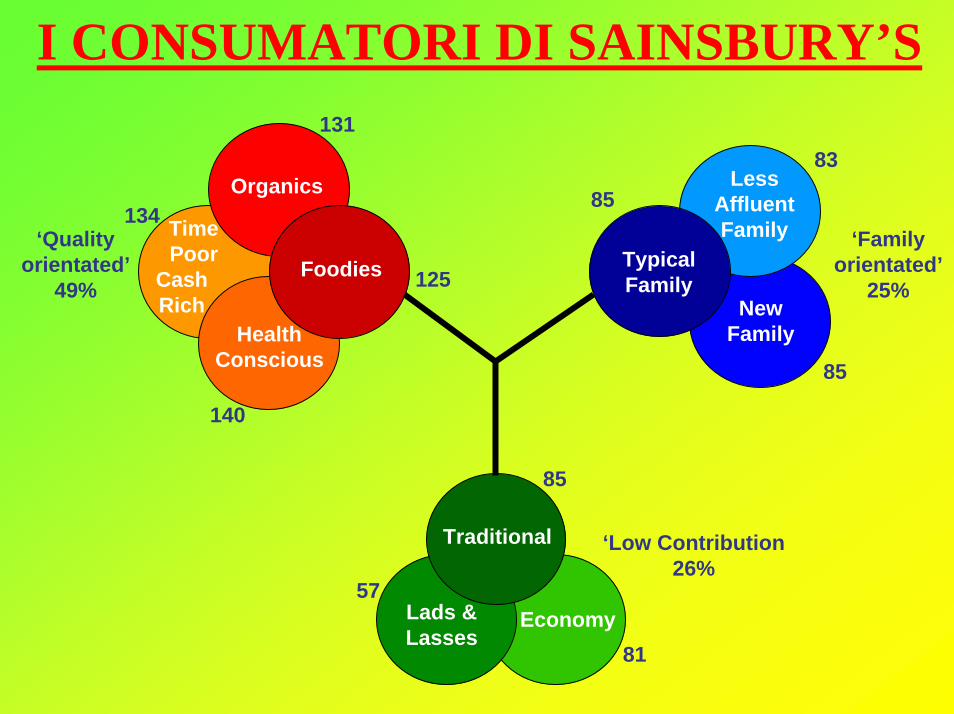
I CONSUMATORI DI SAINSBURY’S
Organics
TimePoor
CashRich
HealthConscious
Foodies TypicalFamily
LessAffluentFamily
NewFamily
Traditional
Lads &Lasses
Economy
‘Qualityorientated’
49%
‘Familyorientated’
25%
‘Low Contribution26%
85
81
57
85
83
85
131
125
140
134

CAPIRE I CONSUMATORI INFLUENZA LO STILE ARCHITETTONICO DEL SUPERMERCATO
TailoredOffers Formats Organisation Property
PortfolioPresente CustomerOpportunity
PropertyPortfolio
DifferentialOffer
RelevantCustomersPassato Organisation Formats

Q FB Q F Q FF
B
Q
Main+ AverageMain Average Main HighMain+ Low
Main Low
Q F
MixedGrab & Go
MixedMeals
Q F
P S+ ESP S+ ES P S+ ES P S+ ES P S+ ES P S+ ES
☺☺ ☺☺ ☺☺ ☺☺☺ ☺££
£ ££ £ ££
Qv
Qv
Qv
Qv
Qv
Qv
Qv
Qv
Proposition First for Food
Toolkit
Environment
Marc Profile
Own Label
Range / Choice
Q = Quality (TDD, BGTY, Premium Brands)F = Family (Standard+, Standard, Some Economy)B = Budget (Extended Economy, Tertiary Brands)
P = Premium S = StandardS+ = Standard Plus E = Economy
No Frills + GM----------------------------------------------
No Frills First for Foodies
Superior Food + GMFor Family and Home
-----------------------------------------------
First for Foodies & Typical Families
Fast, Fresh, NewAnd ExcitingFirst for Fresh
BusinessBenchmark
Extended
BasicNo Frills
Standard Flagship
+ Non-Food Starbuys + Non-Food Starbuys
Profile 18 Profile xxProfile 14 Avg: Profile 12High: Profile 13 Profile 11
TIPO DI SUPERMERCATI
Promotions
Service
Brand
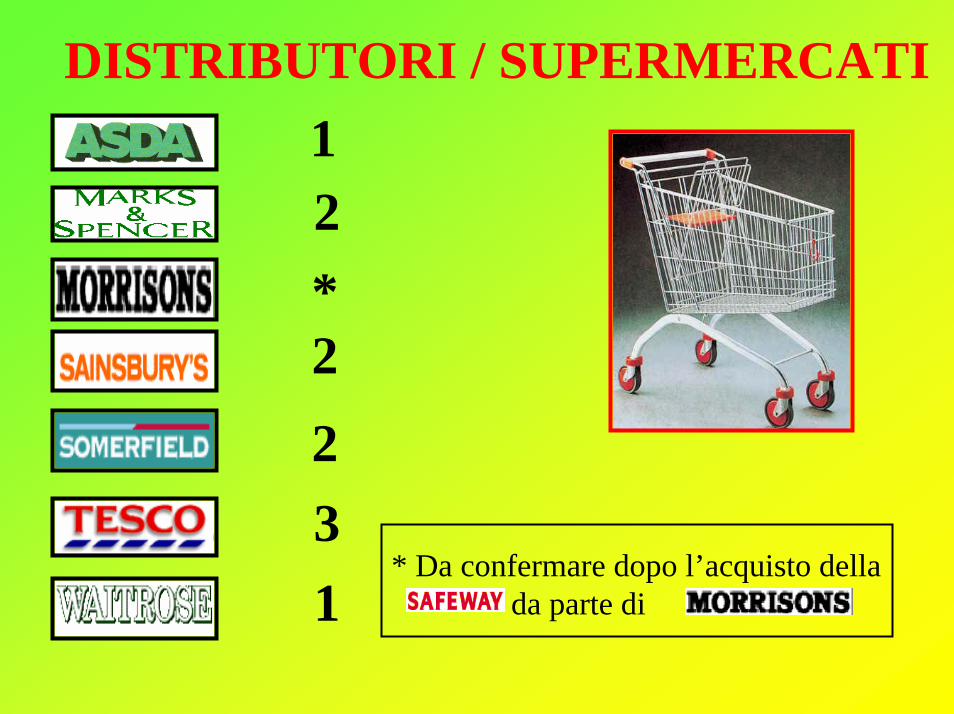
DISTRIBUTORI / SUPERMERCATI12*2
231
* Da confermare dopo l’acquisto dellada parte di

Responsabilità del Distributore• Protegge il fatturato, il margine, il profitto del
supermercato• Fornire 52 settimane all’anno / Programmi• Prodotto secondo le specifiche di qualità del prodotto• Più libertà di scegliere i fornitori o paesi d'origine, tra
quelli approvati dal supermercato.• Il distributore deve inoltre garantire:
– Eurep Gap BRC Nature’s Choice (Certificazioni di qualità)– Carichi Diretti - Trasporto – Packaging, tecnologia, – Nuove varietà

IL DOVERE DEL FORNITORE
• Capacità di coprire i programmi• Specifiche di qualità del prodotto• Rispettare le regole di Assicurazione Qualità
(BRC - Eurep GAP – Nature’s Choice)• Fedeltà reciproca
COSA VUOLE IL CONSUMATORE
• Prodotto sano e sicuro• Prodotto disponibile tutto l’anno con stessa qualità
e caratteristiche• Prodotto che soddisfi i propri gusti
– facile da mangiare (senza semi)– sempre più dolce (Kiwi, Ananas)
• Confezioni adatte• Al consumatore non interessa la provenienza del
prodotto
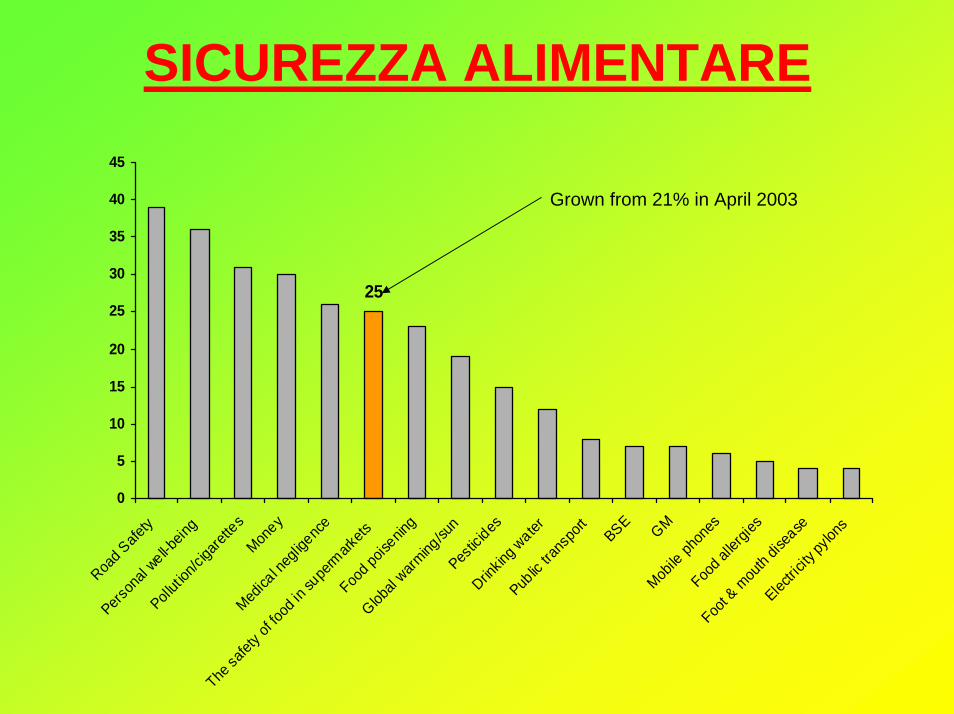
SICUREZZA ALIMENTARE
25
0
5
10
15
20
25
30
35
40
45
Road S
afety
Person
al well-b
eing
Pollut i
on/ci
garet
tesMon
ey
Medica
l neg
ligenc
e
The sa
fety o
f food
in su
perm
arkets
Food p
oisenin
g
Global
warming
/sun
Pestic
idesDrin
king w
ater
Public
trans
port
BSE GMMob
ile ph
ones
Food a
llergi
es
Foot &
mou
th dis
ease
Electric
ity py
lons
Grown from 21% in April 2003

0
10
20
30
40
50
60
70
80
90
100
Salmon
ella &
E-Coli
BSE in bee
fHigh s
ugar/fa
tBSE in
lamb
Pesticid
e res
idues o
n prod
uce
Quality
chec
ked fo
r SSL
Misleadin
g lab
elling
High salt
levels
Caged h
ens
DNA trace
ability
of bee
f GMPes
ticides
Artificia
l flavo
uring
sFoo
d colou
rings
Suppo
rting B
ritish
farm
ersFarm
assu
rance
GM in anim
al fee
d
Environ
mental
damag
e thro
ugh fa
rming
Animal w
elfare
in m
eat/e
gg pr
oduct
ion
Preserv
atives
in fo
od
Antibiot
ics in
anim
al tre
atmen
t
Unhealt
hy kid
's foo
d
Recycling
- pac
kagin
g
Ingredie
nt au
thenti
city
0
10
20
30
40
50
60
70
80
90
100
Pollutio
n
Fair tra
de prod
uctsLo
cal sourc
ing
Food wast
age in
store
Colours in
an imal feed
Animal m
atter
in an
imal
feed
SSL outdoor re
ared ra
nge
Socially
respon
sible tra
ding
On pack tem
perature
Food a llergies
/range
Artific ia l sw
eeteners
Mecha
nically
recov
ered m
eat
Recycling
facili
ties in
store
Added water in
meat/fi
sh produc
ts
Sourcing
from th
e wildBiodiv
ersityFortif
icatio
nFoo
d miles
British organic
farm
ersOrgan
ic foo
d5-a
-day
Highest
organ
ic standa
rds
Use of w
ords li
ke trad
itiona
l/assur
ed
Irradia
tion of fo
od
Marine Stew
ardship
Council
Nov 2002 Nov 2004Nov 2003 Biggest increases
SICUREZZA ALIMENTARE

SICUREZZA ALIMENTARE
• Eurep Gap/ BRC / Tracciabilità/Nature’s Choice• Prodotti Biologici• Cattiva pubblicità sulla stampa ed in TV• Name & Shame• Commercio Equo - Solidale• Social Responsible Trading ( es. SA 8000 )

NETTARINE
• PUNTI FORTI – Buone varietà apprezzate dal mercato inglese– Buone quantità, disponibili in maniera uniforme durante
tutta la stagione.– Il mercato in leggera crescita a scapito delle pesche.
• PUNTI DEBOLI– Mancanza di proposte di nuova varietà in confronto alla
Spagna.– Non adeguati controlli di qualità e di shelf life durante le
operazioni di confezionamento.– Prodotto non uniforme.
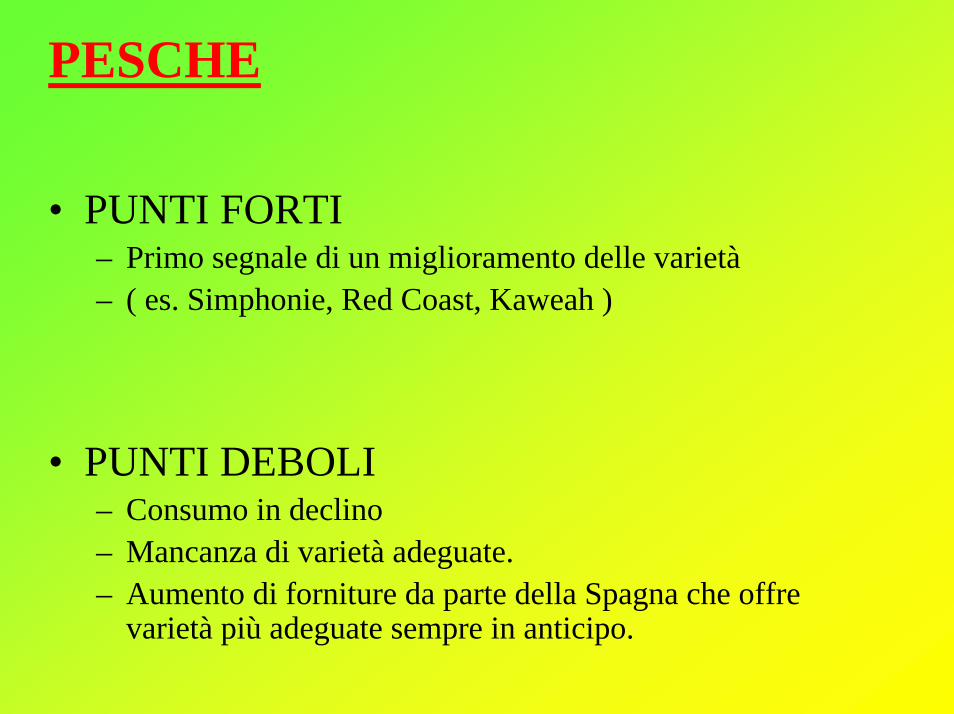
PESCHE
• PUNTI FORTI– Primo segnale di un miglioramento delle varietà – ( es. Simphonie, Red Coast, Kaweah )
• PUNTI DEBOLI– Consumo in declino– Mancanza di varietà adeguate.– Aumento di forniture da parte della Spagna che offre
varietà più adeguate sempre in anticipo.
TECNOLOGIA
• Per innalzare il livello medio qualitativo e per portare un maggiore uniformità e fiducia al consumatore occorre sfruttare le nuove tecnologie
• Lo strumento FTA ( Pressione )• La tecnologia NIR ( °Bx – Difetti Interni)

VENDITE IN % DEI PRODOTTI DI LARGO CONSUMO
Percentage contribution of individual sub-categories
2 0.9 6 % 2 2 .4 2 % 1 9 .4 3 %2 5 .1 9 % 2 3 .6 9 %
1 4 .7 0%1 9 .3 9 %
2 4 .4 6 %
1 3 .4 0%1 5 .2 1 % 1 8 .01 %
1 9 .5 3 %1 8 .1 6 %
1 0.2 8 %
1 6 .2 3 %
2 0.8 5 %
1 7 .7 7 %1 7 .8 7 % 1 7 .03 %
1 6 .7 3 %1 6 .6 9 %
1 4 .00%
1 7 .7 5 %
1 6 .1 7 %
7 .6 7 % 8 .4 2 %
7 .8 4 %7 .4 9 %
1 4 .9 4 %
8 .3 8 %
8 .7 2 %1 1 .8 6 %
1 3 .1 3 % 1 2 .4 2 %
1 2 .4 5 %1 1 .2 4 %
1 3 .6 1 %
1 0.06 %
1 0.8 7 %8 .1 7 %
8 .2 9 % 7 .7 2 %8 .04 %
8 .9 8 %
1 2 . 9 1 % 1 2 . 4 3 %8 . 7 5 %
2 3 . 1 5 %1 5 . 2 2 %
8 . 4 3 %
4 .2 6 %
4 .4 0% 3 .8 1 %
5 .1 8 %
5 .9 1 %5 .3 7 %
4 .5 0%4 .8 6 %
1 0.4 8 %
6 .2 2 %6 .9 4 %
4 .1 2 %
5 . 9 3 %1 0 . 4 9 %
0%
10%
20%
30%
40%
50%
60%
70%
80%
90%
100%
Sainsbury Tesco Saf eway Asda Morr isons Marks andSpencer
Wait rose Somerf ield
Apple Bananas Citrus Pears Stone-fruit Grapes Tropical Soft fruit

CONCLUSIONI
• Il consumatore è la figura più importante della filiera
• I Supermercati UK hanno quasi monopolizzato la distribuzione ( 80% )
• Il paese d’origine del prodotto ha adesso poca importanza

CONCLUSIONI
• I fornitori diventano sempre più specializzati e per “selezione naturale” il loro numero si riduce
• Chi non rispetta le regole imposte dal Supermercato è fuori…comunque coloro che le rispettano hanno accesso al canale di vendita più importante del mercato UK (80%)

…E FINALMENTE !!!!!!!

![CPDLViolino [I] T T T T ˝ ‘ Violino [II] T ˝ ‘ ‘ • ‘ ˝ ˝ ‘ Cornetto [I] T T T T ˝ ‘ Cornetto [II] T ˝ ‘ ‘ • ‘ ˝ ˝ ‘ Cornetto [III] T T T](https://static.fdocumenti.com/doc/165x107/603c519bcaf49e6c0f1d3476/violino-i-t-t-t-t-a-violino-ii-t-a-a-a-a-a-cornetto.jpg)