Fosca Giannotti Pisa KDD Lab, ISTI-CNR & Univ. Pisa...
113
Data Mining (Analisi dei dati ed estrazione di conoscenza) Informatica per l’Economia e l’Azienda Fosca Giannotti Pisa KDD Lab, ISTI-CNR & Univ. Pisa http://www-kdd.isti.cnr.it/ DIPARTIMENTO DI INFORMATICA - Università di Pisa anno accademico 2006/2007
Transcript of Fosca Giannotti Pisa KDD Lab, ISTI-CNR & Univ. Pisa...
Data Mining(Analisi dei dati ed estrazione di conoscenza)Informatica per l’Economia e l’Azienda
Fosca GiannottiPisa KDD Lab, ISTI-CNR & Univ. Pisa
http://www-kdd.isti.cnr.it/
DIPARTIMENTO DI INFORMATICA - Università di Pisaanno accademico 2006/2007

Giannotti & PedreschiAnno accademico, 2004/2005 Introduzione 2
Data Mining (Analisi dei dati ed estrazione di
conoscenza)
Acronimo: DM (Data Mining)Orario: Lunedì 14-16 aula D1, Giovedi 11-13 aula CDocenti:
Fosca Giannotti, ISTI-CNR, [email protected] Nanni, ISTI-CNR, [email protected]
Ricevimento:⌧Giannotti: mercoledì 15-17, ISTI, Area Ricerca CNR, località
San Cataldo, Pisa (prenotazione per e-mail)

Giannotti & PedreschiAnno accademico, 2004/2005 Introduzione 3
Data MiningRiferimenti bibliografici
Pang-Ning Tan, Michael Steinbach, Vipin Kumar, Introduction to DATA MINING, Addison Wesley, ISBN 0-321-32136-7, 2006Jiawei Han, Micheline Kamber, Data Mining: Concepts and Techniques, Morgan Kaufmann Publishers, 2000 http://www.mkp.com/books_catalog/catalog.asp?ISBN=1-55860-489-8 U. Fayyad, G. Piatetsky-Shapiro, P. Smyth, R. Uthurusamy(editors). Advances in Knowledge discovery and data mining, MITPress, 1996. Barry Linoff Data Mining Techniques for Marketing Sales and Customer Support, John Wiles & Sons, 2002
I lucidi utilizzati nelle lezioni saranno resi disponibili attraverso il sito web del corso: http://www-kdd.isti.cnr.it/
Giannotti & PedreschiAnno accademico, 2004/2005 Introduzione 4
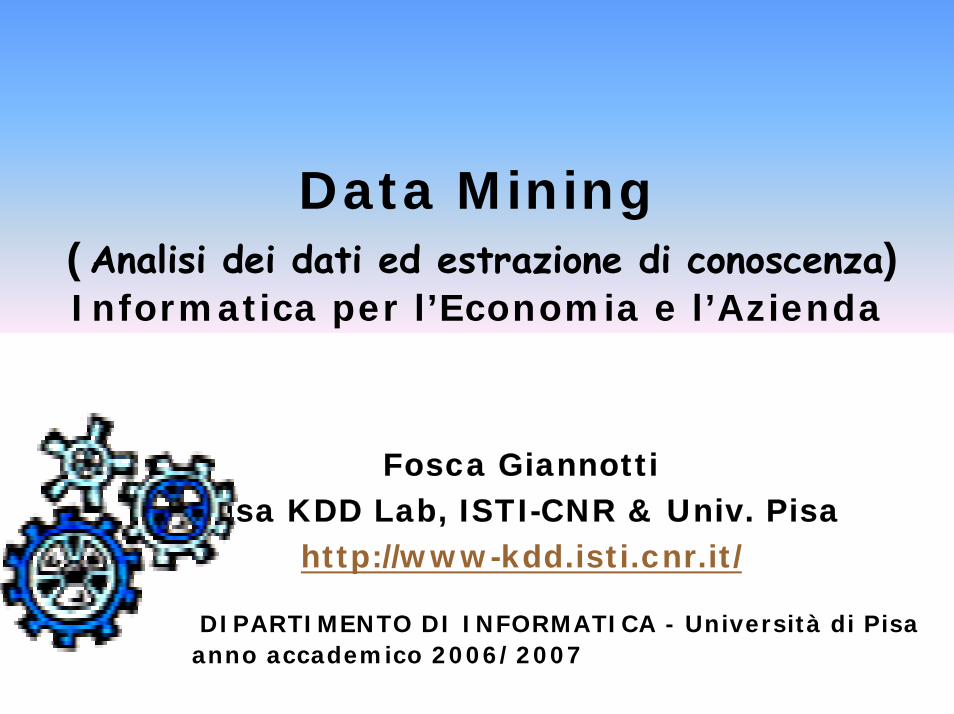
Questionario
Tipi di Lauree di primo livello:
Laurea in Informatica: 3 Siena (WEA), 10 Pisa
(Wea), Cagliari (Wea), Bari (Wea)
Laurea in Informatica Umanistica: 4
Giannotti & PedreschiAnno accademico, 2004/2005 Introduzione 5
Questionario
Messaggio e-mail [email protected] con
subject: Corso Data Mining
Contenuto⌧Nome e Cognome………………..
⌧e-mail:……………………………
⌧Corso di laurea, provenienza :……………………..
⌧Corsi di basi di dati:
⌧•

Giannotti & PedreschiAnno accademico, 2004/2005 Introduzione 6
Contenuti del corso Data MiningAnalisi dei Dati ed Estrazione di conoscenza
Una parte preliminare dove si introducono i concetti essenziali del processo di estrazione della conoscenza: studio e preparazione dei dati, forme dei dati, misure e similarità dei datiUna parte centrale dove si introducono le principali tecniche didatamining (regole associative, classificazione e clustering). Di queste tecniche si studieranno gli aspetti formali e implementativi;Una parte più metodologica dove: si visiteranno alcune casi di studio nell’ambito del marketing, del supporto alla gestione clienti e dell’evasione fiscale.Una parte del corso si concentrerà sulle dimensioni e le metodologie di sviluppo del processo di sul processo di estrazione di conoscenza.L’ultima parte del corso ha l’obiettivo di introdurre gli aspetti di privacy ed etici inerenti all’utilizzo di tecniche inferenza sui dati e dei quali l’analista deve essere a conoscenza
Giannotti & PedreschiAnno accademico, 2004/2005 Introduzione 7
Contenuti del corso
Introduzione e Concetti Basici (6 ore)Le applicazioniIl processo di knowledge discovery
Il processo di estrazione della conoscenza Le fasi iniziali: preparazione e pulizia dei dati
Introduzione alle tecniche di base (6 + 2 0re )Regole AssociativeAlberi di decisioneClustering
Algoritmi di Base (4 + 2 ore )Regole associative: algoritmo Apriori e varianti Alberi di Decisione: C4.5Clustering: K-Means

Giannotti & PedreschiAnno accademico, 2004/2005 Introduzione 8
Contenuti del corso
Il processo di estrazione della conoscenza Le dimensioni del processoEsempi di estrazione (Evasione fiscale, Business Intelligence)
Interpretazione e valutazione della qualità della conoscenza estratta
Rassegna di strumenti commercialiUno standard metodologico: CRISP Alcuni casi di studio: Custumer Segmentation, Basket Marketing Analysis, GeoMarketing…
Aspetti di privacy (2 ore)Contenuti del libro
Giannotti & PedreschiAnno accademico, 2004/2005 Introduzione 9
Modalità di valutazione
Verifica Intermedia 40% Progetto (Analisi dei dati): 60%
Progetti: Si dovranno fare gruppi da due. Gli studenti di un gruppo riceveranno lo stesso voto. La divisione del lavoro è loro responsabilità. I progetti, corredati di relazione, debbono essere presentati oralmente e se necessario con dimostrazione.I lucidi e le relazioni debbono essere rese
disponibili in PDF, PPT o HTML.
Giannotti & PedreschiAnno accademico, 2004/2005 Introduzione 10
Seminar 1 outline
MotivationsApplication AreasKDD Decisional ContextKDD ProcessArchitecture of a KDD systemThe KDD steps in short4 Examples in short

Giannotti & PedreschiAnno accademico, 2004/2005 Introduzione 11
Evolution of Database Technology:from data management to data analysis
1960s:Data collection, database creation, IMS and network DBMS.
1970s: Relational data model, relational DBMS implementation.
1980s: RDBMS, advanced data models (extended-relational, OO, deductive, etc.) and application-oriented DBMS (spatial, scientific, engineering, etc.).
1990s: Data mining and data warehousing, multimedia databases, and Web technology.
Giannotti & PedreschiAnno accademico, 2004/2005 Introduzione 12
Why Data Mining
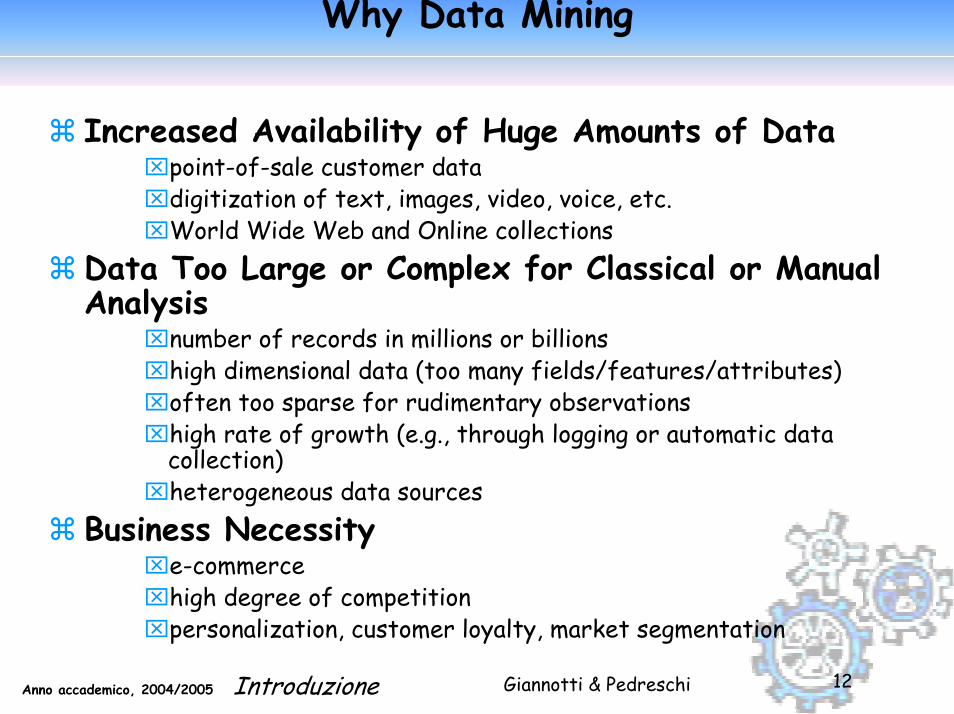
Increased Availability of Huge Amounts of Data⌧point-of-sale customer data⌧digitization of text, images, video, voice, etc.⌧World Wide Web and Online collections
Data Too Large or Complex for Classical or Manual Analysis
⌧number of records in millions or billions ⌧high dimensional data (too many fields/features/attributes)⌧often too sparse for rudimentary observations⌧high rate of growth (e.g., through logging or automatic data
collection)⌧heterogeneous data sources
Business Necessity⌧e-commerce⌧high degree of competition⌧personalization, customer loyalty, market segmentation

Giannotti & PedreschiAnno accademico, 2004/2005 Introduzione 13
Motivations“Necessity is the Mother of Invention”
Data explosion problem:Automated data collection tools, mature database technology and internet lead to tremendous amounts of data stored in databases, data warehouses and other information repositories.
We are drowning in information, but starving for knowledge! (John Naisbett)
Data warehousing and data mining :On-line analytical processingExtraction of interesting knowledge (rules, regularities, patterns, constraints) from data in large databases.

Giannotti & PedreschiAnno accademico, 2004/2005 Introduzione 14
Motivations for DM
Abundance of business and industry dataCompetitive focus - Knowledge ManagementInexpensive, powerful computing enginesStrong theoretical/mathematical foundations
machine learning & artificial intelligencestatisticsdatabase management systems
Giannotti & PedreschiAnno accademico, 2004/2005 Introduzione 15
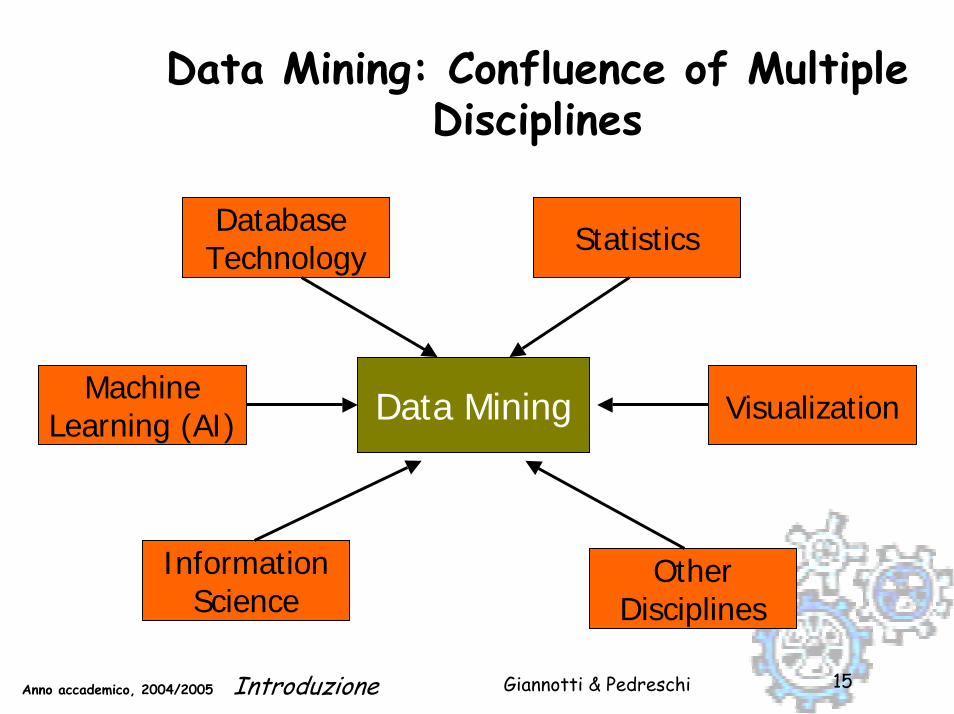
Data Mining: Confluence of Multiple Disciplines
Data Mining
Database Technology Statistics
MachineLearning (AI) Visualization
OtherDisciplines
InformationScience

Giannotti & PedreschiAnno accademico, 2004/2005 Introduzione 16
Sources of DataBusiness Transactions
widespread use of bar codes => storage of millions of transactions daily (e.g., Walmart: 2000 stores => 20M transactions per day)most important problem: effective use of the data in a reasonable time frame for competitive decision-makinge-commerce data
Scientific Datadata generated through multitude of experiments and observations examples, geological data, satellite imaging data, NASA earth observationsrate of data collection far exceeds the speed by which we analyze the data

Giannotti & PedreschiAnno accademico, 2004/2005 Introduzione 17
Sources of DataFinancial Data
company informationeconomic data (GNP, price indexes, etc.)stock markets
Personal / Statistical Datagovernment censusmedical historiescustomer profilesdemographic datadata and statistics about sports and athletes

Giannotti & PedreschiAnno accademico, 2004/2005 Introduzione 18
Sources of Data
World Wide Web and Online Repositoriesemail, news, messages Web documents, images, video, etc.link structure of of the hypertext from millions of Web sitesWeb usage data (from server logs, network traffic, and user registrations)online databases, and digital libraries
Giannotti & PedreschiAnno accademico, 2004/2005 Introduzione 19
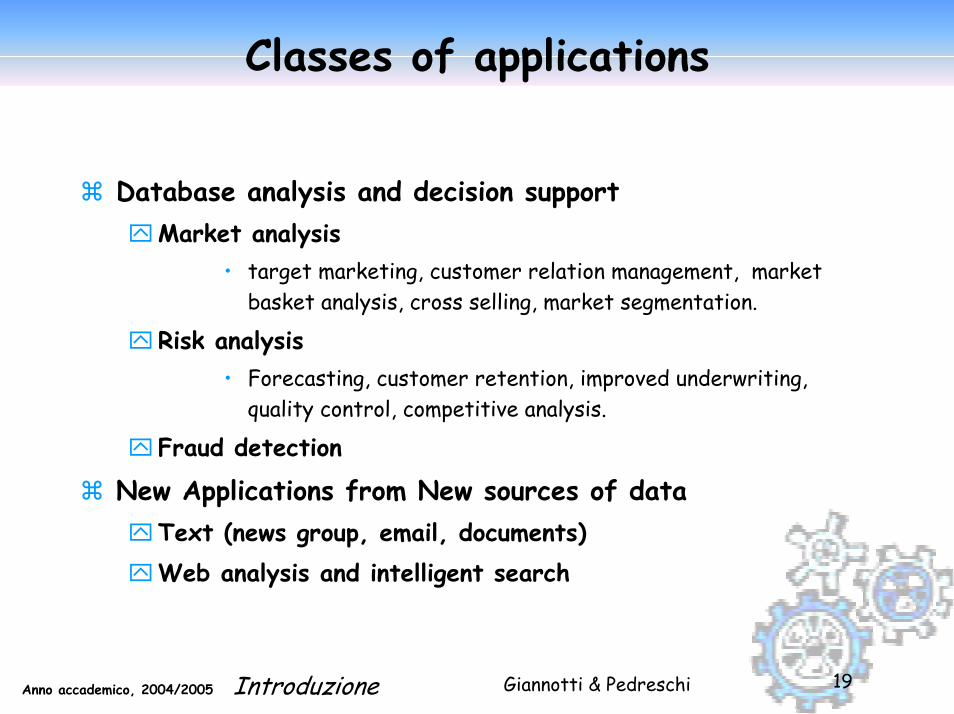
Classes of applications
Database analysis and decision support Market analysis
• target marketing, customer relation management, market basket analysis, cross selling, market segmentation.
Risk analysis• Forecasting, customer retention, improved underwriting,
quality control, competitive analysis.
Fraud detection
New Applications from New sources of dataText (news group, email, documents) Web analysis and intelligent search

Giannotti & PedreschiAnno accademico, 2004/2005 Introduzione 20
Market Analysis
Where are the data sources for analysis?Credit card transactions, loyalty cards, discount coupons, customer complaint calls, plus (public) lifestyle studies.
Target marketingFind clusters of “model” customers who share the same characteristics: interest, income level, spending habits, etc.
Determine customer purchasing patterns over timeConversion of single to a joint bank account: marriage, etc.
Cross-market analysisAssociations/co-relations between product salesPrediction based on the association information.

Giannotti & PedreschiAnno accademico, 2004/2005 Introduzione 21
Market Analysis (2)
Customer profilingdata mining can tell you what types of customers buy what products (clustering or classification).
Identifying customer requirementsidentifying the best products for different customersuse prediction to find what factors will attract new customers
Summary informationvarious multidimensional summary reports;statistical summary information (data central tendency and variation)
Giannotti & PedreschiAnno accademico, 2004/2005 Introduzione 22
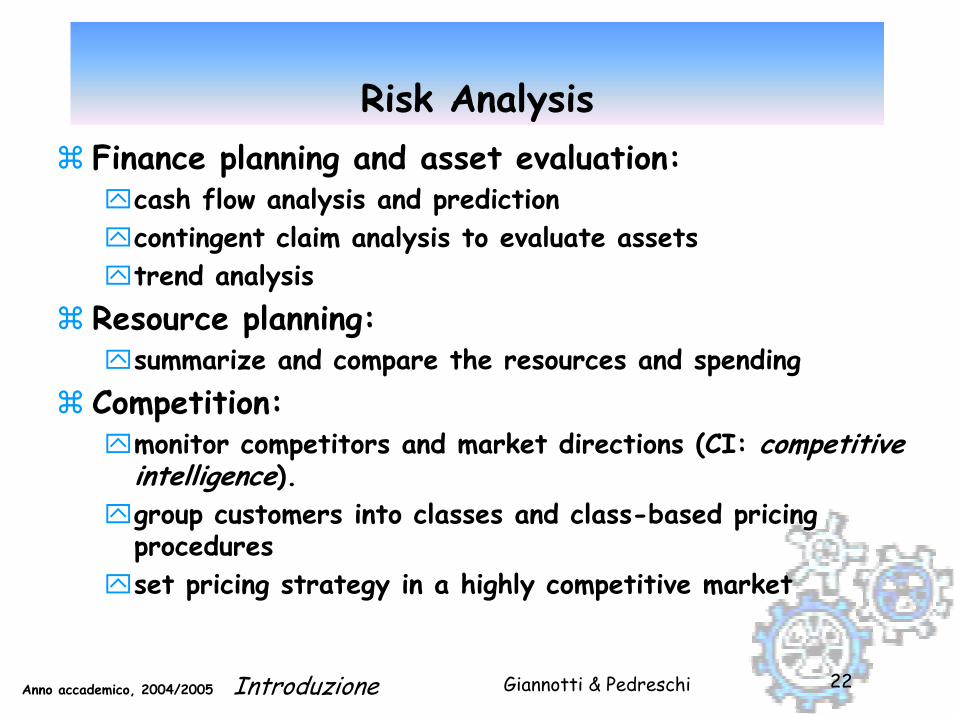
Risk Analysis Finance planning and asset evaluation:
cash flow analysis and predictioncontingent claim analysis to evaluate assets trend analysis
Resource planning:summarize and compare the resources and spending
Competition:monitor competitors and market directions (CI: competitive intelligence).group customers into classes and class-based pricing proceduresset pricing strategy in a highly competitive market
Giannotti & PedreschiAnno accademico, 2004/2005 Introduzione 23
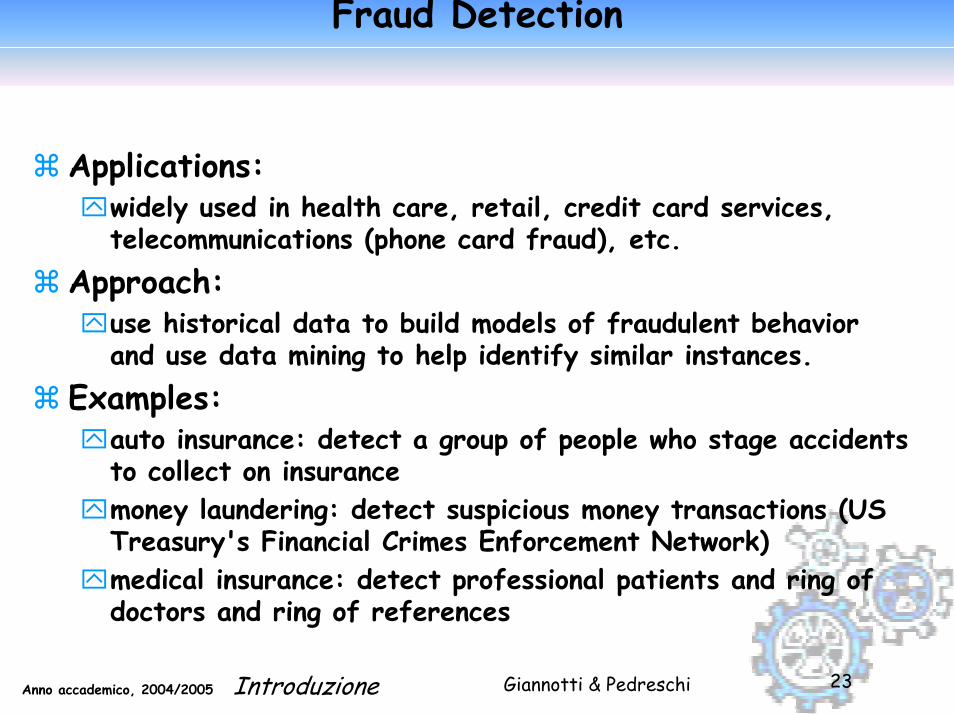
Fraud Detection
Applications:widely used in health care, retail, credit card services, telecommunications (phone card fraud), etc.
Approach:use historical data to build models of fraudulent behavior and use data mining to help identify similar instances.
Examples:auto insurance: detect a group of people who stage accidents to collect on insurancemoney laundering: detect suspicious money transactions (US Treasury's Financial Crimes Enforcement Network) medical insurance: detect professional patients and ring of doctors and ring of references
Giannotti & PedreschiAnno accademico, 2004/2005 Introduzione 24
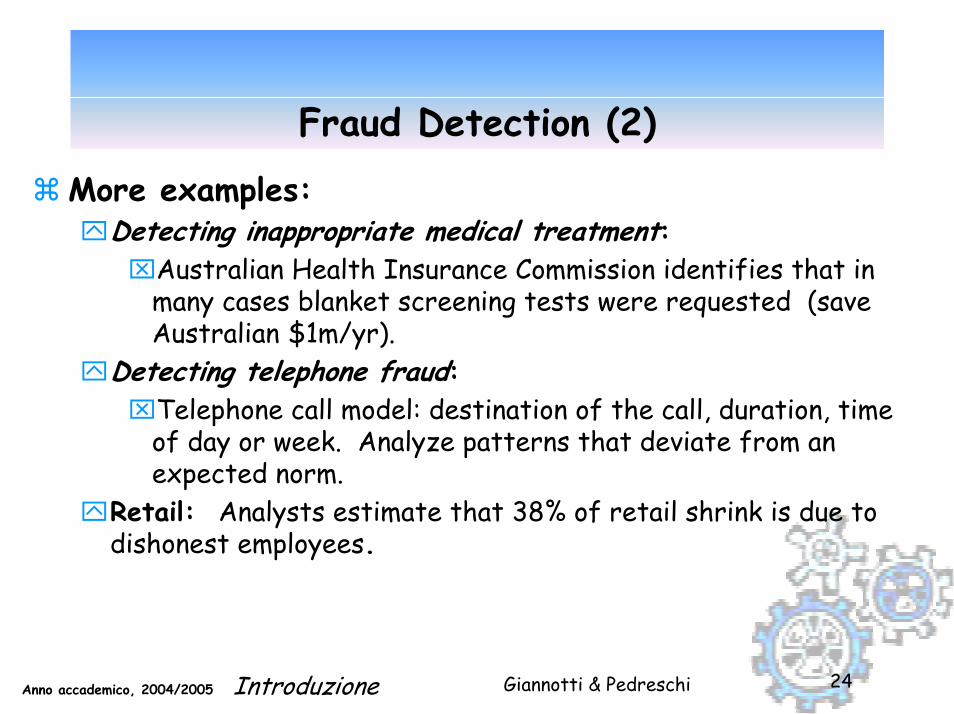
Fraud Detection (2)
More examples:Detecting inappropriate medical treatment: ⌧Australian Health Insurance Commission identifies that in
many cases blanket screening tests were requested (save Australian $1m/yr).
Detecting telephone fraud: ⌧Telephone call model: destination of the call, duration, time
of day or week. Analyze patterns that deviate from an expected norm.
Retail: Analysts estimate that 38% of retail shrink is due to dishonest employees.
Giannotti & PedreschiAnno accademico, 2004/2005 Introduzione 25
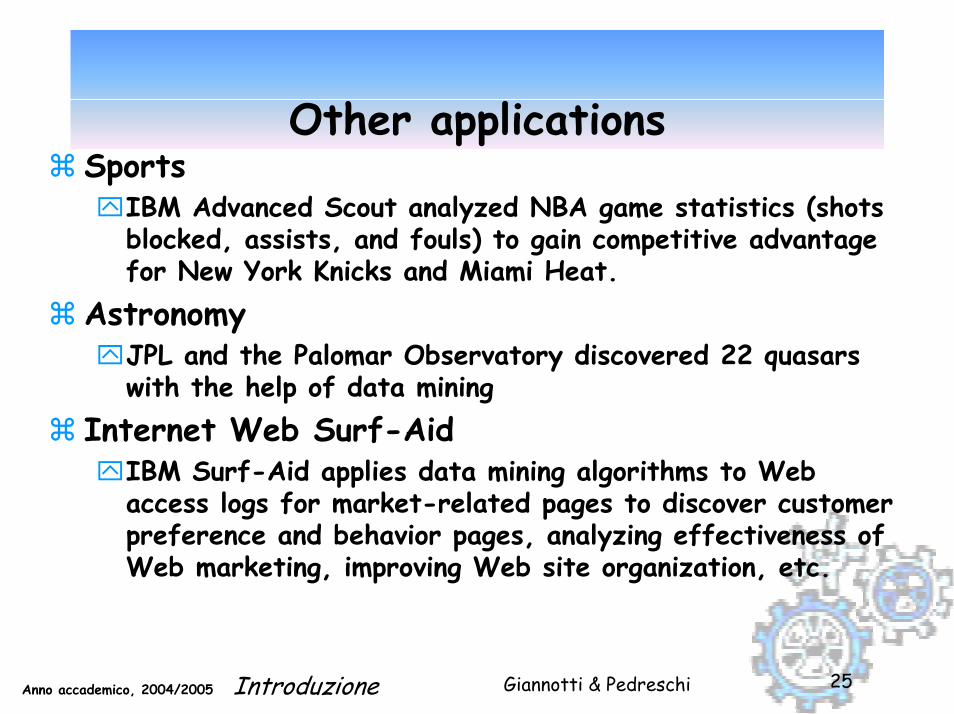
SportsIBM Advanced Scout analyzed NBA game statistics (shots blocked, assists, and fouls) to gain competitive advantage for New York Knicks and Miami Heat.
AstronomyJPL and the Palomar Observatory discovered 22 quasars with the help of data mining
Internet Web Surf-AidIBM Surf-Aid applies data mining algorithms to Web access logs for market-related pages to discover customer preference and behavior pages, analyzing effectiveness of Web marketing, improving Web site organization, etc.
Other applications

Giannotti & PedreschiAnno accademico, 2004/2005 Introduzione 26
The selection and processing of data for:the identification of novel, accurate, and useful patterns, and the modeling of real-world phenomena.
Data mining is a major component of the KDD process - automated discovery of patterns and the development of predictive and explanatory models.
What is Knowledge Discovery in Databases (KDD)? A process!

Giannotti & PedreschiAnno accademico, 2004/2005 Introduzione 27
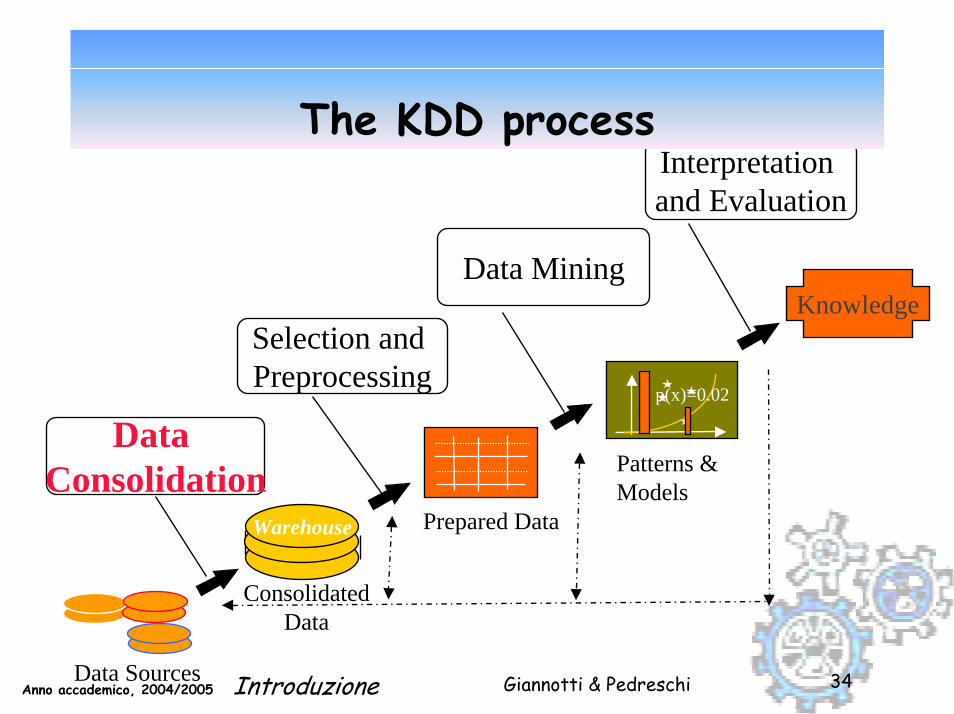
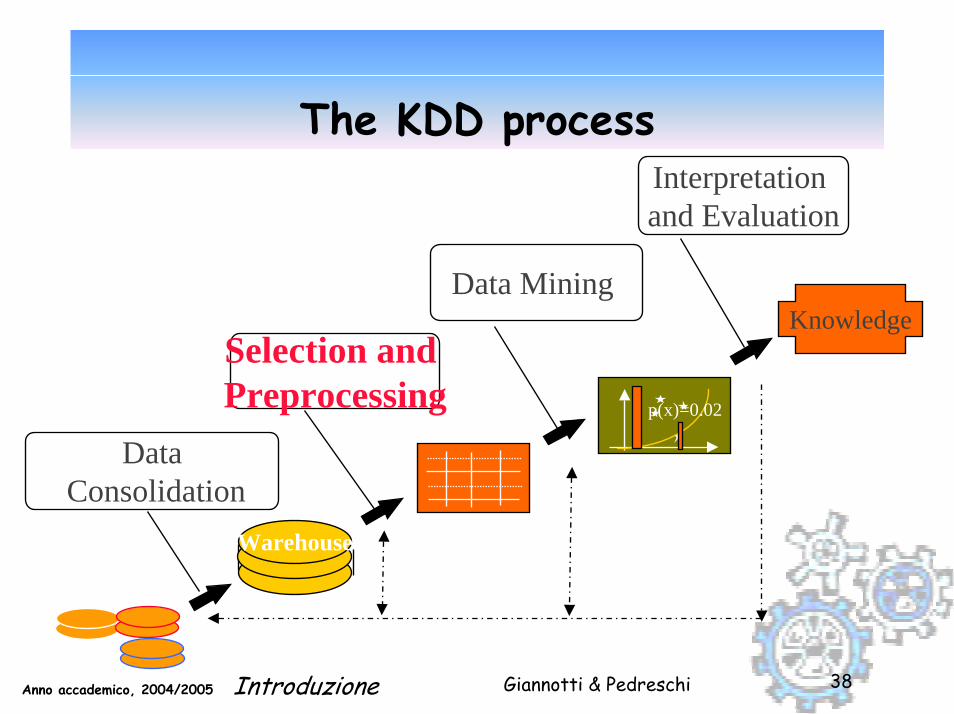
The KDD process
Selection andPreprocessing
Data Mining
Interpretation and Evaluation
DataConsolidation
Knowledge
p(x)=0.02
Warehouse
Data Sources
Patterns &Models
Prepared Data
ConsolidatedData
Giannotti & PedreschiAnno accademico, 2004/2005 Introduzione 28
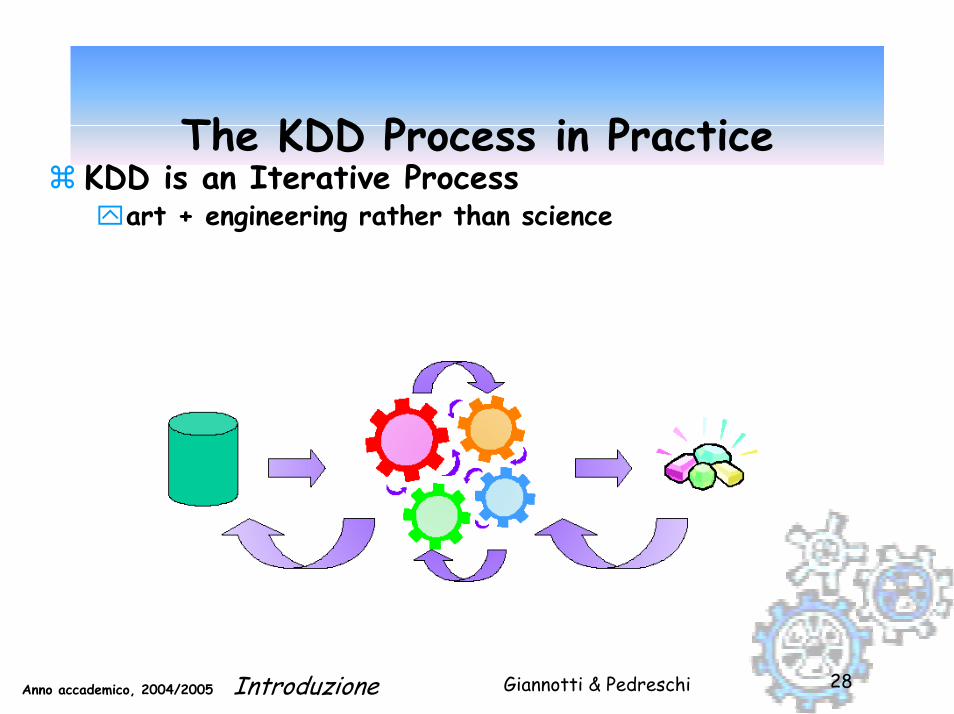
The KDD Process in Practice KDD is an Iterative Process
art + engineering rather than science
Giannotti & PedreschiAnno accademico, 2004/2005 Introduzione 29
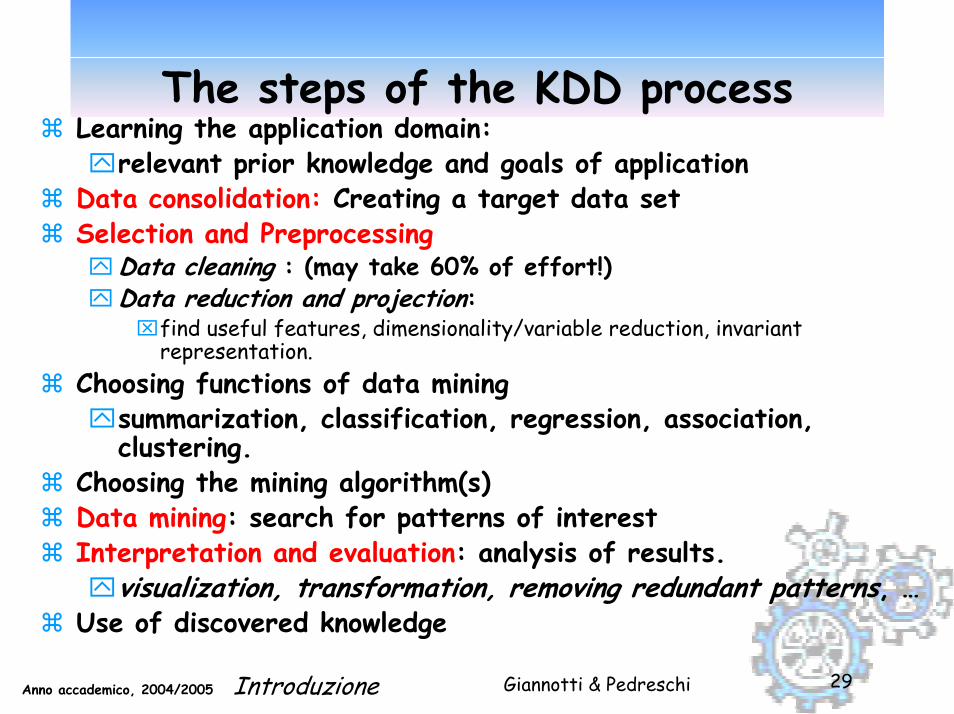
Learning the application domain:relevant prior knowledge and goals of application
Data consolidation: Creating a target data setSelection and Preprocessing
Data cleaning : (may take 60% of effort!)Data reduction and projection:⌧find useful features, dimensionality/variable reduction, invariant
representation.Choosing functions of data mining
summarization, classification, regression, association, clustering.
Choosing the mining algorithm(s)Data mining: search for patterns of interestInterpretation and evaluation: analysis of results.
visualization, transformation, removing redundant patterns, … Use of discovered knowledge
The steps of the KDD process

Giannotti & PedreschiAnno accademico, 2004/2005 Introduzione 30
The virtuous cycle
CogNovaTechnologies
9
The KDD ProcessThe KDD Process
Selection and Preprocessing
Data Mining
Interpretation and Evaluation
Data Consolidation
Knowledge
p(x)=0.02
Warehouse
Data Sources
Patterns & Models
Prepared Data
ConsolidatedData
KnowledgeProblem
IdentifyProblem orOpportunity
Act onKnowledge
Measure effectof Action ResultsStrategy
Giannotti & PedreschiAnno accademico, 2004/2005 Introduzione 31
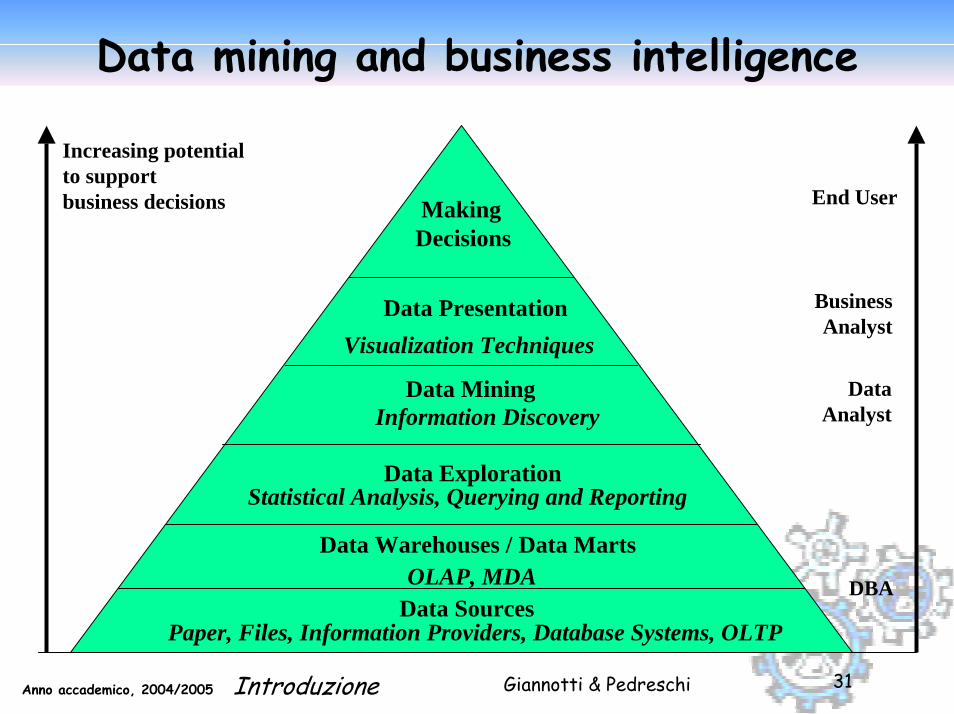
Increasing potentialto supportbusiness decisions End User
BusinessAnalyst
DataAnalyst
DBA
MakingDecisions
Data PresentationVisualization Techniques
Data MiningInformation Discovery
Data Exploration
OLAP, MDA
Statistical Analysis, Querying and Reporting
Data Warehouses / Data Marts
Data SourcesPaper, Files, Information Providers, Database Systems, OLTP
Data mining and business intelligence
Giannotti & PedreschiAnno accademico, 2004/2005 Introduzione 32
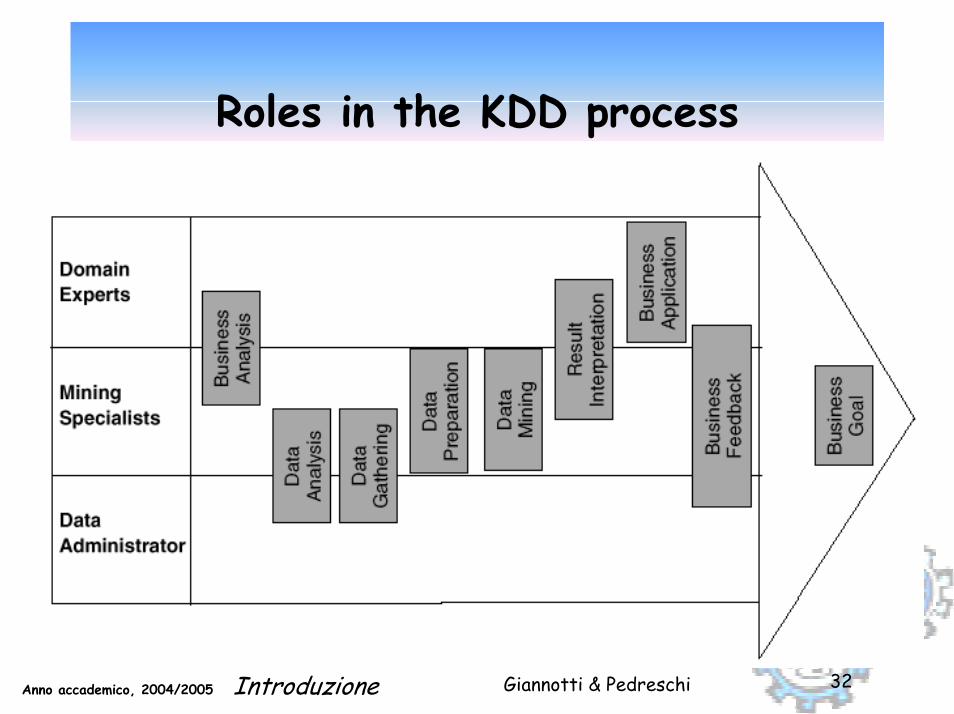
Roles in the KDD process

Giannotti & PedreschiAnno accademico, 2004/2005 Introduzione 33
A business intelligence environment
Giannotti & PedreschiAnno accademico, 2004/2005 Introduzione 34
Selection andPreprocessing
Data Mining
Interpretation and Evaluation
DataConsolidation
Knowledge
p(x)=0.02
Warehouse
Data Sources
Patterns &Models
Prepared Data
ConsolidatedData
The KDD process
Giannotti & PedreschiAnno accademico, 2004/2005 Introduzione 35
Data consolidation and preparation
Garbage in Garbage outThe quality of results relates directly to quality of the data50%-70% of KDD process effort is spent on data consolidation and preparationMajor justification for a corporate data warehouse

Giannotti & PedreschiAnno accademico, 2004/2005 Introduzione 36
From data sources to consolidated datarepository
RDBMS
Legacy DBMS
Flat Files
DataConsolidationand Cleansing
Warehouse
ObjectObject/Relation DBMS/Relation DBMSMultidimensionalMultidimensional DBMSDBMSDeductiveDeductive DatabaseDatabaseFlat files Flat files
External
Data consolidation

Giannotti & PedreschiAnno accademico, 2004/2005 Introduzione 37
Data consolidation
Determine preliminary list of attributes Consolidate data into working database
Internal and External sourcesEliminate or estimate missing valuesRemove outliers (obvious exceptions)Determine prior probabilities of categories and deal with volume bias
Giannotti & PedreschiAnno accademico, 2004/2005 Introduzione 38
Selection andPreprocessing
Data Mining
Interpretation and Evaluation
DataConsolidation
Knowledge
p(x)=0.02
Warehouse
The KDD process

Giannotti & PedreschiAnno accademico, 2004/2005 Introduzione 39
Data selection and preprocessingGenerate a set of examples
choose sampling methodconsider sample complexitydeal with volume bias issues
Reduce attribute dimensionalityremove redundant and/or correlating attributescombine attributes (sum, multiply, difference)
Reduce attribute value rangesgroup symbolic discrete valuesquantify continuous numeric values
Transform datade-correlate and normalize values map time-series data to static representation
OLAP and visualization tools play key role

Giannotti & PedreschiAnno accademico, 2004/2005 Introduzione 40
Selection andPreprocessing
Data Mining
Interpretation and Evaluation
DataConsolidation
Knowledge
p(x)=0.02
Warehouse
The KDD process
Giannotti & PedreschiAnno accademico, 2004/2005 Introduzione 41
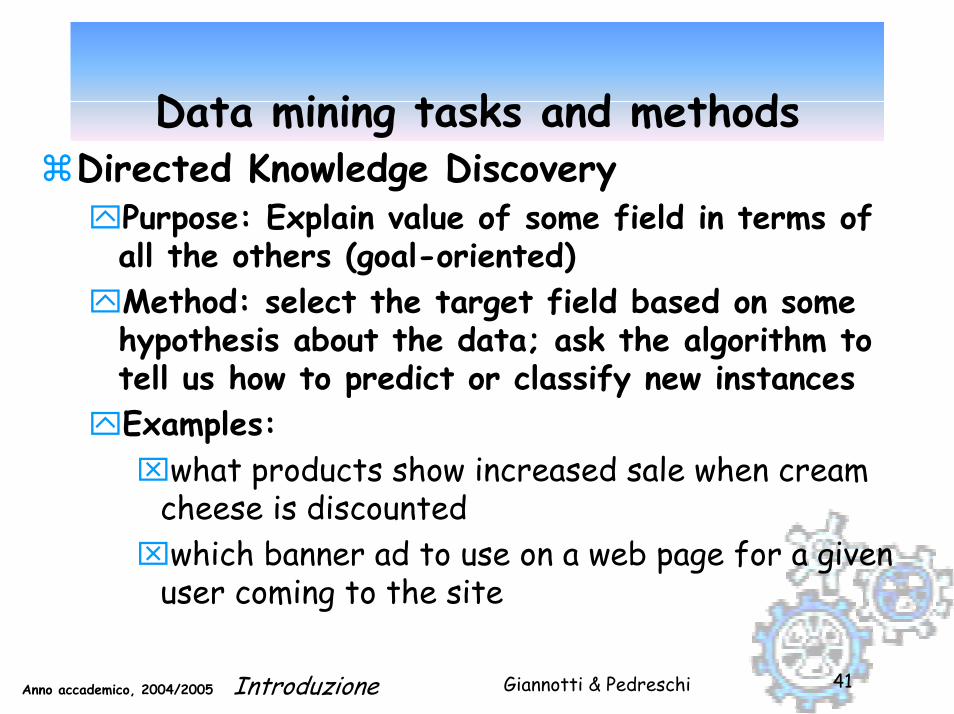
Data mining tasks and methodsDirected Knowledge Discovery
Purpose: Explain value of some field in terms of all the others (goal-oriented)Method: select the target field based on some hypothesis about the data; ask the algorithm to tell us how to predict or classify new instancesExamples:⌧what products show increased sale when cream
cheese is discounted⌧which banner ad to use on a web page for a given
user coming to the site
Giannotti & PedreschiAnno accademico, 2004/2005 Introduzione 42
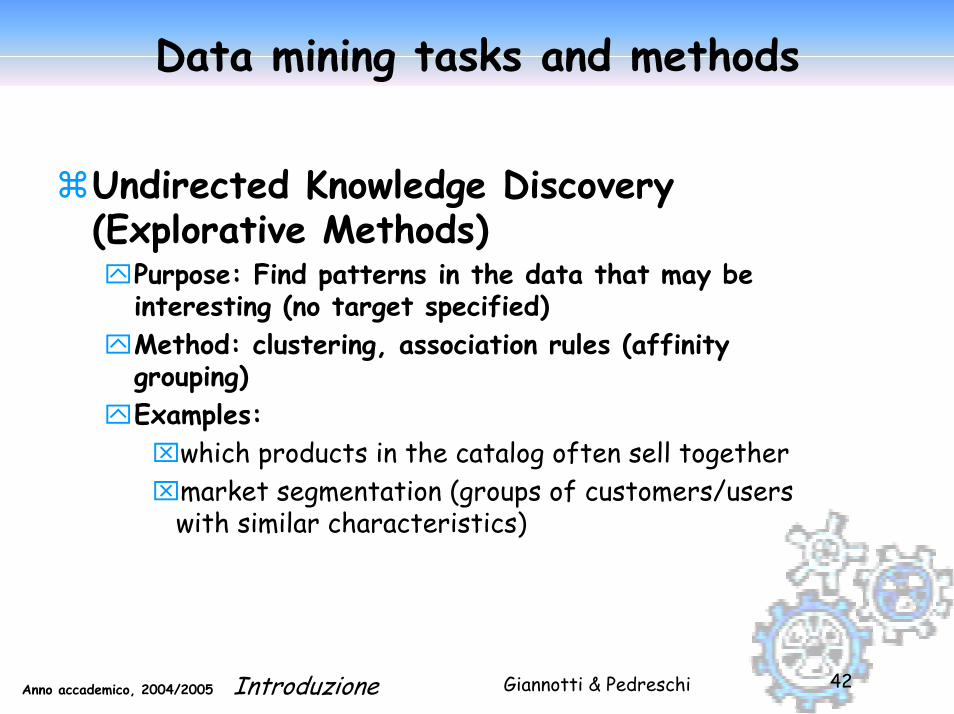
Data mining tasks and methods
Undirected Knowledge Discovery (Explorative Methods)
Purpose: Find patterns in the data that may be interesting (no target specified)Method: clustering, association rules (affinity grouping)Examples:⌧which products in the catalog often sell together⌧market segmentation (groups of customers/users
with similar characteristics)

Giannotti & PedreschiAnno accademico, 2004/2005 Introduzione 43
Data Mining Models
Automated Exploration/Discoverye.g.. discovering new market segmentsclustering analysis
Prediction/Classificatione.g.. forecasting gross sales given current factorsregression, neural networks, genetic algorithms,decision trees
Explanation/Descriptione.g.. characterizing customers by demographics andpurchase historydecision trees, association rules
x1
x2
f(x)
x
if age > 35and income < $35k
then ...
Giannotti & PedreschiAnno accademico, 2004/2005 Introduzione 44
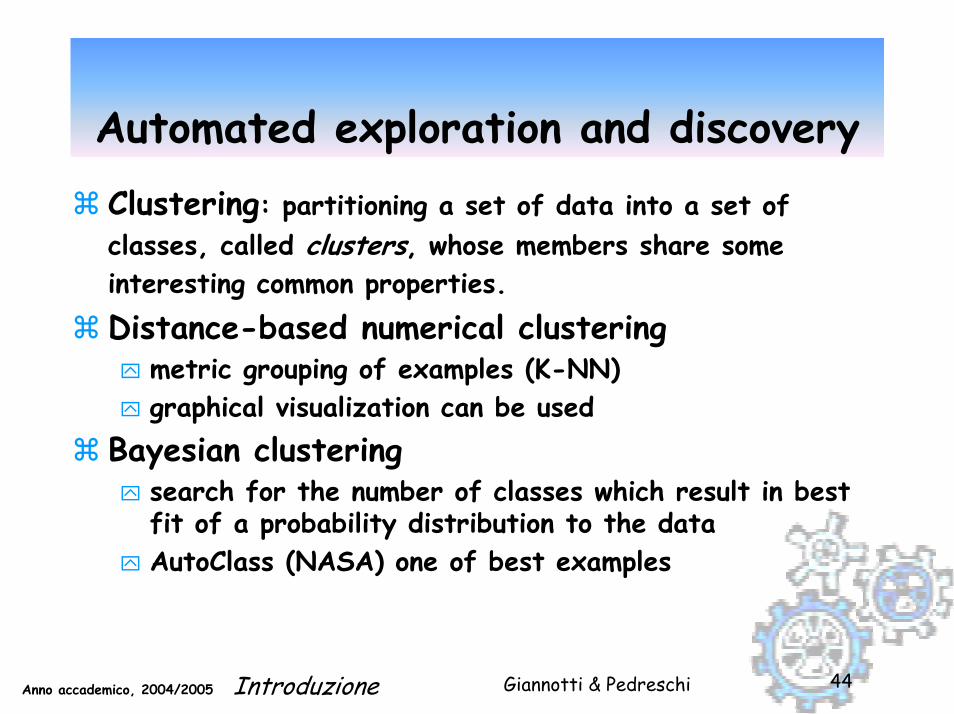
Automated exploration and discoveryClustering: partitioning a set of data into a set of classes, called clusters, whose members share some interesting common properties.Distance-based numerical clustering
metric grouping of examples (K-NN)graphical visualization can be used
Bayesian clusteringsearch for the number of classes which result in best fit of a probability distribution to the data AutoClass (NASA) one of best examples
Giannotti & PedreschiAnno accademico, 2004/2005 Introduzione 45
Prediction and classification
Learning a predictive modelClassification of a new case/sample Many methods:
Artificial neural networksInductive decision tree and rule systemsGenetic algorithmsNearest neighbor clustering algorithmsStatistical (parametric, and non-parametric)
Giannotti & PedreschiAnno accademico, 2004/2005 Introduzione 46
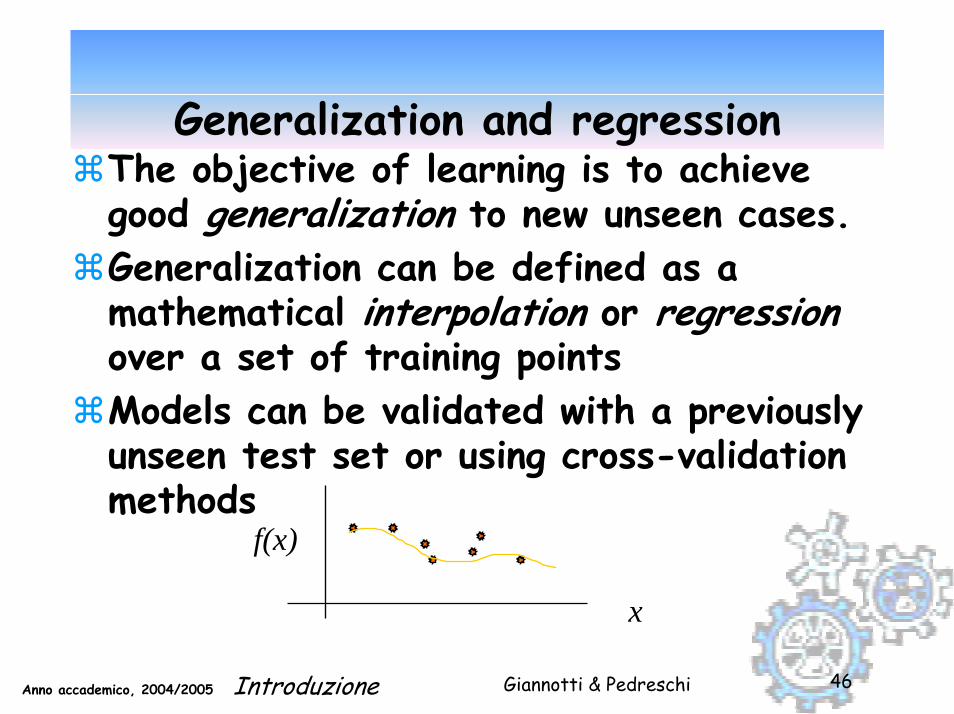
The objective of learning is to achieve good generalization to new unseen cases.Generalization can be defined as a mathematical interpolation or regressionover a set of training pointsModels can be validated with a previously unseen test set or using cross-validation methods
f(x)
x
Generalization and regression
Giannotti & PedreschiAnno accademico, 2004/2005 Introduzione 47
Classification and prediction
Classify data based on the values of a targetattribute, e.g., classify countries based on climate, or classify cars based on gas mileage.
Use obtained model to predict some unknown or missing attribute values based on other information.
Giannotti & PedreschiAnno accademico, 2004/2005 Introduzione 48
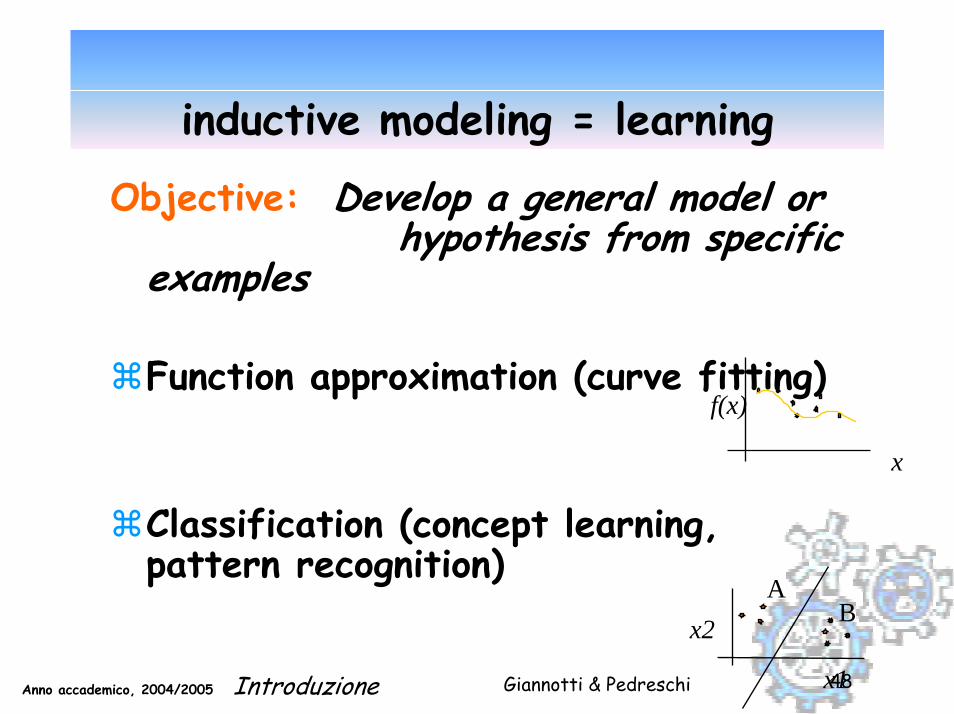
inductive modeling = learning
Objective: Develop a general model or hypothesis from specific
examples
Function approximation (curve fitting)
Classification (concept learning, pattern recognition)
x1
x2A
B
f(x)
x
Giannotti & PedreschiAnno accademico, 2004/2005 Introduzione 49
Explanation and description (MOBASHER RULES)
Learn a generalized hypothesis (model) from selected dataDescription/Interpretation of model provides new knowledge Affinity GroupingMethods:
Inductive decision tree and rule systemsAssociation rule systemsLink Analysis…

Giannotti & PedreschiAnno accademico, 2004/2005 Introduzione 50
Affinity Grouping
Determine what items often go together (usually in transactional databases)Often Referred to as Market Basket Analysis
used in retail for planning arrangement on shelvesused for identifying cross-selling opportunities“should” be used to determine best link structure for a Web site
Examplespeople who buy milk and beer also tend to buy diaperspeople who access pages A and B are likely to place an online order
Suitable data mining toolsassociation rule discoveryclusteringNearest Neighbor analysis (memory-based reasoning)

Giannotti & PedreschiAnno accademico, 2004/2005 Introduzione 51
Exception/deviation detection
Generate a model of normal activityDeviation from model causes alertMethods:
Artificial neural networksInductive decision tree and rule systemsStatistical methodsVisualization tools
Giannotti & PedreschiAnno accademico, 2004/2005 Introduzione 52
Outlier and exception data analysis
Time-series analysis (trend and deviation): Trend and deviation analysis: regression, sequential pattern, similar sequences, trend and deviation, e.g., stock analysis.Similarity-based pattern-directed analysisFull vs. partial periodicity analysis
Other pattern-directed or statistical analysis

Giannotti & PedreschiAnno accademico, 2004/2005 Introduzione 53
The KDD process
Selection andPreprocessing
Data Mining
Interpretation and Evaluation
Data Consolidationand Warehousing
Knowledge
p(x)=0.02
Warehouse
Giannotti & PedreschiAnno accademico, 2004/2005 Introduzione 54
Are all the discovered pattern interesting?A data mining system/query may generate thousands of patterns, not all of them are interesting.Interestingness measures:
easily understood by humansvalid on new or test data with some degree of certainty.potentially usefulnovel, or validates some hypothesis that a user seeks to confirm
Objective vs. subjective interestingness measuresObjective: based on statistics and structures of patterns, e.g., support, confidence, etc.Subjective: based on user’s beliefs in the data, e.g., unexpectedness, novelty, etc.
Giannotti & PedreschiAnno accademico, 2004/2005 Introduzione 55
Interpretation and evaluation
EvaluationStatistical validation and significance testingQualitative review by experts in the fieldPilot surveys to evaluate model accuracy
InterpretationInductive tree and rule models can be read directlyClustering results can be graphed and tabledCode can be automatically generated by some systems (IDTs, Regression models)

Giannotti & PedreschiAnno accademico, 2004/2005 Introduzione 56
Seminar 1 - Bibliography
Jiawei Han, Micheline Kamber, Data Mining: Concepts and Techniques, Morgan Kaufmann Publishers, 2000 Micheael, J. A. Berry, Gordon S. Linoff, Mastering Data Mining, Wiley, 2000 Klosgen, Zytkow, Handbook of Data Mining,
Oxford, 2001
Giannotti & PedreschiAnno accademico, 2004/2005 Introduzione 57
Seminar 1 - Bibliography
Jiawei Han, Micheline Kamber, Data Mining: Concepts and Techniques, Morgan Kaufmann Publishers, 2000 http://www.mkp.com/books_catalog/catalog.asp?ISBN=1-55860-489-8 U. Fayyad, G. Piatetsky-Shapiro, P. Smyth, R. Uthurusamy(editors). Advances in Knowledge discovery and data mining, MIT Press, 1996. David J. Hand, Heikki Mannila, Padhraic Smyth, Principles of Data Mining, MIT Press, 2001.S. Chakrabarti, Mining the Web: Discovering Knowledge from Hypertext Data, Morgan Kaufmann, ISBN 1-55860-754-4, 2002
Examples of DM projects
Competitive IntelligenceFraud Detection,
Health care,Traffic Accident Analysis,
Moviegoers database: a simple example at work
L’Oreal, a case-study on competitive intelligence:
Source: DM@CINECAhttp://open.cineca.it/datamining/dmCineca/
Giannotti & PedreschiAnno accademico, 2004/2005 Introduzione 60
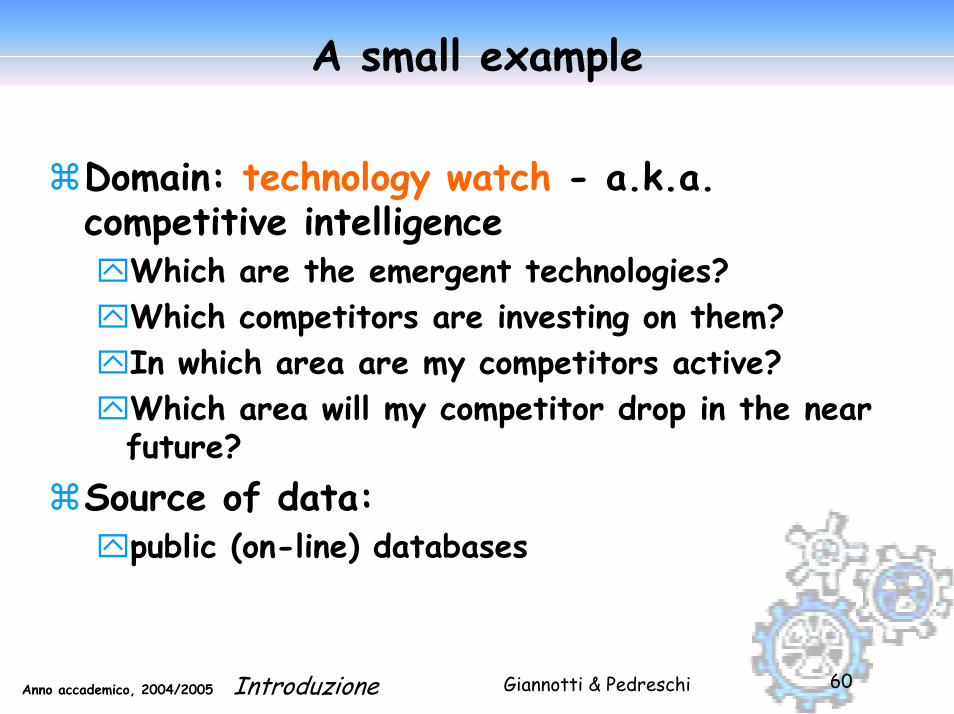
A small example
Domain: technology watch - a.k.a. competitive intelligence
Which are the emergent technologies? Which competitors are investing on them? In which area are my competitors active?Which area will my competitor drop in the near future?
Source of data:public (on-line) databases
Giannotti & PedreschiAnno accademico, 2004/2005 Introduzione 61
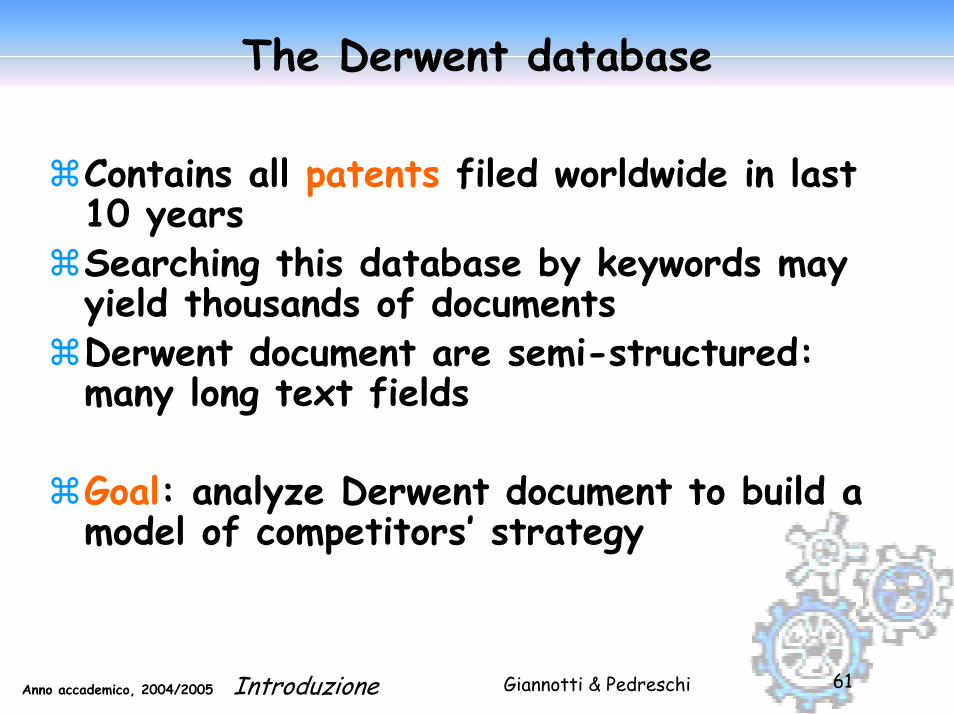
The Derwent database
Contains all patents filed worldwide in last 10 yearsSearching this database by keywords may yield thousands of documentsDerwent document are semi-structured: many long text fields
Goal: analyze Derwent document to build a model of competitors’ strategy

Giannotti & PedreschiAnno accademico, 2004/2005 Introduzione 62
Structure of Derwent documents
Giannotti & PedreschiAnno accademico, 2004/2005 Introduzione 63
Example dataset
Patents in the area: patch technology (cerotto medicale)
105 companies from 12 countries 94 classification codes 52 Derwent codes
Giannotti & PedreschiAnno accademico, 2004/2005 Introduzione 64
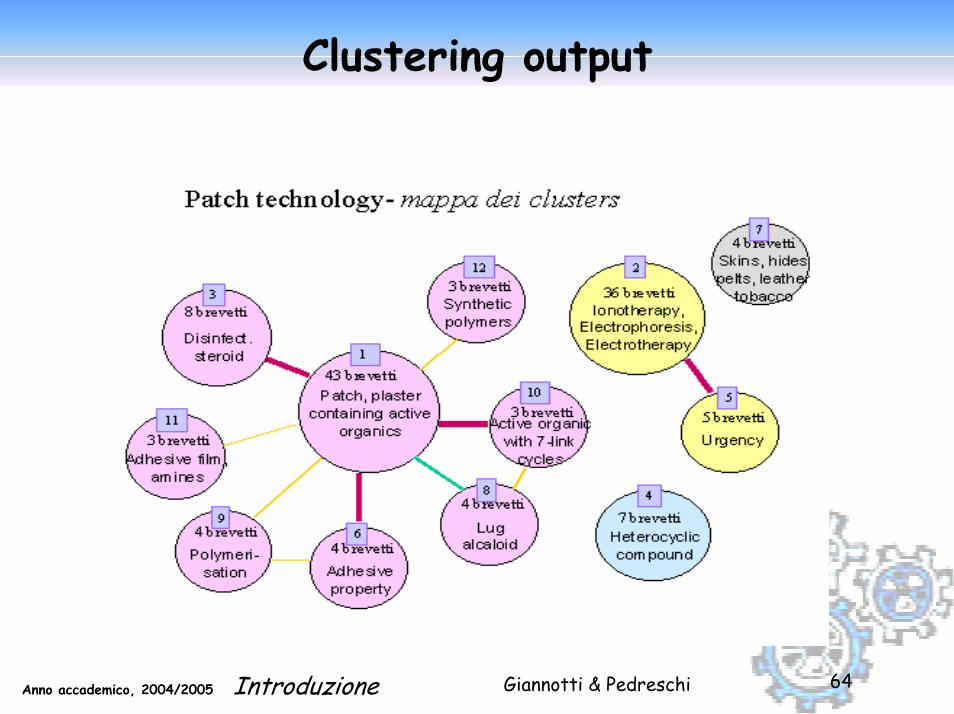
Clustering output

Giannotti & PedreschiAnno accademico, 2004/2005 Introduzione 65
Zoom on cluster 2

Giannotti & PedreschiAnno accademico, 2004/2005 Introduzione 66
Zoom on cluster 2 - profiling competitors
Giannotti & PedreschiAnno accademico, 2004/2005 Introduzione 67
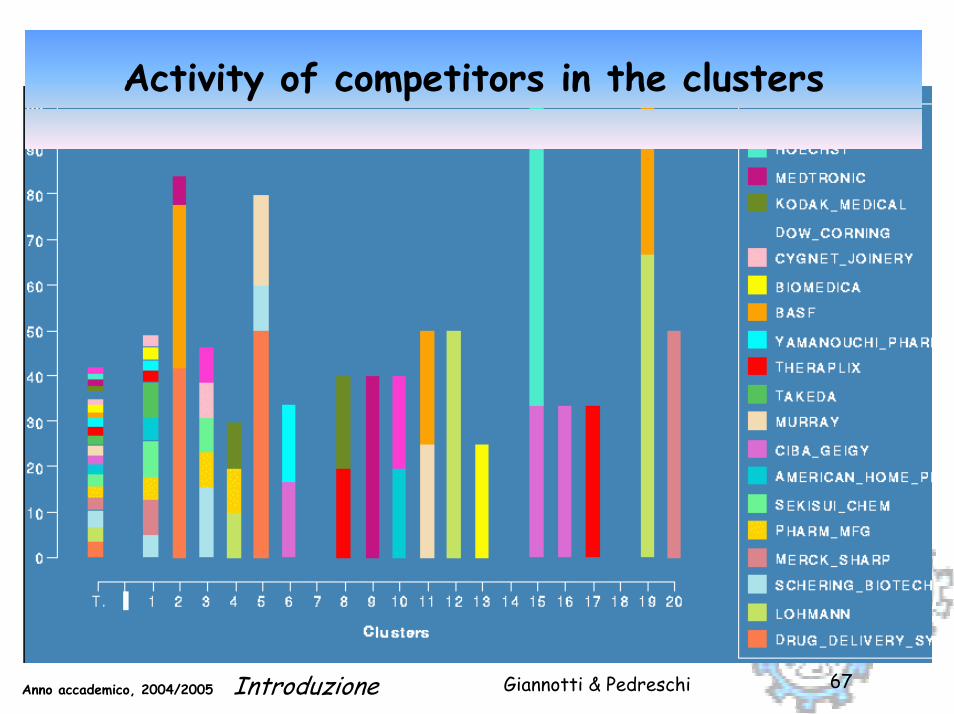
Activity of competitors in the clusters
Giannotti & PedreschiAnno accademico, 2004/2005 Introduzione 68
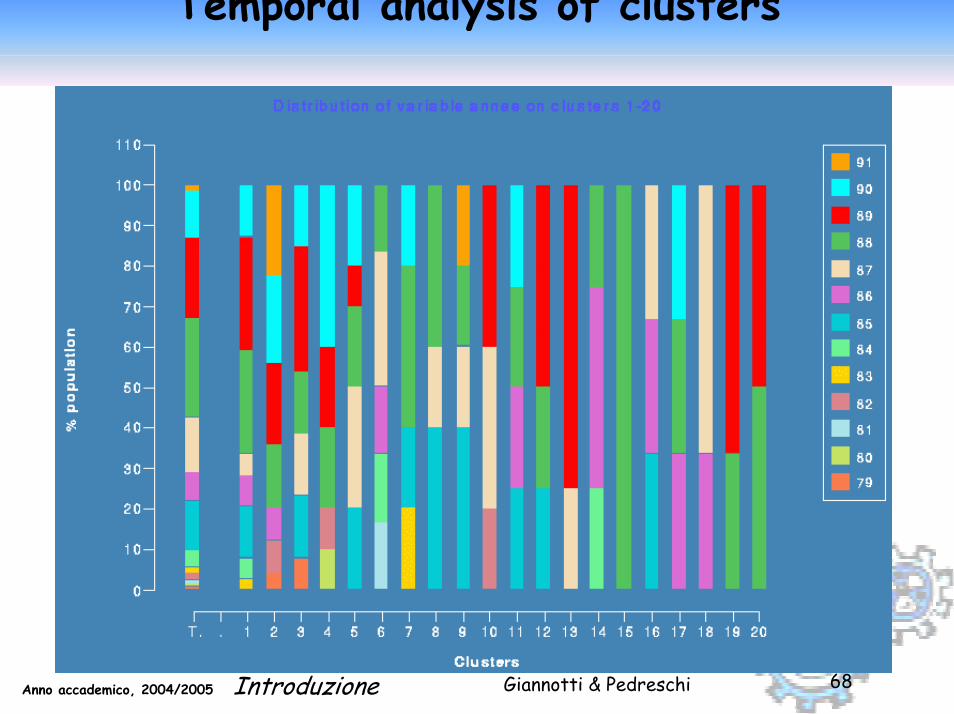
Temporal analysis of clusters
Fraud detection and audit planning
Source: Ministero delle FinanzeProgetto Sogei, KDD Lab. Pisa
Giannotti & PedreschiAnno accademico, 2004/2005 Introduzione 70
Fraud detection
A major task in fraud detection is constructing models of fraudulent behavior, for:
preventing future frauds (on-line fraud detection)discovering past frauds (a posteriori fraud detection)
analyze historical audit data to plan effective future audits
Giannotti & PedreschiAnno accademico, 2004/2005 Introduzione 71
Audit planning
Need to face a trade-off between conflicting issues:
maximize audit benefits: select subjects to be audited to maximize the recovery of evaded taxminimize audit costs: select subjects to be audited to minimize the resources needed to carry out the audits.
Giannotti & PedreschiAnno accademico, 2004/2005 Introduzione 72
Available data sources
Dataset: tax declarations, concerning a targeted class of Italian companies, integrated with other sources:
social benefits to employees, official budget documents, electricity and telephone bills.
Size: 80 K tuples, 175 numeric attributes. A subset of 4 K tuples corresponds to the auditedcompanies:
outcome of audits recorded as the recovery attribute (=amount of evaded tax ascertained )

Giannotti & PedreschiAnno accademico, 2004/2005 Introduzione 73
Data preparation TAX DECLARATIONCodice Attivita'Debiti Vs bancheTotale Attivita'Totale Passivita'Esistenze InizialiRimanenze FinaliProfittiRicaviCosti FunzionamentoOneri PersonaleCosti TotaliUtile o PerditaReddito IRPEG
SOCIAL BENEFITSNumero Dipendenti'Contributi TotaliRetribuzione Totale
OFFICIAL BUDGETVolume AffariCapitale Sociale
ELECTRICITY BILLSConsumi KWH
AUDITRecovery
originaldataset81 K
auditoutcomes
4 K
data consolidationdata cleaning
attribute selection

Giannotti & PedreschiAnno accademico, 2004/2005 Introduzione 74
Cost model
A derived attribute audit_cost is defined as a function of other attributes
760Codice Attivita'Debiti Vs bancheTotale Attivita'Totale Passivita'
Esistenze InizialiRimanenze FinaliProfitti
RicaviCosti FunzionamentoOneri PersonaleCosti Totali
Utile o PerditaReddito IRPEG
INPSNumero Dipendenti'Contributi TotaliRetribuzione Totale
Camere di CommercioVolume AffariCapitale Sociale
ENELConsumi KWH
AccertamentiMaggiore ImpostaAccertata
f audit_cost
Giannotti & PedreschiAnno accademico, 2004/2005 Introduzione 75
Cost model and the target variable
recovery of an audit after the audit cost actual_recovery = recovery - audit_cost
target variable (class label) of our analysis is set as the Class of Actual Recovery (c.a.r.):
negative if actual_recovery ≤ 0 c.a.r. =
positive if actual_recovery > 0.
Giannotti & PedreschiAnno accademico, 2004/2005 Introduzione 76
Quality assessment indicators
The obtained classifiers are evaluated according to several indicators, or metricsDomain-independent indicators
confusion matrixmisclassification rate
Domain-dependent indicatorsaudit #actual recoveryprofitabilityrelevance

Giannotti & PedreschiAnno accademico, 2004/2005 Introduzione 77
Domain-dependent quality indicators
audit # (of a given classifier): number of tuplesclassified as positive =
# (FP ∪ TP) actual recovery: total amount of actual recovery for all tuples classified as positiveprofitability: average actual recovery per auditrelevance: ratio between profitability and misclassification rate

Giannotti & PedreschiAnno accademico, 2004/2005 Introduzione 78
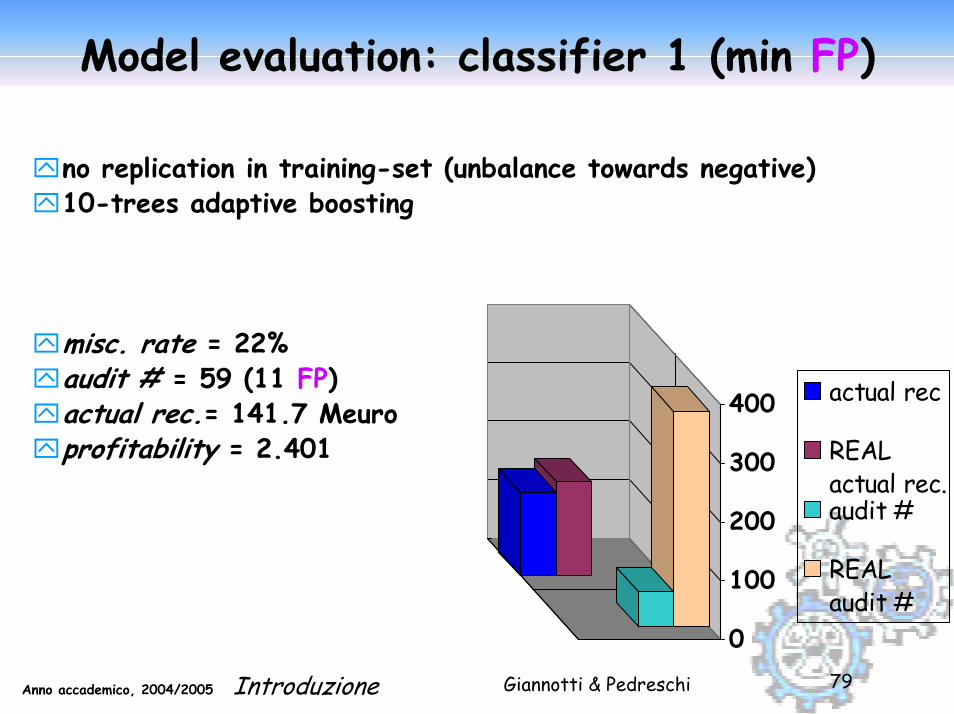
The REAL case
Classifiers can be compared with the REAL case, consisting of the whole test-set:
audit # (REAL) = 366actual recovery(REAL) = 159.6 M euro
Giannotti & PedreschiAnno accademico, 2004/2005 Introduzione 79
Model evaluation: classifier 1 (min FP)
no replication in training-set (unbalance towards negative)10-trees adaptive boosting
misc. rate = 22%audit # = 59 (11 FP)actual rec.= 141.7 Meuroprofitability = 2.401
0
100
200
300
400 actual rec
REALactual rec.audit #
REALaudit #
Giannotti & PedreschiAnno accademico, 2004/2005 Introduzione 80
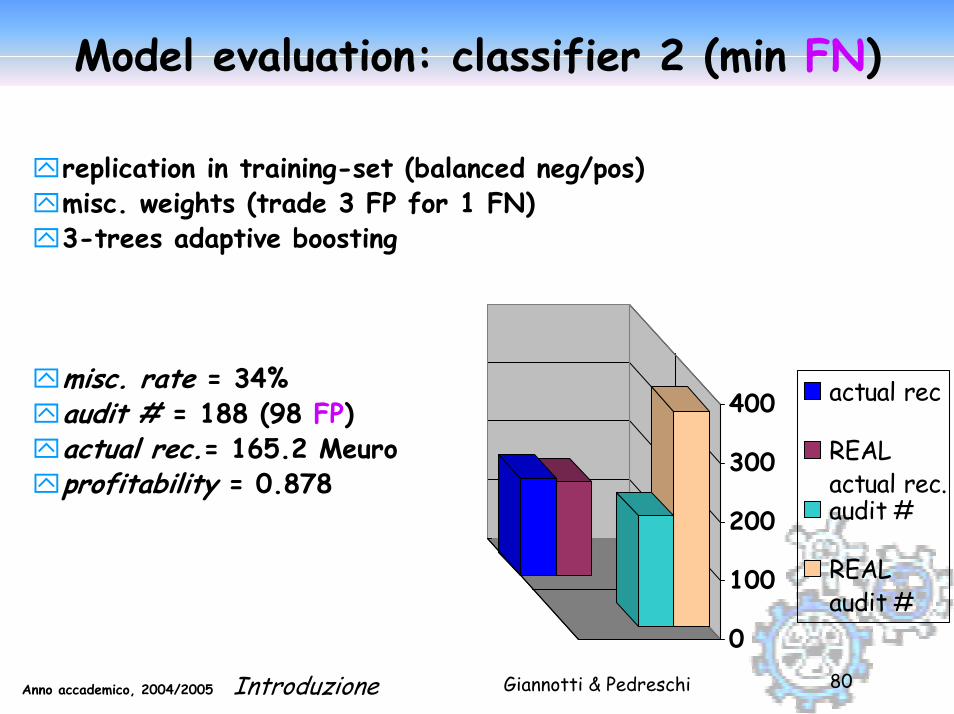
Model evaluation: classifier 2 (min FN)
replication in training-set (balanced neg/pos)misc. weights (trade 3 FP for 1 FN)3-trees adaptive boosting
misc. rate = 34%audit # = 188 (98 FP)actual rec.= 165.2 Meuroprofitability = 0.878
0
100
200
300
400 actual rec
REALactual rec.audit #
REALaudit #

Atherosclerosis prevention study
2nd Department of Medicine, 1st Faculty of Medicine of Charles University and Charles University Hospital, U nemocnice 2, Prague 2 (head. Prof. M. Aschermann, MD, SDr, FESC)
Giannotti & PedreschiAnno accademico, 2004/2005 Introduzione 82
Atherosclerosis prevention study:
The STULONG 1 data set is a real database that keeps information about the study of the development of atherosclerosis risk factors in a population of middle aged men.
Used for Discovery Challenge at PKDD 00-02-03-04

Giannotti & PedreschiAnno accademico, 2004/2005 Introduzione 83
Atherosclerosis prevention study:
Study on 1400 middle-aged men at Czech hospitals
Measurements concern development of cardiovascular disease and other health data in a series of exams
The aim of this analysis is to look for associations between medical characteristics of patients and death causes.Four tables
Entry and subsequent exams, questionnaire responses, deaths
Giannotti & PedreschiAnno accademico, 2004/2005 Introduzione 84
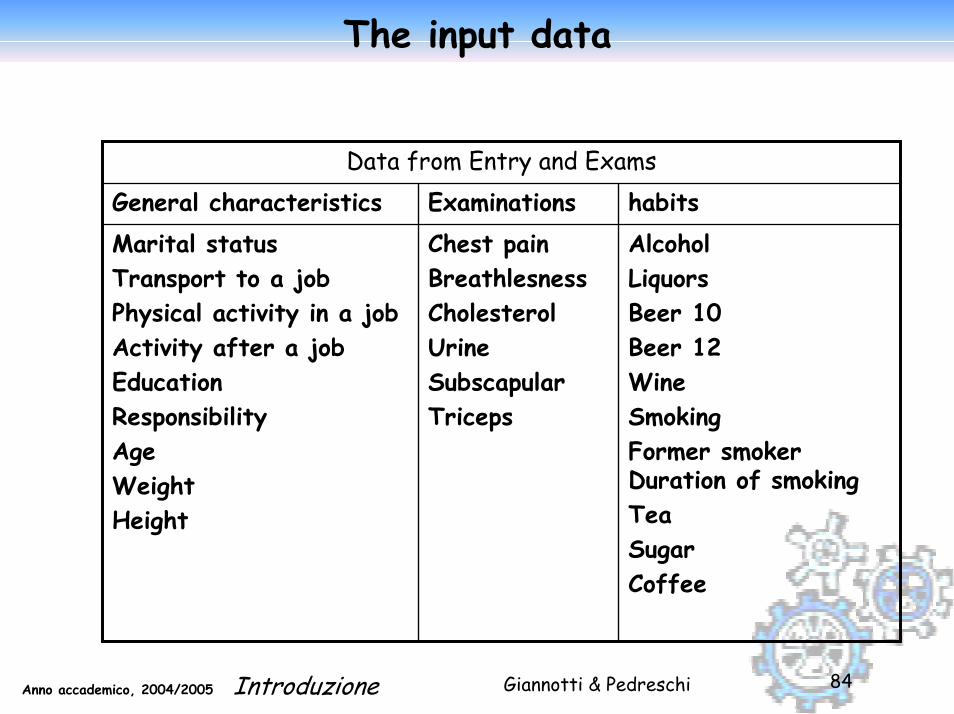
The input data
Data from Entry and Exams General characteristics Examinations habitsMarital statusTransport to a job Physical activity in a jobActivity after a jobEducationResponsibilityAgeWeightHeight
Chest painBreathlesnessCholesterolUrine SubscapularTriceps
AlcoholLiquorsBeer 10Beer 12Wine Smoking Former smoker Duration of smokingTeaSugarCoffee
Giannotti & PedreschiAnno accademico, 2004/2005 Introduzione 85
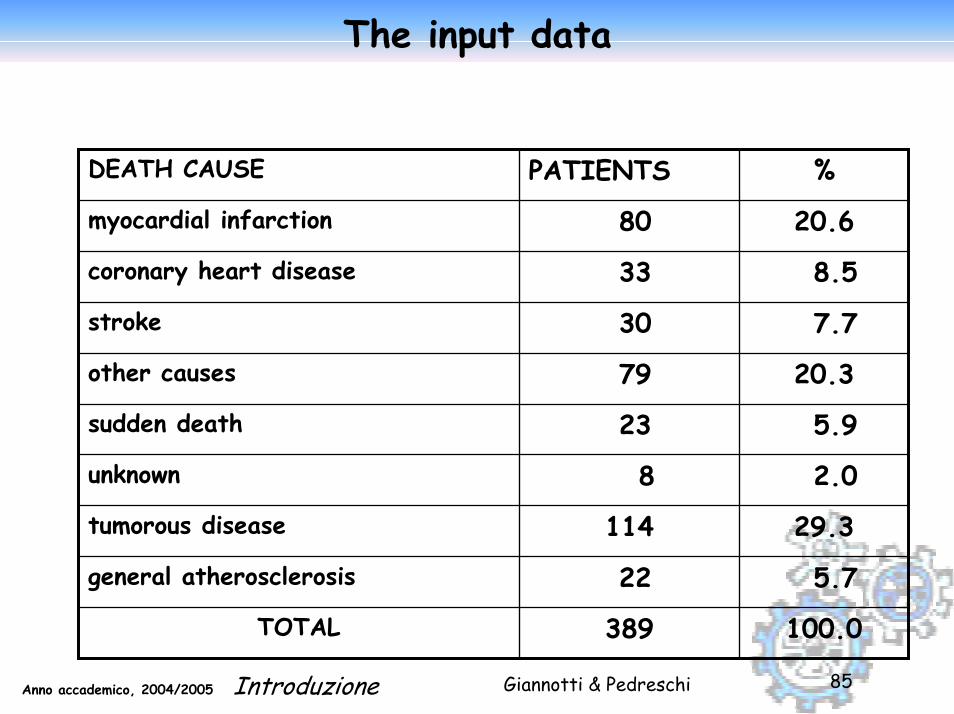
The input data
DEATH CAUSE PATIENTS %
myocardial infarction 80 20.6
coronary heart disease 33 8.5
stroke 30 7.7
other causes 79 20.3
sudden death 23 5.9
unknown 8 2.0
tumorous disease 114 29.3
general atherosclerosis 22 5.7
TOTAL 389 100.0
Giannotti & PedreschiAnno accademico, 2004/2005 Introduzione 86
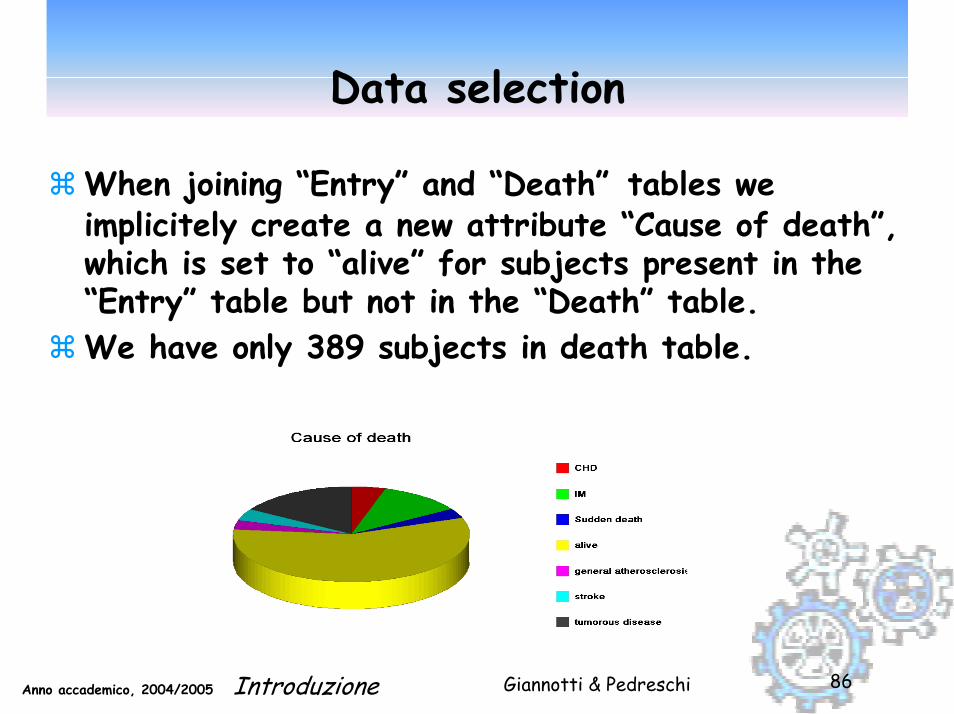
Data selection
When joining “Entry” and “Death” tables we implicitely create a new attribute “Cause of death”,which is set to “alive” for subjects present in the “Entry” table but not in the “Death” table.We have only 389 subjects in death table.
Giannotti & PedreschiAnno accademico, 2004/2005 Introduzione 87
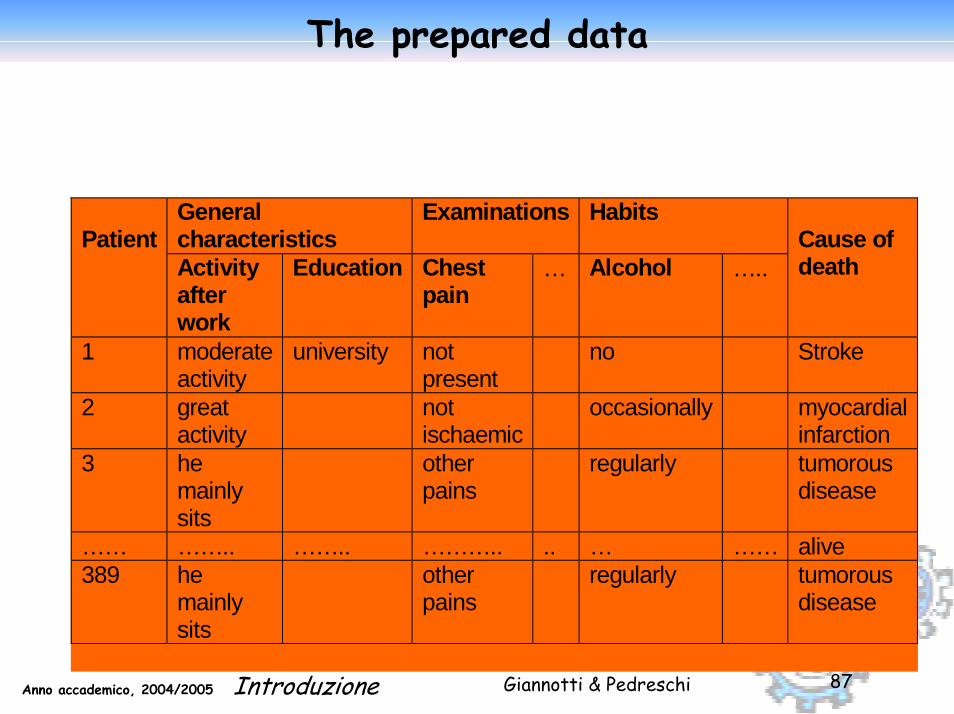
The prepared data
General characteristics
Examinations Habits Patient
Activity after work
Education Chest pain
… Alcohol …..
Cause of death
1
moderate activity
university not present
no Stroke
2
great activity
not ischaemic
occasionally myocardial infarction
3
he mainly sits
other pains
regularly tumorous disease
…… …….. …….. ……….. .. … …… alive 389 he
mainly sits
other pains
regularly tumorous disease
Giannotti & PedreschiAnno accademico, 2004/2005 Introduzione 88
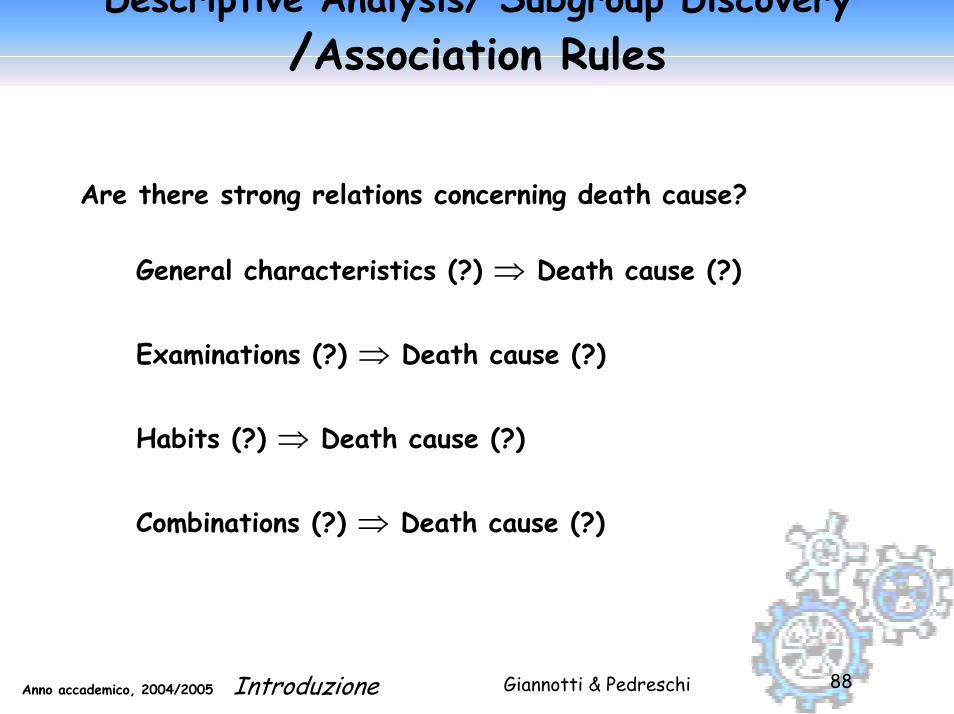
Descriptive Analysis/ Subgroup Discovery/Association Rules
Are there strong relations concerning death cause?
1. General characteristics (?) ⇒ Death cause (?)
2. Examinations (?) ⇒ Death cause (?)
3. Habits (?) ⇒ Death cause (?)
4. Combinations (?) ⇒ Death cause (?)

Giannotti & PedreschiAnno accademico, 2004/2005 Introduzione 89
Example of extracted rules
Education(university) & Height<176-180> ⇒Death cause (tumouros disease), 16 ; 0.62It means that on tumorous disease have died 16, i.e. 62% of patients with university education and with height 176-180 cm.

Giannotti & PedreschiAnno accademico, 2004/2005 Introduzione 90
Example of extracted rules
Physical activity in work(he mainly sits) & Height<176-180> ⇒ Death cause (tumourosdisease), 24; 0.52It means that on tumorous disease have died 24 i.e. 52% of patients that mainly sit in the work and whose height is 176-180 cm.

Giannotti & PedreschiAnno accademico, 2004/2005 Introduzione 91
Example of extracted rules
Education(university) & Height<176-180> ⇒Death cause (tumouros disease),
16; 0.62; +1.1;the relative frequency of patients who died on tumorous disease among patients with university education and with height 176-180 cm is 110 per cent higher than the relative frequency of patients who died on tumorousdisease among all the 389 observed patients

Moviegoer Database :

Giannotti & PedreschiAnno accademico, 2004/2005 Introduzione 93
Giannotti & PedreschiAnno accademico, 2004/2005 Introduzione 94
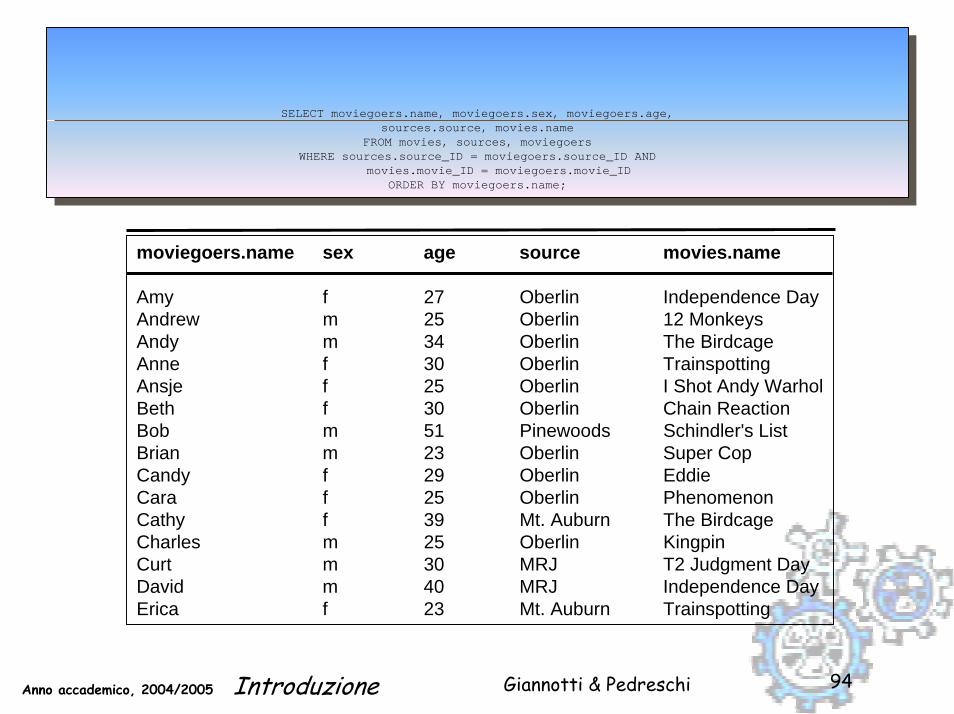
SELECT moviegoers.name, moviegoers.sex, moviegoers.age,sources.source, movies.name
FROM movies, sources, moviegoersWHERE sources.source_ID = moviegoers.source_ID AND
movies.movie_ID = moviegoers.movie_IDORDER BY moviegoers.name;
SELECT moviegoers.name, moviegoers.sex, moviegoers.age,sources.source, movies.name
FROM movies, sources, moviegoersWHERE sources.source_ID = moviegoers.source_ID AND
movies.movie_ID = moviegoers.movie_IDORDER BY moviegoers.name;
moviegoers.name sex age source movies.name
Amy f 27 Oberlin Independence DayAndrew m 25 Oberlin 12 MonkeysAndy m 34 Oberlin The BirdcageAnne f 30 Oberlin TrainspottingAnsje f 25 Oberlin I Shot Andy WarholBeth f 30 Oberlin Chain ReactionBob m 51 Pinewoods Schindler's ListBrian m 23 Oberlin Super CopCandy f 29 Oberlin EddieCara f 25 Oberlin PhenomenonCathy f 39 Mt. Auburn The BirdcageCharles m 25 Oberlin KingpinCurt m 30 MRJ T2 Judgment DayDavid m 40 MRJ Independence DayErica f 23 Mt. Auburn Trainspotting
Giannotti & PedreschiAnno accademico, 2004/2005 Introduzione 95
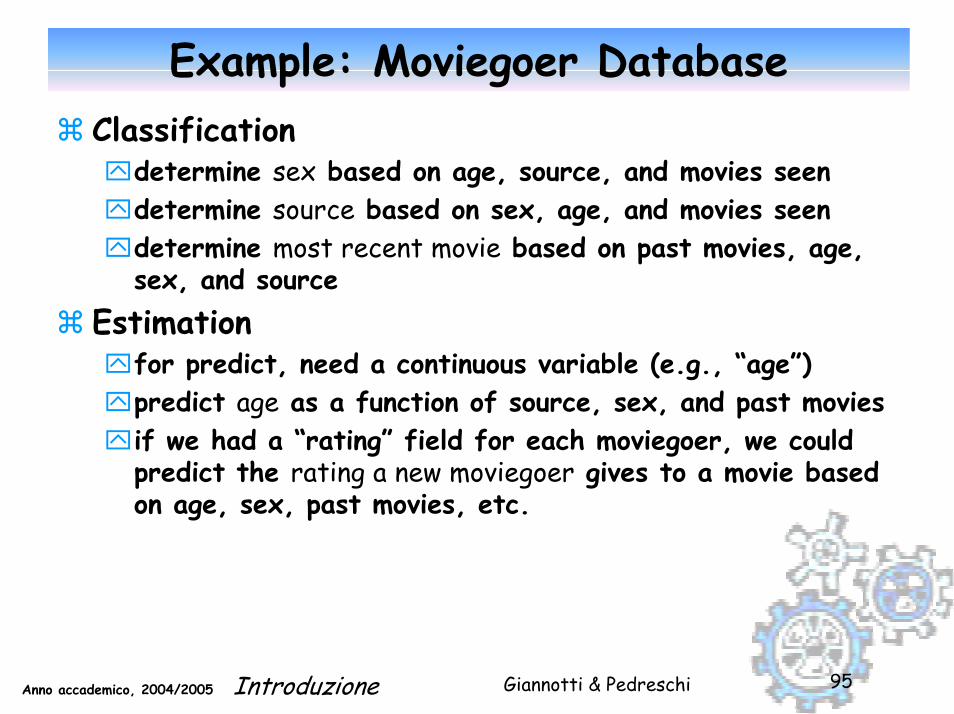
Example: Moviegoer DatabaseClassification
determine sex based on age, source, and movies seendetermine source based on sex, age, and movies seendetermine most recent movie based on past movies, age, sex, and source
Estimationfor predict, need a continuous variable (e.g., “age”)predict age as a function of source, sex, and past moviesif we had a “rating” field for each moviegoer, we could predict the rating a new moviegoer gives to a movie based on age, sex, past movies, etc.

Giannotti & PedreschiAnno accademico, 2004/2005 Introduzione 96
Example: Moviegoer Database
Clusteringfind groupings of movies that are often seen by the same peoplefind groupings of people that tend to see the same moviesclustering might reveal relationships that are not necessarily recorded in the data (e.g., we may find a cluster that is dominated by people with young children; or a cluster of movies that correspond to a particular genre)
Giannotti & PedreschiAnno accademico, 2004/2005 Introduzione 97
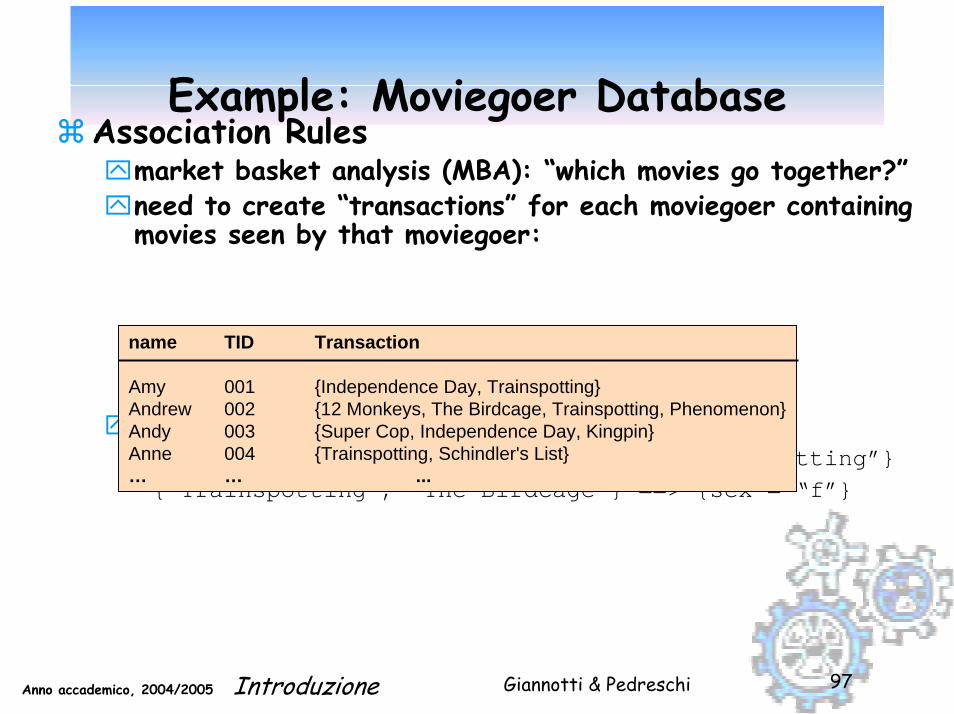
Example: Moviegoer DatabaseAssociation Rules
market basket analysis (MBA): “which movies go together?”need to create “transactions” for each moviegoer containing movies seen by that moviegoer:
may result in association rules such as:{“Phenomenon”, “The Birdcage”} ==> {“Trainspotting”}{“Trainspotting”, “The Birdcage”} ==> {sex = “f”}
name TID Transaction
Amy 001 {Independence Day, Trainspotting}Andrew 002 {12 Monkeys, The Birdcage, Trainspotting, Phenomenon}Andy 003 {Super Cop, Independence Day, Kingpin}Anne 004 {Trainspotting, Schindler's List}… … ...
Giannotti & PedreschiAnno accademico, 2004/2005 Introduzione 98
Example: Moviegoer Database
Sequence Analysissimilar to MBA, but order in which items appear in the pattern is importante.g., people who rent “The Birdcage” during a visit tend to rent “Trainspotting” in the next visit.

On the road to knowledge: mining 21 years of UK traffic accident reports
Peter Flach et al.Silnet Network of Excellence
Giannotti & PedreschiAnno accademico, 2004/2005 Introduzione 100
Mining traffic accident reports
The Hampshire County Council (UK) wanted to obtain a better insight into how the characteristics of traffic accidents may have changed over the past 20 years as a result of improvements in highway design and in vehicle design.The database, contained police traffic accident reports for all UK accidents that happened in the period 1979-1999.
Giannotti & PedreschiAnno accademico, 2004/2005 Introduzione 101
Business Understanding
Understanding of road safety in order to reduce the occurrences and severity of accidents.
⌧influence of road surface condition; ⌧influence of skidding; ⌧influence of location (for example: junction
approach); ⌧and influence of street lighting.
trend analysis: long-term overall trends, regional trends, urban trends, and rural trends.the comparison of different kinds of locations is interesting: for example, rural versus metropolitan versus suburban.
Giannotti & PedreschiAnno accademico, 2004/2005 Introduzione 102
Data understanding
Low data quality. Many attribute values were missing or recorded as unknown.Different maps were created to investigate the effect of several parameters like accident severity and accident date.
Giannotti & PedreschiAnno accademico, 2004/2005 Introduzione 103
Modelling
The aim of this effort was to find interesting associations between road number, conditions (e.g., weather, and light) and serious or fatal accidents.Certain localities had been selected and performed the analysis only over the years 1998 and 1999.

Giannotti & PedreschiAnno accademico, 2004/2005 Introduzione 104
Extracted rule
FATAL Non FATAL TOTAL Road=V61 AND Weather=1
15 141 156
NOT (Road=V61 AND Weather=1)
147 5056 5203
The relative frequency of fatal accidents among all accidents in the locality was 3%. The relative frequency of fatal accidents on the road (V61) under fine weather with no winds was 9.6% — more than 3 times greater.
Giannotti & PedreschiAnno accademico, 2004/2005 Introduzione 105
Seminar 1 Case studies - Bibliography
Artif. Intell. Med. 2001 Jun;22(3), Special Issue on Data Mining in MedicineKlosgen, Zytkow, Handbook of Data Mining, Oxford, 2001Micheael, J. A. Berry, Gordon S. Linoff, Mastering Data Mining, Wiley, 2000 ECML/PKDD2004 Discovery Challenge
homepage[http://lisp.vse.cz/challenge/ecmlpkdd2004/] On the road to knowledge: mining 21 years of UK traffic accident reports, in Data Mining and Decision Support: Aspects of Integration and Collaboration, pages 143--155. Kluwer Academic Publishers, January 2003 ata Mining and Decision Support: Aspects of Integration and Collaboration, pages 143--155. Kluwer Academic Publishers, January 2003
How to develop a Data Mining Project?

Giannotti & PedreschiAnno accademico, 2004/2005 Introduzione 107
CRISP-DM: The life cicle of a data miningproject
KDD Process
Giannotti & PedreschiAnno accademico, 2004/2005 Introduzione 108
Business understanding
Understanding the project objectives and requirements from a business perspective.
then converting this knowledge into a data mining problem definition and a preliminary plan.
Determine the Business ObjectivesDetermine Data requirements for Business Objectives Translate Business questions into Data Mining Objective
Giannotti & PedreschiAnno accademico, 2004/2005 Introduzione 109
Data understanding
Data understanding: characterize data available for modelling. Provide assessment and verification for data.
Giannotti & PedreschiAnno accademico, 2004/2005 Introduzione 110
Modeling
In this phase, various modeling techniques are selected and applied and their parameters are calibrated to optimal values. Typically, there are several techniques for the same data mining problem type. Some techniques have specific requirements on the form of data. Therefore, stepping back to the data preparation phase is often necessary.
Giannotti & PedreschiAnno accademico, 2004/2005 Introduzione 111
Evaluation
At this stage in the project you have built a model (or models) that appears to have high quality from a data analysis perspective.Evaluate the model and review the steps executed to construct the model to be certain it properly achieves the business objectives.A key objective is to determine if there is some important business issue that has not been sufficiently considered.
Giannotti & PedreschiAnno accademico, 2004/2005 Introduzione 112
Deployment
The knowledge gained will need to be organized and presented in a way that the customer can use it. It often involves applying “live” models within an organization’s decision making processes, for example in real-time personalization of Web pages or repeated scoring of marketing databases.
Giannotti & PedreschiAnno accademico, 2004/2005 Introduzione 113
Deployment
It can be as simple as generating a report or as complex as implementing a repeatable data mining process across the enterprise.
In many cases it is the customer, not the data analyst, who carries out the deployment steps.