Fast equilibrium reconstruction (FASTEQ) for the control...
4
Fast equilibrium reconstruction (FASTEQ) for the control in real time of MHD instabilities in FTU tokamak S. Nowak 1 , S. Cirant 1 , E. Alessi 1 , L. Boncagni 2 , F. Crisanti 2 , C. Galperti 1 , G. Granucci 1 , C. Sozzi 1 and E. Vitale 2 1 Associazione Euratom-ENEA sulla Fusione, IFP-CNR, Via R. Cozzi 53, 20125 Milano, Italy 2 Associazione Euratom-ENEA sulla Fusione, CR ENEA Frascati, Via E. Fermi 45, 00044 Frascati, Italy e-mail : [email protected] Introduction The control of magnetohydrodynamic (MHD) instabilities as the (Neo)classical Tearing Modes ((N)TMs) is one of the major issue for the plasma confinement in fusion devices. Electron Cyclotron (EC) waves are a powerful tool to stabilize the more dangerous (2,1) and (3,2) resistive modes, but the application must be done alive in real time. In order to test the logic and the difficulties of such an application, in FTU a new two-mirrors EC launcher [1], allowing poloidal and toroidal steering in real time, can be used combined with an automatic controller of the mode based on a-priori estimate by ray-tracing of the EC deposition radius r dep and by EC Emission (ECE) and magnetic correlation of the mode location r mhd . In this way we get information of the “mean value” of both r dep and r mhd at any time and we are able to decide how to react for the stabilization of these modes adjusting the EC injection angles of the new launcher. To achieve this goal it is important to evaluate r dep in plasma by a fast ray-tracing in real time. A procedure for a fast equilibrium (FASTEQ) is provided, based on a large database of FTU equilibria with plasma boundaries provided by magnetic measurements and plasma axis from the barycentre of the electron temperature profile by a 12-channels polychromator. The Shafranov’s shift, ellipticity, triangularity and plasma current, electron density and temperature profiles are best fitted from many FTU equilibria for different plasma scenarii. FASTEQ code The FASTEQ code allows to reconstruct in real time the plasma equilibrium and calculate the ray-tracing and absorption. The -poloidal flux surfaces equilibrium map is obtained starting from the acquisition of on-line signals: plasma boundaries internal/external of the Last Closed Surface (LCS) in the major radius (r s1 /r s2 ) and vertical (z s1 /z s2 ) directions, electron temperature T e from the 12 channels of the polychromator, toroidal magnetic field and plasma current. The ray-tracing is calculated by using the on-line signal of the line-averaged electron density, 38 th EPS Conference on Plasma Physics (2011) P4.085
Transcript of Fast equilibrium reconstruction (FASTEQ) for the control...

Fast equilibrium reconstruction (FASTEQ) for the control in real time of
MHD instabilities in FTU tokamak S. Nowak1, S. Cirant1, E. Alessi1, L. Boncagni2, F. Crisanti2, C. Galperti1, G. Granucci1, C.
Sozzi1 and E. Vitale2
1Associazione Euratom-ENEA sulla Fusione, IFP-CNR, Via R. Cozzi 53, 20125 Milano, Italy 2Associazione Euratom-ENEA sulla Fusione, CR ENEA Frascati, Via E. Fermi 45, 00044
Frascati, Italy
e-mail : [email protected]
Introduction
The control of magnetohydrodynamic (MHD) instabilities as the (Neo)classical Tearing
Modes ((N)TMs) is one of the major issue for the plasma confinement in fusion devices.
Electron Cyclotron (EC) waves are a powerful tool to stabilize the more dangerous (2,1) and
(3,2) resistive modes, but the application must be done alive in real time. In order to test the
logic and the difficulties of such an application, in FTU a new two-mirrors EC launcher [1],
allowing poloidal and toroidal steering in real time, can be used combined with an automatic
controller of the mode based on a-priori estimate by ray-tracing of the EC deposition radius
rdep and by EC Emission (ECE) and magnetic correlation of the mode location rmhd. In this
way we get information of the “mean value” of both rdep and rmhd at any time and we are able
to decide how to react for the stabilization of these modes adjusting the EC injection angles
of the new launcher. To achieve this goal it is important to evaluate rdep in plasma by a fast
ray-tracing in real time. A procedure for a fast equilibrium (FASTEQ) is provided, based on
a large database of FTU equilibria with plasma boundaries provided by magnetic
measurements and plasma axis from the barycentre of the electron temperature profile by a
12-channels polychromator. The Shafranov’s shift, ellipticity, triangularity and plasma
current, electron density and temperature profiles are best fitted from many FTU equilibria
for different plasma scenarii.
FASTEQ code
The FASTEQ code allows to reconstruct in real time the plasma equilibrium and calculate the
ray-tracing and absorption. The -poloidal flux surfaces equilibrium map is obtained starting
from the acquisition of on-line signals: plasma boundaries internal/external of the Last Closed
Surface (LCS) in the major radius (rs1/rs2) and vertical (zs1/zs2) directions, electron temperature
Te from the 12 channels of the polychromator, toroidal magnetic field and plasma current.
The ray-tracing is calculated by using the on-line signal of the line-averaged electron density,
38th EPS Conference on Plasma Physics (2011) P4.085
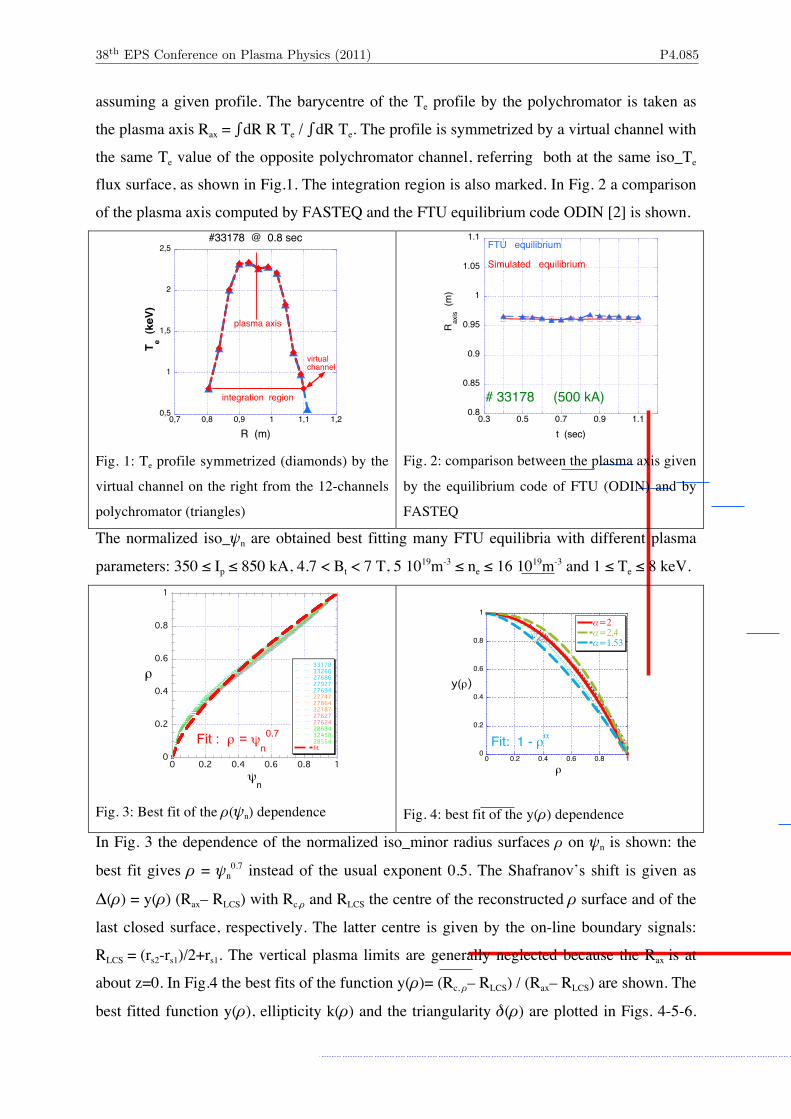
assuming a given profile. The barycentre of the Te profile by the polychromator is taken as
the plasma axis Rax = ∫ dR R Te / ∫ dR Te. The profile is symmetrized by a virtual channel with
the same Te value of the opposite polychromator channel, referring both at the same iso_Te
flux surface, as shown in Fig.1. The integration region is also marked. In Fig. 2 a comparison
of the plasma axis computed by FASTEQ and the FTU equilibrium code ODIN [2] is shown.
0,5
1
1,5
2
2,5
0,7 0,8 0,9 1 1,1 1,2
#33178 @ 0.8 sec
T e (ke
V)
R (m)
integration region
plasma axis
virtualchannel
Fig. 1: Te profile symmetrized (diamonds) by the
virtual channel on the right from the 12-channels
polychromator (triangles)
0.8
0.85
0.9
0.95
1
1.05
1.1
0.3 0.5 0.7 0.9 1.1
Raxis
(m)
t (sec)
FTU equilibrium Simulated equilibrium
# 33178 (500 kA)
Fig. 2: comparison between the plasma axis given
by the equilibrium code of FTU (ODIN) and by
FASTEQ
The normalized iso_n are obtained best fitting many FTU equilibria with different plasma
parameters: 350 ≤ Ip ≤ 850 kA, 4.7 < Bt < 7 T, 5 1019m-3 ≤ ne ≤ 16 1019m-3 and 1 ≤ Te ≤ 8 keV.
0
0.2
0.4
0.6
0.8
1
0 0.2 0.4 0.6 0.8 1
33178332602768627927276942774727864321872762727624286343245828554fit
ρ
ψn
Fit : ρ = ψn0.7
Fig. 3: Best fit of the (n) dependence
0
0.2
0.4
0.6
0.8
1
0 0.2 0.4 0.6 0.8 1
=2=2.4=1.53
y(ρ)
ρ
Fit: 1 - ρα
Fig. 4: best fit of the y() dependence
In Fig. 3 the dependence of the normalized iso_minor radius surfaces on n is shown: the
best fit gives = n0.7 instead of the usual exponent 0.5. The Shafranov’s shift is given as
() = y() (Rax– RLCS) with Rc, and RLCS the centre of the reconstructed surface and of the
last closed surface, respectively. The latter centre is given by the on-line boundary signals:
RLCS = (rs2-rs1)/2+rs1. The vertical plasma limits are generally neglected because the Rax is at
about z=0. In Fig.4 the best fits of the function y()= (Rc, – RLCS) / (Rax– RLCS) are shown. The
best fitted function y(), ellipticity k() and the triangularity () are plotted in Figs. 4-5-6.
38th EPS Conference on Plasma Physics (2011) P4.085

The 3 fits considered for y(), k() and (), enveloping the experimental data, give
differences up to about 0.06% in the simulated equilibrium. The dispersion of data for () in
the range 0 < < 0.025 is due to numerical errors; very low triangularity is typical in FTU.
0.95
1
1.05
1.1
1.15
0 0.2 0.4 0.6 0.8 1
a=1.10,b=0.11,c=0.05a=1.11,b=0.11,c=0.07a=1.09,b=0.122,c=0.05
k(ρ)
ρ
Fit: a - bρ + c*ρ2
Fig. 5: Best fit of the ellipticity k()
-0.3
-0.2
-0.1
0
0.1
0.2
0.3
0 0.2 0.4 0.6 0.8 1
a=0,b=0.055,c=5a=0.03,b=0.055,c=4a=-0.04,b=0.065,c=4
δ(ρ)
ρ
Fit: a + bρc
Fig. 6: Best fit of the triangularity ()
Finally, the iso_ flux surfaces are parameterized as:
!
R = a"cos[# +$(")sin(# )+ R LCS +%(") z = a"sin# k(")
In Fig. 7 the FTU equilibrium and ray-tracing from ODIN and FASTEQ codes are compared
for the discharge #33178 at 0.7s, 500 kA, 5.4 T with electron peak density 6 1019m-3 and
temperature 2.4 keV. The simulated equilibrium is given here for y()=1.2, k()=1.1 and
()=0; the density profile is fitted as: ne() 1.8 ne_av(1-n) and Te(n)=Te,0poly(1-n0.8)1.7. The
calculated rdep is about at the same location of rdep by ODIN -4% corresponding at r~-1 cm.
The 2 EC power depositions, located inside the same 2 channels of polychromator, are seen at
the same position by the automatic controller. The fast rdep calculation [3] is provided
considering 3 optical rays: one central and 2 outer rays of the injected beam. The a-priori
estimate of rdep is the mean value of the deposition location of these 3 rays: rdep= (rdep_central +
r1dep_outer + r2dep_outer) / 3.
-40
-30
-20
-10
0
10
20
30
40
60 70 80 90 100 110 120 130
# 33178 @ 0.7s
z (
cm
)
R (cm)
FTU equilibrium
NEW equil.
EC res
Fig. 7: ODIN and FASTEQ equilibria
Fig. 8: comparison of the q=1 location with the
polychromator channels (left) and the profile given by
FASTEQ code (right) for the shot #34286 at 0.67s.
38th EPS Conference on Plasma Physics (2011) P4.085

FASTEQ gives also the q profile in cylindrical approximation using the fitted plasma current
profile Ip(n)/Ip=1.9n-0.9n2: an example is shown in Fig.8 where the q=1 location is
compared with the inversion radius position from the polychromator channels.
The different combinations of the 3 fits for y(), k() and (), used in the equilibrium
reconstruction, give the error bar estimate w.r.t. the FTU equilibrium. The minimum and
maximum error bars found are shown in Fig. 9, being theta the angle spanning the poloidal
section, r and rde the minor radius from FASTEQ and ODIN, respectively.
-0.4
-0.3
-0.2
-0.1
0
0.1
0.2
0.3
0.4
-0.02
-0.015
-0.01
-0.005
0
0.005
0.01
0.015
0.02
-1 0 1 2 3 4 5 6 7
r - rd
e (
cm) (r - rde) /r
theta (rad) Fig. 9(a): minimum differences in terms of r-
rde and (r-rde)/r
-2
-1.5
-1
-0.5
0
0.5
1
-0.1
-0.08
-0.06
-0.04
-0.02
0
0.02
-1 0 1 2 3 4 5 6 7
r - rd
e (
cm) (r - rde) /r
theta (rad) Fig. 9(b): maximum differences in terms of r-rde and
(r-rde)/r
FASTEQ on MARTe real time framework
The fast equilibrium code is now implemented using the MARTe real time framework and
runs over the backup feedback control system [4] in ~ 44 µsec.
Conclusions
A procedure for a fast equilibrium (FASTEQ) for the real time MHD control using a new
two-mirrors EC launcher is provided, based on a large database of FTU equilibria by using
plasma boundaries by magnetic measurements and plasma axis by the 12 channels of
polychromator. The Shafranov’s shift, ellipticity, triangularity and electron density and
temperature profiles are best fitted from the data of many FTU equilibria for different plasma
scenarii. The good agreement found with the FTU equilibrium code ODIN encourages to
take into account both these codes in the automatic controller.
References [1] W. Bin et al., 2009 Fusion Engineering and Design 84 451, Elsevier
[2] F. Alladio and F. Crisanti, 1986 Nucl. Fusion 26 1143
[3] S. Nowak and A. Orefice, 1994 Phys. Plasmas 1 1242
[4] L. Boncagni et al., 2011 preprint submitted to Fusion Engineering and Design
38th EPS Conference on Plasma Physics (2011) P4.085