Chimica delle Proteine e Medicina Molecolarepaduaresearch.cab.unipd.it/3378/1/PhD_Thesis.pdf ·...
172
UNIVERSITA’ DEGLI STUDI DI PADOVA Dipartimento di Scienze Farmaceutiche Scuola di Dottorato in Scienze Molecolari Indirizzo Scienze Farmaceutiche XXIII° Ciclo Chimica delle Proteine e Medicina Molecolare Direttore della Scuola: Ch.mo Prof. Maurizio CASARIN Coordinatore di indirizzo: Ch.ma Prof.ssa Adriana CHILIN Supervisore: Ch.mo Prof. Vincenzo DE FILIPPIS Dottorando: Dr. Fabio MASET
Transcript of Chimica delle Proteine e Medicina Molecolarepaduaresearch.cab.unipd.it/3378/1/PhD_Thesis.pdf ·...
UNIVERSITA’ DEGLI STUDI DI PADOVA
Dipartimento di Scienze Farmaceutiche
Scuola di Dottorato in Scienze Molecolari
Indirizzo Scienze Farmaceutiche
XXIII° Ciclo
Chimica delle Proteine e
Medicina Molecolare Direttore della Scuola: Ch.mo Prof. Maurizio CASARIN
Coordinatore di indirizzo: Ch.ma Prof.ssa Adriana CHILIN
Supervisore: Ch.mo Prof. Vincenzo DE FILIPPIS
Dottorando: Dr. Fabio MASET

UNIVERSITY OF PADUA
Department of Pharmaceutical Sciences
Ph.D. School in Molecular Sciences
Pharmaceutical Sciences Curriculum
XXIII° Cycle
Protein Chemistry and
Molecular Medicine School Director: Prof. Maurizio CASARIN
Curriculum Coordinator: Prof. Adriana CHILIN
Supervisor: Prof. Vincenzo DE FILIPPIS
Ph.D. Student: Fabio MASET


Non pregate per avere una
vita facile. Pregate piuttosto per
essere persone più forti.
John Fitzgerald Kennedy

Cover Illustration: Jackson Pollock - Enchanted Forest, 1947 Oil on canvas 221,3 x 114,6 cm Peggy Guggenheim Collection, Venice
CONTENTS
RIASSUNTO 1
ABSTRACT 3
1. INTRODUCTION
An introduction to mass spectrometry 7
Ionization methods 8
Electrospray ionization 8
Matrix-assisted laser desorption/ionization 11
Mass analysers 13
The quadrupole mass filter 14
The TOF mass analyzer 15
Protein preparation and purification 17
Special considerations for protein preparation methods 17
Analysis of intact proteins 18
Digestion and preparation of gel-separated proteins for MS analysis 19
Peptide sequencing by tandem mass spectrometry 20
Protein identification by database searching 22
Peptide mass fingerprint 22
Searching with tandem mass spectrometric data 23
Database searching and protein modifications 24
Liquid chromatography and tandem mass 24
Principles 24
Instrumental and practical considerations 26
References 29
2. PROTEASE NEXIN-1 (PN-1)
Conformational and biochemical characterization of a biological active rat
recombinant protease nexin-1 expressed in E.coli 37
Introduction 37
Materials and methods 38
Results 46
Discussion 61
References 63
3. PYTHON SEBAE SERUM
A novel protein from the serum of Python sebae, structurally homologous
to γ-phospholipase A2 inhibitor, displays antitumor activity 71
Introduction 71
Materials and methods 73
Results 80
Discussion 93
References 96
Supplemental data 98
4. ALANINE:GLYOXYLATE AMINOTRANSFERASE (AGT)
Molecular defects of the glycine 41 variants of alanine:glyoxylate aminotransferase
associated with primary hyperoxaluria type I 107
Introduction 107
Materials and methods 109
Results 111
Discussion 119
References 122
Supporting Information .124
5. VON WILLEBRAND FACTOR (VWF)
Serine proteases from primary granules of leukocytes efficiently cleave oxidized
von willebrand factor: divergence from ADAMTS-13 137
Introduction 137
Materials and methods 138
Results 143
Discussion 152
References 155
APPENDICES
Appendix A. Abbreviations and symbols 163
Appendix B. Amino acids nomenclature 164
1
RIASSUNTO
La proteomica riguarda lo studio sistematico delle proteine al fine di fornire una visione
completa della funzione, della struttura e della regolazione dei sistemi biologici. I progressi
avvenuti negli ultimi decenni, sia per quanto riguarda la strumentazione sia le metodologie
utilizzate, hanno permesso di ampliare il campo di studi biologici passando dall’analisi di proteine
purificate all’analisi di miscele complesse. La proteomica sta rapidamente diventando una
componente essenziale della ricerca biologica ed associato ai progressi della bioinformatica, questo
approccio alla descrizione dei sistemi biologici avrà indubbiamente un impatto notevole sulla nostra
comprensione dei fenotipi sia delle cellule normali e malate.
Inizialmente la proteomica era focalizzata principalmente sulla generazione di mappe proteiche
bidimensionali utilizzando elettroforesi su gel di poliacrilammide. La verifica dell’espressione o la
misurazione quantitativa dei livelli globali di proteine può ancora essere fatta sulla base dei gel
bidimensionali, tuttavia oramai questi compiti sono affidati alla spettrometria di massa la quale può
contare su di un’elevata sensibilità e specificità. La spettrometria di massa applicata alle proteine
offre molti vantaggi: oltre a calcolare il peso molecolare con elevata precisione, questa tecnica
permette di analizzare e caratterizzare la sequenza aminoacidica. Può anche essere utilizzata nello
studio delle modificazioni post-traduzionali e per monitorare la formazione di complessi in
soluzione. Infine può essere applicata con differenti scopi, quali l'analisi conformazionale, l'analisi
della cinetica di ripiegamento e di studi sulle attività catalitiche delle proteine.
Durante il dottorato di ricerca la mia attenzione è stata focalizzata soprattutto sull’utilizzo di tale
tecnica abbinata a metodologie di chimica delle proteine quali ad esempio l’elettroforesi mono e
bidimensionali, differenti cromatografie in fase liquida, la sintesi peptidica in fase solida e l’utilizzo
di proteasi enzimatiche. In particolare in questa Tesi di Dottorato gli argomenti di studio sono stati
trattati singolarmente, distinguendo i principali progetti in cui sono stato coinvolto in capitoli
indipendenti. Brevemente, nel capitolo 2 è proposto lo studio di protease nexin-1 (PN-1), il
principale inibitore della trombina a livello cerebrale, volto a chiarire la funzione della porzione
glucidica sulla conformazione, stabilità e funzione della proteina mediante lo studio della proteina
ricombinante prodotta in E. coli. Nel capitolo 3 è riportato il lavoro concernente la purificazione e la
caratterizzazione chimica, in particolare dell’identificazione de novo della sequenza amminoacidica,
di un analogo dell’inibitore della fosfolipasi A2 estratto dal siero di Python sebae, il quale ha
dimostrato di possedere un effetto citotossico pro-apoptotico e che potrebbe essere sfruttato per lo
sviluppo di nuove strategie antitumorali. Nel capitolo 4 l’attenzione è stata concentrata a chiarire le
2
dinamiche molecolari che portano allo sviluppo di iperossaluria primaria di tipo I mediante lo studio
del mutante G41R dell’enzima alanina:gliossilato amminotransferasi (AGT) analizzando in
particolar modo i meccanismi che portano G41R ad essere maggiormente soggetto a degradazione e
aggregazione rispetto alla proteina WT. Infine, il capitolo 5 tratta dell’effetto dello stress ossidativo
sul metabolismo del fattore di von Willebrand (VWF). Il fattore di von Willebrand è una
glicoproteina plasmatica estremamente complessa le cui dimensioni contribuiscono a regolare
l’equilibrio emostatico. Nello specifico, è stato osservato come l’ossidazione di un residuo di
metionina situato nel dominio A2 della glicoproteina impedisca il taglio proteolitico da parte di
ADAMTS-13, mentre non vada ad influenzare o in alcuni casi addirittura favorisca la proteolisi di
VWF da parte di proteasi leucocitarie liberate dai polimorfonucleati in seguito a stati infiammatori.
3
ABSTRACT
Proteomics involves the systematic study of proteins in order to provide a comprehensive view
of the structure, function and regulation of biological systems. Advances in instrumentation and
methodologies have fueled an expansion of the scope of biological studies from simple biochemical
analysis of single proteins to measurements of complex protein mixtures. Proteomics is rapidly
becoming an essential component of biological research. Coupled with advances in bioinformatics,
this approach to comprehensively describing biological systems will undoubtedly have a major
impact on our understanding of the phenotypes of both normal and diseased cells.
Initially, proteomics was focused on the generation of protein maps using two-dimensional
polyacrylamide gel electrophoresis. Protein expression, or the quantitative measurement of the
global levels of proteins, may still be done with two-dimensional gels, however, mass spectrometry
has been incorporated to increase sensitivity, specificity and to provide results in a high-throughput
format.
Mass spectrometry applied to proteins offers many advantages: in addition to calculating the
molecular weight with high accuracy, this technique allows to analyze and characterize the amino
acid sequence. It can also be used in the study of post-translational modifications and to monitor the
formation of complexes in solution. Finally it can be applied with different purposes such as the
conformational analysis, analysis of the kinetics of refolding and studies on the catalytic activities
of proteins.
During my Ph.D. course my efforts have been mainly devoted on the use of this technique in
combination with methods of protein chemistry such as the one- and two-dimensional
electrophoresis, differents liquid chromatographies, solid phase peptide synthesis and use of
proteolytic enzymes. Herein reported in my Ph.D. Thesis, the different treated subjects are divided
into independent chapters each containing a single case study. Briefly in chapter 2 it has been
proposed the study on protease nexin-1 (PN-1), the main inhibitor of thrombin in the brain, aimed at
clarifying the role of the carbohydrate portion on the conformation, stability and function, through
studies on recombinant protein produced in E.coli. In chapter 3 it has been showed the work on
purification and chemical characterization, including de novo identification of amino acid sequence,
of a similar inhibitor of phospholipase A2 extracted from the Python sebae serum, which
demonstrated an effect cytotoxic pro-apoptotic and that could be exploited for the development of
new anticancer strategies. In chapter 4 it has been reported the molecular dynamics that lead to the
development of primary hyperoxaluria type I by studying the G41R mutant enzyme alanine:
4
glyoxylate aminotransferase (AGT). In particular, were investigated the mechanisms leading to
G41R be more susceptible to degradation and aggregation than wild type protein. Finally, chapter 5
deals with the effect of oxidative stress on the metabolism of von Willebrand Factor (VWF). The
von Willebrand Factor is a very complex plasma glycoprotein whose dimensions help to regulate
the hemostatic balance. Specifically, in the study was observed as the oxidation of a methionine
residue located in the A2 domain of glycoprotein prevents proteolytic cleavage by ADAMTS-13,
while not going to influence or, in some cases, promote proteolysis of VWF by proteases released
from polymorphonuclear leukocytes in inflammatory conditions.

1. INTRODUCTION

1.Introduction
7
CHAPTER 1
An Introduction to Mass Spectrometry
Mass spectrometry (MS) is an analytical technique whose beginnings date back to the early days
of the last century. Among the analytical techniques, MS holds a special place because it measures
an intrinsic property of a molecule, its mass, with very high sensitivity and therefore it is used in an
amazingly wide range of applications. Beginning in the 1980s and on a larger scale in the 1990s,
mass spectrometry has played an increasingly significant role in the biological sciences. Why has it
taken so long? Mainly because mass spectrometers require charged, gaseous molecules for analysis.
Biomolecules being large and polar, however, they are not easily transferred into the gas phase and
ionized. Electrospray (ES) (1) and matrix-assisted laser desorption ionization (MALDI) (2) are the
ionization techniques that should be credited most for the success of mass spectrometry in the life
sciences. These methods were developed in the late 1980s and were the basis for the increasingly
powerful instrumentation that became available a few years later. Major advances were also made
in sample preparation for MS, a crucial area for overall feasibility and sensitivity of analysis.
Starting in 1993, software algorithms were published that allowed the correlation of mass
spectrometric data obtained for a protein with the increasingly populated sequence databases. In
retrospect, this event marked the transformation of mass spectrometry into a largescale, functional
genomics technique. The last few years have seen development of even more powerful
instrumentation and algorithms for protein characterization, a trend that shows no signs of slowing
down.
At the same time MS was being developed to meet the demands of molecular biology for high
sensitivity, the concept of proteomics began to be popularized. Proteomics is now defined as the
large-scale analysis of the function of genes and is becoming a central field in functional genomics
(3). The major tool to study purified proteins in this field is mass spectrometry. The history of
proteomics dates back to the discovery of two-dimensional gels in the 1970s, which provided the
first feasible way of displaying hundreds or thousands of proteins on a single gel (4, 5).
Identification of the spots separated on these gels remained laborious and was limited to the most
abundant proteins until the 1990s, when biological mass spectrometry had developed into a
sufficiently sensitive and robust technique. Today, mass spectrometry is an essential element of the
proteomics field. Indeed, researchers are now successfully harnessing the power of MS to supersede
the two-dimensional gels that originally gave proteomics its impetus.
1.Introduction
8
Currently, the uses of MS in proteomics are in three major areas. MS is the preferred technique
for characterization and quality control of recombinant proteins and other macromolecules, an
important task in the field of biotechnology. It is also commonly used for protein identification,
either in classical biochemical projects or in large-scale proteomic ones. Finally, because MS
measures the molecular weight of a protein, it is the method of choice for the detection and
characterization of posttranslational modifications and potentially can identify any covalent
modification that alters the mass of a protein.
Ionization methods
Mass spectrometry measures the mass-to-charge ratio of ionised molecules in the gas phase.
Hence, the analytes need to be ionised and transferred to the gas phase prior to analysis. Earlier
techniques such as electron impact (EI) (6) and chemical ionisation (CI) (7) were efficient in
ionising small volatile thermally stable molecules. Fast-atom bombardment (FAB) was introduced
in the early 1980s by Barber and co-workers (8) and was the first ionisation technique that could be
used for routine analysis of biomolecules of mass up to a few thousand daltons (9). The soft
ionisation techniques, MALDI and electrospray, are the revolutionising methods that have made
mass spectrometry one of the most important tools to analyse large biomolecules.
Electrospray ionization
Electrospray is an atmospheric-pressure ionisation method that produces small charged droplets
from a liquid medium under the influence of an electric field. The process itself originates from the
beginning of the last century but it was Dole and co-workers (10) who first transferred large
molecules to the gas phase in the late 1960s. In 1984, electrospray was used for the first time to
create gas phase ions to be analysed by a mass spectrometer. The group of J. B. Fenn reported the
use of electrospray mass spectrometry (11,12) at approximately the same time as Alexandrov and
co-workers (13) but it was still a few more years before the first electrospray mass spectra of large
molecules were published, again from the group of Fenn (14,15).
As Alexandrov et al. (13) reported 1984, electrospray is a very suitable method for combining
chromatographic methods with mass spectrometry. This is because the electrospray process
transfers ions from the solution phase to the gas phase at atmospheric pressure. In conventional
electrospray, a flow of liquid, from a chromatographic system or a syringe pump, is passed through
1.Introduction
9
a thin conducting needle at high voltage (3–4 kV). The potential difference is applied between the
needle and the counter electrode (the inlet of the mass spectrometer). The analytes will to some
extent, depending on the pH of the solvent, exist in an ionised form in the liquid and the applied
potential will create an accumulation of like charges at the tip of the needle. Positive or negative
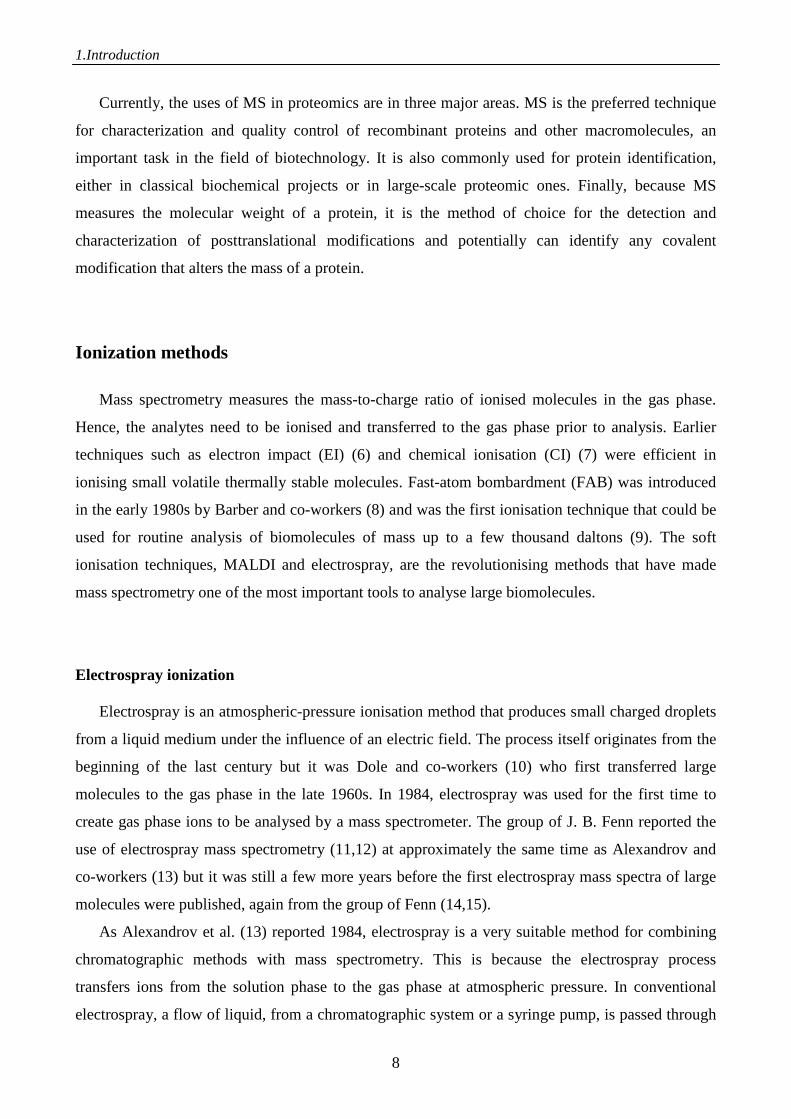
ions will migrate to the end of the capillary depending on the polarity of the applied field. Figure 1
illustrates the electrospray process in the positive-ion mode, where positively charged ions
accumulate at the liquid surface (meniscus). Ions of opposite polarity (negatively charged ions) will
migrate towards the positive capillary wall. The high density of positive charges at the tip leads to
the formation of a Taylor cone (16) due to the repulsive coulombic forces between the positive ions.
Under a high electric field, the repulsive forces become stronger than the surface tension at the tip
of the cone, and a liquid mist is ejected. The mist breaks up in small highly charged droplets when
moving towards the counter electrode (Fig. 1).
Figure 1. Schematic representation of the electrospray process. A positive potential is applied to the capillary, causing positiveions in solution to drift towards the meniscus. The meniscus destabilises, leading to the formation of a Taylor cone emitting droplets with excess positive charge. Gas phase ions are formed from charged droplets in a series of solvent evaporation cycles as they are accelerated towards the entrance of the mass spectrometer.
Both a potential and a pressure gradient will direct the droplets towards the inlet of the mass
spectrometer and a counter-current flow of gas facilitates solvent vaporisation and prevents ion
cluster formation. As the solvent evaporates, the charge remains constant in the droplets and at a
certain point, the surface coulombic forces exceed the surface tension forces, the Rayleigh limit
(17), and the droplets break up into smaller droplets (18). This process continues until droplets with
diameters in the nanometer range are generated. The formation of gas phase ions from the small
charged droplets is not yet fully understood. Two mechanisms have been proposed. The original
idea was that the solvent evaporates and droplets break up until those with only a single analyte ion
1.Introduction
10
are created (10). The evaporation continues until a gas phase ion is formed. This is usually referred
to as the charged-residue model. Iribarne and Thomson (19) suggested an alternative mechanism in
1976 (the ion evaporation model), in which they proposed that droplets with a radius less than 10
nm can allow field desorption, i.e. direct emission of a gaseous ion. The charge state of the ion will
depend on the number of charges that are transferred from the droplet surface to the ion during
desorption. The gas phase ion formation processes are still under debate, and while the ion
evaporation theory might be the most accepted, a mechanism related to the charged-residue process
may account for the formation of gaseous protonated macromolecules (20). A number of useful
papers and volumes have been published in which detailed descriptions of the electrospray process
are discussed (21-24).
The electrospray ion source has gone through major developments since its introduction.
Conventional electrospray instruments operate best at a flow rate of 3–10 µl/min, but the coupling
of liquid chromatography (LC) to mass spectrometry has sometimes demanded flow rates of up to 1
ml/min. The electrospray evaporation is then facilitated by a coaxial gas flow (a nebulising gas)
(25). This type of source is generally called pneumatically assisted electrospray. On the other hand,
the coupling of capillary electrophoresis (CE) to mass spectrometry gives very low flow rates and a
sheath flow of organic solvent might be needed. However, this process dilutes the sample solution
and sheathless interfaces have been developed (26). Like all other analytical techniques,
miniaturisation has been one of the key steps in the development of electrospray ionisation. The
first report on low-flow-rate electrospray ionisation came in 1993 (27). The following year, Emmett
and Caprioli (28) followed up with a continuous infusion source operating at a flow rate of
approximately 300–800 nl/min, resulting in a major sensitivity increase. This source is called the
microelectrospray source and neuropeptides have been analysed down to the zeptomole (10–21
mole) level (29). The first electrospray source without continuous infusion was developed by Wilm
and Mann (30,31) and called nanospray. The sample is sprayed from a metal-coated capillary
(needle) with an opening of 1–10 µm. This results in a flow rate of 20–50 nl/min and, hence, small
sample volumes are consumed. Less than 0.5 µl can be loaded into the needle and used for more
than 15 min in favourable situations. This time frame is usually enough for several MS/MS
experiments. The flow rate will depend on the orifice diameter of the needle, the applied voltage
(usually < 1 kV) as well as the viscosity and volatility of the solvent. The nanospray source has
higher ionisation efficiency than a conventional electrospray source due to the production of smaller
droplets, and it is also reportedly less sensitive to salts than conventional electrospray. Another
modification that has made electrospray sources overall more tolerant to inorganic salts is the Z-
spray configuration (32). In this set-up, the spraying device is mounted at a right angle to the
1.Introduction
11
inlet/cone of the mass spectrometer. The idea is that the major part of the inorganic salts will not be
desorbed from the droplets and will hence travel in a straight path and not be analysed, while the
organic ions will be more easily transferred to the gas phase and transported into the mass
spectrometer down the pressure and potential gradients.
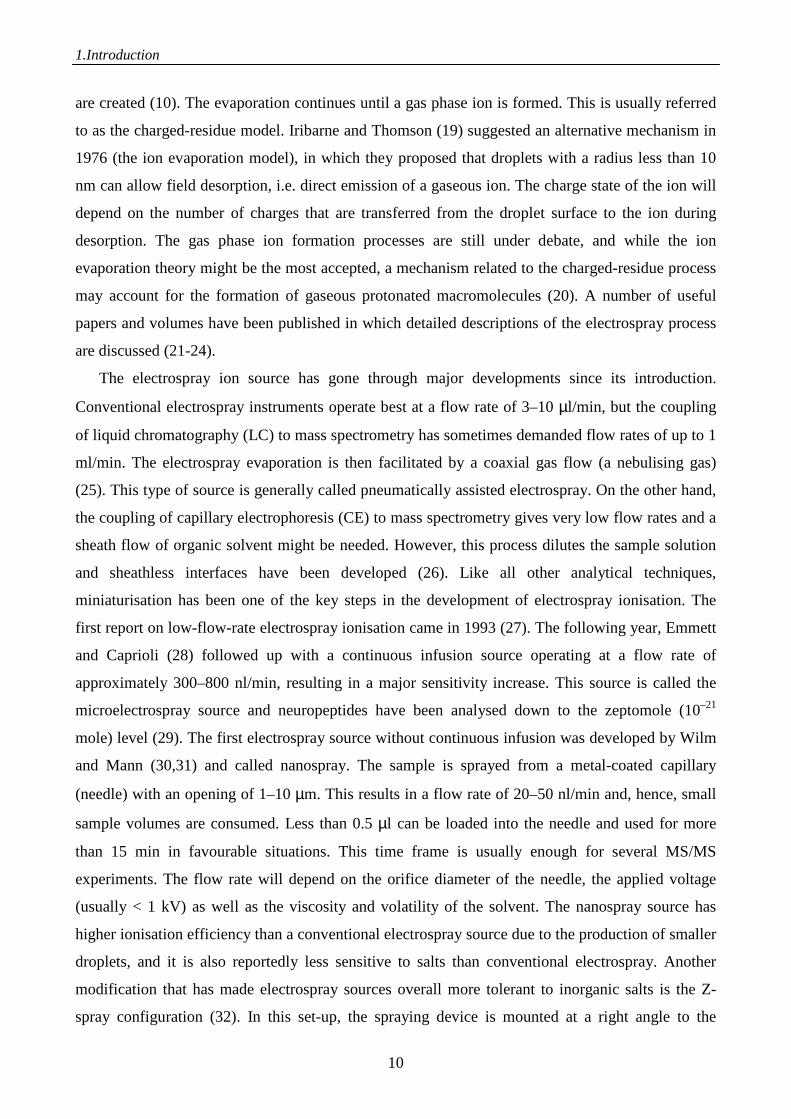
Electrospray ionisation produces multiply charged ions, and proteins with molecular weights in
the 10–100 kDa mass range will in general produce an envelope of ions with m/z values below 2500
(Fig. 2). Ion transmission is generally good in this region and mass measurement statistics are
excellent due to many different charge states being observed. These features make electrospray the
most suitable ionization method for molecular-weight determination of large biomolecules. The
envelope of different charge states can be converted to a true mass scale via maximum-entropy
processing (Fig. 2), an iterative method that calculates the mass and the abundance from the
experimental m/z peaks (33) or via other deconvolution or transform processes.
Figure 2. Electrospray mass spectrum of a protein. The attachment of many protons per protein molecule (from less than 30 to more than 50 here) leads to a series of m/z peaks for this single protein. The inset shows a computer analysis of the data from this series of peaks that generates a single peak at the correct molecular mass of the protein. (Adapted from Figure 2 in Mann M, Wilm M, 1995. Trends in Biochemical Sciences 20:219–224.)
Matrix-assisted laser desorption/ionisation
MALDI was introduced in the late 1980s by the group of Hillenkamp (34). The MALDI
technique is, like electrospray ionisation, referred to as ‘soft’ and thereby compatible with analysis
1.Introduction
12
of large biomolecules like proteins (35,36). The analytes are mixed with a saturated solution of
ultraviolet-absorbing matrix. The most commonly used matrices in peptide/protein analysis are α-
cyano-4-hydroxy-cinnamic acid (for small peptides) and 3,5-dimethoxy-4-hydroxy-cinnamic acid, i.
e. sinapinic acid (for larger peptides and proteins). The matrix/analyte mixture is applied to a target
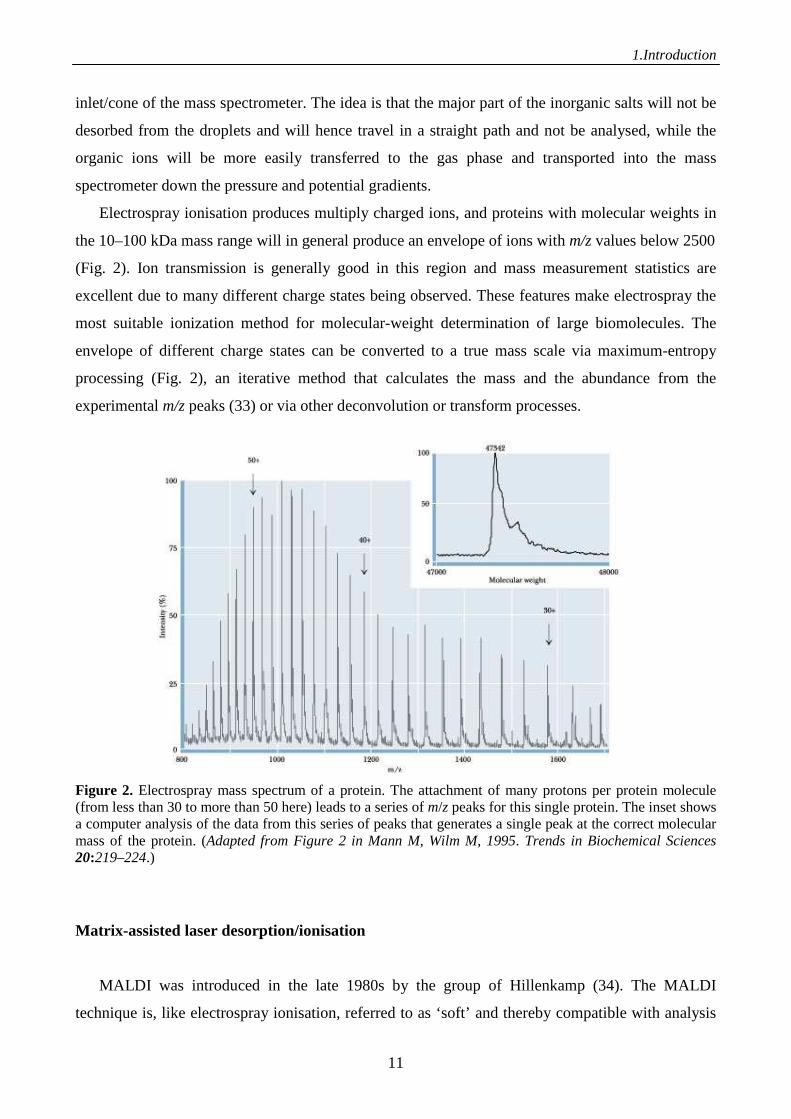
plate. The solvent evaporates and the matrix and the analytes co-crystallise on the target. A laser
beam (commonly a nitrogen laser at 337 nm) provides light that is absorbed by the aromatic matrix
molecules. Energy is subsequently transferred to the analyte that becomes desorbed into the gas
phase (Fig. 3). The ionisation mechanism is not fully understood and several suggestions are still
debated (37). Co-desorption of matrix and analyte succeeds proton transfer, which may take place
in the solid phase, and also in the expanding plume of matrix and analyte ions after the laser
irradiation.
Figure 3. Ionization of matrix and sample particles as a result of laser exposure.
The MALDI source has traditionally been coupled to TOF mass analysers because of its pulsed
nature. Recent developments have made possible atmospheric pressure MALDI mass spectrometry.
MALDI produces mainly singly charged ions, and this feature means it is excellently suited for
analysis of complex biological mixtures such as protein digests (38). MALDI TOF mass
spectrometry is thus the primary analytical technique in proteomics for identification of proteins
separated by two-dimensional gel electrophoresis (39). The basic amino acid residues in peptides
and proteins are easily protonated and, consequently, these biomolecules are preferably analysed in
the positive ion mode. The MALDI ionisation process is less sensitive to salts than electrospray
ionisation. Nevertheless, salts and other impurities will cause peak broadening with the formation of
adducts. This will lower the mass accuracy and limit sensitivity, and these problems highlight the
1.Introduction
13
importance of satisfactory sample preparation. A number of different clean-up approaches have
been reported (40-41) often including the use of microcolumns for desalting, which have recently
become available commercially (ZipTip; Millipore). Several biotechnology companies have
launched robotic systems that desalt the large sample sets produced, before the introduction of
sample to MALDI mass spectrometry.
For a long time, MALDI TOF was considered a low-resolution mass spectrometric method. The
introduction of delayed extraction (42-44) and the mass reflectron (45) has changed this view
dramatically. Descriptions of these two features can be found below in the ‘The time-offlight mass
analyser’ section.
MALDI TOF has lately become the instrument of choice for many laboratories that are
investing in mass spectrometry equipment. The major advantages are that it is an easy system to
operate, it requires minimal mass spectrometric expertise to obtain data and it usually gives a quick
result. The relatively low purchasing cost together with reasonable running costs are other
parameters that make the system attractive from a buyers point of view. However, as with all mass
spectrometric systems, the interpretation of data, whether mass spectra or a list of database search
‘hits’, requires a degree of expertise and provides the rate-determining step for protein analysis.
Mass analysers
When ions have been formed in the source, they are transported to the analyser region and
separated according to their mass-to-charge ratio. A number of mass analysers are available which
can be divided into two classes. The first class, electric-field mass analysers, consist of the
quadrupole mass filter, the quadrupole ion trap (Paul trap) and the TOF mass analyser. The second
class, magnetic field mass analysers, comprise magnetic sectors and ion cyclotron resonance mass
analysers. The different analysers vary in their mass accuracy, mass range, resolution, sensitivity,
speed, footprint, cost, and the choice will depend on the specific application. The quadrupole ion
trap, for example, has MSn capability (the possibility to perform dissociation analysis of created
product ions), and FTICR mass spectrometers have extraordinary resolution (up to 107) and mass
accuracy (46). Magnetic sector instruments are the most mature instruments on the market and have
been a mainstay for many decades. Today, they are the instrument of choice for environmental
pollutant analysis. However, quadrupoles, traps and TOF instruments have largely accommodated
the growth in biological applications while the market for sector instruments remains constant. The
characteristics of the quadrupole mass filter and the TOF mass analyzer are described below.
1.Introduction
14
The quadrupole mass filter
The quadrupole mass filter is the most common mass analyser in use today and can be regarded
as a real ‘workhorse’. It was introduced in the early 1950s (47) and the technique has only seen
modest developments since then. The mass filter is used extensively as both a stand-alone device
and in multistage mass spectrometers like triple quadrupoles (48) and quadrupole TOF instruments
(49,59). The quadrupole analyser is constructed of four electronically conducting cylindrical rods
and is operated by the application of a combination of direct current (DC) and radio frequency (RF)
voltages (Fig.4).
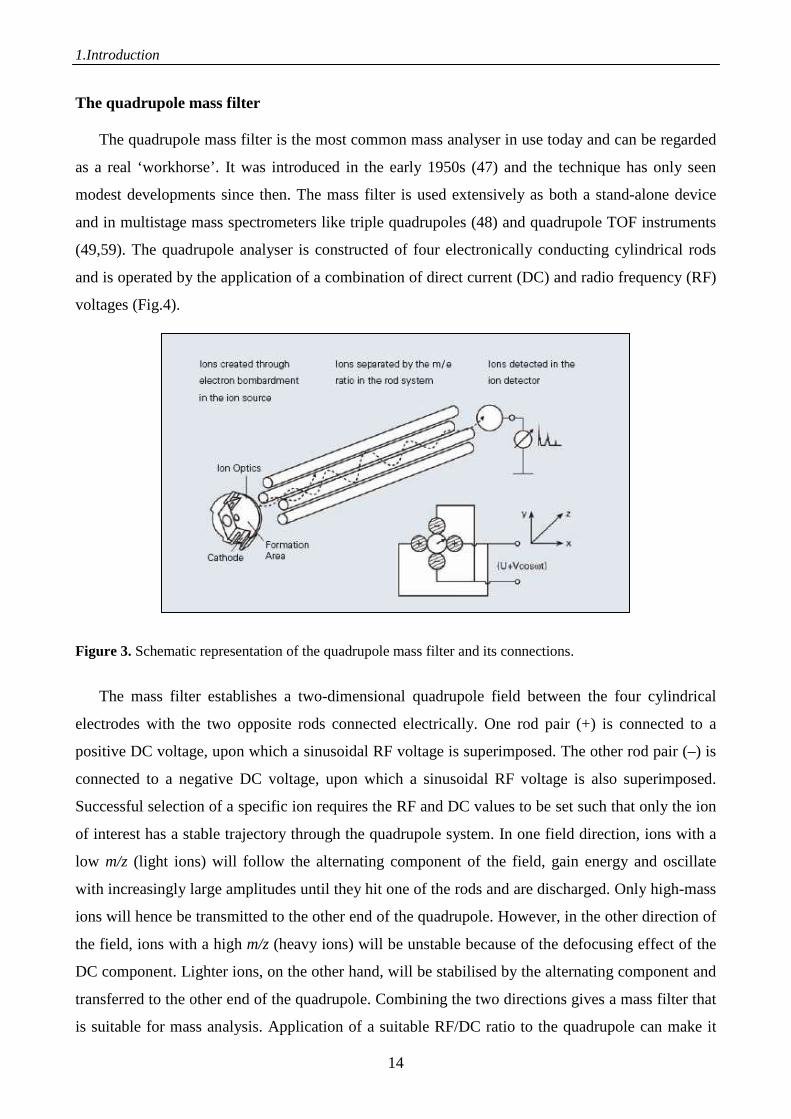
Figure 3. Schematic representation of the quadrupole mass filter and its connections.
The mass filter establishes a two-dimensional quadrupole field between the four cylindrical
electrodes with the two opposite rods connected electrically. One rod pair (+) is connected to a
positive DC voltage, upon which a sinusoidal RF voltage is superimposed. The other rod pair (–) is
connected to a negative DC voltage, upon which a sinusoidal RF voltage is also superimposed.
Successful selection of a specific ion requires the RF and DC values to be set such that only the ion
of interest has a stable trajectory through the quadrupole system. In one field direction, ions with a
low m/z (light ions) will follow the alternating component of the field, gain energy and oscillate
with increasingly large amplitudes until they hit one of the rods and are discharged. Only high-mass
ions will hence be transmitted to the other end of the quadrupole. However, in the other direction of
the field, ions with a high m/z (heavy ions) will be unstable because of the defocusing effect of the
DC component. Lighter ions, on the other hand, will be stabilised by the alternating component and
transferred to the other end of the quadrupole. Combining the two directions gives a mass filter that
is suitable for mass analysis. Application of a suitable RF/DC ratio to the quadrupole can make it
1.Introduction
15
discriminate against both high- and low-mass ions to a desired degree. The mass filter can be set to
transmit a single isotope or to scan over a wide m/z range.The mass filter is a continuous analyser
compared to the TOF analyser that has a pulsed nature. This feature makes the quadrupole highly
compatible with continuous infusion sources, e. g. electrospray and liquid separation techniques
such as high-performance liquid chromatography (HPLC) and CE. The sensitivity of the analyser
for mass spectral acquisition is limited by the necessity to scan the quadrupole. The mass range of
commercial instruments is now about m/z 4000. However, modern quadrupoles can transmit ions
with m/z values above 10,000 (51) and by reducing the operating frequency, the mass range can be
extended to m/z 45,000 (52). Even though calibration is a straightforward process in mass filters
(m/z depends linearly on RF and DC), mass accuracy has traditionally been poor. However, Green
and co-workers have shown that accuracies in the range of 5 ppm can be achieved with careful
operation (53).
The TOF mass analyzer
A major development in TOF mass spectrometry came in the mid 1950s when Wiley and
McLaren (54) described ‘time-lag focusing’which markedly improves resolution. The principle of
the TOF mass analyser is to measure the flight time of ions accelerated out of an ion source into a
field-free drift tube to a detector. The flight time is related to the m/z values of the ions according to
the following formula:
TOF = L (2Uacc e)–1/2 (m/z)1/2
where L is the drift length in the field-free region, Uacc is the potential difference in the accelerating
region, e is the charge of an electron, m is the mass of the ion and z is its charge state. The TOF is
usually measured from the time point at which the ions are accelerated out of the source to the time
point when they reach the detector. The ions will separate in the TOF mass analyser according to
their m/z ratios, light ions arriving at the detector earlier than heavy ions if they carry the same
number of charges.
The ions initial spatial spread and initial velocity of the ions limit the resolving power of a TOF
mass analyser. In a MALDI source, for example, the ionisation creates a burst of ions that will be at
different distances from the detector (spatial spread) and have different kinetic energies. Ions with
the same m/z value but with different distances to the detector will consequently be detected at
different time points, thus decreasing resolution. The same is true for ions with the same m/z value
1.Introduction
16
but with different initial kinetic energy. As mentioned earlier, powerful tools have been invented to
compensate for these two problems.
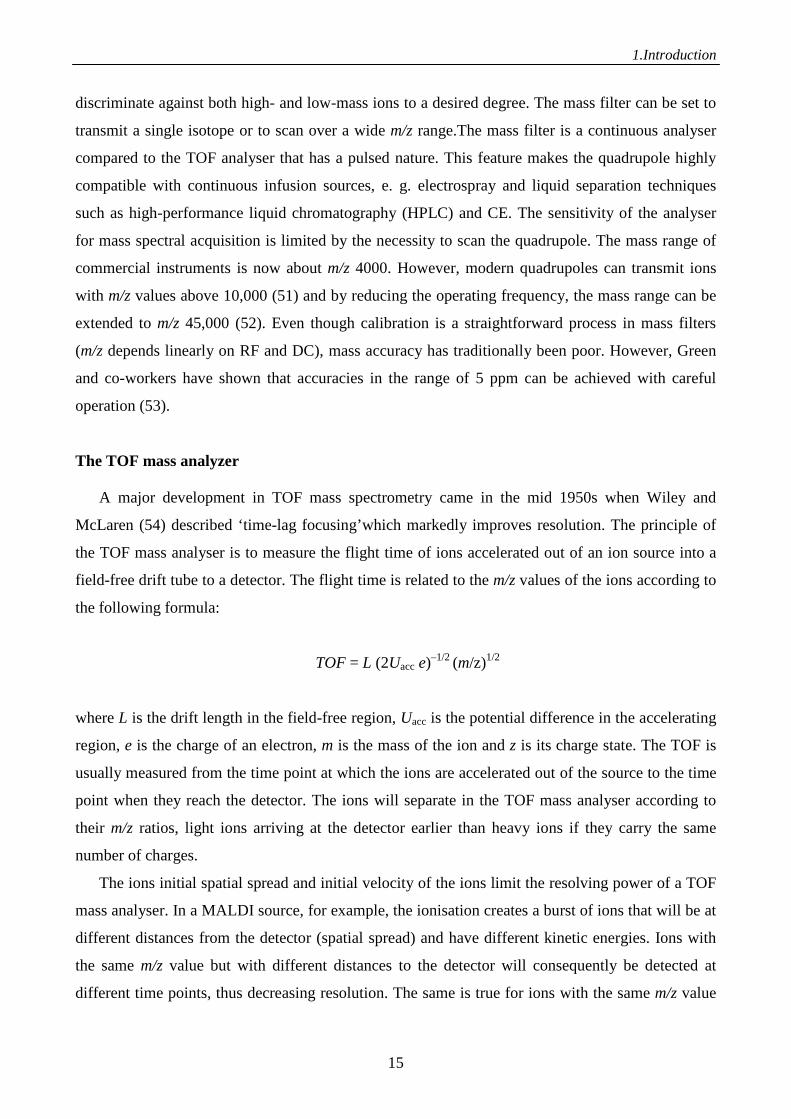
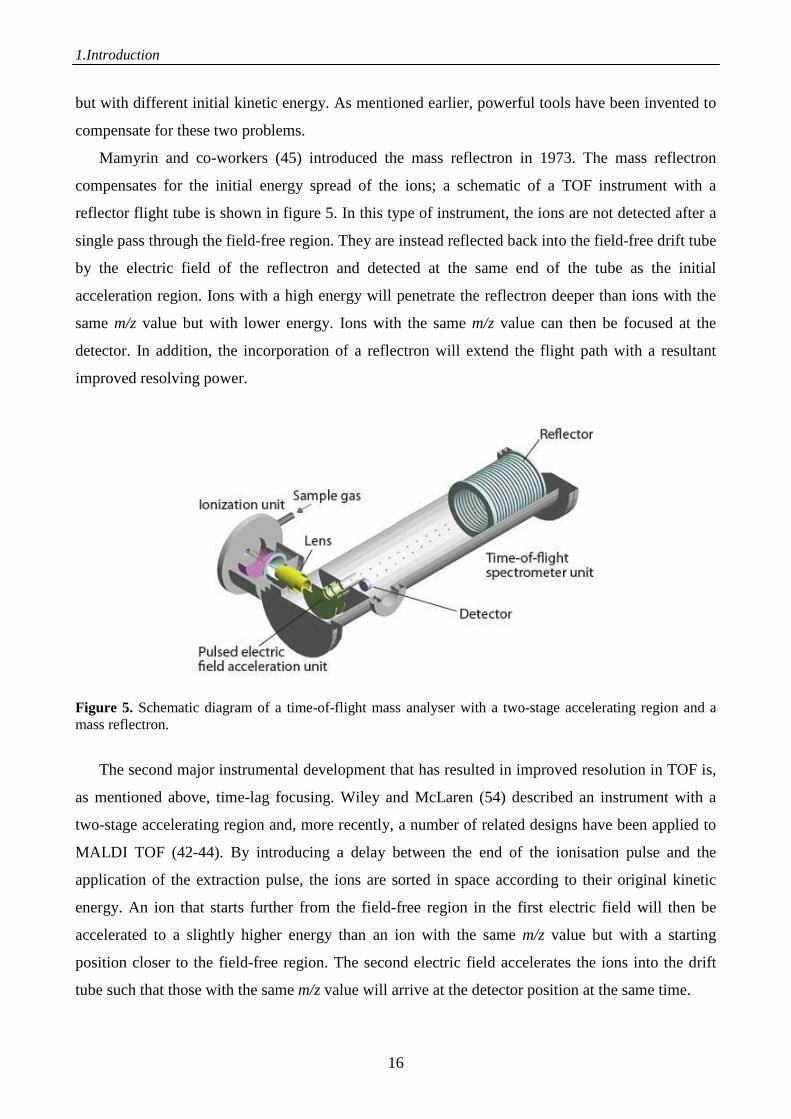
Mamyrin and co-workers (45) introduced the mass reflectron in 1973. The mass reflectron
compensates for the initial energy spread of the ions; a schematic of a TOF instrument with a
reflector flight tube is shown in figure 5. In this type of instrument, the ions are not detected after a
single pass through the field-free region. They are instead reflected back into the field-free drift tube
by the electric field of the reflectron and detected at the same end of the tube as the initial
acceleration region. Ions with a high energy will penetrate the reflectron deeper than ions with the
same m/z value but with lower energy. Ions with the same m/z value can then be focused at the
detector. In addition, the incorporation of a reflectron will extend the flight path with a resultant
improved resolving power.
Figure 5. Schematic diagram of a time-of-flight mass analyser with a two-stage accelerating region and a mass reflectron.
The second major instrumental development that has resulted in improved resolution in TOF is,
as mentioned above, time-lag focusing. Wiley and McLaren (54) described an instrument with a
two-stage accelerating region and, more recently, a number of related designs have been applied to
MALDI TOF (42-44). By introducing a delay between the end of the ionisation pulse and the
application of the extraction pulse, the ions are sorted in space according to their original kinetic
energy. An ion that starts further from the field-free region in the first electric field will then be
accelerated to a slightly higher energy than an ion with the same m/z value but with a starting
position closer to the field-free region. The second electric field accelerates the ions into the drift
tube such that those with the same m/z value will arrive at the detector position at the same time.
1.Introduction
17
TOF is considered to be a high-speed mass analyser. The basic cycle time for the TOF analyser
is limited by the flight time of the heaviest ions. Since this is frequently in the 100 µs range,
thousands of full mass spectra can be generated each second. TOF mass analysers can produce full
spectra at high sample utilisation efficiencies, because all the m/z values in the flight tube at any
time can be detected. These capabilities of fast spectral generation rate, high efficiency and a high
duty cycle have made TOF a target for continuous ionization sources. Dodonov and co-workers
(55) introduced the electrospray source to an orthogonal extraction TOF mass spectrometer in 1987.
The continuously infused ions are pulsed at a high frequency perpendicular to their initial direction
of movement and their flight times are measured. The group of Guilhaus (56,57) has made great
contributions to the area of orthogonal-acceleration TOF mass analysers. This instrumental set-up
with coupling to continuous ionisation sources has opened up many new important applications for
TOF. One new application is in the field of non-covalent interactions of proteins, where the
theoretically unlimited mass range of the TOF mass analyser is of great value (58). Nowadays, TOF
mass analysers provide a valuable second stage in hybrid tandem mass spectrometers (49,59).
Protein preparation and purification
The up-front isolation procedures can have the most significant impact on the outcome of an
MS-based investigation. For example, sensitivity of the overall procedure is usually determined
more by the purification strategy than by the sensitivity of the MS instrument per se. Typically,
protein purification starts with a whole-cell lysate and ends with a gel-separated protein band or
spot. MS analysis is usually carried out on peptides obtained after enzymatic degradation of these
gel-separated proteins. In special cases, the intact proteins are analyzed or the gel electrophoretic
step is omitted by digesting a collection of proteins in solution and analyzing the resulting complex
mixture of peptides.
Special considerations for protein preparation methods
In principle, any of the classical separation methods such as centrifugation, column
chromatography, and affinity-based procedures can precede the final gel electrophoresis. As long as
the proteins of interest can be adequately resolved, it is best to minimize the number of separations.
Generally, silver-stained amounts are necessary for successful MS identification of proteins (5–50
ng or 0.1–1 pmol for a 50 kDa protein], but even higher sensitivities have been achieved by
specialized groups. It is important to minimize contamination with keratins, which are introduced
1.Introduction
18
by dust, chemicals, handling without gloves, etc, as the keratin peptides can easily dominate the
spectrum. Most detergents and salts are incompatible with both 2-D gels and MS. Therefore,
dialysis of the sample may be required. If the protein can be eluted from reversed-phase media, the
best sample preparation is achieved on small, low-pressure traps that can be incorporated into MS
injection ports. In affinity-based protocols it is important that the bait is pure, as contaminating
proteins, for example bacterial proteins in a Glutathione S. transferase (GST) fusion preparation,
will hinder analysis.
Analysis of intact proteins
Several uses of mass spectrometry involve the characterization of recombinant proteins. For
example, the glycosylation and disulfide bonding pattern of therapeutic proteins, such as growth
factors, can be studied in detail. A mass spectrum of the intact protein provides the precise
molecular weight of the major and minor forms of the protein, data that cannot always be gained
from peptide mapping. However, larger proteins are typically heterogeneous, making molecular
weight determination difficult.
Electrospray is the method of choice for determining molecular weight of proteins, as MALDI
results in broad peaks and low sensitivity for proteins above about 30 kDa. As mentioned above,
proteins need to be free of detergents and salts, which is usually accomplished by reversed-phase
chromatography. Formic acid can be used to solubilize proteins for electrospray analysis.
Identification of intact proteins from cell lysates by molecular weight alone is difficult for
several reasons. Sensitivity of ESI-MS for large molecules is poorer than for peptide analysis
because the signal is distributed over many charge states and the heterogeneity of the protein
similarly splits the signal into many components. More fundamentally, the molecular weight of a
protein cannot be predicted precisely from its database entry, because of N- and C-terminal
processing, posttranslational modifications, and chemical modifications introduced during sample
purification (for example, oxidation of methionines). Therefore, even a precise molecular weight by
itself will not allow identification of the protein. Nevertheless, in a recent study several hundred
proteins were recorded in a single experiment in which isoelectric capillary electrophoresis of
lysates of an Escherichia coli cell was combined with FTMS (60). Identification of the proteins was
not achieved in this experiment for the above-mentioned reasons.
1.Introduction
19
Digestion and preparation of gel-separated proteins for MS analysis
For MS-based analysis, most of the detergents and salts are eliminated in the gel washing
procedure. Nevertheless, the protein should be as concentrated as possible in the gel, to avoid
excessive background in the MS analysis. Pooling of spots is not necessarily advantageous, as both
protein and background will increase. Coomassie staining, silver staining, or radioactive labeling,
which are all compatible with MS analysis, can visualize proteins. Cross-linkers and harsh
oxidizing agents should be avoided as they interfere with extraction of peptides from the gel or may
chemically modify the peptides (61). Silver staining provides adequate sensitivity, but it should be
recognized that it has a narrow linear range.
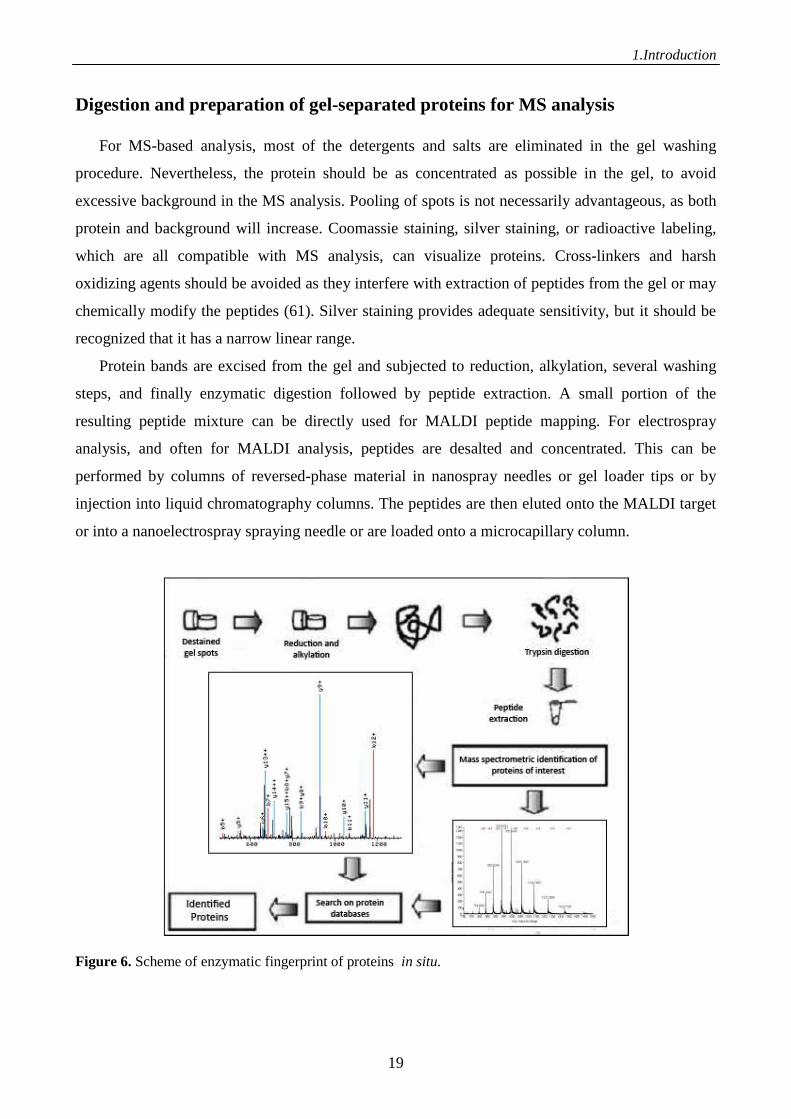
Protein bands are excised from the gel and subjected to reduction, alkylation, several washing
steps, and finally enzymatic digestion followed by peptide extraction. A small portion of the
resulting peptide mixture can be directly used for MALDI peptide mapping. For electrospray
analysis, and often for MALDI analysis, peptides are desalted and concentrated. This can be
performed by columns of reversed-phase material in nanospray needles or gel loader tips or by
injection into liquid chromatography columns. The peptides are then eluted onto the MALDI target
or into a nanoelectrospray spraying needle or are loaded onto a microcapillary column.
Figure 6. Scheme of enzymatic fingerprint of proteins in situ.
1.Introduction
20
Peptide sequencing by tandem mass spectrometry
The sequence of peptides can be determined by interpreting the data resulting from fragmenting
the peptides in tandem mass spectrometers (62,63). In this technique, one peptide species out of a
mixture is selected in the first mass spectrometer and is then dissociated by collision with an inert
gas, such as argon or nitrogen. The resulting fragments are separated in the second part of the
tandem mass spectrometer, producing the tandem mass spectrum, or MS/MS spectrum. In the
instruments in use today, multiple collisions impart energy onto the molecule until it fragments.
(This is low-energy fragmentation, in which any single hit is not sufficient to break the peptide
bond. In high-energy fragmentation, the molecules have higher velocity and a single hit can break
bonds).
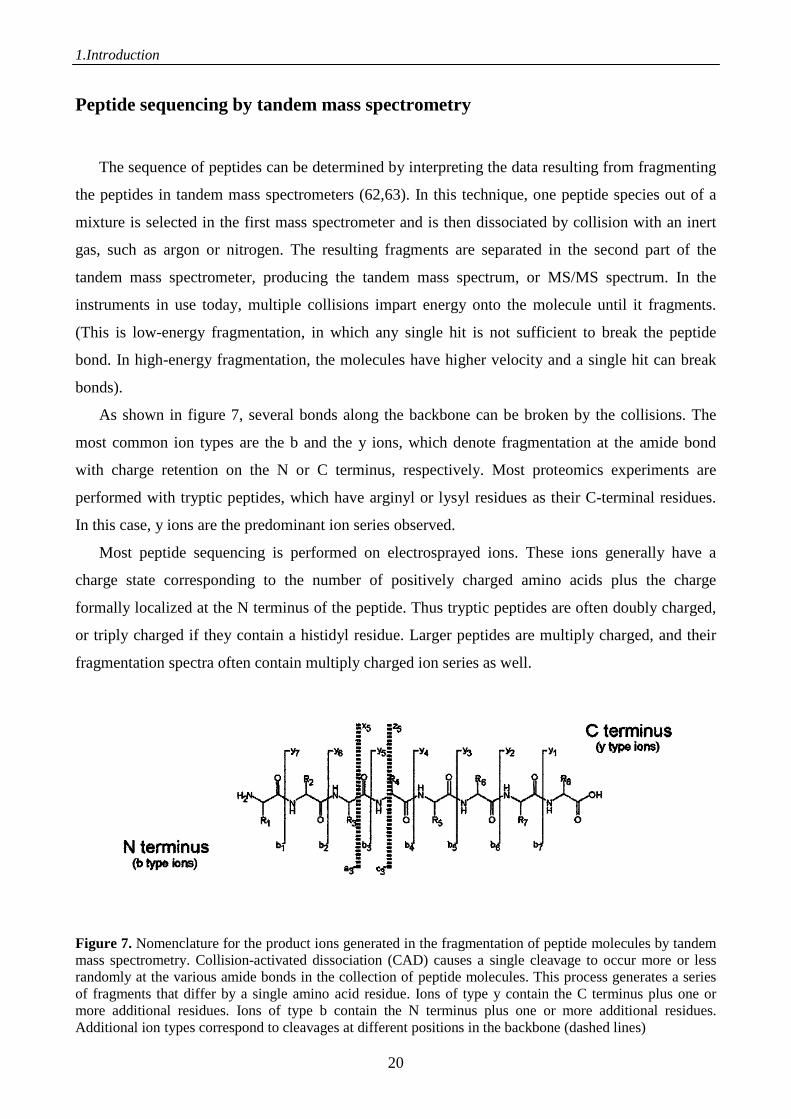
As shown in figure 7, several bonds along the backbone can be broken by the collisions. The
most common ion types are the b and the y ions, which denote fragmentation at the amide bond
with charge retention on the N or C terminus, respectively. Most proteomics experiments are
performed with tryptic peptides, which have arginyl or lysyl residues as their C-terminal residues.
In this case, y ions are the predominant ion series observed.
Most peptide sequencing is performed on electrosprayed ions. These ions generally have a
charge state corresponding to the number of positively charged amino acids plus the charge
formally localized at the N terminus of the peptide. Thus tryptic peptides are often doubly charged,
or triply charged if they contain a histidyl residue. Larger peptides are multiply charged, and their
fragmentation spectra often contain multiply charged ion series as well.
Figure 7. Nomenclature for the product ions generated in the fragmentation of peptide molecules by tandem mass spectrometry. Collision-activated dissociation (CAD) causes a single cleavage to occur more or less randomly at the various amide bonds in the collection of peptide molecules. This process generates a series of fragments that differ by a single amino acid residue. Ions of type y contain the C terminus plus one or more additional residues. Ions of type b contain the N terminus plus one or more additional residues. Additional ion types correspond to cleavages at different positions in the backbone (dashed lines)
1.Introduction
21
Tandem mass spectra are usually interpreted with computer assistance, or matched against
databases directly. In very high quality spectra it is possible to interpret the fragmentation ladders
(the b and the y ion series) from the low mass end through to the highest mass ion. For example, the
y ion series of tryptic peptides will start with masses y1=147 (Lys) or 175 (Arg). The next
fragmentation peak in the y ion series, the y2 ion, differs by the mass of an amino acid residue and
thus “spells out” the next amino acid. Similarly, the b ion series starts with b1 for the N-terminal
amino acid and is traced upward in molecular weight. Note that the b and y ions are not
distinguishable a priori. Ideally, a complete set of b and y ions will (doubly) confirm the entire
peptide sequence. In practice, not all fragment ions are present at detectable levels and fragments
also arise by double fragmentation of the backbone (internal fragment ions). Therefore, it is often
possible to interpret part but not all of the sequence with confidence.
Other features of the MS/MS spectrum include immonium ions (i), which arise by double
cleavage of the peptide backbone, N-terminal and C-terminal to the amino acid residue. These
immonium ions can indicate or confirm the presence of individual amino acids.
Fragmentation is not equally likely along the entire length of the peptide backbone. For
example, fragmentation between the two N-terminal amino acids is energetically unfavorable and
therefore the b1 ion is often not observed. The b2 ion, however, and its companion, the a2 ion, at a
28 Da (CO) mass difference, is usually very prominent. Likewise, fragmentation at the C-terminal
bond of a praline residue is weak but cleavage at the N-terminal side is usually very prominent.
Another feature that can frequently be observed is the switchover from a C-terminal to a N-
terminal series because of charge retention of a positively charged amino acid residue, such as
histidine.
Bond breakage of the doubly charged tryptic peptides most often used in protein
characterization is believed to proceed via the localized charge on the arginines or lysine residue on
the C terminus and the delocalized proton formally located on the N terminus, which induces the
amide bond breakage along the backbone. The arginyl residue strongly localizes the proton, and
peptides containing internal arginines often result in MS/MS spectra that are very difficult to
interpret.
As mentioned above, fragmentation of large, multiply charged ions often leads to multiply
charged ion series. High resolution is advantageous in studying these ions because it allows direct
assignment of the charge state of fragments based on the spacing of the carbon isotope peaks (for
example, they are spaced 1/3 of a dalton apart if they are triply charged). Larger peptides often
fragment efficiently and provide long ion series, but because the precursor ion intensity is
distributed over several charge states, sensitivity may not be as high.
1.Introduction
22
Mass spectrometers in use today cannot distinguish between isoleucine and leucine, which have
the same mass (though the distinction can in principle be made by using the different retention time
of leucine- and isoleucine-containing peptides during chromatography or the side chain
fragmentation in high-energy collisions). The glutamyl and lysyl residues have the same nominal
mass but can be distinguished by their mass difference of 0.036 Da on modern TOF or FTMS
instruments.
Protein identification by database searching
A key advance in biological mass spectrometry was the development of algorithms for the
identification of proteins by mass spectrometric data matched to a database, originally using a set of
peptide masses and now increasingly using the fragmentation spectra of the individual peptides. For
the reasons described in previous sections, obtaining the complete sequence of a peptide from the
tandem mass spectrum was time consuming at best and often impossible. With the availability of
the complete sequence of an increasing number of model species, the peptide sequencing problem,
formerly a holy grail in biological mass spectrometry, is reduced to a database correlation, enabling
automation and the scaling up of proteomics experiments.
Peptide mass fingerprint
In this method, a “mass fingerprint ” is obtained of a protein enzymatically degraded with a
sequence-specific protease such as trypsin. This set of masses, typically obtained by MALDI-TOF,
is then compared to the theoretically expected tryptic peptide masses for each entry in the database.
The proteins can be ranked according to the number of peptide matches (Fig. 5). More sophisticated
scoring algorithms take the mass accuracy and the percentage of the protein sequence covered into
account and attempt to calculate a level of confidence for the match (64-66). Other factors can also
be included, such as the fact that larger peptides are less frequent in the database and should
therefore count more when matched. The accuracy obtained in the measurement of peptide mass
strongly influences the specificity of the search (67,68). When high mass accuracy (10 to 50 ppm) is
achieved, as a rule at least five peptide masses need to be matched to the protein and 15% of the
protein sequence needs to be covered for an unambiguous identification. After a match has been
found, a second-pass search is performed to correlate remaining peptides with the database
sequence of the match, taking into account possible modifications.
1.Introduction
23
Mass fingerprinting can also resolve simple protein mixtures, consisting of several proteins
within a roughly comparable amount. For example, databases can be searched iteratively by
removing the peptides associated with an unambiguous match (69).
Generally, peptide mass fingerprinting is used for the rapid identification of a single protein
component. Protein sequences need to be in the database in substantially full length. Isoforms can
be differentiated from each other, if peptides covering the sequence differences appear in the
peptide map.
Searching with tandem mass spectrometric data
Databases can also be searched by tandem mass spectrometric data obtained on peptides from
the proteins of interest. Because the tandem mass spectra contain structural information related to
the sequence of the peptide, rather than only its mass, these searches are generally more specific and
discriminating.
Several approaches exist. The peptide sequence tag method (70) makes use of the fact that
nearly every tandem mass spectrum contains at least a short run of fragment ions that
unambiguously specifies a short amino acid sequence. As few as two amino acids can be combined
with the start mass and the end mass of the series, which specify the exact location of the sequence
in the peptide and the known cleavage specificity of the enzyme. Such a peptide sequence tag will
then retrieve from the database one or a few sequences whose theoretical fragmentation pattern is
matched against the experimental one. The procedure can be automated and is highly specific,
especially when performed using instruments with a high accuracy for mass, such as the quadrupole
TOF instrument.
Other methods do not attempt to extract any sequence information at all from the MS/MS
spectrum (71). Instead, the experimental spectrum is matched against a calculated spectrum for all
peptides in the database. A score is given to determine howmuch the tandem mass spectrum agrees
with the calculated sequence. Another score indicates how differently the next most similar
sequence in the database fits the spectrum. Although this method can be highly automated, the
sequences need to be verified by manual inspection unless the score is very high. In a typical liquid
chromatography MS/MS experiment on an ion trap, about 10–20% of MS/MS spectra may require
no further interpretation, whereas a much larger percentage can be verified manually.
Tandem mass spectrometry allows direct analysis of protein mixtures. Bands from one-
dimensional gels, when analyzed with the high sensitivity of the mass spectrometer, often turn out
to contain several proteins. In such a case, the software reports a list of proteins, each matched by
1.Introduction
24
one or several peptides. In extreme cases, crude protein mixtures can be reduced to peptides, and
the peptides fragmented and searched in databases (72). In this way, large numbers of proteins, up
to hundreds, can be identified all at once (see LC-MS/MS below).
Database searching and protein modifications
Protein modifications do not present an obstacle to identification. Of a typical 50 peptides (for a
50 kDa protein) generated by tryptic digestion, only a few will be modified. As described above,
only a small number of peptides are required for unique matching to a database entry, especially in
the case of data from tandem mass spectrometry; therefore even extensive modification only
marginally increases the difficulty of protein identification.
Modifications may also be discovered while searching databases. For example, a
phosphopeptide can be correlated to a peptide sequence in the database with an additional mass
increment due to the phosphogroup (80 Da). In the algorithm for the peptide sequence tag, a mass
difference at either side of the tag sequence can be allowed. For example, the tag sequence and the
mass to the C terminus of the peptide could agree with the database entry. However, the mass to the
N terminus could be larger by 80 Da. In this case there would have to be a modification yielding a
mass difference of 80 Da between the N terminus of the peptide and the start of the tag sequence.
The peptide fragmentation spectra can also be calculated for all possible combinations of
common modifications. For example, serines in suspected phosphopeptides can be substituted in
turn with phosphoserines when calculating fragmentation spectra. Because of the increase in
possible peptide fragmentation spectra to consider and the increase in computation time, this search
is usually not performed for the whole database but only for a small set of sequences, including the
protein sequence already identified in the database from unmodified peptides.
Liquid chromatography and tandem mass
Principles
Liquid chromatography (LC) coupled to tandem mass spectrometry, called LC-MS/MS, is a
powerful technique for the analysis of peptides and proteins. This methodology combines efficient
separations of biological materials and sensitive identification of the individual components by
mass spectrometry. Complicated mixtures containing hundreds of proteins can be analyzed directly
even when concentration levels of different proteins vary by orders of magnitude. LC-MS/MS can
1.Introduction
25
be used alone or in combination with 1-D or 2-D electrophoresis, immunoprecipitation, or other
protein purification techniques.
Although numerous methods for coupling liquid chromatography to mass spectrometry have
been explored, it is electrospray ionization that has transformed LC-MS/MS into a routine
laboratory procedure sensitive enough to analyze peptides and proteins at levels interesting in
biological research. As described above, ESI requires a continuous flow of liquid, and signal
strength is independent of flow rate. In order to obtain maximum sensitivity, research efforts have
focused on coupling nano-scale LC at submicroliter flow rates to the highly sensitive micro-scale
ESI interface (30,73, 74). Currently, detection limits of a few femtomoles of peptide material loaded
on the column make this technique compatible with silver-stained, fluorescently labeled, or faintly
stained Coomassie gel bands and capable of detecting proteins and peptides present at a low copy
number per cell.
In a typical LC-MS/MS experiment, the analyte is eluted from a reversed-phase column to
separate the peptides by hydrophobicity, and is ionized and transferred with high efficiency into the
mass spectrometer for analysis. A large amount of data regarding individual species in a
complicated mixture is generated. For example, the peptide ligands associated with the human
major histocompatibility complex (MHC) class I molecules, HLA-A2.1, are a mixture of
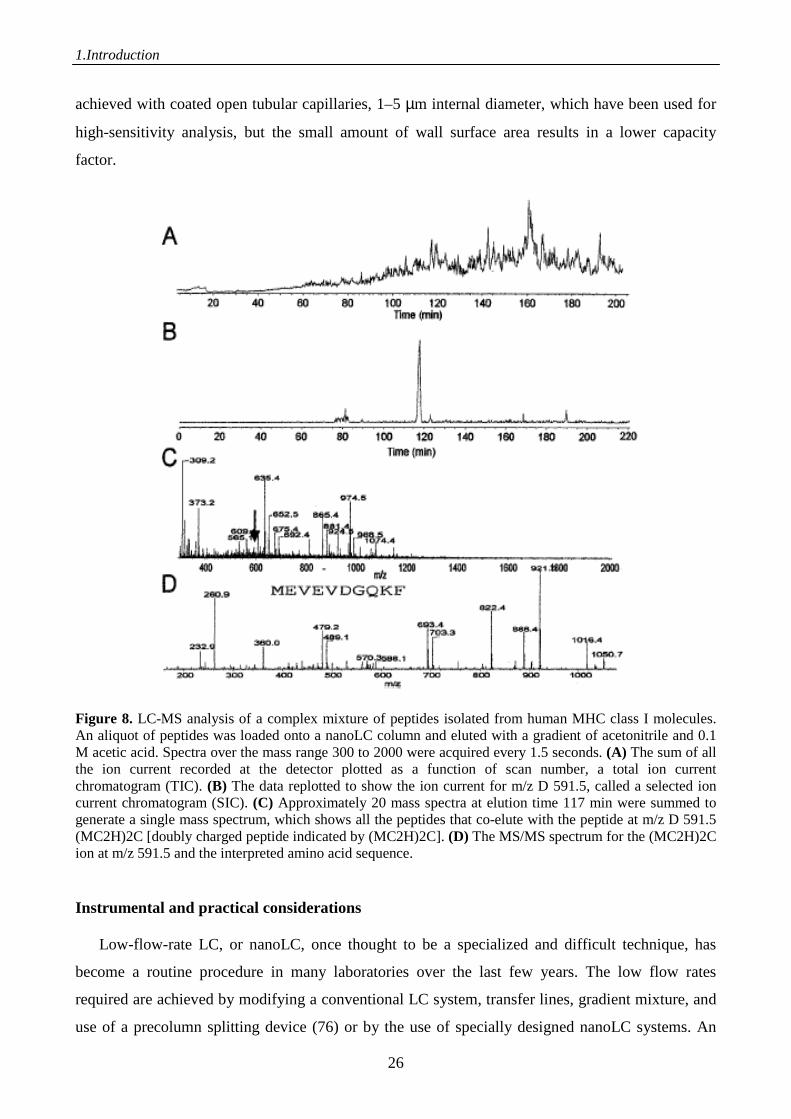
approximately 10,000 different peptide species (75). As shown in figure 8, an aliquot representing
the amount isolated from 1 x 10⁸ cells was loaded onto a nanoLC column and eluted into an ion trap
mass spectrometer using a long gradient. Mass spectra were acquired over the mass range 300–
2000. The data acquired contain molecular weight information on the peptide species and their
amounts. The ion current for each scan can be summed and plotted as a function of time. This
display is a total ion current chromatogram (TIC), shown in figure 8A, and is similar to a UV
chromatogram. Postacquisition, the data can be interrogated to reveal the ion current recorded at a
particular m/z (molecular weight), or a selected ion current chromatogram (SIC) (Fig. 8B). Any
individual peptide can be sequenced without further purification by isolating the eluting peptide,
fragmenting it, and obtaining the MS/MS spectrum (Fig. 8D). In this manner a large number of
peptides can be sequenced in a single LC-MS/MS run, even those that have the same molecular
weight if they differ in hydrophobicity. In practice, the mass spectrometer is often programmed to
perform one scan to determine the peptide masses and then to sequence the three to eight most
abundant peptides (data-dependent acquisition). The separation principle is almost always reversed-
phase high-performance liquid chromatography (RP-HPLC) as applied elsewhere in protein
chemistry; the only difference is that the dimensions and flow rates are much smaller. Peptides elute
with a typical peak width of 30 seconds. Higher separation efficiencies could in principle be
1.Introduction
26
achieved with coated open tubular capillaries, 1–5 µm internal diameter, which have been used for
high-sensitivity analysis, but the small amount of wall surface area results in a lower capacity
factor.
Figure 8. LC-MS analysis of a complex mixture of peptides isolated from human MHC class I molecules. An aliquot of peptides was loaded onto a nanoLC column and eluted with a gradient of acetonitrile and 0.1 M acetic acid. Spectra over the mass range 300 to 2000 were acquired every 1.5 seconds. (A) The sum of all the ion current recorded at the detector plotted as a function of scan number, a total ion current chromatogram (TIC). (B) The data replotted to show the ion current for m/z D 591.5, called a selected ion current chromatogram (SIC). (C) Approximately 20 mass spectra at elution time 117 min were summed to generate a single mass spectrum, which shows all the peptides that co-elute with the peptide at m/z D 591.5 (MC2H)2C [doubly charged peptide indicated by (MC2H)2C]. (D) The MS/MS spectrum for the (MC2H)2C ion at m/z 591.5 and the interpreted amino acid sequence. Instrumental and practical considerations
Low-flow-rate LC, or nanoLC, once thought to be a specialized and difficult technique, has
become a routine procedure in many laboratories over the last few years. The low flow rates
required are achieved by modifying a conventional LC system, transfer lines, gradient mixture, and
use of a precolumn splitting device (76) or by the use of specially designed nanoLC systems. An
1.Introduction
27
online UV detector is incorporated into the system, if desired. Typical nanoLC columns are 50–100
µm in internal diameter and are packed with polymeric or silica-based, C18 coated, stationary
phases with typical particle sizes in the 3 to 10 µm range. The smaller the column diameter, the
lower the flow rate for the same chromatographic separation and hence the higher the sensitivity.
Column diameters of 75 µm are the current compromise between ultimate sensitivity and trouble-
free operation on a routine basis. Columns are available from commercial vendors or are packed in
individual laboratories. As in conventional LC, the sample can be introduced onto the column via
loop injections of the sample. Auto samplers are available that inject submicroliter volumes. To
minimize losses associated with handling of the sample, an alternative method is to displace the
sample directly from the sample tube onto the column by pneumatic displacement (bomb loading).
Ideally, the sample is loaded at a higher flow rate (microliters per minute) onto a trap column and is
then eluted onto the separation column. This arrangement has the further advantage of leading to
fewer problems of plugging in these very fine columns.
An electrical connection needs to be made between the liquid and a power supply in order to
supply the charges to the electrospray process. In one type of connection the electrospray needle, or
emitter, is coated with a conductive material and the voltage is applied directly. Alternatively, a
liquid junction, approximately 3 nl, is purposefully formed in a metal union (stainless steel, gold,
titanium) between the exit of the LC column and the electrospray needle (77) or by applying the
spraying voltage prior to the column (78). For high-sensitivity LC-MS/MS applications, careful
consideration must be given to solvent purity. For example, even though UV-detectable trace
contaminants may not be present, the solvents may contain ionizable impurities that reduce the final
signal to noise of the analysis. The nanoLC system couples to various mass spectrometers such as
triple quadrupole, quadrupole TOF, ion traps, and FTMS instruments.
For nanoLC systems, sensitivity at 1–10 fmol in LC-MS/MS mode is routine on a triple
quadrupole mass spectrometer (75) and has been reported in the low attomole range for selected ion
monitoring. The newer quadrupole TOF instrument promises to provide a large improvement in
sensitivity in MS/MS mode over the triple quadrupole instrument, in addition to increased mass
resolution. The ion trap mass spectrometer has sensitivity in the full-scan MS mode of 1–5 fmol and
is mainly limited by chemical noise introduced into the trap. However, in MS/MS mode, increased
duty cycle of the ion trap instrument results in an improvement of ultimate sensitivity reported in
the 10 to 50 attomole range (79). This feature of the ion trap can be used only when sequencing a
particular, known mass during an LC-MS/MS run (for example, when sequencing a putative
phosphopeptide or when the mass has been already been determined by a more sensitive full-scan
method of mass spectrometry such as FTMS). Recently, automated variable-flow LC, 5–200 nl/min
1.Introduction
28
(80), also known as peak parking (81), has been employed to improve sensitivity to the 10 to 50
attomole level in MS/MS experiments on an ion trap mass spectrometer. On the FTMS, LC-MS
sensitivities at the 10 attomole level with a dynamic range of 103 have been reported. Sample
carryover does not appear to be a problem in the analysis when high-sensitivity applications are
dedicated to a single instrumental setup. It should be noted that all these sensitivity numbers relate
to material applied to the column rather than protein material in a gel band.
Mass spectrometry is the core technique of proteomics. Progress in instrumentation continues to
be made at a fast pace. Automation will make it possible to obtain rates of data generation that will
exceed those of genomics. This will allow the study of all protein complexes and organelles that can
be purified. Many protein interactions can be studied by coimmunoprecipitation followed by mass
spectrometric identification. Quantitative proteomics will most likely be achieved by stable isotope
methods in combination with mass spectrometry. Apart from the pressing areas of automation of
data acquisition and interpretation, areas for future research will be the analysis of protein
modification on a large scale. Cross-linking studies will tell us not only about the composition but
also about the spatial organization of protein complexes. There is much room for creativity in
connecting cell and molecular biological strategies with the powerful mass spectrometric
capabilities to solve questions that could not previously be addressed.
1.Introduction
29
REFERENCES
1. Fenn JB, Mann M, Meng CK, Wong SF,Whitehouse CM (1989) Electrospray ionization for
mass spectrometry of large biomolecules Science 246:64–71
2. Karas M, Hillenkamp F (1988) Laser desorption ionization of proteins with molecular
masses exceeding 10,000 daltons. Anal. Chem. 60:2299–2301
3. Pandey A, Mann M (2000) Proteomics to study genes and genomes. Nature 405:837–846
4. Klose J. (1975) Protein mapping by combined isoelectric focusing and electrophoresis of
mouse tissues. A novel approach to testing for induced point mutations in mammals
Humangenetik 26:231–243
5. O’Farrell PH (1975) High resolution two-dimensional electrophoresis of proteins J. Biol.
Chem. 250:4007–4021
6. Dempster AJ (1918) A new method of positive ray analysis. Phys. Rev. 11: 316–324
7. Munson MSB, Field FH (1966) Chemical ionization mass spectrometry I. General
introduction. J. Am. Chem. Soc. 88: 2621–2630
8. Barber M, Bordoli RS, Sedgwick RD, Tyler AN (1981) Fast atom bombardment of solids
(FAB): a new ion source for mass spectrometry. J. Chem. Soc. Chem. Commun. 325–327
9. Barber M, Bordoli RS, Elliott GJ, Sedgwick RN, Tyler AN (1982) Fast atom bombardment
mass spectrometry. Anal. Chem. 54:645A–657A
10. Dole M, Mach LL, Hines RL, Mobley RC, Ferguson LD, Alice MB (1968) Molecular
beams of macroions. J. Chem. Phys. 49:2240–2247
11. Yamashita M, Fenn JB (1984) Electrospray ion source: another variation on the free-jet
theme. J. Phys. Chem. 88:4451–4459
12. Yamashita M, Fenn JB (1984) Negative ion production with the electrospray ion source. J.
Phys. Chem. 88:4671–4675
13. Alexandrov ML, Gall LN, Krasnov NV, Nikolaev VI, Pavlenko VA, Shkurov VA, Baram
GI, Grachev MA, Knorre VD, Kusner YS (1984) Direct coupling of a microcolumn liquid
chromatograph and a mass spectrometer. Bioorg. Khim. 10:710–712
14. Meng CK, Mann M, Fenn JB (1988) Of protons or proteins. Z. Phys. D. 10:361–368
15. Fenn JB, Mann M, Meng CK, Wong SF, Whitehouse CM (1989) Electrospray ionization for
mass spectrometry of large biomolecules. Science 246:64–71
16. Taylor G. (1964) Disintegration of water drops in an electric field. Proc. R. Soc. Lond
A280:383–397
1.Introduction
30
17. Rayleigh, Lord (1882) On the equilibrium of liquid conducting masses charged with
electricity. Philos. Mag. 14:184–186
18. Kebarle P, Ho Y (1997) On the mechanism of electrospray mass spectrometry. In:
Electrospray Ionization Mass Spectrometry: Fundamentals, Instrumentation and
Applications, pp. 3–63, Cole R. B. (ed), Wiley, New York
19. Iribarne JV, Thomson BA (1976) On the evaporation of small ions from charged droplets. J.
Chem. Phys. 64:2287–2294
20. Fenn JB (1993) Ion formation from charged droplets: roles of geometry, energy, and time. J.
Am. Soc. Mass Spectrom. 4:524–535
21. Kebarle P, Tang L (1993) From ions in solution to ions in the gas phase. Anal. Chem.
65:972A-986A
22. Cole RB.(ed) (1997) Electrospray Ionization Mass Spectrometry: Fundamentals,
Instrumentation and Applications, Wiley, New York
23. Kebarle J (2000) A brief overview of the present status of the mechanisms involved in
electrospray mass spectrometry. J. Mass Spectrom. 35:804–817
24. Cole RB (2000) Some tenets pertaining to electrospray ionization mass spectrometry. J.
Mass Spectrom. 35:763–772
25. Bruins AP (1991) Liquid chromatography-mass spectrometry with ionspray and
electrospray interfaces in pharmaceutical and biomedical research. J. Chromatogr. 554:39–
46
26. Barnidge DR, Nilsson S, Markides KE (1999) A design for low-flow sheathless electrospray
emitters. Anal. Chem. 71:4115–4118
27. Gale DC, Smith R. D. (1993) Small volume and low flow-rate electrospray ionization mass
spectrometry of aqueous samples. Rapid Commun. Mass Spectrom. 7:1017–1021
28. Emmett MR, Caprioli RM (1994) Micro-electrospray mass spectrometry: ultra-high-
sensitivity analysis of peptides and proteins. J. Am. Soc. Mass Spectrom. 5:605–613
29. Andren PE, Emmett MR, Caprioli RM (1994) Microelectrospray: zeptomole/attomole per
microliter sensitivity for peptides. J. Am. Soc. Mass Spectrom. 5:867–869
30. Wilm M, Mann M. (1994) Electrospray and Taylorcone theory: Dole’s beam of
macromolecules at last? Int. J. Mass Spectrom. Ion Proces. 136:167–180
31. Wilm M, Mann M. (1996) Analytical properties of the nano-electrospray ion source. Anal.
Chem. 68:1–8
1.Introduction
31
32. Richards D, Verrier H, Major H, Rontree J. (1998) The direct LC-MS analysis of drug
candidates in cell culture media using a dual orthogonal sampling API interface, p. 75, Proc.
16th IMMS, 4–6 May, Budapest
33. Ferrige AG, Seddon MJ, Green BN, Jarvis SA, Skilling J (1992) Disentangling electrospray
spectra with maximum entropy. Rapid Commun. Mass Spectrom. 6:707–711
34. Karas M, Bachmann D, Bahr U, Hillenkamp F (1987) Matrix-assisted ultraviolet laser
desorption of non-volatile compounds. Int. J. Mass Spectrom. Ion Proces. 78:53–68
35. Karas M, Hillenkamp F (1988) Ultraviolet laser desorption of ions above 10 kDa. In:
Abstracts, 11th Int. Mass Spectrom. Conf., Bordeaux, 29 August – 2 September
36. Karas M, Hillenkamp F (1988) Laser desorption ionization of proteins with molecular
masses exceeding 10 000 Daltons. Anal. Chem. 60:1299–2301
37. Cotter RJ (1997) Time-of-Flight Mass Spectrometry: Instrumentation and Applications in
Biological Research, pp. 131–134, Am. Chemical Society, Washington, D.C.
38. Roepstorff P (2000) MALDI-TOF mass spectrometry in proteinchemistry. In: Proteomics in
Functional Genomics: Protein Structure Analysis, pp. 81–97, Jollès P and Jörnvall H (eds),
Birkhäuser, Basel
39. Pandey A, Mann M (2000) Proteomics to study genes and genomes. Nature 405:837–846
40. Vorm O, Mann M. (1994) Improved mass accuracy in matrix-assisted laser
desorption/ionization time-of-flight mass spectrometry of peptides. J. Am. Soc. Mass
Spectrom. 5:955–958
41. Gobom J, Nordhoff E, Mirgorodskaya E, Ekman R, Roepstorff P. (1999) Sample
purification and preparation technique based on nano-scale reversed phase columns for the
sensitive analysis of complex peptide mixtures by matrix-assisted laser desorption/ionization
mass spectrometry. J. Mass Spectrom. 34:105–116
42. Colby SM, King TB, Reilly JP (1994) Improving the resolution of matrix-assisted laser
desorption/ionization timeof flight mass spectrometry by exploiting the correlation between
ion position and velocity. Rapid Commun. Mass Spectrom. 8:865–868
43. Vestal ML, Juhasz P, Martin SA (1995) Delayed extraction matrix-assisted laser
desorption/ionization time of flight mass spectrometry. Rapid Commun. Mass Spectrom.
9:1044–1050
44. Brown RS, Lennon JJ (1995) Mass resolution improvement by incorporation of pulsed ion
extraction/ionization linear time of flight mass spectrometry. Anal. Chem. 67:1998–2003
1.Introduction
32
45. Mamyrin BA, Karataev VI, Shmikk DV, Zagualin VA (1973) The mass-reflectron, a new
non-magnetic time of flight mass spectrometer with high resolution. Sov. Phys. JETP.
37:45–48
46. He F, Hendrickson CL, Marshall AG (2001) Baseline mass resolution of peptide isobars: a
record for molecular mass resolution. Anal. Chem. 73:647–650
47. Paul VW, Steinwedel H (1953) Ein neues Massenspektrometer ohne Magnetfeld. Z.
Naturforsch. 8a: 448–450
48. Yost RA, Enke CG.(1978) Selected ion fragmentation with a tandem quadrupole mass
spectrometer. J. Am. Chem. Soc. 100:2274–2275
49. Morris HR, Paxton T, Dell A, Langhorn B, Berg M, Bordoli RS, Hoyes J, Bateman RH
(1996) High sensitivity collisionally-activated decomposition tandem mass spectrometry on
a novel quadrupole/orthogonal-acceleration time-of-flight mass spectrometer. Rapid
Commun. Mass Spectrom. 10:889–896
50. Shevchenko A, Chernushevich I, Ens W, Standing KG, Thomson B, Wilm M, Mann M
(1997) Rapid ‘de novo’ peptide sequencing by a combination of nano electrospray, isotopic
labelling and a quadrupole/time of flight mass spectrometer. Rapid Commun. Mass
Spectrom. 11:1015–1024
51. Rostom AA, Robinson CV (1999) Detection of the intact GroEL chaperonin assembly by
mass spectrometry. J. Am. Chem. Soc. 121:4718-4719
52. Winger BE, Light-Wahl KJ, Ogorzalek Loo RR, Udseth HR, Smith RD (1993) Observation
and implications of high mass-to-charge ratio ions from electrospray ionization mass
spectrometry. J. Am. Soc. Mass Spectrom. 4:536–545
53. Tyler AN, Clayton E, Green BN (1996) Exact mass measurements of polar organic
molecules at low resolution using electrospray ionization and a quadrupole mass
spectrometer. Anal. Chem. 68:3561–3569
54. Wiley WC, McLaren I. H. (1955) Time of flight mass spectrometer with improved
resolution. Rev. Sci. Instrum. 26:1150–1157
55. Dodonov AF, Chernushevich IV, Dodonona TF, Raznikov VV, Talrose VL (1987) USSR
patent number 1681340A1
56. Guilhaus M, Mlynski V, Selby D (1997) Perfect timing: time of flight mass spectrometry.
Rapid Commun. Mass Spectrom. 11:951–962
57. Guilhaus M, Selby D, Mlynski V (2000) Orthogonal acceleration time of flight mass
spectrometry. Mass Spectrom. Rev. 19:65–107
1.Introduction
33
58. Tito MA, Tars K, Valegard K, Hajdu J, Robinson CV (2000) Electrospray time of flight
mass spectrometry of the intact MS2 virus capsid. J. Am. Chem. Soc. 122:3550–3551
59. Bateman RH, Green MR, Scott G, Clayton E (1995) A combined magnetic sector-time-of-
flight mass spectrometer for structural determination studies by tandem mass spectrometry.
Rapid Commun. Mass Spectrom. 9:1227–123
60. Jensen PK, Pasa-Tolic L, Anderson GA, Horner JA, Lipton MS, Bruce JE, Smith RD (1999)
Probing proteomes using capillary isoelectric focusing-electrospray ionization Fourier
transform ion cyclotron resonance mass spectrometry. Anal. Chem. 71:2076–208
61. Shevchenko A, Wilm M, Vorm O, Mann M. (1996) Mass spectrometric sequencing of
proteins silver-stained polyacrylamide gels. Anal. Chem. 68:850–858
62. Biemann K, Scoble HA (1987) Characterization by tandem mass spectrometry of structural
modifications in proteins. Science 237:992–998
63. Hunt DF, Shabanowitz J, Yates JR 3rd, Zhu NZ, Russell DH (1987) Tandem quadrupole
Fourier-transform mass spectrometry of oligopeptides and small proteins. Proc. Natl. Acad.
Sci. USA 84:620–623
64. Berndt P, Hobohm U, Langen H (1999) Reliable automatic protein identification from
matrix-assisted laser desorption/ionization mass spectrometric peptide
fingerprints.Electrophoresis 20:3521–3526
65. Perkins DN, Pappin DJ, Creasy DM, Cottrell JS (1999) Probability-based protein
identification by searching sequence databases using mass spectrometry data.
Electrophoresis 20:3551–3567
66. Eriksson J, Chait BT, Fenyo D (2000) A statistical basis for testing the significance of mass
spectrometric protein identification results. Anal. Chem. 72:999–1005
67. Jensen ON, Podtelejnikov A, Mann M (1996) Delayed extraction improves specificity in
database searches by matrix-assisted laser desorption/ionization peptide maps. Rapid
Commun. Mass Spectrom. 10:1371–1378
68. Clauser KR, Baker P, Burlingame AL (1999) Role of accurate mass measurement (+/- 10
ppm) in protein identification strategies employing MS or MS/MS and database searching.
Anal. Chem. 71:2871–2882
69. Jensen ON, Podtelejnikov AV, Mann M (1997) Identification of the components of simple
protein mixtures by high-accuracy peptide mass mapping and database searching Anal.
Chem. 69:4741–4750
70. Mann M, Wilm M (1994) Error-Tolerant Identification of Peptides in Sequence Databases
by Peptide Sequence Tags. Anal. Chem. 66:4390–4399
1.Introduction
34
71. Eng JK, McCormack AL, Yates JR 3rd (1994) An Approach to Correlate Tandem Mass
Spectral Data of Peptides with Amino Acid Sequences in a Protein Database. J. Am. Soc.
Mass Spectrom. 5:976– 989
72. Yates JR 3rd, McCormack AL, Schieltz D, Carmack E, Link A (1997) Direct analysis of
protein mixtures by tandem mass spectrometry. J. Protein Chem. 16:495–497
73. Gale DC, Smith RD (1993) Micro-electrospray mass spectrometry: ultra-high-sensitivity
analysis of peptides and proteins. Rapid Commun.Mass Spectrom. 7:1017–1021
74. Emmett MR, Caprioli RM (1994) Micro-electrospray mass spectrometry: ultra-high-
sensitivity analysis of peptides and proteins. J. Am. Soc. Mass Spectrom. 5:605–613
75. Cox AL, Skipper J, Chen Y, Henderson RA, Darrow TL, Shabanowitz J, Engelhard VH,
Hunt DF, Slingluff CL Jr. (1994) Identification of a peptide recognized by five melanoma-
specific human cytotoxic T cell lines. Science 264:716–719
76. Chervet JP, Ursem M, Salzmann JP (1996) Instrumental Requirements for Nanoscale Liquid
Chromatography. Anal. Chem. 68:1507–1512
77. Davis MT, Stahl DC, Hefta SA, Lee TD (1995) A Microscale Electrospray Interface for
Online, Capillary Liquid Chromatography/Tandem Mass Spectrometry of Complex Peptide
Mixtures. Anal. Chem. 67:4549–4556
78. Gatlin CL, Kleemann GR, Hays LG, Link AJ, Yates JR 3rd. (1998) Protein identification at
the low femtomole level from silver-stained gels using a new fritless electrospray interface
for liquid chromatography-microspray and nanospray mass spectrometry. Anal. Biochem.
263:93–101
79. Shabanowitz J, Settlage RE, Marto JA, Christian RE, White FM, (2000). In Mass
Spectrometry in Biology and Medicine, ed. AL Burlingame, SA Carr, MABaldwin, pp. 163–
177. Totowa, NJ: Humana Press
80. Martin SE, Shabanowitz J, Hunt DF, Marto JA (2000) Subfemtomole MS and MS/MS
Peptide Sequence Analysis Using Nano-HPLC Micro-ESI Fourier Transform Ion Cyclotron
Resonance Mass Spectrometry. Anal. Chem. 72:4266–4274
81. Davis MT, Lee TD (1997) Variable flow liquid chromatography-tandem mass spectrometry
and the comprehensive analysis of complex protein digest mixturesJ. Am. Soc. Mass
Spectrom. 8:1059-1069

2. PROTEASE NEXIN-1 (PN-1)

2.Protease Nexin-1
37
CHAPTER 2
Conformational and biochemical characterization of a biologically
active rat recombinant Protease Nexin-1 expressed in E. coli
Rosaria Arconea, Alberto Chinalib, Nicola Pozzic, Maddalena Parafatia, Fabio Masetc, Concetta
Pietropaolob and Vincenzo De Filippisc
aDipartimento di Scienze Farmacobiologiche, Università di Catanzaro “Magna Graecia”, Italy; bDipartimento di Biochimica e Biotecnologie Mediche, Università di Napoli “Federico II”, Italy; cDipartimento di Scienze Farmaceutiche, Università di Padova, Italy.
Published in Biochim. Biophys. Acta. (BBA) 2009; 1794(4):602-14. INTRODUCTION
Glia-derived nexin or Protease nexin-1 (PN-1) is a 44 kDa glycoprotein expressed and secreted
by a variety of cells, including fibroblasts (1), myoblasts (2), vascular smooth muscle cells (3),
astrocytes (4), and neuronal cells (5). PN-1 belongs to the serpin super-family (6) and inhibits
several serine proteases, including thrombin, urokinase, tissue plasiminogen activator and plasmin
(7, 8) with a mechanism of suicide substrate mediated by the formation of a covalent complex with
the target protease (9). Once formed, the serpin-protease complex binds back to the cells and is
internalized and degraded, thus providing a localized mechanism for inhibiting and clearing the
protease from the extracellular environment (8). Through the production of inhibitors such as PN-1,
glial cells would be able to modulate the extent of neuronal migration and cause modifications
compatible with the early, target independent outgrowth of neurite. A fine localized balance
between neuronal proteolytic activity and PN-1 inhibition would sustain neurite elongation (8).
Although the molecular nature of the PN-1 inhibitory complex in native conditions remains
controversial, in vitro it consists of a 1:1 covalent protease-PN-1 complex and it appears to be stable
both in in reducing SDS-electrophoresis (7) and physiological conditions (10). Studies on the
distribution of PN-1 in various tissues have shown that it is a major serpin found in physiologic
amounts in the brain (5, 11), primarily secreted by glial cells (12) and differentially expressed
during neuronal differentiation (13). PN-1 has been found to inhibit thrombin-mediated neurite
outgrowth retraction (14) and in the protects neuronal cells from proteolytic damage and thrombin-
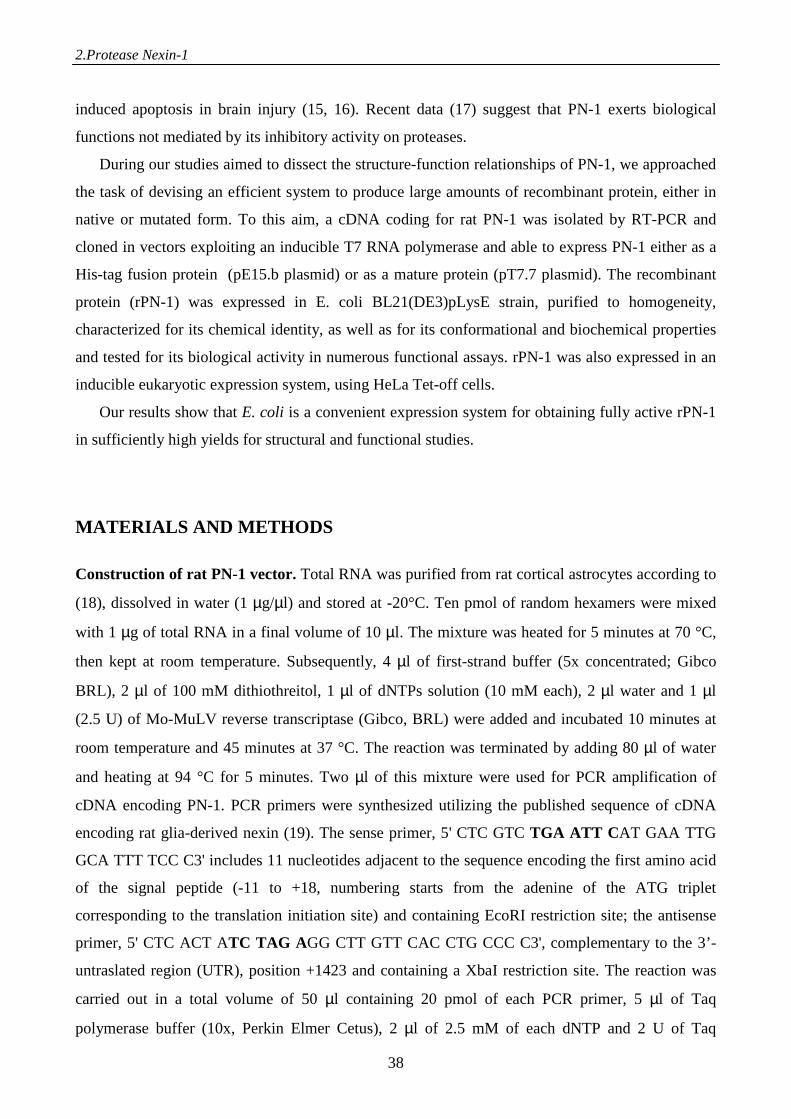
2.Protease Nexin-1
38
induced apoptosis in brain injury (15, 16). Recent data (17) suggest that PN-1 exerts biological
functions not mediated by its inhibitory activity on proteases.
During our studies aimed to dissect the structure-function relationships of PN-1, we approached
the task of devising an efficient system to produce large amounts of recombinant protein, either in
native or mutated form. To this aim, a cDNA coding for rat PN-1 was isolated by RT-PCR and
cloned in vectors exploiting an inducible T7 RNA polymerase and able to express PN-1 either as a
His-tag fusion protein (pE15.b plasmid) or as a mature protein (pT7.7 plasmid). The recombinant
protein (rPN-1) was expressed in E. coli BL21(DE3)pLysE strain, purified to homogeneity,
characterized for its chemical identity, as well as for its conformational and biochemical properties
and tested for its biological activity in numerous functional assays. rPN-1 was also expressed in an
inducible eukaryotic expression system, using HeLa Tet-off cells.
Our results show that E. coli is a convenient expression system for obtaining fully active rPN-1
in sufficiently high yields for structural and functional studies.
MATERIALS AND METHODS
Construction of rat PN-1 vector. Total RNA was purified from rat cortical astrocytes according to
(18), dissolved in water (1 µg/µl) and stored at -20°C. Ten pmol of random hexamers were mixed
with 1 µg of total RNA in a final volume of 10 µl. The mixture was heated for 5 minutes at 70 °C,
then kept at room temperature. Subsequently, 4 µl of first-strand buffer (5x concentrated; Gibco
BRL), 2 µl of 100 mM dithiothreitol, 1 µl of dNTPs solution (10 mM each), 2 µl water and 1 µl
(2.5 U) of Mo-MuLV reverse transcriptase (Gibco, BRL) were added and incubated 10 minutes at
room temperature and 45 minutes at 37 °C. The reaction was terminated by adding 80 µl of water
and heating at 94 °C for 5 minutes. Two µl of this mixture were used for PCR amplification of
cDNA encoding PN-1. PCR primers were synthesized utilizing the published sequence of cDNA
encoding rat glia-derived nexin (19). The sense primer, 5' CTC GTC TGA ATT CAT GAA TTG
GCA TTT TCC C3' includes 11 nucleotides adjacent to the sequence encoding the first amino acid
of the signal peptide (-11 to +18, numbering starts from the adenine of the ATG triplet
corresponding to the translation initiation site) and containing EcoRI restriction site; the antisense
primer, 5' CTC ACT ATC TAG AGG CTT GTT CAC CTG CCC C3', complementary to the 3’-
untraslated region (UTR), position +1423 and containing a XbaI restriction site. The reaction was
carried out in a total volume of 50 µl containing 20 pmol of each PCR primer, 5 µl of Taq
polymerase buffer (10x, Perkin Elmer Cetus), 2 µl of 2.5 mM of each dNTP and 2 U of Taq
2.Protease Nexin-1
39
polymerase (Perkin Elmer Cetus). The PCR amplification was carried out through 5 cycles of
denaturing (94°C, 1 minute), annealing (57°C, 1.5 minute) and extension (72°C, 2 minutes),
followed by further 35 cycles using a different annealing temperature (60°C, 1.5 minute). The final
extension was at 72°C for 10 minutes. The 1451-bp PCR product containing the cDNA encoding
PN-1 was recovered by agarose gel electrophoresis purified and ligated into pGEM-T vector
(Promega). The resulting plasmid pGEM-T-PN-1 was controlled by restriction mapping and the
cloned cDNA was verified by nucleotide sequence analysis (20). A NdeI restriction site was
introduced at the serine-20 codon (numbering start at the methionine-1 of PN-1 leader peptide), in
frame with the remaining coding sequence, by site-specific mutagenesis directed by a synthetic
oligonucleotide carrying the appropriate nucleotide substitutions, used as a primer in a PCR on
pGEM-T-PN-1 DNA.
For production of polyclonal antibodies against PN-1, the PCR fragment was excised by NdeI-
XbaI restriction endonucleases and cloned in the pET-15b vector (Novagen, UK), which allows the
expression of a Hexa-His-tagged protein easily purified by affinity chromatography on a nickel-
agarose column. The resulting vector was named pET-15b-PN-1. Polyclonal antiserum was raised
in rabbit against affinity purified His-tagged PN-1 (21).
To produce a large amount of mature PN-1, a NdeI-SalI fragment (1170 bp) was excised from
pET-15b-PN-1 DNA and inserted in a pT7.7 plasmid (22). The resulting vector was named pT7.7-
PN1. For in vitro transcription and translation of PN-1 cDNA, a SalI restriction site was introduced
in the polylinker region of pGEM-T-PN-1 plasmid by PCR mutagenesis and the SalI-XbaI fragment
containing the PN-1 cDNA region was excised and cloned in the pGEM-4Z vector, resulting in a
pGEM-4Z-rPN-1 vector.
To obtain an inducible expression system of PN-1 in eukaryotic cells, a 1212 bp EcoRI-XbaI
fragment, including the sequence coding for the signal peptide, was cloned in the pTRE vector
(Clontech, Cambridge, UK). The resulting plasmid, pTRE-PN-1, was further modified by inserting
a Kozak consensus sequence (23) to optimize the translation in eukaryotic cells. The final vector
was indicated as pTRE-Kozak-rbs-PN-1. All the constructs were controlled by restriction mapping
and DNA sequence analysis.
Expression in E. coli, renaturation and purification of rPN-1. The pET-15b-PN-1 or pT7.7-PN-
1 expression vectors were introduced in E. coli BL21(DE3)pLysE strain which expresses the T7
RNA polymerase under the inducible lac UV5 promoter. Bacterial growth, isolation of inclusion
bodies and extraction of proteins were performed as previously reported (24). The in vitro refolding
of rPN-1 was obtained through a two-step dialysis; first step against a low concentration of the
2.Protease Nexin-1
40
denaturing agent (2 M GdnHCl, 50 mM Tris-HCl pH 8.0) containing 2 mM DTT. The second
dialysis step was performed against 50 mM Tris-HCl pH 8.0, 0.15 M NaCl, 1 mM DTT, 10%
glycerol. The refolded extract was centrifuged at 15000 g for 45 min to remove insoluble material
and loaded at 1 ml/min onto a HiTrap Heparin HP column (5 ml, GE Healthcare Life Science)
connected to a FPLC system (GE Healthcare Life Science). The column was equilibrated in the
dialysis buffer and after 10 volumes washing, the elution was performed at 4 ml/min by applying 10
volumes of a linear gradient to 1.5 M NaCl and collecting 0.5 ml fractions. Protein analysis was
performed by SDS-PAGE and Western blotting and fractions containing rPN-1 were pooled,
aliquoted and stored at -20°C.
The Hexa-His-PN-1 protein was purified from bacterial lysate using nickel agarose (Ni-NTA)
resin (Qiagen, Germany) according to the manufacturer’s instructions. The concentration of total
protein was determined by a Bio-Rad protein assay (25) using bovine serum albumin as a standard.
Twelve percent polyacrilamide SDS-PAGE was performed as described by Laemmli (26). After
electrophoresis, proteins were stained by Coomassie brilliant blue R-250 or electrophoretically
transferred to nitrocellulose filters (BA85; Schleicher & Schull). Blots were probed with rabbit
antisera against PN-1 followed by incubation with a peroxidase-conjugated anti-rabbit IgG in PBS,
containing 5% dry milk and developed according to the Enhanced Chemioluminescence (ECL)
technique.
Analytical techniques
RP-HPLC. The purity of rPN-1 preparations was checked by loading an aliquot (100 µl) of rPN-1
solution (0.12 mg/ml) onto a Vydac (The Separation Group, Hesperia, CA) C4 column (4.6 x 150
mm, 5µm particle size), eluted with a linear acetonitrile-0.078% TFA gradient at flow rate of 0.8
ml/min. The absorbance of the effluent was recorded at 226 nm.
Mass spectrometry. Accurate molecular weight determination of rPN-1 was obtained with a
Mariner ESI-TOF high-resolution mass spectrometer (Perseptive Biosystems, Stafford, TX).
Tipically, RP-HPLC purified rPN-1 (5 µg) was lyophilized, dissolved in 1:1 water:acetonitrile
mixture (20 µl), containing 1% (by vol.) formic acid, and then analyzed by mass spectrometry,
obtaining mass values in agreement with the expected amino acid composition within 0.01% mass
accuracy.
Two-Dimensional Electrophoresis. 2D electrophoresis was conducted on a BioRad Protean IEF-
Cell apparatus, using essentially the procedure provided by the manufacturer (27). For the first
dimension, an immobilized pH-gradient (IPG) strip (pH 3-10) (Biorad-1632009) was incubated
with 300 µl of rehydration buffer (i.e., 0.1% (w/v) CHAPS, 0.1% (w/v) Bio-Lyte 3-10, 8M urea, 0.1
2.Protease Nexin-1
41
M DTT, and 0.001% (w/v) Bromophenol Blue) containing the lyophilised rPN-1 sample (5 µg) and
5 µl of protein standard (BioRad, 161-0320). Rehydration was carried out at 20±0.5 °C for 15 hours
and applying a constant potential of 50 V. Prior to isoelectrofocusing (IEF), desalting of the strip
was achieved by applying a potential of 250 V for 15 min. IEF was conducted at 10 kV·h for 3
hours and then at 10 kV·h, up to 60 kV. Finally, the strip was frozen at –80°C. To reduce protein
disulfide bonds eventually present, the strip was then incubated under gentle stirring for 10 min
with 6 ml of 0.375 M Trs-HCl buffer, pH 8.8, 6 M urea, 2% SDS, 20% glycerol (buffer A),
containing 2% DTT. The reducing buffer was discarded and the strip incubated for 10 min with
buffer A containing 2.5% iodoacetamide, for blocking unreacted DTT. The second dimension was
carried out by loading the strip on a (20 x 20 cm) SDS-PAGE vertical slab (26) (stacking gel: 4%
acrylamide; running gel: 12% acrylamide) run overnight at a constant current of 10 mA. The gel
was stained using a modified silver staining protocol (28).
Spectroscopic Measurements
Determination of protein concentration. The concentration of PN-1 was determined by ultraviolet
(UV) absorption at 280 nm on a double beam model Lambda-2 spectrophotometer from Perkin-
Elmer. The extinction coefficient at 280 nm was calculated using a molar absorption coefficient of
1,280 M-1·cm-1 for tyrosine, 5,690 M-1·cm-1 for tryptophan, 120 M-1·cm-1 for disulfides (29), and
taken as 0.83 mg -1·cm 2. The concentration of thrombin was determined either by UV absorbance
at 280 nm, using a molar absorption coefficient of 65770 M-1·cm-1 (30) or, alternatively, by titration
of thrombin active-site with hirudin (31).
Circular dichroism. CD spectra were recorded on a Jasco model J-810 spectropolarimeter equipped
with a thermostated cell-holder connected to a NesLab (Newington, NH) model RTE-111 water-
circulating bath. Far- and near-UV CD spectra were recorded at 20±0.5 °C in 50 mM Tris-HCl
buffer, pH 8.8, containing 0.6 M NaCl and 10% (v/v) glycerol, using a 1- or 10-mm path length
quartz cells in the far- and near-UV region, respectively.
Fluorescence. Emission spectra were recorded at 20±0.5 °C on a Perkin-Elmer spectrofluorimeter
model LS-50B, equipped with a thermostated cell-holder connected to a Haake F3-C water-
circulating bath. Protein samples in 50 mM Tris-HCl buffer, pH 8.8, containing 0.6 M NaCl and
10% (v/v) glycerol were excited at 280 or 295 nm, using an excitation/emission slit of 5/10 nm.
Heparin binding to rPN-1. For measuring heparin binding to rNP-1, a Jasco model FP-6500
spectrofluorimeter, equipped with a Peltier model ETC-273T temperature control system, was used.
Excitation and emission wavelengths were at 280 and 341 nm, respectively, using an
2.Protease Nexin-1
42
excitation/emission slit of 10/10 nm. During titration experiments, the increase of fluorescence
intensity at 341 nm was recorded as a function of heparin concentration. For all measurements, the
Long-Time-Measurement software (Jasco) was used. Under these conditions, photobleaching of
Trp-residues was essentially absent. To a solution of rPN-1 (2 ml, 130 nM) in 5 mM Tris-HCl
buffer pH 7.5, 0.15 M NaCl, 0.1% PEG-8000, were added under gentle magnetic stirring aliquots
(2-8 µl) of a stock solution (146 U/ml) of unfractionated porcine heparin (Calbiochem). Of note, 1
U of heparin is an amount equivalent to 2 µg of pure heparin, having an average molecular weight
of 14.500 Da (32). Fluorescence intensities were corrected for dilution (2-3% at the end of the
titration) and subtracted for the signal of the ligand (i.e., heparin) at the indicated concentration.
Molecular Modelling and Computational Methods. The structure of rPN-1 in the active and
latent form was modeled on the corresponding crystallographic structures of PAI-1 (PDB codes:
1dvmA, for the active form, and 1dvnA, for the latent form) (33), that displays high sequence
similarity with PN-1 (19). The three-dimensional model of rPN1 was obtained using the Swiss-
Model automated comparative protein modeling server (http://swissmodel.expasy.org/SWISS-
MODEL.html) (34). Accessible surface area (ASA) calculations were carried out by using a
computer program available on-line at the site http://molbio.info.nih.gov/structbio/basic.html (35).
Alignment of the rat PN-1 sequence (SwissProt code: P07092) with that of the human PAI-1
(SwissProt code: P05121) was carried out using the computer program Clustal W (vs. 1.83)
available on-line at the site http://www.ebi.ac.uk/clustalw (36). The theroretical pI value of rPN-1
was calculated using the software ProtParam, available on-line at the site http://www.expasy.ch/cgi-
bin/protparam. N-Glycosylation sites were predicted using the program NetNGlyc, available on-line
at the site http://www.cbs.dtu.dk/services/NetNGlyc/.
Thrombin-rPN-1 complex formation monitored by SDS-PAGE. rPN-1 was mixed with natural
thrombin (Calbiochem) (2:1 molar ratio) at room temperature (22±1°C) in in 5 mM Tris-HCl buffer
pH 7.5, 0.15 M NaCl, 0.1% PEG-8000. Samples were taken at time intervals, mixed immediately
with reducing SDS-loading buffer, and heated for a further 3 min at 100°C. SDS-gel electrophoresis
was performed in a 12% acrylamide SDS-gel (26) and proteins were stained with Coomassie
Brilliant Blue R-250.
Thrombin inhibition assays. In the absence of heparin, the inhibition of natural thrombin by rPN-1
was determined at 25±0.5°C by a discontinuous assay procedure similar to that described for
thrombin inhibition by antithrombin-III (32). Briefly, the protease (1 nM) was incubated in the
2.Protease Nexin-1
43
presence of rPN-1 (40 nM) in 300 µl (final volume) of 5 mM Tris-HCl, 0.15 M NaCl, 0.1% PEG
8000, pH 7.5. The residual protease activity was determined at time intervals by diluting 50 µl of
the reaction mixture into 950 µl of the same buffer containing the chromogenic substrate (D)-Phe-
L-pipecolyl-L-Arg-p-nitroanilide (Sigma) (S-2238, 93 µM). The inhibition of p-nitroaniline release
from S-2238 was monitored by measuring the absorbance at 405 nm, using a molar absorption
coefficient for p-nitroaniline of 9920 M-1·cm-1. The concentration of S-2238 was determined by
measuring the absorbance at 342 nm, using a molar absorption coefficient of 8270 M-1·cm-1 (37).
The per cent residual thrombin concentration was determined as the ratio of vi/v0, where vi and v0
are the initial velocities of thrombin-catalyzed substrate hydrolysis in the presence or absence of
rPN-1. The % active thrombin was plotted as a function of time and the data fitted to equation 1,
from which pseudo a first-order association constant, ka, could be estimated (see Data Analysis).
In the presence of heparin, thrombin inhibition assays were carried out at 25±0.5°C by a
continuous assay procedure. rPN-1 (2.0 nM) was incubated for 15 min at the same temperature with
S-2238 (85.7 µM) and increasing concentrations (from 100 pM to 100 µM) of unfractionated
porcine heparin (Calbiochem) in 950 µl of 5 mM Tris-HCl, 0.15 M NaCl, 0.1% PEG 8000, pH 7.5.
The reaction was started by addition of 50 µl thrombin, up to a final concentration of 50 pM. After
rapid mixing (5 s), substrate hydrolysis was immediately recorded by measuring the increase of the
absorbance at 405 nm. Progress curves were fitted to equation 2 and analyzed as detailed below.
Data analysis. Either in the absence or presence of heparin, the inhibition of thrombin by PN-1 has
been previously shown to conform to the mechanism reported in Scheme 1 (32, 38):
k1 k2 E + I ↔ EI* → EI (Scheme 1)
k-1
where the protease, E, reversibly binds the inhibitor, I, to form the encounter complex, EI*, that
irreversibly converts into the stable protease-serpin complex, EI, with a rate constant k2. KEI is the
equilibrium constant for the noncovalent complex formation, KEI = k-1/k1, where k1 and k-1 are the
association and dissociation rate constants, respectively. If the equilibrium E + I ↔ EI* is rapid
compared with the rate of formation of EI (i.e., k2 << k -1) and if (I) << KEI (i.e., when (EI*) is
negligible), then the reaction follows simple second-order kinetics and appears to be a one-step
irreversible process:
ka E + I → EI (Scheme 2)
2.Protease Nexin-1
44
where ka is the second-order rate constant for the formation of nondissociating complex EI. From
Scheme 2 it follows that dE/dt = -ka (E)·(I). Integration of equation 1 under pseudo first-order
conditions (i.e., (I) > 10·(E)), yields equation 1:
(E)t = (E)0·exp(-kobs·t) (1)
where (E)0 and (E)t are the enzyme concentrations at time zero and t, respectively, and kobs is the
pseudo first-order rate constant given by kobs = ka·(I)0, where (I)0 is the serpin concentration. The
values of (E)t were determined by the discontinuous assay method (32) (see above), plotted as a
function of reaction time and fitted to equation 1, yielding kobs as a fitting parameter. In the
discontinuous method, thrombin was incubated with PN-1 and samples of the reaction mixture were
taken at various times. Measurements of residual enzyme activity were conducted by monitoring the
initial rate of chromogenic substrate hydrolysis, S (i.e., S-2238), that yields the product P (i.e., p-
nitroaniline). Finally, from the knowledge of serpin concetration, (I)0, the value of ka could be easily
calculated. Here we used this procedure to analyze thrombin inhibition data by rPN-1 in the absence
of heparin.
In the presence of heparin, the affinity of PN-1 for thrombin increases by about 1000-fold,
thereby preventing an accurate estimation of ka using the discontinuous method (32). To overcome
this limitation, we used a continuous assay method (see above) in which continuous monitoring of
thrombin-PN-1 reaction was conducted in the presence of S-2238. It has been previously shown
(38-40) that thrombin inhibition by PN-1 follows a reversible slow binding process according to the
mechanism depicted in Scheme 3:
k1 Km kcat EI* ↔ I + E + S ↔ ES → E + P (Scheme 3)
k-1
Under pseudo first-order conditions, and with negligible consumption of substrate (<10%), the
amount of product, P, as a function of time, t, is given by the exponential equation (39, 40):
(P)t = vs·t + ((v0 – vs)/kobs)·(1 – exp(-kobs·t)) (2)
where kobs is the pseudo first-order rate constant for product formation and v0 and vs are the initial
and steady-state velocities, respectively. Estimates of kobs, v0, and vs were obtained by fitting to
equation 2 the data of product generation obtained at different heparin concentrations, from 100 pM
2.Protease Nexin-1
45
to 100 µM. At each heparin concentration, the second-order rate constant, k1, can be related to kobs,
v0, vs, and Km by equation 3:
k1 = (kobs·(1 - vs/v0))/(I)·(1 + (S)/Km) (3)
where Km is the Michaelis constant for thrombin-catalyzed hydrolysis of S-2238 at 25°C,
previously estimated as 3.0±0.3 µM (41). When the value of k1 was plotted against the
concentration of heparin, a bell-shaped curve is obtained. Such a curve is empirically described by
equation 4:
k1 = k1°/(1 + (H)/K1 + K2/(H)) (4)
where k1° is the maximum value of k1 obtained at an optimal heparin concentration, and K1 and K2
are empirical constants that represent the concentrations of heparin at which the half-maximal value
of k1 is observed. Estimates of k1°, K1 and K2 were obtained by fitting the data of k1 vs. (H) to
equation 4.
Cell Cultures, DNA transfections and immunocytochemistry. NB2A mouse neuroblastoma cells
(kindly provided by Dr V. De Franciscis, CNR, Italy) and human HeLa Tet-Off cells (Clontech)
were cultured in Dulbecco’s modified Eagle’s medium (DMEM) supplemented with 10% fetal
bovine serum (FBS), or 10% Tet system approved fetal bovine serum (Clontech) for the HeLa Tet-
off cells. All culture media were also supplemented with 1.5 mM L-glutamine, 50 IU/ml penicillin
and 50 µg/ml streptomycin. The cells were maintained at 37°C in a 5% CO2 atmosphere and were
subcultured twice a week by 3-5-fold dilution with culture medium.
For DNA transfection, cells were seeded subconfluent on cover slips and in 60-mm plates; 24 hr
after plating, transfection was carried out using 1-7 µg of pTRE-Kozak-rbs-PN-1 DNA using the
Lipofectamin 2000 reagent technique (Invitrogen, Life Technologies) according to the
manufacturer’s instructions; 18 hours after transfection, cells were washed with culture media and
maintained in the presence (10 ng/ml) or absence of doxycycline hydrochloride (Sigma-Aldrich,
Italy). At 24, 48 and 72 h following depletion of the antibiotic, cells were harvested and culture
media collected for western blotting analysis and the cover slip cultures processed for indirect
immunofluorescence staining.
Subconfluent cells on glass cover slips, were fixed with cold 3.7% formaldehyde (Fluka, France) in
PBS with Ca2+ (0.1g/lt) and Mg2+ (0.1g/lt) for 20 min, permeabilized with 0.1% Triton X-100 in
2.Protease Nexin-1
46
PBS for 5 min. The cover slips were incubated for 2 h at room temperature with polyclonal PN-1
antibodies (21) at a 1:20 dilution in a PBS-0.2% gelatin solution, washed three times for 5 min with
0.5 NaCl, 0.02 M NaPO4 pH 7.4 and finally, with PBS. An anti-rabbit IgG (Fc-specific)
fluorescein-isothiocyanate (FITC)-conjugated (Jackson Immunoresearch Laboratories) was used as
secondary antibody, at 1:200 dilutions in PBS-0.2% gelatin, for 1 h at room temperature.
Cover slips were washed and mounted with Mowiol (Hoechst, FRG) on microscope slides and
observed with a Zeiss Axiovert 10 photomicroscope using a 63xPlan-Apochromat lens and
fluorescein (450-490 nm, FT515-LP565) filters. After several washings, nuclear staining was
performed. Cover slips were incubated for 20 min with 385 nM 4',6-diaminide-2-phenylindole
(DAPI, Sigma) (42), then washed and mounted with Mowiol (Hoechst, FRG) on microscope slides.
Cells were observed by a Zeiss Axiovert 10 photomicroscope using a 100x oil immersion objective
Plan-Apochromat lens and DAPI (379-401 nm, 435-485 nm) filters.
For F-actin staining, cells were fixed, permeabilized, washed with PBS (with Ca2+ and Mg2+) and
then incubated in the dark for 20 min at room temperature with 0.768 µM rhodamine phalloidin
(Molecular Probes) in PBS. Cells were rapidly washed for three times with buffer, mounted with
Mowiol and observed with a Zeiss Axiovert 10M photomicroscope using a 63xPlan-Apochromat
lens and rhodamine (546 nm, 590 nm) filters.
Induction of neurite outgrowth in NB2A neuroblastoma cells. NB2A cells were grown
subconfluent on cover slips and cultured for 24 h in DMEM supplemented with 10% FBS. Cells
were then differentiated to a neuronal morphology by serum deprivation (0% FBS), or kept
undifferentiated in 0.8% FBS, for 4 hr. Cells were exposed to 50 nM rPN-1 alone or in combination
with 2 nM thrombin, and after 3hr incubation were fixed and processed for immunocytochemistry.
RESULTS Expression, purification, and chemical characterization. A cDNA fragment coding for rat PN-1
was isolated by RT-PCR using specific synthetic oligonucleotides on total RNA from rat cortical
astrocytes (18). The PCR DNA product was inserted in pGEM-T vector. The resulting vector,
pGEM-T-PN-1, was sequenced and found to contain the rat PN-1 cDNA, as reported in the
NCBI/Gene Bank (accession number M17784).
Site specific mutagenesis was performed to introduce a NdeI restriction site which would allow
us to excise a NdeI-XbaI DNA fragment coding for the mature PN-1. Thereafter, the mature PN-1
2.Protease Nexin-1
47
cDNA was cloned in pET-15b and in pT7.7 vectors, resulting in pET-15b-PN-1 and pT7.7-PN-.1
vectors, respectively. E. coli cells, strain BL21(DE3)pLysE, were transformed with pET-15b-PN-1
DNA and produced the His-tagged PN-1. Bacterial culture was processed as detailed in Materials
and Methods and the fused rPN-1 protein was purified by IMAC on a nickel-loaded column (see
below). The purified protein was used to produce polyclonal anti-PN-1 antibodies in rabbit, that
were able to recognize PN-1 expressed in rat oligodendrocytes (21).
The recombinant protein was efficiently expressed in E. coli following IPTG induction (Fig. 1A,
+ IPTG). As also observed for the His-tagged form, mature rPN-1 was delivered to the inclusion
bodies. After solubilization of inclusion bodies (24), rPN-1 was refolded in vitro by dialysing
against Tris buffer, pH 8.8, containing moderate concentrations of denaturants and reducing agents
(i.e., 2 M Gnd-HCl and 2 mM DTT) and then against the same buffer, without denaturant,
containing 0.15 M NaCl, 1 mM DTT, and 10% glycerol. Addition of DTT prevented oxidation of
the three free Cys-residues in the PN-1 structure during refolding (43), while glycerol was added to
increase protein solubility. The refolding mixture was purified by affinity chromatography on a
heparin-Sepharose column, whereby rPN-1 eluted as a single peak at 0.8 M NaCl. Expression,
refolding and purification of rPN-1 was monitored by SDS-PAGE (Fig. 1A) and Western blot (Fig.
1B) analyses, showing the presence of a single intense band, at the molecular weight expected for
rPN-1 (i.e., 42 kDa) and immunoreactive against PN-1 antibodies. Strikingly, the expression and
purification procedure herein reported allowed us to recover about 3 mg of homogeneous (see
below) rPN-1 per liter of cell culture.
The homogeneity of rPN-1 was also checked by reversed phase (RP) HPLC, demonstrating that
the protein elutes as a single peak on a C4 analytical column (Fig. 1C). Accurate molecular weight
determination of rPN-1, carried out by ESI-TOF mass spectrometry (Inset to Fig. 1C), yielded a
mass value of 41774.4 ± 5 a.m.u. in close agreement with that expected from the amino acid
composition of rPN-1 (average mass: 41777.6 u.m.a.) (19). The isoelectric point, pI, of rPN-1 was
estimated by two-dimensional electrophoresis (Fig. 1D), yielding a pI value of 9.7, consistent with
the theoretical value deduced form the amino acid composition, pI 9.72. The minor spot at pI 9.6
likely originates from the artefactual cyanylation of some Lys-residues that sometimes occurs
during long-time incubation (i.e., 15 h) of the IEF strip with protein samples in the presence 8 M
urea (see Methods). Within the limits of the analytical methods used, these results provide strong
evidence for the homogeneity and chemical identity of our recombinant rPN-1 preparation, that was
subsequently used for conformational and functional characterization.
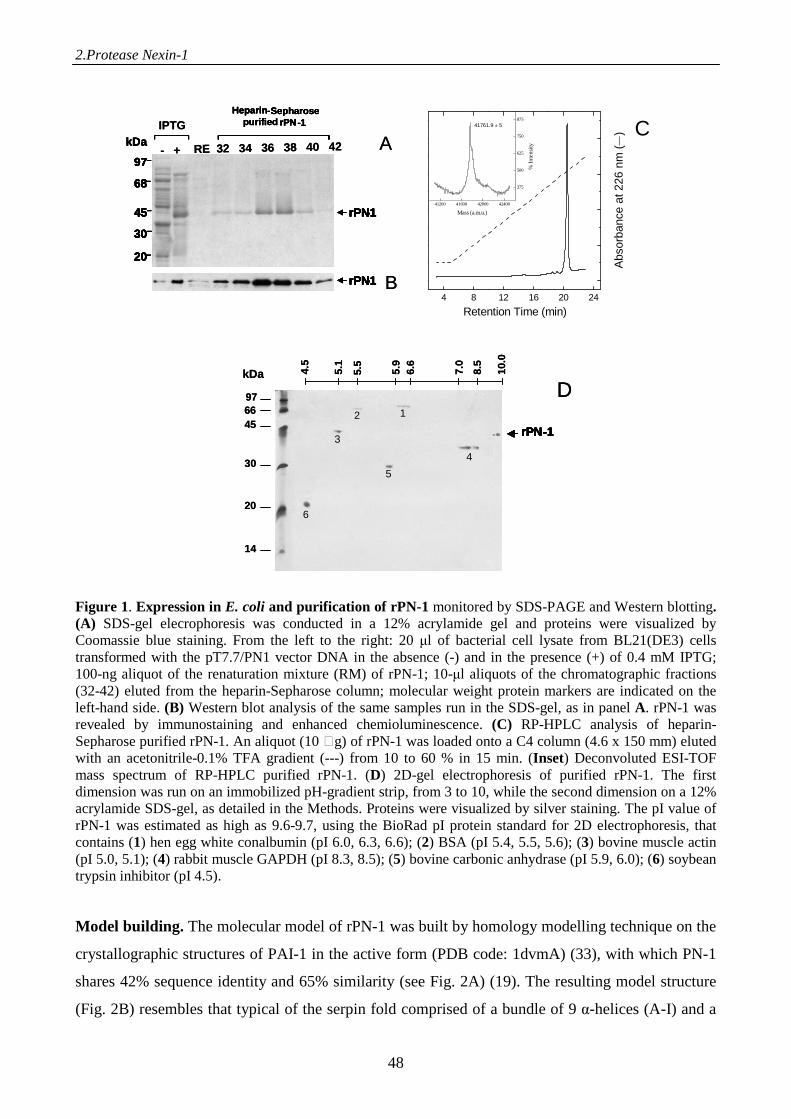
2.Protease Nexin-1
48
68
97
68
97
45
30
20
kDa
Heparin-Sepharosepurified rPN-1
rPN-1
rPN-1
RE 32 34 36 38 40 42- +
45
30
20
45
30
20
kDa
Heparin-Sepharosepurified rPN-1
68
97
68
97
rPN-1rPN-1
rPN-1rPN-
A
B
IPTG
45
30
20
45
30
20
kDa
Heparin-Sepharosepurified rPN-1
rPN-1rPN-1
rPN-1rPN-1
RE 32 34 36 38 40 42- +
45
30
20
45
30
20
kDa
Heparin-Sepharosepurified rPN-1
68
97
68
97
rPN-1rPN-1
rPN-1rPN-
A
B
IPTG
4 8 12 16 20 24
Abs
orba
nce
at 2
26 n
m (
)
Retention Time (min)
41200 41600 42000 42400
375
500
625
750
875
% In
tens
ity
Mass (a.m.u.)
41761.9 ± 5 C
kDa
976645
30
20
14
4.5
5.1
5.5
5.9
6.6
7.0
8.5
10.0
12
3
4
5
6
D
rPN-1rPN-1rPN-1
kDa
976645
30
20
14
4.5
5.1
5.5
5.9
6.6
7.0
8.5
10.0
12
3
4
5
6
D
rPN-1rPN-1rPN-1rPN-1rPN-1rPN-1rPN-1
Figure 1. Expression in E. coli and purification of rPN-1 monitored by SDS-PAGE and Western blotting. (A) SDS-gel elecrophoresis was conducted in a 12% acrylamide gel and proteins were visualized by Coomassie blue staining. From the left to the right: 20 µl of bacterial cell lysate from BL21(DE3) cells transformed with the pT7.7/PN1 vector DNA in the absence (-) and in the presence (+) of 0.4 mM IPTG; 100-ng aliquot of the renaturation mixture (RM) of rPN-1; 10-µl aliquots of the chromatographic fractions (32-42) eluted from the heparin-Sepharose column; molecular weight protein markers are indicated on the left-hand side. (B) Western blot analysis of the same samples run in the SDS-gel, as in panel A. rPN-1 was revealed by immunostaining and enhanced chemioluminescence. (C) RP-HPLC analysis of heparin-Sepharose purified rPN-1. An aliquot (10 g) of rPN-1 was loaded onto a C4 column (4.6 x 150 mm) eluted with an acetonitrile-0.1% TFA gradient (---) from 10 to 60 % in 15 min. (Inset) Deconvoluted ESI-TOF mass spectrum of RP-HPLC purified rPN-1. (D) 2D-gel electrophoresis of purified rPN-1. The first dimension was run on an immobilized pH-gradient strip, from 3 to 10, while the second dimension on a 12% acrylamide SDS-gel, as detailed in the Methods. Proteins were visualized by silver staining. The pI value of rPN-1 was estimated as high as 9.6-9.7, using the BioRad pI protein standard for 2D electrophoresis, that contains (1) hen egg white conalbumin (pI 6.0, 6.3, 6.6); (2) BSA (pI 5.4, 5.5, 5.6); (3) bovine muscle actin (pI 5.0, 5.1); (4) rabbit muscle GAPDH (pI 8.3, 8.5); (5) bovine carbonic anhydrase (pI 5.9, 6.0); (6) soybean trypsin inhibitor (pI 4.5). Model building. The molecular model of rPN-1 was built by homology modelling technique on the
crystallographic structures of PAI-1 in the active form (PDB code: 1dvmA) (33), with which PN-1
shares 42% sequence identity and 65% similarity (see Fig. 2A) (19). The resulting model structure
(Fig. 2B) resembles that typical of the serpin fold comprised of a bundle of 9 α-helices (A-I) and a
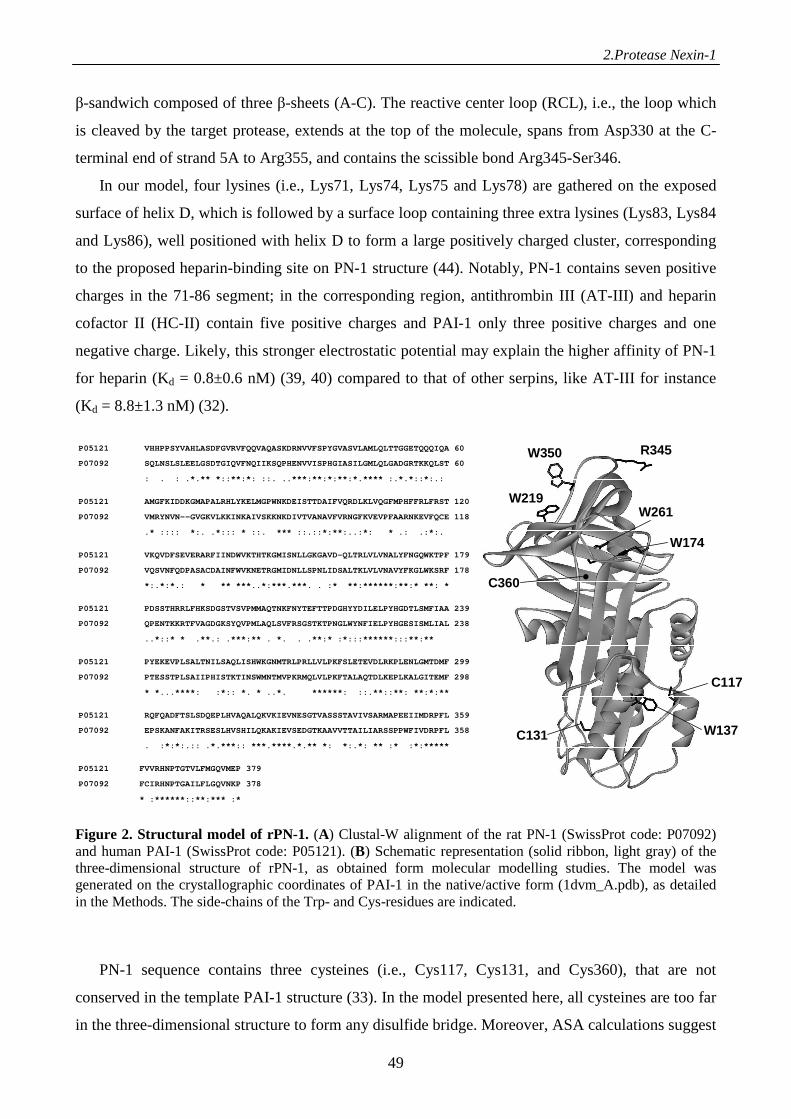
2.Protease Nexin-1
49
β-sandwich composed of three β-sheets (A-C). The reactive center loop (RCL), i.e., the loop which
is cleaved by the target protease, extends at the top of the molecule, spans from Asp330 at the C-
terminal end of strand 5A to Arg355, and contains the scissible bond Arg345-Ser346.
In our model, four lysines (i.e., Lys71, Lys74, Lys75 and Lys78) are gathered on the exposed
surface of helix D, which is followed by a surface loop containing three extra lysines (Lys83, Lys84
and Lys86), well positioned with helix D to form a large positively charged cluster, corresponding
to the proposed heparin-binding site on PN-1 structure (44). Notably, PN-1 contains seven positive
charges in the 71-86 segment; in the corresponding region, antithrombin III (AT-III) and heparin
cofactor II (HC-II) contain five positive charges and PAI-1 only three positive charges and one
negative charge. Likely, this stronger electrostatic potential may explain the higher affinity of PN-1
for heparin (Kd = 0.8±0.6 nM) (39, 40) compared to that of other serpins, like AT-III for instance
(Kd = 8.8±1.3 nM) (32).
Figure 2. Structural model of rPN-1. (A) Clustal-W alignment of the rat PN-1 (SwissProt code: P07092) and human PAI-1 (SwissProt code: P05121). (B) Schematic representation (solid ribbon, light gray) of the three-dimensional structure of rPN-1, as obtained form molecular modelling studies. The model was generated on the crystallographic coordinates of PAI-1 in the native/active form (1dvm_A.pdb), as detailed in the Methods. The side-chains of the Trp- and Cys-residues are indicated.
PN-1 sequence contains three cysteines (i.e., Cys117, Cys131, and Cys360), that are not
conserved in the template PAI-1 structure (33). In the model presented here, all cysteines are too far
in the three-dimensional structure to form any disulfide bridge. Moreover, ASA calculations suggest
P05121 VHHPPSYVAHLASDFGVRVFQQVAQASKDRNVVFSPYGVASVLAMLQLTTGGETQQQIQA 60
P07092 SQLNSLSLEELGSDTGIQVFNQIIKSQPHENVVISPHGIASILGMLQLGADGRTKKQLST 60
: . : .*.** *::**:*: ::. ..***:**:*:**:*.**** :.*.*::*:.:
P05121 AMGFKIDDKGMAPALRHLYKELMGPWNKDEISTTDAIFVQRDLKLVQGFMPHFFRLFRST 120
P07092 VMRYNVN--GVGKVLKKINKAIVSKKNKDIVTVANAVFVRNGFKVEVPFAARNKEVFQCE 118
.* :::: *:. .*::: * ::. *** ::.::*:**:..:*: * .: .:*:.
P05121 VKQVDFSEVERARFIINDWVKTHTKGMISNLLGKGAVD-QLTRLVLVNALYFNGQWKTPF 179
P07092 VQSVNFQDPASACDAINFWVKNETRGMIDNLLSPNLIDSALTKLVLVNAVYFKGLWKSRF 178
*:.*:*.: * ** ***..*:***.***. . :* **:******:**:* **: *
P05121 PDSSTHRRLFHKSDGSTVSVPMMAQTNKFNYTEFTTPDGHYYDILELPYHGDTLSMFIAA 239
P07092 QPENTKKRTFVAGDGKSYQVPMLAQLSVFRSGSTKTPNGLWYNFIELPYHGESISMLIAL 238
..*::* * .**.: .***:** . *. . .**:* :*:::******:::**:**
P05121 PYEKEVPLSALTNILSAQLISHWKGNMTRLPRLLVLPKFSLETEVDLRKPLENLGMTDMF 299
P07092 PTESSTPLSAIIPHISTKTINSWMNTMVPKRMQLVLPKFTALAQTDLKEPLKALGITEMF 298
* *...****: :*:: *. * ..*. ******: ::.**::**: **:*:**
P05121 RQFQADFTSLSDQEPLHVAQALQKVKIEVNESGTVASSSTAVIVSARMAPEEIIMDRPFL 359
P07092 EPSKANFAKITRSESLHVSHILQKAKIEVSEDGTKAAVVTTAILIARSSPPWFIVDRPFL 358
. :*:*:.:: .*.***:: ***.****.*.** *: *:.*: ** :* :*:*****
P05121 FVVRHNPTGTVLFMGQVMEP 379
P07092 FCIRHNPTGAILFLGQVNKP 378
* :******::**:*** :*
W350
W219
W137
W174
W261
C117
C131
C360 •
R345
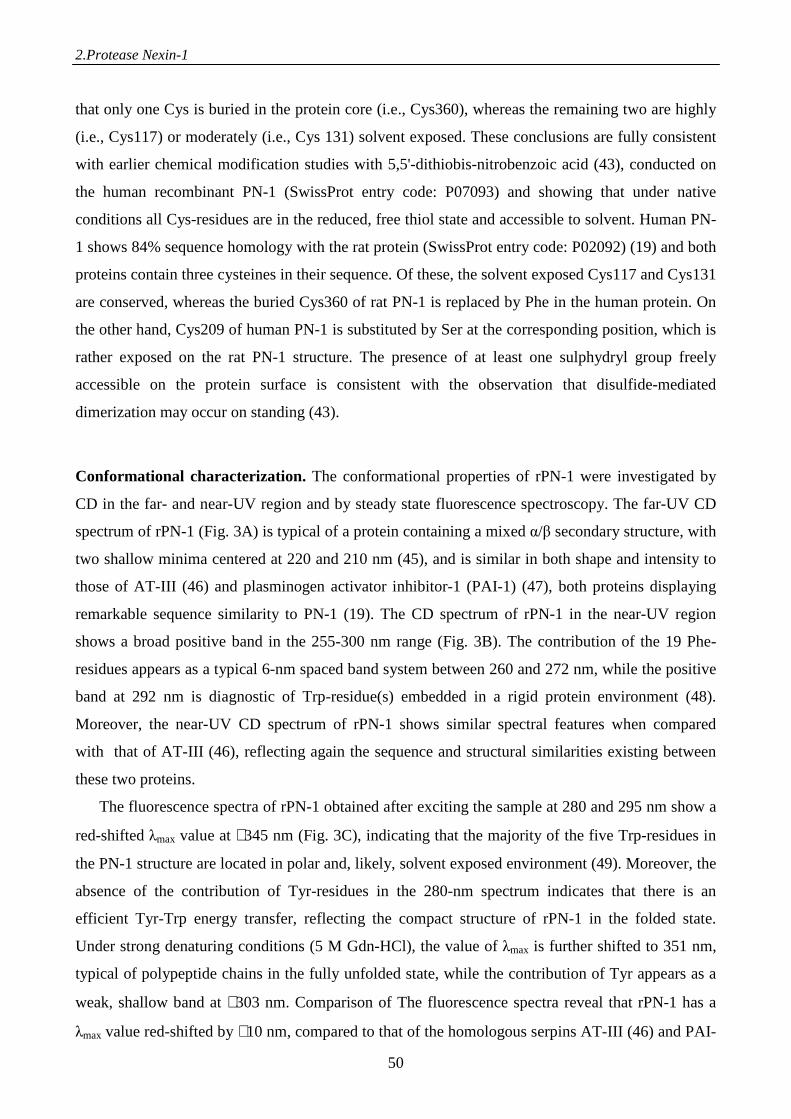
2.Protease Nexin-1
50
that only one Cys is buried in the protein core (i.e., Cys360), whereas the remaining two are highly
(i.e., Cys117) or moderately (i.e., Cys 131) solvent exposed. These conclusions are fully consistent
with earlier chemical modification studies with 5,5'-dithiobis-nitrobenzoic acid (43), conducted on
the human recombinant PN-1 (SwissProt entry code: P07093) and showing that under native
conditions all Cys-residues are in the reduced, free thiol state and accessible to solvent. Human PN-
1 shows 84% sequence homology with the rat protein (SwissProt entry code: P02092) (19) and both
proteins contain three cysteines in their sequence. Of these, the solvent exposed Cys117 and Cys131
are conserved, whereas the buried Cys360 of rat PN-1 is replaced by Phe in the human protein. On
the other hand, Cys209 of human PN-1 is substituted by Ser at the corresponding position, which is
rather exposed on the rat PN-1 structure. The presence of at least one sulphydryl group freely
accessible on the protein surface is consistent with the observation that disulfide-mediated
dimerization may occur on standing (43).
Conformational characterization. The conformational properties of rPN-1 were investigated by
CD in the far- and near-UV region and by steady state fluorescence spectroscopy. The far-UV CD
spectrum of rPN-1 (Fig. 3A) is typical of a protein containing a mixed α/β secondary structure, with
two shallow minima centered at 220 and 210 nm (45), and is similar in both shape and intensity to
those of AT-III (46) and plasminogen activator inhibitor-1 (PAI-1) (47), both proteins displaying
remarkable sequence similarity to PN-1 (19). The CD spectrum of rPN-1 in the near-UV region
shows a broad positive band in the 255-300 nm range (Fig. 3B). The contribution of the 19 Phe-
residues appears as a typical 6-nm spaced band system between 260 and 272 nm, while the positive
band at 292 nm is diagnostic of Trp-residue(s) embedded in a rigid protein environment (48).
Moreover, the near-UV CD spectrum of rPN-1 shows similar spectral features when compared
with that of AT-III (46), reflecting again the sequence and structural similarities existing between
these two proteins.
The fluorescence spectra of rPN-1 obtained after exciting the sample at 280 and 295 nm show a
red-shifted λmax value at ∼345 nm (Fig. 3C), indicating that the majority of the five Trp-residues in
the PN-1 structure are located in polar and, likely, solvent exposed environment (49). Moreover, the
absence of the contribution of Tyr-residues in the 280-nm spectrum indicates that there is an
efficient Tyr-Trp energy transfer, reflecting the compact structure of rPN-1 in the folded state.
Under strong denaturing conditions (5 M Gdn-HCl), the value of λmax is further shifted to 351 nm,
typical of polypeptide chains in the fully unfolded state, while the contribution of Tyr appears as a
weak, shallow band at ∼303 nm. Comparison of The fluorescence spectra reveal that rPN-1 has a
λmax value red-shifted by ∼10 nm, compared to that of the homologous serpins AT-III (46) and PAI-
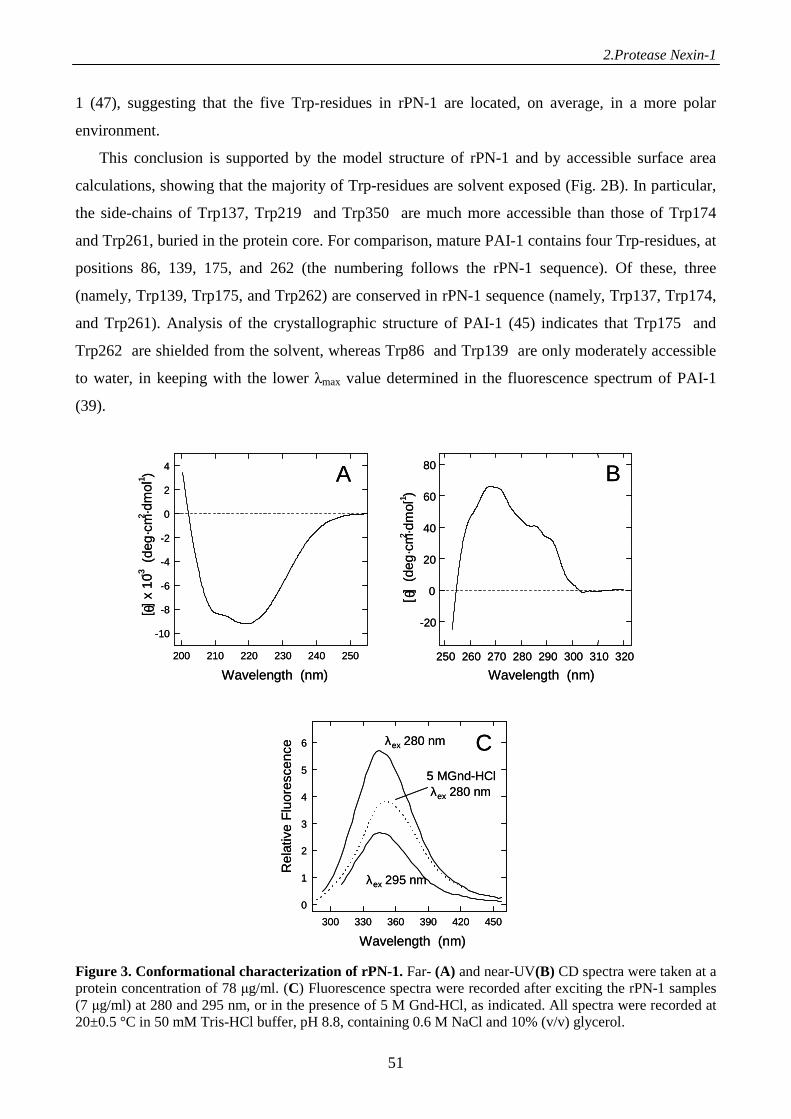
2.Protease Nexin-1
51
1 (47), suggesting that the five Trp-residues in rPN-1 are located, on average, in a more polar
environment.
This conclusion is supported by the model structure of rPN-1 and by accessible surface area
calculations, showing that the majority of Trp-residues are solvent exposed (Fig. 2B). In particular,
the side-chains of Trp137, Trp219 and Trp350 are much more accessible than those of Trp174
and Trp261, buried in the protein core. For comparison, mature PAI-1 contains four Trp-residues, at
positions 86, 139, 175, and 262 (the numbering follows the rPN-1 sequence). Of these, three
(namely, Trp139, Trp175, and Trp262) are conserved in rPN-1 sequence (namely, Trp137, Trp174,
and Trp261). Analysis of the crystallographic structure of PAI-1 (45) indicates that Trp175 and
Trp262 are shielded from the solvent, whereas Trp86 and Trp139 are only moderately accessible
to water, in keeping with the lower λmax value determined in the fluorescence spectrum of PAI-1
(39).
Figure 3. Conformational characterization of rPN-1. Far- (A) and near-UV(B) CD spectra were taken at a protein concentration of 78 µg/ml. (C) Fluorescence spectra were recorded after exciting the rPN-1 samples (7 µg/ml) at 280 and 295 nm, or in the presence of 5 M Gnd-HCl, as indicated. All spectra were recorded at 20±0.5 °C in 50 mM Tris-HCl buffer, pH 8.8, containing 0.6 M NaCl and 10% (v/v) glycerol.
200 210 220 230 240 250
-10
-8
-6
-4
-2
0
2
4
[ θ] x
10-3
(deg
·cm2 ·d
mol-1
)
Wavelength (nm)
A
250 260 270 280 290 300 310 320
-20
0
20
40
60
80
[ θ]
(deg
·cm2 ·d
mol-1
)
Wavelength (nm)
B
C
300 330 360 390 420 450
0
1
2
3
4
5
6
Rel
ativ
e F
luor
esce
nce
Wavelength (nm)
λex 280 nm
5 MGnd-HClλex 280 nm
λex 295 nm
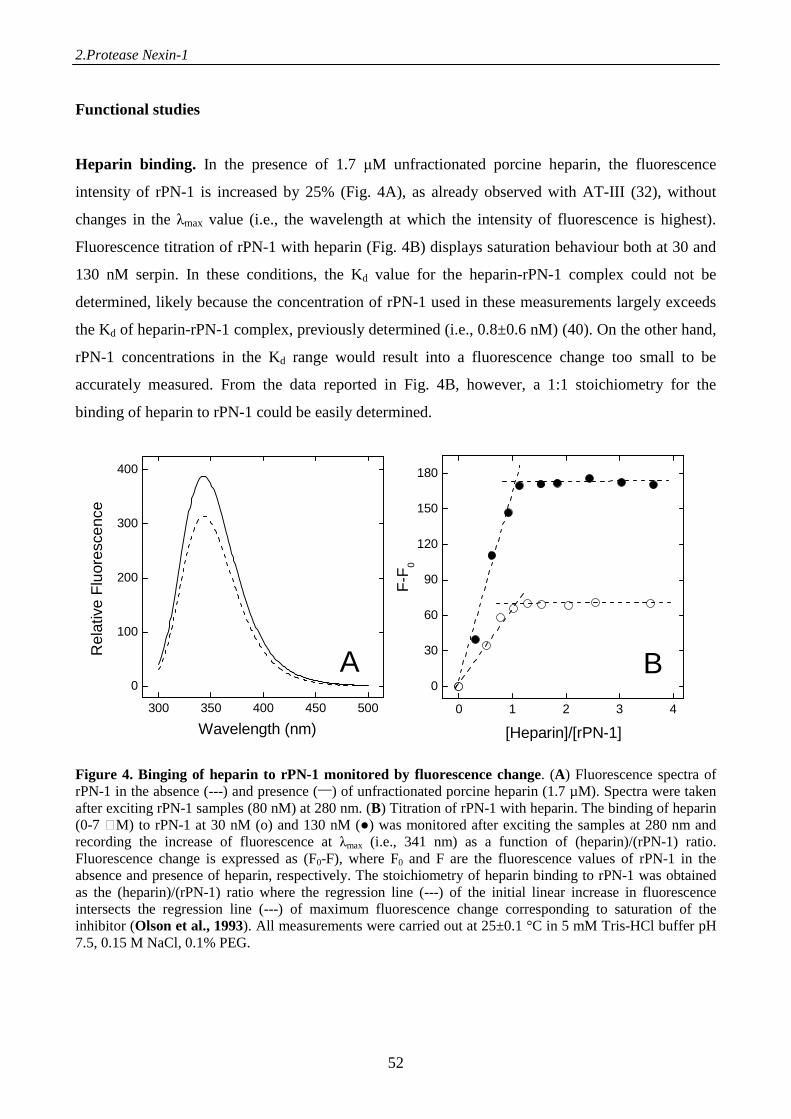
2.Protease Nexin-1
52
Functional studies
Heparin binding. In the presence of 1.7 µM unfractionated porcine heparin, the fluorescence
intensity of rPN-1 is increased by 25% (Fig. 4A), as already observed with AT-III (32), without
changes in the λmax value (i.e., the wavelength at which the intensity of fluorescence is highest).
Fluorescence titration of rPN-1 with heparin (Fig. 4B) displays saturation behaviour both at 30 and
130 nM serpin. In these conditions, the Kd value for the heparin-rPN-1 complex could not be
determined, likely because the concentration of rPN-1 used in these measurements largely exceeds
the Kd of heparin-rPN-1 complex, previously determined (i.e., 0.8±0.6 nM) (40). On the other hand,
rPN-1 concentrations in the Kd range would result into a fluorescence change too small to be
accurately measured. From the data reported in Fig. 4B, however, a 1:1 stoichiometry for the
binding of heparin to rPN-1 could be easily determined.
Figure 4. Binging of heparin to rPN-1 monitored by fluorescence change. (A) Fluorescence spectra of rPN-1 in the absence (---) and presence (___) of unfractionated porcine heparin (1.7 µM). Spectra were taken after exciting rPN-1 samples (80 nM) at 280 nm. (B) Titration of rPN-1 with heparin. The binding of heparin (0-7 M) to rPN-1 at 30 nM (o) and 130 nM (●) was monitored after exciting the samples at 280 nm and recording the increase of fluorescence at λmax (i.e., 341 nm) as a function of (heparin)/(rPN-1) ratio. Fluorescence change is expressed as (F0-F), where F0 and F are the fluorescence values of rPN-1 in the absence and presence of heparin, respectively. The stoichiometry of heparin binding to rPN-1 was obtained as the (heparin)/(rPN-1) ratio where the regression line (---) of the initial linear increase in fluorescence intersects the regression line (---) of maximum fluorescence change corresponding to saturation of the inhibitor (Olson et al., 1993). All measurements were carried out at 25±0.1 °C in 5 mM Tris-HCl buffer pH 7.5, 0.15 M NaCl, 0.1% PEG.
300 350 400 450 500
0
100
200
300
400
Rel
ativ
e F
luor
esce
nce
Wavelength (nm)
A B0 1 2 3 4
0
30
60
90
120
150
180
[Heparin]/[rPN-1]
F-F
0
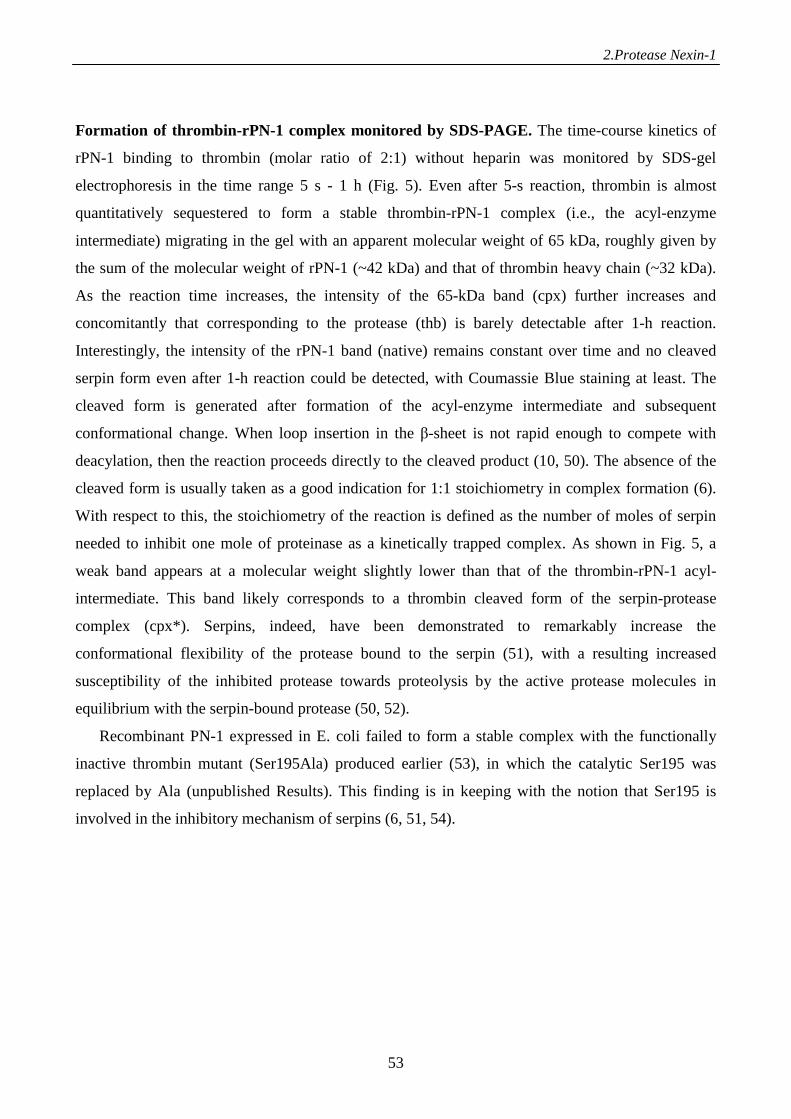
2.Protease Nexin-1
53
Formation of thrombin-rPN-1 complex monitored by SDS-PAGE. The time-course kinetics of
rPN-1 binding to thrombin (molar ratio of 2:1) without heparin was monitored by SDS-gel
electrophoresis in the time range 5 s - 1 h (Fig. 5). Even after 5-s reaction, thrombin is almost
quantitatively sequestered to form a stable thrombin-rPN-1 complex (i.e., the acyl-enzyme
intermediate) migrating in the gel with an apparent molecular weight of 65 kDa, roughly given by
the sum of the molecular weight of rPN-1 (~42 kDa) and that of thrombin heavy chain (~32 kDa).
As the reaction time increases, the intensity of the 65-kDa band (cpx) further increases and
concomitantly that corresponding to the protease (thb) is barely detectable after 1-h reaction.
Interestingly, the intensity of the rPN-1 band (native) remains constant over time and no cleaved
serpin form even after 1-h reaction could be detected, with Coumassie Blue staining at least. The
cleaved form is generated after formation of the acyl-enzyme intermediate and subsequent
conformational change. When loop insertion in the β-sheet is not rapid enough to compete with
deacylation, then the reaction proceeds directly to the cleaved product (10, 50). The absence of the
cleaved form is usually taken as a good indication for 1:1 stoichiometry in complex formation (6).
With respect to this, the stoichiometry of the reaction is defined as the number of moles of serpin
needed to inhibit one mole of proteinase as a kinetically trapped complex. As shown in Fig. 5, a
weak band appears at a molecular weight slightly lower than that of the thrombin-rPN-1 acyl-
intermediate. This band likely corresponds to a thrombin cleaved form of the serpin-protease
complex (cpx*). Serpins, indeed, have been demonstrated to remarkably increase the
conformational flexibility of the protease bound to the serpin (51), with a resulting increased
susceptibility of the inhibited protease towards proteolysis by the active protease molecules in
equilibrium with the serpin-bound protease (50, 52).
Recombinant PN-1 expressed in E. coli failed to form a stable complex with the functionally
inactive thrombin mutant (Ser195Ala) produced earlier (53), in which the catalytic Ser195 was
replaced by Ala (unpublished Results). This finding is in keeping with the notion that Ser195 is
involved in the inhibitory mechanism of serpins (6, 51, 54).
2.Protease Nexin-1
54
Figure 5. SDS-PAGE analysis of the reaction mixture of rPN-1 with thrombin. At each time-point, to 22 µll of the reaction mixture, containing 2.4 µg of rPN-1 and 0.9 µg of α-thrombin (2:1 molar ratio), incubated at room temperature (22±1°C) in 5 mM Tris-HCl buffer pH 7.5, 0.15 M NaCl, 0.1% PEG-8000, were added 6 µl of pre-heated reducing SDS-loading buffer. After rapid mixing, samples were heated for a further 3 min at 100°C. The gel was stained with Coumassie Blue. Lane 1 is rPN-1 alone; lanes 2-9 correspond to 5-, 15-, 30-, 60-, 120-, 600-, 1200-, and 3600-s time points of the reaction; lane 10 is thrombin alone. Molecular-weight markers were loaded in the left-handed well. Reactants and products are labelled as follows: native, intact rPN-1; thb, thrombin (heavy chain); cpx, stable thrombin-rPN-1 complex; cpx*, cleaved complex. Thrombin inhibition by rPN-1 in the absence and presence of heparin. Thrombin inactivation
by rPN-1 in the absence of heparin was determined by the discontinuous assay method, according to
which the protease and the serpin were incubated at 25±0.5°C under pseudo-first order conditions
(i.e., (rPN-1) >> (trombin)) in Tris-HCl buffer, pH 7.5. The residual protease activity was
determined at time intervals by measuring the initial velocity of S-2238 substrate hydrolysis at 405
nm in the absence (v0) and presence (vi) of rPN-1. The per cent active thrombin was plotted as a
function of time (Fig. 6A) and the data fitted to equation 1, from which a figure of the pseudo first-
order association rate constant, ka, could be estimated as 1.1±0.1 x 10⁶ M-1·s-1 (see Methods for
details). This value is fully consistent with those reported for natural, ka = 1.4 x 10⁶ M-1·s-1 (39), and
recombinant PN-1 expressed in chinese hamster ovary cells, ka = 0.8 x 10⁶ M-1·s-1 (43), or in yeast,
ka =1.4 x 10⁶ M-1·s-1 (40).
In the presence of heparin, the affinity of rPN-1 for thrombin increases by 103-fold (39, 40) and
therefore the discontinuous method would not yield reliable ka values. To overcome this limitation,
inhibition assays were carried out at 25±0.5°C by continuously measuring over time inactivation of
thrombin by rPN-1 in the presence of S-2238 and increasing concentrations of heparin (100 pM–
100 µM) (32). The reaction was started by addition of thrombin (50 pM) and the progress curves of
the release of p-nitroanilide as a function of time were fitted to equation 2 (Fig. 6B). From these
data, the second-order association rate constant, k1, could be estimated at each heparin
82 3 4 5 6 71 9
thb
native
cpx
97
kDa
66
45
30
10
2.Protease Nexin-1
55
concentration. Plotting k1 values as a function of heparin concentration (Fig. 6C) yielded a typical
bell-shaped curve, similar to previous data reported with natural (39) or recombinant (40) PN-1.
The data were fitted to equation 4, yielding an optimal heparin concentration, (H)opt, at which the k1
value is maximal, k1° = 0.45±0.02 x 10⁹ M-1·s-1. Notably, this value is very similar to that reported
for natural PN-1, k1° = 0.46±0.04 x 10⁹ M-1·s-1 (39). For further increase of heparin concentration,
the cofactor seems to have an inhibitory effect on serpin-thrombin interaction, consistent with the
template model of heparin-accelerated inhibition of thrombin by serpins (32. The affinity of heparin
for PN-1 (Kd = 0.8±0.6 nM) (40) is much higher than that for thrombin (Kd = 0.69±0.06 µM) (55).
This large difference in affinities implies that the assembly of the ternary serpin-heparin-protease
complex, I·H·P, occurs predominantly as a bimolecular association between the serpin-heparin
binary complex, I·H, and the free protease, P, according to the template model reported in Scheme
4:
KIHP kIH I·H + P ↔ I·H·P → I·P + H (Scheme 4)
where KIHP is the equilibrium dissociation constant of the encounter I·H·P complex and kIH is the
first-order rate constant for the conversion of the I·H·P complex to the stable I·P complex and
release of heparin (32). According to this model, at heparin concentrations higher than (H)opt, the
free heparin not bound to rPN-1 can compete with the inhibitor-heparin complex, I·H, for the
binding to thrombin thereby reducing the reaction rate for the formation of thrombin-rPN-1
complex.
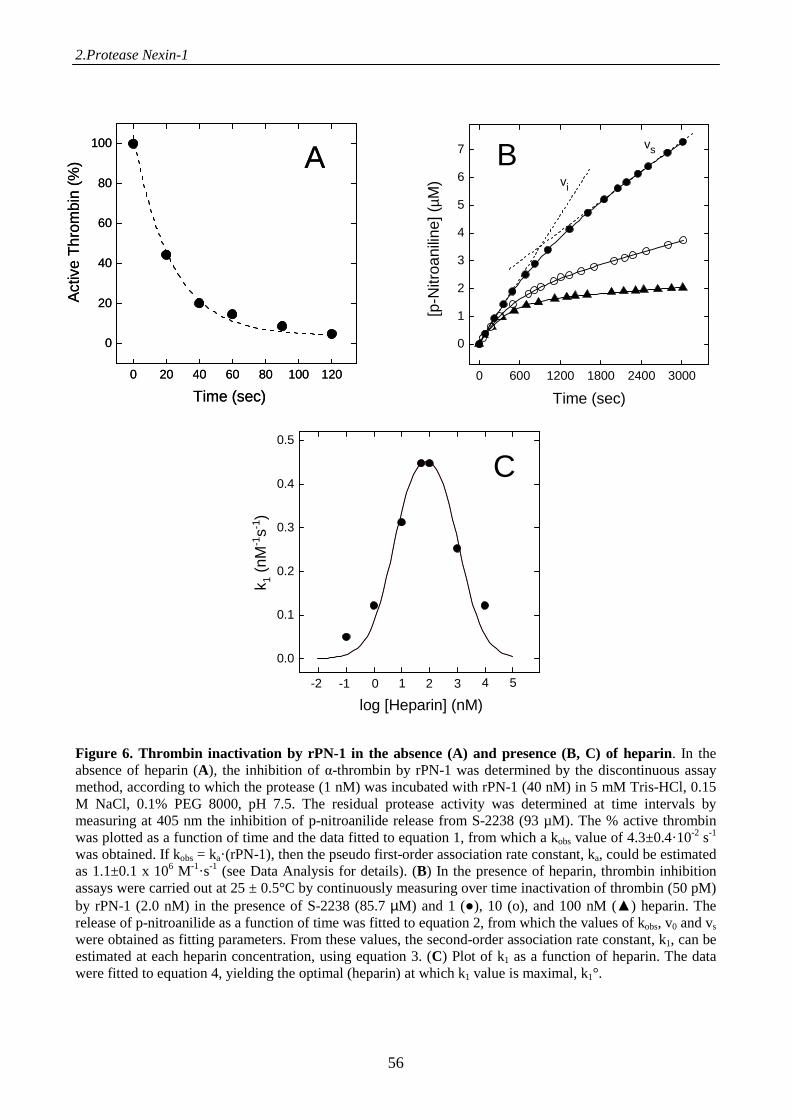
2.Protease Nexin-1
56
Figure 6. Thrombin inactivation by rPN-1 in the absence (A) and presence (B, C) of heparin. In the absence of heparin (A), the inhibition of α-thrombin by rPN-1 was determined by the discontinuous assay method, according to which the protease (1 nM) was incubated with rPN-1 (40 nM) in 5 mM Tris-HCl, 0.15 M NaCl, 0.1% PEG 8000, pH 7.5. The residual protease activity was determined at time intervals by measuring at 405 nm the inhibition of p-nitroanilide release from S-2238 (93 µM). The % active thrombin was plotted as a function of time and the data fitted to equation 1, from which a kobs value of 4.3±0.4·10-2 s-1 was obtained. If kobs = ka·(rPN-1), then the pseudo first-order association rate constant, ka, could be estimated as 1.1±0.1 x 10⁶ M-1·s-1 (see Data Analysis for details). (B) In the presence of heparin, thrombin inhibition assays were carried out at 25 ± 0.5°C by continuously measuring over time inactivation of thrombin (50 pM) by rPN-1 (2.0 nM) in the presence of S-2238 (85.7 µM) and 1 (●), 10 (o), and 100 nM (▲) heparin. The release of p-nitroanilide as a function of time was fitted to equation 2, from which the values of kobs, v0 and vs were obtained as fitting parameters. From these values, the second-order association rate constant, k1, can be estimated at each heparin concentration, using equation 3. (C) Plot of k1 as a function of heparin. The data were fitted to equation 4, yielding the optimal (heparin) at which k1 value is maximal, k1°.
0 20 40 60 80 100 120
0
20
40
60
80
100
Act
ive
Thr
ombi
n (%
)
Time (sec)
A
0 20 40 60 80 100 120
0
20
40
60
80
100
Act
ive
Thr
ombi
n (%
)
Time (sec)
A
0 600 1200 1800 2400 3000
0
1
2
3
4
5
6
7
vi
[p-N
itroa
nilin
e] (
µM)
Time (sec)
vsB
0.0
0.1
0.2
0.3
0.4
0.5
543210-1
k 1
(nM
-1s-1
)
log [Heparin] (nM)
-2
C
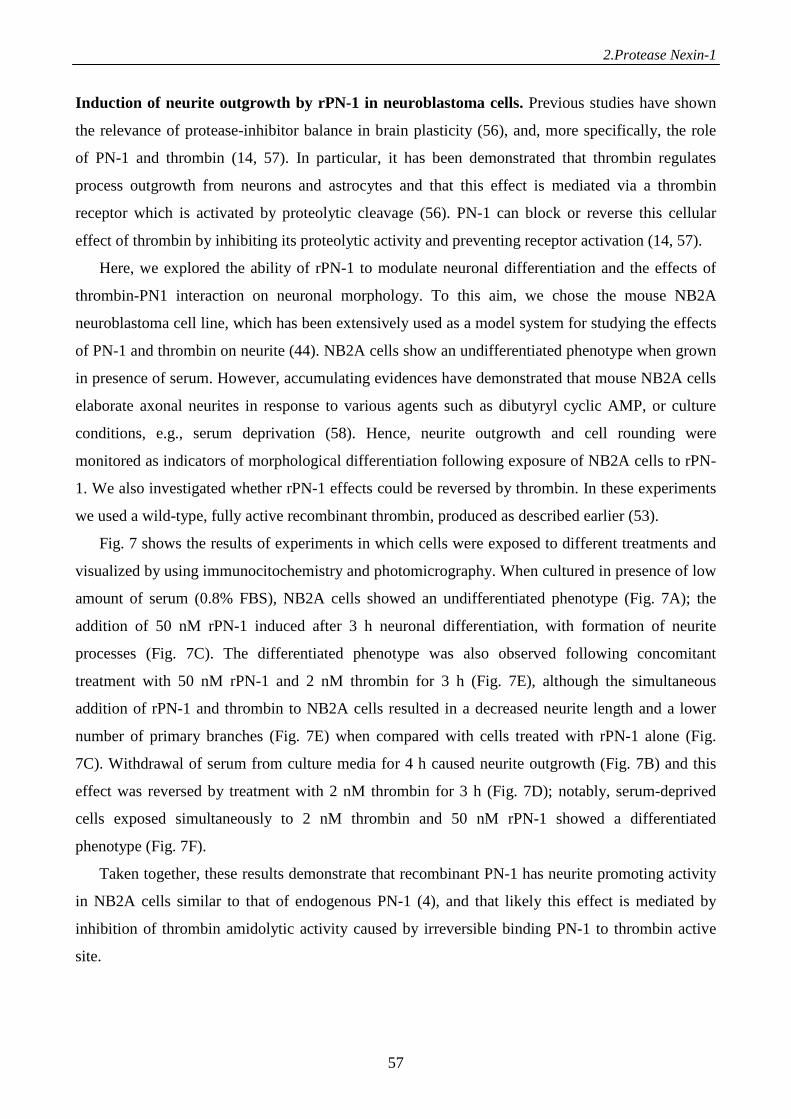
2.Protease Nexin-1
57
Induction of neurite outgrowth by rPN-1 in neuroblastoma cells. Previous studies have shown
the relevance of protease-inhibitor balance in brain plasticity (56), and, more specifically, the role
of PN-1 and thrombin (14, 57). In particular, it has been demonstrated that thrombin regulates
process outgrowth from neurons and astrocytes and that this effect is mediated via a thrombin
receptor which is activated by proteolytic cleavage (56). PN-1 can block or reverse this cellular
effect of thrombin by inhibiting its proteolytic activity and preventing receptor activation (14, 57).
Here, we explored the ability of rPN-1 to modulate neuronal differentiation and the effects of
thrombin-PN1 interaction on neuronal morphology. To this aim, we chose the mouse NB2A
neuroblastoma cell line, which has been extensively used as a model system for studying the effects
of PN-1 and thrombin on neurite (44). NB2A cells show an undifferentiated phenotype when grown
in presence of serum. However, accumulating evidences have demonstrated that mouse NB2A cells
elaborate axonal neurites in response to various agents such as dibutyryl cyclic AMP, or culture
conditions, e.g., serum deprivation (58). Hence, neurite outgrowth and cell rounding were
monitored as indicators of morphological differentiation following exposure of NB2A cells to rPN-
1. We also investigated whether rPN-1 effects could be reversed by thrombin. In these experiments
we used a wild-type, fully active recombinant thrombin, produced as described earlier (53).
Fig. 7 shows the results of experiments in which cells were exposed to different treatments and
visualized by using immunocitochemistry and photomicrography. When cultured in presence of low
amount of serum (0.8% FBS), NB2A cells showed an undifferentiated phenotype (Fig. 7A); the
addition of 50 nM rPN-1 induced after 3 h neuronal differentiation, with formation of neurite
processes (Fig. 7C). The differentiated phenotype was also observed following concomitant
treatment with 50 nM rPN-1 and 2 nM thrombin for 3 h (Fig. 7E), although the simultaneous
addition of rPN-1 and thrombin to NB2A cells resulted in a decreased neurite length and a lower
number of primary branches (Fig. 7E) when compared with cells treated with rPN-1 alone (Fig.
7C). Withdrawal of serum from culture media for 4 h caused neurite outgrowth (Fig. 7B) and this
effect was reversed by treatment with 2 nM thrombin for 3 h (Fig. 7D); notably, serum-deprived
cells exposed simultaneously to 2 nM thrombin and 50 nM rPN-1 showed a differentiated
phenotype (Fig. 7F).
Taken together, these results demonstrate that recombinant PN-1 has neurite promoting activity
in NB2A cells similar to that of endogenous PN-1 (4), and that likely this effect is mediated by
inhibition of thrombin amidolytic activity caused by irreversible binding PN-1 to thrombin active
site.
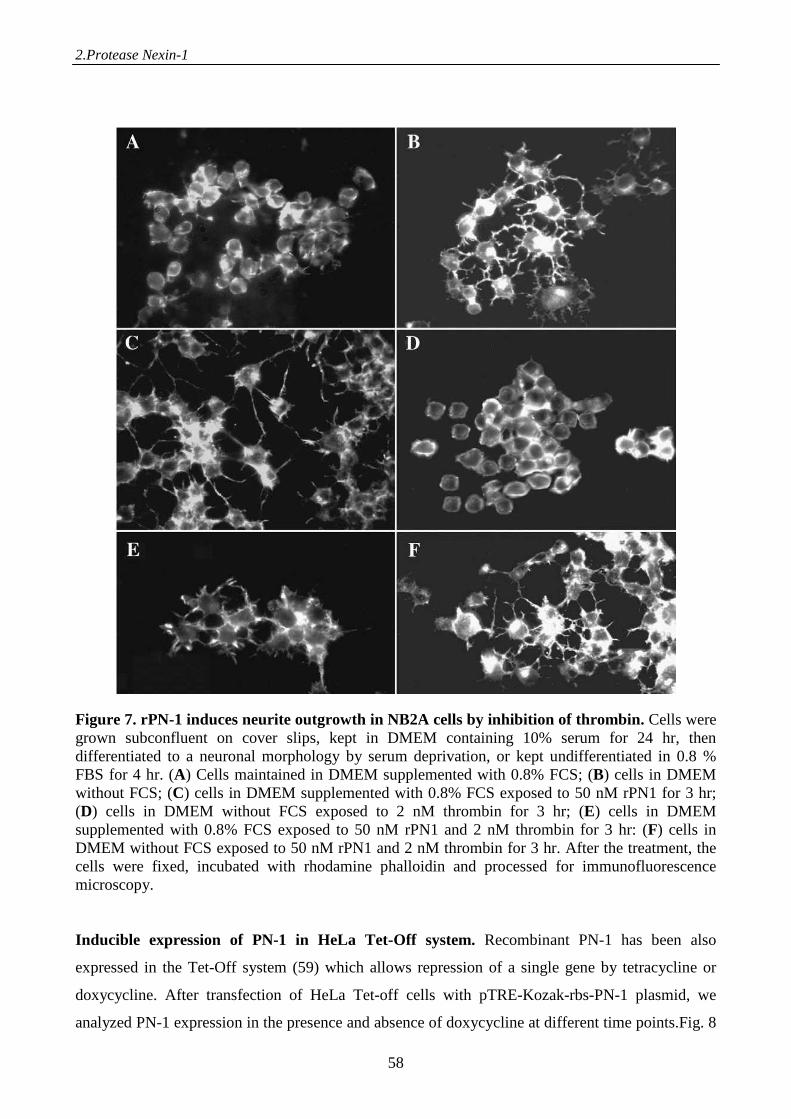
2.Protease Nexin-1
58
Figure 7. rPN-1 induces neurite outgrowth in NB2A cells by inhibition of thrombin. Cells were grown subconfluent on cover slips, kept in DMEM containing 10% serum for 24 hr, then differentiated to a neuronal morphology by serum deprivation, or kept undifferentiated in 0.8 % FBS for 4 hr. (A) Cells maintained in DMEM supplemented with 0.8% FCS; (B) cells in DMEM without FCS; (C) cells in DMEM supplemented with 0.8% FCS exposed to 50 nM rPN1 for 3 hr; (D) cells in DMEM without FCS exposed to 2 nM thrombin for 3 hr; (E) cells in DMEM supplemented with 0.8% FCS exposed to 50 nM rPN1 and 2 nM thrombin for 3 hr: (F) cells in DMEM without FCS exposed to 50 nM rPN1 and 2 nM thrombin for 3 hr. After the treatment, the cells were fixed, incubated with rhodamine phalloidin and processed for immunofluorescence microscopy. Inducible expression of PN-1 in HeLa Tet-Off system. Recombinant PN-1 has been also
expressed in the Tet-Off system (59) which allows repression of a single gene by tetracycline or
doxycycline. After transfection of HeLa Tet-off cells with pTRE-Kozak-rbs-PN-1 plasmid, we
analyzed PN-1 expression in the presence and absence of doxycycline at different time points.Fig. 8
2.Protease Nexin-1
59
shows the results of the immunofluorescence analysis of PN-1 expression. After removal of
doxycyline, PN-1 appeared in the cell cytoplasm of transfected HeLa cells (Fig. 8B; 24, 48 and 72
h), and no signal was observed in the presence of the antibiotic (Fig. 8D; 24, 48 and 72 h). At 24 h,
a strong perinuclear fluorescence was observed in the putatively Golgi region, as expected for a
secreted protein. At 48 and 72 h, cell cytoplasm was strongly stained, thus indicating a high level of
protein synthesis. As a control, the same fields were stained with DAPI (Fig. 8C, 24, 48 and 72 h).
Figure 8. Inducible expression of rPN-1 in pTRE-PN-1 transfected HeLa Tet-off cells. Immunofluorescence microscopy in the presence of doxycycline or following doxycycline removal from the culture media, at the indicated time. Nuclei were stained with DAPI. Cells were grown to 80% confluence on glass cover slips, transiently transfected with the pTRE-Kozak-rbs-PN-1 plasmid. At the indicated times after removal of doxycycline, cells were fixed with formaldehyde and processed for immunofluorescence staining, using anti-PN-1 polyclonal serum, followed by fluorescein isothiocyanate antirabbit IgG, and DAPI stained.
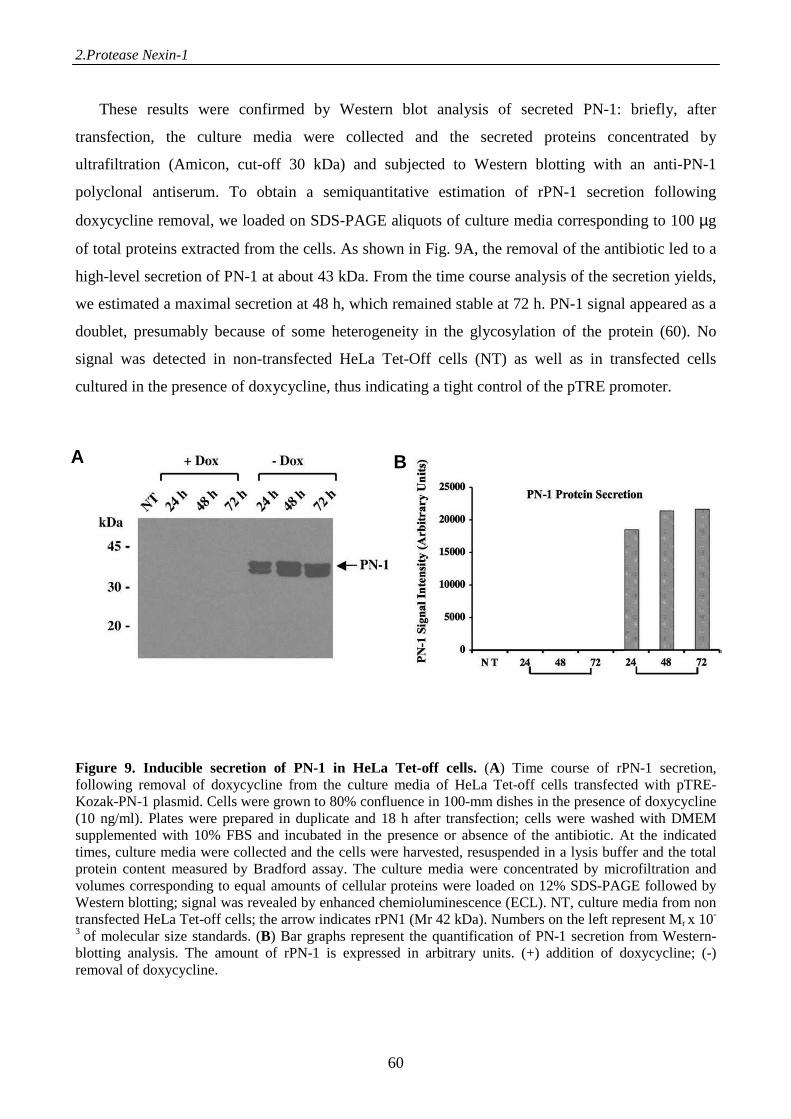
2.Protease Nexin-1
60
These results were confirmed by Western blot analysis of secreted PN-1: briefly, after
transfection, the culture media were collected and the secreted proteins concentrated by
ultrafiltration (Amicon, cut-off 30 kDa) and subjected to Western blotting with an anti-PN-1
polyclonal antiserum. To obtain a semiquantitative estimation of rPN-1 secretion following
doxycycline removal, we loaded on SDS-PAGE aliquots of culture media corresponding to 100 µg
of total proteins extracted from the cells. As shown in Fig. 9A, the removal of the antibiotic led to a
high-level secretion of PN-1 at about 43 kDa. From the time course analysis of the secretion yields,
we estimated a maximal secretion at 48 h, which remained stable at 72 h. PN-1 signal appeared as a
doublet, presumably because of some heterogeneity in the glycosylation of the protein (60). No
signal was detected in non-transfected HeLa Tet-Off cells (NT) as well as in transfected cells
cultured in the presence of doxycycline, thus indicating a tight control of the pTRE promoter.
Figure 9. Inducible secretion of PN-1 in HeLa Tet-off cells. (A) Time course of rPN-1 secretion, following removal of doxycycline from the culture media of HeLa Tet-off cells transfected with pTRE-Kozak-PN-1 plasmid. Cells were grown to 80% confluence in 100-mm dishes in the presence of doxycycline (10 ng/ml). Plates were prepared in duplicate and 18 h after transfection; cells were washed with DMEM supplemented with 10% FBS and incubated in the presence or absence of the antibiotic. At the indicated times, culture media were collected and the cells were harvested, resuspended in a lysis buffer and the total protein content measured by Bradford assay. The culture media were concentrated by microfiltration and volumes corresponding to equal amounts of cellular proteins were loaded on 12% SDS-PAGE followed by Western blotting; signal was revealed by enhanced chemioluminescence (ECL). NT, culture media from non transfected HeLa Tet-off cells; the arrow indicates rPN1 (Mr 42 kDa). Numbers on the left represent Mr x 10-
3 of molecular size standards. (B) Bar graphs represent the quantification of PN-1 secretion from Western-blotting analysis. The amount of rPN-1 is expressed in arbitrary units. (+) addition of doxycycline; (-) removal of doxycycline.
A B
2.Protease Nexin-1
61
DISCUSSION
Rat glia-derived PN-1 has an apparent molecular weight of 43 kDa (60), about 2 kDa higher
than that deduced form its cDNA sequence (i.e., 41.7 kDa) (19), assigned to glycosylation reactions.
Scanning of rat PN-1 amino acid sequence for possible N-glycosylation sites identifies Asn364 as a
likely candidate, in the loop region connecting strand 358-364 and strand 369-376 in the B8 sheet.
Notably, natural PN-1 was sensitive to periodic acid staining (60) and treatment of glioma cells with
tunicamycin, a well known inhibitor of glycosylation in eukaryots, resulted in a decrease of about 3
kDa in the apparent molecular weight of PN-1 isolated from these cells (44). Being a glycoprotein,
PN-1 has been expressed using several eukaryotic systems, including yeast (44), chinese hamster
ovary cells (43), and baculovirus (44). In all cases, the recombinant PN-1 proteins were found to be
functionally identical to the natural species (40). Nevertheless, the exceedingly low levels of
expression and the poor yields of purification of rPN-1 from cell cultures were sufficient only for
conducting functional studies whilst impairing structural investigation, for which larger amounts of
protein are required. More recently, during studies aimed at identifying in rat seminal vesicles the
protein responsible of the inhibition of prostasin, an invasion suppressor in prostate cancer cells, rat
PN-1 was also expressed in E. coli (61).
The aim of our study was to develop an expression system suitable for producing large amounts
of pure and biologically active rPN-1 to be used in crystallization studies aimed at elucidating the
threedimesional structure of this physiologically important serpin at the atomic level. Hence, we
explored the possibility of expressing the protein in an inducible manner either in an eukaryotic
expression system, using the HeLa Tet-Off cells, and in a simple prokaryotic system like E. coli.
Notably, in the former case we observed a tight doxycycline-regulated synthesis and secretion of
PN-1, as demonstrated by immunocychemical and protein analysis of HeLa Tet-off cells transfected
with pTRE-Kozak-PN-1 plasmid (Figg. 8 and 9). Notwithstanding, this system still suffered of poor
expression yields. At variance, high-level expression of either His-Tagged fusion protein and
mature form was obtained in E. coli under control of the T7 RNA polymerase promoter. The
purified His-tagged PN-1 was used to obtain an anti-PN-1 antiserum that specifically recognized the
endogenous protein expressed in rat oligodendrocytes, as previously shown (21).
Hence, we decided to express mature rPN-1 on a larger scale in E. coli cell cultures. After
solubilization of inclusion bodies and in vitro refolding, the mature rPN-1 was purified to
homogeneity by heparin-sepharose affinity chromatography, allowing us to recover about 3 mg of
highly homogenous protein per liter of bacterial culture, as demonstrated by the appearance of a
single, immunoreactive band in reducing SDS-electrophoresis (Fig. 1 A, B) and of a single, sharp
2.Protease Nexin-1
62
peak eluting from a C4 RP-HPLC column (Fig. 1C). Notably, the molecular mass of rPN-1 agrees
well with the theoretical value of the mature rat PN-1 (Inset to Fig. 1C). Finally, a pI value of 9.7
was determined for rPN-1 by 2D-gel electrophoresis (Fig. 1D), consistent with the theoretical value
deduced form the amino acid composition of rat PN-1 (i.e., pI 9.72). The protein was stable when
kept at -20° C as eluted from the heparin-sepharose column and no significant loss of activity was
observed even for samples stored for six months.
The amount of purified rPN-1 obtained in this work was at least 10-50 fold higher than that
attainable with eukaryotic systems (44) and this allowed us to carry out for the first time a detailed
conformational characterization of rPN-1 in solution by means of steady state fluorescence
spectroscopy and circular dichroism in the far- and near-UV region (Fig. 3). These spectroscopic
data compared favourably with those obtained with other serpins, such as AT-III (46) and PAI-1
(47), and validated the theoretical model of PN-1 structure reported in Fig. 2. Next, the native-like
structure of rPN-1 and the resulting biochemical properties were probed with respect to the ability
of the recombinant protein to (1) bind heparin, (2) form a SDS-stable complex with thrombin, and
(3) inhibit thrombin amidolytic activity in the absence and presence of heparin.
The data shown in Fig. 4 demonstrate that rPN-1 binds heparin tightly and in a normal manner,
with a 1:1 serpin-cofactor stoichiometric ratio. As already observed with AT-III (32, 46), heparin
binding remarkably enhances the fluorescence intensity of rPN-1, without changing the λmax value.
These data are unprecedented and compatible with a rigidification of the chemical environment of
some Trp-residues (e.g., Trp174) nearby the heparin-binding site (49). However, further studies are
required to clarify whether this conformational change simply reflects a structural adaptation of PN-
1 in response to cofactor binding or, alternatively, if it plays an effective role in promoting PN-1
binding to the target proteases, according to the allosteric activation mechanism previously
highlighted for AT-III function (32).
Although PN-1 exhibits broad protease inhibitory specificity, α-thrombin has been recognized
as its primary physiological target (7, 8). With respect to this, the formation of a SDS-stable
complex with thrombin (see Fig. 5), occurring with a 1:1 stoichiometry, is a clear-cut proof of the
native-like structure of our recombinant PN-1 (9). In fact, upon complex formation both the serpin
and protease undergo massive conformational changes (51) involving the formation of a tetrahedral
covalent intermediate between the Ser195 Oγ of the enzyme and the carbonyl carbon of the amino
acid at P1 position of the scissible P1-P1' bond in the reactive centre loop (RCL) of the inhibitor. In
a second step, the Ser195-acyl-intermediate is formed while the peptide bond between P1 ad P1' has
been broken (6, 54). Once formed, the serpin-protease complex rapidly adopts its lowest energy
conformation through the incorporation of the N-terminal portion of the RCL into -sheet A and
2.Protease Nexin-1
63
translocation of the tethered protease for the top to the bottom of the serpin, with a resulting
distortion of the protease conformation (51). At this stage, deacylation of the acyl-enzyme trapped
intermediate, to form the active protease and the cleaved serpin, is prevented largely by destruction
of the oxyanion hole in the protease (51). For these complex and concerted reactions to occur, it is
necessary that strict stereochemical and dynamical requirements are fulfilled in both serpin and
protease structure. Therefore, the quantitative formation of a stable thrombin-rPN-1 complex (Fig.
5) can be taken as a signature of the native-like conformation of recombinant PN-1 expressed in E.
coli.
Similar conclusions can be drawn from thrombin inhibition experiments yielding a value of
1.1±0.1 x 10⁶ M-1·s-1 for the association rate constant, ka, of thrombin-rPN-1 interaction (Fig. 6A).
Strikingly, this value agrees well with those reported earlier for natural (39), and recombinant PN-1
expressed in different systems (40, 43). In the presence of unfractionated porcine heparin (Fig. 6B,
C), the ka value increases by about three orders of magnitude (k1° = 0.45±0.02 x 10⁹ M-1·cm-1) at
the optimal heparin concentration ((H)opt ~ 60 nM). These values are fully consistent with those
reported for natural PN-1 (39) and suggest that the rate of association of thrombin and PN-1 in the
presence of heparin is essentially at the diffusion-controlled limit.
Finally, the cellular effects of rPN-1 were investigated by measuring the ability of the
recombinant serpin to promote neurite outgrowth in neuroblastoma NB2A cells. The results shown
in Fig. 7 provide evidence that recombinant PN-1 has neurite promoting activity in NB2A cells
similar to that of natural PN-1 (4), and that this effect is mediated by inhibition of thrombin
amidolytic activity, in agreement with previous studies showing that PN-1 can block or reverse the
cellular effects of thrombin by inhibiting its proteolytic activity, thus preventing proteolytic
activation of thrombin receptor(s) on neuronal cells (14, 57).
Altogether, our results demonstrate that E. coli is a suitable expression system for obtaining
milligram quantities of pure and fully active recombinnat PN-1 to be used in future structural and
functional studies.
REFERENCES
1. Eaton DL, Baker JB (1983) Phorbol ester and mitogens stimulate human fibroblast secretions of
plasmin-activatable plasminogen activator and protease nexin, and antiactivator/antiplasmin. J.
Cell Biol. 97:323–328.
2.Protease Nexin-1
64
2. Guttridge DC, Lau A, Tran L, Cunningham DD (1997) Thrombin causes a marked delay in
skeletal myogenesis that correlates with the delayed expression of myogenin and
p21CIP1/WAF1. J. Biol. Chem. 272:24117–24120.
3. Bouton MC, Richard B, Rossignol P, Philippe M, Guillin MC, Michel JB, Jandrot-Perrus M
(2003) The serpin protease-nexin 1 is present in rat aortic smooth muscle cells and is
upregulated in L-NAME hypertensive rats. Arterioscler. Thromb. Vasc. Biol. 23:142–147.
4. Hoffmann MC, Nitsch C, Scotti AL, Reinhard E, Monard D (1992) The prolonged presence of
glia-derived nexin, an endogenous protease inhibitor, in the hippocampus after ischemia-
induced delayed neuronal death. Neuroscience. 49:397–408.
5. Reinhard E, Suidan HS, Pavlik A, Monard D (1994) Glia-derived nexin/protease nexin-1 is
expressed by a subset of neurons in the rat brain. J. Neurosci. Res. 37:256–270.
6. Silverman GA, Bird PI, Carrell RW, Church FC, Coughlin PB, Gettins PG, Irving JA, Lomas
DA, Luke CJ, Moyer RW, Pemberton PA, Remold-O'Donnell E, Salvesen GS, Travis J,
Whisstock JC (2001) The serpins are an expanding superfamily of structurally similar but
functionally diverse proteins. Evolution, mechanism of inhibition, novel functions, and a revised
nomenclature. J. Biol. Chem. 276:33293–33296.
7. Baker JB, Low DA, Simmer RL, Cunningham DD (1980) Protease-nexin: a cellular component
that links thrombin and plasminogen activator and mediates their binding to cells.Cell 21:37–45.
8. Crisp RJ, Knauer DJ, Knauer MF (2000) Roles of the heparin and low density lipid receptor-
related protein-binding sites of protease nexin 1 (PN1) in urokinase-PN1 complex catabolism.
The PN1 heparin-binding site mediates complex retention and degradation but not cell surface
binding or internalization. J. Biol. Chem. 275:19628–19637.
9. Le Bonniec BF, Guinto ER, Stone SR (1995) Identification of thrombin residues that modulate
its interactions with antithrombin III and alpha 1-antitrypsin. Biochemistry 34:12241–12248.
10. Lawrence DA, Olson ST, Muhammad S, Day DE, Kvassman JO, Ginsburg D, Shore JD (2000)
Partitioning of serpin–proteinase reactions between stable inhibition and substrate cleavage is
regulated by the rate of serpin reactive center loop insertion into beta-sheet A. J. Biol. Chem.
275:5839–5844.
11. Mansuy IM, van der Putten H, Schmid P, Meins M, Botteri FM, Monard D (1993) Variable and
multiple expression of Protease Nexin-1 during mouse organogenesis and nervous system
development. Development 119:1119–1134.
12. Giau R, Carrette J, Bockaert J, Homburger V (2005) Constitutive secretion of protease nexin-1
by glial cells and its regulation by G-protein-coupled receptors. J. Neurosci. 25:8995–9004.
2.Protease Nexin-1
65
13. Beilin O, Karussis DM, Korczyn AD, Gurwitz D, Aronovich R, Hantai D, Grigoriadis N,
Mizrachi-Kol R, Chapman J Increased thrombin inhibition in experimental autoimmune
encephalomyelitis. J. Neurosci. Res. 79:351–359.
14. Cavanaugh KP, Gurwitz D, Cunningham DD (1990) Bradshaw RA Reciprocal modulation of
astrocyte stellation by thrombin and protease nexin-1. J. Neurochem. 54:1735–1743.
15. Nitsch C, Scotti AL, Monard D, Heim C, Sontag KH (1993) The glia-derived protease nexin 1
persists for over 1 year in rat brain areas selectively lesioned by transient global ischaemia. Eur.
J. Neurosci. 5:292–297.
16. Cunningham DD, Pulliam L, Vaughan PJ (1993) Protease nexin-1 and thrombin: injuryrelated
processes in the brain. Thromb. Haemost. 70:168–171.
17. Onuma Y, Asashima M, Whitman M (2006) A Serpin family gene, protease nexin-1 has an
activity distinct from protease inhibition in early Xenopus embryos. Mech. Dev. 123:463–471.
18. Grimaldi M, Arcone R, Ciliberto G, Schettini G (1995) Synergistic stimulation of interleukin 6
release and gene expression by phorbol esters and interleukin 1 beta in rat cortical astrocytes:
role of protein kinase C activation and blockade. J. Neurochem. 64:1945–1953.
19. Sommer J, Gloor SM, Rovelli GF, Hofsteenge J, Nick H, Meier R, Monard D (1987) cDNA
sequence coding for a rat glia-derived nexin and its homology to members of the serpin
superfamily. Biochemistry 26:6407–6410.
20. Sanger F, Nicklen S, Coulson AR (1977) DNA sequencing with chain-terminating inhibitors.
Proc. Natl. Acad. Sci. U. S. A. 74:5463–5467.
21. Blasi F, Ciarrocchi A, Luddi A, Strazza M, Riccio M, Santi S, Arcone R, Pietropaolo C,
D'Angelo R, Costantino-Ceccarini E, Melli M (2002) Stage-specific gene expression in early
differentiating oligodendrocytes. Glia 39:114–123.
22. Studier FW, Rosenberg AH, Dunn JJ, Dubendorff JW (1990) Use of T7 RNA polymerase to
direct expression of cloned genes. Methods Enzymol. 185:60–89.
23. Kozak M (1987) At least six nucleotides preceding the AUG initiator codon enhance translation
in mammalian cells. J. Mol. Biol. 196:947–950.
24. Arcone R, Pucci P, Zappacosta F, Fontane V, Malori A, Marino G, Ciliberto G (1991) Single-
step purification and structural characterization of human interleukin-6 produced in Escherichia
coli from a T7 RNA polymerase expression vector. Eur. J. Biochem. 198:541–547.
25. Bradford MM (1976) A rapid and sensitive method for the quantitation of microgram quantities
of protein utilizing the principle of protein-dye binding. Anal. Biochem. 72:248–254.
26. Laemmli UK (1970) Cleavage of structural proteins during the assembly of the head of
bacteriophage T4. Nature 227:680–685.
2.Protease Nexin-1
66
27. Jungblut PR, Seifert R (1990) Analysis by high-resolution two-dimensional electrophoresis of
differentiation-dependent alterations in cytosolic protein pattern of HL-60 leukemic cells. J.
Biochem. Biophys. Methods 21:47–58.
28. Heukeshoven J, Dernick R (1985) Simplified method for silver staining of proteins in
polyacrylamide gels and the mechanism of silver staining. Electrophoresis 6:103–112.
29. Gill SC, von Hippel PH (1989) Calculation of protein extinction coefficients from amino acid
sequence data. Anal. Biochem. 182:319–326.
30. Fenton JW 2nd, Fasco M, Stackrow AB (1977) Human thrombins: production, evaluation, and
properties of α-thrombin. J. Biol. Chem. 252:3587–3598.
31. Dang QD, Di Cera E (1994) A simple activity assay for thrombin and hirudin. J. Protein. Chem.
13:367–373.
32. Olson ST, Björk I, Shore JD (1993) Kinetic characterization of heparin-catalyzed and
uncatalyzed inhibition of blood coagulation proteinases by antithrombin. Methods Enzymol.
222:525–559.
33. Stout TJ, Graham H, Buckley DI, Matthews DJ (2000) Structures of active and latent PAI-1: a
possible stabilizing role for chloride ions. Biochemistry 39:8460–8469.
34. Kopp J, Schwede T. The SWISS-MODEL repository of annotated threedimensional protein
structure homology models. Nucleic Acids Res. 32:D230–234.
35. Gerstein M (1992) A resolution-sensitive procedure for comparing protein surface and its
application to the comparison of antigen-combining sites. Acta Cryst. A48:271–276.
36. Thompson JD, Higgins DG, Gibson TJ (1994) CLUSTALW: improving the sensitivity of
progressive multiple sequence alignment through sequence weighting, positionspecific gap
penalties and weight matrix choice. Nucleic Acids Res. 22:4673–4680.
37. Lottenberg R, Jackson CM (1983) Solution composition dependent variation in extinction
coefficients for p-nitroaniline. Biochim. Biophys. Acta 742:558–564.
38. Stone SR, Nick H, Hofsteenge J, Monard D (1987) Glial-derived neurite-promoting factor is a
slow-binding inhibitor of trypsin, thrombin, and urokinase. Arch. Biochem. Biophys. 252:237–
244.
39. Wallace A, Rovelli G, Hofsteenge J, Stone SR (1989) Effect of heparin on the gliaderived-
nexin–thrombin interaction. Biochem. J. 257:191–196.
40. Rovelli G, Stone SR, Guidolin A, Sommer J, Monard D (1992) Characterization of the heparin-
binding site of glia-derived nexin/protease nexin-1. Biochemistry 31:3542–3549.
41. Wells CM, Di Cera E (1992) Thrombin is a Na(+)-activated enzyme. Biochemistry 31:11721–
11730.
2.Protease Nexin-1
67
42. Tarnowski BI, Spinale FG, Nicholson JH (1991) DAPI as a useful stain for nuclear quantitation.
Biotech. Histochem. 66:297–302.
43. Evans DL, McGrogan M, Scott RW, Carrell RW (1991) Protease specificity and heparin
binding and activation of recombinant protease nexin I. J. Biol. Chem. 266:22307–22312.
44. Stone SR, Brown-Luedi ML, Rovelli G, Guidolin A, McGlynn E, Monard D (1994)
Localization of the heparin-binding site of glia-derived nexin/protease nexin-1 by site-directed
mutagenesis. Biochemistry 33:7731–7735.
45. Brahms S, Brahms J (1980) Determination of protein secondary structure in solution by vacuum
ultraviolet circular dichroism. J. Mol. Biol. 138:149–178.
46. Bruch M, Weiss V, Engel J (1988) Plasma serine proteinase inhibitors (serpins) exhibit major
conformational changes and a large increase in conformational stability upon cleavage at their
reactive sites. J. Biol. Chem. 263:16626–16630.
47. Dwivedi AM, Woodeshick RW, Walton HL, Reilly TM (1991) A spectroscopic study of the
conformations of active and latent forms of recombinant plasminogen activator inhibitor-1.
Biochem. Biophys. Res. Commun. 175:437–443.
48. Strickland EH (1974) Aromatic contributions to circular dichroism spectra of proteins. CRC
Crit. Rev. Biochem. 2:113–175.
49. Lakowicz JR (1986) Fluorescence studies of structural fluctuations in macromolecules as
observed by fluorescence spectroscopy in the time, lifetime, and frequency domains. Methods
Enzymol. 131:518–567.
50. Zhou A, Carrell RW, Huntington JA (2001) The serpin inhibitory mechanism is critically
dependent on the length of the reactive center loop. J. Biol. Chem. 276:27541–27547.
51. Huntington JA, Read RJ, Carrell RW (2000) Structure of a serpin–protease complex shows
inhibition by deformation. Nature 407:923–926.
52. Stavridi ES, O'Malley K, Lukacs CM, Moore WT, Lambris JD, Christianson DW, Rubin H,
Cooperman BS (1996) Structural change in alpha-chymotrypsin induced by complexation with
alpha 1-antichymotrypsin as seen by enhanced sensitivity to proteolysis. Biochemistry
35:10608–10615.
53. Arcone R, Pagliuca MG, Chinali A, Grimaldi M, Schettini G, Gast A, Pietropaolo C (1999)
Thrombin mutants with altered enzymatic activity have an impaired mitogenic effect on mouse
fibroblasts and are inefficient modulators of stellation of rat cortical astrocytes. Biochim.
Biophys. Acta 1451:173–186.
2.Protease Nexin-1
68
54. Lawrence DA, Ginsburg D, Day DE, Berkenpas MB, Verhamme IM, Kvassman JO, Shore JD
(1995) Serpin–protease complexes are trapped as stable acylenzyme intermediates. J. Biol.
Chem. 270:25309–25312.
55. Olson ST (1988) Transient kinetics of heparin-catalyzed protease inactivation by antithrombin
III. Linkage of protease-inhibitor–heparin interactions in the reaction with thrombin. J. Biol.
Chem. 263:1698–1708.
56. Turgeon VL, Houenou LJ (1997) The role of thrombin-like (serine) proteases in the
development, plasticity and pathology of the nervous system. Brain Res. Brain Res. Rev. 25:85–
95.
57. Cunningham DD (1992) Regulation of neuronal cells and astrocytes by protease nexin-1 and
thrombin, Ann. N.Y. Acad. Sci. 674:228–236.
58. Klann E, Shelton KR (1990) A lead-associated nuclear protein which increases in maturing
brain and in differentiating neuroblastoma 2A cells exposed to cyclic AMP-elevating agents.
Brain Res. Dev. Brain Res. 57:71–75.
59. Gossen M, Bujard H (1992) Tight control of gene expression in mammalian cells by
tetracycline-responsive promoters. Proc.Natl.Acad. Sci.U. S. A. 89:5547–5551.
60. Guenther J, Nick H, Monard D (1985) A glia-derived neurite-promoting factor with protease
inhibitory activity. EMBO J. 4:1963–1966.
61. Chen LM, Zhang X, Chai KX (2004) Regulation of prostasin expression and function in the
prostate. Prostate 59:1–12.

3. PYTHON SEBAE SERUM

3.Python sebae serum
71
CHAPTER 3 A novel protein from the serum of Python sebae, structurally homologous to γ-phospholipase A2 inhibitor, displays antitumor activity
Sandra Donninia, Simona Franceseb, Gloriano Monetic, Guido Mastrobuonic, Fabio Masetd, Roberta Frassond, Michele Palmieria, Mario Pazzaglie, Enrico Garacif, Vincenzo De Filippisd and Marina Zichea aDepartment of Molecular Biology, Pharmacology Unit, University of Siena, Siena; bBiomedical Research Centre, Sheffield Hallam University, Sheffield, UK; cDepartment of Clinical and Preclinical Pharmacology, University of Florence, Florence; dDepartment of Pharmaceutical Sciences, University of Padua, Padua; eDepartment of Clinical Physiopathology, University of Florence, Florence; fDepartment of Experimental Medicine and Biochemical Sciences, University of Rome “TorVergata”, Rome.
INTRODUCTION
Snake venoms are complex mixtures of pharmacologically active proteins, including proteases
and secretory phospholipases (PLA2) (1). The latter enzyme family can be distinguished in two 12
groups (I-XII), according to their chain length and intramolecular disulfide-bond topology (2,3).
PLA2s catalyse the hydrolysis of the acyl-ester bond at the sn-2 position of 1,2-diacyl-sn-
phosphoglycerides, leading to the formation lysophospholipids and free fatty acids which are the
precursors of proinflammatory eicosanoids (i.e, prostaglandins, thromboxanes, leukotrienes, and
lipoxins) (4). Thus, PLA2s play a key role in the inflammatory pathway and has been implicated in
numerous severe inflammatory diseases (5). Besides their pro-inflammatory function, PLA2s also
exhibit important physiological functions such as lipid digestion, cell migration and proliferation,
and antibacterial defence (5,6). Although the snake venom PLA2 enzymes differ in the type of
pharmacological effects they induce, toxicity is not directly related to PLA2 enzymatic activity,
thus suggesting the presence of a “toxic” site in the PLA2 structure distinct from the “catalytic” site
(7).
To protect themselves from leakage of their own venom PLA2s into the circulatory system,
venomous snakes contain in their blood PLA2s inhibitors (PLIs), classified into three groups
according to their structure (i.e., PLIα, PLIβ and PLIγ) (5,8). PLIs are acidic oligomeric
glycoproteins with N-linked oligosacchardide chains, composed of three to six identical or different
3.Python sebae serum
72
non-covalently linked subunits having a molecular weight of 20-30 kDa (9,10). PLIα is a trimer
composed of identical 20-kDa subunits, having a C-type lectin domain, and specifically inhibits
group-II acidic PLA2s. PLIβ selectively inhibits group-II basic PLS2s and has nine tandem leucine-
rich repeats in its sequence. Contrary to PLIα and PLIβ, PLIγ is a rather nonspecific inhibitor and
its primary structure is characterized by two tandem patterns of Cys-residues, as are found in
urokinase-type plasminogen activator receptor and in Ly6-related proteins (8,11,12). All three types
of PLIs have been found both in the sera of venomous snakes like Viperidae, whereas only PLIγ has
been identified in the sera of venomous Elapidae snakes (10). However, PLIs have also been
identified in the sera of nonvenomous snakes like Elaphe quadrivirgata (i.e., PLIα and PLIβ, PLIγ)
(13-15) and Python reticulatus (16). Thus, the presence of PLIs in nonvenomous snakes suggest that
their physiological role might not be restricted to the protection against the venom PLA2s and that
PLIs may axhibit other different, still unknown, functions.
In the present study, we explored the possibility of identifying in the serum of the nonvenomous
African Rock Python (Python sebae) PLIs possessing novel biological activities not directly related
to the inhibition of PLA2s. With this aim, samples of Python sebae serum, hereafter denoted as
PSS, were tested on several assays for cell toxicity and viability and on in vivo tumor growth. As a
control, similar experiments were carried out with serum samples from Python regius species,
denoted as PRS. Here we report data showing that PSS from P. sebae, species specifically,
produces cytotoxic and antiproliferative effects on tumor cells growing in vitro and reduces tumor
growth in nude mice transplanted with A431 cell line without side effects. To possibly identify the
chemical component(s) responsible for the cytotoxic and antitumor activity, PSS was fractionated
by ion-exchange chromatography (IEC), yielding an active protein fraction (i.e., F5). Notably, F5
reduced tumor cell viability by inducing apoptosis, with a mechanism involving activation of
caspase-3. Further analysis by size-exclusion (SEC) and reversed-phase (RP-HPLC)
chromatography, indicated F5 mainly exists in solution as a tetramer of about 90 kDa, formed by
two dimers, each composed of two non-covalently linked subunits (i.e., P1 and P2) of about 23
kDa. Of interest, isolated P1 and P2 lack cytotoxic and antitumor effects. Enzymatic peptide mass
fingerprint analysis and N-terminal Edman sequencing allowed us to establish that P1 and P2 differ
only by a few amino acids and that both proteins share high sequence homology with type-γ PLI
from P. reticulatus, PIP (16). Despite high sequence similarity, PIP is a homo-hexamer (16),
whereas F5 is a hetero-tetramer. More importantly, PIP is able to effectively inhibit the hydrolytic
activity of PLAs2, whereas the anti-PLA2 function of F5 is negligible. In conclusion, here we have
identified and thoroughly characterized a novel PLI-γ molecule possessing remarkable cytotoxic
and antitumor effects, that can be exploited for potential pharmacological applications.
3.Python sebae serum
73
MATERIALS AND METHODS
Python serum sampling. Serum from the African Rock Python specie (P. sebae, species sebae
sebae) was sampled from two females aged approximately three years. As a control, serum was also
sampled from two females of the P. regius specie, aged approximately three and four years. All
donor snakes were born in captivity. In animal starved for 24 h and sedated by gentle handling for 2
h, blood samples (average 10 ml) were withdrawn from the cardiac cavity by a 20 cc syringe with a
21G needle. After sedimentation and centrifugation at 3000 rpm at room temperature for 10 min,
the clear supernatant was removed and stored in aliquots at –20°C and used as such in the
experiments after proper dilution in culture media or PBS. In the experiments the serum was diluted
in culture medium deprived of FCS, and titration was performed by protein content quantified by
the Bradford assay. The P. sebae serum is identified all through the manuscript by the abbreviation
PSS, while P. regius serum is identified as PRS. Details about the complete procedure of sample
preparation are reported in the patent n. PCT/EP01/14727.
Functional assays
Cells and culture conditions. Human squamous epithelial carcinoma (A431), human glioblastoma
(U373 MG), human breast cancer (MCF-7) cell lines and human fibroblast (HF) cell line were from
the American Type Culture Collection (ATCC). The A431 and MCF-7 cell line were cultured in
DMEM with 4500 mg/L of glucose and 10% fetal calf serum (FCS). HF cell line was cultured in
DMEM with 1000 mg/L of glucose, 1% non essential aminoacids, 10% sodium pyruvate and 10%
FCS. U373 MG cell line was cultured in MEM with 1% non essential aminoacids, 10% sodium
pyruvate and 10% FCS. Mouse lung carcinoma cell line (LLC) was kindly provided by Dr. F. Pica
at the University of Tor Vergata, Rome, and were cultured in RPMI 1640 with 10% FCS. Capillary
venular endothelial cells (CVEC) were obtained and cultured as described (17).
Cell morphology. Cells (3 x10³/well) were plated in 96 microtiter plate in the presence of 10%
FCS, let to adhere for 5 h, and then treated with different concentrations of PSS in 10% FCS for 1h.
Cells (3 x10³/well) were plated in 96 microtiter plate in the presence of 10% FCS, let to adhere for 5
h, and then treated with different concentrations of PSS in 10% FCS for 1h. After supernatant
removal, cells were fixed with methanol at 4 °C for 18 h and stained with Diff Qick. Cell
morphology was evaluated by optical microscope Nikon Eclipse T400 at 200X magnification and
the images were recorded by Nikon CCD camera. Cell survival was reported as total cell number
counted/well.
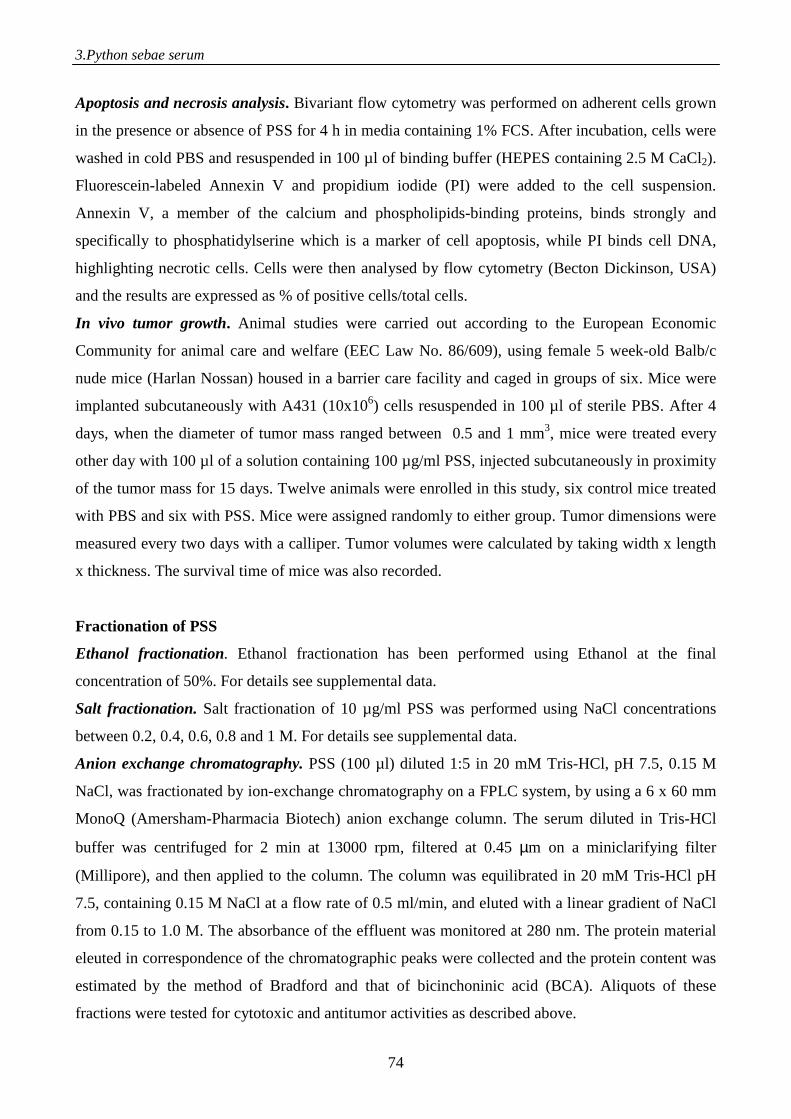
3.Python sebae serum
74
Apoptosis and necrosis analysis. Bivariant flow cytometry was performed on adherent cells grown
in the presence or absence of PSS for 4 h in media containing 1% FCS. After incubation, cells were
washed in cold PBS and resuspended in 100 µl of binding buffer (HEPES containing 2.5 M CaCl2).
Fluorescein-labeled Annexin V and propidium iodide (PI) were added to the cell suspension.
Annexin V, a member of the calcium and phospholipids-binding proteins, binds strongly and
specifically to phosphatidylserine which is a marker of cell apoptosis, while PI binds cell DNA,
highlighting necrotic cells. Cells were then analysed by flow cytometry (Becton Dickinson, USA)
and the results are expressed as % of positive cells/total cells.
In vivo tumor growth. Animal studies were carried out according to the European Economic
Community for animal care and welfare (EEC Law No. 86/609), using female 5 week-old Balb/c
nude mice (Harlan Nossan) housed in a barrier care facility and caged in groups of six. Mice were
implanted subcutaneously with A431 (10x106) cells resuspended in 100 µl of sterile PBS. After 4
days, when the diameter of tumor mass ranged between 0.5 and 1 mm3, mice were treated every
other day with 100 µl of a solution containing 100 µg/ml PSS, injected subcutaneously in proximity
of the tumor mass for 15 days. Twelve animals were enrolled in this study, six control mice treated
with PBS and six with PSS. Mice were assigned randomly to either group. Tumor dimensions were
measured every two days with a calliper. Tumor volumes were calculated by taking width x length
x thickness. The survival time of mice was also recorded.
Fractionation of PSS
Ethanol fractionation. Ethanol fractionation has been performed using Ethanol at the final
concentration of 50%. For details see supplemental data.
Salt fractionation. Salt fractionation of 10 µg/ml PSS was performed using NaCl concentrations
between 0.2, 0.4, 0.6, 0.8 and 1 M. For details see supplemental data.
Anion exchange chromatography. PSS (100 µl) diluted 1:5 in 20 mM Tris-HCl, pH 7.5, 0.15 M
NaCl, was fractionated by ion-exchange chromatography on a FPLC system, by using a 6 x 60 mm
MonoQ (Amersham-Pharmacia Biotech) anion exchange column. The serum diluted in Tris-HCl
buffer was centrifuged for 2 min at 13000 rpm, filtered at 0.45 µm on a miniclarifying filter
(Millipore), and then applied to the column. The column was equilibrated in 20 mM Tris-HCl pH
7.5, containing 0.15 M NaCl at a flow rate of 0.5 ml/min, and eluted with a linear gradient of NaCl
from 0.15 to 1.0 M. The absorbance of the effluent was monitored at 280 nm. The protein material
eleuted in correspondence of the chromatographic peaks were collected and the protein content was
estimated by the method of Bradford and that of bicinchoninic acid (BCA). Aliquots of these
fractions were tested for cytotoxic and antitumor activities as described above.
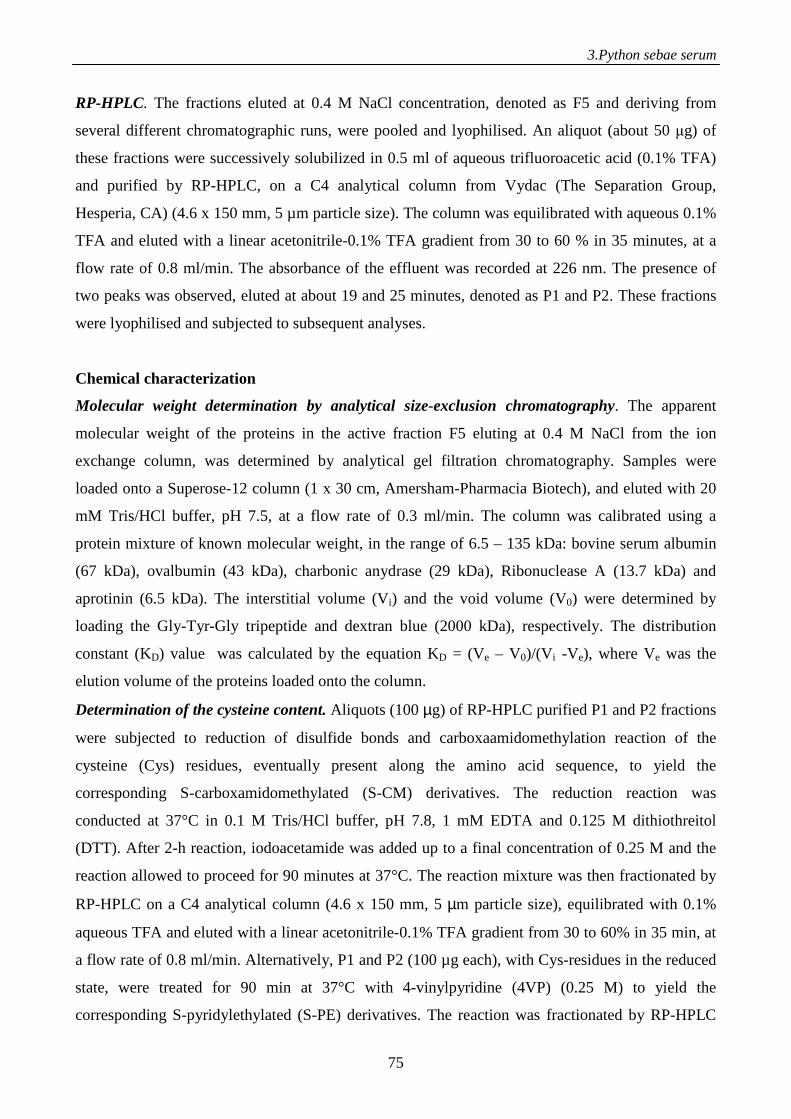
3.Python sebae serum
75
RP-HPLC. The fractions eluted at 0.4 M NaCl concentration, denoted as F5 and deriving from
several different chromatographic runs, were pooled and lyophilised. An aliquot (about 50 µg) of
these fractions were successively solubilized in 0.5 ml of aqueous trifluoroacetic acid (0.1% TFA)
and purified by RP-HPLC, on a C4 analytical column from Vydac (The Separation Group,
Hesperia, CA) (4.6 x 150 mm, 5 µm particle size). The column was equilibrated with aqueous 0.1%
TFA and eluted with a linear acetonitrile-0.1% TFA gradient from 30 to 60 % in 35 minutes, at a
flow rate of 0.8 ml/min. The absorbance of the effluent was recorded at 226 nm. The presence of
two peaks was observed, eluted at about 19 and 25 minutes, denoted as P1 and P2. These fractions
were lyophilised and subjected to subsequent analyses.
Chemical characterization
Molecular weight determination by analytical size-exclusion chromatography. The apparent
molecular weight of the proteins in the active fraction F5 eluting at 0.4 M NaCl from the ion
exchange column, was determined by analytical gel filtration chromatography. Samples were
loaded onto a Superose-12 column (1 x 30 cm, Amersham-Pharmacia Biotech), and eluted with 20
mM Tris/HCl buffer, pH 7.5, at a flow rate of 0.3 ml/min. The column was calibrated using a
protein mixture of known molecular weight, in the range of 6.5 – 135 kDa: bovine serum albumin
(67 kDa), ovalbumin (43 kDa), charbonic anydrase (29 kDa), Ribonuclease A (13.7 kDa) and
aprotinin (6.5 kDa). The interstitial volume (Vi) and the void volume (V0) were determined by
loading the Gly-Tyr-Gly tripeptide and dextran blue (2000 kDa), respectively. The distribution
constant (KD) value was calculated by the equation KD = (Ve – V0)/(V i -Ve), where Ve was the
elution volume of the proteins loaded onto the column.
Determination of the cysteine content. Aliquots (100 µg) of RP-HPLC purified P1 and P2 fractions
were subjected to reduction of disulfide bonds and carboxaamidomethylation reaction of the
cysteine (Cys) residues, eventually present along the amino acid sequence, to yield the
corresponding S-carboxamidomethylated (S-CM) derivatives. The reduction reaction was
conducted at 37°C in 0.1 M Tris/HCl buffer, pH 7.8, 1 mM EDTA and 0.125 M dithiothreitol
(DTT). After 2-h reaction, iodoacetamide was added up to a final concentration of 0.25 M and the
reaction allowed to proceed for 90 minutes at 37°C. The reaction mixture was then fractionated by
RP-HPLC on a C4 analytical column (4.6 x 150 mm, 5 µm particle size), equilibrated with 0.1%
aqueous TFA and eluted with a linear acetonitrile-0.1% TFA gradient from 30 to 60% in 35 min, at
a flow rate of 0.8 ml/min. Alternatively, P1 and P2 (100 µg each), with Cys-residues in the reduced
state, were treated for 90 min at 37°C with 4-vinylpyridine (4VP) (0.25 M) to yield the
corresponding S-pyridylethylated (S-PE) derivatives. The reaction was fractionated by RP-HPLC
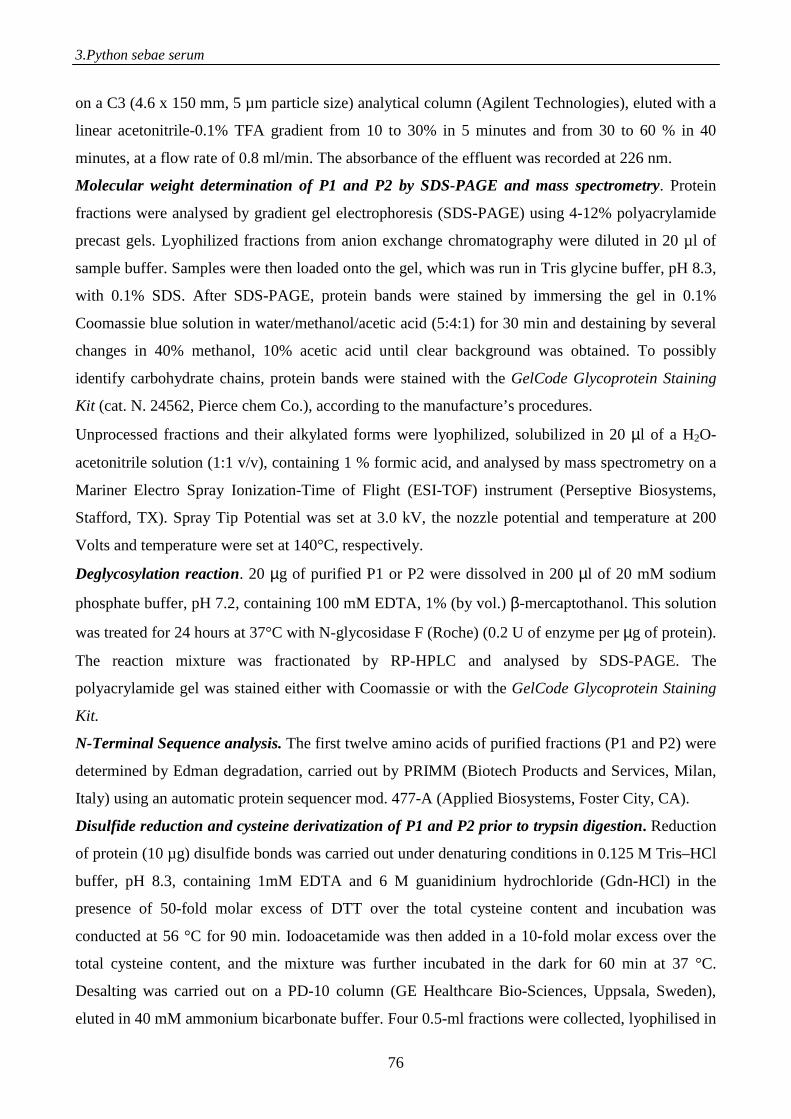
3.Python sebae serum
76
on a C3 (4.6 x 150 mm, 5 µm particle size) analytical column (Agilent Technologies), eluted with a
linear acetonitrile-0.1% TFA gradient from 10 to 30% in 5 minutes and from 30 to 60 % in 40
minutes, at a flow rate of 0.8 ml/min. The absorbance of the effluent was recorded at 226 nm.
Molecular weight determination of P1 and P2 by SDS-PAGE and mass spectrometry. Protein
fractions were analysed by gradient gel electrophoresis (SDS-PAGE) using 4-12% polyacrylamide
precast gels. Lyophilized fractions from anion exchange chromatography were diluted in 20 µl of
sample buffer. Samples were then loaded onto the gel, which was run in Tris glycine buffer, pH 8.3,
with 0.1% SDS. After SDS-PAGE, protein bands were stained by immersing the gel in 0.1%
Coomassie blue solution in water/methanol/acetic acid (5:4:1) for 30 min and destaining by several
changes in 40% methanol, 10% acetic acid until clear background was obtained. To possibly
identify carbohydrate chains, protein bands were stained with the GelCode Glycoprotein Staining
Kit (cat. N. 24562, Pierce chem Co.), according to the manufacture’s procedures.
Unprocessed fractions and their alkylated forms were lyophilized, solubilized in 20 µl of a H2O-
acetonitrile solution (1:1 v/v), containing 1 % formic acid, and analysed by mass spectrometry on a
Mariner Electro Spray Ionization-Time of Flight (ESI-TOF) instrument (Perseptive Biosystems,
Stafford, TX). Spray Tip Potential was set at 3.0 kV, the nozzle potential and temperature at 200
Volts and temperature were set at 140°C, respectively.
Deglycosylation reaction. 20 µg of purified P1 or P2 were dissolved in 200 µl of 20 mM sodium
phosphate buffer, pH 7.2, containing 100 mM EDTA, 1% (by vol.) β-mercaptothanol. This solution
was treated for 24 hours at 37°C with N-glycosidase F (Roche) (0.2 U of enzyme per µg of protein).
The reaction mixture was fractionated by RP-HPLC and analysed by SDS-PAGE. The
polyacrylamide gel was stained either with Coomassie or with the GelCode Glycoprotein Staining
Kit.
N-Terminal Sequence analysis. The first twelve amino acids of purified fractions (P1 and P2) were
determined by Edman degradation, carried out by PRIMM (Biotech Products and Services, Milan,
Italy) using an automatic protein sequencer mod. 477-A (Applied Biosystems, Foster City, CA).
Disulfide reduction and cysteine derivatization of P1 and P2 prior to trypsin digestion. Reduction
of protein (10 µg) disulfide bonds was carried out under denaturing conditions in 0.125 M Tris–HCl
buffer, pH 8.3, containing 1mM EDTA and 6 M guanidinium hydrochloride (Gdn-HCl) in the
presence of 50-fold molar excess of DTT over the total cysteine content and incubation was
conducted at 56 °C for 90 min. Iodoacetamide was then added in a 10-fold molar excess over the
total cysteine content, and the mixture was further incubated in the dark for 60 min at 37 °C.
Desalting was carried out on a PD-10 column (GE Healthcare Bio-Sciences, Uppsala, Sweden),
eluted in 40 mM ammonium bicarbonate buffer. Four 0.5-ml fractions were collected, lyophilised in
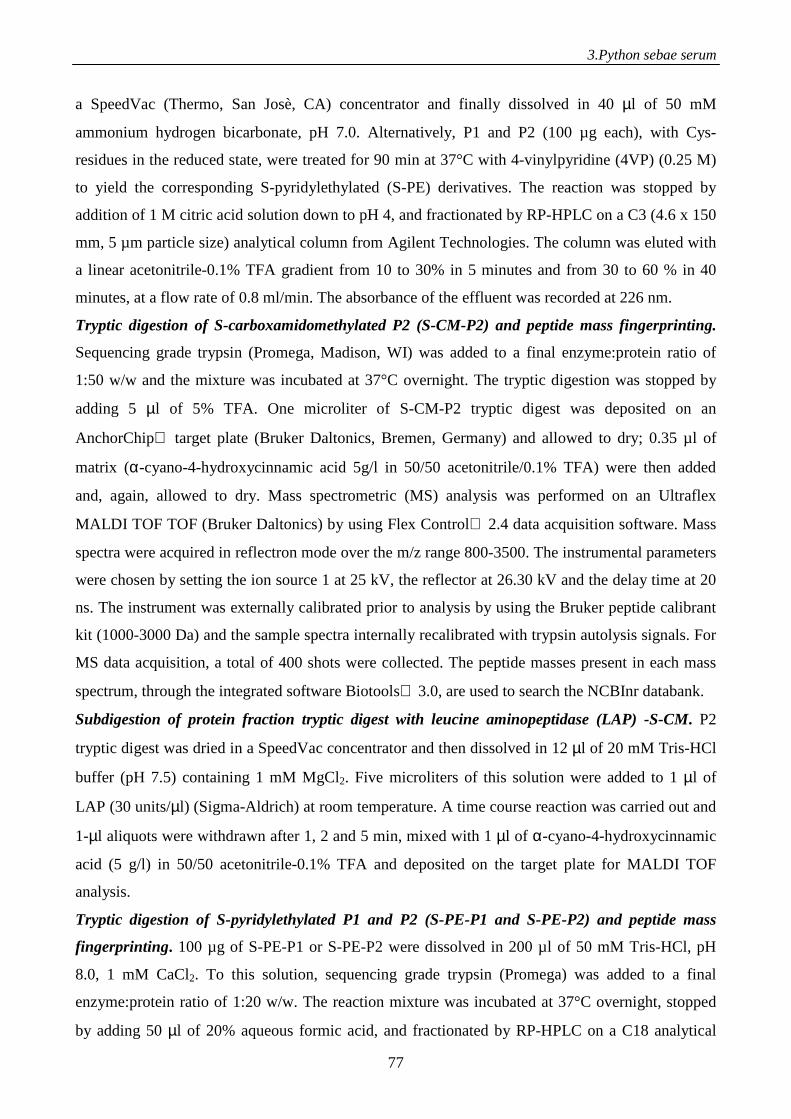
3.Python sebae serum
77
a SpeedVac (Thermo, San Josè, CA) concentrator and finally dissolved in 40 µl of 50 mM
ammonium hydrogen bicarbonate, pH 7.0. Alternatively, P1 and P2 (100 µg each), with Cys-
residues in the reduced state, were treated for 90 min at 37°C with 4-vinylpyridine (4VP) (0.25 M)
to yield the corresponding S-pyridylethylated (S-PE) derivatives. The reaction was stopped by
addition of 1 M citric acid solution down to pH 4, and fractionated by RP-HPLC on a C3 (4.6 x 150
mm, 5 µm particle size) analytical column from Agilent Technologies. The column was eluted with
a linear acetonitrile-0.1% TFA gradient from 10 to 30% in 5 minutes and from 30 to 60 % in 40
minutes, at a flow rate of 0.8 ml/min. The absorbance of the effluent was recorded at 226 nm.
Tryptic digestion of S-carboxamidomethylated P2 (S-CM-P2) and peptide mass fingerprinting.
Sequencing grade trypsin (Promega, Madison, WI) was added to a final enzyme:protein ratio of
1:50 w/w and the mixture was incubated at 37°C overnight. The tryptic digestion was stopped by
adding 5 µl of 5% TFA. One microliter of S-CM-P2 tryptic digest was deposited on an
AnchorChip target plate (Bruker Daltonics, Bremen, Germany) and allowed to dry; 0.35 µl of
matrix (α-cyano-4-hydroxycinnamic acid 5g/l in 50/50 acetonitrile/0.1% TFA) were then added
and, again, allowed to dry. Mass spectrometric (MS) analysis was performed on an Ultraflex
MALDI TOF TOF (Bruker Daltonics) by using Flex Control 2.4 data acquisition software. Mass
spectra were acquired in reflectron mode over the m/z range 800-3500. The instrumental parameters
were chosen by setting the ion source 1 at 25 kV, the reflector at 26.30 kV and the delay time at 20
ns. The instrument was externally calibrated prior to analysis by using the Bruker peptide calibrant
kit (1000-3000 Da) and the sample spectra internally recalibrated with trypsin autolysis signals. For
MS data acquisition, a total of 400 shots were collected. The peptide masses present in each mass
spectrum, through the integrated software Biotools 3.0, are used to search the NCBInr databank.
Subdigestion of protein fraction tryptic digest with leucine aminopeptidase (LAP) -S-CM. P2
tryptic digest was dried in a SpeedVac concentrator and then dissolved in 12 µl of 20 mM Tris-HCl
buffer (pH 7.5) containing 1 mM MgCl2. Five microliters of this solution were added to 1 µl of
LAP (30 units/µl) (Sigma-Aldrich) at room temperature. A time course reaction was carried out and
1-µl aliquots were withdrawn after 1, 2 and 5 min, mixed with 1 µl of α-cyano-4-hydroxycinnamic
acid (5 g/l) in 50/50 acetonitrile-0.1% TFA and deposited on the target plate for MALDI TOF
analysis.
Tryptic digestion of S-pyridylethylated P1 and P2 (S-PE-P1 and S-PE-P2) and peptide mass
fingerprinting. 100 µg of S-PE-P1 or S-PE-P2 were dissolved in 200 µl of 50 mM Tris-HCl, pH
8.0, 1 mM CaCl2. To this solution, sequencing grade trypsin (Promega) was added to a final
enzyme:protein ratio of 1:20 w/w. The reaction mixture was incubated at 37°C overnight, stopped
by adding 50 µl of 20% aqueous formic acid, and fractionated by RP-HPLC on a C18 analytical
3.Python sebae serum
78
column (Agilent Technologies) eluted at a flow rate of 0.8 ml/min with a linear acetonitrile-0.1%
TFA gradient from 5 to 50 % in 40 minutes. The absorbance of the effluent was recorded at 226
nm. Peptide material eluted in correspondence of the chromatographic peaks were collected,
lyophilised, and dissolved in 1%-aqueous formic acid for subsequent mass spectrometry analysis.
Cys-containing fragments were identified by spectrophotometric analysis of S-pyridylethylated
cysteine in the near-UV region (350-240 nm), using a model Lambda 2 Perkin-Elmer (Norwalk,
CA) UV-Vis spectrophotometer.
Subdigestion of S-pyridylethylated P1 and P2, after tryptic digestion, with Glu-C endoproteinase
V8. The peptide materials eluted in correspondence of selected peaks, that remained unidentified in
the tryptic RP-HPLC fingerprint analysis, were lyophilised, dissolved in 100 µl of sodium
phosphate buffer, pH 7.8, and treated at 37°C for 2 hours with Glu-C endoproteinase V8 from S.
aureus, using a peptide:protease ratio of 1:50 by weight. The reaction was stopped by acid addition
and analysed by RP-HPLC on a C18 (4.6 x 150 mm) column eluted with a linear acetonitrile-0.1%
TFA gradient from 2 to 60% in 10 minutes.
Digestion of S-pyridylethylated P1 and P2 (S-PE-P1 and S-PE-P2) with Glu-C endoproteinase
V8 and peptide mass fingerprinting. 100 µg of S-PE-P1 or S-PE-P2 were dissolved in 200 µl of
sodium phosphate buffer, pH 7.8. To this solution, Glu-C endoproteinase V8 (Boheringher) was
added to a final enzyme:protein ratio of 1:20 w/w. The reaction mixture was incubated at 37°C
overnight, stopped by adding 50 µl of 20% aqueous formic acid, and fractionated by RP-HPLC. The
chromatographic peaks were lyophilised, dissolved in 1% aqueous formic acid and analysed by
ESI-TOF mass spectrometry. Prior to mass analysis, all chromatographic fractions were scanned by
UV-Vis absorption spectroscopy for identifying S-pyridylethylated Cys-residues.
Data analysis and protein identification. We used Mascot as a search tool (Matrix Science Ltd.,
London, UK) available on line (http://www.matrixscience.com) to perform the peptide mass
fingerprinting data. Mascot probability score is assigned by computing the probability (P) that the
observed match between the experimental data and mass values calculated from a candidate peptide
sequence is a random event. The correct match, which is not a random event, has a very low
probability. Mascot score is calculated as -10Log10(P). By using NCBInr as protein databank to
search against, Mascot significance threshold is 64. Trypsin autolysis mass signals were excluded
from the protein searching. The taxonomy was set on Chordata; S-carbamidomethylation or S-
pyridylethylation was selected as complete modification; two missed cleavages were allowed for
trypsin chosen as cleaving agent. Searches were performed with a tolerance of 40 ppm. MALDI MS
MS spectra of the peptide signals at m/z 1564.76 and 1485.84 were acquired as well by using
LIFT technology (Bruker Daltonics).
3.Python sebae serum
79
Spectroscopic measurements. Protein concentration was determined by the method of
bicinconinic acid for both P1 and P2 recording the absorbance of the solution at 562 nm on a double
beam model Lambda-2 spectrophotometer from Perkin-Elmer (Norwalk, CT). Circular dichroism
(CD) spectra were recorded on a Jasco (Tokyo, japan) model J-810 spectropolarimeter equipped
with a thermostated cell-holder connected to a NesLab (Newington, NH) model RTE-111 water-
circulating bath. Far-UV CD spectra were recorded at 20±0.5°C in 10 mM sodium phosphate pH
7.0, using a 1-mm pathlength quartz cell.
Immunochemical assays
Western Blotting. Cells (3 x 10⁵) were seeded in 60 mm diameter dishes. After adherence, cells
were serum starved (0.1% serum, 24 h) and then stimulated with F5 or F1 (5 ug/ml) in 1% FCS.
Cells were then lysed and centrifuged at 10000 g (20 min at 4°C). 30 µg of proteins were mixed
with 4X reducing SDS-PAGE sample buffer and denatured (10 min at 100°C). Anti-cleaved-
caspase-3 antibody was used (1:1000, Santa Cruz). Results were normalized with actin (1:10000).
Immunohistochemical analysis. CVEC, A431 or U373MG cells (2.5x10⁴ cells/well on glass cover-
slips placed into 24 multiwell plates) were incubated in 0.1% FCS with F5 (50 µg/ml), or F1 (50
µg/mL) or Colchicin (25 µM). After 24 h cells were fixed and incubated overnight at 4°C with
monoclonal antibodies against phosphatydilserine (for A431) or α-tubulin (for CVEC, A431 and
U373MG) diluted 1:200 in PBS/0.5% BSA. Samples were then incubated with secondary
antibodies FITC or TRITC conjugated (Sigma, Italy). Markers were assessed by fluorescence
microscope (Eclipse TE300, Nikon) at 40X magnification and images taken by a digital camera.
Phospholipase A2 activity assay. The secretory PLA2 (sPLA2) activity was measured by using the
sPLA2 Assay Kit (Cayman). Briefly, 106 A431 cells/100 mm dishes were plated in 10% FCS for 24
h and then the conditioned medium was collected, concentrated by Amicon Concentrator columns
(cut off 3 kDa) and tested for secretory Phospholipase A2 (PLA2) activity in the presence or
absence of F5 or F1 following manufactures raccomandations.
The inhibitory activity of PSS or its fractions was assayed by the sPLA2 (type V) Inhibitor
Screening Assay kit (Cayman). Briefly, different concentrations of PSS or its cytotoxic fractions
were added to the plate containing the sPLA2 and the inhibitory activity evaluated as absorbance at
405 nm after 1 minute using a plate reader. Data are reported as % inhibition for each sample versus
sPLA2 activity.
3.Python sebae serum
80
Statistics. Results are expressed as means ± SD. Statistical analysis were performed using Student’s
t-test. Differences between groups were considered statistically significant at p<0.05.
RESULTS
PSS induces cytotoxicity in tumor and non tumor cell lines
Cytotoxicity was evaluated in cell suspension as well as on adherent cells. Exposure to PSS in
the 25-1000 µg/ml range, induced concentration-dependent cytotoxicity in human tumor cell lines
(A431 and U373MG, ED50 = 62.5 µg/ml; MCF-7, ED50 = 100 µg/ml ), in mouse tumor cell line
(LLC, ED50 = 75 µg/ml) and in the non-tumor cell lines bovine endothelial cells (CVEC, ED50 =
115 µg/ml) and human skin fibroblasts (HF, ED50 = 125 µg/ml). (Table 1A and B, Supplemental
data). To investigate the species specificity of PSS activity we assessed the effect of the serum
obtained from two specimens of P. regius, PRS1 and PRS2, and from another specimen of the
African Rock Python, PSS2. Similar results were obtained with PSS2, while PRS1 and PRS2 failed
to induce cytotoxic effects (Table 2S).
PSS reduces cell viability
Microscope observation of cells stained with Diff Quick after 1 h exposure to PSS (100 µg/ml)
showed that the cytotoxicity was mainly characterized by retraction of cytoplasmic expansion,
leading to round shaped cells and lysis of cell bodies when compared to basal condition (1% FCS
without PSS) (Fig S1). Then, the PSS effects on cell viability were investigated using the MTT
assay. Cells were exposed to PSS for 5 days at concentrations selected as the least toxic, based on
previous results. Exposure to repeated PSS treatment (every 2 days for 5 days) in the low
concentration range (10-50 µg/ml), evidenced that PSS at 10 µg/ml had no relevant effect on cell
viability for any cell line. However, at higher concentrations, PSS significantly and concentration-
dependently reduced cell viability (Fig. 1).
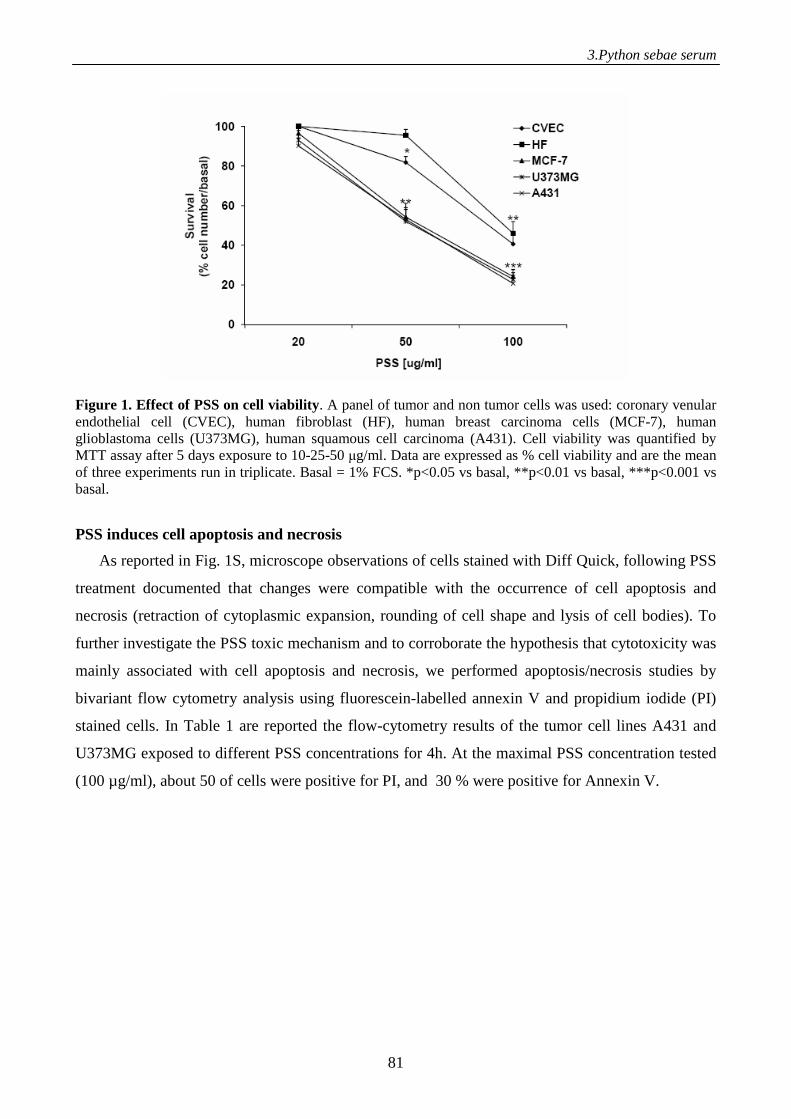
3.Python sebae serum
81
Figure 1. Effect of PSS on cell viability. A panel of tumor and non tumor cells was used: coronary venular endothelial cell (CVEC), human fibroblast (HF), human breast carcinoma cells (MCF-7), human glioblastoma cells (U373MG), human squamous cell carcinoma (A431). Cell viability was quantified by MTT assay after 5 days exposure to 10-25-50 µg/ml. Data are expressed as % cell viability and are the mean of three experiments run in triplicate. Basal = 1% FCS. *p<0.05 vs basal, **p<0.01 vs basal, ***p<0.001 vs basal.
PSS induces cell apoptosis and necrosis
As reported in Fig. 1S, microscope observations of cells stained with Diff Quick, following PSS
treatment documented that changes were compatible with the occurrence of cell apoptosis and
necrosis (retraction of cytoplasmic expansion, rounding of cell shape and lysis of cell bodies). To
further investigate the PSS toxic mechanism and to corroborate the hypothesis that cytotoxicity was
mainly associated with cell apoptosis and necrosis, we performed apoptosis/necrosis studies by
bivariant flow cytometry analysis using fluorescein-labelled annexin V and propidium iodide (PI)
stained cells. In Table 1 are reported the flow-cytometry results of the tumor cell lines A431 and
U373MG exposed to different PSS concentrations for 4h. At the maximal PSS concentration tested
(100 µg/ml), about 50 of cells were positive for PI, and 30 % were positive for Annexin V.
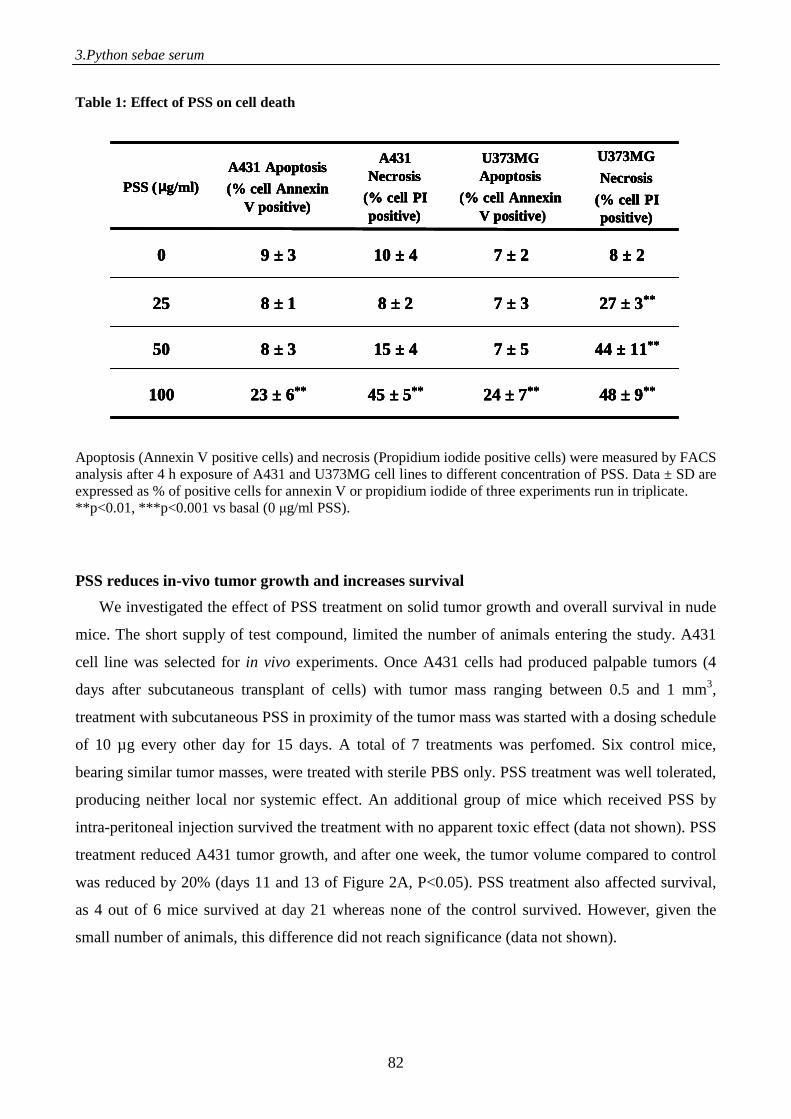
3.Python sebae serum
82
Table 1: Effect of PSS on cell death
Apoptosis (Annexin V positive cells) and necrosis (Propidium iodide positive cells) were measured by FACS analysis after 4 h exposure of A431 and U373MG cell lines to different concentration of PSS. Data ± SD are expressed as % of positive cells for annexin V or propidium iodide of three experiments run in triplicate. **p<0.01, ***p<0.001 vs basal (0 µg/ml PSS).
PSS reduces in-vivo tumor growth and increases survival
We investigated the effect of PSS treatment on solid tumor growth and overall survival in nude
mice. The short supply of test compound, limited the number of animals entering the study. A431
cell line was selected for in vivo experiments. Once A431 cells had produced palpable tumors (4
days after subcutaneous transplant of cells) with tumor mass ranging between 0.5 and 1 mm3,
treatment with subcutaneous PSS in proximity of the tumor mass was started with a dosing schedule
of 10 µg every other day for 15 days. A total of 7 treatments was perfomed. Six control mice,
bearing similar tumor masses, were treated with sterile PBS only. PSS treatment was well tolerated,
producing neither local nor systemic effect. An additional group of mice which received PSS by
intra-peritoneal injection survived the treatment with no apparent toxic effect (data not shown). PSS
treatment reduced A431 tumor growth, and after one week, the tumor volume compared to control
was reduced by 20% (days 11 and 13 of Figure 2A, P<0.05). PSS treatment also affected survival,
as 4 out of 6 mice survived at day 21 whereas none of the control survived. However, given the
small number of animals, this difference did not reach significance (data not shown).
48 ± 9**24 ± 7**45 ± 5**23 ± 6**100
44 ± 11**7 ± 515 ± 48 ± 350
27 ± 3**7 ± 38 ± 28 ± 125
8 ± 27 ± 210 ± 49 ± 30
U373MG
Necrosis
(% cell PI positive)
U373MG Apoptosis
(% cell AnnexinV positive
A431 Necrosis
(% cell PI positive)
A431 Apoptosis
(% cell AnnexinV positive)
PSS (µµµµg/ml)
48 ± 9**24 ± 7**45 ± 5**23 ± 6**100
44 ± 11**7 ± 515 ± 48 ± 350
27 ± 3**7 ± 38 ± 28 ± 125
8 ± 27 ± 210 ± 49 ± 30
U373MG
Necrosis
(% cell PI positive)
U373MG Apoptosis
(% cell AnnexinV positive)
A431 Necrosis
(% cell PI positive)
A431 Apoptosis
(% cell AnnexinV positive)
PSS (µµµµg/ml)
48 ± 9**24 ± 7**45 ± 5**23 ± 6**100
44 ± 11**7 ± 515 ± 48 ± 350
27 ± 3**7 ± 38 ± 28 ± 125
8 ± 27 ± 210 ± 49 ± 30
U373MG
Necrosis
(% cell PI positive)
U373MG Apoptosis
(% cell AnnexinV positive
A431 Necrosis
(% cell PI positive)
A431 Apoptosis
(% cell AnnexinV positive)
PSS (µµµµg/ml)
48 ± 9**24 ± 7**45 ± 5**23 ± 6**100
44 ± 11**7 ± 515 ± 48 ± 350
27 ± 3**7 ± 38 ± 28 ± 125
8 ± 27 ± 210 ± 49 ± 30
U373MG
Necrosis
(% cell PI positive)
U373MG Apoptosis
(% cell AnnexinV positive)
A431 Necrosis
(% cell PI positive)
A431 Apoptosis
(% cell AnnexinV positive)
PSS (µµµµg/ml)
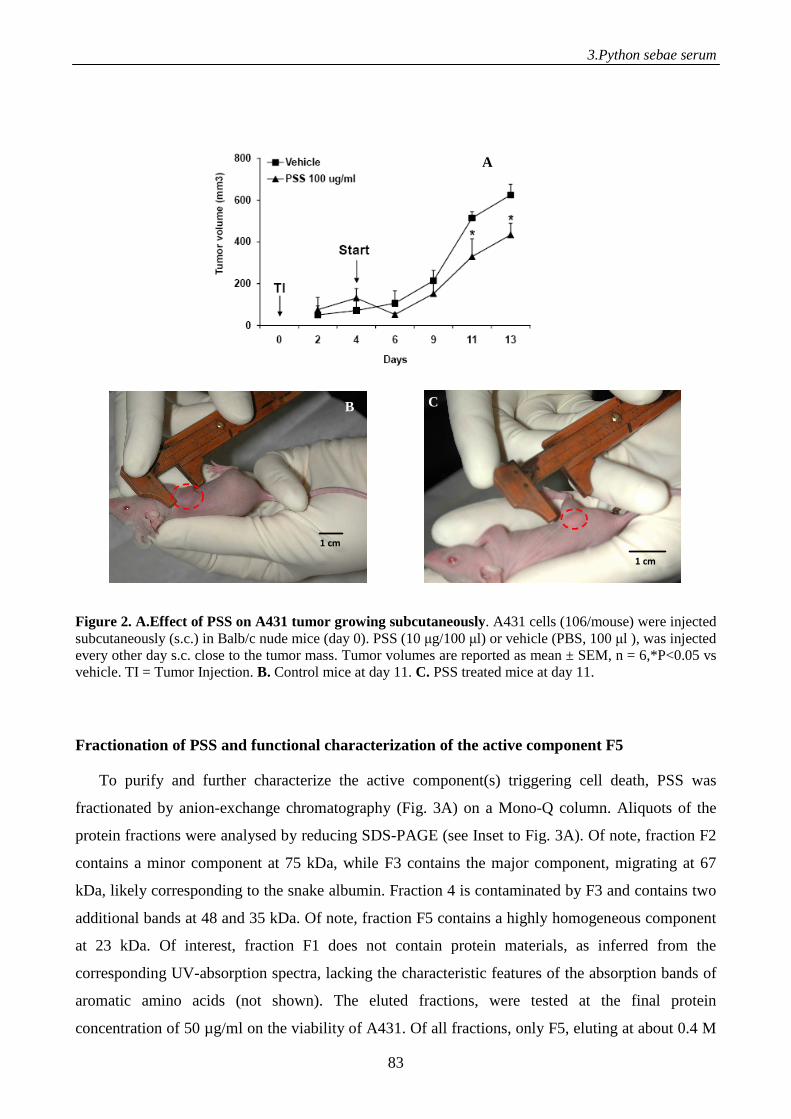
3.Python sebae serum
83
Figure 2. A.Effect of PSS on A431 tumor growing subcutaneously. A431 cells (106/mouse) were injected subcutaneously (s.c.) in Balb/c nude mice (day 0). PSS (10 µg/100 µl) or vehicle (PBS, 100 µl ), was injected every other day s.c. close to the tumor mass. Tumor volumes are reported as mean ± SEM, n = 6,*P<0.05 vs vehicle. TI = Tumor Injection. B. Control mice at day 11. C. PSS treated mice at day 11.
Fractionation of PSS and functional characterization of the active component F5
To purify and further characterize the active component(s) triggering cell death, PSS was
fractionated by anion-exchange chromatography (Fig. 3A) on a Mono-Q column. Aliquots of the
protein fractions were analysed by reducing SDS-PAGE (see Inset to Fig. 3A). Of note, fraction F2
contains a minor component at 75 kDa, while F3 contains the major component, migrating at 67
kDa, likely corresponding to the snake albumin. Fraction 4 is contaminated by F3 and contains two
additional bands at 48 and 35 kDa. Of note, fraction F5 contains a highly homogeneous component
at 23 kDa. Of interest, fraction F1 does not contain protein materials, as inferred from the
corresponding UV-absorption spectra, lacking the characteristic features of the absorption bands of
aromatic amino acids (not shown). The eluted fractions, were tested at the final protein
concentration of 50 µg/ml on the viability of A431. Of all fractions, only F5, eluting at about 0.4 M
1 cm1 cm
B
1 cm1 cm
B
1 cm1 cm
C
1 cm1 cm
C
AA
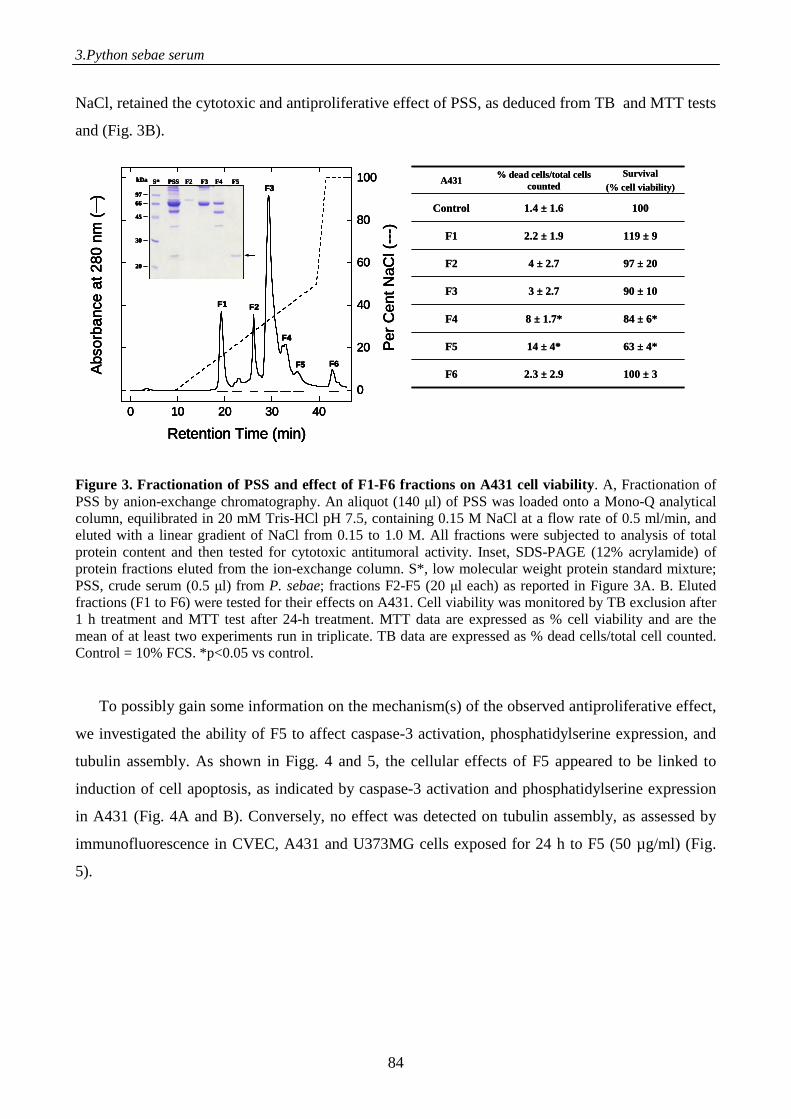
3.Python sebae serum
84
NaCl, retained the cytotoxic and antiproliferative effect of PSS, as deduced from TB and MTT tests
and (Fig. 3B).
Figure 3. Fractionation of PSS and effect of F1-F6 fractions on A431 cell viability. A, Fractionation of PSS by anion-exchange chromatography. An aliquot (140 µl) of PSS was loaded onto a Mono-Q analytical column, equilibrated in 20 mM Tris-HCl pH 7.5, containing 0.15 M NaCl at a flow rate of 0.5 ml/min, and eluted with a linear gradient of NaCl from 0.15 to 1.0 M. All fractions were subjected to analysis of total protein content and then tested for cytotoxic antitumoral activity. Inset, SDS-PAGE (12% acrylamide) of protein fractions eluted from the ion-exchange column. S*, low molecular weight protein standard mixture; PSS, crude serum (0.5 µl) from P. sebae; fractions F2-F5 (20 µl each) as reported in Figure 3A. B. Eluted fractions (F1 to F6) were tested for their effects on A431. Cell viability was monitored by TB exclusion after 1 h treatment and MTT test after 24-h treatment. MTT data are expressed as % cell viability and are the mean of at least two experiments run in triplicate. TB data are expressed as % dead cells/total cell counted. Control = 10% FCS. *p<0.05 vs control.
To possibly gain some information on the mechanism(s) of the observed antiproliferative effect,
we investigated the ability of F5 to affect caspase-3 activation, phosphatidylserine expression, and
tubulin assembly. As shown in Figg. 4 and 5, the cellular effects of F5 appeared to be linked to
induction of cell apoptosis, as indicated by caspase-3 activation and phosphatidylserine expression
in A431 (Fig. 4A and B). Conversely, no effect was detected on tubulin assembly, as assessed by
immunofluorescence in CVEC, A431 and U373MG cells exposed for 24 h to F5 (50 µg/ml) (Fig.
5).
0 10 20 30 40
0
20
40
60
80
100
Per
Cen
t NaC
l (--
-)
Abs
orba
nce
at 2
80 n
m (
)
Retention Time (min)
F1 F2
F3
F4
F5 F6
0 10 20 30 40
0
20
40
60
80
100
Per
Cen
t NaC
l (--
-)
Abs
orba
nce
at 2
80 n
m (
)
Retention Time (min)
F1 F2
F3
F4
F5 F6
9766
45
30
kDa S* PSS F2 F3 F4 F5
20
9766
45
30
kDa S* PSS F2 F3 F4 F5
20
0 10 20 30 40
0
20
40
60
80
100
Per
Cen
t NaC
l (--
-)
Abs
orba
nce
at 2
80 n
m (
)
Retention Time (min)
F1 F2
F3
F4
F5 F6
0 10 20 30 40
0
20
40
60
80
100
Per
Cen
t NaC
l (--
-)
Abs
orba
nce
at 2
80 n
m (
)
Retention Time (min)
F1 F2
F3
F4
F5 F6
9766
45
30
kDa S* PSS F2 F3 F4 F5
20
9766
45
30
kDa S* PSS F2 F3 F4 F5
20
100 ± 32.3 ± 2.9F6
63 ± 4*14 ± 4*F5
84 ± 6*8 ± 1.7* F4
90 ± 103 ± 2.7F3
97 ± 204 ± 2.7F2
119 ± 92.2 ± 1.9F1
1001.4 ± 1.6Control
Survival(% cell viability)
% dead cells/total cellscounted
A431
100 ± 32.3 ± 2.9F6
63 ± 4*14 ± 4*F5
84 ± 6*8 ± 1.7* F4
90 ± 103 ± 2.7F3
97 ± 204 ± 2.7F2
119 ± 92.2 ± 1.9F1
1001.4 ± 1.6Control
Survival(% cell viability)
% dead cells/total cellscounted
A431
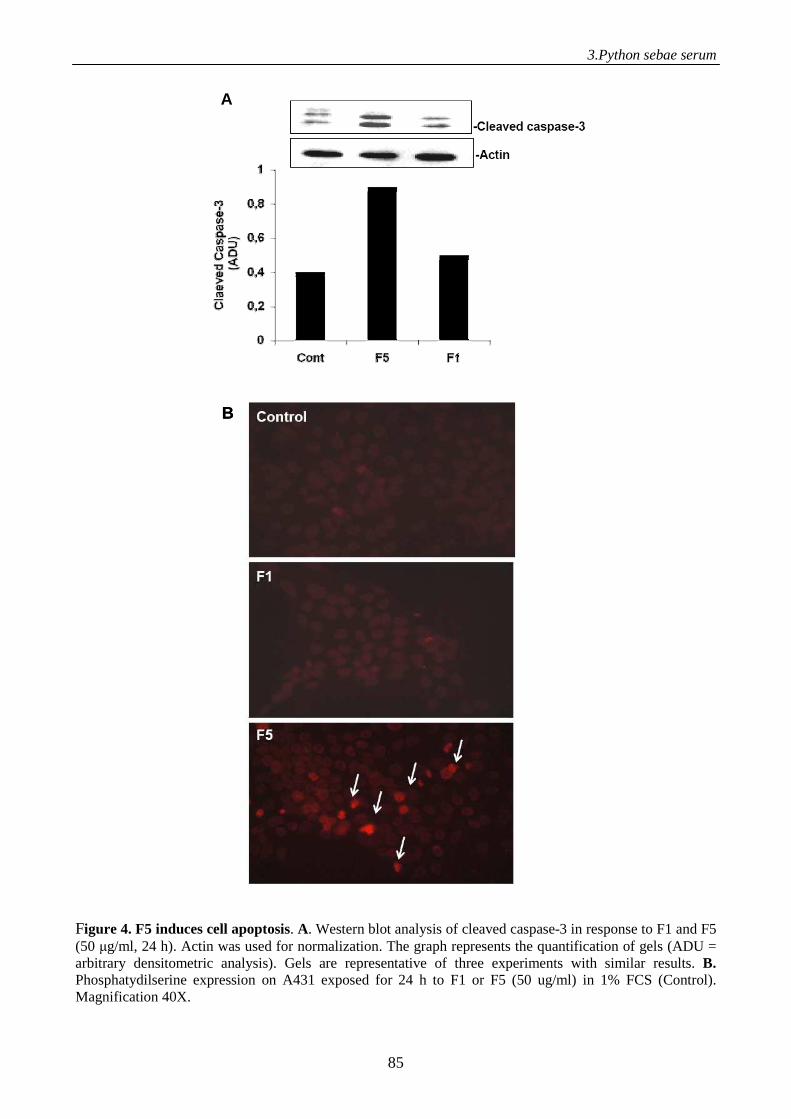
3.Python sebae serum
85
Figure 4. F5 induces cell apoptosis. A. Western blot analysis of cleaved caspase-3 in response to F1 and F5 (50 µg/ml, 24 h). Actin was used for normalization. The graph represents the quantification of gels (ADU = arbitrary densitometric analysis). Gels are representative of three experiments with similar results. B. Phosphatydilserine expression on A431 exposed for 24 h to F1 or F5 (50 ug/ml) in 1% FCS (Control). Magnification 40X.
AA
BB
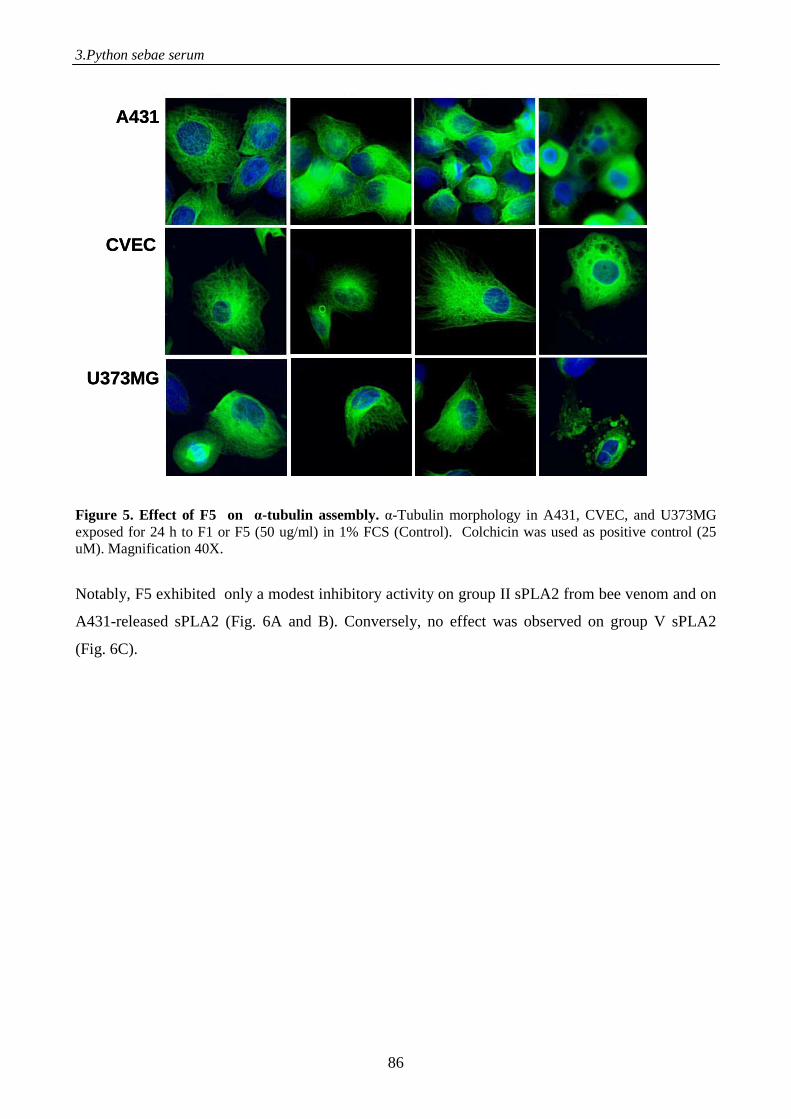
3.Python sebae serum
86
Figure 5. Effect of F5 on α-tubulin assembly. α-Tubulin morphology in A431, CVEC, and U373MG exposed for 24 h to F1 or F5 (50 ug/ml) in 1% FCS (Control). Colchicin was used as positive control (25 uM). Magnification 40X.
Notably, F5 exhibited only a modest inhibitory activity on group II sPLA2 from bee venom and on
A431-released sPLA2 (Fig. 6A and B). Conversely, no effect was observed on group V sPLA2
(Fig. 6C).
A431
CVEC
U373MG
A431
CVEC
U373MG
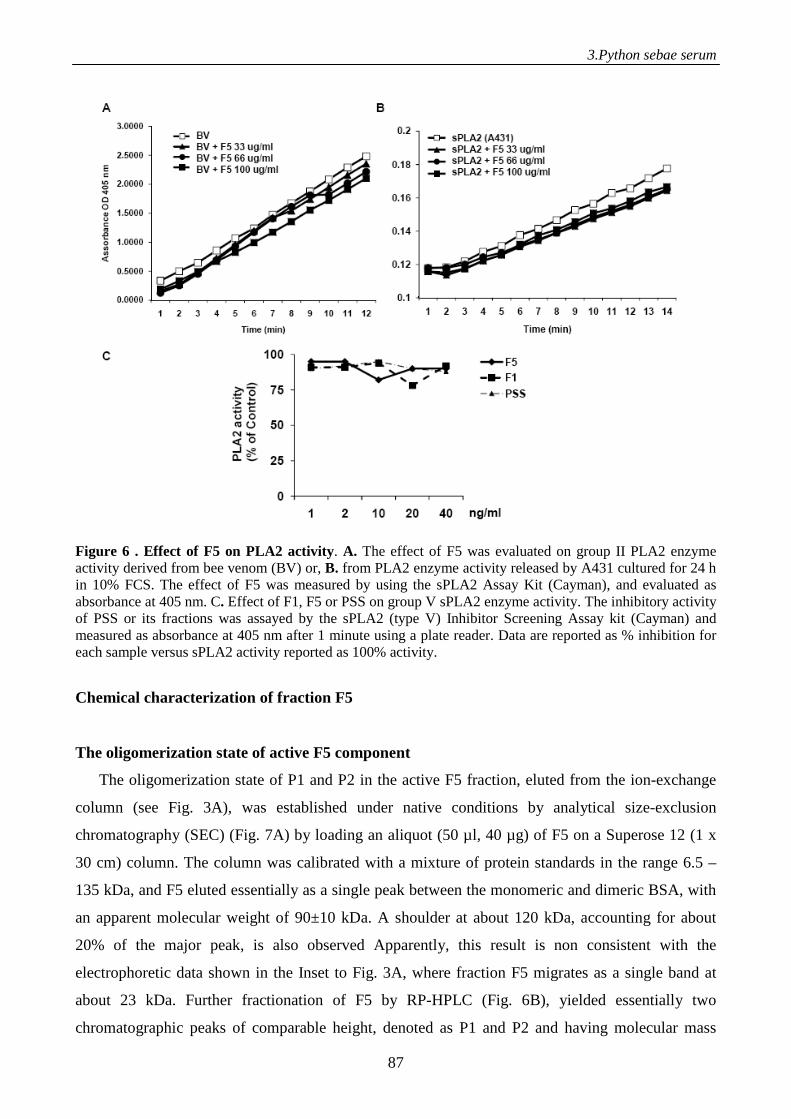
3.Python sebae serum
87
Figure 6 . Effect of F5 on PLA2 activity. A. The effect of F5 was evaluated on group II PLA2 enzyme activity derived from bee venom (BV) or, B. from PLA2 enzyme activity released by A431 cultured for 24 h in 10% FCS. The effect of F5 was measured by using the sPLA2 Assay Kit (Cayman), and evaluated as absorbance at 405 nm. C. Effect of F1, F5 or PSS on group V sPLA2 enzyme activity. The inhibitory activity of PSS or its fractions was assayed by the sPLA2 (type V) Inhibitor Screening Assay kit (Cayman) and measured as absorbance at 405 nm after 1 minute using a plate reader. Data are reported as % inhibition for each sample versus sPLA2 activity reported as 100% activity.
Chemical characterization of fraction F5
The oligomerization state of active F5 component
The oligomerization state of P1 and P2 in the active F5 fraction, eluted from the ion-exchange
column (see Fig. 3A), was established under native conditions by analytical size-exclusion
chromatography (SEC) (Fig. 7A) by loading an aliquot (50 µl, 40 µg) of F5 on a Superose 12 (1 x
30 cm) column. The column was calibrated with a mixture of protein standards in the range 6.5 –
135 kDa, and F5 eluted essentially as a single peak between the monomeric and dimeric BSA, with
an apparent molecular weight of 90±10 kDa. A shoulder at about 120 kDa, accounting for about
20% of the major peak, is also observed Apparently, this result is non consistent with the
electrophoretic data shown in the Inset to Fig. 3A, where fraction F5 migrates as a single band at
about 23 kDa. Further fractionation of F5 by RP-HPLC (Fig. 6B), yielded essentially two
chromatographic peaks of comparable height, denoted as P1 and P2 and having molecular mass
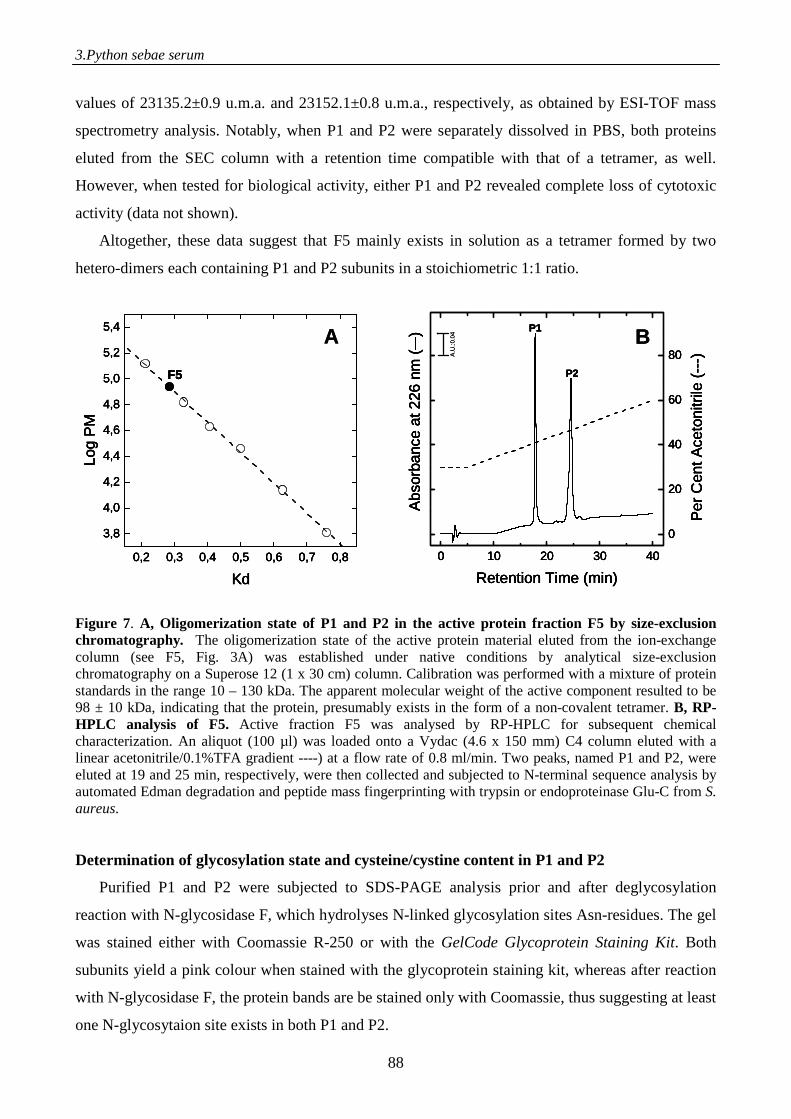
3.Python sebae serum
88
values of 23135.2±0.9 u.m.a. and 23152.1±0.8 u.m.a., respectively, as obtained by ESI-TOF mass
spectrometry analysis. Notably, when P1 and P2 were separately dissolved in PBS, both proteins
eluted from the SEC column with a retention time compatible with that of a tetramer, as well.
However, when tested for biological activity, either P1 and P2 revealed complete loss of cytotoxic
activity (data not shown).
Altogether, these data suggest that F5 mainly exists in solution as a tetramer formed by two
hetero-dimers each containing P1 and P2 subunits in a stoichiometric 1:1 ratio.
Figure 7. A, Oligomerization state of P1 and P2 in the active protein fraction F5 by size-exclusion chromatography. The oligomerization state of the active protein material eluted from the ion-exchange column (see F5, Fig. 3A) was established under native conditions by analytical size-exclusion chromatography on a Superose 12 (1 x 30 cm) column. Calibration was performed with a mixture of protein standards in the range 10 – 130 kDa. The apparent molecular weight of the active component resulted to be 98 ± 10 kDa, indicating that the protein, presumably exists in the form of a non-covalent tetramer. B, RP-HPLC analysis of F5. Active fraction F5 was analysed by RP-HPLC for subsequent chemical characterization. An aliquot (100 µl) was loaded onto a Vydac (4.6 x 150 mm) C4 column eluted with a linear acetonitrile/0.1%TFA gradient ----) at a flow rate of 0.8 ml/min. Two peaks, named P1 and P2, were eluted at 19 and 25 min, respectively, were then collected and subjected to N-terminal sequence analysis by automated Edman degradation and peptide mass fingerprinting with trypsin or endoproteinase Glu-C from S. aureus. Determination of glycosylation state and cysteine/cystine content in P1 and P2
Purified P1 and P2 were subjected to SDS-PAGE analysis prior and after deglycosylation
reaction with N-glycosidase F, which hydrolyses N-linked glycosylation sites Asn-residues. The gel
was stained either with Coomassie R-250 or with the GelCode Glycoprotein Staining Kit. Both
subunits yield a pink colour when stained with the glycoprotein staining kit, whereas after reaction
with N-glycosidase F, the protein bands are be stained only with Coomassie, thus suggesting at least
one N-glycosytaion site exists in both P1 and P2.
0,2 0,3 0,4 0,5 0,6 0,7 0,8
3,8
4,0
4,2
4,4
4,6
4,8
5,0
5,2
5,4
Log
PM
Kd
F5
0,2 0,3 0,4 0,5 0,6 0,7 0,8
3,8
4,0
4,2
4,4
4,6
4,8
5,0
5,2
5,4
Log
PM
Kd
F5
0 10 20 30 40
0
20
40
60
80
Per
Cen
t Ace
toni
trile
(--
-)
Abs
orba
nce
at 2
26 n
m (
)
Retention Time (min)
A.U
.:0.0
4A.
U.:0
.04
A.U
.:0.0
4 P1
P2
0 10 20 30 40
0
20
40
60
80
Per
Cen
t Ace
toni
trile
(--
-)
Abs
orba
nce
at 2
26 n
m (
)
Retention Time (min)
A.U
.:0.0
4A.
U.:0
.04
A.U
.:0.0
4A.
U.:0
.04
A.U
.:0.0
4A.
U.:0
.04
A.U
.:0.0
4 P1
P2
A B
0,2 0,3 0,4 0,5 0,6 0,7 0,8
3,8
4,0
4,2
4,4
4,6
4,8
5,0
5,2
5,4
Log
PM
Kd
F5
0,2 0,3 0,4 0,5 0,6 0,7 0,8
3,8
4,0
4,2
4,4
4,6
4,8
5,0
5,2
5,4
Log
PM
Kd
F5
0 10 20 30 40
0
20
40
60
80
Per
Cen
t Ace
toni
trile
(--
-)
Abs
orba
nce
at 2
26 n
m (
)
Retention Time (min)
A.U
.:0.0
4A.
U.:0
.04
A.U
.:0.0
4 P1
P2
0 10 20 30 40
0
20
40
60
80
Per
Cen
t Ace
toni
trile
(--
-)
Abs
orba
nce
at 2
26 n
m (
)
Retention Time (min)
A.U
.:0.0
4A.
U.:0
.04
A.U
.:0.0
4A.
U.:0
.04
A.U
.:0.0
4A.
U.:0
.04
A.U
.:0.0
4 P1
P2
A B
3.Python sebae serum
89
Determination of Cys-content of P2 fraction was carried out by
reduction/carboxamidomethylation reaction with DTT/iodoacetamide. The Cys-reduced and
carboxamidomethylated P2 (S-CM-P2) eluted as a single peak in RP-HPLC on a C4 analytical
column (not shown), with an increase in the mass value of 928.9±0.5 a.m.u. Considering that
carboxamidomethylation of half-cystine adds 58.03 a.m.u, we conclude that P2 contains 16
cysteines (16 x 58.03 a.m.u.. = 928.48 a.m.u.), arranged to form eight disulfides. Of note, neither P1
nor P2 reacts with Ellman’s reagent (dithio-bis(2-nitrobenzoic acid), indicating that no free Cys-
residues is present.
Similar results were obtained either with P1 and P2, after reduction and derivatization with 4-
vinylpyridine, a more selective reagent for Cys-residues (18). In both cases, a mass increment of
1696±0.7 a.m.u. was obtained, thus confirming the presence of 16 cysteines in both proteins (106
a.m.u. x 16 = 1696 a.m.u.).
Sequencing of P1 and P2
Purified P1 and P2, (see Fig. 7B) were subjected to N-terminal sequencing by Edman
degradation on a liquid-phase protein sequencer. In both fractions, the sequence
HKXEIXHGFGDD was obtained in which X denotes the absence in the RP-HPLC chromatogram
of a well-defined phenylthiohydantoine (PTH) derivative, indicating the presence of a disulfide
bridge in the X position. The N-terminal amino acidic sequence (HKCEICHGFGDD), when
compared with a protein databank, using the BLAST software, matched the sequence 1-12,
DKCEICHGFGDD, of the sPLA2 inhibitory protein (PIP) isolated from P. reticulatus (SwissProt
accession number: Q9I8P7) (16), apart from an amino acid replacement in position 1 (His in P.
sebae instead of Asp in P. reticulatus).
Internal sequence information on P1 and P2 were obtained by peptide mass fingerprinting of the
reduced and S-alkylated species with trypsin and Glu-C endoproteinase (Fig. 8A, B and C; Table 2
and 3), spectrophotometric analysis of S-pyridylethylated P1 and P2 proteolytic fragments and by
MS-MS analysis of some selected peptides (Fig. 2, Supplemental data). In the enzymatic peptide
mass fingerprint analysis, Cys-containing peptides were readily identified during RP-HPLC
analysis by the absorbance spectrum of the S-β-(4-pyridylethyl)-moiety, showing a characteristic
shape with a maximum at 254 nm (18). During electrospray ionisation tandem mass spectrometry,
Cys-containing peptides were identified by the appearance of a pyridylethyl-fragment ion of 106
a.m.u. Some anomalous tryptic cleavages were found and confirmed by careful MS-MS sequence
determination. From these data, we could establish a high sequence similarity between P1 and P2,
constituting the active protein serum component (i.e., fraction F5), with that of PLA2 inhibitor from
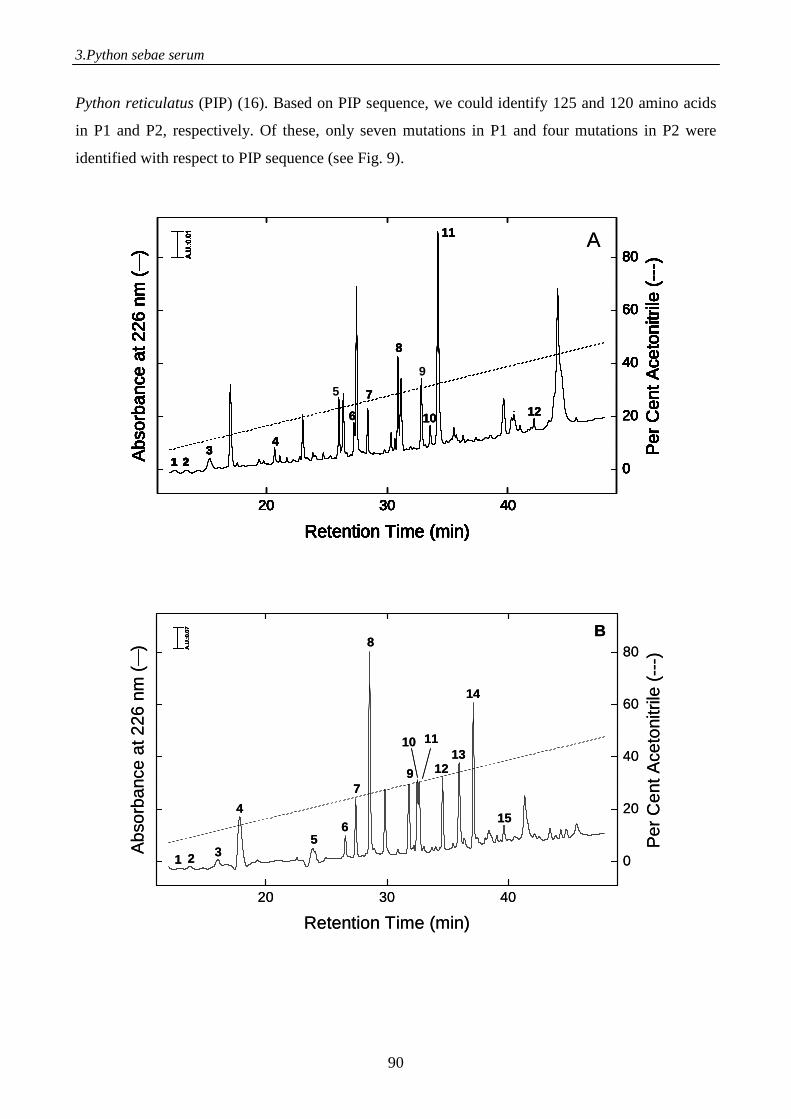
3.Python sebae serum
90
Python reticulatus (PIP) (16). Based on PIP sequence, we could identify 125 and 120 amino acids
in P1 and P2, respectively. Of these, only seven mutations in P1 and four mutations in P2 were
identified with respect to PIP sequence (see Fig. 9).
20 30 40
0
20
40
60
80
Per
Cen
t Ace
toni
trile
(--
-)
Abs
orba
nce
at 2
26 n
m (
)
Retention Time (min)
A.U
.:0.0
1
23
1
45
6
7
20 30 40
0
20
40
60
80
Per
Cen
t Ace
toni
trile
(--
-)
Abs
orba
nce
at 2
26 n
m (
)
Retention Time (min)
A.U
.:0.0
1A.
U.:0
.01
23
1
45
6
7
4
6
5 7
8
9
10
11
12
20 30 40
0
20
40
60
80
Per
Cen
t Ace
toni
trile
(--
-)
Abs
orba
nce
at 2
26 n
m (
)
Retention Time (min)
A.U
.:0.0
1
23
1
45
6
7
20 30 40
0
20
40
60
80
Per
Cen
t Ace
toni
trile
(--
-)
Abs
orba
nce
at 2
26 n
m (
)
Retention Time (min)
A.U
.:0.0
1A.
U.:0
.01
23
1
45
6
7
4
20 30 40
0
20
40
60
80
Per
Cen
t Ace
toni
trile
(--
-)
Abs
orba
nce
at 2
26 n
m (
)
Retention Time (min)
A.U
.:0.0
1
23
1
45
6
7
20 30 40
0
20
40
60
80
Per
Cen
t Ace
toni
trile
(--
-)
Abs
orba
nce
at 2
26 n
m (
)
Retention Time (min)
A.U
.:0.0
1A.
U.:0
.01
23
1
45
6
7
4
6
5 7
8
9
10
11
12
A
20 30 40
0
20
40
60
80
Per
Cen
t Ace
toni
trile
(--
-)
Abs
orba
nce
at 2
26 n
m (
)
Retention Time (min)
A.U
.:0.0
1
23
1
45
6
7
20 30 40
0
20
40
60
80
Per
Cen
t Ace
toni
trile
(--
-)
Abs
orba
nce
at 2
26 n
m (
)
Retention Time (min)
A.U
.:0.0
1A.
U.:0
.01
23
1
45
6
7
4
6
5 7
8
9
10
11
12
20 30 40
0
20
40
60
80
Per
Cen
t Ace
toni
trile
(--
-)
Abs
orba
nce
at 2
26 n
m (
)
Retention Time (min)
A.U
.:0.0
1
23
1
45
6
7
20 30 40
0
20
40
60
80
Per
Cen
t Ace
toni
trile
(--
-)
Abs
orba
nce
at 2
26 n
m (
)
Retention Time (min)
A.U
.:0.0
1A.
U.:0
.01
23
1
45
6
7
4
20 30 40
0
20
40
60
80
Per
Cen
t Ace
toni
trile
(--
-)
Abs
orba
nce
at 2
26 n
m (
)
Retention Time (min)
A.U
.:0.0
1
23
1
45
6
7
20 30 40
0
20
40
60
80
Per
Cen
t Ace
toni
trile
(--
-)
Abs
orba
nce
at 2
26 n
m (
)
Retention Time (min)
A.U
.:0.0
1A.
U.:0
.01
23
1
45
6
7
4
6
5 7
8
9
10
11
12
A
20 30 40
0
20
40
60
80P
er C
ent A
ceto
nitr
ile (
---)
Abs
orba
nce
at 2
26 n
m (
)
Retention Time (min)
4
321
7
65
9
8
10 11
1213
14
15
A.U
.:0.0
7A.
U.:0
.07
A.U
.:0.0
7 B
20 30 40
0
20
40
60
80P
er C
ent A
ceto
nitr
ile (
---)
Abs
orba
nce
at 2
26 n
m (
)
Retention Time (min)
4
321
7
65
9
8
10 11
1213
14
15
A.U
.:0.0
7A.
U.:0
.07
A.U
.:0.0
7 B
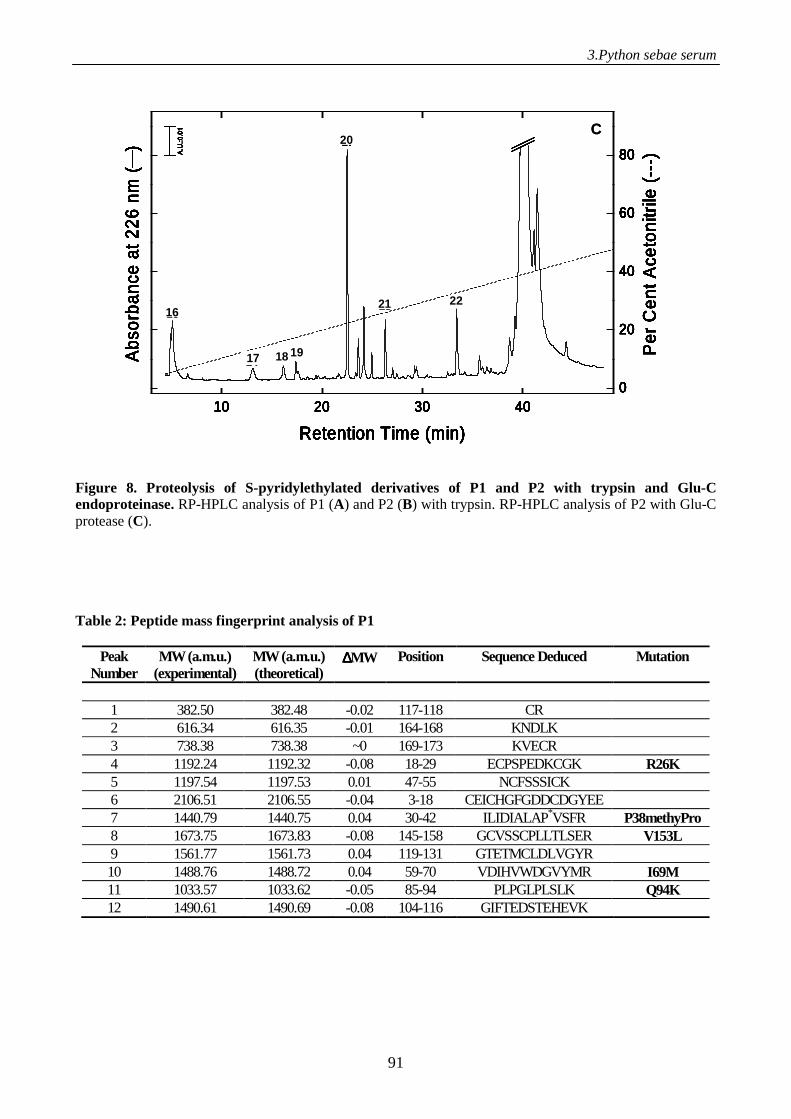
3.Python sebae serum
91
Figure 8. Proteolysis of S-pyridylethylated derivatives of P1 and P2 with trypsin and Glu-C endoproteinase. RP-HPLC analysis of P1 (A) and P2 (B) with trypsin. RP-HPLC analysis of P2 with Glu-C protease (C).
Table 2: Peptide mass fingerprint analysis of P1
Peak Number
MW (a.m.u.) (experimental)
MW (a.m.u.) (theoretical)
∆∆∆∆MW Position Sequence Deduced Mutation
1 382.50 382.48 -0.02 117-118 CR 2 616.34 616.35 -0.01 164-168 KNDLK 3 738.38 738.38 ~0 169-173 KVECR 4 1192.24 1192.32 -0.08 18-29 ECPSPEDKCGK R26K 5 1197.54 1197.53 0.01 47-55 NCFSSSICK 6 2106.51 2106.55 -0.04 3-18 CEICHGFGDDCDGYEE 7 1440.79 1440.75 0.04 30-42 ILIDIALAP*VSFR P38methyPro 8 1673.75 1673.83 -0.08 145-158 GCVSSCPLLTLSER V153L 9 1561.77 1561.73 0.04 119-131 GTETMCLDLVGYR 10 1488.76 1488.72 0.04 59-70 VDIHVWDGVYMR I69M 11 1033.57 1033.62 -0.05 85-94 PLPGLPLSLK Q94K 12 1490.61 1490.69 -0.08 104-116 GIFTEDSTEHEVK
10 20 30 400
20
40
60
80
Per
Cen
t Ace
toni
trile
(--
-)
Abs
orba
nce
at 2
26 n
m (
)
Retention Time (min)
1514
13
16
17
18 19
10 20 30 400
20
40
60
80
Per
Cen
t Ace
toni
trile
(--
-)
Abs
orba
nce
at 2
26 n
m (
)
Retention Time (min)
1514
13
16
17
18 19
A.U
.:0.0
1
10 20 30 400
20
40
60
80
Per
Cen
t Ace
toni
trile
(--
-)
Abs
orba
nce
at 2
26 n
m (
)
Retention Time (min)
1514
13
16
17
18 19
10 20 30 400
20
40
60
80
Per
Cen
t Ace
toni
trile
(--
-)
Abs
orba
nce
at 2
26 n
m (
)
Retention Time (min)
1514
13
16
17
18 19
A.U
.:0.0
1A.
U.:0
.01
17
16
18 19
21
20
22
C
10 20 30 400
20
40
60
80
Per
Cen
t Ace
toni
trile
(--
-)
Abs
orba
nce
at 2
26 n
m (
)
Retention Time (min)
1514
13
16
17
18 19
10 20 30 400
20
40
60
80
Per
Cen
t Ace
toni
trile
(--
-)
Abs
orba
nce
at 2
26 n
m (
)
Retention Time (min)
1514
13
16
17
18 19
A.U
.:0.0
1
10 20 30 400
20
40
60
80
Per
Cen
t Ace
toni
trile
(--
-)
Abs
orba
nce
at 2
26 n
m (
)
Retention Time (min)
1514
13
16
17
18 19
10 20 30 400
20
40
60
80
Per
Cen
t Ace
toni
trile
(--
-)
Abs
orba
nce
at 2
26 n
m (
)
Retention Time (min)
1514
13
16
17
18 19
A.U
.:0.0
1A.
U.:0
.01
17
16
18 19
21
20
22
10 20 30 400
20
40
60
80
Per
Cen
t Ace
toni
trile
(--
-)
Abs
orba
nce
at 2
26 n
m (
)
Retention Time (min)
1514
13
16
17
18 19
10 20 30 400
20
40
60
80
Per
Cen
t Ace
toni
trile
(--
-)
Abs
orba
nce
at 2
26 n
m (
)
Retention Time (min)
1514
13
16
17
18 19
A.U
.:0.0
1
10 20 30 400
20
40
60
80
Per
Cen
t Ace
toni
trile
(--
-)
Abs
orba
nce
at 2
26 n
m (
)
Retention Time (min)
1514
13
16
17
18 19
10 20 30 400
20
40
60
80
Per
Cen
t Ace
toni
trile
(--
-)
Abs
orba
nce
at 2
26 n
m (
)
Retention Time (min)
1514
13
16
17
18 19
A.U
.:0.0
1A.
U.:0
.01
17
16
18 19
21
20
22
C
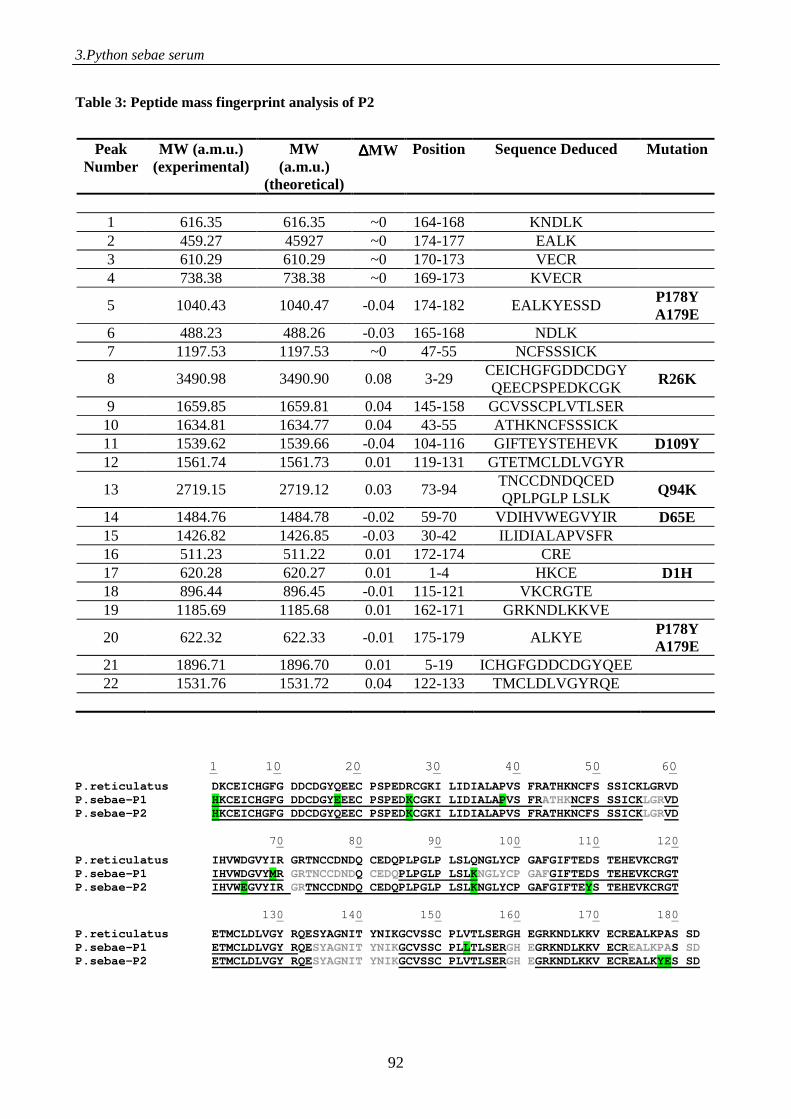
3.Python sebae serum
92
Table 3: Peptide mass fingerprint analysis of P2
1 10 20 30 40 50 60
P.reticulatus DKCEICHGFG DDCDGYQEEC PSPEDRCGKI LIDIALAPVS FRATHKNCFS SSICKLGRVD P.sebae-P1 HKCEICHGFG DDCDGYEEEC PSPEDKCGKI LIDIALAPVS FRATHKNCFS SSICKLGRVD P.sebae-P2 HKCEICHGFG DDCDGYQEEC PSPEDKCGKI LIDIALAPVS FRATHKNCFS SSICKLGRVD
70 80 90 100 110 120
P.reticulatus IHVWDGVYIR GRTNCCDNDQ CEDQPLPGLP LSLQNGLYCP GAFGIFTEDS TEHEVKCRGT P.sebae-P1 IHVWDGVYMR GRTNCCDNDQ CEDQPLPGLP LSLKNGLYCP GAFGIFTEDS TEHEVKCRGT P.sebae-P2 IHVWEGVYIR GRTNCCDNDQ CEDQPLPGLP LSLKNGLYCP GAFGIFTEYS TEHEVKCRGT
130 140 150 160 170 180
P.reticulatus ETMCLDLVGY RQESYAGNIT YNIKGCVSSC PLVTLSERGH EGRKNDLKKV ECREALKPAS SD P.sebae-P1 ETMCLDLVGY RQESYAGNIT YNIKGCVSSC PLLTLSERGH EGRKNDLKKV ECREALKPAS SD P.sebae-P2 ETMCLDLVGY RQESYAGNIT YNIKGCVSSC PLVTLSERGH EGRKNDLKKV ECREALKYES SD
Peak Number
MW (a.m.u.) (experimental)
MW (a.m.u.)
(theoretical)
∆∆∆∆MW Position Sequence Deduced Mutation
1 616.35 616.35 ~0 164-168 KNDLK 2 459.27 45927 ~0 174-177 EALK 3 610.29 610.29 ~0 170-173 VECR 4 738.38 738.38 ~0 169-173 KVECR
5 1040.43 1040.47 -0.04 174-182 EALKYESSD P178Y A179E
6 488.23 488.26 -0.03 165-168 NDLK 7 1197.53 1197.53 ~0 47-55 NCFSSSICK
8 3490.98 3490.90 0.08 3-29 CEICHGFGDDCDGY QEECPSPEDKCGK
R26K
9 1659.85 1659.81 0.04 145-158 GCVSSCPLVTLSER 10 1634.81 1634.77 0.04 43-55 ATHKNCFSSSICK 11 1539.62 1539.66 -0.04 104-116 GIFTEYSTEHEVK D109Y 12 1561.74 1561.73 0.01 119-131 GTETMCLDLVGYR
13 2719.15 2719.12 0.03 73-94 TNCCDNDQCED QPLPGLP LSLK Q94K
14 1484.76 1484.78 -0.02 59-70 VDIHVWEGVYIR D65E 15 1426.82 1426.85 -0.03 30-42 ILIDIALAPVSFR 16 511.23 511.22 0.01 172-174 CRE 17 620.28 620.27 0.01 1-4 HKCE D1H 18 896.44 896.45 -0.01 115-121 VKCRGTE 19 1185.69 1185.68 0.01 162-171 GRKNDLKKVE
20 622.32 622.33 -0.01 175-179 ALKYE P178Y A179E
21 1896.71 1896.70 0.01 5-19 ICHGFGDDCDGYQEE 22 1531.76 1531.72 0.04 122-133 TMCLDLVGYRQE
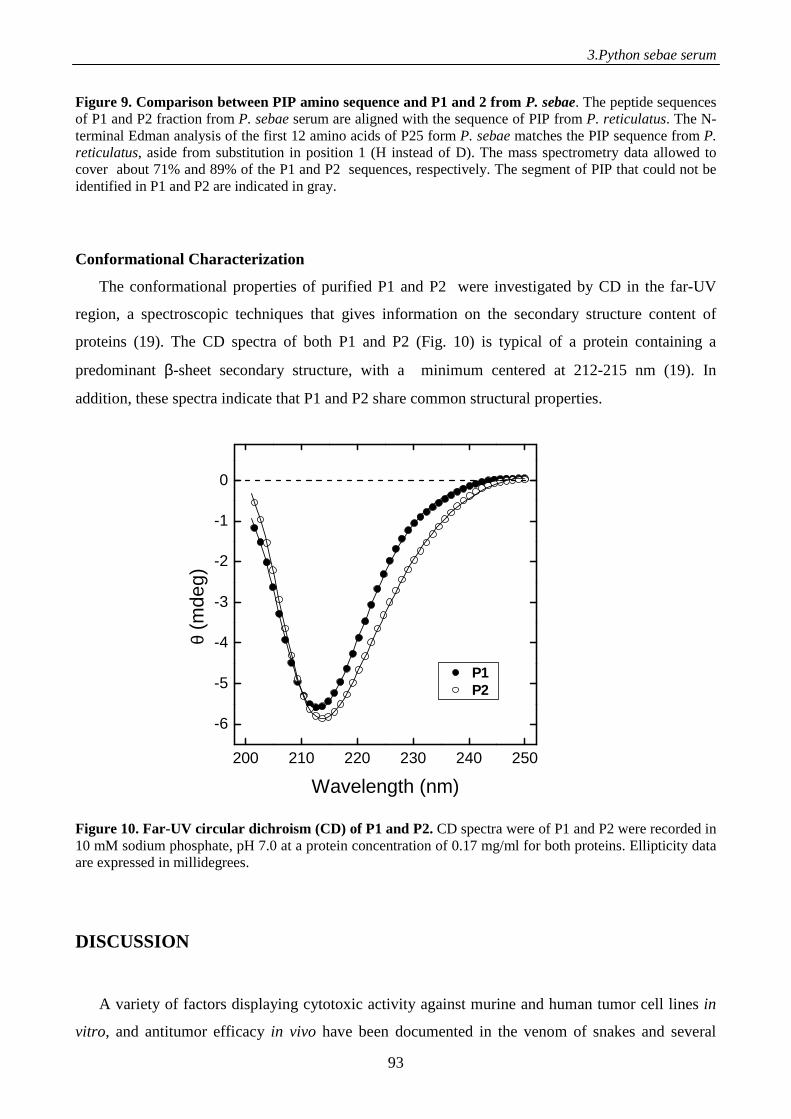
3.Python sebae serum
93
Figure 9. Comparison between PIP amino sequence and P1 and 2 from P. sebae. The peptide sequences of P1 and P2 fraction from P. sebae serum are aligned with the sequence of PIP from P. reticulatus. The N-terminal Edman analysis of the first 12 amino acids of P25 form P. sebae matches the PIP sequence from P. reticulatus, aside from substitution in position 1 (H instead of D). The mass spectrometry data allowed to cover about 71% and 89% of the P1 and P2 sequences, respectively. The segment of PIP that could not be identified in P1 and P2 are indicated in gray.
Conformational Characterization
The conformational properties of purified P1 and P2 were investigated by CD in the far-UV
region, a spectroscopic techniques that gives information on the secondary structure content of
proteins (19). The CD spectra of both P1 and P2 (Fig. 10) is typical of a protein containing a
predominant β-sheet secondary structure, with a minimum centered at 212-215 nm (19). In
addition, these spectra indicate that P1 and P2 share common structural properties.
Figure 10. Far-UV circular dichroism (CD) of P1 and P2. CD spectra were of P1 and P2 were recorded in 10 mM sodium phosphate, pH 7.0 at a protein concentration of 0.17 mg/ml for both proteins. Ellipticity data are expressed in millidegrees.
DISCUSSION
A variety of factors displaying cytotoxic activity against murine and human tumor cell lines in
vitro, and antitumor efficacy in vivo have been documented in the venom of snakes and several
200 210 220 230 240 250
-6
-5
-4
-3
-2
-1
0
θ (m
deg)
Wavelength (nm)
P1P2
3.Python sebae serum
94
proteins have been isolated and characterized (20-24). Conversely, little information is available on
the identification of antitumor products in the snake serum.
In this work for the first time, we purified from the serum of the non venomous snake P. sebae,
termed PSS, a protein having a selective anti tumor activity. PSS cytotoxicity was evaluated in cell
suspension and in cell adhesion experiments using both tumor and non tumor cell lines. In both
experimental conditions and for all the cell lines, PSS exhibited a remarkable and dose-dependent
cytotoxic effect. Exposure to low concentration of PSS for prolonged time also affected cell
viability as measured by the MTT assay. After exposure to PSS at concentration ranging from 400
to 2000 µg/ml, changes of morphology and cell lysis occurred within minutes. Microscope
observation of cells exposed for several h to PSS, evidenced that a consistent proportion of the cell
monolayer became detached. The time dependence of the changes in cell morphology (1 h), is
evocative of a rapid treatment-induced gradual loss of cell-matrix adhesion, similar to that
documented for other cytotoxic principle obtained from snakes (24-26) Consistent with the
morphological appearance of cytoplasmic retraction, rounding of cell shape and lysis of cell bodies,
PSS effects were mainly associated with cell apoptosis and necrosis. With respect to the decrease in
cell viability and the morphological changes observed following exposure to PSS, our data suggest
a direct cytotoxic/pro-apoptotic activity of the serum in vitro. An interesting finding of this work
was that the cytotoxic effect appears to be more pronounced on human tumor cells than in non
tumor cells. At concentration of 50 µg/ml PSS was devoid of any effect on non-tumor cell lines,
while inducing over 50% inhibition of tumor cell growth. These effects were absent at
concentrations lower than 50 µg/ml.
In vivo experiments demonstrated that the cytotoxic effect produced in vitro on tumor cell lines
translated in tumor growth inhibition in nude mice bearing epithelial tumors (A431). PSS
peritumoral treatment, which was well tolerated, reduced tumor growth (30%). Although biased by
the limited number of mice that could be studied given the limited availability of the source, we
found interesting that the treatment appeared to increase survival.
The active protein component, F5, was purified from the crude PSS by ion-exchange
chromatography and found to exist as a tetramer of about 90 kDa, formed by two dimers, each
composed of two non-covalently linked subunits (i.e., P1 and P2) of about 23 kDa. Of interest,
isolated P1 and P2 lack cytotoxic and antitumor effects. Notably, F5 reduced tumor cell viability
and induced apoptosis by activation of caspase-3. In an attempt to identify the molecular target of
F5, the β-tubulin distribution was measured in cells treated with the active protein, but no effect was
observed on microtubule dynamics. Limitations in the supply of the source of the active protein,
prevented a comprehensive assessment of the putative mechanism for the anti-proliferative activity.
3.Python sebae serum
95
The cloning and recombinant expression of the novel protein, may open toward the full
characterization of the mechanisms, and in particular, the molecular target(s) of this cytotoxic
factor.
The results of the detailed chemical characterization, conducted by enzymatic peptide mass
fingerprint analysis and N-terminal Edman sequencing, revealed that P1 and P2 are two isoforms of
the same protein and both share high sequence homology with the γ-type phospholipase inhibitor
(PLI) from P. reticulatus, PIP (16) (see Fig. 9). The blood of venomous as well as non-venomous
snakes contains specialized serum proteins as an endogenous mechanisms of natural resistance to
toxicity induced by toxins such as myotoxic and neurotoxic PLA2s, as well as hemorrhagic
metalloproteinases (27). In particular, the PLA2 enzyme family can be distinguished in 12 groups
(I-XII), according to their chain length and intramolecular disulfide-bond topology (2,3), and it play
a key role in numerous severe inflammatory diseases (5). Specific inhibitors (PLIs) of the toxic
activity of PLA2s, have been characterized, and classified into three groups according to their
structure (i.e., PLIα, PLIβ and PLIγ) (5,8) PLIs are acidic oligomeric glycoproteins with N-linked
oligosaccharide chains, composed of three to six identical or different non-covalently linked
subunits having a molecular weight of 20-30 kDa (10,12) PLIα specifically inhibits group-II acidic
PLA2s, PLIβ selectively inhibits group-II basic PLA2s, while PLIγ is a nonspecific inhibitor and its
primary structure is characterized by two tandem patterns of Cys-residues (8,11,12) The PLIγ from
P. reticulatus, has been reported to appear as a homo-hexamer able to inhibit different types of
PLAs2 (28). On the contrary, the isolated F5 protein exists as a hetero-tetramer, and does not
possess an appreciable inhibitory activity on both type II and V PLA2s tested. Earlier studies have
shown that the segment 85PLPGLPLSLQNGLY98 (29) and 59VDIHVWDGV 67 (30) are responsible
for the PLA2 inhibitory activity of PIP. As shown in Fig. 9, we have indentified in P1 the sequence 59VDIHVWDGV 67 and in P2 the same sequence containing the mutation D65E, 59VDIHVWEGV67.
In P1, we have also identified the sequence 85PLPGLPLSLK94 and in P2 the sequence 95PLPGLPLSLKNGLY98. Rather surprisingly, F5 does not show any appreciable PLA2 inhibition.
This can be due to a different arrangement of the PLA2 recognition sites in F5 and/or to the
mutations D65E and Q94K. Of note, substitutions of charged amino acids are involved in both
cases. Finally, the conformational characterization of P1 and P2 revealed the presence of high
content of β-sheet secondary structure. This finding is consistent with earlier studies showing
significant structural similarity of PLIγ from different species, including PIP, with the structure of
mammalian urokinase-type plasminogen activator receptor (uPAR), which displays a characteristic
β-sheet structure and unique disulfide bond pattern.
3.Python sebae serum
96
In conclusion, in this study we have shown that P. sebae serum contains a previously unknown
specie specific and selective cytotoxic protein component endowed with pro-apototic activity which
could be exploited for the development of novel antitumor strategies.
REFERENCES
1. Kim SI, Kim KS, Kim HS, Choi MM, Kim DS, Chung KH, Park YS (2004) Inhibition of
angiogenesis by salmosin expressed in vitro. Oncol. Res. 14:227-233
2. Heinrikson RL, Krueger ET, Keim PS (1977) Amino acid sequence of phospholipase A2-alpha
from the venom of Crotalus adamanteus. A new classification of phospholipases A2 based upon
structural determinants. J. Biol. Chem. 252:4913-4921
3. Dennis EA (1997) The growing phospholipase A2 superfamily of signal transduction enzymes.
Trends Biochem. Sci. 22:1-2
4. Kishino J, Ohara O, Nomura K, Kramer RM, Arita H (1994) Pancreatic-type phospholipase A2
induces group II phospholipase A2 expression and prostaglandin biosynthesis in rat mesangial
cells. J. Biol. Chem. 269:5092-5098
5. Lambeau G, Lazdunski M (1999) Receptors for a growing family of secreted phospholipases
A2. Trends Pharmacol. Sci. 20:162-170
6. Buckland AG, Wilton DC (2000) The antibacterial properties of secreted phospholipases A(2).
Biochim. Biophys. Acta 1488:71-82
7. Kini RM, Evans HJ (1989) A model to explain the pharmacological effects of snake venom
phospholipases A2. Toxicon 27:613-635
8. Ohkura N, Okuhara H, Inoue S, Ikeda K, Hayashi K (1997) Purification and characterization of
three distinct types of phospholipase A2 inhibitors from the blood plasma of the Chinese
mamushi, Agkistrodon blomhoffii siniticus. Biochem. J. 325: 527-531
9. Faure G (2000) Natural inhibitors of toxic phospholipases A(2). Biochimie 82:833-840
10. Dunn RD, Broady KW (2001) Snake inhibitors of phospholipase A(2) enzymes. Biochim.
Biophys. Acta 1533:29-37
11. Ploug M, Ellis V (1994) Structure-function relationships in the receptor for urokinase-type
plasminogen activator. Comparison to other members of the Ly-6 family and snake venom
alpha-neurotoxins. FEBS Lett. 349:163-168
3.Python sebae serum
97
12. Faure G, Villela C, Perales J, Bon C (2000) Interaction of the neurotoxic and nontoxic secretory
phospholipases A2 with the crotoxin inhibitor from Crotalus serum. Eur. J. Biochem. 267:4799-
4808
13. Okumura K, Inoue S, Ikeda K, Hayashi K (2003) Identification and characterization of a serum
protein homologous to alpha-type phospholipase A2 inhibitor (PLIalpha) from a nonvenomous
snake, Elaphe quadrivirgata. IUBMB Life. 55:539-545
14. Okumura K, Inoue S, Ohkura N, Ikeda K, Hayashi K. (1999) cDNA cloning of the two subunits
of phospholipase A2 inhibitor PLIgamma from blood plasma of the Chinese mamushi,
Agkistrodon blomhoffii siniticus. IUBMB Life. 48:99-104
15. Okumura K, Masui K, Inoue S, Ikeda K, Hayashi K (1999) Purification, characterization and
cDNA cloning of a phospholipase A2 inhibitor from the serum of the non-venomous snake
Elaphe quadrivirgata. Biochem J. 341:165-171
16. Thwin MM, Gopalakrishnakone P, Kini RM, Armugam A, Jeyaseelan K (2000) Recombinant
antitoxic and antiinflammatory factor from the nonvenomous snake Python reticulatus:
phospholipase A2 inhibition and venom neutralizing potential. Biochemistry 39: 9604-9611
17. Schelling ME, Meiningerm CJ, Hawker JR Jr, Granger HJ (1988) Venular endothelial cells
from bovine heart. Am. J. Physiol. 254:1211-1217
18. Moritz RL, Eddes JS, Reid GE, Simpson RJ (1996). S-pyridylethylation of intact
polyacrylamide gels and in situ digestion of electrophoretically separated proteins: a rapid mass
spectrometric method for identifying cysteine-containing peptides. Electrophoresis 17: 907-917
19. Brahms S, Brahms J (1980) Determination of protein secondary structure in solution by
vacuum ultraviolet circular dichroism. J. Mol. Biol. 138:149-178
20. Schmitmeier S, Markland FS, Chen TC (2000) Anti-invasive effect of contortrostatin, a snake
venom disintegrin, and TNF-alpha on malignant glioma cells. Anticancer Res. 20:4227-4233
21. Oliveira JC, de Oca HM, Duarte MM, Diniz CR., Fortes-Dias CL (2002) Toxicity of South
American snake venoms measured by an in vitro cell culture assay. Toxicon 40:321-325
22. Abu-Sinna G, Esmat AY, Al-Zahaby AA, Soliman NA, Ibrahim TM (2003) Fractionation and
characterization of Cerastes cerastes cerastes snake venom and the antitumor action of its lethal
and non-lethal fractions. Toxicon 42:207-215
23. Kim SI, Kim KS, Kim HS, Choi MM, Kim DS, Chung KH, Park YS (2004) Inhibition of
angiogenesis by salmosin expressed in vitro. Oncol. Res. 14:227-233
24. Baramova EN, Shannon JD, Bjarnason JB, Fox JW (1989) Degradation of extracellular matrix
proteins by hemorrhagic metalloproteinases. Arch. Biochem. Biophys. 275:63-71
3.Python sebae serum
98
25. Coelho AL, de Freitas MS, Oliveira-Carvalho AL, Moura-Neto V, Zingali RB, Barja-Fidalgo C
(1999) Effects of jarastatin, a novel snake venom disintegrin, on neutrophil migration and actin
cytoskeleton dynamics. Exp. Cell. Res. 251:379-387
26. Petretski JH, Kanashiro MM, Rodrigues FR, Alves EW, Machado OL, Kipnis TL (2000) Edema
induction by the disintegrin-like/cysteine-rich domains from a Bothrops atrox hemorrhagin.
Biochem. Biophys. Res. Commun. 276:29-34
27. Koh DCI., Armugam A, Jeyaseelan K (2006) Snake venom components and their applications
in biomedicine. Cell. Mol. Life Sci. 63:3030–304
28. Thwin MM, Gopalakrishnakone P (1998) Snake endovenomation and protective natural
endogenous proteins: a mini review of the recent development (1991-1997). Toxicon 36:1471-
1482
29. Thwin MM, Satish RL, Chan ST, Gopalakrishnakone P (2002) Functional site of endogenous
phospholipase A2 inhibitor from python serum. Eur. J. Biochem. 269:719-727
30. Thwin MM, Satyanarayanajois SD, Nagarajarao LM, Sato K, Arjunan P, Ramapatna SL, Kumar
PV, Gopalakrishnakone P (2007) Novel peptide inhibitors of human secretory phospholipase A2
with antiinflammatory activity: solution structure and molecular modeling. J. Med. Chem.
50:5938-5950
SUPPLEMENTAL DATA
MATERIALS AND METHODS
Cells and culture conditions
The A431 and MCF-7 cell line were cultured in DMEM with 4500 mg/L of glucose and 10% fetal
calf serum (FCS). HF cell line was cultured in DMEM with 1000 mg/L of glucose, 1% non
essential aminoacids, 10% sodium pyruvate and 10% FCS. U373 MG cell line was cultured in
MEM with 1% non essential aminoacids, 10% sodium pyruvate and 10% FCS. Mouse lung
carcinoma cell line (LLC) was kindly provided by Dr. F. Pica at the University of Tor Vergata,
Rome, and were cultured in RPMI 1640 with 10% FCS. Capillary venular endothelial cells (CVEC)
were obtained and cultured as described.
3.Python sebae serum
99
Cell morphology
Cells (3 x10³/well) were plated in 96 microtiter plate in the presence of 10% FCS, let to adhere for
5 h, and then treated with different concentrations of PSS in 10% FCS for 1h. After supernatant
removal, cells were fixed with methanol at 4 °C for 18 h and stained with Diff Qick. Cell
morphology was evaluated by optical microscope Nikon Eclipse T400 at 200X magnification and
the images were recorded by Nikon CCD camera. Cell survival was reported as total cell number
counted/well.
Apoptosis and necrosis analysis
Bivariant flow cytometry was performed on adherent cells grown in the presence or absence of PSS
for 4 h in media containing 1% FCS. After incubation, cells were washed in cold PBS and
resuspended in 100 µl of binding buffer (HEPES containing 2.5 M CaCl2). Fluorescein-labeled
Annexin V and propidium iodide (PI) were added to the cell suspension. Annexin V, a member of
the calcium and phospholipids-binding proteins, binds strongly and specifically to
phosphatidylserine which is a marker of cell apoptosis, while PI binds cell DNA, highlighting
necrotic cells. Cells were then analysed by flow cytometry (Becton Dickinson, USA) and the results
are expressed as % of positive cells/total cells.
Ethanol fractionation
One ml of PSS was treated with 1 ml of cold Ethanol for 30 min at 4°C, centrifuged at 13.000 rpm
at 4°C for 30 min, and the supernatant was discarded. The pellet was diluted in 50% cold Ethanol.
This procedure was repeated for three times and the final pellet was reconstituted in 1ml of PBS and
an aliquote tested on cell viability using the Sulphorodamine B assay.
Salt fractionation
Salt fractionation of 10 µg/ml PSS was performed using NaCl concentrations between 0.2, 0.4, 0.6,
0.8 and 1 M. The serum was pre-treated with the reported NaCl concentrations for 30 min at room
temperature, centrifuged at 13.000 rpm for 5 min and the supernatants were tested on cell viability
using the Trypan Blue assay.
Tryptic digestion of S-carboxamidomethylated P2 (S-CM-P2) and peptide mass fingerprinting
Sequencing grade trypsin (Promega, Madison, WI) was added to a final enzyme:protein ratio of
1:50 w/w and the mixture was incubated at 37°C overnight. The tryptic digestion was stopped by
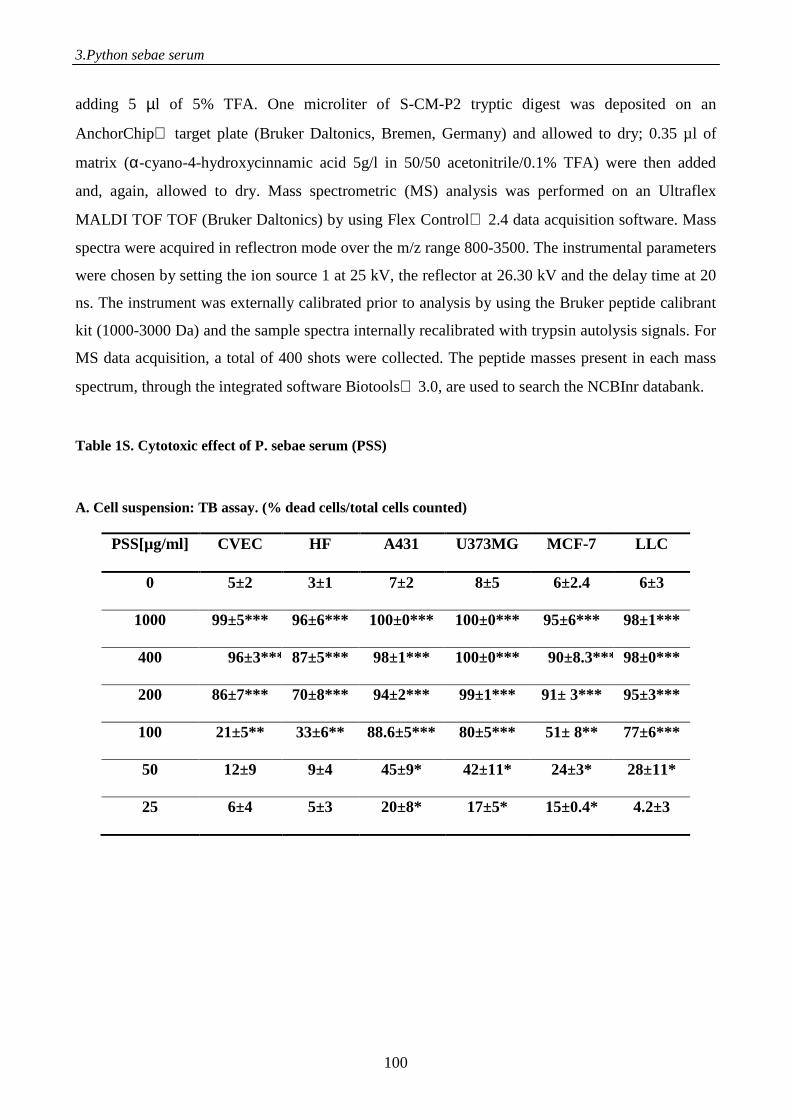
3.Python sebae serum
100
adding 5 µl of 5% TFA. One microliter of S-CM-P2 tryptic digest was deposited on an
AnchorChip target plate (Bruker Daltonics, Bremen, Germany) and allowed to dry; 0.35 µl of
matrix (α-cyano-4-hydroxycinnamic acid 5g/l in 50/50 acetonitrile/0.1% TFA) were then added
and, again, allowed to dry. Mass spectrometric (MS) analysis was performed on an Ultraflex
MALDI TOF TOF (Bruker Daltonics) by using Flex Control 2.4 data acquisition software. Mass
spectra were acquired in reflectron mode over the m/z range 800-3500. The instrumental parameters
were chosen by setting the ion source 1 at 25 kV, the reflector at 26.30 kV and the delay time at 20
ns. The instrument was externally calibrated prior to analysis by using the Bruker peptide calibrant
kit (1000-3000 Da) and the sample spectra internally recalibrated with trypsin autolysis signals. For
MS data acquisition, a total of 400 shots were collected. The peptide masses present in each mass
spectrum, through the integrated software Biotools 3.0, are used to search the NCBInr databank.
Table 1S. Cytotoxic effect of P. sebae serum (PSS)
A. Cell suspension: TB assay. (% dead cells/total cells counted)
PSS[µg/ml] CVEC HF A431 U373MG MCF-7 LLC
0 5±2 3±1 7±2 8±5 6±2.4 6±3
1000 99±5*** 96±6*** 100±0*** 100±0*** 95±6*** 98±1***
400 96±3*** 87±5*** 98±1*** 100±0*** 90±8.3*** 98±0***
200 86±7*** 70±8*** 94±2*** 99±1*** 91± 3*** 95±3***
100 21±5** 33±6** 88.6±5*** 80±5*** 51± 8** 77±6***
50 12±9 9±4 45±9* 42±11* 24±3* 28±11*
25 6±4 5±3 20±8* 17±5* 15±0.4* 4.2±3
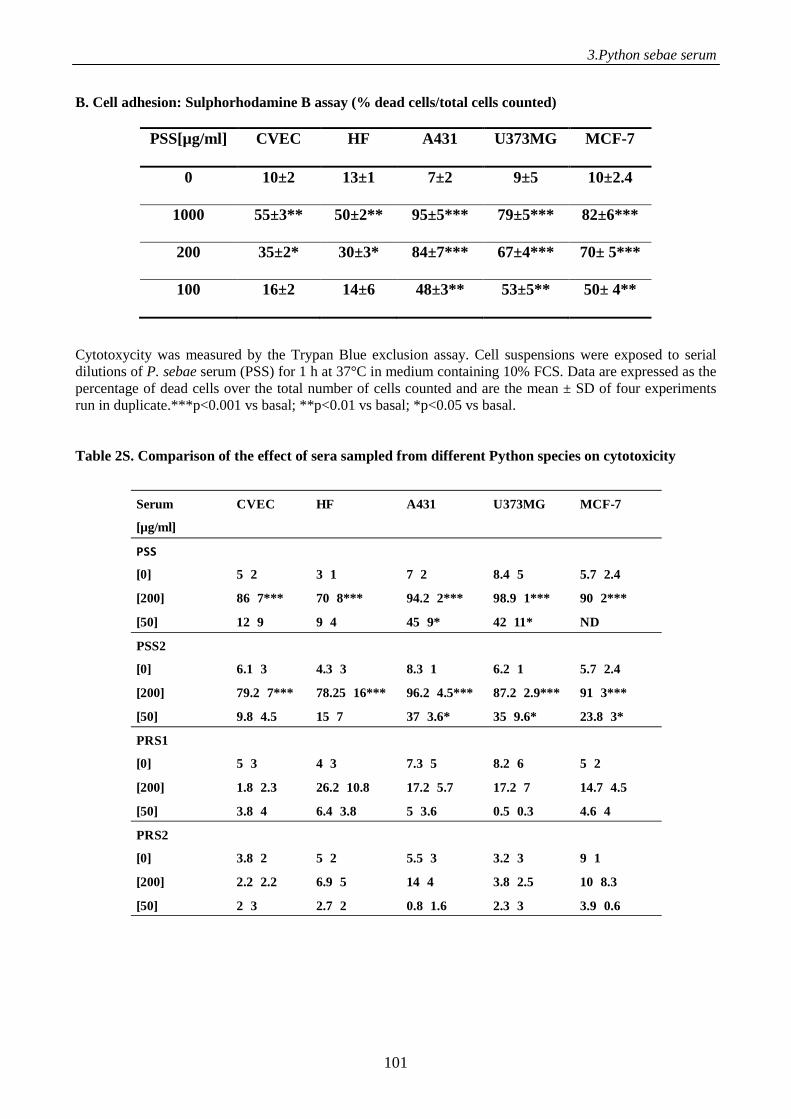
3.Python sebae serum
101
Serum
[µg/ml]
CVEC HF A431 U373MG MCF-7
PSS
[0]
[200]
[50]
5 2
86 7***
12 9
3 1
70 8***
9 4
7 2
94.2 2***
45 9*
8.4 5
98.9 1***
42 11*
5.7 2.4
90 2***
ND
PSS2
[0]
[200]
[50]
6.1 3
79.2 7***
9.8 4.5
4.3 3
78.25 16***
15 7
8.3 1
96.2 4.5***
37 3.6*
6.2 1
87.2 2.9***
35 9.6*
5.7 2.4
91 3***
23.8 3*
PRS1
[0]
[200]
[50]
5 3
1.8 2.3
3.8 4
4 3
26.2 10.8
6.4 3.8
7.3 5
17.2 5.7
5 3.6
8.2 6
17.2 7
0.5 0.3
5 2
14.7 4.5
4.6 4
PRS2
[0]
[200]
[50]
3.8 2
2.2 2.2
2 3
5 2
6.9 5
2.7 2
5.5 3
14 4
0.8 1.6
3.2 3
3.8 2.5
2.3 3
9 1
10 8.3
3.9 0.6
B. Cell adhesion: Sulphorhodamine B assay (% dead cells/total cells counted)
PSS[µg/ml] CVEC HF A431 U373MG MCF-7
0 10±2 13±1 7±2 9±5 10±2.4
1000 55±3** 50±2** 95±5*** 79±5*** 82±6***
200 35±2* 30±3* 84±7*** 67±4*** 70± 5***
100 16±2 14±6 48±3** 53±5** 50± 4**
Cytotoxycity was measured by the Trypan Blue exclusion assay. Cell suspensions were exposed to serial dilutions of P. sebae serum (PSS) for 1 h at 37°C in medium containing 10% FCS. Data are expressed as the percentage of dead cells over the total number of cells counted and are the mean ± SD of four experiments run in duplicate.***p<0.001 vs basal; **p<0.01 vs basal; *p<0.05 vs basal.
Table 2S. Comparison of the effect of sera sampled from different Python species on cytotoxicity
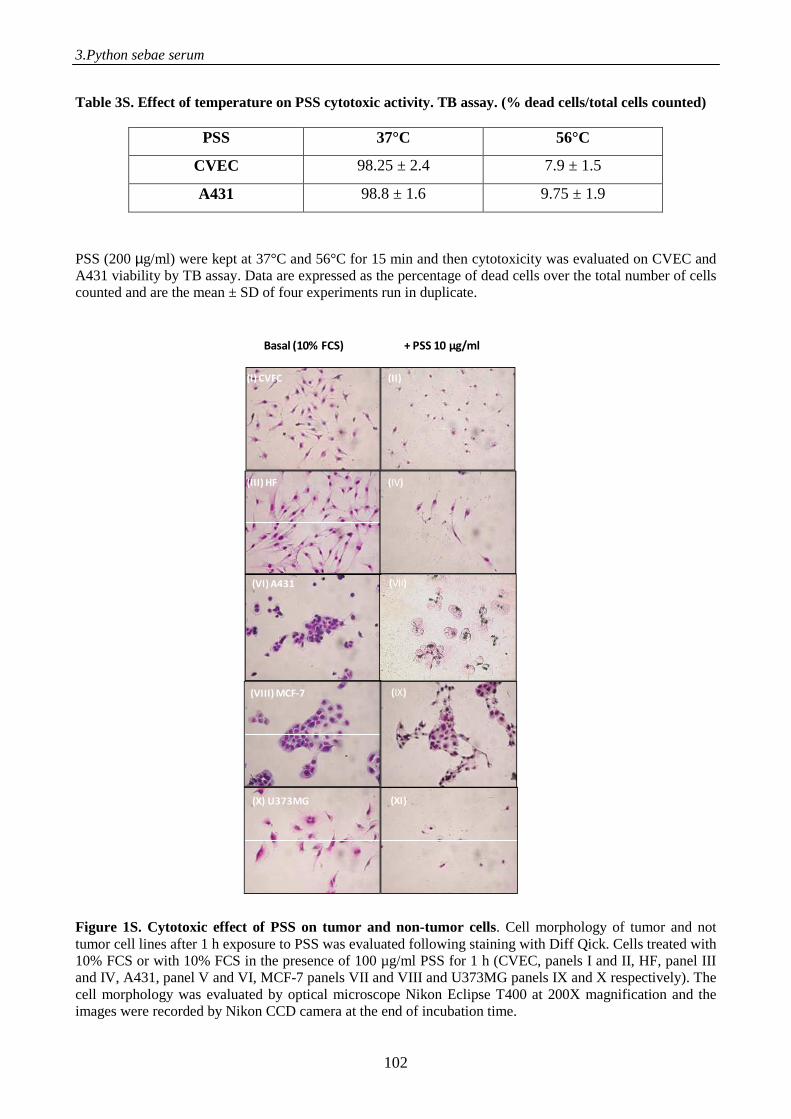
3.Python sebae serum
102
Table 3S. Effect of temperature on PSS cytotoxic activity. TB assay. (% dead cells/total cells counted)
PSS 37°C 56°C
CVEC 98.25 ± 2.4 7.9 ± 1.5
A431 98.8 ± 1.6 9.75 ± 1.9
PSS (200 µg/ml) were kept at 37°C and 56°C for 15 min and then cytotoxicity was evaluated on CVEC and A431 viability by TB assay. Data are expressed as the percentage of dead cells over the total number of cells counted and are the mean ± SD of four experiments run in duplicate.
Figure 1S. Cytotoxic effect of PSS on tumor and non-tumor cells. Cell morphology of tumor and not tumor cell lines after 1 h exposure to PSS was evaluated following staining with Diff Qick. Cells treated with 10% FCS or with 10% FCS in the presence of 100 µg/ml PSS for 1 h (CVEC, panels I and II, HF, panel III and IV, A431, panel V and VI, MCF-7 panels VII and VIII and U373MG panels IX and X respectively). The cell morphology was evaluated by optical microscope Nikon Eclipse T400 at 200X magnification and the images were recorded by Nikon CCD camera at the end of incubation time.
(VIII) MCF-7 (IX)
(X) U373MG (XI)
(VI) A431
(I) CVEC (II)
(III) HF (IV)
(VII)
Basal (10% FCS) + PSS 10 µg/ml
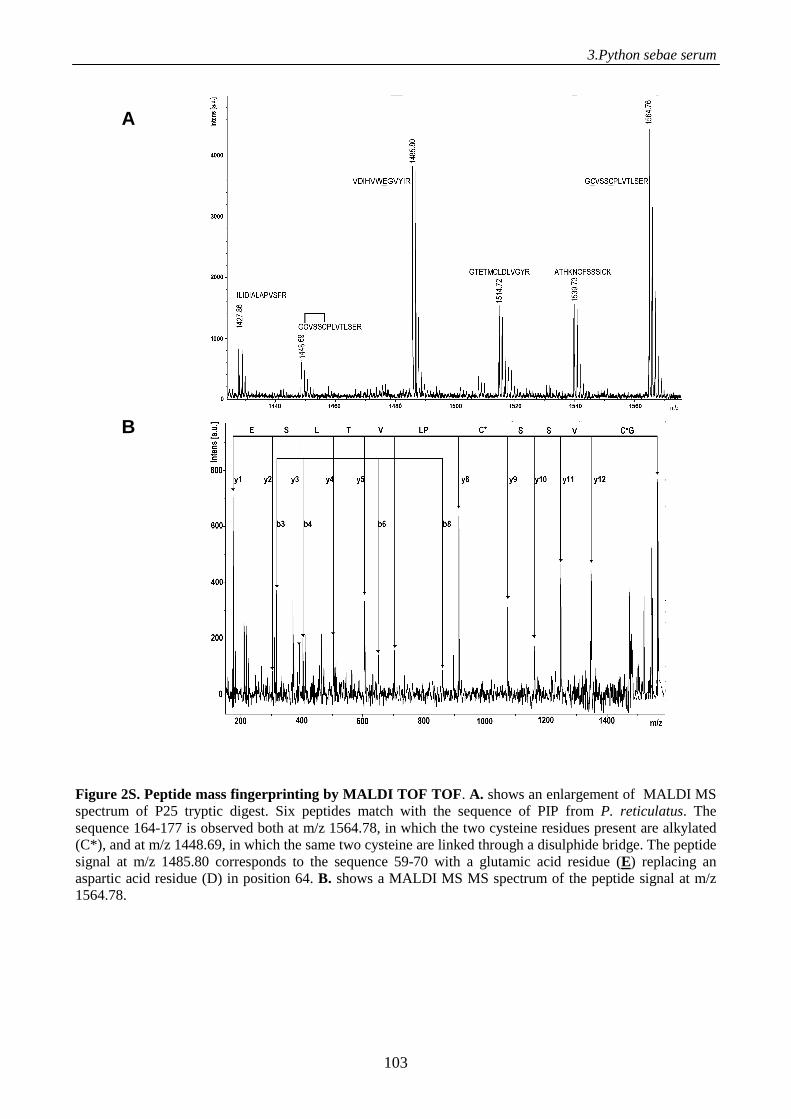
3.Python sebae serum
103
Figure 2S. Peptide mass fingerprinting by MALDI TOF TOF. A. shows an enlargement of MALDI MS spectrum of P25 tryptic digest. Six peptides match with the sequence of PIP from P. reticulatus. The sequence 164-177 is observed both at m/z 1564.78, in which the two cysteine residues present are alkylated (C*), and at m/z 1448.69, in which the same two cysteine are linked through a disulphide bridge. The peptide signal at m/z 1485.80 corresponds to the sequence 59-70 with a glutamic acid residue (E) replacing an aspartic acid residue (D) in position 64. B. shows a MALDI MS MS spectrum of the peptide signal at m/z 1564.78.
A
B

4. ALANINE:GLYOXYLATE AMINOTRANSFERASE (AGT)

4.alanine:glyoxylate aminotransferase
107
CHAPTER 4
Molecular defects of the glycine 41 variants of alanine:glyoxylate
aminotransferase associated with primary hyperoxaluria type I.
Barbara Cellinia,1, Riccardo Montiolia,1, Alessandro Paiardinib, Antonio Lorenzettoa, Fabio Masetc, Tiziana Bellinid, Elisa Oppicia and Carla Borri Voltattornia
aDipartimento di Scienze Morfologico-Biomediche, Sezione di Chimica Biologica, Facoltà di Medicina e Chirurgia, Università degli Studi di Verona, Strada Le Grazie, 8, 37134 Verona, Italy; bDipartimento di Scienze Biochimiche "A. Rossi Fanelli" and Centro di Biologia Molecolare del Consiglio Nazionale delle Ricerche, Università "La Sapienza", 00185 Roma, Italy; cDipartimento di Scienze Farmaceutiche, Università di Padova, via F. Marzolo 5, 35131 Padova, Italy; dDipartimento di Biochimica e Biologia Molecolare, Università di Ferrara, via Borsari 46 44100 Ferrara, Italy. 1B.C. and R.M. contributed equally to this work Published in Proc Natl Acad Sci U S A. 2010;107(7):2896-901
INTRODUCTION
Alanine:glyoxylate aminotransferase (AGT) is a homodimeric pyridoxal 5’-phosphate (PLP)
dependent enzyme which catalyzes the interconversion of L-alanine and glyoxylate into pyruvate
and glycine. Human AGT has been cloned, expressed in E. coli and purified. The enzyme crystal
structure, complexed with the competitive inhibitor amino-oxyacetic acid, was determined at a
resolution of 2.5 Å. Each subunit includes a N-terminal extension (residues 1-21), a large N-
terminal domain (residues 22-282) containing the PLP-binding lysine (K209), and a smaller C-
terminal domain (residues 283-392) (1). Steady-state and pre-steady-state kinetic studies featuring
the AGT transamination revealed high specificity for glyoxylate to glycine processing, consistent
with a key role of AGT in glyoxylate detoxification (2). The human liver-specific AGT is localized
in the peroxisomal matrix (3). The enzyme has been the focus of extensive clinical research because
its functional deficiency causes primary hyperoxaluria type 1 (PH1). PH1 is a rare autosomal
recessive disorder characterized by excessive synthesis and excretion of oxalate and glycolate, and
progressive accumulation of insoluble oxalate in kidneys and urinary tract (4). The AGT gene
(AGXT) occurs normally as one of the two allelic forms: the major (AGT-Ma) or minor (AGT-Mi)
alleles. The latter, comprising two coding polymorphisms, P11L and I340M, and a non-coding
4.alanine:glyoxylate aminotransferase
108
duplication in intron 1 (5), has no dramatic effect on the properties of AGT. To date, well over one
hundred pathogenic mutations associated to AGT-Ma and/or AGT-Mi are known (6). Three
categories of enzymatic phenotypes causing PH1 can be identified: deficiency of AGT catalytic
activity but not AGT immunoreactivity, catalytic activity and immunoreactivity deficiency, and
mistargeting to mitochondria (4, 7). Notably, clinical data for single PH1 AGT mutations are
generally limited to a small number of individuals, which may interfere with identifying clear
correlations between disease characteristics and properties of mutant proteins. Currently, the way of
treatment of this progressive and potentially fatal disease is poor, as the molecular bases of the
effects of the various disease-associated point mutations are unknown. In the last years, a
biochemical characterization of the pathogenic variants G82E-Ma and F152I-Mi allowed us to
correlate the clinical and enzymatic phenotypes with the structural and functional properties of the
corresponding variants (2,8).
The G41 series of pathogenic mutations, including the G41R encoded on the background of the
major (G41R-Ma) and the minor (G41R-Mi) alleles, and the G41V, which only co-segregates with
the major allele (G41V-Ma), is of special interest because (i) G41 is an interfacial residue making
van der Waals contacts with the same residue of the other subunit and belongs to an α-helix
connected with the active site loop 24-32 (Fig. S1), (ii) G41R mutation is more severe when occurs
on AGT-Mi than on AGT-Ma (4), and (iii) responsiveness to pyridoxine therapy for the patients
bearing these mutations is so far unknown (9). Previous clinical and cell biochemical studies
suggested that the weakening of the dimeric structure of AGT consequent to G41 replacements
could be responsible for depletion of immunoreactive AGT, its intraperoxisomal aggregation (4,
10), and sensitivity to proteasomal degradation (11,12). Since formal proves of the effect of these
mutations at the molecular level are so far absent, we thought to provide insights into the molecular
basis of the G41 mutation’s pathogenicity. Biochemical data indicate for the first time that G41
mutations, besides causing a weakening of the intersubunit interaction, alter the conformational
state of the AGT dimeric form, reduce its resistance to thermal inactivation and unfolding, and
induce susceptibility to proteolytic degradation and self-aggregation. Moreover, predictions of the
structural effects caused by G41 mutation by means of molecular dynamics (MD) provide a
possible interpretation and explanation of our in vitro results.
4.alanine:glyoxylate aminotransferase
109
MATERIALS AND METHODS
Construction, expression and purification of G41 variant. AGT-Ma and AGT-Mi were prepared
as reported (2, 8). Site-directed mutagenesis, expression and purification of G41 variants in the C-
terminal His-tagged form were performed using standard procedures as described under SI.
Enzyme activity assays. Pyruvate formation was measured by the spectrophotometric assay already
reported (2). Kinetic parameters for the pair alanine/glyoxylate of G41 variants were determined in
the presence of 150 µM PLP by varying the substrate concentrations at a fixed saturating co-
substrate concentration. Data were fitted to the Michaelis-Menten equation. Thermal inactivation
experiments were performed as follows: enzyme (10 µM) was incubated for 10 min in 100 mM
potassium phosphate buffer, pH 7.4, at different temperatures, and then chilled on ice.
Transaminase activity was measured as indicated above.
Binding affinity for PLP. The KD(PLP) of G41 variants were determined by measuring the PLP-
induced changes either on the intrinsic fluorescence or in the CD visible spectrum of the
apoenzymes. The experimental conditions and the relative data analysis are given in the SI.
Cross-linking and SEC experiments. Photo-induced cross-linking with TBPR was performed as
previously described (7). SEC experiments were done on an Akta FPLC system (GE Healthcare)
using a custom packed Sephacryl S-300 10/600 column. The data were analyzed according to the
method of Manning et al. (16). Details are given in SI.
Proteinase K digestion and mass spectrometry analysis. Holo and apo AGT-Ma, AGT-Mi and
G41 variants (15 µM) were treated with proteinase K in 100 mM potassium phosphate buffer, pH
7.4, at 25°C at various AGT/proteinase K (w/w) ratios. At various times, 15 µl-aliquots were
withdrawn from the reaction mixtures and subjected to enzymatic activity assay, SDS-PAGE and
immunoblotting. The reaction was stopped by adding PMSF or EGTA to a final concentration of 2
mM to each aliquot. After staining with Coomassie Blue the band intensities were visualized and
analyzed using ImageJ software (Wajne Rasband, Bethesda, NY). Immunoblotting was made as
described in SI. LC-MS analyses of G41R-Mi were carried out with a model Mariner Esi-Tof
spectrometer from PerSeptive Biosystems (Stafford, TX) connected to a C4 Grace-Vydac
microbore column (1 x 50 mm). Column elution was carried out with a CH3CN-1% HCOOH
gradient from 1 to 80% in 30 min. Proteolysis reaction of G41R-Mi with proteinase K was analyzed
4.alanine:glyoxylate aminotransferase
110
with a model 4800 Plus MALDI TOF-TOF instrument from Applied Biosystems (Foster City, CA).
Samples were desalted on a P10 C4 Zip-Tip (Bedford, MA), eluted with a sinapinic acid (Sigma)
saturated solution (2 µl) in CH3CN:H2O (60:40 by vol). Details are given in supporting information.
Turbidimetry measurements. The aggregation experiments were carried out in potassium
phosphate buffer, pH 7.4, at different I values and/or different enzyme concentrations. The turbidity
was monitored by measuring the absorbance at 600 nm as already reported (17).
DLS measurements. DLS measurements were made on a Zetasizer Nano S device from Malvern
Instruments (Malvern, Worcestershire, UK). The temperature of sample cell was controlled by a
thermostating system within ± 0.1 °C and 12.5 x 45-mm disposable cells with stopper were used.
To study the aggregation kinetics, an aliquot of each enzymatic species was diluted to a final
concentration of 4 µM in potassium phosphate buffer pH 7.4 at the desired I and temperature. PLP
was added to the holoenzyme solutions to a final concentration of 60 µM. The buffer was filtered
immediately before use to eliminate any impurities. TMAO or betaine were added to the buffer
before the addition of G41R-Mi.
Spectroscopic measurements. Absorption, fluorescence and CD spectra were performed as
described under supporting information.
Difference Scanning Calorimetry. DSC experiments were conducted with a VP-DSC
microcalorimeter (Microcal) in the temperature interval from 20 to 90 °C, with a scan rate of 90
°C/hour in 100 mM potassium phosphate buffer, pH 7.4, and at 5.5 µM protein concentration.
Computational analyses. MD simulations of the molecular models of AGT-Mi and G41R-Mi,
derived from the crystal structure of human AGT (1), downloaded from Brookhaven Protein Data
Bank (PDB) (18), were performed. A detailed description of the generation of these structures and
MD simulations is given in supporting information. Electrostatic computations on AGT-Mi and its
N-terminus deleted form were carried out by solving the nonlinear Poisson-Boltzmann equation,
one of the most popular continuum models for describing electrostatic interactions between
molecular solutes in salty, aqueous media. Adaptive Poisson Boltzman Solver was used to this
purpose (19), with a protein and solvent dielectric of 2.0 and 80.0, respectively, and I = 150 mM .
4.alanine:glyoxylate aminotransferase
111
RESULTS
G41 mutations affect the spectral features and the coenzyme binding affinity. Like AGT-Ma
and AGT-Mi, G41 variants bind 2 mol of PLP per dimer, and exhibit visible absorbance and CD
spectra similar to those of AGT-Ma or AGT-Mi, even if their absorbance and dichroic maxima are
about 10-12 nm blue shifted (Fig. S2 and inset). The KD(PLP) values for G41R-Ma, G41V-Ma and
G41R-Mi were found to be 1.5 ± 0.4 µM, 0.55 ± 0.1 µM and 6.0 ± 0.5 µM, respectively, that are ~
6-, 2- and 23-fold higher than that of AGT-Ma or AGT-Mi (2, 8). Both AGT-Ma and AGT-Mi bind
pyridoxamine 5’-phosphate (PMP) with a KD(PMP) value << 0.1 µM, while even a prolonged time of
incubation of the apo forms of G41 variants with PMP (up to 5 mM) does not result in a dichroic
signal at 340 nm, typical of the AGT-PMP complex (2). Thus, G41 mutations exert a decrease in
the PLP binding affinity and a dramatic reduction in the PMP binding affinity. The comparison of
near-UV CD spectra as well as of intrinsic and 1-anilinonaphthalene sulfonic acid (ANS)
fluorescence spectra of AGT-Ma, AGT-Mi and G41 variants provides evidence that a different
conformation exists between each apoenzymatic form and the corresponding holo form, and
between the holo and apo forms of G41 variants and the corresponding forms of AGT-Ma or AGT-
Mi (Fig. S3A and B). These data imply that (i) conformational changes seem to accompany the apo
to holo transition for each enzymatic form, and (ii) G41 mutations affect the overall conformation
of both holo and apo AGT.
The far-UV CD spectra of G41 variants have been compared with those of AGT-Ma and AGT-
Mi. All spectra exhibit minima at 210 and 222 nm, typical of proteins containing appreciable
amounts of α-helix. However, spectra deconvolution reveals that AGT-Ma, AGT-Mi and G41V-Ma
have an identical composition of the overall secondary structure, while both G41R-Ma and G41R-
Mi display about 5% less α-helical content.
G41 mutations slightly affect the kinetic parameters. The kinetic parameters of AGT-Ma, AGT-
Mi and G41 variants for the pair alanine-glyoxylate are reported in Table S1. The Km values of G41
variants for L-alanine and glyoxylate are not significantly altered while the kcat values decrease by
1.5-3.5-fold as compared to those of the corresponding AGT-Ma and AGT-Mi. Altogether, these
data indicate that the G41 mutations slightly affect the catalytic properties of AGT.
G41 mutations increase the dimer-monomer equilibrium dissociation constant (Kd). As a first
step to investigate the impact of G41 mutations on the AGT dimeric structure, photo-induced cross-
linking experiments with Tris(2,2’-bipyridyl) ruthenium(II) chloride (TBPR) have been carried out
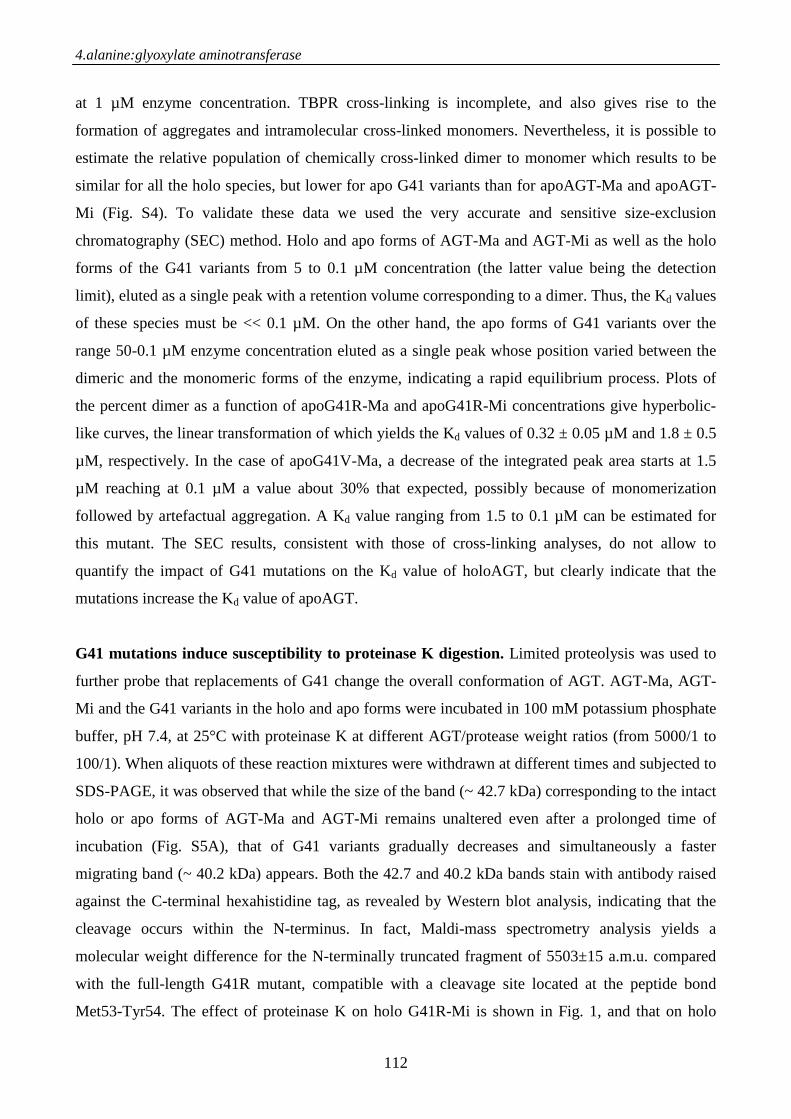
4.alanine:glyoxylate aminotransferase
112
at 1 µM enzyme concentration. TBPR cross-linking is incomplete, and also gives rise to the
formation of aggregates and intramolecular cross-linked monomers. Nevertheless, it is possible to
estimate the relative population of chemically cross-linked dimer to monomer which results to be
similar for all the holo species, but lower for apo G41 variants than for apoAGT-Ma and apoAGT-
Mi (Fig. S4). To validate these data we used the very accurate and sensitive size-exclusion
chromatography (SEC) method. Holo and apo forms of AGT-Ma and AGT-Mi as well as the holo
forms of the G41 variants from 5 to 0.1 µM concentration (the latter value being the detection
limit), eluted as a single peak with a retention volume corresponding to a dimer. Thus, the Kd values
of these species must be << 0.1 µM. On the other hand, the apo forms of G41 variants over the
range 50-0.1 µM enzyme concentration eluted as a single peak whose position varied between the
dimeric and the monomeric forms of the enzyme, indicating a rapid equilibrium process. Plots of
the percent dimer as a function of apoG41R-Ma and apoG41R-Mi concentrations give hyperbolic-
like curves, the linear transformation of which yields the Kd values of 0.32 ± 0.05 µM and 1.8 ± 0.5
µM, respectively. In the case of apoG41V-Ma, a decrease of the integrated peak area starts at 1.5
µM reaching at 0.1 µM a value about 30% that expected, possibly because of monomerization
followed by artefactual aggregation. A Kd value ranging from 1.5 to 0.1 µM can be estimated for
this mutant. The SEC results, consistent with those of cross-linking analyses, do not allow to
quantify the impact of G41 mutations on the Kd value of holoAGT, but clearly indicate that the
mutations increase the Kd value of apoAGT.
G41 mutations induce susceptibility to proteinase K digestion. Limited proteolysis was used to
further probe that replacements of G41 change the overall conformation of AGT. AGT-Ma, AGT-
Mi and the G41 variants in the holo and apo forms were incubated in 100 mM potassium phosphate
buffer, pH 7.4, at 25°C with proteinase K at different AGT/protease weight ratios (from 5000/1 to
100/1). When aliquots of these reaction mixtures were withdrawn at different times and subjected to
SDS-PAGE, it was observed that while the size of the band (~ 42.7 kDa) corresponding to the intact
holo or apo forms of AGT-Ma and AGT-Mi remains unaltered even after a prolonged time of
incubation (Fig. S5A), that of G41 variants gradually decreases and simultaneously a faster
migrating band (~ 40.2 kDa) appears. Both the 42.7 and 40.2 kDa bands stain with antibody raised
against the C-terminal hexahistidine tag, as revealed by Western blot analysis, indicating that the
cleavage occurs within the N-terminus. In fact, Maldi-mass spectrometry analysis yields a
molecular weight difference for the N-terminally truncated fragment of 5503±15 a.m.u. compared
with the full-length G41R mutant, compatible with a cleavage site located at the peptide bond
Met53-Tyr54. The effect of proteinase K on holo G41R-Mi is shown in Fig. 1, and that on holo
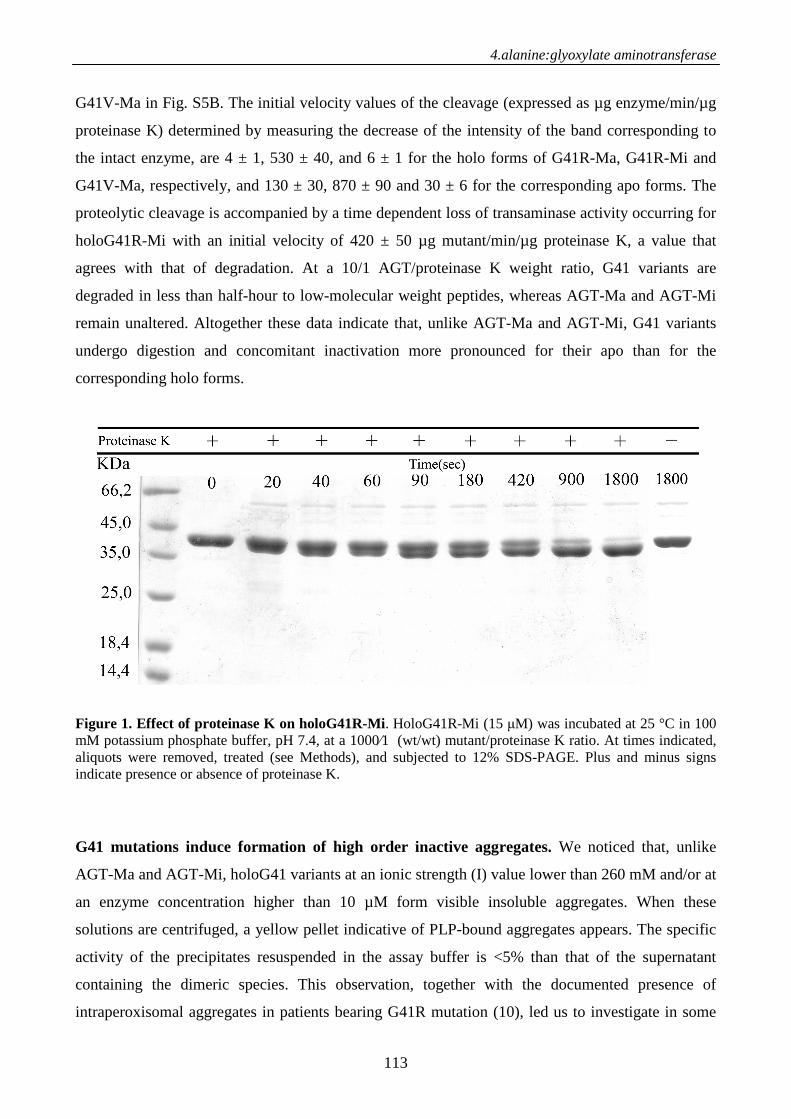
4.alanine:glyoxylate aminotransferase
113
G41V-Ma in Fig. S5B. The initial velocity values of the cleavage (expressed as µg enzyme/min/µg
proteinase K) determined by measuring the decrease of the intensity of the band corresponding to
the intact enzyme, are 4 ± 1, 530 ± 40, and 6 ± 1 for the holo forms of G41R-Ma, G41R-Mi and
G41V-Ma, respectively, and 130 ± 30, 870 ± 90 and 30 ± 6 for the corresponding apo forms. The
proteolytic cleavage is accompanied by a time dependent loss of transaminase activity occurring for
holoG41R-Mi with an initial velocity of 420 ± 50 µg mutant/min/µg proteinase K, a value that
agrees with that of degradation. At a 10/1 AGT/proteinase K weight ratio, G41 variants are
degraded in less than half-hour to low-molecular weight peptides, whereas AGT-Ma and AGT-Mi
remain unaltered. Altogether these data indicate that, unlike AGT-Ma and AGT-Mi, G41 variants
undergo digestion and concomitant inactivation more pronounced for their apo than for the
corresponding holo forms.
Figure 1. Effect of proteinase K on holoG41R-Mi. HoloG41R-Mi (15 µM) was incubated at 25 °C in 100 mM potassium phosphate buffer, pH 7.4, at a 1000⁄1 (wt/wt) mutant/proteinase K ratio. At times indicated, aliquots were removed, treated (see Methods), and subjected to 12% SDS-PAGE. Plus and minus signs indicate presence or absence of proteinase K.
G41 mutations induce formation of high order inactive aggregates. We noticed that, unlike
AGT-Ma and AGT-Mi, holoG41 variants at an ionic strength (I) value lower than 260 mM and/or at
an enzyme concentration higher than 10 µM form visible insoluble aggregates. When these
solutions are centrifuged, a yellow pellet indicative of PLP-bound aggregates appears. The specific
activity of the precipitates resuspended in the assay buffer is <5% than that of the supernatant
containing the dimeric species. This observation, together with the documented presence of
intraperoxisomal aggregates in patients bearing G41R mutation (10), led us to investigate in some
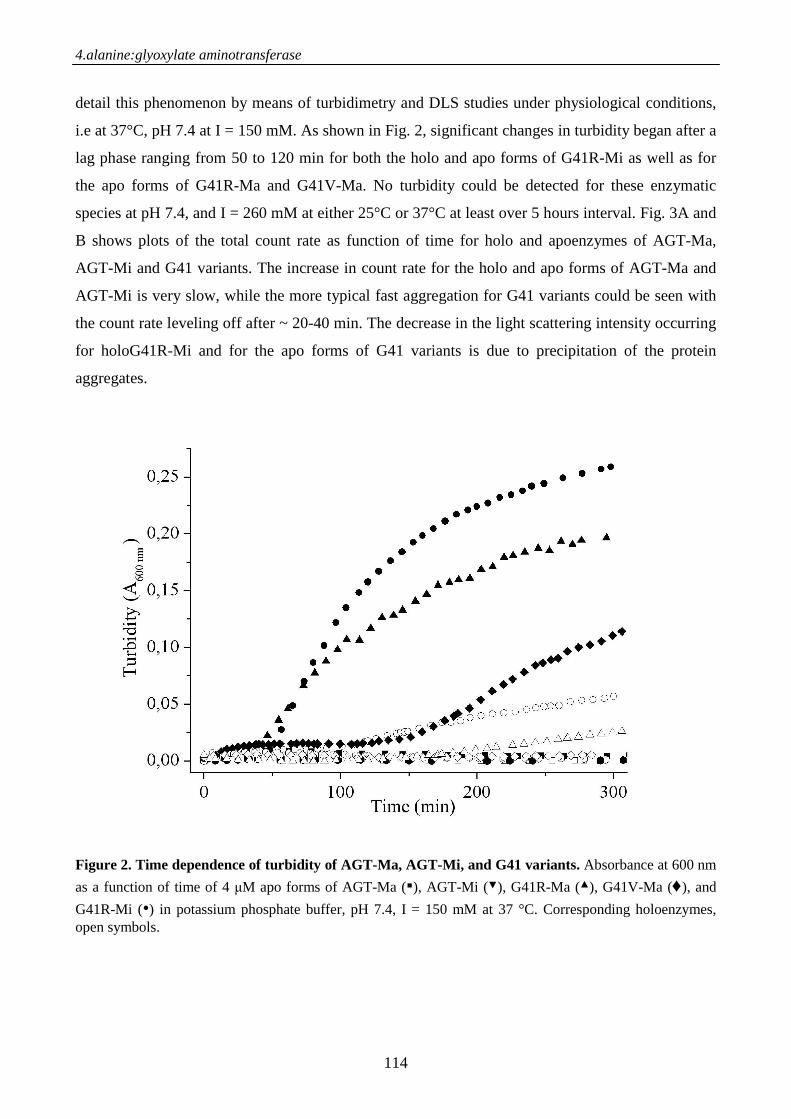
4.alanine:glyoxylate aminotransferase
114
detail this phenomenon by means of turbidimetry and DLS studies under physiological conditions,
i.e at 37°C, pH 7.4 at I = 150 mM. As shown in Fig. 2, significant changes in turbidity began after a
lag phase ranging from 50 to 120 min for both the holo and apo forms of G41R-Mi as well as for
the apo forms of G41R-Ma and G41V-Ma. No turbidity could be detected for these enzymatic
species at pH 7.4, and I = 260 mM at either 25°C or 37°C at least over 5 hours interval. Fig. 3A and
B shows plots of the total count rate as function of time for holo and apoenzymes of AGT-Ma,
AGT-Mi and G41 variants. The increase in count rate for the holo and apo forms of AGT-Ma and
AGT-Mi is very slow, while the more typical fast aggregation for G41 variants could be seen with
the count rate leveling off after ~ 20-40 min. The decrease in the light scattering intensity occurring
for holoG41R-Mi and for the apo forms of G41 variants is due to precipitation of the protein
aggregates.
Figure 2. Time dependence of turbidity of AGT-Ma, AGT-Mi, and G41 variants. Absorbance at 600 nm
as a function of time of 4 µM apo forms of AGT-Ma (▪), AGT-Mi (▾), G41R-Ma (▴), G41V-Ma (♦), and
G41R-Mi (•) in potassium phosphate buffer, pH 7.4, I = 150 mM at 37 °C. Corresponding holoenzymes, open symbols.
4.alanine:glyoxylate aminotransferase
115
Figure 3. Time-dependence of total count rate (measured as kilo counts per second) of AGT-Ma, AGT-Mi, and G41 variants in the holo (A) and apo (B) forms. Measurements performed at 4 µM enzyme concentration, 37 °C, I = 150 mM, pH 7.4. Color code: black, AGT-Ma; red, AGT-Mi; blue, G41R-Ma; green, G41V-Ma; fuchsia, G41R-Mi.
Altogether, the turbidity and DLS data indicate that (i) replacements of G41 are responsible for
the propensity of mutants to self-association, the extent of which is more pronounced for the apo
forms than for the corresponding holo forms, and (ii) G41R-Mi results the variant most prone to
aggregation. The molecular size of the species present in the enzymic solutions has been also
evaluated. The particle size of the dimeric form of AGT-Ma, AGT-Mi and G41 variants, measured
at 25°C, pH 7.4, at I = 260 mM, i.e. under conditions of no detectable association, is about 10 nm.
This value is consistent either with that (9.32 nm) derived from the X-ray structure (1) or that (7 ± 2
nm) calculated by an appropriate empirical equation (13). When the aggregation process occurring
under the physiological conditions mentioned above was followed by DLS, the time dependence of
the apparent particle size indicates that the 10 nm species is always present for holo and apo AGT-
Ma and holoAGT-Mi, although small aggregates (100-800 nm) appear after about 30 min (Fig. 4A
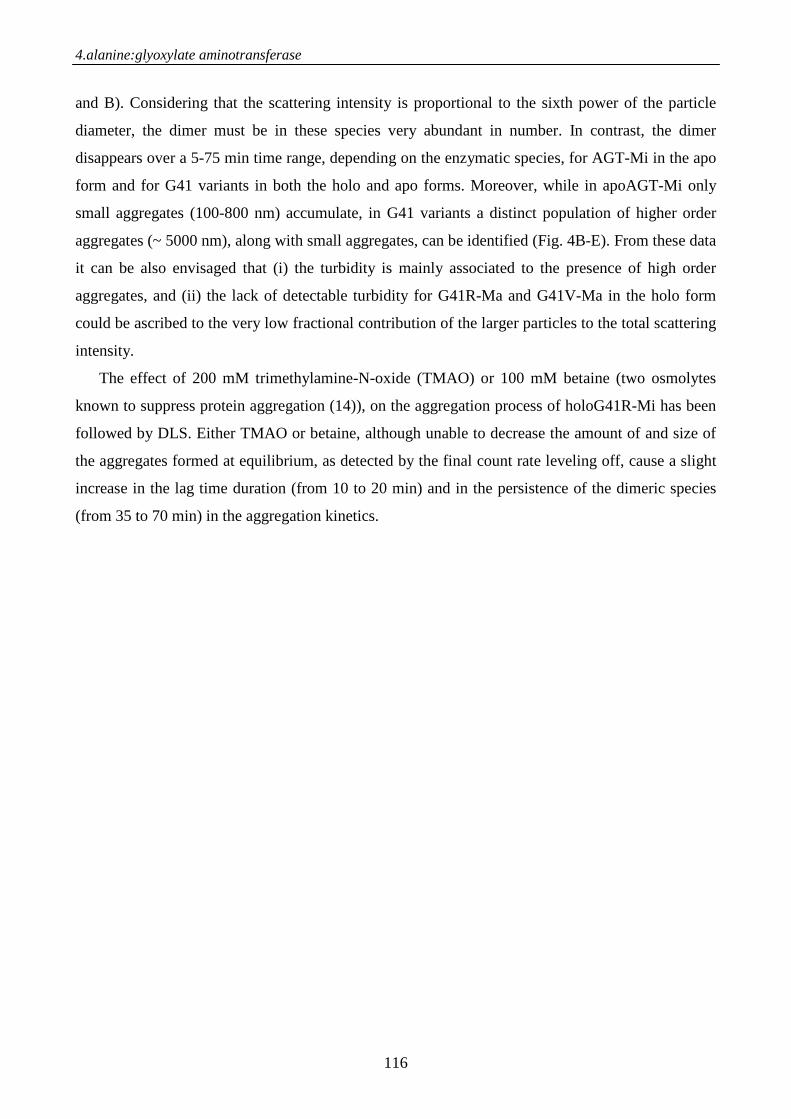
4.alanine:glyoxylate aminotransferase
116
and B). Considering that the scattering intensity is proportional to the sixth power of the particle
diameter, the dimer must be in these species very abundant in number. In contrast, the dimer
disappears over a 5-75 min time range, depending on the enzymatic species, for AGT-Mi in the apo
form and for G41 variants in both the holo and apo forms. Moreover, while in apoAGT-Mi only
small aggregates (100-800 nm) accumulate, in G41 variants a distinct population of higher order
aggregates (~ 5000 nm), along with small aggregates, can be identified (Fig. 4B-E). From these data
it can be also envisaged that (i) the turbidity is mainly associated to the presence of high order
aggregates, and (ii) the lack of detectable turbidity for G41R-Ma and G41V-Ma in the holo form
could be ascribed to the very low fractional contribution of the larger particles to the total scattering
intensity.
The effect of 200 mM trimethylamine-N-oxide (TMAO) or 100 mM betaine (two osmolytes
known to suppress protein aggregation (14)), on the aggregation process of holoG41R-Mi has been
followed by DLS. Either TMAO or betaine, although unable to decrease the amount of and size of
the aggregates formed at equilibrium, as detected by the final count rate leveling off, cause a slight
increase in the lag time duration (from 10 to 20 min) and in the persistence of the dimeric species
(from 35 to 70 min) in the aggregation kinetics.
4.alanine:glyoxylate aminotransferase
117
Figure 4. Time dependence of the apparent diameters of AGT-Ma, AGT-Mi, and G41 variants. Experimental conditions (see legend to Fig. 3). (A) holo and apo AGT-Ma. (B) holo and apo AGT-Mi. (C) holo and apo G41R-Ma. (D) holo and apo G41V-Ma. (E) holo and apo G41R-Mi. Color code: black, holo dimer; green, apo dimer; red, holo small aggregates; blue, apo small aggregates; cyan, holo high aggregates; fuchsia, apo high aggregates.
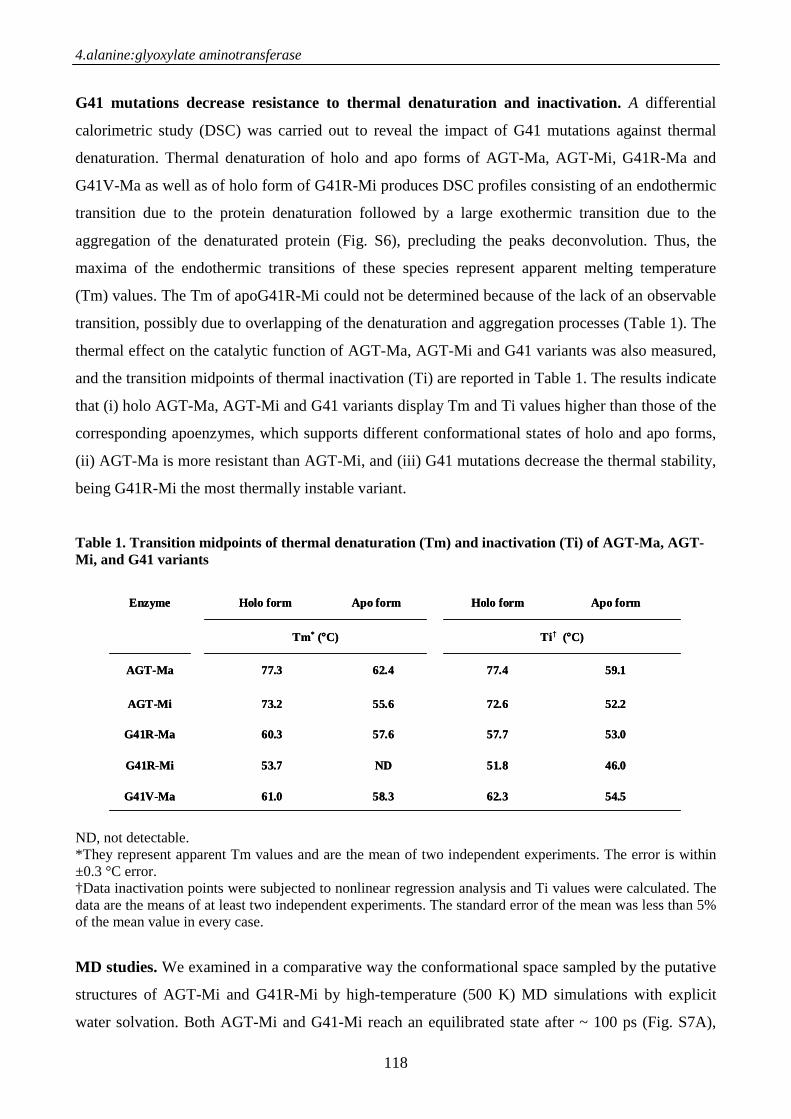
4.alanine:glyoxylate aminotransferase
118
G41 mutations decrease resistance to thermal denaturation and inactivation. A differential
calorimetric study (DSC) was carried out to reveal the impact of G41 mutations against thermal
denaturation. Thermal denaturation of holo and apo forms of AGT-Ma, AGT-Mi, G41R-Ma and
G41V-Ma as well as of holo form of G41R-Mi produces DSC profiles consisting of an endothermic
transition due to the protein denaturation followed by a large exothermic transition due to the
aggregation of the denaturated protein (Fig. S6), precluding the peaks deconvolution. Thus, the
maxima of the endothermic transitions of these species represent apparent melting temperature
(Tm) values. The Tm of apoG41R-Mi could not be determined because of the lack of an observable
transition, possibly due to overlapping of the denaturation and aggregation processes (Table 1). The
thermal effect on the catalytic function of AGT-Ma, AGT-Mi and G41 variants was also measured,
and the transition midpoints of thermal inactivation (Ti) are reported in Table 1. The results indicate
that (i) holo AGT-Ma, AGT-Mi and G41 variants display Tm and Ti values higher than those of the
corresponding apoenzymes, which supports different conformational states of holo and apo forms,
(ii) AGT-Ma is more resistant than AGT-Mi, and (iii) G41 mutations decrease the thermal stability,
being G41R-Mi the most thermally instable variant.
Table 1. Transition midpoints of thermal denaturation (Tm) and inactivation (Ti) of AGT-Ma, AGT-Mi, and G41 variants
ND, not detectable. *They represent apparent Tm values and are the mean of two independent experiments. The error is within ±0.3 °C error. †Data inactivation points were subjected to nonlinear regression analysis and Ti values were calculated. The data are the means of at least two independent experiments. The standard error of the mean was less than 5% of the mean value in every case.
MD studies. We examined in a comparative way the conformational space sampled by the putative
structures of AGT-Mi and G41R-Mi by high-temperature (500 K) MD simulations with explicit
water solvation. Both AGT-Mi and G41-Mi reach an equilibrated state after ~ 100 ps (Fig. S7A),
G41V-Ma
G41R-Mi
G41R-Ma
AGT-Mi
AGT-Ma
Enzyme
54.562.358.361.0
46.051.8ND53.7
53.057.757.660.3
52.272.655.673.2
59.177.462.477.3
Ti† (°C)Tm* (°C)
Apo formHolo formApo formHolo form
G41V-Ma
G41R-Mi
G41R-Ma
AGT-Mi
AGT-Ma
Enzyme
54.562.358.361.0
46.051.8ND53.7
53.057.757.660.3
52.272.655.673.2
59.177.462.477.3
Ti† (°C)Tm* (°C)
Apo formHolo formApo formHolo form
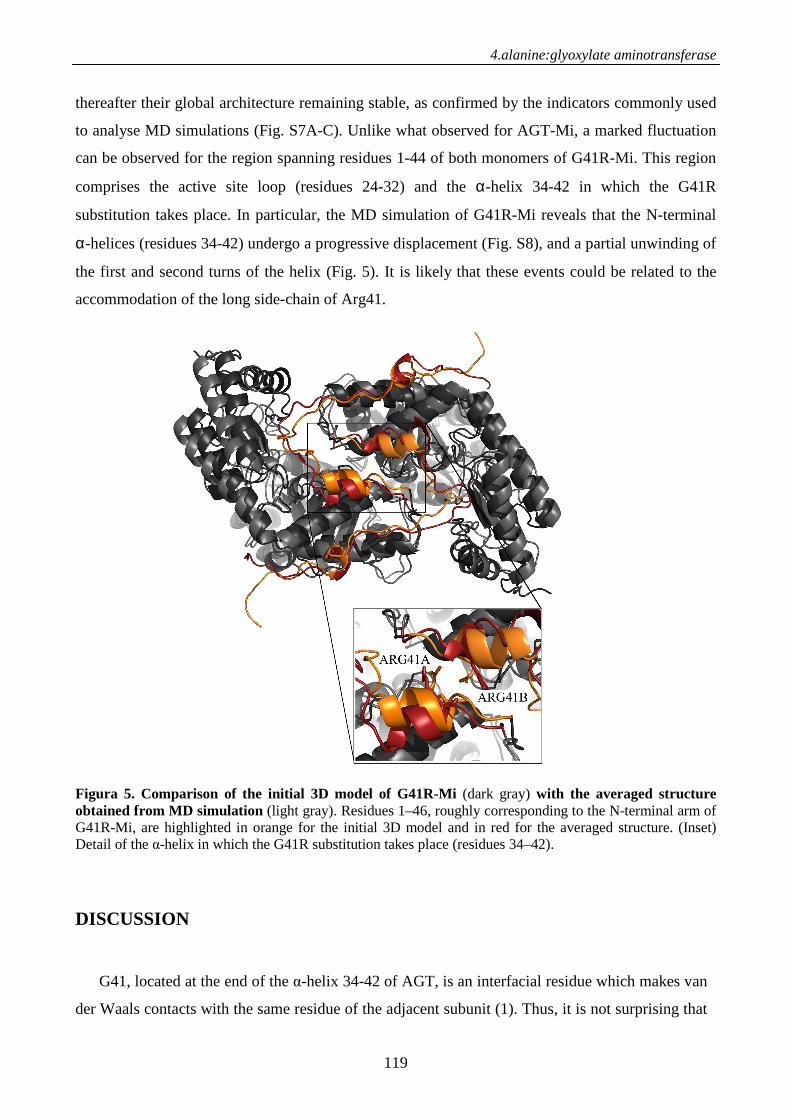
4.alanine:glyoxylate aminotransferase
119
thereafter their global architecture remaining stable, as confirmed by the indicators commonly used
to analyse MD simulations (Fig. S7A-C). Unlike what observed for AGT-Mi, a marked fluctuation
can be observed for the region spanning residues 1-44 of both monomers of G41R-Mi. This region
comprises the active site loop (residues 24-32) and the α-helix 34-42 in which the G41R
substitution takes place. In particular, the MD simulation of G41R-Mi reveals that the N-terminal
α-helices (residues 34-42) undergo a progressive displacement (Fig. S8), and a partial unwinding of
the first and second turns of the helix (Fig. 5). It is likely that these events could be related to the
accommodation of the long side-chain of Arg41.
Figura 5. Comparison of the initial 3D model of G41R-Mi (dark gray) with the averaged structure obtained from MD simulation (light gray). Residues 1–46, roughly corresponding to the N-terminal arm of G41R-Mi, are highlighted in orange for the initial 3D model and in red for the averaged structure. (Inset) Detail of the α-helix in which the G41R substitution takes place (residues 34–42).
DISCUSSION
G41, located at the end of the α-helix 34-42 of AGT, is an interfacial residue which makes van
der Waals contacts with the same residue of the adjacent subunit (1). Thus, it is not surprising that
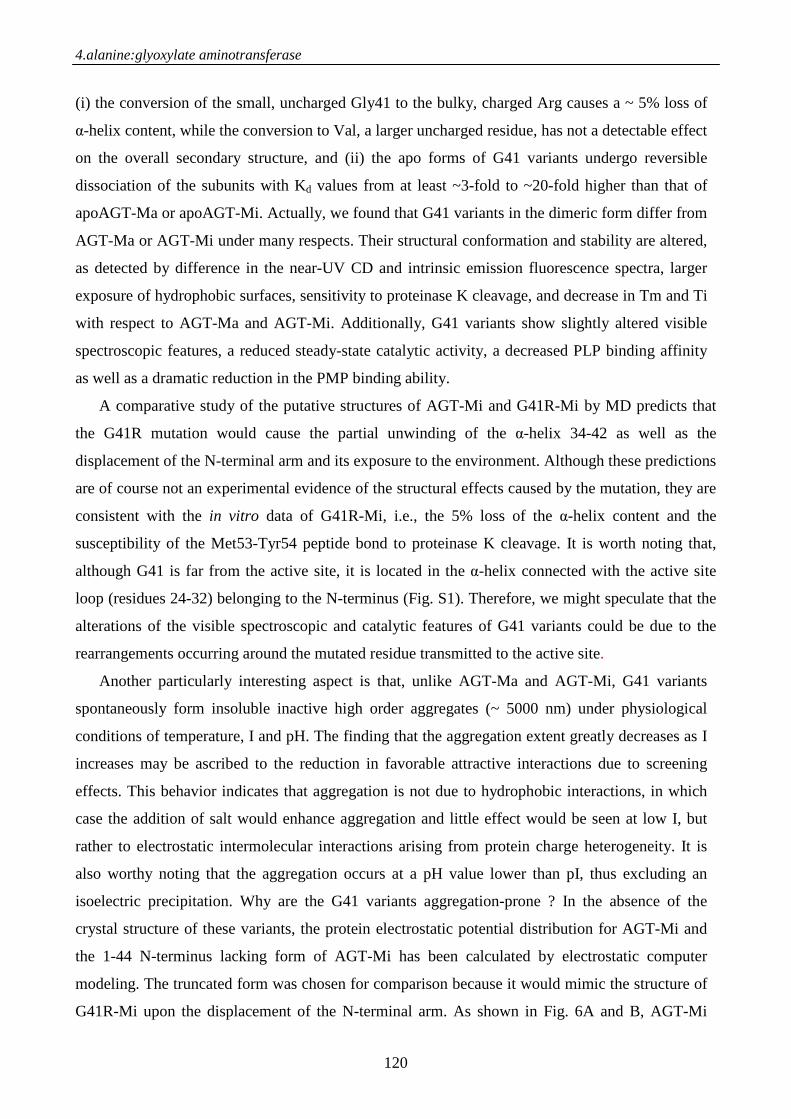
4.alanine:glyoxylate aminotransferase
120
(i) the conversion of the small, uncharged Gly41 to the bulky, charged Arg causes a ~ 5% loss of
α-helix content, while the conversion to Val, a larger uncharged residue, has not a detectable effect
on the overall secondary structure, and (ii) the apo forms of G41 variants undergo reversible
dissociation of the subunits with Kd values from at least ~3-fold to ~20-fold higher than that of
apoAGT-Ma or apoAGT-Mi. Actually, we found that G41 variants in the dimeric form differ from
AGT-Ma or AGT-Mi under many respects. Their structural conformation and stability are altered,
as detected by difference in the near-UV CD and intrinsic emission fluorescence spectra, larger
exposure of hydrophobic surfaces, sensitivity to proteinase K cleavage, and decrease in Tm and Ti
with respect to AGT-Ma and AGT-Mi. Additionally, G41 variants show slightly altered visible
spectroscopic features, a reduced steady-state catalytic activity, a decreased PLP binding affinity
as well as a dramatic reduction in the PMP binding ability.
A comparative study of the putative structures of AGT-Mi and G41R-Mi by MD predicts that
the G41R mutation would cause the partial unwinding of the α-helix 34-42 as well as the
displacement of the N-terminal arm and its exposure to the environment. Although these predictions
are of course not an experimental evidence of the structural effects caused by the mutation, they are
consistent with the in vitro data of G41R-Mi, i.e., the 5% loss of the α-helix content and the
susceptibility of the Met53-Tyr54 peptide bond to proteinase K cleavage. It is worth noting that,
although G41 is far from the active site, it is located in the α-helix connected with the active site
loop (residues 24-32) belonging to the N-terminus (Fig. S1). Therefore, we might speculate that the
alterations of the visible spectroscopic and catalytic features of G41 variants could be due to the
rearrangements occurring around the mutated residue transmitted to the active site.
Another particularly interesting aspect is that, unlike AGT-Ma and AGT-Mi, G41 variants
spontaneously form insoluble inactive high order aggregates (~ 5000 nm) under physiological
conditions of temperature, I and pH. The finding that the aggregation extent greatly decreases as I
increases may be ascribed to the reduction in favorable attractive interactions due to screening
effects. This behavior indicates that aggregation is not due to hydrophobic interactions, in which
case the addition of salt would enhance aggregation and little effect would be seen at low I, but
rather to electrostatic intermolecular interactions arising from protein charge heterogeneity. It is
also worthy noting that the aggregation occurs at a pH value lower than pI, thus excluding an
isoelectric precipitation. Why are the G41 variants aggregation-prone ? In the absence of the
crystal structure of these variants, the protein electrostatic potential distribution for AGT-Mi and
the 1-44 N-terminus lacking form of AGT-Mi has been calculated by electrostatic computer
modeling. The truncated form was chosen for comparison because it would mimic the structure of
G41R-Mi upon the displacement of the N-terminal arm. As shown in Fig. 6A and B, AGT-Mi
4.alanine:glyoxylate aminotransferase
121
displays a highly positive charge distribution around its surface, while the truncated form exhibits
a clear dipole segregation of charges. In fact, the depletion of the highly positively charged N-
terminal arm of AGT-Mi leads to the exposure of several negatively charged residues (Asp51,
Glu59, Glu62, Glu274, Glu281, Asp344, Glu346 of each monomer), i.e to a condition of
electrostatically-driven self-aggregation of AGT. Thus, one can reason out that the fluctuation of
the N-terminus in G41R-Mi could cause the exposure of negative charged residues similar to that
observed for the truncated AGT form. Although this could be a plausible explanation for the
propensity of G41 variants to aggregate spontaneously, a conclusive evidence for this
interpretation is lacking.
Figure 6. Electrostatic potential surface maps of AGT-Mi and its truncated form. Electrostatic gradient and map (kT⁄e) of AGT-Mi (A), and 1–44 truncated form of AGT-Mi (B).
The finding that G41R-Mi displays structural and functional alterations more pronounced than
G41R-Ma needs to be discussed. The thermal unfolding data indicate that the instability of G41R-
Mi is due to the additive contribution of the polymorphic and pathogenic mutations. The effect of
the polymorphic substitutions is possibly due to P11L in that Pro instead of Leu (i) contributes to
the increase of structural rigidity, (ii) exerts additional constraints to the backbone, since the ring
closure keeps its Ф angle value almost fixed, and (iii) makes hydrophobic interactions with a
surface cavity surrounded by residues Leu14, Glu62, Gly63, Tyr66 and Ala280.
Altogether, our data assist in assessing a picture of the G41 variants enzymatic phenotype
more exhaustive than that previously proposed. The pathogenicity of G41 variants has been until
now related to a disruption of the interface and impairment of dimerization resulting in formation
of monomers with reduced catalytic activity and prone to degradation and/or intraperoxisomal
aggregation (1, 4, 15). Our in vitro results would indicate not only the impact of G41 mutations on
4.alanine:glyoxylate aminotransferase
122
the dimerization but also provide evidence that G41 variants in the dimeric form are prone to
degradation and aggregation. The presence of aggregates only within the peroxisomal matrix in
patients bearing G41R mutation (10) is consistent with this view in that the peroxisomal import
machinery acts on folded dimeric proteins. In any case, it will be important to establish if the
intraperoxisomal aggregates have ultrastructure similarities with the aggregates spontaneously
formed in vitro. If this were the case, the electrostatically-driven protein aggregation between
folded dimers could represent a novel pathogenic mechanism by which G41 inherited mutations
would cause protein aggregation. Indeed, many disease-related genetic mutations are known to
alter the folding or stability of proteins leading to intermediates in which hydrophobic patches
become exposed and prone to self-association.
Overall, our work improves the understanding of the correlation between the genotype and the
enzymatic phenotype, thus allowing us to foresee the response to pyridoxine in patients carrying the
G41 mutations. Administration of pyridoxine to these patients is not sufficient to counteract the
disease because the molecular defects of these variants appear to be related to structural
rearrangements yielding molecules that are both in the apo and the holo forms prone to degradation
and aggregation. A promising therapeutic strategy could be the administration of small molecules
able to stabilize the native state of the protein, thus preventing degradation and aggregation. In this
regard, our preliminary results on the effects of osmolytes on the aggregation behaviour of G41
variants could be an encouraging perspective.
REFERENCES
1. Zhang X, et al. (2003) Crystal structure of alanine:glyoxylate aminotransferase and the
relationship between genotype and enzymatic phenotype in primary hyperoxaluria type 1. J Mol
Biol 331:643–652.
2. Cellini B, Bertoldi M, Montioli R, Paiardini A, Borri Voltattorni C (2007) Human wild-type
alanine:glyoxylate aminotransferase and its naturally occurring G82E variant: Functional
properties and physiological implications. Biochem J 408:39–50.
3. Motley A, et al. (1995) Mammalian alanine/glyoxylate aminotransferase 1 is imported into
peroxisomes via the PTS1 translocation pathway. Increased degeneracy and context specificity
of the mammalian PTS1 motif and implications for the peroxisome- to-mitochondrion
mistargeting of AGT in primary hyperoxaluria type 1. J Cell Biol 131:95–109.
4.alanine:glyoxylate aminotransferase
123
4. Danpure CJ (2005) Molecular etiology of primary hyperoxaluria type 1: New directions for
treatment. Am J Nephrol 25:303–310.
5. Purdue PE, Takada Y, Danpure CJ (1990) Identification of mutations associated with
peroxisome-to-mitochondrion mistargeting of alanine/glyoxylate aminotransferase in primary
hyperoxaluria type 1. J Cell Biol 111:2341–2351.
6. Coulter-Mackie MB, Rumsby G (2004) Genetic heterogeneity in primary hyperoxaluria type 1:
Impact on diagnosis. Mol Genet Metab 83:38–46.
7. Lumb MJ, Danpure CJ (2000) Functional synergism between the most common polymorphism in
human alanine:glyoxylate aminotransferase and four of the most common disease-causing
mutations. J Biol Chem 275:36415–36422.
8. Cellini B, Montioli R, Paiardini A, Lorenzetto A, Voltattorni CB (2009) Molecular insight into
the synergism between the minor allele of human liver peroxisomal alanine:glyoxylate
aminotransferase and the F152I mutation. J Biol Chem 284:8349–8358.
9. Coulter-Mackie MB, Lian Q, Wong SG (2005) Overexpression of human alanine:glyoxylate
aminotransferase in Escherichia coli: Renaturation from guanidine-HCl and affinity for
pyridoxal phosphate co-factor. Protein Expres Purif 41:18–26.
10.Danpure CJ, et al. (1993) Enzymological and mutational analysis of a complex primary
hyperoxaluria type 1 phenotype involving alanine:glyoxylate aminotransferase peroxisome-to-
mitochondrion mistargeting and intraperoxisomal aggregation. Am J Hum Genet 53:417–432.
11.Coulter-Mackie MB, Lian Q (2008) Partial trypsin digestion as an indicator of mis-folding of
mutant alanine:glyoxylate aminotransferase and chaperone effects of specific ligands. Study of a
spectrum of missense mutants. Mol Genet Metab 94:368–374.
12.Coulter-Mackie MB, Lian Q (2006) Consequences of missense mutations for dimerization and
turnover of alanine:glyoxylate aminotransferase: Study of a spectrum of mutations. Mol Genet
Metab 89:349–359.
13.Wilkins DK, et al. (1999) Hydrodynamic radii of native and denatured proteins measured by
pulse field gradient NMR techniques. Biochemistry 38:16424–16431.
14.Venkatesu P, Lee MJ, Lin HM (2007) Thermodynamic characterization of the osmolyte effect
on protein stability and the effect of GdnHCl on the protein denatured state. J Phys Chem B
111:9045–9056.
15.Danpure CJ (2006) Primary hyperoxaluria type 1: AGT mistargeting highlights the fundamental
differences between the peroxisomal and mitochondrial protein import pathways. Biochim
Biophys Acta 1763:1776–1784.
4.alanine:glyoxylate aminotransferase
124
16.Manning LR, Dumoulin A, Jenkins WT, Winslow RM, Manning JM (1999) Determining
subunit dissociation constants in natural and recombinant proteins. Methods Enzymol 306:113–
129.
17.Yong YH, Foegeding EA (2008) Effects of caseins on thermal stability of bovine beta-
lactoglobulin. J Agric Food Chem 56:10352–10358.
18.Sussman JL, et al. (1998) Protein data bank (PDB): Database of three-dimensional structural
information of biological macromolecules. Acta Crystallogr D 54: 1078–1084.
19.Baker NA, Sept D, Joseph S, Holst MJ, McCammon JA (2001) Electrostatics of nanosystems:
Application to microtubules and the ribosome. Proc Natl Acad Sci USA 98:10037–10041.
SUPPORTING INFORMATION
Materials. Pyridoxal 50-phosphate (PLP), pyridoxamine 50-phosphate, L-alanine, glyoxylate,
rabbit muscle L-lactic dehydrogenase, isopropyl β-thiogalactopyranoside, Tris(2,20-bipyridyl)
ruthenium (II) chloride (TBPR), trimethylamine-N-oxide, and betaine were all purchased from
Sigma. ANS (1-anilinonaphthalene sulfonic acid) was purchased from Molecular Probes. Anti-his
(C-term) antibody and ECL™ peroxidase labeled anti-mouse antibody were from Invitrogen. All
other chemicals were of the highest purity available.
Construction, Expression, and Purification of G41 Variants. Site-directed mutagenesis was
performed with the QuikChange II sitedirectedmutagenesis kit (Stratagene). G41V-Ma and G41R-
Ma variants were generated using the pAGThis-Ma construct as template, whereas the G41R-Mi
construct was created on the pAGThis-Mi template. The oligonucleotides used for mutagenesis
were as follows: G41V forward primer, 5’GCAGCCGTAGGGCTGCAGATGATCGG and its
complement; G41R forward primer, 5’GCAGCCCGCGGGCTGCAGATGATCGG and its
complement. The underlined codons indicate mutated amino acids. All mutations were confirmed
by DNA sequencing. G41R-Ma, G41R-Mi, and G41V-Ma were expressed and purified by using the
same procedure as alanine:glyoxylate aminotransferase (AGT)-Ma and AGT-Mi (1, 2). In the case
of G41R-Mi, the expression and purification were also carried out in the presence of 60 µM
exogenous PLP. The purified variants were homogenous as indicated by a single band on SDS-
PAGE with a mobility identical to that of AGT-Ma and AGT-Mi. Yields of G41R-Ma and G41V-
Ma after the standard purification were slightly lower than that of AGT-Ma, whereas yield of
G41R-Mi was about 20% with respect to that of AGT-Ma but increases to 40% when exogenous
4.alanine:glyoxylate aminotransferase
125
PLP was added to the bacterial culture and the buffer during purification. The protein concentration
in the AGT samples was determined by absorbance spectroscopy using an extinction coefficient of
9.4 × 10⁴ M−1 cm−1 at 280 nm (1). The PLP content of G41R-Ma and G41V-Ma was determined
by releasing the coenzyme in 0.1 M NaOH and by using ε = 6600 M−1 cm−1 at 388 nm, whereas
that of G41R-Mi was determined by spectrophotometric titration of apoenzyme (11 µM) with
increasing PLP concentrations (2–50 µM). The transition point of the biphasic plot of A430 versus
[PLP] was taken as the maximum value of PLP bound to the mutant (i.e., 1.84 mol per mol of the
dimeric species). The apo forms of the enzymes were prepared as already described (1).
Binding Affinity for PLP. The KD(PLP) from G41R-Ma (0.5 µM), G41R-Mi (0.5 µM), and G41V-
Ma (0.1 µM) were determined by measuring the quenching of the intrinsic fluorescence of
apoenzyme in the presence of PLP at concentrations ranging from 0.2 to 60 µM, 0.5 to 60 µM, and
0.1 to 10 µM, respectively. The KD(PLP) from G41R-Mi (4.5 µM) and G41V-Ma (1.5 µM) was also
determined by CD spectrophotometric titration at 420 nm of their apo forms in the presence of PLP
at concentrations ranging from 1 to 100 µM and 0.1 to 50 µM, respectively. All these experiments
were carried out in 100 mM potassium phosphate buffer, pH 7.4. The KD(PLP) values of G41R-Ma,
G41R-Mi, and G41V-Ma mutant-coenzyme complexes were obtained using the following equation:
[ ] [ ] [ ] [ ]( ) [ ] [ ][ ]{ } [ ]ttt2
)PLP(Dtt)PLP(Dttmax E2/PLPE4KPLPEKPLPEYY −++−++= [S1]
where [E]t and [PLP]t represent the total concentrations of the mutant and PLP, respectively, Y
refers to either the intrinsic fluorescence quenching or the 420 nm dichroic signal changes at a PLP
concentration, [PLP]t and Ymax refers to the aforementioned changes when all enzyme molecules are
complexed with coenzyme.
Determination of Kd. Size-exclusion chromatography (SEC) was used to analyze the amount of
monomer or dimer present in the solutions of AGT-Ma, AGT-Mi, and G41 variants in the holo and
apo forms at different enzymes concentrations. The analysis was performed on an Akta FPLC
system (GE Healthcare) using a custom packed Sephacryl S-300 10⁄600 column at room
temperature. The flow rate was 0.4 mL⁄ min, and the injection volume was 500 µL with detection at
280 nm. The mobile phase was 100 mM potassium phosphate buffer, pH 7.4 for the apoenzyme
samples, and the same buffer containing 60 µMPLP in the case of holoenzymes. To determine the
Kd, a stock solution of AGT-Ma, AGT-Mi, or G41 variants in the apo or holo forms was dissolved
in 100 mM potassium phosphate buffer, pH 7.4, to different enzyme concentrations, and after 3 h of
4.alanine:glyoxylate aminotransferase
126
incubation at 25 °C (a sufficient time to reach the equilibrium between monomer and dimer),
subjected to SEC. Each sample was injected in triplicate, and the elution volume and data handling
were done using the software Unicorn 5.01 (Amersham Biosciences). The rapid equilibrium process
observed for G41 variants in the apo form was analyzed according to the method of Manning et al.
(3). This is a treatment that mathematically relates the protein concentration (in terms of the
theoretical maximum concentration of dimer) to the expected amounts of dimer and monomer for
an associating–dissociating equilibrium. The elution volumes of each sample have been measured
in terms of average peak concentration, which is calculated as
(sample volume) × (sample concentration) / (peak volume),
where the total peak volume is estimated to be equivalent to the volume at half-peak height.
The Kd value has been estimated as follows (3). If the maximum amount of AGT dimer is [E]
and the concentrations of monomeric and dimeric species are [M] and [D], respectively, so that
%D=100[D] / [E], it follows that
Kd = [M]2 / [D] = 4([E] – [D])2 / [D] = [(100 - %D)2 [E] / (25%D)] = 0.04 (100-%D) [E] / %D
Hence,
[ ]( )
−−=
2dD%10004.0
)D(%logElog)Klog( [S2]
Thus, a plot of log[(%D ⁄ 0.04 (100 − %D)2] with respect to log[E] yields a straight line of slope 1.
When [%D ⁄ 0.04 (100 − %D)2] = 1, Kd = [E]. The quadratic equation [S2] can also be solved in
terms of (%D):
[ ]( ) [ ][ ] [ ]E08.0/)EK16K(KE8D% d2dd +−+= [S3]
Spectroscopic Measurements. Absorption spectra were made with a Jasco V-550
spectrophotometer. CD spectra were obtained using a Jasco J-710 spectropolarimeter with a
thermostatically controlled compartment at 25 °C. For near-UV and visible wavelengths, the protein
concentration varied from 0.5 to 1 mg⁄mL in a cuvette with a path length of 1 cm. Routinely, three
spectra were recorded at a scan speed of 50 nm min−1 with a bandwith of 2 nm and averaged
4.alanine:glyoxylate aminotransferase
127
automatically. Secondary structure content was calculated from far-UV CD spectra using the
Dicroweb software. Fluorescence spectra were recorded with a Jasco FP-750 spectrofluorometer
using 5 nm excitation and emission bandwidths. Spectra of blanks, i.e., samples containing all
components except the enzyme, were taken immediately before the measurements of samples
containing protein. Tryptophan emission spectra were taken from 300 to 500 nm using an excitation
wavelength of 280 nm at a protein concentration of 1 µM. For ANS binding experiments, a stock
solution of ANS was added to a final concentration of 15 µM to solutions of AGT-Ma, AGT-Mi,
and G41 variants in the holo and apo forms. The excitation wavelength was 365 nm, and the
emission was recorded from 400 to 560 nm. The values were normalized by subtracting the baseline
recorded for the probe alone under identical conditions. To determine the emission maximum
position, fluorescence spectra were processed by Jasco software.
Immunoblotting. Samples of G41 variants (15 µM) before and after treatment with proteinase K,
were separated by SDS-PAGE. The proteins were then transferred to a nitrocellulose Immobilon P
membrane (Millipore). After blocking at 4 °C with 5% dry milk, 0.05% Tween 20 in Tris buffered
saline (TBS), the membrane was incubated with anti-His (C-term) antibody, washed three times
with TBS, and detected with horseradish peroxidase secondary antibody by chemiluminescence.
Mass Spectrometry. Mass spectrometry analyses of G41R-Mi were carried out with a model
Mariner ESI-TOF spectrometer from PerSeptive Biosystems. Specifically, 5 µL of a 35 µM solution
of G41R-Mi in 100 mM potassium phosphate buffer, pH 7.4, were loaded onto a C4 Grace-Vydac
microbore column (1 × 50 mm), equilibrated for 20 min at a flow-rate of 20 µL⁄ min with
H2O∶CH3CN (99∶1), containing 1% HCOOH and eluted with a linear CH3CN-1%HCOOH
gradient from 1% to 80% in30 min. Spray-tip potential was set at 3.0 kV, while the nozzle potential
and temperature were set at 200 V and 140.0 °C, respectively. Proteolysis reaction of G41R-Mi
with proteinase K was analyzed with a model 4800 Plus Maldi-Tof-Tof instrument from Applied
Biosystems. Samples were desalted and concentrated by loading 10 µL of proteolysis reaction of
G41R-Mi (35 µM) onto a P10 C4 Zip-Tip, eluted manually with a sinapinic acid (Sigma) saturated
solution (2 µL) in CH3CN∶H2O (60∶40 by vol). The relative intensity of the laser was set at 5000
and delay time at 1800 ns.
Molecular Dynamics (MD). For the MD simulation of AGT-Mi and G41R-Mi, the crystal
structure of human AGT, downloaded from Brookhaven Protein Data Bank (PDB code: 1H0C),
was used as starting structure. The structure was checked and missing residues (1–3; 121–122; 392)
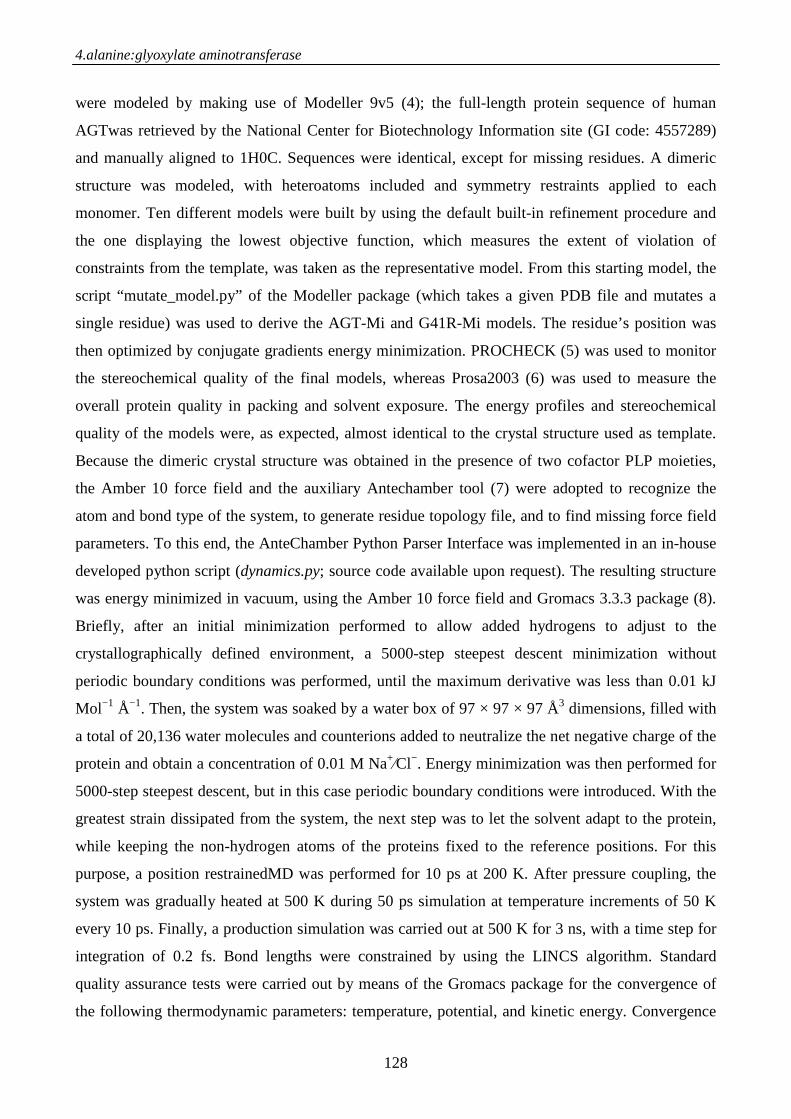
4.alanine:glyoxylate aminotransferase
128
were modeled by making use of Modeller 9v5 (4); the full-length protein sequence of human
AGTwas retrieved by the National Center for Biotechnology Information site (GI code: 4557289)
and manually aligned to 1H0C. Sequences were identical, except for missing residues. A dimeric
structure was modeled, with heteroatoms included and symmetry restraints applied to each
monomer. Ten different models were built by using the default built-in refinement procedure and
the one displaying the lowest objective function, which measures the extent of violation of
constraints from the template, was taken as the representative model. From this starting model, the
script “mutate_model.py” of the Modeller package (which takes a given PDB file and mutates a
single residue) was used to derive the AGT-Mi and G41R-Mi models. The residue’s position was
then optimized by conjugate gradients energy minimization. PROCHECK (5) was used to monitor
the stereochemical quality of the final models, whereas Prosa2003 (6) was used to measure the
overall protein quality in packing and solvent exposure. The energy profiles and stereochemical
quality of the models were, as expected, almost identical to the crystal structure used as template.
Because the dimeric crystal structure was obtained in the presence of two cofactor PLP moieties,
the Amber 10 force field and the auxiliary Antechamber tool (7) were adopted to recognize the
atom and bond type of the system, to generate residue topology file, and to find missing force field
parameters. To this end, the AnteChamber Python Parser Interface was implemented in an in-house
developed python script (dynamics.py; source code available upon request). The resulting structure
was energy minimized in vacuum, using the Amber 10 force field and Gromacs 3.3.3 package (8).
Briefly, after an initial minimization performed to allow added hydrogens to adjust to the
crystallographically defined environment, a 5000-step steepest descent minimization without
periodic boundary conditions was performed, until the maximum derivative was less than 0.01 kJ
Mol−1 Å−1. Then, the system was soaked by a water box of 97 × 97 × 97 Å3 dimensions, filled with
a total of 20,136 water molecules and counterions added to neutralize the net negative charge of the
protein and obtain a concentration of 0.01 M Na+⁄Cl−. Energy minimization was then performed for
5000-step steepest descent, but in this case periodic boundary conditions were introduced. With the
greatest strain dissipated from the system, the next step was to let the solvent adapt to the protein,
while keeping the non-hydrogen atoms of the proteins fixed to the reference positions. For this
purpose, a position restrainedMD was performed for 10 ps at 200 K. After pressure coupling, the
system was gradually heated at 500 K during 50 ps simulation at temperature increments of 50 K
every 10 ps. Finally, a production simulation was carried out at 500 K for 3 ns, with a time step for
integration of 0.2 fs. Bond lengths were constrained by using the LINCS algorithm. Standard
quality assurance tests were carried out by means of the Gromacs package for the convergence of
the following thermodynamic parameters: temperature, potential, and kinetic energy. Convergence
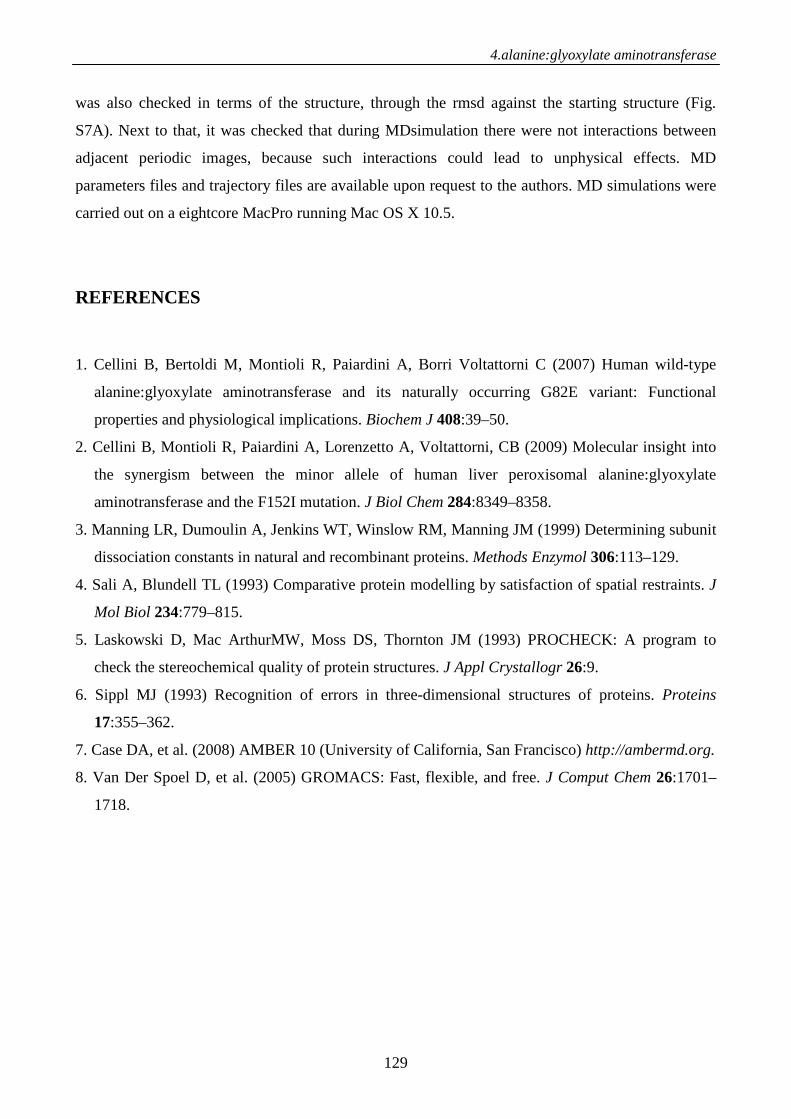
4.alanine:glyoxylate aminotransferase
129
was also checked in terms of the structure, through the rmsd against the starting structure (Fig.
S7A). Next to that, it was checked that during MDsimulation there were not interactions between
adjacent periodic images, because such interactions could lead to unphysical effects. MD
parameters files and trajectory files are available upon request to the authors. MD simulations were
carried out on a eightcore MacPro running Mac OS X 10.5.
REFERENCES
1. Cellini B, Bertoldi M, Montioli R, Paiardini A, Borri Voltattorni C (2007) Human wild-type
alanine:glyoxylate aminotransferase and its naturally occurring G82E variant: Functional
properties and physiological implications. Biochem J 408:39–50.
2. Cellini B, Montioli R, Paiardini A, Lorenzetto A, Voltattorni, CB (2009) Molecular insight into
the synergism between the minor allele of human liver peroxisomal alanine:glyoxylate
aminotransferase and the F152I mutation. J Biol Chem 284:8349–8358.
3. Manning LR, Dumoulin A, Jenkins WT, Winslow RM, Manning JM (1999) Determining subunit
dissociation constants in natural and recombinant proteins. Methods Enzymol 306:113–129.
4. Sali A, Blundell TL (1993) Comparative protein modelling by satisfaction of spatial restraints. J
Mol Biol 234:779–815.
5. Laskowski D, Mac ArthurMW, Moss DS, Thornton JM (1993) PROCHECK: A program to
check the stereochemical quality of protein structures. J Appl Crystallogr 26:9.
6. Sippl MJ (1993) Recognition of errors in three-dimensional structures of proteins. Proteins
17:355–362.
7. Case DA, et al. (2008) AMBER 10 (University of California, San Francisco) http://ambermd.org.
8. Van Der Spoel D, et al. (2005) GROMACS: Fast, flexible, and free. J Comput Chem 26:1701–
1718.
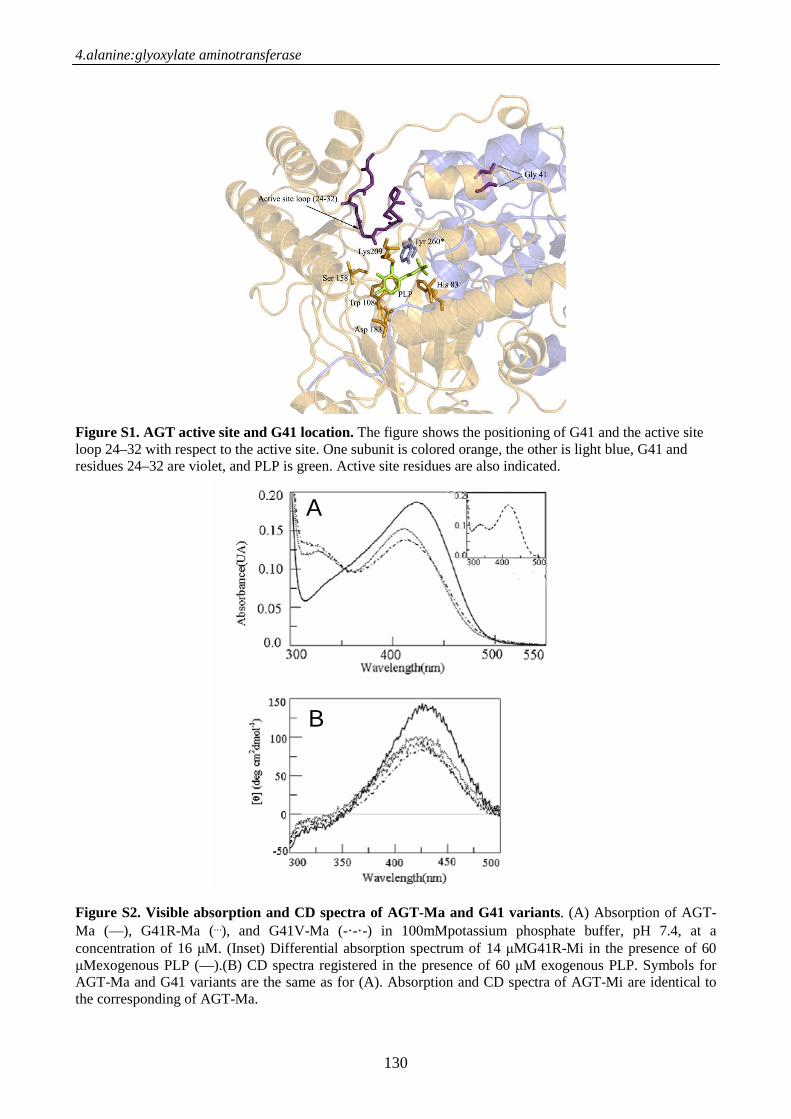
4.alanine:glyoxylate aminotransferase
130
Figure S1. AGT active site and G41 location. The figure shows the positioning of G41 and the active site loop 24–32 with respect to the active site. One subunit is colored orange, the other is light blue, G41 and residues 24–32 are violet, and PLP is green. Active site residues are also indicated.
Figure S2. Visible absorption and CD spectra of AGT-Ma and G41 variants. (A) Absorption of AGT-Ma (—), G41R-Ma (⋯), and G41V-Ma (-·-·-) in 100mMpotassium phosphate buffer, pH 7.4, at a concentration of 16 µM. (Inset) Differential absorption spectrum of 14 µMG41R-Mi in the presence of 60 µMexogenous PLP (—).(B) CD spectra registered in the presence of 60 µM exogenous PLP. Symbols for AGT-Ma and G41 variants are the same as for (A). Absorption and CD spectra of AGT-Mi are identical to the corresponding of AGT-Ma.
A
B
A
B
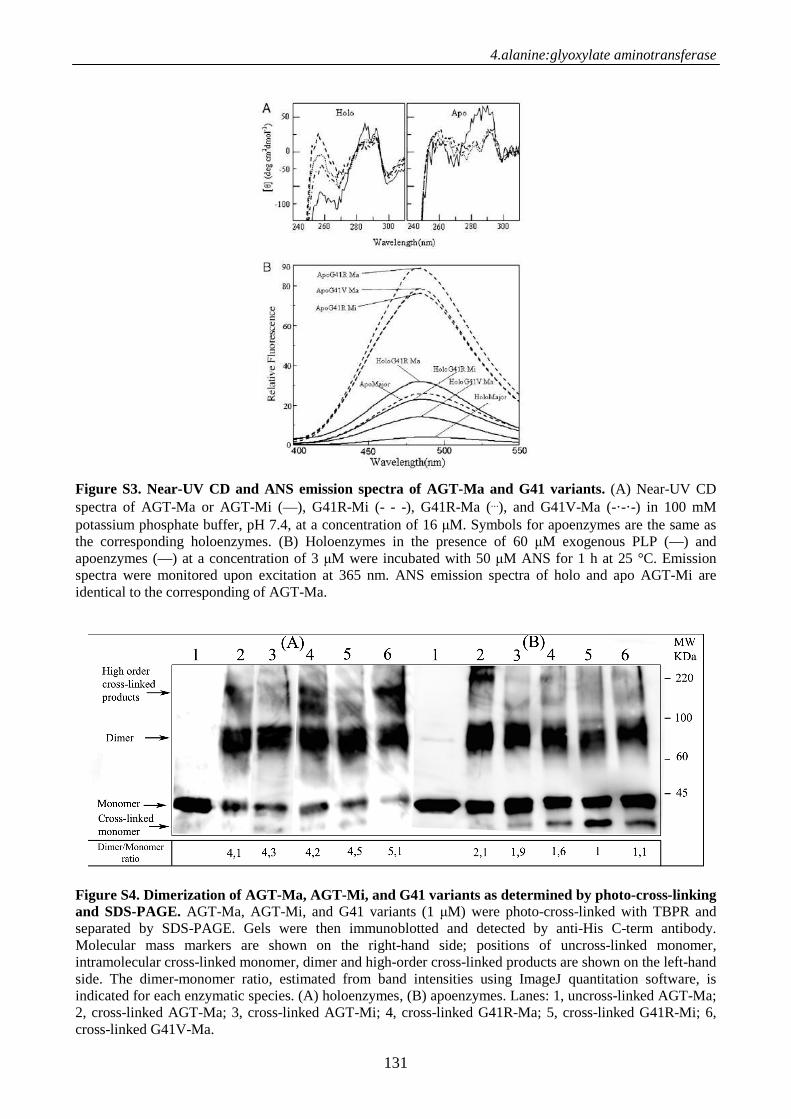
4.alanine:glyoxylate aminotransferase
131
Figure S3. Near-UV CD and ANS emission spectra of AGT-Ma and G41 variants. (A) Near-UV CD spectra of AGT-Ma or AGT-Mi (—), G41R-Mi (- - -), G41R-Ma (⋯), and G41V-Ma (-·-·-) in 100 mM potassium phosphate buffer, pH 7.4, at a concentration of 16 µM. Symbols for apoenzymes are the same as the corresponding holoenzymes. (B) Holoenzymes in the presence of 60 µM exogenous PLP (—) and apoenzymes (—) at a concentration of 3 µM were incubated with 50 µM ANS for 1 h at 25 °C. Emission spectra were monitored upon excitation at 365 nm. ANS emission spectra of holo and apo AGT-Mi are identical to the corresponding of AGT-Ma.
Figure S4. Dimerization of AGT-Ma, AGT-Mi, and G41 variants as determined by photo-cross-linking and SDS-PAGE. AGT-Ma, AGT-Mi, and G41 variants (1 µM) were photo-cross-linked with TBPR and separated by SDS-PAGE. Gels were then immunoblotted and detected by anti-His C-term antibody. Molecular mass markers are shown on the right-hand side; positions of uncross-linked monomer, intramolecular cross-linked monomer, dimer and high-order cross-linked products are shown on the left-hand side. The dimer-monomer ratio, estimated from band intensities using ImageJ quantitation software, is indicated for each enzymatic species. (A) holoenzymes, (B) apoenzymes. Lanes: 1, uncross-linked AGT-Ma; 2, cross-linked AGT-Ma; 3, cross-linked AGT-Mi; 4, cross-linked G41R-Ma; 5, cross-linked G41R-Mi; 6, cross-linked G41V-Ma.
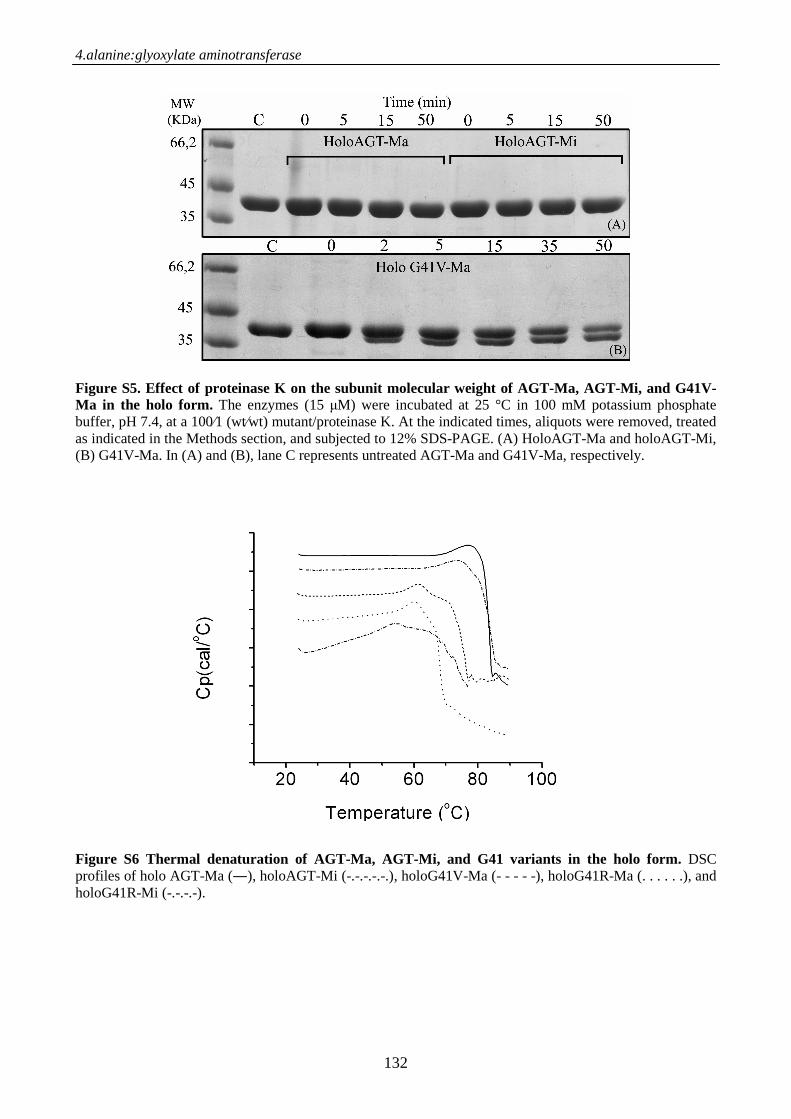
4.alanine:glyoxylate aminotransferase
132
Figure S5. Effect of proteinase K on the subunit molecular weight of AGT-Ma, AGT-Mi, and G41V-Ma in the holo form. The enzymes (15 µM) were incubated at 25 °C in 100 mM potassium phosphate buffer, pH 7.4, at a 100⁄1 (wt⁄wt) mutant/proteinase K. At the indicated times, aliquots were removed, treated as indicated in the Methods section, and subjected to 12% SDS-PAGE. (A) HoloAGT-Ma and holoAGT-Mi, (B) G41V-Ma. In (A) and (B), lane C represents untreated AGT-Ma and G41V-Ma, respectively. Figure S6 Thermal denaturation of AGT-Ma, AGT-Mi, and G41 variants in the holo form. DSC profiles of holo AGT-Ma (―), holoAGT-Mi (-.-.-.-.-.), holoG41V-Ma (- - - - -), holoG41R-Ma (. . . . . .), and holoG41R-Mi (-.-.-.-).
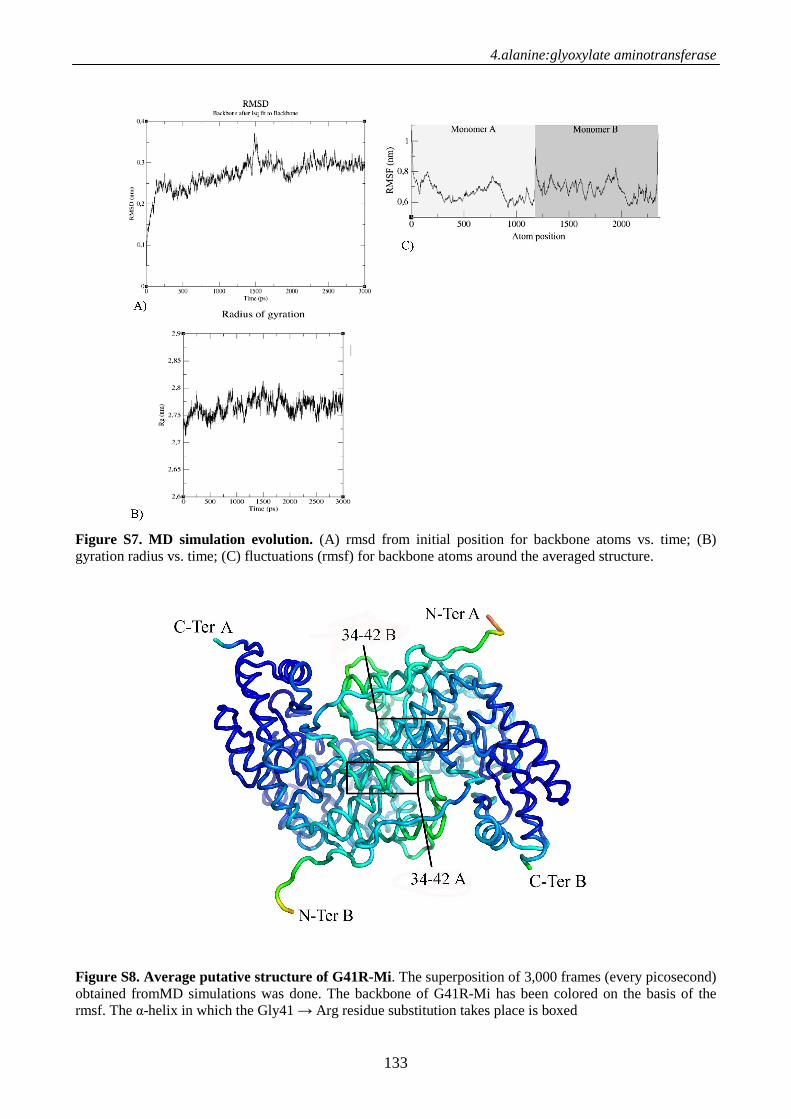
4.alanine:glyoxylate aminotransferase
133
Figure S7. MD simulation evolution. (A) rmsd from initial position for backbone atoms vs. time; (B) gyration radius vs. time; (C) fluctuations (rmsf) for backbone atoms around the averaged structure. Figure S8. Average putative structure of G41R-Mi. The superposition of 3,000 frames (every picosecond) obtained fromMD simulations was done. The backbone of G41R-Mi has been colored on the basis of the rmsf. The α-helix in which the Gly41 → Arg residue substitution takes place is boxed
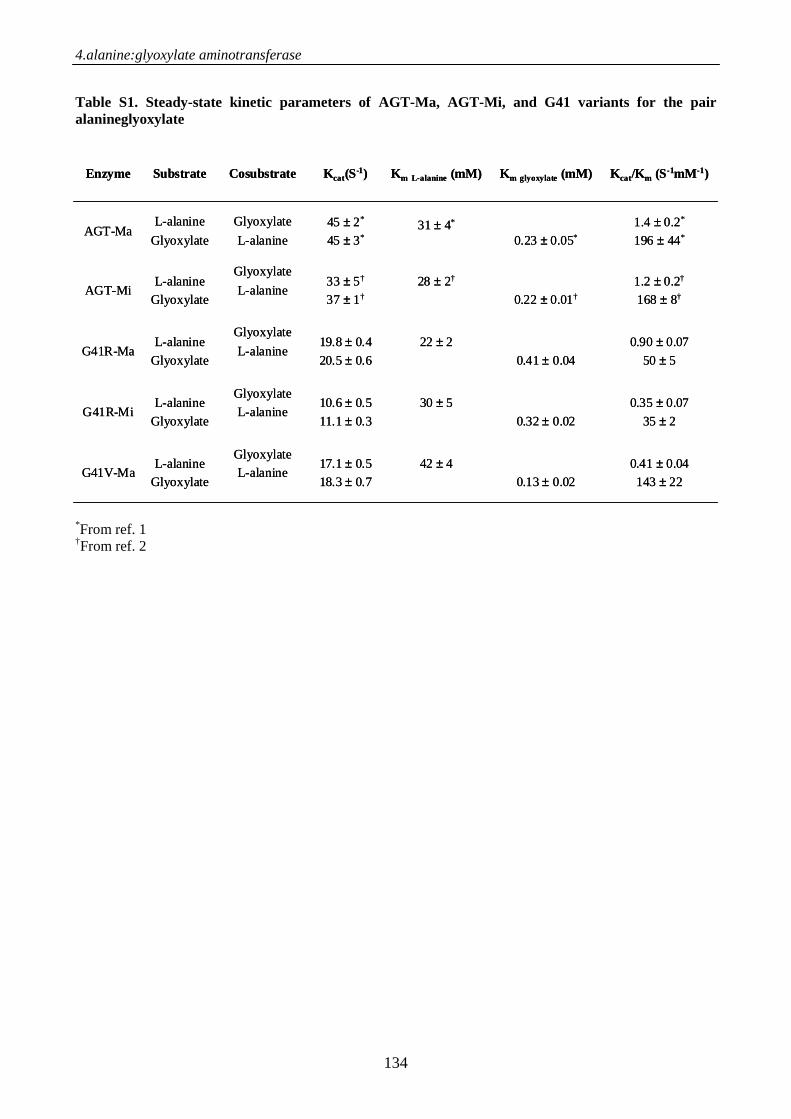
4.alanine:glyoxylate aminotransferase
134
Table S1. Steady-state kinetic parameters of AGT-Ma, AGT-Mi, and G41 variants for the pair alanineglyoxylate
*From ref. 1 †From ref. 2
0.41 ± 0.04
143 ± 220.13 ± 0.02
42 ± 417.1 ± 0.5
18.3 ± 0.7
Glyoxylate
L-alanineL-alanine
GlyoxylateG41V-Ma
0.35 ± 0.07
35 ± 20.32 ± 0.02
30 ± 510.6 ± 0.5
11.1 ± 0.3
Glyoxylate
L-alanineL-alanine
GlyoxylateG41R-Mi
0.90 ± 0.07
50 ± 50.41 ± 0.04
22 ± 219.8 ± 0.4
20.5 ± 0.6
Glyoxylate
L-alanineL-alanine
GlyoxylateG41R-Ma
1.2 ± 0.2†
168 ± 8†0.22 ± 0.01†
28 ± 2†33 ± 5†
37 ± 1†
Glyoxylate
L-alanineL-alanine
GlyoxylateAGT-Mi
1.4 ± 0.2*
196 ± 44*0.23 ± 0.05*31 ± 4*45 ± 2*
45 ± 3*
Glyoxylate
L-alanine
L-alanine
GlyoxylateAGT-Ma
Kcat/Km (S-1mM-1)Km glyoxylate (mM)Km L-alanine (mM)Kcat(S-1)CosubstrateSubstrateEnzyme

5. VON WILLEBRAND FACTOR (VWF)

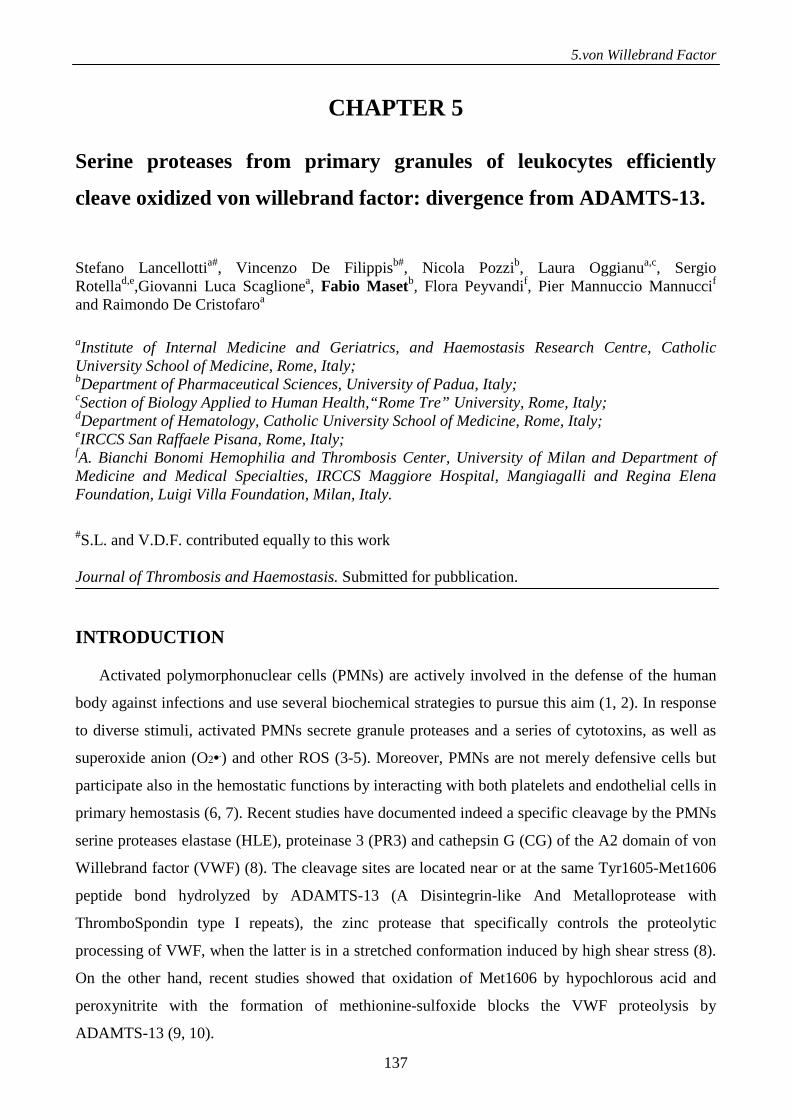
5.von Willebrand Factor
137
CHAPTER 5
Serine proteases from primary granules of leukocytes efficiently
cleave oxidized von willebrand factor: divergence from ADAMTS-13.
Stefano Lancellottia#, Vincenzo De Filippisb#, Nicola Pozzib, Laura Oggianua,c, Sergio Rotellad,e,Giovanni Luca Scaglionea, Fabio Masetb, Flora Peyvandif, Pier Mannuccio Mannuccif
and Raimondo De Cristofaroa
aInstitute of Internal Medicine and Geriatrics, and Haemostasis Research Centre, Catholic University School of Medicine, Rome, Italy; bDepartment of Pharmaceutical Sciences, University of Padua, Italy; cSection of Biology Applied to Human Health,“Rome Tre” University, Rome, Italy; dDepartment of Hematology, Catholic University School of Medicine, Rome, Italy; eIRCCS San Raffaele Pisana, Rome, Italy; fA. Bianchi Bonomi Hemophilia and Thrombosis Center, University of Milan and Department of Medicine and Medical Specialties, IRCCS Maggiore Hospital, Mangiagalli and Regina Elena Foundation, Luigi Villa Foundation, Milan, Italy. #S.L. and V.D.F. contributed equally to this work Journal of Thrombosis and Haemostasis. Submitted for pubblication. INTRODUCTION
Activated polymorphonuclear cells (PMNs) are actively involved in the defense of the human
body against infections and use several biochemical strategies to pursue this aim (1, 2). In response
to diverse stimuli, activated PMNs secrete granule proteases and a series of cytotoxins, as well as
superoxide anion (O2•-) and other ROS (3-5). Moreover, PMNs are not merely defensive cells but
participate also in the hemostatic functions by interacting with both platelets and endothelial cells in
primary hemostasis (6, 7). Recent studies have documented indeed a specific cleavage by the PMNs
serine proteases elastase (HLE), proteinase 3 (PR3) and cathepsin G (CG) of the A2 domain of von
Willebrand factor (VWF) (8). The cleavage sites are located near or at the same Tyr1605-Met1606
peptide bond hydrolyzed by ADAMTS-13 (A Disintegrin-like And Metalloprotease with
ThromboSpondin type I repeats), the zinc protease that specifically controls the proteolytic
processing of VWF, when the latter is in a stretched conformation induced by high shear stress (8).
On the other hand, recent studies showed that oxidation of Met1606 by hypochlorous acid and
peroxynitrite with the formation of methionine-sulfoxide blocks the VWF proteolysis by
ADAMTS-13 (9, 10).
5.von Willebrand Factor
138
VWF, beside its well known engagement in primary haemostasis, participates in other
biological phenomena, such as bacterial infections and leukocyte recruitment and extravasation.
The high molecular weight VWF multimers are involved for instance in bacterial adhesion,
mediated by surface adhesins molecules called MSCRAMMs (Microbial Surface Components
Recognizing Adhesive Matrix Molecules)(11-14). Staphylococcus aureus is known to express
numerous adhesins (15), such as Staphylococcal protein A (Spa), which binds to soluble and
immobilized VWF multimers (16). The process of bacterial adhesion causes migration and
activation of PMNs that secrete enzymes and ROS to eliminate the pathogens. Very recently, VWF
multimers have been demonstrated to mediate also PMN extravasation (17).
Thus, in this study we investigated a) whether PMN-induced oxidative stress influences VWF
hydrolysis by purified leukocyte serine proteases (LPSs) HLE, CG and PR3; b) whether cleavage of
VWF by LSPs secreted by PMNs in a highly oxidative milieu may alter the efficiency of VWF
proteolysis. The investigation of these mechanistic aspects may further unravel the role of
leukocytes-VWF interactions in both hemostatic and extra hemostatic functions of VWF.
MATERIALS AND METHODS
Proteolysis of VWF74 and VWF74 Met-SO by human LSPs and identification of the cleavage
sites by mass spectrometry. The pseudo wild-type peptide VWF74, containing the amino acid
exchange Cys1669Ala and encompassing the VWF A2 domain sequence 1596-1669
(DREQAPNLVYM VTGNPASDEIKRLPGDIQVVPIGVGPNANVQELERIGWPNAPILIQDFET
LPREAPDLVLQRA), and its derivative containing MetSO at position 1606 were synthesized by
the solid-phase method and characterized as previously detailed (10). VWF74 or VWF74-MetSO
(120 µl, 20 µM) in 10 mM Hepes, 150 mM NaCl, 5 mM CaCl2, pH 7.4 (HBS) were separately
incubated for 90 min at 37°C with 20 nM PMN-derived HLE, CG and PR3 , all purchased from
Sigma Aldrich (Milano, Italy). For comparison, proteolysis reaction was carried for 60 min under
identical experimental conditions with 5 nM recombinant human ADAMTS-13 (R&D Systems,
Minneapolis, MN). The reaction was stopped by adding 4% aqueous TFA (80 µl) and 6 M Gdn-
HCl (200 µl) and fractionated on a Grace-Vydac (The Separation Group, Hesperia, CA) C18
analytical column (4.6 x 250 mm), using an acetonitrile-0.1%TFA gradient (10 to 30% in 10 min;
30 to 45% in 30 min, 0.8 ml/min). The peptides eluted in correspondence of the chromatographic
peaks were collected, lyophilized and then analyzed by mass spectrometry (MS) on a Mariner ESI
TOF instrument from PerSeptive Biosystems (Stafford, TX), as detailed elsewhere(10).
5.von Willebrand Factor
139
Determination of Michaelis-Menten parameters for proteolysis of VWF74 and VWF74-MetSO by
human LSPs. The Michaelis-Menten parameters for the hydrolysis of VWF74 and VWF74 MetSO
by LSPs and ADAMTS-13 were determined by quantifying the cleavage products by RP-HPLC, as
previously described (10). The VWF74- peptide substrates were used at concentrations ranging
from 1.2 to 20.8 µM, whereas HLE, PR3 and CG were all used at 5 nM. The steady state hydrolysis
of VWF peptides was performed in 10 mM Hepes, 0.15 M NaCl, 3 mM CaCl2, pH 7.5 at 37 °C.
The Michaelis-Menten parameters were calculated by quantifying at 210 nm the N-terminal
peptides (1596Asp-Tyr1605 or 1596Asp-Val1607) released from VWF74 and VWF74-MetSO,
respectively. RP-HPLC and MS analyses showed that proteolysis of VWF74 peptides with PR3,
CG, and ADAMTS-13 in the time-range of the analysis (30-90 min) occurred exclusively at a single
peptide bond, Tyr1605-Met1606 or Val1607-Thr1608 (see Results), allowing us to determine the
parameters kcat and Km pertaining to a single proteolytic process. At variance, HLE cleaved VWF74
peptides at multiple sites with comparable efficiency, even after short incubation time. Thus, in the
latter case only an observed pseudo-first order kinetic constant, kobs, of VWF74 disappearance was
derived at 25 °C and low substrate concentration (4 µM). A lower temperature was chosen in this
case to slow down the proteolytic reaction and monitor with higher precision the products’ release.
Oxidation of VWF multimers by hypochlorous acid and the myeloperoxidase/H2O2/Cl- system
(MOPSY). Plasma VWF multimers were purified and characterized as previously detailed (10,18)
and their hypochlorous acid (HClO)- or myeloperoxidase system (MOPSY)-mediated oxidation was
carried out using a procedure described earlier (19). Intact VWF samples (200 nM as a monomer) in
10 mM Hepes-buffered saline, pH 7.50, were treated for 15 min at 25°C with increasing
concentrations of HClO (i.e., 2.5, 5, 10, 20 and 40 µM), in the absence or presence of L-tyrosine,
added to promote the formation of tyrosyl radicals that contribute to oxidative protein damage and
dityrosine intermolecular cross-links (20). When MOPSY was used, human leukocyte
myeloperoxidase (MPO, 25 nM) was added to VWF samples (200 nM) in HBS in the presence of
H2O2 (200 µM) and L-tyrosine (100 µM). The concentration of hypochlorous acid and hypochlorite
ion in commercial NaOCl solution (Sigma) was determined spectrophotometrically at 230 nm,
using a molar absorptivity of 93.3 and 7.2 M-1·cm-1, respectively19. The concentration of H2O2
solution was determined by UV-absorption at 240 nm, using a molar absorptivity of 350 M-1·cm1
(21). Excess HOCl/NaOCl and tyrosine were eliminated by gel-filtration on a Bio-Rad (Richmond,
CA) DG10 column. Oxidation of the model compound Nα-acetyl-tryptophanyl-amide (NATA) to
its mono- (Oia) and di-oxyindolylalanine (Dia) derivatives was carried out by the DMSO-HCl
5.von Willebrand Factor
140
procedure (22). The reaction was conducted for 15 min and quenched by 1:20 (v/v) dilution with
water. The products were then analyzed by MS and UV-absorption, revealing the presence of both
Oia and Dia in a 3:2 ratio.
Proteolysis of the HClO- and MOPSY-treated VWF multimers by LPSs and ADAMTS-13. After
treatment with HClO or MOPSY, VWF samples (20 µg/ml) were separately incubated at 37 °C
with 10 nM ADAMTS-13, HLE, PR3, and CG in 5 mM Tris-HCl buffer, pH 8.0, containing 3 mM
CaCl2, in the absence or presence of 1.5 mg/ml sulphate-free ristocetin (Helena Laboratories,
Beaumont, TX). At time intervals (i.e, 0, 1, and 2 hr), aliquots (50 µl) of these solutions were
sampled and the reaction stopped by adding 0.3 M acetic acid (final concentration) or 10 mM
EDTA, when ADAMTS-13 was reacted. In all cases, proteolysis of oxidized VWF (VWF-Ox) was
assessed by SDS-agarose electrophoresis in 1.5% agarose gel, using rabbit anti-human VWF
polyclonal antibody and a HRP-conjugated secondary anti-rabbit antibody (Dako, Milano, Italy), as
previously detailed (18).
Hydrolysis of VWF multimers by activated PMNs. Purified VWF multimers (20 µg/ml) were
incubated with human PMNs, isolated from healthy volunteers and stimulated with 50 ng/ml 12-
phorbol 13-myristate acetate (PMA, Sigma) in HBS. PMNs were purified by following a procedure
published elsewhere, with only minor modifications (23): EDTA-treated blood (20 ml) was mixed
with PBS (100 ml) and layered over 30 ml of endotoxin tested Ficoll-Paque solution (GE
Healthcare, Milan, Italy), and centrifuged at 400 g for 30 min at 20°C. The supernatant and the
mononuclear cell/platelet layer were removed by suction, and the bottom fraction containing PMN
cells and red cells was diluted with 10 volumes of 0.83% 7(w/v) NH4Cl to promote red cells lysis.
PMNs were collected by centrifugation (800 g for 15 min), washed twice with 10 mM phosphate
buffered saline, and resuspended in HBS at a concentration of 1-5x l03 cells/µl. Purity of PMN cell
preparations was checked by a FACS Canto® flow cytometer (BD Biosciences, Mountain View,
CA) using FITC-conjugated anti-CD11b or isotype control antibody. Data were then collected by
recording FITC fluorescence at 525 nm. Time from blood withdrawal to testing was less than 2 hr.
Production of superoxide by isolated PMNs in response to PMA was assessed by monitoring the
reduction of ferricytochrome C (24), by recording at 25°C the absorbance at 550 nm, on a model
Benchmark Plus microplate spectrophotometer (Bio-Rad), expressed as µM per 106 PMNs, using
an extinction coefficient of 21 mM-1·cm-1 for (reduced-oxidized) cytochrome C (25). The
concentration of superoxide was determined in the absence and presence of 6 U/ml SOD, 1 mM L-
methionine, and 200 nM catalase, used as superoxide and H2O2 scavengers, respectively. VWF was
5.von Willebrand Factor
141
added to these PMNs suspensions and immediately afterwards PMA was added to stimulate PMNs.
An aliquot of the PMNs suspension was taken and centrifuged at 10,000 rpm for 30 sec, while the
supernatant containing added VWF was used to analyze the pattern of VWF multimers. To inhibit
LSP activity, 500 µM aprotinin and phenyl-methyl-sulphenyl-fluoride (PMSF) were added in
control samples under identical experimental conditions. The SDS-agarose electrophoresis of VWF
multimers treated with activated PMNs was carried out in 0.8 % (stacking gel)-1.5 % (running gel)
agarose gel. The Western blot analysis was performed as detailed above.
Flow cytometry measurement of oxidative metabolism and spectrophotometric measurements of
ROS/LSP secretion by PMN cells. PMNs (1x10⁶/tube) were labeled with 2′-7′-dichlorofluorescein
diacetate (DCFH-DA; 20 µM final concentration) and hydroethidine (HE; 10 µM final
concentration) for 15 min at 37°C to measure H2O2 and superoxide anion production, respectively
(26). Cells loaded with the fluorescent probes were then stimulated with 50 ng/ml PMA. Samples
were immediately analyzed on a FACS Canto® flow cytometer to ensure a true zero value and then
each tube was run individually to measure DCFH-DA and HE fluorescence, every 5 min for up to
25 min. Control tubes consisted of PMN cells without addition of PMA. Fluorescence emission for
DCFH-DA and HE was collected at 525 nm and 620 nm, respectively. A minimum of 10,000
events was acquired in list mode. Samples were analyzed with the FACS Diva software package
(BD Biosciences). Superoxide generation in intact cells was measured at 25°C by
spectrophotometric assay of ferricytochrome c reduction in 1.0 ml cuvettes containing 2×10⁶ cells
and 50 µM cytochrome c in phosphate-buffered saline (PBS), pH 7,4, supplemented with 1.2 mM
MgCl2, 2 mM CaCl2. The mixture was blanked at 550nm in a Bio-Rad Benchmark Plus microplate
reader before adding PMA, and the time-dependent release of superoxide from PMNs was recorded
with or without the addition of superoxide dismutase, catalase and methionine, as ROS scavengers.
Readings were taken every 20 s for a total run time of 30 min. Superoxide dismutase-inhibitable
absorbance was calculated using ε=2·11×104 M−1cm−1 for reduced cytochrome c.
The concentrations of human leukocyte elastase antigen (HLE) bound to the specific inhibitor α1-
anti-protease 1, present in the supernatants of PMA-stimulated PMNs were measured using “PMN-
Elastase ELISA” kit (Abnova, Milano, Italy) according to the manufacturer’s instructions.
Absorbance values were measured with a Bio-Rad Benchmark Spectrophotometer Microplate
Reader (Bio-Rad Laboratories, Hercules, CA) at 450 nm, subtracting the aspecific contribution at
620 nm. Aliquots of the same supernatant solutions, taken from 5 to 30 min after addition of PMA,
were used to measure the level of HLE, by monitoring at 405 nm the enzyme activity toward 200
µM of the synthetic substrate N-(Methoxysuccinyl)-Ala-Ala-Pro-Val 4-nitroanilide (Sigma-
5.von Willebrand Factor
142
Aldrich). The reference curve was constructed using purified HLE over a concentration ranging
from 10 to 100 nM.
Spectroscopic measurements. UV-absorption spectra of intact and oxidized VWF multimers at
different HClO concentrations were recorded on a Varian-Cary (Palo Alto, CA) model 2200
spectrophotomer or on a Jasco (Tokyo, Japan) V-630 instrument. For native VWF, an extinction
coefficient at 280 nm was calculated as 0.846 (mg/ml)-1 cm-1 determined by the method of Pace et
al. (27). Intrinsic fluorescence spectra were recorded on a model Eclipse spectrofluorimeter (Varian,
Santa Clara, CA), equipped with a Peltier temperature control system at 25°C. Both intact and
HClO-oxidized (HClO, 2.5-40 µM for 15 min) VWF multimers were used at a concentration of 200
nM. VWF solutions were excited at 280 or 295, using excitation and emission slits of 2.5 or 5 nm.
Dityrosine production was assessed by exciting the samples at 325 nm and recording the
fluorescence intensity at 410 nm (28). Denaturation experiments of VWF and VWF-Ox were
carried out by recording the fluorescence λmax as a function of guanidine hydrochloride (Gdn-HCl)
concentration. Unfolding data were analyzed according to a two-state model, as previously reported
(27,29). Far-UV CD spectra were taken on a Jasco (Tokyo, Japan) J-810 spectropolarimeter using a
1-mm pathlength cuvette. The final spectra resulted from four accumulations after base line
subtraction and CD signal, [θ], was expressed as the mean residue ellipticity. All spectroscopic
measurements were carried out at 25±0.1°C in HBS.
Dynamic light scattering measurements on native and oxidized VWF samples were carried
out at 25±0.1°C with a Zetasizer Nano S (Malvern Instruments, Malvern, U.K.) at a fixed angle
(i.e., 173°) from the incident light (He-Ne laser power: 4 mW; incident light: 633 nm). Samples
were manually injected into a 1-cm pathlength Suprasil quartz cuvette (45 µl) (Hellma Italia, Milan,
Italy). Data were collected for at least 15 minutes from injection. Each measurement consisted of a
subset of runs automatically determined, each being averaged for 10 s. Peak intensity analysis was
used to determine the average hydrodynamic diameters (Z-average diameter) of the scattering
particles. Polydispersity index was obtained by a cumulative analysis of the intensity
autocorrelation function using the Nano vs. 5.0 software (30).
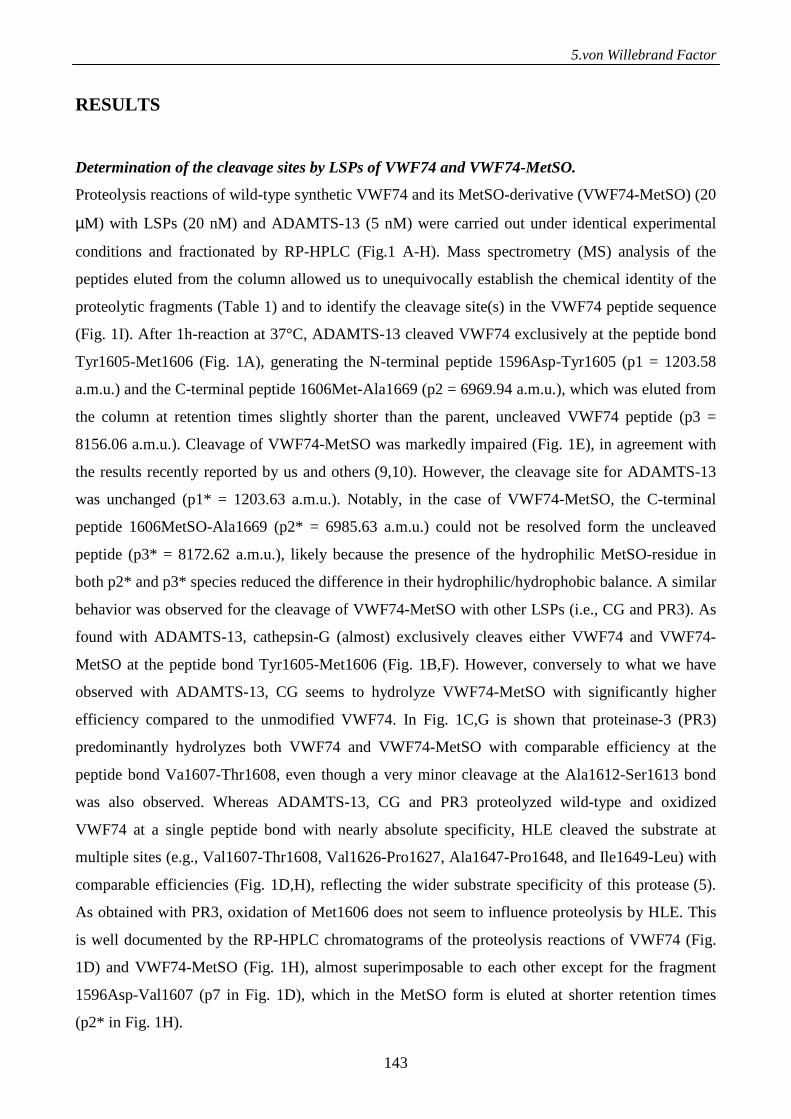
5.von Willebrand Factor
143
RESULTS
Determination of the cleavage sites by LSPs of VWF74 and VWF74-MetSO.
Proteolysis reactions of wild-type synthetic VWF74 and its MetSO-derivative (VWF74-MetSO) (20
µM) with LSPs (20 nM) and ADAMTS-13 (5 nM) were carried out under identical experimental
conditions and fractionated by RP-HPLC (Fig.1 A-H). Mass spectrometry (MS) analysis of the
peptides eluted from the column allowed us to unequivocally establish the chemical identity of the
proteolytic fragments (Table 1) and to identify the cleavage site(s) in the VWF74 peptide sequence
(Fig. 1I). After 1h-reaction at 37°C, ADAMTS-13 cleaved VWF74 exclusively at the peptide bond
Tyr1605-Met1606 (Fig. 1A), generating the N-terminal peptide 1596Asp-Tyr1605 (p1 = 1203.58
a.m.u.) and the C-terminal peptide 1606Met-Ala1669 (p2 = 6969.94 a.m.u.), which was eluted from
the column at retention times slightly shorter than the parent, uncleaved VWF74 peptide (p3 =
8156.06 a.m.u.). Cleavage of VWF74-MetSO was markedly impaired (Fig. 1E), in agreement with
the results recently reported by us and others (9,10). However, the cleavage site for ADAMTS-13
was unchanged (p1* = 1203.63 a.m.u.). Notably, in the case of VWF74-MetSO, the C-terminal
peptide 1606MetSO-Ala1669 (p2* = 6985.63 a.m.u.) could not be resolved form the uncleaved
peptide (p3* = 8172.62 a.m.u.), likely because the presence of the hydrophilic MetSO-residue in
both p2* and p3* species reduced the difference in their hydrophilic/hydrophobic balance. A similar
behavior was observed for the cleavage of VWF74-MetSO with other LSPs (i.e., CG and PR3). As
found with ADAMTS-13, cathepsin-G (almost) exclusively cleaves either VWF74 and VWF74-
MetSO at the peptide bond Tyr1605-Met1606 (Fig. 1B,F). However, conversely to what we have
observed with ADAMTS-13, CG seems to hydrolyze VWF74-MetSO with significantly higher
efficiency compared to the unmodified VWF74. In Fig. 1C,G is shown that proteinase-3 (PR3)
predominantly hydrolyzes both VWF74 and VWF74-MetSO with comparable efficiency at the
peptide bond Va1607-Thr1608, even though a very minor cleavage at the Ala1612-Ser1613 bond
was also observed. Whereas ADAMTS-13, CG and PR3 proteolyzed wild-type and oxidized
VWF74 at a single peptide bond with nearly absolute specificity, HLE cleaved the substrate at
multiple sites (e.g., Val1607-Thr1608, Val1626-Pro1627, Ala1647-Pro1648, and Ile1649-Leu) with
comparable efficiencies (Fig. 1D,H), reflecting the wider substrate specificity of this protease (5).
As obtained with PR3, oxidation of Met1606 does not seem to influence proteolysis by HLE. This
is well documented by the RP-HPLC chromatograms of the proteolysis reactions of VWF74 (Fig.
1D) and VWF74-MetSO (Fig. 1H), almost superimposable to each other except for the fragment
1596Asp-Val1607 (p7 in Fig. 1D), which in the MetSO form is eluted at shorter retention times
(p2* in Fig. 1H).
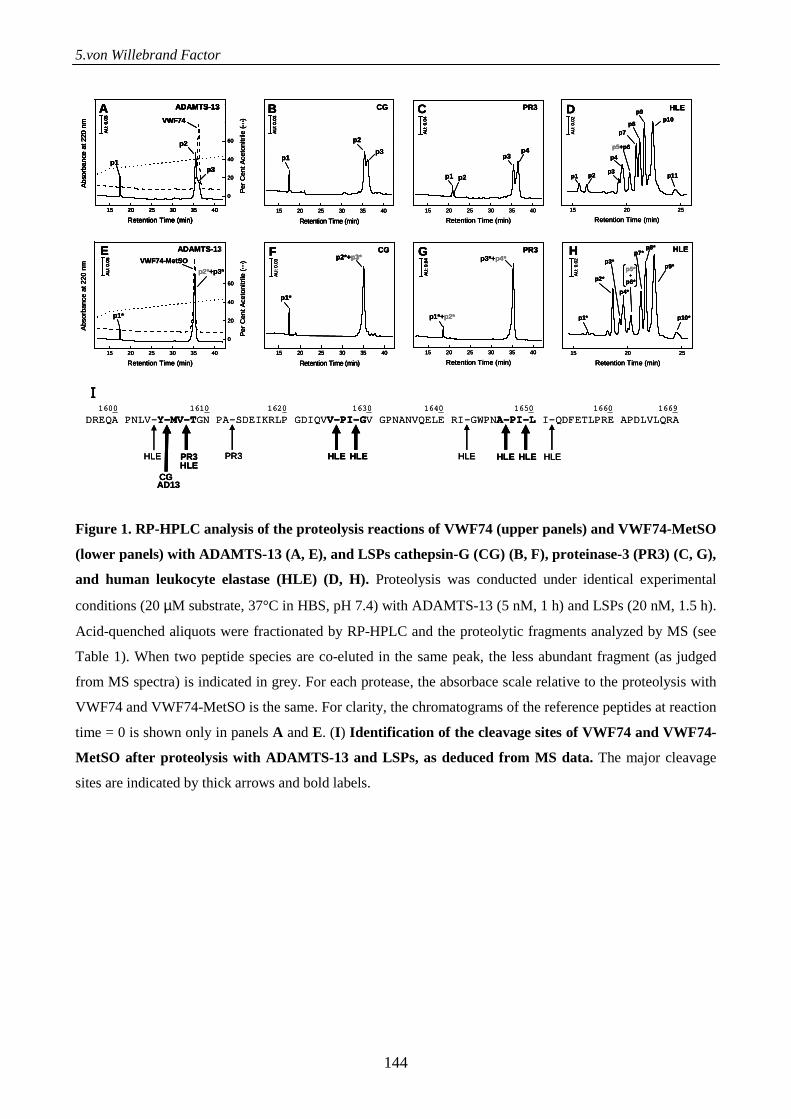
5.von Willebrand Factor
144
Figure 1. RP-HPLC analysis of the proteolysis reactions of VWF74 (upper panels) and VWF74-MetSO
(lower panels) with ADAMTS-13 (A, E), and LSPs cathepsin-G (CG) (B, F), proteinase-3 (PR3) (C, G),
and human leukocyte elastase (HLE) (D, H). Proteolysis was conducted under identical experimental
conditions (20 µM substrate, 37°C in HBS, pH 7.4) with ADAMTS-13 (5 nM, 1 h) and LSPs (20 nM, 1.5 h).
Acid-quenched aliquots were fractionated by RP-HPLC and the proteolytic fragments analyzed by MS (see
Table 1). When two peptide species are co-eluted in the same peak, the less abundant fragment (as judged
from MS spectra) is indicated in grey. For each protease, the absorbace scale relative to the proteolysis with
VWF74 and VWF74-MetSO is the same. For clarity, the chromatograms of the reference peptides at reaction
time = 0 is shown only in panels A and E. (I ) Identification of the cleavage sites of VWF74 and VWF74-
MetSO after proteolysis with ADAMTS-13 and LSPs, as deduced from MS data. The major cleavage
sites are indicated by thick arrows and bold labels.
1600 1610 1620 1630 1640 1650 1660 1669
DREQA PNLV-Y-MV-TGN PA-SDEIKRLP GDIQVV-PI-GV GPNANVQELE RI-GWPNA-PI-L I-QDFETLPRE APDLVLQRA
HLEHLE
AD13
PR3
CG
PR3 HLE HLE HLE HLE HLE HLE
I
0
20
40
60
80
100
Per
Cen
t Ace
toni
trile
(
)
15 20 25 30 35 40
Abs
orba
nce
at 2
20 n
m
Retention Time (min)
••
•
p1p3
p2
VWF74
A ADAMTS-13A
U: 0
.05
0
20
40
60
80
100
Per
Cen
t Ace
toni
trile
(
)
15 20 25 30 35 40
Abs
orba
nce
at 2
20 n
m
Retention Time (min)
••
•
p1p3
p2
VWF74
A ADAMTS-13A
U: 0
.05
15 20 25 30 35 40
Abs
orba
nce
at 2
20 n
m
Retention Time (min)
••
•
p1p3
p2
VWF74
A ADAMTS-13A
U: 0
.05
AU
: 0.0
5
15 20 25 30 35 40
Retention Time (min)
B CG
p1
p2
p3
AU
: 0.0
3
15 20 25 30 35 40
Retention Time (min)
B CG
p1
p2
p3
AU
: 0.0
3A
U: 0
.03
15 20 25 30 35 40
Retention Time (min)
C PR3
p1 p2
p3p4
AU
: 0.0
4
15 20 25 30 35 40
Retention Time (min)
C PR3
p1 p2
p3p4
AU
: 0.0
4A
U: 0
.04
15 20 25
Retention Time (min)
D HLE
p5+p6
p4
p3p2p1 p11
p7p8
p9p10
AU
: 0.0
2
15 20 25
Retention Time (min)
D HLE
p5+p6
p4
p3p2p1 p11
p7p8
p9p10
AU
: 0.0
2
0
20
40
60
80
100 P
er
Cen
t Ace
toni
trile
(
)
15 20 25 30 35 40
Abs
orba
nce
at 2
20 n
m
Retention Time (min)
••
•
E
p1*
p2*+p3*
VWF74-MetSO
ADAMTS-13
AU
: 0.0
5
0
20
40
60
80
100 P
er
Cen
t Ace
toni
trile
(
)
15 20 25 30 35 40
Abs
orba
nce
at 2
20 n
m
Retention Time (min)
••
•
E
p1*
p2*+p3*
VWF74-MetSO
ADAMTS-13
AU
: 0.0
5A
U: 0
.05
15 20 25 30 35 40
Retention Time (min)
p1*
p2*+p3*F CG
AU
: 0.0
3
15 20 25 30 35 40
Retention Time (min)
p1*
p2*+p3*F CG
AU
: 0.0
3
15 20 25 30 35 40
Retention Time (min)
p3*+p4*G PR3
p1*+p2*
AU
: 0.0
4
15 20 25 30 35 40
Retention Time (min)
p3*+p4*G PR3
p1*+p2*
AU
: 0.0
4A
U: 0
.04
15 20 25
Retention Time (min)
H HLE
p1*
p4*
p2*
p3*p7*
p8*
p10*
p9*
AU
: 0.0
2
p5*+
p6*
15 20 25
Retention Time (min)
H HLE
p1*
p4*
p2*
p3*p7*
p8*
p10*
p9*
AU
: 0.0
2
p5*+
p6*
1600 1610 1620 1630 1640 1650 1660 1669
DREQA PNLV-Y-MV-TGN PA-SDEIKRLP GDIQVV-PI-GV GPNANVQELE RI-GWPNA-PI-L I-QDFETLPRE APDLVLQRA
HLEHLE
AD13
PR3
CG
PR3 HLE HLE HLE HLE HLE HLE
I1600 1610 1620 1630 1640 1650 1660 1669
DREQA PNLV-Y-MV-TGN PA-SDEIKRLP GDIQVV-PI-GV GPNANVQELE RI-GWPNA-PI-L I-QDFETLPRE APDLVLQRA
HLEHLE
AD13
PR3
CG
PR3 HLE HLE HLE HLE HLE HLE
I
0
20
40
60
80
100
Per
Cen
t Ace
toni
trile
(
)
15 20 25 30 35 40
Abs
orba
nce
at 2
20 n
m
Retention Time (min)
••
•
p1p3
p2
VWF74
A ADAMTS-13A
U: 0
.05
0
20
40
60
80
100
Per
Cen
t Ace
toni
trile
(
)
15 20 25 30 35 40
Abs
orba
nce
at 2
20 n
m
Retention Time (min)
••
•
p1p3
p2
VWF74
A ADAMTS-13A
U: 0
.05
15 20 25 30 35 40
Abs
orba
nce
at 2
20 n
m
Retention Time (min)
••
•
p1p3
p2
VWF74
A ADAMTS-13A
U: 0
.05
AU
: 0.0
5
15 20 25 30 35 40
Retention Time (min)
B CG
p1
p2
p3
AU
: 0.0
3
15 20 25 30 35 40
Retention Time (min)
B CG
p1
p2
p3
AU
: 0.0
3A
U: 0
.03
15 20 25 30 35 40
Retention Time (min)
C PR3
p1 p2
p3p4
AU
: 0.0
4
15 20 25 30 35 40
Retention Time (min)
C PR3
p1 p2
p3p4
AU
: 0.0
4A
U: 0
.04
15 20 25
Retention Time (min)
D HLE
p5+p6
p4
p3p2p1 p11
p7p8
p9p10
AU
: 0.0
2
15 20 25
Retention Time (min)
D HLE
p5+p6
p4
p3p2p1 p11
p7p8
p9p10
AU
: 0.0
2
0
20
40
60
80
100 P
er
Cen
t Ace
toni
trile
(
)
15 20 25 30 35 40
Abs
orba
nce
at 2
20 n
m
Retention Time (min)
••
•
E
p1*
p2*+p3*
VWF74-MetSO
ADAMTS-13
AU
: 0.0
5
0
20
40
60
80
100 P
er
Cen
t Ace
toni
trile
(
)
15 20 25 30 35 40
Abs
orba
nce
at 2
20 n
m
Retention Time (min)
••
•
E
p1*
p2*+p3*
VWF74-MetSO
ADAMTS-13
AU
: 0.0
5A
U: 0
.05
15 20 25 30 35 40
Retention Time (min)
p1*
p2*+p3*F CG
AU
: 0.0
3
15 20 25 30 35 40
Retention Time (min)
p1*
p2*+p3*F CG
AU
: 0.0
3
15 20 25 30 35 40
Retention Time (min)
p3*+p4*G PR3
p1*+p2*
AU
: 0.0
4
15 20 25 30 35 40
Retention Time (min)
p3*+p4*G PR3
p1*+p2*
AU
: 0.0
4A
U: 0
.04
15 20 25
Retention Time (min)
H HLE
p1*
p4*
p2*
p3*p7*
p8*
p10*
p9*
AU
: 0.0
2
p5*+
p6*
15 20 25
Retention Time (min)
H HLE
p1*
p4*
p2*
p3*p7*
p8*
p10*
p9*
AU
: 0.0
2
p5*+
p6*
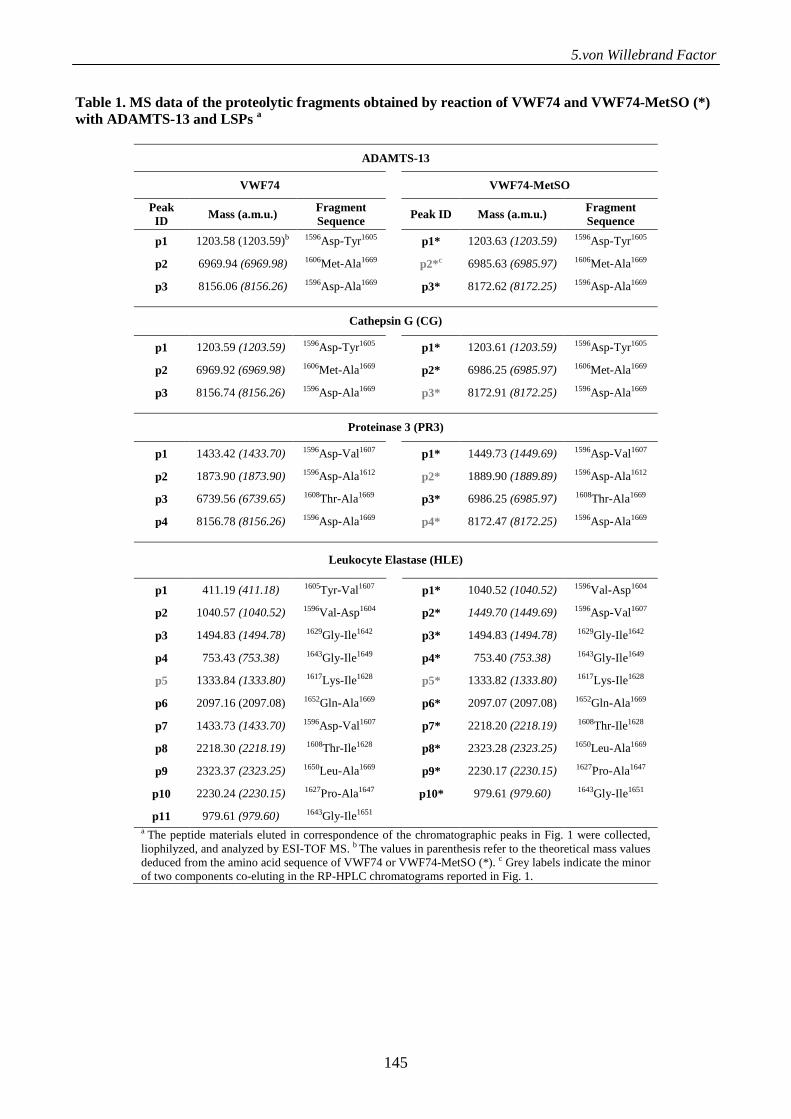
5.von Willebrand Factor
145
Table 1. MS data of the proteolytic fragments obtained by reaction of VWF74 and VWF74-MetSO (*) with ADAMTS-13 and LSPs a
ADAMTS-13
VWF74 VWF74-MetSO
Peak ID
Mass (a.m.u.) Fragment Sequence
Peak ID Mass (a.m.u.) Fragment Sequence
p1 1203.58 (1203.59)b 1596Asp-Tyr1605 p1* 1203.63 (1203.59) 1596Asp-Tyr1605
p2 6969.94 (6969.98) 1606Met-Ala1669 p2*c 6985.63 (6985.97) 1606Met-Ala1669
p3 8156.06 (8156.26) 1596Asp-Ala1669 p3* 8172.62 (8172.25) 1596Asp-Ala1669
Cathepsin G (CG)
p1 1203.59 (1203.59) 1596Asp-Tyr1605 p1* 1203.61 (1203.59) 1596Asp-Tyr1605
p2 6969.92 (6969.98) 1606Met-Ala1669 p2* 6986.25 (6985.97) 1606Met-Ala1669
p3 8156.74 (8156.26) 1596Asp-Ala1669 p3* 8172.91 (8172.25) 1596Asp-Ala1669
Proteinase 3 (PR3)
p1 1433.42 (1433.70) 1596Asp-Val1607 p1* 1449.73 (1449.69) 1596Asp-Val1607
p2 1873.90 (1873.90) 1596Asp-Ala1612 p2* 1889.90 (1889.89) 1596Asp-Ala1612
p3 6739.56 (6739.65) 1608Thr-Ala1669 p3* 6986.25 (6985.97) 1608Thr-Ala1669
p4 8156.78 (8156.26) 1596Asp-Ala1669 p4* 8172.47 (8172.25) 1596Asp-Ala1669
Leukocyte Elastase (HLE)
p1 411.19 (411.18) 1605Tyr-Val1607 p1* 1040.52 (1040.52) 1596Val-Asp1604
p2 1040.57 (1040.52) 1596Val-Asp1604 p2* 1449.70 (1449.69) 1596Asp-Val1607
p3 1494.83 (1494.78) 1629Gly-Ile1642 p3* 1494.83 (1494.78) 1629Gly-Ile1642
p4 753.43 (753.38) 1643Gly-Ile1649 p4* 753.40 (753.38) 1643Gly-Ile1649
p5 1333.84 (1333.80) 1617Lys-Ile1628 p5* 1333.82 (1333.80) 1617Lys-Ile1628
p6 2097.16 (2097.08) 1652Gln-Ala1669 p6* 2097.07 (2097.08) 1652Gln-Ala1669
p7 1433.73 (1433.70) 1596Asp-Val1607 p7* 2218.20 (2218.19) 1608Thr-Ile1628
p8 2218.30 (2218.19) 1608Thr-Ile1628 p8* 2323.28 (2323.25) 1650Leu-Ala1669
p9 2323.37 (2323.25) 1650Leu-Ala1669 p9* 2230.17 (2230.15) 1627Pro-Ala1647
p10 2230.24 (2230.15) 1627Pro-Ala1647 p10* 979.61 (979.60) 1643Gly-Ile1651
p11 979.61 (979.60) 1643Gly-Ile1651 a The peptide materials eluted in correspondence of the chromatographic peaks in Fig. 1 were collected, liophilyzed, and analyzed by ESI-TOF MS. b The values in parenthesis refer to the theoretical mass values deduced from the amino acid sequence of VWF74 or VWF74-MetSO (*). c Grey labels indicate the minor of two components co-eluting in the RP-HPLC chromatograms reported in Fig. 1.
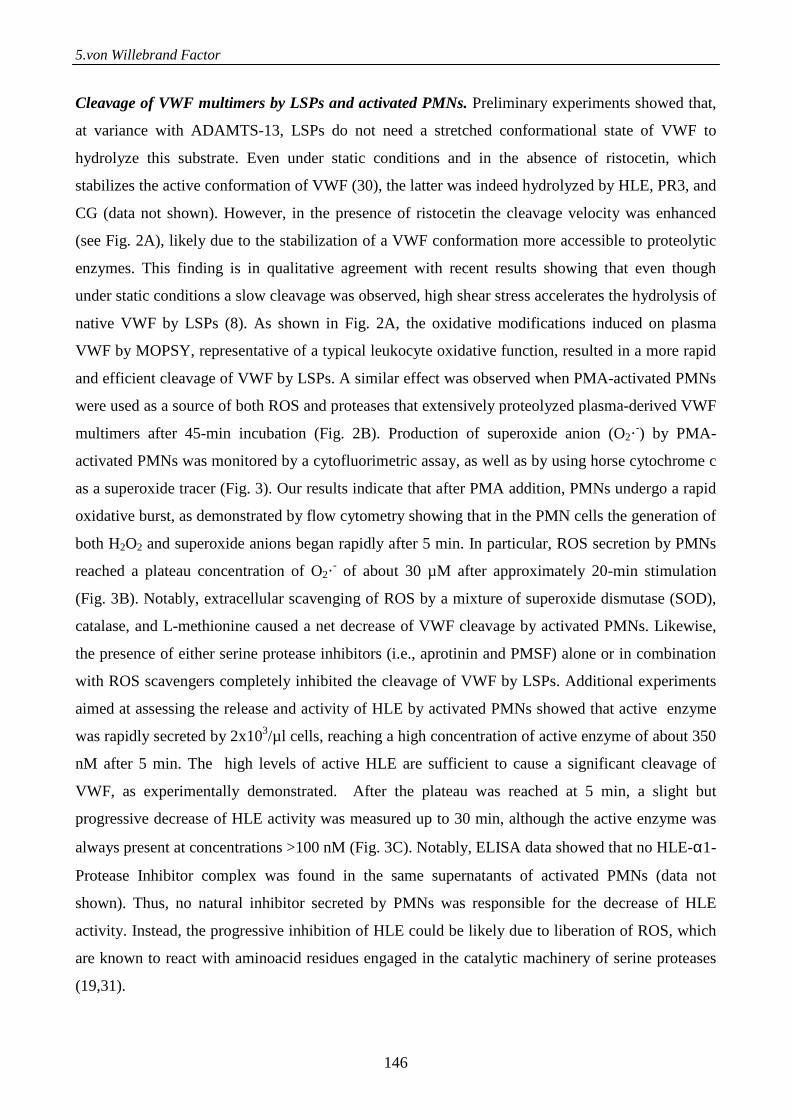
5.von Willebrand Factor
146
Cleavage of VWF multimers by LSPs and activated PMNs. Preliminary experiments showed that,
at variance with ADAMTS-13, LSPs do not need a stretched conformational state of VWF to
hydrolyze this substrate. Even under static conditions and in the absence of ristocetin, which
stabilizes the active conformation of VWF (30), the latter was indeed hydrolyzed by HLE, PR3, and
CG (data not shown). However, in the presence of ristocetin the cleavage velocity was enhanced
(see Fig. 2A), likely due to the stabilization of a VWF conformation more accessible to proteolytic
enzymes. This finding is in qualitative agreement with recent results showing that even though
under static conditions a slow cleavage was observed, high shear stress accelerates the hydrolysis of
native VWF by LSPs (8). As shown in Fig. 2A, the oxidative modifications induced on plasma
VWF by MOPSY, representative of a typical leukocyte oxidative function, resulted in a more rapid
and efficient cleavage of VWF by LSPs. A similar effect was observed when PMA-activated PMNs
were used as a source of both ROS and proteases that extensively proteolyzed plasma-derived VWF
multimers after 45-min incubation (Fig. 2B). Production of superoxide anion (O2·-) by PMA-
activated PMNs was monitored by a cytofluorimetric assay, as well as by using horse cytochrome c
as a superoxide tracer (Fig. 3). Our results indicate that after PMA addition, PMNs undergo a rapid
oxidative burst, as demonstrated by flow cytometry showing that in the PMN cells the generation of
both H2O2 and superoxide anions began rapidly after 5 min. In particular, ROS secretion by PMNs
reached a plateau concentration of O2·- of about 30 µM after approximately 20-min stimulation
(Fig. 3B). Notably, extracellular scavenging of ROS by a mixture of superoxide dismutase (SOD),
catalase, and L-methionine caused a net decrease of VWF cleavage by activated PMNs. Likewise,
the presence of either serine protease inhibitors (i.e., aprotinin and PMSF) alone or in combination
with ROS scavengers completely inhibited the cleavage of VWF by LSPs. Additional experiments
aimed at assessing the release and activity of HLE by activated PMNs showed that active enzyme
was rapidly secreted by 2x10³/µl cells, reaching a high concentration of active enzyme of about 350
nM after 5 min. The high levels of active HLE are sufficient to cause a significant cleavage of
VWF, as experimentally demonstrated. After the plateau was reached at 5 min, a slight but
progressive decrease of HLE activity was measured up to 30 min, although the active enzyme was
always present at concentrations >100 nM (Fig. 3C). Notably, ELISA data showed that no HLE-α1-
Protease Inhibitor complex was found in the same supernatants of activated PMNs (data not
shown). Thus, no natural inhibitor secreted by PMNs was responsible for the decrease of HLE
activity. Instead, the progressive inhibition of HLE could be likely due to liberation of ROS, which
are known to react with aminoacid residues engaged in the catalytic machinery of serine proteases
(19,31).
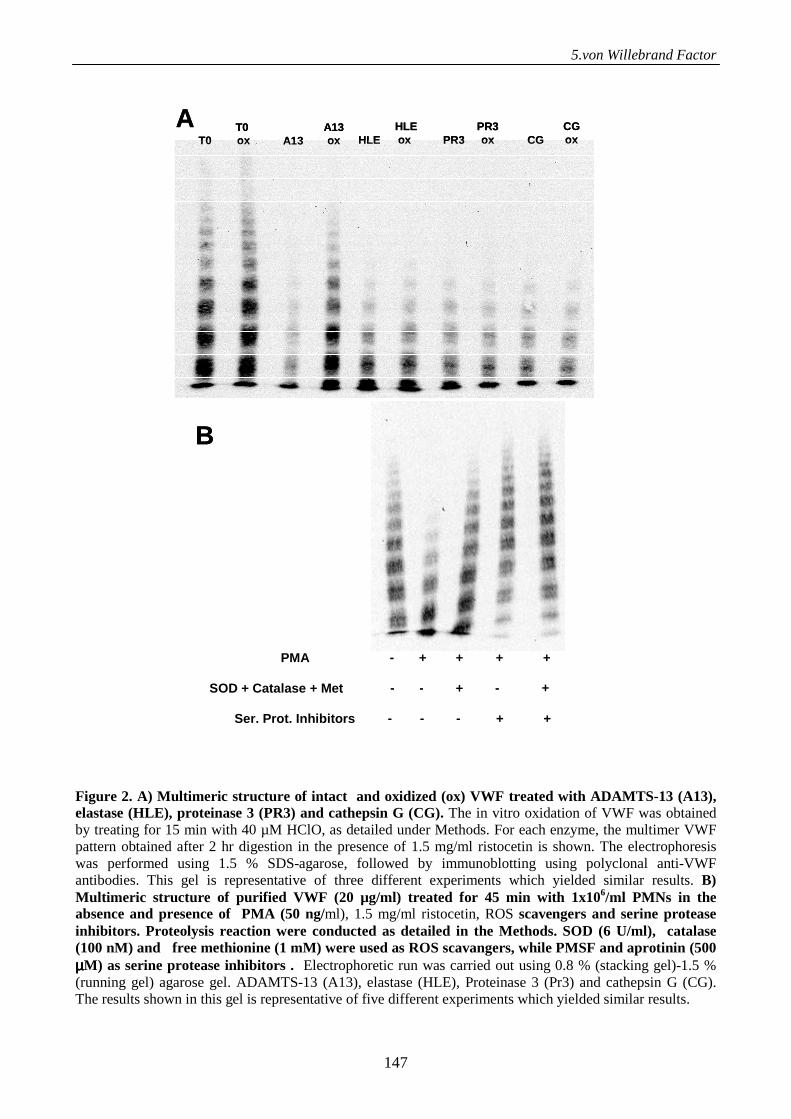
5.von Willebrand Factor
147
Figure 2. A) Multimeric structure of intact and oxidized (ox) VWF treated with ADAMTS-13 (A13), elastase (HLE), proteinase 3 (PR3) and cathepsin G (CG). The in vitro oxidation of VWF was obtained by treating for 15 min with 40 µM HClO, as detailed under Methods. For each enzyme, the multimer VWF pattern obtained after 2 hr digestion in the presence of 1.5 mg/ml ristocetin is shown. The electrophoresis was performed using 1.5 % SDS-agarose, followed by immunoblotting using polyclonal anti-VWF antibodies. This gel is representative of three different experiments which yielded similar results. B) Multimeric structure of purified VWF (20 µg/ml) tre ated for 45 min with 1x10⁶/ml PMNs in the absence and presence of PMA (50 ng/ml), 1.5 mg/ml ristocetin, ROS scavengers and serine protease inhibitors. Proteolysis reaction were conducted as detailed in the Methods. SOD (6 U/ml), catalase (100 nM) and free methionine (1 mM) were used as ROS scavangers, while PMSF and aprotinin (500 µµµµM) as serine protease inhibitors . Electrophoretic run was carried out using 0.8 % (stacking gel)-1.5 % (running gel) agarose gel. ADAMTS-13 (A13), elastase (HLE), Proteinase 3 (Pr3) and cathepsin G (CG). The results shown in this gel is representative of five different experiments which yielded similar results.
A
B
PMA - + + + +
SOD + Catalase + Met - - + - +
Ser. Prot. Inhibitors - - - + +
A
B
T0T0 ox A13
A13ox
HLEoxHLE PR3
PR3 ox CG
CG oxT0
T0 ox A13
A13ox
HLEoxHLE PR3
PR3 ox CG
CG ox
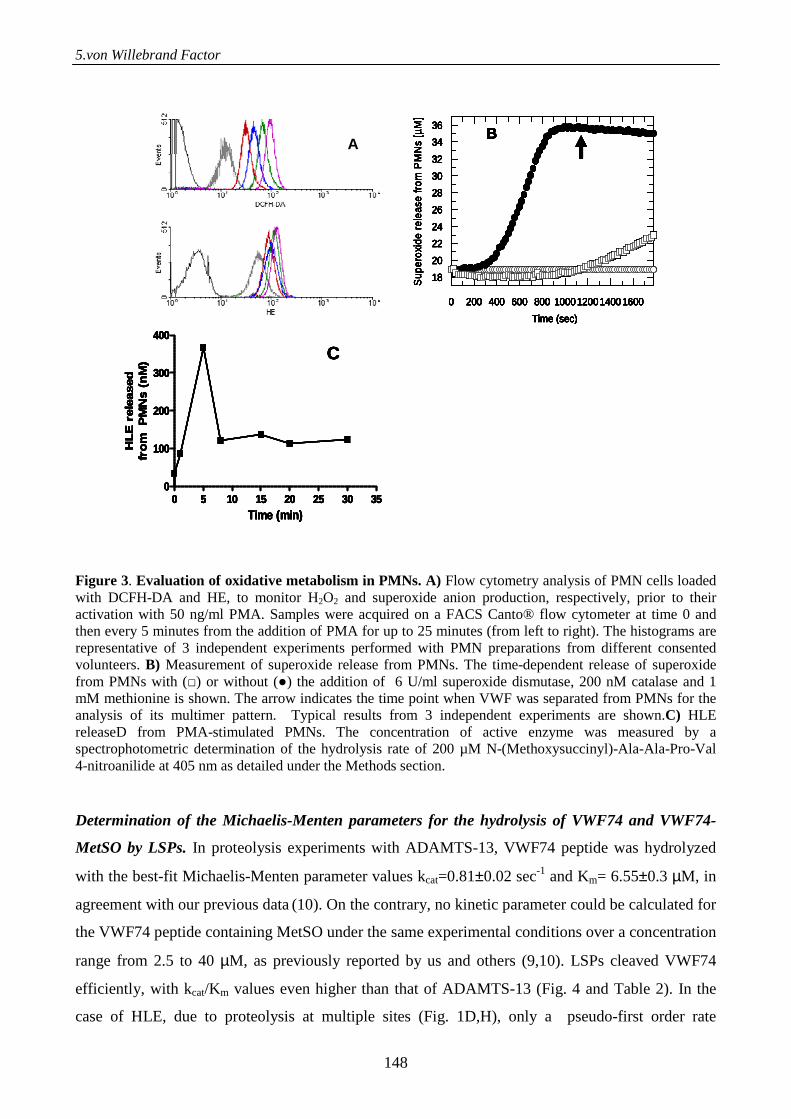
5.von Willebrand Factor
148
Figure 3. Evaluation of oxidative metabolism in PMNs. A) Flow cytometry analysis of PMN cells loaded with DCFH-DA and HE, to monitor H2O2 and superoxide anion production, respectively, prior to their activation with 50 ng/ml PMA. Samples were acquired on a FACS Canto® flow cytometer at time 0 and then every 5 minutes from the addition of PMA for up to 25 minutes (from left to right). The histograms are representative of 3 independent experiments performed with PMN preparations from different consented volunteers. B) Measurement of superoxide release from PMNs. The time-dependent release of superoxide from PMNs with (□) or without (●) the addition of 6 U/ml superoxide dismutase, 200 nM catalase and 1 mM methionine is shown. The arrow indicates the time point when VWF was separated from PMNs for the analysis of its multimer pattern. Typical results from 3 independent experiments are shown.C) HLE releaseD from PMA-stimulated PMNs. The concentration of active enzyme was measured by a spectrophotometric determination of the hydrolysis rate of 200 µM N-(Methoxysuccinyl)-Ala-Ala-Pro-Val 4-nitroanilide at 405 nm as detailed under the Methods section. Determination of the Michaelis-Menten parameters for the hydrolysis of VWF74 and VWF74-
MetSO by LSPs. In proteolysis experiments with ADAMTS-13, VWF74 peptide was hydrolyzed
with the best-fit Michaelis-Menten parameter values kcat=0.81±0.02 sec-1 and Km= 6.55±0.3 µM, in
agreement with our previous data (10). On the contrary, no kinetic parameter could be calculated for
the VWF74 peptide containing MetSO under the same experimental conditions over a concentration
range from 2.5 to 40 µM, as previously reported by us and others (9,10). LSPs cleaved VWF74
efficiently, with kcat/Km values even higher than that of ADAMTS-13 (Fig. 4 and Table 2). In the
case of HLE, due to proteolysis at multiple sites (Fig. 1D,H), only a pseudo-first order rate
A
A
A
A
16001400120010008006004002000
36
34
32
30
28
26
24
22
20
18
Time (sec)
Sup
erox
ide
rele
ase
from
PM
Ns
[µM
]
B
16001400120010008006004002000
36
34
32
30
28
26
24
22
20
18
Time (sec)
Sup
erox
ide
rele
ase
from
PM
Ns
[µM
]
B
16001400120010008006004002000
36
34
32
30
28
26
24
22
20
18
Time (sec)
Sup
erox
ide
rele
ase
from
PM
Ns
[µM
]
B
16001400120010008006004002000
36
34
32
30
28
26
24
22
20
18
Time (sec)
Sup
erox
ide
rele
ase
from
PM
Ns
[µM
]
B
0 5 10 15 20 25 30 350
100
200
300
400
Time (min)
HLE
rele
ase
dfr
om
P
MN
s (n
M)
C
0 5 10 15 20 25 30 350
100
200
300
400
Time (min)
HLE
rele
ase
dfr
om
P
MN
s (n
M)
C
0 5 10 15 20 25 30 350
100
200
300
400
Time (min)
HLE
rele
ase
dfr
om
P
MN
s (n
M)
C
A
A
A
A
16001400120010008006004002000
36
34
32
30
28
26
24
22
20
18
Time (sec)
Sup
erox
ide
rele
ase
from
PM
Ns
[µM
]
B
16001400120010008006004002000
36
34
32
30
28
26
24
22
20
18
Time (sec)
Sup
erox
ide
rele
ase
from
PM
Ns
[µM
]
B
16001400120010008006004002000
36
34
32
30
28
26
24
22
20
18
Time (sec)
Sup
erox
ide
rele
ase
from
PM
Ns
[µM
]
B
16001400120010008006004002000
36
34
32
30
28
26
24
22
20
18
Time (sec)
Sup
erox
ide
rele
ase
from
PM
Ns
[µM
]
B
0 5 10 15 20 25 30 350
100
200
300
400
Time (min)
HLE
rele
ase
dfr
om
P
MN
s (n
M)
C
0 5 10 15 20 25 30 350
100
200
300
400
Time (min)
HLE
rele
ase
dfr
om
P
MN
s (n
M)
C
0 5 10 15 20 25 30 350
100
200
300
400
Time (min)
HLE
rele
ase
dfr
om
P
MN
s (n
M)
C
5.von Willebrand Factor
149
constant, kobs, of VWF74 disappearance at 25 °C could be detrmined as 0.125±0.01 min-1. At
variance with what previously observed with ADAMTS-13 (9-10), oxidation of Met1606 did not
inhibit the hydrolysis of VWF74 by LSPs. Instead, the specific oxidation of Met1606 slightly
increased the kcat/Km value of CG, mainly due to a slight increase of the kcat value, whereas the
value of kcat/Km and kobs for PR3 and HLE, respectively, remained essentially unchanged within the
experimental error, if compared to that of VWF74 (Table 2). These findings were in qualitative
agreements with those obtained with oxidized VWF multimers, as described above
Figure 4. Determination of the Michaelis-Menten parameters of VWF74 (A) and VWF74-MetSO (B) hydrolysis by ADAMTS13 (▲), cathepsin G (○) and proteinase 3 (●). The steady state kinetic parameters were calculated by measuring with RP-HPLC the concentration of the N-terminal peptide released in the proteolysis reaction. The continuous lines were drawn according to the best-fit Michaelis parameters listed in Table 2.
0 5 10 15 200.0
0.2
0.4
0.6
0.8
1.0
VWF74-MetSO (µM)
Initi
al r
ate
(sec
-1)
0 5 10 15 200.0
0.2
0.4
0.6
0.8
VWF74 (µM)
Initi
al r
ate
(sec
-1)
A
B
0 5 10 15 200.0
0.2
0.4
0.6
0.8
1.0
VWF74-MetSO (µM)
Initi
al r
ate
(sec
-1)
0 5 10 15 200.0
0.2
0.4
0.6
0.8
VWF74 (µM)
Initi
al r
ate
(sec
-1)
A
B
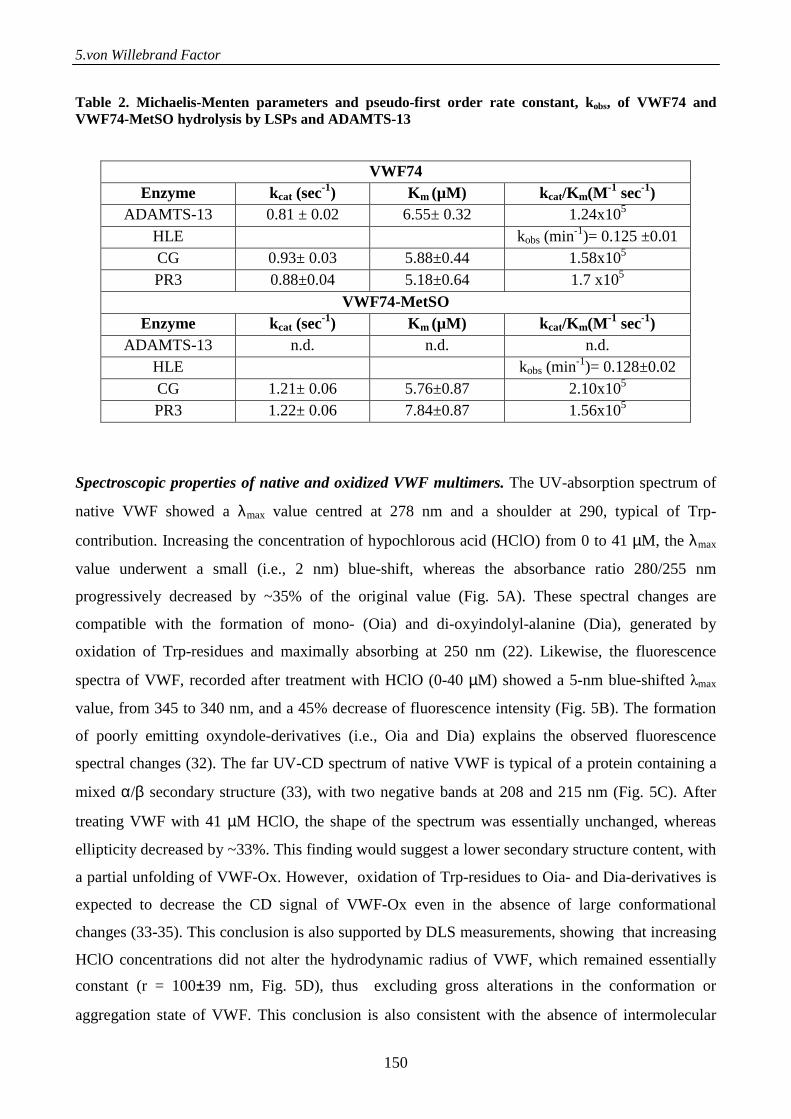
5.von Willebrand Factor
150
Table 2. Michaelis-Menten parameters and pseudo-first order rate constant, kobs, of VWF74 and VWF74-MetSO hydrolysis by LSPs and ADAMTS-13
VWF74 Enzyme kcat (sec-1) Km (µM) k cat/Km(M -1 sec-1)
ADAMTS-13 0.81 ± 0.02 6.55± 0.32 1.24x10⁵ HLE kobs (min-1)= 0.125 ±0.01 CG 0.93± 0.03 5.88±0.44 1.58x10⁵ PR3 0.88±0.04 5.18±0.64 1.7 x10⁵
VWF74-MetSO Enzyme kcat (sec-1) Km (µM) kcat/Km(M -1 sec-1)
ADAMTS-13 n.d. n.d. n.d. HLE kobs (min-1)= 0.128±0.02 CG 1.21± 0.06 5.76±0.87 2.10x10⁵ PR3 1.22± 0.06 7.84±0.87 1.56x10⁵
Spectroscopic properties of native and oxidized VWF multimers. The UV-absorption spectrum of
native VWF showed a λmax value centred at 278 nm and a shoulder at 290, typical of Trp-
contribution. Increasing the concentration of hypochlorous acid (HClO) from 0 to 41 µM, the λmax
value underwent a small (i.e., 2 nm) blue-shift, whereas the absorbance ratio 280/255 nm
progressively decreased by ~35% of the original value (Fig. 5A). These spectral changes are
compatible with the formation of mono- (Oia) and di-oxyindolyl-alanine (Dia), generated by
oxidation of Trp-residues and maximally absorbing at 250 nm (22). Likewise, the fluorescence
spectra of VWF, recorded after treatment with HClO (0-40 µM) showed a 5-nm blue-shifted λmax
value, from 345 to 340 nm, and a 45% decrease of fluorescence intensity (Fig. 5B). The formation
of poorly emitting oxyndole-derivatives (i.e., Oia and Dia) explains the observed fluorescence
spectral changes (32). The far UV-CD spectrum of native VWF is typical of a protein containing a
mixed α/β secondary structure (33), with two negative bands at 208 and 215 nm (Fig. 5C). After
treating VWF with 41 µM HClO, the shape of the spectrum was essentially unchanged, whereas
ellipticity decreased by ~33%. This finding would suggest a lower secondary structure content, with
a partial unfolding of VWF-Ox. However, oxidation of Trp-residues to Oia- and Dia-derivatives is
expected to decrease the CD signal of VWF-Ox even in the absence of large conformational
changes (33-35). This conclusion is also supported by DLS measurements, showing that increasing
HClO concentrations did not alter the hydrodynamic radius of VWF, which remained essentially
constant (r = 100±39 nm, Fig. 5D), thus excluding gross alterations in the conformation or
aggregation state of VWF. This conclusion is also consistent with the absence of intermolecular
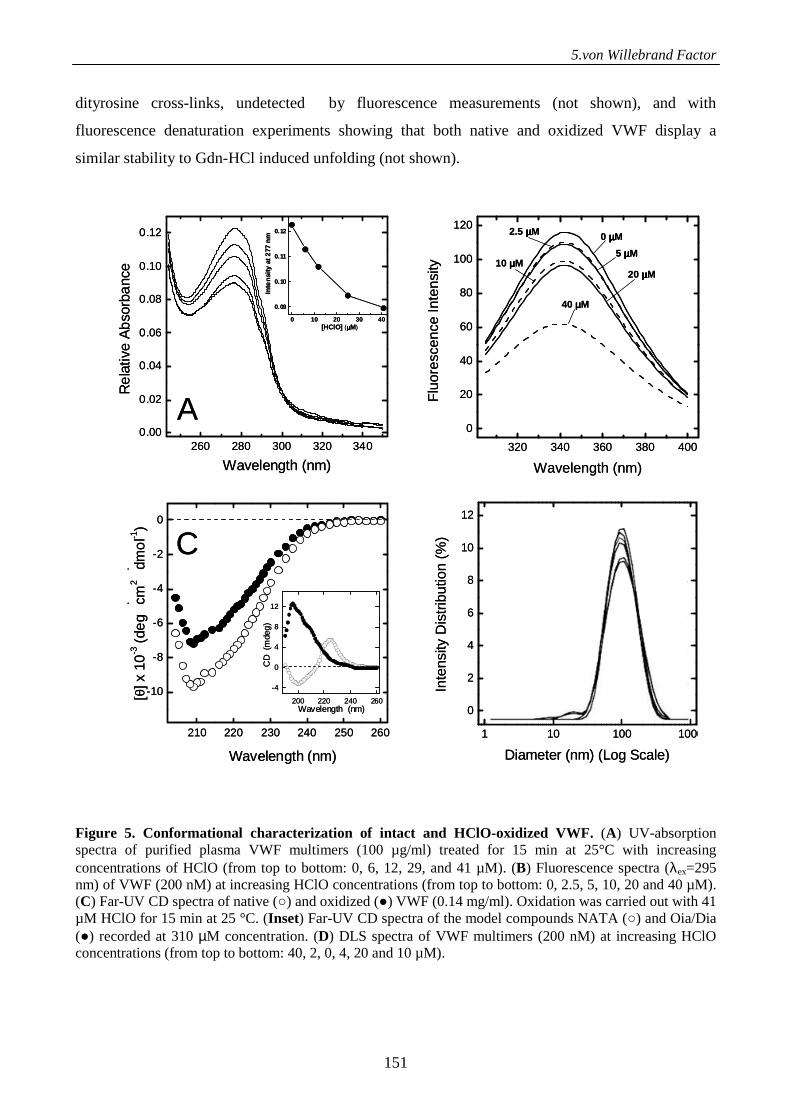
5.von Willebrand Factor
151
dityrosine cross-links, undetected by fluorescence measurements (not shown), and with
fluorescence denaturation experiments showing that both native and oxidized VWF display a
similar stability to Gdn-HCl induced unfolding (not shown).
Figure 5. Conformational characterization of intact and HClO-oxidized VWF. (A) UV-absorption spectra of purified plasma VWF multimers (100 µg/ml) treated for 15 min at 25°C with increasing concentrations of HClO (from top to bottom: 0, 6, 12, 29, and 41 µM). (B) Fluorescence spectra (λex=295 nm) of VWF (200 nM) at increasing HClO concentrations (from top to bottom: 0, 2.5, 5, 10, 20 and 40 µM). (C) Far-UV CD spectra of native (○) and oxidized (●) VWF (0.14 mg/ml). Oxidation was carried out with 41 µM HClO for 15 min at 25 °C. (Inset) Far-UV CD spectra of the model compounds NATA (○) and Oia/Dia (●) recorded at 310 µM concentration. (D) DLS spectra of VWF multimers (200 nM) at increasing HClO concentrations (from top to bottom: 40, 2, 0, 4, 20 and 10 µM).
C
1 10 100 1000
0
2
4
6
8
10
12
Inte
nsity
Dis
trib
utio
n (%
)
Diameter (nm) (Log Scale)
C
1 10 100 1000
0
2
4
6
8
10
12
Inte
nsity
Dis
trib
utio
n (%
)
Diameter (nm) (Log Scale)
260 280 300 320 3400.00
0.02
0.04
0.06
0.08
0.10
0.12
Re
lativ
e A
bso
rban
ce
Wavelength (nm)
0 10 20 30 40
0.09
0.10
0.11
0.12
Inte
nsity
at 2
77 n
m
[HClO] (µµµµM)
A260 280 300 320 340
0.00
0.02
0.04
0.06
0.08
0.10
0.12
Re
lativ
e A
bso
rban
ce
Wavelength (nm)
0 10 20 30 40
0.09
0.10
0.11
0.12
Inte
nsity
at 2
77 n
m
[HClO] (µµµµM)
A
210 220 230 240 250 260
-10
-8
-6
-4
-2
0
[θ
] x 1
0-3 (
deg
· cm
2 · dm
ol-1
)
Wavelength (nm)
C
200 220 240 260
-4
0
4
8
12
CD
(m
deg)
Wavelength (nm)
210 220 230 240 250 260
-10
-8
-6
-4
-2
0
[θ
] x 1
0-3 (
deg
· cm
2 · dm
ol-1
)
Wavelength (nm)
C
200 220 240 260
-4
0
4
8
12
CD
(m
deg)
Wavelength (nm)
320 340 360 380 400
0
20
40
60
80
100
120
Flu
ores
cenc
e In
tens
ity
Wavelength (nm)
0 µµµµM
5 µµµµM
2.5 µµµµM
20 µµµµM10 µµµµM
40 µµµµM
320 340 360 380 400
0
20
40
60
80
100
120
Flu
ores
cenc
e In
tens
ity
Wavelength (nm)
0 µµµµM
5 µµµµM
2.5 µµµµM
20 µµµµM10 µµµµM
40 µµµµM
5.von Willebrand Factor
152
DISCUSSION
ADAMTS-13 has been considered in the recent past the only enzyme responsible for the
proteolytic processing of VWF (8,36). However, recent studies showed that LSP efficiently cleave
VWF multimers near or even at the same peptide bond hydrolyzed by ADAMTS-13 (8). The results
of mass spectrometry analysis agree with those recently reported (8), showing that ADAMTS-13
and CG cleave rFRETS-VWF73 at Met1605-Tyr1606, whereas both HLE and PR3 hydrolyze the
same substrate selectively at Val1607-Thr1608. Strikingly, our results also show for the first time
that, at variance with ADAMTS-13, the selective oxidation of Met1606 to MetSO does not affect or
even slightly enhances VWF proteolysis by LSPs and this was ascertained with both synthetic
VWF74-MetSO peptide (Fig. 1) and full-length VWF oxidized with HClO or leukocyte MPO,
either by using purified proteases or activated PMN cells (Fig. 3) as source of LSPs and ROS.
PMNs stimulation by endogenous or exogenous agents results in an increase of their oxygen
consumption (respiratory burst) with a production of ROS, starting with the generation of
superoxide anion through the activation of NADPH oxidase and its product hydrogen peroxide
(H2O2) (37,38). Neutrophils produce also peroxynitrite from •O2- by reaction with nitric oxide
(NO•) and hydroxyl radical (OH•) from H2O2 in the presence of transition metals (39,40).
Activated PMNs release from their cytoplasmic granules proteolytic enzymes as well as
myeloperoxidase (MPO), which in the presence of chloride is responsible for the generation of
hypochlorous acid (HOCl), one of the most powerful oxidant molecules in vivo. As shown in Fig. 3,
stimulation of PMNs with PMA (50 ng/ml), a receptor-independent exogenous leukocyte activator
(2), leads to the relatively rapid generation of intracellular ROS, reaching a plateau concentration
>30 µM after about 20 min under physiological conditions (Fig. 3A). ROS are able to pass the cell
membrane and oxidize external macromolecules, as demonstrated by the cytochrome c assay (Fig.
3B). The degranulation reaction occurs after the oxidative burst and ROS generation, leading to
release of serine- and zinc-proteases. The results shown in Fig. 2B (a me pare sia figura 2 e non 3)
unequivocally show that the proteolytic processing of VWF by LSPs not only is not inhibited by the
presence of ROS but is even significantly accelerated by the action of ROS released by activated
PMNs.
Overall, the results herein reported, while further confirming and extending previous studies (8-
10), are unprecedented and demonstrate that oxidative modifications of a single amino acid in VWF
produce opposite effects on the interaction with the different enzymes (i.e., ADAMTS-13 and
LSPs) involved in its proteolytic processing. Notably, at variance with what recently described for
the effect of oxidation on VWF cleavage by ADAMTS-13 (9,10), the formation of MetSO at
position 1606 of the A2 domain does even favor the proteolysis of the Tyr1605-Met1606 peptide
5.von Willebrand Factor
153
bond by leukocyte LSPs, especially CG, thus supporting the hypothesis that the proteolytic
processing of VWF in vivo does not rely on ADAMTS-13 proteolysis alone, but arises also from the
activity of various serine proteases secreted by activated leukocytes (8).
Based on these findings, the question arises as to whether the positive and negative effect of
ROS on VWF cleavage by PMN serine proteases and ADAMTS-13, respectively, was caused by a
change in the physical-chemical properties of the sensitive amino acids (e.g., side-chain volume,
polarizability, and hydrophobicity of Met, Tyr, or Trp residues) that might directly be engaged in
the protease binding sites, thus favoring/disfavoring proteolysis, or oxidation affected proteolytic
efficiency indirectly by inducing a global conformational alteration of VWF multimers.
The comparative analysis of UV-absorption, fluorescence and CD spectra of native and
oxidized VWF (Fig. 5 A,B,C) displayed significant differences, suggesting some perturbation in the
secondary/tertiary structure of VWF upon HClO-mediated oxidation, with a partial unfolding of
VWF-Ox, which therefore would become more susceptible to proteolysis (41). However, the results
of DLS (Fig. 5D) and guanidinium-induced denaturation (Fig. S1) measurements indicate that upon
oxidation VWF does not undergo any gross distortion of the tertiary conformation nor
polymerization state, and agree with the results obtained with VWF74 and VWF74-MetSO, which
are largely unfolded (10) thus excluding any conformational effect of Met oxidation. Hence, we
conclude that the observed differences in the proteolysis of VWF are predominantly due to the
different chemical/structural properties of MetSO compared with those of unmodified Met at the
cleavable bond. However, more discrete local conformational changes in the A2 domain, possibly
undetected by the spectroscopic techniques used in this study, cannot be ruled out.
In the case of ADAMTS-13, our recent model building and docking studies suggest that
replacing an apolar amino acid like Met with a highly polar residue like MetSO strongly hampers
productive binding of the cleavable Tyr-Met bond to the hydrophobic S1′ site of the protease (10,
42). Opposite, albeit conceptually similar, considerations hold for explaining the effect of Met
oxidation on substrate hydrolysis by LSPs. LSPs are extremely basic enzymes, with pI values
ranging from 9.5 of PR3 to 12 of CG. (5). Furthermore, the crystallographic structure of CG
(1kyn.pdb) is characterized by the presence of a strong positive electrostatic potential in the region
surrounding the S1′ site, thus favouring binding of negatively charged substrates at P1'. These
structural features are consistent with the enhanced catalytic efficency of CG for VWF74-MetSO
(Table 2). At variance, the S1′ site of PR3 (1fuj.pdb) (43, 44) and especially of HLE (2rg3.pdb) (45)
is less electropositive than that of CG and is principally formed by apolar/neutral amino acids.
Accordingly, Met oxidation does not appreciably affect proteolysis by PR3 or HLE (Table 2).
5.von Willebrand Factor
154
May these findings have patho-physiological implications? Any activation of PMNs in
inflammatory, infectious or onco-hematological settings may influence the properties and functions
of VWF. Under physiological conditions, a discrete and “tonic” activation of leukocytes may
contribute to proteolytic processing of circulating VWF, because HLE, PR3 and CG are able to
cleave VWF with a catalytic specificity similar or even higher than that of ADAMTS-13. Notably,
De Meyer et al have recently detected satellite bands in plasma from TTP-patients and
ADAMTS13-/- mice by using VWF multimer analysis (46). As these bands are commonly
interpreted as cleavage products, it is reasonable to assume that they are generated in the above
settings by LSPs. Moreover, massive and uncontrolled release of LSPs and ROS in promyelocytic
leukemia causes extensive proteolytic degradation of VWF resulting in a severe hemorrhagic setting
(47) . Finally, it is known that VWF multimers play also extra-haemostatic functions. In particular,
it is engaged by bacterial pathogens to adhere to vascular vessel and transmigrate into tissues.
Staphylococcal aureus protein A (Spa) binds with high affinity to soluble and immobilized VWF
and has been identified as a novel staphylococcal adhesin, especially for the high molecular weight
VWF multimers (16). The process of bacterial adhesion causes migration and activation of PMNs
that secrete enzymes and ROS to eliminate the pathogens. Thus, the LSPs-mediated VWF
proteolysis may be considered a mechanism aimed at limiting the VWF-mediated adhesion and
invasion of such common bacteria in a highly oxidant milieu, where ADAMTS-13 could not
efficiently proteolyze VWF. Our results are compatible with the existence of two different pathways
of coupled oxidative/proteolytic reactions: 1) chronic oxidative stress by peroxynitrite, mainly
arising from endothelial cells in chronic inflammatory settings, diabetes and in ageing (48), reduces
cleavage by ADAMTS-13, with a resulting pro-thrombotic effect (9,10); 2) a rapid and
simultaneous release of ROS and serine proteases from activated leukocytes attracted by bacterial
pathogens results in a positive effect on VWF proteolysis, under conditions where high
concentrations of ROS could impede the activity of ADAMTS-13. The latter effect might assist the
anti-bacterial activity of PMNs, impeding an efficient VWF-mediated adhesion of bacterial
pathogens to vascular wall and their tissue invasion (16). Finally, further studies are needed at
assessing whether or not perturbations of the proteolytic processing of VWF by LSPs could be also
involved in the pathogenesis of “atypical” thrombotic microangiopathies presenting with normal
ADAMTS-13 levels (49).
5.von Willebrand Factor
155
REFERENCES
1. Nathan C (2006) Neutrophils and immunity: challenges and opportunities. Nat Rev Immunol.
6:173-182.
2. Sheppard FR, Kelher MR, Moore EE, McLaughlin NJ, Banerjee A, Silliman CC (2005)
Structural organization of the neutrophil NADPH oxidase: phosphorylation and translocation
during priming and activation. J Leukoc Biol. 78:1025-1042.
3. Dahlgren C, Karlsson A (1999) Respiratory burst in human neutrophils. J Immunol Methods.
232:3-14.
4. Pham CT (2006) Neutrophil serine proteases: specific regulators of inflammation. Nat Rev
Immunol. 6:541-550.
5. Korkmaz B, Moreau T, Gauthier F (2008) Neutrophil elastase, proteinase 3 and cathepsin G:
physicochemical properties, activity and physiopathological functions. Biochimie. 90:227-242.
6. Piccardoni P, Sideri R, Manarini S, Piccoli A, Martelli N, De Gaetano G, Cerletti C, Evangelista
V (2001) Platelet/polymorphonuclear leukocyte adhesion: a new role for SRC kinases in Mac-1
adhesive function triggered by P-selectin. Blood. 98:108-116.
7. Zarbock A, Polanowska-Grabowska RK, Ley K (2007) Platelet-neutrophil-interactions: linking
hemostasis and inflammation. Blood Rev. 21:99-111.
8. Raife TJ, Cao W, Atkinson BS, Bedell B, Montgomery RR, Lentz SR, Johnson GF, Zheng XL
(2009) Leukocyte proteases cleave von Willebrand factor at or near the ADAMTS13 cleavage
site. Blood. 114:1666-1674.
9. Chen J, Fu X, Wang Y, Ling M, Mc Mullen B, Kulman J, Chung DW, Lopez JA (2010)
Oxidative modification of von Willebrand factor by neutrophil oxidants inhibits its cleavage by
ADAMTS13. Blood. 115:706-712.
10. Lancellotti S, De Filippis V, Pozzi N, Peyvandi F, Palla R, Rocca B, Rutella S, Pitocco D,
Mannuci PM, De Cristofro R (2010) Formation of methionine sulfoxide by peroxynitrite at
position 1606 of von Willebrand factor inhibits its cleavage by ADAMTS-13: A new
prothrombotic mechanism in diseases associated with oxidative stress. Free Radic Biol Med.
48:446-456.
11. Patti JM, Allen BL, McGavin MJ, Hook M (1994) MSCRAMM-mediated adherence of
microorganisms to host tissues. Annu Rev Microbiol. 48:585-617.
12. George NP, Wei Q, Shin PK, Konstantopoulos K, Ross JM (2006) Staphylococcus aureus
adhesion via Spa, ClfA, and SdrCDE to immobilized platelets demonstrates shear-dependent
behavior. Arterioscler Thromb Vasc Biol. 26:2394-2400.
5.von Willebrand Factor
156
13. Moreillon P, Entenza JM, Francioli P, McDevitt D, Foster TJ, François P, Vandaux P (1995)
Role of Staphylococcus aureus coagulase and clumping factor in pathogenesis of experimental
endocarditis. Infect Immun. 63:4738-4743.
14. Heilmann C, Herrmann M, Kehrel BE, Peters G (2002) Platelet-binding domains in 2
fibrinogen-binding proteins of Staphylococcus aureus identified by phage display. J Infect Dis.
186:32-39.
15. Hartford OM, Wann ER, Hook M, Foster TJ (2001) Identification of residues in the
Staphylococcus aureus fibrinogen-binding MSCRAMM clumping factor A (ClfA) that are
important for ligand binding. J Biol Chem. 276:2466-2473.
16. Hartleib J, Kohler N, Dickinson RB, Chhatwal GS, Sixma JJ, Hartford OM, Foster TJ, Peters G,
Kehrel BE, Herrmann M (2000) Protein A is the von Willebrand factor binding protein on
Staphylococcus aureus. Blood. 96:2149-2156.
17. Petri B, Broermann A, Li H, Khandoga AG, Zarbock A, Krombach F, Goerge T, Schneider SW,
Jones C, Nieswandt B, Wild MK, Vestweber D (2010) Von Willebrand factor promotes
leukocyte extravasation. Blood. 116:4712-471.
18. De Cristofaro R, Peyvandi F, Palla R, Lavoretano S, Lombardi R, Merati G, Romitelli F, Di
Stasio E, Mannucci PM (2005) Role of chloride ions in modulation of the interaction between
von Willebrand factor and ADAMTS-13. J Biol Chem. 280:23295-23302.
19. De Cristofaro R, Landolfi R (2000) Oxidation of human alpha-thrombin by the
myeloperoxidase-H2O2-chloride system: structural and functional effects. Thromb Haemost.
83:253-261.
20. Bhattacharjee S, Pennathur S, Byun J, Crowley J, Mueller D, Gischler J, Hotchkiss RS,
Heinecke JW. (2001) NADPH oxidase of neutrophils elevates o,o'-dityrosine cross-links in
proteins and urine during inflammation. Arch Biochem Biophys. 395:69-77.
21. Nelson DP, Kiesow LA (1972) Enthalpy of decomposition of hydrogen peroxide by catalase at
25 degrees C (with molar extinction coefficients of H2O2 solutions in the UV). Anal Biochem.
49:474-478.
22. Savige WE, Fontana A (1980) Oxidation of tryptophan to oxindolylalanine by dimethyl
sulfoxide-hydrochloric acid. Selective modification of tryptophan containing peptides. Int J
Pept Protein Res. 15:285-297.
23. Klock JC, Bainton DF (1976) Degranulation and abnormal bactericidal function of granulocytes
procured by reversible adhesion to nylon wool. Blood. 48:149-161.
24. Kessels GC, Krause KH, Verhoeven AJ (1993) Protein kinase C activity is not involved in N-
formylmethionyl-leucyl-phenylalanine-induced phospholipase D activation in human
5.von Willebrand Factor
157
neutrophils, but is essential for concomitant NADPH oxidase activation: studies with a
staurosporine analogue with improved selectivity for protein kinase C. Biochem J. 292(Pt
3):781-785.
25. Van GB, Slater EC (1962) The extinction coefficient of cytochrome c. Biochim Biophys Acta.
58:593-595.
26. Robinson J (1997) Oxidative metabolism. Vol. In Current Protocols in Flow Cytometry. New
York: John Wiley & Sons, Inc.
27. Pace CN, Vajdos F, Fee L, Grimsley G, Gray T (1995) How to measure and predict the molar
absorption coefficient of a protein. Protein Sci. 4:2411-2423.
28. Yan LJ (2009) Analysis of oxidative modification of proteins. Curr Protoc Protein Sci. Chapter
14:Unit 14
29. Di Stasio E, Bizzarri P, Misiti F, Pavoni E, Brancaccio A (2004) A fast and accurate procedure
to collect and analyze unfolding fluorescence signal: the case of dystroglycan domains. Biophys
Chem. 107:197-211.
30. Di Stasio E, Romitelli F, Lancellotti S, Arcovito A, Giardina B, De Cristofaro R. (2009) Kinetic
study of von Willebrand factor self-aggregation induced by ristocetin. Biophys Chem. 144:101-
107.
31. Shao B, Belaaouaj A, Verlinde CL, Fu X, Heinecke JW (2005) Methionine sulfoxide and
proteolytic cleavage contribute to the inactivation of cathepsin G by hypochlorous acid: an
oxidative mechanism for regulation of serine proteinases by myeloperoxidase. J Biol Chem.
280:29311-29321.
32. Hawkins CL, Davies MJ (1998) Hypochlorite-induced damage to proteins: formation of
nitrogen-centred radicals from lysine residues and their role in protein fragmentation. Biochem
J. 332 (Pt 3):617-625.
33. Brahms S, Brahms J (1980) Determination of protein secondary structure in solution by vacuum
ultraviolet circular dichroism. J Mol Biol. 138:149-178.
34. De Filippis V, De Dea E, Lucatello F, Frasson R (2005) Effect of Na+ binding on the
conformation, stability and molecular recognition properties of thrombin. Biochem J. 390:485-
492.
35. Pozzi N, Banzato A, Bettin S, Bison E, Pengo V, De Filippis V (2010) Chemical synthesis and
characterization of wild-type and biotinylated N-terminal domain 1-64 of beta2-glycoprotein I.
Protein Sci. 19:1065-1078.
36. Chung DW, Fujikawa K (2002) Processing of von Willebrand factor by ADAMTS-13.
Biochemistry. 41:11065-11070.
5.von Willebrand Factor
158
37. Klebanoff SJ (2005) Myeloperoxidase: friend and foe. J Leukoc Biol. 77:598-625.
38. Cheung EY, Uitte de Willige S, Vos HL, Leebeek FW, Dippel DW, Bertina RM, de Maat MP
(2008) Fibrinogen gamma' in ischemic stroke: a case-control study. Stroke. 39:1033-1035.
39. Carreras MC, Pargament GA, Catz SD, Poderoso JJ, Boveris A (1994) Kinetics of nitric oxide
and hydrogen peroxide production and formation of peroxynitrite during the respiratory burst of
human neutrophils. FEBS Lett. 341:65-68.
40. Winterbourn CC (1981) Hydroxyl radical production in body fluids. Roles of metal ions,
ascorbate and superoxide. Biochem J. 198:125-131.
41. Fontana A, Polverino de Laureto P, De Filippis V, Scaramella E, Zambonin M (1997) Probing
the partly folded states of proteins by limited proteolysis. Fold Des. 2:R17-26.
42. Pozzi N, De Cristofaro R, Lancellotti S, De Filippis V (2010) Resistance of peroxynitrite-
oxidized von Willebrand factor to proteolysis by ADAMTS-13: a novel pro-thrombotic
mechanism elucidated by targeted mass spectrometry and molecular modeling. Biochem J.
Submitted for pubblication.
43. Greco MN, Hawkins MJ, Powell ET, Almond HR Jr, Corcoran TW, de Garavilla L, Kauffman
JA, Recacha R, Chattopadhyay D, Andrade-Gordon P, Maryanoff BE (2002) Nonpeptide
inhibitors of cathepsin G: optimization of a novel beta-ketophosphonic acid lead by structure-
based drug design. J Am Chem Soc. 124:3810-3811.
44. Fujinaga M, Chernaia MM, Halenbeck R, Koths K, James MN (1996) The crystal structure of
PR3, a neutrophil serine proteinase antigen of Wegener's granulomatosis antibodies. J Mol Biol.
261:267-278.
45. Huang W, Yamamoto Y, Li Y, Dou D, Alliston KR, Hanzlik RP, Williams TD, Groutas WC
(2008) X-ray snapshot of the mechanism of inactivation of human neutrophil elastase by 1,2,5-
thiadiazolidin-3-one 1,1-dioxide derivatives. J Med Chem. 51:2003-2008.
46. De Meyer S.F., Budde U., Deckmyn HKV (2009) In vivo absence of ADAMTS13 does not
abrogate VWF size heterogeneity. Journal of Thrombosis and Haemostasis. 7:PP-TH-091, 964.
47. Federici AB, Berkowitz SD, Lattuada A, Mannucci PM (1993) Degradation of von Willebrand
factor in patients with acquired clinical conditions in which there is heightened proteolysis.
Blood. 81:720-725.
48. van der Loo B, Labugger R, Skepper JN, Bachschmid M, Kilo J, Powell JM, Palacios-Callender
M, Erusalimsky JD, Quaschning T, Malinski T, Gygi D, Ullrich V, Lüscher TF (2000)
Enhanced peroxynitrite formation is associated with vascular aging. J Exp Med. 192:1731-1744.

5.von Willebrand Factor
159
49. Vesely SK, George JN, Lammle B, Studt JD, Alberio L, El-Harake MA, Raskob GE (2003)
ADAMTS13 activity in thrombotic thrombocytopenic purpura-hemolytic uremic syndrome:
relation to presenting features and clinical outcomes in a prospective cohort of 142 patients.
Blood. 102:60-68.


APPENDICES

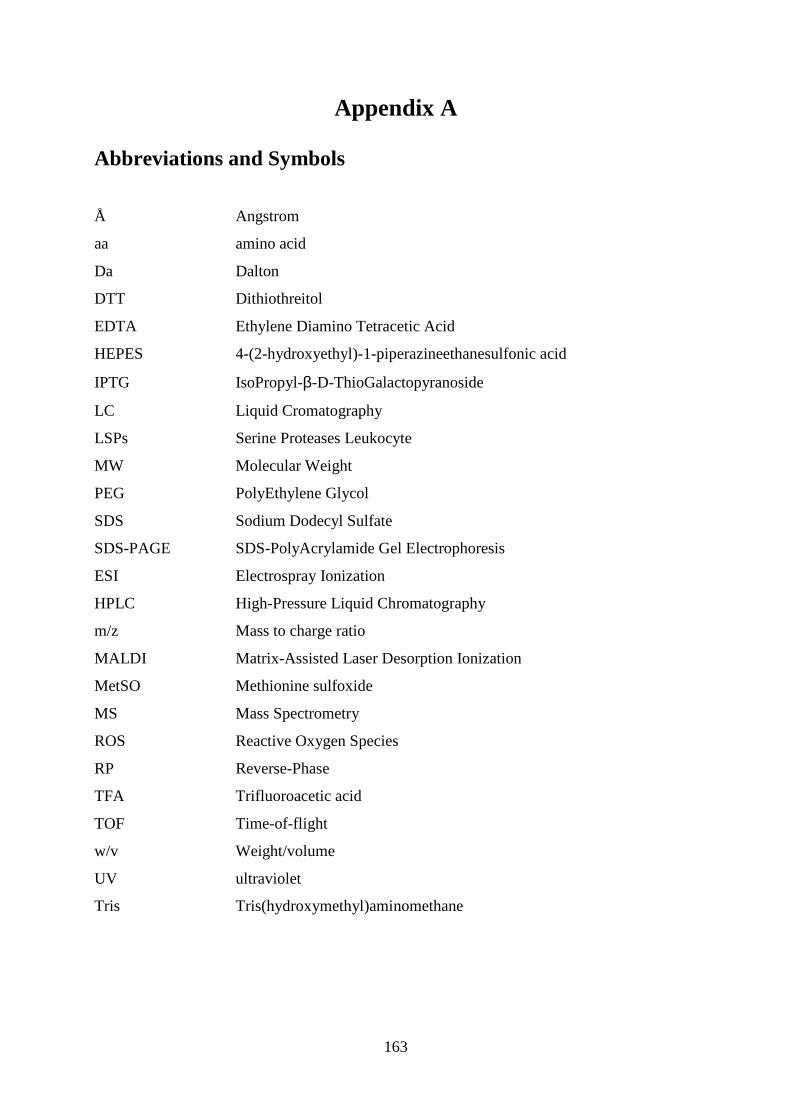
163
Appendix A Abbreviations and Symbols
Å Angstrom
aa amino acid
Da Dalton
DTT Dithiothreitol
EDTA Ethylene Diamino Tetracetic Acid
HEPES 4-(2-hydroxyethyl)-1-piperazineethanesulfonic acid
IPTG IsoPropyl-β-D-ThioGalactopyranoside
LC Liquid Cromatography
LSPs Serine Proteases Leukocyte
MW Molecular Weight
PEG PolyEthylene Glycol
SDS Sodium Dodecyl Sulfate
SDS-PAGE SDS-PolyAcrylamide Gel Electrophoresis
ESI Electrospray Ionization
HPLC High-Pressure Liquid Chromatography
m/z Mass to charge ratio
MALDI Matrix-Assisted Laser Desorption Ionization
MetSO Methionine sulfoxide
MS Mass Spectrometry
ROS Reactive Oxygen Species
RP Reverse-Phase
TFA Trifluoroacetic acid
TOF Time-of-flight
w/v Weight/volume
UV ultraviolet
Tris Tris(hydroxymethyl)aminomethane
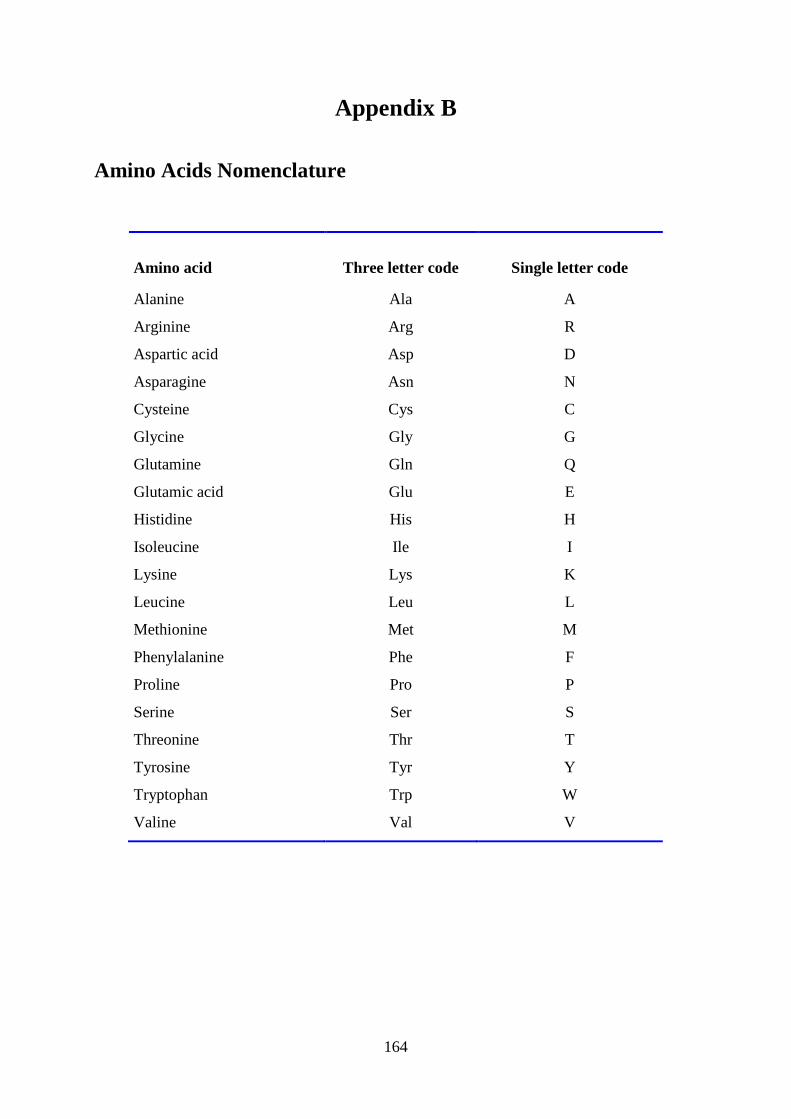
164
Appendix B
Amino Acids Nomenclature
Amino acid Three letter code Single letter code
Alanine Ala A
Arginine Arg R
Aspartic acid Asp D
Asparagine Asn N
Cysteine Cys C
Glycine Gly G
Glutamine Gln Q
Glutamic acid Glu E
Histidine His H
Isoleucine Ile I
Lysine Lys K
Leucine Leu L
Methionine Met M
Phenylalanine Phe F
Proline Pro P
Serine Ser S
Threonine Thr T
Tyrosine Tyr Y
Tryptophan Trp W
Valine Val V