
Universitá di Pisa Dipartimento Di Ingegneria Meccanica ... · the cladding surface is lost and...
116
Universitá di Pisa Dipartimento Di Ingegneria Meccanica, Nucleare e Della Produzione Scuola di Dottorato in Ingegneria “Leonardo Da Vinci” Corso di Dottorato di Ricerca in SICUREZZA NUCLEARE E INDUSTRIALE Tesi di Dottorato di Ricerca The Development of a Three Field Two Phase Rewetting Numerical Model for a Boiling Water Reactor Lander Ibarra Copyright Anno 2015
Transcript of Universitá di Pisa Dipartimento Di Ingegneria Meccanica ... · the cladding surface is lost and...

Universitá di Pisa
Dipartimento Di Ingegneria Meccanica,
Nucleare e Della Produzione
Scuola di Dottorato in Ingegneria “Leonardo Da Vinci”
Corso di Dottorato di Ricerca in SICUREZZA NUCLEARE E INDUSTRIALE
Tesi di Dottorato di Ricerca
The Development of a Three Field Two Phase Rewetting Numerical Model for a Boiling Water Reactor
Lander Ibarra
Copyright Anno 2015

ii
The Development of a Three Field Two Phase Rewetting Numerical Model for a Boiling Water Reactor
Allievo: Relatori:
Lander Ibarra Prof. Ing. Francesco D’Auria
Dr. Ing. Giorgio Galassi
Dr. Ing. Alessandro Petruzzi
Dr. Ing. Juswald Vedovi
Dr. Ing. Jens Andersen
Dr. Ing. Jeffrey Rambo
Date Approved:

i
TABLE OF CONTENTS
Page
1. Introduction ..................................................................................................................................... 1-1 1.1 LOCA Overview in Light Water Reactors ................................................................................ 1-2 1.2 ATWS-Instability Overview in Light Water Reactors .............................................................. 1-6 1.3 Rewetting & Quenching Overview as a Multiphase Framework ............................................ 1-11 1.4 Quenching Numerical Models and Correlations – An Overview ............................................ 1-16
1.4.1 Quenching Models............................................................................................................ 1-16 1.4.2 Re-Nodalization Schemes ................................................................................................ 1-17
1.5 Outline and Objectives of the Current Research Work ........................................................... 1-19 2. Flow Regimes and Heat Transfer During a Reflood Transient ....................................................... 2-1
2.1 Flow Regimes Definitions Relevant to Quenching ................................................................... 2-1 2.1.1 Bubbly-Churn Flow ............................................................................................................ 2-3 2.1.2 Annular Flow ...................................................................................................................... 2-4 2.1.3 Transition Flow .................................................................................................................. 2-4
2.2 Heat Transfer Regimes Definitions Relevant to Quenching ..................................................... 2-4 2.2.1 Boiling Curve ..................................................................................................................... 2-5 2.2.2 Wall Temperatures: TCHF, Leidenfrost Temperature and Tmin .......................................... 2-7 2.2.3 Nucleate Boiling ................................................................................................................. 2-9 2.2.4 Transition Boiling ............................................................................................................. 2-10 2.2.5 Film Boiling ..................................................................................................................... 2-10
2.3 Motivation for the Present Research ....................................................................................... 2-11 3. Methodology.................................................................................................................................... 3-1
3.1 COBRAG Code Description ..................................................................................................... 3-1 3.1.1 Conservation Equations for the COBRAG Three-Field Model ......................................... 3-2 3.1.2 Heat Conduction Model ..................................................................................................... 3-3 3.1.3 COBRAG Discretization .................................................................................................... 3-4 3.1.4 Solution Scheme ................................................................................................................. 3-5
3.2 Proposed COBRA2CON Numerics and Solver Modifications ................................................. 3-6 3.2.1 Proposed 2DCON Conduction-Controlled Model ............................................................. 3-7 3.2.2 Proposed Heat Transfer Models ....................................................................................... 3-13 3.2.3 Film/Droplet Flow Split ................................................................................................... 3-15 3.2.4 Water Packing .................................................................................................................. 3-18
3.3 Summary ................................................................................................................................. 3-19 4. Benchmark Description and Analysis ............................................................................................. 4-1
4.1 Quenching Experiment Overview ............................................................................................. 4-1 4.2 2-D Conduction Controlled Calculation Confirmation ............................................................. 4-2 4.3 Halden Test Facility .................................................................................................................. 4-5
4.3.1 Test Facility Description .................................................................................................... 4-5 4.3.2 COBRAG/COBRA2CON Model ....................................................................................... 4-8
4.4 Rod Bundle Heat Transfer (RBHT) Test Facility.................................................................... 4-11 4.4.1 Test Facility Description .................................................................................................. 4-11 4.4.2 COBRAG/COBRA2CON Model ..................................................................................... 4-12

ii
4.5 Quenching Experiment Summary ............................................................................................. 4-0 5. Benchmark Results and Sensitivities ............................................................................................... 5-7
5.1 Halden Benchmark .................................................................................................................... 5-7 5.1.1 Test 12 Results ................................................................................................................... 5-7 5.1.2 Summary and Conclusions ............................................................................................... 5-12
5.2 RBHT Benchmark and Sensitivities Runs ............................................................................... 5-13 5.2.1 Pressure and Mass Flux Sensitivity Calculations ............................................................. 5-13 5.2.2 System Pressure Sensitivity Results ................................................................................. 5-16 5.2.3 Time Step Sensitivity Results ........................................................................................... 5-27 5.2.4 Summary and Conclusions ............................................................................................... 5-29
5.3 Verification and Benchmark Summary ................................................................................... 5-30 6. Conclusions ..................................................................................................................................... 6-1
6.1 Summary & Conclusions of the Research ................................................................................. 6-1 6.2 Recommendations for Future Work .......................................................................................... 6-3
7. References .......................................................................................................................................... 1

iii
LIST OF TABLES
Table Title Page
Table 3-1 Wall Heat Transfer Selection Logic ........................................................................................ 3-13
Table 4-1 Benchmark Table for the Testing of COBRA2CON ................................................................. 4-1
Table 4-2 RBHT Test 1383 Experimental Conditions .................................................................. 4-15
Table 5-1 Sensitivity Analyses with Modified RBHT Test 1383 Values for Pressure and Mass Flux ....................................................................................................................... 5-14
Table 5-2 Modified RBHT Test 1383 Pressure Sensitivity Analyses ............................................ 5-15

iv
LIST OF FIGURES
Figure Title Page
Figure 1-1 Representative BWR/2 Water Inventory during Normal Operation ................................ 1-3
Figure 1-2 Representative BWR/2 Water Inventory, Fuel Temperatures and Velocities during Initial Blowdown .................................................................................................. 1-4
Figure 1-3 Representative BWR/2 Water Inventory, Fuel Temperatures and Velocities 660 s after Core Spray Initiation. .............................................................................................. 1-6
Figure 1-4 Liquid and Vapor Flow Rate for a Representative BWR/4 during ATWS-I - TTWBP. ........................................................................................................................... 1-8
Figure 1-5 Heat Transfer and Rod Temperature for a Representative BWR/4 during ATWS-I - TTWBP.......................................................................................................................... 1-9
Figure 1-6 Liquid and Vapor Flow Rate for a Representative BWR/4 during ATWS-I (TTWBP) – Delayed Operator Action ........................................................................... 1-10
Figure 1-7 Heat Transfer and Rod Temperature for a Representative BWR/4 during ATWS-I (TTWBP) – Delayed Operator Action. .......................................................................... 1-11
Figure 1-8 Low and High Flooding Rate Heat Transfer Regimes [12] ........................................... 1-13
Figure 1-9 Hydraulic Conditions in a Fuel Channel during Spray Cooling [14]............................. 1-15
Figure 1-10 an example of the fine mesh-rezoning process. [2] ....................................................... 1-18
Figure 1-11 an example of the T-H moving fine grid nodalization [40] ........................................... 1-19
Figure 2-1 Flow Regime Map for Vertical Upward Two-Phase Flow [31] ...................................... 2-2
Figure 2-2 Flow Patterns in Vertical Co-Current Flow [31] ............................................................. 2-3
Figure 2-3 Low and High Flooding Rate Heat Transfer Regimes [31] ............................................. 2-5
Figure 2-4 Typical Boiling Curve for Water at 1 Atm. ..................................................................... 2-6
Figure 2-5 Schematic of the Surface Temperatures during Reflood. ................................................ 2-9
Figure 3-1 Schematic of the Staggered Grid Variables ..................................................................... 3-4
Figure 3-2 Three Field Heat Transfer between Fields ....................................................................... 3-9
Figure 3-3 Re-Nodalization Scheme ............................................................................................... 3-12
Figure 3-4 Film Fraction Correlation vs. Total Reynolds Number [38] .......................................... 3-17
Figure 3-5 Film Split Schematic ...................................................................................................... 3-18
Figure 4-1 Conduction-controlled axial and radial nodalization ....................................................... 4-2
Figure 4-2 Conduction-Controlled Axial temperature distribution comparison with [9] .................. 4-3
Figure 4-3 Conduction-Controlled axial and radial Temperature Distribution ................................. 4-4
Figure 4-4 Instrumentation Location and a Typical Axial Thermal Flux Distribution ..................... 4-5
Figure 4-5 Fresh and Irradiated Fuels for Dryout Tests .................................................................... 4-6
Figure 4-6 Schematic of the Dryout Sequence .................................................................................. 4-7
Figure 4-7 Test Results for Experiment 12 (FastScan 5093) ............................................................. 4-8
Figure 4-8 1x1 Rod Lattice COBRAG/COBRA2CON Geometry .................................................... 4-9
Figure 4-9 Channel B: Tests 12: Model Nodalization ..................................................................... 4-10
Figure 4-10 RBHT Rod Bundle Cross Section View [56] ................................................................ 4-12
Figure 4-11 7x7 Rod Lattice COBRAG/COBRA2CON Geometry .................................................. 4-14
Figure 4-12 Axial and Radial COBRAG/COBRA2CON Nodalization ............................................ 4-16

v
Figure 4-13 Axial Power Profile of the Heater Rod recreated based on [56]. ................................... 4-17
Figure 5-1 Comparison of the PCT between COBRAG, COBRA2CON and the Halden Thermocouple Data .......................................................................................................... 5-8
Figure 5-2 Comparison of the PCT and Tmin values between COBRAG and COBRA2CON ...... 5-10
Figure 5-3 Comparison of the Three Field (Droplet and Film Data) for COBRA2CON ................ 5-11
Figure 5-4 Comparison of the Void Distribution and Surface Temperature for Subchannel 28 as a Function of Time – 7MPa ....................................................................................... 5-18
Figure 5-5 Comparison of the Axial Field Distributions for Subchannel 28 around the Time of Quench ....................................................................................................................... 5-19
Figure 5-6 Comparison of the Axial Distribution of the Heat Transfer and PCT for Sub-Channel 28 around the Time of Quench ........................................................................ 5-19
Figure 5-7 Comparison of the Void Distribution and Surface Temperature for Subchannel 28 as a Function of Time – 1MPa ....................................................................................... 5-22
Figure 5-8 Comparison of the Field Distribution for Subchannel 28 at Cell 15 as a Function of Time – 1MPa ............................................................................................................. 5-23
Figure 5-9 Comparison of the Axial Distribution of the Heat Transfer and PCT for Sub-Channel 28 at 20 seconds ............................................................................................... 5-23
Figure 5-10 Comparison of the Axial Distribution of the Heat Transfer and PCT for Sub-Channel 28 at 25 seconds ............................................................................................... 5-24
Figure 5-11 Comparison of the Axial Position of Rewetted Cells between COBRAG and COBRA2CON ............................................................................................................... 5-26
Figure 5-12 Comparison of the Axial Quench Front position between RBHT Test 1383 and COBRA2CON ............................................................................................................... 5-26
Figure 5-13 Comparison of the Time Dependent Field Fraction Distribution at Node 15 for two different Time Steps. ............................................................................................... 5-28
Figure 5-14 Comparison of the Time Dependent Temperature Distribution at Node 15 for two different Time Steps. ...................................................................................................... 5-29

vi
ABSTRACT
During normal operation in a Boiling Water Reactor (BWR), a constant contact between a liquid film and the fuel rod surface is maintained thus guaranteeing efficient cooling of the cladding surface. During a Loss-Of-Coolant Accident (LOCA) or an Anticipated Transient Without Scram-Instability (ATWS-I), the established liquid film on the fuel rods can be vaporized due to coolant inventory loss. This inventory loss can be local (ATWS-I) or at a larger scale (LOCA). When the film is vaporized, optimal heat transfer at the cladding surface is lost and fuel bundles begin heating-up rapidly. To avoid high surface temperatures that could compromise the integrity of the cladding, the film of the coolant needs to be re-established on the surface. This phenomenon is called rewetting and its modeling is very important for determining the thermal behavior of the cladding. In order to predict the cladding temperature behavior and the rewetting of the fuel rods, Nuclear Safety Analysis (NSA) calculations need to be performed.
Traditionally, for Appendix K compliant methods [14], LOCA transients have used conservative thermal-hydraulic models. The simplified computer models and often excessive conservatism of these analytical methods do not allow to fully capture the details of the physical phenomena during a LOCA transient. In addition to unrealistic modeling, this conservatism leads to unnecessary large thermal margins that may impact plant economics and operation. While ATWS-I is a beyond design basis event and best-estimate conditions can be used for its analysis, both LOCA and ATWS-I rely on the numerical prediction of the rewetting. Therefore, accurately predicting flow regimes and heat transfer regimes is critical to the safety analysis of nuclear reactors and rewetting in particular. The predictions of the rewetting phenomenon requires a variety of constitutive relationships to describe the mass, momentum, and energy exchange that occurs between the flow fields (steam, droplets and liquid film) and provide closure to the set of momentum equations. Rewetting is characterized as a localized physical phenomenon where sharp temperature, void fraction and mass flux gradients are observed within a small distance. Often, these characteristics are not well represented by Appendix K compliant methods or overly conservative analyses in general.
The optimal utilization of modern high performance fuel designs in combination with the industrial application of best-estimate methodologies generated interest to depart from these conservative approaches. However, most thermal-hydraulic system codes used throughout the nuclear industry for accident analysis employ a one-dimensional two-field two-phase model that tracks single homogeneous liquid and vapor phases and relies on simplified models or correlations to predict the complex heat transfer and flow phenomena during quenching. Several best-estimate models used in NSA codes have a fine mesh option for the heat conduction solution (two-phase two-field codes such as TRACE [1], RELAP [2,3] and two-phase three-field subchannel codes such as COBRA [4 and 5]), but the very small mesh sizes required to characterize the temperature gradients at the quench fronts makes such method impractical for system calculations. Consequently, the multiscale characteristics of the quench front could be lost and important aspects of the physics of this phenomenon may not be captured. Improving the predictive capabilities of ECCS models is crucial for safety analysis since ECCS capacity may dictate core operating limits on local power production.
The originality of the present study lies in that it has examined the predictive capabilities of two-field and three-field transient analysis codes focusing on the rewetting region for BWR at LOCA and ATWS-I

vii
conditions. This analysis of the rewetting characteristics yielded the development of a quenching model that includes:
1) A dynamic axial re-nodalization scheme of the local quench front. A coupled T-H re-nodalization model with a fine moving mesh dynamically refining the Eulerian hydraulic mesh of an NSA computer code was developed to better model quenching heat transfer. This refinedEulerian hydraulic mesh is in turn coupled with a Lagrangian non-uniform nodalization in order to compute the temperature distribution within the fuel rod and calculate the heat transfer to the coolant. The Lagrangian-Eulerian coupling and dynamic re-nodalization logic for three-field solvers is a new approach that has been developed for this thesis.
2) The development of a heat transfer logic and the use of pr-established heat transfer correlations to properly calculate temperature gradients at locations where sharp thermal-hydraulic property changes are experienced,
3) The development of a 2D-Conduction Controlled model that solves the temperature distribution in the fuel rod and computes film front velocities, heat transfer from the rod surface to the fluid and couples these results to the considered NSA computer code original T/H solution.
The three-field GEH proprietary code COBRAG code was used for this work because of its capability to model steam, droplets and film which provides additional resolution in modeling the rewetting phenomenon. Its spatial resolution capabilities were increased with including the dynamic re-nodalization scheme and the implementation of the quenching model. In order to incorporate the models discussed previously, COBRAG was modified to include constitutive relations to compute the flow regimes and heat transfer, mass and energy distribution between fields at the rewetting front.. The models that are incorporated into the proposed three-field rewetting package are developed uniquely for the problem at hand.
The developed rewetting modeling package for COBRAG includes:
1) The implementation of a functional relationship modeling the liquid phase split between film and droplet based on comparisons to experimental data. This model was implemented in COBRAG to refine the liquid distribution between the liquid film and the droplets.
2) The improvements to the numerical method to mitigate water packing in numerical cells at locations of sharp interfacial property changes and low pressure applications.
The quenching model and the methods package developed during the research work provide a detailed spatial representation of the subchannel thermal-hydraulic properties for a single BWR bundle for ATWS-I and LOCA conditions. Given the importance of the physical phenomena at play in a BWR channel for safety analyses of various reactor accident scenarios and the interest to generate more precise and updated experimental data, this modeling methodology provides a starting ground in improving the predictive capabilities of three-field transient analysis codes until a more stable and viable approach is ascertained for both ATWS-I and LOCA applications. Benchmark results in the current study demonstrate that the development and inclusion of this newly proposed model for rewetting modeling along with the necessary COBRAG modifications is able to match experimental data for high pressure and high temperature quenching. The development of the 2D-Conduction Controlled quenching model and renodalization scheme along with the COBRAG modification results in an enhanced capability to model

viii
the rewetting phenomenon in a Lagrangian-Eulerian framework for two-phase flow and three fields numerical model.
The result of this thesis developed an advanced COBRAG code version with transient capabilities. It was demonstrated that this advanced COBRAG code reasonably models experimental results representative of BWR LOCA and ATWS-I analyses

ix
ACKNOWLEDGMENTS
First, I would like to thank my dissertation advisor and committee chair, Professor Francesco D’Auria. I sincerely appreciate him taking me under his wing for this doctorate work at Universitá di Pisa. I am thankful to have had the opportunity to study under him.
I am extremely grateful to Universitá di Pisa and in particular to Professor Walter Ambrosini. Prof. Ambrosini has been extremely understanding, patient and provided great help throughout the PhD program.
Next, I would like to thank my mentors at San Piero a Grado: Dr. Alessandro Petruzzi and Dr. Giorgio Galassi; as well as my industrial mentors, Dr. Juswald Vedovi, Dr. Jens Andersen and Dr. Jeff Rambo. I am forever grateful for their immeasurable time commitment, support, patience and guidance during the completion of this work. Dr. Jens Andersen’s and Dr. Jeff Rambo’s expertise in thermal hydraulic code development and analysis tools was invaluable throughout this process and the opportunity to work alongside them during the past several years has proved to be an invaluable experience. Lastly, I would like to express my gratitude to Dr. Juswald Vedovi for his guidance, nurturance, technical and life lessons which have broadly contributed to improving the personality and analytical approach of the author.
I would also like to acknowledge the contributions of the following individuals to this research: Belgacem Hizoum, whose COBRAG expertise and teachings have been invaluable for this project; Dr. Lev Klebanov and Charles Heck, for the numerous discussions, thermal-hydraulic teachings and the permanent questioning of my work, always proposing alternative routes when no clear path was in view. I am also grateful to the entire Thermal-Hydraulic Stability team for their constant support. Additionally I would like to thank Dr. Phil Sharpe, Jordan Hagaman and Justin Lamy for sharing their expertise, friendship and insights.
I must also give very special thanks to my family and in particular to my fiancée, Marybeth Ingle, as well as my parents, Emilio and Arantxa. Marybeth provided unlimited understanding, encouragement and an unshakable patience throughout this entire process. I would not have been able to complete this work without her support. My parents have also encouraged me throughout my life to follow my dreams. They have provided me with the foundation upon which I was able to build on to pursue my interests. I have them to thank for where I am today.
Among my friends, there are several who stand out for their support. Firstly, I must thank Andrea Bianco, who made the same frightening decision to do research while working full time. Our frequent conversations and sharing of our life experiences maintained the momentum of this fabulous experience. I also would like to show my appreciation to my friends Ghislain Retaureau, Arnaud Thabot and Min Yun who started a whole new life with me at Georgia Tech and have been a fantastic support ever since.

x
ACRONYMS AND ABBREVIATIONS
Nomenclature
Term Definition
ABWR Advanced Boiling Water Reactor
ACRS Advisory Committee on Reactor Safeguards
ARI Alternate Rod Insertion
ATWS-I Anticipated Transient Without Scram- instability
BWR Boiling Water Reactor
BWROG BWR Owners’ Group
CFL Courant–Friedrichs–Lewy
CFR Code of Federal Regulations
CHF Critical Heat Flux
COBRAG COolant Boiling in Rod Arrays – GNF
DBA Design Basis Accident
DEGB Double Ended Guillotine Break
DFFB Dispersed Flow Film Boiling
DNB Departure from Nucleate Boiling
DO Dryout
ECCS Emergency Core Cooling Systems
GDC General Design Criteria
GEH GE-Hitachi Nuclear Energy Americas, LLC
GNF Global Nuclear Fuel, LLC
IAFB Inverted Annular Film Boiling
LOCA Loss-Of-Coolant Accident
LOOP Loss Of Off-Site Power
LWR Light Water Reactor
NRC Nuclear Regulatory Commission
NSA Nuclear Safety Analysis
PCT Peak Cladding Temperature
PWR Pressurized Water Reactor
RBHT Rod Bundle Heat Transfer (Test Facility)
RPS Reactor Protection System

xi
Nomenclature
Term Definition
RPT Reactor Pump Trip
SLCS Standby Liquid Control System
SRP Standard Review Plan
TAF Top of Active Fuel
T-H Thermal-Hydraulic
TRACG Transient Reactor Analysis Code – GE
TTWBP Turbine Trip With ByPass
Greek Symbols
α Void Fraction
ρ Density
Subscripts
CHF Critical Heat Flux
g Gas, Steam
l Liquid
sat Saturation
v Vapor
w Wall or Fuel Rod Surface

1-1
1. INTRODUCTION
During normal operation in a Boiling Water Reactor (BWR), a constant contact between a liquid film and the fuel rod surface is maintained thus guaranteeing efficient cooling of the cladding surface. During a Loss-Of-Coolant Accident (LOCA) or an Anticipated Transient Without Scram-Instability (ATWS-I), the established liquid film on the fuel rods can be vaporized due to coolant inventory loss. This inventory loss can be local (ATWS-I) or extended (LOCA). When a film is vaporized, optimal heat transfer at the cladding surface is lost and fuel bundles begin heating-up rapidly. To avoid high surface temperatures that could compromise the integrity of the cladding, the film of coolant needs to be re-established on the surface. This phenomenon is called rewetting and its modeling is very important to determine the thermal behavior of the cladding. In order to predict the cladding temperature behavior and the rewetting of the fuel rods, NSA calculations are performed.
Accurately predicting flow regimes and heat transfer regimes during reflood or core spray cooling is important to several applications and most notably the safety analysis of nuclear reactors. Such analyses require an accurate prediction of the phenomena associated with the quenching of the fuel rods, including pressure gradients as well as the distribution of liquid and the interfacial rate of exchange between the film and dispersed droplet fields. To better understand the mechanisms of rewetting in the framework of LOCA and ATWS-I, both transients are discussed following. The overview of a LOCA in a BWR is given in Section 1.1. Section 1.2 contains the overview of an ATWS-Instability event. The description of the mechanisms of rewetting and quenching is provided in Section 1.3.
Several best-estimate codes used in NSA codes have a fine mesh option for the heat conduction solution (codes such as TRACE [1], RELAP [2, 3] and the subchannel code COBRA [4,5 and 6]), but the very small mesh sizes needed to characterize the temperature gradients at the quench fronts makes such method impractical for system calculations. Consequently, the multiscale characteristics of the quench front are typically lost and important aspects of the physics of this phenomenon are ignored. Improving the predictive capabilities of Emergency Core Cooling Systems (ECCS) models is crucial in the safety analysis since ECCS capacity may dictate core operating limits on local power production. Following, a review of representative quenching models to capture these phenomena is in Section 1.4. Finally, the objectives of the current research are outlined in Section 1.5.

1-2
1.1 LOCA OVERVIEW IN LIGHT WATER REACTORS
A LOCA is characterized by any event that can compromise the integrity of the primary coolant pressure
boundary resulting in a loss in the vessel coolant inventory that cannot be recovered within normal
operation. The primary coolant pressure boundary integrity is compromised in general by a break in any
of the piping attached to the vessel or unanticipated operation of safety valves [7]. The break could take
place in any attached piping (recirculation lines, feedwater lines, main steam lines, ECCS lines, etc.) and
may range in size from a small leak up to the double-ended guillotine break of the pipe in consideration.
In general, breaks occurring below top of active fuel (TAF) locations are more limiting than those located
above TAF provided there is adequate makeup inventory to reflood the core in a reasonable amount of
time. It is typically more difficult to reflood the vessel for the former than that of the latter for a same
break size.
Design basis accidents (DBA), i.e., double ended breaks (in general large breaks), are challenging for the
fuel integrity due to the rate of inventory loss, and hence earlier fuel heatup. For large breaks, it is often
only possible to reflood the core to the break elevation. On the other hand, smaller breaks may become
challenging due to the duration of heat up. This is especially true considering that, for small breaks, the
limiting single failure usually eliminates high pressure water makeup systems. Smaller breaks
depressurize much slower with respect to the larger breaks, and hence low pressure ECCS injection is
delayed accordingly. As mentioned previously, a break in the recirculation line presents the most severe
challenge to the reactor and ECCS and usually results in the higher peak cladding temperatures. This is
especially true for external loop plants (such as BWR/2) where coolant inventory recovery is challenged
by the location and the size of the break at or below the lower plenum. Recirculation line breaks of
varying sizes can result in the limiting peak cladding temperature (PCT) depending upon interrelated
initial conditions modeled such as assumed power distribution, power level, inventory loss rate,
depressurization rate, ADS initiation time, single failure consideration, ECCS injection time, and ECCS
Figure 1-1 provides a representative view of the initial water levels in the reactor prior to a LOCA.
The present study focuses solely on the DBA LOCA for a BWR reactor, i.e. double ended guillotine
break (DEGB) of a recirculation line. Therefore, the following description is only applicable for a
postulated double-ended rupture of one recirculation loop.
Immediately after the postulated double-ended recirculation line break, vessel pressure and core flow
depressurizes rapidly. For licensing LOCA calculations, a Loss Of Off-site Power (LOOP) is assumed
concurrently with the event. Both recirculation and feedwater pumps are assumed to trip at the event
initiation, thus causing rapid core flow decrease. The reactor is assumed to have scrammed and all control
rods inserted into the reactor core. However, even though fission power production has ceased, the
relatively slow radioactive decay of the fission products within the fuel pellets continues to generate heat.
In jet pump plants, the initial blowdown pressure response is governed by the closure of the turbine
control valves in response to the drop in steamline flow and the relative values of energy added to the
system by decay heat and energy removed from the system by the initial blowdown of fluid from the
downcomer. The initial core flow decrease is rapid because the recirculation pump in the broken loop

1-3
loses suction and ceases to pump almost immediately. The pump in the intact loop coasts down relatively
slowly. This pump coastdown governs the core flow response for the next several seconds. During the
period before the system pressure drops to the level at which the accumulator check valve opens and ECC
starts rushing into the system, the coolant flow in the core is determined by the competing effects of the
break flow and the pumps. Because of the increased rate of vessel pressure loss, the initially subcooled
water in the lower plenum saturates and flashes up through the core, increasing the core flow. This lower
plenum flashing continues at a reduced rate for the next several seconds.
For external recirculation loop plants (BWR/2), such as the plant type illustrated in Figure 1-1 to Figure
1-3, inventory loss through the break happens very rapidly. The coolant is lost until the break location is
uncovered. This inventory loss happens very quickly for the DEGB. After the initial depressurization and
inventory loss, the core remains uncovered for the totality of the LOCA transient.
Figure 1-1 Representative BWR/2 Water Inventory during Normal Operation
Heat transfer rates on the fuel cladding are governed primarily by the available inventory in the core to
cool down the fuel surface. Continued inventory loss through the break eventually causes fuel rods to
uncover. At this time, effective cooling of the core is lost and the core is subjected to a nearly adiabatic
heatup. The cladding temperature rapidly increases with the drop in heat transfer, driven by the stored
energy within the fuel. The initial part of the blowdown is illustrated in Figure 1-2 and shows the loss of
inventory throughout the vessel.
Bottom Peaked Bundle

1-4
At the end of the blowdown period, the vessel is essentially empty, with very little water remaining in the
lower plenum. The steam environment surrounding the rods does not provide sufficient heat transfer from
the cladding to remove heat being added from fission-product decay in the fuel pellets. At that time,
steam provides most of the cooling through convective heat transfer. Steam cooling however is not
sufficient to remove the totality of the decay heat. There is a potential for the heat generated to heat-up
fuel and cladding to temperatures such that fuel integrity would not be maintained if the heat is not
removed in a timely fashion.
The ECCS, initiated at the beginning of the event by low reactor water level trips, begin injecting after the
initiation of diesel generators and the pressure permissive is reached at the end of the blowdown. The
ECCS aim to remove the decay generated in the fuel by restoring the cladding temperature back to the
local saturation temperature by injecting subcooled coolant into the core. For jet-pump plants, there are
two avenues for this coolant to penetrate the fuel channel: reflooding from the bottom of the core or top-
down quenching. These two avenues can coexist during ECCS injection of a LOCA. Bottom reflood and
top-down quenching will be discussed following in that order. For an external recirculation loops BWR,
only top-down quenching is available since coolant inventory in the lower vessel plenum is depleted to
levels that do not allow reflood.
Figure 1-2 Representative BWR/2 Water Inventory, Fuel Temperatures and Velocities during Initial Blowdown
The reflood period begins when the lower plenum is filled and the inventory added reaches the bottom of
the reactor core. During the reflood phase the coolant rises up in the core and rewets the fuel rod surface,
Bottom Peaked Bundle

1-5
resulting in much improved heat transfer conditions. This process is characterized by very violent boiling
since by this time the fuel rod surface temperature is highly superheated. Initially, the coolant cannot
maintain contact with the fuel rod surface. Instead, most of the coolant simply flows past the hot surface
separated from it by a thin vapor film. Vapor cooling is one of the main heat transfer mechanisms that
occur at the cladding surface. Eventually, however, the bottom of the fuel rods are cooled enough to be
quenched and coolant-rod surface contact is re-established.
This contact begins at the bottom of the rod where the coolant is injected and begins to propagate up the
rod. As more coolant is added, the rod cooling/quenching phenomenon continues until the entire length of
the fuel rod is cooled. The point at which coolant-rod surface contact is first reestablished is referred to as
the quench front region and the speed at which this region moves up the rod is the quench front velocity.
The quench front creates a rapid and localized cooling and prior to quenching of the fuel cladding,
resulting in a steep gradient in the surface temperature. Advancement of the quench front is controlled by
the rate at which the liquid is evaporated by the hot cladding surface so that along the fuel rod, heat is
removed by a combination of conduction and convection.
At the onset of subcooled ECC injection and until the beginning of top-down quenching, the core spray
Emergency Core Cooling (ECC) plays a minor role. The subcooled liquid sprayed onto the reactor core is
intended to flow downwards the reactor vessel. However, significant steam flowing up the fuel bundles
limits ECC liquid from penetrating downward in to fuel channels. The liquid is held up at the top of the
fuel bundle upper tie plate until Counter-Current Flow Limitation (CCFL) breakdown takes place. Due to
relatively lower steaming rate in lower power peripheral bundles, and bypass, CCFL break down first
happens on top of these regions, causing core spray inventory to penetrate into these regions, and through
which, penetrate into lower plenum. During this period, even though high powered fuel channels do not
receive any spray flow from the top, they get significant cooling through channel wall which is cooled by
the spray flow penetrating into bypass. Eventually, CCFL breakdown happens in high powered fuel
bundles as well causing spray flow to start penetrating into these channels. This contact begins at the top
of the fuel rods where the coolant is injected and begins to propagate downward the rod progressively. As
more coolant is added, the rod cooling/quenching phenomenon continues until the entire length of the fuel
rod is cooled.
For a BWR recirculation line DEGB scenario, the core never fully refloods. Continued coolant spray
injection to the fuel rods, however, provide cooling aimed at keeping fuel rods from further heating up.
As core spray coolant penetrates into the channel, significant thermodynamic non-equilibrium flow is
experienced within the fuel channel. Superheated steam, subcooled liquid from core spray injection and
the generation of saturated steam from the quench front are consistently mixing during the transient in
chaotic fashion. Therefore, better modeling these phenomena would significantly improve the predictive
capabilities of ECCS models for NSA. A plot of a typical fuel rod and core PCT temperature response is
shown in Figure 1-3.
Even though the results of this study could be generalized to other LOCA scenarios, the applicability to
other LWR types or thermal-hydraulic conditions for LOCA are not discussed in the present document
and the study is limited to the DBA scenario for a BWR2 plant.

1-6
The thermohydraulics of ECC bypass and penetration is extremely complex, requiring for realistic
analyses, consideration of thermal and mechanical in multidimensional flow configurations. This aspect is
described in greater detail in the following section. One of the objects of LOCA analysis is to calculate
the PCT. PCT predictions involve all phases of a LOCA until the core has been quenched. Determining
the cladding temperature is also of interest since local cladding oxidation is directly correlated to the
cladding surface temperature. Maintaining high cladding temperatures maintain an accelerated cladding
oxidation build-up. This build up contributes to the heat transfer degradation between the fuel cladding
and the coolant. Additionally, it also contributes in changing the cladding material properties, which
could compromise cladding integrity, if cladding temperatures are not reduced.
Figure 1-3 Representative BWR/2 Water Inventory, Fuel Temperatures and Velocities 660 s after Core Spray Initiation.
1.2 ATWS-INSTABILITY OVERVIEW IN LIGHT WATER REACTORS
The focus on Anticipated Transient Without Scram (ATWS) events originated with an Advisory
Committee on Reactor Safeguards (ACRS) concern that there could be a safety problem a common mode
failure could reduce the reliability of the Reactor Protection System (RPS) in such a way that the system
would not function properly in the event of an anticipated transient [8]. Because the consequences of such
event could be severe in some cases, the American Nuclear Regulatory Commission (NRC) challenged
the industry to put in place actions to enhance prevention and mitigation of this beyond design basis
occurrence. This challenge resulted in the rulemaking and issuance of 10CFR50.62, "Requirements for
Bottom Peaked Bundle

1-7
Reduction of Risk from Anticipated Transients without Scram (ATWS) Events for Light-water Cooled
Nuclear Power Plants." This regulation has resulted in the installation on all United States (US) BWRs of:
1. an automatic recirculation pump trip (RPT) under conditions indicative of an ATWS;
2. an alternate rod insertion (ARI) system diverse from the reactor trip system; and
3. a standby liquid control system (SLCS) with increased capacity and guidance to operators to
reduce the water level and thereby reduce the power level until the SLCS becomes effective.
Consequent to this ruling, the potential for instabilities in ATWS events must be considered from an
operational perspective, i.e. operators must consider the possibility of an RPS failure following a transient
such as a Turbine Trip With ByPass (TTWBP) or a Reactor Pump Trip (RPT).The transient event can
lead to an uncontrolled instability event due to RPS failure. This event is called ATWS-I or ATWS event
with oscillations. ATWS-I takes into consideration the unlikely event to experience large irregular
oscillations during an ATWS event. Because of the RPS failure, these oscillations are not mitigated and
local high peak clad temperatures can be calculated where rod dryout occurs. It is therefore important to
be able to calculate accurately the peak clad temperature generated when large oscillations are
experienced.
Acceptance criteria for this event are the following:
1. Although a locally high peak clad temperature is calculated and some fuel damage cannot be
precluded for some cases, peak fuel energy deposition is in all cases less than 280 Cal/g.
Stability-related oscillations are not expected to significantly distort the core, impede core
cooling, or prevent safe shutdown.
2. Stability-related oscillations pose no challenge for the primary system integrity.
3. Containment integrity is maintained for ATWS events through existing Emergency Procedure
Guide (EPG) actions, independent of the presence of oscillations.
4. Thermal-hydraulic oscillations pose no challenge to long-term shutdown and cooling capability.
These acceptance criteria constitute the confirmation of acceptable BWR standby liquid control system
(SLCS) negative reactivity insertion capability for ATWS events, including automatic capability. They
are required by 10 CFR 50.62.
Postulated core thermal-hydraulic oscillations affect the ATWS analysis basis in two ways. First,
oscillations may occur during some subset of the previously analyzed ATWS events, i.e. thermal-
hydraulic oscillations are occurring at the time of the ATWS.
The two event scenarios (TTWBP and 2RPT) mentioned previously are considered for ATWS-I. The
TTWBP event is typically more limiting as all feedwater heating is lost resulting in a large increase in
inlet subcooling which increases the power to flow ratio during the event and results in more severe
oscillations. The 2RPT event does not result in a loss of all feedwater heating; however, the 2RPT event
does not immediately result in an automatic reactor scram (unlike the TTWBP event). Due to the later
time of scram (and assumed scram failure) the operator response is postulated to be delayed relative to the

1-8
TTWBP event. The failure to scram is the key entry point to the plant Emergency Operating Procedures
(EOPs).
Occasional large oscillation spikes can be experienced for a turbine trip event when the inlet subcooling
increases sufficiently. These large irregular oscillations are characterized by periodic changes in flow and
power in a BWR bundle. These changes can be core-wide (the entire core power and flow oscillate in
phase) or regional (half of the core oscillates out of phase with the other half). Mass flow oscillations
characteristic of this event are shown in Figure 1-4.
Figure 1-4 Liquid and Vapor Flow Rate for a Representative BWR/4 during ATWS-I - TTWBP.
The fluctuations in mass flow and the corresponding core power result in local changes of the cladding
temperature. The increase in cladding temperature is induced by the periodic surface heat transfer
reduction due to local coolant loss. This trend is reversed after the flow is restored and the clad
temperature starts to decrease because of increased steam cooling. If the decreasing cladding temperature
is below the minimum film boiling temperature (a more detailed description is provided in Section 1.3),
the heat transfer between the cladding and the liquid re-establishes a higher heat transfer regime. Figure
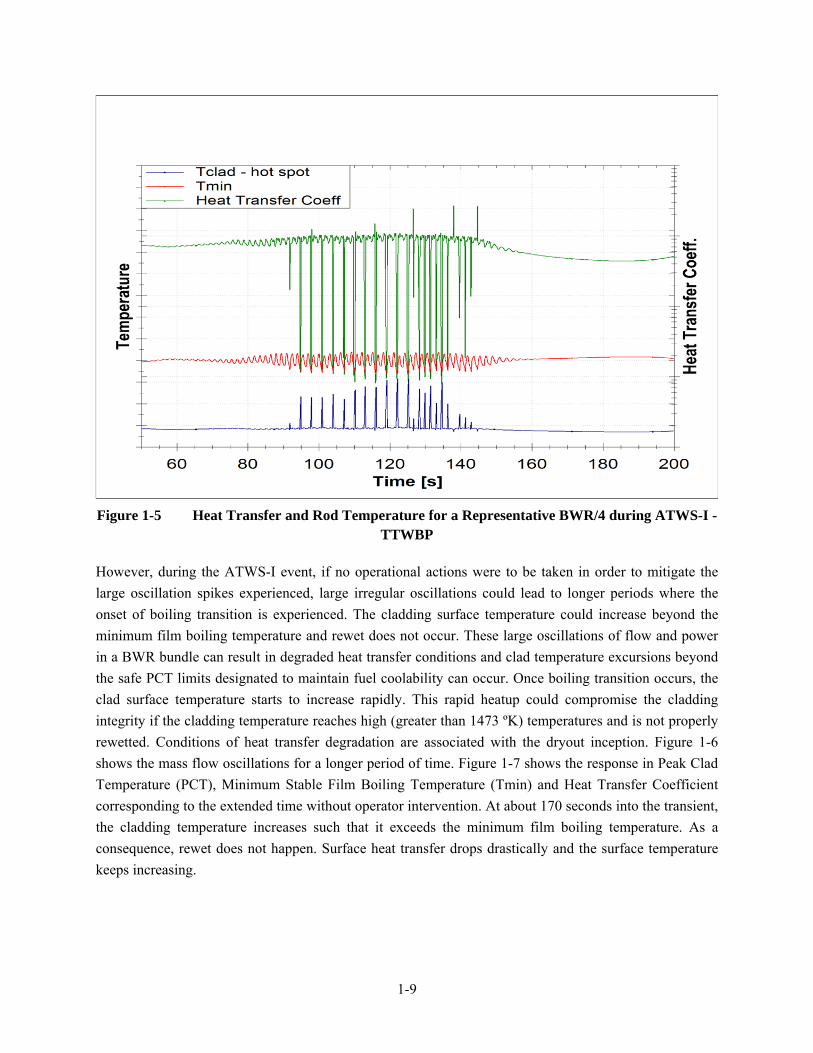
1-5 outlines the changes in cladding surface temperature in concordance with a diminution of local
surface heat transfer. In Figure 1-5, the cladding heat up is not high enough for the cladding temperature
to exceed the minimum film boiling temperature. Rewetting is immediate and a dryout-rewet cycle is
established. The cladding temperature reached remains below the safe PCT limits designated to maintain
fuel coolability. The temperature is never high enough to threaten that limit. With the detailed accounting
of the phenomena governing this periodic dryout and rewetting, the limiting consideration for fuel safety
is shifted from dryout inception to failure to rewet. Accordingly, periodic dryout and rewetting is not
considered a threat to fuel integrity as long as clad high temperature excursion does not occur.
1-9
Figure 1-5 Heat Transfer and Rod Temperature for a Representative BWR/4 during ATWS-I - TTWBP
However, during the ATWS-I event, if no operational actions were to be taken in order to mitigate the
large oscillation spikes experienced, large irregular oscillations could lead to longer periods where the
onset of boiling transition is experienced. The cladding surface temperature could increase beyond the
minimum film boiling temperature and rewet does not occur. These large oscillations of flow and power
in a BWR bundle can result in degraded heat transfer conditions and clad temperature excursions beyond
the safe PCT limits designated to maintain fuel coolability can occur. Once boiling transition occurs, the
clad surface temperature starts to increase rapidly. This rapid heatup could compromise the cladding
integrity if the cladding temperature reaches high (greater than 1473 ºK) temperatures and is not properly
rewetted. Conditions of heat transfer degradation are associated with the dryout inception. Figure 1-6
shows the mass flow oscillations for a longer period of time. Figure 1-7 shows the response in Peak Clad
Temperature (PCT), Minimum Stable Film Boiling Temperature (Tmin) and Heat Transfer Coefficient
corresponding to the extended time without operator intervention. At about 170 seconds into the transient,
the cladding temperature increases such that it exceeds the minimum film boiling temperature. As a
consequence, rewet does not happen. Surface heat transfer drops drastically and the surface temperature
keeps increasing.

1-10
Figure 1-6 Liquid and Vapor Flow Rate for a Representative BWR/4 during ATWS-I (TTWBP) – Delayed Operator Action
The capability to model properly cladding rewetting for fast transients such as ATWS-I is needed to
demonstrate that the rod surface rewets and that cladding temperatures do not maintain a high PCT
(which leads to cladding failure) throughout the transient. This means that for ATWS-I applications
cladding rewet predictions can be enhanced and, therefore, provide additional flexibility in terms of
system functions and operator actions. Evaluation of ATWS-I events is technically complex. Accurate
analysis requires detailed modeling of the sequence of events, including both, system functions and
operator actions, as well as the plant configuration and initial conditions.

1-11
Figure 1-7 Heat Transfer and Rod Temperature for a Representative BWR/4 during ATWS-I (TTWBP) – Delayed Operator Action.
1.3 REWETTING & QUENCHING OVERVIEW AS A MULTIPHASE FRAMEWORK
The need to guarantee the cooling of water-cooled reactor fuel elements during a LOCA has prompted
considerable research into the quenching process. An overview of this extensive research will be provided
in Section 1.4. In a LWR, the rewetting phase of a postulated LOCA is crucial in the fuel bundles. The
quenching front advancement is partly determined by the local wall temperature. However, fuel rods
within a single fuel bundle do not all have the same surface temperature. Therefore, quench front
propagation is not going to be homogeneous throughout a fuel bundle, let alone throughout the entire
core. When the local clad surface temperatures fall below the rewetting temperature, the liquid wets the
surface, resulting in a very high (boiling) heat transfer mode. This manner of cooling or quenching, of
fuel rods can propagate from the bottom of the core (reflood) or the top of the core (top down quenching)
when core spray is the main ECCS.
In both regimes, the quench front is characterized by large temperature and heat flux gradients within
small axial distances (Δz ~ 1 mm) [9]. The front advancement is controlled by two heat-removal
mechanisms. The first mechanism is described thoroughly in Duffey and Porthouse [10]. It is
characterized by the axial heat conduction from the dry region ahead of the quench front to the very large
nucleate boiling heat transfer region behind the advancing film and the quench front. The second
mechanism is described in Sun, Dix and Tien [11], which is the precursory rod cooling. This cooling

1-12
mechanism is associated with heat transfer to the droplets entrained in the vapor field ahead of the quench
front.
The physical processes that occur with bottom flooding are different depending on whether the rate of
admission of coolant to the channel is high or low (Figure 1-8). At low flooding rates, an annular flow
region is formed with the quench front being defined as the boundary between the hot surface wall, the
dryout region (also referred to as the un-wetted surface) and the liquid film. The quench front is noted
“QF” in Figure 1-8. Other nucleate boiling regimes occur upstream (wetted region of the cladding) of the
quench front. These regimes will be discussed in a greater extent in Section 2.2. At high flooding rates the
liquid level in the channel rises more rapidly than the quench front and a film boiling region (also called
Inverted annular region) is formed. The quench front corresponds in this case to the point where the thin
vapor film collapses and the cladding surface is wetted. At both low and high flooding rates a significant
amount of entrainment of the coolant in the vapor stream occurs. In both cases, the quench front
propagates upward due to the combined effects of axial heat conduction through the cladding and
precooling from the liquid column ahead of the quench front in the "inverted annular” flow region.
For slow reflooding, the quench front propagation is primarily due to axial heat conduction in the
cladding. A very steep axial surface temperature gradient within a few millimeters of the quench front is
established. Below the quench front, the dominant heat transfer region is nucleate boiling heat transfer.
This regime is characterized by high heat transfer between the cladding wall and the coolant. Ahead of the
quench front, in the dry region, film boiling heat transfer is the dominant mode of heat transfer. The
quench front is the location where the transition between nucleate boiling and film boiling occurs. High
flow rates of superheated vapor result from the steam generated as the rods are quenched. Vapor
velocities are usually high enough to entrain significant fractions of the liquid in the form of droplets.
This droplet entrainment is beneficial since it enhances heat transfer downstream of the quench front by
cooling the steam and contributing to the total steam flow rate as the drops evaporate. Consequently,
quench fronts often form at the top of the bundles once the entrained droplets have cooled the local clad
surfaces below the rewetting temperature. Those quench fronts propagate downwards as the liquid film
caused by accumulation of droplets falls along the surface, shattering at the quench front into droplets.
These films formed by the impingement of droplets at the top of the rods have the same mechanics as the
top-down quenching presented below. This phenomenon enhances local cooling of the cladding, also
called precursory cooling.

1-13
Figure 1-8 Low and High Flooding Rate Heat Transfer Regimes [12]
The physical processes that occur in the case of top-down quenching are shown in Figure 1-9. ECCS
injects subcooled coolant, which rapidly reaches its saturation temperature, aimed at a rapid surface
temperature decrease. The cladding temperature is significantly hotter than the saturation temperature of
the coolant. This temperature difference produces an insulating vapor layer at the contact surface. If the
cladding temperature exceeds a temperature called the Leidenfrost temperature, a stable vapor film is
established and the vapor prevents the remaining liquid from wetting the cladding, limiting the cooling
effectiveness. At cladding temperatures below the Leidenfrost temperature, the vapor film is unstable in
nature and the liquid has intermittent contact with the hot surface. Below this surface temperature, the
liquid can enter in prolonged contact with the cladding surface: the cladding is rewetted. The intricacy
between these surface temperatures is described in greater detail in Section 2.2.
In summary, quenching is a transient process that occurs when an initially very hot metal surface is
exposed to a coolant. In the case of a tube, an annulus, or a rod bundle fuel element, the coolant may be
admitted either from above – top-down quenching- or from the base of the channel – bottom flooding, or
more commonly denominated, reflooding. Sometimes both methods are used simultaneously in a nuclear
power plant. Both modes are considered in the present study.

1-14
As mentioned previously, an understanding of the phenomena at and beyond the dryout location and the
capability to model properly cladding quenching results directly in an enhanced capability to model
oxidation buildup (which is exponentially proportional to the cladding temperature), optimizing the plant
thermal-margins. This means that for LOCA applications the amount of predicted oxidation can be
reduced and, therefore, provide additional thermal margin.

1-15
Figure 1-9 Hydraulic Conditions in a Fuel Channel during Spray Cooling [14]

1-16
1.4 QUENCHING NUMERICAL MODELS AND CORRELATIONS – AN OVERVIEW
A variety of studies involving theoretical and experimental investigations have been undertaken to understand the complex phenomena of rewetting. Several rewetting experiments have been performed throughout the years on top quenching and reflood in various ranges of pressure, temperature, coolant composition and environments (steam, air, etc.). It was determined early on that the movement of the quench fronts on the rods and channel walls was determined by a balance between heat transfer through conduction and heat removal by convection. In general, most of the rewetting models solve the Fourier conduction equation for a given set of heat transfer coefficients and rewetting temperatures to obtain the temperature distribution in the hot surface. In general, the rewetting models consider either an analytical or a numerical method to solve the conduction equation. The most common approaches to modeling this phenomenon are provided below. First, the different quenching models used in current system codes are reviewed. Then, the different re-nodalization schemes implemented in system codes are compared.
1.4.1 Quenching Models
Initially, efforts were made to analyze rewetting problems based on one-dimensional approximation. In these models a constant heat transfer coefficient was assumed in the wet region and an adiabatic condition in dry region in order to analyze the rewetting process [9-11, 15]. In 1968, Yamanouchi [15] presented a tentative to analytically model top quenching. Thompson [9] provided a numerical method utilizing finite differences and writing separate energy equations for surface and interior nodes to solve the temperature distribution within the rod and consequently model the rewetting. Yu [16] proposed a summary of correlations for different temperature, pressure and quenching velocity conditions. Duffey [10] proposed a one dimensional analytical solution
It was observed that during rewetting of a thin slab at lower rewetting rates, the variation of temperature in the transverse direction is less significant and the problem can be considered as one-dimensional. However, at higher rewetting rates the temperature gradient in transverse direction cannot be neglected. Following Yu and Duffey, Tien and Yao [17], and Dix and Andersen [18] provided a two-dimensional analysis of the conduction-controlled rewetting. Tien and Yao [16] proposed a model that demonstrates the transition between one-dimensional and two-dimensional formulations and establishes the limitation of one-dimensional model for high values of Peclet number and Biot number.
Several two-dimensional conduction models were proposed for analyzing the rewetting phenomena at higher Biot number and higher rewetting rates. The basic rewetting models [16-17] usually consider two different regions (wet and dry) for a hot object (slab or rod) of infinite length with a quasi-steady approximation. The majority of the models were based upon the assumption that a constant heat transfer coefficient can be used for the wet side of the front and that the dry side ahead of the front can be treated as adiabatic. In Thompson’s work however, a heat transfer coefficient proportional to ΔT3 was explored with much success.
Vreeland [19] proposed a new model to calculate the heat transfer coefficient, accounting for the effect of coolant subcooling and mass flux. Analytical models however, are usually reduced in that they do not account for a variety of parameters impacting the reflood heat transfer rates that are tightly coupled with each other.

1-17
In Safety analysis codes, two methods are considered [21]: Correlations based on Analytical considerations, 2-Dimensional Conduction-Controlled along with dynamic re-nodalization.
1.4.1.1 Biot-Peclet Correlations
In TRACG, the motion of a quench front on a hot surface is considered as a complex function of axial conduction, radial convection both ahead and behind the front, internal heat generation, and heat transfer. Since axial conduction of heat from ahead of the front to the quenched side occurs on a length scale of a centimeter or less, and typical fuel rods are several meters long, analytical methods have been developed to approximate quench front motion without resorting to costly two-dimensional conduction solutions. A correlation, which approximates the one- and two-dimensional solutions, is used for the quench front velocity. This correlation is based on a Biot-Peclet approximation that was introduced in Reference 18. Its implementation into TRACG is described in Reference 20.
1.4.2 Re-Nodalization Schemes
1.4.2.1 2-Phase 2-Field Codes
In TRACE [1] and RELAP [2, 3], a fine mesh-rezoning scheme is implemented to efficiently use the two-dimensional conduction solution for reflood calculations. The scheme is intended to resolve the large axial variation of wall temperatures and heat fluxes. The number of axial nodes in the heat structures is varied in such a way that the fine nodes exist only in the nucleate boiling and transition boiling regions.
Figure 1-10 shows typical heat structure geometry with one fluid-control volume connected to each heat structure. The dots are radial mesh points. At the initiation of the reflood model, each heat structure is subdivided into two axial intervals. A two-dimensional array of mesh points is thus formed. Thereafter, the number of axial intervals may be doubled, halved, or unchanged at each time step according to a set of rules [2]. Figure 1-10 also shows an example of a heat structure going through a cycle of axial nodalization variation. The nodes within the rod and cladding are only subdivided in the axial direction. No radial re-nodalization is considered in these schemes. The axial re-nodalization permits to resolve the axial conduction component of the quench front. However, the two dimensional conduction at the quench front is not resolved. Additionally, all the fine mesh surface nodes shown on Figure 1-10 propose a uniform re-nodalization.

1-18
Figure 1-10 an example of the fine mesh-rezoning process. [2]
1.4.2.2 2-Phase 3-Field Codes
More recently, several efforts have attempted to characterize reflood -and LOCA in a broader
perspective- with three-field safety codes and formulations [22, 23, 24]. Frepoli and Mahaffy [40] have
proposed an approach that is very similar to the present study. The development of a fully-implicit
scheme [41] to model the two-phase three-field flow and heat transfer problem is presented to simulate
the complex phenomena occurring in proximity of the quench front of a nuclear reactor core during the
reflood phase of a postulated LOCA was introduced.
The FHMG [40, 41] computational module developed at Penn State is characterized by a local fine
hydraulic mesh or ‘subgrid’ which follows the quench front as it moves into the core. The fine mesh
module is used to solve the coupled two-phase flow and heat transfer problem in the quench front and
froth region with much greater detail than the current model. The moving subgrid ‘slides’ over the
Eulerian mesh of the system code that is used to simulate the reflood as shown in Figure 1-11. The
primary output of the FHMG module is an improved estimate of the source terms for the
entrainment/deposition, vapor generation and local wall heat transfer. The source terms calculated with
the subgrid replace the source terms in the governing the hydraulic model for the fine mesh is
approximated as one-dimensional.

1-19
Figure 1-11 an example of the T-H moving fine grid nodalization [40]
This model is a Fine Hydraulic Moving Grid (FHMG) that overlies a coarse Eulerian mesh in the
proximity of the quench front and entrainment region. The development of such model and its mesh
refinement scheme, however, did not explore a non-uniform meshing to better capture the sharp gradients
that are present at the quench front. Additionally, the work is limited to PWRs and does not explore the
application of three-field simulations for BWR.
1.5 OUTLINE AND OBJECTIVES OF THE CURRENT RESEARCH WORK
The originality of the present study lies in that it has examined the predictive capabilities of two-field and three-field transient analysis codes focusing on the rewetting region for BWR at LOCA and ATWS-I conditions. This research project develops a 2D Conduction-Controlled quenching model
This analysis of the rewetting characteristics yielded the following developments of a rewetting modeling package that includes:
1) A dynamic axial refining of the local rewetting region scheme. A coupled T-H re-nodalization model with a fine moving mesh dynamically refining a NSA computer code Eulerian hydraulic mesh was developed to better model the rewetting heat transfer. This local Eulerian hydraulic mesh is in turn coupled with a Lagrangian non-uniform nodalization in order to compute the

1-20
temperature distribution within the fuel rod and calculate the heat transfer to the coolant. The Lagrangian-Eulerian coupling and dynamic re-nodalization logic for three-field solvers is a new approach that has been developed for this thesis.
2) The development of a heat transfer logic and the corresponding heat transfer coefficient models to properly calculate temperature gradients at locations where sharp thermal-hydraulic property changes are experienced,
3) The development of a 2D-Conduction Controlled model that solves the temperature distribution in the fuel rod and computes film front velocities, heat transfer from the rod surface to the fluid and couples this results to the considered NSA computer code original T/H solution,
In order to model the quench front propagation in a subchannel framework the code COBRAG is modified. The COBRAG code is a GEH proprietary version of the COBRA (COolant Boiling in Rod Arrays) [4]. It is a best estimate code for subchannel analysis of thermal–hydraulic phenomena in a BWR type fuel bundle. The three-field code COBRAG code was used for this work because of its capability to model steam, droplets and film which provides additional resolution in modeling the rewetting phenomenon. Its spatial resolution capabilities were increased with including the dynamic re-nodalization scheme and the implementation of the quenching model. In order to incorporate the capability to capture the film front progression as the bundle rewets, COBRAG was modified to include constitutive relations to compute the flow regimes and heat transfer, mass and energy distribution between fields at the rewetting front. Constitutive relations available in literature were assessed relative to the models employed in the COBRAG code original version. Model modifications and/or upgrades are made in an effort to utilize the most appropriate models that are based on either local flow characteristics or developed from experimental data collected over the desired range of conditions. The models that are incorporated into the proposed rewetting package are developed uniquely for the problem at hand.
The developed rewetting modeling package for COBRAG includes:
1) The implementation of a functional relationship between the actual and theoretical liquid phase split between film and droplet based on comparisons to experimental data to account for any deficiencies that exist in the original theoretical model. This model was implemented in COBRAG to refine the liquid distribution between the liquid film and the droplets.
2) The improvements to the numerical method to mitigate water packing in numerical cells at locations of sharp interfacial property changes and low pressure applications.
The moving mesh logic mentioned above and a two-dimensional conduction controlled quench front model were incorporated into the COBRAG code to create the code COBRA2CON. The goal of this work is to provide a new way of capturing the dominant mechanisms and calculate the important parameters that affect heat transfer mechanisms during rewet. This means that for ATWS-I applications cladding rewet predictions can be enhanced and, therefore, provide additional flexibility in terms of system functions and operator actions.
Chapter 2 introduces key concepts such as the flow and heat transfer regimes, and rewetting temperature.

1-21
The focus of the model development and the modifications of COBRAG to develop COBRA2CON in the current work can be seen in Chapter 3. This chapter presents an overview of the thermal-hydraulic model and discretization of the COBRA2CON code.
Chapter 4 introduces the COBRAG benchmark used for verification and validation of the implemented models. Firstly, the benchmark of the 2-D conduction-controlled quenching model will be discussed. Secondly, the one rod Halden reflood experiment for ATWS-I transients will be presented. Finally, the Rod Bundle Heat Transfer (RBHT) experimental facility and the Core Spray Heat Transfer (GÖTA), which consider bottom reflood and top-down quenching respectively will be discussed. The analysis and interpretation of the benchmark for both COBRAG and COBRA2CON are presented in Chapter 5. Finally, in Chapter 6 several conclusions on the proposed COBRAG code are provided and some recommendations for future work are offered.

2-1
2. FLOW REGIMES AND HEAT TRANSFER DURING A REFLOOD TRANSIENT
The heat transfer rate that a fuel rod is subject to during rewetting is strongly coupled with local thermal-
hydraulic properties such as flow, cladding and coolant temperatures and material properties. As such,
heat transfer correlations take on different forms for different hydraulic conditions. This in turn affects the
rewetting characteristics, quenching rates that are widely affected by the dominant heat transfer
mechanism experienced locally. Modeling cladding rewetting requires an accurate prediction of the heat
transfer and heat fluxes from the cladding to the coolant and strongly depends on the closure relationships
applied. The selection of the appropriate closure relationship applicable for a given thermal-hydraulic
condition is dictated by the flow and heat transfer regime maps. The relationships required by safety
analysis computer codes to simulate vapor-liquid-cladding interactions during rewetting include, but are
not limited to:
1. wall friction factor,
2. interfacial friction factor between the liquid film and the vapor field,
3. interfacial drag coefficient between the dispersed droplets and the vapor field,
4. entrainment rate,
5. deposition rate,
6. entrained droplet size,
7. interfacial heat transfer coefficient between the continuous liquid and vapor fields,
8. interfacial heat transfer coefficient between the dispersed droplets and vapor fields,
9. heat transfer coefficient between the wall and the liquid field, and
10. heat transfer coefficient between the wall and the vapor field.
Accurate predictions of the heat transfer rate depend on the code capability to properly calculate local
flow and temperature conditions. These conditions in turn are used to determine the applicable flow and
heat transfer regimes. Section 2.1 will discuss the flow regimes that are considered in this study. Section
2.2 will discuss the heat transfer regimes that are relevant to the rewetting process. The present study only
focuses on fuel bundle thermal hydraulic behavior. Therefore, only vertical flows will be considered since
they are the dominant flow characteristic within a fuel bundle. No horizontal flow patterns will be
discussed in the following chapters.
2.1 FLOW REGIMES DEFINITIONS RELEVANT TO QUENCHING
The two-fluid three-field model used in COBRAG (discussed in Chapter 3) requires the use of auxiliary
relations for the constitutive correlations in the basic conservation equations. The constitutive correlations
relate the exchange of mass, momentum, and energy between each phase and its surroundings. The
exchange of energy and momentum at the interface between vapor and liquid depend on the interfacial
area per unit volume and the topology of the two-phase flow. For this reason, it is important to identify
the flow regime in each hydraulic cell before proceeding to solving the local balance equations.

2-2
Figure 2-1 Flow Regime Map for Vertical Upward Two-Phase Flow [31]
Extensive qualitative studies of the flow regimes have been performed using various experimental
techniques [28, 35, 36, 53 and 54].These observations have led to the understanding and characterization
of flow regimes observed during the reflood phase. However, the categorization of flow patterns still
remains qualitative, thus subjective, and flow regimes categorization can differ widely throughout the
literature to this day. This study considers that the flow patterns outlined in Reference 31 provide
sufficient resolution for the purpose of this work. The flow regime map corresponding to the flow patterns
below as a function of the relative density and flow in vertical co-current flow is given in Figure 2-2. The
visual characterization of the flow patterns is provided in Figure 2-2 below.
The flow regime map utilized in COBRAG, which is built upon the flow regimes in Reference 31 is
further simplified into two major flow regimes:
1. The liquid continuous flow regime at low void fraction and
2. The vapor continuous flow regime at high void fraction.
A transition region is included in between the two major flow regimes in order to avoid discontinuities in
heat transfer and interfacial shear to minimize numerical problems. The liquid continuous flow regime
includes single–phase liquid flow and bubbly/churn flow. The vapor continuous flow regime includes
dispersed annular droplet flow and single–phase vapor flow. The transition regime involves churn to
annular and churn to droplet; depending on the void fraction, flow rate and other variables. These

2-3
characteristics are described following. The COBRAG version from which this study is started splits
liquid flow into droplets and film flow, in the transition to annular flow, such that there is equilibrium
between the entrainment rate and droplet rate . The COBRAG film-droplet split model [38] was modified
for this study and its development is described in more detail in Chapter 3.
Figure 2-2 Flow Patterns in Vertical Co-Current Flow [31]
2.1.1 Bubbly-Churn Flow
Bubbly flow occurs inside of fuel bundles when the wall superheat becomes sufficient for the coolant to
reach its saturation temperature and locally generates vapor nucleation sites at the heating surface. The
bubbly flow pattern is characterized by the presence of discrete bubbles (also called bubble suspension) in
a continuous liquid [28] and [29]. There are numerous regimes that can be characterized as bubbly flow

2-4
[31]. These regimes are characterized based upon the interfacial interactions and bubble behavior.
Detailed discussion of bubble behavior can be found in [28] and [29] and is not repeated in the present
study. As wall superheat increases, the number of nucleation sites increases as well. A larger amount of
bubbles are created and bubble interaction increases. At higher vapor flows, bubble coalescence (fusion of
bubbles together) occurs. This regime is known as slug flow regime. During reflood, pure slug flow is
unlikely to develop. The long vertical distance required for the bubbles to coalesce is not available when
large vapor generation rates are experienced.
In COBRAG, for modeling simplification purposes, the flow patterns bubbly, slug and churn in Figure
2-2 are condensed into one single flow regime called bubbly-churn flow. The bubbly-churn flow
terminology in Chapter 3 will refer to these three flow regimes indiscriminately.
2.1.2 Annular Flow
Annular flow is a flow regime that occurs at higher vapor fractions and velocities. This flow regime is
characterized by the presence of a liquid film flowing on the channel wall and by the vapor flowing in the
central part of the channel (called vapor core). The near-wall liquid film and the vapor core may be both
concurrent and countercurrent. The void fraction in annular flow, -determined as a fraction of the cross
section occupied by the gas phase- is high. Void fractions in annular flow are considered to be exceeding
75-80%. A phase transition (evaporation, condensation) may be observed at the phase-change interfaces.
The liquid film surface flowing on the channel wall is a region of intricate interactions. As the vapor
flows, the interfacial shear between the liquid film and the vapor creates a zone on disturbance in the film.
Droplets in the flow core deposits on the film surfaces. In this case, the region is often referred to as
annular-dispersed flow [30].
2.1.3 Transition Flow
The mechanism of transition between churn flow and annular flow is extremely complicated [28]. The
transition regime involves churn to annular and churn to droplet; depending on the void fraction, flow rate
and other variables. The criterion for transition is when the liquid in the film can be lifted by the vapor
flow relative to the liquid in the churn flow regime. This criterion is satisfied at the void fraction where
the same velocity is predicted for churn flow as for annular flow. During the transition to annular flow,
COBRAG [6, 26] splits liquid flow into droplets and film flow such that there is equilibrium between the
entrainment rate and droplet rate.
2.2 HEAT TRANSFER REGIMES DEFINITIONS RELEVANT TO QUENCHING
The heat transfer correlations are closely connected with the actual flow region. The heat transfer regions
and their occurrence in LWRs are determined by the safety analysis codes by considering the temperature
behavior that a heated surface may experience locally. Wall heat transfer encompasses many different
regimes, including:
1. single-phase heat transfer (liquid or gas, forced or natural circulation),
2. two-phase heat transfer (nucleate boiling, film boiling, condensation) and
3. thermal radiation.

2-5
For example, during rewetting, as the liquid level reaches the bottom of the fuel rod and starts to rise around the rods, a series of complex heat transfer mechanisms takes place. These exist as part of two distinct flow patterns, depending on whether the flooding rate is either low or high, as shown in Figure 2-3. The following sections introduce the concept of the boiling curve, the Critical Heat Flux Temperature and the minimum film boiling temperature as well as the different heat transfer regimes: nucleate boiling, transition boiling and film boiling.
Figure 2-3 Low and High Flooding Rate Heat Transfer Regimes [31]
2.2.1 Boiling Curve
A simplified example of the relationship between the surface temperature and heat transfer regime is the
boiling curve shown in Figure 2-4. In this figure, the boiling curve relates the wall temperature to the heat
flux between the wall and the liquid phase. Actually, a single curve in the figure is representative of a
family of curves that depend on the flow rate with higher curves corresponding to higher flow rates.

2-6
Figure 2-4 Typical Boiling Curve for Water at 1 Atm.
The left most part of the curve represents single-phase convection to liquid in which the fluid motion can result from an imposed pressure difference or can result from density differences (natural convection).
As the wall temperature rises sufficiently above the saturated conditions (TSAT), nucleate boiling occurs. In the nucleate boiling regime, the liquid is the continuous fluid: vapor is generated at specific nucleation sites on the heating surface and vapor bubbles are discretely distributed through the continuous, saturated liquid phase (liquid continuous). However, there is the possibility that, the bulk liquid may still be sub-cooled. Therefore, TSAT refers to local wall conditions. This regime is also called the isolated bubble regime and is characterized by high heat transfer rates.
When the heat flux applied to the surface in contact with the liquid is progressively increased, a point is reached at which the continuous contact between the surface and the liquid is lost and the critical heat flux (CHF) is attained The CHF occurs when the heat flux reaches a maximum prior to degradation in heat transfer.

2-7
As the wall temperature increases past the point of the CHF, transition boiling occurs. At low vapor content, this phenomenon is known as Departure from Nucleate Boiling (DNB). In this regime, the local vapor generation is so great that the drag on the liquid moving toward the surface prevents it from completely wetting the surface. As a result, the heat transfer decreases. For BWRs, high quality CHF is more relevant. This corresponds to the dryout of the liquid film at the wall, resulting in reduced heat transfer. In an increasing heat flux experiment, transition boiling would not be encountered. The local minimum at the end of the transition-boiling regime is termed the minimum heat flux or the minimum stable film boiling temperature.
When the entire boiling surface becomes blanketed with vapor, the regime is the film boiling regime. The heat flux then begins to increase with increasing superheat, and velocities. Radiation effects become more important for high wall temperature. The heat transfer in each of these boiling regimes or the transition points between regimes are predicted by correlations developed specifically for a particular regime. For a given set of local thermal-hydraulic conditions, a unique wall heat transfer mode is assigned. In a similar manner to the boiling curve, the heat transfer at the wall is divided into the following modes:
1. Single-phase liquid convection mode 2. Sub-cooled and nucleate boiling mode 3. Transition boiling mode 4. Film boiling mode 5. Single-phase vapor convection
Two important points on the boiling curve with their corresponding temperatures are very decisive for the flow region and thus the heat transfer:
1. critical heat flux, and 2. minimum film boiling heat flux or temperature.
These temperatures are discussed in the following sections.
2.2.2 Wall Temperatures: TCHF, Leidenfrost Temperature and Tmin
The CHF an extremely important mechanism as it separates normal and abnormal operation with an appropriate safety margin. Two mechanisms of CHF are recognized, DNB in liquid continuous flow and film dryout (DO) in vapor continuous flow (Figure 2-3).
DNB occurs on a heating surface under subcooled or saturated nucleate boiling. Bubbles become crowded in the vicinity of the heating surface and form a moving bubble layer as shown in the left in Figure 2-3. When the bubble layer becomes thick enough to impede cooling liquid contacting the hot surface, the bubbles will merge into a vapor film changing the boiling in heat flux controlled systems from the efficient nucleate boiling to the highly inefficient film boiling. DNB is likely when the heat flux is high. If the heat flux is low compared to the DNB heat flux, then DNB will not occur and boiling transition does not occur until the liquid on the surface disappear, which is characteristic of DO.. CHF occurs when liquid film becomes too thin and breaks down into dry patches as shown in the right in Figure 2-3. . The wall temperature at which CHF occurs is labelled TCHF in Figure 2-4. Because of the different behavior of each mechanism, a different correlation is required for each mechanism.

2-8
As mentioned in Section 1.3, at transient conditions (ATWS-I and LOCA) the cladding temperature can be significantly hotter than the saturation temperature of the coolant. This temperature difference produces an insulating vapor layer at the contact surface. If the cladding temperature exceeds a temperature called the Leidenfrost temperature, a stable vapor film is established and the vapor prevents the remaining liquid from wetting the cladding, limiting the cooling effectiveness. At cladding temperatures below the Leidenfrost temperature, the vapor film is unstable in nature and the liquid has intermittent contact with the hot surface.
The Leidenfrost effect limits film advancement when the local heat transfer rates cause the liquid to evaporate from the surface at a rate equal to the rate at which the film is able to supply new liquid (Figure 2-5). In the dry section above (in the case of reflood) or below (in the case of top-down quenching) the front, the temperature is above the Leidenfrost temperature, and the heat transfer away from the surface is negligible relative to the wetted cladding just behind the film front. In the rewetted section behind the front, the temperature drops very rapidly to the saturation temperature and the heat transfer away from the surface is significant.
If the wall temperature ahead of the quench front is less than the minimum stable film boiling temperature
(Tmin) [20], then precursory cooling will play a more dominant role and the wall temperature will
quickly drop because of the large value of the transition boiling heat transfer. There is much confusion in
the literature about the nature of Tmin because it is often taken to be equivalent to other temperatures
such as the Leidenfrost temperature (TLeid), critical heat flux temperature (TCHF), or quench
temperature (TQ). Carbajo (1984) [13] carefully distinguishes the phenomenon associated with each
temperature and describes flow and heat transfer conditions where the different temperatures become
indistinguishable. It is likely that because of these special situations that the confusion persists. Carbajo
defines the minimum film boiling temperature (TMFB) which is equivalent to Tmin as used in this work.
TCHF is the temperature below which the liquid can be in continuous contact with the wall. Therefore,
cladding must be cooled below the Leidenfrost temperature to allow the ECCS liquid to rewet the
cladding surface. Initial cooling at the top of the channel allows a liquid film to form. Once formed, this
film begins to run down the surface. However, at some point the film is violently thrown off the surface.
This ejection of the film from the rod has been termed sputtering. The sputtering point or the quench front
divides the dry-wall, high-temperature region of the channel from the wet-wall, low temperature region. It
is observed that the quench front propagates down the channel at a uniform velocity that is a function of
the initial surface temperature Tw. The vapor formed by the quenching process escapes upward out of the
channel.

2-9
Figure 2-5 Schematic of the Surface Temperatures during Reflood.
The minimum film boiling heat flux -and its corresponding minimum film boiling temperature- is an important parameter in temperature-controlled systems as it separates the high temperature region, where the inefficient film boiling takes place, from the lower temperature region, where the more efficient transition boiling occurs. It thus provides a limit to the initiating rewetting by ECCS. The heat transfer coefficient on either side of the minimum film boiling temperature can differ by two orders of magnitude.
As long as the wall temperature is greater than the minimum film boiling temperature the heat is
transferred from the wall to the vapor film and subsequently from the vapor to the vapor-liquid interface.
If the liquid core is subcooled a significant fraction of the heat flux will be used for heating the liquid; if
the liquid is saturated the heat transferred from the interface will be used for evaporation thus increasing
the vapor velocity.
The increased velocity differential across the interface will lead to an increased entrainment in the vapor
film and also to a higher turbulence level in the vapor annulus. This will increase the wall-vapor and the
vapor-liquid core heat transfer which in turn will lower the wall temperature. If the wall temperature
drops below the minimum film boiling temperature rewetting of the wall may occur.
2.2.3 Nucleate Boiling
Nucleate boiling takes place when the wall surface temperature is hotter than the saturated fluid
temperature by a certain amount but where the heat flux is below the critical heat flux. When boiling

2-10
occurs on a solid surface at low superheat, bubbles can be seen to form repeatedly at preferred positions
called nucleation sites. Nucleate boiling can occur in Pool Boiling and in Forced-Convective Boiling.
Highly accurate heat transfer correlations in the nucleate boiling and forced convective boiling flow
regions are not required in order to calculate heat transfer during a LOCA. The reason for this is that heat
transfer in these regions is very efficient and should not be a limiting factor concerning the behavior of
fuel and cladding during a rewet. Much of the difficulty arises from the sensitivity of nucleate boiling to
the micro geometry of the surface on a micron length scale and to its wettability; it is difficult to find
appropriate ways of quantifying these characteristics.
2.2.4 Transition Boiling
Transition boiling is characterized by a wall heat flux that increases with decreasing wall superheat [30].
Physically, this is caused by dryout of the liquid film over portions of the surface, which adds to the
thermal resistance. This is dubbed at post-CHF heat transfer. Post-CHF heat transfer occurs once the CHF
value has been exceeded and the heated wall surface is no longer in continuous contact with the liquid
phase. As a result, post-CHF heat transfer is inherently poor due to the decreased thermal conductivity of
the vapor phase in contact with the heated surface in place of the liquid phase. Post-CHF heat transfer can
be divided into two distinct regimes: transition and film boiling.
In transition boiling, the CHF has been exceeded such that the bubble nucleation rate is high enough to produce a vapor film on the heated surface or insufficient liquid is present such that intermittent film breakdown causes an increase in the wall temperature. Intermittent wetting of the heated surface is still possible in transition boiling until the minimum film boiling temperature or Leidenfrost point is exceeded. The relatively poor post-CHF heat transfer is demonstrated with the drop in wall heat flux as the wall superheat and quality increase in the transition boiling regime until reaching a minimum at the Leidenfrost point, in Figure 2-5. Once the wall superheat surpasses the Leidenfrost point, the film boiling regime begins.
2.2.5 Film Boiling
In film boiling, the heated surface is covered with a continuous vapor blanket with vapor being generated at the liquid-vapor interface by evaporation rather than at the wall. In a two-phase flow regime, this may correspond to either a dispersed flow regime or an inverted-annular depending upon the liquid content of the flow and the vapor velocity. Hence, the film boiling heat transfer regime can be subdivided into two regimes: Inverted Annular Film Boiling (IAFB) and Dispersed Flow Film Boiling (DFFB). IAFB, which is sometimes referred to as saturated film boiling, is characterized by a thin vapor film on the heated surface with a significant amount of liquid concentrated in the core of Figure 2-3. The IAFB regime occurs when the CHF limit is surpassed, and there is a departure from nucleate boiling leading to a vapor film surrounding the heated surface. Additional vapor bubbles may be dispersed throughout the liquid core but have little influence on the flow [31].
On the other hand, DFFB results from liquid dryout. In this case, the liquid film on the heated surface is evaporated until there is no longer continuous liquid contact with the heated surface. This leads to a high velocity vapor core and increased interfacial shear which entrains liquid droplets creating a dispersed droplet field. Dependent upon the flow conditions, the liquid droplets may or may not be able to come

2-11
into contact with the heated surface. As mentioned previously, because DFFB is the main mechanism in film boiling for BWR, the focus of this work will be specifically on DFFB when referring to film boiling.
Heat transfer in the DFFB regime occurs by several mechanisms. The overall heat transfer process from the heated surface can be taken as a three component process:
1. Heat transferred from the wall to the vapor, 2. Heat transferred from the vapor to the dispersed droplets, and 3. Heat transferred from the wall to the dispersed liquid droplets (droplets will only
have a significant heat transfer when Twall < Tmin)
The models and correlations that have been used and developed into COBRAG for the purpose of this study will be provided in greater detail in Chapter 3.
2.3 MOTIVATION FOR THE PRESENT RESEARCH
As previously described, current methods for modeling reflood in transient analysis codes are either relying on a Biot-Peclet type correlations to determine rewetting properties or two-fluid two-dimensional conduction controlled quenching with re-nodalization schemes. However, in the case of the Biot-Peclet correlations, mechanisms of importance for the rewetting physics (such as precursory heat transfer) are not modelled. Additionally, Biot-Peclet correlations are used to determine the properties of the quench front and heat transfer but without altering the nodalization. This can yield to over predictions of the heat transfer from the cladding to the coolant and/or incorrect surface temperature axial distributions due to the typically large nodalization in system codes. Codes that use dynamic re-nodalization use uniform nodalization. Because of uniform nodalization, large gradients within the node containing the quench front cannot be properly captured. Best-estimate safety analyses applications are currently used more extensively in the industry to replace overly-conservative models to improve prediction of specific parameters.
Several types of computer codes are used throughout the nuclear industry for NSA. The current work is focused on two-fluid, three field subchannel analysis codes. The use of two liquid fields allows for the modeling of continuous (i.e., films) and discrete (i.e., droplets) liquid fields. The need to explicitly model droplets during a rewetting analysis has been shown by Yadigaroglu [37]. The goal of the current study is to modify a two-phase three-field code model rewet. The code needs to contain boundary conditions, constitutive correlations and numerical schemes that are applicable to the transient conditions considered.
The three-field COBRAG was modified to increase its spatial resolution capabilities without impacting its overall numerical performances. In addition, to incorporate the capability to capture the film front progression as the bundle rewets, COBRAG was modified to include constitutive relations to compute the flow regimes and heat transfer, mass and energy distribution between fields at the rewetting front. Model modifications and/or upgrades are made in an effort to utilize the most appropriate models that are based on either the physics of the flow or developed from experimental data collected over the desired range of conditions. The models that are incorporated into the proposed rewetting package are either leveraging previous research work or are developed uniquely for the problem at hand.

3-1
3. METHODOLOGY
A three dimensional two–fluid and three–field model which is considered to be the most appropriate to
provide the capability of describing the film dryout phenomenon, non–equilibrium effects and subchannel
mixing, is adopted to model the two–phase flow. The two fluids represented are the vapor and liquid
phases while the three fields represent the continuous vapor or bubbles, the continuous liquid or droplets,
and the liquid film fields.
The three-field GEH proprietary code COBRAG code was used for this work because of its capability to
model steam, droplets and film which is expected to provide additional resolution in modeling the
rewetting phenomenon. COBRAG [26] is a best-estimate thermal-hydraulic subchannel analysis code
developed for LWR. The code uses a two-fluid modeling approach with consideration for three separate,
independent flow fields; fluid film, vapor, and liquid droplets. Significant differences can exist
concurrently in terms of velocity and flow direction between the two liquid forms fields. The three-field
representation allows for analyzing situations where liquid can coexist in both continuous and discrete
forms, as is the case for quenching film front propagation during rewetting phenomena or where the
capability of a traditional two-field model is limited. Section 3.1 provides a description of the COBRAG
code. Section 3.2 outlines the modifications of the COBRAG numeric to adapt the code to rewetting
scenarios to generate the foundations of COBRA2CON. Section 3.4 and 3.5 provide an overview of the 2-
D conduction controlled 2DCON code that has been developed and the details of the coupling to
COBRA2CON.
3.1 COBRAG CODE DESCRIPTION
COBRAG [6, 26, and 27] is a detailed subchannel analysis code developed at GEH Nuclear Energy, LLC
with the main objective of predicting the critical power, the bundle pressure drop and the void distribution
of the BWR fuel bundles. The capabilities of COBRAG include transient subchannel calculations. It was
originally developed by GEH to predict BWR bundle critical power and dryout locations, bundle planar
averaged and local void fraction distribution; and bundle pressure drop [6, 26].
COBRAG uses a separated flow formulation to solve the multiphase flow problems on an Eulerian-
Eulerian mesh using conservation equations for each field [26]. In addition to the mass, momentum and
energy conservation equations that solve the time dependent 3-dimensional two-phase flow, the transient
heat conduction in the fuel rods and heat transfer to the two-phase flow are also modeled. The
computational scheme of the code is constructed on the basis of semi-implicit method. The code solves
two-phase multi-field time-dependent governing equations in both axial and lateral directions along with
models for turbulent mixing and void drift to calculate the void distribution across the bundle sub-
channels, droplet deposition and film entrainment modeling to determine the local film flow condition.
The COBRAG model solves the governing equations of the two–phase flow model for the conservation
equations in mass, momentum and energy for each field. The code solves three separate momentum
equations for the liquid and the dispersed bubble field for the bubbly and churn flow regimes, and the
vapor phase, the continuous liquid field and the entrained droplet field for the dispersed annular flow
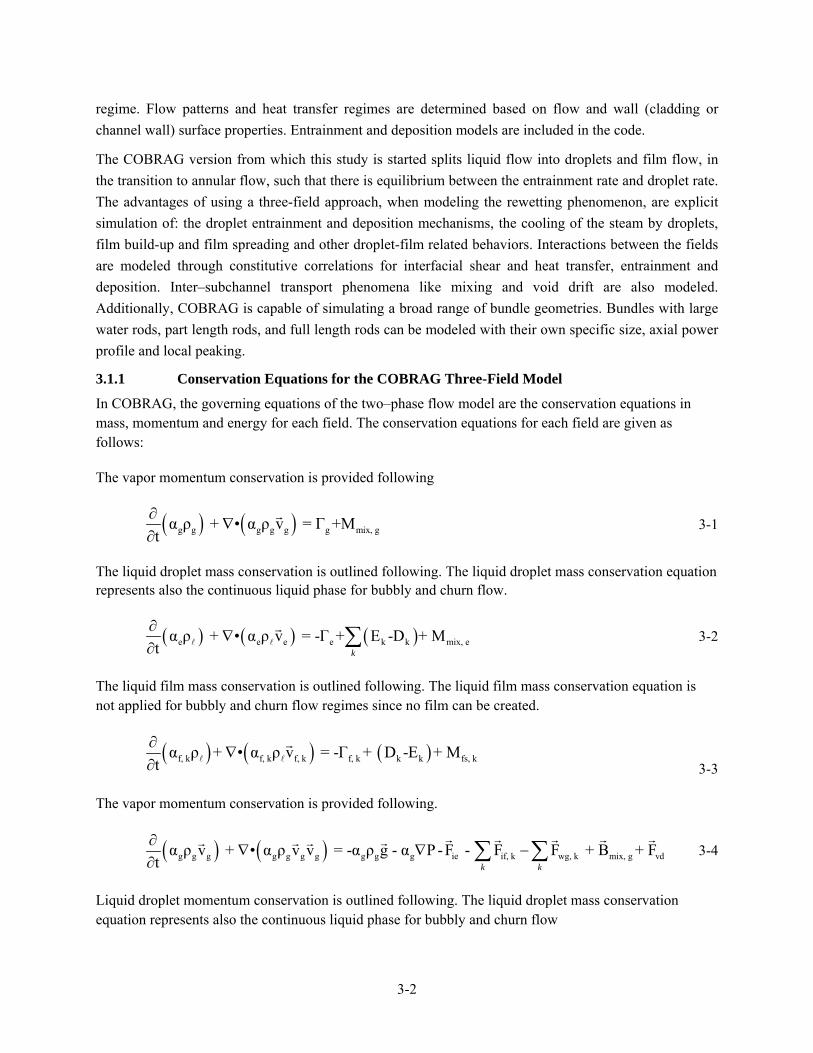
3-2
regime. Flow patterns and heat transfer regimes are determined based on flow and wall (cladding or
channel wall) surface properties. Entrainment and deposition models are included in the code.
The COBRAG version from which this study is started splits liquid flow into droplets and film flow, in
the transition to annular flow, such that there is equilibrium between the entrainment rate and droplet rate.
The advantages of using a three-field approach, when modeling the rewetting phenomenon, are explicit
simulation of: the droplet entrainment and deposition mechanisms, the cooling of the steam by droplets,
film build-up and film spreading and other droplet-film related behaviors. Interactions between the fields
are modeled through constitutive correlations for interfacial shear and heat transfer, entrainment and
deposition. Inter–subchannel transport phenomena like mixing and void drift are also modeled.
Additionally, COBRAG is capable of simulating a broad range of bundle geometries. Bundles with large
water rods, part length rods, and full length rods can be modeled with their own specific size, axial power
profile and local peaking.
3.1.1 Conservation Equations for the COBRAG Three-Field Model
In COBRAG, the governing equations of the two–phase flow model are the conservation equations in mass, momentum and energy for each field. The conservation equations for each field are given as follows:
The vapor momentum conservation is provided following
g g g g g g mix, gα ρ + • α ρ v = Γ +Mt
3-1
The liquid droplet mass conservation is outlined following. The liquid droplet mass conservation equation represents also the continuous liquid phase for bubbly and churn flow.
e e e e k k mix, eα ρ + • α ρ v = -Γ + E -D + Mt k
3-2
The liquid film mass conservation is outlined following. The liquid film mass conservation equation is not applied for bubbly and churn flow regimes since no film can be created.
f, k f, k f, k f, k k k fs, kα ρ + • α ρ v = -Γ + D -E + Mt
3-3
The vapor momentum conservation is provided following.
g g g g g g g g g g ie if, k wg, k mix, g vdα ρ v + • α ρ v v = -α ρ g - α P -F - F F + B + Ft k k
3-4
Liquid droplet momentum conservation is outlined following. The liquid droplet mass conservation equation represents also the continuous liquid phase for bubbly and churn flow

3-3
e e e e e e e ie we, k mix, e vd
k
k f, k k ek
α ρ v + • α ρ v v = -α ρ g - α P + F - F + B - Ft
+ E v -D v
3-5
The liquid film momentum conservation is outlined following. The liquid film momentum conservation equation is not applied to bubbly and churn flow regimes since no film can be created.
f, k f, k f, k f, k f, k f, k f, k
if,k wf, k fs,k k e k f, k
α ρ v + • α ρ v v = -α ρ g - α Pt
+ F - F + B + D v - E v
3-6
Vapor energy:
g g g g g g g g g g ige igf, k wg, k mix, gk k
Pα ρ h + • α ρ v h = α + Γ h + q q + q + E
t t
3-7
The film temperature is assumed to be the same as the droplets since the liquid temperature is essentially the saturation temperature for both droplets and film.
Total energy:
g g g e f, k g g g g e e f, k f, kk k
mix, g mix, e fs, k w, kk k
α ρ h +α ρ h + α ρ h + • α ρ v h + α ρ v h + α ρ v h =t
P+ E + E + E + q
t
3-8
where subscripts k identifies the liquid films in a subchannel. , in the total energy equation represents
the total heat transfer from surface k. Its components are: the wall heat transfer to the film and the vapor,
3.1.2 Heat Conduction Model
In order to calculate the effect of the fuel rod heat transfer, it is necessary to include the transient heat
conduction in the fuel rods. In the current version of COBRAG, a one-dimensional conduction model is
implemented. In cylindrical geometry, the heat conduction equation is formulated as:
ww w w w
TCp k T q
t
3-9
where T is the temperature, r the radial location, ρ, k and Cp the density, conductivity and heat capacity of
the material respectively and q′′′ is the volumetric heat source.
The heat generation distribution inside the fuel pellet, cladding and channel box can be specified through
input. For the boundary condition of the fuel rods, the heat flux at the fuel rod or channel surfaces is
related to convection heat transfer to the fluid:

3-4
w l l v vq h T T h T T 3-10
where q′′ is the surface heat flux, Tl and Tv are the liquid and vapor temperature respectively, hl and hv
the surface to liquid and the surface to vapor heat transfer coefficients. The heat transfer coefficients are
evaluated according to the heat transfer regime at the surfaces and the two-phase flow regime.
Heat conduction in the fuel rods is evaluated as a one-dimensional problem in each surface associated
with a subchannel cell. Inside the fuel rods, different materials are separated as different zones with
different properties.
3.1.3 COBRAG Discretization
COBRAG utilizes the finite-difference equations in implicit form with Eulerian staggered mesh to
increase the stability of the solution. The finite-difference equations are written in an implicit form with
donor cell differencing for convective quantities and based on a staggered computational cell shown in
Figure 3-1. In the staggered mesh approach the momentum cells are centered on the edges of the
continuity and energy cells. Therefore, flow rates and velocities are solved for at the edges of the
continuity cell and the state variables (density, pressure, enthalpy, and volume fractions) are obtained at
the cell centers. An example of the implementation of a staggered mesh is shown in Reference 26. The
axial mesh is given on the left and the corresponding radial mesh is given on the right.
Figure 3-1 Schematic of the Staggered Grid Variables

3-5
The numerical solution requires a discretization in space and time. Let ∆x and ∆t be the space and time
increment, respectively. The partial derivatives in the momentum, continuity and energy equations are
replaced by difference quotients. In the following description, the finite difference method in the
conservative form is applied in a combined implicit explicit scheme. Due the nature of the equation which
has a wave-like solution, an upwinding scheme or donor cell is applied to better capture the propagation
of propriety on time and space as well as assure numerical stability.
Phantom cells are added by COBRAG to the user-specified mesh above and below the subchannel to
allow for the specification of inlet and outlet state variables using either one of the available boundary
conditions or by connection to another subchannel.
Donor cell differencing is used to provide values of the convected parameters at the edges of the control
volumes used to solve the mass and energy equations. This technique increases the stability of the
solution by introducing numerical diffusion into the calculation. Meanwhile, linear averages are used to
calculate values of the state variables when calculating the constitutive relationships that are required to
solve the momentum equations at the cell boundaries.
In COBRAG a computational cell is characterized by:
1. axial cross-sectional area,
2. height and
3. number and widths of the lateral connections to adjacent cells.
COBRAG assumes all sections are vertically oriented and the positive axial flow is vertically upward.
COBRAG does not require a uniform mesh size; however, the size of the computational cells within the
mesh should be made to be large enough to obtain a solution in a reasonable (user defined) amount of
time, but at the same time small enough to capture the important effects within the geometry and the flow.
3.1.4 Solution Scheme
COBRAG uses a fully implicit spatial integration technique in space for the conservation equations for
mass and energy. The predictor–corrector method used by TRACG [20] is adopted to solve the
discretized equations as described in section 4.1. The main principle of the method is to obtain the
solution in two steps. The first step, called the predictor step, is to linearize the discretized equations in
time such that the time step size is not restricted by the Courant limit. However, conservation of mass,
momentum and energy are not perfectly maintained in this step. COBRAG solves the fully implicit non-
linear equations mass and energy through a Newton iteration and thus there will always be a small
conservation error proportional with the tightness of the convergence. The second step, called the
corrector step, is designed to restore the mass conservation. The COBRAG numerical method is not a
predictor-corrector method in the classical sense. The outer iteration (also referred previously as the
predictor step) will converge to the solution of the non-linear differential equation when fully converged.
The second step (also referred previously as the corrector step) ensures that mass is conserved even with
small momentum and energy balance error proportional to the level of convergence within the predictor

3-6
step. The assumption for the second step is that energy conservation is also obtained as long as mass
conservation is obtained and thermal equilibrium is reasonable close.
The predictor step linearizes the discretized equations in time such that the time step size is not restricted
by the Courant limit. The convective terms in the momentum equations uses the new time properties for
outflow and old time properties for inflow. The shears, mixing, void drift; entrainment and deposition are
based on new velocities and approximated by Taylor expansion around old velocities. These equations
constitute a set of linear equations in new velocities and new pressures. Consequently, the new velocities
can be solved as function of the new pressures and are used to eliminate the velocities in the mass and
energy equations. The convective terms in the mass and energy equations use the new properties for
iteration k+1 for outflow and new time properties from iteration k for inflow, when solving for the
iteration k+1 properties. The heat transfers, mixing, void drift, entrainment, deposition and evaporation
and are based on the new iteration k+1 properties. The mass and energy equations form a set of non-linear
matrix equations in pressure, void fractions and temperatures that can be solved by any standard matrix
inversion algorithm.
3.2 PROPOSED COBRA2CON NUMERICS AND SOLVER MODIFICATIONS
Coupled thermal-hydraulic numerical simulations of rewetting encounter difficulties with large axial
computational mesh spacing (typically, 0.1m axially for a full bundle) which cannot adequately resolve
the temperature and surface heat flux axial profiles across the quench front. During quenching, the entire
boiling curve--from film boiling through transition boiling and critical heat flux to nucleate boiling--can
be encompassed by one hydrodynamic mesh cell. Constraining the entire cell to be in one boiling regime
is nonphysical and results in stepwise cell-by-cell quenching, producing flow oscillations that can obscure
the correct hydrodynamic solution. Consequently, an integration of the boiling curve shape through the
hydrodynamic computational cell must be performed.
The proposed rewetting modeling code COBRA2CON integrates a combination of schemes and models
to mitigate this issue. The integration of the 2D Conduction Controlled Numerical Scheme is done in two
steps:
1) A dynamic axial refining of the local rewetting region scheme is developed. A coupled T-H re-nodalization model with a fine moving mesh dynamically refining a NSA computer code Eulerian hydraulic mesh was developed to better model the rewetting heat transfer. This local Eulerian hydraulic mesh is in turn coupled with a Lagrangian non-uniform nodalization in order to compute the temperature distribution within the fuel rod and calculate the heat transfer to the coolant. The Lagrangian-Eulerian coupling and dynamic re-nodalization logic for three-field solvers is a new approach that has been developed for this thesis.
2) The a heat transfer logic and the corresponding heat transfer coefficient models are developed to properly calculate temperature gradients at locations where sharp thermal-hydraulic property changes are experienced,
3) A 2D-Conduction Controlled model that solves the temperature distribution in the fuel rod and computes film front velocities, heat transfer from the rod surface to the fluid and couples these results to the considered NSA computer code original T/H solution.

3-7
The three-field GEH proprietary code COBRAG code is modified to integrate the models developed above. In order to incorporate the capability to capture the film front progression as the bundle rewets, COBRAG was also modified to include constitutive relations to compute the flow regimes and heat transfer, mass and energy distribution between fields at the rewetting front. Model modifications and/or upgrades are made in an effort to utilize the most appropriate correlations based on either local flow characteristics or developed from experimental data collected over the desired range of thermos-hydraulic conditions. The models that are incorporated into the proposed rewetting package are developed uniquely for the problem at hand.
The developed rewetting modeling package for COBRAG includes:
1) The implementation of a functional relationship between the actual and theoretical liquid phase split between film and droplet based on comparisons to experimental data to account for any deficiencies that exist in the original theoretical model. This model was implemented in COBRAG to refine the liquid distribution between the liquid film and the droplets.
2) The improvements to the numerical method to mitigate water packing in numerical cells at locations of sharp interfacial property changes and low pressure applications.
The detailed implementation of these models is provided following.
3.2.1 Proposed 2DCON Conduction-Controlled Model
3.2.1.1 Lagrangian 2-D Conduction FVM Model
As previously outlined, the calculation of the heat transfer at the front is extremely complex, and the
movement of the front is determined by a balance between the conductive heat transfer in the cladding
(more generally, fuel bundle) and the convective heat transfer to the film. For this purpose, a two
dimensional heat conduction model (2DCON) is developed. This two-dimensional model simulates the
rewetting phenomena provided in Figure 2-5. The solution for this problem is solved in a Lagrangian
coordinate system using the finite difference method on a non-uniform nodalization. The coordinate
system is moving at the same speed as the film front which allows solving the Fourier equation in a
pseudo steady-state framework. The mesh used is a structured mesh with variable length, i.e. the smallest
mesh-length is used where the temperature gradient is largest (i.e. around the quench front).
The conductive heat transfer is the term . in equation 3-8 and provides the “coupling” between the
quench front behavior and the hydraulics, in the channel. The governing equation for heat conduction
within the rod can be expressed as:
ww w w w
TCp k T q
t
3-11
In equation 3-9, the subscript ‘w’ represents the wall or cladding region. The surface temperature is
determined from the heat conduction equation 3-10.
An iterative process is established to calculate the wall temperature distribution at the wetted node based
on the conduction controlled rewetting model. The conductive heat transfer during quenching is
determined by the Fourier equation 3-10. The movement of the film and consequently the quench front
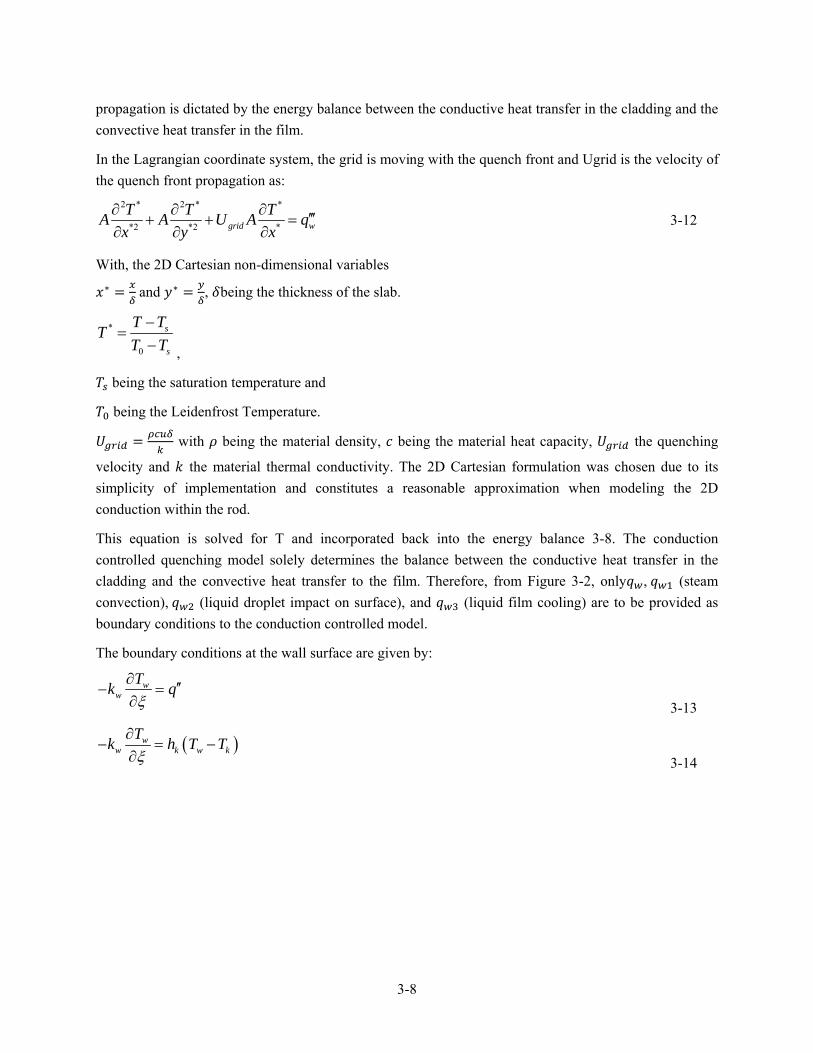
3-8
propagation is dictated by the energy balance between the conductive heat transfer in the cladding and the
convective heat transfer in the film.
In the Lagrangian coordinate system, the grid is moving with the quench front and Ugrid is the velocity of
the quench front propagation as:
2 * 2 * *
*2 *2 *grid w
T T TA A U A q
x y x
3-12
With, the 2D Cartesian non-dimensional variables
∗ and ∗ , being the thickness of the slab.
*
0
s
s
T TT
T T
,
being the saturation temperature and
being the Leidenfrost Temperature.
with being the material density, being the material heat capacity, the quenching
velocity and the material thermal conductivity. The 2D Cartesian formulation was chosen due to its
simplicity of implementation and constitutes a reasonable approximation when modeling the 2D
conduction within the rod.
This equation is solved for T and incorporated back into the energy balance 3-8. The conduction
controlled quenching model solely determines the balance between the conductive heat transfer in the
cladding and the convective heat transfer to the film. Therefore, from Figure 3-2, only , (steam
convection), (liquid droplet impact on surface), and (liquid film cooling) are to be provided as
boundary conditions to the conduction controlled model.
The boundary conditions at the wall surface are given by:
ww
Tk q
3-13
ww k w k
Tk h T T
3-14

3-9
Figure 3-2 Three Field Heat Transfer between Fields
It is assumed the vapor and droplet heat fluxes from the wall only occur in the non-wetted section.
Therefore, only the wetted part will be considered as:
1 1
2 2
3 3
, if the surface is dry
, if the surface is dry
, if the surface is wetted
w
ww w
w
h T TT
k h T T
h T T
3-15
Currently, the model assumes that if the surface if dry, or if the Leidenfrost effect prevents droplet
contact, the heat transfer coefficient is zero. Hence, h1=0 and h2=0
The numerical method consists of using the old time step temperature distribution as calculated by
COBRAG and computing the rod wall temperature based on the temperature boundary conditions from
the three-field model. Once the film velocity is evaluated based on the temperature distribution within the
region containing the quench front, the temperature distribution is calculated and fed back to the three-
field model into the energy balance equation for the new time step calculations. The quench front velocity
is obtained with an additional equation obtained by solving the heat conduction problem at the quench
front location (described above). The equation is based on the condition that the wall temperature is
known at the quench front location and it is equal at the Leidenfrost temperature. Here, the velocity of the
quench front was estimated based on the Leidenfrost point location.

3-10
3.2.1.2 Re-Nodalization Scheme
A coarse hydraulic mesh is used to describe the complex fluid flow in the quench front region which is a limitation of most of the best-estimate codes. This coarse nodalization is accurate enough to capture large-scale phenomena. However, cell sizes become too large to calculate large variations of the void fraction and other thermal-hydraulic properties within the quench region. This constitutes a numerical limitation when attempting the modeling of the phenomena in proximity of the quench front and precursory quenching regions.
Therefore, a dynamic refinement of the meshing is necessary to improve the resolution of the properties within the quench region. A coupled thermal-hydraulic re-nodalization model with a moving mesh dynamically refining the COBRAG Eulerian hydraulic mesh was developed to better model the rewetting heat transfer. This local Eulerian hydraulic mesh is in turn coupled with the Lagrangian non-uniform nodalization (see Section 3.2.1.1) in order to compute the temperature distribution within the fuel rod and calculate the heat transfer to the coolant. Hence, the quench front modeling is based on a local fine Eulerian hydraulic mesh which describes key thermal-hydraulic processes occurring in proximity of the quench front at level of details significantly greater than the current models.
The finite difference nodalization in Figure 3-3 is used for the conduction controlled rewetting solution (described in Section 3.2.1.1). The grid is non-uniform and the size of the cells is reduced in the axial and radial direction in the vicinity of the quenching front. The detailed nodalization resolves high temperature gradients near the quenching front where experimental data indicates a very steep change in surface temperature across the quench front. The heat conduction equation is integrated using a Finite Volume Method (FVM). Similarly to the fluid equations, the heat conduction equation includes additional terms containing the velocity of the mesh Ugrid. These terms account for the heat flux, which is ‘convected’ because of the grid motion. The solution of the heat conduction is based on the Successive Over-Relaxation Method.
The three field nodalization is based on a standard finite volume formulation consistent with [26]. The
staggered grid is ‘coupled’ with the conduction controlled quenching model nodalization. The conduction
controlled method is then applied. The quenching velocity is solved and the temperature distribution
within the considered cell is recalculated. Boundary conditions are then updated and the three field
thermal hydraulics variables are updated. The finite difference nodalization in Figure 4 is used for the
conduction controlled rewetting solution. The grid is non-uniform and the size of the cells is reduced in
the axial and radial direction in the vicinity of the quenching front. The detailed nodalization resolves
high temperature gradients near the quenching front where experimental data indicates a very steep
change in surface temperature across the quench front.
This analysis outlines the basis of an improved quenching model by incorporating a local quench front
propagation model using Lagrangian coordinates into an existing 3-field model using conventional finite
difference methods with Eulerian coordinates. The new model utilizes the physical mechanism associated
with the liquid film, dispersed droplets, steam flow and multidimensional conduction in the fuel rod to
predict film propagation.

3-11
This is a two-step method (Predictor and Corrector) where the solution is obtained by solving two half time steps. The first step is explicit in the radial direction and implicit in the axial direction. The second step is implicit in the radial direction and explicit in the axial direction. The solution of the 2-D temperature distribution in the non-uniform mesh is solved at the beginning of the first step. This allows the calculation of each source term in the balance equations. These source terms correspond to interactions between fields (interfacial shear, interfacial heat transfer, entrainment, deposition). The parameters of importance governing the interactions between fields have been identified and modified to incorporate the update of the Jacobian matrix based on the updated temperature distribution within the fuel rods.
The velocity Ugrid is obtained with an additional equation obtained by solving the heat conduction problem at the quench front location (described above). The equation is based on the condition that the wall temperature is known at the quench front location and it is equal at the Leidenfrost temperature. Here, the velocity of the quench front was estimated based on the Leidenfrost point location. The bottom reflood of a core can be seen as a series of fronts translating upward at about the same velocity as the rod is cooled and quenched.

3-12
Figure 3-3 Re-Nodalization Scheme

3-13
3.2.2 Proposed Heat Transfer Models
3.2.2.1 Heat Transfer Selection Logic
The heat transfer coefficient depends on local conditions and parameters such as wall and coolant temperature, material properties. Additionally, the heat transfer coefficient is highly dependent on the flow behavior. Due to this dependency to a large number of parameters, it is difficult to derive a heat transfer coefficient analytically and it is calculated from correlations that depend on the local flow and heat transfer regimes. Each mode of heat transfer has a correlation to predict the amount of heat transfer. The heat transfer selection logic from TRACG [20] is modified to develop the COBRA2CON specific heat transfer logic. This wall heat transfer logic is based upon local conditions at the wall such as the void fraction and the wall temperature. The TRACG logic is provided in Table 3-1.
Table 3-1 Wall Heat Transfer Selection Logic
Wall Conditions
Fluid Condition No Boiling Transition Boiling Transition
Flow Regime Tw<Tsat Tsat < Tw < TCHF TCHF < Tw < Tmin Tmin < Tw
α=0 Liquid
Convection Liquid Convection N/A N/A
0< α< αtran Liquid
Convection
Sub-cooled/Nucleate
Boiling Transition Boiling
Inverted Annular Flow
Regime
αtran< 1 Condensation Forced Convection
Vaporization Transition Boiling Film Boiling
α =1 N/A Vapor Convection Vapor Convection Vapor
Convection
For single-phase liquid (α= 0), convective heat transfer will exist up to the point of net vapor generation
for sub-cooled boiling (hl=hld).
For two-phase flow with void fractions below the transition to annular flow (Section 2.1.3), several heat
transfer regimes can exist. For sub-cooled wall temperatures, liquid convection will exist at the wall while
condensation will take place at the bubble interface if Tl < TSAT. For superheated wall temperatures up
to the point of boiling transition, either subcooled (xe < 0) or nucleate boiling (xe > 0) will exist
dependent on the equilibrium quality.

3-14
Nucleate boiling will exist up to the point where boiling transition occurs (xe < xc and Tw<TCHF
dependent on the boiling transition correlation). If boiling transition has occurred, transition boiling will
exist if the wall temperature is less than the minimum point on the boiling curve (Tw < Tmin ) and
sufficient liquid is present for rewet (xe < xc ); otherwise, film boiling will exist.
The partitioning of the wall heat transfer between the phases is based on the fraction of the surface area in
contact with the respective phase. This is determined in COBRA2CON by the calculation of the wetted
fraction of the rod wall or channel wall in a specific subchannel at a specific elevation. Based on the
wetted fraction (WETF), i.e. the fraction of film covering the surface, the wall heat transfer is determined.
For the liquid continuous flow regimes, all the heat transfer is to the liquid. For the vapor continuous flow
regimes, the energy is deposited in the vapor phase. Only for transition boiling during rewet, the wall heat
transfer is weighted between heat transfer to the vapor and heat transfer to the liquid.
3.2.2.2 Shumway Model Implementation for Calculation of the Minimum Stable Film Boiling
The boundary between the transition boiling regime and the film boiling regime corresponds to a
minimum point in the boiling curve. This boundary point is defined by the minimum stable film boiling
temperature (Tmin). In COBRAG, Tmin was calculated using the Iloeje correlation, discussed in
Referemce 20. The Iloeje correlation is an empirical correlation with a very limited application range and
does not include parameters that have been shown to have an impact on Tmin: e.g., Pressure, Reynold’s
number. Because of the simplicity of the correlation, Iloeje’s is not able to model phenomena that had
been experimentally shown to impact Tmin. Among them, the decrease in Tmin as the wall temperature
increases.
A better model for the minimum stable film boiling temperature (Tmin) was implemented to be able to
calculate the wall temperature at which the cladding can rewet. The model chosen to be implemented into
COBRA2CON to determine Tmin is based on the Shumway correlation [42]. In this paper, Shumway
surveyed the correlations and data in the literature in an attempt to develop a better correlation for the
minimum film boiling temperature that could be applied over a wider range.
Shumway defines the quench temperature (TQ) to be the temperature of the surface at which significant
deviations from film boiling are observed from a temperature versus time or distance curve. In other
words, at TQ there is an observable increase in the rate that the surface temperature is dropping that
implies that the heat transfer coefficient is increasing. Carbajo [13] equates the quench temperature with
the rewetting temperature at which a liquid film can reestablish (and maintain) contact with the dry
surface. This is assimilated to be the minimum stable film boiling temperature (Tmin) or the wall
temperature below which stable film boiling can no longer be maintained.
The correlation developed by Shumway for TRAC-B includes the effects of flow rate, pressure, void
fraction, fluid properties and wall properties on Tmin. The correlation that Shumway developed is the
following:

3-15
0.1
2 0.153.7 1 1 1 1.5E-5 Re 1
Prg fg
Q satcritp
h PT T PC
3-16
Where
p
p w
k C
k C
3-17
There is very little basis for the void fraction benefit in the calculation of Tmin in the Shumway
calculation. Therefore, the void fraction dependent term in the Schumway correlation for Tmin is ignored.
The mathematical expression implemented in COBRAG for calculating Tmin is:
0.1
0.153.7 1 1.5E-5 Re 1
Prg fg
Q satcritp
h PT T PC
3-18
As stated in Reference 28, the shape of the boiling curve is influenced by many phenomena which change
in importance with the varying experimental conditions. The minimum heat flux (Qmin) and the
temperature at which it occurs is not exclusively dependent on hydrodynamic or thermodynamic
properties of the fluid. It varies with surface conditions such as roughness and surface thermodynamic
properties. Factors such as velocity, pressure, subcooling, drop size, liquid contact angle, wetting agents,
and even gravity influence the minimum heat flux. This correlation, however, has been shown to provide
a reasonable heat transfer coefficient for modeling the transition between stable film boiling and nucleate
boiling. Its application to rewetting problems is therefore favorable and with the application range for the
correlation.
3.2.3 Film/Droplet Flow Split
COBRAG predictions for entrainment fraction (FENT) in annular flow, defined as the ratio of droplet
flow to the sum of droplet and film flow, from simple geometry experiments showed a need for further
improvement of the entrainment and deposition rate models. A set of equilibrium entrainment and
deposition rate models was developed following the recommendation in Reference 38 using the Risø data,
which were collected from high-pressure, high-temperature steam-water adiabatic experiments in round
tube and annulus geometry. S. Oh et al. [38] demonstrated that the correct split of total liquid in forms of
film and droplets at the onset of annular-mist flow regime was also important to obtain a good prediction
of film flow rates and entrainment fractions. Film flow and entrainment fraction are important in LOCA
and ATWS-I since dryout but also rewet (specifically during reflood) of BWR fuels in annular flow is
predicted by a liquid film mass balance using appropriate droplet entrainment and deposition models
along with evaporation. It is of great importance to define a correct boundary condition for the liquid flow
split between the liquid film and entrained droplets at the onset of annular flow. However, it is difficult to
obtain good experimental data at the onset of annular flow due to the complicated nature of the flow
structure at the boundary of churn-turbulent flow and annular flow. As a result, limited information
relevant to the film-droplet split has been available to the two-phase flow community and many

3-16
researchers have used either a single assumed value of the entrainment fraction at the onset of annular
flow or an entrainment model developed from adiabatic equilibrium conditions [38].
The entrainment fraction (FENT) in annular flow is defined as the ratio of droplet flow to the sum of
droplet and film flow. For simplicity of data presentation, a new parameter, film fraction or fraction of
film flow relative to total liquid flow, is defined as
fW
1 W
film ent
g f
F FW
3-19
The fraction of the bulk liquid flow (e-field) leaving cell j into the film flow (f-field) entering cell j+1 in
Figure 3-5 is labelled Fs. Similarly, the fraction f the film flow leaving cell j into the bulk liquid flow
entering cell j+1 is labelled Fd.
Leaving cell j using the proper donor-celled densities we have the following mass flows for the bulk
liquid and film on surface i:
e e l eW A v 3-20
fi fi l fiW A v 3-21
From these flows COBRA2CON can calculate the film flow split for surface i
fiW
Wfi
ifi e
T
XS
WS
3-22
where Si is the perimeter of surface i and ST it the total perimeter for all the surfaces in the subchannel.
However, this calculated film flow split needs to be adjusted based on actual experimental data. A
mathematical expression based on an exponential correlation between the total Reynolds number in a tube
and the film fraction was derived in reference 38

3-17
Figure 3-4 Film Fraction Correlation vs. Total Reynolds Number [38]
Let be the film split calculated the correlation shown in Figure 3-4 based on the total mass flux in the
subchannel leaving cell j.
If then there is too much bulk liquid and not enough film flow, and the following values for Fs
and Fd are adjusted such that the film split is met for the flow entering cell j+1:
0f fi
fi
X X
1 XSiF
3-23
0diF 3-24
If then there is too little bulk liquid and too much film flow and we calculate the following
values for Fs and Fd such that the film split is met for the flow entering cell j+1:
0SiF 3-25
0fi f
fi
X X
XdiF
3-26
This process automatically sets the film flow fraction to the desired value at the first boundary past =
0.3, and then automatically adjust the film flow fraction if conditions change, such as due to evaporation
or cross flows, at all subsequent cell boundaries until = t + 0.1 is reached. This process will also
remove the nodalization sensitivity in the current process.

3-18
Figure 3-5 Film Split Schematic
The new correlation developed by S. Oh [38] was implemented into COBRA2CON. This correlation was
shown to predict well the overall or total film flow rate. This correlation was implemented into
COBRA2CON to better model the creation of the propagating film front at the beginning of the reflood.
3.2.4 Water Packing
Large pressure spikes that cannot be explained by known physical phenomena are at times encountered
when Eulerian-type computer codes are used to analyze integral systems tests or reactor accidents [2].
These fictitious pressure spikes are sometimes calculated when vapor/gas is disappearing from, and liquid
is about to fill, a control volume. The situation is often referred to as water packing
The cause of the anomalous pressure spikes is the discontinuous change in compressibility between a
two-phase mixture of small void fraction and a pure liquid phase, and approximations inherent in the
discrete momentum equations. The same problems are seen using a two-fluid model or the homogeneous
equilibrium model. The density-pressure relationship used to calculate the new time pressure is based
upon the beginning of time step values for the state properties and derivatives. The compressibility of this
low void fraction cell is dominated by the mass transfer. The equivalent mixture corresponds to a highly
compressible fluid, i.e., significant volume changes can easily occur with very little change in pressure.
This high compressibility can allow significant continuing influx of liquid with very little pressure rise. In
fact, in some cases the net volume influx of liquid during the time step can be larger than the initial
vapor/gas volume in the cell. This filling of the cell is accompanied by only slight pressure changes. This
small change in pressure may do little to slow down or reverse the liquid influx momentum. If this is the
case, the following time step will be taken with a liquid full cell and large liquid influx momentum

3-19
existing at the beginning of the time step. Because the liquid is nearly incompressible, this large influx of
liquid momentum will cause a large increase in pressure during this following time step.
Within the adjacent cells of these spurious numerical pressure spikes, the calculated phasic velocities may
increase substantially, and smaller time-step sizes are needed to satisfy the material Courant stability
limit. Thus, the computational efficiency is greatly reduced by the presence of water packing. Of course,
the computed pressure spikes are unphysical. Furthermore, water packing may severely distort the
transient solution by changing the void distribution or driving the liquid completely out of an open
system.
Large variations in local pressure were observed for COBRA2CON and thought to be attributed to water
packing. To try mitigating these spikes, a water packing scheme has been implemented in COBRA2CON.
the scheme involves a numerical artifact that, when a pressure change occurs in a volume containing
mostly liquid, the volume of the cell undergoing water packing is increased in an infinitesimal manner to
absorb this unphysical pressure spike. This approach aims at simulating the material deformation dduring
a pressure spikeThis water packing scheme is implemented into the COBRA2CON predictor step of the
outer iteration.
3.3 SUMMARY
Every model introduced in Section 3.2 was implemented for use in COBRA2CON. The first part of the implementation consisted in the development of a stand-along rewetting module that includes:
1) A dynamic axial refining of the local rewetting region scheme. 2) The development of a heat transfer logic and the corresponding heat transfer coefficient models to
properly calculate temperature, 3) The development of a 2D-Conduction Controlled model that solves the temperature distribution
in the fuel rod and computes film front velocities, heat transfer from the rod surface to the fluid.
In order to incorporate the capability to capture the film front progression as the bundle rewets, COBRAG was modified for the implementation of correlations to compute the flow regimes and heat transfer, mass and energy distribution between fields at the rewetting front. The models that are incorporated into the proposed rewetting package were developed uniquely for the problem at hand.
The developed rewetting modeling package for COBRAG includes:
1) The implementation of a functional relationship between the actual and theoretical liquid phase split between film and droplet to refine the liquid distribution between the liquid film and the droplets.
2) The improvements to the numerical method to mitigate water packing in numerical cells at locations of sharp interfacial property changes and low pressure applications.
The benchmark and testing of COBRA2CON is outlined in the following chapter.

4-1
4. BENCHMARK DESCRIPTION AND ANALYSIS
4.1 QUENCHING EXPERIMENT OVERVIEW
To demonstrate the correct modeling of the bundle thermal-hydraulics during rewetting, a matrix of experimental data to benchmark COBRAG, COBRA2CON has been considered (See Table 4-1). This matrix identifies separate test effects analyses that provide the basis of the COBRAG/COBRA2CON models.
The objective of these calculations is to demonstrate that the implementation of this newly proposed model for quenching along with the necessary COBRAG code modifications are able to match experimental data for high pressure and high temperature quenching.
Table 4-1 Benchmark Table for the Testing of COBRA2CON
Number Code Test Test Conditions and Purpose
- 2DCON
Thompson AECL
Numerical Simulation
[9]
Hot Surface Rewetting by a Falling
Liquid Film.
This test is performed as verification of
surface temperature comparison for the
2D Conduction Model.
1 COBRAG/
COBRA2CON
Halden
[48, 49, 50, 51]
Single Rod Bottom Reflood Tests.
Comparison of the PCT profile with
experiment to validate reflood
quenching mechanisms- 1x1 bundle.
2 COBRAG/
COBRA2CON
Rod Bundle Heat
Transfer Test (RBHT)
[54, 55, 56]
Reflood reduced Scale 7x7 BWR fuel
bundle mock-up
Comparison of the PCT profile with
experiment to validate reflood
quenching mechanisms- 7x7 bundle
The conduction controlled quench model that is being incorporated into the three field thermal hydraulic
model has been benchmarked against separate test-effect test experiments from the literature. The first
test considered is the comparison of the 2D Conduction Controlled Module (2DCON) to Thompson’s 2-D
conduction numerical simulation [9]. This comparison constitutes a verification of the correct
implementation of 2DCON. The verification is described in Section 4.2. Once the proper 2D conduction
heat transfer behavior of 2DCON is ascertained, 2DCON is incorporated into the three-field thermal
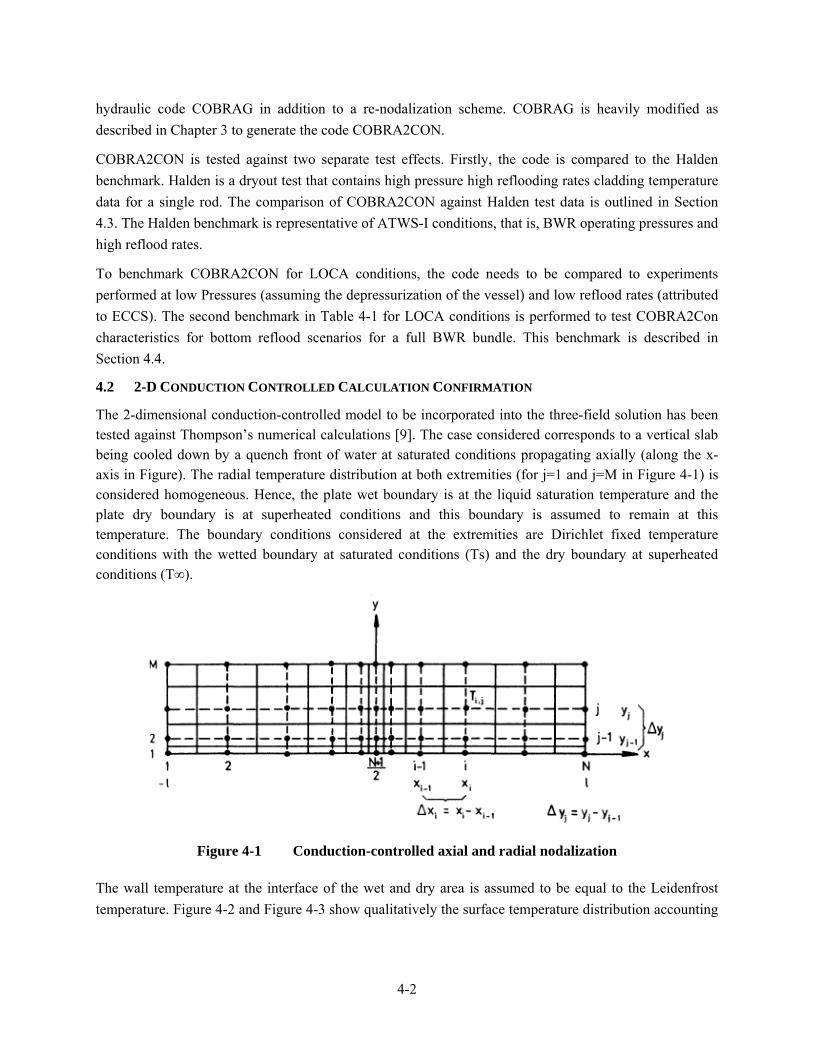
4-2
hydraulic code COBRAG in addition to a re-nodalization scheme. COBRAG is heavily modified as
described in Chapter 3 to generate the code COBRA2CON.
COBRA2CON is tested against two separate test effects. Firstly, the code is compared to the Halden
benchmark. Halden is a dryout test that contains high pressure high reflooding rates cladding temperature
data for a single rod. The comparison of COBRA2CON against Halden test data is outlined in Section
4.3. The Halden benchmark is representative of ATWS-I conditions, that is, BWR operating pressures and
high reflood rates.
To benchmark COBRA2CON for LOCA conditions, the code needs to be compared to experiments
performed at low Pressures (assuming the depressurization of the vessel) and low reflood rates (attributed
to ECCS). The second benchmark in Table 4-1 for LOCA conditions is performed to test COBRA2Con
characteristics for bottom reflood scenarios for a full BWR bundle. This benchmark is described in
Section 4.4.
4.2 2-D CONDUCTION CONTROLLED CALCULATION CONFIRMATION
The 2-dimensional conduction-controlled model to be incorporated into the three-field solution has been tested against Thompson’s numerical calculations [9]. The case considered corresponds to a vertical slab being cooled down by a quench front of water at saturated conditions propagating axially (along the x-axis in Figure). The radial temperature distribution at both extremities (for j=1 and j=M in Figure 4-1) is considered homogeneous. Hence, the plate wet boundary is at the liquid saturation temperature and the plate dry boundary is at superheated conditions and this boundary is assumed to remain at this temperature. The boundary conditions considered at the extremities are Dirichlet fixed temperature conditions with the wetted boundary at saturated conditions (Ts) and the dry boundary at superheated conditions (T∞).
Figure 4-1 Conduction-controlled axial and radial nodalization
The wall temperature at the interface of the wet and dry area is assumed to be equal to the Leidenfrost
temperature. Figure 4-2 and Figure 4-3 show qualitatively the surface temperature distribution accounting

4-3
for the quenching front location. Figure 4-2 shows a good agreement with the numerical calculation in
[9]. The temperature decrease at the quench front is adequately determined.
Both figures demonstrate that Dirichlet boundary conditions are correctly imposed. Additionally, correct
implementation of Neumann boundary conditions at the wall where convection occurs is of prime
importance since it determines the location of the quenching front and consequently the temperature
distribution at the contact surface where the heat fluxes to the different fields are to be determined.
The modeling of the axial heat flux is critical since is constitutes an input to the energy balance of the
three-field model. The heat flux at the interface of the wet and dry area dictates the thermal-hydraulic
behavior of the quench front and ultimately dictates the thermal-hydraulic behavior of the coolant. As
previously mentioned, the wall temperature at the interface of the wet and dry area is assumed to be equal
to the Leidenfrost temperature, and it is assumed that the wall is wetted and nucleate boiling occurs up to
this temperature. At higher wall temperatures, film boiling is assumed to occur and the heat flux is several
orders of magnitude smaller due to the steep decrease in heat transfer coefficient.
Figure 4-2 Conduction-Controlled Axial temperature distribution comparison with [9]
200
250
300
350
400
450
500
‐2 ‐1.5 ‐1 ‐0.5 0 0.5 1 1.5 2
Surface Temperature [K]
Distance from Quench Front [mm]
Comparison Between 2DCON Conduction Code and Numerical Thompson's AECL Calculation
Thompson AECLCalculation
2D ConductionControlled Code

4-4
Figure 4-3 Conduction-Controlled axial and radial Temperature Distribution

4-5
4.3 HALDEN TEST FACILITY
4.3.1 Test Facility Description
Three series of dryout experiments [48, 49, 50, and 51] with an Instrumented Fuel Assembly No. 613
(IFA-613) were conducted in Halden reactor in 1996 – 98. The objective of these dryout experiments was
to provide information on the consequences to the cladding material properties induced on fuel by short
term dryout. These dryout periods have characteristics similar to those anticipated to occur from all pump
trips in BWRs transients such that boiling transition would occur within the fuel bundle. The burnup
range zero (0) to 40 MWd/kgU was explored with emphasis on fuel at about 25 MWd/kgU.
Figure 4-4 Instrumentation Location and a Typical Axial Thermal Flux Distribution
The test loop used for IFA-613 enabled simulation of BWR conditions with light water with actual fuel rods with Zircaloy cladding, at high power, and at high pressure (around 7MPa). IFA-613 holds three fuel rods, each one in a separate channel shown in Figure 4-4. However, for the third series of dryout

4-6
experiments (IFA-613.4), only two channels, channel B and channel C, as shown in Figure 4-5 were used. Location of most of the instrumentation is shown in Figure 4-4 along with a typical axial thermal flux distribution.
Fresh fuel segment 613-7 was loaded in Channel C (right in Figure 4-5), whereas an irradiated fuel
segment N1310 together with a fresh fuel segment 613-8.1 (left in Figure 4-5) was loaded in Channel B.
The details of the fuel segments are shown in Figure 4-5.
Figure 4-5 Fresh and Irradiated Fuels for Dryout Tests
As seen in Figure 4-4, light water coolant entered the test section through the downcomer. The flow
transients could thus be implemented separately for each rod placed in a different channel. Since the fuel
rods were short (Figure 4-4), they were kept in position by the end supports and no spacer grids was used
within the individual flow channels.
The fresh fuel segment (613-7 loaded in channel C) had a design similar to the fresh fuel segment in the
first series. The irradiated segment (loaded in channel B) consisted of two sub-segments. The upper
segment (N1310) was a pre-irradiated (29 MWd/kgU) LWR segment. To give similar operating
conditions as for the fresh fuel rod, the irradiated segment was extended downwards with an additional
fresh segment (613-8.1) as seen in Figure 4-5.

4-7
The rig instrumentation consisted of:
i. four neutron detectors (three vanadium detectors and one cobalt detector)
ii. four inlet coolant thermocouples,
iii. two outlet coolant thermocouples,
iv. two outlet condenser thermocouples,
v. Four clad surface thermocouples, and
vi. two clad extensometers.
Location of most of the instrumentation is shown in Figure 4-4 along with a typical axial thermal flux
distribution. All fuel segments were equipped with two thermocouples each; the upper one situated
slightly below the top end of the active length of the fuel pellet column. For the fresh fuel rod, the lower
clad surface thermocouple was located about 1/3 of the total length from the bottom end of the fuel pellet
stack. To reach dryout condition, the reactor power, and thus also the linear heat generation rate (LHGR)
of the fuel rod, was kept constant while the flow rate in the considered channel was decreased such that
dryout occurred and was detected at the upper clad surface thermocouple. The idealized dryout event
during the experiment is depicted in Figure 4-6.
Figure 4-6 Schematic of the Dryout Sequence
Note that the above sequence is similar to that expected during an ATWS-I event (see description in
Section 1.3), i.e., flow reduction, boiling transition, heat up and then rewet as the flow is reestablished.
Four experiments (No. 4, 3, 12 and 11c) where the upper clad surface temperature recorded significant
dryout condition (temperature above 650°C) are simulated using COBRAG and COBRA2CON [48].
Experiments 4 and 3 used fresh fuel in Channel C and Experiments 12 and 11c used irradiated fuel in
Channel B. Test results as obtained from the FastScan data recording system are shown in Figure 4-7.
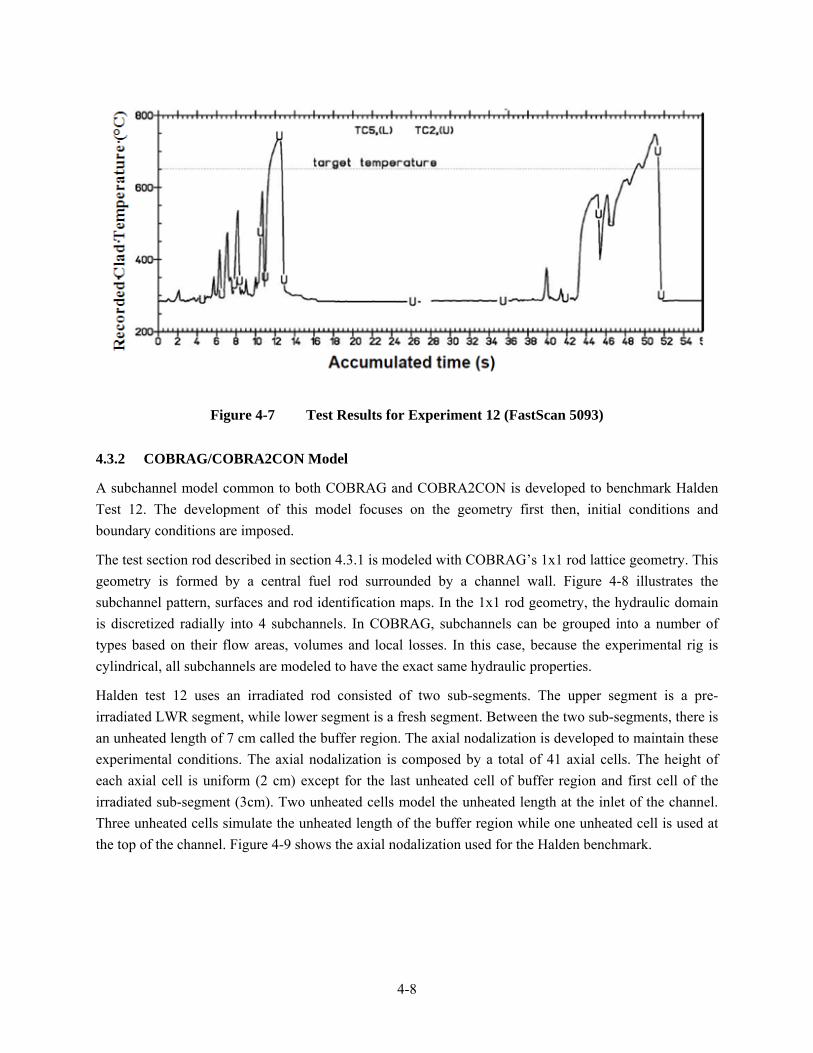
4-8
Figure 4-7 Test Results for Experiment 12 (FastScan 5093)
4.3.2 COBRAG/COBRA2CON Model
A subchannel model common to both COBRAG and COBRA2CON is developed to benchmark Halden
Test 12. The development of this model focuses on the geometry first then, initial conditions and
boundary conditions are imposed.
The test section rod described in section 4.3.1 is modeled with COBRAG’s 1x1 rod lattice geometry. This
geometry is formed by a central fuel rod surrounded by a channel wall. Figure 4-8 illustrates the
subchannel pattern, surfaces and rod identification maps. In the 1x1 rod geometry, the hydraulic domain
is discretized radially into 4 subchannels. In COBRAG, subchannels can be grouped into a number of
types based on their flow areas, volumes and local losses. In this case, because the experimental rig is
cylindrical, all subchannels are modeled to have the exact same hydraulic properties.
Halden test 12 uses an irradiated rod consisted of two sub-segments. The upper segment is a pre-
irradiated LWR segment, while lower segment is a fresh segment. Between the two sub-segments, there is
an unheated length of 7 cm called the buffer region. The axial nodalization is developed to maintain these
experimental conditions. The axial nodalization is composed by a total of 41 axial cells. The height of
each axial cell is uniform (2 cm) except for the last unheated cell of buffer region and first cell of the
irradiated sub-segment (3cm). Two unheated cells model the unheated length at the inlet of the channel.
Three unheated cells simulate the unheated length of the buffer region while one unheated cell is used at
the top of the channel. Figure 4-9 shows the axial nodalization used for the Halden benchmark.

4-9
a) b)
c)
a) Lattice Subchannel Pattern
b) Lattice Subchannel and Gap Identification Map
c) Lattice Surface and Rod Identification Map
Figure 4-8 1x1 Rod Lattice COBRAG/COBRA2CON Geometry
The channel wall is connected to a hydraulic subchannel on the inner surface. An example of the channel
wall surface connections is displayed in Figure 4-8. As an example the channel wall inner surface 5 is
connected to hydraulic subchannel 1. The outer channel wall surface is set to be an adiabatic boundary
condition. The channel wall temperature is set to match the experimental conditions. The rod power is
specified by setting the rod total power and specifying the axial power shape.
The inlet flow is modeled in COBRAG/COBRA2CON by applying a velocity boundary condition. The
channel outlet is modeled as a pressure boundary. The pressure for each test is set to be the approximate
value documented in Reference 48. Saturated vapor conditions are modeled at the outlet for the void
fraction and temperature.
The inlet pressure boundary condition is specified to be equal to the exit boundary condition. This permits
the code to specify an initial guess for the pressure distribution within the channel. The pressure is then
re-calculated by the code based on the loss coefficients except at the pressure boundary. Inlet temperature
and velocity conditions are extracted from Reference 48, Figures A12 & B12a for Experiment 12. Time
dependent mass flux and inlet liquid temperature boundary conditions are specified as time dependent
quantities in COBRAG/COBRA2CON. Hence, six time-dependent inlet boundary conditions are
specified:
1. Liquid velocity (m/sec) is converted from mass flux flow (kg/m2/s) from Figure 4-6.
2. Vapor velocity (m/sec) is set to be equal or approximately equal to the liquid mass flux. Because
the injected coolant is subcooled liquid, the values provided for the vapor are not important and
can be set equal to the liquid mass flux.
3. Inlet and outlet pressures are both set to 7MPa to match the outlet pressure boundary condition of
the experiment.
4. The inlet liquid temperature is converted in Kelvin from inlet flow temperatures (ºC) from the
figures referenced above.

4-10
5. Vapor temperature (K) is set to a constant 559.0 K. Because the injected coolant is subcooled
liquid, the values provided for the vapor are not important and can be set equal to the saturation
temperature.
6. Inlet void Fraction is set to constant 0.0 since only liquid is injected.
Figure 4-9 Channel B: Tests 12: Model Nodalization
For test 12, the on/off valve in the high flow branch was not completely closed, and there were some uncertainties in the flow rate even when the valve is indicated closed. The intrinsic flow rate uncertainty from the high-flow line is not known and cannot be accounted for in the calculations. The high-flow line mass flux is estimated by iterating on the bundle inlet flow in the line until the cladding temperature matches the test data. Test 12 is the test that generates the highest PCT and consequently permits to draw

4-11
differences between COBRAG and COBRA2CON. The results of Halden Test 12 benchmark is discussed in Section 5.1.
4.4 ROD BUNDLE HEAT TRANSFER (RBHT) TEST FACILITY
4.4.1 Test Facility Description
The Rod Bundle Heat Transfer (RBHT) Test Facility is designed to conduct separate-effects tests under controlled conditions in order to generate fundamental rod bundle heat transfer data from single phase steam cooling tests, low flow boiling tests, steam flow tests with and without injected droplets, inverted annular film boiling tests, and dispersed flow film boiling heat transfer tests. The facility is capable of operating in both forced and variable reflood modes covering wide ranges of flow and heat transfer conditions at pressures ranging from 0.134 to 0.402 MPa [56]. The various components of the RBHT Test Facility are described in References 54, 55 and 56 and are not repeated here unless it contains any relevant information related to the development of the models for this study.
The test section consists of the heated rod bundle, flow housing, and the lower and upper plenums, per References 54 through 56. The electrically powered heater rods arrangement is shown in Figure 4-10. The bundle has 45 heater rods and 4 unheated corner rods. The support rods, which are at the bundle corners, are made from Inconel 600 tubing having a diameter 9.525 mm, a wall thickness of 2.108 mm, and a total length of 3.96 m. The heater rods are single ended and consist of a Monel 500 electrical resistance heating element surrounded by hot pressed boron nitride (BN) insulation and enclosed in a Inconel 600 cladding. Rods marked with an “I” in are instrumented with eight 0.508 mm diameter ungrounded thermocouples attached to the inside surface of the Inconel clad at various locations. Rods marked with a “U” are not instrumented. These rods have a 3.66 m heated length with a skewed axial power profile, as shown in Figure 4-13, with the peak power located at the 2.74 m elevation. The rod-to-rod power is uniform, i.e. all heated rods have the same power. There is no radial rod power variation. The axial power distribution is characterized by a maximum-to-average power ratio (Pmax/Pavg) is 1.5 at the peak power location and 0.5 at both ends of the heated length. The bundle has a uniform radial power distribution and therefore all radial peaking factors are set to 1.
The development of both COBRAG and COBRA2CON models of the RBHT facility is outlined in the following Section.

4-12
Figure 4-10 RBHT Rod Bundle Cross Section View [56]
4.4.2 COBRAG/COBRA2CON Model
A subchannel model common to both COBRAG and COBRA2CON is developed to benchmark RBHT test 1383. The development of the model for RBHT follows the same approach than that of Halden. The development of this model focuses on the geometry first then, initial conditions and boundary conditions are imposed. The RBHT facility has several components providing inlet and outlet conditions to the test section. Because these components simply provide boundary conditions to the channel, only the test section is modeled with COBRAG and COBRA2CON simplifying the numerical model of the test facility.
The test section consists of a lower plenum, a low-mass housing containing the heater rod bundle, and upper plenum. The channel model developed for the subchannel analysis consists of a total of 31 axial cells. Of these 31 cells, 3 are unheated cells to model the lower and upper plena. The rest of the 28 axial cells are heated (for the RBHT rods that are powered). Figure 4-12 shows the axial nodalization used for the RBHT benchmark.

4-13
a) Lattice Subchannel Pattern
b) Lattice Subchannel and Gap Identification Map

4-14
c) Lattice Surface and Rod Identification Map
Figure 4-11 7x7 Rod Lattice COBRAG/COBRA2CON Geometry
To model the test section rod described in Figure 4-10, a 7x7 rod lattice geometry is developed. This
specific geometry pattern was not available in COBRAG and had to be generated. The lattice subchannel
pattern modeled with COBRAG is formed by a 49 fuel rods surrounded by a channel wall. Figure 4-11
illustrates the subchannel pattern, surfaces and rod identification maps. In the 7x7 rod geometry, the
hydraulic domain is discretized radially into 64 subchannels. In COBRAG, subchannels can be grouped
into a number of types based on their flow areas, volumes and local losses. In this case, the subchannels
are grouped into 4 groups based on their location within the bundle. Figure 4-12 shows the subchannel
grouping. The subchannels in Figure 4-12 in red represent the corner subchannels. These channels only
contain a quarter of a rod as well as the corner channel wall. The subchannels in green are the
subchannels right next to the corner channels. These channels contain two quarters of the two rods within
the subchannel. The subchannels in Figure 4-12 in orange are similar to the green channels and represent
the hydraulic domain. These channels contain two quarter of the two rods in this subchannel. The
subchannels in grey are the central subchannels. These channels have all four quarters of the four rods
within the subchannel.
The 49 rods in the simulated 7x7 bundle are individually modelled to account for the radial mixing and temperature distribution within the bundle as shown in Figure 4-12. The axial power distribution shown in Figure 4-13 is the same for each heated rod. Both COBRAG and COBRA2CON are modified to incorporate the film surface, rod and subchannel mapping of the RBHT experimental rig which enables the codes to locate each rod within the bundle and calculate the properties of the film and gaps for that subchannel.
The inner surface channel wall connections to each hydraulic subchannel are developed along with the
lattice pattern for the 7x7 bundle. An example of the channel wall surface connections is displayed in
Figure 4-11. The outer channel wall surface is set to be an adiabatic boundary condition. The channel wall
temperature is set to match the experimental conditions. The total bundle power is distributed uniformly

4-15
across the powered rods. The radial peaking factor for each rod is input along with the axial power shape
shown in Figure 4-13.
Table 4-2 RBHT Test 1383 Experimental Conditions
Experiment Pressure
[MPa]
Inlet
Flooding
[kg/m2/s]
Peak
Power
[kW/m]
Initial Peak
Clad
Temperature
[K]
Inlet
Subcooling
[K]
1383 0.3 23.8 1.31 1033.0 11.0
Two different sets of boundary conditions are used for this benchmark. The first boundary conditions set
is used to initialize the rod surface temperatures to match the initial conditions of the RBHT 1383 test ().
The heat-up phase utilizes a pure steam environment within the bundle and a total bundle power 10 times
higher than the bundle power in the experiment. These conditions are set in order to maximize the
increase in temperature of the cladding to match the experimental conditions. The second boundary
conditions set is used to reproduce the experimental conditions of the RBHT 1383 test (Table 4-2). In
both cases, the inlet flow is modeled in COBRAG/COBRA2CON by applying a velocity boundary
condition. The channel outlet is modeled as a pressure boundary. The pressure for each test is set to be the
approximate value documented in Reference 56. Saturated vapor conditions are modeled at the outlet for
the void fraction and temperature for both the heat-up and the reflood phases.
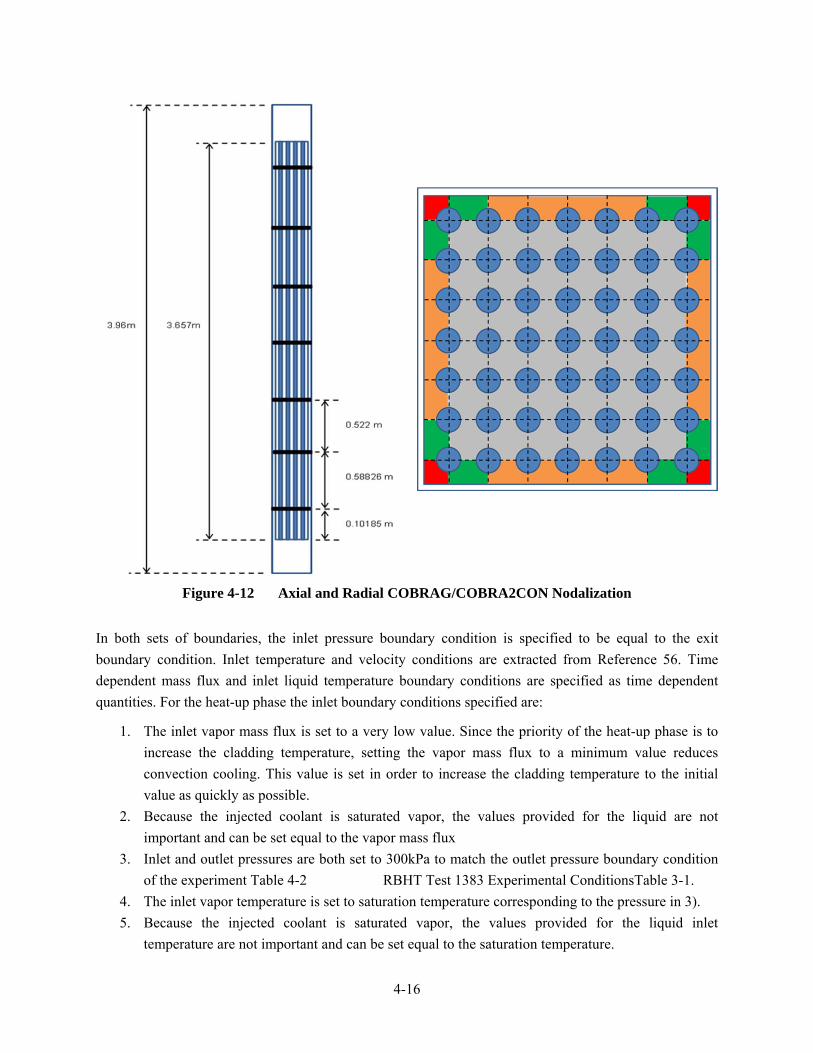
4-16
Figure 4-12 Axial and Radial COBRAG/COBRA2CON Nodalization
In both sets of boundaries, the inlet pressure boundary condition is specified to be equal to the exit
boundary condition. Inlet temperature and velocity conditions are extracted from Reference 56. Time
dependent mass flux and inlet liquid temperature boundary conditions are specified as time dependent
quantities. For the heat-up phase the inlet boundary conditions specified are:
1. The inlet vapor mass flux is set to a very low value. Since the priority of the heat-up phase is to
increase the cladding temperature, setting the vapor mass flux to a minimum value reduces
convection cooling. This value is set in order to increase the cladding temperature to the initial
value as quickly as possible.
2. Because the injected coolant is saturated vapor, the values provided for the liquid are not
important and can be set equal to the vapor mass flux
3. Inlet and outlet pressures are both set to 300kPa to match the outlet pressure boundary condition
of the experiment Table 4-2 RBHT Test 1383 Experimental ConditionsTable 3-1.
4. The inlet vapor temperature is set to saturation temperature corresponding to the pressure in 3).
5. Because the injected coolant is saturated vapor, the values provided for the liquid inlet
temperature are not important and can be set equal to the saturation temperature.

4-17
6. Inlet void Fraction is set to constant 1.0 since only vapor is injected.
For the reflood phase the inlet boundary conditions specified are:
7. The liquid mass flux is specified to match the reflood boundary condition of the experiment in
Table 4-2
8. Vapor mass flux is set to be equal or approximately equal to the liquid mass flux. Because the
injected coolant is subcooled liquid, the values provided for the vapor are not important and can
be set equal to the liquid mass flux.
9. Inlet and outlet pressures are both set to 300kPa to match the outlet pressure boundary condition
of the experiment in Table 3-1.
10. The inlet liquid temperature is set to match the inlet subcooling from the experiment in Table 4-2.
11. The inlet vapor temperature is set to saturation temperature corresponding to the pressure in 3).
Because the injected coolant is subcooled liquid, the values provided for the vapor are not
important and can be set equal to the saturation temperature.
12. Inlet void Fraction is set to constant 0.0 since only liquid is injected.
Figure 4-13 Axial Power Profile of the Heater Rod recreated based on [56].
During the RBHT benchmark, convergence problems were identified in COBRAG and COBRA2CON. The experimental conditions of test 1383 were modified to generate representative sensitivity cases. The sensitivity runs and the modified conditions of the est 1383 of the RBHT benchmark are discussed in Section 5.2

4-0
4.5 QUENCHING EXPERIMENT SUMMARY
One verification calculation and a series of 2 benchmarks were considered to test the codes 2DCON, COBRAG and COBRA2CON.
Before conducting the COBRA2CON code benchmark again experimental data, the 2D Conduction Controlled module 2DCON was checked against Thompson’s 2D conduction numerical calculations [9]. The comparison between the 2D Conduction Controlled module 2DCON and the numerical calculations of Thompson demonstrated that 2DCON captured the temperature distribution at the quench front properly. The boundary conditions and the non-uniform nodalization were properly implemented.
The first part of the code benchmark consisted in the comparison between COBRAG and COBRA2CON with the 1 rod reflood Halden experimental data. The Halden experiment was chosen because of its application to ATWS-I and the simplicity of the geometry. The single rod allows the testing of the COBRA2CON re-nodalization scheme and the 2D Conduction Controlled Lagrangian-Eulerian coupling.
The second and last part of the code testing performed is the comparison between COBRAG and COBRA2CON with the 7x7 bundle model of the RBHT experimental facility. The 7x7 bundle geometry of the experimental rig was modeled with both COBRAG and COBRA2CON. The test was performed to probe the capability of COBRA2CON to model several fronts simultaneously for a multi-rod geometry. The RBHT rig was chosen for its similarity with a BWR bundle. The comparison between COBRAG and COBRA2CON was performed at high pressure high reflood rates. The multiple rod geometry allowed the testing of the COBRA2CON re-nodalization scheme and the 2D Conduction Controlled Lagrangian-Eulerian coupling simultaneously for multiple rods.
5-7
5. BENCHMARK RESULTS AND SENSITIVITIES
The benchmark cases outlined in Chapter 4 (Halden and RBHT) were modeled with COBRAG and COBRA2CON. The main difference between the two codes is the activation of the dynamic nodalization and the 2D Conduction-Controlled quenching modules for COBRA2CON. Hence, both COBRAG and COBRA2CON are expected to have similar responses (e.g. steady-state and heat up) except during the reflooding phase.
First, the COBRAG/COBRA2CON Halden benchmark results will be examined and the impact of the 2D conduction controlled quench front model quantified.
Second, the COBRAG/COBRA2CON RBHT reflood benchmark results are reviewed. To determine the range of application of the COBRA2CON code, sensitivities in system pressure and reflood velocities are performed. These sensitivity runs are performed to show that for specific conditions, the COBRA2CON code models reasonably well phenomenological behaviors representative of ATWS-I. Additionally, time step sensitivities are conducted to determine the impact of the time step on the numerical solution.
The benchmarks analyzed in the present section examine the predictive capabilities of the three-field transient analysis code COBRA2CON during quenching conditions for a BWR plant at ATWS-I conditions.
5.1 HALDEN BENCHMARK
The Halden experiments were conducted specifically for ATWS-I conditions. The system pressure was maintained throughout the transient at a typical BWR pressure of 7 MPa. The rod power was maintained at the same power levels as during the steady-state conditions. The single rod rig was subjected to high reflood rates as described in Section 4.3. Test 12 in Reference 48 is modeled with COBRAG and COBRA2CON. Test 12 is chosen to be a representative case because of the higher heatup of the rod. Because of the higher rod heat up, the rod surface temperature is highly likely to exceed the minimum film boiling temperature. Consequently, the benefits of the 2D conduction controlled model can be determined. The results presented in Sections below show the differences in calculated PCT between COBRAG and COBRA2CON.
5.1.1 Test 12 Results
The Halden test 12 experimental conditions are simulated with COBRAG and COBRA2CON. The thermal-hydraulic boundary conditions are identical between the two codes. For COBA2CON, the 2D Conduction-Controlled module and the dynamic re-nodalization are activated through a flag in the input file.
Figure 5-1 provides the fuel cladding temperature comparison between the experimental data, COBRAG and COBRA2CON. The black curve in Figure 5-1 represents the cladding temperature as a function of time. This plot corresponds to the temperature data measured by thermo-couple at the top of the bundle (See Section 4.3 for details on the experimental procedure). The green curve in Figure 5-1 shows the COBRAG calculated surface temperature, while the red curve corresponds to the clad surface temperature computed by COBRA2CON. The temperatures calculated by the subchannel codes are extracted from each respective output for the axial node corresponding to the experimental thermo-couple elevation. In both codes, the thermos-couple elevation corresponds to axial cell 38.

5-8
For Halden test 12, the on/off valve in the high flow branch was not completely closed, and there were some uncertainties in the flow rate. The fluctuations observed in the measured cladding temperature in Figure 5-1 are the direct consequence of this flow uncertainty. Even though the inlet mass flux is not exactly known, the cladding temperature, for both COBRAG and COBRA2CON, during the heat-up period follows closely the temperature trend of the experiment. Hence, the approximation of the inlet mass flux used as input in the numerical simulation is considered adequate and matches the overall behavior of the experimental temperature data.
Figure 5-2 shows the comparison of the fuel cladding temperature in parallel with the minimum film boiling temperature (Tmin) between COBRAG and COBRA2CON. The green curve in Figure 5-2 shows the calculated surface temperature by COBRAG, while the red curve corresponds to the clad surface temperature computed by COBRA2CON. The light green curve outlines the time dependent behavior of the minimum film boiling temperature calculated in cell 38 by COBRAG. The blue curve represents the Tmin value calculated by COBRA2CON in cell 38.
Figure 5-3 shows the fraction of each of the three fields as calculated by COBRA2CON as a function of time. These field fractions are plotted against the COBRA2CON calculated cladding temperature. Experimental data corresponding to void, droplet and film fractions was not measured. Because there is no data on these quantities, the analysis of these values is reduced to a qualitative discussion.
As expected, COBRAG and COBRA2CON calculate the temperature increase during the heatup identically. As the inlet mass flux is reduced (see Figure 4-6), the heat transfer from the cladding transitions from nucleate boiling to transition boiling and; finally, the film boiling regime is established once the rod is dried out. This sequence is determined in COBRAG/COBRA2CON by the boiling curve logic that was implemented into the subchannel codes. Correlations for nucleate boiling heat transfer, transition boiling and film boiling are the same between the two codes. Since this logic and correlations are used to model the heat-up, both codes calculate the same temperature increase. This heat-up behavior is consistent with the experimental data.
During the heat-up sequence, the cladding temperature increases beyond the minimum film boiling temperature and a film boiling regime is established. This is supported by the comparison in Figure 5-2 between the cladding temperature and Tmin for both COBRAG and COBRA2CON. While in film boiling, heat transfer from the cladding to the fluid is very limited (see Section 2.2.5). Once the reflood initiates, the cladding temperature reduces initially for both codes. This is likely due to the temporary increase in convective cooling that result from the reflood initialization.
Despite the initial drop in the cladding temperature, the temperature calculated by COBRAG remains high for the rest of the transient. The behavior of the cladding temperature for COBRAG results can be explained by two parameters: minimum film boiling temperature and power generation. As described in Section 4.3, the Halden benchmark was conducted with constant power generation. The rod power is the same before and after the dryout sequence. When the dryout sequence is initiated, the loss of inventory drastically reduces the heat transfer between the rod and the fluid. Because the cladding temperature is higher than Tmin, neither liquid droplets nor any film are able make contact with the heated surface. The film boiling heat transfer regime between the hot surface and the fluid is maintained. Consequently, the heat transfer from the cladding to the vapor phase is not sufficient to remove the heat generated by the rod. The cladding temperature remains high throughout the rest of the transient and the rod never rewets.

5-9
In COBRA2CON, when the dryout sequence is initiated, the heat transfer from the cladding to the fluid drops drastically similar to the COBRAG case. The film boiling heat transfer regime between the hot surface and the fluid is maintained for some time, and the heat exchange between the vapor phase and the cladding is not high enough to remove the heat generated by the rod. Unlike COBRAG, however, COBRA2CON has the capability to simulate the 2-Dimensional conduction within the rod and utilize the calculated values to refine the heat transfer from the cladding to the coolant. COBRA2CON is therefore capable of modeling the local heat diffusion from the hotter to the cooler regions within the rods and quantify its impact. The COBRA2CON results in Figure 5-2 show that, when the quench model is activated, the surface temperature continues to drop beyond the initial drop seen in both cases. Film boiling heat transfer regime remains the mode of heat transfer. However, the additional heat transfer occurring within the rod [17] is effective in reducing the clad temperature regardless of the Tmin value. Conduction within the rod is sufficient to eventually reduce the cladding temperature below the minimum film boiling temperature and the rod quenches. This shows the importance of using the COBRA2CON quench model which predicts the experimental data very well
Figure 5-3 shows mass balance of the three fields as calculated by COBRA2CON as a function of time. These plots demonstrate that COBRA2CON is able to capture the phenomena at play during quenching. The plot on the top left outlines the progression of the void fraction and it is compared with the surface temperature. When the dryout sequence is initiated, liquid inventory within the rod is lost. As a result, the void fraction increases to reach approximately 0.95 void fraction. The transition from nucleate boiling to transition boiling and finally film boiling can be seen in the film and droplet fraction plots. While in nucleate boiling, the continuous liquid is modeled as droplets by COBRA2CON. During the heat-up phase, as transition boiling is reached, COBRA2CON differentiates between droplets and film. Consequently, the liquid film fraction increases while the droplet fraction decreases. When the rod dries out, the film boiling regime is established. The droplet and liquid fractions on the surface of the rod disappear. During the reflood phase, the temperature drops rapidly as described previously. A film is established on the cladding surface and the 2DCON logic calculates the heat transfer above and below the quench front. The film is rapidly replaced by continuous liquid (droplets) and the transition from film boiling to nucleate boiling is immediate. The rod is quenched.
The results of the Halden benchmark show that the quench model is effective in reducing the clad temperature regardless of the Tmin value. When the quench model is turned off (COBRAG), the cladding temperature remains high and the rod never cools down. This benchmark shows that use of the COBRA2CON quench model is needed for a reasonable agreement with test data.

5-8
Figure 5-1 Comparison of the PCT between COBRAG, COBRA2CON and the Halden Thermocouple Data
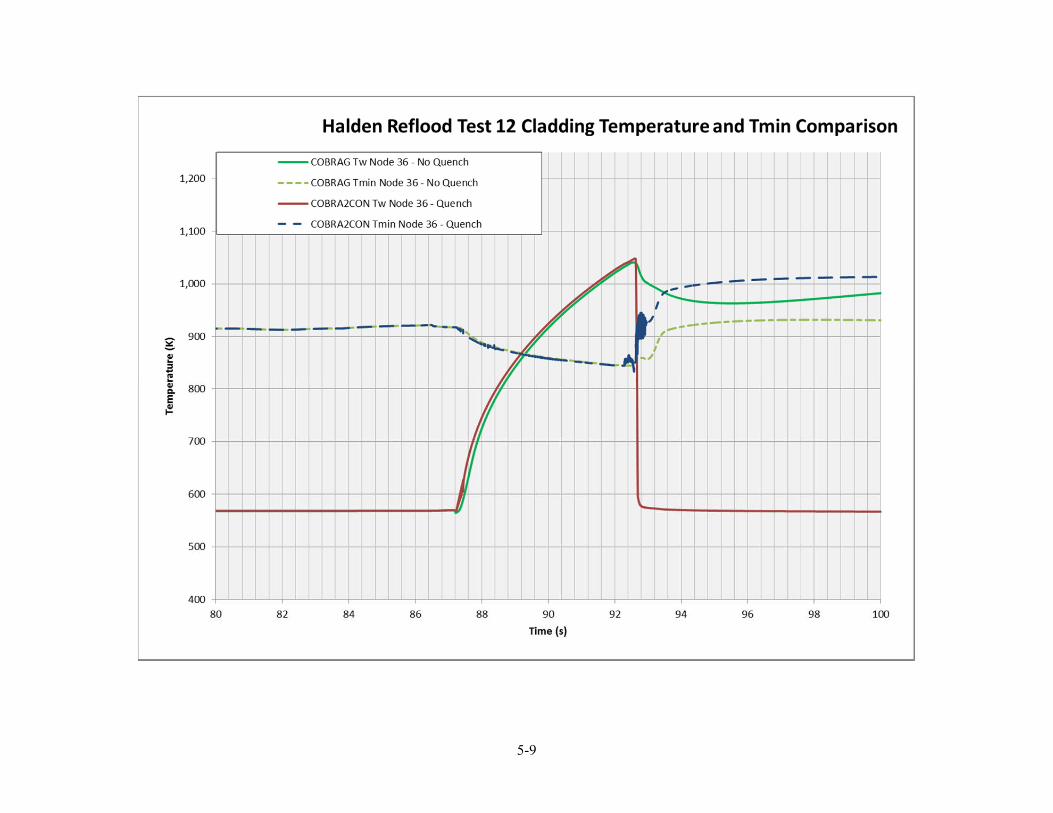
5-9

5-10
Figure 5-2 Comparison of the PCT and Tmin values between COBRAG and COBRA2CON

5-11
Figure 5-3 Comparison of the Three Field (Droplet and Film Data) for COBRA2CON

5-12
5.1.2 Summary and Conclusions
The Halden test 12 experimental conditions were simulated with COBRAG and COBRA2CON. This benchmark was conducted to provide a validation basis of the COBRA2CON quench front heat transfer model. The benchmarks were performed with actual fuel rods with Zircaloy cladding, at high power, and at high pressure (around 7 MPa).
Figure 5-1 shows clearly that the rewetting of the rod is modelled properly with COBRA2CON. The timing of the rewet between the experiment and the code (1 sec.) is likely due to the uncertainty in the inlet coolant flow boundary condition. COBRA2CON matches the experiment adequately.
A more detailed look at the surface temperatures and Tmin show that the difference between the two codes comes from an initial temperature drop larger for COBRA2CON than in of COBRAG. This drop in temperature allows the wall temperature to drop below Tmin and the rod surface can rewet. After rewetting, the wall temperature drops back to Tsat. The rod is quenched. Without the quenching model, COBRAG experiences an initial drop in temperature likely due to the temporary increase in convective cooling resulting from the reflood initialization. The cladding temperature remains high throughout the rest of the transient and the rod never quenches unlike the experiment.
Furthermore, a detailed analysis of the mass balance and the COBRA2CON behavior demonstrated qualitatively the code is able to capture the phenomena at play during quenching.
The results of the Halden benchmark show that the quench model is effective in reducing the clad temperature regardless of the Tmin value. When the quench model is turned off (COBRAG), the cladding temperature remains high and the rod never cools down. This benchmark shows that use of the COBRA2CON quench model is needed for a reasonable agreement with test data.
The results of this testing demonstrated that the heatup and cladding temperatures were well predicted despite uncertainty in the experimental flood rate. The cladding temperature sharp decrease experienced during the quenching was well captured with COBRA2CON. The differences between COBRAG and COBRA2CON explicitly demonstrate that the 2D-Conduction Controlled code and the modifications of the original three-field code are capable of capturing the propagation of the quench front and the corresponding temperature profile. This benchmark however, is limited to a single rod. Hence, the effect of multiple rods quenching simultaneously was not shown with this study. To model this aspect of the COBRA2CON 2D Conduction module, the full bundle reflood benchmark RBHT is considered.

5-13
5.2 RBHT BENCHMARK AND SENSITIVITIES RUNS
During the RBHT benchmark, convergence problems were identified in COBRAG and COBRA2CON. These convergence problems were characterized by a divergent behavior between two consecutive iterations in the COBRAG/COBRA2CON predictor step. The Pressure and Vapor Temperature residuals fail to converge. Pressure and enthalpy (based on vapor and liquid temperature) are used to calculate the water properties, hence, the divergent behavior of these two quantities leads to mass and energy imbalances in two of the LOCA condition benchmarks. A close examination of both COBRAG and COBRA2CON source codes and a systemic debugging of the low pressure benchmark cases were conducted. It was determined that values of the newly calculated variables exceeded the defined upper or lower bounds on pressure, enthalpy, void fraction and liquid volumetric fractions which resulted in the COBRAG/COBRA2CON divergence issues. However, the cause for these variables to exceed the defined upper and lower bounds could not be determined.
The experimental conditions of test 1383 were modified to generate representative sensitivity cases. The goal of these sensitivity cases is to demonstrate the impact of the 2D Conduction Controlled quenching model. Among the parameters provided above, pressure and mass fluxes are considered for the sensitivity studies.
5.2.1 Pressure and Mass Flux Sensitivity Calculations
To determine where the convergence problems would appear in the COBRAG and COBRA2CON codes, several sensitivity cases based on the RBHT test 1383 were conducted.
The subchannel nodalization and geometry were maintained consistent with the RBHT geometry. Only boundary conditions were modified. Previous experimental studies found that the rewetting velocity was nearly constant with time, but that it was a function of surface temperature, coolant temperature, coolant flow rate and pressure [10]. Pressure and coolant flow rate were therefore explored. Two extreme values in pressure and mass fluxes were considered for the sensitivity analyses. The lower end of the pressure range was based on the pressure conditions of the RBHT test 1383. This pressure is 300 kPa. The higher end of the pressure range was based on a typical BWR pressure for normal operation. This pressure is 7 MPa. BWR normal operation pressure was considered for ATWS-I purposes. Four pressure values are considered between these lower and upper limits: 3MPa, 1MPa, 750 kPa and 500 kPa.
The lower end of the mass flux range was based on the reflood conditions of the RBHT test 1383. The reflood mass flux in test 1383 is pressure is 23.8kg/m2/s. The higher end of the pressure range was based on a typical BWR bundle mass flux for normal operation. This pressure is 458.0kg/m2/s. BWR normal operation pressure was considered for ATWS-I purposes.
The results of these sensitivities are shown in Table 5-1.

5-14
Table 5-1 Sensitivity Analyses with Modified RBHT Test 1383 Values for Pressure and Mass Flux
Case Pressure
[kPa]
Mflux
[kg/m2/s]
COBRAG
Failure
COBRA2CON
Failure
1 7000 458.0 Converged Converged
2 3000 458.0 Converged Converged
3 1000 458.0 Converged Converged
4 750 458.0 Vapor Temperature
Convergence Problems Converged
5 500 458.0 Vapor Temperature
Convergence Problems Vapor Temperature Rate of Change
6 300 458.0 Vapor Temperature
Convergence Problems
Thermodynamic Properties
Exceeded
7 7000 23.8 Vapor Temperature
Convergence Problems Converged
8 3000 23.8 Converged Converged
9 1000 23.8 Converged Converged
10 750 23.8 Converged Converged
11 500 23.8 Converged Converged
12 300 23.8 Vapor Temperature
Convergence Problems
Thermodynamic Properties
Exceeded
13 7000 100 Vapor Temperature
Convergence Problems Converged
14 3000 100 Vapor Temperature
Convergence Problems
Vapor Temperature Convergence
Problems

5-15
15 1000 100 Vapor Temperature
Convergence Problems
Vapor Temperature Convergence
Problems
16 750 100 Vapor Temperature
Convergence Problems
Vapor Temperature Convergence
Problems
17 500 100 Converged Converged
18 300 100 Converged Vapor Temperature Convergence
Problems
Sensitivity analyses permitted to conclude that the convergence problem is more pronounced at low pressures and low mass fluxes. From the conclusion of these extensive sensitivity calculations, the experimental conditions of test 1383 repeated in Table 5-2 were modified to generate representative sensitivity cases. The goal of these sensitivity cases is to demonstrate the impact of the 2D Conduction Controlled quenching model. Pressure is considered for the sensitivity studies. It was demonstrated that the convergence behavior in COBRAG/COBRA2CON is directly linked to the pressure residual behavior. System pressure is a significant parameter that impacts rewetting rates and quenching behavior. Fluid properties such as vapor, droplet temperature and minimum film boiling temperature (Tmin) depend directly on pressure. The higher pressure value was chosen to correspond to the operational pressure of a typical BWR. The table below provides the cases that converged and the converging representative cases outlined in Table 5-2will be discussed in the following sections.
Table 5-2 Modified RBHT Test 1383 Pressure Sensitivity Analyses
Experiment Pressure
[MPa]
Inlet
Flooding
[kg/m2/s]
Peak
Power
[kW/m]
Initial Peak
Clad
Temperature
[K]
Inlet
Subcooling
[K]
1383 0.3 23.8 1.31 1033.0 11.0
Case Number Pressure
[MPa]
Inlet
Flooding
[kg/m2/s]
Peak
Power
[kW/m]
Initial Peak
Clad
Temperature
[K]
Inlet
Subcooling
[K]
1 7 458.0 1.31 1300.0 11.0
2 3 458.0 1.31 1300.0 11.0
3 1 458.0 1.31 1300.0 11.0

5-16
5.2.2 System Pressure Sensitivity Results
The RBHT test 1383 experimental conditions were modified to palliate the convergence problems of COBRAG and COBRA2CON. Two of the sensitivity cases discussed in Table 5-2 are discussed below. The thermal-hydraulic boundary conditions are identical between the two codes. For COBA2CON, the 2D Conduction Controlled module and the dynamic re-nodalization are activated through a flag in the input file.
5.2.2.1 System Pressure 7 MPa
Figure 5-4 provides the cladding temperature comparison between COBRAG and COBRA2CON as a function of time. It also shows the comparison in void fraction as a function of time between the two codes. Both void fraction and cladding temperature are plotted for a central subchannel at an axial elevation close to the mid-elevation of the total bundle length. In the present comparison the mid-elevation corresponds to axial cell 15. Because there is no water rod at the center of the bundle, central rods are expected to yield the highest rod surface temperatures. Additionally, even though the radial power distribution is uniform, rod surface temperatures are not impacted by the much colder channel wall at the center of the bundle. The continuous blue curve in Figure 5-4 represents the cladding temperature as a function of time in subchannel 28 as calculated by COBRAG. The blue dotted line shows the time behavior of the void fraction at the same location calculated by the same code. The red curve in Figure 5-4 shows the cladding temperature as a function of time in subchannel 28 as calculated by COBRA2CON, while the dotted red curve corresponds to the void fraction at the same location.
Figure 5-5 shows a comparison of the axial distribution of the average pressure, droplet, vapor and film fields between COBRAG and COBRA2CON. All quantities displayed in Figure 5-5 are plotted at time t=20 seconds. This corresponds to the time in Figure 5-4 at which the clad temperature rapidly decreases. The variables are plotted for the central subchannel 28.
The continuous dark blue curve in Figure 5-5 corresponds to the subchannel average pressure as calculated by COBRA2CON. The dotted curve of the same color represents the same variable (average Pressure) as calculated by COBRAG. The continuous red curve in Figure 5-5 corresponds to the subchannel axial void fraction as calculated by COBRA2CON. The dotted curve of the same color represents the same variable (axial void fraction) as calculated by COBRAG. The continuous green curve in Figure 5-5 corresponds to the subchannel droplet fraction as calculated by COBRA2CON. The dotted curve of the same color represents the same variable (droplet fraction) as calculated by COBRAG. The continuous purple curve in Figure 5-5 corresponds to the film fraction on one of the cladding surfaces as calculated by COBRA2CON. The dotted curve of the same color represents the same variable (Film fraction on subchannel surface 1) as calculated by COBRAG. The light blue curve in Figure 5-5 corresponds to the film fraction on one of the other cladding surfaces within the subchannel as calculated by COBRA2CON. The dotted curve of the same color represents the same variable (Film fraction on subchannel surface 5) as calculated by COBRAG.
Figure 5-6 shows a comparison of the axial distribution of the cladding temperature for one representative surface within subchannel 28 between COBRAG and COBRA2CON. This figure displays the total heat transfer from the representative surface to the liquid. All quantities in Figure 5-6 are plotted at time t=20 seconds. This corresponds to the time in Figure 5-4 at which the clad temperature rapidly decreases.
5-17
The continuous green curve in Figure 5-6 corresponds to the cladding temperature for the representative surface in subchannel 28 as calculated by COBRAG. The dotted curve of the same color represents the total heat transfer as calculated by COBRAG. The continuous red curve in Figure 5-5 corresponds to the cladding temperature for the representative surface in subchannel 28 as calculated by COBRA2CON. The dotted curve of the same color represents the total heat transfer as calculated by COBRA2CON.
Prior to the injection of subcooled liquid at 15 seconds, the case is initialized. The void fraction within the
bundle is close to 1.0 and steam is the only fluid present. At time t=15 seconds, the case initialization is
stopped and the reflood transient is initiated. In addition to the injection of subcooled water at the bottom
of the bundle, the total bundle power is reduced to simulate power levels consistent with decay heat.
Immediately following the initiation of the reflood, the rod temperature continues to increase due to
thermal inertia. Despite the initial increase in the cladding temperature, the temperature calculated by both
codes decreases rapidly for the rest of the transient. This behavior can be explained by the combination of
the power reduction at the initialization of the reflood and the high system pressure.
The effects of convective steam cooling are increased because the rod power is significantly reduced. This
is shown in Figure 5-4 where the local void fraction remains at 1.0 until 9 seconds after the initialization
of the water injection (24 seconds on the plot). During this time, the cladding temperature is reduced by
about 300K. Because of the high system pressure, both the saturation temperature and the Tmin value are
high (see section 3.2). The combination of steam cooling and the high values of TSAT and Tmin results in
the rapid cooling of the cladding below the minimum stable film boiling temperature. Consequently,
droplets and film can make contact with the heated surface rapidly and the cladding temperature drops to
the saturation temperature.
Figure 5-5 shows that, at 20 seconds, the representative rod in subchannel 28 has rewetted up to cell 7.
Both COBRAG and COBRA2CON display similar behaviors. Above node 11, the cladding surface is
subject to film boiling heat transfer: neither a film nor droplets are present in sufficient fraction to suggest
rewetting. The cladding temperature remains high and the heat transfer from the cladding to the coolant is
negligible. This phenomenon is outlined in Figure 5-6.
Between cells 7 and 11, the cladding surface is subject to transition boiling heat transfer. A film is
established in both calculations. Both film and droplets are present in this region. Additionally, the
cladding temperature has decreased significantly. Heat transfer from the cladding to the coolant is high, as
shown in Figure 5-6, thus confirming rewetting. The difference in heat transfer between COBRAG and
COBRA2CON is directly related to the 2DCON module. The feedback from the quenching model to the
thermal-hydraulics of the subchannel code results in higher heat transfer from the rod to the coolant.
Below cells 7, the cladding surface is subject nucleate boiling heat transfer. The rod is surrounded by
continuous liquid (characterized by the higher droplet fraction and no film fraction). Additionally, the
cladding temperature is at saturation. Heat transfer from the cladding to the coolant is negligible because
of the low surface temperature, as shown in Figure 5-6, thus confirming rewetting.
At high pressures (7MPa), both COBRAG and COBRA2CON calculate the same cladding temperature.
The rewetting of the cladding comes from the successive progression through the boiling curve: from film

5-18
boiling to transition boiling and finally nucleate boiling. Small differences, in particular between the
calculated total heat transfers, show the impact of the 2D Conduction Controlled model implementation.
The effects of the quenching model at high pressure are negligible.
Figure 5-4 Comparison of the Void Distribution and Surface Temperature for Subchannel 28 as a Function of Time – 7MPa

5-19
Figure 5-5 Comparison of the Axial Field Distributions for Subchannel 28 around the Time of Quench
Figure 5-6 Comparison of the Axial Distribution of the Heat Transfer and PCT for Sub-Channel 28 around the Time of Quench

5-20
5.2.2.2 System Pressure 1 MPa
Figure 5-7 provides the cladding temperature comparison between COBRAG and COBRA2CON as a function of time. It also shows the comparison in void fraction as a function of time between the two codes. Both void fraction and cladding temperature are plotted for a central subchannel at an axial elevation close to the mid-elevation of the total bundle length. In the present comparison the mid-elevation corresponds to axial cell 15. Because there is no water rod at the center of the bundle, central rods are expected to yield the highest rod surface temperatures. Additionally, even though the radial power distribution is uniform, rod surface temperatures are not impacted by the much colder channel wall at the center of the bundle. The continuous blue curve in Figure 5-7 represents the cladding temperature as a function of time in subchannel 28 as calculated by COBRAG. The blue dotted line shows the time behavior of the void fraction at the same location calculated by the same code. The red curve in the figure shows the cladding temperature as a function of time in subchannel 28 as calculated by COBRA2CON, while the dotted red curve corresponds to the void fraction at the same location.
Figure 5-8 shows a comparison as a function of time between COBRAG and COBRA2CON film, droplet and void fraction. All quantities displayed in Figure 5-8 are plotted at the mid-rod elevation (Cell 15). The variables are plotted for the central subchannel 28. The continuous blue curve in Figure 5-8 corresponds to the subchannel void fraction as calculated by COBRA2CON. The dotted curve of the same color represents the same variable (subchannel void fraction) as calculated by COBRAG. The continuous red curve in the figure corresponds to the subchannel void fraction as calculated by COBRA2CON. The dotted curve of the same color represents the same variable (cell void fraction) as calculated by COBRAG. The continuous green curve in Figure 5-8 corresponds to the film fraction on one of the rod representative surfaces within the subchannel as calculated by COBRA2CON. The dotted curve of the same color represents the same variable (film fraction) as calculated by COBRAG.
Figure 5-9 shows a comparison of the axial distribution of the cladding temperature for one representative surface within subchannel 28 between COBRAG and COBRA2CON. This figure also displays the total heat transfer from the representative surface to the liquid. All quantities in Figure 5-9 are plotted at time t=20 seconds. This corresponds to the time in Figure 5-9 at which the clad temperature rapidly decreases for COBRA2CON. The continuous green curve in the figure corresponds to the cladding temperature for the representative surface in subchannel 28 as calculated by COBRAG. The dotted curve of the same color represents the total heat transfer as calculated by COBRAG. The continuous red curve in Figure 5-9 corresponds to the cladding temperature for the representative surface in subchannel 28 as calculated by COBRA2CON. The dotted curve of the same color represents the total heat transfer as calculated by COBRA2CON.
Similarly to Figure 5-9, Figure 5-10 shows a comparison of the axial distribution of the cladding temperature for one representative surface within subchannel 28 between COBRAG and COBRA2CON. This figure also displays the total heat transfer from the representative surface to the liquid. All quantities in Figure 5-10 are plotted at time t=25 seconds. This corresponds to the time at which the cladding is already quenched in COBRA2CON but keeps decreasing in COBRAG. The continuous green curve in the figure corresponds to the cladding temperature for the representative surface in subchannel 28 as calculated by COBRAG. The dotted curve of the same color represents the total heat transfer as calculated by COBRAG. The continuous red curve in Figure 5-10 corresponds to the cladding

5-21
temperature for the representative surface in subchannel 28 as calculated by COBRA2CON. The dotted curve of the same color represents the total heat transfer as calculated by COBRA2CON.
Consistent with the previous sensitivity run, prior to the injection of subcooled liquid at 15 seconds, the
case is initialized. The void fraction within the bundle is close to 1.0 and steam is the only fluid present.
At time t=15 seconds, the case initialization is stopped and the reflood transient is initiated. In addition to
the injection of subcooled water at the bottom of the bundle, the total bundle power is reduced to simulate
power levels consistent with decay heat. Despite the initial increase in the cladding temperature, the
temperature calculated by both codes decreases rapidly for the first 9 seconds consistent with the previous
case.
The effects of convective steam cooling for COBRAG are observed in this case as well because the rod
power is significantly reduced. This is shown in Figure 5-8. Immediately after the rapid initial cool down,
the rate at which the cladding temperature decreases for COBRAG is reduced. Steam cooling is
maintained and the void fraction remains high (around 0.85). Because of the lower system pressure
(1MPa), both the saturation temperature and the Tmin value are lower than in the case of 7MPa. The lower
values of TSAT and Tmin result in additional time needed to cool the cladding below the minimum stable
film boiling temperature. Between 24 and 43 seconds, the only heat transfer mode is film boiling (steam
cooling). Even though liquid is present, droplets and film cannot make contact with the heated surface
until the cladding temperature drops below Tmin (see Figure 5-8) Once the minimum film boiling
temperature is reached, the cladding temperature immediately cools down and reaches the saturation
temperature.
On the other hand, in COBRA2CON, immediately following the initiation of the reflood, the rod
temperature continues to increase similarly to COBRAG. The cladding temperature heat transfer drops at
a rate similar to the COBRAG case. The film boiling heat transfer regime between the hot surface and the
fluid is maintained for some time. Unlike COBRAG, however, the modeling the local heat diffusion in
COBRA2CON allows additional cooling of the cladding. Conduction within the rod is sufficient to
eventually reduce the cladding temperature below the minimum film boiling temperature and the rod
quenches.
Figure 5-9 shows that, at 20 seconds, the representative rod in subchannel 28 has rewetted up to cell 14 in
the COBRA2CON case. Above node 16, the cladding surface temperature remains high and the heat
transfer from the cladding to the coolant is negligible. Between cells 10 and 15, the cladding surface is
subject to nucleate and transition boiling heat transfer. The cladding temperature has decreased
significantly. Heat transfer from the cladding to the coolant is high, as shown in Figure 5-9. Below cells
10, the cladding surface is subject nucleate boiling heat transfer. The rod is surrounded by continuous
liquid (characterized by the higher droplet fraction and no film fraction). Additionally, the cladding
temperature is at saturation (or close to saturation). Heat transfer from the cladding to the coolant is
relatively low because of the low surface temperature, as shown in the figure, thus confirming rewetting.
For COBRAG on the other hand, only cell 2 is rewetted. This cell corresponds to the first axial heated
cell. The temperature of the remaining cells follows closely the axial power shape. The rod has not rewet
and remains in film boiling. Consequently, the total heat transfer from the cladding to the coolant is

5-22
negligible. The difference in heat transfer between COBRAG and COBRA2CON can be attributed to the
differences in heat transfer regime as well as the impact from the 2DCON module.
Figure 5-10 shows that, at 25 seconds, the representative rod in subchannel 28 has completely quenched
in the COBRA2CON case. For COBRAG on the other hand, only cells 2 to 6 and cells 32 to 38 have
rewet. The rewetting of the rod in COBRAG is done from the bottom and the top of the rod while the
center of the rod remains at high temperature. In COBRAG, the heat transfer from the cladding to the
coolant is high, as shown in Figure 5-10, thus confirming rewetting at the rod extremities. The center of
rod has not rewet and remains in film boiling. Consequently, the total heat transfer from the cladding to
the coolant is negligible.
Figure 5-7 Comparison of the Void Distribution and Surface Temperature for Subchannel 28 as a Function of Time – 1MPa

5-23
Figure 5-8 Comparison of the Field Distribution for Subchannel 28 at Cell 15 as a Function of Time – 1MPa
Figure 5-9 Comparison of the Axial Distribution of the Heat Transfer and PCT for Sub-Channel 28 at 20 seconds

5-24
Figure 5-10 Comparison of the Axial Distribution of the Heat Transfer and PCT for Sub-Channel 28 at 25 seconds
Figure 5-11 shows the comparison of the axial location of the rewetted cells between COBRAG and COBRA2CON. It shows the axial location of a cell that has rewetted as a function of time. The red dots in the figure show the location of the quench front propagation as for COBRA2CON The blue dots in Figure 5-11 show the location of the rewetted cells from the bottom of the rod, while the green dots corresponds to the location of the rewetted cells from the top of the rod.
Figure 5-11 shows that the cladding surface rewetting propagation in the case of the quenching front
advancement (COBRA2CON) is much faster than for the rewet through the boiling curve (COBRAG).
The average quench front propagation speed in the COBRA2CON case is about 34 cm/s. The average
rewet propagation speed in the COBRAG case is about 4.5 cm/s. The difference in velocity between the
two cases is linked to the different nature of the rewet. In the COBRA2CON case, quenching is the main
rewetting phenomenon. In the COBRAG case, steam cooling of the cladding temperature below Tmin is
the main phenomenon leading to the rewetting of the rod because of the conduction within the rod is not
considered. In the case of COBRA2CON, the local heat diffusion from the hotter to the cooler regions
within the rods is modeled. Consequently, the additional heat transfer occurring within the rod is effective
in reducing the clad temperature much faster, regardless of the Tmin value. Conduction within the rod is
sufficient to eventually reduce the cladding temperature below the minimum film boiling temperature and
the rod quenches.
Figure 5-11 shows that the rewetting of the rod in COBRAG is done from the bottom and the top of the
rod. The bottom rewet is a direct consequence of the reflood and this mechanism has been discussed in
the previous paragraph. The rewetting from the top is due to steam condensation on the unheated cells.
The unheated cells at the top of the rod have a much lower surface temperatures than the heated cells.
Because of the lower temperature, condensation is possible. The condensation of the steam at these cells
allows additional cooling of the top heated cells. As a result, the combination of steam cooling and

5-25
condensation at the top of the rod permits the higher cells to rewet. This phenomenon is shown by the
green dots in Figure 5-11.
Figure 5-12 shows the comparison of the quench front propagation as calculated with COBRA2CON for
the sensitivity run at 3 MPa and that of the experimental data for RBHT’s test 1383. The purpose of this
figure is to demonstrate the impact of pressure and reflood rates on the quench front propagation. The
figure is used to demonstrate that the mechanistic behavior of the quench front propagation is in line with
the experiments. The average quench front propagation speed in the COBRA2CON case is about 34 cm/s
as discussed previously whereas the average quench front propagation at low pressure and low flows is 5
mm/s. The quench front propagation is about two orders of magnitude slower in the case of the
experiment. Pressure and mass flux are the parameters at the basis of this significant difference. Both
parameters result in a much lower film boiling and results in longer time periods for the quenching of the
rods. On one hand, pressure directly impacts the saturation temperature and the minimum film boiling
temperature. These quantities decrease if the pressure decreases. Consequently, at higher pressures (3MPa
vs. 300 kPa in the RBHT test), Tmin and Tsat are much higher, and, thus, the amount of cooling necessary
to rewet is much smaller. On the other hand, a lower mass flux implies lesser inventory available for the
cooling down of the rods.
This sensitivity case demonstrated that quenching at the cladding surface is enhanced with the 2D
Conduction Controlled model. Without the quenching model, the cooling of the cladding is mainly driven
by steam cooling until the surface reaches Tmin. Once Tmin is reached, transition boiling heat transfer is
re-established between the coolant and the cladding and surfaces are in nucleate boiling. In the case of
COBRA2CON however, the heat transfer at the quench front is modelled resulting in faster cooling of the
cladding at the interface. Because of the Pressure and reflood rates at which the sensitivity run were
conducted it was shown that COBRA2CON over predicts over predicts quench front velocities. This
behavior is expected and is attributed to limitations in the COBRA2CON code at low Pressures which do
not permit performing the benchmark at lower pressures and mass fluxes.

5-26
Figure 5-11 Comparison of the Axial Position of Rewetted Cells between COBRAG and COBRA2CON
Figure 5-12 Comparison of the Axial Quench Front position between RBHT Test 1383 and COBRA2CON

5-27
5.2.3 Time Step Sensitivity Results
The manner in which COBRA2CON is applied for simulation of the tests described above is an important
consideration in assessing the adequacy of the basic thermal hydraulic models. To ensure that
COBRA2CON is not affected by simulation parameters, time step sensitivity calculations were
performed. The time step sensitivity starts from the pressure sensitivity case discussed in section 5.2.2.2
as the base case, i.e. the 1MPa pressure sensitivity case.
The COBRA2CON calculation in section 5.2.2.2 was conducted using a time step of 0.01 second for the
reflood portion of the simulation. To demonstrate the adequacy of this time step and to confirm the
solution is not impacted by the change in time step, a total of two calculations were performed. The first
one used a time step of 0.001 seconds for the reflood calculation the second sensitivity case used a time
step of 1 millisecond. Since the results for both calculations were similar, only the sensitivity case used a
time step of 0.001 seconds is discussed below.
Figure 5-13 shows a comparison as a function of time the base case and the time step sensitivity film, droplet and void fractions. The continuous dark blue curve and light blue in Figure 5-13 correspond to the subchannel void fraction for the base case and the time step sensitivity respectively. The continuous red curve and pink in the figure correspond to the subchannel droplet fraction for the base case and the time step sensitivity respectively. Figure 5-13 demonstrates that both results are identical.
Figure 5-14 provides the cladding temperature comparison between the 1MPa base case and the time step Dt= 0.001 s as a function of time. It also shows the comparison in void fraction as a function of time between the two cases. Both void fraction and cladding temperature are plotted for a central subchannel at axial cell 15. The continuous blue curve in Figure 5-14 represents the void fraction as a function of time in subchannel 28 for the base COBRA2CON case. The continuous light blue line shows the time behavior of the void fraction at the same location calculated for the smaller time step case. The red curve in the figure shows the cladding temperature as a function of time in subchannel 28 for the COBRA2CON base case, while the green curve corresponds to the same cladding temperature for the smaller time step case. Figure 5-14 demonstrates that both results are identical.
The results obtained from the sensitivity analysis demonstrate that the COBRA2CON code along with the 2DCON module is not affected by the value of the time step used in the simulation. Additionally, because the results are identical between the two cases, the time step used in the sensitivity cases is adequate for the purpose of this analysis.

5-28
Figure 5-13 Comparison of the Time Dependent Field Fraction Distribution at Node 15 for two different Time Steps.

5-29
Figure 5-14 Comparison of the Time Dependent Temperature Distribution at Node 15 for two different Time Steps.
5.2.4 Summary and Conclusions
COBRA2CON was used to reproduce the RBHT reflood tests-of the Penn State RBHT test facility [54, 55 and 56]. The tests were performed on a full-scale electrically heated 7x7 fuel bundle. During the benchmark of these separate test effects, convergence problems at low pressures and low reflood rates were identified. The results of the comparisons of COBRAG/COBRA2CON calculations with measured data support the following conclusions:
1. Sensitivity analyses permitted to conclude that the convergence problem is more pronounced at
low pressures and low mass fluxes.
2. At lower Pressures, the effects of the decreasing Tmin are observed. Without an appropriate
quenching model, the cooling of the cladding is mainly driven by steam cooling until the surface
reaches Tmin. Once Tmin is reached, optimum heat transfer is re-established between the coolant
and the cladding and surfaces are in nucleate boiling. In the case of COBRA2CON however, the
heat transfer at the quench front is modelled resulting in faster cooling of the cladding at the
interface. The sensitivity case at 1 MPa demonstrated that quenching at the cladding surface is
enhanced with the 2D Conduction Controlled model. The effects of the decreasing Tmin are
observed. Without an appropriate quenching model, the cooling of the cladding is mainly driven
by steam cooling until the surface reaches Tmin. With a 2D Conduction Controlled model, the

5-30
heat transfer at the quench front is modeled which results in faster cooling of the cladding at the
interface. The sensitivity case at 1 MPa demonstrated that quenching at the cladding surface is
enhanced with the 2D Conduction Controlled model.
3. The effects of the 2D-Conduction Controlled quench front model are accentuated as the Pressure
decreases. At high pressures, because of the characteristics of Tsat and Tmin, both COBRAG and
COBRA2CON behave the same way.
4. Because of the pressure and reflood rates at which the benchmark were conducted it was shown that COBRA2CON over predicts quench front velocities. The over prediction of the quench front velocity in COBRA2CON is because the simulation was done at a higher pressure. Hence, this behavior is expected and is attributed to limitations in the COBRA2CON code at low Pressures which do not permit performing the benchmark at lower pressures and mass fluxes.
5. The time step utilized for the sensitivity calculations was shown to be adapted to the behavior of the rewetting phenomenon. No differences were observed with different time steps for COBRA2CON.
5.3 VERIFICATION AND BENCHMARK SUMMARY
The goal of the Thompson’s verification calculation [9] was to properly ascertain that the 2D Conduction controlled module (2DCON) boundary conditions, and numerical formulation functioned as intended. During this verification calculation, testing was conducted for the same geometry and conditions as in Reference 9. The thermal-hydraulic properties, such as the fuel material properties, the temperature distribution and heat transfer coefficients were provided as input to 2DCON. 2DCON was able to reproduce the temperature distribution at the cladding-coolant interface consistent with Thompson’s two dimensional conduction calculations. The functionality of 2DCON was deemed adequate based on this comparison. Consequently, the Lagrangian conduction controlled non-uniform meshing module was shown to be able to reproduce the temperature distributions and capture the location of the quench front for specified boundary conditions.
The first benchmark (Halden) considered examined the mechanics of dryout and reflood in an ATWS-I context. The objective of the dryout experiments conducted at Halden was to provide information on the heat-up and rewet of the fuel cladding during short term dryout, which is characteristic to ATWS-I in BWR plants (See Section 1.2). The Halden experiment was simulated with both COBRAG and COBRA2CON. Detailed discussion of the Halden benchmark is provided in Section 5.1. The results of the benchmark demonstrated that the newly proposed model for 2DCON and the re-nodalization scheme along with the necessary COBRAG modifications was able to match experimental data for high pressure and high mass flux conditions. The comparison between the two code versions further demonstrated the benefits of the quenching model. The rod rewetting observed in the experiment could not be modelled without the 2D-Conduction Controlled model and the re-nodalization scheme. Without these two modules, quenching of the rod surface could not be modeled and the calculated PCT remained high in the case of COBRAG. The COBRA2CON capability to model rewetting, and thus provide a more accurate simulation of fast transients such as ATWS-I, was demonstrated.
In addition to Halden, RBHT [56] was used to demonstrate the behavior of COBRA2CON during an ATWS-I event. RBHT is a reflood benchmark for a 7x7 mock-up bundle at low pressure and low reflood

5-31
rate, consistent with LOCA conditions (see Section 1.1). Increasing pressure and mass flux yielded thermal-hydraulic conditions consistent with ATWS-I. The geometry of the experimental rig was used to perform several comparison tests between COBRAG and COBRA2CON. Even though no experimental data was available at these pressure and flow conditions, the comparison between COBRAG and COBRA2CON demonstrated the functionality of 2DCON for multiple quench fronts
Initially, RBHT was used to benchmark the code for LOCA conditions. However, during the benchmark, a divergent behavior between two Newton iterations in the predictor step was identified. The residuals of the pressure and vapor temperature between two Newton iterations in the predictor step fail to converge. Pressure and enthalpy (based on vapor and liquid temperature) are used to calculate the water properties, hence, the divergent behavior of these two quantities led to mass and energy imbalances in two of the LOCA condition benchmarks. Consequently, the values of the newly calculated variables exceeded the defined upper or lower bounds on pressure, enthalpy, void fraction and liquid volumetric fractions resulting in the COBRAG divergence issue. Hence, the divergent behavior of these two quantities led to mass and energy imbalances in the two LOCA condition benchmarks. Consequently, the values of the new calculated variables exceed defined upper or lower bounds on pressure, enthalpy, void fraction and liquid volumetric fractions. Because, these independent variables are bounded to ensure that their value is always inside the interpolation region of the steam tables, the COBRAG solution would diverge. As a consequence, the variables are not updated and the time step is repeated with a smaller time step size. Despite reduction of the time step, pressure and vapor temperature could not converge below the specified convergence criteria. Sensitivity studies have been performed on these convergence criteria. These parametric studies were performed to understand how the convergence issues would manifest themselves as a function of pressure and mass flux.
The testing of COBRAG and COBRA2CON was conducted to demonstrate the benefits of 2D Conduction Controlled module 2DCON. These benefits were shown for single fuel rod and the results were benchmarked against experimental data. A qualitative testing was performed for conditions similar to ATWS-I to demonstrate these benefits for a fuel bundle containing multiple fuel rods. It was concluded that COBRA2CON is capable of modeling simultaneously multiple quench fronts. The timing of the quenching of the different rods in different locations shows that 2DCON is able to calculate the local temperature distribution independently of other film front advancements.
6-1
6. CONCLUSIONS
6.1 SUMMARY & CONCLUSIONS OF THE RESEARCH
The current study has illustrated the development of COBRA2CON, a functional subchannel code for predicting rewetting phenomena over a wide range of conditions within a three-field analysis environment. Chapter 1 provided an overview of the different aspects of rewetting and the importance of accurately modeling heat transfer and flow behaviors in nuclear reactor safety analysis, specifically ATWS-I and LOCA. Chapter 1 also discussed the quenching models in best-estimate codes used in NSA codes. This review discussed the benefits and shortcomings of such models for two-phase two-field and two-phase three-field subchannel codes.
Chapter 2 presented a comprehensive discussion of the flow and heat transfer regimes experienced and insight on the physical mechanisms governing the simultaneous phenomena in rewetting and discussed available constitutive relationships and re-nodalization models necessary to the prediction of rewetting in both two-field and three-field analysis tools.
Chapter 3 detailed the development of the Lagrangian 2D Conduction-Controlled Quenching model, the
modifications of COBRAG to adapt it to the adequate transient conditions and the coupling of both
elements into the COBRA2CON subchannel code. The rewetting modeling code COBRA2CON
integrates a combination of schemes and models to mitigate this issue. The integration of the 2D
Conduction Controlled Numerical Scheme is done in two steps:
1) A dynamic axial refining of the local rewetting region scheme is developed. A coupled T-H re-nodalization model with a fine moving mesh dynamically refining a NSA computer code Eulerian hydraulic mesh was developed to better model the rewetting heat transfer. This local Eulerian hydraulic mesh is in turn coupled with a Lagrangian non-uniform nodalization in order to compute the temperature distribution within the fuel rod and calculate the heat transfer to the coolant. The Lagrangian-Eulerian coupling and dynamic re-nodalization logic for three-field solvers is a new approach that has been developed for this thesis.
2) The a heat transfer logic and the corresponding heat transfer coefficient models are developed to properly calculate temperature gradients at locations where sharp thermal-hydraulic property changes are experienced,
3) A 2D-Conduction Controlled model that solves the temperature distribution in the fuel rod and computes film front velocities, heat transfer from the rod surface to the fluid and couples these results to the considered NSA computer code original T/H solution.
The three-field GEH proprietary code COBRAG code is modified to integrate the models developed above. In order to incorporate the capability to capture the film front progression as the bundle rewets, COBRAG was also modified to include constitutive relations to compute the flow regimes and heat transfer, mass and energy distribution between fields at the rewetting front. Model modifications and/or upgrades are made in an effort to utilize the most appropriate correlations based on either local flow characteristics or developed from experimental data collected over the desired range of thermos-hydraulic conditions. The models that are incorporated into the proposed rewetting package are developed uniquely for the problem at hand.

6-2
The developed rewetting modeling package for COBRAG includes:
1) The implementation of a functional relationship between the actual and theoretical liquid phase split between film and droplet based on comparisons to experimental data to account for any deficiencies that exist in the original theoretical model. This model was implemented in COBRAG to refine the liquid distribution between the liquid film and the droplets.
2) The improvements to the numerical method to mitigate water packing in numerical cells at locations of sharp interfacial property changes and low pressure applications.
Chapter 4 and 5 demonstrated that the inclusion of the Lagrangian-Eulerian coupled 2D Conduction Controlled proposed model for rewetting modeling, along with the necessary COBRAG modifications, is able to match experimental data for high pressure and high mass flux conditions. This permits to demonstrate that the fuel rods quench with sufficient accuracy to capture the propagation of the quench front propagation and model the decrease in cladding temperatures. Another result of the current study discussed in Chapter 5 was the identification of a divergent behavior in COBRAG when operating a low Pressure and low flow conditions. The residuals of the pressure and vapor temperature between two Newton iterations in the predictor step fail to converge. Pressure and enthalpy (based on vapor and liquid temperature) are used to calculate the water properties, hence, the divergent behavior of these two quantities led to mass and energy imbalances in two of the LOCA condition benchmarks. Consequently, the values of the newly calculated variables exceeded the defined upper or lower bounds on pressure, enthalpy, void fraction and liquid volumetric fractions resulting in the COBRAG divergence issue. Sensitivity studies have been performed on these convergence criteria and the key results are presented in this thesis. Future work will need to solve this COBRAG intrinsic convergence problem in order to perform transient applications in the full range of T-H conditions characterizing LOCA and ATWS-I analyses.
Ultimately it is desired to develop a code that fulfills the need of the nuclear industry to provide analyses tools that are able to provide accurate predictions of a wide range of transient phenomena. The methods package developed during the research work provides a detailed spatial representation of the subchannel thermal-hydraulic properties for a single BWR bundle for ATWS-I and LOCA. Provided the importance of the physical phenomena at play in a BWR channel for safety analyses of various reactor accident scenarios, this modeling methodology provides a starting ground in improving the predictive capabilities of three-field transient analysis codes until a more stable and viable approach is ascertained for both ATWS-I and LOCA.
The methodology employed in the current study provides a means of implementing models that are based on the physical mechanisms, as they are currently understood, while simultaneously leveraging the available experimental data to improve the predictive capability of the code. The COBRA2CON code developed in the current study provides both a bridge towards this ultimate goal and a new baseline for future research to be conducted to continue enhancing the predictive capabilities of three-field analysis tools for safety transient analysis.

6-3
6.2 RECOMMENDATIONS FOR FUTURE WORK
In the process of developing the new COBRAG version COBRA2CON several areas for future work have been identified to continue the development and improve predictive capabilities of the code. These areas include:
1. Resolution of the COBRAG intrinsic convergence problem 2. Integration of spacer grid effects in the COBRA2CON heat transfer model and quenching model 3. Investigation of transition boiling model in COBRA2CON 4. Integration of a radiative heat transfer model into COBRA2CON
First, future efforts in the COBRA2CON development need to focus on resolving the COBRAG convergence problem. As discussed in Chapter 5, the current study identified the divergent behavior of COBRAG when operating a low pressure and low flow conditions. In order to demonstrate the benefits of COBRA2CON for LOCA conditions, COBRA2CON convergence needs to be mitigated to perform transient applications in the full range of T-H conditions characterizing LOCA and ATWS-I analyses. A modification of the Jacobian matrix to incorporate a Pressure regulation scheme could be used to mitigate these convergence problems. For example, an averaging scheme can be utilized to enhance pressure convergence and consequently improve the overall performance of the code.
Second, spacer grid effects in the rewetting model and the COBRA2CON heat transfer model should be integrated into the code. Spacer grids have been shown to potentially have significant impact on reflood and quenching rates [58]. They provide an unheated structure with significant surface area. Spacer grids could quench in advance of the quench front providing a means of cooling the surrounding vapor as well as serving as another entrainment source. The effects of spacer grids on the droplet size spectrum as well as the enhanced mixing that the spacers provide to the droplet field are two key areas of focus that could enhance rewetting and need to be investigated further.
Third, the transition boiling heat transfer modeling in COBRA2CON should be investigated. The current method utilizes a linear interpolation between nucleate boiling and film boiling heat transfer regimes. The linear weighting for the heat transfer in the transition boiling region is currently based upon a linear interpolation of the void fraction in the transition flow regime and the comparison of the wall temperature versus the minimum film boiling temperature and the local critical heat flux value. Other options can be explored to improve the predictive capabilities of COBRA2CON in the transition boiling regime.
Fourth, one effect that has a significant impact on heat transfer at high temperatures is radiative heat transfer. Radiative heat transfer is a significant cooling mechanism and may account for a significant amount of the total heat transfer within the bundle: surface-to-surface and surface-to-fluid. A radiative heat transfer model should be developed to account for the radiation impact so the impact of non-condensable can be investigated with COBRA2CON. For certain BWR types, radiative heat transfer is the main cooling mechanism. The implementation of such model will enhance the capabilities of COBRA2CON to better predict PCTs.

A-1
7. REFERENCES
1. TRACE v5.0 Theory Manual, “Field Equations, Solution Methods, and Physical Models,”
ML120060403 (2012).
2. RELAP5-3D Code Manual Volume I: “Code Structure, System Models, and Solution
Methods,” Revision 2.4, (2005)
3. RELAP5-3D Code Manual Volume IV: “Models and Correlations,” Revision 2.4, (2005).
4. C. L. Wheeler, et al., “COBRA–NC: A Thermal–Hydraulic Code for Transient Analysis of
Nuclear Reactor Components,” NUREG/CR–3262, PNL–5515, Pacific Northwest
Laboratory, (May 1986).
5. R.K. Salko, M.N. Avramova, “CTF Theory Manual,” The Pennsylvania State University,
Department of Mechanical and Nuclear Engineering, Reactor Dynamics and Fuel
Management Group (March 2015).
6. B. Hizoum, J. Andersen, A. Sakoda and S. Bowman,”COBRAG Subchannel Analysis Of
BWR Fuel Thermal Hydraulic Performance”, Proceedings of 2010 LWR Fuel
Performance/TopFuel/WRFPM, Orlando, Florida, USA, (September 2010).
7. J.G.M. Andersen et al., “Realistic Assessment of Break Size in Simulated BWR Loss-of-
Coolant Accidents,” International Topical Meeting on Nuclear Reactor Thermal Hydraulics,
NURETH-13, Kanazawa City, Japan, (September 2009).
8. BWR Owners’ Group, “ATWS Rule Issues Relative to BWR Core Thermal-Hydraulic
Stability,” NEDO-32047, (February 1992).
9. T.S Thompson, “On the process of rewetting a hot surface by a falling liquid film”, Atomic
Energy of Canada Ltd., AECL-4516, (June 1973).
10. R.B. Duffey, D.T.C. Porthouse, “The physics of rewetting in water reactor emergency core
cooling”, Nuclear Engineering Design, 25, 379–394, (1973).
11. K. H. Sun, G. E. Dix and C. L. Tien, “Effect of Precursory Cooling on Falling-Film
Rewetting”, Transaction of the ASME, p 360, (1975).
12. Andreani, M. and Yadigaroglu, G.: “Prediction Methods for Dispersed Flow Film Boiling,”
International Journal of Multiphase Flow, Vol. 20, Suppl., pp. 1-51 (1994).
13. J.J. Carbajo, “A Study on the Rewetting Temperature,” Nuclear Engineering and Design, 84,
21-52, (1985).
14. GE Hitachi Nuclear Energy Licensing Topical Report, NEDO-20566-P-A, “General Electric
Company Analytical Model for Loss-Of-Coolant Analysis in Accordance with 10CFR50
Appendix K,” Volume 1, (September 1986).
A-2
15. A. Yamanouchi, “Effect of core spray cooling in transient state after Loss of Coolant
Accident”, Journal of Nuclear Science and Technology, 5, 547-558, (1968).
16. S.K.W. Yu, P.R. Farmer, M.W.E. Coney, “Methods and Correlations for the Prediction of
Quenching Rates on hot Surfaces,” Int. J. Multiphase Flow, Vol. 3, 415-443, (1977).
17. C.L. Tien and L.S. Yao, “Analysis of conduction-controlled rewetting of a vertical surface”,
ASME Journal of Heat Transfer 97, 161-165, (1975).
18. G. E. Dix and J. G. M. Andersen, “Spray Cooling Heat Transfer for a BWR Fuel Bundle”,
Symposium on the Thermal Hydraulic Aspects of Nuclear Reactor Safety, Vol. 1: Light
Water Reactors, ASME, (1977).
19. D.G. Vreeland, “Analytical Model for the Inverted Annular Film Boiling Region,” Ph.D.
Thesis, U.C. Berkley, (1989).
20. GE Hitachi Nuclear Energy Licensing Topical Report, “TRACG Model Description,”
NEDO-32176P, Revision 4, (January 2008).
21. S.K. Sahu, P.K. Das and S. Bhattacharyya, “A comprehensive analysis of conduction-
controlled rewetting of hot surfaces by the Heat Balance Integral Method”, International
Journal of Heat Mass Trans., 49, pp. 4978–4986, (2006).
22. V.M. Alipchenkov, et al., “A three fluid model of two phase dispersed-annular flow”,
International Journal of Heat and Mass Transfer, 47, 5323–5338, (2004).
23. B. S. Shiralkar and K. H. Chu, “Recent Trends in Subchannel Analysis,” Subchannel
Analysis in Nuclear Reactor, Edited by H. Ninokata and M. Aritomi, The Institute of Applied
Energy and Atomic Energy Society of Japan (1992).
24. M.J. Meholic, “The Development of a Non-Equilibrium Dispersed Flow Film Boiling Heat
Transfer Modeling Package,” Ph.D. thesis, Penn. State, (2011).
25. GE Hitachi Nuclear Energy Licensing Topical Report, “TRACG Qualification,” NEDO-
32177P, Revision 3, (August 2007).
26. GE Hitachi Nuclear Energy Licensing Topical Report, “COBRAG Subchannel Code - Model
Description Report,” NEDO-32199P, Revision 1, (July 2007).
27. X.M. Chen, J.G.M. Andersen and L.A. Klebanov, “A Transient Subchannel Analysis Method
for BWR Fuel Bundles”, Fifth International Topical Meeting on Nuclear Thermal Hydraulics,
Operations, & Safety, Beijing (1997).
28. G. Hetsroni, “Handbook of Multiphase Systems,” McGraw-Hill, (1982).
29. G.B. Wallis, “One-Dimensional Two-Phase Flow”, McGraw-Hill, (1969).
30. N.E. Todreas, M.S. Kazimi, “Nuclear Systems I, Thermal Hydraulic Fundamentals,” Taylor
& Francis, New York (1990).

A-3
31. J.G. Collier and J.R. Thome, “Convective Boiling and Condensation,” 3rd Ed., Oxford
University Press (1996).
32. R.T. Lahey Jr., F.J. Moody, “The Thermal-Hydraulics of a Boiling Water Nuclear Reactor,”
1st Ed., American Nuclear Society, (1977).
33. M. M. El-Wakil, “Nuclear Heat Transport,” 3rd Ed., American Nuclear Society, (1981).
34. NUREG/IA-0002, “Heat Transfer Processes During Intermediate and Large Break Loss-of-
Coolant Accidents (LOCAs),” (September 1986).
35. G.F. Hewitt and D.N. Roberts, “Studies of Two-Phase Flow Patterns by Simultaneous X-ray
and Flash Photography,” AERE-M 2159, HMSO (1969).
36. M. Ishii and G. DeJarlais, "Flow Visualization Study of lnverted Annular Flow of Post
Dryout Heat Transfer Region," Nuclear Engineering and Design, vol. 99, pp. 187-199,
(1987).
37. G. Yadigaroglu, R.A. Nelson, V. Teschendorff, Y. Murao, J. Kelly, D. Bestion, “Modeling of
Reflooding,” Nuclear Engineering and Design, 145, 1-35, (1993).
38. S. Oh, B. Hizoum et al., “Film Droplet Split Correlation at the Onset of Annular Mist Flow,”
International Topical Meeting on Nuclear Reactor Thermal Hydraulics, NURETH-16,
Chicago (September 2015).
39. L. Ibarra, J.G.M. Andersen et al., “Numerical Modeling of Flow and Heat Transfer During
Quenching for a Postulated Loss-Of-Coolant Accident,” The 15th International Topical
Meeting on Nuclear Reactor Thermal - Hydraulics, NURETH-15 Pisa, Italy, May 12-17,
(2013).
40. C. Frepoli, J.H. Mahaffy, L.E. Hochreiter, “A moving subgrid model for simulation of
reflood heat transfer,” Nuclear Engineering and Design 224, 131–148, (2003).
41. C. Frepoli, J.H. Mahaffy, K. Ohkawa, “Notes on the implementation of a fully-implicit
numerical scheme for a two-phase three-field flow model” Nuclear Engineering and Design
225, 191–217, (2003).
42. R.W. Shumway, EGG-RST-6781, “TRAC-BWR Heat Transfer: Assessment of Tmin,”
(January 1985).
43. V. K. Dhir, R. B. Duffey, I. Cation, “Quenching Studies on a Zircaloy Rod Bundle”, Journal
of Heat Transfer, Vol. 103, (May 1981).
44. Henry, R.E., “A Correlation for the Minimum Film Boiling Temperature”, Heat Transfer
Research and Design, AIChE Symposium, Series 70, No. 138, pp. 81-90, (1974).
45. Peterson, L.J. and S.M. Bajorek; “Experimental Investigation of Minimum Film Boiling
Temperature for Vertical Cylinders at Elevated Pressure;” Proceedings of ICONE10 10th;
Arlington, VA; (April 14-18, 2002).

A-4
46. J.C. Stewart and D.C. Groeneveld, “Low-Quality and Subcooled Film Boiling of Water at
Elevated Pressures,” Nuclear Engineering Design, 67, pp. 259-272, (1981).
47. Hofmann, P. et al., “Quench Behavior of Zircaloy Fuel Rod Cladding Tubes: Small-Scale
Experiments and Modeling of the Quench Phenomena,” FZKA 6208, Forschungszentrum
Karlsruhe, (March 1999).
48. Ianiri, R., “The Third Dryout Fuel Behaviour Test Series in IFA-613,” HWR-552, OECD
Halden Reactor Project, (February 1998).
49. M. Limbäck and R. Ianiri, “OECD Halden Reactor Project – Dryout Fuel Behaviour Tests in
IFA-613.1”, HWR-493, (February 1997).
50. M. Limbäck and R. Ianiri, “OECD Halden Reactor Project – Dryout Fuel Behaviour Tests in
IFA-613.2”, HWR-494, (February 1997).
51. McGrath, M. et al., “Investigation into the Effects of In-Pile Dry-Out Transients on Zircaloy
Fuel Cladding as Performed in IFA-613,” HWR-666, OECD Halden Reactor Project, (March
2001).
52. J.W. Lane, “The Development of a Comprehensive Annular Flow Modeling Package for
Two-Phase Three-Field Transient Safety Analysis Codes,” Ph.D. thesis, Penn. State, (2009).
53. Y. Murao and et al., "A Study on Quench Phenomena during Reflood Phase, 1,'' JAERI-M-
6984, (1976).
54. Hochreiter, L.E. et al., NUREG/CR-6975, “Rod Bundle Heat Transfer Test Facility Test Plan
and Design,” (July 2010).
55. Hochreiter, L.E. et al., NUREG/CR-6976, “Rod Bundle Heat Transfer Test Facility
Description,” (July 2010).
56. Hochreiter, L.E. et al., NUREG/CR-6980, “RBHT Reflood Heat Transfer Experiments Data
and Analysis,” (April 2012).
57. M. Valette, J. Pouvreau, D. Bestion, P. Emonot, “Revisiting large break LOCA with the
CATHARE-3 three-field model,” Nuclear Engineering and Design 241, 4487–4496, (2011).
58. S. Ergun, L.E. Hochreiter, J.H, Mahaffy, “Modifications of COBRA-TF to model dispersed
flow film boiling with two flow, four field Eulerian-Eulerian approach – Parts 1&2,” Annals
of Nuclear Energy 35, 1663-1676, (2008).
59. H. Abel-Larsen et al., “Heat Transfer Correlations in Nuclear Reactor Safety Calculations,”
Vol. 1, (1985).
60. D. C. Groenveld and J. C. Stewart, "The Minimum Film Boiling Temperature for Water
During Film Boiling Collapse,” Proceedings 7th International Heat Transfer Conference,
Munich, FB 37, pp. 393-398 (1982).


![IRONWOOD - PAVE PAVIMENTAZIONI · durezza scala mohs 5-8 ≥ 5 [en 101] surface hardness duretÉ de surface escala de dureza mohs ritzhÄrte der oberflÄche gres porcellanato estruso](https://static.fdocumenti.com/doc/165x107/5f70ba4980eaf430ea1c2fc4/ironwood-pave-durezza-scala-mohs-5-8-a-5-en-101-surface-hardness-duret-de.jpg)