
Research Article Torsional Oscillations in Automotive ...
15
Research Article Torsional Oscillations in Automotive Transmissions: Experimental Analysis and Modelling Enrico Galvagno, Mauro Velardocchia, and Alessandro Vigliani Dipartimento di Ingegneria Meccanica e Aerospaziale, Politecnico di Torino, Corso Duca degli Abruzzi 24, 10129 Torino, Italy Correspondence should be addressed to Enrico Galvagno; [email protected] Received 30 July 2015; Revised 21 December 2015; Accepted 28 December 2015 Academic Editor: Radoslaw Zimroz Copyright © 2016 Enrico Galvagno et al. is is an open access article distributed under the Creative Commons Attribution License, which permits unrestricted use, distribution, and reproduction in any medium, provided the original work is properly cited. e paper investigates the torsional oscillations of an automotive transmission system by means of an experimental test bench used to validate the proposed lumped parameter model. e rig consists of a Dual Clutch Transmission (DCT) and a Manual Transmission (MT) connected through the respective output shaſts, while the excitation is provided by two electric motors, which are controlled in speed or torque. e experimental analysis includes the measurement of the external torques, applied by the two electric motors to the mechanical system, and the measurement of the system response in terms of angular speeds at different positions along the transmission line. e frequency response of the system is estimated from the experimental data and compared with the results of a 5-degree-of-freedom lumped parameter model, which proves to be adequate to describe the dynamic behaviour of the system up to a frequency of 200 Hz. e comparison between simulated results and experimental data shows good agreement, so the model can be used to predict the torsional vibrations of the transmission system in the linear field. Moreover, the effects of the nonlinearities associated with the mean value of the excitations are shown. Finally the influence of the selected gear ratio on the experimental frequency response is discussed. 1. Introduction Automotive transmissions are commonly used to transfer mechanical power from the prime mover of the vehicle, most frequently an Internal Combustion Engine (ICE), to the wheels. Today’s research is oriented towards more efficient and less polluting alternatives, yet ICEs still represent the most widely used onboard power source due to their relevant advantages, especially in terms of specific power, autonomy, and ease of refueling. From a dynamic point of view, a drawback is the torque irregularity, mainly due to the combustion process itself and to the inertial loads of the reciprocating and rotating masses. ese irregularities show a frequency spectrum quite rich in harmonic content, obviously related to the orders of the rotational speed. Hence, irregularities represent an excitation source for the torsional vibrations affecting the whole automotive driveline; these oscillations may result in diminished comfort or in undesirable noise (clonk, rattle, etc. [1]). Usually carmakers face this problem through expensive on-board experimental tests aiming at finding out how to reduce undesired phenomena, oſten requiring a large number of runs. An alternative approach is offered by simulation: obviously the whole transmission has to be accurately mod- elled and the resultant torsional model needs experimental validation. Under these assumptions, torsional models of automotive transmission systems may prove to be essential tools to design and verify the vibrational behaviour of a pow- ertrain. In fact, the knowledge of the transmission transfer function matrix allows predicting the torsional vibration level of the transmission components for a given engine type, in the whole working speed and torque range [2]. e problem of reducing noise and vibrations is widely investigated in all engineering fields: [3] presents a summary of a large study regarding the isolation improvement of many vibration isolation devices, using different structural configurations, based on compressing and torsion rubber elements. Hindawi Publishing Corporation Shock and Vibration Volume 2016, Article ID 5721960, 14 pages http://dx.doi.org/10.1155/2016/5721960
Transcript of Research Article Torsional Oscillations in Automotive ...

Research ArticleTorsional Oscillations in Automotive TransmissionsExperimental Analysis and Modelling
Enrico Galvagno Mauro Velardocchia and Alessandro Vigliani
Dipartimento di Ingegneria Meccanica e Aerospaziale Politecnico di Torino Corso Duca degli Abruzzi 24 10129 Torino Italy
Correspondence should be addressed to Enrico Galvagno enricogalvagnopolitoit
Received 30 July 2015 Revised 21 December 2015 Accepted 28 December 2015
Academic Editor Radoslaw Zimroz
Copyright copy 2016 Enrico Galvagno et al This is an open access article distributed under the Creative Commons AttributionLicense which permits unrestricted use distribution and reproduction in any medium provided the original work is properlycited
The paper investigates the torsional oscillations of an automotive transmission system by means of an experimental test benchused to validate the proposed lumped parameter model The rig consists of a Dual Clutch Transmission (DCT) and a ManualTransmission (MT) connected through the respective output shafts while the excitation is provided by two electric motors whichare controlled in speed or torque The experimental analysis includes the measurement of the external torques applied by the twoelectric motors to the mechanical system and the measurement of the system response in terms of angular speeds at differentpositions along the transmission lineThe frequency response of the system is estimated from the experimental data and comparedwith the results of a 5-degree-of-freedom lumped parametermodel which proves to be adequate to describe the dynamic behaviourof the systemup to a frequency of 200HzThe comparison between simulated results and experimental data shows good agreementso the model can be used to predict the torsional vibrations of the transmission system in the linear field Moreover the effects ofthe nonlinearities associated with the mean value of the excitations are shown Finally the influence of the selected gear ratio onthe experimental frequency response is discussed
1 Introduction
Automotive transmissions are commonly used to transfermechanical power from the prime mover of the vehiclemost frequently an Internal Combustion Engine (ICE) to thewheels Todayrsquos research is oriented towards more efficientand less polluting alternatives yet ICEs still represent themost widely used onboard power source due to their relevantadvantages especially in terms of specific power autonomyand ease of refueling
From a dynamic point of view a drawback is the torqueirregularity mainly due to the combustion process itselfand to the inertial loads of the reciprocating and rotatingmassesThese irregularities show a frequency spectrum quiterich in harmonic content obviously related to the ordersof the rotational speed Hence irregularities represent anexcitation source for the torsional vibrations affecting thewhole automotive driveline these oscillations may result indiminished comfort or in undesirable noise (clonk rattle etc[1])
Usually carmakers face this problem through expensiveon-board experimental tests aiming at finding out how toreduce undesired phenomena often requiring a large numberof runs An alternative approach is offered by simulationobviously the whole transmission has to be accurately mod-elled and the resultant torsional model needs experimentalvalidation Under these assumptions torsional models ofautomotive transmission systems may prove to be essentialtools to design and verify the vibrational behaviour of a pow-ertrain In fact the knowledge of the transmission transferfunctionmatrix allows predicting the torsional vibration levelof the transmission components for a given engine type in thewhole working speed and torque range [2]
The problem of reducing noise and vibrations is widelyinvestigated in all engineering fields [3] presents a summaryof a large study regarding the isolation improvement ofmany vibration isolation devices using different structuralconfigurations based on compressing and torsion rubberelements
Hindawi Publishing CorporationShock and VibrationVolume 2016 Article ID 5721960 14 pageshttpdxdoiorg10115520165721960
2 Shock and Vibration
In the automotive field Dual Mass Flywheels (DMFs)represent examples of devices used to reduce vibrations theyare continuously improved through sophisticated innova-tions (eg inner dampers slide shoes or pendulum-typedampers [4]) The torsional dynamic behaviour of a DMFis investigated both numerically and experimentally in [5]where a lumped parameter model of the torsional test rigconsidering two different models for the DMF damping(viscous and hysteretic) is proposed
Nonlinear torsional models are used to analyse automo-tive transmission rattle problems and find solutions to reducenoise vibration and dynamic loads In [6] the authors showthat the torsional stiffness and inertial distribution of suchsystems represent a numerically stiff problem In additionthe clearance nonlinearities in the gear meshes result in dis-continuous functions both factors affect the efficacy of timedomain integration and smoothening functions are widelyused to overcome computational difficulties and improve thesimulation In [7] a mathematical model for the study ofthe nonlinear torsional vibrations of a one-stage transmis-sion gear system with backlash is presented Four differenttechniques based on discretization method perturbationmethod Ritz method and stepwise time-integration methodmodelled with Simulink are compared in terms of time andfrequency response It has been demonstrated that althoughall the investigatedmethods are accurate and computationallyeffective for finding the main spectral contribution onlydiscretization and step-wise time-integration methods areable to identify the other frequency components
A hybrid modelling technique for the simulation of thetorsional vibration of vehicle driveline systems is proposedin [8] More specifically the driveline is modelled partiallyas a lumped system and partially as a distributed parametersystem the authors show that hybrid modelling allowsidentifying the high frequency components associated withclonk while a simple lumped model cannot
In [9] an experimental activity for the analysis ofclonk phenomenon is shown torsional impulses are appliedthrough a torque preload system to a drivetrain rig in orderto excite high frequency clonk modes Calibrated accelerom-eters are located in various positions along the driveline inorder to record tangential acceleration A typical spectralcomposition for the driveshaft is reported indicating highfrequency contents in the range 15ndash5 kHz
In [10] the experimental and analytical methodologiesfor characterizing the torsional dynamic behaviour of anAutomated Manual Transmission (AMT) and a DMF arediscussed The effects of changing the gear ratio of the AMTin terms of Frequency Response Function (FRF) complianceare shown from themeasures and from the simulation resultsof the proposed model
Other authors [11] propose a method to calculate thevarious time-varying parameters transmission error lengthof contact line meshing stiffness meshing damping coeffi-cient input and output torque dynamic meshing force anddynamic friction force
In case of transmissions with Hookersquos joints as commonin many automotive systems [12] proposes a torsional vibra-tion mathematical model of the transmission shaft driving
gear and driven gear based on lumped masses and the mainreducer system assembly The influence of the angle betweentransmission shafts and intermediate support stiffness on thevibration and noise of the main reducer is obtained andverified experimentally
With regard to the experimental approach the novelapproach proposed in [13] to simulate the actual workingcondition when testing dynamic stiffness is worth citingIn experimental modal analysis of powertrain mountingsystems the method of traditional impact hammer testingmay produce large error and the identification results ofmodal parameters are not reliable while identification usingthe method of operational modal analysis allows obtainingmore accurate and reliable results which are consistent withthe actual working condition
In the first part of the paper the authors describe thetransmission test rig for torsional vibration analysis availableat the Politecnico di Torino discussing its potentialitiesIn particular they address some aspects of the interactionbetween the electric motors control and the mechanical partsof the test rig
The 4-dof lumped parameter model of the tested trans-mission proposed in [14] has been improved here the authorspropose a 5-dof model aiming at analysing the torsionalbehaviour up to higher frequencies The modal shapes andnatural frequencies of the modelled system are discussed andthe FRF matrix is derived
The analysis of the simulation results highlights the effectsof the electric motors control tuning and of some physicalparameters on the system torsional behaviour
The last part of the paper draws some considerationson the postprocessing method to estimate the FrequencyResponse Functions from the experimental data the compar-ison between simulated and experimental results is presentedMoreover some effects of the nonlinearities associated withthe mean value of the excitations are shown and discussedFinally the influence of the selected gear ratio on the experi-mental frequency response is presented
2 Transmission Test Bench
Figure 1 shows the transmission test bench located in theMechanics Laboratory at the Politecnico di Torino Its maincomponents are two electric motors (M1 and M2) andtwo transmission systems for passenger cars with lockeddifferentials that is a Dual Clutch Transmission (DCT) anda Manual Transmission (MT)
As visible in Figure 2 both the DCT and MT gearboxesare used to amplify the torque delivered by the electricmotorsconnected to the respective input shaftsThe twooutput shaftsSA1 and SA2 are connected through a brake disk D
The test bench is equipped with many sensors (encodersand inductive pick-ups to measure speed torque andtemperature transducers) aiming at monitoring the actualdynamic state of the transmission system For torsionalvibration analysis the most relevant sensors are
(i) two torque-meters (T1 and T2 in Figure 2) measur-ing the torque provided by the two electric motors
Shock and Vibration 3
M1M2DCT MT
Figure 1 Transmission test bench at the Politecnico di Torino
EM2
M2
T2
MT
B
D
SA2 SA1
DCT
ED
T1
M1
EM1
Motordrives
Figure 2 Layout of the transmission test bench electric motors (M1 M2) speed sensors (encoders EM1 EM2 and ED) torque sensors(T1T2) disk (D) brake (B) and output half shafts (SA1 SA2)
(ii) three incremental encoders (see Table 1 for the reso-lutions) EM1 and EM2 measure the angular speed ofthe two motors while ED measures the speed of theDCT differential
The test bench is conceived as a Hardware-in-the-Loop(HiL) system aiming at reproducing typical manoeuvresrepresentative of the real usage of a gearbox on a passengercar This goal is achieved through the implementation of asimulation model running and exchanging information inreal time with the physical sensors and actuators of the testbench Some examples of test benches sharing a similar HiLtechnology are reported in [15ndash17]
In Figure 1 from left to right the following componentsare visible
(i) M1 a three-phase induction electric motor used tosimulate the prime mover of the vehicle for examplethe Internal Combustion Engine
(ii) DCT a 6-speed dry Dual Clutch Transmission (seeeg [18] for the kinematic and dynamic behaviour ofthis transmission)
(iii) MT a 6-speed Manual Transmission
Table 1 Data of the encoders
Encoder location Pulses per revolutionEM1 1024ED 9000EM2 4096
(iv) M2 a second three-phase induction electric motorthat simulates the vehicle load that is the aerody-namic and rolling resistance the road slope and thevehicle inertial effects
It is worth noting that the good controllability in terms oftorque and speed of both electric motors allows generatingstandard (eg step sine wave or chirp) and custom excita-tions Moreover speed sensors along the transmission allowmonitoring the dynamical system response
Consequently the torsional vibrations of the transmissionsystem can be investigated the rest of the paper focuses onthis aspect
3 System Model
The linearized lumped parameter model used to study thetorsional behaviour of the dynamic system is depicted in
4 Shock and Vibration
M1 controller
120599ref
1205991
1205991
+
minus
e PI
I1
kDMF
120573DMF
I2
12059921205911
kGB1I3
1205993kSA1
120573SA1
I4
1205994kSA2
120573SA2
1205912
120573GB2120573GB1
I5
1205995
M1 DMF DCT SA1 B SA2 MT M2
TM1
TM2
Figure 3 Torsional model of the test bench
Table 2 Numerical values of the model parameters
Parameter Value Unit1198681 1198682 1198683 1198684 1198685
019 014 012 018 0065 kgm2
119896DMF 119896GB1 119896SA1 119896SA2 046 96 12 149 kNmrad1205731 1205732 1205733 1205734 1205735
02 2 002 034 02 Nmsrad120573SA1 120573SA2 120573GB1 120573GB2 01 01 0 4 Nmsrad
119896119875 119896119868
175 15 NmsradNmrad
1205911
1205912
591 (3rd gear)403 (4th gear) mdash
Figure 3The numerical values of the parameters used for thesimulation are shown in Table 2
The model considers the interaction between themechanical parts and the speedtorque controllers realizedby the electric motor drives
31 Electric Motors Control Electric motor M1 is speed-controlled while motor M2 is torque-controlled A constantspeed is the set point for the M1 controller while motorM2 provides an almost harmonic torque excitation with afrequency varying with time in the desired frequency range
The speed control of the electric motor M1 is imple-mented through a Proportional-Integral (PI) algorithm
119879M1 = 119896119875 (ref minus 1) + 119896119868 int (ref minus 1) 119889119905 (1)
where 119896119875and 119896
119868are the proportional and integral gains
respectivelyUnder the assumption that the speed set point is constant
(ref = const) the former equation can be written in the form
119879M1 = ref (119896119875 + 119896119868 sdot 119905) minus 1198961198681205791 minus 1198961198751 (2)
Equation (2) shows that the integral gain acts as a torsionalstiffness that is the elastic term being 119896
1198681205791 while the
proportional gain acts as a viscous damping the viscous termbeing 119896
1198751
The torque applied by electric motor M2 is a differentmatter In fact considering small oscillations around anequilibrium point and neglecting the constant torque thatthe motors have to deliver to guarantee that steady-statecondition it is not necessary to show explicitly the torqueapplied by the electric motor M2 A harmonic excitationapplied to one of the inertias of the system the one havingmoment of inertia 119868
5in this case is implicit in the receptance
method [19]
32 Torsional System Dynamics A 5-dof torsional system isused to describe the dynamic behaviour of the mechanicalsystem under testThe DCT gearbox is modelled consideringthe gear ratio 120591
1of the actual gear (defined as the ratio
between input and output speed) an overall torsional stiff-ness 119896GB1 of the active transmission path and two momentsof inertia that is part of inertia 119868
2and inertia 119868
3mainly
related to the differentialFor the Dual Mass Flywheel of the DCT installed on the
test bed a low stiffness spring 119896DMF and a viscous damperwith damping coefficient 120573DMF are introduced in the modelThe moment of inertia of the first DMF mass is added to theM1 rotor inertia just before the spring and damper elementwhile the secondmass is added to the equivalent inertia of theDCT (except its differential) evaluated at its input shaft
The second gearboxnamedMT ismodelled as simple gearpairs characterised by the actual gear ratio 120591
2with unitary
efficiency The MT total moment of inertia is reflected to theinput shaft and constitutes a part of inertia 119868
5
The two half shafts SA1 and SA2 aremodelled as elementspossessing torsional elastic and damping characteristics
The generalized coordinates are the angularpositions of each flywheel composing the system119902 = 1205791 1205792 1205793 1205794 1205795
119879
Shock and Vibration 5
1st mode f1 = 1Hz
2nd mode f2 = 101Hz
3rd mode f3 = 146Hz
4th mode f4 = 622Hz
5th mode f5 = 1517Hz
I1 I2 I3 I4 I5
Figure 4 Natural frequencies and mode shapes computed from the simulation model
The equations of motion of the torsional system depictedin Figure 3 are
11986811+ 119896DMF (1205791 minus 1205792) + 120573DMF (1 minus 2) + 12057311
+ 119879M1 = 0
11986822+ (1205732+120573GB11205912
1
) 2minus 119896DMF (1205791 minus 1205792)
minus 120573DMF (1 minus 2) minus119896GB11205911
(1205793minus1205792
1205911
) = 0
11986833+ 12057333+ 119896GB1 (1205793 minus
1205792
1205911
) + 119896SA1 (1205793 minus 1205794)
+ 120573SA1 (3 minus 4) = 0
11986844+ 12057344+ 119896SA2 (1205794 minus
1205795
1205912
) + 120573SA2 (4 minus5
1205912
)
+ 119896SA1 (1205794 minus 1205793) + 120573SA1 (4 minus 3) = 0
11986855+ (1205735+120573GB21205912
2
) 5minus119896SA21205912
(1205794minus1205795
1205912
)
minus120573SA21205912
(4minus5
1205912
) = 0
(3)
which can be cast in matrix form
[119872] + [119861] + [119870] 119902
= 1 0 0 0 0119879
ref 1 (119896119875 + 119896119868119905) (4)
where the mass damping and stiffness matrices are reportedin the appendix
33 Natural Frequencies and Mode Shapes By solving theeigenvalue problem associated with the undamped systemthat is
([119870] minus 1205961198942[119872]) 120595
119894= 0 119894 = 1 5 (5)
it is possible to compute the natural frequencies 119891119894= 1205961198942120587
and the associated modal shapes described by the naturalmodes or modal vectors 120595
119894
The mode shapes are normalized so that the modulus ofthe maximum element of each eigenvector is unitary
Moreover due to the presence of two gear ratios that isthe transmission ratio of the two gearboxes it is convenient toshow the eigenvectors referred to the same shaft for examplethe shaft of the electric motor M1 As an example the 119903theigenvector is scaled as follows
120595119903M1 = 1205951 1205952 12059111205953 12059111205954
1205911
1205912
1205955
119879
119903
(6)
Figure 4 shows the natural frequency and the mode shapereferred to M1 shaft for each of the five vibration modes
The first low frequency mode (asymp1 Hz) is almost a rigidbody mode and is primarily associated with the electricmotor speed controller Increasing the integral gain 119896
119868of the
PI controller determines an increase of the first resonancefrequency of the system while increasing the proportionalgain 119896
119875raises the damping factor relative to the first mode
(Figures 5 and 6)The second mode is the first real torsional mode of the
systemThe 2nd and 3rd natural frequencies are very close toeach other (approximately 10Hz for the second and 15Hz forthe third) hence their individual effects combine to give riseto a single peak in the frequency response at an intermediatefrequency between the two that is 125Hz A larger inertiaof the electric motor M1 (119868
1) reduces that frequency while
a bigger mass of the second flywheel (1198682) amplifies the peak
6 Shock and VibrationM
agni
tude
(rad
sN
m)
0
90
Phas
e (de
g)
Frequency (Hz)
100
10minus1
10minus2
100 101 102
Frequency (Hz)100 101 102
minus90
kI = 75NmradkI = 15NmradkI = 225Nmrad
Figure 5 Sensitivity analysis results effect of the integral gain of thePI speed controller on the FRF
51198795
Mag
nitu
de (r
ads
Nm
)
0
90
Phas
e (de
g)
Frequency (Hz)
100
10minus1
10minus2
100 101 102
Frequency (Hz)100 101 102
minus90
kP = 175NmsradkP = 35NmsradkP = 525Nmsrad
Figure 6 Sensitivity analysis effect of the proportional gain of thePI speed controller on the FRF
51198795
amplitude Increasing the half-shaft stiffness shifts the peakto higher frequencies If the DMF damping is small enoughthere are two separate peaks increasing damping initiallyflattens the two peaks and then produces an increase of thesingle peak amplitude (Figure 7)
The last two high frequency modes show a very similarcharacteristic in both cases a single inertia vibrates withrespect to the remaining part of the driveline which stayspractically stationary The 4th mode is at about 62Hz and
Mag
nitu
de (r
ads
Nm
)
0
90
Phas
e (de
g)
Frequency (Hz)
100
10minus1
10minus2
100 101 102
Frequency (Hz)100 101 102
minus90
120573DMF = 075Nmsrad120573DMF = 225Nmsrad120573DMF = 75Nmsrad
Figure 7 Sensitivity analysis effect of the DMF damping coefficienton the FRF
51198795
involves mainly the brake disk inertia 1198684 while the 5th mode
(152Hz) is due to the vibration of the DCT differential1198683 Therefore the dynamic behaviour of the system and its
sensitivity to the parameters in the neighbourhood of thecorrespondent natural frequency are similar to those of a 1-dof system As an example the equivalent 1-dof system forthe 4th mode is composed of inertia 119868
4 stiffness 119896SA1 + 119896SA2
and damping 1205733
34 Frequency Response Functions The response of a vis-cously damped 119899-dof system to a harmonic excitation canbe calculated by means of the receptance matrix 120572(Ω)relating the displacement of each degree of freedom 120579
119894to the
excitation 119879 as a function of frequency
1205790 = [120572 (Ω)] 1198790 (7)
where 1198790 is a real vector of constant amplitudes while 120579
0 is
a complex vectorMatrix120572(Ω) can be calculated as the inverseof the dynamic stiffness matrix that is
[120572 (Ω)] = [119870dyn]minus1
= ([119870] + 119895Ω [119861] minus Ω2[119872])minus1
(8)
The measures on the test bench are angular speeds andtorques hence the FRFs to be computed from the modelare the ratios between these two quantities called mobilityfunctions [19]
If motion is harmonic the relationship between speedand angular position amplitudes is
0= 119895Ω120579
0(9)
so that
0 = 119895Ω [120572 (Ω)] 1198790 (10)
Shock and Vibration 7
0 20 40 60 80 100 120405060708090
(Nm
)Torques
0 20 40 60 80 100 12020406080
100
(Nm
)
0 20 40 60 80 100 120100200300400500
(Nm
)
Time (s)
Time (s)
Time (s)
TT1
TT2
TSA1
(a)
0 20 40 60 80 100 120450
500
550
Speeds
(rpm
)
0 20 40 60 80 100 120250300350400450
(rpm
)
0 20 40 60 80 100 1207580859095
Time (s)
Time (s)
Time (s)
(rpm
)
nM1
nM2
nDiff
(b)
Figure 8 Time histories of the torques (a) and the speeds (b) during a chirp test
More specifically the harmonic torque 1198795is applied from
electric motor M2 to the 5th inertia of the system con-sequently the only element of 119879
0 different from zero is
the fifth one (1198790 = 119879
00 0 0 0 1
119879
) so that the set ofequations representing the frequency response of each degreeof freedom contains only the fifth column of the receptancematrix
1
2
3
4
5
1198795
= 119895Ω
12057215(Ω)
12057225(Ω)
12057235(Ω)
12057245(Ω)
12057255(Ω)
(11)
As explained in [10] the torque measured on the bench isnot directly the excitation since the sensor T2 is mountedon the output shaft that is downstream the electric motorinertia and the bearing damping Consequently the followingequation must be considered
119894
119879T2= (
119894
1198795
) sdot (1 + 119868M2Ω2 1205995
1198795
minus 1198885119895Ω
1205995
1198795
)
minus1
(12)
Alternatively themechanical systemupstreamof themeasur-ing pointmust be neglected in themodel that is themodel ofthe system must not take into account the mechanical modelof the electric motor that excites the system
4 Experimental Tests
During a torsional vibration test one electricmotor (egM2)produces a sinusoidal torque having almost constant ampli-tude and continuously variable frequency (torque control is
enabled for this motor) while the second motor (M1) tries tokeep the speed of its shaft constant (closed-loop speed controlmode enabled)
It should be noted that before the torsional excitationstarts the systemmust be brought to a steady-state conditionthat is constant speed and torque where the behaviour of thesystem can be linearized A torque offset must be thereforeconstantly applied and added to the harmonic trend duringthe test in order to have approximately constant systemparameters for example no appreciable stiffness variationsand no crossing of the line of zero torque to avoid thenonlinear phenomena associated with load reversal (impactbetween rotating components due to backlash)
Time histories of the torques applied by the two electricmotors are measured and collected together with the angularspeeds in three points of the transmission line (Figure 8)
The sinusoidal torque set point is
119879ref 5 = 1198790 + sin (2120587119891 (119905) 119905) (13)
with constant amplitude and frequency 119891 varying as a powerfunction of time (logarithmic chirp) that is
119891 (119905) = 1198910sdot (
1198911
1198910
)
1199051199051
(14)
The logarithmic trend can be clearly seen in Figure 9 showingthe spectrogramof the torquemeasured by sensor T2 A 12th-order related vibration probably due to the torque generationsystem of the electric machine is also visible in the sameplot
A postprocessing tool based on the 1198671estimator (see
eg [10 20] for details) applied to the acquired data allows
8 Shock and Vibration
20 40 60 80 100 120Time (s)
0
20
40
60
80
100
120
140
160
180
200
Freq
uenc
y (H
z)
10
20
30
40
50
60
12x
Excitation frequency f(t) Torq
ue (d
B re
f1N
m)
Figure 9 Time-frequency spectrogram of torque 119879M2
obtaining the transfer functions between the input torqueapplied by the electric motor M2 and the rotational speeds
Even if an external load is applied by both electricmotorsa single-input multiple-output (SIMO) approach can be usedto analyse the dynamic behaviour of the system The closed-loop speed controller of the electric motor must become partof the system under test and so its mathematical descriptionis included in the model
Figures 10ndash12 show the FRFs estimated from themeasurestogether with the coherence functions Since the excitationfor the dynamic system is generated by electricmotorM2 theamplitude of the response
5is high enough to be measured
accurately by the encoder up tomore than 150HzConverselythe lower amplitude of oscillation of the other electric motorM1 due also to the lower sensor resolution limits the range ofreliability of
11198795to 20Hz
The sensors used to measure the angular velocity of thethree instrumented shafts are incremental encoders havingdifferent resolutions as shown in Table 1 High-resolutionencoders allow extending the frequency analysis towardshigher frequencies As an example even if the amplitude ofthe oscillation at the differential output is low (see Figure 12)the FRF shows a clear trend up to more than 150Hz
Under the assumption that the system under test is linear(at least in the neighborhood of the equilibrium point aroundwhich the system vibrates) and time-invariant the estimationof a FRF from experimental data can be performed bycalculating the Power Spectral Density (PSD) and the Cross-Power Spectral Density (CSD)
The method generally used for computing these twoquantities isWelchrsquos method [21] it allows better noise reduc-tion in comparison with the standard periodogram spectrumestimating method or Bartlettrsquos method that averages theestimates derived from contiguous nonoverlapping portionsof the original signal
Welchrsquos method instead is based on time averaging overshort windowed periodograms applied to overlapping seg-ments
The PSD estimate using Welchrsquos method is
119909119909(119896) =
119878119875
119872
119872
sum
119898=1
1003816100381610038161003816119883119908119898 (119896)1003816100381610038161003816
2
119896 = 1 2 119873
2 (15)
where hat symbol denotes the estimated functions119872 is thenumber of segments having length 119873 119878
119875is a scaling factor
and 119883119908119898
(119896) is the Discrete Fourier Transform (DFT) of the119898th windowed segment that is
119883119908119898
(119896) = DFT [119909119898(119899) sdot 119908 (119899)] (16)
where 119909119898(119899) is the 119898th data segment 119908(119899) is the window
applied to each segment and 119899 is the identifier of each samplein the data segment The time blocks in which the total timehistories of the two measures are subdivided are overlappedthus decreasing the random error of the estimate
As stated in [21] when calculating PSD and CSD therandom error is influenced by windowing and overlap pro-cessing more specifically with increasing overlap percentageat first we get a substantial reduction in the variance forincreasing overlap while above a particular overlap percent-age the additional gain is very small Since the experimentallyevaluated FRF using 119867
1estimator is the ratio between CSD
and PSD the same concepts apply also for the FRF varianceas illustrated in Figure 13 where the effect of the percentageof overlap used during the averaging process on the quality ofthe estimated FRF is shown
The influence of some nonlinearities of the system isshown in Figure 14 plotting the modulus of the FRF betweenthe desired torque 119879ref 5 and the actual value 119879fb5 measuredthrough torque meter T2 for three different values of themean value of M2 torque an increase of the mean valuecauses larger amplitude of the FRF
Finally Figure 15 shows the influence of different gearratios on the FRF The most relevant consequences are afrequency shift of the first FRF peak and the increase of thepeaks amplitude
41 Model Order Selection The model development wasdriven for simplicity issues by the will to use the minimumnumber of dof necessary to describe the system dynamics inthe frequency range of interest
It must be observed that since every mechanical systemhas distributed properties (inertial elastic and dissipative)the choice of the positionwhere the inertias should be lumpedis not always obvious especially if the frequency range ofinterest increases As an example the first modelling attemptwas to use only 4 dof the DCT was simply modelled asdone for MT Comparing experimental and simulated FRFssignificant differences in phase and the lack of a peak inthe magnitude at about 150Hz were observed as reportedin Figure 16 the additional dof in correspondence of thedifferential of the DCT allows increasing the accuracy of theestimate
Shock and Vibration 9
Mag
nitu
de 100
10minus1
10minus2
Frequency (Hz)100 101 102
(rad
sN
m)
(a)
090
180
Phas
e (de
g)
Frequency (Hz)100 101 102
minus90
(b)
0
05
1
Frequency (Hz)
Mag
nitu
de
100 101 102
Coherence function 1205742
(c)
Figure 10 FRF 51198795 modulus (a) phase (b) and coherence function (c)
Mag
nitu
de 100
10minus2
10minus4
Frequency (Hz)100 101 102
(rad
sN
m)
(a)
090
minus180
Phas
e (de
g)
Frequency (Hz)100 101 102
minus360
(b)
0
05
1
Frequency (Hz)
Mag
nitu
de
100 101 102
Coherence function 1205742
(c)
Figure 11 FRF 11198795 modulus (a) phase (b) and coherence function (c)
Frequency (Hz)100 101 102
Mag
nitu
de
10minus2
10minus3
10minus1
10minus4(rad
sN
m)
(a)
minus630minus450minus270minus90
90
Phas
e (de
g)
Frequency (Hz)100 101 102
(b)
0
05
1
Mag
nitu
de
Frequency (Hz)100 101 102
Coherence function 1205742
(c)
Figure 12 FRF 31198795 modulus (a) phase (b) and coherence function (c)
10 Shock and Vibration
OL = 10
OL = 25
OL = 50
OL = 95
Mag
nitu
de (r
ads
Nm
)
100
10minus1
10minus2
Mag
nitu
de (r
ads
Nm
)
100
10minus1
10minus2
Mag
nitu
de (r
ads
Nm
)100
10minus1
10minus2
Mag
nitu
de (r
ads
Nm
)
100
10minus1
10minus2
Frequency (Hz)100 101 102
Frequency (Hz)100 101 102
Frequency (Hz)100 101 102
Frequency (Hz)100 101 102
Figure 13 Overlap effect on the estimated FRF 51198795with Hamming window (windows length 25 s)
5 Model Validation
The plots reported in Figures 17ndash19 show the comparisonbetween the simulated FRF calculated numerically by eval-uating (11) and the FRF estimated from the experimentalresults that is using the measures of torque and speed on thetest rig
The correspondence between simulated and experimen-tal curves is excellent in case of FRFs
51198795and 31198795in both
modulus and phase Similarly Figure 18 (FRF 11198795) shows
a fairly good correspondence for both modulus and phaseup to the limit of reliability of the experimental data (20Hz)The frequency and amplitude of the resonance peaks are wellcaptured by the model
51 Results Analysis A quantitative comparison between themeasured and simulated FRFs is given in Table 3 (it mustbe underlined that results for FRFs
21198795and
41198795are not
shown due to lack of experimental measures)The root mean
Table 3 Estimation error for FRFs 11198795 31198795 and
51198795
FRF 119891max[Hz]
RMS (exp-sim)Magnitude[radsNm] Phase [∘]
11198795
200 135119864 minus 02 53321 140119864 minus 02 30
31198795 200 300119864 minus 03 45
51198795
200 320119864 minus 02 8170 340119864 minus 02 29
square (RMS) of the difference between the experimental andthe simulated magnitude and phase of the FRFs is the indexchosen to evaluate the model accuracy
The results concerning the first FRF (11198795) are affected
by a relevant phase RMS difference if the whole frequency
Shock and Vibration 11
minus30
minus25
minus20
minus15
minus10
minus5
0
5
10
15
Frequency (Hz)
Mag
nitu
de (d
B)
100 101 102
TM2 mean = 40NmTM2 mean = 60NmTM2 mean = 80Nm
Figure 14 Effect of the mean value on the modulus of the FRF119879fb5119879ref 5
MT 3rd gear engagedMT 4th gear engaged
minus30
minus25
minus20
minus15
minus10
minus5
0
5
10
Frequency (Hz)
Mag
nitu
de (d
B)
100 101 102
Figure 15 Effect of the gear ratio on the modulus of the FRF119879fb5119879ref 5
range that is up to a maximum frequency 119891max = 200Hzis considered This is due to the low resolution of encoderM1 with respect to the angular displacement to measuretherefore the error at high frequencies is mainly attributableto errors in the experimental measures rather than to themodel as also confirmed by the coherence function thatdrops to zero very quickly after 21Hz (see Figure 11) Limitingthe maximum frequency to 21Hz that is up to the valuefor which the experimental data are reliable the phase errorbecomes significantly smaller
FRF 31198795is very well estimated in the whole frequency
range the shapes of the experimental magnitude and phase
Mag
nitu
de (r
ads
Nm
)
minus450
minus270
minus90
90
Phas
e (de
g)
ExpSim 5-dofSim 4-dof
Frequency (Hz)100 101 102
Frequency (Hz)100 101 102
100
10minus2
10minus4
10minus6
10minus8
FRF 120596DiffTM2
Figure 16 Tuning of the model order with the experimental FRF
trends are well captured by the model as visible in Figure 19and the accuracy of themeasure is also adequate up to 200Hzdue to the high encoder resolution thus resulting in smallRMS errors for both magnitude and phase
TwoRMSvalues are calculated for FRF 51198795 the first one
is on the whole frequency range while the second is limitedto 70Hz As visible also qualitatively fromFigure 17 the accu-racy of the estimation decreases significantly immediatelyafter the third peak in magnitude Probably an additionaldegree of freedom is needed in order to extend the validity ofthemodel up to 200Hz also for this FRF further investigationis required in order to solve this issue
6 Conclusions
The torsional vibrations of a transmission system mountedon a test rig have been investigated and a reliable lumpedparameter model has been developed A sensitivity anal-ysis highlighting the effect of the electric motors controltuning and other model parameters on the global torsionalbehaviour is presented
The first highly damped torsional mode of the transmis-sion system (asymp1 Hz) is almost a rigid body mode and it isprimarily associated with the electric motor speed controller
The second mode is the first real torsional mode of thesystemThe 2nd and 3rd natural frequencies are very close toeach other hence their individual effects combine to give riseto a single peak in the FRFs at about 125Hz
The 4th and 5th modes represent the vibrations of thebrake disk (inertia 119868
4) and of the DCT differential (inertia
12 Shock and Vibration
ExpSim
Mag
nitu
de (r
ads
Nm
)
Frequency (Hz)100 101 102
100
10minus1
10minus2
(a)
ExpSim
minus90
0
90
Phas
e (de
g)
Frequency (Hz)100 101 102
(b)
Figure 17 FRF of 51198795 modulus (a) and phase (b)
Mag
nitu
de (r
ads
Nm
)
ExpSim
Frequency (Hz)100 101 102
10minus2
10minus4
10minus6
(a)
minus720minus540minus360minus180
0
Phas
e (de
g)
ExpSim
Frequency (Hz)100 101 102
(b)
Figure 18 FRF 11198795 modulus (a) and phase (b)
Mag
nitu
de (r
ads
Nm
)
100
ExpSim
Frequency (Hz)100 101 102
10minus1
10minus3
10minus5
(a)
minus630
minus450
minus270
minus90
90
Phas
e (de
g)
ExpSim
Frequency (Hz)100 101 102
(b)
Figure 19 FRF 31198795 modulus (a) and phase (b)
1198683) with respect to the remaining part of the driveline that
remains practically stationaryComparing experimental and simulated results the paper
shows where to concentrate the model parameters of thetransmission system in order to obtain an accurate estimationof the experimental frequency response Adding a dof repre-senting the DCT differential inertia results in an additional
peak in the frequency response and shifts up the phase at highfrequencies according to the experimental results
The comparison with the results obtainable with mod-els using a smaller number of degrees of freedom showsthat five dof is an appropriate choice to describe thelinear torsional system behaviour up to a frequency of200Hz
Shock and Vibration 13
The nonlinear behaviour of the system under test ishighlighted through specific measurements an increase ofthe mean torque value applied during the tests causes largermagnitudes of the FRF Also the influence of the actual gearof the MT has been experimentally investigated the mostrelevant consequence is a frequency shift of a FRF peak
Appendix
System Matrices
Mass stiffness and damping matrices are as follows
[119872] = diag (1198681 1198682 1198683 1198684 1198685)
[119861] =
[[[[[[[[[[[[[[
[
120573DMF + 1205731 + 119896119875 minus120573DMF 0 0 0
minus120573DMF 120573DMF + 1205732 +120573GB11205912
1
0 0 0
0 0 1205733+ 120573SA1 minus120573SA1 0
0 0 minus120573SA1 120573SA1 + 120573SA2 + 1205734 minus120573SA21205912
0 0 0 minus120573SA21205912
1205735+120573GB21205912
2
]]]]]]]]]]]]]]
]
[119870] =
[[[[[[[[[[[[[[
[
119896DMF + 119896119868 minus119896DMF 0 0 0
minus119896DMF 119896DMF +119896GB11205912
1
minus119896GB11205911
0 0
0 minus119896GB11205911
119896GB1 + 119896SA1 minus119896SA1 0
0 0 minus119896SA1 119896SA1 + 119896SA2 minus119896SA21205912
0 0 0 minus119896SA21205912
119896SA21205912
2
]]]]]]]]]]]]]]
]
(A1)
As stated in Section 31 with regard to the electric motorcontrol it is worth observing that the proportional gain 119896
119875
appears in the damping matrix while the integral gain 119896119868
appears in the stiffness matrix
Symbols and Abbreviations
B BrakeCSD Cross-Power Spectral DensityD Brake diskDCT Dual Clutch TransmissionDFT Discrete Fourier Transformdof Degree of freedomDiff DCT differentialDMF Dual Mass FlywheelE EncoderFRF Frequency Response FunctionHiL Hardware-in-the-Loop119868 Mass moment of inertiaICE Internal Combustion EngineM1M2 Electric motorsMT Manual TransmissionPSD Power Spectral DensitySA1SA2 Half shafts119896 Torsional stiffness119895 Imaginary unit
120573 Viscous damping coefficient120579 Angular position speed and acceleration1205911 Gear ratio (inout) of the DCT
1205912 Gear ratio of the MT
Ω Angular frequency119879 TorqueT1T2 Torque sensors[120572] Receptance matrix[119861] Damping matrix[119870] Stiffness matrix[119872] Mass matrix120595119894 119894th natural mode
120596119894 Natural frequency of 119894th mode
Conflict of Interests
The authors declare that there is no conflict of interestsregarding the publication of this paper
References
[1] P Bellomo N De Vito C Lang and L Scamardi ldquoIn depthstudy of vehicle powertrains to identify causes of loose com-ponents rattle in transmissionsrdquo SAE Technical Paper 2002-01-0702 2002
14 Shock and Vibration
[2] E Galvagno D Morina A Sorniotti and M VelardocchialdquoDrivability analysis of through-the-road-parallel hybrid vehi-clesrdquoMeccanica vol 48 no 2 pp 351ndash366 2013
[3] S Nastac and A Leopa ldquoNew structural configurationsfor vibroisolation devices with high isolation performancesrdquoWSEAS Transactions on Applied andTheoretical Mechanics vol3 no 5 pp 155ndash164 2008
[4] L Q Song L P Zeng S P Zhang J D Zhou and H E NiuldquoDesign and analysis of a dual mass flywheel with continuouslyvariable stiffness based on compensation principlerdquoMechanismand Machine Theory vol 79 pp 124ndash140 2014
[5] E Galvagno M Velardocchia A Vigliani and A Tota ldquoExper-imental analysis and model validation of a dual mass flywheelfor passenger carsrdquo in Proceedings of the SAE World Congressamp Exhibition SAE Technical Paper no 2015-01-1121 pp 1ndash8Detroit Mich USA April 2015
[6] Z Zhang R Singh and A R Crowther ldquoLimitations ofsmoothening functions for automotive vibro-impact problemsrdquoShock and Vibration vol 18 no 1-2 pp 397ndash406 2011
[7] A Farshidianfar H Moeenfard and A Rafsanjani ldquoFrequencyresponse calculation of non-linear torsional vibration in gearsystemsrdquo Proceedings of the Institution of Mechanical EngineersPart K Journal of Multi-body Dynamics vol 222 no 1 pp 49ndash60 2008
[8] A Farshidianfar M Ebrahimi and H Bartlett ldquoHybrid mod-elling and simulation of the torsional vibration of vehicledriveline systemsrdquo Proceedings of the Institution of MechanicalEngineers Part D Journal of Automobile Engineering vol 215no 2 pp 217ndash229 2001
[9] M T Menday H Rahnejat and M Ebrahimi ldquoClonk anonomatopoeic response in torsional impact of automotive driv-elinesrdquo Proceedings of the Institution of Mechanical EngineersPart D vol 213 no 4 pp 349ndash357 1999
[10] E Galvagno A Tota M Velardocchia and A Vigliani ldquoTestbench characterisation and frequency domain torsional modelvalidation of transmission systems and componentsrdquo in Pro-ceedings of the TrC-IFToMM Symposium onTheory of Machinesand Mechanisms pp 1ndash9 Izmir Turkey June 2015
[11] Q Chang LHou Z Sun YWei andY You ldquoNonlinearmodel-ing of helical gear pair with friction force and frictional torquerdquoWSEAS Transactions on Applied andTheoretical Mechanics vol9 no 1 pp 264ndash274 2014
[12] X Jinli S Xingyi and P Bo ldquoNumerical analysis and demon-stration transmission shaft influence on meshing vibration indriving and driven gearsrdquo Shock andVibration vol 2015 ArticleID 365084 10 pages 2015
[13] Y Jin J Zhang and X Guan ldquoTheoretical calculation andexperimental analysis of the rigid body modes of powertrainmounting systemrdquo WSEAS Transactions on Applied and Theo-retical Mechanics vol 8 no 3 pp 193ndash201 2013
[14] E Galvagno G R Guercioni and M Velardocchia ldquoExperi-mental analysis and modeling of transmission torsional vibra-tionsrdquo in Proceedings of the 6th International Conference onAutomotive and Transportation Systems (ICAT rsquo15) SalernoItaly June 2015
[15] A S Mendes and P S Meirelles ldquoApplication of the hardware-in-the-loop technique to an elastomeric torsional vibrationdamperrdquo SAE International Journal of Engines vol 6 no 4 pp2004ndash2014 2013
[16] A Sorniotti N DrsquoAlfio E Galvagno A Morgando and FAmisano ldquoHardware-in-the-loop testing of automotive controlsystemsrdquo SAE Technical Paper 2006-01-1962 2006
[17] G Bracco E Giorcelli G Mattiazzo V Orlando and MRaffero ldquoHardware-In-the-Loop test rig for the ISWEC waveenergy systemrdquoMechatronics vol 25 pp 11ndash17 2015
[18] E Galvagno M Velardocchia and A Vigliani ldquoDynamic andkinematic model of a dual clutch transmissionrdquoMechanism andMachine Theory vol 46 no 6 pp 794ndash805 2011
[19] L Meirovitch Fundamentals of Vibrations International Edi-tion McGraw-Hill 2001
[20] A Brandt Noise and Vibration AnalysismdashSignal Analysis andExperimental Procedures John Wiley amp Sons Chichester UK2010
[21] P D Welch ldquoThe use of fast Fourier transform for the estima-tion of power spectra a method based on time averaging overshortmodified periodogramsrdquo IEEETransactions onAudio andElectroacoustics vol 15 no 2 pp 70ndash73 1967
International Journal of
AerospaceEngineeringHindawi Publishing Corporationhttpwwwhindawicom Volume 2014
RoboticsJournal of
Hindawi Publishing Corporationhttpwwwhindawicom Volume 2014
Hindawi Publishing Corporationhttpwwwhindawicom Volume 2014
Active and Passive Electronic Components
Control Scienceand Engineering
Journal of
Hindawi Publishing Corporationhttpwwwhindawicom Volume 2014
International Journal of
RotatingMachinery
Hindawi Publishing Corporationhttpwwwhindawicom Volume 2014
Hindawi Publishing Corporation httpwwwhindawicom
Journal ofEngineeringVolume 2014
Submit your manuscripts athttpwwwhindawicom
VLSI Design
Hindawi Publishing Corporationhttpwwwhindawicom Volume 2014
Hindawi Publishing Corporationhttpwwwhindawicom Volume 2014
Shock and Vibration
Hindawi Publishing Corporationhttpwwwhindawicom Volume 2014
Civil EngineeringAdvances in
Acoustics and VibrationAdvances in
Hindawi Publishing Corporationhttpwwwhindawicom Volume 2014
Hindawi Publishing Corporationhttpwwwhindawicom Volume 2014
Electrical and Computer Engineering
Journal of
Advances inOptoElectronics
Hindawi Publishing Corporation httpwwwhindawicom
Volume 2014
The Scientific World JournalHindawi Publishing Corporation httpwwwhindawicom Volume 2014
SensorsJournal of
Hindawi Publishing Corporationhttpwwwhindawicom Volume 2014
Modelling amp Simulation in EngineeringHindawi Publishing Corporation httpwwwhindawicom Volume 2014
Hindawi Publishing Corporationhttpwwwhindawicom Volume 2014
Chemical EngineeringInternational Journal of Antennas and
Propagation
International Journal of
Hindawi Publishing Corporationhttpwwwhindawicom Volume 2014
Hindawi Publishing Corporationhttpwwwhindawicom Volume 2014
Navigation and Observation
International Journal of
Hindawi Publishing Corporationhttpwwwhindawicom Volume 2014
DistributedSensor Networks
International Journal of
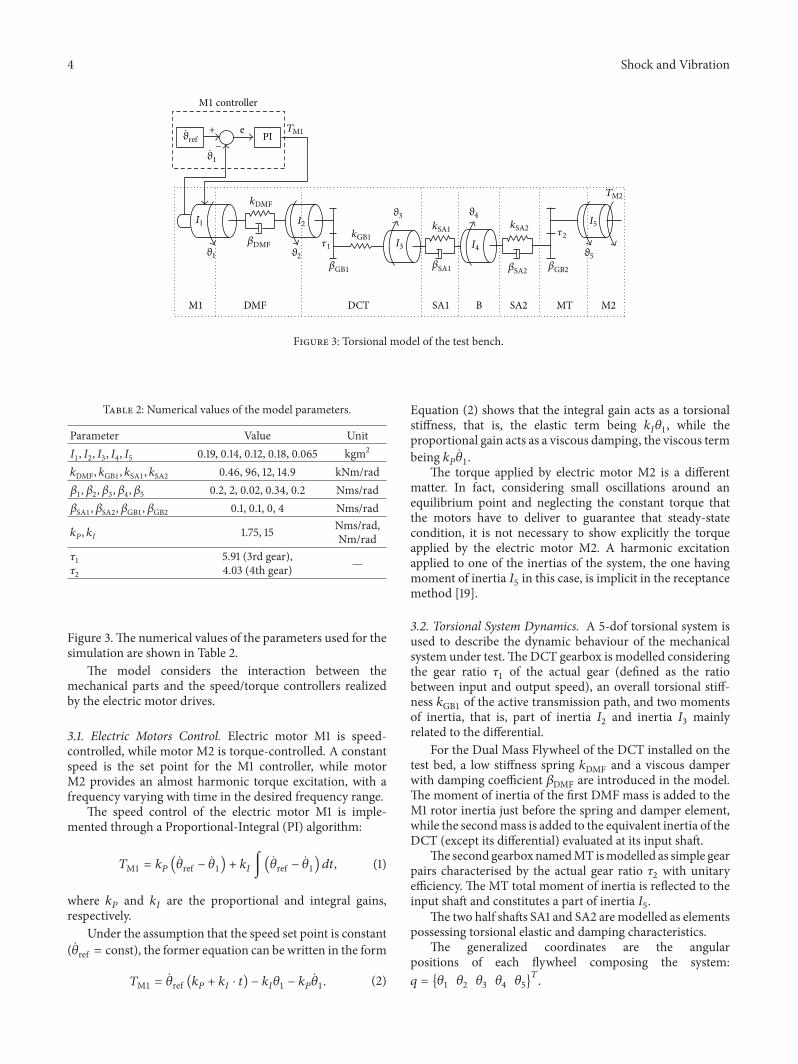
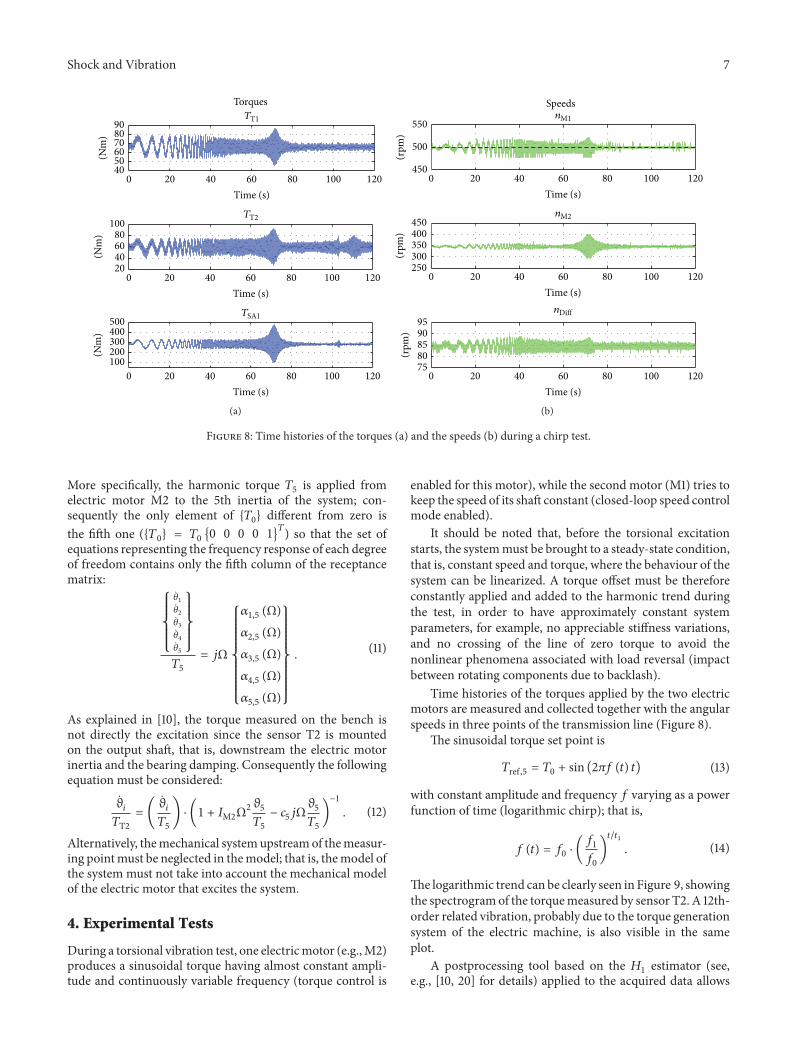

International Journal of
AerospaceEngineeringHindawi Publishing Corporationhttpwwwhindawicom Volume 2014
RoboticsJournal of
Hindawi Publishing Corporationhttpwwwhindawicom Volume 2014
Hindawi Publishing Corporationhttpwwwhindawicom Volume 2014
Active and Passive Electronic Components
Control Scienceand Engineering
Journal of
Hindawi Publishing Corporationhttpwwwhindawicom Volume 2014
International Journal of
RotatingMachinery
Hindawi Publishing Corporationhttpwwwhindawicom Volume 2014
Hindawi Publishing Corporation httpwwwhindawicom
Journal ofEngineeringVolume 2014
Submit your manuscripts athttpwwwhindawicom
VLSI Design
Hindawi Publishing Corporationhttpwwwhindawicom Volume 2014
Hindawi Publishing Corporationhttpwwwhindawicom Volume 2014
Shock and Vibration
Hindawi Publishing Corporationhttpwwwhindawicom Volume 2014
Civil EngineeringAdvances in
Acoustics and VibrationAdvances in
Hindawi Publishing Corporationhttpwwwhindawicom Volume 2014
Hindawi Publishing Corporationhttpwwwhindawicom Volume 2014
Electrical and Computer Engineering
Journal of
Advances inOptoElectronics
Hindawi Publishing Corporation httpwwwhindawicom
Volume 2014
The Scientific World JournalHindawi Publishing Corporation httpwwwhindawicom Volume 2014
SensorsJournal of
Hindawi Publishing Corporationhttpwwwhindawicom Volume 2014
Modelling amp Simulation in EngineeringHindawi Publishing Corporation httpwwwhindawicom Volume 2014
Hindawi Publishing Corporationhttpwwwhindawicom Volume 2014
Chemical EngineeringInternational Journal of Antennas and
Propagation
International Journal of
Hindawi Publishing Corporationhttpwwwhindawicom Volume 2014
Hindawi Publishing Corporationhttpwwwhindawicom Volume 2014
Navigation and Observation
International Journal of
Hindawi Publishing Corporationhttpwwwhindawicom Volume 2014
DistributedSensor Networks
International Journal of


![Mobile Automotive [Ninjamarketing - Francesco Piccolo]]](https://static.fdocumenti.com/doc/165x107/54bbccab4a7959f91a8b45cd/mobile-automotive-ninjamarketing-francesco-piccolo.jpg)