
premio firenze university press tesi di dottorato – 18 · Paolo Felli, Facoltà di Architettura...
68
premio firenze university press tesi di dottorato – 18 –
Transcript of premio firenze university press tesi di dottorato – 18 · Paolo Felli, Facoltà di Architettura...

premio firenze university presstesi di dottorato
– 18 –

Collana Premio Tesi di doTToraTo Commissione giudicatrice, anno 2010
luigi lotti, Facoltà di Scienze Politiche (Presidente della Commissione)
Fortunato Tito arecchi, Facoltà di Scienze MFN Vincenzo Collotti, Facoltà di Lettere e Filosofia Paolo Felli, Facoltà di Architettura ada Fonzi, Facoltà di Psicologia Pelio Fronzaroli, Facoltà di Lettere e Filosofia roberto Genesio, Facoltà di Ingegneria Ferrando mantovani, Facoltà di Giurisprudenza mario Pio marzocchi, Facoltà di Farmacia salvo mastellone, Facoltà di Scienze della Formazioneadolfo Pazzagli, Facoltà di Medicina e Chirurgia Giancarlo Pepeu, Facoltà di Medicina e Chirurgia Franco scaramuzzi, Facoltà di AgrariaPiero Tani, Facoltà di Economia Fiorenzo Cesare Ugolini, Facoltà di Agraria

Cristina Polito
Molecular imaging in Parkinson’s disease
Firenze University Press2011

Immagine di copertina: © Luk Cox | Dreamstime.com
© 2011 Firenze University PressUniversità degli Studi di FirenzeFirenze University PressBorgo Albizi, 2850122 Firenze, Italyhttp://www.fupress.com/
Printed in Italy
Molecular imaging in Parkinson’s disease / Cristina Polito. – Firenze : Firenze University Press, 2011.(Premio FUP. Tesi di dottorato ; 18)
http://digital.casalini.it/978866550419
ISBN 978-88-6655-037-2 (print)ISBN 978-88-6655-041-9 (online)

Chapter 1 Introduction 11. Parkinson’s disease 12. Molecular imaging in PD 3
2.1 Dopaminergic imaging 42.2 Non-dopaminergic imaging and extrastriatal systems 82.3 Brain metabolic imaging 9
3. Molecular imaging biomarkers in PD 113.1 Dopaminergic imaging 113.2 Non-dopaminergic imaging 133.3 Brain metabolic imaging 14
Chapter 2 Aim 17
Chapter 3 Methods 191. Subjects 192. Clinical and neuropsychological assessment 193. MRI 204. [123I]FP-CIT SPECT 205. [18F]-FDG PET 206. Statistical Parametric Mapping (SPM) 20
Chapter 4 Study 1 Cerebral brain metabolism in drug-naïve Parkinson’s disease patients 231. Background 232. Methods 23
2.1 Subjects 232.2 Statistical analysis 242.3 SPM 24
3. Results 253.1 Demographic and clinical findings 253.2 SPM results 25
Contents
Cristina Polito, Molecular imaging in Parkinson’s disease ISBN 978-88-6655-037-2 (print) ISBN 978-88-6655-041-9 (online) © 2011 Firenze University Press
VI Cristina Polito
Chapter 5 Study 2 Brain metabolic correlates of dopaminergic degeneration in de novo idiopathic Parkinson’s disease 291. Background 292. Methods 30
2.1 Subjects 302.2 Image analysis 302.3 SPM 31
3. Results 31
Chapter 6 Study 3 Functional changes related to dopamine depletion in the caudate nucleus in early Parkinson’s disease 351. Background 352. Methods 36
2.1 Subjects 362.2 Image analysis 382.3 Statistical analysis 382.4 SPM 38
3. Results 393.1 [123I]FP-CIT SPECT and neuropsychological findings 393.2 Correlation with rCMRglc 40
Chapter 7 Discussion 451. Brain metabolism in drug naïve PD patients 452. Early functional changes related to dopamine depletion in drug naïve
PD patients 462.1 [123I]FP-CIT SPECT and clinical findings 462.2 Brain metabolic changes related to DA degeneration in early PD 47
References 49
Chapter 1
Introduction
1. Parkinson’s disease
Parkinson's disease (PD) is a progressive neurodegenerative disorder, characte-
rized by asymmetric onset of resting tremor, rigidity, and bradykinesia followed by
postural instability. The disease usually manifests during the sixth decade and the
prevalence rates increase with age. European population-based studies suggest that
the overall prevalence of PD in people aged over 65 is 1.8%, with an increase from
0.6% for persons aged 65 to 69 years to 2.6% for people aged 85 to 89 years (de Rijk
et al., 1995, 2000).The incidence of the disease rises steeply with age, from 17.4 in
100000 person years between 50 and 59 years of age to 93.1 in 100000 person years
between 70 and 79 years, with a lifetime risk of developing the disease of 1.5%
(Bower et al., 1999). The median age of onset is 60 years and the mean duration of
the disease from diagnosis to death is 15 years, with a mortality ratio of 2 to 1.5
(Katzenschlager et al., 2008).
The pathological hallmark of PD is a region-specific selective loss of dopami-
nergic, neuromelanin-containing neurons from the pars compacta of the substantia
nigra, which results in striatal dopamine deficiency. This in turn leads to increased
inhibitory output activity from the basal ganglia to the ventral thalamus and frontal
cortex and subsequent development of parkinsonism (Bezard et al., 2003; Obeso et
al., 2008). It has been estimated that, at the time of the first motor signs of PD at least
30% of all the nerve cells in the pars compacta have already disappeared and, within
5 years of diagnosis, 50% of the neurons will have died with an annual attrition rate
of 7% of surviving neurons per year. Extrapolation of the rate of nigral cell loss back
beyond the date of diagnosis suggests that neuronal damage could begin at least 5–10
years before the first motor symptoms emerge (Fearnley and Lees, 1991). Cell loss in
the locus coeruleus, dorsal nuclei of the vagus, raphe nuclei, nucleus basalis of Mey-
nert, and some other catecholaminergic brain stem structures including the ventro-
tegmental area also occur (Damier et al., 1999). Besides nerve-cell loss, three distinc-tive intraneuronal inclusions can be found in PD: the Lewy body, the pale body, and
the Lewy neurites. Synuclein immunocytochemistry studies reveal that intraneuronal
Lewy body inclusions can be detected in the lower brainstem ahead of midbrain and
Cristina Polito, Molecular imaging in Parkinson’s disease ISBN 978-88-6655-037-2 (print) ISBN 978-88-6655-041-9 (online) © 2011 Firenze University Press
Cristina Polito 2
nigral involvement and later spread to limbic and association cortical areas in a pre-
dictable manner (Braak et al., 2003).
PD usually occurs as a sporadic disorder, nevertheless few environmental factors
have been identified (Dick et al., 2007). Aging is the major risk factor for PD, as for
other neurodegenerative diseases (Lees et al., 2009). The protective role of tobacco
against PD risk is still debated (Allam, 2004; Hernàn, 2001), as also the increased
risk for PD in men and postmenopausal women not taking hormone replacement,
who take no or low dose of caffeine (Ascherio et al., 2003, 2004). Weak associations
between Parkinson‘s disease and head injury, rural living, middle-age obesity, lack of
exercise, well-water ingestion, and herbicide and insecticide exposure have also been
reported (Elbaz et al., 2007, Thaker et l., 2008).
Genetic studies in PD identified over the past decade more than 13 loci and 9
genes, but their implication in PD is still under investigation. Alpha-synuclein point
mutations, duplications and triplications cause a rare dominant form of PD in familial
and sporadic cases. Autosomal dominant PD is mainly caused by mutations in the
leucine-rich repeat kinase 2 (LRRK2) gene particularly in certain ethnic groups.
Loss-of-function mutations in Parkin, PINK1, DJ-1 and ATP13A2 cause autosomal
recessive parkinsonism with early-onset (Lesage et al., 2009).
The onset of PD motor symptoms is gradual and the early symptoms might be
unnoticed and misinterpreted for a long time. The early clinical signs are often as-
cribed to old age or rheumatism, so that a lag of 2-3 years from first symptoms to di-
agnosis is not unusual. Early diagnosis of PD is desirable since in the very early stag-
es the neural damage is presumed to be more restricted. Therefore the principal aim
of PD research in the last years has been to extend diagnosis to even earlier in the
disease course (Marek and Jennings, 2009).
Clinical, neuroimaging, and pathologic studies identified a variety of non motor
symptoms which can precede the classic motor features of PD by years and, perhaps,
even decades (Gonera et al., 1997; Abbot et al., 2003; Iranzo et al., 2006; Ross et al.,
2006 et al.; Haehner, 2007). Currently, the period when these symptoms arise is
commonly referred to as the premotor phase of the disease (Tolosa et al., 2009) (Fig-
ure 1.1). A prenigral involvement at the basis of non motor symptoms, preceding
classic motor PD features, is supported by Braak et al.(Braak et al., 2003) recent pro-
posal that synuclein pathology (Lewy bodies and neurites) in PD starts in the lower
brainstem and progresses following a predictable caudal-rostral pattern, only reach-
ing the substantia nigra in the mesencephalon after extensive involvement of the
brainstem has occurred.

Introduction
3
Figure 1.1 Natural history of PD (from Marek, 2009).
Among early non motor features of PD olfactory deficits and cardiac sympathetic
denervation have been identified in a high proportion of patients at the time of the
earliest motor signs, therefore suggesting that such features probably precede the mo-
tor signs. Other features documented in a smaller proportion of patients early in the
course of the disease include pain, orthostatic hypotension, urinary urgency, and ex-
ecutive dysfunction found on neuropsychological testing (Lim et al., 2009).
PD is therefore characterized by insidious onset and inexorable progression, so
that growing interest is directed to the identification of reliable and well-validated
biomarkers to identify individuals ―at risk‖ for PD, to accurately diagnose individuals
at the threshold of clinical PD, and to monitor PD progression throughout its course
(Marek and Jennings, 2009). In this perspective molecular imaging plays a key role.
2. Molecular imaging in PD
Molecular imaging refers to the use of non-invasive imaging techniques to detect
signals that originate from molecules and their interaction with a specific cellular tar-
get in vivo. There are many different areas of investigation in the field of molecular
imaging. Much research on neurodegenerative disorder is currently focused on de-
tecting pre-disease state or molecular states that occur before typical symptoms of a
disease are clinically manifest (Herschman, 2003).
PET and SPECT have been extensively employed to elucidate the functional
changes associated with PD and other neurodegenerative parkinsonian disorders.
Both modalities provide a means of assessing: (1) disease severity as reflected by
presynaptic dopamine terminal dysfunction, (2) subclinical dysfunction in subjects who are at risk for PD, (3) disease progression and the effects on this of putative neu-
roprotective agents, and (4) changes in non-dopaminergic neurotransmission (Pavese
et al., 2009).
Cristina Polito 4
2.1 Dopaminergic imaging
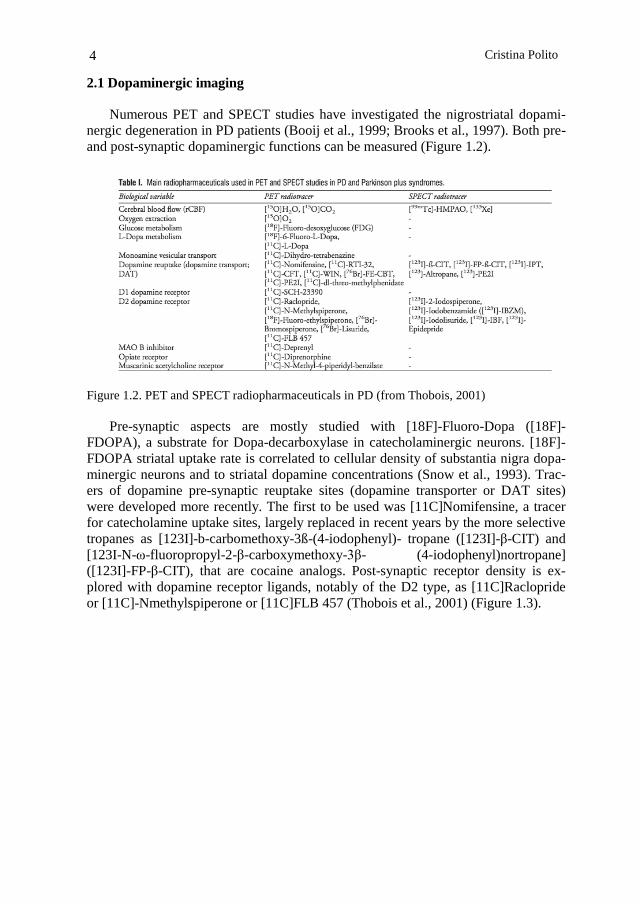
Numerous PET and SPECT studies have investigated the nigrostriatal dopami-
nergic degeneration in PD patients (Booij et al., 1999; Brooks et al., 1997). Both pre-
and post-synaptic dopaminergic functions can be measured (Figure 1.2).
Figure 1.2. PET and SPECT radiopharmaceuticals in PD (from Thobois, 2001)
Pre-synaptic aspects are mostly studied with [18F]-Fluoro-Dopa ([18F]-
FDOPA), a substrate for Dopa-decarboxylase in catecholaminergic neurons. [18F]-
FDOPA striatal uptake rate is correlated to cellular density of substantia nigra dopa-
minergic neurons and to striatal dopamine concentrations (Snow et al., 1993). Trac-
ers of dopamine pre-synaptic reuptake sites (dopamine transporter or DAT sites)
were developed more recently. The first to be used was [11C]Nomifensine, a tracer
for catecholamine uptake sites, largely replaced in recent years by the more selective
tropanes as [123I]-b-carbomethoxy-3ß-(4-iodophenyl)- tropane ([123I]-β-CIT) and
[123I-N-ω-fluoropropyl-2-β-carboxymethoxy-3β- (4-iodophenyl)nortropane]
([123I]-FP-β-CIT), that are cocaine analogs. Post-synaptic receptor density is ex-
plored with dopamine receptor ligands, notably of the D2 type, as [11C]Raclopride
or [11C]-Nmethylspiperone or [11C]FLB 457 (Thobois et al., 2001) (Figure 1.3).

Introduction
5
Figure 1.3.Imaging dopamine terminal function in healthy controls and early Parkinson's dis-
ease (from Pavese, 2009).
PRESYNAPTIC DOPAMINERGIC IMAGING
The assessment of functional integrity of presynaptic nigrostriatal projections is
one of the main applications of molecular imaging techniques in PD. Three different
markers of presynaptic dopaminergic terminals are usually employed.
Markers of striatal aromatic amino acid decarboxilase activity
[18F]-FDOPA radiotracer uptake reflects the dopaminergic nerve density but at
the same time, the activity of the aromatic amino acid decarboxylase enzyme
(AADC) that converts dopa into dopamine and the storage of dopamine (Firnau et
al., 1987). This radiotracer allows the study of the integrity of the presynaptic dopa-
minergic system in the nigrostriatal and also the mesolimbic and mesocortical dopa-
minergic pathways.
The density of the axonal terminal plexus and the AADC activity is estimated by
the uptake of [18F]-FDOPA in the striatal nuclei, measured by an influx constant Ki
over 90 minutes. [18F]-FDOPA uptake in the striatum of patients with PD is influ-
enced by the number of remaining dopaminergic cells. Pathological studies, indeed,
demonstrated that levels of striatal [18F]-FDOPA uptake correlated with nigral cell
counts in PD experimental models (Snow et al., 1993; Pate et al., 1993). In the early
stages, however, because of the presence of compensatory up-regulation of AADC
[18F]-FDOPA PET may underestimate the degenerative process (Ribeiro et al.,
2002).
Correlations have been found between [18F]-FDOPA putaminal uptake and clin-
ical severity of rigidity and bradykinesia as measured by the Unified Parkinson‘s
Disease Rating Scale (UPDRS). Tremor severity was instead demonstrated not to be
related with [18F]-FDOPA uptake, suggesting that either non-nigrostraital and/or
non-dopaminergic pathways are involved in the pathogenesis of this symptom
(Brooks et al., 1990; Vingerhoets et al., 1997; Broussolle et al., 1999).
Cristina Polito 6
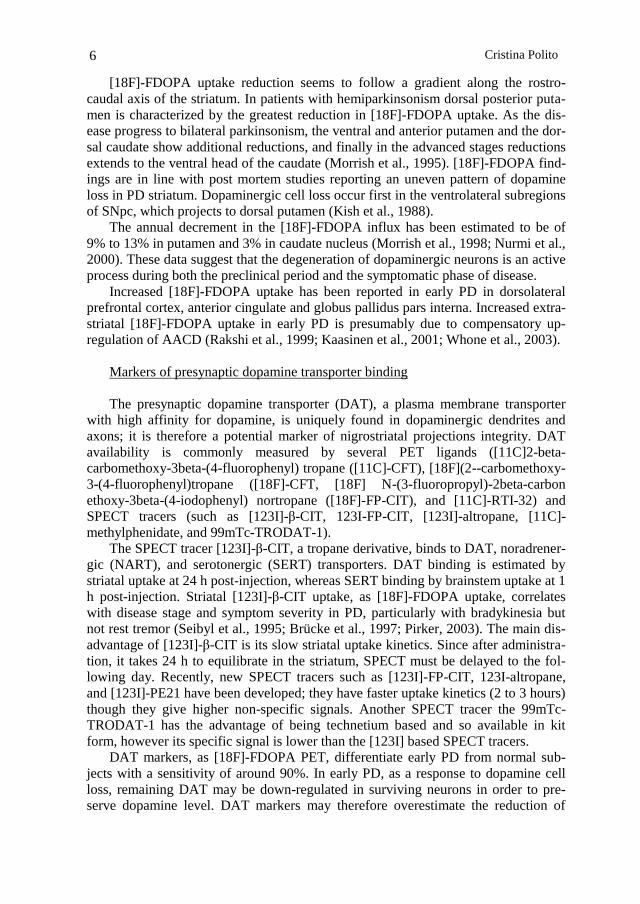
[18F]-FDOPA uptake reduction seems to follow a gradient along the rostro-
caudal axis of the striatum. In patients with hemiparkinsonism dorsal posterior puta-
men is characterized by the greatest reduction in [18F]-FDOPA uptake. As the dis-
ease progress to bilateral parkinsonism, the ventral and anterior putamen and the dor-
sal caudate show additional reductions, and finally in the advanced stages reductions
extends to the ventral head of the caudate (Morrish et al., 1995). [18F]-FDOPA find-
ings are in line with post mortem studies reporting an uneven pattern of dopamine
loss in PD striatum. Dopaminergic cell loss occur first in the ventrolateral subregions
of SNpc, which projects to dorsal putamen (Kish et al., 1988).
The annual decrement in the [18F]-FDOPA influx has been estimated to be of
9% to 13% in putamen and 3% in caudate nucleus (Morrish et al., 1998; Nurmi et al.,
2000). These data suggest that the degeneration of dopaminergic neurons is an active
process during both the preclinical period and the symptomatic phase of disease.
Increased [18F]-FDOPA uptake has been reported in early PD in dorsolateral
prefrontal cortex, anterior cingulate and globus pallidus pars interna. Increased extra-
striatal [18F]-FDOPA uptake in early PD is presumably due to compensatory up-
regulation of AACD (Rakshi et al., 1999; Kaasinen et al., 2001; Whone et al., 2003).
Markers of presynaptic dopamine transporter binding
The presynaptic dopamine transporter (DAT), a plasma membrane transporter
with high affinity for dopamine, is uniquely found in dopaminergic dendrites and
axons; it is therefore a potential marker of nigrostriatal projections integrity. DAT
availability is commonly measured by several PET ligands ([11C]2-beta-
carbomethoxy-3beta-(4-fluorophenyl) tropane ([11C]-CFT), [18F](2--carbomethoxy-
3-(4-fluorophenyl)tropane ([18F]-CFT, [18F] N-(3-fluoropropyl)-2beta-carbon
ethoxy-3beta-(4-iodophenyl) nortropane ([18F]-FP-CIT), and [11C]-RTI-32) and
SPECT tracers (such as [123I]-β-CIT, 123I-FP-CIT, [123I]-altropane, [11C]-
methylphenidate, and 99mTc-TRODAT-1).
The SPECT tracer [123I]-β-CIT, a tropane derivative, binds to DAT, noradrener-
gic (NART), and serotonergic (SERT) transporters. DAT binding is estimated by
striatal uptake at 24 h post-injection, whereas SERT binding by brainstem uptake at 1
h post-injection. Striatal [123I]-β-CIT uptake, as [18F]-FDOPA uptake, correlates
with disease stage and symptom severity in PD, particularly with bradykinesia but
not rest tremor (Seibyl et al., 1995; Brücke et al., 1997; Pirker, 2003). The main dis-
advantage of [123I]-β-CIT is its slow striatal uptake kinetics. Since after administra-
tion, it takes 24 h to equilibrate in the striatum, SPECT must be delayed to the fol-
lowing day. Recently, new SPECT tracers such as [123I]-FP-CIT, 123I-altropane,
and [123I]-PE21 have been developed; they have faster uptake kinetics (2 to 3 hours)
though they give higher non-specific signals. Another SPECT tracer the 99mTc-
TRODAT-1 has the advantage of being technetium based and so available in kit
form, however its specific signal is lower than the [123I] based SPECT tracers.
DAT markers, as [18F]-FDOPA PET, differentiate early PD from normal sub-
jects with a sensitivity of around 90%. In early PD, as a response to dopamine cell
loss, remaining DAT may be down-regulated in surviving neurons in order to pre-
serve dopamine level. DAT markers may therefore overestimate the reduction of
Introduction
7
terminal density in early PD. DAT binding, alike [18F]-FDOPA, decreases with age
(Pirker et al., 2000; van Dyck et al., 1995).
Measurement of the vesicular monoamine transporter 2
The type-2 vesicular monoamine transporter (VMAT2), exclusively expressed in
the brain, is responsible for the uptake of monoamines from the cytoplasm into the
secretory vesicles in dopamine neurons (Liu and Edwards, 1997). Lee et al. com-
pared striatal uptake of [11C]-dihydrotetrabenazine ([11C]DTBZ), a PET tracer that
binds to VMAT2, [18F]-FDOPA, and the DAT ligand [11C]-methylphenidate in PD.
They found in the parkinsonian striatum, [18F]-FDOPA Ki relatively less reduced
than the [11C]DTBZ binding potential, and [11C]DTBZ binding less reduced than
[11C]-methylphenidate binding (Lee et al., 2000). This finding supports the presence
of relative AADC up-regulation and DAT down-regulation in PD striatum in order to
increase dopamine turnover and diminish its re-uptake.
POST-SYNAPTIC DOPAMINERGIC IMAGING
At least five dopamine receptor subtypes have been described so far, which are
classified into two main categories: the D1 type receptors (D1 and D5), which stimu-
late the enzyme adenylate cyclase, and the D2 type receptors (D2, D3, D4), which
are inhibitory. Post-synaptic dopaminergic PET and SPECT studies in PD have
mainly focused on D2 dopamine receptors.
[11C]-Raclopride, a low affinity dopaminergic D2 receptor ligand has been used
in most PET studies to study postsynaptic dopamine receptors. In de novo, drug-
naïve PD patients, [11C]-Raclopride binding is either normal or increased in the pu-
tamen and normal in the caudate nucleus (Dentresangle et al., 1999; Rinne et al.,
1993). The increase of the putaminal binding at disease onset is usually interpreted in
the frame of compensatory mechanism involving receptor up-regulation. In advanced
PD, [11C]-Raclopride binding normalizes in the putamen and most often decreases in
the caudate (Antonini et al., 1994; Brooks et al., 1990, 1992; Dentresangle et al.,
1999; Turjanski et al., 1997).
The expression of D2 and D3 receptors has been followed by the dopaminergic
ligand, [11C]-FLB 457. They are reduced in the anterior cingulate, dorsolateral pre-
frontal and temporal cortex and the thalamus in late stage PD, suggesting lesions of
the mesolimbic dopaminergic pathways that may be involved in the cognitive and
emotional deficits in PD patients (Kaasinen et al., 2000, 2003).
The striatal binding of [123I]-iodobenzamide (IBZM), a SPECT ligand of dopa-
mine D2 receptors was found not to be altered in idiopathic drug-naïve PD patients
(Schwarz et al., 1996).
[11C]-SCH23390, a D1 receptor ligand, is normally taken up in the putamen of
de novo drug-naïve PD patients and its binding may either be normal or reduced in
more advanced and treated patients (Shinotoh et al., 1993; Turjanski et al., 1997).
Cristina Polito 8
2.2 Non-dopaminergic imaging and extrastriatal systems
PD is a multi-system disease and the involvement of extrastriatal pathways in the
disease process is now well established (Lang, 2007). Serotoninergic, noradrenergic
and cholinergic neurons have been shown to be target of neurodegeneration soon in
the disease process, indeed Lewy body pathology in noradrenergic, serotoninergic
and cholinergic systems seems to be responsible for the onset of some non-motor
symptoms in PD (Rodriguez-Oroz et al., 2009).
SEROTONINERGIC AND NORADRENRGIC SYSTEMS
Serotoninergic and noradrenergic systems have been investigated by [18F]-
FDOPA PET. AADC is present in all monoaminergic neurons terminals, therefore
[18F]-FDOPA uptake in extrastriatal areas reflects the density serotoninergic and no-
radrenergic together with dopaminergic terminals. A recent [18F]-FDOPA cross-
sectional study on extrastriatal dopamine dysfunction in PD, showed in early PD
raised [18F]-FDOPA uptake in midbrain raphe and reduced tracer uptake in locus
coeruleus, while in advanced patients [18F]-FDOPA uptake decreased in both nuclei.
Uptake into the red nucleus, subthalamus, ventral thalamus and pineal gland was also
targeted in more advanced patients, whereas limbic areas, except for hypothalamus,
were spared even in late disease (Moore et al., 2008).
Serotoninergic system has been explored by [11C]-WAY-100635 PET, a marker
of serotonin 5-HT1A receptors which act as autoreceptors on the soma of serotoner-
gic neurones in the median raphe. PD patients compared to healthy controls showed a
25% reduction in binding of [11C]-WAY-100635 in the midbrain raphe, but the
magnitude of reduction was independent of the presence of depression (Doder et al.,
2000). [11C]-DASB PET, a marker of brain serotonin transporter binding, revealed
in advanced, non-depressed PD patients a binding reduction of 20–30% in all ex-
amined brain areas compatible with a modest, widespread loss of brain serotonergic
innervation (Guttman, 2007). These studies, therefore, do not support a major role for
serotonergic loss in PD depression. Noradrenergic and dopaminergic neurotransmis-
sion has been recently assessed in PD patients with depression, by means of [11C]-
RT132 PET. Depressed PD patients showed lower [11C]-RT132 binding in locus
coeruleus and areas of the limbic system than non-depressed PD patients. In areas
with low dopaminergic innervation such as locus coeruleus, [11C]-RT132 uptake
mainly reflects the density of noradrenergic neurons. In limbic areas, such as the ven-
tral striatum and amygdala, [11C]-RT132 uptake reflects function of both dopami-
nergic and noradrenergic pathways (Remy et al., 2005). An important role for nora-
drenaline and limbic dopaminergic rather than serotonergic dysfunction in the patho-
genesis of depression in PD patients was therefore suggested.
Introduction
9
CHOLINERGIC SYSTEM
Cholinergic deficiency in demented PD patients has been assessed by PET and
SPECT. [123I]-BMV SPECT, an in vivo marker of the vesicular acetylcholine trans-
porter, showed in non demented PD patients reduced tracer uptake in the parietal and
occipital cortex, whereas in demented PD a more severe global reduction of cortical
binding similar to that seen in Alzheimer's disease patients occurs (Kuhl et al., 1996).
Cortical acethylcholinesterase activity in PD has been assessed by [11C]-MP4A
PET, revealing a loss of cholinergic function throughout the cortex in parallel with
the loss of striatal dopaminergic function, demented PD cases showing the most se-
vere reductions (Hilker et al., 2005). [11C]-PMP PET was also used to assay cortical
acethylcholinesterase activity in PD with and without dementia. As expected, PD pa-
tients with dementia (PDD) were characterized by the greatest reduction in cortical
acetylcholinesterase activity. As compared to Alzheimer's disease patients PDD pa-
tients, although matched for dementia severity, showed a lesser reduction in choli-
nergic innervation, the lateral temporal cortex being selectively targeted (Bohnen et
al., 2003).
2.3 Brain metabolic imaging
Molecular imaging techniques to localize and quantify abnormalities of brain
energy metabolism have been used for many years to study the pathophysiology of
neurodegenerative disorders. (Slosman and Pellerin, 2004; Herholz et al., 2004).
In Parkinson‘s disease, presynaptic dopamine loss has been shown to be asso-
ciated with broader functional abnormalities involving cortico–striato–pallido–
thalamocortical (CSPTC) loops and related pathways (De Long and Wichmann,
2007). Thus, nigrostriatal dysfunction, even if highly localized, is associated with
disease-specific alterations on regional cerebral metabolism across the whole brain.
[18F]FDG-PET, thanks to its capability to assess local synaptic activity as well
as biochemical maintenance process, has been widely employed in the study of the
pathophysiology of PD (Pellerin et al., 2007, Eidelberg, 2009).
The first [18F]FDG-PET studies revealed 1) in hemiparkinsonian patients at an
early stage of the disease, an increased metabolism in the lentiform nucleus (putamen
and Globus pallidus) on the opposite side of the affected hemibody (Wolfson et al.,
1985) 2) in more severely affected patients with dementia, a decrease in cortical glu-
cose utilization, particularly in posterior and temporal parietal associative regions
(Kuhl et al., 1984; Wolfson et al., 1985).
Afterwords, network analysis of functional imaging data in PD revealed a specif-
ic abnormal spatial covariance pattern involving metabolic changes at key nodes of
the CSPTC loops and related pathways (Eidelberg et al., 1994, 1997; Moeller et al.,
1999; Ma et al., 2007).
The Parkinson‘s disease-related pattern (PDRP) is characterized by increased
pallido–thalamic and pontine metabolic activity associated with relative reductions in
premotor cortex, supplementary motor area (SMA), and in parietal association re-
gions (Figure 4) . PDRP has been detected in several patient population (Eckert et al.,

Cristina Polito 10
2007), it shows a good test-retest reproducibility in individual subjects over hours to
weeks (Ma et al., 2007), and its expression correlates with standardized motor ratings
in different patient cohorts (Asanuma et al., 2006). Further PDRP expression discri-
minates between PD, atypical parkinsonian syndromes, and healthy control subjects
in prospective FDG PET scans (Eckert et al., 2008).
Network analysis was further used to explore pathophysiological changes at the
basis of cognitive dysfunction in PD.(Huang et al., 2007). A PD-related cognitive
pattern (PDCP) characterized by metabolic reductions mainly in medial frontal and
parietal association regions, and relative increases in cerebellar cortex and dentate
nuclei was identified (Figure 1.4). This cognitive pattern correlated with performance
on neuropsychological tests of memory and executive functioning. The expression of
the PDCP was found to increase stepwise in PD patients categorized by clinical crite-
ria for mild cognitive impairment (MCI) (Huang et al., 2008).
Figure 1.4. PDRP and PDCP (from Poston, 2009)
Besides network analysis, region of interest (ROI) analysis and voxel based mul-
tivariate analysis by Statistical Parametric Mapping (SPM), were used to explore
brain metabolism in PD. Frontal and temporo-parietal hypometabolism has been do-
cumented in PD patients (Hu et al., 2000; Juh et al., 2005), although recent studies
suggested that patients without cognitive impairment had limited areas of hypometa-
bolism in the frontal and occipital cortices, whereas in patients with mild cognitive
impairment there were extensive areas of hypometabolism in the posterior cortical
regions, including the temporo-parieto-occipital junction, medial parietal, and infe-
rior temporal cortices (Huang et al., 2008; Hosokai et al., 2009).
Introduction
11
3. Molecular imaging biomarkers in PD
PD distinctive motor features are characterized by an insidious onset and an in-
exorable but variable progression. Thus, in recent years much effort are directed to
determine reliable and well validated biomarkers for PD to identify individuals ―at
risk‖ before motor symptoms onset, accurately diagnose individuals at the threshold
of clinical PD, and monitor PD progression throughout its course. Biomarkers of
such a type, would dramatically improve patient care and accelerate research into
both PD cause and therapeutics (Marek et al., 2008).
Biomarkers are broadly defined as characteristics that are objectively measured
and evaluated as indicators of normal biological processes, pathogenic processes, or
pharmacological responses to a therapeutic intervention (Biomarkers Definitions
Working Group, 2001; De Gruttola et al., 2001).
Biomarkers in clinical research and clinical care can be employed to the follow-
ing aims: 1) to measure the biologic activity of a disease, therefore providing useful
information about the disease process; 2) as a diagnostic tools or to determine risk
and prognosis; 3) to provide information about an intervention‘s mechanism or bi-
ologic activity in in-vitro models, animal studies, or early human clinical trials in
therapy development and evaluation; 4) as surrogate endpoints (i.e. a subset of bio-
markers intended to substitute for clinical endpoints).
Biomarkers for PD are critical to the understanding of disease cause and disease
progression. In particular, biomarkers may provide a window to the premotor period
of PD before typical symptoms are manifest, but while degeneration has already be-
gun (Marek and Jennings, 2009). Both pathology and imaging studies, indeed, dem-
onstrated that PD is characterized by a long period during which vulnerable neuronal
populations are degenerating, but when typical motor symptoms have not yet devel-
oped. At the threshold of motor symptoms about 40–60% of dopamine neuronal
markers have been lost (Fearnley and Lees,1991; Marek, 1999; Morrish et al., 1998).
The duration of the premotor period is unclear, however imaging and pathology data
suggest that it may last from 5 to 20 years.
3.1 Dopaminergic imaging
Molecular imaging of the presynaptic nigrostriatal function, because of its capa-
bility to assess the ongoing dopaminergic degeneration, has been widely used as
biomarker in studies assessing early PD. Dopaminergic degeneration has been ex-
plored either with [18F]-FDOPA and/or with DAT tracers (Brooks et al., 1990;
Asenbaum et al., 1997; Mozley et al., 2000; Frey et al., 1996; Booij et al., 1998; Innis
et al., 1993; Vingerhoets et al., 1994). A good correlation has been found between dopamine neuron loss and [18F]-FDOPA uptake, although in a very small sample
(Snow et al., 1993). In postmortem PD brain, DAT density has been shown to be re-
duced in the striatum (Kaufman et al., 1991; Niznik et al., 1991; Wilson et al., 1996).
Cristina Polito, Molecular imaging in Parkinson’s disease ISBN 978-88-6655-037-2 (print) ISBN 978-88-6655-041-9 (online) © 2011 Firenze University Press

Cristina Polito 12
Consistent with the expected PD pathology, reductions in [18F]-FDOPA, vesicular
monoamine transporter type 2 and DAT ligand uptake have been found. In details,
these imaging studies demonstrate asymmetric loss of dopaminergic uptake, with a
greater loss in the putamen as compared to the caudate, and the imaging loss corre-
lates with worsening clinical symptoms in cross-sectional evaluation (Huang et al.,
2001; Booij et al., 2001; Fischman et al., 1998; Sawle et al., 1994; Seibyl et al., 1995;
Frey et al., 2001; Scherfler et al., 2007).
Many studies have demonstrated that imaging markers can identify individuals
with typical motor PD, even in its early stages, however, if the main future applica-
tion of imaging biomarkers would be to assess premotor PD, studies must move
―backwards‖ to focus on subjects at risk but not yet diagnosed. (Marek and Jennings,
2009) (Figure 1.1).
At present, the challenge is how to find at risk subjects. Individuals with one or
more symptoms of parkinsonism and therefore with suspected, but not diagnosed, PD
constitutes one way to identify subjects at risk for PD. Several studies have examined
the accuracy of DAT imaging in subjects with nondiagnostic motor symptoms (Cata-
fau and Tolosa, 2004; Jennings et al., 2004; Tolosa et al., 2007). Imaging was com-
pared with a longitudinal ―gold standard‖ clinical diagnosis. Individuals with sus-
pected PD and reduced DAT density were demonstrated to be at very high risk for a
clinical diagnosis of PD. These imaging markers, however, cannot distinguish be-
tween idiopathic PD and other parkinsonisms such as progressive supranuclear palsy,
multiple system atrophy, cortical basal ganglionic degeneration, and diffuse Lewy
body disease. To this aim, [18F]FDG PET by revealing changes in neural circuit di-
rectly or indirectly related to dopaminergic dysfunction, may be more useful in dis-
tinguishing PD from these Parkinson syndromes (Eckert et al., 2008).
Dopaminergic imaging has also demonstrated its utility in clinical trials on very
early PD. In untreated recently diagnosed PD, in vivo dopaminergic imaging has
identified about 10–15% of enrolled subjects with scans in the normal range—termed
scans without evidence of dopaminergic deficit (SWEDD) (Whone et al., 2002; Par-
kinson Study Group, 2004, 2007). Follow-ups subsequently demonstrated that those
patients with SWEDD are unlikely to have PD, whereas those with DAT deficit are
very likely to have PD (Marek et al., 2003) Therefore, dopaminergic imaging accu-
rately distinguishes subjects unlikely to have PD from those with an eventual clinical
diagnosis of PD.
Before the development of motor symptoms, early non-motor symptoms may re-
liably identify subjects at risk for PD, so that combined with imaging markers they
may aid further defining premotor PD. Among early non motor features of PD, the
ones more often described include loss of olfactory function, sleep disturbances (e.g.,
RBD), autonomic dysfunction such as constipation, and behavioral and cognitive
changes (Langston, 2006; Siderowf and Stern, 2006; Tolosa et al., 2007).
To identify premotor PD, early clinical manifestations and dopaminergic imaging
have been recently considered together. Among PD relatives showing olfactory defi-
cit, DAT imaging identifies a sub-group with increased risk of developing PD (Pon-
sen et al., 2004). Similar findings have been reported by combining RBD and dopa-
minergic imaging (Stiasny-Kolster et al., 2005).
Introduction
13
Recent advances in molecular genetics, by uncovering several genes for PD, has
provided new possibilities to identify at risk and premotor PD population (Klein and
Schlossmacher, 2007; Pankratz et al., 2007). Genes mutations previously described
generally account for a very small number of PD patients, on the contrary LRRK2
mutations may identify approximately 20–35% of the PD patients in populations
such as the Ashkenazi Jewish or in regional populations of Spain or North Africa
(Ozelius et al., 2006; Saunders-Pullman et al., 2006; Lesage et al., 2006). In addition,
thanks to initiatives as the International LRRK2 Consortium genetic, clinical, and
imaging assessment have been combined to shed new light on premotor PD in genet-
ic PD subsets (Healy et al., 2008). Dopaminergic imaging has been demonstrated to
be altered in unaffected family members of patients with PD who are gene-positive
for LRRK2 and other Park gene abnormalities (Adams et al., 2005; Khan et al.,
2002).
3.2 Non-dopaminergic imaging
Recent growing interest is directed towards nondopaminergic imaging biomark-
ers for premotor PD, aimed to explore specific potential underlying pathophysiology
of PD such as inflammation, α-synuclein deposition, mitochondrial dysfunction, or
protein misfolding (Hirsch et al., 2003; Olanow and McNaught, 2006; Schapira et al.,
1998; Singleton et al., 2003).
Inflammation has been proposed as a risk biomarker for PD by recent pathologic,
imaging and epidemiologic studies, as a consequence imaging markers of inflamma-
tion may be an early marker of PD risk (Chen et al., 2005, 2008; McGeer and
McGeer, 2004). Increased microglial activation in PD has been shown by [11C]-
PK11195 PET studies (Gerhard et al., 2006; Ouchi et al., 2005).
Molecular genetics showed how increased α-synuclein could be a risk biomarker
for PD (Winkler, 2007; Cookson and van der Brug, 2008; Ahn et al., 2008). Changes
in the plasma and cerebral spinal fluid of PD patients have been revealed by α-
synuclein assays (El-Agnaf et al., 2006; Tokuda et al., 2006). Unfortunately, α-
synuclein imaging is as yet an unfulfilled goal.
Early non-motor features of PD, such as olfactory deficits, sleep disturbances,
autonomic dysfunction, and behavioral and cognitive changes, are most often not due
to dopamine loss, but may involve pathology in norepinephrine, serotonin, choliner-
gic, or other neuronal systems. Nondopaminergic imaging biomarkers for early non
motor clinical manifestations have begun to emerge. For example, cardiac imaging
with [123I]-metaiodobenzylguanidine may identify early norepinephrine dysfunction
in autonomic neurons (Spiegel et al., 2005; Oka et al., 2007). Serotonin dysfunction
has been shown to be associated with depression in PD both by imaging and patho-
logic studies (Guttman et al., 2007).
The growing burden of dementia in PD patients, has turned the interest to imag-
ing biomarkers to identify early cognitive dysfunction in PD. Markers of β-amyloid
burden, glucose metabolism, or nicotinic receptor binding, have been suggested as
tools that might identify prodromal sign of dementia in PD (Rowe et al., 2007; Fujita
et al., 2006; Huang et al., 2007; Maetzler et al., 2008).
Cristina Polito 14
3.3 Brain metabolic imaging
Metabolic brain imaging with [18F]FDG PET, thanks to its capability to assess
regional synaptic activity has become an prominent biomarker for PD (Eidelberg et
al., 1997). [18F]FDG-PET can be used both to study the pathophysiology of PD and
to assess the treatment effects.
Since localized dopaminergic pathology can alter functional connectivity across
the entire brain in a disease-specific manner, spatial covariance methods have been
used to identify metabolic abnormalities at the network level in PD (Eckert and Ei-
delberg, 2005; Eckert al., 2007).
Network analysis of [18F]FDG-PET identified the previously described PDRP,
which has been detected in seven independent patient populations (e.g., Moeller et
al., 1999; Feigin.et al., 2002; Lozza et al., 2004; Eckert et al., 2007). Its expression in
individual subjects has been demonstrated to be highly reproducible (Ma et al.,
2007). PDRP scores have also been used to discriminate between patients with PD
and atypical parkinsonism (Ma et al., 2007; Eckert et al., 2007, 2008). In PD patients,
pattern expression has been found to correlate with standardized motor ratings (Asa-
numa et al., 2006; Eidelberg et al., 1994, 1995), symptoms duration (Moeller and Ei-
delberg, 1997; Huang et al., 2007b), and intraoperative measurements of subthalamic
nucleus (STN) firing rate (Lin et al., 2008). PDRP has therefore been proposed as a
biomarker to differentiate PD patients from patients with atypical parkinsonism, and
to assess longitudinal changes in disease-related motor disability.
In addition to motor symptoms, voxel-based spatial covariance analysis of FDG
PET has been used to identify a distinct PD-related metabolic pattern associated with
cognitive dysfunction in non-demented patients, the PDCP, previously described
(Huang et al., 2007a). Correlations between PDCP expression and performance in
neuropsychological tests assessing memory and executive functions have been found
(Huang et al., 2007a). The expression of this pattern has been shown to be greater in
PD patients with mild cognitive impairment (MCI) compared to cognitively normal
PD (Huang et al., 2008). PDCP, as PDRP, has been found to be highly reproducible
in individual patients. However, unlike the PDRP, PDCP activity is not modulated by
symptomatic treatment with levodopa or STN stimulation (Huang et al., 2007a; Hi-
rano et al., 2008). Moreover, the time course of PDCP expression in early stage dis-
ease is different from that of the PDRP (Huang et al., 2007b), with a slower, non-
linear trajectory that is unrelated to concurrent changes in motor function or striatal
dopamine transporter (DAT) binding (Eckert et al., 2007b). The PDCP has been
therefore suggested as a complementary network biomarker with specificity for early
cognitive dysfunction in patients with PD.
[18F]FDGF-PET has been used as biomarker to measures the pathologic
processes associated with clinical disease progression. In a recent longitudinal study,
[18F]FDG-PET was used in conjunction with dopaminergic imaging and UPDRS
assessments to follow the change in network PDRP and PDCP activity in patients
with early PD (Huang, 2007b). The development of PDRP expression over time was
found to occur in parallel with progressive deterioration in UPDRS motor ratings and
putamen DAT binding, whereas the progression of PDCP was found to progressively
increase over time but with a slower and less significant progression rate as com-
Introduction
15
pared to PDRP(Huang, 2007b). Further, changes in PDCP activity did not correlate
with concurrent declines in striatal DAT binding or increases in UPDRS motor rat-
ings. Thus, the two network measures of disease progression, the PDRP and the
PDCP, have been regarded as distinct. These findings suggest that different underly-
ing pathophysiological networks could be associated with motor and cognitive dis-
ease progression in PD, and therefore the use of the PDCP has been proposed as a
biomarker to assess cognitive changes in PD patients.
The quantification of network activity was used also in the assessment of the
clinical response to therapeutic intervention in PD (Eckert and Eidelberg, 2005). In-
formations obtained by comparing the changes in metabolic network activity during
treatment, can indeed be used as biomarkers to identify the underlying pathological
processes involved in observed clinical changes. Applications of such a type are fun-
damental in the development of novel PD treatments and in the assessment of inter-
vention efficacy.
During dopaminergic treatment changes in both pallidal metabolism and PDRP
network activity was found to correlated with clinical improvement in the UPDRS
motor rating score (Feigin et al., 2001; Asanuma et al., 2006). During neurosurgical
modulation of subthalamic nucleus (STN) activity a significant correlation between
PDRP expression and intraoperative recordings of STN firing rate was found (Lin et
al., 2008). The activity of this metabolic network may therefore be modulated by
surgical interventions in this region. Indeed, FDG-PET studies have revealed sus-
tained reductions in PDRP expression following therapeutic STN lesioning (Su et al.,
2001; Trošt et al., 2003) as well as in PD cohorts treated with STN DBS (Asanuma et
al., 2006; Trošt et al., 2006; Hirano et al., 2008). Overall, the metabolic changes re-
ported with STN DBS reflect normalization of the regional changes observed in un-
treated PD patients. Specifically, STN stimulation has been found to increase meta-
bolism in parietal association cortex and, to a lesser degree, in the prefrontal cortex
(Trošt et al., 2006; Asanuma et al., 2006), regions with significant reduced metabol-
ism in untreated PD (Moeller et al., 1999; Eckert et al., 2007b). This suggests that the
baseline metabolic reductions observed in these cortical regions are to some degree
reversible. This may be attributable to a correction of overactive signaling in inhibi-
tory pallidal projections to a variety of thalamic relay nuclei (Taktakishvili et al.,
2002).
Interestingly, the effects of levodopa and STN DBS on PDRP expression were
not found to be additive (Asanuma et al., 2006). A ―floor effect‘‖ occurs, which does
not allow to lower network activity beyond a naturally defined level determined by
the effects of therapeutic STN lesioning. These findings suggest that upper and lower
thresholds exist for therapeutic PDRP modulation. These bounds may define the min-
imum and maximum functional changes that are achievable with current interven-
tions. Whether interventions at other key PDRP nodes like the pedunculopontine
nucleus (PPN) (Stefani et al., 2007) can further reduce network activity is a topic of
ongoing investigation.

Chapter 2
Aim
The aim of this thesis was to explore brain function in drug-naïve Parkinson‘s
disease patients by means of molecular imaging techniques.
In detail:
[18F]FDG-PET was employed to identify in drug-naïve PD patients brain meta-
bolic alteration uniquely related to disease process and not modulated by antiparkin-
sonian therapeutic intervention. To this aim changes in cerebral metabolic rate of
glucose (CMRglc) in drug-naïve PD patients as compared to a group of normal con-
trols (NL) were assessed (Study 1).
[18F]FDG-PET and [123I]FP-CIT SPECT were employed together to explore
the early functional changes in brain function related to dopaminergic depletion in
the putamen (Study 2) and in the caudate nucleus (Study 3).
Cristina Polito, Molecular imaging in Parkinson’s disease ISBN 978-88-6655-037-2 (print) ISBN 978-88-6655-041-9 (online) © 2011 Firenze University Press

Chapter 3
Methods
1. Subjects
Thirty-one consecutive PD patients (males 20, females 11; mean age 65,87 ±
6,18 years; mean disease duration 18,58 ± 9,14 months) from the Neurological Clinic
of the University of Florence were enrolled in this study.
The inclusion criteria were 1) clinical diagnosis of possible PD according to Gelb
criteria (Gelb, 1999) 2) striatal decrease in DAT density as measured with [123I]FP-
CIT SPECT. The exclusion criteria were 1) current or past assumption of any anti-
parkinsonian drugs 2) moderate cognitive impairment (Mini Mental State Examina-
tion < 24, MMSE; Folstein, 1975) 3) diagnosis of major depression 4) white matter
microvascular disease and atrophy on brain MRI.
Seventeen patients had predominant right-sided limb involvement, fourteen pa-
tients had predominant involvement of the left limbs.
Before the beginning of a specific therapy for PD, patients underwent clinical as-
sessment, neuropsychological assessment, MRI, [123I]FP-CIT SPECT, [18F]FDG
PET within a period of one month at our University Institution.
2. Clinical and neuropsychological assessment
Clinical severity of disease was assessed with Hoehn & Yahr (H&Y) scores
(Hoehn and Yahr, 1967) and the motor part (part III) of the Unified Parkinson‘s Dis-
ease Rating Scale (UPDRS III) (Fahn et al., 1987).
The neuropsychological assessment explored the following cognitive domains:
executive functions (EF), attention and inhibition processes, memory and visuocon-
structional abilities. MMSE was administered to evaluate global cognitive function-
ing and to exclude patients with moderate cognitive decline. EF, attention and inhibi-
tion processes were explored by the Modified Card Sorting Test (MCST) (Nelson,
1976), letter fluency (Novelli et al., 1986) and the Stroop Color Word Test (SCWT)
(Spreen and Strauss, 1991). Visual short term memory (STM) was assessed by the
Corsi Block Tapping Test (CBTT), verbal STM by Two Syllabic Word Repetition
Test (TSWRT) and by the recency effect of the Serial Position Curve Test (SPCT),
verbal long term memory (LTM) was assessed by the primacy effect of the SPCT
Cristina Polito, Molecular imaging in Parkinson’s disease ISBN 978-88-6655-037-2 (print) ISBN 978-88-6655-041-9 (online) © 2011 Firenze University Press

Cristina Polito 20
(Spinnler and Tognoni, 1987). Visuoconstructional abilities were assessed by Frag-
mented Figures Assembling Test (FFAT) (Spinnler and Tognoni, 1987).
3. MRI
MRI brain scan was performed on Gyroscan NT Intera (Philips Medical System,
Europe) with T1-, T2-weighted, and FLAIR sequences (matrix 512x512, voxel size
0,49x0,49x6,60mm). Images were reconstructed into 20 slices with 6 mm slice
thickness in axial, coronal and sagittal orientation.
4. [123I]FP-CIT SPECT
All subjects underwent a [123I]FP-CIT SPECT scan. SPECT images were ac-
quired 3 hours after intravenous administration of [123I]FP-CIT (185 MBq) with a 3-
headed camera (IRIX, Philips Medical System, Europe) equipped with UHR collima-
tors. Images were acquired over 360° (120 angles, 40 projection/head,128 X 128 ma-
trix, bin size 2,33 mm); scanning time was of 60 sec/step and lasted 40 minutes. Im-
age data were reconstructed using OSEM algorithm into 128 slices (128x128 matrix,
2.33 mm/pixel, 2.33 mm slice thickness). Attenuation correction was performed us-
ing Chang algorithm.
5. [18F]-FDG PET
Patients were injected with a dose of 370 MBq 18
F-FDG, in resting state in a
dimly lighted room with minimal background noise. Thirty minutes after [18F]-FDG
administration, a scan lasting 20 minutes was acquired, using a GE PET device. A
polycarbonate head holder was used to reduce head movements during the scan.
Emission scans were acquired in two dimensional mode with an axial FOV of 15 cm
and a planar FOV of 55 x 55 cm. Images were reconstructed by OSEM iterative algo-
rithm (2 iterations, 21 subsets). A transmission scan with 68
Ge-sources was used for
photon attenuation correction. Thirty-five PET slices were acquired using a 256x256
matrix with a pixel dimension of 2.15 mm and slice thickness of 4.25 mm.
6. Statistical Parametric Mapping (SPM)
PET images were converted from DICOM into Analyze format using the
MIPAV software and then processed using SPM2 (Study1) or SPM5 (Study 2 & 3)
(Wellcome Department of Cognitive Neurology, Institute of Neurology, London)
running on Matlab 7 (Mathworks, Inc., Natick, MA). A 12- parameter linear affine
transformation and a non-linear three-dimensional deformation were applied to each
subject scan to realign and spatially normalize images to a reference stereotactic
template (Montreal Neurological Institute -MNI-, McGill University, Montreal, Que-
bec). The normalized data were then smoothed using a Gaussian kernel at FWHM 12

Methods
21
mm to account for individual variability in structure–function relation and to enhance
signal to noise ratio. Global normalization was performed using the proportional
scaling routine in SPM. The gray matter threshold was set to 0.8 of the mean and
global calculation was obtained with respect to the mean voxel value.
The appropriate SPM design was used for each study, in the context of the gen-
eral linear model. Coordinates of local maxima were converted from MNI to Talai-
rach space using the ―mni2tal‖ function (http://www.mrc-
cbu.cam.ac.uk/Imaging/Common/mnispace.shtml) and labeled according to the
Talairach and Tournoux space (Talairach and Tournoux, 1988) by using the Talai-
rach Daemon Client Version 2.0
(http://ric.uthscsa.edu/projects/talairachdaemon.html).
Patients informed consent was obtained according to the Declaration of Helsinki
and the local Ethical Committee approved the study.

Chapter 4
Study 1 Cerebral brain metabolism in drug-naïve Parkinson’s dis-
ease patients
1. Background
In recent years, attention has turned towards the potential applications of func-
tional neuroimaging in Parkinson‘s disease (PD).
Dopaminergic imaging has become a prominent diagnostic tool in PD, but nigral
cell loss is just one of several events in the disease progression and it may parallel the
effects of disease in other brain areas (Michell et al., 2004; Braak et al., 2003). In this
scenario, [18F]fluoro-deoxyglucose ([18F]FDG) PET, because of its capability to as-
sess changes in physiologically relevant neural systems, has been proposed as bio-
marker for PD, particularly to monitor disease progression and modulation effect of
antiparkisonian therapy (Eckert et al., 2007; Asanuma et al., 2006).
Until now, [18F]FDG-PET studies examining brain metabolic changes in PD
mainly included, besides few drug-naïve patients, already treated patients in the ―off-
medication‖ condition (Asanuma et al., 2006; Ma et al., 2007). However in these
washout designs a persistent medication effect on brain metabolism could not be
completely ruled out.
Thus, to assess the possible role of [18F]FDG-PET as a biomarker to monitor
treatment effect, it is important to evaluate brain metabolic alterations in drug-naïve
PD patients. Therefore this [18F]FDG-PET study explored alterations in cerebral
metabolic rate of glucose (CMRglc) in drug-naïve PD patients.
2. Methods
2.1 Subjects
The whole PD sample was included in study 1,i.e. thirty-one consecutive PD pa-
tients (Table 4.1).
Twenty–five healthy and unmedicated sex- and age-matched normal subjects
(NL) were recruited at New York University (NYU) (Table 4.1). Brain disease or
cognitive disorders were excluded by MRI and detailed clinical and neuropsycholog-
ical examinations.
Cristina Polito, Molecular imaging in Parkinson’s disease ISBN 978-88-6655-037-2 (print) ISBN 978-88-6655-041-9 (online) © 2011 Firenze University Press
Cristina Polito 24
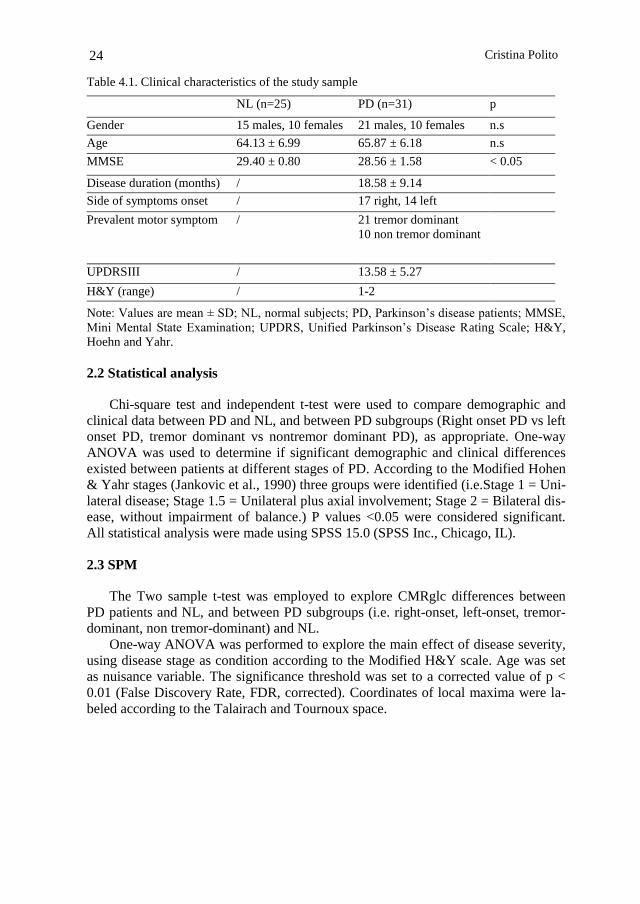
Table 4.1. Clinical characteristics of the study sample
NL (n=25) PD (n=31) p
Gender 15 males, 10 females 21 males, 10 females n.s
Age 64.13 ± 6.99 65.87 ± 6.18 n.s
MMSE 29.40 ± 0.80 28.56 ± 1.58 < 0.05
Disease duration (months) / 18.58 ± 9.14
Side of symptoms onset / 17 right, 14 left
Prevalent motor symptom / 21 tremor dominant
10 non tremor dominant
UPDRSIII / 13.58 ± 5.27
H&Y (range) / 1-2
Note: Values are mean ± SD; NL, normal subjects; PD, Parkinson‘s disease patients; MMSE,
Mini Mental State Examination; UPDRS, Unified Parkinson‘s Disease Rating Scale; H&Y,
Hoehn and Yahr.
2.2 Statistical analysis
Chi-square test and independent t-test were used to compare demographic and
clinical data between PD and NL, and between PD subgroups (Right onset PD vs left
onset PD, tremor dominant vs nontremor dominant PD), as appropriate. One-way
ANOVA was used to determine if significant demographic and clinical differences
existed between patients at different stages of PD. According to the Modified Hohen
& Yahr stages (Jankovic et al., 1990) three groups were identified (i.e.Stage 1 = Uni-
lateral disease; Stage 1.5 = Unilateral plus axial involvement; Stage 2 = Bilateral dis-
ease, without impairment of balance.) P values <0.05 were considered significant.
All statistical analysis were made using SPSS 15.0 (SPSS Inc., Chicago, IL).
2.3 SPM
The Two sample t-test was employed to explore CMRglc differences between
PD patients and NL, and between PD subgroups (i.e. right-onset, left-onset, tremor-
dominant, non tremor-dominant) and NL.
One-way ANOVA was performed to explore the main effect of disease severity,
using disease stage as condition according to the Modified H&Y scale. Age was set
as nuisance variable. The significance threshold was set to a corrected value of p <
0.01 (False Discovery Rate, FDR, corrected). Coordinates of local maxima were la-
beled according to the Talairach and Tournoux space.
Study 1
25
3. Results
3.1 Demographic and clinical findings
There were no demographic differences between PD patients and NL (Table 4.1).
There were no differences between right- and left-onset PD subgroups for motor
dominant symptom, mean disease duration, UPDRSIII and H&Y scores, while left-
onset PD were older than right-onset PD. In the right-onset PD group there were
more males than females (p<0.05). There were no differences between tremor-
dominant and non tremor-dominant PD patients for age, gender distribution, side of
symptoms onset, mean disease duration, UPDRSIII and H&Y scores. As expected,
PD patients at different H&Y stages showed significant increases in UPDRSIII at
advanced H&Y stages, while there were not demographic differences between
groups.
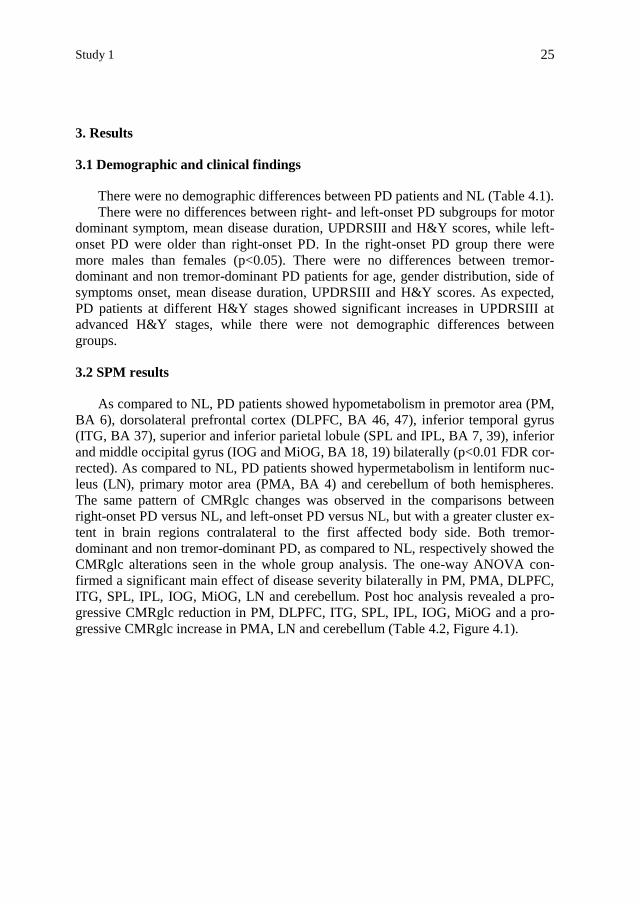
3.2 SPM results
As compared to NL, PD patients showed hypometabolism in premotor area (PM,
BA 6), dorsolateral prefrontal cortex (DLPFC, BA 46, 47), inferior temporal gyrus
(ITG, BA 37), superior and inferior parietal lobule (SPL and IPL, BA 7, 39), inferior
and middle occipital gyrus (IOG and MiOG, BA 18, 19) bilaterally (p<0.01 FDR cor-
rected). As compared to NL, PD patients showed hypermetabolism in lentiform nuc-
leus (LN), primary motor area (PMA, BA 4) and cerebellum of both hemispheres.
The same pattern of CMRglc changes was observed in the comparisons between
right-onset PD versus NL, and left-onset PD versus NL, but with a greater cluster ex-
tent in brain regions contralateral to the first affected body side. Both tremor-
dominant and non tremor-dominant PD, as compared to NL, respectively showed the
CMRglc alterations seen in the whole group analysis. The one-way ANOVA con-
firmed a significant main effect of disease severity bilaterally in PM, PMA, DLPFC,
ITG, SPL, IPL, IOG, MiOG, LN and cerebellum. Post hoc analysis revealed a pro-
gressive CMRglc reduction in PM, DLPFC, ITG, SPL, IPL, IOG, MiOG and a pro-
gressive CMRglc increase in PMA, LN and cerebellum (Table 4.2, Figure 4.1).

Cristina Polito 26
Table 4.2. Brain regions showing significant CMRglc differences in PD patients as compared
to NL subjects.
Cluster
extent Anatomic area Functional area
Talairach Coordinates z
x y z
PD < NL
9696 Left Inferior Parietal Lobule BA 39
-50 -71 11 6.16
Left Inferior Temporal Gyrus BA 37 -56 -58 -4 6.03
Left Inferior Temporal Gyrus BA 37 -50 -67 3 5.91
Inferior Occipital Gyrus BA 18 -35 -90 -8 4.41
4679 Right Precentral Gyrus BA 6
62 4 24 5.21
Right Middle Frontal Gyrus BA 46 52 27 25 5.08
Right Middle Frontal Gyrus BA 47 50 38 -6 4.91
4763 Left Inferior Frontal Gyrus BA 47 -42 26 -9 4.99
Left Precentral Gyrus BA 6 -45 0 24 4.85
Left Middle Frontal Gyrus BA 47 -45 40 -5 4.64
4752 Right Inferior Temporal Gyrus BA 37 48 -63 1 4.74
Middle Occipital Gyrus BA 19 45 -70 -4 4.01
1009 Right Superior Parietal Lobule BA 7 14 -71 41 4.22
PD > NL
9895 Left cerebellum Culmen -6 -41 -18 5.12
Right cerebellum Culmen 14 -52 -15 4.80
1970 Right Lentiform Nucleus 29 -17 11 5.01
894 Left Lentiform Nucleus -26 -17 12 4.83
54 Right Precentral Gyrus BA 4 24 -15 48 3.68
181 Left Precentral Gyrus BA 4 -12 -22 64 3.67
P < 0.01 FDR corrected
Note: Values are mean ± SD; NL, normal subjects; PD, Parkinson‘s disease patients; MMSE,
Mini Mental State Examination; UPDRS, Unified Parkinson‘s Disease Rating Scale; H&Y,
Hoehn and Yahr.
Study 1
27
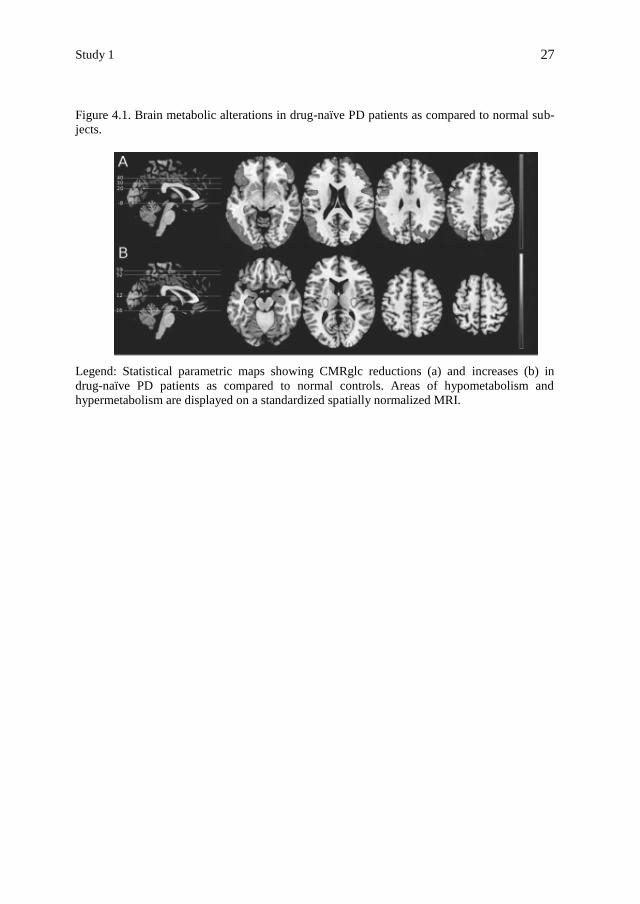
Figure 4.1. Brain metabolic alterations in drug-naïve PD patients as compared to normal sub-
jects.
Legend: Statistical parametric maps showing CMRglc reductions (a) and increases (b) in
drug-naïve PD patients as compared to normal controls. Areas of hypometabolism and
hypermetabolism are displayed on a standardized spatially normalized MRI.


Chapter 5
Study 2 Brain metabolic correlates of dopaminergic degeneration
in de novo idiopathic Parkinson’s disease
1. Background
The cardinal pathological feature of PD is the degeneration of dopaminergic ni-
grostriatal neurons in the substantia nigra pars compacta, resulting in a loss of dopa-
minergic terminals in the striatum (Fearnley and Lees, 1991). SPECT and PET imag-
ing has been widely used to reveal abnormalities in dopaminergic transmission, par-
ticularly in the diagnostic phase (Seibyl et al., 2003). Nigrostriatal dopaminergic neu-
ronal loss in PD is, however, the cardinal of several neuro-functional steps in the
pathologic progression of the disease(Bezard et al., 2003; Braak et al., 2003; Obeso
et al., 2004). Previous [18F]-FDG PET studies showed a characteristic pattern of re-
gional glucose metabolism (rCMRglc) in patients with PD compared to controls, in-
volving frontal and temporo-parietal-occipital hypometabolism, together with in-
creased pallido-thalamic, pontine and cerebellar activity (Eckert et al., 2005b; Eidel-
berg et al., 1994; Fukuda et al., 2001; Huang et al., 2007b). Besides, several studies
showed the correlation between reduced rCMRglc and severity of motor impairment
in PD, demonstrating an inverse correlation involving in particular anterior cingulate
gyrus, orbitofrontal and occipitotemporal regions (Nagano-Saito et al., 2004).
The study of the relation between the severity of dopaminergic degeneration, as
assessed with [123I]-FP-CIT SPECT, and metabolic dysfunction in PD patients, as
assessed by [18F]FDG-PET might reveal in which regions rCMRglc changes are di-
rectly related to the dopaminergic neuronal loss. To this aim, an accurate measure-
ment of dopaminergic degeneration plays a key role and the enrolment of drug naïve
PD patient is mandatory. Indeed, in de novo PD patients the pathological processes
are not yet affected by pharmacological agents (Fahn et al., 2004), allowing a more
accurate insight of PD processes.
The present study evaluates in drug-naïve PD patients the relation between the
brain metabolic changes, measured with [18F]-FDG PET, and the severity of dopa-
minergic degeneration, assessed with [123I]-FP-CIT SPECT. Striatal [123I]-FP-CIT
uptake was quantified with the Binding Potential measurement (Tissingh et al., 1998;
Innis et al., 2007), estimated by the Least Squares (LS) method, an algorithm previ-
ously developed in our Institute, which allows to obtain BP estimates that are less af-
fected by partial volume effects (PVE) and its reliability has been validated in phan-
tom (Vanzi et al., 2007) and clinical studies (Berti et al., 2008).
Cristina Polito, Molecular imaging in Parkinson’s disease ISBN 978-88-6655-037-2 (print) ISBN 978-88-6655-041-9 (online) © 2011 Firenze University Press

Cristina Polito 30
2. Methods
2.1 Subjects
Twenty-six PD patients of the whole drug-naïve PD sample were included in this
study (17 males and 9 females, mean age: 65.3±6.4 years) (Table 5.1). They were ex-
amined with MRI scan, [123I]-FP-CIT SPECT and [18F]-FDG PET.
Table 5.1. Patients‘ demographic and clinical data
Demographics Value
Age (years) 65 ± 6 [53-77]
Sex 17 males, 9 females
Side of motor symptoms onset 13 right, 13 left
Symptom at onset 20 tremor, 6 brad/rig
Disease duration (months) 19 ± 9 [3-36]
UPDRS III score 14 ± 5 [7-27]
H&Y score 1.6 ± 0.4 [1-2.5]
Note: values are mean ± standard deviation [range]
2.2 Image analysis
Each MRI scan was coregistered with the corresponding SPECT scan recon-
structed with the OSEM algorithm by using a 3D method based on rigid transforma-
tion with correlation ratio as cost function implemented in Medical Image Process-
ing, Analysis and Visualization (MIPAV version 3.1.3, National Institutes of Health,
NIH, Bethesda, MD). Coregistered MRI/SPECT images consisted in axial sections of
128 slices (128x128 matrix, 2.33 mm/pixel, 2.33 mm slice thickness).
ROIs were manually segmented on the coregistered MRI images on right and left
caudate nucleus (NC) and right and left putamen, and on cerebellum. These ROIs
were rigidly repositioned on [123I]FP-CIT SPECT and used to quantify striatal BP
by means of Least Squares (LS) method (Formiconi et al., 1993; Vanzi et al., 2007).
Striatal BP was estimated as the ratio of a region of specific binding (striatum) to
a region of non-specific binding (cerebellum). We estimated BP for right and left
caudate nucleus and right and left putamen separately.
Among all striatal regions, putaminal BP was identified as the most accurate
measure to determine the severity of dopaminergic degeneration (Spiegel et al.,
2007; Isaias et al., 2007) and therefore used to test the correlation with the clinical
scales of disease severity and with rCMRglc.
Study 2
31
2.3 SPM
The Multiple Regression Design was employed to explore regions in which
rCMRglc correlates negatively with UPDRS III and positively with putaminal BP.
The SPM{t} maps were obtained at a height threshold of p < 0.005, cluster extent ≥
50 voxels. Correction for multiple comparisons was conducted using SPM‘s Small-
Volume-Correction (SVC) facility (Worsley et al., 1996) across the frontal lobe,
based on the a priori knowledge of the physiology of fronto-striatal circuits (Alexan-
der et al., 1986, 1990) and of the regional pattern of metabolic changes in PD, which
involves prefrontal regions (Fukuda et al., 2001). The significance threshold was set
to a corrected value of p<0.05 (False Discovery Rate, FDR, corrected).
3. Results
Caudate and putaminal BP values are shown in Table 5.2.
Table 5.2. Striatal BP values
Striatal region BP
Right caudate nucleus 6.98 ± 1.88
Left caudate nucleus 6.86 ± 1.90
Right putamen 4.59 ± 1.33
Left putamen 4.54 ± 1.33
Ipsi caudate nucleus 7.20 ± 1.82
Contr caudate nucleus 6.64 ± 1.91
Ipsi putamen 5.05 ± 1.36
Contr putamen 4.09 ± 1.36
Note: values are mean ± standard deviation [range]
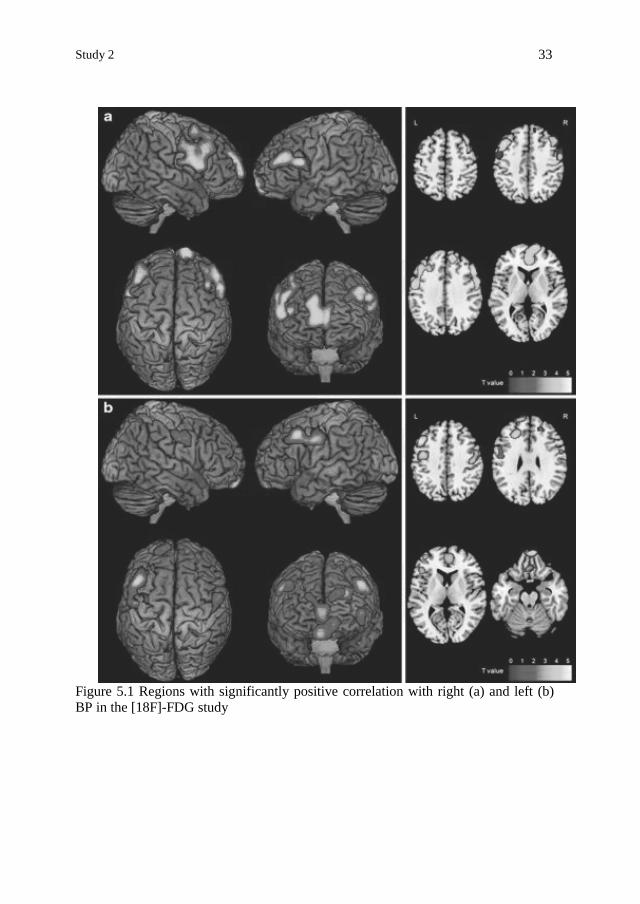
SPM analysis demonstrated a negative correlation between UPDRS III scores
and rCMRglc in bilateral premotor cortex (PMC, Brodmann Area-BA 6) (Table 5.3).
The clusters did not survive after SVC correction for multiple comparisons.
Right putaminal BP positively correlated with rCMRglc in bilateral DLPFC (BA
9), bilateral PMC (BA 6) and bilateral anterior prefrontal cortex (APFC, BA 10) (Ta-
ble 5.3) (Figure 5.1). After SVC correction for multiple comparison, right putaminal
BP positively correlated with rCMRglc in right DLPFC (BA 9), right PMC (BA 6)
and right APFC (BA 10).
Left putaminal BP positively correlated with rCMRglc in bilateral DLPFC (BA
9), bilateral PMC (BA 6), bilateral APFC (BA 10) and bilateral orbitofrontal cortex
(OFC, BA 11) (Table 5.3) (Figure 5.1). After SVC correction for multiple compari-

Cristina Polito 32
son, left putaminal BPLS positively correlated with rCMRglc in left DLPFC (BA 9),
left PMC (BA 6), left APFC (BA 10) and left OFC (BA 11).
Table 5.3. List of local maxima of the most significant correlations with rCMRglc.
Cluster
extent Anatomic area
Functional
area
Talairach
Coordinates t
x y z
UPDRS III
negative
94 Left Frontal lobe GFm BA 6 -26 15 62 3.91
Left Frontal lobe GFs BA 6 -16 22 60 3.67
Left Frontal lobe GFs BA 6 -18 13 64 3.17
113 Right Frontal lobe GFs BA 6 22 -6 70 3.62
Right Frontal lobe GFs BA 6 16 3 68 3.51
Right putaminal BPLS
positive
2552 Right Frontal lobe GFs BA 9 16 48 25 4.93*
Right Frontal lobe GFd BA 10 2 51 9 4.47*
Right Frontal lobe GFs BA 10 12 66 2 4.30*
2035 Right Frontal lobe GFi BA 6 55 0 24 4.77*
Right Frontal lobe GFm BA 9 50 25 32 4.72*
1251 Left Frontal lobe GPrC BA 9 -44 21 36 4.63
Left Frontal lobe GPrC BA 6 -53 0 35 4.43
178 Left Frontal lobe GFm BA 10 -38 53 10 4.15
Left putaminal BP
positive
1332 Left Frontal lobe GPrC BA 9 -46 21 36 5.62*
Left Frontal lobe GFm BA 9 -24 32 26 4.69*
Left Frontal lobe GPrC BA 6 -48 0 33 4.62*
454 Right Frontal lobe GFs BA 11 8 59 -21 4.98
Left Frontal lobe GFs BA 11 -2 57 -21 3.77*
Left Frontal lobe GFs BA 11 -12 66 -10 3.63
125 Left Frontal lobe GFm BA 10 -38 51 9 3.77*
362 Right Frontal lobe GPrC BA 6 55 2 31 3.75
175 Left Frontal lobe GFs BA 9 -18 58 27 3.65
Left Frontal lobe GFs BA 10 -12 61 23 3.42
675 Right Frontal lobe GFd BA 10 4 51 5 3.47
Right Frontal lobe GFd BA 9 20 42 22 3.43
101 Right Frontal lobe GR BA 11 4 32 -20 3.31
Note: * Survived at SVC correction for multiple comparisons (p<0.05).
Abbreviations: GFm=middle frontal gyrus; GFs=superior frontal gyrus; GFi=inferior frontal
gyrus; GPrC=precentral gyrus; GFd=medial frontal gyrus; GR=rectal gyrus.
Study 2
33
Figure 5.1 Regions with significantly positive correlation with right (a) and left (b)
BP in the [18F]-FDG study

Chapter 6
Study 3 Functional changes related to dopamine depletion in the
caudate nucleus in early Parkinson’s disease
1. Background
PD is a neurodegenerative disorder, in which, besides characteristic motor symp-
toms, cognitive deficits ranging from mild cognitive impairment to genuine dementia
often occur (Caviness et al., 2007; Riedel et al., 2008). Functional neuroimaging
plays a key role in the understanding of mechanisms underlying both motor and non
motor dysfunction in PD (Nandhagopal et al., 2008).
The cardinal neuropathological feature of PD is the degeneration of nigrostriatal
dopaminergic (DA) neurons, resulting in a loss of DA terminals in the striatum
(Fearnley and Lees, 1991). [123I]FP-CIT SPECT imaging is the diagnostic technique
most widely used to clinically assess DA system impairment (Booij et al., 2001). Be-
sides, in PD patients correlations have been found between DA depletion in the cau-
date nucleus (NC) and the degree of dementia (Rinne et al., 1989) and neuropsy-
chological performance (Brück et al., 2001, 2005; Marie et al., 1999), although these
findings have not been always confirmed (Broussolle et al., 1999; Rinne et al, 2000).
On the other side, [18F]FDG PET, has been used to identify regional changes in
brain function that differentiate PD patients with and without cognitive dysfunction
(Huang et al., 2008). Several studies identified a metabolic pattern associated with
cognitive dysfunction in PD characterized by metabolic reductions in frontal and pa-
rietal association areas with relative increases in the cerebellar vermis and dentate
nuclei (Huang et al., 2007).
DA transporter imaging (FP-CIT SPECT imaging) and brain metabolic imaging
(FDG PET imaging) have been broadly employed to explore the biological substrate
of PD, but the information of these two widespread molecular imaging techniques
has been long considered apart. In study 2 we investigated the relation between the
severity of DA degeneration in the putamen and metabolic dysfunction in early drug
naïve PD patients (Berti et al., 2009), thus focusing on the functional changes occur-
ring in motor basal ganglia cortical circuit. Besides the metabolic changes in ex-
pected motor cortical regions, we found changes in associative and limbic regions,
such as dorsolateral prefrontal, anterior prefrontal and orbitofrontal areas, hence sug-
gesting an early involvement of non motor frontostriatal circuit in PD.
Given the central role of NC in cognitive dysfunction in PD (Grahn et al., 2008),
the study of the direct relation between DA depletion severity in NC, brain metabo-
Cristina Polito, Molecular imaging in Parkinson’s disease ISBN 978-88-6655-037-2 (print) ISBN 978-88-6655-041-9 (online) © 2011 Firenze University Press
Cristina Polito 36
lism and cognitive functions in early drug naïve PD patients could reveal the early
functional changes directly related to NC DA depletion in associative frontostriatal
circuit, in the absence of the modulation effect of anitiparkinsonian treatment both on
brain metabolism (Asanuma et al, 2006) and cognitive functions (Cools, 2006).
Therefore in the present study, we investigate the direct relation between DA de-
generation severity in NC, assessed by [123I]FP-CIT SPECT NC BP, brain meta-
bolic dysfunction, assessed by [18F]FDG PET rCMRglc, and cognitive dysfunction
in de novo PD patients.
2. Methods
2.1 Subjects
Twenty five drug naïve non demented PD patients of the original PD sample
were enrolled in this study.
Demographic data, disease duration, motor symptoms onset side, UPDRS III
scores, H&Y scores, neuropsychological data are shown in Tables 6.1, 6.2.
Table 6.1. Patients characteristics
No of subjects 25
Sex 17 males, 8 females
Age (years) 65.60 ± 6.34 [53-77]
Education 7.44 ± 3.30 [5-18]
Side of motor symptoms onset 12 right, 13 left
Disease duration (months) 19.52 ± 9.44 [3-36]
Note: values are mean ± standard deviation [range]

Study 3
37
Table 6.2 Clinical and neuropsychological data
UPDRS III 14.44 ± 5.48 [7-27]
H&Y 1.6 ± 0.4 [1-2.5]
MMSE 28.69 ± 1.63 [24.27-30]
MCST PE 5.09 ± 7.63 [0-35]
MCST NPE 3.52 ± 4.79 [0-16]
MCST TE 9.04 ± 10.34 [0-36]
MCST Categories 5.08 ± 1.60 [2-6]
Letter fluency 31.32 ± 9.14 [16-48.5]
SCWT A 19.68 ± 7.11 [11-44]
SCWT B 27.96 ± 10.07 [11-47]
SCWT C 42.56 ± 16.00 [19-80]
CBTT 5.42 ± 1.01 [4-7.25]
TSWRT 4.35 ± 0.72 [3-5.63]
SPCT Primacy effect 3.67 ± 2.10 [0-7.50]
SPCT Recency effect 13.64 ± 4.65 [3-20]
FFAT 9.06 ± 3.31 [0.75-13.75]
Note: Values are mean ± standard deviation [range]
UPDRS III, Unified Parkinson‘s Disease Rating Scale part III; H&Y, Hoehn and Yahr;
MMSE, Mini Mental State Examination; MCST PE, NPE, TE, Modified Card Sorting Test
perseverative errors, non perseverative errors, total errors; SCWT A, B, C, Stroop Color Word
Test, part A, part B, part C; CBTT, Corsi Block Tapping Test; TSWRT, Two Syllabic Word
Repetition Test; SPCT, Serial Position Curve Test; FFAT, Fragmented Figures Assembling
Test.
Cristina Polito 38
2.2 Image analysis
Each MRI scan was coregistered with the corresponding SPECT scan recon-
structed with the OSEM algorithm by using a 3D method based on rigid transforma-
tion with correlation ratio as cost function implemented in Medical Image Process-
ing, Analysis and Visualization (MIPAV version 3.1.3, National Institutes of Health,
NIH, Bethesda, MD). Coregistered MRI/SPECT images consisted in axial sections of
128 slices (128x128 matrix, 2.33 mm/pixel, 2.33 mm slice thickness).
ROIs were manually segmented on the coregistered MRI images on right and left
NC and right and left putamen, and on cerebellum. These ROIs were rigidly reposi-
tioned on [123I]FP-CIT SPECT and used to quantify striatal BP by means of Least
Squares (LS) method. The LS method, a reconstruction algorithm developed in our
Institute (Formiconi, 1993), validated in phantom (Vanzi et al., 2007) and clinical
studies (Berti et al., 2008), was used to estimate striatal BP since it allows a quantifi-
cation of striatal [123I]FP-CIT BP scarcely affected by partial volume effects (Vanzi
et al., 2007), and it was demonstrated to be a sensitive parameter to explore correla-
tions with rCMRglc relative to traditional reconstruction algorithms (Berti et al.,
2009).
Striatal BP was estimated as the ratio of a region of specific binding (striatum) to
a region of non-specific binding (cerebellum). We estimated BP for right and left NC
and right and left putamen separately.
Among striatal regions, right and left NC BP separately were used to test the cor-
relation with neuropsychological test scores and with rCMRglc, according to the
classical model of basal ganglia functional organization which maintains NC as the
striatal relais of non motor associative loop (Alexander et al, 1986).
2.3 Statistical analysis
For normality testing, Kolmogorov-Smirnov test and Shapiro-Wilk test were
used, as appropriate. Independent t test was used to compare NC and putamen BP.
Spearman‘s rho correlation coefficient was used to determine the relationship be-
tween NC BP values and neuropsychological tests scores. Values of p < 0.05 were
considered statistically significant.
2.4 SPM
The Multiple Regression Design was employed to explore regions in which
rCMRglc correlates with neuropsychological test scores and with right and left NC
BP separately. Among neuropsychological test, the following tests were selected for
the SPM multiple regression analysis: MCST perseverative errors and letter fluency
for EF, SCWT C for attention and inhibition process, SPCT primacy effect for LTM,
SPCT recency effect for STM, FFAT for visuoconstructional abilities. The SPM{t}
maps were obtained at a height threshold of p < 0.005, cluster extent ≥ 50 voxels.
Correction for multiple comparisons was conducted using SPM‘s Small-Volume-
Correction (SVC) facility (Worsley et al., 1996) across dorsolateral prefrontal cortex

Study 3
39
(DLPFC), anterior prefrontal cortex (APFC), orbitofrontal cortex (OFC), based on
the a priori knowledge of the physiology of fronto-striatal non motor circuits (Alex-
ander et al, 1986; Alexander and Crutcher, 1990) and across prefrontal, posterior pa-
rietal and cerebellar regions based on the regional pattern of metabolic changes asso-
ciated with cognitive dysfunction in PD (Huang et al., 2007). The significance
threshold was set to a corrected value of p < 0.05 (False Discovery Rate, FDR, cor-
rected).
3. Results
3.1 [123I]FP-CIT SPECT and neuropsychological findings
NC and putaminal BP values are shown in Table 6.3.
Table 6.3 [123I]FP-CIT SPECT Binding Potential (BP)
Right NC BP 6.86 ± 1.82 [3.58-9.94]
Left NC BP 6.73 ± 1.81 [3.24-9.87]
Ipsilateral NC BP 7.20 ± 1.76 [4.03-9.94]
Contralateral NC BP 6.39 ± 1.78 [3.24-9.87]
Right putaminal BP 4.48 ± 1.48 [0.26-6.87]
Left putaminal BP 4.45 ± 1.31 [1.33-6.89]
Ipsilateral putaminal BP 4.96 ± 1.30 [1.33-6.89]
Contralateral putaminal BP 3.98 ± 1.29 [0.26-6.23]
Note: Values are mean ± standard deviation [range]
NC: caudate nucleus.
There is no significant difference between BP values of right and left NC and of
right and left putamen. Considering the first and most affected side of motor symp-
toms, the BP values in the contralateral putamen to the most affected body side (3.98
± 1.29) were significantly lower than BP values in the ipsilateral putamen (4.96 ±
1.30) (p < 0.01). Contralateral NC BP values had a lower mean as compared to ipsi-
lateral NC BP values (6.39 ± 1.78 vs 7.20 ± 1.76), however this difference did not
reach statistical significance (p = 0.11). Putaminal BP values were significantly
lower than NC BP values, both in the ipsilateral and contralateral side ( 4.96 ± 1.30
vs 7.20 ± 1.76, p < 0.0001, and 3.99 ± 1.29 vs 6.39 ± 1.78 p < 0.0001 respectively).
There was a significant correlation between right NC and right putamen (r = 0.769, p
< 0.0001), left NC and left putamen (r = 0.699, p < 0.0001), ipsilateral NC and ipsi-
lateral putamen (r = 0.693, p < 0.0001), contralateral NC and contralateral putamen (r
= 0.791, p < 0.0001). None of the patients complained of subjective cognitive deficits, even so com-
pared to available normative data impairment in both EF and memory domains were
observed (14 patients), as well as selective deficits in EF (one patients) and memory

Cristina Polito 40
(7 patients). Only three patients showed no cognitive impairment, nevertheless no
significant correlation was found between right and left NC BP and neuropsy-
chological test scores.
3.2 Correlation with rCMRglc
As concerns the correlation with neuropsychological measures SPM analysis re-
vealed that rCMRglc correlated: (1) negatively with MCST perseverative errors in
right premotor cortex (PMC, BA 6); (2) positively with letter fluency in bilateral
OFC (BA 10), DLPFC (BA 9, BA 46), right primary motor area (PMA, BA 4) and
PMC (BA 6), (3) negatively with SCWT part C in left PMC (BA 6), right PMA (BA
4) and right primary auditory area (BA 41); (4) positively with the SPCT primacy ef-
fect in left extrastriate visual association area (BA 19), and in right cerebellar poste-
rior lobe; (5) positively with SPCT recency effect in right postcentral gyrus (BA 43),
PMC (BA 6) and in left insula (BA 13); (6) positively with FFAT in left thalamus
and left OFC (BA 47). None of these clusters survived FDR SVC correction for mul-
tiple comparisons (Table 6.4).

Study 3
41
Table 6.4 List of local maxima of the most significant correlations between neuropsychologi-
cal test scores and rCMRglc.
Talairach
Coordinates (mm)
Cluster
extent
Anatomic and functional area x y z t
1. MCST EP
Negative correlation
128
R Superior Frontal Gyrus BA 6
18
15
60
3.69
2. Letter fluency
Positive correlation
226
R precentral Gyrus BA 4
R precentral Gyrus BA 4
53
48
-6
-5
41
52
3.90
2.97
86 R Middle Frontal Gyrus BA46 44 44 25 3.32
96 R Middle Frontal Gyrus BA 10 40 58 -10 3.21
121 L Superior Frontal Gyrus BA 10 -20 66 23 4.00
143 L Middle Frontal Gyrus BA 9
L Superior Frontal Gyrus BA 9
L Superior Frontal Gyrus BA 10
-36
-12
-26
48
52
52
27
34
25
3.56
3.20
3.04
2. SCWT C
Negative correlation
55
R Precentral Gyrus BA 4
55
-12
36
3.22
90 R Superior temporal gyrus BA 41 45 -34 13 3.36
54 L Middle Frontal Gyrus BA 6 -38 14 59 3.57
3. SPCT Primacy effect
Positive correlation
154
R cerebellar posterior lobe Tuber
48
-67
-29
3.47
124 L Superior occipital gyrus BA 19 48 -67 -29 3.47
4. SPCT Recency effect
Positive correlation
674
R Postcentral gyrus BA 43
53
-16
16
4.88
R Precentral Gyrus BA 6 54 1 11 4.48
57 L Insula BA 13 -43 -24 16 3.19
5. FFAT
Positive correlation
243
L Thalamus
-4
-2
2
4.03
237 L Orbital Gyrus BA 47 -12 20 -26 3.94
p value < 0.005 uncorrected
Note: MCST PE, Modified Card Sorting Test perseverative errors; SCWT C, Stroop Color
Word Test part C; SPCT, Serial Position Curve Test; FFAT, Fragmented Figures Assembling
Test; R, Right; L, Left.
As concerns NC BP correlation, SPM analysis revealed a positive correlation be-
tween right NC BP and rCMRglc in bilateral anterior cingulate cortex (ACC, BA
32), OFC (BA 10, 11, 47), DLPFC (BA 9), superior and middle temporal gyrus (BA 38, 21), while left NC BP correlated with rCMRglc in bilateral ACC (BA 32), OFC
(BA 10, 11), DLPFC (BA 9) and right middle temporal gyrus (BA 38). All these
clusters survived the FDR SVC correction for multiple comparisons (Table 6.5, Fig-
ures 6.1 and 6.2). Middle temporal regions were not included in our a priori hypothe-

Cristina Polito 42
sis based on frontostriatal circuits so a post hoc SVC correction was performed based
on network connecting NC and ventral striatum to middle temporal regions, demon-
strated by recent MRI tractography studies (Leh et al., 2007).
Table 6.5 List of local maxima of the most significant correlations between NC BP and
rCMRglc.
Note: NC, caudate nucleus; BP, Binding Potential; R, Right; L, Left.
Talairach
Coordinates (mm)
Cluster
extent
Anatomic and functional area x y z t
1. Right NC BP
Positive correlation
3160
L Anterior Cingulate BA 32
0
41
5
6.43
R Superior Frontal Gyrus BA 11 14 61 -18 4.76
R Rectal Gyrus BA 11 4 34 -20 4.66
359 R Superior Frontal Gyrus BA 9 46 40 31 4.08
108 R Inferior Frontal Gyrus BA 47 42 21 -4 4.07
201 L Middle Frontal Gyrus BA 9 -44 35 31 3.89
50 L Middle Frontal Gyrus BA 10 -44 35 31 3.34
335 R Superior Temporal Gyrus BA 38 40 10 -34 5.19
219 L Middle Temporal Gyrus BA 21 -42 8 -34 3.37
2. Left NC BP
Positive correlation
114
L Cingulate Gyrus BA 32
-12
23
34
4.46
518 R Superior Frontal Gyrus BA 11 12 59 -21 4.85
R Rectal Gyrus BA 11 2 32 -20 4.22
942 R Medial Frontal Gyrus BA 10 10 43 11 4.76
341 R Superior Frontal Gyrus BA 9 46 40 31 3.80
537 L Superior Frontal Gyrus BA 9 -40 36 29 3.87
L Middle Frontal Gyrus BA 10 -36 51 10 3.43
190 R Middle Temporal Gyrus BA 38 42 8 -36 4.71
p value < 0.05 FDR SVC

Study 3
43
Figure 6.1 Direct correlation between rCMRglc and right NC BP. (A) Significant clusters pro-
jected on the standardized MNI MRI render surface, (B) Significant cluster projected on stan-
dardized MNI MRI axial slices, (C-F) Regression analysis of rCMRglc response as dependent
variable and right caudate BP as independent variable at most significant clusters.NC; caudate
nucleus.
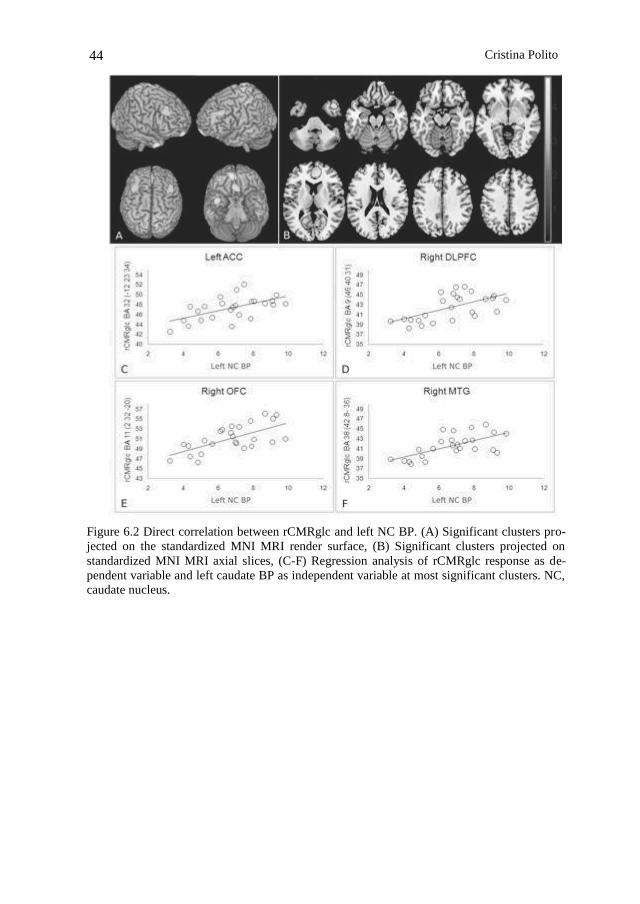
Cristina Polito 44
Figure 6.2 Direct correlation between rCMRglc and left NC BP. (A) Significant clusters pro-
jected on the standardized MNI MRI render surface, (B) Significant clusters projected on
standardized MNI MRI axial slices, (C-F) Regression analysis of rCMRglc response as de-
pendent variable and left caudate BP as independent variable at most significant clusters. NC,
caudate nucleus.

Chapter 7
Discussion
The aim of this thesis was to explore the early functional brain changes characte-
ristic of drug naïve PD patients by means of molecular imaging techniques, and spe-
cifically [123I]FP-CIT SPECT and [18F]FDG PET.
1. Brain metabolism in drug naïve PD patients
In study 1 we investigated brain metabolism in drug-naïve PD patients, in order
to explore CMRglc alterations uniquely related to disease process and not modulated
by antiparkinsonian treatment.
Drug-naïve PD patients showed several CMRglc alterations as compared to NL,
characterized by hypometabolism in frontal (PM, DLPFC) and temporo-parieto-
occipital regions (ITG, SPL, IPL, IOG, MiOG), and hypermetabolism in motor
(PMA), lentiform and cerebellar regions. Interestingly, these metabolic changes were
confirmed independently of symptoms onset side and of prevalent motor symptom.
The progressive effect of disease severity on CMRglc in frontal, temporo-parieto-
occipital, motor, lentiform and cerebellar regions was demonstrated by post hoc
comparisons between NL and PD patients at increasing H&Y stages.
The proposal to explore brain metabolism in drug-naïve PD patients rose from
the recent growing interest for imaging biomarkers, but also from the fact that
[18F]FDG-PET studies supporting brain metabolism as a PD biomarker mainly ex-
amined already treated patients in the off-medication condition. The drawbacks of
the washout designs were previously addressed for DAT-imaging studies, about
which contrasting evidences concerning drug-induced striatal DAT regulation
emerged (Guttman et al., 2001; Boij et al., 2008). Moreover, after antiparkinsonian
therapies withdrawal the effect of medication on clinical symptoms persists for over
two days, and therefore it could not be ruled out a possible persistent effect also on
brain metabolic activity (Fahn et al., 2004).
Our findings are consistent with previous [18F]FDG-PET studies, enrolling both
drug-naïve and off-medication PD patients, which demonstrated in PD patients
CMRglc reductions in frontal and temporo-parieto-occipital areas, and CMRglc in-
creases in subcortical regions and cerebellum (Asanuma et al., 2006; Ma et al., 2007;
Juh et al., 2005; Hosokai et al., 2009).
Cristina Polito, Molecular imaging in Parkinson’s disease ISBN 978-88-6655-037-2 (print) ISBN 978-88-6655-041-9 (online) © 2011 Firenze University Press
Cristina Polito 46
So far, this [18F]FDG-PET study confirms in drug-naïve patients brain metabolic
alterations in PD-related regions, therefore fulfilling a preliminary verification to the
use of brain metabolism as a PD biomarker to monitor disease progression and
treatment modulation effect. The brain metabolic changes found in drug-naïve PD
patients motivate further research on the effect of therapeutic intervention on brain
metabolism, in order to assess whether and in which PD-related regions pharmaco-
logical treatment could modify brain activity.
2. Early functional changes related to dopamine depletion in drug naïve PD pa-
tients
In studies 2 and 3 we explored the direct relation between the severity of striatal
DA degeneration, brain metabolism, motor and cognitive impairment in early drug-
naïve PD patients in order to look for the early functional changes related to striatal
DA depletion in PD.
2.1 [123I]FP-CIT SPECT and clinical findings
[123I]FP-CIT SPECT revealed, consistent with previous SPECT findings, lower
NC DA impairment compared to the putamen, and a greater impairment in the puta-
men contralateral to the first and most affected body side compared to the ipsilateral
one (Booij et al., 1997). DA depletion in contralateral NC was greater than in ipsila-
teral NC, although not reaching statistical significance. Contralateral NC BP were
however strongly correlated with contralateral putaminal BP; this finding suggests
that at early disease stages NC has already got involved in the disease process, as
demonstrated by previous SPECT findings (Winogrodzka et al., 2003) and by PD an-
imal models (Pérez-Otaño et al., 1994), in which a parallel loss of DA terminals in
putamen and NC was observed, although firstly and to a greater extent in the puta-
men.
As concerns motor impairment, we recently demonstrated that [123I]FP-CIT
SPECT BP measured with the LS method allows to find a correlation between puta-
minal DA impairment and clinical ratings of PD severity (Berti et al., 2008). On the
other hand the LS method does not succeed in finding the correlation between DA
impairment in the CN and early cognitive deficits in drug-naïve PD patients.
In line with previous reports (Muslimović et al., 2005; Williams-Gray et al.,
2007), the present PD sample is characterized by cognitive deficits mainly in atten-
tion, executive and memory domains, nevertheless no significant correlation was
found between NC BP and neuropsychological test scores. Our results are in disa-
greement with previous studies which found correlations between cognitive measures
and striatal BP (Duchesne et al., 2002; Müller et al., 2000); however, they differ from
the present one for several reasons. First of all some of them used a combined
NC/putaminal BP (Duchesne, 2002). Further PD samples enrolled in these studies included patients already under antiparkinsonian treatment, at different disease stag-
es, and with a wider range of cognitive deficits. The aim of study 3 was to explore
the early functional and cognitive changes related to the severity of DA depletion in
NC, thus we selected only patients at early disease stages, who had never been phar-

DISCUSSION
47
macologically treated before. The contrasting evidences about the effect of DA re-
placement treatment on cognitive functions in PD given (Cools, 2006), this latter
point became fundamental. The drawback of this accurate patients selection was that
we reduced variability between patients, hence not ensuring enough variability for a
correlation analysis between a biological parameter and cognitive variables. There-
fore the lack of a correlation between NC BP and cognitive dysfunction in our study
may be due to the narrow range of neuropsychological test scores or, not less impor-
tant, to the small PD sample size, this latter point confirming the need for larger pa-
tients sample to obtain significant results relative to cognitive measure (Alexander et
al., 2002).
2.2 Brain metabolic changes related to DA degeneration in early PD
In study 2 we found putaminal DA degeneration to be related to functional activ-
ity in premotor, dorsolateral prefrontal, anterior prefrontal, and orbitofrontal regions.
The correlation between disease severity, as measured by putaminal BP, and
rCMRglc in prefrontal cortical areas confirms the classical model of the basal ganglia
circuit organization, derived from anatomical and electrophysiological studies in
non-human primates (Albin et al., 1989, Obeso et al., 2000).
The concept of frontostriatal loops has been widely used to explain the functional
organization of frontostriatal circuits, by emphasizing the functional inter-
relationships between the neocortex and the striatum. According to this model, five
parallel topographically organized functional circuits has been described: two motor
circuits (i.e., the motor circuit & oculomotor circuit) and three complex (i.e., nonmo-
tor) circuits, originating from the dorsolateral prefrontal cortex (DLPFC), the anterior
cingulate cortex (ACC), and the orbitofrontal cortex OFC (Alexander et al., 1986).
In study 2 we found a positive correlation between putaminal BP and rCMRglc
not only in frontal regions belonging to the motor loop, but also in dorsolateral, ante-
rior prefrontal and orbitofrontal regions, which are part of the associative and limbic
loop (Alexander, 1986). Indeed, the loss of dopaminergic projections in PD is not
confined to the putamen but at the same time occurs also in the caudate nucleus and
in ventral striatum, which are the striatal relais of associative and limbic frontostriatal
loops, therefore connected with DLPFC, APFC and OFC.
This finding led us to further investigate the direct relation between DA degen-
eration in the NC and brain metabolism. As expected we found caudate DA depletion
to be related to functional changes in brain regions belonging to associative and lim-
bic frontostriatal circuits, i.e. DLPFC, OFC and ACC. Therefore, besides motor cir-
cuits, we further confirm the partially anatomical and functional segregation of non
motor frontostriatal circuits too. Recent MRI tractography studies, by exploring NC
connections in vivo, in humans, showed that the head of NC was connected to me-
dial, ventral and dorsolateral prefrontal cortex, prefrontal pole, and supplementary
motor area (Lehericy et al., 2004).
The essential pathophysiological characteristic of the PD state is increased neu-
ronal firing activity in the output nuclei of the basal ganglia leading to excessive in-
hibition of thalamocortical motor system. The correlation between the severity of DA
degeneration in the putamen and brain metabolic alteration in several prefrontal areas

Cristina Polito 48
therefore confirm pathopshysiological changes occurring in the functional organiza-
tion of the basal ganglia in PD. Indeed, the excessive inhibition of thalamocortical
projections may be at the basis of reduced prefrontal rCMRglc correlating with re-
duced BP. Whether thalamocortical inhibition extends to different cortico-striatal
pallidal loops is not yet known, since most studies in PD and animal models have fo-
cused on the motor features associated with DA depletion and replacement, and have
not addressed the molecular and physiological changes that occur in the different
basal ganglia subcircuits (Obeso et al., 2008). The finding of a correlation between
NC DA depletion and dorsolateral, orbitofronatal, anterior cingulate activity how-
ever, suggest that reduced prefrontal rCMRglc correlating with reduced NC BP may
be due to the excessive inhibition of thalamocortical projections in associative and
limbic regions.
Besides DLPFC, OFC and ACC regions which are directly involved in classical
frontostriatal circuits, we found a positive correlation between NC DA depletion and
rCMRglc reduction in superior and middle temporal regions, and specifically in the
temporal pole (TP). In support of a direct connection between temporal lobe and NC,
the temporal lobe has been demonstrated to be a target of basal ganglia outputs in
functional connectivity studies (Postuma and Dagher, 2006), in anatomical studies in
animals (Middleton and Strick, 1996), and in recent MRI tractography study (Leh et
al., 2007). In turn, the TP, thanks to its anatomical position, is highly interconnected
with OFC and with the amygdala (Olson, 2007), and anatomical and functional con-
nections between ventral striatum and the basolateral amygdala have been reported
(Cardinal et al., 2002; Postuma and Dagher., 2006).
The correlation between 123I-FP-CIT putaminal binding potential and rCMRglc,
demonstrates a direct association between a biomarker of dopaminergic degeneration
severity and cortical metabolic reduction in several frontal and prefrontal areas, such
as PMC, DLPFC, APFC and OFC. Our findings, hence, turn the attention on [18F]-
FDG uptake in prefrontal regions as a potential biomarker in PD. A biomarker is a
characteristic that is objectively measured and evaluated as an indicator of normal or
pathogenic biological processes (Biomarkers Definition Working Group, 2001). Ac-
cording with that, prefrontal [18F]-FDG uptake might fulfil the basic requirements
for a biomarker, since it can be objectively measured and it is associated with the PD
pathogenic process, i.e. the dopaminergic degeneration as demonstrated in study 2.
On the other hand the correlation between NC DA impairment and reduced
rCMRglc in associative and limbic regions (study 3) gives further evidences of an
early involvement of non motor circuit in PD. More interestingly, the metabolic re-
duction in temporolimbic regions was uniquely related to DA depletion in NC. The
early involvement of temporolimbic regions in PD disease progression has been
demonstrated by neuropathological studies (Braak et al., 2003), which proposed the
temporolimbic pathology to parallel occur to the degeneration of nigrostriatal DA
neurons. Our finding of a selective correlation between NC DA degeneration and
temporolimbic hypometabolism might suggest additional early functional changes in
temporolimbic regions more directly mediated by NC DA depletion.
References
Abbott RD, Ross GW, White LR, et al. (2003). Environmental, life-style, and physical precur-
sors of clinical Parkinson‘s disease: recent findings from the Honolulu-Asia Aging Study.
J Neurol, 250 (Suppl 3), 30 –39.
Adams JR, van Netten H, Schulzer M, et al. (2005). PET in LRRK2 mutations: comparison to
sporadic Parkinson‘s disease and evidence for presymptomatic compensation. Brain, 128,
2777–2785.
Ahn TB, Kim SY, Kim JY, et al. (2008). Alpha-synuclein gene duplication is present in spo-
radic Parkinson disease. Neurology, 70, 43– 49.
Albin R, Young AB, Penny JB (1989). The functional anatomy of basal ganglia disorders.
Trends Neurosci, 12, 366-375.
Alexander GE, Crutcher MD (1990). Functional architecture of basal ganglia circuits: neural
substrates of parallel processing. Trends Neurosci, 13, 266-271.
Alexander GE, DeLong MR, Strick PL (1986). Parallel organization of funcionally segregated
circuits linking basal ganglia and cortex. Ann Rev Neurosci, 9, 357-381.
Alexander GE, Chen K, Pietrini P, Rapoport SI, Reiman EM, (2002). Longitudinal PET eval-
uation of cerebral metabolic decline in dementia: a potential outcome measure in Alzhei-
mer‘s disease treatment studies. Am. J. Psychiatry 159, 738–745.
Allam MF, Campbell MJ, Hofman A, Del Castillo AS, FernaÅLndez-Crehuet Navajas R
(2004). Smoking and Parkinson‘s disease: systematic review of prospective studies. Mov
Disord, 19, 614–21.
Antonini A, Schwarz J, Oertel WH, Beer HF, Madeja UD, Leenders KL (1994).
[11C]raclopride and positron emission tomography in previously untreated patients with
Parkinson's disease: Influence of L-dopa and lisuride therapy on striatal dopamine D2-
receptors. Neurology, 44(7), 1325-9.
Asanuma K, Tang C, Ma Y, Dhawan V, Mattis P, Edwards C, Kaplitt MG, Feigin A, Eidel-
berg D (2006). Network modulation in the treatment of Parkinson's disease. Brain, 129(Pt
10), 2667-78.
Ascherio A, Chen H, Schwarzschild MA, Zhang SM, Colditz GA, Speizer FE (2003). Caffe-
ine, postmenopausal estrogen, and risk of Parkinson‗s disease. Neurology, 60, 790–95.
Ascherio A, Weisskopf MG, O‘Reilly EJ (2004;). Coffee consumption, gender, and Parkin-
son‘s disease mortality in the cancer prevention study II cohort: the modifying effects of
estrogen. Am J Epidemiol, 160, 977–84.
Asenbaum S, Brucke T, Pirker W, et al. (1997). Imaging of dopamine transporters with
iodine-123-beta-CIT and SPECT in Parkinson‘s disease. J Nucl Med, 38, 1– 6.
Berti V, Pupi A, Ramat S, Vanzi E, De Cristofaro MT, Pellicanò G, Mungai F, Marini P, Sor-
bi S (2008). Clinical correlation of the binding potential with 123I-FP-CIT in de novo
idiopathic Parkinson's disease patients. Eur J Nucl Med Mol Imaging, 35(12), 2220-6.
Berti V, Polito C, Rama S, Vanzi E, De Cristofaro MT, Pellicanò G, Mungai F, Marini P,
Formiconi AR, Sorbi S, Pupi A (2009). Brain metabolic correlates of dopaminergic dege-
Cristina Polito, Molecular imaging in Parkinson’s disease ISBN 978-88-6655-037-2 (print) ISBN 978-88-6655-041-9 (online) © 2011 Firenze University Press

Cristina Polito 50
neration in de novo idiopathic Parkinson's disease. Eur J Nucl Med Mol Imaging, 37(3),
537-44.
Bezard E, Gross CE, Brotchie JM (2003). Presymptomatic compensation in Parkinson‘s dis-
ease is not dopamine-mediated. Trends Neurosci, 26, 215-221.
Biomarkers Definitions Working Group (2001). Biomarkers and surrogate endpoints: pre-
ferred definitions and conceptual framework. Clin Pharmacol Ther, 69, 89 –95.
Bohnen NI, Kaufer DI, Ivanco LS, Lopresti B, Koeppe RA, Davis JG, Mathis CA, Moore RY,
DeKosky ST (2003). Cortical cholinergic function is more severely affected in parkinso-
nian dementia than in Alzheimer disease: an in vivo positron emission tomographic study.
Arch Neurol, 60(12), 1745-8.
Booij J, Habraken JB, Bergmans P, et al. (1998) Imaging of dopamine transporters with
iodine-123-FP-CIT SPECT in healthy controls and patients with Parkinson‘s disease. J
Nucl Med, 39, 1879 –1884.
Booij J, Kemp P (2008). Dopamine transporter imaging with [(123)I]FP-CIT SPECT: poten-
tial effects of drugs. Eur J Nucl Med Mol Imaging, 35:424-38.
Booij J, Tissingh G, Winogrodzka A, van Royen EA (1999). Imaging the dopaminergic neu-
rotransmission system using singlephoton emission tomography and positron emission
tomography in patients with parkinsonism. Eur JNucl Med, 26, 171-82.
Booij T, Tissingh G, Boer G (1997). [123I]FP-SPECT shows a pronounced decline of striatal
dopamine transporter labelling in early and advanced Parkinson‘s disease. J Neurol Neu-
rosurg Psychiatry, 62, 133–140.
Booij J, Speelman .JD, Horstink MW, Wolters, EC (2001). The clinical benefit of imaging
striatal dopamine trasporters with [123I]FP-CIT SPET in differentiating patients with pre-
synaptic parkinsonism from those with other forms of parkinsonism. Eur. J. Nucl. Med.
28, 266-272.
Bower JH, Maraganore DM, McDonnell SDK, Rocca WA (1999). Incidence and distribution
of parkinsonism in Olmsted County, Minnesota, 1976–1990. Neurology, 52, 1214–20.
Braak H, Del Tredici K, Rüb U, de Vos RA, Jansen Steur EN, Braak E (2003). Staging of
brain pathology related to sporadic Parkinson's disease. Neurobiol Aging, 24, 197-211.
Brooks DJ, Ibanez V, Sawle GV et al. (1990). Differing patterns of striatal 18F-dopa uptake
in Parkinson‘s disease, multiple system atrophy, and progressive supranuclear palsy. Ann
Neurol, 28, 547–555.
Brooks DJ, Ibanez V, Sawle GV, Playford ED, Quinn N, Mathias CJ, Lees AJ, Marsden CD,
Bannister R, Frackowiak RS (1992). Striatal D2 receptor status in patients with Parkin-
son's disease, striatonigral degeneration, and progressive supranuclear palsy, measured
with 11C-raclopride and positron emission tomography. Ann Neurol, 31(2), 184-92.
Brooks DJ, Salmon EP, Mathias CJ, Quinn N, Leenders KL, Bannister R, Marsden CD,
Frackowiak RS (1990). The relationship between locomotor disability, autonomic dys-
function, and the integrity of the striatal dopaminergic system in patients with multiple
system atrophy, pure autonomic failure, and Parkinson's disease, studied with PET. Brain,
113 (Pt 5), 1539-52.
Brooks DJ (1997). PET and SPECT studies in Parkinson‘s disease. Bailliere’s Clinical Neu-
rology, 6, 69-87.
Broussolle E, Dentresangle C, Landais P, Garcia-Larrea L, Pollak P, Croisile B, Hibert O,
Bonnefoi F, Galy G, Froment JC, Comar D (1999). The relation of putamen and caudate
nucleus 18F-Dopa uptake to motor and cognitive performances in Parkinson's disease. J
Neurol Sci, 166(2), 141-51.
Brück A, Aalto S, Nurmi E, Bergman J, Rinne J (2005). Cortical 6-[18F]fluoro-L-dopa uptake
and frontal cognitive functions in early Parkinson's disease. Neurobiol. Aging, 26, 891-
898.
References
51
Brück A, Portin R, Lindell A, Laihinen A, Bergman J, Haaparanta M, Solin O, Rinne JO
(2001). Positron emission tomography shows that impaired frontal lobe functioning in
Parkinson‘s disease is related to dopaminergic hypofunction in the caudate nucelus. Neu-
rosci. Lett, 311, 81–84.
Brücke T, Asenbaum S, Pirker W, Djamshidian S, Wenger S, Wöber C, Müller C, Podreka I
(1997). Measurement of the dopaminergic degeneration in Parkinson's disease with [123I]
beta-CIT and SPECT. Correlation with clinical findings and comparison with multiple
system atrophy and progressive supranuclear palsy. J Neural Transm Suppl, 50, 9-24.
Cardinal RN, Parkinson JA, Hall J, Everitt BJ (2002). Emotion and motivation: the role of the
amygdala, ventral striatum, and prefrontal cortex. Neurosci Biobehav Rev, 26, 321-52.
Catafau AM, Tolosa E (2004). Impact of dopamine transporter SPECT using 123I-Ioflupane
on diagnosis and management of patients with clinically uncertain parkinsonian syn-
dromes. Mov Disord, 19, 1175–1182.
Caviness JN, Driver-Dunckley E, Connor DJ, Sabbagh MN, Hentz JG, Noble B, Evidente
VG, Shill HA, Adler CH (2007). Defining mild cognitive impairment in Parkinson's dis-
ease. Mov Disord, 22, 1272–1277.
Chen H, Jacobs E, Schwarzschild MA, et al. (2005). Nonsteroidal antiinflammatory drug use
and the risk for Parkinson‘s disease. Ann Neurol, 58, 963–967.
Chen H, O‘Reilly EJ, Schwarzschild MA, Ascherio A (2008). Peripheral inflammatory bio-
markers and risk of Parkinson‘s disease. Am J Epidemiol, 167, 90 –95.
Cookson MR, van der Brug M (2008). Cell systems and the toxic mechanism(s) of alpha-
synuclein. Exp Neurol, 209: 5–11.
Cools R (2006). Dopaminergic modulation of cognitive function-implications for L-DOPA
treatment in Parkinson's disease. Neurosci Biobehav Rev, 30, 1-23.
Damier P, Hirsch EC, Agid Y, Graybiel AM (1999). The substantia nigra of the human brain.
II. Patterns of loss of dopamine-containing neurons in Parkinson‗s disease. Brain, 122,
1437–48.
De Gruttola VG, Clax P, DeMets DL et al. (2001). Considerations in the evaluation of surro-
gate endpoints in clinical trials. Summary of a National Institutes of Health workshop.
Control Clin Trials, 22, 485–502.
de Rijk MC, Breteler MM, Graveland GA et al. (1995). Prevalence of Parkinson‘s disease in
the elderly: the Rotterdam Study. Neurology, 45, 2143–46.
de Rijk MC, Launer LJ, Berger K, Breteler MM, Dartigues JF, Baldereschi M, Fratiglioni L,
Lobo A, Martinez-Lage J, Trenkwalder C, Hofman A (2000). Prevalence of Parkinson's
disease in Europe: A collaborative study of population-based cohorts. Neurologic Diseas-
es in the Elderly Research Group. Neurology, 54(11 Suppl 5), S21-3.
DeLong MR, Wichmann T (2007). Circuits and circuit disorders of the basal ganglia. Arch
Neurol, 64(1), 20-4.
Dentresangle C, Veyre L, Le Bars D, Pierre C, Lavenne F, Pollak P, Guerin J, Froment JC,
Brousolle E (1999). Striatal D2 dopamine receptor status in Parkinson's disease: an
[18F]dopa and [11C]raclopride PET study. Mov Disord, 14(6), 1025-30.
Dick FD, De Palma G, Ahmadi A, Scott NW, Prescott GJ, Bennett J, Semple S, Dick S,
Counsell C, Mozzoni P, Haites N, Wettinger SB, Mutti A, Otelea M, Seaton A, Söderk-
vist P, Felice A; Geoparkinson study group (2007). Environmental risk factors for Parkin-
son's disease and parkinsonism: the Geoparkinson study. Occup Environ Med,;64(10),
666-72.
Doder M, Rabiner EA, Turjanski N, Lees AJ, Brooks DJ (2003). Tremor in Parkinson's dis-
ease and serotonergic dysfunction: an 11C-WAY 100635 PET study. Neurology, 60(4),
601-5.
Duchesne N, Soucy JP, Masson H, Chouinard S, Bédard MA (2002). Cognitive deficits and
striatal dopaminergic denervation in Parkinson's disease: a single photon emission com-
Cristina Polito 52
puted tomography study using 123iodine-beta-CIT in patients on and off levodopa. Clin.
Neuropharmacol, 25, 216-224.
Eckert T, Barnes A, Dhawan V, Frucht S, Gordon MF, Feigin AS et al. (2005). FDG PET in
the differential diagnosis of parkinsonian disorders. NeuroImage, 26, 912-921.
Eckert T, Eidelberg D (2005). Neuroimaging and therapeutics in movement disorders. Neu-
roRx, 2(2), 361-71.
Eckert T, Tang C, Eidelberg D (2007). Assessment of the progression of Parkinson's disease:
a metabolic network approach. Lancet Neurol, 6(10), 926-32.
Eckert T, Tang C, Ma Y, Brown N, Lin T, Frucht S, Feigin A, Eidelberg D (2008). Abnormal
metabolic networks in atypical parkinsonism. Mov Disord, 23(5), 727-33.
Eidelberg D, Moeller JR, Dhawan V, Spetsieris P, Takikawa S, Ishikawa T, Chaly T, Robeson
W, Margouleff D, Przedborski S, et al. (1994). The metabolic topography of parkinson-
ism. J Cereb Blood Flow Metab, 14(5), 783-801.
Eidelberg D, Moeller JR, Ishikawa T, Dhawan V, Spetsieris P, Chaly T, Robeson W, Dahl JR,
Margouleff D (1995). Assessment of disease severity in parkinsonism with fluorine-18-
fluorodeoxyglucose and PET. J Nucl Med, 36(3), 378-83.
Eidelberg D, Moeller JR, Kazumata K, Antonini A, Sterio D, Dhawan V, Spetsieris P, Alter-
man R, Kelly PJ, Dogali M, Fazzini E, Beric A (1997). Metabolic correlates of pallidal
neuronal activity in Parkinson's disease. Brain, 120 ( Pt 8),1315-24.
Eidelberg D (2009). Metabolic brain networks in neurodegenerative disorders: a functional
imaging approach. Trends Neurosci, 32(10), 548-57.
El-Agnaf OM, Salem SA, Paleologou KE, et al. (2006). Detection of oligomeric forms of al-
pha-synuclein protein in human plasma as a potential biomarker for Parkinson‘s disease.
FASEB , ;20, 419–425.
Elbaz A, Tranchant C (2007). Epidemiologic studies of environmental exposures in Parkin-
son‘s disease. J Neurol Sci, 262, 37–44.
Fahn S, Oakes D, Shoulson I, Kieburtz K, Rudolph A, Lang A, et al. (2004) Levodopa and the
progression of Parkinson's disease. N Engl J Med, 351, 2498-2508.
Fahn S, Elton RL and members of the UPDRS Development Committee (1987). Unified Par-
kinson's disease rating scale, in: Fahn S., Marsden C.D., Calne D.B., Goldstein M.(Eds).
Recent development in Parkinson's disease. Florham Park: Macmillan Healthcare infor-
mation,. pp. 153-164.
Fearnley J, Lees A (1991). Ageing and Parkinson‘s disease: substantia nigra regional selec-
tivity. Brain, 114, 2283– 2301.
Feigin A, Antonini A, Fukuda M, De Notaris R, Benti R, Pezzoli G, Mentis MJ, Moeller JR,
Eidelberg D (2002). Tc-99m ethylene cysteinate dimer SPECT in the differential diagno-
sis of parkinsonism. Mov Disord, 17(6), 1265-70.
Feigin A, Fukuda M, Dhawan V, Przedborski S, Jackson-Lewis V, Mentis MJ, Moeller JR,
Eidelberg D (2001). Metabolic correlates of levodopa response in Parkinson's disease.
Neurology, 57(11), 2083-8.
Firnau G, Sood S, Chirakal R, Nahmias C, Garnett ES (1987). Cerebral metabolism of 6-
[18F]fluoro-L-3,4-dihydroxyphenylalanine in the primate. J Neurochem, 48, 1077–1082.
Fischman AJ, Bonab AA, Babich JW et al. (1998). Rapid detection of Parkinson‘s disease by
SPECT with altropane: a selective ligand for dopamine transporters. Synapse, 29, 128–
141.
Folstein MF, Folstein SE, McHugh PR (1975). "Mini-mental state". A practical method for
grading the cognitive state of patients for the clinician. J Psychiatr Res, 12(3), 189-98.
Formiconi AR (1993). Least squares algorithm for region of interest evaluation in emission
tomography. IEEE Trans. Med. Imag, 12, 90–100.
Frey K, Koeppe R, Kilbourn M (2001). Imaging the vesicular monoamine transporter. Adv
Neurol, 86, 237–247.

References
53
Frey KA, Koeppe RA, Kilbourn MR et al. (1996). Presynaptic monoaminergic vesicles in
Parkinson‘s disease and normal aging. Ann Neurol, 40, 873–884.
Fujita M, Ichise M, Zoghbi SS, et al. (2006). Widespread decrease of nicotinic acetylcholine
receptors in Parkinson‘s disease. Ann Neurol, 59, 174–177.
Fukuda M, Edwards C, Eidelberg D (2001). Functional brain networks in Parkinson‘s disease.
Parkinsonism and Related Disorders, 8, 91-94.
Gelb DJ, Oliver E, Gilman S (1999). Diagnostic criteria for Parkinson disease. Arch Neurol,
56(1), 33-9.
Gerhard A, Pavese N, Hotton G et al. (2006) In vivo imaging of microglial activation with
[11C](R)-PK11195 PET in idiopathic Parkinson‘s disease. Neurobiol Dis, 21, 404–412.
Gonera EG, Van‘t Hof M, Berger HJC, Van Weel C, Horstink MWIM (1997). Symptoms and
duration of the premotor phase in Parkinson‘s disease. Mov Disord, 12, 871–876.
Grahn JA, Parkinson JA, Owen AM (2008). The cognitive functions of the caudate nucleus.
Prog. Neurobiol, 86, 141-155.
Guttman M, Boileau I, Warsh J, Saint-Cyr JA, Ginovart N, McCluskey T, Houle S, Wilson A,
Mundo E, Rusjan P, Meyer J, Kish SJ (2007). Brain serotonin transporter binding in non-
depressed patients with Parkinson's disease. Eur J Neurol. May, 14(5), 523-8.
Guttman M, Stewart D, Hussey D, Wilson A, Houle S, Kish S (2001). Influence of L-dopa
and pramipexole on striatal dopamine transporter in early PD. Neurology, 56, 1559-64.
Haehner A, Hummel T, Hummel C, Sommer U, Junghanns S, Reichmann H (2007). Olfactory
loss may be a first sign of idiopathic Parkinson‘s disease. Mov Disord, 22, 839–842.
Healy DG, Falchi M, O‘Sullivan SS, et al. (2008). Phenotype, genotype, and worldwide ge-
netic penetrance of LRRK2- associated Parkinson‘s disease: a case-control study. Lancet
Neurol, 7, 583–590.
Herholz K. Herscovitch P and Heiss W D (2004). Imaging brain function. In: NeuroPET: Po-
sitron Emission Tomography in Neuroscience and Clinical Neurology, vol. 3, pp. 143 –
185, Herholz K, Herscovitch P and Heiss WD (eds.), Springer, New York.
Hernàn MA, Zhang SM, Rueda-deCastro AM, Colditz GA, Ascherio A (2001). Cigarette
smoking and the incidence of Parkinson‘s disease in two prospective studies. Ann Neurol,
50, 780–86.
Herschman HR (2003). Molecular imaging: looking at problems, seeing solutions, Science,
302, 605–608.
Hilker R, Thomas AV, Klein JC, Weisenbach S, Kalbe E, Burghaus L, Jacobs AH, Herholz K,
Heiss WD (2005). Dementia in Parkinson disease: functional imaging of cholinergic and
dopaminergic pathways. Neurology, 65(11), 1716-22.
Hirano S, Asanuma K, Ma Y, Tang C, Feigin A, Dhawan V, Carbonß M, Eidelberg D (2008).
Dissociation of metabolic and neurovascular responses to levodopa in the treatment of
Parkinson's disease. J Neurosci, 28(16), 4201-9.
Hirsch EC, Breidert T, Rousselet E, Hunot S, Hartmann A, Michel PP (2003). The role of gli-
al reaction and inflammation in Parkinson‘s disease. Ann NY Acad Sci, 991, 214–228.
Hoehn MM, Yahr MD (1967). Parkinsonism: onset, progression and mortality. Neurology,
17(5), 427-42.
Hosokai Y, Nishio Y, Hirayama K, Takeda A, Ishioka T, Sawada Y, Suzuki K, Itoyama Y,
Takahashi S, Fukuda H, Mori E (2009). Distinct patterns of regional cerebral glucose me-
tabolism in Parkinson's disease with and without mild cognitive impairment. Mov Disord,
24(6), 854-62.
Hu MT, Taylor-Robinson SD, Chaudhuri KR, Bell JD, Labbé C, Cunningham VJ, Koepp MJ,
Hammers A, Morris RG, Turjanski N, Brooks DJ (2000). Cortical dysfunction in non-
demented Parkinson's disease patients: a combined (31)P-MRS and (18)FDG-PET study.
Brain. 123 ( Pt 2), 340-52.

Cristina Polito 54
Huang C, Mattis P, Perrine K, Brown N, Dhawan V, Eidelberg D (2008). Metabolic abnor-
malities associated with mild cognitive impairment in Parkinson disease. Neurology,
70(16 Pt 2), 1470-7.
Huang C, Mattis P, Tang C, Perrine K, Carbon M, Eidelberg D (2007). Metabolic brain net-
works associated with cognitive function in Parkinson‘s disease. Neuroimage, 34: 714–
723.
Huang C, Tang C, Feigin A, Lesser M, Ma Y, Pourfar M, Dhawan V, Eidelberg D (2007).
Changes in network activity with the progression of Parkinson's disease. Brain, 130(Pt 7),
1834-46.
Huang WS, Lin SZ, Lin JC, Wey SP, Ting G, Liu RS (2001). Evaluation of early-stage Par-
kinson‘s disease with 99mTc- TRODAT-1 imaging. J Nucl Med, 42, 1303–1308.
Innis RB, Cunningham VJ, Delforge J, Fujita M, Gjedde A, Gunn RN, et al. (2007). Consen-
sus nomenclature for in vivo imaging of reversibly binding radioligands. J Cereb Blood
Flow Metab, 27, 1533-1539.
Innis RB, Seibyl JP, Scanley BE, et al. ( 1993). Single photon emission computed tomograph-
ic imaging demonstrates loss of striatal dopamine transporters in Parkinson disease. Proc
Natl Acad Sci USA, 90, 11965–11969.
Iranzo A, Molinuevo JL, Santamaría J, et al. (2006). Rapid-eyemovement sleep behaviour
disorder as an early marker for a neurodegenerative disorder: a descriptive study. Lancet
Neurol, 5, 572–577.
Isaias IU, Benti R, Cilia R, Canesi M, Marotta G, Gerundini P, et al. (2007). [123I]FP-CIT
striatal binding in early Parkinson‘s disease patients with tremor vs. akinetic-rigid onset.
NeuroReport, 18, 1499-1502.
Jankovic J, McDermott M, Carter J, Gauthier S, Goetz C, Golbe L, et al. (1990). Variable ex-
pression of Parkinson‘s disease: a base-line analysis of the DATATOP cohort. Neurology,
50, 1529 –1534.
Jennings D, Seibyl J, Oakes D, Eberly S, Murphy J, Marek K (2004). (123I) -CIT and single-
photon emission computed tomographic imaging versus clinical evaluation in parkinso-
nian syndrome: unmasking an early diagnosis. Arch Neurol, 61, 1219 –1228.
Juh R, Pae CU, Lee CU, Yang D, Chung Y, Suh T, Choe B (2005). Voxel based comparison
of glucose metabolism in the differential diagnosis of the multiple system atrophy using
statistical parametric mapping. Neurosci Res,, 52(3), 211-9.
Kaasinen V, Aalto S, NAgren K, Hietala J, Sonninen P, Rinne JO (2003). Extrastriatal dopa-
mine D(2) receptors in Parkinson's disease: a longitudinal study. J Neural Transm,
110(6), 591-601.
Kaasinen V, Någren K, Hietala J, Oikonen V, Vilkman H, Farde L, Halldin C, Rinne JO
(2000). Extrastriatal dopamine D2 and D3 receptors in early and advanced Parkinson's
disease. Neurology, 54(7), 1482-7.
Kaasinen V, Nurmi E, Brück A, Eskola O, Bergman J, Solin O, Rinne JO (2001). Increased
frontal [(18)F]fluorodopa uptake in early Parkinson's disease: sex differences in the pre-
frontal cortex. Brain, 124(Pt 6), 1125-30.
Katzenschlager R, Head J, Schraq A, Ben-Shlomo Y, Evans A, Lees AJ (2008). Fourteen-year
final report of the randomized PDRG-UK trial comparing three initial treatments in PD.
Neurology, 71, 474–80.
Kaufman M, Madras B (1991). Severe depletion of cocaine recognition sites associated with
the dopamine transporter in Parkinson‘s diseased striatum. Synapse, 9, 43– 49.
Khan NL, Valente EM, Bentivoglio AR, et al. (2002). Clinical and subclinical dopaminergic
dysfunction in PARK6-linked parkinsonism: an 18F-dopa PET study. Ann Neurol, 52,
849–853.

References
55
Kish SJ, Shannak K, Hornykiewicz O (1988). Uneven pattern of dopamine loss in the striatum
of patients with idiopathic Parkinson's disease. Pathophysiologic and clinical implica-
tions. N Engl J Med, 318(14), 876-80.
Klein C, Schlossmacher MG (2007). Parkinson disease, 10 years after its genetic revolution:
multiple clues to a complex disorder. Neurology, 69, 2093–2104.
Kuhl DE, Metter EJ, Riege WH (1984). Patterns of cerebral glucose utilisation determined in
Parkinson‘s disease by the 18Ffluorodeoxyglucose method. Ann Neurol, 15, 419-24.
Kuhl DE, Minoshima S, Fessler JA, Frey KA, Foster NL, Ficaro EP, Wieland DM, Koeppe
RA (1996). In vivo mapping of cholinergic terminals in normal aging, Alzheimer's dis-
ease, and Parkinson's disease. Ann Neurol, 40(3), 399-410.
Lang AE (2007). The progression of Parkinson disease: a hypothesis. Neurology, 68(12):948-
52.
Langston JW (2006). The Parkinson‘s complex: parkinsonism is just the tip of the iceberg.
Ann Neurol, 59, 591–596.
Lee CS, Samii A, Sossi V, Ruth TJ, Schulzer M, Holden JE, Wudel J, Pal PK, de la Fuente-
Fernandez R, Calne DB, Stoessl AJ (2000). In vivo positron emission tomographic evi-
dence for compensatory changes in presynaptic dopaminergic nerve terminals in Parkin-
son's disease. Ann Neurol, 47(4), 493-503.
Lees AJ, Hardy J, Revesz T (2009). Parkinson's disease. Lancet, 373(9680), 2055-66.
Leh SE, Ptito A, Chakravarty MM, Strafella AP (2007). Fronto-striatal connections in the
human brain: a probabilistic diffusion tractography study. Neurosci Lett, 419, 113-118.
Lehericy S, Ducros M, Van de Moortele PF, Francois C, Thivard L, Poupon C, Swindale N,
Ugurbil K, Kim DS (2004). Diffusion tensor fiber tracking shows distinct corticostriatal
circuits in humans. Ann. Neurol, 55, 522–529.
Lesage S, Brice A (2009). Parkinson's disease: from monogenic forms to genetic susceptibility
factors. Hum Mol Genet, 18(R1), R48-59.
Lesage S, Durr A, Tazir M, et al. (2006). LRRK2 G2019S as a cause of Parkinson‘s disease in
North African Arabs. N Engl J Med, 354, 422– 423.
Lim SY, Fox SH, Lang AE (2009). Overview of the extranigral aspects of Parkinson disease.
Arch Neurol, 66(2), 167-72.
Lin TP, Carbon M, Tang C, Mogilner AY, Sterio D, Beric A, Dhawan V, Eidelberg D (2008).
Metabolic correlates of subthalamic nucleus activity in Parkinson's disease. Brain, 131(Pt
5), 1373-80.
Liu Y, Edwards RH (1997). The role of vesicular transport proteins in synaptic transmission
and neural degeneration. Annu Rev Neurosci, 20:125-56.
Lozza C, Baron JC, Eidelberg D, Mentis MJ, Carbon M, Marié RM (2004). Executive
processes in Parkinson's disease: FDG-PET and network analysis. Hum Brain Mapp,
22(3), 236-45.
Ma Y, Tang C, Spetsieris PG, Dhawan V, Eidelberg D (2007). Abnormal metabolic network
activity in Parkinson's disease: test-retest reproducibility. J Cereb Blood Flow Metab,
27(3), 597-605.
Maetzler W, Reimold M, Liepelt I, et al. (2008). [11C]PIB binding in Parkinson‘s disease
dementia. Neuroimage, 39, 1027–1033.
Marek K, Jennings D, Tamagnan G, Seibyl J (2008). Biomarkers for Parkinson's disease: tools
to assess Parkinson's disease onset and progression. Ann Neurol, 64 Suppl 2, S111-21.
Marek K, Jennings D (2009). Can we image premotor Parkinson disease? Neurology, 72(7
Suppl), S21-6.
Marek K, Seibyl J; Parkinson Study Group (2003). -CIT scans without evidence of dopami-
nergic deficit (SWEDD) in the ELLDOPA-CIT and CALM-CIT study: long-term imag-
ing assessment. Neurology, 60(suppl 1), A298.

Cristina Polito 56
Marek K (1999). Dopaminergic dysfunction in parkinsonism: new lessons from imaging.
Neuroscientist, 5, 333– 339.
Marie RM, Barre L, Dupuy B, Viader F, Defer G, Baron JC (1999). Relationships between
striatal dopamine denervation and frontal executive tests in Parkinson‘s disease. Neurosci.
Lett, 260, 77–80.
McGeer PL, McGeer EG (2004). Inflammation and neurodegeneration in Parkinson‘s disease.
Parkinsonism Relat Disord, 10(suppl 1), S3–S7.
Michell AW, Lewis SJ, Foltynie T, Barker RA (2004). Biomarkers and Parkinson's disease.
Brain, 127, 1693-705.
Moeller JR, Eidelberg D (1997). Divergent expression of regional metabolic topographies in
Parkinson's disease and normal ageing. Brain, 120 ( Pt 12), 2197-206.
Moeller JR, Nakamura T, Mentis MJ, Dhawan V, Spetsieres P, Antonini A, Missimer J,
Leenders KL, Eidelberg D (1999). Reproducibility of regional metabolic covariance pat-
terns: comparison of four populations. J Nucl Med, 40(8), 1264-9
Moore RY, Whone AL, Brooks DJ (2008). Extrastriatal monoamine neuron function in Par-
kinson's disease: an 18F-dopa PET study. Neurobiol Dis, 29(3), 381-90.
Morrish PK, Rakshi JS, Bailey DL, Sawle GV, Brooks DJ (1998). Measuring the rate of pro-
gression and estimating the preclinical period of Parkinson‘s disease with [18F]dopa PET.
J Neurol Neurosurg Psychiatry, 64:314 –319.
Morrish PK, Sawle GV, Brooks DJ (1995). Clinical and [18F] dopa PET findings in early
Parkinson's disease. J Neurol Neurosurg Psychiatry, 59(6), 597-600.
Mozley PD, Schneider JS, Acton PD et al. (2000). Binding of [99mTc]TRODAT-1 to dopa-
mine transporters in patients with Parkinson‘s disease and in healthy volunteers. J Nucl
Med, 41, 584 –589.
Müller U, Wächter T, Barthel H, Reuter M, von Cramon DY (2000). Striatal [123I]beta-CIT
SPECT and prefrontal cognitive functions in Parkinson's disease. J Neural Transm, 107,
303-319.
Muslimović D, Post B, Speelman JD, Schmand B (2005). Cognitive profile of patients with
newly diagnosed Parkinson disease. Neurology, 65, 1239-1245.
Nagano-Saito A, Kato T, Arahata Y, Washimi Y, Nakamura A, Abe Y, et al. (2004). Cogni-
tive- and motor-related regions in Parkinson‘s disease: FDOPA and FDG PET studies.
NeuroImage, 22, 553-561.
Nandhagopal R, McKeown MJ, Stoessl AJ (2008). Functional imaging in Parkinson disease.
Neurology, 70, 1478-1488.
Nelson HE (1976). A modified card sorting test sensitive to frontal lobe defects. Cortex,
12(4), 313-24.
Niznik HB, Fogel EF, Fassos FF, Seeman P (1991). The dopamine transporter is absent in
Parkinsonian putamen and reduced in the caudate nucleus. J Neurochem, 56, 192–198.
Novelli G, Papagno C, Capitani E, Laiacona M, Vallar G, Cappa S (1986). Tre test clinici di
ricerca e produzione lessicale: taratura sui soggetti normali. Archivio di Psicologia, Neu-
rologia e Psichiatria, 47, 477-506.
Nurmi E, Ruottinen HM, Kaasinen V, Bergman J, Haaparanta M, Solin O et al. (2000). Pro-
gression in Parkinson‘s disease: a positron emission tomography study with dopamine
transporter ligand [18F]CFT. Ann Neurol, 47, 804-8.
Obeso JA, Marin C, Rodriguez-Oroz C, Blesa J, Benitez-Temiño B, Mena-Segovia J,
Rodríguez M, Olanow CW (2008). The basal ganglia in Parkinson's disease: current con-
cepts and unexplained observations. Ann Neurol, 64 Suppl 2, S30-46.
Obeso JA, Rodriguez-Oroz MC, Lanciego JL, Rodriguez Diaz M (2004). How does Parkin-
son‘s disease begin? The role of compensatory mechanisms. Trends Neurosci, 27, 125-
127.

References
57
Obeso JA, Rodriguez-Oroz MC, Rodriguez M, Lanciego JL, Artieda J, Gonzao N, et al.
(2000) Pathophysiology of the basal ganglia in Parkinson‘s disease. Trens Neurosci, 2,
S8-19.
Obeso JA, Marin C, Rodriguez-Oroz C, Blesa J, Benitez-Temiño B, Mena-Segovia J,
Rodríguez M, Olanow CW (2008). The basal ganglia in Parkinson's disease: current con-
cepts and unexplained observations. Ann. Neurol, 64, S30-46.
Oka H, Yoshioka M, Morita M, et al. (2007). Reduced cardiac 123I-MIBG uptake reflects
cardiac sympathetic dysfunction in Lewy body disease. Neurology, 69,1460–1465.
Olanow CW, McNaught KS (2006). Ubiquitin-proteasome system and Parkinson‘s disease.
Mov Disord, 21, 1806–1823.
Olson IR, Plotzker A, Ezzyat Y (2007). The Enigmatic temporal pole: a review of findings on
social and emotional processing. Brain, 130, 1718-1731.
Ouchi Y, Yoshikawa E, Sekine Y et al. (2005) Microglial activation and dopamine terminal
loss in early Parkinson‘s disease. Ann Neurol, 57, 168–175.
Ozelius LJ, Senthil G, Saunders-Pullman R et al. (2006). LRRK2 G2019S as a cause of Par-
kinson‘s disease in Ashkenazi Jews. N Engl J Med, 354, 424–425.
Pankratz N, Foroud T (2007). Genetics of Parkinson disease. Genet Med, 9, 801–811.
Parkinson Study Group (2004). Levodopa and the progression of Parkinson disease. N Engl J
Med, 351, 18–28.
Parkinson Study Group (2007). Mixed lineage kinase inhibitor CEP-1347 fails to delay disa-
bility in early Parkinson disease. Neurology, 69:1480 –1490.
Pate BD, Kawamata T, Yamada T, McGeer EG, Hewitt KA, Snow BJ, Ruth TJ, Calne DB
(1993). Correlation of striatal fluorodopa uptake in the MPTP monkey with dopaminergic
indices. Ann Neurol, 34(3), 331-8.
Pavese N, Brooks DJ (2009). Imaging neurodegeneration in Parkinson's disease. Biochim Bio-
phys Acta, 1792(7), 722-9.
Pellerin L, Bouzier-Sore AK, Aubert A, Serres S, Merle M, Costalat R, Magistretti PJ (2007).
Activity-dependent regulation of energy metabolism by astrocytes: an update. Glia,
55(12), 1251-62.
Pérez-Otaño I, Oset C, Luquin MR, Herrero MT, Obeso JA, Del Río J (1994). MPTP-induced
parkinsonism in primates: pattern of striatal dopamine loss following acute and chronic
administration. Neurosci. Lett, 175, 121-5.
Pirker W, Asenbaum S, Hauk M, Kandlhofer S, Tauscher J, Willeit M, Neumeister A, Pra-
schak-Rieder N, Angelberger P, Brücke T (2000). Imaging serotonin and dopamine trans-
porters with 123I-beta-CIT SPECT: binding kinetics and effects of normal aging. J Nucl
Med, 41(1), 36-44.
Pirker W (2003). Correlation of dopamine transporter imaging with parkinsonian motor han-
dicap: how close is it? Mov Disord, 18 Suppl 7, S43-51.
Ponsen M, Stoffers D, Booij J, van Eck-Smit B, Wolters E, Berendse H (2004). Idiopathic hy-
posmia as a preclinical sign of Parkinson‘s disease. Ann Neurol, 56, 173–181.
Postuma RB, Dagher A (2006). Basal ganglia functional connectivity based on a meta-
analysis of 126 positron emission tomography and functional magnetic resonance imag-
ing publications. Cereb. Cortex, 16, 1508–1521.
Rakshi JS, Uema T, Ito K, Bailey DL, Morrish PK, Ashburner J, Dagher A, Jenkins IH, Fris-
ton KJ, Brooks DJ (1999). Frontal, midbrain and striatal dopaminergic function in early
and advanced Parkinson's disease A 3D [(18)F]dopa-PET study. Brain, 122 ( Pt 9), 1637-
50.
Remy P, Doder M, Lees A, Turjanski N, Brooks D (2005). Depression in Parkinson's disease:
loss of dopamine and noradrenaline innervation in the limbic system. Brain, 128(Pt 6),
1314-22.

Cristina Polito 58
Ribeiro MJ, Vidailhet M, Loc'h C, Dupel C, Nguyen JP, Ponchant M, Dollé F, Peschanski M,
Hantraye P, Cesaro P, Samson Y, Remy P (2002). Dopaminergic function and dopamine
transporter binding assessed with positron emission tomography in Parkinson disease.
Arch Neurol, 59(4), 580-6.
Riedel O, Klotsche J, Spottke A, Deuschl G, Forstl H, Henn F, Heuser I, Oertel W, Reich-
mann H, Riederer P, Trenkwalder C, Dodel R, Wittchen HU (2008). Cognitive impair-
ment in 873 patients with idiopathic Parkinson's disease. Results from the German Study
on Epidemiology of Parkinson's Disease with Dementia (GEPAD). J. Neurol, 255, 255–
264.
Rinne JO, Laihinen A, Rinne UK, Någren K, Bergman J, Ruotsalainen U (1993). PET study
on striatal dopamine D2 receptor changes during the progression of early Parkinson's dis-
ease. Mov Disord, 8(2), 134-8.
Rinne JO, Rummukainen J, Paljarvi L, Rinne UK (1989). Dementia in Parkinson‘s disease is
related to neuronal loss in the medial substantia nigra. Ann. Neurol, 26, 47–50.
Rodriguez-Oroz MC, Jahanshahi M, Krack P, Litvan I, Macias R, Bezard E, Obeso JA (2009).
Initial clinical manifestations of Parkinson's disease: features and pathophysiological me-
chanisms. Lancet Neurol, 8(12), 1128-39.
Ross GW, Abbott RD, Petrovitch H, et al. (2006). Association of olfactory dysfunction with
incidental Lewy bodies. Mov Disord, 21, 2062–2067.
Rowe CC, Ng S, Ackermann U, et al. (2007). Imaging beta-amyloid burden in aging and de-
mentia. Neurology, 68, 1718–1725.
Saunders-Pullman R, Lipton RB, Senthil G et al. (2006). Increased frequency of the LRRK2
G2019S mutation in an elderly Ashkenazi Jewish population is not associated with de-
mentia. Neurosci Lett, 402, 92–96.
Sawle G, Playford E, Burn D, Cunnigham V, Brooks D (1994). Separating Parkinson‘s dis-
ease from normality: Discriminant function analysis of fluorodopa F18 positron emission
tomography data. Arch Neurol, 51, 237–243.
Schapira AH, Gu M, Taanman JW et al. (1998). Mitochondria in the etiology and pathogene-
sis of Parkinson‘s disease. Ann Neurol, 44, S89 –S98.
Scherfler C, Schwarz J, Antonini A, et al. (2007). Role of DATSPECT in the diagnostic work
up of parkinsonism. Mov Disord, 22, 1229–1238.
Schwarz J, Oertel WH, Tatsch K (1996). Iodine-123-iodobenzamide binding in parkinsonism:
reduction by dopamine agonists but not L-Dopa. J Nucl Med, 37(7), 1112-5.
Seibyl JP, Marek KL, Quinlan D, et al. ( 1995) Decreased single photon emission computed
tomographic [123I]beta-CIT striatal uptake correlates with symptom severity in Parkin-
son‘s disease. Ann Neurol, 38, 589–598.
Seibyl JP, Marek KL, Quinlan D, Sheff K, Zoghbi S, Zea-Ponce Y, Baldwin RM, Fussell B,
Smith EO, Charney DS et al. (1995). Decreased single-photon emission computed tomo-
graphic [123I]beta-CIT striatal uptake correlates with symptom severity in Parkinson's
disease. Ann Neurol, 38(4), 589-98.
Seibyl JP (2003). Imaging studies in movement disorders. Semin Nucl Med, 33, 105-113.
Shinotoh H, Inoue O, Hirayama K, Aotsuka A, Asahina M, Suhara T, Yamazaki T, Tateno Y
(1993). Dopamine D1 receptors in Parkinson's disease and striatonigral degeneration: a
positron emission tomography study. J Neurol Neurosurg Psychiatry, 56(5), 467-72.
Siderowf A, Stern MB (2006). Preclinical diagnosis of Parkinson‘s disease: are we there yet?
Curr Neurol Neurosci Rep, 6, 295–301.
Singleton AB, Farrer M, Johnson J et al. (2003). Alpha-Synuclein locus triplication causes
Parkinson‘s disease. Science, 302, 841.
Slosman DO and Pellerin L (2004) Perfusion tracers: biological bases and clinical implica-
tions. In: Nuclear Medicine in Psychiatry, vol. 3, pp. 33 – 44. Otte A, Audenaert K,
Peremans K, van Heeringen K and Dierckx RA, (eds.) Springer, Berlin.
References
59
Snow BJ, Tooyama I, McGeer EG, Yamada T, Calne DB, Takahashi H et al. (1993). Human
positron emission tomographic [18F]Fluorodopa studies correlate with dopamine cell
counts and levels. Ann Neurol, 34, 324-30.
Spiegel J, Hellwig G, Samnick S, Jost W, Mollers MO, Fassbender K et al. (2007). Striatal
FP-CIT uptake differs in subtypes of early Parkinson‘s disease. J Neural Transm, 114,
331-335.
Spiegel J, Mollers MO, Jost WH et al. (2005). FP-CIT and MIBG scintigraphy in early Par-
kinson‘s disease. Mov Disord, 20, 552–561.
Spinnler H and Tognoni G (1987). Standardizzazione e taratura italiana di test neuropsicolo-
gici. The Italian Journal of Neurological Sciences, suppl. 8, 1-120
Spreen O, Strauss E (1991). A compendium of neuropsychological tests. Oxford University
Press, New York.
Stefani A, Lozano AM, Peppe A, Stanzione P, Galati S, Tropepi D, Pierantozzi M, Brusa L,
Scarnati E, Mazzone P (2007). Bilateral deep brain stimulation of the pedunculopontine
and subthalamic nuclei in severe Parkinson's disease. Brain, 130(Pt 6), 1596-607.
Stiasny-Kolster K, Doerr Y, Moller JC et al. (2005). Combination of ‗idiopathic‘ REM sleep
behaviour disorder and olfactory dysfunction as possible indicator for alpha-
synucleinopathy demonstrated by dopamine transporter FP-CIT-SPECT. Brain, 128,
126–137.
Su PC, Ma Y, Fukuda M, Mentis MJ, Tseng HM, Yen RF, Liu HM, Moeller JR, Eidelberg D
(2001). Metabolic changes following subthalamotomy for advanced Parkinson's disease.
Ann Neurol, 50(4), 514-20.
Taktakishvili O, Sivan-Loukianova E, Kultas-Ilinsky K, Ilinsky IA (2002). Posterior parietal
cortex projections to the ventral lateral and some association thalamic nuclei in Macaca
mulatta. Brain Res Bull, 59(2), 135-50.
Talairach J, Tournoux P. Co-planar stereotaxic atlas of the human brain. Thieme, New York.
1988.
Thacker EL, Chen H, Patel AV et al. (2008). Recreational physical activity and risk of Parkin-
son‘s disease. Mov Disord, 23, 69–74.
Thobois S, Guillouet S, Broussolle E (2001). Contributions of PET and SPECT to the under-
standing of the pathophysiology of Parkinson's disease. Neurophysiol Clin, 31(5), 321-40.
Tissingh G, Booij J, Bergmans P, Winogrodzka A, Janssen A, Van Royen E et al. (1998).
Iodine-123-N--fluoropropyl-2-ß-carbomethoxy-3ß-(4-iodophenyl)tropane SPECT in
healthy controls and early stage, drug-naive Parkinson's disease. J Nucl Med, 39, 1143–
1148.
Tokuda T, Salem SA, Allsop D et al. (2006). Decreased alphasynuclein in cerebrospinal fluid
of aged individuals and subjects with Parkinson‘s disease. Biochem Biophys Res Com-
mun, 349, 162–166.
Tolosa E, Borght TV, Moreno E (2007). Accuracy of DaTSCAN (123I-Ioflupane) SPECT in
diagnosis of patients with clinically uncertain parkinsonism: 2-year follow-up of an open-
label study. Mov Disord, 22, 2346–2351.
Tolosa E, Compta Y, Gaig C (2007). The premotor phase of Parkinson‘s disease. Parkinson-
ism Relat Disord, 13(suppl), S2–S7.
Tolosa E, Gaig C, Santamaría J, Compta Y (2009). Diagnosis and the premotor phase of Par-
kinson disease. Neurology, 72(7 Suppl), S12-20.
Trost M, Su PC, Barnes A, Su SL, Yen RF, Tseng HM, Ma Y, Eidelberg D (2003). Evolving
metabolic changes during the first postoperative year after subthalamotomy. J Neurosurg,
99(5), 872-8.
Trost M, Su S, Su P, Yen RF, Tseng HM, Barnes A, Ma Y, Eidelberg D (2006). Network
modulation by the subthalamic nucleus in the treatment of Parkinson's disease. Neuroi-
mage, 31(1), 301-7.

Cristina Polito 60
Turjanski N, Lees AJ, Brooks DJ (1997). In vivo studies on striatal dopamine D1 and D2 site
binding in L-dopa-treated Parkinson's disease patients with and without dyskinesias. Neu-
rology, 49(3), 717-23.
van Dyck CH, Seibyl JP, Malison RT, Laruelle M, Wallace E, Zoghbi SS, Zea-Ponce Y,
Baldwin RM, Charney DS, Hoffer PB (1995). Age-related decline in striatal dopamine
transporter binding with iodine-123-beta-CITSPECT. J Nucl Med, 36(7), 1175-81.
Vanzi E, De Cristofaro MT, Ramat S, Sotgia B, Mascalchi M, Formiconi AR (2007). A direct
ROI quantification method for inherent PVE correction: accuracy assessment in striatal
SPECT measurements. Eur J Nucl Med Mol Imaging, 34, 1480-1489.
Vingerhoets FJ, Schulzer M, Calne DB, Snow BJ (1997). Which clinical sign of Parkinson's
disease best reflects the nigrostriatal lesion? Ann Neurol, 41(1), 58-64.
Vingerhoets FJ, Snow BJ, Tetrud JW, Langston JW, Schulzer M, Calne DB (1994). Positron
emission tomographic evidence for progression of human MPTP-induced dopaminergic
lesions. Ann Neurol, 36, 765–770.
Whone A, Remy P, Davis MR et al. (2002). The REAL-PET study: slower progression in ear-
ly Parkinson‘s disease treated with ropinirole compared with L-Dopa. Neurology,
58(suppl 3), A82–A83.
Whone AL, Moore RY, Piccini PP, Brooks DJ (2003). Plasticity of the nigropallidal pathway
in Parkinson's disease. Ann Neurol, 53(2), 206-13.
Williams-Gray CH, Foltynie T, Brayne CEG, Robbins TW, Barker RA (2007). Evolution of
cognitive dysfunction in an incident Parkinson‘s disease cohort. Brain, 130, 1787-1798.
Wilson JM, Levey AI, Rajput A et al. (1996). Differential changes in neurochemical markers
of striatal dopamine nerve terminals in idiopathic Parkinson‘s disease. Neurology, 47,
718–726.
Winkler S, Hagenah J, Lincoln S et al. (2007). Alpha-synuclein and Parkinson disease suscep-
tibility. Neurology, 69, 1745–1750.
Winogrodzka A, Bergmans P, Booij J, van Royen EA, Stoof JC, Wolters EC (2003).
[(123)I]beta-CIT SPECT is a useful method for monitoring dopaminergic degeneration in
early stage Parkinson's disease. J. Neurol. Neurosurg. Psychiatry, 74, 294-298.
Wolfson LI, Leenders KL, Brown LL, Jones T (1985). Alterations of regional cerebral blood
flow and oxygen metabolism in Parkinson‘s disease. Neurology, 35, 1399-405.
Worsley K, Marrett S, Neelin P, Vanda A, Friston K, Evans A (1996). A unified statistical
approach for determining significant signals in images of cerebral activation. Human
Brain Mapping, 4, 58–73.
Kerenyi L, Ricaurte GA, Schretlen DJ, McCann U, Varga J, Mathews WB, Ravert HT, Dan-
nals RF, Hilton J, Wong DF, Szabo Z (2003). Positron emission tomography of striatal
serotonin transporters in Parkinson disease. Arch Neurol, 60(9), 1223-9.
premio firenze university presstesi di dottorato
Coppi E., Purines as Transmitter Molecules. Electrophysiological Studies on Purinergic Signalling in Different Cell Systems, 2007
Natali I., The Ur-Portrait. Stephen Hero ed il processo di creazione artistica in A Portrait of the Artist as a Young Man, 2007
Petretto L., Imprenditore ed Università nello start-up di impresa. Ruoli e relazioni critiche, 2007 Mannini M., Molecular Magnetic Materials on Solid Surfaces, 2007 Bracardi M., La Materia e lo Spirito. Mario Ridolfi nel paesaggio umbro, 2007Bemporad F., Folding and Aggregation Studies in the Acylphosphatase-Like Family, 2008Buono A., Esercito, istituzioni, territorio. Alloggiamenti militari e «case Herme» nello Stato di Milano (secoli
XVI e XVII), 2008Castenasi S., La finanza di progetto tra interesse pubblico e interessi privati, 2008Gabbiani C., Proteins as Possible Targets for Antitumor Metal Complexes: Biophysical Studies of their
Interactions, 2008Colica G., Use of Microorganisms in the Removal of Pollutants from the Wastewater, 2008Inzitari M., Determinants of Mobility Disability in Older Adults: Evidence from Population-Based
Epidemiologic Studies, 2009Di Carlo P., I Kalasha del Hindu Kush: ricerche linguistiche e antropologiche, 2009Pace R., Identità e diritti delle donne. Per una cittadinanza di genere nella formazione, 2009Macrì F., Verso un nuovo diritto penale sessuale. Diritto vivente, diritto comparato e prospettive di riforma
della disciplina dei reati sessuali in Italia, 2009Vignolini S., Sub-Wavelength Probing and Modification of Complex Photonic Structures, 2009Decorosi F., Studio di ceppi batterici per il biorisanamento di suoli contaminati da Cr(VI), 2009Di Patti F., Finite-Size Effects in Stochastic Models of Population Dynamics: Applications to Biomedicine and
Biology, 2009Polito C., Molecular imaging in Parkinson’s disease, 2010Fedi M., «Tuo lumine». L’accademia dei Risvegliati e lo spettacolo a Pistoia tra Sei e Settecento, 2010Orsi V., Crisi e Rigenerazione nella valle dell’Alto Khabur (Siria). La produzione ceramica nel passaggio dal
Bronzo Antico al Bronzo Medio, 2010Fondi M., Bioinformatics of genome evolution: from ancestral to modern metabolism. Phylogenomics and
comparative genomics to understand microbial evolution, 2010Marino E., An Integrated Nonlinear Wind-Waves Model for Offshore Wind Turbines, 2010Romano R., Smart Skin Envelope. Integrazione architettonica di tecnologie dinamiche e innovative per il
risparmio energetico, 2010

Finito di stampare pressoGrafiche Cappelli Srl – Osmannoro (FI)