Meccanismi di distribuzione e sopravvivenza del Grillaio ... · naturale, la deriva genetica e il...
154
1 Dottorato di Ricerca in Biologia Ambientale e Biodiversità Dipartimento di Scienze e Tecnologie Biologiche, Chimiche e Farmaceutiche BIO/05 Meccanismi di distribuzione e sopravvivenza del Grillaio (Falco naumanni) in un agro – ecosistema del Mediterraneo LA DOTTORESSA IL COORDINATORE Rosanna Di Maggio Prof. Marco Arculeo IL TUTOR CO - TUTOR Prof. Maurizio Sarà Dott.ssa Daniela Campobello CICLO XVI ANNO ACCADEMICO 2014/15
Transcript of Meccanismi di distribuzione e sopravvivenza del Grillaio ... · naturale, la deriva genetica e il...

1
Dottorato di Ricerca in Biologia Ambientale e Biodiversità
Dipartimento di Scienze e Tecnologie Biologiche, Chimiche e Farmaceutiche
BIO/05
Meccanismi di distribuzione e sopravvivenza del Grillaio (Falco naumanni) in un agro – ecosistema del Mediterraneo
LA DOTTORESSA IL COORDINATORE
Rosanna Di Maggio Prof. Marco Arculeo
IL TUTOR CO - TUTOR
Prof. Maurizio Sarà Dott.ssa Daniela Campobello
CICLO XVI
ANNO ACCADEMICO 2014/15

2
Indice
Riassunto 3
Abstract 4
Scopi e ipotesi di ricerca 7
Capitolo 1: Effetti dell’aggregazione spaziale dei nidi, della dimensione della colonia e
della sincronia riproduttiva sulla fitness del Grillaio 21
Appendice 1
Capitolo 2: Effetti del disturbo antropico, dell’isolamento spaziale e della dimensione
della colonia sulla variabilità genetica del Grillaio 40
Appendice 2
Capitolo 3: Studio della probabilità di sopravvivenza e modello demografico del
Grillaio in ambiente pseudosteppico 57
Appendice 3
Capitolo 4: Studio della variabilità della dieta di Grillaio in relazione all’habitat 82
Capitolo 5: Effetti di fattori biotici e abiotici sulle temperature all’interno di nidi
di Grillaio 102
Risultati generali & Conclusioni 121
Bibliografia 126
Ringraziamenti 128

3
Riassunto
La distribuzione spaziale degli animali nel loro ambiente naturale ha da sempre attratto
l’interesse degli studiosi di ecologia animale e dei biologi della conservazione. Infatti, i
meccanismi di selezione dell’habitat possono influenzare processi ecologici di base come la
regolazione delle popolazioni e l’andamento demografico, che in ultima analisi, possono
agire sulla selezione naturale, la variabilità genetica e il flusso genico. Le principali teorie
sulla distribuzione spaziale degli animali affermano che la qualità degli habitat è eterogenea
e che gli organismi vanno alla ricerca di territori di elevata qualità al fine di ottimizzare la
fitness. La ricerca da parte degli animali di habitat di elevata qualità rappresenta il cuore dei
primi modelli evolutivi di selezione dell’habitat: i) la Ideal Free Distribution; ii) la Ideal
Despotic Distribution e iii) la Ideal Pre- emptive Distribution. Il Grillaio (Falco naumanni)
è un rapace coloniale che vive in ambienti pseudosteppici caratterizzati da differenti usi del
suolo. Il Grillaio rappresenta un modello appropriato per lo studio delle relazioni specie –
habitat a causa del suo ruolo di indicatore biologico per il monitoraggio delle dinamiche di
popolazione di uccelli pseudosteppici mediterranei. Le pseudo steppe sono ambienti aperti
aridi spesso drasticamente modificati dall’’uomo. Lo status di conservazione del Grillaio è
migliorato negli ultimi anni dopo i drammatici declini degli anni ‘50 ma in parecchie parti
dell’areale è ancora fluttuante e non consolidato. In questa tesi, ho analizzato alcuni fattori
biotici e abiotici che determinano la distribuzione e la probabilità di sopravvivenza di due
sub-popolazioni di Grillaio in Sicilia (Italia). Tra i molti fattori analizzati, la dimensione
della colonia sembra essere un determinante fondamentale delle dinamiche di popolazione
di questo rapace coloniale. Infatti, essa agisce aumentando la sopravvivenza dei pulcini e dei
giovani per mezzo di una interazione tra la distanza tra nidi e il numero di conspecifici.
D’altra parte, un elevato numero di conspecifici determina una diminuzione della parentela
tra pulcini e della fecondità delle coppie. Un altro fattore importante è rappresentato dalla

4
tipologia di habitat il quale, determinando una differente disponibilità alimentare durante la
crescita dei pulcini, agisce sul tasso di accrescimento della popolazione. In conclusione,
agendo sui fattori che determinano la sopravvivenza, la distribuzione e l’andamento
demografico del Grillaio si potrebbero intraprendere le più concrete azioni di conservazione
per una corretta gestione della popolazione di Grillaio in Sicilia e nel resto del suo areale.
Abstract
Merging patterns and processes about the way animals should be distributed in and among
habitats is a cornerstone of spatial ecology and have always attracted researchers' interest.
In fact, the spatial distribution of individuals in their environment can influence several
important ecological processes as population demography and size and species interactions.
These ecological processes, in turn, could affect evolutionary processes such as natural
selection, genetic drift and gene flow.
Assuming that habitat quality is heterogeneous and that organisms are looking for
high-quality patches to optimize their fitness, animal and plant species may experience
distinct habitat types, different development rates, life span, birth and death rates. Population
size and growth rate may vary as functions of the relative proportion of different habitat
types available. However, natural and anthropogenic drivers can interfere and change the
availability of habitats and, as a consequence, the proportion of individuals of a given species
in any particular habitat type may be altered.
Here, I report the results of a experimental research in which I analyzed some biotic
and abiotic factors determining distribution and survival probability of a lesser kestrel
population breeding in Sicily (Italy). The lesser kestrel population in Sicily is actually the
second largest in Italy and, clumped in two areas of the island, one corresponding to the Gela
Plain (South-East of Sicily) and the other around Sicani Mountain (North-West). This

5
species has suffered a dramatic decline in the last century in all of the Mediterranean
populations. Only recently, it improved its conservation status turning from "vulnerable" to
“least concern” due to aimed conservation actions.
The first aim of this thesis (Chapter 1) was to describe and understand the
connection between coloniality and fitness of colony members in such big population of
lesser kestrel breeding in the South-East of Sicily. Particularly, I was interested in evaluating
the singular and the interactive effect of spatial proximity among nests, breeder abundance
and reproductive synchrony on eggs and nestlings survival probabilities in order to
investigate mechanisms explaining fitness variation in lesser kestrel in particular, and in
colonial species in general.
Coloniality is, in fact, the result of multiple interacting costs and benefits, which may
vary according to species, populations and individuals. Among fitness costs, the depression
of genetic diversity enhanced by the inbreeding rates is likely the most dangerous for
population permanence. Specifically, for colonial species living in human- modified
landscape, the intensification of farming practices, causing the increase of habitat
fragmentation and the reduction of dispersal behaviour, could be a potential driver of the
reduction of genetic diversity of a species to be taken in consideration.
Thus, the second aim of the thesis (Chapter 2) was to study the effects of agricultural
intensification (i.e. human disturbance), colony size and spatial isolation on a measure of
inbreeding rates, i.e. the relatedness between nestlings belonging to different nests in two
lesser kestrel subpopulations. In fact, numerous studies and reviews have linked the decline
of many European farmland bird populations since the 1970s, to changes in agricultural
practices. Anthropogenic modifications of habitats may in fact reduce the resources available
for species, leading to populations decline and extinction. In particular, for colonial species
living in farmland areas, the interaction between agricultural intensification and density

6
dependent mechanisms could influence population dynamics through the reduction of food
availability.
Thus, I used demographic data on lesser kestrels (Chapter 3) to understand the
importance of land-use changes and density-dependent mechanisms in their survival
probability and fecundity, and provided conservation guidelines to improve habitat
suitability for one of the largest Italian populations of this small raptor.
In order to explain the results obtained from survival analysis and population growth
rate described in Chapter 3, I analyzed in details the land-use related diet of lesser kestrels
living in a changing and anthropogenic environment (Chapter 4). Despite the effects of
agricultural intensification on lesser kestrel demography, other anthropogenic factors can
contribute to determine the status of this species in Sicily. A growing body of literature
demonstrates the effects of human-induced global warming on the structure and distribution
of populations and communities across taxa. However, most of these effects was analyzed
only at a macro-scale level. In order to quantify the combination between factors at different
scales of observation and their effects on animal fitness, an increasing calls for integrating
micro - and macro-habitat characteristics are compulsory.
Secondary-cavity nesters (i.e. birds that use pre-existing cavities or holes to nest) are
an excellent model to analyze the potential interactive effects between temperatures recorded
at micro – and macro – scale. Specifically, the last aim of the thesis (Chapter 5) was to
investigate whether micro-scale temperature was determined not only by temperature at
macro-scale but also by biotic (e.g. number of nestlings) and/or abiotic factors (e.g. nest
type). I also explored the possibility that this species might attempt to mitigate adverse
microenvironments by modifying behavioral and/or life-history traits.

7
Scopi e ipotesi di ricerca
Lo studio dei meccanismi attraverso i quali gli animali si distribuiscono all’interno e tra gli
habitat ha da sempre attratto l’interesse dei ricercatori (Oro, 2008). Infatti, la distribuzione
spaziale degli individui nel loro ambiente naturale può influenzare numerosi processi
ecologici (Tregenda, 1995) come l’andamento demografico di una popolazione e le
interazioni tra le specie (Rodenhouse et al., 1997; McPeek et al., 2001). In ultima analisi,
questi processi ecologici possono influenzare meccanismi evolutivi come la selezione
naturale, la deriva genetica e il flusso genico (Holt, 1987).
Se si assume che la qualità degli habitat sia eterogenea e che gli organismi vadano
alla ricerca di territori di elevata qualità al fine di ottimizzare la fitness, allora gli animali e
le piante sarebbero caratterizzati, nelle diverse tipologie di habitat, da differenti tassi di
accrescimento, di natalità e mortalità (Pulliam & Danielson, 1991). Fattori di origine naturale
e antropogenica possono interferire e modificare la disponibilità degli habitat e, di
conseguenza, determinare una alterazione nel numero di individui di una data specie in un
particolare habitat (Tregenda, 1995).
In questa tesi, ho analizzato alcuni fattori biotici e abiotici in grado di determinare la
distribuzione e la sopravvivenza di una popolazione di Grillaio (Falco naumanni) nidificante
in Sicilia (Italia). La popolazione di Grillaio in Sicilia è attualmente la seconda più
importante in Italia, dove è concentrata in due aree principali dell’isola, una corrispondente
alla Piana di Gela (Sud-Est della Sicilia) e l’altra intorno ai Monti Sicani (Nord-Ovest).
Questa specie ha sofferto un drastico declino nell’ultimo secolo in tutte le popolazioni del
Mediterraneo (Birdlife International, 2011) e solo recentemente ha migliorato il suo stato di
conservazione passando da “Vulnerabile” a “Rischio minimo” (IUCN, 2011) in seguito ad
azioni di conservazione (Iñigo & Barov, 2011).

8
Una delle classiche teorie sulla distribuzione degli animali afferma che gli organismi
occuperebbero i territori in relazione alle risorse disponibili nei diversi habitat (Calsbeek &
Sinervo, 2002). Questa teoria fu formalmente chiamata “Ideal Free Distribution” da Fretwell
& Lucas (1970).
La Ideal Free Distribution (IFD) si verifica quando la conoscenza della qualità di
tutti gli habitat di una data area è “ideale” (gli organismi hanno una conoscenza perfetta
dell’ambiente) e gli animali sono liberi di insediarsi in ciascun habitat e di muoversi tra gli
di essi senza ridurre la fitness. Se tutti i competitori hanno le medesime abilità
nell’acquisizione del cibo, se possono muoversi tra gli habitat senza costi e se hanno una
perfetta conoscenza delle risorse e della distribuzione dei competitori allora ciascun
organismo si insedierà nell’habitat con il maggiore guadagno in termini di fitness (una
strategia evolutivamente stabile secondo Maynard Smith, 1982). Applicata alla selezione del
sito riproduttivo e di foraggiamento, la IFD postula che gli individui si distribuiranno in
proporzione alla disponibilità delle risorse (Hakoyama, 2001).
Quando l’habitat preferito inizialmente diventa però sovraffollato, determinando una
riduzione della fitness rispetto a habitat di qualità relativamente più bassa ma meno affollati,
allora gli individui dovrebbero scegliere di insediarsi in questi ultimi (Tregenda, 1995; Oro,
2008).
Osservazioni sul campo (e.g. Sutherland, 1983) hanno evidenziato però che un
numero elevato di organismi utilizza habitat di scarsa qualità rispetto a quanto viene predetto
dalla IFD. Alcuni autori hanno osservato che non tutti gli animali hanno le stesse capacità
competitive né una conoscenza perfetta di tutti gli habitat. Questa teoria è stata chiamata
“Ideal Despotic Distribution” (IDD). Al contrario della IFD, la IDD non determina una
fitness uguale all’equilibrio tra tutti gli organismi ma gli individui subordinati avranno una

9
fitness più bassa della media del gruppo determinando una asimmetria nella distribuzione
delle risorse (Calsbeek & Sinervo, 2002).
Un assunto critico della IDD è che gli individui devono essere in grado di valutare la
qualità dell’habitat. Oro (2008) ha testato se individui di Gabbiano reale (Larus michahellis),
nidificanti in due distinti habitat confinanti, seguissero una distribuzione dispotica
all’interno della stessa popolazione locale. In questo caso, i risultati supportavano alcune
delle previsioni della IDD: i giovani gabbiani si riproducevano principalmente nell’habitat
di qualità peggiore, e questi uccelli, dopo aver fallito nella riproduzione, provavano a
nidificare nella stagione successiva nell’habitat migliore ma venivano attivamente esclusi
dai residenti. I risultati suggerivano inoltre che questo comportamento di dominanza era
probabilmente collegato all’età, possibile meccanismo che spiega la distribuzione dispotica
(Marra, 2000; Rendon et al., 2001; Rohwer, 2004; Serrano & Tella, 2007). Un’altra teoria,
la “Ideal Pre – Emptive Distribution” (IPD; Pulliam & Danielson, 1991) afferma che alcuni
individui potrebbero ottenere le risorse in modo da renderle non disponibili per gli altri
conspecifici. In accordo con la IPD, gli habitat migliori sono occupati per primi e non sono
più disponibili per gli altri (Falcy, 2015).
Per le specie coloniali, in particolare per quelle che vivono in habitat che differiscono
nella qualità, il numero e la vicinanza dei conspecifici possono giocare un ruolo cruciale nel
determinarne i meccanismi di distribuzione, la dispersione e il comportamento in generale
(Serrano et al., 2004). Per queste specie, le performance riproduttive dei conspecifici
possono rappresentare delle fonti di informazioni affidabili sulla qualità dei siti riproduttivi
(Boulinier & Danchin, 1997; Danchin & Wagner, 1997).
Vivere in gruppo può essere vantaggioso grazie all’aumento delle difese anti-
predatorie e del successo di foraggiamento (Campobello et al., 2012). Nidi posti a breve
distanza tra loro promuovono, inoltre, uno scambio di informazioni, consentendo di ottenere
10
informazioni dai conspecifici sulle nuove aree di foraggiamento (Ward & Zahavi, 1973).
Secondo questa teoria, nota come “Information centre hypothesis” (ICH, Ward & Zahavi,
1λ73), le colonie e i dormitori degli uccelli possono agire come centri d’informazione non
solo sulle migliori aree di foraggiamento, ma anche su altre tipologie d’informazioni come
la presenza di predatori o di buoni siti di riproduzione.
Il primo obiettivo della tesi è descrivere e comprendere la relazione tra la colonialità
e la fitness in una delle più grandi popolazioni di Grillaio italiane. In particolare, ho valutato
gli effetti della vicinanza spaziale tra nidi, della dimensione della colonia e della sincronia
riproduttiva sulla probabilità di sopravvivenza delle uova e dei pulcini.
Per quanto riguarda le specie coloniali, il numero di coppie riproduttive (i.e.
dimensione della colonia) fluttua tipicamente in relazione alla disponibilità di siti riproduttivi
e delle aree di foraggiamento (Møller, 2002). In accordo con Danchin & Wagner (1997), la
colonialità è il risultato di un compromesso tra costi e benefici, i quali possono variare in
accordo alla specie, alle popolazioni e agli individui. La colonialità può avere, come detto
precedentemente, numerosi benefici (Varela et al., 2007) ma anche dei costi come l’aumento
delle interazioni agonistiche tra conspecifici (Serrano & Tella, 2007) e la riduzione della
diversità genetica, amplificata dal rischio di accoppiamento tra consanguinei (Serrano et al.,
2004). In particolare, per le specie coloniali che vivono in habitat fortemente antropizzati,
l’intensificazione delle pratiche agricole, responsabile della frammentazione dell’habitat e
della riduzione della dispersione (Martinez-Cruz et al., 2004), può rappresentare un ulteriore
fattore determinante la riduzione della diversità genetica di una specie (Spear & Storfer,
2010). La comprensione degli effetti delle modificazioni degli habitat di origine antropica
sulla struttura genetica delle popolazioni è fondamentale per mettere in atto efficaci strategie
di conservazione.

11
Di conseguenza, il secondo obiettivo della tesi è quello di studiare gli effetti
dell’agricoltura intensiva (i.e. disturbo antropico), della dimensione della colonia e
dell’isolamento spaziale sulla diversità genetica di due sub-popolazioni di Grillaio misurata
come parentela tra i pulcini appartenenti a differenti nidi.
Numerosi studi hanno collegato il declino di molte specie di uccelli legati ad ambienti
pseudosteppici con i cambiamenti nelle pratiche agricole (Chamberlain et al., 1999;
Siriwardena et al., 2000). Le modificazioni degli habitat di natura antropogenica possono,
infatti, ridurre le risorse disponibili per le specie portando al declino e all’estinzione delle
popolazioni (Sullivan et al., 2015). Nel 2000, lo studio della relazione tra l’andamento di 14
specie di uccelli in Inghilterra e i cambiamenti dell’uso del suolo legati all’agricoltura hanno
evidenziato una bassa presenza di uccelli nelle aree ad agricoltura intensiva (Siriwardena et
al., 2000). Al contrario, una componente chiave dell’agricoltura estensiva, la presenza di
grandi aree destinate al pascolo, era, insieme con gli ambienti eterogenei, correlata
positivamente con la presenza della maggior parte delle specie studiate. Per molte specie,
comunque, non è ancora stata dimostrata una forte relazione tra i parametri demografici e
l’agricoltura intensiva (Siriwardena et al., 2000, ma si veda Conover et al., 2011). In
particolare, per le specie coloniali che vivono in ambiente agricolo, l’interazione tra
l’intensificazione delle pratiche agricole e i meccanismi densità – dipendenti potrebbero
influenzare le dinamiche di popolazione attraverso la riduzione della disponibilità alimentare
(Catry et al., 2012).
Al di là dell’intensificazione delle pratiche agricole, è ampiamente accettato che gli
habitat possano differire in qualità, e che alcune popolazioni vadano ad occupare habitat
idonei (con elevata fitness) mentre altre si insedieranno in siti di bassa qualità (Tregenza,
1995; Oro, 2008). Però, poco è noto sulla eterogeneità della qualità degli habitat su scala
ridotta all’interno di una popolazione (Oro, 2008). Nonostante la grande quantità

12
d’informazioni in letteratura sui tassi riproduttivi e sulle probabilità di sopravvivenza, pochi
studi hanno comparato direttamente l’andamento demografico di una stessa specie in habitat
differenti all’interno della stessa area (ma si veda Oro, 2008).
Per il terzo obiettivo della tesi, ho utilizzato dati demografici del Grillaio, specie
chiave delle zone agricole del Mediterraneo, per comprendere l’importanza dei cambiamenti
dell’uso del suolo e dei meccanismi densità – dipendenti sulla sua sopravvivenza e fecondità.
Il passo successivo è stato identificare quali componenti del modello demografico
influenzassero maggiormente il tasso di accrescimento della popolazione e fornire linee
guida di conservazione al fine di migliorare l’idoneità degli habitat di una delle più grandi
popolazioni italiane di Grillaio.
Infatti, un habitat eterogeneo intorno a un sito riproduttivo, può influenzare non solo
la distribuzione e il successo riproduttivo di una specie ma anche altri aspetti tra cui la dieta
e la disponibilità alimentare (Bretagnolle et al., 2011; Rioux Paquette et al., 2014). Una
scarsa qualità dell’habitat può ostacolare le performance individuali in una certa stagione e
influenzare la sopravvivenza e la riproduzione negli anni successivi attraverso un effetto
carry – over (Norris et al., 2004; Harrison et al., 2011; Rioux Paquette et al., 2014). Risorse
limitate possono ridurre, ad esempio, le riserve energetiche dei genitori al punto che questi
potrebbero decidere di non portare più a termine la riproduzione o di non riprodursi affatto
(Kowalczyk et al., 2014).
Al fine di spiegare i risultati ottenuti dall’analisi demografica e di sopravvivenza, ho
analizzato in dettaglio la dieta del Grillaio in relazione all’uso del suolo intorno alle colonie
di nidificazione. Questo approfondimento è stato necessario al fine di ottenere dei risultati
chiave per la comprensione delle interazione habitat – dieta e quindi per la gestione e la
conservazione delle specie (Kowalczyk et al., 2014).
13
Al di là degli effetti dell’agricoltura intensiva sulla demografia del grillaio, altri
fattori di origine antropica, come l’aumento delle temperature, possono contribuire a
determinare lo stato della specie in Sicilia e in generale la distribuzione delle popolazioni e
delle comunità di uccelli (Walther et al., 2002; De Frenne et al., 2013). Tuttavia, la maggior
parte degli effetti del global warming sono stati analizzati soltanto su scala ampia ma
inevitabilmente con bassa risoluzione. Al contrario sarebbe necessario quantificare la
combinazione tra fattori a differenti scale di osservazione e i loro effetti sulla fitness degli
organismi (Varner & Dearing, 2014; De Marchi et al., 2015).
Gli uccelli che usano come nidi cavità preesistenti rappresentano un eccellente
modello per analizzare la potenziale interazione tra le temperature registrate su micro scala
(i.e. microclima) e su macro-scala. In particolare l’ultimo obiettivo della tesi è finalizzato a
determinare se le temperature microclimatiche siano influenzate non solo dalla temperatura
registrata su larga scala dalle stazioni meteorologiche ma anche da fattori biotici (e.g. il
numero di pulcini) e/o abiotici (e.g. la tipologia di nido). Ho inoltre verificato la possibilità
che la specie potesse cercare di mitigare le avverse condizioni microclimatiche modificando
il comportamento o alcuni tratti della life history.
La specie studiata
Il Grillaio è un piccolo rapace che vive in ambienti aperti e secchi di pseudosteppa del
Paleartico (Cramp & Simmons, 1980). E’ un rapace coloniale facoltativo che si riproduce
solitamente in colonie di 2 – 60 coppie (Forero et al., 1996; Serrano et al., 2004), di solito in
associazione con le Taccole Corvus monedula e i Piccioni Columba livia. Nidifica in siti
pre-esistenti come buchi nei muri o cavità nella roccia e sotto le tegole di edifici rurali (Negro
& Hiraldo, 1993).
Era considerato uno dei più abbondanti rapaci della regione Paleartica ma negli ulimi
cinquant’anni ha subito un rapido declino in tutto il suo areale, dall’Europa all’Asia fino

14
all’Africa (BirdLife International, 2011). Era praticamente scomparso in altri (Francia,
Portogallo, Bulgaria) fino a quando concreti interventi di conservazione e protezione
dell'habitat hanno migliorato i suoi contingenti riproduttivi (Iñigo & Barov, 2011; Birdlife
international, 2011).
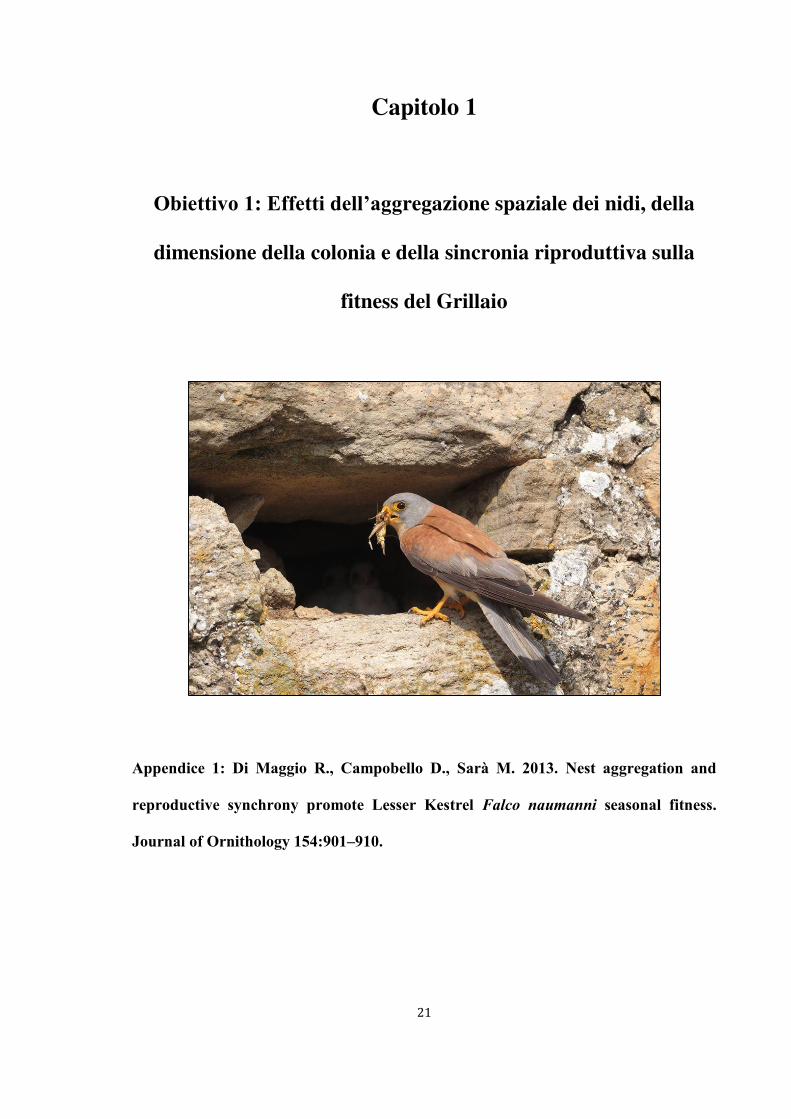
Fig.1 Un maschio di Grillaio (a sinistra) e la femmina in volo (a destra).
Le aree di studio
Le ricerche di campo del mio dottorato si sono focalizzate su due aree che ospitano due delle
più grandi popolazioni più grandi di Grillaio presenti in Siciliaμ la Piana di Gela e l’area
intorno ai Monti Sicani.
La Piana di Gela nel SE della Sicilia (Italia, 37º07'N, 14º19'E), è una delle più grandi
piane in Italia (circa 474 km2 ). L’area è caratterizzata da pendii collinari in leggero declivio
fino a 200 m. s.l.m., rilievi di calcarenite e gesso e calanchi di argilla e sabbia (Mascara &
Sarà 2006). A causa delle limitate precipitazioni (350 mm/anno), il paesaggio agricolo è
costituito da un mosaico di pseudosteppa dominato da campi di carciofi Cynara spp. e da
colture non irrigue, soprattutto cereali, leguminose foraggere, vegetazione a gariga, incolti e
pascoli (si veda l’Appendice 3 per maggiori dettagli sull’area di studio).

15
All’interno della Piana, numerosi edifici rurali, spesso parzialmente distrutti e
abbandonati, ospitano nidi di Grillaio. Ciascuna colonia è solitamente costituita da un’unica
struttura o, in casi eccezionali, da due o più edifici di piccole dimensioni vicini tra loro (i.e.
< 30 m).
L’area dei Sicani (37° 44’ N, 13° 1λ’ E) invece, è localizzata a Nord – Ovest della
Sicilia, con un’altitudine di 626.2 ± 34.λ3 m (media ± ES) per la presenza dei Monti Sicani.
La maggior parte dell’area è composta da macchia mediterranea e campi di grano, ma una
grande fetta dell’habitat è stato sostituito da coltivazioni intensive (si veda l’Appendice 2
per maggiori dettagli).
Bibliografia
Birdlife International (2011) Species fact sheet: Falco naumanni. http://www.birdlife.org.
Boulinier, T., Danchin, E., (1997) The use of conspecific reproductive success for breeding
patch selection in territorial migratory species. Evolutionary Ecology 11, 505-517.
Bretagnolle, V., Villers, A., Denonfoux, L., Cornulier, T., Inchausti,P., Badenhausser, I.
(2011) Rapid recovery of a depleted population of Little Bustards Tetrax tetrax
following provision of alfalfa through an agri-environment scheme. Ibis 153, 4-1.
Calsbeek, R., Sinervo, B. (2002) An experimental test of the ideal despotic distribution.
Journal of Animal Ecology 71, 513–523.
Campobello, D., Sarà, M., Hare, J.F. (2012) Under my wing: lesser kestrels and jackdaws
derive reciprocal benefits in mixed-species colonies. Behavioural Ecology 23, 425-
433.

16
Catry, I., Amano, T., Franco, A.M.A., Sutherland, W.J. (2012) Influence of spatial and
temporal dynamics of agricultural practices on the lesser kestrel. Journal of Applied
Ecology 49, 99-108.
Chamberlain, D.E., Wilson, J.D., Fuller, R.J. (1999) A comparison of bird populations on
organic and conventional farmland in southern Britain. Biological Conservation 88,
307–320.
Conover, R.R., S.J. Dinsmore, L.W. Burger, Jr. (2011) Effects of conservation practices on
bird nest density and survival in intensive agriculture. Agriculture, Ecosystems and
Environment 141:126-132.
Cramp, S., Simmons, K.E.L, (1980) The birds of the Western Palaearctic. Vol. 2. Oxford
University Press, Oxford.
Danchin, E., Wagner, R.H. (1997) The evolution of coloniality: the emergence of new
perspectives. Trends Ecology and Evolution 12, 342-347.
De Frenne, P., Rodríguez-Sánchez, F., Coomes, D.A., Baeten, L., Verstraeten, G., Vellen,
M., Bernhardt-Römermann, M., Brown, C.D., Brunet, J., Cornelis, J., Decocq, G.M.,
Dierschke, H., Eriksson, O., Gilliam, F.S., Hédl, R., Heinken, T., Hermy, M.,
Hommel, P., Jenkins, M.A., Kelly, D.L., Kirby, K.J., Mitchell, F.J.G., Naaf, T.,
Newman, M., Peterken, G., Petrík, P., Schultz, J., Sonnier, G., Van Calster, H.,
Waller. D.M., Walther, G.R., White, P.S., Woods, K.D., Wulf, M., Graae, B.J.,
Verheyen, K. (2013) Microclimate moderates plant responses to macroclimate
warming. Proceedings National Academy Science USA 110, 18561-18565.
De Marchi, G., Chiozzi, G., Dell'Omo, G., Fasola, M. (2015) Low incubation investment in
the burrow-nesting crab plover Dromas ardeola permits extended foraging on a tidal
food resource. Ibis 157, 31-43.

17
Falcy, M. (2015) Density-dependent habitat selection of spawning Chinook salmon: broad-
scale evidence and implications. Journal of Animal Ecology 84, 545–553.
Forero, M.G., Tella, J.L., Donazar, J.A., Hiraldo, F. (1996) Can interspecific competition
and nest site availability explain the decrease of lesser kestrel Falco naumanni
populations? Biological Conservation 78, 289-293.
Fretwell, S.D., Lucas, H.L. (1970) On territorial behaviour and other factors influencing
habitat distribution in birds. I. Theoretical development. Acta Biotheoriologica 19,
16–36.
Hakoyama (2001) The ideal free distribution when the resource is variable. Behavioral
Ecology14(1), 109–115.
Harrison, X.A., Blount, J.D., Inger, R., Norris, D.R., Bearhop, S. (2011) Carry-over effects
as drivers of fitness differences in animals. Journal of Animal Ecology 80, 4–18.
Holt, R.D. (1987) Population dynamics and evolutionary processes: the manifold roles of
habitat selection. Evolutionary Ecology 1, 331–347.
Iñigo, A., Barov, B. (2011) Action plan for the lesser kestrel Falco naumanni in the European
Union. SEO-BirdLife & BirdLife International for the European Commission.
Kowalczyk, N. D., Chiaradia, A., Preston, T. J., Reina, R. D. (2014) Linking dietary shifts
and reproductive failure in seabirds: a stable isotope approach. Functional Ecology
28, 755–765.
Marra, P. P. (2000) The role of behavioral dominance in structuring patterns of habitat
occupancy in a migrant bird during the nonbreeding season. Behavioral Ecology 11,
299–308.

18
Martinez-Cruz, B., Godoy, J.A., Negro, J.J. (2004) Population genetics after fragmentation:
the case of the Spanish imperial eagle Aquila adalberti. Molecular Ecology 13, 2243–
2255.
Mascara, R., Sarà, M. (2006) Densità e biologia riproduttiva del Grillaio Falco naumanni
nella piana di Gela (Sicilia). Avocetta 30, 51-59.
Maynard Smith, J., (1982) Evolution and the theory of games. Cambridge: Cambridge
University Press.
McPeek, M.A., Rodenhouse, N.L., Holmes, R.T., Sherry, T.W. (2001) A general model of
site-dependent population regulation: population-level regulation without individual-
level interactions. Oikos 94,417–424.
Moller, A.P. (2002) Parent–offspring resemblance in degree of sociality in a passerine bird.
Behavioural Ecology and Sociobiology 51, 276–281.
Negro, J.J., Hiraldo, F. (1993) Nest-site selection and breeding success in the Lesser Kestrel
Falco naumanni. Bird Study 40, 115-119.
Norris, D. R., P. P. Marra, T. K. Kyser, T. W. Sherry, L. M. Ratcliffe. (2004) Tropical winter
habitat limits reproductive success on the temperate breeding grounds in a migratory
bird. Proceedings of the Royal Society of London B 271, 59–64.
Oro, D. (2008) Living in a ghetto within a local population: an empirical example of an ideal
despotic distribution. Ecology 89:848-846.
Pulliam, H. R., B. J. Danielson (1991) Sources, sinks, and habitat selection: a landscape
perspective on population dynamics. American Naturalist 137, S50–S66.
Rendon, M. A., Garrido, A., Ramı´rez, J. M., Rendo´ n, M., Martos, Amat J. A. (2001)
Despotic establishment of breeding colonies of greater flamingos, Phoenicopterus
ruber, in southern Spain. Behavioral Ecology and Sociobiology 50, 55–60.

19
Rioux Paquette, S., Pelletier, F.,Garant, D., Be´lisle, M. (2014) Severe recent decrease of
adult body mass in a declining insectivorous bird population. Proceedings Royal
Society B 281, 20140649.
Rodenhouse, N.L., Sherry, T.W. & Holmes, R.T. (1997) Site-dependent regulation of
population size: a new synthesis. Ecology, 78, 2025–2042.
Rohwer, S. (2004) Using age ratios to infer survival and despotic breeding dispersal in
hybridizing warblers. Ecology 85, 423–431.
Serrano, D., Forero, M.G., Donazar, J.A., Tella, J.L. (2004) Dispersal and social attraction
affect colony selection and dynamics of lesser kestrels. Ecology 85, 3438-3447.
Serrano, D.,Tella J. L.( 2007) The role of despotism and heritability in determining
settlement patterns in the colonial lesser kestrel. American Naturalist 169, E53–E67.
Siriwardena, G. M., Crick, H. Q. P., Baillie, S. R., Wilson, J. D. (2000) Agricultural land-
use and the spatial distribution of granivorous lowland farmland birds. Ecography
23, 702–719.
Spear, S.F., Storfer, A. (2010) Anthropogenic and natural disturbance lead to differing
patterns of gene flow in the Rocky Mountain tailed frog, Ascaphus montanus.
Biological Conservation143, 778–786.
Sullivan, M.J.P., Davies, R.G., Mossman, H.L., Franco, A.M.A. (2015) An anthropogenic
habitat facilitates the establishment of non-native birds by providing underexploited
resources. Plos One 10(8), e0135833.
Sutherland, W.J., (1λ83) Aggregation and the ‘ideal free’ distribution. Journal of Animal
Ecology 52, 821–828.
Tregenza, T., (1994) Common misconceptions in applying the ideal free distribution. Animal
Behaviour 47, 485–487.

20
Varela, S.A.M., Danchin, E., Wagner, R.H. (2007) Does predation select for or against avian
coloniality? – A comparative analysis. Journal of Evolutionary Biology 20, 1490-
1503.
Varner, J., Dearing, M.D. (2014) The importance of biologically relevant microclimates in
habitat suitability assessments. Plos One 9, e104648.
Walther, G.R., Post, E., Convey, P., Menzel, A., Parmesan, C., Beebee, T.J.C., Fromentin,
J.M., Hoegh-Guldberg, O., Bairlein, F. (2002) Ecological responses to recent climate
change. Nature 416, 389: 294 395.
Ward. P., Zahavi, A. (1973) The importance of certain assemblages of birds as “information-
centres” for food finding. Ibis 115, 517-534.
21
Capitolo 1
Obiettivo 1: Effetti dell’aggregazione spaziale dei nidi, della
dimensione della colonia e della sincronia riproduttiva sulla
fitness del Grillaio
Appendice 1: Di Maggio R., Campobello D., Sarà M. 2013. Nest aggregation and
reproductive synchrony promote Lesser Kestrel Falco naumanni seasonal fitness.
Journal of Ornithology 154:901–910.

22
Introduzione
Il valore adattativo della colonialità è stato argomento chiave di molti studi e uno sforzo
considerevole è stato fatto per comprendere costi e benefici del vivere in gruppo (Danchin
& Wagner, 1997; Brown & Brown, 2001) sebbene, ad oggi, nessuna teoria che spieghi
l’evoluzione della colonialità è risultata interamente soddisfacente (Hoogland & Sherman,
1976 ma si veda Hare & Murie, 2007). La vicinanza spaziale tra i nidi, la dimensione della
colonia e la sincronia riproduttiva sono stati proposti come i fattori principali responsabili
dell’aumento delle difese e del successo di foraggiamento delle specie coloniali (Serrano et
al., 2005; Sachs et al., 2007).
I benefici in termini di fitness devono superare i costi dell’aumento della competizione
per le risorse (Bonal & Aparicio, 2008) e del rischio di trasmissione di parassiti e malattie
(Serrano et al., 2004) associati con il vivere in gruppo. Potenziali benefici della colonialità
includono una riduzione del rischio di predazione grazie a una più rapida individuazione dei
predatori (Bijleveld et al., 2010; Brown & Brown, 1987), a una riduzione dell’investimento
individuale nella vigilanza (Terhune & Brillant 1996; Campobello et al., 2012) o infine è
utile a confondere il predatore abbassando il rischio di predazione (Varela et al., 2007;
Calabuig et al., 2010a).
Oltre al numero degli individui in una colonia, anche la distanza tra nidi ha importanti
ripercussioni sul successo riproduttivo (Brown et al., 1990). Una distanza ridotta tra i nidi
promuove lo scambio di informazioni, consentendo agli individui che non riescono a trovare
cibo di acquisire informazioni dai conspecifici sulle nuove aree di foraggiamento (Ward &
Zahavi, 1973; Campobello & Hare, 2007). Tuttavia, con il ridursi delle distanze tra nidi al
di sotto di una certa soglia sono stati identificati effetti negativi come un aumento delle
interazioni agonistiche (Serrano & Tella, 2007).

23
Vivere in gruppo può essere ancora più vantaggioso quando gli individui sono
sincronizzati nella riproduzione. La sovrapposizione temporale tra un elevato numero di
individui che si riproducono aumenta l’efficienza in termini sia di vigilanza che di difesa.
Riproduttori asincroni (i.e. individui che nidificano prima o dopo la maggior parte dei
membri di una colonia), sono lasciati da soli a difendere le uova e i pulcini (Hoogland &
Sherman, 1976). Di conseguenza, questi individui di solito presentano una riduzione del
tasso di schiusa e/o d’involo (Stokes & Boersma, 2000; Sachs et al., 2007). Se la
riproduzione della maggior parte dei membri di una colonia è anche sincronizzata con il
picco della disponibilità di cibo allora i vantaggi della colonialità risultano ancora maggiori
(Both, 2010).
L’aumento del numero di conspecifici all’interno di una colonia, la loro vicinanza e
la sincronia riproduttiva possono tuttavia imporre dei costi in termini di fitness (Stokes &
Boersma, 2000). La vicinanza tra nidi può promuovere accoppiamenti al di fuori della coppia
(Wagner, 1993), mentre un elevato numero di conspecifici può aumentare la competizione
per le risorse (Danchin & Wagner, 1997; Sachs et al., 2007; Calabuig et al., 2010b). Rimane
una questione aperta se questi tre fattori agiscono in modo sinergistico o in antagonismo tra
loro.
Adottando un approccio innovativo alla quantificazione delle distanze tra nidi, ho
esaminato se quest’ultima, insieme alla dimensione della colonia e alla sincronia
riproduttiva, agisse singolarmente o interagendo con le altre variabili nel determinare la
sopravvivenza delle uova e dei pulcini di Grillaio nella Piana di Gela (Sicilia).

24
Materiali & Metodi
Quantificazione dei parametri coloniali
Lo studio è stato condotto tra aprile e luglio 2009-2010. I nidi di Grillaio sono stati
inizialmente identificati osservando le colonie con binocoli 10 x 50 e cannocchiali 20 x 60.
Sono state identificate 14 colonie di Grillaio nel 2009 e 12 nel 2010, distribuite all’interno
della Piana con una distanza di 7 ± 0.5 km (media ± ES) tra loro (range: 0.6–1.9 km; Fig. 1,
Appendice 1).
Fig. 1 Mappa della Piana di Gela (Sicilia, Italia) in cui è mostrata la distribuzione spaziale delle colonie di
Grillaio. Punti piccoli: 1–11 coppie; punti medi: 12–22 coppie; cerchi pieni: 23–33 coppie.
I potenziali nidi, sotto le tegole o dentro i buchi dei casolari, sono stati visitati solo
quando almeno una coppia di Grillai ha mostrato un comportamento riproduttivo (i.e. un
maschio che porta una preda alla femmina, copulazioni o visite ai nidi; Serrano et al., 2001;
Sarà, 2010). Il controllo ai nidi ha consentito la quantificazione del numero totale delle

25
coppie riproduttive per colonia. A causa dell’incertezza sulla presenza di nidi in alcune
facciate dei casolari, è stato necessario escludere alcune di queste dall’analisi. Sono state
studiate in media 2.9 ± 0.4 facciate per colonia con 127 nidi nel 2009 e 123 nel 2010. Nei
due anni, il numero di nidi studiati ha rispecchiato il numero totale di nidi all’interno di
ciascuna colonia (Correlazione di Spearman, r = 0.82, p < 0.0001, n = 26) e di conseguenza
è stato usato come indice del numero di coppie nidificanti in una colonia. Ciascun nido è
stato visitato almeno tre volte durante la stagioneμ durante la deposizione e l’incubazione
delle uova, la schiusa e l’involo dei pulcini. Durante questi controlli, ho registrato il numero
delle uova e dei pulcini all’interno di ogni nido.
Il successo riproduttivo di ogni coppia è stato determinato attraverso l’analisi del
tempo di sopravvivenza di ciascun uovo fino alla schiusa e di ciascun pulcino fino all’involo
(Nur et al., 2004). L’identificazione dei vari stadi riproduttivi è stata effettuata a partire dai
controlli ai nidi o attraverso un processo di retrodatazione standardizzato su: 7 giorni di
deposizione, 2λ giorni per l’incubazione e 2λ-32 giorni per la crescita dei pulcini (Cramp &
Simmons, 1980). Uova o pulcini morti con evidenti segni di predazione sono stati registrati
come predati. Tutte le uova non schiuse o scomparse e tutti i pulcini morti sono stati trattati
come falliti il giorno corrispondente al punto centrale tra due visite consecutive (Mayfield,
1975; Serrano et al., 2001; Mascara & Sarà, 2006).
Per determinare il ruolo del numero e della prossimità dei conspecifici sul successo
riproduttivo, ho testato l’effetto di tre fattori sulla fitness degli individui: Neighbour Index
(NI, Campobello & Hare, 2007), la distanza dal vicino più prossimo (i.e. la distanza tra un
nido e il nido più vicino; Negro & Hiraldo, 1993) e la dimensione della colonia (i.e. il numero
di coppie nidificanti per facciata). Il primo indice, il NI, quantifica l’interazione tra il numero
e la vicinanza tra i nidi e il nido di riferimento. La distanza dal vicino più prossimo e il

26
numero di coppie per facciata quantificano separatamente la vicinanza dei nidi e il numero
di vicini. Per quantificare entrambi gli indici, è stato necessario calcolare le distanze tra i
nidi. Per far questo, ciascuna facciata di una colonia è stata fotografata e le foto caricate sul
software TechDig 2.0. A ciascuna foto è stato assegnato un set di assi cartesiani e un
riferimento preso precedentemente sul campo (e.g. l’altezza di una porta, la distanza tra
finestre etc.). La posizione di ciascun nido è stata segnata nelle foto, e le cordinate x –y sono
state usate per calcolare le distanze a coppie tra i nidi (Fig. 2, Appendice 1).
.
Fig.2 Facciata di una colonia ospitante nidi di Grillaio (cerchi rossi). Per calcolare le distanze tra nidi, un set
di assi cartesiani (linee in rosso) e un riferimento metrico (linea in giallo) sono stati calcolati precedentemente
sul campo.
Il Neighbour Index è stato calcolato usando la formula:
NI nidon = ∑ (1/dist-nidon)
dove n è il numero di nidi e dist-nido è la distanza tra il nido di interesse e gli altri nidi della
stessa facciata (Campobello & Hare, 2007). Un valore basso dell’indice indica un nido
isolato, mentre un valore elevato di NI indica un nido circondato da molti conspecifici a
breve distanza.

27
Per quantificare la sincronia riproduttiva, ho usato l’indice di sincronia (SI) come
proposto da Kempenaers (1993) e da Class et al., (2011) e applicato alle singole colonie
(Johnsen & Lifjeld, 2003; La Barbera et al., 2010). Ho calcolato tre indici: i) SI nido/pop
come il numero di femmine fertili nella popolazione per ogni giorno corrispondente al
periodo fertile della femmina di riferimento (Kempenaers, 1993; Class et al., 2011); ii) SI
nido/col come il numero di femmine fertili nella colonia per ogni giorno corrispondente al
periodo fertile della femmina di riferimento (Johnsen & Lifjeld, 2003; La Barbera et al.,
2010); e iii) SI col come il numero di femmine fertili all’interno di ciascuna colonia durante
il periodo fertile di tutte le femmine della colonia (Johnsen & Lifjeld, 2003; La Barbera et
al., 2010). Questi indici quantificano la sincronia riproduttiva di ciascun nido rispetto
all’intera popolazione (SI nido/pop), rispetto alla colonia (SI nido/col), e fornisce una stima
della sincronia riproduttiva all’interno di ciascuna colonia (SI col). Il periodo fertile delle
femmine corrisponde al periodo di tempo che va da 5 giorni antecedenti alla deposizione
del primo uovo (Negro et al., 1992) fino alla fine del periodo di deposizione, per un totale di
12 giorni (Mougeot, 2004).
Analisi statistiche
Ho verificato se le distanze tra i nidi differissero negli anni con una analisi della Varianza
(ANOVA, Zar, 1999) in cui l’anno di studio è stato considerato come fattore fisso con due
livelli, uno per ciascun anno di studio. Il tempo di sopravvivenza delle uova e dei pulcini è
stato esaminato con un test di Kaplan – Meier (Kaplan & Meier, 1958; Nur et al., 2004;
Bellia et al., 2011). Differenze nella sopravvivenza delle uova e dei pulcini tra gli anni sono
state studiate usando il test Gehan – Wilcoxon, trattando l’anno di studio come fattore
indipendente e il tempo di sopravvivenza come variabile dipendente (Cox & Oakes, 1984;
Fox, 2001).

28
L’effetto della distanza tra nidi, della dimensione della colonia, la loro interazione e
la sincronia riproduttiva sono stati quantificati conducendo test parametrici di sopravvivenza
(Lognormal tests, Dempster et al., 1977), in cui NI, distanza dal vicino più prossimo,
dimensione della colonia e sincronia sono stati trattati come fattori indipendenti e il tempo
di sopravvivenza delle uova e dei pulcini come variabili dipendenti. Sono state infine create
le curve di sopravvivenza in cui valori minimi e massimi dei predittori risultati significativi
sono stati proiettati con il valore medio registrato nella popolazione.
Tutte le analisi sono state condotte usando STATISTICA 6.0 (Statsoft 2001).
Risultati
Le distanze tra i nidi non differivano negli anni (ANOVA, F1,248 = 2.07, p = 0.151; 2009
media ± ES: 4.24 ± 0.40 m, n = 127; 2010 3.31 ± 0.27 m, n = 123). La minima distanza tra
nidi andava da 0.34 a 25.02 m e le facciate delle colonie ospitavano da 2 a 11 coppie (5.7 ±
0.08) con 1-23 coppie per colonia (10.0 ± 1.10). L’aggregazione tra i nidi misurata dal NI
andava da 0.0004 (nidi isolati) fino a 0.0517 (nidi circondati da molti altri a breve distanza).
Ciascuna femmina presentava una sovrapposizione del periodo fertile in media del 39% (±
0.9%) con le altre femmine fertili della popolazione e del 41% (± 1.2%) con le femmine
fertili della propria colonia. Il 41% (± 0.7%) di tutti i nidi delle singole colonie si
sovrapponeva al periodo fertile medio della colonia. Quest’ultimo indice di sincronia
dipende dall’aggregazione dei nidi (NI) e indica che più numerose e vicine sono le coppie di
Grillaio, più sono sincronizzate nella riproduzione (Spearman correlation test: r = 0.138, p =
0.030, n = 248).
La proporzione di uova che sono sopravvissute alla schiusa era di 0.88 ± 0.01 nel 2009
(Kaplan-Meier product limit, n = 564) e di 0.87 ± 0.01 nel 2010 (n = 583), mentre la
proporzione di pulcini che sono sopravvissuti era di 0.69 ± 0.03 (n = 409) e di 0.77 ± 0.02

29
(n = 504) nel 2009 e nel 2010, rispettivamente. Non è stato riscontrato nessun effetto
dell’anno di studio sulla sopravvivenza delle uova (Gehan's Wilcoxon test, WW = 1666, p
= 0.80, n = 1147) e dei pulcini (WW = - 6201, p = 0.20, n = 913), di conseguenza i due anni
sono stati trattati insieme per le successive analisi statistiche.
Tra le variabili considerate, solo la SI all’interno delle colonie (SI col) aveva un effetto
significativo sulla sopravvivenza delle uova alla schiusa, indicando che nidi più sincroni
all’interno delle colonie beneficiavano di un tasso di schiusa maggiore (Tabella 1, Appendice
1).
Tabella 1 Effetti del Neighbour Index, della distanza del vicino più prossimo, del numero di coppie
per facciata e della sincronia riproduttiva (SI) sul tempo di sopravvivenza delle uova di Grillaio
nella Piana di Gela (Lognormal test, n = 1147).
L’effetto positivo della sincronia riproduttiva sulla sopravvivenza delle uova è
mostrato in Fig. 3, dove la curva media di sopravvivenza della popolazione è comparata con
quelle risultanti dalle colonie più e meno sincrone. La sopravvivenza dei pulcini era invece
influenzata dal NI (Tabella 2, Appendice 1). Poiché né la distanza dal vicino più prossimo,

30
né il numero di coppie per facciata influenzava la sopravvivenza (Tabella 2), questi risultati
indicavano che la prossimità e il numero dei vicini agivano sulla sopravvivenza dei pulcini
in modo interattivo piuttosto che individuale.
Fig. 3 Curve di sopravvivenza delle uova di Grillaio calcolate con i valori minimi, medi e massimi di
sincronia riproduttiva registrati nella popolazione della Piana di Gela (Sicilia).
Contrariamente alla sopravvivenza delle uova, quella dei pulcini era anche
influenzata positivamente dalla sincronia riproduttiva della popolazione (Tabella 2). In Fig.4
(Appendice 1) è mostrata la curva di sopravvivenza dei pulcini nei nidi più sincroni e più
aggregati. Ulteriori dettagli sono presenti in Appendice 1.
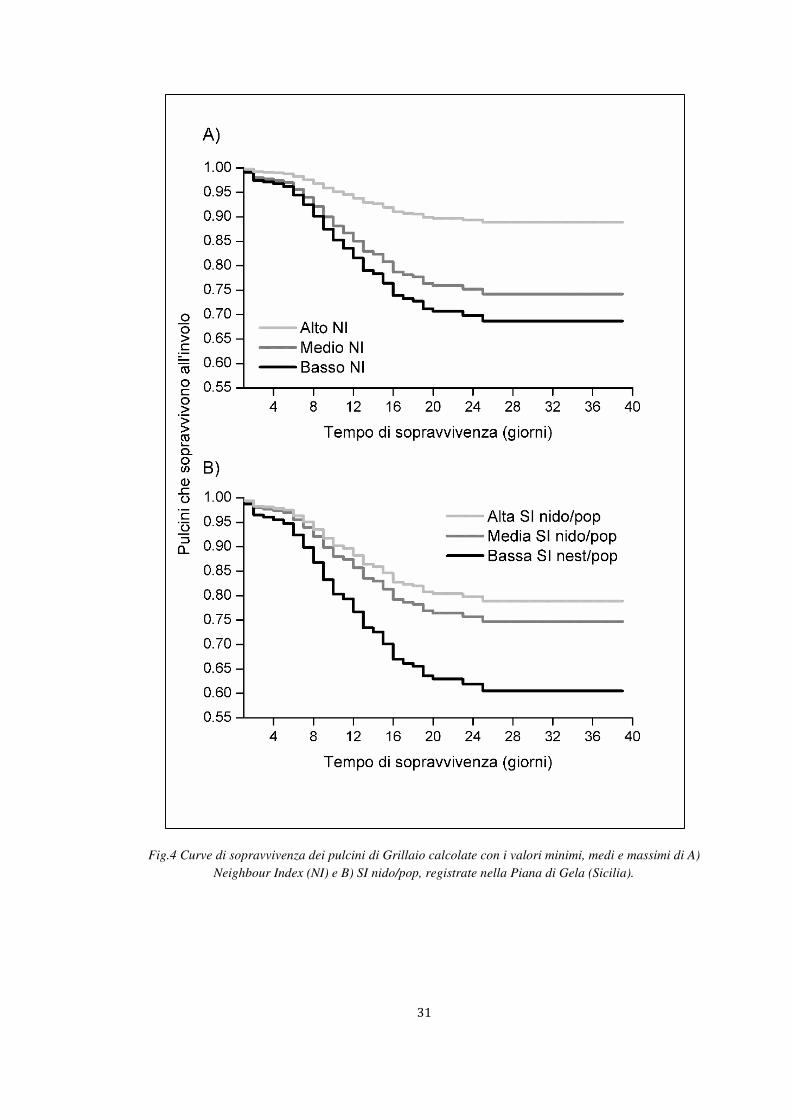
31
Fig.4 Curve di sopravvivenza dei pulcini di Grillaio calcolate con i valori minimi, medi e massimi di A)
Neighbour Index (NI) e B) SI nido/pop, registrate nella Piana di Gela (Sicilia).

32
Tabella 2 Effetti del Neighbour Index, della distanza del vicino più prossimo, del numero di coppie
per facciata, e della Sincronia Riproduttiva sul tempo di sopravvivenza dei pulcini di Grillaio nella
Piana di Gela (Lognormal test, n = 913).
Discussione
Nella Piana di Gela, l’aggregazione tra i nidi e la sincronia riproduttiva aumentano il
successo riproduttivo di una grande popolazione di Grillai nidificante nel suo tipico habitat
pseudosteppico. Individui circondati da numerosi conspecifici a breve distanza e sincroni
nella loro riproduzione, involano un numero maggiore di pulcini rispetto ai nidi isolati e
asincroni.
Nell’area di studio, l’aggregazione tra i nidi e la dimensione della colonia non
contribuiscono singolarmente all’aumento del successo riproduttivo ma interagiscono tra
loro. Un legame opposto tra dimensione della colonia e distanza tra i nidi è stata riscontrata
in una popolazione spagnola dove al di sopra di un certo numero di conspecifici si
evidenziava un effetto negativo sul successo riproduttivo (Serrano et al., 2004). Colonie di
grandi dimensioni, infatti, implicano una riduzione delle distanze tra i nidi vicini e un
conseguente aumento delle interazioni agonistiche (Serrano & Tella, 2007).
33
In Spagna, le principali cause di fallimento della nidificazione sono la predazione
(Serrano et al., 2004) e la mancanza di cibo per i pulcini (Bonal & Aparicio, 2008). La
predazione è particolarmente intensa nelle piccole colonie maggiormente accessibili ai
predatori (Serrano et al., 2004). A causa della loro attività prevalentemente diurna, i Grillai
troverebbero difficoltoso identificare alcuni predatori terrestri come il Ratto (Rattus rattus;
Serrano et al., 2004). Al contrario, i predatori aerei potrebbero essere più facili da
identificare, e ciascun individuo mediante l’individuazione, la difesa e la dissuasione
potrebbe aumentare l’efficienza anti-predatoria del gruppo (Brown et al., 1990; Westneat,
1992; Arroyo et al., 2001; Campobello & Sealy, 2011).
Risultati precedenti nella Piana di Gela hanno mostrato come il Grillaio attacca in
gruppo potenziali predatori aerei (Campobello et al., 2012), come la Gazza (Pica pica), la
Taccola (Corvus monedula) e il Corvo Imperiale (Corvus corax) responsabili di molti
episodi di predazione (Campobello et al., 2012). Di conseguenza, l’ipotesi più attendibile
è che un aumento delle difese anti-predatorie contribuisca a ridurre il fallimento della
nidificazione dei nidi più aggregati.
I risultati potrebbero essere spiegati anche con un aumento dell’efficienza di
foraggiamento tra le coppie con molti conspecifici a breve distanza. Infatti, le colonie
potrebbero agire come centri di informazione e aumentare le opportunità di foraggiamento
attraverso lo scambio di informazioni sulle migliori aree di caccia (Ward & Zahavi, 1973;
Campobello & Hare, 2007).
Il successo riproduttivo è inoltre positivamente correlato con la sincronia
riproduttiva. La sincronia riproduttiva all’interno della colonia determina un aumento della
sopravvivenza delle uova mentre la sincronia a livello di popolazione aumenta la
sopravvivenza dei pulcini. Vantaggi di tipo anti-predatorio e di foraggiamento
risulterebbero vani se la riproduzione tra i nidi vicini non fosse temporalmente sovrapposta.

34
Infatti, individui che iniziano a riprodursi prima o dopo i conspecifici vicini sono di fatto
isolati e non trarrebbero beneficio alcuno dalla diluizione del rischio di predazione (Varela
et al., 2007), dall’aumento dell’individuazione del predatore (Wissel & Brandl, 1988;
Westneat, 1992) o dalla sovrapposizione temporale tra il picco della disponibilità di cibo e
il momento della riproduzione (Rodriguez et al., 2010; Møller et al., 2011).
Identificare le cause della mortalità delle uova e dei pulcini, incluso il tipo di
predatore, determinare la disponibilità alimentare e la qualità della dieta del Grillaio
sarebbero utili per portare alla luce i benefici della colonialità forniti dalla sincronia
riproduttiva e dall’aggregazione tra i nidi.

35
Bibliografia
Arroyo, B., Mougeot, F., Bretagnole, V. (2001) Colonial breeding and nest defence in
Montagu's Harrier (Circus pygargus). Behavioural Ecology Sociobiology 50, 109-
115.
Bellia, E., Campobello, D., Sarà, M. (2011) Great Tit (Parus major) breeding in fire-prone
oak woods: differential effects of post-fire condition reproductive stages. Journal of
Wildland Fire 20, 605-611.
Bijleveld, A.I., Egas, M., van Gils, J.A., Piersma, T. (2010) Beyond the information centre
hypothesis: communal roosting for information on food, predators, travel companions
and mates? Oikos 119, 277-285.
Bonal, R., Aparicio, J.M. (2008) Evidence of prey depletion around Lesser Kestrel Falco
naumanni colonies and its short term negative consequences. Journal of Avian Biology
39,189-197.
Both, C. (2010) Food availability, mistiming and climate change. In: Møller AP, Fiedler W,
Berthold P (ed) Effects of climate change on birds. Oxford University Press, Oxford,
pp. 129-147.
Brown, C.R., Brown, M.B. (2001) Avian coloniality: progress and problems. Current
Ornithology 16,1-82.
Brown, C.R., Stutchbury, B.J., Walsh, P.D. (1990) Choice of colony size in birds. Trends
Ecology and Evolution 12, 398-403.
Brown, C.R., Brown, M.B. (1987) Group-living in Cliff Swallows as an advantage in
avoiding predators. Behavioural Ecology and Sociobiology 21, 97-107.
Calabuig, G., Ortego, J., Aparicio, J.M., Cordero, P.J. (2010a) Intercolony movements and
prospecting behaviour in the colonial lesser kestrel. Animal Behaviour 79, 811-817.

36
Calabuig, G., Ortego, J., Cordero, P.J., Aparicio, J.M. (2010b) Colony foundation in the
lesser kestrel: patterns and consequences of the occupation of empty habitat patches.
Animal Behaviour 80, 975-982.
Campobello, D., Sarà, M., Hare, J.F. (2012) Under my wing: Lesser Kestrels and Jackdaws
derive reciprocal benefits in mixed-species colonies. Behavioural Ecology 23, 425-
433. doi:10.1093/beheco/arr207.
Campobello, D., Sealy, S.G. (2011) Use of social over personal information enhances nest
defense against avian brood parasitism. Behavioural Ecology 22, 422-428.
Campobello, D., Hare, J.F. (2007) Information transfer determined by association of
neighbours in European Bee-eater (Merops apiaster) colonies. Ethology Ecology and
Evolution 19, 237-243.
Class, A.M., Haruka, W., Lynn, S.E., Moore, I.T. (2011) The timing of life-history stages
across latitudes in Zonotrica sparrows. Condor 113, 438-448.
Cox, D.R., Oakes, D. (1984) Analysis of survival data. Chapman and Hall, London.
Cramp, S., Simmons, K.E.L. (1980) The birds of the Western Palaearctic. Vol. 2. Oxford
University Press, Oxford.
Danchin, E., Wagner, R.H. (1997) The evolution of coloniality: the emergence of new
perspectives. Trends Ecology and Evolution 12, 342-347.
Dempster, A.P., Laird, N.M., Rubin, D.B. (1977) Likelihood from incomplete data via the
EM Algorithm. Journal Royal Statistical Society B 39, 1-38.
Fox, G.A. (2001) Failure-time analysis: studying times to events and rates at which events
occur. In: Scheiner SM, Gurevitch J (ed) Design and analysis of ecological
experiments. Oxford University Press, Oxford, pp. 235-266.

37
Hare, J.F., Murie, J.O. (2007) Ecology, kinship and ground squirrel society: insights from
comparative analyses. In: Wolff JO, Sherman W (ed) Rodents societies: an ecological
and evolutionary perspectives. University of Chicago Press, Chicago, pp. 345-355.
Hoogland, J.L., Sherman, P.W. (1976) Advantages and disadvantages of Bank Swallow
(Riparia riparia) coloniality. Ecological Monograph 46, 33-58.
Johnsen, A., Lifjeld, J.T. (2003) Ecological constraints on extra-pair paternity in the
bluethroat. Oecologia 136, 476-483
Kaplan, E., Meier, P.L. (1958) Nonparametric estimation from incomplete observations.
Journal American Statistical Association 53, 457-481.
Kempenaers, B. (1993) The use of a breeding synchrony index. Ornis Scandinavica 24, 84.
La Barbera, K., Lambías, P.E., Cramer, E.R.A., Schaming, T.D., Lovette, I.J. (2010)
Synchrony does not explain extrapair paternity rate variation in northern or southern
house wrens. Behavioural Ecology 21, 773-780.
Mascara, R., Sarà, M. (2006) Densità e biologia riproduttiva del Grillaio Falco naumanni
nella piana di Gela (Sicilia). Avocetta 30, 51-59.
Mayfield, H.F. (1975) Suggestions for calculating nest success. Wilson Bulletin 87, 456-
466.
Møller, A.P., Saino, N., Adamík, P., Ambrosini, R., Antonov, A., Campobello, D., Stokke,
B.G., Fossøy. E,, Lehikoinen. E., Martin- Vivaldi, M., Moksnes, A., Moskat, C.,
Røskaft, E., Rubolini, D., Schulze-Hagen, K., Soler, M., Shykoff, J.A. (2011) Rapid
change in host use of the Common Cuckoo Cuculus canorus linked to climate change.
Proceedings Royal Society B 278, 733-738. doi: 10.1098/rspb.2010.1592.
Mougeot, F. (2004) Breeding density, cuckoldry risk and copulation behaviour during the
fertile period in raptors: a comparative analysis. Animal Behaviour 67, 1067-1076.

38
Negro, J.J., Donázar, J.A., Hiraldo, F. (1992) Copulatory behaviour in a colony of lesser
kestrels: sperm competition and mixed reproductive strategies. Animal Behaviour 43,
921-930.
Nur, N., Holmes, A.L., Geupel, G.R. (2004) Use of survival time analysis to analyze nesting
success in birds: an example using Loggerhead Shrikes. Condor 106, 457-471.
Rodriguez, C., Tapia, L., Kieny, F., Bustamante, J. (2010) Temporal changes in Lesser
Kestrel (Falco naumanni) diet during the breeding season in Southern Spain. Journal
of Raptor Research 44, 120-128.
Sachs, L.L., Hughes, C.R., Nuechterlein, L.G., Buitron, D. (2007) Evolution of coloniality
in birds: a test of the hypothesis with the Rednecked Grebe (Podiceps grisegena). Auk
124, 628-642.
Sarà, M. (2010) Climate and land-use changes as determinants of Lesser Kestrel Falco
naumanni abundance in Mediterranean cereal steppes (Sicily). Ardeola 57, 3-22.
Serrano, D., Tella, J.L. (2007) The role of despotism and heritability in determining
settlement patterns in the colonial lesser kestrel. American Naturalist 169, E53-E67.
Serrano, D., Oro, D., Ursua, E., Tella, J.L. (2005a) Colony size selection determines adult
survival and dispersal preferences: allee effects in a colonial bird. American Naturalist
166, 22-31.
Serrano, D., Forero, M.G., Donazar, J.A., Tella, J.L. (2004) Dispersal and social attraction
affect colony selection and dynamics of Lesser Kestrels. Ecology 85,3438-3447.
Serrano, D., Tella, J.L., Forero, M.G., Donazar, J.A. (2001) Factors affecting breeding
dispersal in the facultatively colonial lesser kestrel: individual experience vs.
conspecific cues. Journal of Animal Ecology 70, 568–578.
Sokos, C.K., Mamolos, A. P., Kalburtji, K.L., Birtsas, P.K. (2013) Farming and wildlife in
Mediterranean agroecosystems. Journal for Nature Conservation 21, 81-92.

39
Statsoft Inc. (2001) STATISTICA for Windows. Statsoft Inc. Tulsa, OK.
Stokes, D.L., Boersma, P.D. (2000) Nesting density and reproductive success in a colonial
seabird, the Magellanic Penguin. Ecology 81, 2878-2891.
Terhune, J.M., Brillant, S.W. (1996) Harbour Seal vigilance decreases over time since haul
out. Animal Behaviour 51, 757-763.
Varela, S.A.M., Danchin, E., Wagner, R.H. (2007) Does predation select for or against avian
coloniality? – A comparative analysis Journal of Evolutionary Biology 20, 1490-1503.
Wagner, R.H. (1993) The pursuit of extra-pair copulations by female birds: a new hypothesis
of colony formation. Journal of Theoretical Biology 163, 333-346.
Ward, P., Zahavi, A. (1973) The importance of certain assemblages of birds as “ information-
centres” for food finding. Ibis 115, 517-534.
Westneat, D.F. (1992) Nesting synchrony by female Red-winged Blackbirds: effects on
predation and breeding success. Ecology 73, 2284-2294.
Wissel, C., Brandl, R. (1988) A model for the adaptive significance of partial reproductive
synchrony within social units. Evolutionary Ecology 2, 102-114.
Zar, J.H. (1999) Biostatistical analysis. Upper Saddle River, New Jersey.
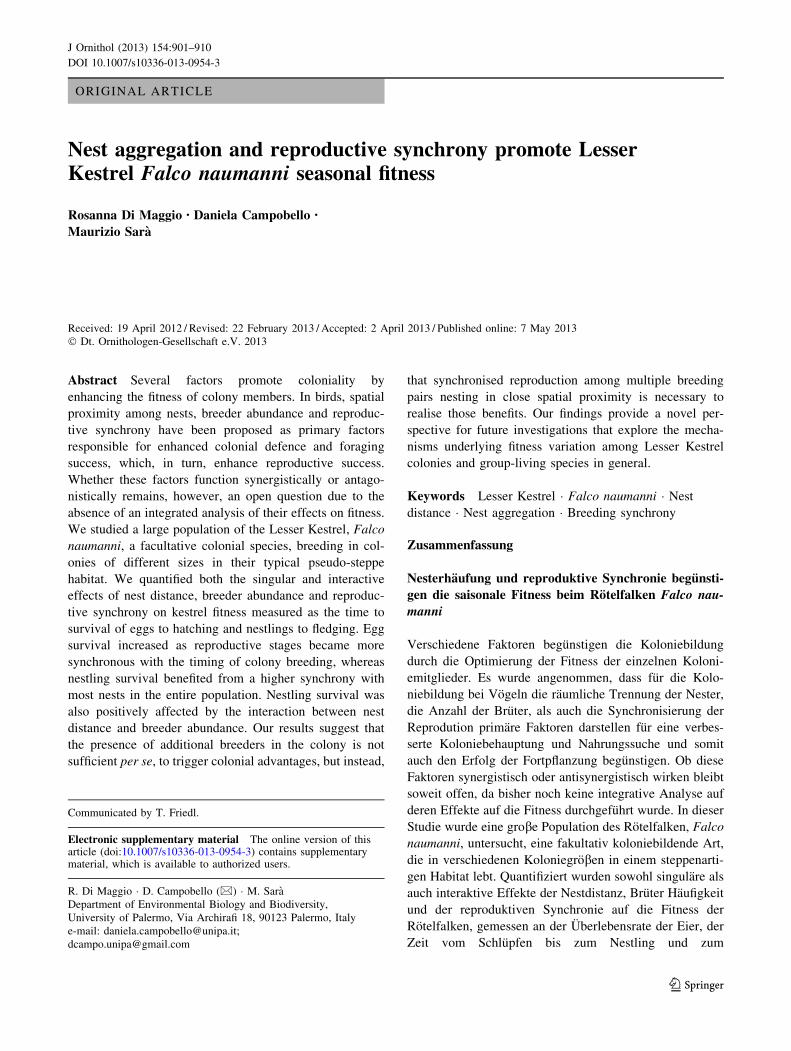
ORIGINAL ARTICLE
Nest aggregation and reproductive synchrony promote LesserKestrel Falco naumanni seasonal fitness
Rosanna Di Maggio • Daniela Campobello •
Maurizio Sara
Received: 19 April 2012 / Revised: 22 February 2013 / Accepted: 2 April 2013 / Published online: 7 May 2013
� Dt. Ornithologen-Gesellschaft e.V. 2013
Abstract Several factors promote coloniality by
enhancing the fitness of colony members. In birds, spatial
proximity among nests, breeder abundance and reproduc-
tive synchrony have been proposed as primary factors
responsible for enhanced colonial defence and foraging
success, which, in turn, enhance reproductive success.
Whether these factors function synergistically or antago-
nistically remains, however, an open question due to the
absence of an integrated analysis of their effects on fitness.
We studied a large population of the Lesser Kestrel, Falco
naumanni, a facultative colonial species, breeding in col-
onies of different sizes in their typical pseudo-steppe
habitat. We quantified both the singular and interactive
effects of nest distance, breeder abundance and reproduc-
tive synchrony on kestrel fitness measured as the time to
survival of eggs to hatching and nestlings to fledging. Egg
survival increased as reproductive stages became more
synchronous with the timing of colony breeding, whereas
nestling survival benefited from a higher synchrony with
most nests in the entire population. Nestling survival was
also positively affected by the interaction between nest
distance and breeder abundance. Our results suggest that
the presence of additional breeders in the colony is not
sufficient per se, to trigger colonial advantages, but instead,
that synchronised reproduction among multiple breeding
pairs nesting in close spatial proximity is necessary to
realise those benefits. Our findings provide a novel per-
spective for future investigations that explore the mecha-
nisms underlying fitness variation among Lesser Kestrel
colonies and group-living species in general.
Keywords Lesser Kestrel � Falco naumanni � Nest
distance � Nest aggregation � Breeding synchrony
Zusammenfassung
Nesterhaufung und reproduktive Synchronie begunsti-
gen die saisonale Fitness beim Rotelfalken Falco nau-
manni
Verschiedene Faktoren begunstigen die Koloniebildung
durch die Optimierung der Fitness der einzelnen Koloni-
emitglieder. Es wurde angenommen, dass fur die Kolo-
niebildung bei Vogeln die raumliche Trennung der Nester,
die Anzahl der Bruter, als auch die Synchronisierung der
Reprodution primare Faktoren darstellen fur eine verbes-
serte Koloniebehauptung und Nahrungssuche und somit
auch den Erfolg der Fortpflanzung begunstigen. Ob diese
Faktoren synergistisch oder antisynergistisch wirken bleibt
soweit offen, da bisher noch keine integrative Analyse auf
deren Effekte auf die Fitness durchgefuhrt wurde. In dieser
Studie wurde eine grobe Population des Rotelfalken, Falco
naumanni, untersucht, eine fakultativ koloniebildende Art,
die in verschiedenen Koloniegroben in einem steppenarti-
gen Habitat lebt. Quantifiziert wurden sowohl singulare als
auch interaktive Effekte der Nestdistanz, Bruter Haufigkeit
und der reproduktiven Synchronie auf die Fitness der
Rotelfalken, gemessen an der Uberlebensrate der Eier, der
Zeit vom Schlupfen bis zum Nestling und zum
Communicated by T. Friedl.
Electronic supplementary material The online version of thisarticle (doi:10.1007/s10336-013-0954-3) contains supplementarymaterial, which is available to authorized users.
R. Di Maggio � D. Campobello (&) � M. Sara
Department of Environmental Biology and Biodiversity,
University of Palermo, Via Archirafi 18, 90123 Palermo, Italy
e-mail: [email protected];
123
J Ornithol (2013) 154:901–910
DOI 10.1007/s10336-013-0954-3

Fluggewerden. Weiterhin konnte gezeigt werden, dass die
Uberlebensrate der Eier mit der Synchronisierung des Ni-
stens in der Kolonie steigt, wohingegen das Uberleben der
Nestlinge ansteigt mit der Synchronisierung des Nistens der
gesamten Population. Das Uberleben der Nestlinge war
auberdem positive beeinflusst von der Interaktion zwischen
dem Abstand der Nester und der Abundanz der Bruter.
Unsere Ergebnisse lassen vermuten, dass die Anwesenheit
zusatzlicher Bruter in der Kolonie allein nicht ausreicht, den
Erfolg der Kolonie positiv zu beeinflussen, sondern dass
stattdessen die synchronisierte Reproduktion vieler Brut-
paare die in enger Nachbarschaft nisten, dafur von Noten
ist. Unsere Ergebnisse weisen neue Perspektiven fur
zukunftige Forschungsansatze auf, die sich mit den Mech-
anismen der Fitnessvariationen in Kolonien des Rotelfalken
und anderen in Gruppen lebenden Arten befassen.
Introduction
The adaptive value of group living has been the focus of
several studies (Danchin and Wagner 1997; Rolland et al.
1998; Brown and Brown 2001). Considerable effort has
focused on understanding the costs and benefits of colo-
niality (Danchin and Wagner 1997), although to date, no
general model explaining the evolution of coloniality has
proven entirely satisfactory (Hoogland and Sherman 1976
but see Hare and Murie 2007). Spatial proximity among
nests, breeder abundance and temporal synchrony of nest-
ing stages have been proposed as primary factors under-
lying enhanced colonial defence and foraging success in
colonially-breeding species (Murphy and Schauer 1996;
Serrano et al. 2005a; Sachs et al. 2007).
Colonial breeders acquire fitness benefits that must
outweigh the costs of both the increased competition for
resources (Bonal and Aparicio 2008) and the increased risk
of transmission of parasites and diseases (Serrano et al.
2004) associated with group living. Potential offsetting
benefits of coloniality include a reduced risk of predation
for individuals and their offspring (Bijleveld et al. 2010).
An increase in the number of individuals residing in a
colony may promote earlier detection of predators (Brown
and Brown 1987), reduce individual investment in vigi-
lance (Terhune and Brillant 1996; Campobello et al. 2012)
or serve to confuse or satiate presumptive predators, and
therefore lower the predation risk (Oro 1996; Varela et al.
2007; Calabuig et al. 2010a).
Apart from the absolute number of individuals living
together, the distance between nests also appears to have
positive repercussions on reproductive success (Brown
et al. 1990). Colonial individuals nesting close to each
other benefit via reduced predation rates, which are
sometimes achieved through enhanced recruitment of
individuals to mob predators (Hernandez-Matıas et al.
2003). A short distance between nests also promotes
information transfer, allowing less successful foragers to
glean information from neighbouring individuals regarding
new food patches (Ward and Zahavi 1973; Weatherhead
1983; Campobello and Hare 2007). Negative effects,
however, have been identified, with increased agonistic
interactions occurring when neighbour distance shortens
below a certain threshold (Serrano and Tella 2007).
Living in groups might be more advantageous when
individuals synchronise the timing of breeding. Beyond
swamping the capacity of predators to take vulnerable
young (Varela et al. 2007), temporal overlap among a high
number of breeders promotes heightened efficiency in
terms of both vigilance and defence (Murphy and Schauer
1996). Asynchronous breeders, i.e. individuals nesting
earlier or later than most colony members, are left by
themselves to defend their eggs and nestlings (Hoogland
and Sherman 1976; Campobello and Sealy 2010). As a
consequence of less efficient individual nest defence in
comparison to that by groups, these breeders often suffer
decreased hatching and fledging success (Murphy and
Schauer 1996; Stokes and Boersma 2000; Sachs et al.
2007). If reproduction of most colony members is also
synchronised with the peak of food resource availability,
colonial advantages may be enhanced further (Both 2010).
Clustering of nests, an increased number of breeding
individuals and reproductive synchrony therefore enhance
fitness, although these same factors might also impose fit-
ness costs (Stokes and Boersma 2000). Proximity between
breeders promotes extra-pair copulations (Wagner 1993),
while a high number of colonial members promotes intense
competition for resources (Danchin and Wagner 1997;
Sachs et al. 2007; Calabuig et al. 2010b).Whether these
three factors function synergistically or antagonistically
remains an open question due to the absence of an inte-
grated analysis of their effects on fitness.
In a Mediterranean area, we studied a large population
of the Lesser Kestrel Falco naumanni, a facultative colo-
nial raptor and a vulnerable species that only recently had
its conservation status altered to ‘‘least concern’’ (Collar
et al. 1994; IUCN 2011). The core population studied here,
breeds in colony buildings surrounded by homogeneous
and traditional agricultural crops (Sara 2010; Triolo et al.
2011; Sara et al. 2012). Mechanisms that affect population
dynamics of this species have been studied in the Iberian
peninsula (Negro and Hiraldo 1993; Serrano et al. 2005a;
Ortego et al. 2007) but are still virtually unexplored in the
remaining part of its Palaearctic breeding range. In two
different Spanish populations, colony abundance differen-
tially affected the reproductive success of Lesser Kestrels
because of different habitat composition surrounding the
902 J Ornithol (2013) 154:901–910
123

different-sized colonies. In heterogeneous habitats, indi-
viduals in large colonies tended to produce more young
(Serrano et al. 2004) but when colony nest availability was
saturated, shorter distances between nests triggered
increased agonistic interactions (Serrano and Tella 2007).
In contrast, no colony size effect was detected on kestrel
breeding performance in more homogeneous habitats
(Calabuig et al. 2010b) and it is unknown whether nest
distance and breeding synchrony affected kestrel repro-
ductive success. By adopting an innovative approach to
quantify distances among nests, we examined whether egg
and nestling survival were affected by singular and inter-
active effects of nest distance, breeder abundance and
reproductive synchrony on the fitness of Lesser Kestrels
breeding in the Gela Plain (Italy).
Methods
Study species
The Lesser Kestrel is a small raptor that lives in open and
dry cereal steppes of the Western Palaearctic (Cramp and
Simmons 1980). It is a facultative colonial raptor that
breeds in colonies of 2–60 pairs (Forero et al. 1996; Ser-
rano et al. 2004), usually with Jackdaws Corvus monedula
and Rock Pigeons Columba livia. The Lesser Kestrel is a
secondary-cavity nester that finds its hole-nests in cliffs or
wall crevices and under roof tiles of rural buildings (Negro
and Hiraldo 1993). The Lesser Kestrel population in the
Gela Plain, the largest in Sicily and one of the most
important in Italy (Mascara and Sara 2007), has grown
consistently over the last decade (Sara 2010).
Study area
The Gela Plain in south-eastern Sicily (Italy, 378070N,
148190E), is one of the largest plains in Italy (about
474 km2). The area is characterised by gentle slopes up to
200 m a. s. l., limestone and gypsum hills and sand and
clay badlands (Mascara and Sara 2006). Due to limited
precipitation (350 mm/year), the agricultural landscape is
composed of a mosaic of pseudo-steppes dominated by
artichoke Cynara spp. fields and non-irrigated, mainly
cereal, crops, garigue vegetation, fallow land and pastures.
Agriculture has rapidly changed with the intensification of
farming practices in some areas of Sicily and populations
of Lesser Kestrels have declined because of agricultural
shifts, from traditional to woody crop cultivations (Sara
2010). Contrary to the general Sicilian trend, in the Gela
Plain, a more homogeneous agricultural composition and
the maintenance of traditional crops, mostly artichokes and
wheat (Triolo et al. 2011), have instead represented
favourable conditions for an increase in the Lesser Kestrel
population in the last decade (Sara 2010). Across the plain,
numerous rural buildings, often partially destroyed or
abandoned, host Lesser Kestrel nests. Each colony building
is usually composed of a single structure, or in rare cases,
two or more small houses close to each other (i.e.\30 m
apart). Colony buildings are comprised of different sides,
representing different faces of the same structure.
Quantification of colony parameters
Investigations were conducted between April and July in
2009 and 2010. Lesser Kestrel nests were first identified by
observing colony structures with 10 9 50 binoculars and
20 9 60 spotting scopes. We identified 14 kestrel colonies
in 2009 and 12 in 2010, distributed across the plain with a
distance of 7 ± 0.5 km (mean ± SE) between each other
(range: 0.6–19 km; Fig. 1). When at least one pair of
kestrels showed reproductive behaviour at the observed
building (i.e. a male delivering prey to a female, copulation
or the inspection of nest chambers; Serrano et al. 2001;
Sara 2010), potential nests inside crevices and under tiles
were inspected. Nest checking allowed the quantification of
the total number of breeding pairs per colony. We identi-
fied 462 nests (18 ± 1.8 per colony per year; range: 5–33)
for which we could confirm the presence of at least one laid
egg. Other potential nests could not be included in the
analyses because of their inaccessibility. Because of the
uncertainty about the presence of these nests, it was nec-
essary to exclude some colony sides that potentially but not
certainly contained nests. We therefore studied a mean of
2.9 ± 0.4 sides per colony that included 127 nests in 2009
and 123 in 2010. Between years, the number of study nests
mirrored the number of total active nests within each col-
ony (Spearman rank order correlation, r = 0.82,
P\ 0.0001, n = 26) and could therefore be used as an
index of colony breeder abundance. Each nest was checked
at least three times per season: during egg-laying/incuba-
tion and at hatching and fledging times. This schedule
allowed the collection of sufficient data to ascertain
reproductive success, while simultaneously minimising
disturbance at the reproductive sites. During nest checks,
we recorded the number of eggs and nestlings inside each
nest. As part of a larger investigation, nestlings were
marked with numbered aluminium and plastic coloured
rings for remote identification of individuals.
The reproductive success of breeding pairs was deter-
mined by analyses of the survival time of each egg to
hatching and nestling to fledging (Nur et al. 2004). The
identification of various reproductive stages was derived
from the data collected from nest checks or by a backdating
process standardised on 7 days for laying, 29 days for
incubation and 29–32 days for fledging periods (Cramp
J Ornithol (2013) 154:901–910 903
123

and Simmons 1980; Sara unpubl.). Missing eggs and nes-
tlings and those found with evident signs of predation were
recorded as being predated. In some instances of unhatched
eggs and nestlings found dead in the nest, we were unable
to identify the exact cause of mortality which might have
included thermoregulation failure and starvation, due to
heavy spring rain and food depletion or inefficient forag-
ing, respectively. Because of such an uncertainty, we could
not perform separate analyses per mortality cause. All
unhatched or missing eggs and dead or missing nestlings
were treated as failed on the day corresponding to the mid-
point between the last two consecutive visits (Mayfield
1975; Serrano et al. 2001; Mascara and Sara 2006).
To determine the role of the number and proximity of
conspecifics on reproductive success, we tested the effect
of three factors: neighbour index (NI, Campobello and
Hare 2007), nearest nest distance (NND, i.e. the shortest
distance between the focal nest and its closest neighbouring
nest; Negro and Hiraldo 1993) and breeder abundance (i.e.
the number of breeding pairs per colony side) on individual
fitness. The first index, NI, quantifies the interactive effect
between the number of neighbours and their proximity to
the focal nesting pair, NND and breeder abundance quan-
tify separately the two variables of nest proximity and
number of neighbours, respectively. To quantify both
indices, it was necessary to calculate the distances between
nests. To do this, colony sides were photographed with a
Leica D-Lux 4 and colony photos were uploaded to the
software TechDig 2.0. A set of Cartesian axes was assigned
to each photo and the length of a reference previously
measured in the field (e.g. height of a door, distance
between windows, etc.) was recorded. The position of each
nest was marked on the photo, so that x–y coordinates were
used to calculate Euclidean distances between each pair of
nests (Fig. 2).
The neighbour index was calculated using the formula:
NI nestn ¼Xn
i¼1
1=dist-nestnð Þ
where n is the nest number and dist-nestn, the distance
between the nest of interest and each of the other nests on
the same colony side (Campobello and Hare 2007). A low
value of the index indicates an isolated nest, while a high
NI value indicates a nest surrounded by many other active
nests in close proximity.
To quantify reproductive synchrony, we adopted the
synchrony index (SI) as proposed by Kempenaers (1993)
and Class et al. (2011) and applied it to single colonies
(Johnsen and Lifjeld 2003; LaBarbera et al. 2010). We
estimated three synchrony indices: (1) SI nest/pop as the
proportion of fertile females in the population for each
day of the focal female’s fertile period (Kempenaers
1993; Class et al. 2011); (2) SI nest/col as the proportion
of fertile females in the colony for each day of the focal
female’s fertile period (Johnsen and Lifjeld 2003;
LaBarbera et al. 2010); and (3) SI col as the proportion of
fertile females within each colony during the fertility
period of all colony females (Johnsen and Lifjeld 2003;
LaBarbera et al. 2010). The above indices thus quantified
the breeding synchrony of each nest with respect to that
of the entire population (SI nest/pop) and its colony
(SI nest/col), and provided an estimate of the breeding
Fig. 1 Map of the Gela Plain
(Sicily, Italy) showing the
spatial distribution of Lesser
Kestrel colonies. Small dots
1–11 pairs; medium dots 12–22
pairs; full circles 23–33 pairs
904 J Ornithol (2013) 154:901–910
123

synchrony occurring within each colony (SI col). We
considered the fertile period of kestrel females to be from
5 days prior the laying of the first egg (Negro et al. 1992)
to the end of the laying period (Mougeot 2004), thus, for
a total of 12 days. Although these three indices were
correlated with each other (Spearman correlation,
n = 248, r = 0.62–0.70, P\ 0.001), they showed a dif-
ferent response as independent factors to egg and nestling
survival (see ‘‘Results’’) and were therefore analysed
singly.
Both the variables NND and NI showed a symmetrical
and opposite response if correlated with the breeder
abundance (Online Resource 1). Thus, as the number of
neighbours increased, the nearest distance became shorter,
while the mean distance with all the other nests increased.
Because of the opposite and symmetrical correlations,
distances and number of pairs were maintained as potential
predictors to be tested.
Statistical analyses
We determined whether nest distances differed between
years with an Analysis of Variance (ANOVA, Zar 1999)
where the study year was the orthogonal fixed factor with
two levels, one per study year. The survival time of eggs
and nestlings was examined using the Kaplan–Meier
product limit (Kaplan and Meier 1958; Nur et al. 2004;
Bellia et al. 2011). Differences in egg and nestling survival
between years were determined using the Gehan–Wilcoxon
test, by treating the study year as an independent factor and
survival time as the dependent variable (Cox and Oakes
1984; Fox 2001).
The effect of nest distance, colony size, their interaction
effect, and reproductive synchrony was quantified by
conducting separate parametric survival tests (Lognormal
tests, Dempster et al. 1977) where NI, NND, breeder
abundance and SIs were treated as independent factors and
egg and nestling survival times were the dependent vari-
able. These models used the expectation maximisation
algorithm (Dempster et al. 1977), where the normal dis-
tribution of the log-survival times was revealed by points
of residual survival times arranged in a straight line. If a
regression revealed a statistically significant effect, the
survival curve obtained with the minimum and maximum
predictor values recorded in the population was projected
against the curve obtained with the mean predictor value.
To control for any confounding effect of the first laying
day on the nestling survival we calculated the Julian date
corresponding to first laying day for each nest and then we
conducted a survival test by using Julian dates as inde-
pendent factor and nestling survival time as dependent
variable. Nestling survival was not affected by first laying
day (log normal tests, v2 = 6.45, P = 0.096, N = 913), so
we excluded a possible effect of the laying date on lesser
kestrel nestling survival.
To control for any bias that might have been incurred by
determining the survival of each egg and nestling, two
separate nested ANOVAs (Underwood 1997), were con-
ducted, using the proportion of eggs hatched and chicks
fledged as dependent variables, year and colony size as
Fig. 2 Side of one of the colonies that housed Lesser Kestrel nests (red circles). To calculate the distance between nests, a set of Cartesian axes
(red lines) and a metric reference (yellow line) previously measured in the field were overlaid onto the digital photograph (colour figure online)
J Ornithol (2013) 154:901–910 905
123

independent factors, and colony identity as a random term.
Both colony size and identity were nested in year. Results
revealed no effect of the year or colony size on either hatching
or fledging rates (Online Resource 2), but colony identity did
have an effect on both these rates (Online Resource 2). Post
hoc tests revealed one single colony to be significantly dif-
ferent from the others in terms of hatching (Newman–Keuls
test, betweenMS = 0.07, P = 0.023 for 1 out of 24 pairwise
comparisons) and fledging (between MS = 0.06, P\ 0.010
for all pairwise comparisons) values. Therefore, this colony
was removed from the following analyses.
Finally, we tested the relationship between reproductive
synchrony and level of nest aggregation by using linear
regressions (Zar 1999) between SIs and all NI. All analyses
were conducted using STATISTICA 6.0 software (Statsoft
Inc. 2001).
Results
Distances between nests did not differ (ANOVA,
F1,248 = 2.07, P = 0.151) between 2009 (mean ± SE:
4.24 ± 0.40 m, n = 127) and 2010 (3.31 ± 0.27 m,
n = 123). The shortest distance between nests ranged from
0.34 to 25.02 m and colony sides hosted 2–11 breeding
pairs (5.7 ± 0.08) with 1–23 pairs per colony (10.0 ±
1.10). Nest aggregation measured by the NI ranged from
0.0004 (i.e. isolated nests) to 0.0517 (i.e. nests surrounded
by many others within a short distance). Each female
overlapped each day of its fertile period with a mean of
39 % (±0.9 %) of all other fertile females in the popula-
tion and with 41 % (±1.2 %) of fertile females in its col-
ony. Single colonies showed 41 % (±0.7 %) of all nests
overlapping their breeding on each day of the kestrel fer-
tility period. This last SI was dependent on nest clumping
(i.e. NI), indicating that the more numerous and less distant
were the pairs in the colony, the more synchronised
was their breeding period (Spearman correlation test:
r = 0.138, P = 0.030, n = 248).
The cumulative proportion of eggs that survived to
hatching was 0.88 ± 0.01 in 2009 (Kaplan–Meier product
limit, n = 564) and 0.87 ± 0.01 in 2010 (n = 583), while
the cumulative proportion of nestlings that survived was
0.69 ± 0.03 (n = 409) and 0.77 ± 0.02 (n = 504) in 2009
and 2010, respectively. There was no year effect on the
survival of eggs (Gehan’s Wilcoxon test, WW = 1666,
P = 0.80, n = 1147) or nestlings (WW = -6201,
P = 0.20, n = 913), allowing data for the two study years
to be pooled for further analyses.
Among the independent variables examined, only SI
within colonies (SI col) had a significant effect on egg
survival to hatching, indicating that more synchronous nests
within colonies benefited from a higher hatching rate
(Table 1). The positive effect of breeding synchrony on egg
survival is shown in Fig. 3, where the survival curve of the
population is compared with that resulting from the least or
most synchronous colonies. Nestling survival was affected
by NI (Table 2). Because neither the NND nor the breeder
abundance affected nestling survival (Table 2), these results
indicated that proximity and the number of neighbours
affected the survival of nestlings via their interaction (i.e.,
quantified as NI), rather than as individual variables. Con-
trary to egg survival, nestling survival was also positively
affected by population rather than colony breeding syn-
chrony (Table 2). Figure 4 shows the higher survival of
nestlings in the most clumped and synchronous nests.
Discussion
In the Gela Plain, nest clumping and reproductive syn-
chrony enhanced the reproductive success of a large Lesser
Table 1 Effects of neighbour index, nearest nest distance, breeder
abundance and breeding SI on the survival time of eggs of Lesser
Kestrels breeding in the Gela Plain (Lognormal test, n = 1147)
v2 P
Neighbour index 1.50 0.2199
Nearest nest distance 1.56 0.2111
Breeder abundance 3.27 0.0707
SI nest/pop 2.30 0.1292
SI nest/col 4.06 0.0439
SI col 8.43 0.0037
SI nest/pop proportion of fertile females in the population for each
fertile day of the focal nest, SI nest/col proportion of fertile females in
the colony for each fertile day of the focal nest, SI col proportion of
colony fertile females for each day of the kestrel fertility period
Fig. 3 Survival curves of Lesser Kestrel eggs calculated with
minimum, mean and maximum values of breeding SI col values
recorded in the population of the Gela Plain (Sicily, Italy)
906 J Ornithol (2013) 154:901–910
123

Kestrel population nesting in its typical pseudo-steppe
habitat. Breeding individuals surrounded by several con-
specifics in close proximity and synchronised in their
reproduction, fledged more young than isolated and rela-
tively asynchronous breeding pairs.
In Lesser Kestrels, colony size is strictly related to
breeding experience. Dispersing individuals are often
breeders at their first nesting attempt (Jovani et al. 2008;
Serrano and Tella 2012). They are prevented from nesting
in large colonies by philopatric pairs and then become
founders of new small colonies (Serrano and Tella 2007;
Calabuig et al. 2010b). Depending on the surrounding
habitat, large and small colonies might offer different or
similar bases for successful reproduction. In large colonies
of one Spanish population occurring in good quality pat-
ches, adult kestrels benefited from higher reproductive
output than yearlings in small colonies that insisted on
habitats rendered suboptimal by a particularly high preda-
tion rate (Serrano and Tella 2007). On the contrary, in
another population, philopatric individuals and founders
nesting in large and small colonies, respectively, enjoyed a
similar fitness, probably because of more homogeneous
agricultural crops being present near to colony buildings
(Calabuig et al. 2010b). The findings of the latter case
study are consistent with our results, where a homogeneous
land use cover across the Gela Plain (Sara 2010) might
have offered all colonies consistent foraging opportunities
and resulted in a similar breeding performances irrespec-
tive of the colony size (Mascara and Sara 2006).
In the Gela Plain, nest clumping and colony abundance
did not contribute to higher reproductive success as single
factors, but via their interactive effect. An opposite rela-
tionship between colony size and nest distance was found
in one Spanish kestrel population where the increase of
colony size beyond a certain threshold exerted a negative
effect because of its repercussions on nest distance (Ser-
rano et al. 2004). Larger colonies implied a shorter distance
to the closest breeding neighbour and a consequent
increase in agonistic interactions (Serrano and Tella 2007).
As the colony became larger, we recorded the same
decrease in the closest neighbour distance while the mean
distance with the other breeding neighbours increased. This
latter event might have compensated for the first effect,
resulting in a non-significant single effect of nest distance
on reproductive success.
In Spain, the main causes of kestrel nesting failure are
predation (Serrano et al. 2004) and nestling starvation
(Bonal and Aparicio 2008). Predation was particularly
recorded in small colonies that were more accessible to
predators (Serrano et al. 2004). In the Gela Plain, 88 % of
colony structures are farmhouses with a similar status (i.e.
abandoned buildings, partially in ruins with roof still
present; Mascara and Sara 2006; Sara et al. 2012) which
apparently eliminates predator access as a factor that dif-
fers between different-sized colonies. Because of their
aerial and diurnal activity, Lesser Kestrels might find it
(A)
(B)
Fig. 4 Survival curves of Lesser Kestrel nestlings calculated with
minimum, mean and maximum values of a NI and b breeding SI nest/
pop, both recorded in the population of the Gela Plain (Sicily, Italy).
The NI is a measure of nest aggregation that increases with the
number of breeding neighbours and decreases with the distance
between the focal nest and all conspecifics nesting on a colony side.
SI nest/pop: proportion of fertile females in the population for each
fertile day of the focal nest
Table 2 Effects of neighbour index, nearest nest distance, breeder
abundance and breeding SI on the survival time of nestlings of Lesser
Kestrels breeding in the Gela Plain (Lognormal test, n = 913)
v2 P
Neighbour index 12.33 0.0004
Nearest nest distance 0.55 0.4572
Breeder abundance 1.60 0.2065
SI nest/pop 4.86 0.0274
SI nest/col 3.33 0.0682
SI col 0.83 0.3627
SI nest/pop proportion of fertile females in the population for each
fertile day of the focal nest, SI nest/col proportion of fertile females in
the colony for each fertile day of the focal nest, SI col proportion of
colony fertile females for each day of the kestrel fertility period
J Ornithol (2013) 154:901–910 907
123

difficult to spot some terrestrial predators, such as Back
Rats (Rattus rattus; Serrano et al. 2004); however, the
presence of aerial predators might be easier to identify, and
the detection, deterrence and defence behaviours by each
individual might improve the antipredator efficiency of the
group (Brown et al. 1990; Westneat 1992; Arroyo et al.
2001; Campobello and Sealy 2011a, b). Previous findings
at the Gela Plain showed that Lesser Kestrels group-mob-
bed potential aerial predators (Campobello et al. 2012),
which is consistent with predation events by European
Magpies (Pica pica), Jackdaws (Corvus monedula) and
Common Ravens (Corvus corax) recorded during several
observation sessions (Campobello et al. 2012, unpubl.
data). Accordingly, a valid working hypothesis might test
whether enhanced antipredator advantages contribute to the
reduced nesting failure among densely clumped breeders
found in this study.
The mechanisms underlying our results might also relate
to improved foraging efficiency among pairs with many
conspecifics breeding in close proximity. In another
Spanish population, an important cause of mortality of
kestrel nestlings was starvation, mostly recorded in large
colonies more exposed to density-dependent food depletion
(Bonal and Aparicio 2008). As mentioned above, a more
homogeneous habitat composition in the Gela Plain (Sara
2010; Triolo et al. 2011) might explain the nonsignificant
effect of colony size on kestrel reproductive success.
Instead, consistent hypotheses worth testing might include
improved foraging opportunities and the exchange of
information on the whereabouts of good hunting patches
(Ward and Zahavi 1973; Campobello and Hare 2007).
In our study population, nest success was also positively
correlated with reproductive synchrony. Synchrony at the
colony and population level, however, played a different
role in egg or nestling survival. Colony synchrony allowed
a higher survival of eggs to hatching, while population
synchrony increased the survival of nestlings until fledging.
In other kestrel populations, age at first breeding has been
found to affect synchrony, with yearlings nesting in small
colonies being less synchronous and productive than adults
(Serrano et al. 2004). A different age composition between
differently sized colonies was not observed (M. Sara un-
publ. data), although a more specific study is warranted.
Antipredator and/or foraging advantages facilitated by nest
clustering would be rendered irrelevant if reproduction
among those neighbouring breeding pairs did not overlap
temporally. In fact, individuals that start breeding much
earlier or later than their neighbours-to-be are effectively
isolated breeders and as such, do not enjoy the possible
benefits of dilution of predation risk (Varela et al. 2007),
enhanced predator detection and deterrence (Wissel and
Brandl 1988; Westneat 1992; Murphy and Schauer 1996)
or temporal overlap between source peak demand and
habitat availability (Post and Forchhammer 2008;
Campobello and Sealy 2009; Rodriguez et al. 2010; Møller
et al. 2011).
Our results reveal how colonial factors, typically
examined separately, act in concert to affect the fitness of
Lesser Kestrels. The abundance of colonial breeders and
nest aggregation interact to enhance fitness, although the
mechanisms that underlie such benefits are still to be
identified as antipredator and/or foraging advantages. Our
results, however, revealed no effect of nest clumping on
hatching success, which is consistent with the previously
reported finding that egg hatchability is independent of
colony size (Serrano et al. 2005b). Identifying the putative
cause of nestling and egg mortality, including the type of
predator, determining colonial age composition and com-
paring food availability and quality of kestrel diet relative
to nestling status would all prove useful in disentangling
the potential coloniality benefits provided by synchronous
reproduction among tightly clustered breeding pairs.
Acknowledgments We thank Rosario Mascara, Stefano Triolo,
Joelle Tysseire and Laura Zanca for field assistance and Emilio Gi-
udice and Rosario Mascara for field accommodation. An earlier
version of the manuscript was greatly improved by suggestions of J.
F. Hare and three anonymous reviewers. Language was revised by J.
F. Hare and Proof-Reading-Service.com. Funding was provided by a
Scientific Research Grant (ex-quota 60 %, year 2007, University of
Palermo) to MS. This study complies with the current Italian laws
regulating scientific research on animals.
References
Arroyo B, Mougeot F, Bretagnole V (2001) Colonial breeding and
nest defence in Montagu’s Harrier (Circus pygargus). Behav
Ecol Sociobiol 50:109–115
Bellia E, Campobello D, Sara M (2011) Great Tit (Parus major)
breeding in fire-prone oak woods: differential effects of post-fire
condition reproductive stages. Int J Wildland Fire 20:605–611
Bijleveld AI, Egas M, van Gils JA, Piersma T (2010) Beyond the
information centre hypothesis: communal roosting for informa-
tion on food, predators, travel companions and mates? Oikos
119:277–285
Bonal R, Aparicio JM (2008) Evidence of prey depletion around
Lesser Kestrel Falco naumanni colonies and its short term
negative consequences. J Avian Biol 39:189–197
Both C (2010) Food availability, mistiming and climate change. In:
Møller AP, Fiedler W, Berthold P (eds) Effects of climate
change on birds. Oxford University Press, Oxford, pp 129–147
Brown CR, Brown MB (1987) Group-living in Cliff Swallows as
an advantage in avoiding predators. Behav Ecol Sociobiol 21:
97–107
Brown CR, Brown MB (2001) Avian coloniality: progress and
problems. Curr Ornithol 16:1–82
Brown CR, Stutchbury BJ, Walsh PD (1990) Choice of colony size in
birds. Trends Ecol Evol 12:398–403
Calabuig G, Ortego J, Aparicio JM, Cordero PJ (2010a) Intercolony
movements and prospecting behaviour in the colonial lesser
kestrel. Anim Behav 79:811–817
908 J Ornithol (2013) 154:901–910
123

Calabuig G, Ortego J, Cordero PJ, Aparicio JM (2010b) Colony
foundation in the lesser kestrel: patterns and consequences of the
occupation of empty habitat patches. Anim Behav 80:975–982
Campobello D, Hare JF (2007) Information transfer determined by
association of neighbours in European Bee-eater (Merops
apiaster) colonies. Ethol Ecol Evol 19:237–243
Campobello D, Sealy SG (2009) Avian brood parasitism in a
Mediterranean region: hosts and habitat preferences of common
cuckoos Cuculus canorus. Bird Study 56:389–400
Campobello D, Sealy SG (2010) Enemy recognition of Reed Warbler
(Acrocephalus scirpaceus): threats and reproductive value act
independently in nest defence modulation. Ethology 116:498–
508
Campobello D, Sealy SG (2011a) Use of social over personal
information enhances nest defense against avian brood parasit-
ism. Behav Ecol 22:422–428
Campobello D, Sealy S (2011b) Nest defence against avian brood
parasites is promoted by egg-removal events in a cowbird-host
system. Anim Behav 82:885–891
Campobello D, Sara M, Hare JF (2012) Under my wing: Lesser
Kestrels and Jackdaws derive reciprocal benefits in mixed-
species colonies. Behav Ecol 23:425–433. doi:10.1093/beheco/
arr207
Class AM, Haruka W, Lynn SE, Moore IT (2011) The timing of life-
history stages across latitudes in Zonotrica sparrows. Condor
113:438–448
Collar NJ, Crosby MJ, Stattersfield AJ (1994) Birds to watch 2: the
world list of threatened birds. Cambridge. BirdLife International
(BirdLife Conservation Series no. 4)
Cox DR, Oakes D (1984) Analysis of survival data. Chapman and
Hall, London
Cramp S, Simmons KEL (1980) The birds of the Western Palaearctic,
vol 2. Oxford University Press, Oxford
Danchin E, Wagner RH (1997) The evolution of coloniality: the
emergence of new perspectives. Trends Ecol Evol 12:342–347
Dempster AP, Laird NM, Rubin DB (1977) Likelihood from
incomplete data via the EM Algorithm. J R Stat Soc B 39:1–38
Forero MG, Tella JL, Donazar JA, Hiraldo F (1996) Can interspecific
competition and nest site availability explain the decrease of
lesser kestrel Falco naumanni populations? Biol Cons 78:289–
293
Fox GA (2001) Failure-time analysis: studying times to events and
rates at which events occur. In: Scheiner SM, Gurevitch J (eds)
Design and analysis of ecological experiments. Oxford Univer-
sity Press, Oxford, pp 235–266
Hare JF, Murie JO (2007) Ecology, kinship and ground squirrel
society: insights from comparative analyses. In: Wolff JO,
Sherman W (eds) Rodents societies: an ecological and evolu-
tionary perspectives. University of Chicago Press, Chicago,
pp 345–355
Hernandez-Matıas A, Jover L, Ruiz X (2003) Predation on common
tern eggs in relation to sub-colony size, nest aggregation and
breeding synchrony. Waterbirds 26:280–289
Hoogland JL, Sherman PW (1976) Advantages and disadvantages of
Bank Swallow (Riparia riparia) coloniality. Ecol Monogr
46:33–58
IUCN (2011) IUCN Red List of Threatened Species. Version 2011.2.
www.iucnredlist.org. Accessed 19 April 2012
Johnsen A, Lifjeld JT (2003) Ecological constraints on extra-pair
paternity in the bluethroat. Oecologia 136:476–483
Jovani R, Serrano D, Ursua E, Tella JL (2008) Truncated power laws
reveal a link between low-level behavioral processes and
grouping patterns in a colonial bird. PLoS One 3:e1992. doi:
10.1371/journal.pone.0001992
Kaplan E, Meier PL (1958) Nonparametric estimation from incom-
plete observations. J Am Stat Assoc 53:457–481
Kempenaers B (1993) The use of a breeding synchrony index. Ornis
Scandinavica 24:84
LaBarbera K, Lambıas PE, Cramer ERA, Schaming TD, Lovette IJ
(2010) Synchrony does not explain extrapair paternity rate
variation in northern or southern house wrens. Behav Ecol
21:773–780
Mascara R, Sara M (2006) Densita e biologia riproduttiva del Grillaio
Falco naumanni nella piana di Gela (Sicilia). Avocetta 30:51–59
Mascara R, Sara M (2007) Censimento di specie d’uccelli steppic-
ocerealicole d’interesse comunitario nella Piana di Gela (Sicilia
sudorientale) (Aves). Nat Sicil 4:27–39
Mayfield HF (1975) Suggestions for calculating nest success. Wilson
Bull 87:456–466
Møller AP, Saino N, Adamık P, Ambrosini R, Antonov A,
Campobello D, Stokke BG, Fossøy E, Lehikoinen E, Martin-
Vivaldi M, Moksnes A, Moskat C, Røskaft E, Rubolini D,
Schulze-Hagen K, Soler M, Shykoff JA (2011) Rapid change in
host use of the common cuckoo Cuculus canorus linked to
climate change. Proc R Soc B 278:733–738. doi:10.1098/rspb.
2010.1592
Mougeot F (2004) Breeding density, cuckoldry risk and copulation
behaviour during the fertile period in raptors: a comparative
analysis. Anim Behav 67:1067–1076
Murphy EC, Schauer JH (1996) Synchrony in egg-laying and
reproductive success of neighboring Common Murres, Uria
aalge. Behav Ecol Sociobiol 39:245–258
Negro JJ, Hiraldo F (1993) Nest-site selection and breeding success in
the Lesser Kestrel Falco naumanni. Bird Study 40:115–119
Negro JJ, Donazar JA, Hiraldo F (1992) Copulatory behaviour in a
colony of lesser kestrels: sperm competition and mixed repro-
ductive strategies. Anim Behav 43:921–930
Nur N, Holmes AL, Geupel GR (2004) Use of survival time analysis
to analyze nesting success in birds: an example using Logger-
head Shrikes. Condor 106:457–471
Oro D (1996) The effects of trawler discard availability on the egg-
laying and the breeding success of the Lesser Blackbacked Gull
Larus fuscus in the western Mediterranean. Mar Ecol Progr Ser
132:43–46
Ortego J, Aparicio JM, Calabuig G, Cordero PJ (2007) Increase of
heterozygosity in a growing population of lesser kestrels. Biol
Lett 3:585–588
Post E, Forchhammer MC (2008) Climate change reduces reproduc-
tive success of an Arctic herbivore through trophic mismatch.
Philos Trans R Soc B 363:2369–2375
Rodriguez C, Tapia L, Kieny F, Bustamante J (2010) Temporal
changes in Lesser Kestrel (Falco naumanni) diet during the
breeding season in Southern Spain. J Raptor Res 44:120–128
Rolland C, Danchin E, de Fraipont M (1998) The evolution of
coloniality in birds in relation to food, habitat, predation, and
life-history traits: a comparative analysis. Am Nat 151:514–529
Sachs LL, Hughes CR, Nuechterlein LG, Buitron D (2007) Evolution
of coloniality in birds: a test of the hypothesis with the
Rednecked Grebe (Podiceps grisegena). Auk 124:628–642
Sara M (2010) Climate and land-use changes as determinants of
Lesser Kestrel Falco naumanni abundance in Mediterranean
cereal steppes (Sicily). Ardeola 57:3–22
Sara M, Campobello D, Zanca L (2012) Effects of nest and colony
features on lesser kestrel (Falco naumanni) reproductive success.
Avian Biol Res 5:209–217
Serrano D, Tella JL (2007) The role of despotism and heritability in
determining settlement patterns in the colonial lesser kestrel. Am
Nat 169:E53–E67
Serrano D, Tella JL (2012) Lifetime fitness correlates of natal
dispersal distance in a colonial bird. J Anim Ecol 81:97–107
Serrano D, Tella JL, Forero MG, Donazar JA (2001) Factors affecting
breeding dispersal in the facultatively colonial lesser kestrel:
J Ornithol (2013) 154:901–910 909
123

individual experience vs. conspecific cues. J Anim Ecol
70:568–578
Serrano D, Forero MG, Donazar JA, Tella JL (2004) Dispersal and
social attraction affect colony selection and dynamics of Lesser
Kestrels. Ecology 85:3438–3447
Serrano D, Oro D, Ursua E, Tella JL (2005a) Colony size selection
determines adult survival and dispersal preferences: allee effects
in a colonial bird. Am Nat 166:22–31
Serrano D, Tella JL, Ursua E (2005b) Proximate causes and fitness
consequences of hatching failure in Lesser Kestrels Falco
naumanni. J Avian Biol 36:242–250
Statsoft Inc. (2001) STATISTICA for windows. Statsoft Inc, Tulsa,
OK
Stokes DL, Boersma PD (2000) Nesting density and reproductive
success in a colonial seabird, the Magellanic Penguin. Ecology
81:2878–2891
Terhune JM, Brillant SW (1996) Harbour seal vigilance decreases
over time since haul out. Anim Behav 51:757–763
Triolo S, Campobello D, Sara M (2011) Diurnal habitat suitability for
a Mediterranean steppeland bird, identified by Ecological Niche
Factor Analysis. Wildl Res 38:152–162
Underwood AJ (1997) Experiments in ecology. Their logical design
and interpretation using analysis of variance. Cambridge
University Press, Cambridge, UK
Varela SAM, Danchin E, Wagner RH (2007) Does predation select
for or against avian coloniality? A comparative analysis. J Evol
Biol 20:1490–1503
Wagner RH (1993) The pursuit of extra-pair copulations by female
birds: a new hypothesis of colony formation. J Theor Biol
163:333–346
Ward P, Zahavi A (1973) The importance of certain assemblages of
birds as ‘‘information-centres’’ for food finding. Ibis 115:517–
534
Weatherhead P (1983) Two principal strategies in avian communal
roosts. Am Nat 121:237–243
Westneat DF (1992) Nesting synchrony by female Red-winged
Blackbirds: effects on predation and breeding success. Ecology
73:2284–2294
Wissel C, Brandl R (1988) A model for the adaptive significance of
partial reproductive synchrony within social units. Evol Ecol
2:102–114
Zar JH (1999) Biostatistical analysis. Upper Saddle River, New Jersey
910 J Ornithol (2013) 154:901–910
123

40
Capitolo 2
Obiettivo 2: Effetti del disturbo antropico, dell’isolamento
spaziale e della dimensione della colonia sulla variabilità
genetica del Grillaio
Appendice 2: Di Maggio R., Mengoni C., Mucci N., Campobello D., Randi E., Sarà M.
2014. Do not disturb the family: roles of colony size and human disturbance in the
genetic structure of lesser kestrel. Journal of Zoology 295 (2), 108-115.

41
Introduzione
La comprensione dei meccanismi che influenzano la distribuzione degli animali gioca da
sempre un ruolo fondamentale in ecologia, specialmente quando gli individui occupano
ambienti disturbati e frammentati (Hanski, 1998). Da una prospettiva genetica, studi teorici
hanno suggerito che alleli dannosi possono accumularsi più frequentemente in popolazioni
piccole e isolate rispetto a quelle più grandi e non frammentate, aumentando la probabilità
di inbreeding e di estinzione (Saccheri et al., 1998; Madsen et al., 1999).
La dispersione e la filopatria sono meccanismi fondamentali in grado di influenzare
la struttura genetica delle popolazioni (Bank et al., 2002; Ando et al., 2011). La dispersione
tra le popolazioni mantiene alti livelli di flusso genico e previene l’inbreeding mentre la
filopatria conferisce familiarità con le aree di foraggiamento e con i conspecifici, evitando i
costi di uno spostamento (Dieckmann et al., 1999). La propensione alla dispersione e alla
filopatria può essere influenzata dall’isolamento e dalla frammentazione degli habitat. Questi
ultimi, insieme con il numero e la dimensione delle popolazioni possono determinare costi
genetici per le popolazioni, specialmente per le specie sociali (Temple et al., 2006).
Le specie coloniali mostrano generalmente un ampio range di dimensione della
colonia, anche all’interno della stessa popolazione, determinati dalla disponibilità di cibo e
di siti di nidificazione (Møller, 2002). Vivere in gruppo può innescare vantaggi in termini di
fitness come la riduzione del tempo speso dal singolo individuo nella vigilanza (Campobello
et al., 2012), o aumentare la probabilità di sopravvivenza (Di Maggio et al., 2013).
Nonostante ciò, la vicinanza con i conspecifici impone dei costi come l’intensificazione della
competizione per le risorse (Bonal & Aparicio, 2008; Calabuig et al., 2010) o la riduzione
della diversità genetica aumentando il rischio di accoppiamenti tra consanguinei (Serrano et
al., 2004).

42
I cambiamenti nell’uso del suolo e la frammentazione degli habitat rappresentano i
determinanti fondamentali dell’attuale declino della biodiversità a causa della riduzione,
distruzione e trasformazione degli habitat naturali (Bellia et al., 2011). La frammentazione
dell’habitat aumenta la differenziazione genetica delle popolazioni e l’effetto negativo della
deriva genetica riducendo la dispersione e aumentando la filopatria (Martinez-Cruz et al.,
2004). Per le specie coloniali che vivono in ambiente pseudosteppico, l’intensificazione delle
pratiche agricole (Sokos et al., 2013) può rappresentare un’altra causa della riduzione della
diversità genetica. Ad esempio, la rana Ascaphus montanus modifica la dispersione in
risposta al disturbo antropico (Spear & Storfer, 2010) ma nessuno ha ancora analizzato
l’influenza dell’intensificazione agricola sulla diversità genetica.
Il Grillaio (si vedano Materiali & Metodi per una descrizione della specie) è un
ottimo modello in cui analizzare gli effetti del disturbo antropico, della dimensione della
colonia e dell’isolamento spaziale sulla parentela genetica tra pulcini perché le popolazioni
sono costituite da molte colonie (Serrano et al., 2004; Sarà, 2010) ubicate in aree con un
differente grado di disturbo antropico (Sarà et al., 2012).
Gli obiettivi di questo capitolo sono: 1) studiare la struttura genetica di due sub-
popolazioni di Grillaio utilizzando la parentela tra pulcini e 2) valutare se la differenziazione
genetica e la parentela siano determinate dall’isolamento spaziale. Infine, per spiegare i
risultati ottenuti, ho verificato se il disturbo antropico, insieme con il numero e la vicinanza
dei conspecifici, potesse avere un effetto nel determinare la parentela all’interno e tra le
colonie. Per rispondere a queste domande, sono stati utilizzati i microsatelliti per descrivere
la diversità genetica e la parentela (Manel et al., 2003).

43
Materiali & Metodi
Quantificazione dei parametri coloniali
Lo studio è stato condotto tra Aprile e Luglio 2011. Per questo studio, sono state scelte due
colonie nell’area dei Sicani e otto colonie nella Piana di Gela (si vedano Materiali & Metodi
per una descrizione delle aree di studio) che rappresentano, rispettivamente, il 10 e il 10.4%
delle colonie totali conosciute (20 e 70, rispettivamente) nelle due aree.
Le colonie sono state visitate almeno tre volte durante la stagione riproduttiva. Ho
utilizzato un protocollo standardizzato (Di Maggio et al., 2013; Appendice 1) per raccogliere
i dati sulla biologia riproduttiva, sull’ecologia e sulla struttura delle colonie minimizzando
il disturbo ai nidi. Ho classificato ciascuna colonia in termini di dimensione e disturbo
antropico, mentre ciascun nido è stato caratterizzato in termini di isolamento spaziale. La
dimensione della colonia, definita come il numero di coppie residenti e nidificanti all’interno
delle colonie, è stabile negli anni di studio ( i.e.14 anni).
Il disturbo antropico è stato quantificato calcolando entro un raggio di 1 km da
ciascuna colonia la percentuale di strade, tessuto urbano e aree ad agricoltura intensiva (si
veda Appendice 2).
L’isolamento spaziale di ciascun nido è stato, invece, quantificato da due misure di
distanze lineari calcolate a differenti scale: distanze intra – e inter-colonia e posizione
geografica bidimensionale (2D) delle colonie. La prima misura lineare è la distanza tra un
nido e tutti gli altri all’interno di una colonia o tra colonie diverse delle Piana di Gela e dei
Sicani. Inoltre, il numero di coppie e la distanza all’interno della colonia sono stati combinati
insieme nel Neighbour Index (NI; Campobello & Hare, 2007) per fornire un misura
dell’interazione tra numero e prossimità dei conspecifici (si veda Appendice 1). Per calcolare
le distanze lineari e geografiche, ho registrato le colonie con un GPS e riportato le posizioni
sulle mappe di GoogleTM Earth.

44
Prelievi di sangue e analisi genetiche
Per i prelievi di sangue sui pulcini di Grillaio sono state utilizzate delle cartine FTATM
Classic Cards (Whatman®BioScience), che consentono di ottenere circa 100 L di sangue.
I campioni di sangue sono stati prelevati dalla vena brachiale dei pulcini.
Sono stati analizzati 70 pulcini: 12 appartenenti alla sub-popolazione dei Monti
Sicani e 58 alla sub-popolazione di Gela. Il DNA genomico è stato estratto dai campioni e
purificato con un kit ZR Genomic DNA II (Zymo Research).
I campioni sono stati genotipizzati utilizzando 12 marker microsatelliti specifici per
il Grillaio: FND1_2, FND1_4, FND1_5, FND1_6, FND1_7, FND1_8, FND2_1, FND2_2,
FND2_3, FND2_4, FND2_5, e FND2_6 (Ortego et al., 2008a). E’ stato utilizzato il seguente
protocollo di PCR: : un primo passaggio di denaturazione a 94°C per 3 min; 35 cicli a 94°C
per 40 s, 55°C per 40 s, e 72°C per 40 s; e un ciclo finale a 60°C per 30 min.
Il software Genalex 6.1 (Peakall & Smouse, 2006) è stato usato per stimare la
frequenza allelica per locus e per colonia, l’eterozigosità attesa e osservata, la deviazione
dall’equilibrio di Hardy – Weinberg, il numero medio di alleli per locus e il numero di alleli
privati per colonia. La struttura genetica delle colonie campionate è stata studiata utilizzando
il programma Structure 2.0 (Pritchard et al., 2000), e i grafici ottenuti con Structure
Harvester (Earl & vonHoldt, 2011).
Stima dei coefficienti di parentela
I coefficienti di parentela (n = 2415) stimati con Genalex rappresentano la parentela media
a coppie tra pulcini appartenenti a differenti colonie (inter –colonia, n = 2170), a nidi diversi
di una stessa colonia (intra – colonia, n = 214), e allo stesso nido (intra – nido, n = 31). Ho
testato la correlazione tra il logaritmo delle distanze lineari in metri e i coefficienti di
parentela (Excoffier et al., 1992) effettuando un Mantel test (1967) con il software RStudio
0.98 (pacchetto ade4, Chessel et al., 2004). Un primo Mantel test ha valutato la correlazione

45
tra la parentela e le distanze lineari tra le colonie dei Sicani e della Piana di Gela.
Successivamente, a causa dell’esiguo numero di campioni nella sub-popolazione dei Sicani,
ho effettuato un secondo Mantel test considerando esclusivamente le colonie di Gela.
Ho inoltre studiato la correlazione tra la parentela degli individui in relazione alla
posizione geografica delle colonie nella sub-popolazione di Gela (Double et al., 2005). Il
software Genalex ha calcolato un coefficiente di correlazione basato sulle posizioni 2D delle
colonie e il quadrato delle distanze genetiche. La matrice delle posizioni geografiche è stata
calcolata dalle coordinate X e Y di ciascuna colonia. Tutti gli individui appartenenti a una
colonia possedevano le stesse coordinate.
Infine, ho testato se la parentela intra – colonia fosse influenzata dalla dimensione
della colonia, dal NI e disturbo antropico con un modello lineare generalizzato e misto
(GLMM) (McCullagh & Searle, 2000). Per evitare fenomeni di pseudoreplicazione,
l’identità della colonia è stata inclusa come fattore random (Millar & Anderson, 2004). Le
analisi statistiche sono state effettuate con Statistica 8.0 (Statsoft).
Risultati
Sono stati caratterizzati geneticamente 70 pulcini di Grillaio per un totale di 12 microsatelliti.
Ciascun locus genico analizzato è risultato polimorfico con 63 alleli per la sub-popolazione
dei Sicani e 110 per quella della Piana di Gela. Il numero medio di alleli per locus è stato di
7.5 e andava da 5.2 (Sicani) a 9.1 (Piana di Gela). Il valore medio di eterozigosità è stato di
0.597 ± 0.05 (Media ± ES) e andava da 0.56 (Sicani) a 0.63 (Piana di Gela) e non differiva
tra le due sub-popolazioni (ANOVA, F1,22 = 0.53, P = 0.47). Sono stati ritrovati 53 alleli
privati per la Piana di Gela e solo cinque per la sub-popolazione dei Sicani. Questa differenza
è probabilmente dovuta al differente numero di campioni tra le due aree. Il test di Hardy –

46
Weinberg ha rilevato una deviazione significativa dall’equilibrio per un locus per i Sicani e
di cinque loci per la Piana di Gela.
L’ Fst medio è risultato molto basso (AMOVA, Fst = 0.025, p = 0.03), suggerendo
solo una trascurabile, sebbene significativa, differenza tra le sub-popolazioni. Come ci si
attendeva, la parentela tra pulcini appartenenti allo stesso nido (media ± ES, 0.438 ± 0.047;
n = 31) è risultata maggiore (unequal n Tukey HSD test, p< 0.001) sia di quella inter –
colonia (media ± ES, -0.033 ± 0.005; n = 2170) che di quella intra – colonia (media ± ES, -
0.001 ± 0.005; n = 214), mentre le parentele intra e inter – colonia non mostrano differenze
significative (unequal n Tukey HSD test, p = 0.383).
Il risultato del Mantel test non ha evidenziato differenze significative nella parentela
in relazione alle distanze lineari tra le 10 colonie della Piana di Gela e dei Sicani (r = 0.006,
p = 0.401; n = 45, basato su 9999 permutazioni).
L’analisi dettagliata della sub-popolazione della Piana di Gela ha confermato la
mancanza di differenze tra la parentela intra e inter – colonia (Fig. 1, Appendice 2). Inoltre,
un secondo Mantel test ha evidenziato una mancanza di correlazione tra le distanze lineari
tra le colonie e la parentela inter - colonia (r = -0.023, p = 0.522; n = 28, basato su 9999
permutazioni).

47
Fig. 1. Differente scala spaziale di parentela tra pulcini nella sub-popolazione della Piana di Gela. Nel
dettaglio: parentela inter-colonia (-0.029 ± 0.005, media ± ES), parentela intra-colonia (-0.026 ± 0.015) e
parentela all'interno del singolo nido (0.414 ± 0.041).
Contrariamente alle distanze lineari, l’analisi spaziale bidimensionale (2D; Fig.2,
Appendice 2) ha evidenziato la presenza di un cluster di colonie formante un hotspot (sensu
Peakall & Smouse, 2006) di individui geneticamente correlati.
Fig. 2. Risultati dell'analisi spaziale 2D che mostrano l'autocorrelazione genetica dei campioni appartenenti
alla sub-popolazione della Piana di Gela (2D LSA, P < 0.05). Gli asterischi indicano la presenza di un
cluster di autocorrelazione positiva tra le colonie.

48
I risultati del GLMM hanno evidenziato un effetto negativo sia della dimensione
della colonia che del disturbo antropico (Tabella 1, Fig. 3, Appendice 2) nel determinare la
parentale tra pulcini all’interno di una colonia, mentre sia la distanza intra –colonia che il NI
non sono risultati significativi (Tabella 1, Appendice 2).
Tabella 1. Risultati del GLMM che mostrano la relazione tra la parentela dei pulcini nella sub-
popolazione della Piana di Gela e 1) dimensione della colonia, 2) distanza intra-colonia, 3)
Neighbour Index e disturbo antropico (N= 180). In grassetto i valori significativi. Per evitare la
pseudoreplicazione, l'identità della colonia è stata inserita come fattore random.
F P
Parentela Intra-colonia
Intercetta 1.314 0.253
Dimensione della colonia 7.138 0.008
Distanza lineare 0.168 0.682
Neighbour index 0.908 0.342
Disturbo antropico 14.584 <0.001
Le 4 colonie raggruppate dall’analisi 2D presentano inoltre un indice di disturbo
antropico minore rispetto alle altre 4 colonie (2011, t = 744.95; p < 0.01; n = 8). Questo
risultato non dipende dalla dimensione della colonia dal momento che le colonie
appartenenti o meno al cluster sono costituite da un numero simile di coppie sia nell’anno di
studio (2011, t = 0.986, p = 0.362; n = 8) che nel precedente (2010, t = 0.556, p = 0.598; n
= 8). Ulteriori dettagli sono disponibili in Appendice 2.

49
Fig. 3. Relazione tra la dimensione della colonia (A; r2 = 0.038, P = 0.008), disturbo antropico (B; r2 = 0.
132, P < 0.001) e la parentela tra pulcini appartenenti alla sub-popolazione della Piana di Gela.
Discussione
L’analisi dei microsatelliti ha rivelato una elevata parentela tra pulcini appartenenti allo
stesso nido piuttosto che tra nidi differenti. Questo risultato conferma, come già evidenziato
in Spagna, anche per l’Italia la bassa incidenza di accoppiamenti al di fuori della coppia e
che quindi la monogamia effettiva è il sistema di accoppiamento realmente adottato da
questa specie (Alcaide et al., 2005). L’analisi genetica ha mostrato inoltre solo una leggera

50
differenziazione tra le due sub-popolazioni studiate e nessuna dipendenza dalla distanza
lineare tra colonie. I miei risultati sono in accordo con quelli riportati da Alcaide et al.,
(2009b) che mostra una bassa differenziazione genetica tra 4 distinte popolazioni di Grillaio
spagnole. E’ probabile infatti che pochi eventi di dispersione a lungo raggio siano sufficienti
per collegare geneticamente aree distanti e rendere omogenee le frequenze alleliche.
Similmente, i miei risultati possono essere spiegati dal fatto che le due aree di studio sono
distanti circa 110 km, un valore molto al di sotto della distanza massima di dispersione
giovanile fin qui registrata (136 km; Serrano et al., 2003).
Nelle colonie di Gela, le parentele intra e inter - colonia non differiscono
statisticamente. I Grillai adulti sono generalmente filopatrici al loro sito riproduttivo, mentre
i giovani tendono a disperdersi a breve distanza dalla loro colonia di nascita (Serrano et al.,
2003), con un range di dispersione equivalente alla distanza media tra le 77 colonie della
Piana di Gela (7 km). Questo network di colonie potrebbe favorire lo scambio di individui
tra le colonie e rendere omogenee le parentele e spiegare i risultati ottenuti.
L’analisi di isolamento spaziale della sub-popolazione di Gela rivela la presenza di
4 colonie con una elevata omogeneità genetica. Dixon et al., (2007) hanno descritto un
modello a isola per una popolazione di Orsi (Ursus americanus floridanus) che formavano
cluster genetici discreti. In accordo, i miei risultati indicano che il Grillaio potrebbe seguire
un pattern simile piuttosto che l’isolation – by – distance descritto da Ortego et al., (2008a,
b) e da Alcaide et al., (2009a).
Nella Piana di Gela, la parentela all’interno delle colonie è negativamente influenzata
dalla dimensione della colonia, con gli individui nati in colonie grandi meno imparentati
rispetto a quelli nati in colonie di piccole dimensioni. Nelle colonie piccole potrebbe arrivare
un ridotto numero di immigranti e questo, conseguentemente, potrebbe spiegare, insieme
con il comportamento filopatrico dei Grillai, la minore parentela nelle grandi colonie.
51
Inoltre, il disturbo antropico dovuto all’intensificazione delle pratiche è in grado di
spiegare il cluster di individui geneticamente simili precedentemente descritto. Le 4 colonie
formanti il cluster avevano il più basso livello di disturbo antropico nell’anno dello studio.
Nella Piana di Gela, queste colonie si trovano ai confini dell’area, rispetto alle altre 4 che
invece occupano la regione centrale (Sarà et al., 2012). E’ coerente con i risultati che un
aumento del disturbo dovuto alle pratiche agricole intensive vada a distruggere il
comportamento filopatrico precedentemente riportato per la specie (Ortego et al.,, 2008a)
allontanando gli individui dal loro sito di nascita e abbassando di conseguenza il livello di
parentela.
In conclusione, i risultati mostrano una ridotta differenziazione genetica su grande
scala geografica tra popolazioni di Grillaio nidificante in ambiente mediterraneo. A scala più
piccola, individui maggiormente imparentati nidificano in piccole colonie e formano cluster
nelle aree meno disturbate della Piana di Gela. Questo risultato induce a ipotizzare la
presenza su effetti a lungo termine sulla variabilità genetica di popolazione e come questi
possano apportare delle ripercussioni su sopravvivenza e dinamiche.

52
Bibliografia
Alcaide, M., Negro, J.J., Serrano, D., Tella, J.L. & Rodriguez, C. (2005) Extra-pair paternity
in the lesser kestrel Falco naumanni: a re-evaluation using microsatellite markers.
Ibis 147, 608–611.
Alcaide, M., Serrano, D., Negro, J. J., Tella, J. L., Laaksonen, T., Muller, C., Gal, A. &
Korpimaki, E. (2009a) Population fragmentation leads to isolation by distance but
not genetic impoverishment in the philopatric lesser kestrel: a comparison with the
widespread and sympatric Eurasian kestrel. Heredity 102, 190–198.
Alcaide, M., Serrano, D., Tella, J.L. & Negro, J.J. (2009b) Strong philopatry derived from
capture-recapture records does not lead to fine-scale genetic differentiation in lesser
kestrels. Journal of Animal Ecology 78, 468-475.
Ando, H., Kaneko, S., Suzuki, H., Horikoshi, K., Chiba, H. & Isagi, Y. (2011) Lack of
genetic differentiation among subpopulations of the black-footed albatross on the
Bonin Islands Journal of Zoology 283, 28-36.
Banks, S., Skerratt, L. & Taylor, A. (2002) Female dispersal and relatedness structure in
common wombats (Vombatus ursinus). Journal of Zoology 256, 389–399.
Bellia, E., Campobello, D. & Sarà, M. (2011) Great tit (Parus major) breeding in fire-prone
oak woods: differential effects of post-fire conditions on reproductive stages. Journal
of Wildlife Fire 20, 605-611.
Bonal, R. & Aparicio, J.M. (2008) Evidence of prey depletion around lesser kestrel Falco
naumanni colonies and its short term negative consequences. Journal of Avian Biology
39,189–197.

53
Calabuig, G., Ortego, J., Cordero, P.J. & Aparicio, J.M. (2010) Colony foundation in the
lesser kestrel: patterns and consequences of the occupation of empty habitat patches.
Animal Behaviour 80, 975–982.
Campobello, D. & Hare, J.F. (2007) Information transfer determined by association of
neighbours in European bee-eater (Merops apiaster) colonies. Ethology Ecology
Evolution 19, 237–243.
Campobello, D., Sarà, M. & Hare, J.F. (2012) Under my wing: lesser kestrels and jackdaws
derive reciprocal benefits in mixed species colonies. Behavioural Ecology 23, 425–
433.
Chessel, D., Dufour, A.B. & Thioulouse, J. (2004) The ade4 package-I- One-table methods.
R News 4, 5-10.
Dieckmann, U., O’Hara, B., & Weisser, W. (1999) The evolutionary ecology of dispersal.
Trends Ecology and Evolution 14, 88–90.
Di Maggio, R., Compobello, D. & Sarà, M. (2013) Nest aggregation and reproductive
synchrony promote lesser kestrel Falco naumanni seasonal fitness. Journal of
Ornithology 154, 901–910.
Dixon, J.D., Oli, M.K., Wooten, M.C., Eason, T.H., Mccown, J.W. & Cunningham, M.W.
(2007) Genetic consequences of habitat fragmentation and loss: the case of the Florida
black bear (Ursus americanus floridanus). Conservation Genetics 8, 455–464.
Double, M.C., Peakall, R., Beck, N.R., Cockburn, A. (2005) Dispersal, philopatry and
infidelity: dissecting local genetic structure in superb fairy-wrens (Malurus cyaneus).
Evolution 59(3), 625–635.
Earl, D. & von Holdt, B. (2011) Structure harvester: a website and program for visualizing
structure output and implementing the Evanno method. Conservation Genetics
Resources 4(2), 1-3.

54
Excoffier, L., Smouse, P. E., & Quattro, J. M. (1992) Analysis of molecular variance inferred
from metric distances among DNA haplotypes: application to human mitochondrial
DNA restriction data. Genetics 131(2), 479-91.
Hanski, I. (1998) Metapopulation dynamics. Nature 396, 41–49.
Madsen, T., Shine, R., Olsson, M. & Wittzell, H. (1999) Conservation biology: restoration
of an inbred adder population. Nature 402, 34–35.
Manel, S., Schwartz, M.K., Luikart, G., Taberlet, P. (2003) Landscape genetics: combining
landscape ecology and population genetics. Trends Ecology and Evolution 18, 189 –
197.
Mantel, N. (1967) The detection of disease clustering and a generalized regression approach.
Cancer Research 27, 209–220.
Martínez-Cruz, B., Godoy, J.A. & Negro, J.J. (2004) Population genetics after
fragmentation: the case of the Spanish imperial eagle Aquila adalberti. Molecular
Ecology 13, 2243–2255.
McCullagh, P. & Searle, S.R. (2000) Generalized Linear and Mixed Models. New York:
Wiley-Interscience.
Millar, R. & Anderson, M. J. (2004) Remedies for pseudoreplication. Fishery Research 70,
397-407.
Moller, A. P. (2002) Parent-offspring resemblance in degree of sociality in a passerine bird.
Behavioural Ecology and Sociobiology 51, 276–281.
Ortego, J., Calabuig, G., Aparicio, J.M. & Cordero, P.J. (2008a) Genetic consequences of
natal dispersal in the colonial lesser kestrel. Molecular Ecology 17, 2051–2059.
Ortego, J., Aparicio, J.M., Cordero, P.J. & Calabuig, G. (2008b) Individual genetic diversity
correlates with the size and spatial isolation of natal colonies in a bird metapopulation.
Proceedings of Royal Society London B. 275, 2039–2047.

55
Peakall, R. & Smouse, P.E. (2006) GENALEX 6: genetic analysis in Excel. Population
genetic software for teaching and research. Molecular Ecology Notes 6, 288-295.
Pritchard, J.K., Stephens, M. & Donnelly, P. (2000) Inference of population structure using
multilocus genotype data. Genetics 155, 945–959.
R Development Core Team (2008) R: A language and environment for statistical computing.
R Foundation for Statistical Computing, Vienna, Austria. ISBN 3-900051-07-0, URL
http://www.R-project.org.
RStudio (2012) RStudio: Integrated development environment for R (Version 0.96.122)
Boston: MA.
Saccheri, I., Kuussaari, M., Kankare, M., Vikman, P., Fortelius, W. & Hanski, I. (1998)
Inbreeding and extinction in a butterfly metapopulation. Nature 392, 491–494.
Sarà, M. (2010) Climate and land-use changes as determinants of lesser kestrel Falco
naumanni abundance in Mediterranean cereal steppes (Sicily). Ardeola 57, 3–22.
Sarà, M., Campobello, D. & Zanca, L. (2012) Effects of nest and colony features on lesser
kestrel (Falco naumanni) reproductive success. Avian Biology Research 5, 209–217.
Serrano, D., Tella, J.L., Donázar, J.A. & Pomarol, M. (2003) Social and individual features
affecting natal dispersal in the colonial lesser kestrel. Ecology 84, 3044–3054.
Serrano, D., Forero, M.G., Donazar, J.A. & Tella, J.L. (2004) Dispersal and social attraction
affect colony selection and dynamics of lesser kestrels. Ecology 85, 3438-3447.
Sokos, C.K., Mamolos, A.P., Kalburtji, K.L. & Birtsas, P.K. (2013) Farming and wildlife in
Mediterranean agroecosystems. Journal for Nature Conservation 21, 81– 92.
Spear, S.F. & Storfer, A. (2010) Anthropogenic and natural disturbance lead to differing
patterns of gene flow in the Rocky Mountain tailed frog, Ascaphus montanus.
Biological Conservation 143, 778–786.
Statsoft Inc. (2001) STATISTICA for Windows. Tulsa: Statsoft Inc.

56
Temple, H.J., Hoffman, J.I. & Amos, W. (2006) Dispersal, philopatry and intergroup
relatedness: fine-scale genetic structure in the whitebreasted thrasher, Ramphocinclus
brachyurus. Molecular Ecology 15, 3449–3458.

Do not disturb the family: roles of colony size and human
disturbance in the genetic structure of lesser kestrel
R. Di Maggio1, C. Mengoni2, N. Mucci2, D. Campobello1, E. Randi2,3 & M. Sarà1
1 Department of Biological, Chemical and Pharmaceutical Sciences and Technologies, University of Palermo, Palermo, Italy
2 Laboratorio di Genetica, Istituto per la Protezione e la Ricerca Ambientale (ISPRA), Bologna, Italy
3 Department 18/Section of Environmental Engineering, Aalborg University, Aalborg, Denmark
Keywords
lesser kestrel; genetic structure; colony
size; human disturbance; microsatellites.
Correspondence
Rosanna Di Maggio, Department of
Biological, Chemical and Pharmaceutical
Sciences and Technologies, University of
Palermo, Via Archirafi 18, Palermo 90123,
Italy. Tel: +39 3290842994
Email: [email protected];
Editor: Jean-Nicolas Volff
Received 8 April 2014; revised 25 July
2014; accepted 10 October 2014
doi:10.1111/jzo.12191
Abstract
Dispersal and philopatry are fundamental processes influencing the genetic struc-
ture and persistence of populations, and might be affected by isolation and habitat
perturbation. Habitat degradation induced by human activities could have detri-
mental consequences on the genetic structure of populations. Therefore, it is
crucial to understand the role of human impact in promoting or disrupting the
genetic structure. Here, we conducted a genetic analysis using 12 polymorphic
microsatellite markers of 70 lesser kestrels Falco naumanni from 10 breeding
colonies of two subpopulations in Sicily (southern Italy). Genetic differentiation
between the two subpopulations was negligible, and linear distances played no
role in the level of genetic relatedness recorded in the two sites. Linear distances
between nests also resulted in no effects on the relatedness recorded within and
between colonies in the largest subpopulation. Clusters of more-versus less-related
individuals resulted when the two-dimensional positions of colonies (i.e., latitude
and longitude) were tested as predictors of genetic proximity instead of linear
distances. Specifically, analyses of colony features showed colony size and human
disturbance as factors negatively affecting the relatedness among chicks from
different nests. Regardless of colony size, less-related individuals were born in
colonies located in the core of the agricultural plain, where we quantified a higher
level of human disturbance. In contrast, more related individuals were in colonies
located in the marginal, less disturbed, agricultural area. Given the high
philopatry of this species, our results are consistent with disruption of colony
fidelity related to intensification of agricultural practices. We discuss the possible
implications of long-term effects of genetic variability in small and disturbed
colonies on fitness and population viability.
Introduction
Understanding the mechanisms that influence animal distri-
bution plays a fundamental role in ecology, especially when
individuals occupy fragmented and disturbed environments
(Hanski, 1998). From a genetic perspective, theoretical studies
have suggested that deleterious alleles might accumulate more
frequently in small and isolated populations than in larger and
non-fragmented ones, increasing inbreeding and extinction
probabilities (Saccheri et al., 1998; Madsen et al., 1999).
Dispersal and philopatry are fundamental processes influ-
encing the genetic structure of populations (Banks, Skerratt &
Taylor, 2002; Ando et al., 2011). Dispersal among popula-
tions maintains a higher level of gene flow and prevents
inbreeding, whereas philopatry provides familiarity with for-
aging areas and conspecifics, avoiding travelling costs
(Dieckmann, O’Hara & Weisser, 1999). Dispersal and
philopatric predisposition might be affected by isolation and
habitat fragmentation. These two occurrences, together with
the number and size of populations may, in turn, result in
severe genetic costs of populations, especially in social species
(Frankham, Ballou & Briscoe, 2002; Temple, Hoffman &
Amos, 2006).
Colonial species typically show a wide range of colony sizes,
even within a single population, generally determined by food
or nest-site availability (Moller, 2002). Living in groups could
trigger fitness advantages such as reducing individual invest-
ment in vigilance (Campobello, Sarà & Hare, 2012), or
enhancing survival probability (Di Maggio, Campobello &
Sarà, 2013). Nevertheless, proximity with conspecific may
impose fitness costs via the intensification of competition for
resources (Bonal & Aparicio, 2008; Calabuig et al., 2010) or
depression of genetic diversity by increasing opportunities to
mate with kin (Serrano et al., 2004).
Land-use change and fragmentation represent major
drivers of the current decline in biodiversity because of the
bs_bs_bannerJournal of Zoology
Journal of Zoology. Print ISSN 0952-8369
Journal of Zoology •• (2014) ••–•• © 2014 The Zoological Society of London 1

destruction, reduction and transformation of natural habitats
(Bellia, Campobello & Sarà, 2011). A multi-scale level of
investigation has been recommended to understand the role of
human impact in promoting or disrupting the natural dynam-
ics of dispersal or philopatry of species (Simmons, 1996).
Habitat fragmentation enhances genetic differentiation of
populations and increases the negative effects of genetic drift
(Martinez-Cruz, Godoy & Negro, 2004) by reducing dispersal
or increasing philopatry. For colonial species living in steppe-
like habitats, intensification of farming practices (Sokos et al.,
2013) can be another potential driver of the reduction of
genetic diversity of populations as a result of land-use change.
Ascaphus montanus frogs modify their dispersal pattern in
response to human disturbance (Spear & Storfer, 2010), but
nobody, to our knowledge, has analysed the influence of land-
use intensification on genetic relatedness.
Lesser kestrel Falco naumanni is an excellent model species
in which to investigate the effects of anthropogenic disturb-
ance, colony size and spatial isolation on relatedness because
populations are composed of several colonies (Serrano et al.,
2004; Sarà, 2010) that persist in areas with different degrees of
disturbance (Sarà, Campobello & Zanca, 2012). Yet, colony
size is known to affect the reproductive success of lesser kes-
trels differently (Serrano et al., 2004; Calabuig et al., 2008),
and to enhance nestling survival via an interactive effect
between breeder abundance and nest distance (Di Maggio
et al., 2013). Although genetic consequences of dispersal, size
and spatial isolation of colonies of this species have been
studied in the Iberian Peninsula (Ortego et al., 2008a,b), they
are still completely unexplored in the remaining part of the
breeding range.
The aims of this study were to: (1) investigate the genetic
structure of two lesser kestrel subpopulations using nestling
relatedness; (2) evaluate whether a spatial pattern of genetic
differentiation might be described; (3) estimate the relation-
ship between nestling relatedness and spatial isolation.
Finally, to explain the obtained results, we verified whether
human disturbance, together with breeder abundance and
proximity, might have affected patterns of inter- and intra-
colony relatedness. Specifically, intensive agriculture in prox-
imity of colonies could influence nest success at various levels
(i.e., nest abandonment, eggs/chicks survival); therefore, alter-
ing the tendency of adults to return to the same site after a nest
success (Serrano et al., 2004). We hypothesized a negative
effect of disturbance on nestling relatedness as a result of the
disruption of philopatry previously reported in this species.
To address our questions, we used microsatellite markers to
describe individual genetic diversity and relatedness (Manel
et al., 2003).
Materials and methods
Study species
The lesser kestrel is a small raptor that lives in open and dry
cereal steppes of the Western Palaearctic and breeds in colo-
nies of two to 60 pairs (Catry et al., 2009). It is a secondary-
cavity nester, which finds its nests in cliff holes, wall crevices
and under roof tiles of rural buildings (Sarà et al., 2012).
After a sharp decline in the 1950s (Birdlife International,
2004), the lesser kestrel recently has had its conservation
status improved to ‘least concern’ because of conservation
actions (Iñigo & Barov, 2011). Lesser kestrels in Sicily (south-
ern Italy) are concentrated in two main subpopulations: one
in the Sicani area and the other, the largest in Sicily and
one of the most important in Italy, in the Gela Plain (Sarà,
2010; Sarà et al., 2014).
Study area
The Sicani area (37° 44′ N, 13° 19′ E) is located on the north-
western part of Sicily, with an altitude of 626.2 ± 34.93 m
[mean ± standard error () ] because of the presence of the
Sicani Mountains. Most of the area is composed of Mediter-
ranean xeric grasslands and wheat croplands, but large parts
of this habitat are now being replaced by intensive cultivations
(EEA, 2000). The Gela Plain in the south-eastern portion of
Sicily (474 km2, 37° 07′ N, 14° 19′ E) is 160.3 ± 14.27 m above
sea level, and is a mosaic of pseudo-steppes dominated by
artichoke (Cynara spp.) fields, wheat and leguminous cultiva-
tion (Triolo, Campobello & Sarà, 2011). Across the both
sample areas, several farmhouses and rural buildings host
numerous lesser kestrel nests inside wall crevices and under
roof tiles (Di Maggio et al., 2013).
Quantification of colony parameters
Investigations were conducted between April and July 2011.
For this study, we chose two colonies in the Sicani area and
eight colonies in the Gela Plain that represent, respectively, 10
and 10.4% of total known colonies (20 and 77, respectively) of
these two areas. The number of studied colonies mirrored the
different colony abundance and species occupancy within
each study area (Sarà, 2010), and therefore, the subsamples
were representative of the lesser kestrel subpopulations. We
visited each colony at least three times during the breeding
season. We used a standardized protocol (Di Maggio et al.,
2013) to collect data on reproductive biology and ecology and
colony structure by minimizing disturbance at the reproduc-
tive sites. We classified each colony in terms of size and human
disturbance, whereas each nest was characterized by a
measure of spatial isolation. Colony size, defined as the
number of resident pairs nesting within colonies, proved to be
stable across the long-term study period (i.e., 14 years, Sup-
porting Information, Table S1). We quantified human dis-
turbance in each colony as the percentage of roads, urban
networks and intensive cultivated areas within a 1-km radius.
We selected the following Corine Land Cover (EEA, 2000)
related to agricultural intensification and here indicated as
numbers in brackets according to a 3-level hierarchical classi-
fication system: urban fabric (1.1), road networks (1.2.2), per-
manent crops (2.2) and heterogeneous agricultural areas (2.4)
using ArcGIS 9.0 (ESRI, 2004). Spatial isolation of each nest
was quantified by two linear distance measurements deter-
mined at different scales: intra- and inter-colony distances and
by the two-dimensional (2-D) geographic position of colonies.
Factors affecting genetic structure of lesser kestrels R. Di Maggio et al.
2 Journal of Zoology •• (2014) ••–•• © 2014 The Zoological Society of London

The first linear measure was the distance between one nest and
all the others within the colony, while the inter-colony
distance was the linear measure between one colony and all
the others in both the Gela Plain and Sicani. Furthermore,
pair abundance and intra-colony distance were combined
together in a neighbour index (NI; Campobello & Hare, 2007)
to provide an interactive measure between number and prox-
imity of conspecifics (i. e. the higher the index, the more and
closer the pairs in proximity of the focal nest). To compute
linear and geographic distances among colonies, we recorded
coordinates of colonies with a Garmin (eTrex, Olathe, KS,
USA) global positioning system device and then reported their
positions on GoogleTM Earth maps (version 7.1, Google Inc.,
Mountain View, CA, USA).
Blood sample collection and
genetic analyses
To collect sufficient blood without causing stress to the nest-
lings, we used FTATM Classic Cards (Whatman® BioScience,
FTA™ Blood Collection Kit, Buckinghamshire, UK). They
are made of a chemically treated paper with a circle designed
to hold approximately 100 μL of blood, providing an effective
matrix to preserve blood for DNA analysis. The FTA paper
allowed us to store blood samples at room temperature
without any special precaution or contamination. Blood
samples (≈0.1 mL), obtained by puncture of the brachial vein
of nestlings, were placed on the FTA cards and then stored in
plastic bags until analysis.
We genotyped 70 lesser kestrel nestlings: 12 nestlings
belonging to the Sicani subpopulation and 58 to the Gela
Plain subpopulation. We used a ZR Genomic DNA II Kit
(Zymo Research, Irvine, CA, USA) to extract and purify
genomic DNA from the blood samples. The DNA samples
were genotyped across 12 polymorphic microsatellite markers
designed for F. naumanni species: FND1_2, FND1_4,
FND1_5, FND1_6, FND1_7, FND1_8, FND2_1, FND2_2,
FND2_3, FND2_4, FND2_5, and FND2_6 (Padilla et al.,
2009; Ortego et al., 2008a). We used GIMLET 1.33 (Valiere,
2002) to perform two independent polymerase chain reaction
(PCR) replicates to check the absence of allelic dropout or
false alleles. We used the following PCR protocol: an initial
denaturing step at 94°C for 3 min; 35 cycles at 94°C for 40 s,
55°C for 40 s, and 72°C for 40 s; and a final step at 60°C for
30 min. The PCR products were identified using an ABI
3130XL sequencer with GeneScanTM-350 ROX (Life Technol-
ogies, Carlsbad, CA, USA) as a marker ladder. Allele sizes
were scored with Genemapper 4.0 (Life Technologies).
GENALEX 6.1 (Peakall & Smouse, 2006) was used to esti-
mate allele frequency by locus and colony, observed and
expected unbiased heterozygosity, a chi-square test for devia-
tions from Hardy–Weinberg equilibrium (HWE), mean
number of alleles per locus, and number of private alleles per
colony. Partitions of genetic diversity within and among colo-
nies were computed by analysis of molecular variance
(AMOVA, Excoffier, Smouse & Quattro, 1992) using PhiPT
analogues of Wright’s (1965) F-statistics.
The genetic structure of the sampled colonies was inferred
using the Bayesian clustering procedures implemented in
STRUCTURE 2.0 (Pritchard, Stephens & Donnelly, 2000),
and graphs were obtained with STRUCTURE HAR-
VESTER (Earl & von Holdt, 2011). Structure was designed
to identify the K number of distinct genetic populations
(clusters) included in the sample, assuming HWE and linkage
equilibrium within each subpopulation, and to assign the
individuals to the inferred clusters. Burn-in periods of 30 000
steps followed by 100 000 Monte Carlo iterations were used
to obtain convergence of the parameter values. Explorative
analyses were performed first with K from 1 to 5 using all the
samples ignoring sample locations. All simulations were inde-
pendently replicated five times for each K, using the ‘admix-
ture’ and the ‘independent’ allele frequency models (Falush,
Stephens & Pritchard, 2003). The number of K populations
was set at the value that maximized the increase in the pos-
terior probability of the LnP(D) data according to the
formula [LnP (D) k − LnP (D) k − 1] (Garnier et al., 2004).
We examined genetic relatedness using the mean correlation
of genetic distances based on the estimator from Lynch &
Ritland (1999).
Modelling relatedness
Relatedness coefficients estimated by GENALEX repre-
sented the mean relatedness of pair-wise combinations of
nestlings from different colonies, from different nests within
the same colony, and within the same nest (n = 2,415). We
therefore distinguished these three relatedness values to
which, for brevity, we refer as inter-colony (n = 2,170), intra-
colony (n = 214) and intra-nest relatedness (n = 31), respec-
tively. We tested the correlations between the logarithm of
the linear distances in metres and PhiPT values (Excoffier
et al., 1992) by performing Mantel’s (1967) tests with the
software RStudio (2012) 0.98 (package ade4, Chessel,
Dufour & Thioulouse, 2004). An initial Mantel test evalu-
ated the correlation between relatedness and the correspond-
ing linear distances among the 10 colonies of Sicani and
Gela Plain subpopulations. Then, because of the small
sample size of the Sicani subpopulation, we focussed on the
Gela Plain subpopulation. In a second Mantel test, we fitted
PhiPT values measured among Gela Plain colonies with the
corresponding inter-colony linear distances. We also
explored the correlation of genetic similarity between pairs
of individuals in relation to their geographical positions in
the Gela subpopulation (Double et al., 2005). GENALEX
computed the autocorrelation coefficient r based on the 2-D
positions and squared genetic distance matrices (local spatial
autocorrelation). The geographical position matrix was cal-
culated from X- and Y-coordinates of each of the colonies
sampled in the Gela Plain. All individual residents in the
same colony were given identical coordinates.
Eventually, we tested whether intra-colony relatedness was
predicted by colony size, NI, and human disturbance by a
generalized linear mixed model (GLMM) (McCullagh &
Searle, 2000). In order to control for potential non-
independence of data represented by nestlings from the same
R. Di Maggio et al. Factors affecting genetic structure of lesser kestrels
Journal of Zoology •• (2014) ••–•• © 2014 The Zoological Society of London 3

colony and avoid pseudoreplication, colony identity was
included as a random effect (Millar & Anderson, 2004). Sta-
tistical analyses were performed with Statistica 8.0 (Statsoft
Inc, 2001).
Results
We genotyped 70 lesser kestrel nestlings and 12 overall
microsatellite markers. Each locus analysed was polymorphic
with 63 alleles for the Sicani subpopulation and 110 for the
Gela Plain subpopulation. The mean number of alleles per
locus was 7.5 and ranged from 5.2 (Sicani subpopulation)
to 9.1 (Gela Plain subpopulation). The mean value of
heterozygosity was 0.597 ± 0.05 (mean ± ) and ranged from
0.56 (Sicani) to 0.63 (Gela Plain), with no difference between
the two subpopulations (analysis of variance, F1,22 = 0.53,
P = 0.47). We found 53 private alleles for the Gela and five for
the Sicani subpopulations. This difference was probably
due to the different sample size between subpopulations.
Hardy–Weinberg tests showed a significant deviation from
equilibrium for one locus for the Sicani subpopulation and
five loci for the Gela Plain subpopulation.
Mean Fst values were very low (AMOVA, Fst = 0.025,
P = 0.03), suggesting only a negligible, although statistically
significant population differentiation. As expected, related-
ness between nestlings belonging to the same nest (mean ± ,
0.438 ± 0.047; n = 31) was higher [unequal n Tukey’s honest
significant difference (HSD) test, P < 0.001] than both
inter-colony (mean ± , −0.033 ± 0.005; n = 2,170) and
intra-colony relatedness (mean ± , −0.001 ± 0.005; n = 214),
whereas inter- and intra-colony relatedness showed no signifi-
cant difference (unequal n Tukey’s HSD test, P = 0.383).
The result of the Mantel test showed no significant differ-
ence in relatedness with respect to linear distance among the
10 colonies of the Gela Plain and Sicani subpopulations
(R = 0.006, P = 0.401; n = 45, based on 9 999 permutations).
The detailed analysis of the Gela Plain subpopulation con-
firmed that intra- and inter-colony relatedness did not differ
within and among colonies (Fig. 1). Furthermore, the Mantel
test again showed a lack of correlation between linear dis-
tances of colonies and inter-colony relatedness (R = −0.023,
P = 0.522; n = 28, based on 9,999 permutations). Contrary to
linear distances, the 2-D spatial analysis, employing latitude
and longitude (Fig. 2), showed the presence of a cluster of
colonies corresponding to a hotspot (sensu Peakall & Smouse,
2006) of genetically related individuals.
Results of the GLMM evidenced that colony size and the
human disturbance estimate both had a significant and nega-
tive effect (Table 1, Fig. 3) in determining intra-colony relat-
edness of nestlings, whereas intra-colony distance and NI did
not affect nestling relatedness (Table 1).
The four colonies clustered by the 2-D spatial analysis
proved to have a statistically lower human disturbance index
with respect to the other four colonies (2011, t = 744.95;
P < 0.01; n = 8). This result was not dependent on the effect of
Figure 1 Different spatial scales of nestling relatedness in the Gela
Plain subpopulation. In more detail: inter-colony relatedness (−0.029 ±
0.005, mean ± standard error), intra-colony relatedness (−0.026 ±
0.015) and intra-nest relatedness (0.414 ± 0.041).
Figure 2 Results of the 2-D spatial genetic
analysis showing heterogeneity in genetic
autocorrelation across the Gela Plain sub-
population (2-D local spatial autocorrelation,
P < 0.05). Asterisks indicate a cluster of high
positive autocorrelation among colonies.
Such a cluster of colonies is located at the
edge of the agricultural Gela Plain whereas
the other four colonies (i.e. colonies 2, 5, 6
and 7, respectively) insist in the core agricul-
tural area.
Factors affecting genetic structure of lesser kestrels R. Di Maggio et al.
4 Journal of Zoology •• (2014) ••–•• © 2014 The Zoological Society of London

colony size, as colonies within and outside the cluster were
composed of a similar number of breeding pairs both in the
year of the study (2011, t = 0.986, P 0.362; n = 8) and the
previous one (2010, t = 0.556, P = 0.598; n = 8).
Discussion
Microsatellite analysis revealed, as showed in Spanish popu-
lations, a higher relatedness between chicks belonging to the
same nest rather than between chicks of different nests. This
finding would confirm also the low incidence of extra-pair
paternity in lesser kestrels in southern Italy (Alcaide et al.,
2005). Genetic analyses showed only a slight genetic differen-
tiation between our sampled subpopulations that fell within
the range of values reported by Alcaide et al. (2009b). Nestling
relatedness was, furthermore, not dependent on linear dis-
tances among colonies within subpopulations. Our results are
consistent with Alcaide et al. (2009b), who showed low genetic
differentiation among four geographically distinct popula-
tions and argued that a few long-distance dispersal events are
sufficient to connect genetically distant patches and homog-
enize allele frequencies. Similarly, our low genetic differentia-
tion might be explained by the fact that the Gela Plain and
Sicani areas are approximately 110 km apart in distance, a
value well within the maximum juvenile dispersal found so far
(136 km; Serrano et al., 2003).
In Gela colonies, intra- and inter-colony relatedness did not
differ statistically. Adult lesser kestrels are philopatric to their
previous breeding colony, and first-time breeders tend to dis-
perse fairly close to their natal colony (Serrano et al., 2003),
with dispersal ranges equivalent to the average distance (7 km)
among the 77 colonies of the Gela Plain. Such close network
could facilitate exchange of individuals among colonies,
homogenize the degree of relatedness, and, therefore, explain
our results of comparable relatedness within and between
colonies. In addition, the lack of any correlation among linear
distance of colonies and nestling relatedness further suggested
a widespread gene flow. Either way, this lack of correlation is
in contrast to results found by Ortego et al. (2008b), where
lesser kestrels born in isolated colonies were genetically less
diverse. These colonies received a lower number of immi-
grants, supporting the idea that reduced gene flow was respon-
sible for the observed genetic pattern.
Spatial isolation analysis in the Gela Plain subpopulation
revealed a 2-D scale pattern of genetic differentiation, with
four colonies showing higher genetic similarity that clustered
together on the basis of their geographical position. Dixon
et al. (2007) suggested an island model for bear populations
Ursus americanus floridanus segregating in discrete genetic
clusters. Accordingly, our results indicated that lesser kestrel
subpopulations might follow a similar pattern rather than the
isolation-by-distance documented in Ortego et al. (2008a,b)
and Alcaide et al. (2009a).
In the Gela Plain, intra-colony relatedness of lesser kestrels
was negatively influenced by colony size; thus, individuals born
in larger colonies were less related than those born in smaller
ones. A lower number of immigrants could arrive at small
colonies, which, consequently, may have a lower chance of
being explored by prospectors (Calabuig et al., 2010). The
reduced number of potential immigrants, together with the
philopatric behaviour of kestrels, could explain why related-
ness is higher in small colonies than in large ones. Our results
are thus consistent with the observed positive relationship
Table 1 Generalized linear mixed model results showing the relation-
ship between nestling relatedness in the Gela Plain subpopulation and
colony size, intra-colony distance, neighbour index and human
disturbance (n = 180)
Intra-colony relatedness F P
Intercept 1.314 0.253
Colony size 7.138 0.008
Linear distance 0.168 0.682
Neighbour index 0.908 0.342
Human disturbance 14.584 <0.001
Significant predictor P-values are indicated in bold. Colony identity was
set as a random term to avoid pseudoreplication.
Figure 3 Relationships between colony size (a); r2 = 0.038, P = 0.008),
and human disturbance (b); r2 = 0.132, P < 0.001) with relatedness
among nestlings in the Gela Plain subpopulation.
R. Di Maggio et al. Factors affecting genetic structure of lesser kestrels
Journal of Zoology •• (2014) ••–•• © 2014 The Zoological Society of London 5

between individual genetic diversity and colony size (Ortego
et al., 2008b). In addition, neither the linear distance between
nests in the same colony side nor the NI seemed to influence
relatedness, suggesting that the main factors driving the genetic
structure of colonial breeders act especially at a colony scale.
We found that human disturbance caused by agricultural
intensification was able to explain the relatedness patterns
predicted by 2-D geographic position. Our results hence
provide a mechanism that might explain what was indicated
by Dharmarajan et al. (2014) and Banks et al. (2013), thus
that high levels of disturbance would promote lower related-
ness. The four colonies clustered by 2-D analysis had a lower
human disturbance estimate in the year of study. In the agri-
cultural plain, these colonies occur at the edge with respect to
the other four ones, categorized previously as insisting in the
agricultural core (Sarà et al., 2012). It is therefore consistent
with our results that increased disturbance, because of inten-
sification of agricultural practices, would disrupt the
philopatric behaviour reported in lesser kestrels (Ortego
et al., 2008a) by driving relatives away from their natal sites
with the consequent result of lower relatedness coefficients. If
human disturbance prevents philopatry, our result would be
consistent to imagine a paradoxical outcome where intense
agricultural activities improve gene flow in kestrel popula-
tions and, on the contrary, low human presence would
enhance inbreeding depression. However, gene flow among
our subpopulations could be determined by other factors
(i.e. immigration) acting alone or in interaction with human
disturbance.
In conclusion, our results showed that genetic differentia-
tion is low at a large geographical scale among populations of
lesser kestrels nesting in a southern Mediterranean area. At a
smaller spatial scale, we found evidence of more related indi-
viduals in small colonies and in clusters of colonies in the
least-disturbed area of the agricultural plain. Accordingly, a
topic to further address should examine what are the long-
term effects and the incidence of such atypical source of
genetic variability on population viability.
Acknowledgements
We thank Antonio Fulco, Rosario Mascara, Stefano Triolo,
Joëlle Tysseire and Laura Zanca for field assistance and
Joaquìn Ortego for useful comments on the paper. Language
was revised by Proof-Reading-Service.com. Funding was pro-
vided by the Italian Ministry of Education, University and
Research (PRIN 2010–2011, 20108 TZKHC). This study com-
plies with the current Italian laws regulating scientific research
on animals.
References
Alcaide, M., Negro, J.J., Serrano, D., Tella, J.L. &
Rodriguez, C. (2005). Extra-pair paternity in the lesser
kestrel Falco naumanni: a re-evaluation using microsatellite
markers. Ibis 147, 608–611.
Alcaide, M., Serrano, D., Negro, J.J., Tella, J.L., Laaksonen,
T., Muller, C., Gal, A. & Korpimaki, E. (2009a). Popula-
tion fragmentation leads to isolation by distance but not
genetic impoverishment in the philopatric lesser kestrel: a
comparison with the widespread and sympatric Eurasian
kestrel. Heredity 102, 190–198.
Alcaide, M., Serrano, D., Tella, J.L. & Negro, J.J. (2009b).
Strong philopatry derived from capture-recapture records
does not lead to fine-scale genetic differentiation in lesser
kestrels. J. Anim. Ecol. 78, 468–475.
Ando, H., Kaneko, S., Suzuki, H., Horikoshi, K., Chiba, H.
& Isagi, Y. (2011). Lack of genetic differentiation among
subpopulations of the black-footed albatross on the Bonin
Islands. J. Zool. 283, 28–36.
Banks, S., Skerratt, L. & Taylor, A. (2002). Female dispersal
and relatedness structure in common wombats (Vombatus
ursinus). J. Zool. 256, 389–399.
Banks, S.C., Cary, G.J., Smith, A.L., Davies, I.D., Driscoll,
D.A., Gill, A.M., Lindenmayer, D.A. & Peakall, R. (2013).
How does ecological disturbance influence genetic diversity?
Trends Ecol. Evol. 28, 670–679.
Bellia, E., Campobello, D. & Sarà, M. (2011). Great tit (Parus
major) breeding in fire-prone oak woods: differential effects
of post-fire conditions on reproductive stages. Int. J. Wildl.
Fire 20, 605–611.
Birdlife International (2004). Birds in Europe. Population esti-
mates, trends and conservation status. Cambridge: Birdlife
International.
Bonal, R. & Aparicio, J.M. (2008). Evidence of prey depletion
around lesser kestrel Falco naumanni colonies and its short
term negative consequences. J. Avian Biol. 39, 189–197.
Calabuig, G., Ortego, J., Aparicio, J.M. & Cordero, P.J.
(2008). Public information in selection of nesting colony by
lesser kestrels: which cues are used and when are they
obtained? Anim. Behav. 75, 1611–1617.
Calabuig, G., Ortego, J., Cordero, P.J. & Aparicio, J.M.
(2010). Colony foundation in the lesser kestrel: patterns
and consequences of the occupation of empty habitat
patches. Anim. Behav. 80, 975–982.
Campobello, D. & Hare, J.F. (2007). Information transfer
determined by association of neighbours in European
bee-eater (Merops apiaster) colonies. Ethol. Ecol. Evol. 19,
237–243.
Campobello, D., Sarà, M. & Hare, J.F. (2012). Under my
wing: lesser kestrels and jackdaws derive reciprocal benefits
in mixed species colonies. Behav. Ecol. 23, 425–433.
Catry, I., Alcazar, R., Franco, A.M.A. & Sutherland, W.J.
(2009). Identifying the effectiveness and constraints of con-
servation interventions: a case study of the endangered
lesser kestrel. Biol. Cons. 142, 2782–2791.
Chessel, D., Dufour, A.B. & Thioulouse, J. (2004). The ade4
package-I- One-table methods. R News 4, 5–10.
Dharmarajan, G., Beasley, J.C., Fike, J.A. & Rhodes, O.E. Jr.
(2014). Effects of landscape, demographic and behavioural
factors on kin structure: testing ecological predictions in a
mesopredator with high dispersal capability. Anim. Conserv.
17, 225–234.
Factors affecting genetic structure of lesser kestrels R. Di Maggio et al.
6 Journal of Zoology •• (2014) ••–•• © 2014 The Zoological Society of London

Di Maggio, R., Campobello, D. & Sarà, M. (2013). Nest
aggregation and reproductive synchrony promote lesser
kestrel Falco naumanni seasonal fitness. J. Ornithol. 154,
901–910.
Dieckmann, U., O’Hara, B. & Weisser, W. (1999). The
evolutionary ecology of dispersal. Trends Ecol. Evol. 14,
88–90.
Dixon, J.D., Oli, M.K., Wooten, M.C., Eason, T.H.,
McCown, J.W. & Cunningham, M.W. (2007). Genetic con-
sequences of habitat fragmentation and loss: the case of the
Florida black bear (Ursus americanus floridanus). Conserv.
Genet. 8, 455–464.
Double, M.C., Peakall, R., Beck, N.R. & Cockburn, A.
(2005). Dispersal, philopatry and infidelity: dissecting local
genetic structure in superb fairy-wrens (Malurus cyaneus).
Evolution 59, 625–635.
Earl, D. & von Holdt, B. (2011). Structure harvester: a
website and program for visualizing structure output and
implementing the Evanno method. Conserv. Genet. Resour.
4, 1–3.
ESRI. (2004). ArcGIS 9.0. Environmental Systems Research
Institute, Redlands, California, USA. Available at http://
www.esri.com
European Environmental Agency (EEA). (2000). Corine land
cover technical guide. Addendum. Available at http://
www.eea.europa.eu/publications/tech40add
Excoffier, L., Smouse, P.E. & Quattro, J.M. (1992). Analysis
of molecular variance inferred from metric distances among
DNA haplotypes: application to human mitochondrial
DNA restriction data. Genetics 131, 479–491.
Falush, D., Stephens, M. & Pritchard, J.K. (2003). Inference
of population structure using multilocus genotype data:
linked loci and correlated allele frequencies. Genetics 164,
1567–1587.
Frankham, R., Ballou, J.D. & Briscoe, D.A. (2002). Introduc-
tion to conservation genetics. Cambridge, UK: Cambridge
University Press.
Garnier, S., Alibert, P., Audiot, P., Prieur, B. & Rasplus, J.Y.
(2004). Isolation by distance and sharp discontinuities in
gene frequencies: implications for the phylogeography of an
alpine insect species, Carabus solieri. Mol. Ecol. 13, 1883–
1897.
Hanski, I. (1998). Metapopulation dynamics. Nature 396,
41–49.
Iñigo, A. & Barov, B. (2011). Action Plan for the lesser kestrel
Falco naumanni in the European Union. Madrid: SEO-
BirdLife & BirdLife International for the European
Commission.
Lynch, M. & Ritland, K. (1999). Estimation of pairwise
relatedness sample sizes in both accuracy and precision.
The upward with molecular markers. Genetics 152,
1753–1766.
Madsen, T., Shine, R., Olsson, M. & Wittzell, H. (1999).
Conservation biology: restoration of an inbred adder popu-
lation. Nature 402, 34–35.
Manel, S., Schwartz, M.K., Luikart, G. & Taberlet, P. (2003).
Landscape genetics: combining landscape ecology and
population genetics. Trends Ecol. Evol. 18, 189–197.
Mantel, N. (1967). The detection of disease clustering and a
generalized regression approach. Cancer Res. 27, 209–220.
Martinez-Cruz, B., Godoy, J.A. & Negro, J.J. (2004).
Population genetics after fragmentation: the case of the
Spanish imperial eagle Aquila adalberti. Mol. Ecol. 13,
2243–2255.
McCullagh, P. & Searle, S.R. (2000). Generalized linear and
mixed models. New York: Wiley-Interscience.
Millar, R. & Anderson, M.J. (2004). Remedies for
pseudoreplication. Fish. Res. 70, 397–407.
Moller, A.P. (2002). Parent–offspring resemblance in degree
of sociality in a passerine bird. Behav. Ecol. Sociobiol. 51,
276–281.
Ortego, J., Calabuig, G., Aparicio, J.M. & Cordero, P.J.
(2008a). Genetic consequences of natal dispersal in the
colonial lesser kestrel. Mol. Ecol. 17, 2051–2059.
Ortego, J., Aparicio, J.M., Cordero, P.J. & Calabuig, G.
(2008b). Individual genetic diversity correlates with the size
and spatial isolation of natal colonies in a bird
metapopulation. Proc. Biol. Sci. 275, 2039–2047.
Padilla, J.A., Parejo, J.C., Salazar, J., Martínez-Trancón, M.,
Rabasco, A., Sansinforiano, E. & Quesada, A. (2009). Iso-
lation and characterization of polymorphic microsatellite
markers in lesser kestrel (Falco naumanni) and cross-
amplification in common kestrel (Falco tinnunculus).
Conserv. Genet. 10, 1357–1360.
Peakall, R. & Smouse, P.E. (2006). GENALEX 6: genetic
analysis in Excel. Population genetic software for teaching
and research. Mol. Ecol. Notes 6, 288–295.
Pritchard, J.K., Stephens, M. & Donnelly, P. (2000). Inference
of population structure using multilocus genotype data.
Genetics 155, 945–959.
RStudio (2012). RStudio: integrated development environment
for R (version 0.96.122). Boston, MA. Available at http://
www.rstudio.org/.
Saccheri, I., Kuussaari, M., Kankare, M., Vikman, P.,
Fortelius, W. & Hanski, I. (1998). Inbreeding and
extinction in a butterfly metapopulation. Nature 392,
491–494.
Sarà, M. (2010). Climate and land-use changes as
determinants of lesser kestrel Falco naumanni abundance
in Mediterranean cereal steppes (Sicily). Ardeola 57,
3–22.
Sarà, M., Campobello, D. & Zanca, L. (2012). Effects of nest
and colony features on lesser kestrel (Falco naumanni)
reproductive success. Avian Biol. Res. 5, 209–217.
Sarà, M., Campobello, D., Zanca, L. & Massa, B. (2014).
Food for flight: pre-migratory dynamics of the lesser kestrel
Falco naumanni. Bird Study 61, 29–41.
Serrano, D., Tella, J.L., Donázar, J.A. & Pomarol, M. (2003).
Social and individual features affecting natal dispersal in
the colonial lesser kestrel. Ecology 84, 3044–3054.
R. Di Maggio et al. Factors affecting genetic structure of lesser kestrels
Journal of Zoology •• (2014) ••–•• © 2014 The Zoological Society of London 7

Serrano, D., Forero, M.G., Donazar, J.A. & Tella, J.L.
(2004). Dispersal and social attraction affect colony
selection and dynamics of lesser kestrels. Ecology 85,
3438–3447.
Simmons, I.G. (1996). Changing the face of the earth. Oxford:
Blackwell.
Sokos, C.K., Mamolos, A.P., Kalburtji, K.L. & Birtsas, P.K.
(2013). Farming and wildlife in Mediterranean
agroecosystems. J. Nat. Conserv. 21, 81–92.
Spear, S.F. & Storfer, A. (2010). Anthropogenic and natural
disturbance lead to differing patterns of gene flow in the
Rocky Mountain tailed frog, Ascaphus montanus. Biol.
Conserv. 143, 778–786.
Statsoft Inc (2001). STATISTICA for Windows. Tulsa:
Statsoft, Inc.
Temple, H.J., Hoffman, J.I. & Amos, W. (2006). Dispersal,
philopatry and intergroup relatedness: fine-scale genetic
structure in the whitebreasted thrasher, Ramphocinclus
brachyurus. Mol. Ecol. 15, 3449–3458.
Triolo, S., Campobello, D. & Sarà, M. (2011). Diurnal
habitat suitability for a Mediterranean steppeland bird,
identified by Ecological Niche Factor Analysis. Wildlife
Res. 38, 152–162.
Valiere, N. (2002). GIMLET: a computer program for analys-
ing genetic individual identification data. Mol. Ecol. Notes
2, 377–379.
Wright, S. (1965). The interpretation of population structure
by F-statistics with special regard to systems of mating.
Evolution 19, 395–420.
Supporting information
Additional Supporting Information may be found in
the online version of this article at the publisher’s
web-site:
Table S1. Results of Wilcoxon matched pairs test (t = 11.0,
P = 0.173, n = 10) that show the consistent size between each
colony size recorded in the study year (2011, Cs 2011) and
colony size mean recorded across the long-term study period
(i.e. from 2000 to 2014 except 2011, Cs study period) in the
Gela Plain and Sicani subpopulations.
Factors affecting genetic structure of lesser kestrels R. Di Maggio et al.
8 Journal of Zoology •• (2014) ••–•• © 2014 The Zoological Society of London

57
Capitolo 3
Obiettivo 3:Studio della probabilità di sopravvivenza e modello
demografico del Grillaio in ambiente pseudosteppico
Appendice 3: Di Maggio R., Tavecchia G., Campobello D., Sarà M. 2016. Habitat-
and density-dependent demography of a colonial raptor in Mediterranean agro-
ecosystems. Biological Conservation.

58
Introduzione
I cambiamenti dell’agricoltura, caratterizzati da un parte dall’intensificazione delle pratiche
agricole nelle aree pianeggianti e costiere e dall’altra dall’abbandono delle aree marginali e
meno produttive, stanno causando cambiamenti al paesaggio su scala globale (Donald et al.,
2001; Baldi et al., 2013; Pe’er et al., 2014). Tutto questo sta promuovendo sistemi agricoli
non idonei alla fauna (Brambilla et al., 2008), con la conseguente perdita di biodiversità in
tutta Europa soprattutto per quanto riguarda gli uccelli tipici delle aree agricole (Butler et
al., 2010; Sokos et al., 2013; Berg et al., 2015).
La politica agricola comune (PAC) attraverso gli schemi agro – ambientali (Agri-
Environmental Scheme - AES) fornisce gli strumenti a supporto delle azioni di
conservazione negli agro–ecosistemi e fa i conti con l’espansione del mercato dell’Unione
Europea (Stoate et al., 2009; Sokos et al., 2013). Anche se l’Unione Europea riconosce la
biodiversità come una priorità (European Commission, 2006), promuovendo l’agricoltura
biologica e la protezione degli ambienti rurali (Pe’er et al., 2014), l’intensificazione agricola
è ancora un processo in corso.
Modificazioni drammatiche si verificano nelle pseudosteppe del Mediterraneo,
hotspot di biodiversità (Myers et al., 2000), tra cui la riduzione dei margini tra i campi e delle
zone adibite a pascolo, la rimozione delle aree semi-naturali, l’aumento delle zone irrigue e
l’abuso di biocidi, i quali contribuiscono al declino degli uccelli e degli altri animali legati a
questi ambienti (Sirami et al., 2008; Gonzalez-Estebanez et al., 2011; Sokos et al., 2013;
Chiatante et al., 2014).
Molti autori hanno dimostrato che le specie coloniali di ambiente pseudosteppico
soffrono maggiormente l’attuale intensificazione delle pratiche agricole (Lane et al., 2001;
Catry et al., 2012). Il declino di queste specie di uccelli e i cambiamenti agricoli sono legati

59
da meccanismi densità-dipendenti in cui la dimensione della colonia gioca un ruolo cruciale
(Rodriguez et al., 2006).
E’ infatti plausibile che l’intensificazione delle pratiche agricole possa esacerbare
meccanismi densità-dipendenti tipici delle specie coloniali, di conseguenza le colonie più
grandi, caratterizzate da una maggiore richiesta di cibo e da maggiori interazioni agonistiche
(Serrano & Tella, 2007), potrebbero essere più vulnerabili alla riduzione della disponibilità
di cibo in un ambiente agricolo in rapido cambiamento. In altre parole, la relazione tra
cambiamenti agricoli e dimensione della colonia può avere serie implicazioni per la
comprensione delle dinamiche di popolazione negli uccelli coloniali che vivono in ambiente
pseudosteppico.
Ho quindi analizzato come diversi habitat agricoli e la dimensione della colonia
potessero influenzare l’andamento demografico del Grillaio che nidifica in un ambiente
pseudosteppico del Sud-Italia. Il Grillaio è un modello appropriato per lo studio delle
relazioni tra specie e habitat in quanto indicatore biologico per il monitoraggio delle
dinamiche di popolazione delle specie pseudosteppiche (Bustamante, 1997).
Nello specifico, ho volutoμ i) quantificare l’effetto dell’uso del suolo sulla fecondità
e sulla probabilità di sopravvivenza e la sua potenziale interazione con la dimensione della
colonia; ii) identificare quale componente demografica avesse il peso maggiore nel
determinare il tasso di accrescimento della popolazione e iii) fornire linee guida di
conservazione per migliorare l’idoneità degli habitat per una delle più grandi popolazioni
Italiane di Grillaio.

60
Materiali & Metodi
Durante le stagioni riproduttive 2004 -2012 (con esclusione del 2008), una media di 14 ± 4
(range 8 – 24; n = 28) colonie per anno sono state visitate nella Piana di Gela. La Piana, sin
dal 1950, è caratterizzata da numerosi casolari e ruderi, parzialmente distrutti e abbandonati
che ospitano attualmente l’84% delle colonie di Grillaio nell’area (Sarà, 2010). Le visite alle
colonie sono state condotte periodicamente, dall’occupazione dei siti e deposizione delle
uova (Aprile – Maggio), all’incubazione e schiusa (Maggio – Giugno) fino all’involo dei
pulcini (Giugno – Luglio). Durante queste visite, sono stati catturati gli adulti nei nidi
accessibili, registrati i parametri riproduttivi e inanellati i pulcini con anelli metallici e
colorati per la lettura a distanza.
Nello stesso periodo, da due a quattro osservatori hanno condotto sessioni di rilettura
degli anelli colorati degli uccelli inanellati negli anni precedenti della durata di un’ora per
colonia con cannocchiali 20 x 60. Ogni anno, gli stessi osservatori hanno condotto due o tre
sessioni di rilettura al mese in tre dormitori (un albero di pino e due piloni dell’elettricità)
dove la maggior parte della popolazione si ritrova durante la notte. Una doppia osservazione
degli stessi uccelli, nel dormitorio e nelle colonie, ha provato che molti individui nidificanti
passando la notte al di fuori della colonia. Ho inoltre calcolato lo sforzo di rilettura come il
numero di giorni passati in campo ogni anno, e questa variabile è stata utilizzata come
predittore della probabilità di ricattura.
Caratterizzazione della tipologia di habitat
La Piana di Gela (si veda Materiali & Metodi), a causa delle limitate precipitazioni, è
composta da un mosaico di pseudosteppe dominato da campi di carciofo (Cynara spp.), in
rotazione con grano (Triticum spp.) e aree adibite a incolto e pascolo (80.9%, Sarà, 2010).
Attualmente, l’intensificazione agricola sta rapidamente cambiando l’area della Piana
mediante la semina di colture irrigue dopo la raccolta del carciofo.

61
Una Analisi delle Componenti Principali è stata usata per riassumere le caratteristiche
essenziali dell’uso del suolo entro un raggio di 1 km intorno alle colonie (Bonal & Aparicio,
2008). I risultati indicano che le colonie sono circondate da uno delle tre tipologie di habitat:
arato, incolto e carciofeto e di conseguenza ho assegnato ciascuna colonie a uno di questi tre
habitat per le successive analisi di sopravvivenza e di demografia (Soliveres et al., 2011).
Probabilità di sopravvivenza e di ricattura
Abbiamo classificato ciascuna ricattura o rilettura per ogni anno assegnando un valore “1”
quando l’animale veniva osservato e “0” quanto non veniva osservato (Burnham et al.,
1987). Ho utilizzato i modelli di cattura – marcaggio – ricattura per stimare la probabilità di
sopravvivenza (φ) e di ricattura (p) (Burnham et al., 1987).
Gli uccelli sono stati suddivisi in sei gruppi in accordo con l’età di marcatura (due
gruppi, inanellati da pulcini “J” e da adulti “A”) e in base all’habitat in cui sono stati
inanellati (tre livelli: arato, carciofeto e incolto, denominati ARA, ART e GRA
rispettivamente). Per gli uccelli inanellati da pulcini, ho considerato anche due classi di età,
fino a un anno e oltre un anno di età, denominati “Age” nella notazione dei modelli. Circa il
70% degli uccelli inanellati come nidificanti sono fedeli al sito riproduttivo. Il basso livello
di dispersione è congruo con i risultati provenienti da altre popolazioni (Serrano et al., 2001).
Inoltre, nessun caso di emigrazione verso popolazioni confinanti è stato evidenziato durante
lo studio, nonostante specifici monitoraggi di colonie al di fuori della Piana di Gela.
Oltre all’effetto dell’età e dell’habitat, ho considerato due variabili continue come
predittori della sopravvivenza e della probabilità di ricattura, rispettivamente: i) dimensione
della colonia (“Cs” nella notazione dei modelli) per verificare gli effetti densità-dipendenti,
e ii) lo sforzo di ricattura, definito come il logaritmo decimale del numero di giorni di
osservazione o di cattura effettuati ogni anno alle colonie di Grillaio (“Re” nei modelli) e
usato per valutare lo sforzo di campionamento.

62
Il primo passo dell’analisi di sopravvivenza è stato un test di bontà di adattamento
(Goodness-of-fit test, GOF) del modello generale Cormack-Jolly-Seber (CJS) con il
software U-CARE 2.3 (Choquet et al., 2009). Il modello CJS assume che tutti i parametri
varino nel tempo, di conseguenza, è stato introdotto un fattore con nove livelli corrispondenti
agli anni di studio, sia per gli uccelli marcati da pulcini che per quelli marcati da adulti. Il
GOF test include componenti sensibili a varie forme di eterogeneità come l’età, la presenza
di animali inanellati e mai più riletti (Test 3SR) o una differente sensibilità alla cattura (Test
2CT; Tavecchia et al., 2008). Ho quindi considerato un set di modelli che sono stati
contemporaneamente comparati e classificati con l’ Akaike Information Criterion corretto
per piccoli campioni (AICc; Burnham & Anderson, 2002; Grueber et al., 2011). Il modello
con l’AICc più basso è considerato quello che fornisce il miglior compromesso tra la
devianza del modello e la sua complessità. I modelli che differivano per meno di 2 punti di
AICc sono stati considerati equivalenti (Burnham & Anderson, 2002; Grueber et al., 2011).
In aggiunta all’AICc, ho stimato anche la devianza dei modelli e il peso dei predittori, che
stimano l’importanza relativa di ciascuna variabile nei modelli e sono ottenuti sommando i
valori di AICc di tutti i modelli in cui la variabile compare (Symonds & Moussalli, 2011).
Tutte le analisi sono state effettuate con il programma MARK 7.1 (White & Burnham, 1999).
Fecondità
Dati sulla riproduzione del Grillaio sono stati raccolti dal 2004 al 2012 (con eccezione del
2008). La Fecondità, i.e. il numero di pulcini involati per nido, è stata studiata in funzione
dell’habitat (tre livelli), del tempo (nove livelli) e della dimensione della colonia usando
modelli lineari generalizzati e misti (GLMM) con una distribuzione di Poisson e con
l’identità dell colonia come fattore random (McCullagh & Searle, 2000; Zuur et al., 2013).
Ho effettuato tutte le analisi di fecondità in R 3.0.2 (R Core Team, 2011) con il
pacchetto lme4 (Bates et al., 2013). Sia la fecondità che la sopravvivenza variano al variare

63
della dimensione della colonia (vedi risultati). Di conseguenza, sono stati standardizzati
[valore della variabile, v = (v – min v)/(max v – min v)] per consentire una diretta
comparazione nella stessa scala con la dimensione della colonia (Milligan & Cooper, 1988).
Modello di popolazione
Per stimare il tasso di accrescimento della popolazione in ciascun habitat, ho modificato il
modello di popolazione precedentemente riportato per la specie da Hiraldo et al. (1996) e da
Rodriguez & Bustamante (2003) considerando un campionamento post-riproduttivo. La
formula generale del modello è la seguente:
Nt+1=MNt
dove M è la matrice che incorpora dati sulla fecondità e sulle probabilità di
sopravvivenza dei pulcini e degli adulti in un dato habitat (Caswell, 2001). Nt è un vettore
costituito dal numero di individui in ciascuna classe di età al tempo t. Nel modello sono stati
inclusi inoltre un parametro relativo al numero di giovani e di adulti che hanno provato a
riprodursi negli anni di studio, “C0” e “C” rispettivamente.
Per ciascun habitat, ho calcolato il tasso di accrescimento della popolazione ( ) e la
sensibilità di alle variazioni dei parametri demografici (Caswell, 2001). L’analisi di
sensibilità stima quale parametro demografico ha l’impatto maggiore sul tasso di
accrescimento della popolazione (Caswell, 2001). I modelli di popolazione sono stati
analizzati usando il pacchetto popbio (Stubben & Milligan, 2007) per il programma R (R
Core Team, 2011). Tutti i risultati ottenuto sono mostrati come media ± l’errore standard.
Risultati
Sono state analizzate 2103 riletture/ricatture di Grillai marcati da pulcini e 175 di Grillai
marcati da adulti. Il GOF test è risultato non significativo (GOF χ2 = 41.50, df = 73, p =

64
0.99), dimostrando che i dati seguono gli assunti generali del modello CJS. Tre modelli sono
rientrati all’interno di due punti di AICc e di conseguenza sono stati considerati equivalenti.
Tutti e tre i modelli includono un effetto dell’habitat sulla sopravvivenza dei giovani e degli
adulti. Grillai vissuti o nati in colonie circondate da un habitat arato avevano una probabilità
di sopravvivenza più bassa di quei Grillai in colonie circondate da carciofeto o incolto
(Modelli 1-3, Tabella 1, Appendice 3).

65
Tabella 1 Modelli di probabilità di sopravvivenza e di ricattura di Grillai giovani (φJu and pJu) e adulti (φAd and pAd) inanellati in colonie appartenenti ad
habitat differenti (arato, carciofeto e incolto) della Piana di Gela. Solo i primi dieci modelli sono stati riportati. Notazione dei modelli: dimensione della colonia
(Cs), tempo (t) età (Age), habitat: arato (ARA), carciofeto (ART) e incolto (GRA), costante (.), sforzo di ricattura (Re).
Modelli Sopravvivenza Ricattura AICc ΔAICc AICc w Devianza N Par
1 φJ (ARA + ART = GRA+ t + Age), φA. (ARA + ART = GRA) pJ (Re) pA(Re) 1772.6 0 0.35 1732.2 20
2 φJ (ARA + ART=GRA + t + Age + Cs), φA. (ARA + ART = GRA) pJ (Re) pA(Re) 1773.9 1.36 0.18 1731.5 21
3 φJ (ARA + ART + GRA + t + Age), φA. (ARA + ART = GRA) pJ (Re) pA(Re) 1774.4 1.88 0.14 1732.1 21
4 φ J (ARA+ ART = GRA + t + Age + Cs), φA. (ARA + ART = GRA +Cs) pJ (Re) pA(Re) 1774.8 2.23 0.11 1730.4 22
5 φJ (ARA + ART+ GRA + t + Age), φA. (ARA+ ART + GRA) pJ (Re) pA(Re) 1775.4 2.88 0.08 1731.0 22
6 φJ (ARA = ART = GRA + t + Age), φA. (ARA + ART = GRA) pJ (Re) pA(Re) 1776.8 4.22 0.04 1738.5 19
7 φJ (ARA = GRA+ART + t + Age), φA. (ARA+ ART = GRA) pJ (Re) pA(Re) 1776.8 4.24 0.04 1736.5 20
8 φJ (ARA = ART + GRA + t + Age), φA. (ARA + ART = GRA) pJ (Re) pA(Re) 1777.7 5.11 0.03 1737.3 20
9 φJ (ARA = ART = GRA + t +Age), φA. (ARA + ART + GRA) pJ (Re) pA(Re) 1777.8 5.21 0.03 1737.4 20
10 φJ (ARA = GRA +ART + t + Age), φA. (ARA + ARA = GRA) pJ (Re) pA(Re) 1787.5 14.89 0 1747.1 20

66
Gli ultimi due habitat presentavano gli stessi effetti sulla sopravvivenza dei
giovani e degli adulti e sono stati trattati insieme nelle analisi successive. La probabilità
di sopravvivenza media degli adulti è stata di 0.30 ± 0.08 nelle colonie circondate da
arato, di 0.75 ± 0.07 in carciofeto, e di 0.66 ± 0.07 in colonie circondate da incolto.
Similmente, la probabilità di sopravvivenza dei giovani è stata più bassa nelle colonie
circondate da arato (0.13 ± 0.05) rispetto al carciofeto (0.23 ± 0.07) e all’incolto (0.21 ±
0.07; Fig. 1, Appendice 3).
Fig. 1. Probabilità di sopravvivenza dei giovani di Grillaio nella Piana di Gela in relazione all’anno e all’habitat.
Nel caso dei giovani, i modelli in Tabella 1 includono un effetto dell’anno e
dell’età insieme all’habitat. Inoltre, il secondo modello include anche un effetto positivo
della dimensione della colonia sulla loro sopravvivenza (w = 0.29, predittore lineare:
0.012 ± 0.14 dal modello 2, Fig. 2, Appendice 3).
Per quanto riguarda la probabilità di ricattura, gli adulti avevano una probabilità
di essere riletti/ricatturati quasi tre volte superiore (0.18 ± 0.04) a quella dei giovani (0.07
± 0.02).

67
Fig. 2. Relazione tra la dimensione della colonia e la probabilità di sopravvivenza dei giovani (Modello
2, Tabella 1, N = 2103, punti neri) e la fecondità (Modello 1, Tabella 2, N=1001, punti bianchi).
Fecondità
Nell’analisi sulla fecondità, il modello migliore prevede un effetto significativo dell’anno
con una diminuzione del numero di pulcini da 3.5 ± 0.19 nel 2004 a 1.4 ± 0.10 nel 2012.
Contrariamente all’analisi di sopravvivenza, l’effetto dell’habitat sul numero di pulcini
involati non è risultato significativo e il modello migliore con l’AICc più basso (Modello
1, Tabella 2, Appendice 3) spiega la fecondità esclusivamente in funzione della
dimensione della colonia (Fig. 2, Tabella 2, Appendice 3). Nell’area di studio, una
dimensione della colonia di circa 18-20 coppie risulterebbe ottimale per raggiungere un
compromesso tra fecondità e sopravvivenza dei giovani.

68
Tabella 2 Risultati del GLMM in cui sono stati testati gli effetti della dimensione della colonia,
dell’habitat e dell’anno sulla fecondità (n = 1001 nidi). In grassetto il modello con il valore di
AIC più basso. La colonia è stata inserita come fattore random. L’effetto interattivo è stato
indicato con * e l’effetto additivo con +; N Par = numero di parametri nel modello.
Rank Modelli AIC ΔAIC AIC w N Par
1 Fecondità ~ Anno + Dimensione colonia 3679.5 0 0.619 2
2
Fecondità ~ Anno + Dimensione colonia *
Habitat 3681.0 1.5 0.293 3
3
Fecondità ~ Anno + Dimensione colonia +
Habitat 3683.4 3.9 0.088 3
4 Fecondità ~ Habitat + Anno 3696.9 17.4 0.000 2
5 Fecondità ~ Anno 3793.4 113.9 0.000 1
6 Fecondità ~ Dimensione colonia 3848.4 168.9 0.000 1
7 Fecondità ~ Habitat + Dimensione colonia 3851.6 172.1 0.000 2
8 Fecondità ~ Habitat 3884.4 204.9 0.000 1
Modello di popolazione
Come detto precedentemente, le colonie circondate da incolto e carciofeto sono state
trattate insieme per il calcolo del tasso di accrescimento di popolazione. Il tasso di
accrescimento di popolazione ( ) per le colonie in arato è stato di 0.38 ± 0.01, mentre per
le colonie in carciofeto e incolto è stato di 0.77 ± 0.02 (Fig. 3, Appendice 3).

69
Fig. 3. Tasso di accrescimento della popolazione di Grillaio nel 2004-2012 (con eccezione del 2008) per
gli habitat carciofeto, incolto e arato.
L’analisi di sensibilità ed elasticità ha indicato che il tasso di accrescimento della
popolazione risultava maggiormente sensibile alla sopravvivenza degli adulti seguita da
quella dei giovani in tutti e tre gli habitat (Tabella 3).

70
Tabella 3 Sensibilità ed elasticità del tasso di accrescimento della popolazione alle differenti
componenti del modello demografico nei tre differenti habitat.
Definizione Sensitività Elasticità
A) Arato
Fecondità giovani C0FS0 0.034 <0.001
Fecondità adulti CFSad 0.249 0.140
Probabilità sopravvivenza giovani S0 0.597 0.141
Probabilità sopravvivenza subadulti Ssub 0.096 0.140
Probabilità di sopravvivenza adulti Sad 0.717 0.576
B) Carciofeto e Incolto
Fecondità giovani C0FS0 0.014 <0.001
Fecondità adulti CFSad 0.116 0.074
Probabilità sopravvivenza giovani S0 0.396 0.075
Probabilità sopravvivenza subadulti Ssub 0.103 0.074
Probabilità di sopravvivenza adulti Sad 0.851 0.776
Discussione
In questo capitolo i dati ottenuti dalle riletture e ricatture degli individui sono stati
utilizzati per identificare gli effetti dell’uso del suolo sulla probabilità di sopravvivenza e

71
fecondità del Grillaio. Sia la sopravvivenza che la probabilità di ricattura cambiano
positivamente con l’età (si veda anche Prugnolle et al., 2003). Questo è probabilmente
dovuto a un accesso alla riproduzione dipendente dall’età (Serrano & Tella, 2007), e
dall’effetto delle piogge annuali nelle aree di svernamento africane che determinano una
mortalità età-dipendente (Minhoub et al., 2010).
Effetto della dimensione della colonia sulla demografia del Grillaio
La socialità negli uccelli è caratterizzata da un complesso pattern di costi e benefici
(Danchin & Wagner, 1997; Di Maggio et al., 2013), il cui bilanciamento determina la
variazione della dimensione della colonia (Brown et al., 2000). I miei risultati confermano
il ruolo importante della dimensione della colonia nell’influenzare le dinamiche di
popolazione del Grillaio, tipico uccello coloniale pseudosteppico.
I Grillai che vivono in grandi colonie acquisiscono dei benefici che superano i
costi dell’aumento della competizione delle risorse (Bonal & Aparicio, 2008) e
dell’aumento del rischio di trasmissione di parassiti (Serrano et al., 2004). Tra i benefici
vediamo la riduzione del rischio di predazione (Serrano et al., 2005) e la riduzione
dell’investimento individuale nella vigilanza (Campobello et al., 2012). Inoltre la
dimensione della colonia è in grado di regolare i meccanismi di dispersione in cui il
numero di conspecifici viene utilizzato come indicatore della qualità delle colonie
(Serrano et al., 2001; Serrano & Tella, 2003).
Pressioni selettive opposte agiscono per esempio, nelle Sterne Comuni, Sterna
hirundo, dove le colonie di maggiori dimensioni promuovono una elevata sopravvivenza
ma riducono la qualità dei pulcini (Minias et al., 2015). Analogamente, è stato identificato
un effetto opposto della dimensione della colonia sulla sopravvivenza dei giovani Grillai
e sulla fecondità. Nei giovani, la dimensione della colonia determina un effetto positivo
sulla sopravvivenza; nonostante ciò, il numero di conspecifici ha un effetto negativo sulla

72
fecondità con il numero di pulcini involati che diminuisce nelle colonie di grandi
dimensioni. I miei risultati indicano un compromesso tra la probabilità di sopravvivenza
e la fecondità, con un ridotto numero di pulcini ma di elevata qualità (i.e. con un vantaggio
nella sopravvivenza) nelle grandi colonie. E’ stato inoltre possibile stabilire un valore
medio di dimensione della colonia (i.e.18-20 coppie) che rappresenta un buon
compromesso fra fecondità e sopravvivenza e che potrà essere usato come baseline per
esperimenti futuri.
Effetto dell’uso del suolo sulla demografica del Grillaio
In questo studio l’uso del suolo ha un effetto molto forte nel determinare la probabilità di
sopravvivenza degli adulti e il tasso di accrescimento della popolazione. Gli adulti che
vivevano in colonie circondate da incolto e carciofeto avevano il 50% di probabilità in
più di sopravvivere rispetto ai conspecifici che vivevano in colonie circondate da arato. I
campi di carciofi e gli incolti hanno caratteristiche molto diverse tra loro ma determinano
la stessa sopravvivenza degli adulti. Gli incolti, inclusi i margini e i pascoli, sono tipici
elementi dell’agricoltura tradizionale estensiva, particolarmente importanti per i Grillai
(Franco et al., 2004) e per la fauna in generale (Moreira et al., 2005; Zamora et al., 2007).
Al contrario, i campi di carciofo sono una coltura tipica dell’area di studio, e
rappresenta un habitat di foraggiamento inusuale per i Grillai (García et al., 2006; Catry
et al., 2014). Le dinamiche temporali di coltivazione del carciofo lo rendono
probabilmente idoneo per il Grillaio. Durante l’inverno, quando i Grillai sono assenti
dall’area, i carciofi sono caratterizzati da una intensa attività antropica relativa alla
preparazione del campo, all’impianto dei carciofi e all’uso di fertilizzanti e biocidi (Lo
Giudice et al., 2014). I campi vengono poi abbandonati a fine aprile dopo la raccolta delle
piante e successivamente usati dai Grillai come terreni di caccia.

73
Al contrario, i campi di cereali determinavano la più bassa sopravvivenza dei
Grillai, confermando la cattiva qualità di questo habitat. Questo è probabilmente dovuto
all’altezza della copertura vegetazionale che determina un difficile accesso alle prede
insieme con l’utilizzo di macchinari per la semina e l’aratura che contribuiscono a ridurre
la biomassa presente nel terreno (Garcia et al., 2006; Catry et al., 2012). Solo durante la
mietitura, i cereali rappresentano una buona area di foraggiamento a causa dell’aumento
improvviso, ma di breve durata, della disponibilità di cibo (Catry et al., 2014).
Gestione e conservazione degli habitat agricoli
I valori calcolati di sopravvivenza e fecondità nella Piana di Gela predicono un declino
della popolazione. Come suggerito già da Hiraldo et al. (1λλ6), l’andamento demografico
del Grillaio è guidato dalla classe degli adulti. Di conseguenza, le azioni di conservazione
che si basano sui fattori che determinano la sopravvivenza degli adulti sarebbero le più
mirate per una corretta gestione della popolazione (Ehrlén et al., 2001; Sarà et al., 2014).
La sopravvivenza degli adulti nell’incolto e nel carciofeto (0.66-0.75) assume valori
comparabili con le altre popolazioni europee di Grillaio (0.67-0.72: Hiraldo et al., 1996;
Prugnolle et al., 2003; Serrano et al., 2005). Al contrario, la sopravvivenza degli adulti
nelle colonie circondate da arato (0.30) è la più bassa finora riscontrata nella specie.
Inoltre, il tasso di accrescimento di popolazione indica un trend negativo di tutta la
popolazione in ogni habitat, sebbene più marcato nell’arato.
Di conseguenza, la strategia di conservazione più efficace dovrebbe agire sulle
cause dirette della mortalità degli adulti, ritornando a pratiche agricole estensive come
quelle osservate all’inizio dello studio. In aggiunta, dovrebbero essere considerati gli
effetti positivi di colture non tradizionali come il carciofo nella Piana di Gela o l’alfaalfa
(Medicago sativa) in Spagna (Ursua et al., 2005). Queste azioni di conservazione
74
dovrebbero essere comprese in una AES in modo da ridurre l’intensificazione agricola e
il disturbo antropico e aumentare l’eterogeneità degli habitat.
Bibliografia
Baldi, A., Batary, P., Kleijn, D. (2013) Effects of grazing and biogeographic regions on
grassland biodiversity in Hungary – analysing assemblages of 1200 species.
Agricultural Ecosystems and Environment 166, 28-34.
Bates, D., Maechler, M., Bolker B. (2013) lme4: Linear-mixed Effects Models Using S4
Classes. Available at: http://cran.r-project.org/package=lme4.
Berg, A., Wretenberg, J., Zmihorski, M., Hiron, M., Pärt, T. (2015) Linking occurrence
and changes in local abundance of farmland bird species to landscape
composition and land-use changes. – Agricultural Ecosystems and Environment
204, 1-7.
Bonal, R., Aparicio, J.M. (2008) Evidence of prey depletion around lesser kestrel Falco
naumanni colonies and its short term negative consequences. Journal of Avian
Biology 39,189-197.
Brambilla, M., Guidali, F., Negri, I. (2008) The importance of an agricultural mosaic for
Cirl Buntings Emberiza cirlus in Italy. Ibis 150, 628-632.
Brown, C.R , Brown, M.B.B., Danchin, E. (2000) Breeding habitat selection in cliff
swallows: the effect of conspecific reproductive success on colony choice.
Journal of Animal Ecology 69, 133-142.
Burnham, K.P., Anderson, D.R. (2002) Model selection and multimodel inference: a
practical information-theoretic approach. Springer Verlag.

75
Burnham, K.P., Anderson, D.R., White, G.C., Brownie, C., Pollock, K.H. (1987) Design
and analysis of fish survival experiments based on capture-release. American
Fishery Society Monograph 5, 1-437.
Bustamante, J. 1997. Predictive models for lesser kestrel Falco naumanni distribution,
abundance and extinction in southern Spain. Biological Conservation 80, 153-
160.
Butler, S. J., Boccaccio, L., Gregory, R. D., Vorisek, P., Norris, K. (2010) Quantifying
the impact of land-use change on European farmland bird
populations. Agricultural Ecosystems and Environment 137, 348-357.
Campobello, D., Sarà, M., Hare, J.F. (2012) Under my wing: lesser kestrels and jackdaws
derive reciprocal benefits in mixed species colonies. Behavioural Ecology 23,
425-433.
Caswell, H. (2001) Matrix population models: Construction, analysis, and interpretation.
Sinauer Associates.
Catry, I., Amano, T., Franco, A.M.A., Sutherland, W.J. (2012) Influence of spatial and
temporal dynamics of agricultural practices on the lesser kestrel. Journal of
Applied Ecology 49, 99-108.
Catry, I., Franco, A.M.A.,Moreira, F. (2014) Easy but ephemeral food: exploring the
trade-offs of agricultural practices in the foraging decisions of lesser kestrels on
farmland. Bird Study 1, 1-10.
Chiatante, G., Brambilla, M., Bogliani, G. (2014) Spatially explicit conservation issues
for threatened bird species in Mediterranean farmland landscapes. Journal for
Nature Conservation 22, 103-112.

76
Choquet, R., Lebreton, J.D., Gimenez, O., Reboulet, A.M., Pradel, R. (2009) U-CARE:
utilities for performing goodness of fit tests and manipulating capture-recapture
data. Ecography 32, 1071–1074.
Danchin E., Wagner R.H. (1997) The evolution of coloniality: the emergence of new
perspectives. Trends Ecology and Evolution 12,342-347.
Donald, P.F., Green, R.E., Heath, M.F. (2001) Agricultural intensification and the
collapse of Europe’s farmland bird populations. Proceedings Royal Society
London B. 268, 25-29.
Ehrlén, J., van Groenendael, J., de Kroon, H. (2001) Reliability of elasticity analysis:
reply to Mills et al., Conservation Biology 15, 278-280.
Franco, A.M.A., Catry, I., Sutherland, W.J., Palmeirim, J. (2004) Do different habitat
preference methods produce the same conservation recommendations for lesser
kestrels? Animal Conservation 7, 291-300.
García, J. T., Morales, M. B., Martínez, J., Iglesias, L., García de la Morena, E., Suárez,
F.,Viñuela, J. (2006) Foraging activity and use of space by lesser kestrel Falco
naumanni in relation to agrarian management in central Spain. Bird
Conservation International 16, 83-95.
González-Estébanez, F.J., García-Tejero, S., Mateo-Tomás, P., Olea, P.P. (2011) Effects
of irrigation and landscape heterogeneity on butterfly diversity in Mediterranean
farmlands. Agricultural Ecosystems and Environment 144, 262-270.
Grueber, C.E., Laws, R.J., Nakagawa, S., Jamieson, I.G. (2011) Multimodel inference in
ecology and evolution: challenges and solutions. Journal of Evolutionary
Biology 24, 699-711.

77
Hiraldo, F., Negro, J.J., Donázar, J.A., Gaona, P. (1996) A demographic model for a
population of the endangered lesser kestrel in southern Spain. Journal of Animal
Ecology 33, 1085-1093.
Lane, S.J., Alonso, J.C., Martin, C.A., (2001) Habitat preferences of great bustard Otis
tarda flocks in the arable steppes of central Spain: are potentially suitable areas
unoccupied? Journal of Applied Ecology 38, 193-203.
Lo Giudice, A., Mbohwa, C., Clasadonte, M.T., Ingrao, C. (2014) Life Cycle Assessment
Interpretation and Improvement of the Sicilian Artichokes Production.
International Journal of Environmental Research 8, 305-316.
McCullagh, P., Searle, S.R. (2000) Generalized Linear and Mixed Models. Wiley-
Interscience.
Milligan, G.W., Cooper, M.C. (1988) A study of standardization of variables in cluster
analysis. Journal of Classification 5, 181-204.
Mihoub, J., Gimenez O., Pilard, P., Sarrazin, F. (2010) Challenging conservation of
migratory species: Sahelian rainfalls drive first-year survival of the vulnerable
Lesser Kestrel Falco naumanni. Biological Conservation 143, 839-847.
Minias, P., Włodarczyk, R., Janiszewski, T. (2015) Opposing selective pressures may act
on the colony size in a waterbird species. Evolutionary Ecology 29, 283-297.
Moreira, F., Beja, P., Morgado, R., Reino, L., Gordinho, L., Delgado, A., Borralho, R.
(2005) Effects of field management and landscape context on grassland
wintering birds in Southern Portugal. Agricultural Ecosystems and Environment
109, 59-74.

78
Myers, N., Mittermeier, R.A., Mittermeier, C.G., da Fonseca, G.A.B., Kent, J. (2000)
Biodiversity hotspots for conservation priorities Nature 403, 853-858.
Pe’er, G., Dicks, L.V., Visconti, P., Arlettaz, R., Báldi, A., Benton, T.G., Collins, S.,
Dieterich, M., Gregory, R.D., Hartig, F., Henle, K., Hobson, P. R., Kleijn, D.,
Neumann, R.K., Robijns, T., Schmidt, J., Shwartz, A., Sutherland, W.J., Turbe,
A., Wulf, F., Scott, A.V. (2014) EU agricultural reform fails on biodiversity.
Science 344, 6188.
Prugnolle, F., Pilard, P., Brun, L., Tavecchia, G. (2003) First-year and adult survival of
the endangered lesser kestrel Falco naumanni in southern France. Bird Study
50, 68-72.
R Development Core Team (2011) R: a language and environment for statistical
computing. R Foundation for Statistical Computing, Vienna, Austria.
Rodríguez, C., Bustamante, J. (2003) The effect of weather on lesser kestrel breeding
success: can climate change explain historical population declines? –Journal of
Animal Ecology 72, 793-810.
Rodrıguez, C., Johst, K., Bustamante, J. (2006) How do crop types influence breeding
success in lesser kestrels through prey quality and availability? A modelling
approach. Journal of Applied Ecology 43, 587-597.
Sarà, M. (2010) Climate and land-use changes as determinants of lesser kestrel Falco
naumanni abundance in Mediterranean cereal steppes (Sicily). Ardeola 57, 3-22.
Sarà, M., Campobello, D., Zanca L., Massa B. (2014) Food for flight: pre-migratory
dynamics of the lesser kestrel Falco naumanni. Bird Study 61, 29-41.

79
Serrano, D., Tella, J.L., Forero, M.G., Donázar J.A. (2001) Factors affecting breeding
dispersal in the facultatively colonial lesser kestrel: individual experience vs.
conspecific cues. Journal of Animal Ecology 70, 568-578.
Serrano, D., Forero, M.G., Donázar, J.A., Tella, J.L. (2004) The role of dispersal and
conspecific cues on breeding site selection and colony dynamics of lesser
kestrels. Ecology 85, 3438-3447.
Serrano, D., Oro, D., Ursua, E., Tella, J.L. (2005) Colony size selection determines adult
survival and dispersal preferences: Allee effects in a colonial bird. American
Naturalist 166, 22-31.
Serrano, D., Tella, J.L. (2003) Dispersal within a spatially structured population of lesser
kestrels: the role of spatial isolation and conspecific attraction.–Journal of
Animal Ecology 72,400-410.
Serrano, D.,Tella, J.L. (2007) The Role of Despotism and Heritability in Determining
Settlement Patterns in the Colonial Lesser Kestrel. American Naturalist 169, 53-
67.
Symonds, M.R.E., Moussalli, A. (2011) A brief guide to model selection, multimodel
inference and model averaging in behavioural ecology using Akaike’s
Information Criterion. Behavioural Ecology and Sociobiology 65, 13-21.
Sirami, C., Brotons, L., Burfield, I., Fonderflick, J., Martin, J. L. (2008) Is land
abandonment having an impact on biodiversity? A meta-analytical approach to
bird distribution changes in the north-western Mediterranean. Biological
Conservation 141, 450-459.

80
Sokos, C.K., Mamolos, A. P., Kalburtji, K.L., Birtsas, P.K. (2013) Farming and wildlife
in Mediterranean agroecosystems. Journal for Nature Conservation 21, 81-92.
Soliveres, S., García-Palacios, P., Castillo-Monroy, A.P., Maestre, F.T., Escudero, A.,
Valladares, F. (2011) Temporal dynamics of herbivory and water availability
interactively modulate the outcome of a grass-shrub interaction in a semi-arid
ecosystem. Oikos 120, 710-719.
Stoate, C., Báldi, A., Beja, P., Boatman, N.D., Herzon, I., van Doorn, A., de Snoo, G.R.,
Rakosy, L., Ramwell, C., (2009) Ecological impacts of early 21st century
agricultural change in Europe – a review. Journal of Environmental Management
91, 22-46.
Stubben, C.J., Milligan, B.G. (2007) Estimating and analyzing demographic models using
the popbio package in R. Journal of Statistical Software 22, 1-23.
Tavecchia, G., Minguez, E., De León, A., Louzao, M., Oro, D. (2008) Living close, doing
differently: small-scale asynchrony in demography of two species of seabirds.
Ecology 89, 77-85.
Ursua, E., Serrano, D., Tella, J.L. (2005) Does land irrigation actually reduce foraging
habitat for breeding lesser kestrels? The role of crop types. Biological
Conservation 122, 643-648.
White, G.C., Burnham, K.P. (1999) Program MARK: survival estimation from
populations of marked animals. Bird Study 46, 120-129.
Zamora, J., Verdù, J.R., Galante, E. (2007) Species richness in Mediterranean agro-
ecosystems: spatial and temporal analysis for biodiversity conservation.
Biological Conservation 134, 113-121.

81
Zuur, A.F., Hilbe, J. M., Ieno, E. (2013) A Beginner's Guide to GLM and GLMM with
R: a frequentist and Bayesian perspective for ecologists. Highland Statistics.

Habitat- and density-dependent demography of a colonial raptor inMediterranean agro-ecosystems
Rosanna Di Maggio a,⁎, Daniela Campobello a, Giacomo Tavecchia b, Maurizio Sarà a
a Section of Animal Biology, Dept. STEBICEF— University of Palermo, Via Archirafi 18, Palermo, Italyb Population Ecology Group, IMEDEA (CSIC-UIB), c. M. Marquès 21, 07190 Esporles, Spain
a b s t r a c ta r t i c l e i n f o
Article history:
Received 12 April 2015
Received in revised form 31 October 2015
Accepted 11 November 2015
Available online xxxx
Keywords:
Agricultural intensification
Capture–recapture model
Colony size
Farmland birds
Land-use
Lesser kestrel
Agricultural intensification is considered the major cause of decline in farmland bird populations, especially in
the Mediterranean region. Food shortage increased by the interaction between agricultural intensification and
density-dependentmechanisms could influence the population dynamics of colonial birds.Weused demograph-
ic data on lesser kestrels (Falco naumanni), a key species ofMediterranean pseudo-steppes, to understand the im-
portance of land-use changes and density-dependent mechanisms in the light of its fluctuating conservation
status in the Western Palearctic. Our analysis indicated an important influence of land uses (artichokes, arable
and grassland fields) and colony size on kestrel survival rates. The strong habitat effect revealed the unsuitability
of intensive arable lands with respect to extensive grasslands for lesser kestrels. Notably, artichokes, a winter-
intensive crop, proved to be a high-quality habitat as they were associated with survival values equal to those
of grassland. This is likely due to prey availability and reveals that non-traditional crops may provide suitable
habitats for lesser kestrels. Information theory gave strong support to the negative influence of colony size on fe-
cundity, albeit a small one, for its positive effect on survival probability. The estimated population growth rate
was negative for all three habitats, indicating a decline over time and urging conservation actions in all of the
areas studied. This decline was much higher in colonies surrounded by arable fields. In sensitivity analyses, λ in-
dicated that adult survival was the parameterwith the greatest effect on population growth, followed by survival
offledglings and fecundity. Our study showed how the costs and benefits of group living interact with agricultur-
al intensification to drive species demography. In addition, we integrated significant information on one of the
largest lesser kestrel populations to fine tune the most effective conservation strategy to prevent the collapse
of the species in a relevant part of its range.
© 2015 Elsevier Ltd. All rights reserved.
1. Introduction
The polarization of agriculture, with the intensification of farming
practices in flat and coastal areas and the abandonment of less produc-
tive and marginal lands, is causing great landscape changes on a global
scale (Donald et al., 2001; Baldi et al., 2013; Pe'er et al., 2014). This po-
larization is promoting wildlife-unfriendly farming systems (Brambilla
et al., 2008), with a consequent loss of biodiversity in Europe, especially
in regard to farmland birds (Butler et al., 2010; Sokos et al., 2013; Berg
et al., 2015). Common Agricultural Policy (CAP) through the agri-
environmental schemes (AES) provides the major mechanisms to sup-
port conservation actions in agro-ecosystems and faces the challenges
of the expansion of the EU common market (Stoate et al., 2009; Sokos
et al., 2013). Even if the EU recognizes biodiversity as a priority and
modifies agricultural policies to stop and reverse the biodiversity loss
(European Commission, 2006), agricultural intensification is still an
ongoing process. The reformed CAP for 2014-20 provided new environ-
mental prescriptions such as organic farming and protection of tradi-
tional rural landscape, which have been argued to be too weak to
benefit biodiversity (Pe'er et al., 2014).
Dramatic modifications occurred in Mediterranean pseudo-steppes,
a global biodiversity hotspot (Myers et al., 2000), such as the reduction
in fallow land and field margins, removal of semi-natural patches, in-
crease in irrigated lands, and abuse of biocides, all of which seem to con-
tribute to the decline of farmland birds and other wildlife (Sirami et al.,
2008; Gonzalez-Estebanez et al., 2011; Sokos et al., 2013; Chiatante
et al., 2014).
It has been suggested that avian species breeding in pseudo-steppes
and aggregating in breeding colonies would suffer the most from
the current intensification of farming practices (Lane et al., 2001;
Catry et al., 2012). The causal link between the decline of such avian
species and agricultural changes has been proposed to operate via
density-dependent mechanisms, where colony size plays a crucial role
(Rodrıguez et al., 2006). In many cases, spatial arrangement between
food and nest-site availability determines the number of breeders with-
in colonies, i.e. colony size (Rodrıguez et al., 2006). Moreover, food
Biological Conservation 193 (2016) 116–123
⁎ Corresponding author.
E-mail address: [email protected] (R. Di Maggio).
http://dx.doi.org/10.1016/j.biocon.2015.11.016
0006-3207/© 2015 Elsevier Ltd. All rights reserved.
Contents lists available at ScienceDirect
Biological Conservation
j ourna l homepage: www.e lsev ie r .com/ locate /b ioc

depletion due to intraspecific competition, a density-dependent mech-
anism, regulates colony size and, ultimately, the population growth
rate (Lewis et al., 2001; Forero et al., 2002). It is thus likely that agricul-
tural intensificationwould exacerbate density-dependent effects, so we
might expect large colonies, characterized by higher food demand and
increased levels of agonistic interactions (Serrano and Tella, 2007), to
be more vulnerable to food depletion when placed in fast changing
agro-ecosystems. In other words, the relationship between agricultural
changes and colony size may have serious implications, still poorly
known, for the understanding of population dynamics in colonial birds
living in a pseudo-steppe habitat.
Here, we investigate how different agricultural habitats and colony
sizes may drive the demography of the colonial lesser kestrel Falco
naumanni, breeding in a pseudo-steppe of southern Italy. The lesser
kestrel is an appropriatemodel for the study of species–habitat relation-
ships because of its role as biological indicator for the monitoring of
population dynamics of pseudo-steppe avian species (Bustamante,
1997). The demography of lesser kestrel populations was first investi-
gated in Spain (Hiraldo et al., 1996)with the aim of estimating the prob-
ability of species extinction and evaluating different management
actions. Monitoring lesser kestrel populations beyond the Iberian
peninsula might provide further indications for preserving steppe wild-
life and setting management strategies applicable not only on the local
but also on the regional scale within Europe (Kolb, 2000; Sarà, 2010).
The species has recently been downgraded from the ‘Vulnerable’
to the ‘Least Concern’ IUCN category (Iñigo and Barov, 2011) but popu-
lation trends are highly variable across its range, including local cases
of population decline (Iñigo and Barov, 2011). In reality, where man-
agement measures were applied, the lesser kestrel has improved its
conservation status (Catry et al., 2012), while in areas of the Palearctic
range (e.g. Italy), without effective conservation strategies, populations
are fluctuating (Sarà, 2010). To allow full conservation recovery across
the range, it would be necessary to identify, assess, and ultimately pre-
vent the factors affecting the lesser kestrel's fluctuating demography,
especially in rapidly human-altered environments and in the light of
the six-year reporting cycle under Article 12 of the Birds Directive
2009/147/EC and the 2020 review of the European lesser kestrel Action
Plan.
In this study, we aimed to i) quantify the effect of land uses on fecun-
dity and survival probability, and its potential interaction with colony
size; ii) identify which demographic component was more important
in determining the population growth rate; and iii) provide conserva-
tion guidelines to improve habitat suitability for one of the largest
Italian populations of lesser kestrels.
Lesser kestrels tend to forage close to the breeding colony (García
et al., 2006). As a consequence, we expect a direct influence of habitat
around the colonies on survival and fecundity. In particular, we expect
both parameters to be higher in territories characterized by extensive
agriculture with expected high food availability (García et al., 2006).
Previous works have found higher survival probability in large colonies
compared with medium or small ones and concluded that colony size
was the causative factor (see, for example, Serrano et al., 2005). Because
for a given colony size, per capita food availability would depend on the
total amount of resources, we also explored the simultaneous effect of
colony size, habitat type and their interaction, i.e. the relative effect of
colony size according to the habitat considered.
2. Methods
2.1. Study species and data collection
The lesser kestrel is a small raptor that lives in pseudo-steppes of the
Western Palearctic and spends the winter in West Africa (Iñigo and
Barov, 2011). It is a facultative colonial species that usually breeds in as-
sociation with jackdaws Corvus monedula and rock pigeons Columba
livia (Campobello et al., 2012, 2015). From spring to summer between
2004 and 2012 (with the exception of 2008), an average of 14 ± 4
(range 8–24; N = 28) colonies per year were visited in an area of
474 km2 corresponding to the Gela Plain in southern Sicily (Italy, 37°
07′ N, 14° 19′ E). The Gela Plain hosts one of the most important lesser
kestrel breeding populations in Italy, with colony sizes ranging from1 to
45 pairs (Sarà et al., 2012). Since the 1950s, the human population has
shifted from the villages to the main two cities in the area, and the
rural past of the Gela Plain is characterized by several farmhouses and
rural buildings, partially destroyed or abandoned, that currently host
84% of the lesser kestrel colonies occurring in the area (the remaining
16% nesting in cliffs; Sarà, 2010). We defined a breeding colony as a
man-made building with at least one pair of kestrels performing some
reproductive behavior at the site (i.e. a male delivering prey to a female,
copulation or inspection of nest chambers) (Di Maggio et al., 2013;
2014). Visits to the colonies were conducted periodically, at the time
of site occupation and egg-laying (April–May), incubation and hatching
(May–June), and fledging (June–July). During these visits, we captured
breeding adults in accessible nests, recorded reproductive parameters,
and ringed nestlings usingmetal and darvic rings with unique alphanu-
meric codes. We carefully inspected colony buildings looking for dead
birds, and checked their sex, age, and whenever possible, causes of
death. During the same periods, 2 to 4 experienced observers conducted
resighting sessions of one hour per colonywith 20 × 60 spotting scopes
to check lesser kestrels marked in previous years. Every year, the same
observers conducted two to three resighting sessions per month in
three roosts (one on a pine-tree, two on electric pylons) where most
of the population gathered at night. Birds at the roosts were neither
breeding juveniles of the past year nor breeding adults. Double records
of the same birds, in the roost and at the colony, proved that many
breeders spent the night outside of their colony. Adults were also ob-
served there after having failed to reproduce (M. Sarà, unpublished re-
sults). We recorded the sampling effort as the number of days spent in
the field per year, and used this covariate as a predictor of resighting
probability. Since our data encompass both physical recaptures and
resighting of individuals, we addressed them with the general term of
‘encounters’ (Serrano et al., 2005).
2.2. Habitat types
The Gela Plain, due to limited precipitation (350 mm/yr), is com-
posed of a mosaic of pseudo-steppes dominated by artichoke fields
(Cynara spp.), in rotation with wheat (Triticum spp.) and leguminous
cultivations (80.9%, Triolo et al., 2011). The rest of the area contains
pastures and xeric vegetation, predominantly graminaceous plants
and Mediterranean shrubs (Stipa capensis and Hyparrhenia hirta;
10.7%) and small artificial Eucalyptus and pine stands (3.7%; Sarà
et al., 2012). Previous landscape analysis revealed a strong decrease in
Mediterranean shrublands and grasslands from 1867 to 2000, replaced
by arable lands, vineyards and greenhouses (Russo et al., 2009). Histor-
ically, the cultivation of cotton was predominant in the area until the
latter half of the past century when it was gradually replaced by arti-
chokes in the 1960s–80s. Today, agricultural intensification is increas-
ingly changing the core area of the Gela Plain with irrigated crops
implanted after the artichoke harvest. Nonetheless, the Gela Plain in-
cludes a Special Protection Area (SPA, ITA050001) and a Site of Commu-
nity Importance (SCI, ITA050011) and constitutes an Important Bird
Area (IBA 166; Gariboldi et al., 2000). A Principal Component Analysis
(PCA) was used to summarize the essential land-use characteristics
within an area of radius 1 km around each colony (Bonal and Aparicio,
2008; online Appendix A1). Results indicated that the habitat surround-
ing the colonies was characterized by one of the three main habitat
types (arable, artichoke or grassland (Table A1 and Fig. A1) and thus
we assigned each colony to one of these habitats for survival and demo-
graphic modeling (Soliveres et al., 2011; Fig. A2). PCA was calculated
using STATISTICA 8.0 (www.statsoft.com).
117R. Di Maggio et al. / Biological Conservation 193 (2016) 116–123

2.3. Survival and recapture probabilities
Marked birds were encountered near (i.e. roosts) or within their
breeding colonies. We coded these observations in encounter histories
(Burnham et al., 1987), in which for each year after the marking a “1”
coded for an encounter event and a “0” indicated when a given bird
was not seen. We used capture–recapture models to estimate local
survival (φ) and recapture probabilities (p), from these histories
(Burnham et al., 1987). We sorted birds into six groups according to
age at marking (two groups, originally marked as fledglings and breed-
ing adults are hereafter referred to as juveniles and adults, ‘J’ and ‘A’
subscripts in model notation, respectively) and habitat at marking
(three levels were obtained from the PCA: arable, artichoke and grass-
land, noted ‘ARA’, ‘ART’ and ‘GRA’ in model notation, respectively). For
birds marked as juveniles, we also considered two age classes, 1 yr old
and N1 yr, noted ‘Age’ in model notation. A small quota (4.4% out of a
total N = 2103) of juveniles was observed later as breeders. Possible
change in habitat across individual lifespan could be accommodated
into amultisite/multistate framework (e.g. Tavecchia et al., 2002). How-
ever, our data was too sparse to apply this modeling framework;
therefore, the habitat at marking assigned to juvenile birds represented
their natal habitat. A total of 72.3% of birds marked as breeders was
faithful to its breeding habitat. The low breeding dispersal is congruent
with findings in other populations (cf. Serrano et al., 2001 in which
71.6% of breeding lesser kestrels were recruited into the same colony
or settled in colonieswithin their previous foraging habitats).Moreover,
no cases of adult emigration to neighboring populations were detected
during the study period, in spite of specific monitoring of the colonies
outside the Gela Plain. As most records come from birds remaining in
the same breeding colony or habitat, we considered their habitat
at marking only and we were confident that the relatively few known
dispersal cases ignored here would not bias our results. In addition to
the effect of age and habitat effects, we considered two continuous
covariates as predictors of survival and recapture probabilities, respec-
tively: i) colony size (‘Cs’ inmodel notation) used to assess the potential
density-dependent effects, and defined as the sum of the breeding pairs
occupying a colony in each year; and ii) resighting effort, expressed as
the decimal logarithm of the number of days of observation or capture
carried out each year at lesser kestrel colonies (‘Re’ in model notation),
and used to assess the sampling effort. The analysis began with a
goodness-of-fit test (GOF) of the general Cormack–Jolly–Seber model
(CJS) with software U-CARE 2.3 (Choquet et al., 2009). The CJS model
assumes all parameters to be time dependent, so we introduced a 9-
level factor corresponding to the years of study and implemented it
for birds marked as fledglings as well as for those marked as adults.
The GOF test includes components sensitive to different sources of
heterogeneity, such as age, presence of transient animals (Test 3SR)
or trap-heterogeneity (Test 2CT; Tavecchia et al., 2008). We then con-
sidered a candidate set of a priori defined multiple models, that we si-
multaneously compared using model information theory (IT, Grueber
et al., 2011). In particular, we used the Akaike Information Criterion
corrected for small sample size (AICc; Burnham and Anderson, 2002)
for ranking the models coming from the considered predictors of sur-
vival and recapture probabilities. The model with the lowest AICc
value was considered to provide the best fit between model deviance
and model complexity. Models differing by less than two AICc points
were considered to receive nearly identical support from the data
(Burnham and Anderson, 2002; Grueber et al., 2011). In addition to
AICc values, we estimated model deviances for each model and predic-
tor weights. The latter two estimated the relative importance of each
variable in the model set, and were obtained by summing the AIC
weights of all models in which a given variable appeared (Symonds
and Moussalli, 2011). To account for model selection uncertainty, we
calculated the weighted average and the standard errors of parameter
estimates by full-model averaging (Symonds and Moussalli, 2011).
Model selection, parameter estimate, model deviance, AICc value, and
AIC weight were calculated using the program MARK 7.1 (White and
Burnham, 1999).
Finally, only 10 of the 68 birds found dead (7.55 ± 4.69 per year,
Table A2) were marked, so we were not able to correct for the recovery
probability using capture–recapture-recovery methods (e.g. Tavecchia
et al., 2012). Therefore, we investigated the relative importance of
each cause of death conditional on the recovery event, i.e. using only
birds that had been recovered. This conditional approach assumes that
a dead bird is equally likely to be found regardless of the cause of death.
2.4. Fecundity
Breeding data were collected from 2004 to 2012 (except for 2008).
Fecundity, i.e. the number of fledglings per nest, wasmodeled as a func-
tion of habitat (3-level factor), time (9-level factor) and colony size
(covariate, ‘Cs’) using a Generalized Linear Mixed Model with a Poisson
distribution (GLMM,McCullagh and Searle, 2000). As in survivalmodel-
ing, we compared and selected models using the IT approach. GLMM
was used to control for potential non-independence of data represented
by fledglings and adults from the same nest and/or colony (Millar and
Anderson, 2004; Zuur et al., 2013). To select which effect to include in
the random part of the model, we evaluated nest and colony identities,
first taken alone and then together, in order to select the random effect
with the lowest AIC (Krackow and Tkadlec, 2001); the latter proved
to be colony identity. Once the random structure was set, we modeled
the fixed part as a function of year, colony size and habitat type (Zuur
et al., 2013). We conducted all fecundity analyses in R 3.0.2 (R
Development Core Team, 2011) with the R package lme4 (Bates et al.,
2013). Both fecundity (expressed as the N of fledglings) and survival
(0–1 probability) varied with colony size (see results). Therefore, they
were standardized to their range [variable value, v = (v − min v) /
(max v − min v)] to allow direct comparison on the same scale of the
colony size effect (Milligan and Cooper, 1988).
2.5. Population modeling
To estimate the expected population growth rate in each habitat,
we slightly modified the age-structured population model formerly re-
ported for the species by Hiraldo et al. (1996) and Rodríguez and
Bustamante (2003) by considering a post-breeding census. The general
formulation for the matrix projection model takes the following form:
Ntþ1 ¼ MNt
where M is the population projection matrix (Caswell, 2001, 2007) in-
corporating data on fecundity and survival probabilities of fledgling
and older birds in a given habitat (Table A3). Nt is the vector with abun-
dance of individuals in each class of the life-cycle ages at time t. Thema-
trix M contains the age- and habitat-dependent survival and fecundity
parameters as estimated from individual life-history and colony moni-
toring (Supplementary material, Table A3). We assumed a balanced
sex ratio at fledgling (Negro and Hiraldo, 1992) and included a param-
eter for the proportion of juveniles and adults that attempted to
breed, ‘C0’ and ‘C’, respectively. These two parameters were estimated
by raw data as in Hiraldo et al. (1996). For each habitat, we calculated
the asymptotic population growth rate (λ) as the maximum real eigen-
value ofM, the stable age distribution, and the sensitivity and elasticity
of λ to variations in demographic rates (Caswell, 2001). The stable age
distribution represented the numerical contribution in terms of individ-
uals of each age class to the stable age. The sensitivity of λ indicates
which demographic parameter has the largest impact on the growth
rate of our study population,whereas the elasticity ofλ estimates the ef-
fect of a proportional change in a key demographic parameter (i.e. vital
rate) on the population growth rate (Caswell, 2001). Matrix population
modelswere analyzed using the package popbio (Stubben andMilligan,
2007) for program R (R Development Core Team, 2011). All results
118 R. Di Maggio et al. / Biological Conservation 193 (2016) 116–123

obtained from survival, fecundity and populationmodeling are given as
mean ± standard error, unless otherwise indicated.
3. Results
3.1. Habitat and colony size-dependent survival
We analyzed the encounter histories of 2103 lesser kestrels marked
as fledglings (776 in colonies surrounded by arable fields, 548 by arti-
choke fields and 779 by grasslands) and 175 birds marked as adult
breeders (75 in arable, 52 in artichoke and 48 in grassland colonies).
The result of the GOF test was not significant (GOF χ2 =41.50, df =
73, p=0.99), meaning that our datamet the general assumption of the
CJSmodel. Threemodels rankedwithin the two points of AICc andwere
equally considered to give the best support to lesser kestrel survival. The
first model showed a relatively high AICc weight (0.35) with respect to
the second (0.18) and third (0.14; Table 1). All of thesemodels included
a habitat effect in the survival probability of both juvenile and adult
birds. Lesser kestrels living or born in colonies surrounded by arable
habitat had a lower probability of survival than those in colonies
surrounded by artichoke and grassland habitats (Models 1–3, Table 1).
The latter two habitats had the same effect on the survival of both adults
and juveniles and were treated together in further analyses. Average
survival probability for adults was 0.30 ± 0.08 in arable colonies,
0.75 ± 0.07 in artichoke, and 0.66± 0.07 in grassland colonies. Similar-
ly, survival probability for juveniles was lower in arable (0.13 ± 0.05)
than in artichoke (0.23 ± 0.07) and grassland colonies (0.21 ± 0.07;
Fig. 1).
Model averaging yielded the highest predictor weight of habitat
(w = 0.99) on adult survival, followed by colony size (w = 0.11),
which had no effect on survival. In the case of juveniles, the models in
Table 1 included a time and age effect, together with habitat; survival
was predicted from the model averaged effects of the year of study
(w=0.99, Fig. 1), age (w=0.99) and habitat (w=0.93). Nevertheless,
information theory gave some support for a positive effect of colony size
on predicting juvenile survival (w=0.29, linear predictor: 0.012±0.14
frommodel 2, Fig. 2); this factorwas included only in the second ranked
model. The inclusion of recapture effort led to a reduction of AICc value
(Table 1), as the first model not including the recapture effort
[pJ(t) pA(t)] ranked in the 12th position with a zero AICc weight. The
logit-linear predictor for the recapture effort was 1.13 ± 0.38. Adults
had a nearly 3-fold higher average recapture probability (0.18 ± 0.04)
than juveniles (0.07 ± 0.02; Fig. A3). The most frequent cause of
death among the 68dead lesser kestrelswas poisoning (26.47%) follow-
ed by birds that were stuck under unstable roof tiles (19.12%; Table A2).
3.2. Fecundity
The model selection procedure retained year as a significant source
of variation in the number of fledglings, which passed from an average
of 3.5± 0.19 fledglings in 2004 to 1.4± 0.10 in 2012 (Fig. A4). Contrary
to survival analysis, the effect of habitat on the number of fledglingswas
not significant, and the best model with the lowest AICc (Model 1,
Table 2) explained fecundity as a negative function of colony size and
year but not of their interaction (Fig. 2, Table 2). In our study area, a col-
ony size of around 18–20 pairs would produce the optimal trade-off
between fecundity and juvenile survival.
3.3. Population modeling
Following the previous results, we also treated artichoke and grass-
land colonies together when modeling habitat-dependent growth. The
estimated population growth rate (λ) for arable colonies was 0.38 ±
0.01, whereas for artichoke and grassland colonies it was 0.77 ± 0.02
(Fig. 3). Sensitivity and elasticity analyses indicated that the population
growth rate showed the highest sensitivity and elasticity to adult sur-
vival, followed by changes in juvenile survival and then in adult fecun-
dity in both habitat types (Table 3). The stable age distribution was
dominated by the adult class and showed similar values in all colony
habitats (proportion of adults: 0.59 for arable and 0.57 for artichoke
and grassland).
4. Discussion
Mechanistic models linking land-use and demography can be used
to explore population responses to land-use change if robust estimates
of habitat-dependent vital rates are available (Stephens et al., 2003).
This approach has the advantage that assumptions concerning ecologi-
cal mechanisms are amenable to evaluation, and it identifies the most
appropriate land-management strategy for biodiversity conservation
(Mattison and Norris, 2005). Here, long-term colony monitoring and
Table 1
Capture–recapturemodels estimating survival and recapture probabilities of juveniles (ϕJ and pJ, respectively) and adults (ϕA and pA, respectively) lesser kestrels in different colony hab-
itats of the Gela Plain. Only the first 10 top-rankedmodels have been reported. Model notation: colony size (Cs), time (t), age (Age), habitat: arable (ARA), artichoke (ART) and grassland
(GRA), constant (.), additive effect (+), recapture effort (Re), N Par = number of model parameters.
Model Survival Recapture AICc ΔAICc AICc w Deviance N Par
1 φJ (ARA + ART = GRA + t + Age), φA. (ARA + ART = GRA) pJ (Re) pA(Re) 1772.6 0 0.35 1732.2 20
2 φJ (ARA + ART = GRA + t + Age + Cs), φA. (ARA + ART = GRA) pJ (Re) pA(Re) 1773.9 1.36 0.18 1731.5 21
3 φJ (ARA + ART + GRA + t + Age), φA. (ARA + ART = GRA) pJ (Re) pA(Re) 1774.4 1.88 0.14 1732.1 21
4 φ J (ARA + ART = GRA + t + Age + Cs), φA. (ARA + ART = GRA + Cs) pJ (Re) pA(Re) 1774.8 2.23 0.11 1730.4 22
5 φJ (ARA + ART + GRA + t + Age), φA. (ARA + ART + GRA) pJ (Re) pA(Re) 1775.4 2.88 0.08 1731.0 22
6 φJ (ARA = ART = GRA + t + Age), φA. (ARA + ART = GRA) pJ (Re) pA(Re) 1776.8 4.22 0.04 1738.5 19
7 φJ (ARA = GRA + ART + t + Age), φA. (ARA + ART = GRA) pJ (Re) pA(Re) 1776.8 4.24 0.04 1736.5 20
8 φJ (ARA = ART + GRA + t + Age), φA. (ARA + ART = GRA) pJ (Re) pA(Re) 1777.7 5.11 0.03 1737.3 20
9 φJ (ARA = ART = GRA + t + Age), φA. (ARA + ART + GRA) pJ (Re) pA(Re) 1777.8 5.21 0.03 1737.4 20
10 φJ (ARA = GRA + ART + t + Age), φA. (ARA + ARA = GRA) pJ (Re) pA(Re) 1787.5 14.89 0 1747.1 20
Fig. 1. Survival probability of juvenile lesser kestrels in the Gela Plain (N= 2103) in rela-
tion to natal habitat and year.
119R. Di Maggio et al. / Biological Conservation 193 (2016) 116–123

individual capture–recapture data were used to identify the effect
of land use on fecundity and survival probabilities of lesser kestrels.
In our study area, both survival and recapture probability changed pos-
itively with age (see also Prugnolle et al., 2003). This is probably due to
age-dependent access to reproduction in high quality colonies (Bellia et
al., 2011; Serrano and Tella, 2007), and to the effect of annual rainfall
patterns on age-dependent mortality in overwintering areas (Mihoub
et al., 2010). Not surprisingly, the demography of migratory birdsmost-
ly depends on bothwintering and breeding habitat quality (see below),
which is critical in determining individual fitness (e.g. Gunnarsson et al.,
2005). Population growth of farmland birds is often habitat specific (e.g.
Arlt et al., 2008) and yet, density dependence plays a crucial role in co-
lonial species (Serrano et al., 2005).
4.1. Effect of colony size on lesser kestrel demography
Sociality elicits a complex interplay of costs and benefits (Danchin
and Wagner, 1997; Campobello and Hare, 2007; Di Maggio et al.,
2013), and the unequal fitness payoffs of living in a group drive the var-
iation in avian colony size (Brown et al., 2000). Ourfindings confirm col-
ony size as an important driver of population dynamics of colonial birds
as summarized here for a renowned model species such as the lesser
kestrel.
Lesser kestrels living in larger colonies acquire fitness benefits that
prevail over the costs of both the increased competition for resources
(Bonal andAparicio, 2008) and the increased risk of transmission of par-
asites and diseases associated with group living (Serrano et al., 2004).
Further benefits of living in large colonies include the reduced risk of
predation for adults and their offspring (Serrano et al., 2005) and the re-
duction of individual investment in vigilance (Campobello et al., 2012).
Moreover, colony size regulates the dispersal of lesser kestrels, which
use the number of conspecifics as a cue to colony quality and tend to
move to large colonies (Serrano et al., 2001; Serrano and Tella, 2003).
Earlier studies found colony size to be positively associated with repro-
ductive success in this species (Serrano and Tella, 2007), and nestling
survivalwas higher in large colonies (Serrano et al., 2001), due to the in-
teraction between nest distance and breeder abundance (Di Maggio
et al., 2013). On the other hand, living in large groups imposes signifi-
cant costs (e.g. Szostek et al., 2014), as lesser kestrels experience
density-dependent food depletion in large colonies (Bonal and
Aparicio, 2008). First-breeding birds are forced to emigrate from natal
sites due to social interactions with adults in colonies at carrying capac-
ity (Serrano and Tella, 2007), and the increase in colony size beyond a
certain threshold exerts a negative effect because of its repercussions
on nest distance (Serrano et al., 2004).
Opposite selection pressures are thus acting on colony size as in
common terns Sterna hirundo, where large colonies promote higher sur-
vival but reduce the quality of chicks (Minias et al., 2015). Similarly, we
detected an opposite colony size effect in juvenile survival and fecundi-
ty. In juveniles, colony size plays a small positive effect on survival;
however, colony size has a negative effect on fecundity, as the number
of fledglings decreased more in large colonies than in small ones. Alter-
natively, juveniles born into large colonies might be more philopatric
than those born into small ones. This hypothesis cannot be ruled out
but in view of the negative effect of colony size on fecundity, it would
Fig. 2. Relationship between colony size and juvenile survival probability (Model 2,
Table 1, N = 2103, solid line and black dots) and fecundity (Model 1, Table 2, N = 1001,
dotted line andwhite squares). Juvenile survival probability and fecunditywere standard-
izeddividingby range to have both variableswith the sameorder ofmagnitude and to plot
them on colony size.
Table 2
Results of GLMM testing for the role of colony size, habitat and year on fecundity (N =
1001 nests). In bold themodelwith the lowest AIC value. Colony Idwas fitted as a random
term. Interactive effect marked as * and additive effect as +; N Par = number of model
parameters.
Rank Model AIC ΔAIC AIC w N Par
1 Fecundity ~ year + colony size 3679.5 0 0.619 2
2 Fecundity ~ year + colony size * habitat 3681.0 1.5 0.293 3
3 Fecundity ~ year + colony size + habitat 3683.4 3.9 0.088 3
4 Fecundity ~ habitat + year 3696.9 17.4 0.000 2
5 Fecundity ~ year 3793.4 113.9 0.000 1
6 Fecundity ~ colony size 3848.4 168.9 0.000 1
7 Fecundity ~ habitat + colony size 3851.6 172.1 0.000 2
8 Fecundity ~ habitat 3884.4 204.9 0.000 1
Fig. 3. Estimated lesser kestrel population growth rate in 2004–2012 (with the exception
of 2008) for artichoke, grassland and arable habitats.
Table 3
Sensitivity and elasticity of different vital rates on population growth rates for lesser
kestrels living in arable, artichoke and grassland habitats of the Gela Plain. Estimates and
definitions of vital rates are given in online Table A3.
Matrix element Definition Sensitivity Elasticity
A) Arable
1-year bird fecundity C0FS0 0.034 b0.001
Adult fecundity CFSad 0.249 0.140
First-year survival probability S0 0.597 0.141
1-year bird survival probability Ssub 0.096 0.140
Adult survival probability Sad 0.717 0.576
B) Artichoke and grassland
1-year bird fecundity C0FS0 0.014 b0.001
Adult fecundity CFSad 0.116 0.074
First-year survival probability S0 0.396 0.075
1-year bird survival probability Ssub 0.103 0.074
Adult survival probability Sad 0.851 0.776
120 R. Di Maggio et al. / Biological Conservation 193 (2016) 116–123

imply a maladaptive behavior. Our findings more likely indicated a
trade-off between the survival probability of offspring and fecundity,
with a lower number of high-quality juveniles (i.e. with a small survival
advantage in the first year) produced in larger colonies. The combina-
tion of density-dependent fertility with the small effect that density
has on juvenile survival allowed us to quantify the optimal colony
size. This is almost a midpoint value conditional on the range of colony
sizes settled by lesser kestrels in the Gela Plain under the environmental
conditions of 2004–2012. Nevertheless, it establishes a baseline for fur-
ther experimental design on the selection of amedium colony size, such
as the optimal size for group living in farmland birds.
4.2. Effect of land uses on lesser kestrel demography
The elevated biodiversity in Mediterranean agro-ecosystems re-
quires special management practices on a local scale (Sokos et al.,
2013). In our study we found that land use had a very strong effect on
adult survival probability and population growth rate. Adult lesser
kestrels living in colonies surrounded by grassland and artichoke fields
had 50% higher survival probabilities than conspecifics living in arable
colonies. Though grasslands and artichoke fields are quite different
land uses, adult lesser kestrels experienced equivalent survival proba-
bilities in these two habitats. Grasslands, including set-aside and fallow
lands, are extensive landscape elements of traditional farming particu-
larly important for the lesser kestrel (Franco et al., 2004) and wildlife
conservation (Moreira et al., 2005; Zamora et al., 2007). In contrast,
the artichoke field is a distinctive crop type of the study area, and is an
unusual foraging habitat for the lesser kestrel in Southern Europe
(García et al., 2006; Catry et al., 2014). The temporal dynamics of culti-
vation (Catry et al., 2012), makes artichoke fields suitable for lesser kes-
trels. During the winter, when lesser kestrels are absent from the area,
artichoke fields are disturbed by the human activities related to inten-
sive cultivation, such as preparation of the field, artichoke planting,
and heavy use of fertilizers and biocides (Lo Giudice et al., 2014). The
fields are abandoned after the harvest in late April to early May, and
provide an abundance of prey and biomass to lesser kestrels during
the breeding season (Di Maggio et al., unpublished results).
In our study area, cereal fields grant the lowest survival to lesser kes-
trels, confirming the poor quality of this land use due to tall vegetation
cover that provides low accessibility to prey, and to biocide use, me-
chanical plowing, and mowing, which reduce prey biomass (Garcia
et al., 2006; Catry et al., 2012). Only during harvesting, cereals represent
a good foraging habitat for the ephemeral increase in food supply (Catry
et al., 2014). In our study area, arable fields prove to be the land use pro-
viding the lowest invertebrate and vertebrate richness and biomass (Di
Maggio et al., unpublished results).
4.3. Conservation implications and management of farmland habitats
The current values of vital rates found in the Gela Plain predict a
decline of the lesser-kestrel population. As in Hiraldo et al. (1996), our
findings suggest that lesser kestrel demography is driven by the adult
class (but see Prugnolle et al., 2003). Adult survival is the vital rate con-
tributing the most to the sensitivity and elasticity of the population
growth rate, followed by juvenile survival and adult fecundity. Conser-
vation practices working on the basis of explicit factors affecting adult
survival would thus be the most decisive for correct population man-
agement of the lesser kestrel across the Palearctic range (Ehrlén et al.,
2001; Sarà et al., 2014). Adult survival probabilities in grassland and ar-
tichoke colonies (0.66–0.75) are comparable to those of other lesser
kestrel populations (0.67–0.72: Hiraldo et al., 1996; Prugnolle et al.,
2003; Serrano et al., 2005). Contrarily, adult survival in arable colonies
(0.30) of the Gela Plain is the lowest recorded in demographic studies
of the species so far. The asymptotic growth rate indicated a negative
population trend (λ b 1) across the study period for every land-use, al-
though it was much more marked in the arable colonies. Agricultural
intensification in the Gela Plain is reducing the extent of grasslands,
and extending the irrigated crop season with a much more massive
use of biocides. Their use is particularly dangerous in June, when lesser
kestrels are raising their nestlings as indicated by the large number of
poisoned females recorded dead inside failed nests. Accordingly, the
most effective strategy to prevent the collapse of the lesser kestrel pop-
ulation in the Gela Plain should be based on land-use management and
on thedirect causes of adultmortality, to return to the extensive agricul-
tural practices observed at the beginnings of the study. Although
maintaining low-intensity farming is still the main recommendation
for this species (García et al., 2006; Catry et al., 2012), the positive
effects of irrigated non-traditional crops, such as artichoke in the Gela
Plain, or alfalfa Medicago sativa fields in Spain (Ursua et al., 2005), on
lesser kestrel demography bring forward new management options
when socio-economics pressure makes irrigation unavoidable. Conser-
vation actions should be encompassed in anAES implemented to reduce
agricultural intensification and human disturbance and enhance habitat
heterogeneity (Whittingham, 2007). Specifically, the AES should pro-
mote organic farming in the area and artichoke cultivation with low
input of biocides to make more compatible irrigated crops with lesser
kestrel conservation. Uncut strips of cereals and grasslands should be
left as buffers around arable colonies to improve prey availability and
reduce adult and nestling starvation (Catry et al., 2014). Because there
was no interaction between habitat type and colony size, all of these
conservation actions would be equally effective when applied to all col-
onies, irrespective of colony size.
Experimental manipulations of land uses with simultaneous moni-
toring of pseudo-steppe species, such as the lesser kestrel, would pro-
vide fine-tuned indications, not only for wide-scale conservation
strategies on one bio-indicator of a vulnerable habitat but also for man-
agement actions able to improve sustainability in agricultural practices.
Acknowledgments
We thankV. Italiano, R.Mascara, S. Triolo, J. Tysseire, and L. Zanca for
the field assistance and A. Sanz-Aguilar for the useful comments on the
paper. Language was revised by Proof-Reading-Service.com. Funding
was provided by the Italian Ministry of Education, University and Re-
search (PRIN 2010-2011, 20108 TZKHC). This study complies with the
current Italian laws regulating scientific research on animals.
Appendix A. Supplementary data
Supplementary data to this article can be found online at http://dx.
doi.org/10.1016/j.biocon.2015.11.016.
References
Arlt, D., Forslund, P., Jeppsson, T., Pärt, T., 2008. Habitat-specific population growth offarmland bird. PLoS One 3, e3006.
Baldi, A., Batary, P., Kleijn, D., 2013. Effects of grazing and biogeographic regions on grass-land biodiversity in Hungary — analysing assemblages of 1200 species. Agr EcosystEnviron 166, 28–34.
Bates, D., Maechler, M., Bolker, B., 2013. lme4: linear-mixed effects models using S4 clas-ses. Available at: http://cran.r-project.org/package=lme4.
Bellia, E., Campobello, D., Sarà, M., 2011. Great tit (Parus major) breeding in fire-prone oakwoods: differential effects of post-fire conditions on reproductive stages. Int.J. Wildland Fire 20, 605–611.
Berg, A., Wretenberg, J., Zmihorski, M., Hiron, M., Pärt, T., 2015. Linking occurrence andchanges in local abundance of farmland bird species to landscape composition andland-use changes. Agr Ecosyst Environ 204, 1–7.
Bonal, R., Aparicio, J.M., 2008. Evidence of prey depletion around lesser kestrel Falconaumanni colonies and its short term negative consequences. J. Avian Biol. 39,189–197.
Brambilla, M., Guidali, F., Negri, I., 2008. The importance of an agricultural mosaic for CirlBuntings Emberiza cirlus in Italy. Ibis 150, 628–632.
Brown, C.R., Brown, M.B.B., Danchin, E., 2000. Breeding habitat selection in cliff swallows:the effect of conspecific reproductive success on colony choice. J. Anim. Ecol. 69,133–142.
Burnham, K.P., Anderson, D.R., 2002. Model Selection and Multimodel Inference: A Prac-tical Information-theoretic Approach. Springer Verlag.
121R. Di Maggio et al. / Biological Conservation 193 (2016) 116–123

Burnham, K.P., Anderson, D.R., White, G.C., Brownie, C., Pollock, K.H., 1987. Design andanalysis of fish survival experiments based on capture-release. Am. Fish. Soc.Monogr.5, 1–437.
Bustamante, J., 1997. Predictive models for lesser kestrel Falco naumanni distribution,abundance and extinction in southern Spain. Biol. Conserv. 80, 153–160.
Butler, S.J., Boccaccio, L., Gregory, R.D., Vorisek, P., Norris, K., 2010. Quantifying the impactof land-use change on European farmland bird populations. Agr Ecosyst Environ 137,348–357.
Campobello, D., Hare, J.F., 2007. Information transfer determined by association of neigh-bours in European bee-eater (Merops apiaster) colonies. Ethol. Ecol. Evol. 19, 237–243.
Campobello, D., Sarà, M., Hare, J.F., 2012. Under mywing: lesser kestrels and jackdaws de-rive reciprocal benefits in mixed species colonies. Behav. Ecol. 23, 425–433.
Campobello, D., Hare, J.H., Sarà, M., 2015. Social phenotype extended to communities: ex-panded multilevel social selection analysis reveals fitness consequences of interspe-cific interactions. Evolution. http://dx.doi.org/10.1111/evo.12629.
Caswell, H., 2001. Matrix Population Models: Construction, Analysis, and Interpretation.Sinauer Associates.
Caswell, H., 2007. Sensitivity analysis of transient population dynamics. Ecol. Lett. 10,1–15.
Catry, I., Amano, T., Franco, A.M.A., Sutherland, W.J., 2012. Influence of spatial and tempo-ral dynamics of agricultural practices on the lesser kestrel. J. Appl. Ecol. 49, 99–108.
Catry, I., Franco, A.M.A., Moreira, F., 2014. Easy but ephemeral food: exploring the trade-offs of agricultural practices in the foraging decisions of lesser kestrels on farmland.Bird Study 1, 1–10.
Chiatante, G., Brambilla, M., Bogliani, G., 2014. Spatially explicit conservation issues forthreatened bird species in Mediterranean farmland landscapes. J. Nat. Conserv. 22,103–112.
Choquet, R., Lebreton, J.D., Gimenez, O., Reboulet, A.M., Pradel, R., 2009. U-CARE: utilitiesfor performing goodness of fit tests and manipulating capture–recapture data.Ecography 32, 1071–1074.
Danchin, E., Wagner, R.H., 1997. The evolution of coloniality: the emergence of new per-spectives. Trends Ecol. Evol. 12, 342–347.
R Development Core Team, 2011. R: A Language and Environment for Statistical Comput-ing. R Foundation for Statistical Computing, Vienna, Austria.
Di Maggio, R., Campobello, D., Sarà, M., 2013. Nest aggregation and reproductive synchro-ny promote lesser kestrel Falco naumanni seasonal fitness. J. Ornithol. 154, 901–910.
Di Maggio, R., Mengoni, C., Mucci, N., Campobello, D., Randi, E., Sarà, M., 2014. Do not dis-turb the family: roles of colony size and human disturbance in the genetic structureof lesser kestrel. J. Zool. 295, 108–115.
Donald, P.F., Green, R.E., Heath, M.F., 2001. Agricultural intensification and the collapse ofEurope's farmland bird populations. Proc. R. Soc. Lond. B. 268, 25–29.
Ehrlén, J., van Groenendael, J., de Kroon, H., 2001. Reliability of elasticity analysis: reply tomills et al. – conserv. Biol. 15, 278–280.
European Commission, 2006. Halting the loss of biodiversity by 2010— and beyond, sus-taining ecosystem services for human well-being Accessed 1 Dec 2013. http://ec.europa.eu/environment/.
Forero, M.G., Tella, J.L., Hobson, K.A., Bertellotti, M., Blanco, G., 2002. Conspecific food com-petition explains variability in colony size: a test in Magellanic penguins. Ecology 83,3466–3475.
Franco, A.M.A., Catry, I., Sutherland, W.J., Palmeirim, J., 2004. Do different habitat prefer-ence methods produce the same conservation recommendations for lesser kestrels?Anim. Conserv. 7, 291–300.
García, J.T., Morales, M.B., Martínez, J., Iglesias, L., García de la Morena, E., Suárez, F.,Viñuela, J., 2006. Foraging activity and use of space by lesser kestrel Falco naumanniin relation to agrarian management in central Spain. Bird Conserv. Int. 16, 83–95.
Gariboldi, A., Rizzi, V., Casale, T., 2000. Aree importanti per l'avifauna in Italia. LIPU-Birdlife.
González-Estébanez, F.J., García-Tejero, S., Mateo-Tomás, P., Olea, P.P., 2011. Effects of ir-rigation and landscape heterogeneity on butterfly diversity in Mediterranean farm-lands. Agr Ecosyst Environ 144, 262–270.
Grueber, C.E., Laws, R.J., Nakagawa, S., Jamieson, I.G., 2011. Multimodel inference in ecol-ogy and evolution: challenges and solutions. J. Evol. Biol. 24, 699–711.
Gunnarsson, T.G., Gill, J.A., Newton, J., Potts, P.M., Sutherland, W.J., 2005. Seasonalmatching of habitat quality and fitness in a migratory bird. Proc. Biol. Sci. 272,2319–2323.
Hiraldo, F., Negro, J.J., Donázar, J.A., Gaona, P., 1996. A demographic model for a popula-tion of the endangered lesser kestrel in southern Spain. J. Appl. Ecol. 33, 1085–1093.
Iñigo, A., Barov, B., 2011. Action Plan for the Lesser Kestrel Falco naumanni in theEuropean Union. SEO-BirdLife, BirdLife International for the European Commission.
Kolb, K.H., 2000. Are umbrella and target species useful instruments in nature conserva-tion? Experiences from a black grouse habitat in the Rhon Biosphere Reserve. Cah.Ethol. 20, 481–504.
Krackow, S., Tkadlec, E., 2001. Analysis of brood sex ratios: implications of offspring clus-tering. Behav. Ecol. Sociobiol. 50, 293–301.
Lane, S.J., Alonso, J.C., Martin, C.A., 2001. Habitat preferences of great bustard Otis tardaflocks in the arable steppes of central Spain: are potentially suitable areas unoccu-pied? J. Appl. Ecol. 38, 193–203.
Lewis, S., Sherratt, T.N., Hamer, K.C., Wanless, S., 2001. Evidence of intra-specific compe-tition for food in a pelagic seabird. Nature 412, 816–819.
Lo Giudice, A., Mbohwa, C., Clasadonte, M.T., Ingrao, C., 2014. Life cycle assessment inter-pretation and improvement of the Sicilian artichokes production. Int. J. Environ. Res.8, 305–316.
Mattison, E.H.A., Norris, K., 2005. Bridging the gaps between agricultural policy, land-useand biodiversity. Trends Ecol. Evol. 20, 610–616.
McCullagh, P., Searle, S.R., 2000. Generalized Linear andMixedModels.Wiley-Interscience.
Mihoub, J., Gimenez, O., Pilard, P., Sarrazin, F., 2010. Challenging conservation of migrato-ry species: Sahelian rainfalls drive first-year survival of the vulnerable lesser kestrelFalco naumanni. Biol. Conserv. 143, 839–847.
Millar, R., Anderson, M.J., 2004. Remedies for pseudoreplication. Fish. Res. 70, 397–407.Milligan, G.W., Cooper, M.C., 1988. A study of standardization of variables in cluster anal-
ysis. J. Classif. 5, 181–204.Minias, P., Włodarczyk, R., Janiszewski, T., 2015. Opposing selective pressures may act on
the colony size in a waterbird species. Evol. Ecol. 29, 283–297.Moreira, F., Beja, P., Morgado, R., Reino, L., Gordinho, L., Delgado, A., Borralho, R., 2005. Ef-
fects of field management and landscape context on grassland wintering birds inSouthern Portugal. Agr Ecosyst Environ 109, 59–74.
Myers, N., Mittermeier, R.A., Mittermeier, C.G., da Fonseca, G.A.B., Kent, J., 2000. Biodiver-sity hotspots for conservation priorities. Nature 403, 853–858.
Negro, J.J., Hiraldo, F., 1992. Sex ratios in broods of the lesser kestrel Falco naumanni. Ibis134, 190–191.
Pe'er, G., Dicks, L.V., Visconti, P., Arlettaz, R., Báldi, A., Benton, T.G., Collins, S., Dieterich, M.,Gregory, R.D., Hartig, F., Henle, K., Hobson, P.R., Kleijn, D., Neumann, R.K., Robijns, T.,Schmidt, J., Shwartz, A., Sutherland, W.J., Turbe, A., Wulf, F., Scott, A.V., 2014. EU agri-cultural reform fails on biodiversity. Science 344, 6188.
Prugnolle, F., Pilard, P., Brun, L., Tavecchia, G., 2003. First-year and adult survival of the en-dangered lesser kestrel Falco naumanni in southern France. Bird Study 50, 68–72.
Rodríguez, C., Bustamante, J., 2003. Theeffect ofweather on lesser kestrel breeding success:can climate change explain historical population declines? J. Anim. Ecol. 72, 793–810.
Rodrıguez, C., Johst, K., Bustamante, J., 2006. How do crop types influence breeding suc-cess in lesser kestrels through prey quality and availability? A modelling approach.J. Appl. Ecol. 43, 587–597.
Russo, P., Carullo, L., Tomaselli, G., 2009. Analisi del paesaggio rurale delle aree “natura2000” di Gela per la comprensione delle dinamiche storiche di trasformazione.Ricerca ed innovazione nell'ingegneria dei biosistemi agro territoriali. Doppiavoce,pp. 1–10.
Sarà, M., 2010. Climate and land-use changes as determinants of lesser kestrel Falconaumanni abundance in Mediterranean cereal steppes (Sicily). Ardeola 57, 3–22.
Sarà, M., Campobello, D., Zanca, L., 2012. Effects of nest and colony features on lesser kes-trel (Falco naumanni) reproductive success. Avian Biol. Res. 5, 209–217.
Sarà, M., Campobello, D., Zanca, L., Massa, B., 2014. Food for flight: pre-migratory dynam-ics of the lesser kestrel Falco naumanni. Bird Study 61, 29–41.
Serrano, D., Tella, J.L., 2003. Dispersal within a spatially structured population of lesser kes-trels: the role of spatial isolation and conspecific attraction. J. Anim. Ecol. 72, 400–410.
Serrano, D., Tella, J.L., 2007. The role of despotism and heritability in determining settle-ment patterns in the colonial lesser kestrel. Am. Nat. 169, 53–67.
Serrano, D., Tella, J.L., Forero, M.G., Donázar, J.A., 2001. Factors affecting breeding dispersalin the facultatively colonial lesser kestrel: individual experience vs. conspecific cues.J. Anim. Ecol. 70, 568–578.
Serrano, D., Forero, M.G., Donázar, J.A., Tella, J.L., 2004. The role of dispersal and conspecif-ic cues on breeding site selection and colony dynamics of lesser kestrels. Ecology 85,3438–3447.
Serrano, D., Oro, D., Ursua, E., Tella, J.L., 2005. Colony size selection determines adult sur-vival and dispersal preferences: allee effects in a colonial bird. Am. Nat. 166, 22–31.
Sirami, C., Brotons, L., Burfield, I., Fonderflick, J., Martin, J.L., 2008. Is land abandonmenthaving an impact on biodiversity? A meta-analytical approach to bird distributionchanges in the north-western Mediterranean. Biol. Conserv. 141, 450–459.
Sokos, C.K., Mamolos, A.P., Kalburtji, K.L., Birtsas, P.K., 2013. Farming and wildlife inMediterranean agroecosystems. J. Nat. Conserv. 21, 81–92.
Soliveres, S., García-Palacios, P., Castillo-Monroy, A.P., Maestre, F.T., Escudero, A.,Valladares, F., 2011. Temporal dynamics of herbivory and water availability interac-tively modulate the outcome of a grass–shrub interaction in a semi-arid ecosystem.Oikos 120, 710–719.
Stephens, P.A., Freckleton, R.P., Watkinson, A.R., Sutherland, W.J., 2003. Predicting the re-sponse of farmland bird populations to changing food supplies. J. Appl. Ecol. 40,970–983.
Stoate, C., Báldi, A., Beja, P., Boatman, N.D., Herzon, I., van Doorn, A., de Snoo, G.R., Rakosy,L., Ramwell, C., 2009. Ecological impacts of early 21st century agricultural change inEurope — a review. J. Environ. Manage. 91, 22–46.
Stubben, C.J., Milligan, B.G., 2007. Estimating and analyzing demographic models usingthe popbio package in R. J. Stat. Softw. 22, 1–23.
Symonds, M.R.E., Moussalli, A., 2011. A brief guide to model selection, multimodel infer-ence and model averaging in behavioural ecology using Akaike's Information Criteri-on. Behav. Ecol. Sociobiol. 65, 13–21.
Szostek, K.L., Becker, P.H., Meyer, B.C., Sudmann, S.R., Zintl, H., 2014. Colony size and notnest density drives reproductive output in the common tern Sterna hirundo. Ibis 156,48–59.
Tavecchia, G., Pradel, R., Lebreton, J.D., Biddau, L., Mingozzi, T., 2002. Sex-biased survivaland breeding dispersal probability in a patchy population of the Rock sparrowPetronia petronia. Ibis 144, 79–87.
Tavecchia, G., Minguez, E., De León, A., Louzao, M., Oro, D., 2008. Living close, doing differ-ently: small-scale asynchrony in demography of two species of seabirds. Ecology 89,77–85.
Tavecchia, G., Adrover, J., Muñoz Navarro, A., Pradel, R., 2012. Modelling mortality causesin longitudinal data in the presence of tag loss: application to raptor poisoning andelectrocution. J. Appl. Ecol. 49, 297–305.
Triolo, S., Campobello, D., Sarà, M., 2011. Diurnal habitat suitability for a Mediterraneansteppeland bird, identified by Ecological Niche Factor Analysis. Wildl. Res. 38,152–162.
Ursua, E., Serrano, D., Tella, J.L., 2005. Does land irrigation actually reduce foraging habitatfor breeding lesser kestrels? The role of crop types. Biol. Conserv. 122, 643–648.
122 R. Di Maggio et al. / Biological Conservation 193 (2016) 116–123

White, G.C., Burnham, K.P., 1999. ProgramMARK: survival estimation from populations ofmarked animals. Bird Study 46, 120–129.
Whittingham, M.J., 2007. Will agri-environment schemes deliver substantial biodiversitygain, and if not why not? J. Appl. Ecol. 44, 1–5.
Zamora, J., Verdù, J.R., Galante, E., 2007. Species richness in Mediterranean agro-ecosystems:spatial and temporal analysis for biodiversity conservation. Biol. Conserv. 134, 113–121.
Zuur, A.F., Hilbe, J.M., Ieno, E., 2013. A Beginner's Guide to GLM and GLMM with R: afrequentist and Bayesian perspective for ecologists. Highland Statistics.
123R. Di Maggio et al. / Biological Conservation 193 (2016) 116–123

82
Capitolo 4
Obiettivo 4:Studio della variabilità della dieta del Grillaio in
relazione all’habitat

83
Introduzione
Le popolazioni di molte specie di uccelli legati ad ambienti agricoli, rappresentanti una
grande parte dell’avifauna Europea, hanno sofferto un drammatico declino negli ultimi
decenni soprattutto nel bacino del Mediterraneo (Donald et al., 2001; Sokos et al., 2013).
Le cause di questo declino sono state identificate nei cambiamenti nelle pratiche agricole,
come la forte meccanizzazione, l’aumento dell’uso dei fertilizzanti e dei biocidi, e
l’abbandono delle aree meno produttive e marginali (Benton et al., 2003; Donald et al.,
2001; Fuller et al., 1995; Newton, 2004). Inoltre, l’intensificazione agricola ha condotto
alla riduzione dei rifugi e delle aree di riproduzione degli invertebrati che rappresentano
il cuore della dieta della maggior parte di questi uccelli (Benton et al., 2003; Boatman et
al., 2004; Genghini et al., 2006).
Un habitat di particolare interesse è rappresentato dalle pseudosteppe del
Mediterraneo, un hotspot di biodiversità (Myers et al., 2000; Blondel at al. 2010). Le
pseudosteppe sono composte da un mosaico di campi di cereali, stoppie, arati e incolti e,
nonostante la sua natura fortemente influenzata dall’uomo, supportano una importante
comunità di uccelli di ambienti aperti. Sfortunatamente, anche le pseudosteppe sono state
recentemente modificate in molte aree dell’Europa del Sud contribuendo al declino di
molte specie di uccelli e di altri taxa (Donald et al., 2001; Sirami et al., 2008; Sokos et
al., 2013; Chiatante et al., 2014; Loos et al., 2014).
Al fine di intraprendere opportune misure di conservazione, i benefici ecologici
di certi usi del suolo dovrebbero essere analizzati non solo su larga ma anche scala più
piccola (Johst et al., 2002). Infatti, l’habitat che circonda un sito riproduttivo e la sua
eterogenea distribuzione delle risorse possono influenzare la distribuzione, la

84
riproduzione e la dieta di molti uccelli (Bretagnolle et al., 2011; Rioux Paquette et al.,
2014). Una scarsa qualità dell’habitat può ostacolare le performance individuali in una
data stagione e influenzare la sopravvivenza e la riproduzione negli anni successivi
attraverso un effetto carry – over (Norris et al., 2004; Harrison et al., 2011; Rioux
Paquette et al., 2014). Risorse limitate possono ridurre, ad esempio, le riserve energetiche
dei genitori al punto che questi potrebbero decidere di non portare a termine la
riproduzione o di non riprodursi affatto (Kowalczyk et al., 2014). In questo contesto, una
conoscenza accurata della dieta nei differenti usi del suolo delle specie che vivono in
ambienti mutevoli e antropizzati è fondamentale per la comprensione delle interazioni tra
habitat e disponibilità di cibo e per la conservazione e gestione degli uccelli (Bijlsma,
2013; Kowalczyk et al., 2014).
L’obiettivo principale di questa quarta parte della tesi è di determinare la dieta del
Grillaio durante la stagione riproduttiva e di compararne la composizione e la diversità in
tre differenti habitat semi-naturali che variano nell’intensità delle attività agricole, e dove
nessuna misura di conservazione è stata introdotta finora.
In Spagna, i primi studi sul Grillaio (Bustamante, 1997; Parr et al., 1995; Donazar
et al., 1993; Tella et al., 1998) hanno evidenziato che la mancanza di cibo durante la
stagione riproduttiva, determinata dai cambiamenti agricoli (Franco et al., 2004), era il
fattore più importante responsabile della mortalità dei pulcini e del declino della
popolazione Iberica (Negro et al., 1993). Al di fuori della Penisola Iberica, dove gli
Ortotteri costituiscono la maggior parte della dieta (Catry et al., 2011), la dieta del Grillaio
non è ancora nota. Ho ipotizzato che un habitat eterogeneo, tipico dell’area di studio,
possa determinare una variabilità della dieta all’interno della popolazione.

85
Materiali & Metodi
Raccolta delle borre e identificazione delle prede
Sono state raccolte 988 borre durante cinque anni di studio (2006, 2007, 2010, 2012 e
2013) in 26 colonie (38 ±28 per colonia, media ± ES) della Piana di Gela durante tutta la
stagione riproduttiva dei Grillai, dalla metà di Aprile fino alla fine di Giugno. Ogni
colonia è stata visitata almeno tre volte per stagione, per rimuovere i residui delle borre
degli anni precedenti e per raccogliere le borre appena prodotte in prossimità o all’interno
dei nidi. Dopo la raccolta, le borre sono state conservate a temperatura ambiente, circa
20°C, in buste di plastica fino all’analisi in laboratorio.
Per ciascuna borra, i singoli resti delle prede sono stati assegnati a differenti taxa
utilizzando guide tassonomiche e chiavi dicotomiche (Franco & Andrada, 1977; Rizzo &
Massa, 1995; Massa, 2011). I frammenti degli insetti sono stati identificati a livello
specifico attraverso la comparazione con esemplari presenti nelle collezioni
entomologiche (Rizzo & Massa, 1995) e con esemplari raccolti nell’area di studio (Massa,
2011). Le borre sono state analizzate in laboratorio con uno stereomicroscopio Wild M5.
Ciascun frammento è stato isolato e per ogni borra è stato contato il numero totale di
frammenti. Questi, sono stati divisi in 11 categorie tassonomiche: Roditori, Rettili,
Uccelli, Coleotteri Scarabaeidae, Coleotteri Carabidae, altri Coleotteri, Ortotteri
Tettigoniidae, Ortotteri Acrididae, Ortotteri Gryllidae, altri Ortotteri e altri Insetti.
Ho usato tre variabili per descrivere la dieta del Grillaio: i) biomassa ingerita
(espressa come il peso di una preda in una borra sul peso totale delle prede misurato
durante lo studio, %) calcolata basandosi sulle biomasse delle prede ottenute sul campo
e su dati già pubblicati (Rodriguez et al., 2010; Sumasgutner et al., 2014), ii) il numero
di prede per borra, calcolato sul numero di resti in una borra associabili a una categoria
tassonomica ben precisa (Bonal & Aparicio, 2008; Sumasgutner et al., 2014) e iii)

86
l’ampiezza della dieta (B) come indice della specializzazione della dieta, calcolata
seguendo l’indice di Levin (Levin 1968) come B = 1/Σpi2, dove pi è il numero di resti
appartenenti a una tipologia di preda i in una borra.
Ho inoltre calcolato la biomassa ingerita differenziata nelle 11 categorie
tassonomiche elencate precedentemente in modo da descrivere più accuratamente la dieta
del Grillaio. Per ciascun anno e mese di studio ho inoltre calcolato: iv) il pasto medio,
come rapporto tra la biomassa ingerita e il numero totale di borre, v) il numero medio di
prede per borra come il rapporto tra il numero totale di prede e il numero totale di borre
e vi) il peso medio di una borra calcolato come il rapporto tra la biomassa ingerita e il
numero di prede per borra (Massa & Sarà, 1982).
Analisi statistiche
Ho usato Modelli lineari generalizzati (GLMs) con una distribuzione normale e di Poisson
per testare gli effetti dell’anno di studio (cinque livelli), del mese di studio (tre livelli,
aprile, maggio e giugno) e dell’habitat [(tre livelli, arato (ARA), carciofeto (ART) e
incolto (GRA)] sulla dieta del Grillaio. Il test Tukey’s HSD post hoc è stato utilizzato per
esaminare le differenze nell’ampiezza della dieta, nella biomassa ingerita e nel numero di
prede per borra tra anni successi, mesi e habitat. Per la classificazione dei modelli ho
usato l’ Akaike Information criterion (AIC; Burnham & Anderson, 2002). Il modello con
il più basso valore di AIC è stato considerato il miglior compromesso tra la complessità
del modello e la sua devianza.
Ho condotto le analisi in R 3.0.2 (R Core Team 2013) con il pacchetto R lme4
(Bates et al., 2013) e con STATISTICA 10.0 (Statsoft Inc., 2001).

87
Risultati
Sono state analizzate 4706 prede in 988 borre raccolte in cinque anni (198 ± 128 ES borre
per anno). La dieta del Grillaio risulta equamente divisa tra Coleotteri (40%) e Ortotteri
(41%; Tabella 1). I due ordini di insetti formano il cuore della dieta (81%). Roditori e
altri vertebrati rappresentano il 9% delle prede e il 72% della biomassa ingerita,
soprattutto per quanto riguarda i Rettili (35%, Tabella 1). Gli Ortotteri sono secondi ai
Vertebrati in termini di biomassa ingerita (16%) seguiti dai Coleotteri (8%). Tra i
Coleotteri, Pentodon bidens è la preda dominante (53%) mentre Grylloderes brunneri
(16%) e Aiolopus strepens (16%) sono gli Ortotteri dominanti.
Tabella 1 Frequenza e contributo in termini di biomassa ingerita (%) delle prede trovate in 98
borre di Grillaio analizzate.
Taxon
Numero di
Prede
Numero di
Prede (%)
Biomassa
Ingerita (Kg)
Biomassa
Ingerita (%)
Roditori 184 4% 3.18 23%
Rettili 158 3% 4.75 35%
Uccelli 83 2% 1.93 14%
Totale
Vertebrati 425 9% 9.86 72%
Scarabaeidae 1047 22% 0.75 6%
Carabidae 309 7% 0.16 1%
Altri Coleotteri 515 11% 0.24 2%
Totale
Coleotteri 1871 40% 1.14 8%
Tettigoniidae 663 14% 1.19 9%
Acrididae 607 13% 0.33 2%
Gryllidae 310 7% 0.08 1%
Altri Ortotteri 344 7% 0.52 4%
Totale
Ortotteri 1924 41% 2.13 16%
Altri insetti 486 10% 0.49 4%
Totale 4706 13.62

88
La Figura 1 mostra il numero annuo di prede per borra, il peso medio di una preda
e il pasto medio di un Grillaio. In generale, le tre variabili mostrano un declino durante il
periodo di studio soprattutto nell’ultimo anno e con un picco nel 2007. Il pasto medio era
di 14.91 grammi, il numero medio di prede per borra era di 5.18 individui mentre il peso
medio di una preda era di 2.88 grammi.
Fig. 1. Differenza annuale di i) numero medio di prede/borra, ii) peso medio di una preda gr) e iii) pasto
medio (gr) (n = 988).
Variazione della dieta durante la stagione riproduttiva
L’analisi GLM ha mostrato che la biomassa ingerita, il numero delle prede e l’ampiezza
della dieta variavano durante la stagione riproduttiva. La biomassa ingerita diminuiva in
aprile (F1,2 = 3.65, p = 0.026, Fig.2) mentre mostrava risultati simili in maggio e giugno
(Tukey HSD test, p = 0.60). Il numero di prede per borra aumentava con l’avanzare della
stagione riproduttiva da aprile a maggio (F 1,2 = 15.32, p < 0.001, Fig.2). L’ampiezza della

89
dieta era minore in giugno e aprile e aveva un picco a maggio (F1,2 =16.12, p < 0.001,
Fig.2).
Fig. 2. Variazione mensile di) biomassa ingerita, ii) numero di prede/borra e iii) ampiezza della dieta (n
= 988) durante la stagione riproduttiva.
Differenza della dieta tra gli anni e gli habitat
L’ampiezza della dieta variava in funzione dell’interazione tra anno e habitat (F1.8 = 6.94,
p < 0.001, n= 988; Tabella 2A) con un leggero aumento nelle colonie circondate da
carciofeto e incolto. L’analisi statistica ha inoltre rivelato una interazione significativa
dell’habitat e dell’anno di studio nel determinare la biomassa ingerita (Tabella 2B) con
una elevata biomassa nel 2007 (F1,4 = 104.83, p < 0.001, n= 988; Fig.3A) e negli habitat
con prevalenza di carciofeto e incolto (F1,2 = 3.33, p = 0.04, n= 988; Fig.3B).

90
Tabella 2 Ruolo dell’habitat e dell’anno nel predire: i) ampiezza della dieta, ii) biomassa ingerita
e iii) numero di prede per borra (GLM; n=988).
La biomassa ingerita media era simile nelle colonie circondate da carciofeto
(19.25 ± 1.45 gr) e da incolto (19.35 ± 0.95 gr) mentre diminuisce nelle colonie circondate
da arato (16.08 ±1.45 gr; Fig. 3B). Inoltre, il maggior numero di prede è stato riscontrato
nel 2007 (F1,4 = 116.42, p < 0.001, n= 988) e nelle colonie circondate da incolto (F1,2 =
4.45, p = 0.01, n= 988). Il numero medio di prede per borra è stato di 6.17 ± 0.23
nell’incolto mentre era simile nel carciofeto (5.18 ± 0.35) e nell’arato (5.34 ± 0.23).
Infine, la tipologia di habitat influenzava anche la variazione della biomassa
ingerita nelle 11 categorie tassonomiche in cui è stata differenziata (MANOVA; F7,171, p
< 0.001, n = 988; Fig. 4).
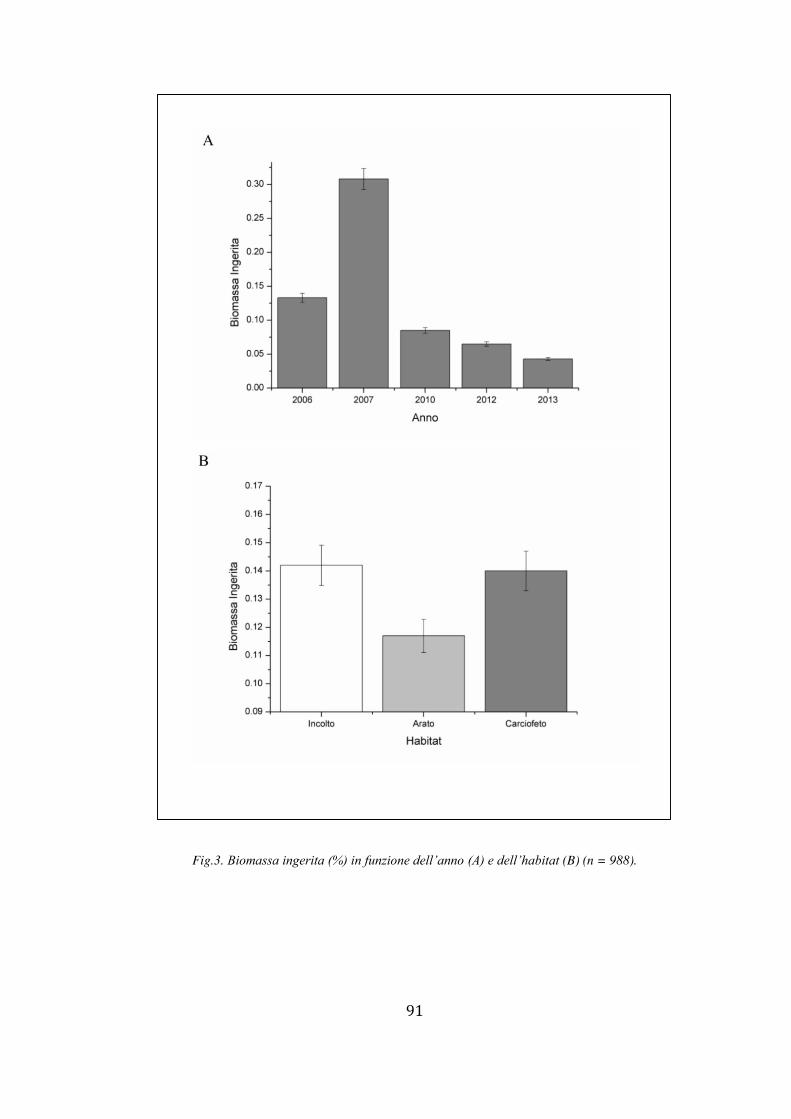
91
Fig.3. Biomassa ingerita (%) in funzione dell’anno (A) e dell’habitat (B) (n = 988).

92
Fig. 4. A) Biomassa ingerita relativamente a Vertebrati (Roditori, Rettili e Uccelli) (grammi) e B)
Invertebrati (Scarabeidi, Carabidi e Tettigonidi) in funzione dell’habitat (n = 988).

93
Discussione
Questo studio ha mostrato come la dieta del Grillaio vari durante la stagione riproduttiva
e risulti fortemente influenzata dalla tipologia di habitat presente nella Piana di Gela.
Variazione annuale e stagionale della dieta
Contrariamente a Perez-Granados (2010) e Rodriguez et al., (2010) la dieta del Grillaio è
equamente divisa tra Coleotteri e Ortotteri mentre la maggior parte della biomassa è
rappresentata da Vertebrati. L’analisi mostra inoltre una grande fluttuazione delle prede
durante la stagione riproduttiva e durante gli anni di studio. Questo è in accordo con
risultati precedenti (Capitolo 3) in cui il numero dei pulcini involati da una coppia
diminuiva negli anni passando da una media di 3.5 pulcini nel 2004 a 1 nel 2012 (Di
Maggio et al., in stampa).
Il declino delle popolazioni di uccelli insettivori, come il Grillaio, è un fenomeno
ben documentato e su larga scala (Razeng & Watson, 2015). Questo declino può essere
attribuito alla riduzione del numero delle prede (i.e. artropodi) causato dalla perdita degli
habitat (Zanette et al., 2000, Rioux Paquette et al., 2014) e a cambiamenti nelle pratiche
agricole (Britschgi et al., 2006). La riduzione della biomassa ingerita può essere dovuta
anche all’aumento del numero di pesticidi usati in agricoltura (Hallmann et al., 2014) i
quali influenzando negativamente le comunità di invertebrati determinano una
distruzione della catena alimentare che, in ultima analisi, influenza anche gli uccelli
insettivori.
Variazione della dieta in funzione dell’habitat
Nella Piana di Gela, l’habitat ha l’effetto maggiore nel determinare la dieta del Grillaio
soprattutto per quanto riguarda il numero delle prede e la biomassa ingerita. In particolare,
la biomassa era maggiore nelle colonie circondate da carciofeto e incolto mentre il
numero di prede era maggiore soltanto negli incolti. Questi risultati non fanno altro che

94
concordare e supportare i risultati sulla sopravvivenza e sull’andamento demografico
precedentemente descritti in questa tesi (Capitolo 3).
I carciofeti rappresentano una tipica coltivazione dell’area di studio; i campi
vengono abbandonati dopo la raccolta fornendo abbondanza di prede al Grillaio durante
la stagione riproduttiva. Triolo et al., (2011) hanno dimostrato che l’Occhione (Burhinus
oedicnemus) mostrava una preferenza per i campi di carciofo quando questi erano stati
raccolti e poi abbandonati. Purtroppo, attualmente, l’intensificazione delle pratiche
agricole sta determinando un cambiamento della Piana di Gela con l’impianto di colture
irrigue dopo la raccolta dei carciofi che potrebbero rappresentare una ulteriore minaccia
per la sopravvivenza della popolazione di Grillaio nell’area.
Implicazioni di conservazione
Il declino delle popolazioni di uccelli legati ad ambienti pseudosteppici è stato da sempre
attribuito ai cambiamenti delle politiche agricole (Donald et al., 2001; 2006). Sin dalla
loro prima applicazione, queste politiche agricole hanno promosso la conversione degli
habitat naturali e degli incolti in campi coltivati su larga scala, con l’uso di pesticidi e
grandi macchinari agricoli (Sanderson et al., 2013). La conseguenza immediata di queste
attività è stata la drastica riduzione dell’eterogeneità dei campi e della biodiversità degli
habitat soprattutto per quanto riguarda gli uccelli (Herkert, 1997; Geiger et al., 2014). Al
fine di invertire questa situazione, gli agro-ecosistemi mediterranei richiederebbero
specifiche azioni di conservazione e gestione a livello locale (Sokos et al., 2013).
L’aumento di margini tra i campi, il mantenimento di un mosaico di colture a rotazione,
insieme con una riduzione dell’abbandono dei campi meno redditizi sono le principali
raccomandazioni per la conservazione delle popolazioni di Grillaio e degli uccelli
pseudosteppici in generale.

95
Inoltre, strisce di terreno incolto dovrebbero essere lasciate tra i campi di cereali
in modo da aumentale la disponibilità di cibo e diminuire l’inedia dei pulcini in
quell’habitat. Infine, la presenza di un elevato numero di Grillai nei campi di carciofi ha
determinato la drastica riduzione del numero di roditori nei campi contribuendo a una
attività di derattizzazione che potrebbe rappresentare un aiuto indiretto agli agricoltori.

96
Bibliografia
Benton, T.G., Vickery, J.A., Wilson, J.D. (2003) Farmland biodiversity: is habitat
heterogeneity the key? Trends Ecology and Evolution 18, 182–188.
Bijlsma, R.G. (2013) Silent winter: the loss of birds from Veluwe's arable land. Limosa
86 (3), 108-121.
Blondel, J.J., Aronson, J., Bodiou, J.Y., Boeuf, G. (2010) The Mediterranean Region:
Biological Diversity in Space and Time. Oxford University Press.
Boatman, N.D., Brickle, N.W., Hart, J.D., Milsom, T.P., Morris, A.J., Murray, A.W.A.,
Murray, K., Robertson, P.A. (2004) Evidence for the indirect effects of pesticides
on farmland birds. Ibis 146 (Suppl. 2), doi: 10.1111/j.1474-919x.2004.00347.x.
Bonal, R., Aparicio, J.M. (2008) Evidence of prey depletion around Lesser Kestrel Falco
naumanni colonies and its short term negative consequences. Journal of Avian
Biology 39,189-197.
Bretagnolle, V., Villers, A., Denonfoux, L., Cornulier, T., Inchausti,P., Badenhausser, I.
(2011) Rapid recovery of a depleted population of Little Bustards Tetrax tetrax
following provision of alfalfa through an agri-environment scheme. Ibis 153, 4-1.
Britschgi, A., Spaar, R., Arlettaz, R. (2006) Impact of grassland farming intensification
on the breeding ecology of an indicator insectivorous passerine, the Whinchat
Saxicola rubetra: lessons for overall Alpine meadowland management. Biological
Conservation 130, 193–205.
Burnham, K.P., Anderson, D.R. (2002) Model selection and multimodel inference: a
practical information-theoretic approach. Springer Verlag.

97
Bustamante, J. (1997) Predictive models for Lesser Kestrel Falco naumanni distribution,
abundance and extinction in southern Spain. Biological Conservation 80, 153-
160.
Catry, I., Franco, A.M.A., Sutherland, W.J. (2011) Adapting conservation efforts to face
climate change: modifying nest-site provisioning for Lesser Kestrels. Biological
Conservation144, 1111-1119.
Chiatante, G., Brambilla, M., Bogliani, G. (2014) Spatially explicit conservation issues
for threatened bird species in Mediterranean farmland landscapes. Journal of
Nature Conservation 22, 103-112.
Donald, P. F., Sanderson, F. J., Burfield, J. I., van Bommel, F. P. J. (2006) Further
evidence of continent-wide impacts of agricultural intensification on European
farmland birds, 1990–2000. Agriculture Ecosystems & Environment 116, 189–
196.
Donald, P.F., Green, R.E., Heath, M.F. (2001) Agricultural intensification and the
collapse of Europe’s farmland bird populations. Proceedings Royal Society
London B. 268, 25-29.
Donázar, J.A., Negro, J. J., Hiraldo F (1993) Foraging habitat selection, land-use changes
and population decline in the Lesser Kestrel Falco naumanni. Journal of Applied
Ecology 30, 515–522.
Franco, A., Andrada, J. (1977) Alimentación y selección de presa en Falco naumanni.
Ardeola, 23, 137-187.

98
Franco, A.M.A., Catry, I., Sutherland, W.J., Palmeirim, J. (2004) Do different habitat
preference methods produce the same conservation recommendations for lesser
kestrels? Animal Conservation 7, 291-300.
Fuller, R.J., Gregory, R.D., Gibbons, D.W., Marchant, J.H., Wilson, J.D., Baillie, S.R.,
Carter, N. (1995) Population declines and range contractions among lowland
farmland birds in Britain. Conservation Biology 9, 1425-1441.
Geiger, F., Hegemann, A., Gleichman, M., Flinks, H., De Snoo, G.R., Prinz, S., Tieleman,
B.I., Berendse, F. (2014) Habitat use and diet of Skylarks (Alauda arvensis)
wintering in an intensive agricultural landscape of the Netherlands. Journal of
Ornithology 15, 507–518
Genghini, M., Gellini, S., Gustin, M., (2006) Organic and integrated agriculture: the
effects on bird communities in orchard farms in northern Italy. Biodiversity
Conservation 15, 3077–309.
Hallmann, R.P.B., Foppen, C.A.M.,van Turnhout, H., de Kroon, E. J. (2014)Declines in
insectivorous birds are associated with high neonicotinoid concentrations Nature,
511, 341–343.
Harrison, X.A., Blount, J.D., Inger, R., Norris, D.R., Bearhop, S. (2011) Carry-over
effects as drivers of fitness differences in animals. Journal of Animal Ecology 80,
4–18.
Herkert, J. R. (1997) Bobolink Dolichonyx oryzivorous population decline in agricultural
landscapes in the Midwestern USA. Biological Conservation 80, 107–112.
Johst, K., Brandl, R., Eber, S. (2002) Metapopulation persistence in dynamic landscapes:
the role of dispersal distance. Oikos 98, 263–270.

99
Kowalczyk, N. D., Chiaradia, A., Preston, T. J., Reina, R. D. (2015) Environmental
variability drives shifts in the foraging behaviour and reproductive success of an
inshore seabird. Oecologia doi: 10.1007/s00442-015- 3294-6.
Levin, R. (1968) Evolution in changing environments; some theoretical explorations.
Princeton, N.J. Princeton University Press.
Loos, J., Dorresteijn, I., Hanspach, J., Fust, P., Rakosy, L., Fischer, J. (2014) Low-
intensity agricultural landscapes in Transylvania support high butterfly diversity:
implications for conservation. PloS One 9, e103256.
Massa, B., Sarà, M. (1982) Dieta comparata del Barbagianni (Tyto alba Scopoli) in
ambienti boschivi, rurali e suburbani della Sicilia. Naturalista siciliano 6, 3-15.
Massa, B. (2011) Gli Ortotteri di Sicilia: check-list commentata. Biogeographia 30, 567–
626.
Myers, N., Mittermeier, R.A., Mittermeier, C.G., da Fonseca, G.A.B., Kent, J. 2000)
Biodiversity hotspots for conservation priorities. Nature 403, 853-858.
Negro, J. J., Donazar, J.A., Hiraldo, F., Hernandez, M.,Fernandez, M. (1993)
Organochlorine and heavy metal contamination in non-viable eggs and its relation
to breeding success in a Spanish population of Lesser Kestrels (Falco naumanni).
Environmental Pollution 82, 201-205.
Newton, I. (2004) The recent declines of farmland bird populations in Britain: an
appraisal of causal factors and conservation actions. Ibis 146, 579–600.
Norris, D. R., P. P. Marra, T. K. Kyser, T. W. Sherry, L. M. Ratcliffe. (2004) Tropical
winter habitat limits reproductive success on the temperate breeding grounds in a
migratory bird. Proceedings of the Royal Society of London B 271, 59–64.

100
Parr, S.J., Collin, P., Silk, S., Wilbraham, J., Williams, N.P. Yarar, M. (1995) A baseline
survey of Lesser Kestrels Falco naumanni in central Turkey. Biological
Conservation 72, 45–53.
Perez – Granados, C. (2010) Diet of adult Lesser Kestrels Falco naumanni during the
breeding season in Central Spain. Ardeola 57(2), 443-448.
R Core Team (2013) R: A language and environment for statistical computing. R
Foundationfor Statistical Computing, Vienna, Austria. URL http://www.R-
project.org/.
Razeng, E., Watson, D. M. (2015) Nutritional composition of the preferred prey of
insectivorous birds: popularity reflects quality. Journal of Avian Biology 46, 89–
96.
Rioux Paquette, S., Pelletier, F.,Garant, D., Be´lisle, M. (2014) Severe recent decrease of
adult body mass in a declining insectivorous bird population. Proceedings Royal
Society B 281, 20140649.
Rizzo, M.C., Massa, B. (1995) Morfologia mandibolare degli Ortotteri in relazione alla
posizione trofica. Phytophaga 6, 205–222.
Rodriguez, C., Tapia, L., Kieny, F., Bustamante, J. (2010) Temporal changes in Lesser
Kestrel (Falco naumanni) diet during the breeding season in southern Spain.
Journal of Raptor Research, 44, 120-128.
Sanderson, F.J., Kucharz, M., Jobda, M., Donald, P.F. (2013) Impacts of agricultural
intensification and abandonment on farmland birds in Poland following EU
accession. Agriculture, Ecosystems and Environment 168, 16–24.

101
Sirami, C., Brotons, L., Burfield, I., Fonderflick, J., Martin, J. L. (2008) Is land
abandonment having an impact on biodiversity? A meta-analytical approach to
bird distribution changes in the north-western Mediterranean. Biological
Conservation 141, 450-459.
Sokos, C.K., Mamolos, A. P., Kalburtji, K.L., Birtsas, P.K. (2013) Farming and wildlife
in Mediterranean agroecosystems. Journal of Nature Conservation 21, 81-92.
Statsoft Inc. (2001) STATISTICA for Windows. Tulsa: Statsoft Inc.
Sumasgutner, P., Nemeth, E., Tebb, G., Krenn, H. W., & Gamauf, A. (2014) Hard times
in the city—Attractive nest sites but insufficient food supply lead to low
reproductive rates in a bird of prey. Frontiers in Zoology 11, 48.
Tella, J.L., Forero, M.G., Hiraldo, F., Donázar, J.A. (1998) Conflicts between Lesser
Kestrel conservation and European agricultural policies as identified by habitat
use analyses. Conservation Biology 12, 593–604.
Triolo, S., Campobello, D., Sarà, M. (2011) Diurnal habitat suitability for a
Mediterranean steppeland bird, identified by Ecological Niche Factor Analysis.
Wildlife Research 38, 152-162.
Zanette, L., Doyle, P., Trémont, S. (2000) Food shortage in small fragments: evidence
from an area-sensitive passerine. Ecology 81(6), 1654–1666.

102
Capitolo 5
Obiettivo 5: Effetti di fattori biotici e abiotici sulle
temperature all’interno di nidi di Grillaio
Campobello D., Lindstrom J., Di Maggio R., Sarà M. The interplay of micro- and
macro-habitat features as a tool to detect climate-driven constraints affecting
conservation status of cavity nesters. Animal Conservation. In revisione.

103
Introduzione
Una parte sempre più estesa della letteratura scientifica dimostra gli effetti del
riscaldamento globale indotto dall’uomo sulla struttura e sulla distribuzione delle
popolazioni e delle comunità di tutti i taxa (Walther et al., 2002; De Frenne et al., 2013).
Un ostacolo nello sviluppo di una chiara conoscenza di questi effetti è dato dal fatto che
gli organismi vanno generalmente alla ricerca di condizioni locali idonee (microhabitat),
mentre i modelli di distribuzione delle specie (MDS) si basano su dati climatici su larga
scala (Potter et al., 2013; Varner & Dearing, 2014). Gli effetti del riscaldamento globale
e l’interazione con altre fonti di stress sono stati tipicamente esaminati o su larga scala o
su scala ridotta, anche se un crescente numero di lavori ha sottolineato l’urgenza di
esplorare meccanismi e dinamiche di fattori a differente scala di osservazione (De Marchi
et al., 2015). Recentemente, Varner & Dearing (2014) hanno mostrato che esiste una
sostanziale differenza tra le temperature misurate nelle stazioni metereologiche, usate nei
MDS, e le temperature del microhabitat, quelle che vengono effettivamente percepite
dagli individui. Conseguentemente, aree considerate non idonee dai classici modelli di
distribuzione delle specie, diventano ottimi rifugi in un’analisi a maggiore risoluzione
(Pearman et al., 2008; Pliscoff et al., 2014).
Analisi su larga scala dei cambiamenti climatici non riflettono la reale
vulnerabilità degli organismi nei confronti dei cambiamenti climatici e di altri fattori di
stress ai quali sono esposti su scala spazio – temporale ridotta (Parmesan, 2006). D’altro
canto, l’analisi delle caratteristiche del microhabitat non forniscono di per se alcuna
indicazione su quale aspetto ambientale è importante per preservare gli organismi dal
global change (Lindström & Forchhammer, 2010). Nonostante il tentativo di Varner &
Dearing (2014) di integrare caratteristiche dell’habitat sia su larga scala che su scala
ridotta, le loro analisi non considerano i potenziali effetti interattivi o cumulativi tra i vari

104
fattori. In quest’ultima parte della tesi, ho usato dati sul Grillaio, uccello nidificante
all’interno di cavità pre-esistenti, che rappresenta un modello eccellente per lo studio delle
interazioni tra fattori biotici e abiotici registrati sia su larga scala (i.e. sito riproduttivo)
che su scala ridotta (i.e. cavità-nido).
Le temperature del nido influenzano sia direttamente che indirettamente tutti gli
stadi riproduttivi degli uccelli (Ardia et al., 2010; De Marchi et al., 2015). Contrariamente
alle aree temperate (Ardia et al., 2010), nelle regioni più calde, alte temperature all’interno
del nido possono influenzare negativamente il tasso di schiusa delle uova (Lei et al., 2014)
e la crescita dei pulcini (Catry et al., 2011).
Tratti comportamentali, come la selezione del sito riproduttivo, possono
rappresentare una misura valida per mitigare le avverse condizioni di nidificazione
quando microambienti idonei sono disponibili per i riproduttori (Ardia et al., 2010; De
Marchi et al., 2015). La selezione del sito riproduttivo dovrebbe essere infatti sotto una
forte pressione selettiva (Both & Visser, 2001; Gienapp et al., 2006). Risorse di elevata
qualità sono infatti limitate in natura. Sin dalla prima definizione dell’ Ideal Free
Distribution, ci sono molte evidenze che mostrano come, quando le risorse variano per
qualità, le migliori sono occupate per prime mentre le altre sono utilizzate solo
successivamente (Fretwell & Lucas, 1970; Pulliam & Danielson, 1991).
In questo studio, ho esaminato le potenziali interazioni tra le temperature registrate
su larga scala (i.e. dalle stazioni meteorologiche) e su scala ridotta (i.e. attraverso dei
termometri all’interno dei nidi) in una popolazione di Grillaio che nidifica nella Piana di
Gela (Sicilia). La riproduzione e la dimensione delle popolazioni di Grillaio è influenzata
da fattori ambientali, sia su larga scala che su scala ridotta, come le piogge o
l’orientamento dei nidi (Rodriguéz & Bustamante, 2003; Sarà, 2010; Catry et al., 2011),
sebbene non sia ancora chiaro se le due scale di misurazione siano collegate e se gli

105
individui rispondano alla variazione di temperatura tra i nidi. Inoltre, i Grillai
rappresentano un modello eccezionale per rispondere a queste domande e fornire
indicazioni di conservazione. Dal momento che il Grillaio si trova in uno stato di
conservazione altalenante (Sarà, 2010; Iñigo & Barov, 2011) e a causa di una improvvisa
riduzione dei siti riproduttivi sono stati aggiunti siti artificiali per fornire più opportunità
riproduttive.
Materiali & Metodi
Lo studio è stato condotto per un periodo di nove anni, da aprile a luglio 2004-2013 con
eccezione del 2008 per un totale di 1.157 nidi monitorati in 35 colonie. Ciascun nido è
stato controllato da tre a sei volte per stagione in modo da registrare la tipologia di nido
(Box [B], Buco [H], Tegola [T]), le caratteristiche del nido (volume cm3), l’esposizione
e il primo giorno di deposizione. Inoltre, sono stati quantificati il numero di pulcini trovati
nei nidi e la loro età (Sarà et al., 2012).
Il SIAS (Servizio Informativo Agro-metereologico Siciliano) è un sistema
regionale di 96 stazioni meteorologiche automatiche che registrano la temperatura,
l’umidità e la velocità del vento ogni ora. Ho usato una di queste stazioni localizzata a
70 m s. l. m. in prossimità della Piana di Gela (4112703N; 440838E) e a circa 2-8 km
dalle colonie di Grillaio per ottenere le temperature orarie durante la stagione
riproduttiva. Negli ultimi quattro anni di studio, 2010-2013, in 11 colonie, sono stati
posizionati 100 termologger HOBO U12-012 (Onset Computer Corporation, Bourne,
MA, USA) che registravano ogni ora la temperatura, all’interno di 108 nidi (23 in 2010,
23 in 2011, 25 in 2012, 37 in 2013) di cui dieci nelle cassette nido (Box), 46 nei buchi

106
dei muri e 52 sotto le tegole. Otto di questi nidi sono falliti all’inizio della stagione e i
termologger sono stati riposizionati in altri otto nidi. Nel 74% dei casi, i termologger
hanno registrato la temperatura sin dal primo giorno di deposizione del primo uovo fino
all’involo dei pulcini o al fallimento del nido, mentre nel resto dei nidi la temperatura è
stata registrata partendo dal primo fino al 34esimo giorno dalla deposizione del primo
uovo. Questo è dovuto al fatto che non è stato sempre possibile stabilire l’esatta
posizione dei nidi. Una volta rimossi dai nidi i dati sono stati scaricati con il software
HOBO (versione 3.7.0).
Analisi statistiche
Ho usato Modelli lineari misti (e.g. Zuur et al., 2009) per studiare il ruolo di fattori biotici
e abiotici registrati a differenti scale di osservazione per predire il microclima del nido.
Ho usato una distribuzione normale con la temperatura del nido come variabile di
risposta. Per la classificazione e comparazione dei modelli, ho usato l’Akaike’s
Information Criterion (AIC, e.g. Symonds & Moussalli, 2011) e il Likelihood Ratio
Testing (LRT). Le analisi sono state effettuate con il software R 3.0.1 (R Core Team,
2013) e il pacchetto lme4 (Bates et al., 2013). Prima di eseguire le analisi, è stata
controllata la co-linearità tra i predittori utilizzando il Variance Inflation Factor (VIF) e
escludendo tutti quei valori con un VIF maggiore di due (Zuur et al., 2009). In particolare,
ho esaminato la potenziale dipendenza della temperatura oraria del nido dalle seguenti
variabili: temperatura ambientale oraria (AmbT, C°, continua), volume del nido (cm3),
tipologia di nido (Box[B], Buco [H], Tegola [T]), esposizione del nido (categorica, due
livelli, Fresco e Caldo), numero di pulcini (numerica, 1-5), età dei pulcini (categorica: a
= 1-7, b = 8-14, c = 15-21, d = 22-28 giorni dopo la schiusa). La temperatura ambientale
è stata registrata dalle stazioni meteorologiche della Piana di Gela. Un nido è stato
classificato come “Fresco” se esposto a Ovest, Nord-Ovest, Nord, Nord- Est, mentre è

107
stato classificato come “Caldo” se esposto a Est, Sud-Est, Sud e Sud –Ovest. Ciascuna
classe di età dei pulcini ha una durata di sette giorni ed è stata determinata dalla
dimensione dei pulcini e dalla crescita delle penne registrate durante il controllo ai nidi.
L’identità del nido, della colonia e dell’anno sono stati trattati come fattori random dei
modelli (Millar & Anderson, 2004). In accordo con i risultati ottenuti, i Grillai dovrebbero
preferire i nidi sotto le tegole, più freschi rispetto agli altri (si vedano i risultati). Dal
momento che i tetti dei casolari in cui nidifica il Grillaio stanno crollando, ho ipotizzato
che le tegole potessero essere una risorsa limitante e, di conseguenza, sarebbero state
utilizzate per prime mentre gli altri nidi sarebbe rimasti a disposizione degli altri
conspecifici. Nei casolari non è possibile verificare l’idoneità di ciascuna tegola come
nido per i Grillai e di conseguenza, non è possibile stimare il numero totale di nidi
disponibili. Senza una quantificazione della disponibilità non è possibile verificare una
preferenza verso un particolare nido. Nonostante ciò, ho verificato se gli organismi che
per primi iniziavano a riprodursi preferivano nidificare sotto le tegole utilizzando una
ANOVA a una via, dove il primo giorno di deposizione rappresentava la variabile di
risposta e la tipologia di nido (due livelli: buco e tegola) la variabile indipendente. Ho
escluso le colonie con cassette nido perché posizionate solo da 4 anni e di conseguenza
non comparabili con gli altri anni.
Risultati
Durante la stagione riproduttiva, le temperature all’interno del nido erano influenzate
dalle temperature ambientali. Il modello che include soltanto questa variabile, però, si
colloca al 25esimo posto nella Tabella 1, indicando che la temperatura ambientale da sola
è insufficiente a spiegare la variazione delle temperature microclimatiche. Il modello
migliore include, insieme alle temperature ambientali, anche l’età dei pulcini, il numero,

108
la tipologia del nido e l’interazione tra numero ed età dei pulcini (Tabella 1). I nidi con
un elevato numero di pulcini diventavano più caldi al crescere dei pulcini stessi
(Figura1A).
Per esempio, quando la temperatura ambientale media era tra 25 e 26°C, un nido
con pulcini giovani (età a e b) raggiungeva una media giornaliera di 27.9°C (n = 53)
mentre nidi con pulcini più grandi (età c e d, n = 96) raggiungevano una temperatura
giornaliera di 28.7°C. Con la stessa temperatura ambientale, nidi con 1-2 pulcini giovani
(età a) raggiungevano temperature di 27.0°C (n =5) mentre raggiungevano temperature
di 30°C con 5 pulcini grandi (età d, n = 10). Le cassette nido (box) rappresentano i nidi
più caldi (temperatura media giornaliera ± ES, 24.9 ± 0.1°C, n = 630), le tegole il nido
più fresco (21.7 ± 0.1°C, n = 3036) e i buchi avevano una temperature intermedia (22.7
± 0.1°C, n = 2625; Fig. 1B).

109
Tabella 1 Set completo dei modelli risultanti dall’analisi GLMMs. In quest’analisi sono stati testati fattori abiotici (caratteristiche del nido e temperature)
e biotici (numero ed età dei pulcini) sulla temperatura registrata all’interno di 108 nidi di Grillaio.
N
Modelli
Modelli Estimate ES AIC C AIC
weight
Numero di
Parametri
1 AmbT+ Età_pulc + N_Pulc +Tipo_nido+ N_Pulc * Età_pulc 192348.50 0.00 0.69 13
AmbT 0.611 0.00
Età_pulc _b 1.143 0.10
Età_pulc _c 1.217 0.10
Età_pulc _d 2.027 0.11
N_Pulc 0.043 0.03
Tipo_nido_buco -0.388 0.45
Tipo_nido_tegola -2.358 0.46
Età_pulcb* N_Pulc -0.021 0.03
Età_pulcc* N_Pulc 0.312 0.03
Età_pulcd* N_Pulc 0.294 0.04
2 Amb_T + Età_pulc+ N_Pulc + Tipo_nido + Esposizione + Età_pulc* N_Pulc 192350.40 1.90 0.27 14
3 Amb_T + Età_pulc+ N_Pulc + Tipo_nido + Esposizione + Età_pulc* N_Pulc + Tipo_nido
* Esposizione
192353.90 5.40 0.05 16

110
4 Amb_T + Età_pulc+ N_Pulc + Esposizione + Età_pulc* N_Pulc 192384.80 36.30 0.00 12
5 Amb_T + Età_pulc+ N_Pulc + Età_pulc* N_Pulc 192385.80 37.30 0.00 11
6 Amb_T + Età_pulc+ N_Pulc + Tipo_nido 192520.50 172.00 0.00 10
7 Amb_T + Età_pulc+ N_Pulc + Tipo_nido + Esposizione 192522.40 173.90 0.00 11
8 Amb_T + Età_pulc+ N_Pulc + Tipo_nido + Esposizione + Tipo_nido * Esposizione 192526.00 177.50 0.00 13
N
Modelli
Modelli AIC C AIC
weight
Numero di
Parametri
9 Amb_T + Età_pulc+ Tipo_nido 192549.30 200.80 0.00 9
10 Amb_T + Età_pulc+ Tipo_nido + Esposizione 192551.10 202.60 0.00 10
11 Amb_T + Età_pulc+ Tipo_nido + Esposizione + Tipo_nido * Esposizione 192554.40 205.90 0.00 12
12 Amb_T + Età_pulc+ N_Pulc + Esposizione 192556.10 207.60 0.00 10
13 Amb_T + Età_pulc+ N_Pulc 192557.20 208.70 0.00 8
14 Amb_T + Età_pulc+ Esposizione 192585.60 237.10 0.00 8
15 Amb_T + Età_pulc 192587.20 238.70 0.00 7
16 Amb_T + N_Pulc + Tipo_nido 196190.10 3841.60 0.00 7
17 Amb_T + N_Pulc + Tipo_nido + Esposizione 196191.10 3842.60 0.00 8
18 Amb_T + N_Pulc + Tipo_nido + Esposizione + Tipo_nido * Esposizione 196191.90 3843.40 0.00 10

111
19 Amb_T + N_Pulc + Esposizione 196228.40 3879.90 0.00 6
20 Amb_T + N_Pulc 196231.80 3883.30 0.00 5
21 Amb_T + Tipo_nido 714760.00 522411.50 0.00 6
22 Amb_T + Tipo_nido + Esposizione 714761.40 522412.90 0.00 7
23 Amb_T + Tipo_nido + Esposizione + Tipo_nido * Esposizione 714762.70 522414.20 0.00 9
24 Amb_T + Esposizione 714808.00 522459.50 0.00 5
25 Amb_T 714811.90 522463.40 0.00 4
Amb_T = temperature ambientale oraria °C; Età_pulc= età dei pulcini, (a = più giovani, d = più grandi); N_Pulc= numbero di pulcini (1-5);
Tipo_nido = tipologia di nido
.

112
Fig. 1. Fattori biotici (età dei pulcini), A) e abiotici (temperature ambientale per tipologia di nido, B)
come migliori predittori della temperatura del nido.

113
Fig. 2. Inizio della nidificazione, espresso come primo giorno di deposizione di 837 nidi di Grillaio
nidificanti in 16 colonie durante nove stagioni riproduttive (2004- 2013 con l’eccezione del 2008).
Un sottocampione di 837 nidi in 16 colonie ha mostrato come le coppie che
occupavano le tegole avevano cominciato a riprodursi per prime (il giorno giuliano di
inizio della deposizione nelle tegole era 115 ± 0.4 mentre nei buchi era 118 ± 0.5; F1,835
= 17.0, p < 0.0001, Fig. 2) rispetto a quelle nidificanti nei buchi in accordo con una
preferenza per le tegole.
Discussione
In questo studio, la temperatura del nido (i.e. microclima) dipende sia da fattori biotici
che abiotici. Il microclima è, non a sorpresa, dipendente dalle temperature ambientali
registrate dalle stazioni meteorologiche vicine. Nonostante ciò, queste non sono in grado
di predire da sole le condizioni all’interno del nido che, invece, sono determinate sia dalla

114
tipologia del nido che dal numero e dall’età dei pulcini. Le condizioni microclimatiche
più fresche si riscontravano nelle tegole dei tetti che venivano occupate dagli individui
che per primi iniziavano a nidificare. Al contrario e paradossalmente, con l’aumento delle
temperature nell’ultima parte della stagione riproduttiva, gli individui che si
riproducevano tardivamente occupavano i buchi dei muri dove si raggiungevano le
temperature più elevate. Di conseguenza, le tegole potrebbero rappresentare una risorsa
limitata preferita dai primi riproduttori con le coppie che si riproducono successivamente
costrette a occupare i nidi rimanenti. Questo sarebbe in linea con la Ideal Pre –emptive
Distribution teorizzata da Pulliam & Danielson (1991) in accordo alla quale, i territori
migliori sono occupati per primi e non sono più disponibili per gli altri.
Gli studi sui cambiamenti climatici solitamente si soffermano sugli effetti delle
temperature su larga scala (Skagen & Adams, 2012; Pliscoff et al., 2014). Alcuni aspetti
fisiologici, come lo stress alle alte temperature, sono stati recentemente integrati in
modelli meccanicistici che però includevano solo le temperature ambientali e non quelle
microclimatiche (Angilletta et al., 2006). In questo studio è mostrato come le condizioni
ambientali del microclima rappresentano componenti fondamentali nella valutazione
dell’ambiente in cui un organismo vive e devono essere necessariamente integrate nei
Modelli di Distribuzione delle Specie in modo da poter fare delle previsioni realistiche
sulla distribuzione futura delle specie (Ardia et al., 2010).
Lo stress termico può ridurre le performance fisiologiche delle organismi e
persino la sopravvivenza, soprattutto al di sopra di una specifica soglia (Violle et al.,
2007; Oswald & Arnold, 2012). Alte temperature inducono disidratazione sia nelle uova
che nei pulcini (Catry et al., 2001). Può inoltre determinare un effetto negativo a cascata
quando i genitori, spendendo meno tempo al nido, aumentano il rischio di infezioni
microbiche e di predazione per le uova e diminuiscono la sincronia di schiusa

115
determinando un potenziale aumento della mortalità dei pulcini (Cook et al., 2005). In
accordo, lavori precedenti hanno dimostrato una riduzione del tasso di schiusa e di involo
all’aumentare delle temperature (Catry et al., 2001).
La selezione del sito riproduttivo è un tratto comportamentale molto efficace nel
mitigare gli effetti del surriscaldamento. I Grillai sono capaci di valutare la differente
qualità dei siti riproduttivi come mostrato nelle popolazioni spagnole (Serrano & Tella,
2007). Questa specie è inoltre caratterizzata da una distribuzione dispotica, con gli
individui adulti e con maggiore esperienza che monopolizzano le risorse migliori mentre
i giovani vengono relegati nelle colonie di bassa qualità (Serrano & Tella, 2007). Come
detto precedentemente, i risultati sono coerenti con una limitazione delle tegole
probabilmente per un graduale ma costante crollo delle strutture che ospitano i Grillai.
Basandosi sui risultati ottenuti e sulla conoscenza della specie, le temperature nei
siti di nidificazione dei Grillai aumenteranno (IPCC, 2014). Di conseguenza, la migliore
misura di conservazione dovrebbe essere quella di mantenere e ristrutturare le strutture in
cui nidifica la specie, sebbene questo implichi costi proibitivi.
Nelle scenario globale dell’aumento delle temperature, la riduzione della tipologia
di nido migliore potrebbe plausibilmente influenzare l’andamento della popolazione. Il
declino dovuto al deterioramento della qualità dell’habitat potrebbe infatti essere
esacerbato dalla mancanza di siti di nidificazione ottimali. Meccanismi microevolutivi
potrebbero modificare tratti comportamentali sottoposti a pressioni selettive in modo da
massimizzare la fitness in risposta ai cambiamenti ambientali (Visser, 2008). Dai risultati
mostrati, anche la riduzione delle covate potrebbero rendere più freschi i nidi. La
riduzione del numero di uova deposte, però, è un tratto non facilmente modificabile nel
breve periodo soprattutto per i rapaci (Cooper et al., 2005), sensibili soprattutto al primo
giorno di deposizione (Daan et al., 1990).
116
In conclusione, le previsioni future sulla distribuzione delle specie e delle
comunità dovrebbe integrare anche un’analisi su scala ridotta. Il Grillaio sembrerebbe
essere un sistema ideale per creare modelli a livello individuale e non di popolazione.
Studi futuri dovrebbero essere indirizzati verso un’analisi dettagliata delle risposte
fisiologiche delle uova e dei pulcini al surriscaldamento e alla quantificazione delle
differenze tra le tipologie di nidi dal punto di vista microclimatico al fine di migliorare le
attuali azioni di gestione.

117
Bibliografia
Angilletta, M.J., Oufiero, C.E., Leache, A.D. (2006) Direct and indirect effects of
environmental temperature on the evolution of reproductive strategies: an
information-theoretic approach. American Naturalist, 168, E123-E135.
Ardia, D.R., Pérez, J.H., Clotfelter, E.D. (2010) Experimental cooling during incubation
leads to reduced innate immunity and body condition in nestling tree swallows.
Proceedings of the Royal Society Series B, 277, 1881-1888.
Bates, D., Maechler, M., Bolker, B., Walker, S. (2013) lme4: Linear mixed-effects
models using Eigen and S4. R package version 1.0-5. http://CRAN.R-
project.org/package=lme4.
Both, C.,Visser, M.E. (2001) Adjustment to climate change is constrained by arrival date
in a long-distance migrant bird. Nature, 411, 296-298.
Catry, I., Franco, A.M.A., Sutherland, W.J. (2011) Adapting conservation efforts to face
climate change: modifying nest-site provisioning for lesser kestrels. Biological
Conservation, 144, 1111-1119.
Cook, M.I., Beissinger, S.R., Toranzos, G.A. (2005) Microbial infection affects egg
viability and incubation behavior in a tropical passerine. Behavioral Ecology, 16,
30-36.
Cooper, C.B., Hochachka, W.M., Butcher, G., Dhondt, A.A. (2005) Seasonal and
latitudinal trends in clutch size: thermal constraints during laying and incubation.
Ecology, 86, 2018-2031.
Daan, S., Dijkstra, C., Tinbergen, J.M. (1990) Family planning in the kestrel (Falco
tinnunculus): the ultimate control of covariation of laying date and clutch size.
Behaviour,114, 83-116.

118
De Frenne, P., Rodríguez-Sánchez, F., Coomes, D.A., Baeten, L., Verstraeten, G., Vellen,
M., Bernhardt-Römermann, M., Brown, C.D., Brunet, J., Cornelis, J., Decocq,
G.M., Dierschke, H., Eriksson, O., Gilliam, F.S., Hédl, R., Heinken, T., Hermy, M.,
Hommel, P., Jenkins, M.A., Kelly, D.L., Kirby, K.J., Mitchell, F.J.G., Naaf, T.,
Newman, M., Peterken, G., Petrík, P., Schultz, J., Sonnier, G., Van Calster, H.,
Waller, D.M., Walther, G.-R., White, P.S., Woods, K.D., Wulf, M., Graae, B.J.,
Verheyen, K. (2013) Microclimate moderates plant responses to macroclimate
warming. Proceedings of the National Academy of Sciences USA, 110, 18561-
18565.
De Marchi, G., Chiozzi, G., Dell'Omo, G., Fasola M. 2015. Low incubation investment
in the burrow-nesting crab plover Dromas ardeola permits extended foraging on a
tidal food resource. Ibis, 157, 31-43.
Fretwell, S. D., Lucas, H. L. (1970) On territorial behaviour and other factors influencing
habitat distribution in birds. Acta Biotheretica 19, 16-36.
Gienapp, P., Postma, E., Visser, M.E. (2006) Why breeding time has not responded to
selection for earlier breeding in a songbird population. Evolution, 60, 2381-2388.
Iñigo, A., Barov, B. (2011) Action Plan for the lesser kestrel Falco naumanni in the
European Union. – SEO-BirdLife, BirdLife International for the European
Commission.
IPCC (2014). Fifth Assessment Report. https://www.ipcc.ch/report/ar5
Lei, B.R., Green, J.A., Pichegru, L. (2014) Extreme microclimate conditions in artificial
nests for Endangered African Penguins. Bird Conservation International, 24, 201-
213.

119
Lindström, J., Forchhammer, M. C. (2010) Time-series analyses. In: Effects of Climate
Change on Birds. (Møller, A. P., Fiedler, W. & Berthold, P. Eds). Oxford University
Press, New York, NY. pp. 57-66.
Oswald, S.A., Arnold, J.M. (2012) Direct impacts of climatic warming on heat stress in
endothermic species: seabirds as bioindicators of changing thermoregulatory
constraints. Integrative Zoology, 7, 121-136.
Parmesan, C. (2006) Ecological and evolutionary responses to recent climate change.
Annual Review of Ecology and Systematics, 37, 637-669.
Pearman, P.B., Guisan, A., Broennimann, O., Randin, C.F. (2008) Niche dynamics in
space and time. Trends in Ecology and Evolution, 23, 149-158.
Pliscoff, P., Luebert, F., Hilger, H.H., Guisan, A. (2014) Effects of alternative sets of
climatic predictors on species distribution models and associated estimates of
extinction risk: A test with plants in an arid environment. Ecological Modelling,
288, 166-177.
Potter, K.A., Woods, H.A., Pincebourde, S. (2013). Microclimatic challenges in global
change biology. Global Change Biology, 19, 2932-2939.
Pulliam, H.R., Danielson, B.J. (1991). Sources, sinks and habitat selection: a landscape
perspective on population dynamics. American Naturalist, 137, 50–66.
R Core Team 2013 R: A language and environment for statistical computing. R
Foundation for Statistical Computing, Vienna, Austria. URL http://www.R-
project.org/.
Rodriguéz, C., Bustamante, J. (2003) The effect of weather on lesser kestrel breeding
success: can climate change explain historical population declines? Journal of
Animal Ecology, 72, 793-810.

120
Sarà, M. (2010) Climate and land-use changes as determinants of lesser kestrel Falco
naumanni abundance in Mediterranean cereal steppes (Sicily). Ardeola (Special),
57, 3-22.
Serrano, D., Tella, J.L. (2007) The role of despotism and heritability in determining
settlement patterns in the colonial lesser kestrel. American Naturalist 169, 53-67.
Skagen, S.K., Adams, A.A.Y. (2012) Weather effects on avian breeding performance and
implications of climate change. Ecological Applications, 22, 1131-1145.
SIAS (2015, July 8) Servizio Informativo Agrometereologico Siciliano. Retrieved from
http://www.sias.regione.sicilia.it/
Symonds, M.R.E., Moussalli, A. (2011) A brief guide to model selection, multimodel
inference and model averaging in behavioural ecology using Akaike's information
criterion. Behavioral Ecology and Sociobiology, 65, 13-21.
Varner, J., Dearing, M.D. (2014) The importance of biologically relevant microclimates
in habitat suitability assessments. Plos One, 9, e104648.
Violle, C., Navas, M.-L., Vile, D., Kazakou, E., Fortunel, C., Hummel, I., Garnier, E.
(2007) Let the concept of trait be functional! Oikos, 116, 882-892.
Visser, M.E. (2008) Keeping up with a warming world; assessing the rate of adaptation
to climate change. Proceedings of the Royal Society Series B, 275, 649-659 .
Walther, G.-R., Post, E., Convey, P., Menzel, A., Parmesan, C., Beebee, T.J.C.,
Fromentin, J.-M., Hoegh-Guldberg, O., Bairlein, F. (2002) Ecological responses to
recent climate change. Nature, 416, 389-395.
Zuur, A.F., Ieno, E.N., Walker, N., Saveliev, A.A., Smith, G.M. (2009) Mixed Effects
Models and Extensions in Ecology with R. Springer, New York, New York, USA.

121
Risultati generali & Conclusioni
L’approccio seguito in questa tesi abbraccia numerosi argomenti come la distribuzione
del Grillaio, i fattori che determinano la sua probabilità di sopravvivenza, la dieta e il
microclima. In una delle sub-popolazioni oggetto di questo studio (i.e. la Piana di Gela),
l’aggregazione dei nidi e la sincronia riproduttiva aumentano la sopravvivenza delle uova
e dei pulcini dei Grillai che nidificano nel loro tipico habitat pseudosteppico. Gli individui
che nidificano circondati da molti conspecifici a breve distanza e sincronizzati nella
riproduzione, involano più pulcini rispetto alle coppie più isolate e asincrone (Capitolo
1).
Numerosi studi hanno evidenziato risultati contrastanti dell’effetto della
dimensione della colonia sul successo riproduttivo e sulla dispersione del Grillaio
(Serrano et al., 2004; Serrano & Tella, 2007; Calabuig et al., 2010). Gli individui che si
disperdono sono spesso al loro primo tentativo di riproduzione (Jovani et al., 2008;
Serrano & Tella, 2012). Essi non possono nidificare in colonie grandi a causa della
presenza delle coppie filopatriche e territoriali e, di conseguenza, possono diventare
fondatori di nuove piccole colonie (Serrano & Tella, 2007, Calabuig et al., 2010).
I miei risultati mostrano che, nella Piana di Gela, l’aggregazione dei nidi e la
dimensione della colonia non contribuiscono singolarmente ad aumentare il successo
riproduttivo, ma agiscono in sinergia per influenzare la fitness dei Grillai. I meccanismi
che sottendono questi risultati possono essere correlati con un aumento dell’efficienza di
foraggiamento e/o con un aumento dei vantaggi anti-predatori, che è coerente con
l’ipotesi dello scambio di informazione per la localizzazione di buone aree di
foraggiamento (Ward & Zahavi, 1973; Campobello & Hare, 2007).
Le informazioni sulle aree di foraggiamento non risultano più affidabili quando le
attività di origine antropica cambiano rapidamente gli habitat (Aparicio et al., 2007). Le

122
attività umane possono modificare negativamente l’habitat intorno a una colonia ed avere
conseguenze negative su innumerevoli caratteristiche di una popolazione tra cui la
struttura genetica e la parentela tra individui. Nel Capitolo 2, ho condotto un’analisi
genetica di due sub-popolazioni di Grillaio e non sono state riscontrate differenze di
parentela né all’interno della colonia né tra colonie diverse. Questo risultato descrive la
presenza di una network di colonie che potrebbe facilitare lo scambio di individui e
rendere di conseguenza più omogeneo il livello di parentela. Inoltre, l’analisi
bidimensionale (Capitolo 2) ha evidenziato la presenza di una struttura genetica a isola
(già descritto da Dixon et al., 2007) in cui gli individui meno imparentati si ritrovavano
in colonie localizzate al centro della piana agricola dove è stato quantificato il maggiore
livello di disturbo antropico. Al contrario, le colonie localizzate ai margini della Piana, la
zona meno disturbata, erano caratterizzate da una elevata parentela tra pulcini. Di
conseguenza, è coerente con i miei risultati che l’aumento del disturbo antropico, dovuto
all’intensificazione delle pratiche agricole, potrebbe influenzare il comportamento
filopatrico del Grillaio (Ortego et al., 2008) spingendo gli individui lontano dalle colonie
di nascita e di conseguenza riducendone la parentela.
Le pratiche agricole intensive hanno altre conseguenze negative sulla popolazione
di Grillaio della Piana di Gela. Nel Capitolo 3, il monitoraggio a lungo termine della
popolazione e l’analisi delle riletture/ricatture degli individui hanno evidenziato una forte
influenza sia dell’uso del suolo che della dimensione della colonia sull’andamento
demografico dei Grillai e inoltre come questi due fattori interagiscano per determinare la
demografia della specie. In questo studio, ho riscontrato un effetto opposto della
dimensione della colonia sulla sopravvivenza dei giovani e sulla fecondità. Nei giovani
Grillai, la dimensione della colonia gioca un ruolo positivo sulla probabilità di
sopravvivenza, ma ha, invece, un forte effetto negativo sulla fecondità con il numero di

123
pulcini per coppia che si riduce all’aumentare del numero di coppie presenti. Questi
risultati consentono inoltre di identificare un valore ottimale medio (i.e. 18-20 coppie)
che rappresenta un buon compromesso tra la sopravvivenza dei giovani e la fecondità,
con un basso numero di giovani con una maggiore sopravvivenza nelle colonie di
maggiori dimensioni.
L’uso del suolo ha inoltre un effetto molto forte sulla probabilità di sopravvivenza
degli adulti e sul tasso di accrescimento della popolazione (Capitolo 3). Questo effetto
dell’habitat ha rivelato la inadeguatezza per il Grillaio delle aree ad agricoltura intensiva
rispetto alle aree incolte. Quest’ultime rappresentano elementi tradizionali del paesaggio
importanti per il Grillaio e per gli uccelli pseudosteppici (Franco et al., 2004; Catry et al.,
2014). Inoltre, anche il carciofeto, tipica coltura invernale, rappresenterebbe un habitat di
elevata qualità grazie alla disponibilità di prede.
Il tasso di accrescimento della popolazione indica un declino della popolazione in
tutti e tre gli habitat studiati, sebbene ridotto nelle colonie circondate da incolto e
carciofeto e molto più alto nelle colonie che si trovano in aree arate. L’analisi di sensibilità
ed elasticità ha evidenziato che la sopravvivenza degli adulti rappresenta il parametro con
il maggiore effetto sul tasso di accrescimento della popolazione, suggerendo che
l’andamento demografico è guidato dalla classe degli adulti. Di conseguenza, la strategia
di conservazione migliore dovrebbe basarsi sulla gestione degli usi del suolo nell’area e
sulle cause dirette della mortalità degli adulti in modo da ritornare alle pratiche agricole
estensive presenti all’inizio dello studio e promuovere colture non tradizionali come i
carciofeti.
Questo è particolarmente importante alla luce dei risultati mostrati nel Capitolo 4
dove la tipologia dell’habitat ha l’effetto maggiore sulla dieta del Grillaio soprattutto per
quello che riguarda la biomassa ingerita e il numero di prede nelle borre. Nello specifico,

124
la biomassa ingerita è risultata maggiore negli habitat a prevalenza di incolto e carciofeto
mentre il numero di prede per borra è risultata maggiore solo nell’incolto. Come detto
precedentemente, questi risultati concordano con a quelli relativi alla sopravvivenza e al
tasso di accrescimento della popolazione (Capitolo 3) e consentono di concludere che i
carciofeti possono rappresentare habitat idonei per il Grillaio grazie all’elevata
disponibilità di prede e alla maggiore accessibilità dovuta alla struttura della vegetazione.
Dall’altro canto, gli habitat a prevalenza di cerealicolo rappresentano gli habitat
peggiori per il Grillaio in quanto l’altezza delle copertura della vegetazione determina
una bassa accessibilità alle prede e l’uso dei biocidi, insieme con l’utilizzo dei macchinari,
riduce la biomassa delle prede (Garcia et al., 2006). Infatti, come mostrato da Catry et al.,
(2014) soltanto durante la mietitura, i cereali rappresentano un habitat ottimale per
l’aumento temporaneo della disponibilità di cibo.
Infine, nel Capitolo 5, ho studiato la possibile interazione di fattori biotici e
abiotici nel determinare il microclima del Grillaio. Ho trovato che le caratteristiche
macroclimatiche da sole (i.e. temperatura ambientale registrata nelle stazioni
meteorologiche) non sono in grado di predire le temperature all’interno del nido le quali
risultano influenzate anche dalla tipologia di nido (con le tegole più fresche rispetto agli
altri nidi) insieme al numero e all’età dei pulcini. Questi risultati mostrano il vantaggio di
integrare caratteristiche ambientali su scala ridotta all’interno di modelli predittivi della
distribuzione del Grillaio sebbene sembra che quest’ultimo non sia in grado di modificare
la dimensione della covata o la selezione del sito riproduttivo in accordo alle differenti
temperature dei nidi. Nonostante ciò, gli individui che iniziano a riprodursi per primi
nidificano preferenzialmente sotto le tegole piuttosto che dentro ai buchi, indicando che
le tegole potrebbero rappresentare una risorsa limitata ma preferita. Questo è coerente con
la Ideal Pre-emptive Distribution di Pulliam & Danielson (1991), in accordo alla quale i

125
territori migliori sono occupati per primi e non risultano più disponibili per gli altri.
Similmente, come secondo modo per far fronte ai nidi con alte temperature, i Grillai non
riducono il numero di uova deposte. Questo è probabilmente dovuto al fatto che questi
effetti della temperatura sono troppo recenti per aver innescato risposte evolutive o,
parallelamente, è possibile che limitazioni di tipo ecologico prevengano questi
adattamenti.
In conclusione, i risultati di questa tesi di dottorato confermano il ruolo della
dimensione della colonia come un driver importante della dinamica di uccelli coloniali.
Inoltre, mostrano come la distribuzione e la sopravvivenza dei Grillai seguano un
complesso pattern che coinvolge fattori biotici e abiotici e che questa specie è suscettibile
ai cambiamenti climatici e alle modificazioni dell’habitat. Questo dimostra la sensibilità
del Grillaio alle condizioni ecologiche e il suo ruolo come “Sentinella alata” dei
cambiamenti globali dell’ambiente (Wormworth & Şekercioğlu, 2011). Nonostante
debbano essere considerati altri aspetti, questa tesi ha fornito dei risultati che possono
essere considerati utili per la realizzazione di misure di conservazione con lo scopo di
rallentare e fermare il declino degli uccelli pseudosteppici.

126
Bibliografia
Aparicio, J.M., Bonal, R., Munoz, A. (2007) Experimental test on public information use
in the colonial lesser kestrel. Evolutionary Ecology 21, 783–800.
Calabuig, G., Ortego, J., Cordero, P.J., Aparicio, J.M. (2010) Colony foundation in the
lesser kestrel: patterns and consequences of the occupation of empty habitat
patches. Animal Behaviour 80, 975-982.
Campobello, D., Hare, J.F. (2007) Information transfer determined by association of
neighbours in European Bee-eater (Merops apiaster) colonies. Ethology Ecology
and Evolution 19, 237-243.
Catry, I., Franco, A.M.A., Moreira, F. (2014) Easy but ephemeral food: exploring the
trade-offs of agricultural practices in the foraging decisions of lesser kestrels on
farmland. Bird Study 1, 1-10.
Dixon, J.D., Oli, M.K., Wooten, M.C., Eason, T.H., Mccown, J.W., Cunningham, M.W.
(2007) Genetic consequences of habitat fragmentation and loss: the case of the
Florida black bear (Ursus americanus floridanus). Conservation Genetics 8, 455–
464.
Franco, A.M.A., Catry, I., Sutherland, W.J., Palmeirim, J. (2004) Do different habitat
preference methods produce the same conservation recommendations for lesser
kestrels? Animal Conservation 7, 291-300.
García, J. T., Morales, M. B., Martínez, J., Iglesias, L., García de la Morena, E., Suárez,
F., Viñuela, J. (2006) Foraging activity and use of space by lesser kestrel Falco
naumanni in relation to agrarian management in central Spain. Bird
Conservation International 16, 83-95.
Jovani, R., Serrano, D., Ursua, E., Tella, J.L. (2008) Truncated power laws reveal a link
between low-level behavioral processes and grouping patterns in a colonial bird.
PLoS One 3, e1992. doi: 10.1371/journal.pone.0001992.

127
Ortego, J., Calabuig, G., Aparicio, J.M., Cordero, P.J. (2008) Genetic consequences of
natal dispersal in the colonial lesser kestrel. Molecular Ecology 17, 2051–2059.
Pulliam, H.R., Danielson, B.J. (1991) Sources, sinks and habitat selection: a landscape
perspective on population dynamics. American Naturalist 137, 50–66.
Serrano, D., Forero, M.G., Donazar, J.A., Tella, J.L. (2004) Dispersal and social attraction
affect colony selection and dynamics of lesser kestrels. Ecology 85, 3438-3447.
Serrano, D., Tella, J.L. (2007) The role of despotism and heritability in determining
settlement patterns in the colonial lesser kestrel. American Naturalist 69, E53-E67.
Serrano, D., Tella, J.L. (2012) Lifetime fitness correlates of natal dispersal distance in a
colonial bird. Journal of Animal Ecology 81, 97-107.
Ward, P., Zahavi, A. (1973) The importance of certain assemblages of birds as
“information-centres” for food finding. Ibis 115, 517-534.
Wormworth, J., Şekercioğlu, C. (2011) Winged sentinels. Birds and climate change.
Cambridge University Press, Cambridge, UK.

128
Ringraziamenti Per prima cosa vorrei ringraziare il prof. Maurizio Sarà per avermi dato la possibilità di
svolgere la tesi di dottorato nel suo laboratorio e per avermi guidato nell’intricato mondo
dei rapaci… e dei rapaciologi!
Un ringraziamento particolare va a Daniela Campobello per il continuo supporto
scientifico e morale. Non credo che questa tesi di dottorato avrebbe visto la luce senza il
suo contributo costante. Grazie per avermi stimolato ogni giorno a fare di meglio.
Grazie anche a Giacomo Tavecchia, per la pazienza con cui mi ha dedicato il suo tempo
a Maiorca e per la più buona paella che abbia mai mangiato!
Grazie a tutti quelli che hanno contribuito alla racconta dei dati nella soleggiata (molto
soleggiata!) Piana di Gela: Laura Zanca, Rosario Mascara, Totò Bondì, Stefano Triolo,
Joelle Tysseire, Enrico Bellia, Mathia Coco, Vincenzo Italiano, Camillo Cusimano.
Infine, un ringraziamento va alla mia famiglia “vecchia” e “nuova” per avermi supportato
e soprattutto sopportato durante questi anni.


![UNIVERSITÀ DEGLI STUDI DI PADOVAtesi.cab.unipd.it/36429/1/tesi.pdf · pubblicati per la prima volta da Senda et Al. nel 1979 [3]. - Elettroporazione per trasferimento genico: di](https://static.fdocumenti.com/doc/165x107/5fe48c571db8e60789569b6b/universit-degli-studi-di-pubblicati-per-la-prima-volta-da-senda-et-al-nel-1979.jpg)