Luca Marescotti, Maria Mascione, Scira Menoni: Moduli 12-14-17-18-19-20-21
50
a cura di Luca Marescotti DOI: 10.13140/RG.2.1.2676.7126 Licenza Creative Commons Conoscenza e tecnologie appropriate per la sostenibilità e la resilienza in urbanistica Knowledge and Appropriate Technologies for Sustainability and Resilience in Planning diLisa Astolfi, Funda Atun, Maria Pia Boni, Annapaola Canevari, Massimo Compagnoni, Luca Marescotti, Maria Mascione, Ouejdane Mejri, Scira Menoni, Pierluigi Paolillo, Floriana Pergalani, Mauro Salvemini è distribuito con Licenza Creative Commons Attribuzione 4.0 Internazionale. Based on a work at https://www.researchgate.net/profile/Luca_Marescotti. Permessi ulteriori rispetto alle finalità della presente licenza possono essere disponibili presso https://polimi.academia.edu/LucaMarescotti.
-
Upload
luca-marescotti -
Category
Education
-
view
312 -
download
1
Transcript of Luca Marescotti, Maria Mascione, Scira Menoni: Moduli 12-14-17-18-19-20-21

a cura di Luca MarescottiDOI: 10.13140/RG.2.1.2676.7126
Licenza Creative CommonsConoscenza e tecnologie appropriate per la sostenibilità e la resilienza in urbanistica
Knowledge and Appropriate Technologies for Sustainability and Resilience in Planning diLisa Astolfi, Funda Atun, Maria Pia Boni, Annapaola Canevari, Massimo
Compagnoni, Luca Marescotti, Maria Mascione, Ouejdane Mejri, Scira Menoni, Pierluigi Paolillo, Floriana Pergalani, Mauro Salvemini è distribuito con Licenza
Creative Commons Attribuzione 4.0 Internazionale.Based on a work at https://www.researchgate.net/profile/Luca_Marescotti. Permessi ulteriori rispetto alle finalità della presente licenza possono essere disponibili presso
https://polimi.academia.edu/LucaMarescotti.

Note per le lezioni di: La conoscenza del rischio (2). Vulnerabilità e resilienza territoriale: come l’urbanistica e la pianificazione territoriale possono contribuire a politiche di prevenzione
Scira Menoni, Dipartimento di Architettura e Studi Urbani – Politecnico di Milano
Premessa
L’urbanistica moderna si è sviluppata concentrando sempre più il proprio fuoco disciplinare sulla città costruita o da costruire, dimenticandosi delle basi fisico-naturali grazie alle quali e a scapito delle quali era cresciuta. È stata l’ascesa dell’ambientalismo a riportare anche nell’urbanistica l’attenzione ai fattori naturali, di suolo, sottosuolo, atmosfera senza i quali la vita sarebbe impossibile. In un’immagine molto suggestiva proposta da due studiosi canadesi (Rees e Wackernagel, 1996), l’obiettivo che si deve raggiungere per rendere le città sostenibili, consiste nel limitare la loro impronta ecologica, nel renderle capaci di sopravvivere e svilupparsi facendo affidamento su una superficie e su una quota di cielo limitati e rappresentati da una virtuale campana di vetro. Ciò richiede che si chiudano i cicli di prelievo-prodotto-rifiuto che la città industriale ha linearizzato su scala planetaria, tenendo conto e assecondando le relazioni che esisteono tra sistemi naturali e artificiali e tra i vari sistemi e sottosistemi territoriali.Lo sviluppo sostenibile dovrebbe portare contestualmente ad una riduzione dei disastri, sia di origine naturale sia per incidenti tecnologici. Sostenibilità e prevenzione diventano quindi due termini inscindibili, poiché ciò che rende ancor più pericolosi gli elementi naturali e più vulnerabili popolazioni e insediamenti è all’origine di uno squilibrato e disarmonico rapporto tra uomo e natura.
Definizione di rischioIn queste prime note sintetizziamo da una parte la definizione di rischio e dall’altra proponiamo alcune riflessioni sul ruolo che l’urbanista può (dovrebbe svolgere) nell’ambito della prevenzione non strutturale, ovvero non tradotta in opere ingegneristiche di difesa, che, per quanto fondamentali e imprescindibili, non possono da sole ridurre il rischio in modo soddisfacente.Definiamo il rischio come una funzione, nella quale R = f (H, V, E), dove H è l’hazard ovvero al pericolosità e V è la vulnerabilità del patrimonio esposto E. Il rischio R è ottenuto dalla combinazione (convoluzione) dei precedenti termini. Gli studiosi di rischio sismico sono stati i primi a sviluppare modelli per la valutazione della vulnerabilità, mentre per tutti gli altri rischi il rischio, che ricordiamolo viene “misurato” in termini di probabilità di danni attesi, veniva valutato come combinazione di pericolosità ed esposizione. Per altri tipi di rischio, quali frane e alluvioni, l’attenzione dei tecnici si è infatti concentrata prevalentemente sui fattori di pericolosità, sui quali si poteva intervenire con opere strutturali: consolidamenti, muretti di sostegno, griglie, canali di drenaggio nel caso delle prime, con argini, vasche di laminazione, dighe a difesa dalle seconde. Nelle valutazioni di rischio idrogeologico non si trovano in
genere analisi complete di vulnerabilità degli insediamenti, della popolazione, dei sistemi produttivi soggetti potenzialmente alla minaccia del versante o del fiume, ma, al più, considerazioni di esposizione, limitate agli oggetti compresi nelle aree o nelle fasce di pericolo. Nel momento in cui si vuole però fare della pianificazione urbanistica e territoriale non un semplice ricettore di indicazioni relative alle zone più pericolose dal punto di vista geologico ed idraulico, ma uno strumento essenziale nella prevenzione dei rischi, occorre migliorare di molto la nostra capacità di misurare e analizzare i fattori di vulnerabilità, e trovare dei modi più efficaci per integrarle agli studi di pericolosità, per ottenere analisi di rischio o scenari di evento comprensivi al loro interno di quegli elementi territoriali sui quali una buona strategia preventiva deve intervenire per ridurre i danni attesi. I tempi sono oggi ormai maturi: negli ultimi vent’anni si è levata in modo potente una domanda di urbanistica quale strumento di prevenzione dei rischi soprattutto da parte delle organizzazioni internazionali (ricordiamo ad esempio la Campagna Resilient Cities dell’UNISDR, l’ufficio delle Nazioni Unite per la riduzione dei rischi da disastri naturali, ma anche l’UNECE, l’UNDP, l’UNESCO che ha lanciato una campagna Cultural Heritage at Risk, per la salvaguardia dei beni culturali soggetti a pericoli naturali, la Banca Mondiale). La domanda di urbanistica – per quanto paradossale e forse anche un po’ assurdo – viene più dalle discipline tecniche che hanno toccato con mano l’inevitabile limitatezza dei soli interventi strutturali, quando essi non siano supportati da un’efficace regolamentazione degli usi del suolo, che come spinta ad entrare nell’ambito degli studi sui rischi da parte degli stessi pianificatori. Se si vuole riuscire a rendere la pianificazione un efficace strumento di prevenzione, occorre che cambi anche il modo di analizzare e valutare i rischi, attraverso un lavoro congiunto e finalizzato a progetti comuni di esperti geologi, ingegneri, urbanisti (Vedi Menoni, 2012).Al fine di integrare i diversi approcci in un prodotto nuovo, è sembrato opportuno partire dalle domande che il pianificatore pone (o dovrebbe porre) agli esperti che studiano i vari fenomeni potenzialmente distruttivi, piuttosto che cercare di incorporare nel piano le analisi dei rischi condotte in modo tradizionale e settoriale.Queste ultime infatti sono state sviluppate ottemperando a criteri di rigore scientifico volti all’avanzamento delle conoscenze in materia, più che pensando ad applicazioni in ambiti concreti, nei quali parametri che appaiono molto rilevanti allo scienziato perdono di peso agli occhi del decisore, in quanto incapaci di incidere significativamente sulle scelte, ad esempio in termini di espansione urbana o di localizzazione dei servizi pubblici. In campo sismico o alluvionale, ad esempio, le ricerche tese a perfezionare la determinazione degli intervalli di occorrenza (o dei tempi di ritorno) di eventi di intensità data, non forniscono al pianificatore elementi chiave dal punto di vista urbanistico. I tempi della città sono infatti ben diversi da quelli di un singolo edificio: una volta scelta un’area di espansione “sbagliata”, questa si ripercuoterà per i decenni e i secoli a venire, dal momento che la “vita” di una città o di una sua parte è di gran

lunga più duratura di quella della maggior parte delle sue costruzioni. Ciò non significa ovviamente che tali ricerche non siano importanti, anzi, sono fondamentali per gli avanzamenti scientifici che porteranno, col tempo, anche frutti applicativi. Ad oggi, tuttavia, per quanto interessa le scelte di piano e di sviluppo degli insediamenti, sono altri i parametri già disponibili che offrono indicazioni preziose nell’immediato.Le risposte più importanti alle quali il pianificatore cerca delle risposte, riguardano i seguenti aspetti:
a. dove si produrranno probabilmente i danni maggiori?b. quali elementi e quali sistemi territoriali risulteranno maggiormente colpiti e con quali conseguenze complessivamente?c. per quanto riguarda la città che ancora non c’è, quali sono le scelte localizzative e le modalità progettuali e realizzative che minimizzano la creazione o l’incremento del rischio?
La terza domanda è in un certo senso la più semplice, e non a caso la legislazione vigente in materia di rischi, focalizza su di essa la propria attenzione. Le prime due domande invece, che riguardano chiaramente il territorio consolidato, le opere e le infrastrutture esistenti, sono molto più difficili, e i tentativi di risposta ancora allo stadio sperimentale. Non ci sono dubbi però sul fatto che si sta avendo una fioritura di ricerche in questo campo, soprattutto internazionalmente. Per cercare delle risposte a queste due domande, occorre ripensare il concetto di rischio, ma soprattutto i modi in cui viene calcolato o valutato, poiché è inevitabile che passando dalla sfera di studio del fenomeno a comprendere il territorio, si dovrà passare a forme di analisi semiqualitative, rinunciando a modelli sofisticati ma inevitabilmente chiusi ed applicabili solo in domini controllabili, e pertanto limitati. Dei modelli finora utilizzati nelle analisi di rischio, si sono mantenuti due caratteri distintivi: da un lato il rigore metodologico, cercando di elaborare strumenti di valutazione del rischio territoriale verificabili e ripercorribili da altri, dall’altro si è mantenuto il momento della valutazione come cardine di un metodo che non vuole limitarsi alla descrizione dell’esposizione, ma mira bensì a connotarla, a darne dei giudizi utili per orientare poi l’intervento preventivo. Le analisi e le valutazioni di rischio territoriale sviluppate fino ad oggi rispettano alcuni condizioni preliminari:
a. si sono tenuti in conto gli aspetti territoriali dei sistemi fisico/naturali ed antropici, evitando di limitare l’analisi a punti o a oggetti isolati dal loro contesto geografico;
b. si è data grande importanza alle relazioni tra i vari sistemi, fisico/naturali e antropici;
c. si sono cambiate le modalità e le procedure di indagine a seconda della scala territoriale di interesse.

La vulnerabilità è intesa come propensione al danno, il grado di fragilità del sistema esposto, che potrebbe portare ad una catastrofe anche a fronte di eventi naturali di severità modesta. L’ingegneria sismica, la prima che ha prodotto modelli di valutazione di vulnerabilità degli edifici, ha dunque elaborato un corpo analitico e valutativo in grado di giudicare la capacità (o incapacità) di risposta di una struttura a partire da alcune sue caratteristiche ritenute fondamentali, in un qualche modo indipendentemente dall’azione del terremoto. Si è quindi elaborata una matrice con 11 parametri che consentono di valutare le prestazioni attese da un dato edificio: i valori dei parametri vengono assegnati dopo aver compiuto un attento esame dello stesso guidati da schede di rilievo concepite e affinate varie volte dal Gruppo Nazionale Difesa dai Terremoti.Ma come si collega la valutazione di vulnerabilità di singoli edifici alla pianificazione nel suo complesso? In diversi modi, a seconda della scala territoriale alla quale si sta conducendo la valutazione e dell’obiettivo prefissato. Rimangono ancora da definire alcuni importanti passaggi per soddisfare le prime due richieste poste dalla pianificazione territoriale all’analisi e valutazione di rischio, e che riguardano i danni attesi nei vari sistemi e soprattutto quelli dovuti alle interazioni sistemiche e funzionali tra le parti.Che ci sia una vulnerabilità sistemica e funzionale da considerare quando dal singolo edificio o dai vari edifici si passa a valutare la vulnerabilità urbana come insieme è stato riconosciuto da tempo. Negli ultimi dieci anni si è fatto un passo in avanti significativo nella predisposizione di strumenti concettuali e di modelli di valutazione della vulnerabilità sistemica (a volte definita anche come l’opposto della resilienza, anche se la resilienza non si esaurisce a questa unica dimensione).
Note per le lezioni di: La conoscenza del rischio (2). La vulnerabilità sistemica delle reti: dall’analisi dei fattori di criticità alla costruzione di strategie di resilienzaScira Menoni, Dipartimento di Architettura e Studi Urbani – Politecnico di Milano
La valutazione della vulnerabilità delle infrastrutture a rete presenta alcune differenze importanti rispetto a quella condotta sugli edifici, in quanto occorre tener conto di alcune caratteristiche specifiche.Infatti, mentre gli edifici sono oggetti puntuali con una collocazione geografica facilmente identificabile, le reti sono spazialmente diffuse su vaste aree, il che ne rende praticamente impossibile un controllo componente per componente. In conseguenza della diffusione ed estensione territoriale, le reti interagiscono con tipi diversi di suolo, cosicché i problemi di natura geotecnica non possono essere circoscritti come nel caso di singoli oggetti puntuali.
Altri fattori che distinguono le reti sono:
a. la gerachicità, ovvero l’esistenza all’interno di una stessa rete di componenti di peso gerarchico diverso e quindi di importanza diversa ai fini della funzionalità del sistema complessivo. Ad esempio, un guasto o una rottura su di un tratto dell’alta tensione elettrica o su di una condotta del gas ad alta pressione ha conseguenze ben diverse rispetto allo stesso tipo di guasto su parti della rete di distribuzione (dunque a bassa tensione o a bassa pressione).
b. Vi è anche una gerarchia tra componenti di una stessa rete, ovvero fra nodi (quali possono essere le centrali di produzione energetica, le centrali di controllo della rete, le stazioni di trasformazione elettrica) ed elementi lineari (le linee ad alta tensione, le linee o condotte a media pressione, i cavi di distribuzione). Anche in questo caso, disfunzioni su nodi ed elementi lineari hanno conseguenze diverse sul funzionamento dell’intero sistema.
c. Le reti presentano una forte interdipendenza non solo all’interno di ciascun sistema, ma anche fra loro. Alcune sono essenziali al funzionamento di altre; in particolare l’elettricità è essenziale per i sistemi di controllo delle telecomunicazioni, dei trasporti (semafori), per le stazioni di pompaggio dell’acqua, per tutti i controlli a distanza, quando questi sono presenti. La rete elettrica, poco vulnerabile al danno diretto fisico prodotto dalle scosse sismiche, è essenziale per il funzionamento di altri sistemi e quindi la sua interruzione, anche temporanea, può comportare conseguenze rilevanti su altre reti e su altri sistemi urbani e territoriali.
d. Quasi tutti i sistemi urbani e territoriali dipendono in misura più o meno rilevante dai servizi a rete; nel caso di parziale o totale interruzione di questi ultimi, i sistemi come quello di gestione dell’emergenza (ospedali, vigili del fuoco), quello produttivo, quello residenziale verrebbero gravemente limitati nella loro funzionalità, con danni gravi nell’immediato post-impatto anche sul piano economico. Se è pur vero che la vulnerabilità degli edifici costituisce la prima causa di morti e feriti in seguito ad un terremoto, è anche da sottolineare che il buon funzionamento delle reti unitamente ad efficienti strutture di protezione civile possono mitigare di molto l’impatto e contribuire a salvare molte vite in fase di emergenza.
Nel caso delle infrastrutture occorre dunque esplicitare la vulnerabilità sistemica, in termini di vulnerabilità funzionale, organizzativa e fisica. Con vulnerabilità sistemica si intende la propensione di un sistema a subire danni o cadute di funzionalità non in seguito a danni fisici occorsi a una delle sue componenti, ma come conseguenza di danni fisici o sistemici riscontrati in altri sistemi dai quali quello in esame dipende. Ad esempio l’acqua fornita dalla rete idrica potrebbe diminuire di molto o del tutto se le stazioni di pompaggio non funzionassero più; oppure, diverse reti potrebbero essere interessate da incendi provocati da fughe di gas.Con vulnerabilità funzionale si indica la possibilità che un’infrastruttura non sia in grado di fornire il servizio in tutto o in parte. I relais di controllo nelle centrali o nelle stazioni di trasformazione dell’energia elettrica possono saltare in seguito alle scosse

anche senza che si sia verificato un danno fisico rilevante – pur compromettendo la continuità dell’erogazione. Soprattutto nelle prime ore dell’emergenza occorre garantire, eventualmente con azioni mirate, che le reti – seppur parzialmente danneggiate – siano comunque in grado di sostenere le operazioni di soccorso. Con vulnerabilità fisica ci si riferisce alla propensione delle infrastrutture a rompersi in modo più o meno grave; è altresì chiaro come non si possa concentrare la prevenzione solo su quest’ultima, dati i costi elevatissimi che una simile operazione comporterebbe. Valutazioni relative al rango gerarchico di uno o più componenti, alle possibili interazioni fra le reti e con altri sistemi territoriali devono pertanto portare all’identificazione di priorità, in base alle quali eventualmente procedere a sostituzioni o al miglioramento di parti delle reti stesse. E’ questa una filosofia ormai consolidata anche nella comunità di matrice più tecnica che si occupa della protezione delle lifelines (Nojima, 1998).Vengono illustrati brevemente i risultati dell’analisi e della valutazione della vulnerabilità delle reti al rischio sismico nei comuni del Garda Bresciano. Per una trattazione più esaustiva della metodologia e dei risultati ottenuti si veda Menoni, 2013.
Alcuni riferimenti bibliografici
Benedetti D., V. Petrini, 1984. La vulnerabilità delle costruzioni in muratura: proposta di una procedura di valutazione. L'Industria delle Costruzioni, 18.
Burby R., (cur.), 1998. Cooperating with nature. Confronting natural hazards with land use planning for sustainable communities, Joseph Henry Press, Washington D.C., pp. 356.
Dow K., 1992. Exploring differences in our common future(s): the meaning of vulnerability to global environmental change. Geoforum, 23: 417-436.
Colonna E., Molina C., Petrini V., 1994. La valutazione del rischio sismico con dati poveri. Ingegneria Sismica, 1.
Margottini C., 2000. Tutela del territorio, rischi naturali e sviluppo sostenibile. In: Progetto Duemila, Agenda 21, Libro Verde, Sviluppo sostenibile, consultabile presso il sito http:// prog2000.casaccia.enea.it/nuovo/ricerca.asp.

Menoni S., 2012, Pianificazione urbanistica e territoriale in aree soggette a rischi naturali: limiti e opportunità, Sentieri Urbani, vol. 7, p. 20-27.
Menoni S., 2013 Valutazione di vulnerabilità sismica: dall’edificio al centro urbano e oltre. Applicazioni al caso di Salò (Brescia), Ingegneria Sismica, pp. 94- 117.
Rees W. e M. Wackernagel, 1996. L'impronta ecologica. Come ridurre l'impatto dell'uomo sulla terra, ed. Ambiente, Roma, pp. 171.
Hewitt K., 1983. Interpretations of calamity, Allen and Unwin inc., Boston.
K. Hewitt, 1997. Regions of risk. A geographical introduction to disasters, Longman, Singapore, pp. 389.
Nojima N., 1998. Lifeline system malfunction and interaction. In: Proceedings of the World Urban-Earthquake Conference in Fukui, Fukui, Japan, June, pp. 109-112.

Note per le lezioni di: Definizione delle strategie e delle tecniche operative nella pianificazione. Strategie di prevenzione non strutturali e di lungo periodo: il ruolo della pianificazione territoriale e urbanistica
Scira Menoni, Dipartimento di Architettura e Studi Urbani – Politecnico di Milano
Premessa
La pianificazione urbanistica e territoriale non ha ancora davvero affrontato la questione di se e come assumere la prevenzione dei rischi naturali e tecnologici come criterio rilevante all’interno dei processi ordinari di decisione progettazione. Ciò non vuol dire che non si siano compiuti dei passi in avanti. In una ricerca finanziata nell’ambito del VI Programma Quadro della UE negli anni tra il 2004 e 2007, Armonia (Applied multi Risk Mapping of Natural Hazards for Impact Assessment), si è cercato di tracciare un quadro della situazione europea in materia (Fleischhauer et al., 2006). La conclusione alla quale si è giunti dopo avere confrontato i sistemi di pianificazione di Italia, Francia, Spagna, Regno Unito, Germania, Grecia è che lo stato dell’arte vede un’attenzione alla materia dei rischi ancora molto settorializzata, poco integrata all’interno della prassi pianificatoria ordinaria, come se fosse un fatto a sé, estraneo alle decisioni in materia di dove costruire, come farlo e quali usi del suolo consentire in aree soggette a fenomeni naturali estremi. Si potrebbe sostenere che la settorializzazione è una delle risposte che la pianificazione ha dato in generale alla complessità dei problemi della città e del territorio, con l’inevitabile perdita di una visione comprensiva e “organica” a favore di una parcellizzazione di temi e di interessi, alla fine scarsamente ricomponibili. Si assiste oggi in mote regioni europee agli esiti di una crescita poco controllata dell’urbanizzazione, perlomeno nella sua dimensione quantitativa, nei decenni del Dopoguerra, e che persiste, almeno in alcune aree, ad esempio costiere, a ritmi sorprendenti per paesi già sviluppati. Nella pratica quotidiana, tuttavia, non si riscontra solo una oggettiva difficoltà a trattare il tema dei rischi all’interno della pianificazione territoriale e urbanistica, ma anche una certa indifferenza culturale alla questione, con alcune significative eccezioni (Galderisi, 2004; Fabietti, 1999; Tira, 1997; Olivieri, 2004), che tuttavia non riescono a innovare dall’interno la prassi corrente.
Proposta di uno schema metodologico di supporto alla pianificazione del territorio in aree soggette a rischi naturali
Il progetto Armonia, finanziato nell’ambito del VI Programma Quadro della UE, ha prodotto un modello di supporto (figura 1.) alle decisioni riguardo a tale futuro destino dei suoli che includa la valutazione del rischio presente e futuro, conseguente alle scelte operate, sulla base di una disamina puntuale delle condizioni di pericolosità (inclusa la presenza di più fonti di pericolo concomitanti, possibili concatenazione di eventi, anche naturali-tecnologici), esposizione e vulnerabilità (intesa non solo come fragilità fisica


dallo stato di rischio attuale, se ritenuto accettabile oppure no. A questo proposito va sottolineata l’importanza delle variabili esposizione e soprattutto vulnerabilità che formano insieme alla pericolosità (e ad altri fattori che si vogliano aggiungere) la funzione di rischio (laddove R = f (P, E, V, …). L’esposizione si riferisce al numero di persone e al valore dei beni che sono potenzialmente soggetti all’azione di un evento estremo; la vulnerabilità definisce invece le caratteristiche qualitative dell’esposto in termini di minore o maggiore capacità di resistenza e risposta. Rendere edificabili suoli agricoli, sottrarre ambiti alla foresta o alla costa per realizzare case e infrastrutture è il più classico ambito di pertinenza dell’urbanistica. Mentre si è ritenuto erroneamente che il ciclo della grande espansione urbana fosse giunto a compimento nei paesi sviluppati del dopoguerra attorno agli anni Ottanta/Novanta, ci si rende conto invece oggi che è mutata la forma di tale espansione e le zone in cui essa è avvenuta con maggiore intensità. Ci si confronta oggi in Occidente, Europa inclusa, con un vasto fenomeno di consumo di suolo, di sprawl urbano (EEA, 2006), a volte, soprattutto nei paesi meridionali del Continente, con propaggini di illegalità che in alcuni casi tuttavia assumono proporzioni davvero abnormi. Se non è aumentata la popolazione europea negli ultimi decenni, è però pur vero che si è assistito a una redistribuzione, che da un lato ha comunque creato delle notevoli concentrazioni e delle megacittà costituite da un continuum costruito e infrastrutturato, come ad esempio la mezzaluna che unisce i territori dell’Elba dell’Europa Centro-Settentrionale al Nord-Italia.La ricostruzione, soprattutto in presenza di danni estesi e ingenti è sempre un’operazione di trasformazione, anche quando, come nel caso della ricostruzione post-sismica friulana si cerca di restituire l’immagine pre-evento degli insediamenti distrutti. La ricostruzione è sempre un processo doloroso e complesso, nel quale si incontrano e si scontrano dinamiche già riconoscibili prima del disastro e istanze nuove emerse come conseguenza dell’esperienza dell’evento calamitoso e del riassetto socio-economico cui a volte si assiste. Come hanno bene mostrato Haas et al. (1977) in un libro ormai classico per chi si occupa di valutazione e gestione dei rischi, la ricostruzione è una fase particolarmente delicata, la cui riuscita dipende da vari fattori. Questi ultimi riguardano la disponibilità di fondi e risorse, umane e materiali, ma anche la capacità di costruire una visione, un progetto di futuro.
Note per le lezioni di: Definizione delle strategie e delle tecniche operative nella pianificazione. Crowdsourcing e social media: dall’uso in emergenza al supporto per la pianificazioneScira Menoni, Dipartimento di Architettura e Studi Urbani – Politecnico di MilanoOuejdane Mejri, Dipartimento di Elettronica e Bioingegneria – Politecnico di Milano
Affinché la pianificazione urbanistica e territoriale possa efficacemente introdurre la prevenzione come uno dei criteri di scelta della destinazione d’uso dei suoli, dell’intensità e della modalità di tali usi, nonché della localizzazione di sevizi pubblici,

della distribuzione delle varie funzioni, e delle infrastrutture, occorre che contestualmente si considerino e si utilizzino strumenti e metodi adeguati, in parte “nuovi”, in parte già da tempo parte del bagaglio disciplinare.
Il globo terrestre digitale
Lo sviluppo tecnologico degli ultimi anni comporta forse un modo nuovo di rapportarsi alla rappresentazione e all’analisi dei fenomeni di natura spaziale, aventi come teatro di sviluppo la superficie terrestre. Se l’introduzione dei GIS è stata salutata un paio di decenni orsono come una significativa innovazione, capace di migliorare sia la qualità e il dettaglio informativo delle carte di piano sia, soprattutto, la quantità di informazioni associate ad ogni oggetto rappresentato sulla carta, creando una connessione tra dati cartografici e di altra natura, i più recenti sviluppi del cosiddetto globo digitale terrestre si cominciano ad apprezzare solo ora. Nei loro articoli, Craglia et al. (2008, 2012) mostrano la parallela evoluzione di due modi di rappresentare e restituire dati relativamente ai fenomeni spaziali o aventi una rilevante dimensione spaziale: da un lato la costruzione di sistemi informativi a se stanti, tra i quali è spesso difficile creare la pur auspicata e “imposta” per legge interoperabilità, dall’altro lo sviluppo “dal basso” di “servizi” che forniscono dati e informazioni mappate sui globi terrestri virtuali realizzati da società commerciali quali Google ed Esri. Indubbiamente i sistemi informativi “certificati”, che possono fornire dati di qualità e fonte note, rimangono fondamentali, ma è altresì chiaro che vi è un movimento “dal basso” che fruisce della maggiore apertura delle piattaforme commerciali per fornire servizi sia su base volontaria sia a pagamento. L’utilizzo di tali piattaforme in occasione di recenti disastri quali lo tsunami nel Sud-Est Asiatico o il terremoto di Haiti ha in un qualche modo sorpreso la stessa comunità internazionale di aiuto umanitario in zone povere devastate da calamità naturali (Harvard Humanitarian Initiative, 2011). E’ ragionevole aspettarsi che l’uso in emergenza sia prima o poi esteso a tutte le fasi di analisi e valutazione dei rischi nonché ad altri campi quali ad esempio le simulazioni sul futuro di aree interessate da significativi cambiamenti infrastrutturali o urbanistici. E’ chiaro che esiste un problema di scala, una sorta di “conflitto” tra ciò che si può vedere alla scala globale e il dettaglio necessario alla scala locale; tuttavia lo sviluppo delle tecnologie è stato nell’ultimo decennio talmente rapido che si potrebbe ipotizzare una significativa capacità di rappresentazione utile anche alla scala locale entro breve tempo.L’introduzione di tali tecnologie nel mondo della pianificazione urbanistica e territoriale comporta un cambiamento nel modo in cui non solo si rappresentano le scelte di piano, ma anche del modo stesso in cui si può rappresentare la relazione tra scale spaziali diverse che tanto peso ha nella dinamica di produzione dei rischi e delle vulnerabilità (si veda in tal senso ancora il progetto Ensure). Fino ad ora anche la sola “sovrapposizione” delle informazioni relative alle varie forme di pericolo e all’urbanizzato esposto era tutt’altro che scontata o semplice. Le carte geologiche dovevano essere appositamente realizzate alla scala utile per il piano urbanistico per fornire informazioni rilevanti; in un futuro prossimo sarà possibile rappresentare contemporaneamente sul globo digitale non solo le zone pericolose, le aree urbanizzate, le infrastrutture, ma anche riportare le

informazioni provenienti da strumentazioni di monitoraggio delle frane o dei livelli idrologici dei fiumi. Tale possibilità consentirà di attribuire alla rappresentazione urbanistica una dimensione dinamica che essa non ha mai avuto, e che richiede riflessioni puntuali per essere apprezzata e utilizzata al meglio.
Usare i “big data” per supportare piani urbanistici di ricostruzioneL’esperienza di cui abbiamo parlato a lezione riguarda l’uso dei cosiddetti “big data” e dati ottenuti dalla rete per supportare non solo la gestione dell’emergenza, come avviene già, come è già avvenuto nelle emergenze di diciamo gli ultimi cinque anni, ma anche il processo di ricostruzione.Sono essenzialmente quattro le tipologie di dati classificati per fonte:1. Dati generati dalle organizzazioni internazionali quali la Croce Rossa, le Nazioni Unite, la Commissione Europea attraverso il Meccanismo di Protezione Civile, che vengono messi a disposizione sui rispettivi siti istituzionali. Si tratta di rapporti, documenti, testimonianze ma anche identificazione di bisogni e richieste di supporto;2. Dati generati dai volontari digitali, che ad esempio digitalizzano mappe anche lavorando in remoto per supportare l’azione delle forze sul terreno, soprattutto quando tali mappe mancano o georeferenziando dati e informazioni che consentano di identificare sul terreno le richieste di aiuto;3. Dati generati sia dai testimoni dell’evento sia dalle vittime (che ovviamente sono anche testimoni ma sono anche colpiti dall’evento). I “social media” sono un grande archivio temporaneo di informazioni di vario genere inclusi filmati, fotografie, racconti che costituiscono una fonte preziosa in quanto seguono la dinamica dell’evento nel suo svolgimento;4. Dati generati da alcuni mezzi di informazione, non solo quelli “tradizionali” quali i giornali e le rispettive versioni in rete, ma anche operatori come Google che destinano una parte del loro portale alle emergenze più gravi.
E’ evidente che la ricerca su tutti questi siti pone diversi problemi il più rilevante riguarda la mole di dati che si possono trovare e l’esigenza quindi di disporre di metodi e strumenti semiautomatici di filtraggio che consentano di identificare i dati e le informazioni davvero utili, eliminare gli altri, eliminare i dati moltiplicati che si possono riscontare in grande quantità.A tal fine ci viene in soccorso la scienza dell’informazione e l’ingegneria informatica che avvalendosi di metodi logici sofisticati e di algoritmi ci consentono di navigare nella grande mole di informazioni. La selezione non è tuttavia l’unico passaggio, occorre poi classificare tali dati per estrarne un senso che ne giustifichi la ricerca e ne permetta l’uso per i fini che ci prefiggiamo. Generalmente tali dati vengono raccolti e usati durante l’emergenza; tuttavia abbiamo verificato con mano sul caso di Tacloban nelle Filippine, in seguito al tifone Hajian/Yolanda del 2013, che tali dati possono essere utili anche nella fase di ricostruzione, in quanto consentono di ricostruire una prima mappatura dei danni, di identificare le zone maggiormente colpite, le comunità che si

sono rivelate più vulnerabili. E’ così possibile verificare se le indicazioni pianificatorie pre-evento sono ancora auspicabili, se le valutazioni di rischio esistenti prima dell’evento erano adeguate o meno, se contemplassero o meno il tipo di evento che si è verificato e correggere adeguatamente le previsioni di piano. Il momento della ricostruzione costituisce una “finestra di opportunità”, nella quale si può pensare di ricostruire riducendo le vulnerabilità e l’esposizione pre-evento, rendendo più sicura la città a fronte di futuri possibili eventi.
Alcuni riferimenti bibliografici
Armonia project (2007). Assessing and mapping multiple risks for spatial planning – approaches, methodologies and tools in Europe. http://ec.europa.eu/research/environment/pdf/publications/fp6/natural_hazards//armonia.pdf
Beck U., (2000), La società del rischio. Verso una seconda modernità. Carocci, Roma.
Bollin, C., Khanna S., (2007), Review of Post Disaster Recovery Needs Assessment and Methodologies: Experiences from Asia and Latin America. International Recovery Platform – Post Disaster Recovery Needs Assessment Methodology and Toolkit (PDNA).
Burby R., (2001), Flood Insurance and Floodplain Management: The U.S. Experience. Journal of Environmental Hazards 3:3.
Comerio M., (1998), Disaster Hits Home: New Policy for Urban Housing Recovery. Berkeley: University of California Press.
Craglia M., Goodchild, M. F. et al., (2008), Next Generation Digital Earth. A position paper from the Vespucci Initiative for the Advancement of Geographic Information Science. International Journal of Spatial Data Infrastructures Research, Vol 3. 146-167.
Craglia M., de Bie K. et al., (2012), Digital Earth 2020: towards the vision for the next decade. International Journal Digital Earth 5(1): 4-21.
De Marchi B., Scolobig A., (2009), Dilemmas in land use planning in flood prone areas. p. 204 in P. Samuels, S. Huntington, W. Allsop and J. Harrop (eds.) Flood Risk Management: Research and

Practice, CRC Press, Taylor and Francis Group, London. (Proceedings of the European Conference on Flood Risk Management. Research into Practice (FLOOD/RISK/ 2008), Oxford, UK 30 Sept –2 Oct 2008).
EEA Report No 10/2006, Urban sprawl in Europe – The ignored challenge
Fleischhauer M, Greiving S., Wanczura S. (eds.), (2006), Natural hazards and spatial planning in Europe, Dortmunder Vertrieb für Bau- und Planungsliteratur.Galderisi A., (2004), Città e terremoti. Metodi e tecniche per la mitigazione del rischio sismico. Gangemi Editore, Roma.
Galderisi A. e S. Menoni, (2007), Rischi naturali, prevenzione, piano, in “Urbanistica. Rivista semestrale dell’Istituto Nazionale di Urbanistica”, n. 134, pp. 20-23.
Haas J., R.Kates, M. Bowden, (1977), Reconstruction following disasters. Cambridge University Press, MIT.
Harvard Humanitarian Initiative, Disaster Relief 2.0: The Future of Information Sharing in Humanitarian Emergencies. Washington, D.C. and Berkshire, UK: UN Foundation & Vodafone Foundation Technology Partnership, 2011.
Vale L.J., Campanella T.J. The Resilient City. How modern city recover from disaster. Oxford University Press: NY, 2005.

Conoscenza e tecnologie appropriate per la sostenibilità urbanistica - Knowledge and Appropriate Technologies for Sustainability in Planning - 29 febbraio - 04 marzo 2016 - Modulo 15
Modulo 19Ecologia e urbanistica, sistemi per governare sistemi complessi socio-ecologici.
Opere pubbliche, servizi pubblici e standard urbanistico ambientaliLuca Marescotti.
La storia degli standard urbanistici italiani dovrebbe essere fin troppo nota per doverla riprendere e ridiscutere, anche se si è a lungo cercato di rimuoverli come se rappresentassero solo un aspetto formale, da piccola e insulsa contabilità, privi della creatività della progettazione urbana: in fin dei conti la bellezza della piazza di Pienza con l'architettura di Bernardo Rossellino ci riempie di emozione assai di più di un parchetto abbandonato privo di manutenzione e possibilmente ubicato in una zona di nessun interesse per gli operatori immobiliari.Il discorso sulla storia degli standard ha però altri aspetti da ricordare, perché, prima di parlare degli standard urbanistici in Italia e degli standard ambientali, è la storia degli inizi dell'organizzazione industriale con le opere dell'architetto e storico dell'arte Gottfried Semper, tra cui Wissenschaft, Industrie und Kunst (Scienza, industria e arte) del 1852 che studia l'industrializzazione e i consumi di massa per trasferirli ai metodi e materiali della architettura e poi con Hermann Muthesius che nel 1907 fonda il Deutsche Werkbund (lega degli artigiani), basato sui concetti di standard e tipo, e con il suo “Programma dei dieci punti” pubblicato nel 1914 per l'Esposizione universale di Colonia.Muthesius sosteneva che la presenza sul mercato mondiale della Germania doveva attuarsi attraverso un processo di industrializzazione con l'adozione di tipi e standard, capaci di garantire alta qualità e favorire l’esportazione dell'industria edilizia tedesca, combinando capacità produttiva industriale e progettazione artistica.Nel 1929 gli standard entrano nell'edilizia popolare a supporto delle industrie: lo existenzminimum di Walter Gropius come illustrato nel 1929 al secondo CIAM Congresso internazionale di architettura moderna (Francoforte sul Meno, Germania) per dare agli operai un alloggio minimo con servizi collettivi (Aymonino 1971).
La singolarità italiana degli standard urbanistici
Lo sviluppo economico del dopoguerra italiano porrà altri e nuovi problemi, l'urbanesimo è sempre più rapido combinandosi con l'abbandono della campagna e l'industrializzazione: l'edilizia economica e popolare con adeguata dotazione di servizi sociali non sarà cosa semplice ma frutto di contrasti violenti e compromessi politici. Gli standard in urbanistica diventano un sistema di ridistribuzione delle risorse e di libertà sociale sul territorio, premessa a una mobilità sociale nel rapida espansione economica degli anni '60 e '70 del secolo scorso con enormi differenze nella loro applicazione (Falco 1978).Il benessere, la casa in proprietà, la disponibilità dell'automobile sembrano modificare questo quadro concettuale e l'attenzione, forse suggestionata da un certo sfondo liberistico, sembra spostarsi verso i servizi commerciali, simbolo di appagamento di ogni desiderio. Ma il discorso non si può chiudere qui, perché la necessità di strategie “ambientali” condivise ci riporta a ridisegnare un nuovo profilo degli standard.
1/3

Conoscenza e tecnologie appropriate per la sostenibilità urbanistica - Knowledge and Appropriate Technologies for Sustainability in Planning - 29 febbraio - 04 marzo 2016 - Modulo 15
Condizioni generali e redistribuzione del reddito e delle opportunità
Di che cosa si parlava quindi, quando si parlava di standard urbanistici: di redistribuzione del reddito? di libertà sul territorio? di condizioni generali? O di tutto questo insieme?Opere pubbliche, lavori pubblici, urbanistica e servizi sociali hanno sempre costituito le condizioni generali per lo sviluppo sociale e industriale (Folin 1978), ma ora per predisporsi per le emergenze e le crisi occorre rimodulare discipline, competenze e formazione anche attraverso una loro reale e efficiente integrazione.I cambiamenti globali, e soprattutto la capacità umana di comprendere le lezioni che possiamo trarre della lettura di accadimenti del passato e di costruire nuovi paradigmi scientifici, ci rende consapevoli della necessità di fronteggiare in prospettiva situazioni non prevedibile: questa sarà la nuova sfida da intraprendere per partecipare alla costruzione di un futuro in una biosfera ancora per noi amichevole.
Quindi ridurre i rischi e gestire le emergenze
Il tema delle emergenze si deve essere scorporato in due famiglie: le emergenze normali (di routine, l'incidente stradale, la chiamata d'urgenza sanitaria) e le emergenze generate da una situazioni di crisi (Howitt e Leonard 2008) (Howitt e Leonard 2009): se per la prima esiste un protocollo, per quanto sempre migliorabile ma consolidato, per le seconde si aprono scenari mai prima sperimenti. Queste situazioni richiedono una preparazione superiore basata sulla capacità di gestire sovratensioni e di interpretare le diverse possibili scale di intervento, in modo da mantenere il controllo della situazione, attraverso attività integrate in tempo reale. In altre parole occorrono capacità professionali, strutture operative e visioni sistemiche, persone e coordinamento. Tutto sommato assomiglia molto alle caratteristiche della mente collettive.Si aprono altri scenari descritti non tanto in libri accademici quanto in linee guida comunitarie, a cui bisognerebbe prestar credito, su impatti cumulativi e effetti sistemici (Johnston e Walker 2001),(EEA 2012).Aprire nuove prospettive significa un doppio salto il primo per rimodulare discipline, competenze e formazione, il secondo per integrare i settori operativi della pubblica amministrazione.Aprire nuove prospettive per l'urbanistica, usando proprio gli standard urbanistici per mantenere l'ambiente in una situazione favorevole -localmente e globalmente- per le società umane. Il primo passo consiste nel dovere prima di tutto cambiare noi stessi, il nostro modo di governare e amministrare il territorio, di usare la pianificazione nelle città, con le città, per le città, che altro non sono che le loro genti, e i loro luoghi dove si giocano comportamenti, strategie finanziarie, acquisizioni di risorse. Questo vuol dire saper leggere le differenze sul significato delle parole, sul modo, per esempio, di usare il termine resilienza non tanto in diversi contesti scientifici, quanto nello stesso contesto ma con significati affatto diversi (Vale 2005), (Randall 2011), SPIRN.Allora aprire nuove prospettive è prendere coscienza sulla realtà territoriale e sull'esistenza di interrelazioni assai più complesse come è rappresentato nelle regioni urbane, che sarebbero del tutto invisibili se viste arroccati nell'interno dei confini di ciascun singolo comune (Forman 2008).
RiferimentiAymonino, Carlo, a c. di. 1971. L’abitazione razionale. Atti dei congressi C.I.A.M. 1929-1930.
Padova: Marsilio.EEA. 2012. Urban adaptation to climate change in Europe. Challenges and opportunities for cities
together with supportive national and European policies. EEA Report 2/2012. Copenhagen: EEA European Environment Agency.
2/3

Conoscenza e tecnologie appropriate per la sostenibilità urbanistica - Knowledge and Appropriate Technologies for Sustainability in Planning - 29 febbraio - 04 marzo 2016 - Modulo 15
Falco, Luigi. 1978. Gli standard urbanistici. Roma: Edizioni delle autonomie.Folin, Marino, a c. di. 1978. Opere pubbliche, lavori pubblici, capitale fisso sociale. Milano:
Angeli.Forman, Richard T. T. 2008. Urban regions: ecology and planning beyond the city. Cambridge,
UK ; New York: Cambridge University Press.Howitt, Arnold M, e Herman B Leonard. 2009. Managing Crises: Responses to Large-Scale
Emergencies. Washington D.C.: CQ Press.Howitt, Arnold M., e Herman B. «Dutch» Leonard. 2008. «The Novelty of Crises: How to Prepare
for the Unprecedented». In The LA Earthquake Sourcebook, 210–17. Pasadena: CA: Art Center College of Design.
———. s.d. Managing Crises: Responses to Large-Scale Emergencies.Johnston, J., e L. J. Walker. 2001. «Guidelines for the Assessment of Indirect and Cumulative
Impacts as well as Impact Interactions». EC DG XI - Environment, Nuclear Safety & Civil Protection.
Randall, Alan. 2011. Risk and precaution. Cambridge, UK ; New York: Cambridge University Press.
Vale, Lawrence J, e Campanella. 2005. The Resilient City: How Modern Cities Recover from Disaster. New York: Oxford University Press.
3/3

Conoscenza e tecnologie appropriate per la sostenibilità urbanistica - Knowledge and Appropriate Technologies for Sustainability in Planning - 29 febbraio - 04 marzo 2016 - Modulo 20
Modulo 20Ecologia e urbanistica, sistemi per governare sistemi complessi socio-ecologici.
STRANE STORIE - ODD STORIESLuca Marescotti.
“Strane storie” per avviarci alle conclusioni vuol dire “sveglia!, guarda il mondo intorno a te e reagisci! Tu sai che cosa puoi fare!”.L'inizio riguarda la società come una mente collettiva, un sistema sociale capace di andare oltre ai paradigmi convenzionali della politica, dei partiti e dell'anarchia, richiamando responsabilità, ascolto e partecipazione. Le tre caratteristiche fondamentali sono la conoscenza condivisa, la condivisione delle strategie e la cooperazione.Conoscenza, coordinamento e cooperazione sono le strade da integrare in una maturazione del concetto di democrazia.
Un pianeta dinamico
Le trasformazioni dei continenti negli ultimi 300 milioni di anni sono la testimonianza delle forti dinamiche terrestri, al cui confronto l'azione umana parrebbe insignificante. Quelle dinamiche riguarda la crosta terrestre, uno dei fattori fisici, ma non parlano dei regni viventi animali e vegetali rispetto ai quali invece l'azione umana appare enorme, capace di mutare la biosfera fino a influire sullo stato stesso delle condizioni geologiche così come le abbiamo conosciute negli ultimi dieci-dodicimila anni.Il tema attuale riguarda quindi due aspetti: come affrontare le dinamiche messe in atto dall'azione umana e che si manifestano in eventi non prevedibili e in forme diverse dal passato (per intensità, per quantità di popolazione esposta, per diffusione delle informazioni) e come valutare il nostro fabbisogno di risorse.
L'impronta ecologica, il computo e le critiche
Al primo punto è il messaggio di allarme a tutti noto: Stiamo consumando tutte le risorse del Pianeta!Sarà vero? Chi lo ha detto? Si domandano gli scettici.Le premesse necessarie per darsi una ragione di quanto accade stanno nella capacità di carico dell'intero pianeta e nel metabolismo urbano. Della capacità di carico, un tempo espressa dalle funzioni logistiche se ne danno altre formalizzazioni introducendo tasso di fertilità, tasso di mortalità, produzione di scarti e rifiuti, e variabilità di ingresso e di uscite, in un qualche modo evidenziando il ruolo delle probabilità con cui si evolve il sistema sociale. L'impronta ecologica ingloba queste metodologie, .. Dopo questo occorre entrare nello specifico delle grandezze usate (consumi di risorse rinnovabili, regioni bioproduttive), dell'unità di misura (ettari globali gha), del metodo di calcolo, fino a scovare eventuali zone d'ombra:
1. le Regioni Bioproduttive sono più che una grandezza ben definita e condivisa da altri una valutazione approssimata che soprattutto serve per rendere popolare il messaggio. É una stima fatta e usata solo da Ecologica Footprint Network;
2. EFp = (P/Yn) × YF × EQF ma questi fattori non sono chiari, soprattutto il fattore di equivalenza che esprime la valutazione di un partoicolare uso del suolo e della sua
1/3

Conoscenza e tecnologie appropriate per la sostenibilità urbanistica - Knowledge and Appropriate Technologies for Sustainability in Planning - 29 febbraio - 04 marzo 2016 - Modulo 20
produttività in termini valori medi globali di regione bioproduttiva. In altre parole, Usa un'unità di misura (ha), ma la trasforma in ettari globali (gha) attraverso operazioni poco trasparenti (YF yield factor e EQF equivalence factor).
In sintesi si osserva che il metodo di calcolo è ben diverso dai metodi “spiccioli” per misurare l'impronta ecologica individuale (cibo, abitudini, trasporti) (Steven Goldfinger et al. 2005), (Steven Goldfinger, Wermer, e Wackernagel 2007). Si può concordare sulla capacità di misurare le diseguaglianze sociali tra le nazioni, (Ewing et al. 2010); si deve essere consapevoli che non è una misura del bilancio tra domanda e offerta (Schaefer et al. 2006); offre una buona comunicazione scientifica, ma chiarisce alcuni aspetti chiave del computo e semplifica la complessità (riduttivismo) (Giampietro e Saltelli 2014a), (Steve Goldfinger et al. 2014), (Giampietro e Saltelli 2014b). Bisogna allora arrivare a distinguere l'utilità del metodo, le direzioni di ricerca, il riduzionismo del messaggio politico.
Applicazioni e politica: il caso di Londra
Per concludere il caso di Londra con la successione di studi privati (Girardet 1996a) (Girardet 1996b), (Girardet 2006), studi pubblici e politiche di riduzione sotto il sindaco di sinistra Ken Livingston (Chartered Institution of Wastes Management Environmental Body; Best Foot Forward Ltd 2002), (Brook Lyndhurst 2003) (London Climate Change Partnership 2006) (London First, s.d.) (London Climate Change Partnership 2006) (Greater London Authority 2008), e i successivi arretramenti del successore, conservatore e ora leader della Brexit, Boris Johnson (Greater London Authority 2009) (Greater London Authority 2009), in cui l'impronta ecologica è sostituita dalla qualità della vita della capitale inglese e che assieme a New York detiene il titolo di capitale della finanza mondiale.
RiferimentiBrook Lyndhurst. 2003. London’s Ecological Footprint A review. June 2003. London: Greater
London Authority, City Hall, The Queen’s Walk, London SE1 2AA. http://www.london.gov.uk/mayor/economic_unit/docs/ecological_footprint.pdf.
Chartered Institution of Wastes Management Environmental Body; Best Foot Forward Ltd. 2002. City Limits: A Resource Flow and Ecological Footprint Analysis of Greater London. Oxford: Best Foot Forward Ltd.
Ewing, Brad, David Moore, Steven Goldfinger, Anna Oursler, Anders Reed, e Mathis Wackernagel. 2010. Ecological Footprint Atlas 2010. Oakland, CA, USA: Global Footprint Network.
Giampietro, Mario, e Andrea Saltelli. 2014a. «Footprints to Nowhere». Ecological Indicators 46 (novembre): 610–21. doi:10.1016/j.ecolind.2014.01.030.
———. 2014b. «Footworking in Circles. Reply to Goldfinger et Al. (2014) “Footprint Facts and Fallacies: A Response to Giampietro and Saltelli (2014) Footprints to Nowhere”». Ecological Indicators 46 (novembre): 260–63. doi:10.1016/j.ecolind.2014.06.019.
Girardet, Herbert. 1996a. «Getting London in Shape». London First.———. 1996b. The Gaia Atlas of Cities: New Directions for Sustainable Urban Living. UN-
HABITAT. New York 1996 (revised edition): Gaia Books Limited. http://books.google.it/books/about/The_Gaia_Atlas_of_Cities.html?id=V6IFvQaSHtAC&redir_esc=y.
———. 2006. «Urban Metabolism: London Sustainability Scenarios». In IABSE Henderson Colloquium. Cambridge. http://www.istructe.org/IABSE/Files/Henderson06/Paper_02.pdf.
Goldfinger, Steven, Chad Monfreda, Dan Moran, Mathis Wackernagel, e Paul Wermer. 2005. «National Footprint and Biocapacity Accounts 2005: The underlying calculation method».
2/3
Conoscenza e tecnologie appropriate per la sostenibilità urbanistica - Knowledge and Appropriate Technologies for Sustainability in Planning - 29 febbraio - 04 marzo 2016 - Modulo 20
Global Footprint Network.Goldfinger, Steven, Paul Wermer, e Mathis Wackernagel. 2007. «Introduction to the Ecological
Footprint: Underlying Research Question and Current Calculation Strategy». Ecological Economics Encyclopaedia, marzo.
Goldfinger, Steve, Mathis Wackernagel, Alessandro Galli, Elias Lazarus, e David Lin. 2014. «Footprint Facts and Fallacies: A Response to Giampietro and Saltelli (2014) “Footprints to Nowhere”». Ecological Indicators 46 (novembre): 622–32. doi:10.1016/j.ecolind.2014.04.025.
Greater London Authority. 2008. The London Plan: Spatial Development Strategy for Greater London ; Consolidated with Alterations since 2004. London: Greater London Authority.
———. 2009. The London Plan: Spatial Development Strategy for Greater London. London: Greater London Authority.
London Climate Change Partnership. 2006. Adapting to Climate Change: Lessons for London. London: Greater London Authority, City Hall, The Queen’s Walk.
London First. s.d. «Making London a Sustainable City Reducing London’s Ecological Footprint». London First, London Remade.
Schaefer, Florian, Ute Luksch, Nancy Steinbach, Julio Cabeça, e Jörg Hanauer. 2006. «Ecological Footprint and Biocapacity The World’s Ability to Regenerate Resources and Absorb Waste in a Limited Time Period». Luxembourg: Office for Official Publications of the European Communities.
ciclo geobiochìmico Fonte: Treccani: Enciclopedie on line
Processo in equilibrio dinamico attraverso il quale avviene la circolazione degli elementi chimici nella biosfera, che si svolge dagli organismi viventi all'ambiente e viceversa. Sono essenziali 30÷40 elementi per gli organismi, alcuni in grande quantità (C, N, O, H), altri in quantità minore o in tracce (S, Na, K, Mg, Fe, P, Ca).
3/3

IABSE Henderson Colloquium, Cambridge, 10-12 July 2006 Herbert Girardet
Factor 10 Engineering for Sustainable Cities
__________________________________________________________________________________________
1
URBAN METABOLISM: LONDON SUSTAINABILITY SCENARIOS
Herbert Girardet
Environmental Consultant, UK
‘Unsustainable’ ‘Towards sustainability’ ‘Sustainable’
Resource
&
Land Use
‘Factor 1’ ~ 2000
Per capita footprint: 6.6 ha
= Total ecological footprint ~
300 x London’s surface area
‘Factor 2’ ~ 2015
Per capita footprint: 3.3 ha
= Total ecological footprint ~
150 x London’s surface area
‘Factor 4’ ~ 2030
Per capita footprint: 1.6 ha
= Total ecological footprint ~
75 x London’s surface area
Food
Long distance supply of highly
packaged food as norm.
Intensive processing.
High meat consumption.
30% food waste.
Very energy intensive.
Only 2% organic, most of this
imported.
Limited allotment growing and peri-
urban fruit and vegetable cultivation.
Reduced long distance supply.
Less processing & packaging.
Reduced meat consumption.
Some food waste recycling.
More energy efficient.
30% organic, mostly locally grown
40% UK grains.
50% increase in allotment growing.
40% peri-urban fruit & vegetable
supplies.
Regional supply emphasised.
Minimal processing.
Low meat consumption.
Much food waste recycling.
Highly energy efficient.
50% organic, incl. use of sewage.
60% UK grains.
A further 30% increase in allotment
growing.
60% peri-urban fruit & vegetable
supplies.
Water/
sewage
Water from Thames & Lea.
High flush toilets, etc.
No run-off storage.
Single household water system.
Little sewage recycling.
‘Imported’ & London water table.
Variable flush toilets as norm.
Some run-off storage.
Efficient household water system.
Some sewage recycling.
‘Imported’ & London water table.
Low flush toilets as norm.
Substantial run-off storage.
Dual household water systems.
Routine sewage recycling.
Energy
Dependence on fossil fuels.
18% nuclear.
Low building insulation st’dards.
Much use of ineff. appliances.
Minimal end use efficiency.
Minimal renewable energy.
Reduced fossil fuel /more CHP.
/some renewable.
Improved building insulation
standards.
More efficient appliances and
increased end use efficiency.
CHP/ solar/ wind/ biomass & fuel
cells as main energy technologies.
High building insulation standards.
Common use of high-efficiency.
appliances and implementation of
high end-use efficiency.
Transport
Emphasis on private transport.
Minimal car sharing.
Little cycling and walking.
Fossil fuel powered transport.
Low transport interconnection.
Better transport mix.
More shared vehicles.
Much cycling and walking.
Petrol, electric & fuel cell tr’sport.
Good interconnections.
Optimal transport mix.
Widespread vehicle sharing.
‘Urban village’, cycling and walking.
Fuel cell & solar-electric transport.
Optimal interconnections.
Materials
Wasteful use of materials.
Only imported materials.
Little product durability.
Everything is packaged.
Few regional supplies.
No regional timber.
Unsustainable sources as norm
No consumption limitation.
More local and reused materials.
Minimal use of virgin materials.
Increasing product durability.
Reduction in packaging use.
Emphasis on regional supplies.
Some regional timber.
Sustainable sources common. Some
consumption reduction.
Minimal waste of materials.
Maximise sustainable sources.
High product durability.
Minimal packaging.
Emphasis on local supplies.
Regional timber in common use.
Shared use of products.
Large consumption reduction.
Waste Linear system.
8% recycling.
Little waste separation.
Minimal recycling.
Most waste disposed in landfills
Some incineration.
No remanufacturing.
Towards a circular system.
25% recycling.
Some waste separation:
Reduce, reuse, recycle.
Restricted landfill disposal.
Minimal incineration.
New re-manufacturing industries.
Circular system.
75% recycling.
Waste separation as norm:
Refuse, reduce, reuse, recycle.
Remanufacture of metals, glass,
paper & consumer waste into new
products has become routine.
© Herbert Girardet, 2002 / 2006
lmares
Underline
lmares
Underline
lmares
Underline
lmares
Highlight
lmares
Highlight
lmares
Highlight
lmares
Sticky Note
lavori pubblici
lmares
Underline
lmares
Underline
lmares
Underline

IABSE Henderson Colloquium, Cambridge, 10-12 July 2006 Herbert Girardet
Factor 10 Engineering for Sustainable Cities
__________________________________________________________________________________________
2
The Environmental Sustainability of Modern Cities
Following the economic growth euphoria of the post-war years, increasingly profligate use of
resources became the norm in the second half of the 20th century. Cities acquired an essentially linear
metabolism, with little concern about the origin of resources flowing into them and the destiny of
waste emanating from them. This has become a major systemic problem regarding their
environmental sustainability. Consequently, dealing with the ever-greater environmental impacts of
an urban-industrial civilisation has become one of the great challenges of our time.
Modern cities depend heavily on materials and energy from outside their boundaries. London’s per-
capita ecological footprint, at 6.6 ha, is lower than that of New York or Los Angeles, at more than 10
ha, but in a world of cities, where American, Australian and European lifestyles are copied all over the
world, significant improvements in resource productivity are called for. A particular concern is the
huge dependence of modern cities on fossil fuels. But policies to deal with these problems have, more
often than not, addressed the effects rather than the causes of the problem.
Friedrich Schmidt-Bleek, formerly of Germany’s Wuppertal Institute, is the originator of the important
concept of ‘Material Input Per Unit Service’ (MIPS). He is highly critical of prevailing sustainability
policies: “Current environmental policies cannot lead to sustainability because they essentially address
the output-side of the economy, they do not focus on lowering resource consumption (in fact, they
often spawn additional resource investments), they are basically non-precautionary, they attempt to
increase the supply of "environmentally friendly" energy and materials and they cause enormous non-
market-driven costs that most countries cannot afford.”
Schmidt-Bleek is also one of the originators of the Factor 4 concept, and the founder of the Factor 10
Institute, which seeks to define practical ways of significantly improving resource productivity by
reducing MIPS in modern urban-industrial systems.
Sustainability Scenarios
The chart above indicates ways of achieving concrete progress towards creating environmentally
sustainable cities, with London as the chosen example. Many of the proposals are concerned with
MIPS-style up-stream rather than end-of-pipe measures. The necessary changes will need to be driven
by a combination of innovative policy and regulation, technological development and behavioural
change.
The existing environmental strategies of the Greater London Authority, if implemented, would
contribute significantly towards a Factor 2 reduction in resource use. Sadly, there are few indications
that the UK government intends to introduce appropriate policies to help London become the
exemplary ‘sustainable world city’ that the mayor wants it to be. Achieving really significant
improvements in resource productivity, and creating a truly circular metabolism, are distant goals.
However, growing concern about the impacts of climate change on London may speed up introduction
and implementations of appropriate policies at city and national levels.
Resource use has to do with lifestyles as well as uses of technology. Making cities work efficiently
requires major changes in both. To create an environmentally sustainable London means reducing its
resource use – as measured by its ecological footprint – by a factor of around 4. But often this may
require a Factor 10 improvement in the performance of London’s engineering systems.
The following paragraphs discuss the London Sustainability Scenarios, as proposed above, in more
detail:
Food
Few cities have a food strategy, on the assumption that urban food supplies are provided commercially
by supermarkets, street markets and corner shops. But given that around 23% of a household’s carbon
footprint arises from its food choices, food provision must be seen as an integral part of the process of
reducing urban footprints.
lmares
Highlight
lmares
Highlight
IABSE Henderson Colloquium, Cambridge, 10-12 July 2006 Herbert Girardet
Factor 10 Engineering for Sustainable Cities
__________________________________________________________________________________________
3
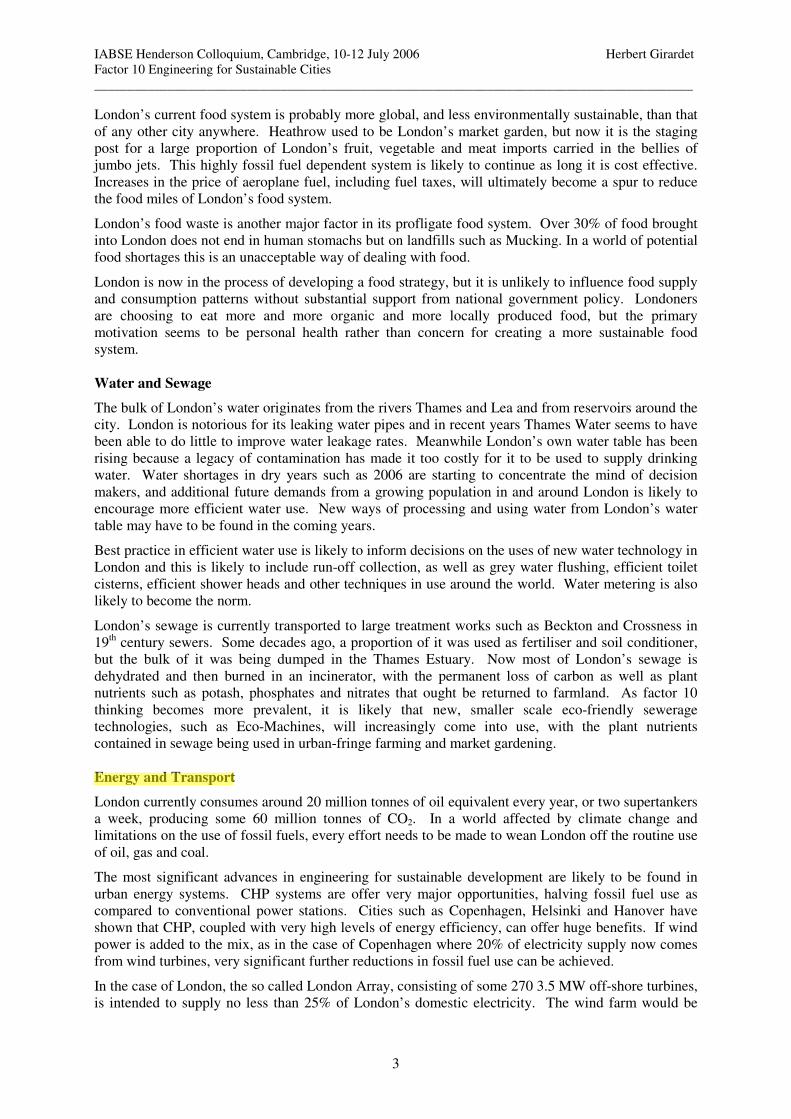
London’s current food system is probably more global, and less environmentally sustainable, than that
of any other city anywhere. Heathrow used to be London’s market garden, but now it is the staging
post for a large proportion of London’s fruit, vegetable and meat imports carried in the bellies of
jumbo jets. This highly fossil fuel dependent system is likely to continue as long it is cost effective.
Increases in the price of aeroplane fuel, including fuel taxes, will ultimately become a spur to reduce
the food miles of London’s food system.
London’s food waste is another major factor in its profligate food system. Over 30% of food brought
into London does not end in human stomachs but on landfills such as Mucking. In a world of potential
food shortages this is an unacceptable way of dealing with food.
London is now in the process of developing a food strategy, but it is unlikely to influence food supply
and consumption patterns without substantial support from national government policy. Londoners
are choosing to eat more and more organic and more locally produced food, but the primary
motivation seems to be personal health rather than concern for creating a more sustainable food
system.
Water and Sewage
The bulk of London’s water originates from the rivers Thames and Lea and from reservoirs around the
city. London is notorious for its leaking water pipes and in recent years Thames Water seems to have
been able to do little to improve water leakage rates. Meanwhile London’s own water table has been
rising because a legacy of contamination has made it too costly for it to be used to supply drinking
water. Water shortages in dry years such as 2006 are starting to concentrate the mind of decision
makers, and additional future demands from a growing population in and around London is likely to
encourage more efficient water use. New ways of processing and using water from London’s water
table may have to be found in the coming years.
Best practice in efficient water use is likely to inform decisions on the uses of new water technology in
London and this is likely to include run-off collection, as well as grey water flushing, efficient toilet
cisterns, efficient shower heads and other techniques in use around the world. Water metering is also
likely to become the norm.
London’s sewage is currently transported to large treatment works such as Beckton and Crossness in
19th century sewers. Some decades ago, a proportion of it was used as fertiliser and soil conditioner,
but the bulk of it was being dumped in the Thames Estuary. Now most of London’s sewage is
dehydrated and then burned in an incinerator, with the permanent loss of carbon as well as plant
nutrients such as potash, phosphates and nitrates that ought be returned to farmland. As factor 10
thinking becomes more prevalent, it is likely that new, smaller scale eco-friendly sewerage
technologies, such as Eco-Machines, will increasingly come into use, with the plant nutrients
contained in sewage being used in urban-fringe farming and market gardening.
Energy and Transport
London currently consumes around 20 million tonnes of oil equivalent every year, or two supertankers
a week, producing some 60 million tonnes of CO2. In a world affected by climate change and
limitations on the use of fossil fuels, every effort needs to be made to wean London off the routine use
of oil, gas and coal.
The most significant advances in engineering for sustainable development are likely to be found in
urban energy systems. CHP systems are offer very major opportunities, halving fossil fuel use as
compared to conventional power stations. Cities such as Copenhagen, Helsinki and Hanover have
shown that CHP, coupled with very high levels of energy efficiency, can offer huge benefits. If wind
power is added to the mix, as in the case of Copenhagen where 20% of electricity supply now comes
from wind turbines, very significant further reductions in fossil fuel use can be achieved.
In the case of London, the so called London Array, consisting of some 270 3.5 MW off-shore turbines,
is intended to supply no less than 25% of London’s domestic electricity. The wind farm would be
lmares
Highlight

IABSE Henderson Colloquium, Cambridge, 10-12 July 2006 Herbert Girardet
Factor 10 Engineering for Sustainable Cities
__________________________________________________________________________________________
4
located more than 20km off the Kent and Essex coasts in the outer Thames Estuary. “When fully
operational, it would make a substantial contribution to the UK Government’s renewable energy target
of providing 10% of the UK’s electricity from renewable sources by 2010. Based on the current
schedule, it is expected that the project would represent nearly 10% of this target. It would also
prevent the emissions of 1.9 million tonnes of carbon dioxide each year.” www.londonarray.com
The prospects for solar PV are looking increasingly bright. Technical breakthroughs, such as those
recently announced by the US/German company Nanosolar, promise to make PV technology cost
competitive with conventional power generation in the near future. Nanosolar is currently in pilot
production of its paper-thin flexible solar cells in Palo Alto and has started ordering volume
production equipment for the new factory in a 100 million dollar investment. Nanosolar says that “the
new plant could produce upward of 1 million solar panels every year, enough to produce 430
megawatts of power – nearly triple the output of all existing solar panel manufacturing facilities in the
US.” www.nanosolar.com
Supported by appropriate “feed-in legislation”, as introduced in 15 EU countries, solar energy
prospects for cities are vast and hold the promise of delivering factor 10 reductions in fossil fuel-based
urban electricity generation and CO2 emissions.
Prospects for Factor 10 engineering in urban transport are well covered in Hugo Spowers’ paper on
fuel cell technology. He makes clear that we need to look not only at engine and brake technology but
also at materials used for vehicle bodies. In addition, we need to look at the potential for significant
reductions in car use. The London congestion charge, together with support for public transport and
cycling has been a useful start, but only a start. Much more needs to be done to assure mode switching
from public transport to cycling, etc., to enable efficient, flexible journeys.
Materials and Waste
The urban metabolism consists of the entire input of resources used by city people, and their
subsequent output of wastes. As suggested above, modern cities tend to have a linear rather than a
circular metabolism. Many materials are used only once and then end up in a landfill. For cities to
exist in the long term, they need to function in a similar manner. High resource productivity is the key
to the necessary changes.
In nature every output by an individual organism is also an input that renews the whole living
environment of which it is a part: the web of life hangs together in a chain of mutual benefit. To
become sustainable, cities have to develop a similar circular metabolism, using and re-using resources
as efficiently as possible and minimising materials use and waste discharges into the natural
environment.
In London a start has been made by the creation of bodies such as London Remade. But this is only a
first, tentative step. London needs to trawl the world for examples of best practice. Implementation of
a policy of efficient materials use certainly involves the uses of new technology. But equally it
requires the participation of Londoners in a “culture of sustainability”. Steps in this direction will be
encouraged by the growing realisation that environmental sustainability is good for generating new
businesses and new jobs.
This seminar offers a great opportunity to explore the engineering options for sustainable urban
development. Factor 10 reductions in urban resource consumption use look feasible in various sectors.
It is important to clarify more precisely were the most significant gains can be made.
lmares
Highlight
lmares
Highlight
Regenerative Cities

Written for the World Future Council and HafenCity University
Hamburg (HCU) Commission on Cities and Climate Change
With thanks for comments and suggestions by Nicholas You, Peter Droege, Dushko Bogunovich, Ralf Otterpohl, Peter Head and Stefan Schurig.
© Herbert Girardet/World Future Council
Cities Commission for „Regenerative Cities“:
The World Future Council brings the interests of future generations to the centre of policy making. It addresses
challenges to our common future and provides decisionmakers with effective policy solutions.
HafenCity University Hamburg (HCU) is Europe's first university that entirely focuses on disciplines of the built
environment, such as architecture, urban and regional planning, civil engineering and geomatics.
Together, the World Future Council and HafenCity University Hamburg (HCU) have established an international
Commission on Cities and Climate Change whose members strife to identify best policies for future urban development.
Coordinators of The Commission: Iris Gust (HCU) and Stefan Schurig (WFC).
The members of the HCU-WFC Commission on Cities and Climate Change are:
Tatiana Bosteels
Head of Responsible Property Investment,
Hermes Real Estate, London, UK
Prof. Peter Droege
Professor, UrbanSCAPE/Institute of Architecture &
Planning, University of Liechtenstein
Chair, World Council for Renewable Energy (WCRE)
Asia Pacific
Steering Committee Member, Urban Climate Change
Research Network
Prof. Dr. Hans-Peter Dürr
Nuclear physicist and philosopher
Member of the World Future Council
Bill Dunster
Managing Director, Bill Dunster architects
ZEDfactory Ltd
Fabio Feldmann
Member, World Future Council
Brazilian environmental legislator
Prof. Dr. hc. mult. Meinhard von Gerkan
Senior partner, gmp architects
Prof. Herbert Girardet
Co-Founder World Future Council
Prof. Dr. Hartmut Graßl
Professor emeritus, Max-Planck-Institute for
Meteorology
Randy Hayes
Policy Officer, World Future Council USA
Peter Head
Director, Planning and Integrated Urbanism, ARUP
Prof. Jeffrey Kenworthy
Professor, The CUSP Institute (Curtin University
Sustainability Policy Institute), Curtin University of
Technology
Ashok Khosla
Member, World Future Council
President, Development Alternatives, New Delhi
President, IUCN (International Union for Conservation
of Nature and Natural Resources)
Prof. C.S. Kiang
Member, World Future Council
Dean of Environmental Studies, Beijing University
Prof. Dr. Jörg Knieling
Professor, Urban Planning and Regional Development,
Vice-president Research HafenCity University Hamburg
(HCU)
Prof. Dr. Dieter Läpple
Professor emeritus, HafenCity University Hamburg
(HCU)
Advisor to Urban Age Network
Dr. Harry Lehmann
Head of Division of Environmental Planning and Sustain-
ability Strategies, Federal Environment Agency Germany
Dr. Eric Martinot
Senior Research Director, Institute for Sustainable
Energy Policies
Sebastian Moffatt
Director of Research and Development, CONSENSUS
Institute Inc.
Prof. Peter Newman
Professor, CUSP Institute (Curtin University
Sustainability Policy Institute)
Curtin University of Technology
Prof. Dr.-Ing. Ralf Otterpohl
Director Institute of Wastewater Management
and Water Protection
Technical University Hamburg- Harburg (TUHH)
Sanjay Prakash
Sanjay Prakash & Associates, Delhi
Fatima Shah
The International Bank for Reconstruction and
Development/The World Bank
Henning Thomsen
Culture & Communications Manager at Gehl Architects
Prof. Suani Teixeira Coelho
CENBIO - The Brazilian Reference Center on Biomass,
Institute of Electrotechnics and Energy, University of
São Paulo
Anders Wijkman
Vice President Club of Rome, Vice President Täåallberg
Foundation, Member of the World Future Council
Nicholas You
Strategic Planning & Knowledge Management for
Sustainability
..

Regenerative Cities
Herbert Gir ardet
Introduction and summary
At the start of the 21st century, humanity is becoming a predominantly urban species and this historic devel-opment represents a fundamental, systemic change in the relationship between humans and nature. Urban-based economic activities account for 55 per cent of GNP in the least developed countries, 73 per cent in middleincome countries and 85 per cent in the most developed countries.1
Modern cities, then, are defined by the concentration of economic activities and intense human interaction.This is reflected in high average levels of personal consumption and the efficient supply of a great variety ofservices at comparatively low per-capita costs. But the environmental impacts of an urbanising humanity are agreat cause for concern. Apart from a near monopoly on the use of fossil fuels, metals and concrete, an urban-ising humanity now consumes nearly half of nature’s annual photosynthetic capacity as well.
Since the industrial revolution the process of urbanisation has become ever more resource-intensive, and it significantly contributes to climate change, loss of soil carbon, natural fertility of farmland, and the loss of biodiversity all over the world. The ravenous appetite of our fossil-fuel powered lifestyles for resources fromthe world’s ecosystems has severe consequences for all life on Earth, including human life.
Cities have developed resource consumption and waste disposal habits that show little concern for the consequences. Addressing this issue is the primary task of this paper.
The larger and the richer the city, the more it tends to draw on nature’s bounty from across the world ratherthan its own local hinterland. Human impacts on the world’s ecosystems and landscapes are dominated by theecological footprints of cities which now stretch across much of the Earth. They can be hundreds of timeslarger than the cities themselves. In an urbanising world, cities need to rapidly switch to renewable energy andto actively help restore damaged ecosystems.
The WWF states in its Living Planet Reports that in the last 30 years a third of the natural world has been obliterated.2 40-50 per cent of Earth’s ice-free land surface has been heavily transformed or degraded by humanactivities, 66 per cent of marine fisheries are either overexploited or at their limit and atmospheric CO2 has increased more than 30 per cent since the advent of industrialisation.3 Helping to reverse this collision course between humans and nature is a new challenge for most national politicians, but even more for urban politicians,planners and managers, and for architects, civil engineers and city dwellers.
The challenge today is no longer just to create sustainable cities but truly regenerative cities: to assure that they donot just become resource-efficient and low carbon emitting, but that they positively enhance rather than underminethe ecosystem services they receive from beyond their boundaries. A wide range of technical and managementsolutions towards this end are already available, but so far implementation has been too slow and too little.
Most importantly, the transformative changes that are required to make cities regenerative call for far-reachingstrategic choices and long-term planning as compared to the short-term compromises and patchwork solutionsthat characterise most of our political decision making systems at all spheres of government.
In recent years there has been a proliferation of urban regeneration initiatives focussed on the health and well-being of urban citizens and the urban fabric – the ‘inner-urban environment’ – particularly in rich countriessuch as Britain, Germany and the USA. Such initiatives have received much funding and media attention, andthey have improved the lives of millions of people. In various countries Urban Regeneration Associations havebeen established to address problems such as deindustrialisation, depopulation, congestion, aging infrastructure,run-down sink estates and associated matters.
1 UN Habitat, The State of the World’s Cities, 2006/7 2 WWF, Living Planet Report 2010, wwf.panda.org/about_our_earth/.../living_planet_report/2010_lpr/3 Vitousek, P.M., J. Lubchenco, H.A. Mooney, J. Melillo. 1997. Human domination of Earth’s ecosystems. Science 277: 494-499
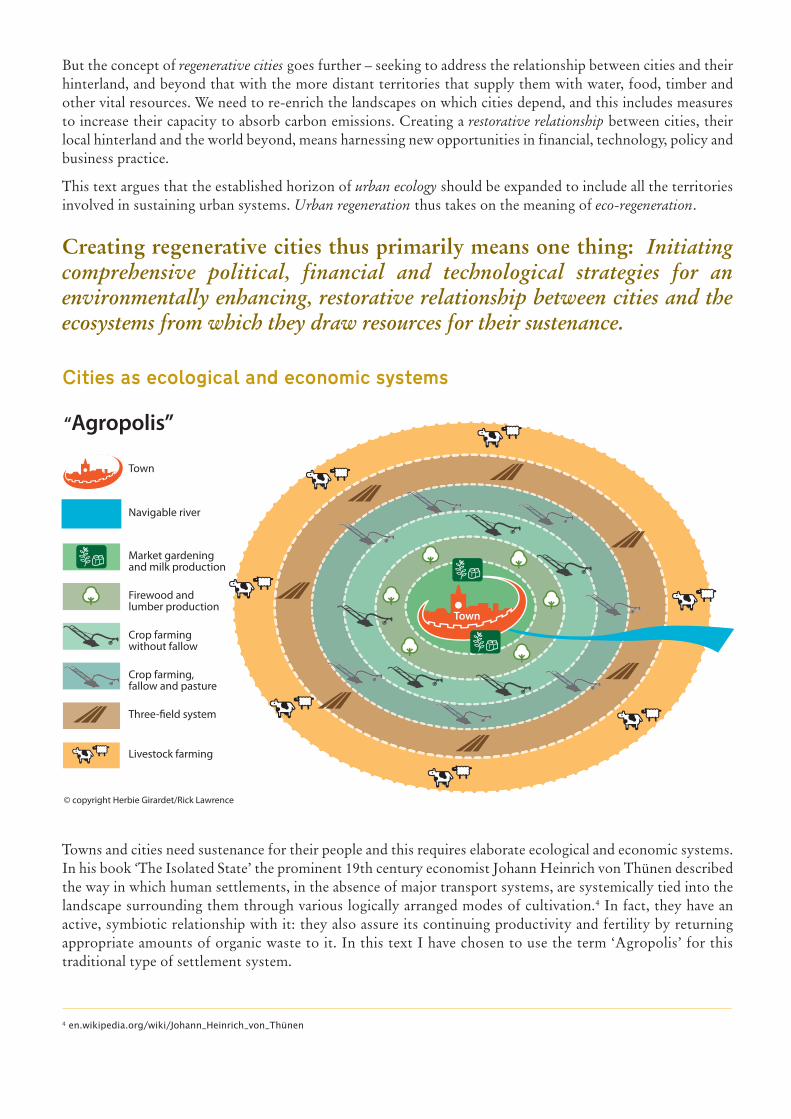
But the concept of regenerative cities goes further – seeking to address the relationship between cities and theirhinterland, and beyond that with the more distant territories that supply them with water, food, timber andother vital resources. We need to re-enrich the landscapes on which cities depend, and this includes measuresto increase their capacity to absorb carbon emissions. Creating a restorative relationship between cities, theirlocal hinterland and the world beyond, means harnessing new opportunities in financial, technology, policy andbusiness practice.
This text argues that the established horizon of urban ecology should be expanded to include all the territoriesinvolved in sustaining urban systems. Urban regeneration thus takes on the meaning of eco-regeneration.
Creating regenerative cities thus primarily means one thing: Initiating comprehensive political, financial and technological strategies for an environmentally enhancing, restorative relationship between cities and theecosystems from which they draw resources for their sustenance.
Cities as ecological and economic systems
Towns and cities need sustenance for their people and this requires elaborate ecological and economic systems.In his book ‘The Isolated State’ the prominent 19th century economist Johann Heinrich von Thünen describedthe way in which human settlements, in the absence of major transport systems, are systemically tied into thelandscape surrounding them through various logically arranged modes of cultivation.4 In fact, they have an active, symbiotic relationship with it: they also assure its continuing productivity and fertility by returning appropriate amounts of organic waste to it. In this text I have chosen to use the term ‘Agropolis’ for this traditional type of settlement system.
4 en.wikipedia.org/wiki/Johann_Heinrich_von_Thünen
Livestock farming
Three-field system
Crop farming, fallow and pasture
Crop farming without fallow
Firewood and lumber production
Market gardening and milk production
Navigable river
Town
Town
© copyright Herbie Girardet/Rick Lawrence
“Agropolis”
Von Thünen pioneered the view that the way cultivated land in close proximity to towns and cities is utilised isa logical function of two interconnected variables – the cost of transporting produce to market, and the landrent a farmer can afford to pay. He describes how isolated communities are surrounded by concentric rings ofvarying land uses. Market gardens and milk production are located closest to the town since vegetables, fruitand dairy products must get to market quickly. Timber and firewood, which are heavy to transport but essentialfor urban living, would be produced in the second ring. The third zone consists of extensive fields for producinggrain which can be stored longer and can be transported more easily than dairy products, and can thus be locatedfurther from the city. Ranching is located in the fourth zone since animals can be raised further away from thecity because they are ‘self-transporting’ on their own legs. Beyond these zones lies uncultivated land of lesseconomic relevance to urban living.
In many parts of the world traditional towns and cities, in the absence of efficient transport systems, had thesekind of symbiotic relationships to the landscapes from which they emerged, depending on nearby market gar-dens, orchards, forests, arable and grazing land and local water supplies for their sustenance. Until very recently,many Asian cities were still largely self-sufficient in food as well as fertiliser, using human and animal wastes tosustain the fertility of local farms.5 Can we learn from these traditional systems in the future whilst utilisingmore up-to-date methodologies and technologies?
The rise of Petropolis
The industrial revolution caused a virtual explosion of urban growth that continues to this day. Steam enginetechnology enabled the unprecedented concentration of industrial activities in urban centres. Cities increasinglycut the umbilical cord between themselves and their local hinterland and became global economic and transporthubs. This process has undermined local economies, as new modes of transportation have made it ever easierto supply food, raw materials and manufactured products from ever greater distances. Cities are no longer centres of civilisation but of mobilisation, with access to global resources as never before.
The phenomenal changes in human lifestyles made possible by the Age of Fire were also reflected in new conceptsof land use planning, particularly for accommodating the road space needed for motor cars. The vast, low-density urban landscapes that appeared in the USA, Australia and elsewhere are defined by the ubiquitous useof cars or petromobiles – the word automobile implies that they are self-powered which clearly they are not.
The modern city could be described as ‘Petropolis’: all its key functions – production, consumption and trans-port – are powered by massive injections of petroleum and other fossil fuels. But there is ever growing evidencethat the resulting dependencies are ecologically, economically and geopolitically untenable, particularly becausethe fossil fuel supplies on which modern cities depend are, most definitely, finite.
Even though we know that we live on a finite planet, infinite economic and urban growth is still taken forgranted. While the world’s population has grown fourfold in the twentieth century, urban populations andglobal resource consumption have increased sixteen fold and are still rising. It took around 300 million yearsfor oil, gas and coal to accumulate in the earth’s crust and we are on track to burn much of it in just 300 years– now at a rate of well over a million years per year. Cities are particularly responsible for this: despite takingup only three to four per cent of the world’s surface area they use approximately 80 per cent of its resourcesand also discharge similar proportions of waste. These figures are still increasing.
The highly problematic patterns of fossil-fuel dependent urbanisation are still expanding across the world.
Today urbanisation and economic and financial globalisation are closely connected. Cities have become glob-alised centres of production as well as consumption, with throughputs of unprecedented quantities of resourcesand industrial products being the norm in the wealthier countries. In emerging countries, too, urbanisation isclosely associated with ever increasing per-capita use of fossil fuels and with impacts on ever more distantecosystems. The rapid growth of cities such as Dubai with its vast airport, world record skyscrapers, artificialislands and low-density desert suburbs, is the latest and most astonishing example of this.
5 F. H. King, Farmers of Forty Centuries: Organic Farming in China, Korea, and Japan, Courier Dover Publications, 1911
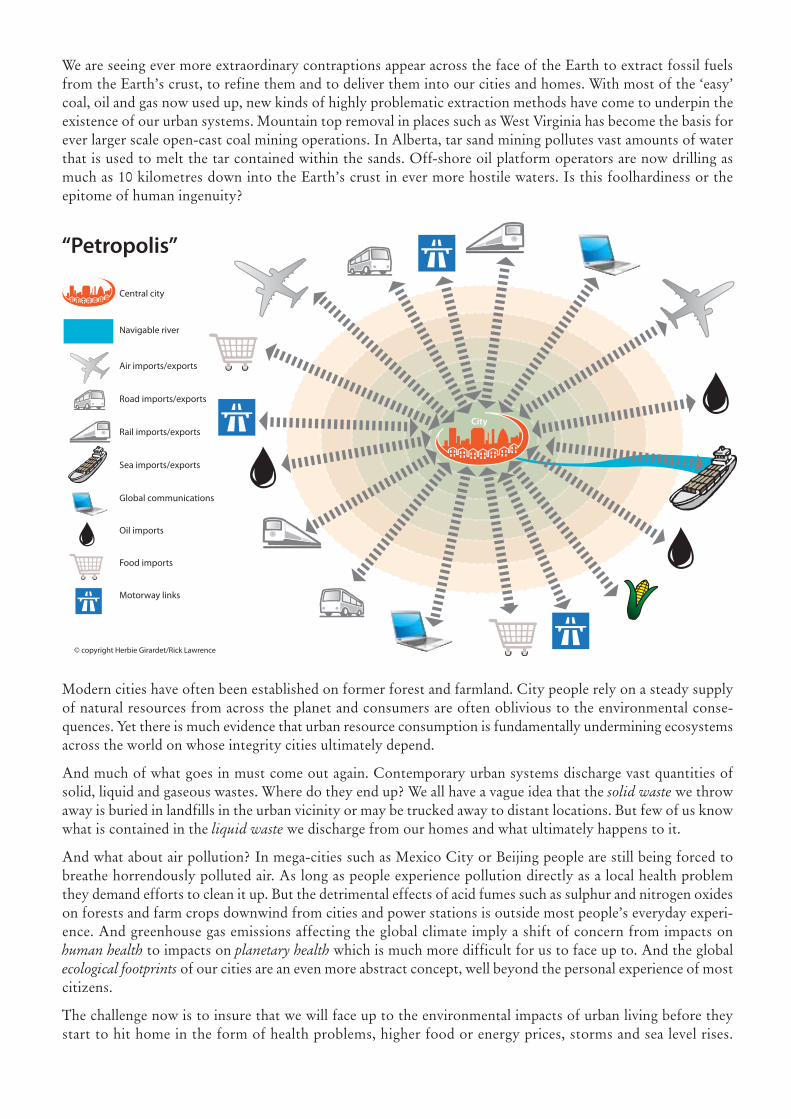
We are seeing ever more extraordinary contraptions appear across the face of the Earth to extract fossil fuelsfrom the Earth’s crust, to refine them and to deliver them into our cities and homes. With most of the ‘easy’coal, oil and gas now used up, new kinds of highly problematic extraction methods have come to underpin theexistence of our urban systems. Mountain top removal in places such as West Virginia has become the basis forever larger scale open-cast coal mining operations. In Alberta, tar sand mining pollutes vast amounts of waterthat is used to melt the tar contained within the sands. Off-shore oil platform operators are now drilling asmuch as 10 kilometres down into the E arth’s crust in ever more hostile waters. Is this foolhardiness or the epitome of human ingenuity?
Modern cities have often been established on former forest and farmland. City people rely on a steady supplyof natural resources from across the planet and consumers are often oblivious to the environmental conse-quences. Yet there is much evidence that urban resource consumption is fundamentally undermining ecosystemsacross the world on whose integrity cities ultimately depend.
And much of what goes in must come out again. Contemporary urban systems discharge vast quantities ofsolid, liquid and gaseous wastes. Where do they end up? We all have a vague idea that the solid waste we throwaway is buried in landfills in the urban vicinity or may be trucked away to distant locations. But few of us knowwhat is contained in the liquid waste we discharge from our homes and what ultimately happens to it.
And what about air pollution? In mega-cities such as Mexico City or Beijing people are still being forced tobreathe horrendously polluted air. As long as people experience pollution directly as a local health problemthey demand efforts to clean it up. But the detrimental effects of acid fumes such as sulphur and nitrogen oxideson forests and farm crops downwind from cities and power stations is outside most people’s everyday experi-ence. And greenhouse gas emissions affecting the global climate imply a shift of concern from impacts onhuman health to impacts on planetary health which is much more difficult for us to face up to. And the globalecological footprints of our cities are an even more abstract concept, well beyond the personal experience of mostcitizens.
The challenge now is to insure that we will face up to the environmental impacts of urban living before theystart to hit home in the form of health problems, higher food or energy prices, storms and sea level rises.
Sea imports/exports
Rail imports/exports
Road imports/exports
Air imports/exports
Navigable river
Central city
Global communications
Oil imports
Food imports
Motorway links
© copyright Herbie Girardet/Rick Lawrence
City
City
“Petropolis”
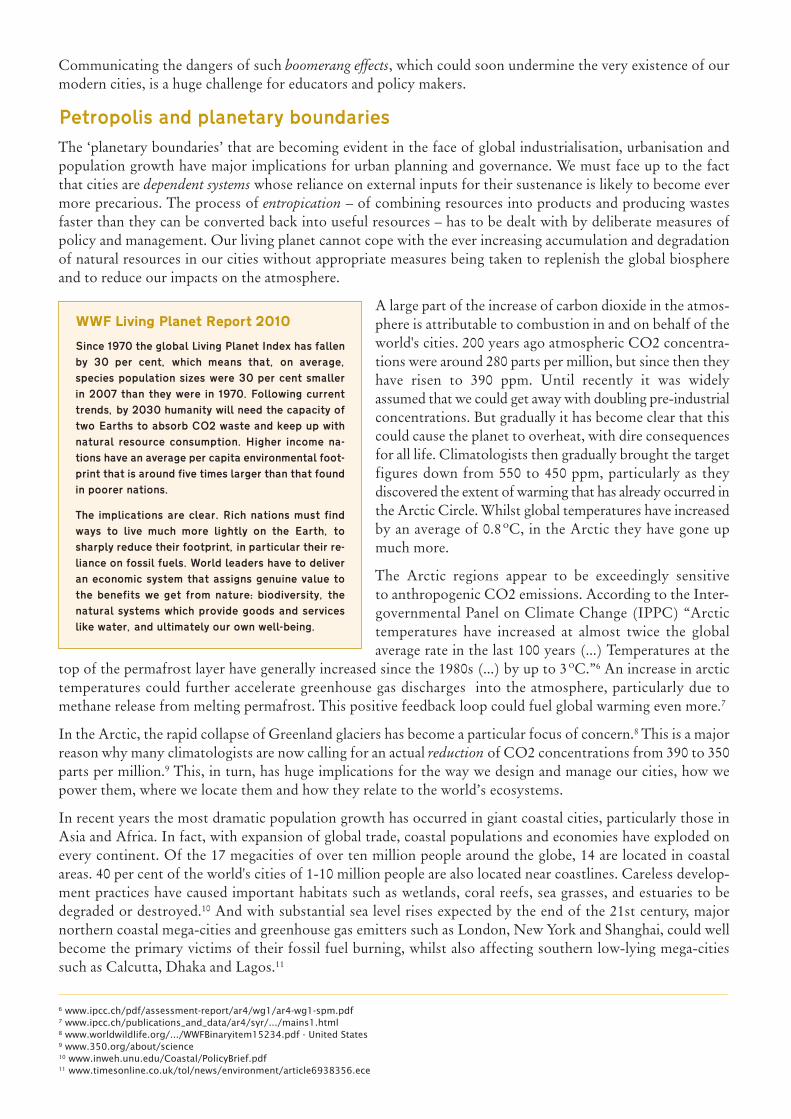
Communicating the dangers of such boomerang effects, which could soon undermine the very existence of ourmodern cities, is a huge challenge for educators and policy makers.
Petropolis and planetary boundaries
The ‘planetary boundaries’ that are becoming evident in the face of global industrialisation, urbanisation andpopulation growth have major implications for urban planning and governance. We must face up to the factthat cities are dependent systems whose reliance on external inputs for their sustenance is likely to become evermore precarious. The process of entropication – of combining resources into products and producing wastesfaster than they can be converted back into useful resources – has to be dealt with by deliberate measures ofpolicy and management. Our living planet cannot cope with the ever increasing accumulation and degradationof natural resources in our cities without appropriate measures being taken to replenish the global biosphereand to reduce our impacts on the atmosphere.
A large part of the increase of carbon dioxide in the atmos-phere is attributable to combustion in and on behalf of theworld's cities. 200 years ago atmospheric CO2 concentra-tions were around 280 parts per million, but since then theyhave risen to 390 ppm. Until recently it was widely assumed that we could get away with doubling pre-industrialconcentrations. But gradually it has become clear that thiscould cause the planet to overheat, with dire consequencesfor all life. Climatologists then gradually brought the targetfigures down from 550 to 450 ppm, particularly as they discovered the extent of warming that has already occurred inthe Arctic Circle. Whilst global temperatures have increasedby an average of 0.8ºC, in the Arctic they have gone upmuch more.
The Arctic regions appear to be exceedingly sensitive to anthropogenic CO2 emissions. According to the Inter-governmental Panel on Climate Change (IPPC) “Arctic temperatures have increased at almost twice the global average rate in the last 100 years (...) Temperatures at the
top of the permafrost layer have generally increased since the 1980s (...) by up to 3ºC.”6 An increase in arctictemperatures could further accelerate greenhouse gas discharges into the atmosphere, particularly due tomethane release from melting permafrost. This positive feedback loop could fuel global warming even more.7
In the Arctic, the rapid collapse of Greenland glaciers has become a particular focus of concern.8 This is a majorreason why many climatologists are now calling for an actual reduction of CO2 concentrations from 390 to 350parts per million.9 This, in turn, has huge implications for the way we design and manage our cities, how wepower them, where we locate them and how they relate to the world’s ecosystems.
In recent years the most dramatic population growth has occurred in giant coastal cities, particularly those inAsia and Africa. In fact, with expansion of global trade, coastal populations and economies have exploded onevery continent. Of the 17 megacities of over ten million people around the globe, 14 are located in coastalareas. 40 per cent of the world's cities of 1-10 million people are also located near coastlines. Careless develop-ment practices have caused important habitats such as wetlands, coral reefs, sea grasses, and estuaries to be degraded or destroyed.10 And with substantial sea level rises expected by the end of the 21st century, majornorthern coastal mega-cities and greenhouse gas emitters such as London, New York and Shanghai, could wellbecome the primary victims of their fossil fuel burning, whilst also affecting southern low-lying mega-citiessuch as Calcutta, Dhaka and Lagos.11
6 www.ipcc.ch/pdf/assessment-report/ar4/wg1/ar4-wg1-spm.pdf 7 www.ipcc.ch/publications_and_data/ar4/syr/.../mains1.html8 www.worldwildlife.org/.../WWFBinaryitem15234.pdf - United States 9 www.350.org/about/science10 www.inweh.unu.edu/Coastal/PolicyBrief.pdf 11 www.timesonline.co.uk/tol/news/environment/article6938356.ece
WWF Living Planet Report 2010
“Since 1970 the global Living Planet Index has fallen
by 30 per cent, which means that, on average,
species population sizes were 30 per cent smaller
in 2007 than they were in 1970. Following current
trends, by 2030 humanity will need the capacity of
two Earths to absorb CO2 waste and keep up with
natural resource consumption. Higher income na-
tions have an average per capita environmental foot-
print that is around five times larger than that found
in poorer nations.
The implications are clear. Rich nations must find
ways to live much more lightly on the Earth, to
sharply reduce their footprint, in particular their re-
liance on fossil fuels. World leaders have to deliver
an economic system that assigns genuine value to
the benefits we get from nature: biodiversity, the
natural systems which provide goods and services
like water, and ultimately our own well-being.”

The concept of Petropolis, the fossil fuel powered city which is the current global ‘urban archetype’, needs tobe challenged fundamentally as its systemic flaws become increasingly evident.
These are some of the dominant trends: demand for fossil fuels, energy costs, carbon emissions, climate insta-bility and sea levels are increasing, whilst global reserves of natural resources and the time left for action issteadily decreasing. But, crucially and hopefully, so is the cost of renewable energy!
Creating the solar city
Some people simply want large modern cities togo away. But given that for the time being urban-isation is a global trend, ways have to be found forcities to minimise their systemic dependence onfossil fuels and their unsustainable use of naturalresources. A rapid switch towards powering ourcities with renewable energy is a crucially impor-tant starting point. The key question to which anurgent answer is needed is: how can cities that arethe product of fossil fuel-based technologies bepowered by renewable energy instead? We haveaddressed this issue in some detail on our recentpublication, Peter Droege’s report ‘100% Renew-able Energy – and beyond – for Cities’.12
Our planet derives its energy supply from the sun and the Earth’s core and, ultimately, these two primary energysources need to be used to power our cities. The good news is that in the last few years rapid strides have beenmade with a wide spectrum of renewable energy technologies.
Technology and policy go closely hand-in-hand: Germany, Spain and another 50 countries and regions aroundthe world have chosen to introduce feed-in tariffs which make the installation of renewable energy systems acost effective proposition. Owners of solar PV roofs in Germany, Spain, Portugal or Greece are entitled to sellthe electricity they produce back to the grid at up to four times the price of conventional power stations. Thebenefits for national economies have been significant, reducing fossil fuel imports, carbon emissions, as well asenvironmental damage. In Germany the total cost per household to implement these renewable energy schemesis just five Euro per household per month. As a result of feed-in legislation, 18 per cent of Germany’s electricitynow comes from hydro power, solar power and wind farms and 300,000 new jobs have been created in ten years.This approach to energy policy has also led to significant breakthroughs in technology, and in the design ofbuildings.
Recently constructed building complexes such as the Solarsiedlung in Freiburg, for example, are designed toproduce more energy than they actually require.13 The highly energy efficient ‘plus-energy’ buildings with southfacing solar roofs are a model for intra-urban renewable energy production. Outside Seville ‘concentrated solarpower’ technology has been pioneered which utilises an array of mirrors that focus beams of sunlight onto thetop of towers through which liquid is circulated which drives steam turbines and generators. Seville is well onits way to become the world’s first large city to power itself with solar energy supplied from its hinterland, aswell from installations on roof tops within the city.14
A major new technological breakthrough is thin-film solar electric cells. These can be produced in printing machines which apply a photo-sensitive ink onto an aluminium or plastic foil. These new thin film technologiesare bringing the cost of solar electricity ever closer to full cost competitiveness with conventional power generation. In Germany arrays of thin-film solar power stations can be found around a growing number oftowns and cities.
12 www.worldfuturecouncil.org/fileadmin/user_upload/PDF/100__renewable_energy_for_citys-for_web.pdf 13 www.solarsiedlung.de/ 14 www.inhabitat.com/2007/05/21/sevilles-solar-power-tower/
DYNAMICS OF CHANGE
Increasing Decreasing
Energy demandEnergy costs
CO2 EmissionsClimate instability
Sea levels
Fossil fuel reservesNatural resources
Time left for actionCost of renewable
energy
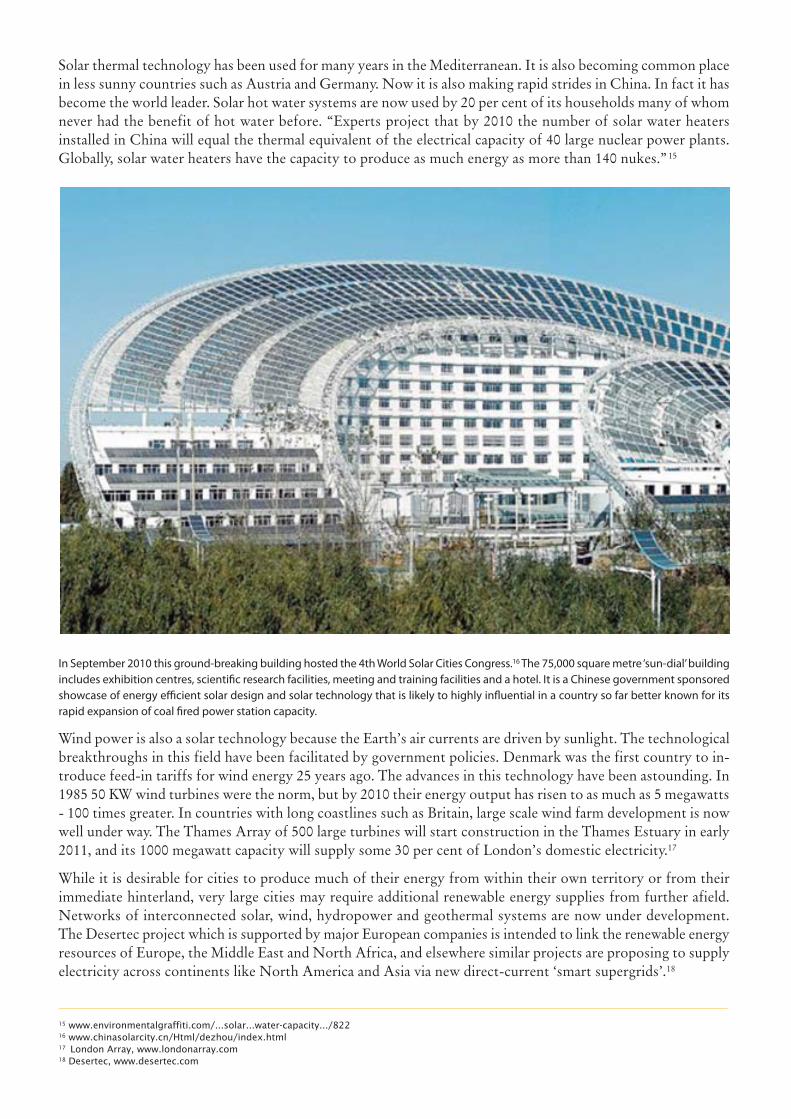
Solar thermal technology has been used for many years in the Mediterranean. It is also becoming common placein less sunny countries such as Austria and Germany. Now it is also making rapid strides in China. In fact it hasbecome the world leader. Solar hot water systems are now used by 20 per cent of its households many of whomnever had the benefit of hot water before. “Experts project that by 2010 the number of solar water heaters installed in China will equal the thermal equivalent of the electrical capacity of 40 large nuclear power plants.Globally, solar water heaters have the capacity to produce as much energy as more than 140 nukes.”15
In September 2010 this ground-breaking building hosted the 4th World Solar Cities Congress.16 The 75,000 square metre ‘sun-dial’ buildingincludes exhibition centres, scientific research facilities, meeting and training facilities and a hotel. It is a Chinese government sponsoredshowcase of energy efficient solar design and solar technology that is likely to highly influential in a country so far better known for itsrapid expansion of coal fired power station capacity.
Wind power is also a solar technology because the Earth’s air currents are driven by sunlight. The technologicalbreakthroughs in this field have been facilitated by government policies. Denmark was the first country to in-troduce feed-in tariffs for wind energy 25 years ago. The advances in this technology have been astounding. In1985 50 KW wind turbines were the norm, but by 2010 their energy output has risen to as much as 5 megawatts- 100 times greater. In countries with long coastlines such as Britain, large scale wind farm development is nowwell under way. The Thames Array of 500 large turbines will start construction in the Thames Estuary in early2011, and its 1000 megawatt capacity will supply some 30 per cent of London’s domestic electricity.17
While it is desirable for cities to produce much of their energy from within their own territory or from theirimmediate hinterland, very large cities may require additional renewable energy supplies from further afield.Networks of interconnected solar, wind, hydropower and geothermal systems are now under development.The Desertec project which is supported by major European companies is intended to link the renewable energyresources of Europe, the Middle East and North Africa, and elsewhere similar projects are proposing to supplyelectricity across continents like North America and Asia via new direct-current ‘smart supergrids’.18
15 www.environmentalgraffiti.com/...solar...water-capacity.../822 16 www.chinasolarcity.cn/Html/dezhou/index.html 17 London Array, www.londonarray.com18 Desertec, www.desertec.com

However, none of these efforts will be sufficient without simultaneously introducing comprehensive energydemand management systems for our cities. For more efficient energy use new insulation materials will enablethe retrofit of buildings from within without a significant loss of interior space. Three centimetres of ‘vacuuminsulation panels’, for instance, have much the same performance as 30 cm of conventional insulation materials.
Meanwhile the argument for increasing urban density has been gaining much credence. We can enhance trans-port energy efficiency through designing for proximity. We need to get people walking and cycling rather thandriving their cars wherever possible and in this we have much to learn from the compact layout of traditionalcities. Meanwhile transport technologies are also changing. Just ten years ago car manufacturers could barelyimagine making cars that did not run on petrol or diesel. Today, all mainstream manufacturers are working onhybrid or electric or fuel cell-powered cars which are promising to become the norm in a matter of years.
All of these measures, taken together, can dramatically change the energy production and consumption patternsof our cities whilst also creating major new economic sectors in our urban regions.
The metabolism of cities: from linear to circular
Similar to nature’s organisms, cities as ‘eco-technical super-organisms’19 have a definable metabolism – the trans-formation of resources into vital functions. Nature essentially has a circular zero-waste metabolism: every outputby an organism is also an input which replenishes and sustains the whole living environment. In contrast, themetabolism of many modern cities is essentially linear, with resources flowing through the urban system without
19 Herbert Girardet, Cities, People, Planet – Urban Development and Climate Change, Wiley, London 2004 and 2008
2000 watt society
The 2000-watt society concept was originated at the Swiss Federal Institute of Technology in Zuürich in 1998. It proposes
limiting the overall per capita energy use in developed countries to 2,000 watts, or 17,520 kilowatt-hours per year, by 2050
without lowering standards of living. Together with this energy limit, it also envisages a one ton of CO2 emissions limit per
person/year. The twofold aim is to implement energy sufficiency whilst commercialising the relevant technologies.
Switzerland currently uses a
per capita average of some
5,000 watts, but in 1960
each Swiss citizen used
around 2,000 watts, today,s;;
world average. Current per
capita energy use is around
12,000 watts in the United
States, 6,000 watts in
Western Europe, 2,000
watts in China, 1,000 watts
in India and 300 watts in
Bangladesh. The scenario
further envisages a reduc-
tion in the average use of
carbon fuels to 500 watts
per person, a quarter of the
total 2,000 watt allocation,
within 50 years.
The Swiss Council of States
wants to move the whole
nation towards a 2,000
watts per person goal by dramatically improving the energy efficiency of all aspects of life. In 2001 the Basel metropolitan
region was the first to adapt the 2,000 watt concept in a partnership between city authorities, industry and research
institutes. Zuürich joined up in 2005 and Geneva declared its interest in 2008.
www.novatlantis.ch/en/2000-watt-society.html
Living and
working
1500
450
1140
500
900
340
570
210
480
140230
180140
100
Consumer
goods and
foodstuffs
Infrastructure Electricity
consumption
Swiss family of 4 persons today:
4,960 watts per person
2,000-watt society:
1,920 watts per person
Mobility
(cars)
Mobility
(aircraft)
Mobility
(public
transport)
Energy requirement in watts

much concern about their origin, and about the destination of wastes. Inputs and outputs are considered aslargely unrelated. Fossil fuels are extracted from rock strata, refined and burned, and the waste gases are dis-charged into the atmosphere. Raw materials are extracted, combined and processed into consumer goods thatultimately end up as rubbish which cannot be beneficially reabsorbed into living nature. In distant forests, treesare felled for their timber or pulp, but all too often forests are not replenished.
Similar processes apply to food: nutrients and carbon are taken from farmland as food is harvested, processedand eaten. The resulting sewage, with or without treatment, is then discharged into rivers and coastal watersdownstream from population centres, and usually not returned to farmland. Rivers and coastal waters all overthe world are ‘enriched’ both with sewage and toxic effluents, as well as with the run-off of mineral fertiliserapplied to the farmland used for feeding cities.
This linear, open-loop approach is utterly unsustainable. In an urbanising world aiming for long-term viabilityit cannot continue. The environmental externalities of urban resources use can no longer be ignored. Unlesswe learn from nature how to create circular systems, an urbanising world will continue to be an agent of globalenvironmental decline.
Planners seeking to design resilient urban systems should start by studying the ecology of natural systems. Ona predominantly urban planet, cities will need to adopt circular metabolic systems to assure their own long-term viability as well as that of the rural environments on which they depend. Outputs will need to become inputs into the local and regional production system. Whilst in recent years a very substantial increase in recycling of paper, metals, plastic and glass has occurred, much more needs to be done. Most importantly, it iscrucial to convert organic waste into compost, and to return plant nutrients and carbon to farmland feedingcities, to assure its long-term fertility.
The local effects of urban resource use also need to be better understood. Cities accumulate large amounts ofmaterials within them. Vienna with some 1.6 million inhabitants, every day increases its actual weight by some25,000 tonnes.20 Much of this is relatively inert materials, such as steel, concrete and tarmac. Other materials,such as heavy metals, have discernible environmental effects as they gradually leach from the roofs of buildingsand from water pipes and accumulate in the local environment. Nitrates, phosphates or chlorinated hydrocarbonsbuild up in soils and water courses, with potentially negative impacts for the health of future inhabitants.
Creating a circular urban metabolism can create resilient cities and create many new local businesses and jobs.
A critical issue today, as cities become the primary human habitat, is whether urban living standards can bemaintained whilst the local and global environmental impacts of cities are brought down to a minimum. To geta clearer picture of the ‘performance’ of cities, it helps to draw up balance sheets comparing urban resourceflows across the world. It is becoming apparent that similar-sized cities supply their needs with a greatly varyingthroughput of resources.
20 Prof. Paul Brunner, Technical University, Vienna, personal communication
Hinterland has a global reach
Outputs
City
InorganicWastes(landfill)
Emissions(CO2, NO2, NO2)
OrganicWastes(landfill, sea, dumping)
Inputs
Goods
Food
Energy
CoalOilNuclear
Minimum Pollution& Wastes
Hinterland workswithin regionalecosystems
Materialsrecycled
OutputsInputs
Goods
Food
Organicwastesrecycled
CityRenewable
MinimumEnergy
CIRCULAR METABOLISM CITIES REDUCE CONSUMPTION AND POLLUTION,RECYCLE AND MAXIMIZE RENEWABLES
LINEAR METABOLISM CITIES CONSUME RESOURCES AND CREATE WASTE AND POLLUTION AT A HIGH RATE
A key component of the sustainable city is a ‘circular metabolism’ which assures the most efficient possible use of resources© Herbert Girardet / Rick lawrence

One estimate suggests that a North American city with 650,000 people requires some 30,000 square kilometres ofland to meet domestic needs, without even including the environmental demands of its industries. In comparison,an Indian city of this size would require just 2,800 square kilometres, or less than ten per cent of an American city. 21
Most large cities across the world have been studied in considerable detail and usually it won't be very difficult tocompare their use of resources. In developed country cities, disposability and built-in obsolescence still permeatescollective behaviour. In contrast, in developing countries large cities have a much lower per capita resourcethroughput and much higher recycling rates, since recycling and re-use are an essential part of local economies.
Food for cities
In many parts of the world, urban growth has been directly linked with mechanisation of farming and rural depopulation. Food is supplied to cities by ever more energy intensive production systems. For example, in theUnited States one farmer, with his complex array of fossil fuelled equipment, typically feeds 100 urban people.But ten times more fossil fuel energy goes into this type of food production system than the calories that areactually contained in the food we get to eat.
We need to find much more efficient ways of supplyingfood for our cities. This includes a new emphasis onlocal food production. It is well documented that inCuba, ‘intra-urban’ organic agriculture now supplieslarge amounts of food to cities such as Havana. Chinahas a national policy of surrounding its cities with beltsof cultivated land. Such ‘peri-urban’ food growing systems are also reappearing in the US where farmers’markets supplied by local growers are becoming popular again.
In the United States significant ‘intra-urban’ agricultureinitiatives are also under way. Detroit, once a city of twomillion people, has contracted to less than 900,000 people, with vast areas of land now lying derelict. Its139-square-mile surface area is larger than San Fran-cisco, Boston, and Manhattan combined. After studyingthe city's options of reusing derelict land within Detroitat the request of civic leaders, the American Instituteof Architects came to this conclusion in a recent report:"Detroit is particularly well suited to become a pioneerin urban agriculture at a commercial scale." Similar options are now being considered for New Orleans, St.Louis, Cleveland and Newark.22
In Denver the Living City Block project goes beyondurban agriculture. It is aiming to create an example of a
replicable, scalable and economically viable framework for the resource efficient redevelopment of existingcities. “Starting with a block and a half of Denver’s historic Lower Downtown district, Living City Block willcreate a demonstration of a regenerative urban centre. LCB will draw on selected partners from around Denver,the U.S. and the world to develop and implement a working model of how one block within an existing citycan be transformed into a paradigm for the new urban landscape.” 23
Even very large cities can source substantial amounts of the vegetables and fruit they require from the urbanterritory and the surrounding countryside. However, grain supplies require much larger areas of land and mostwill have to be supplied from farmland further afield.
21 The International Institute for Sustainable Development, Urban and Ecological Footprints, www.gdrc.org/uem/footprints/ 22 www.smartplanet.com/business/blog/...detroit...urban.../4232/ 23 www.livingcityblock.org/
Urban Food: The Case of Cuba
According to Cuba,s Ministry of Agriculture, some
150,000 acres of land is being cultivated in urban and
suburban settings, in thousands of community farms,
ranging from modest courtyards to production sites that
fill entire city blocks. Organoponicos, as they are called,
show how a combination of grassroots effort and official
support can result in sweeping change, and how neigh-
bours can come together and feed themselves. When the
food crisis hit in 1989, the organoponicos were an ad hoc
response by local communities to increase the amount of
available food. But as the power of the community farm-
ing movement became obvious, the Cuban government
stepped in to provide key infrastructure support and to
assist with information dissemination and skills sharing.
Most organoponicos are built on land unsuitable for cul-
tivation. They rely on raised planter beds. Once the
organoponicos are laid out, the work remains labour-in-
tensive. All planting and weeding is done by hand, as is
harvesting. Soil fertility is maintained by worm compost-
ing. Farms feed their excess biomass, along with manure
from nearby rural farms to worms that produce a nutri-
ent-rich fertiliser. Crews spread about two pound of com-
post per square yard on the bed tops before each new
planting.
www.i-sis.org.uk/OrganicCubawithoutFossilFuels.php
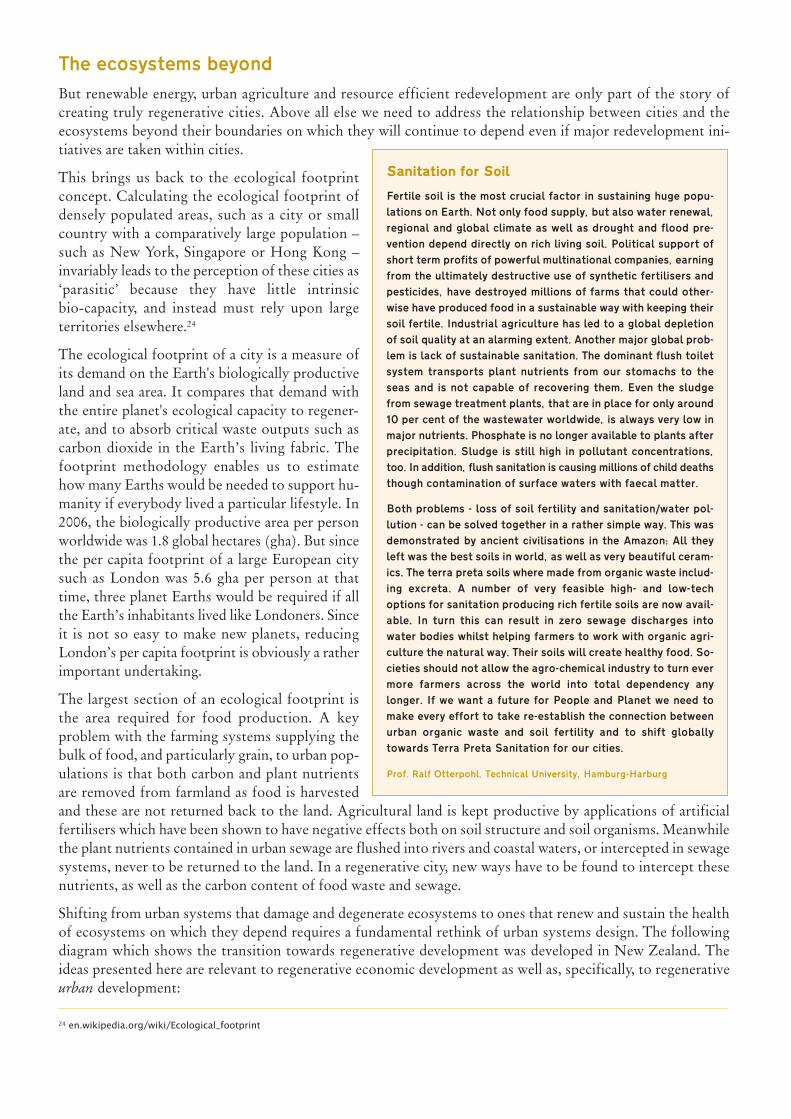
The ecosystems beyond
But renewable energy, urban agriculture and resource efficient redevelopment are only part of the story of creating truly regenerative cities. Above all else we need to address the relationship between cities and theecosystems beyond their boundaries on which they will continue to depend even if major redevelopment ini-tiatives are taken within cities.
This brings us back to the ecological footprintconcept. Calculating the ecological footprint ofdensely populated areas, such as a city or smallcountry with a comparatively large population –such as New York, Singapore or Hong Kong – invariably leads to the perception of these cities as‘parasitic’ because they have little intrinsic bio-capacity, and instead must rely upon large territories elsewhere.24
The ecological footprint of a city is a measure ofits demand on the Earth's biologically productiveland and sea area. It compares that demand withthe entire planet's ecological capacity to regener-ate, and to absorb critical waste outputs such ascarbon dioxide in the Earth’s living fabric. Thefootprint methodology enables us to estimatehow many Earths would be needed to support hu-manity if everybody lived a particular lifestyle. In2006, the biologically productive area per personworldwide was 1.8 global hectares (gha). But sincethe per capita footprint of a large European citysuch as London was 5.6 gha per person at thattime, three planet Earths would be required if allthe Earth’s inhabitants lived like Londoners. Sinceit is not so easy to make new planets, reducingLondon’s per capita footprint is obviously a ratherimportant undertaking.
The largest section of an ecological footprint isthe area required for food production. A keyproblem with the farming systems supplying thebulk of food, and particularly grain, to urban pop-ulations is that both carbon and plant nutrientsare removed from farmland as food is harvestedand these are not returned back to the land. Agricultural land is kept productive by applications of artificialfertilisers which have been shown to have negative effects both on soil structure and soil organisms. Meanwhilethe plant nutrients contained in urban sewage are flushed into rivers and coastal waters, or intercepted in sewagesystems, never to be returned to the land. In a regenerative city, new ways have to be found to intercept thesenutrients, as well as the carbon content of food waste and sewage.
Shifting from urban systems that damage and degenerate ecosystems to ones that renew and sustain the healthof ecosystems on which they depend requires a fundamental rethink of urban systems design. The followingdiagram which shows the transition towards regenerative development was developed in New Zealand. Theideas presented here are relevant to regenerative economic development as well as, specifically, to regenerativeurban development:
24 en.wikipedia.org/wiki/Ecological_footprint
Sanitation for Soil
Fertile soil is the most crucial factor in sustaining huge popu-
lations on Earth. Not only food supply, but also water renewal,
regional and global climate as well as drought and flood pre-
vention depend directly on rich living soil. Political support of
short term profits of powerful multinational companies, earning
from the ultimately destructive use of synthetic fertilisers and
pesticides, have destroyed millions of farms that could other-
wise have produced food in a sustainable way with keeping their
soil fertile. Industrial agriculture has led to a global depletion
of soil quality at an alarming extent. Another major global prob-
lem is lack of sustainable sanitation. The dominant flush toilet
system transports plant nutrients from our stomachs to the
seas and is not capable of recovering them. Even the sludge
from sewage treatment plants, that are in place for only around
10 per cent of the wastewater worldwide, is always very low in
major nutrients. Phosphate is no longer available to plants after
precipitation. Sludge is still high in pollutant concentrations,
too. In addition, flush sanitation is causing millions of child deaths
though contamination of surface waters with faecal matter.
Both problems _- loss of soil fertility and sanitation/water pol-
lution - can be solved together in a rather simple way. This was
demonstrated by ancient civilisations in the Amazon: All they
left was the best soils in world, as well as very beautiful ceram-
ics. The ‘terra preta’ soils where made from organic waste includ-
ing excreta. A number of very feasible high- and low-tech
options for sanitation producing rich fertile soils are now avail-
able. In turn this can result in zero sewage discharges into
water bodies whilst helping farmers to work with organic agri-
culture the natural way. Their soils will create healthy food. So-
cieties should not allow the agro-chemical industry to turn ever
more farmers across the world into total dependency any
longer. If we want a future for People and Planet we need to
make every effort to take re-establish the connection between
urban organic waste and soil fertility and to shift globally
towards Terra Preta Sanitation for our cities.
Prof. Ralf Otterpohl, Technical University, Hamburg-Harburg

The regenerative development of cities isa comprehensive approach that goes be-yond established concepts of sustainabledevelopment. Cities need to proactivelycontribute to the replenishment of therun-down ecosystems – including farmsoils, forests and marine ecosystems –from which they draw resources for theirsurvival. And while cities continue toburn fossil fuels, they also need to findways of assuring that their carbon dioxideemissions are reabsorbed through ‘bio-sequestration’ in soils and forests. 26
The CO2 output of cities is far too largefor trees within their territories to beable to absorb. Every year we are nowdischarging nearly 10 billion tonnes ofcarbon per year 27 of which four to five
billion tonnes are not being reabsorbed into the world’s ecosystems but which are accumulating in the atmosphere. This is the primary cause of the climate change problem that we are faced with.
Can this issue be addressed by cities? Well, some have made a start: In Adelaide, South Australia, large-scale reforestation has been initiated to assure that the surrounding countryside can absorb a substantial proportionof its carbon emissions. Some two million trees have been planted in the last seven years for carbon sequestra-tion, erosion control and general environmental improvement.28 Another million will be planted by 2014. Afew other cities are now involved in similar initiatives. Internationally, the ‘Billion Trees Campaign’ initiated byUNEP in 2007 recorded that over 10 billion trees had been planted by 2010, a quarter of these by urban community groups, NGOs and local or national governments.29
From Petropolis to Ecopolis
One of the primary tasks at the start of the 21st century is to try and map out what is necessary in order to tryand expand the boundaries of what becomes politically possible.
The challenge is to find ways of making cities function differently from the way they do today without increasingthe costs to financially challenged city administrations.
The new task facing of urban planners, civil engineers and managers, in close cooperation with the generalpublic, is to create spatial structures that satisfy the needs of city people whilst also assuring their ecologicaland economic resilience. We need to provide secure habitats that allow us to move about our cities efficiently,and we want them to provide pleasant spaces for work, recreation and human interaction. We want urban environments that are free from pollution and waste accumulation. But we also need to get to grips with theimpacts of cities beyond their boundaries.
It is often said by urban analysts that cities should be seen as the places where solutions to the world’s environ-mental and climate problems can most easily be implemented because as places where most people live closelytogether they have the potential to make efficient use of resources. It is also in cities where people interactmost strongly and where key decisions, and particularly financial decisions, are being made all the time.
This is where the concept of ‘Ecopolis’ – the ecologically as well as an economically restorative city – needs toassert itself, drawing together the various themes discussed in this text into one comprehensive concept.
25 www.mfe.govt.nz/publications/sus-dev/towards-a-sustainable-future/page3.html26 Herbert Girardet and Miguel Mendonca, A Renewable World, Green Books, Dartington, 2009; see chapter 227 www.sciencedaily.com/releases/2008/09/080925072440.htm 28 www.milliontrees.com.au/ 29 www.unep.org/billiontreecampaign/CampaignNews/BTCjune2010.asp
Conventional
Conventional
Little or no consideration isgiven to the environmentalimpact of the design.
Designs generally aim to meetmimimum legal requirementsfor the lowest first-cost price.
A rapidly expanding segmentof business-as-usual is ‘green’and moving towards to sustainable.
Eco-efficency
Green design:
Does not challenge currentproduction methods orconsumption patterns that havenegative environmental impact.
Minimises energy use, pollutionand waste (termed ’less bad’design.
Sustainable design:
Aceives neutral environmentalimpact and maximum efficiency.
Current focus of the New ZealandGreen Star rating scheme.
Regenerative development
Sees humans, humandevelopments, social structures andcultural concerns as an inherentpart of ecosystems.
Questions how humans canparticipate in ecosystems usingdevelopment to create optimumhealth.
Seeks to create or restore capacityof ecosystems and bio -geologicalcycles to function without humanmanagement.
Understands the diversity anduniqueness of each place (socially, culturally and environmentally) ascrucial to the design.
Sees the design process as ongoing, indefinite and participatory.
Green SustainableRegenerative development
Business as Usual
Eco-efficiency
25
25
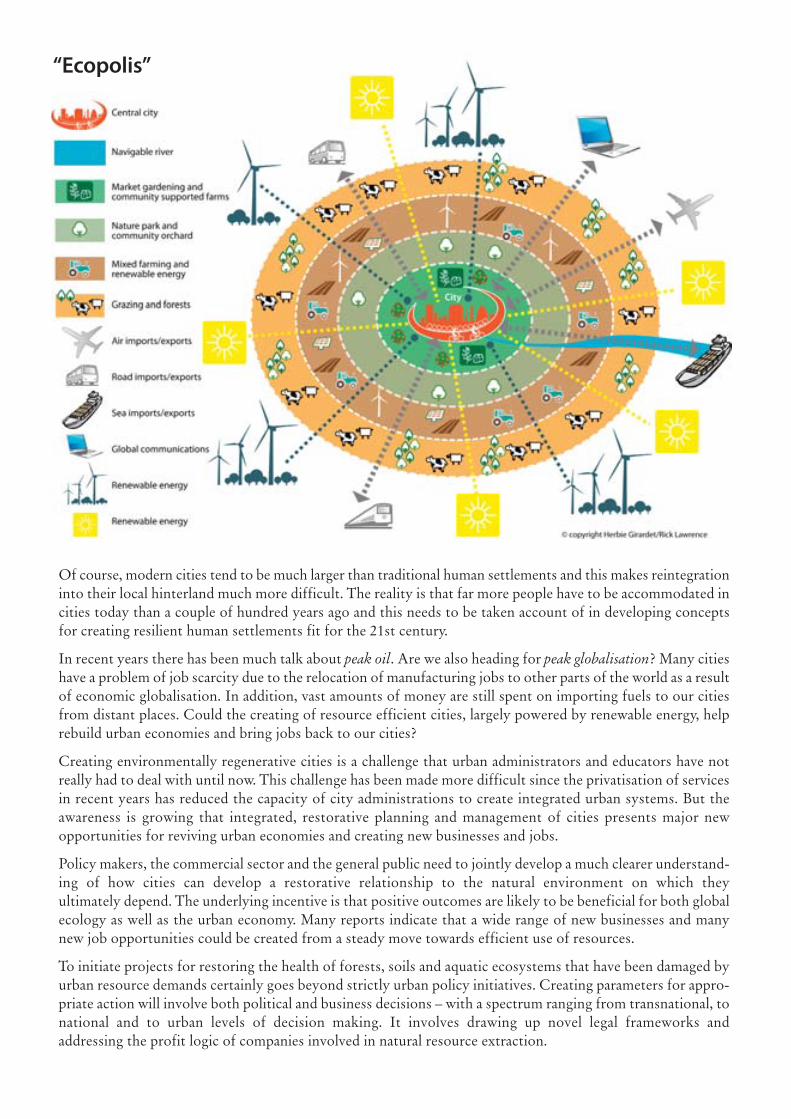
Of course, modern cities tend to be much larger than traditional human settlements and this makes reintegrationinto their local hinterland much more difficult. The reality is that far more people have to be accommodated incities today than a couple of hundred years ago and this needs to be taken account of in developing conceptsfor creating resilient human settlements fit for the 21st century.
In recent years there has been much talk about peak oil. Are we also heading for peak globalisation? Many citieshave a problem of job scarcity due to the relocation of manufacturing jobs to other parts of the world as a resultof economic globalisation. In addition, vast amounts of money are still spent on importing fuels to our citiesfrom distant places. Could the creating of resource efficient cities, largely powered by renewable energy, helprebuild urban economies and bring jobs back to our cities?
Creating environmentally regenerative cities is a challenge that urban administrators and educators have notreally had to deal with until now. This challenge has been made more difficult since the privatisation of servicesin recent years has reduced the capacity of city administrations to create integrated urban systems. But theawareness is growing that integrated, restorative planning and management of cities presents major new opportunities for reviving urban economies and creating new businesses and jobs.
Policy makers, the commercial sector and the general public need to jointly develop a much clearer understand-ing of how cities can develop a restorative relationship to the natural environment on which they ultimately depend. The underlying incentive is that positive outcomes are likely to be beneficial for both globalecology as well as the urban economy. Many reports indicate that a wide range of new businesses and manynew job opportunities could be created from a steady move towards efficient use of resources.
To initiate projects for restoring the health of forests, soils and aquatic ecosystems that have been damaged byurban resource demands certainly goes beyond strictly urban policy initiatives. Creating parameters for appro-priate action will involve both political and business decisions – with a spectrum ranging from transnational, tonational and to urban levels of decision making. It involves drawing up novel legal frameworks and addressing the profit logic of companies involved in natural resource extraction.
“Ecopolis”

The national policies needed to set param-eters for regenerative urbanisation includeboth ‘sticks’ such as waste disposal taxation and carbon taxes, and ‘carrots’such as feed-in tariffs for renewable energyand support schemes for local food production.
Cities need to take advantage of the opportunities inherent in environmentallyrestorative development, harnessing thehuge variety of talents and experiencespresent in cities for better decision making.
For instance, the city government of PortoAlegre, Brazil, decided some years ago toinvolve the general public in the processesof budget-setting. This creative processchallenges citizens to actively contribute
their views. All citizens can now have a say about what their tax money should be spent on – better schools,better transport, playgrounds, parks, renewable energy installations, and so on. Through this novel participatoryprocess Porto Alegre has become a truly dynamic, participatory city, and the ideas pioneered there are beingcopied in cities across the world.30
The ecological, economic, social and externalities of our urban systems need to be addressed in new ways. We need creativity and initiative at the local level, but we also need appropriate national policy frameworks toenable useful things to happen locally. Without national policy initiatives, enhanced by lively public debate, the necessary changes won’t happen fast enough, if at all. For example, feed-in tariffs for renewable energy in Denmark and Germany came out of vigorous public demand that was turned into national policy which wasthen implemented primarily at the local level.
It is important to emphasise, then, that the creating of regenerative cities as described in this text will requirenot just changes in approaches to land use and resource use planning at the local level but that national andtrans-national policies have to be initiated.
Cities take resources from nature. The new challenge is for citiesto find ways to continuously help regenerate natural systemsfrom which they draw resources.
Internationally, cities need to work closely together to develop and implement policies for regenerating regionsacross the world that have been damaged and depleted byurban consumption patterns. One or two organisations,such as the Climate Alliance of European Cities31, whichbrings together 1500 towns and cities across Europe,have made a tentative start at helping cities to take re-sponsibility for their global climatic and environmentalimpacts. Much, much more needs to be done.
Policies for creating regenerative cities
Enshrining regenerative urbanism as an organising principle forurban development practice seems compelling because it offers anumber of major new opportunities for local social and economic well-being:
30 www.sustainablecities.dk 31 www.klimabuendnis.org
The value of ecosystems services
We cannot manage what we do not measure and we are not measuring
either the value of nature's benefits or the costs of their loss. We seem
to be navigating the new and unfamiliar waters of ecological scarcities
and climate risks with faulty instruments. Replacing our obsolete eco-
nomic compass could help economics become part of the solution to re-
verse our declining ecosystems and biodiversity loss.
We need a new compass to set different policy directions, change incen-
tive structures, reduce or phase out perverse subsidies, and engage busi-
ness leaders in a vision for a new economy. Holistic economics – or
economics that recognise the value of nature's services and the costs of
their loss – is needed to set the stage for a new "green economy".
www.guardian.co.uk/commentisfree/cif-green/2010/feb/10/pavan-
sukhdev-natures-economic-model
Pavan Sukhdev, drawing on his report ‘The Economics of Ecoystems and Biodiversity’

Key principles
National policy: Frameworks for enabling regenerative urban development
Urban policy: Integrated, regenerative urban planning as key organising principle
Green Savings: reducing waste, recycling materials and cutting costs
Green Economy: new businesses and jobs by environmental protection and restoration
Green Talent: investing in technical, entrepreneurial and workforce skills
Energy sufficiency
Use the 2000 Watt Society concept as an operative policy principle
Modify building codes to make resource efficient building practice the norm
‘Solar city’ development
Mandate solar city development as national policy priority
Prioritise feed-in legislation for renewable energy systems, allowing owners to sell electricity at advantageous rates
Support renewable energy as an important new manufacturing industry
Create enabling policies for renewable energy development in the urban hinterland
Water security
Balance urban, agricultural and commercial uses of water, and their relative social, economicand environmental benefits
‘Waterproof’ cities by encouraging water efficiency and rainwater collection in householdsand businesses
Make waste water recycling and storm water reuse a central plank of water policy
Implementing zero waste
Develop new enterprises for processing organic wastes into soil enhancing materials
Make sewage reprocessing and nutrient capture a central plank of waste management
Implement policies for the cost effective reprocessing of all technical wastes
Use zero waste policy to create new green businesses and jobs
Local Food
Encourage local peri-urban food production for local markets
Encourage the development of community supported agriculture and farmers markets
Ensure the use of composted, city-derived bio-waste for urban farming
Sustainable transport
Create new pedestrian zones wherever possible
Create a comprehensive network of dedicated cycle lanes across cities
Encourage public transport by improving its attractiveness, frequency and flexibility
Stimulate development of new electric and fuel cell vehicle technology
Encourage car sharing as a key feature or urban transport
Nature and the city
Encourage tree planting for biodiversity and soil erosion control in and around the city
Make carbon sequestration a key aspect of tree planting initiatives
Develop initiatives to help restore forests and wetlands in remoter areas

Green business
Boost the creation of green business by effective use of government procurement
Encourage resource efficiency in all businesses
Create ‘green business incubators’ across the city
Make environmental resilience the basis for new businesses and jobss
A culture of restorative urbanisation
Utilise both global networks and local expertise in developing restorative urbanisation
Ensure that it is addressed in the education system, and through meetings and events
Encourage imaginative reporting on urban restoration measures by the media
Produce regular reports on implementation of eco-restoration policies and practices
Ensure that all citizens take a stake in restorative development
The challenge now is to initiate a mutual learning process in which cities across the world can exchange experiences and information about best policies and practices of regenerative urbanism. The Cities and ClimateCommission of the World Future Council and HafenCity University Hamburg (HCU), intends to make amajor contribution to this vitally important process.
Herbert Girardet, October 2010

“Here’s the book we’ve been waiting for: a thorough, up-to-date, and above all proportionate response to our climatic predicament. When I say proportionate, I mean: it tells us how tosolve the problem we really have, not the one we wish we had. It’s truly important!”– Bill McKibben, founder, 350.org
This book shows how the quadruple crisis facing humanity – ofclimate, energy, finance and poverty – can be regarded as a uniqueopportunity for building a new, global green economy. It is a bookfor those who want to influence the decision on how we can turn visions into practicality.
The authors:
Herbert Girardet is an author and consultant focusing on sustainable development. He is a co-founder and Director of Programmes of the World Future Council.
Miguel Mendonça is a writer and sustainability advocate. He is former Research Manager of the World Future Council.
Green Books 2009 I 256 pages I Paperback I ISBN 978-1-900322-49-2 Distributed in the USA by Chelsea Green.
100% Renewable energy – and beyond –for citiesCan modern cities do without the routine use of fossil fuels andminimise their climate impacts? In this important text Prof. PeterDroege shows clearly that major breakthroughs towards 100 % renewable supplies for cities are now well under way. Even thelargest cities can make this transition, drawing on renewable energysupplies from within their boundaries, as well as from furtheraway. In addition to assuring urban energy security, these developments have also started to stimulate the growth of a verylarge new green economy sector. This important paper describesthe policies and technologies that will enable our cities to make the renewable energy transition a reality in the very near future.
Download from the World Future Council website:
www.worldfuturecouncil.org/fileadmin/user_upload/PDF/100_renewable_energy_for_citys-for_web.pdf
Peter Droege is Professor at the University of Liechtenstein and the University of Newcastle,Australia. His books include 100 Percent Renewable - Energy Autonomy in Action; The Renewable City - A Comprehensive Guide to an Urban Revolution; and Urban EnergyTransition - From Fossil Fuels to Renewable Power. He is a member of the World FutureCouncil/HafenCity University Cities and Climate Change Commission.
World Future Council Foundation
Head Office, HamburgMexikoring 29, 22297 HamburgGermany0049 (0)40 [email protected]
UK Office, London100 Pall MallLondon, SW1Y 5NQ, UK0044 (0)20 [email protected]
World Future Council
The World Future Council brings the interests of future generations to the centre of policy making. Its 50 eminent members from around the globe have already successfully promoted change. The Council addresses challenges to our common future and provides decision-makers with effective policy solutions.In-depth research underpins advocacy work for international agreements, regional policy frameworks andnational lawmaking and thus produces practical and tangible results.
In close cooperation with civil society actors, parliamentarians, governments, business and internationalorganizations we identify good policies around the globe. The results of this research then feed into ouradvocacy work, supporting decision makers in implementing those policies.
The World Future Council is registered as a charitable foundation in Hamburg, Germany. Our work is notpossible without continuous financial support from private and institutional donors. For moreinformation see our website: www.worldfuturecouncil.org
How to donate
Bank transfer
Stiftung World Future CouncilInstitution: GLS BankAcc. No.: 200 900 4000Sort Code: 430 609 67IBAN: DE 7043 0609 6720 0900 4000BIC/SWIFT-Code: GENODEM1GLS
Cheque
Please make cheques payable to “Stiftung
World Future Council” and send them to:
Stiftung World Future CouncilMexikoring 29, 22297 Hamburg, Germany
HafenCity University HamburgIris GustWinterhuder Weg 3122085 Hamburg, Germany0049 40 [email protected]
US Liaison Office, Washington660 Pennsylvania Ave., SE, #302Washington, DC 20003, USA001 (202)547 [email protected]
Africa Liaison OfficeBole Kifle Ketema ZoneKebele 07, House No. 311Addis Ababa, Ethiopia00251 (0) 920 53 78 [email protected]

Conoscenza e tecnologie appropriate per la sostenibilità urbanistica - Knowledge and Appropriate Technologies for Sustainability in Planning - 29 febbraio - 04 marzo 2016 - Modulo 21
Modulo 21Strumenti, obiettivi e potenzialità della gestione delle informazioni
nella mappatura dei rischi e nella protezione dei beni culturali: verso la tutela del territorio - Maria Mascione
Le tecnologie dell'informazione e le capacità di rilievo e registrazione dei dati sono strumenti di lavoro consueti per l'elaborazione di dati relativi ai fenomeni ambientali e antropici che descrivono lo stato del territorio e le sue trasformazioni. L'uso dei sistemi informativi è ormai una prassi acquisita e condivisa in organizzazioni e ambiti di ricerca che si occupino di analisi, pianificazione, gestione, tutela e valorizzazione del territorio. Rispondono a specifiche esigenze di acquisizione, elaborazione, aggiornamento e visualizzazione di dati. Tra questi sono compresi anche gli inventari e i cataloghi dei beni culturali promossi a livello centrale e dagli enti territoriali. Sono set di dati che rispondono per la maggior parte a standard comuni di contenuti e formati di archiviazione la cui disponibilità attraverso la rete sta migliorando proprio in questi ultimi anni. L'utilizzo diffuso di sistemi webGIS pubblici permette infatti di accedere a mappe che rappresentano indagini e indicatori e di effettuare ricerche in modo molto amichevole su basi dati di diverso dettaglio.
Per le applicazioni che indagano il territorio il riferimento geografico è indispensabile perché oltre a individuare i beni e gli oggetti è un modo più semplice e immediato per accedere ai dati alfanumerici ed iconografici, multimediali associati. La georeferenza è inoltre una chiave essenziale della connessione tra i beni: se per quelli immobili l'importanza risulta subito evidente, si pensi alla possibilità di georeferenziare il luogo di rinvenimento di un reperto archeologico oltre a quello della sua conservazione (il sito archeologico stesso, oppure un museo), oppure a quei beni immateriali legati ad uno specifico luogo. Si costruiscono così nuove letture del territorio, si offrono nuove prospettive di ricerca e di valorizzazione. La georeferenza è soprattutto legata all'identificazione certa dell'oggetto e alla precisione delle misurazioni in relazione all'obiettivo d'uso del dato, cioè delle azioni di conoscenza, gestione e intervento sui beni culturali e sul territorio.
I rischi cui sono soggetti i beni culturali sono quelli relativi ai fenomeni naturali e ai fenomeni indotti da cause antropiche, cioè quegli eventi di origine naturale che si sono però verificati in parte a causa di azioni umane. La metodologia definita nel progetto Carta del rischio del patrimonio culturale (ISCR) costituisce un esempio di metodologia in tal senso. Esistono però altri fattori di rischio che possono determinare una maggiore vulnerabilità come per esempio l'abbandono di un bene, l'eccessiva pressione antropica come avviene per alcune importanti mete turistiche, piuttosto che scelte di pianificazione territoriale.
Rispetto alla varietà di elementi che possono determinare la fragilità di beni puntuali o di paesaggi si deve anche registrare che la definizione di “bene culturale” è in continuo mutamento in quanto di volta in volta arricchita di nuovi significati e valori determinando nuove categorie e nuove esigenze di attenzione e tutela. Solo a titolo di esempio si citano i paesaggi culturali (Unesco 1992, Convenzione europea del paesaggio 2000), il patrimonio culturale intangibile (Unesco 2003). La lettura delle definizioni ufficiali evidenzia le interazioni dell'uomo con l'ambiente, che hanno dato origine e trasformano nel tempo lo spazio. Trattare dei rischi connessi alla conservazione dei beni culturali, e in questa sede particolarmente dei beni culturali immobili, necessita quindi di un approccio esteso oltre il settore specifico. La loro conservazione dipende anche dal controllo delle trasformazioni territoriali e dalla mitigazione degli impatti ambientali, dalle istanze di sviluppo sostenibile. Si porrà quindi l'accento sui fattori di rischio derivanti da eventi naturali e su quelli derivanti dalle trasformazioni del territorio ragionando anche sul rapporto scala delle analisi e scala

Conoscenza e tecnologie appropriate per la sostenibilità urbanistica - Knowledge and Appropriate Technologies for Sustainability in Planning - 29 febbraio - 04 marzo 2016 - Modulo 21
dei beni culturali coinvolti.
La comunicazione è organizzata in cinque parti. La prima richiama all'attenzione il significato più attuale di bene culturale secondo una visione estesa al territorio e ai suoi elementi e relazioni, oltre le definizioni formali e normative delle singole categorie. La seconda parte inquadra il concetto di rischio per i beni culturali così come è inteso nel contesto ambientale e della prevenzione e anche rispetto ad altre forme di rischio come ad esempio la pressione turistica. La terza parte presenta gli elementi peculiari che consentono di costruire una conoscenza fondata su regole condivise per struttura e contenuti, finalizzata in particolare sui cataloghi e gli inventari dei beni culturali e alle loro relazioni. La quarta è dedicata alla gestione dei dati in particolare quelli spaziali attraverso esempi di applicazioni webGIS che riguardano la mappatura dei beni culturali integrata con le informazioni derivanti dai settori ambientale e urbanistico . La quinta parte si sofferma sulle potenzialità nella gestione e nell'accesso ai dati offerte dalla “rete” e del ruolo che ha nella condivisione di dati di qualità e nella definizione di piani e azioni di tutela e protezione del patrimonio culturale e ambientale. Significa avere a disposizione fonti certificate di dati provenienti da più produttori attraverso i cosiddetti “servizi di mappa” che permettano di costruire tematismi ed effettuare analisi specifiche (anche dinamiche) sulla base delle proprie esigenze di informazione.
Riferimenti e Fonti per approfondire gli argomenti trattati
Convenzioni, dichiarazioni• Convention concerning the protection of the world cultural and natural heritage, General
Conference of the UNESCO, meeting in Paris from 17 October to 21 November 1972.• Convention for the Safeguarding of the Intangible Cultural Heritage, General Conference of
the UNESCO, meeting in Paris, from 29 September to 17 October 2003. http://www.unesco.org/culture/ich/index.php?lg=en&pg=00006 [ultima consultazione 22.02.2016]
• Convenzione europea per la salvaguardia del patrimonio architettonico, Granada, 3 ottobre 1985 (Italia: ratifica 31/05/1989, entrata in vigore 1/09/1989). https://www.admin.ch/opc/it/classified-compilation/19850205/index.html
• Venice declaration on building resilience at the local level towards protected cultural heritage and climate change adaptation strategies, adottata durante la conferenza internazionale “Building Cities Resilience to Disasters: Protecting Cultural Heritage and Adapting to Climate Change” , 20 marzo 2012. Pagina descrittiva del contesto e del documento: http://whc.unesco.org/en/news/869 [ultima consultazione 10.02.2016]. Anche in Heritage and Resilience..., Appendix II, pp. 40-50.
• Convenzione europea del paesaggio, Consiglio d'Europa, Firenze 2000. http://www.convenzioneeuropeapaesaggio.beniculturali.it
Cultural landscape• Operational Guidelines for the Implementation of the World Heritage Convention , General
Conference of the UNESCO, Wordl Heritage Centre, ver. WHC.15/01 8 July 2015 , p. 11, Annex II, pp.70-71. Inclusione delle definizioni nelle linee guida operative nel 1992.
Gestione e riduzione del rischio per i beni culturali• Stovel Herb, Risk preparedness: a manegement manual for world cultural heritage,
ICCROM, Roma, 1998. In particolare cap. 3, Principles of risk-preparedness for cultural heritage, pp. 20-24; cap 4, Developing sound approach to risk-preparedness for cultural heritage, pp. 25-33.

Conoscenza e tecnologie appropriate per la sostenibilità urbanistica - Knowledge and Appropriate Technologies for Sustainability in Planning - 29 febbraio - 04 marzo 2016 - Modulo 21
http://www.iccrom.org/ifrcdn/pdf/ICCROM_17_RiskPreparedness_en.pdf [ultima consultazione 22.02.2016].
• UNESCO / ICCROM / ICOMOS / IUCN, Managing disaster risk for world heritage, United Nations Educational, Scientific and Cultural Organization, June 2010. Il documento completa Stovel 1998. http://whc.unesco.org/en/activities/630/ [ultima consultazione 22.02.2016].
Appendix I, Glossary of relevant disaster management terms, p. 58.Appendix II, Typology of hazard, pp. 59-60.
• Heritage and Resilience. Issues and Opportunities for Reducing Disaster Risks, background paper for the Global Platform for Disaster Risk Reduction, 19-23 May 2013,Geneva, Switzerland, 4th session. Pagina descrittiva del contesto e del documento http://whc.unesco.org/en/events/1048/ [ultima consultazione 10.02.2016]
• Bigio, Anthony Gad; Ochoa, Maria Catalina; Amirtahmasebi, Rana, Climate-resilient, climate-friendly world heritage cities, Urban development series, knowledge papers no. 19, Washington DC, World Bank Group, 2014.http://documents.worldbank.org/curated/en/2014/01/19885149/climate-resilient-climate-friendly-world-heritage-cities [ultima consultazione 22.02.2016].
• Nora Mitchell, Mechtild Rössler, Pierre-Marie Tricaud, World Heritage Cultural Landscapes. A Handbook for Conservation and Management, UNESCO World Heritage Centre, 2009. http://whc.unesco.org/documents/publi_wh_papers_26_en.pdf [ultima consultazione 22.02.2016].
Carta del rischio del patrimonio culturale - www.cartadelrischio.it• In merito all'impostazione del progetto si veda: Carta del rischio del patrimonio culturale,
Ministero per i beni culturali e ambientali, Ufficio centrale per i beni archeologici architettonici artistici e storici, Istituto centrale per il restauro, ATI-MARIS, 4 voll., 1-La cartografia tematica, 2-la metodologia per il calcolo del rischio, 3-Il rischio locale, 4-Il sistema informativo della carta del rischio, s.l., edizione curata da Bonifica s.p.a., 1996.
• Cacace C., Iadanza C., Spizzichino D., Trigila A., “Beni culturali e rischio idrogeologico”, Bollettino ICR, luglio-dicembre, 2013, pp. 25-35.
• Annuario Ispra 2014, indicatore “Beni culturali esposti a frane e alluvioni (dati 2013), http://annuario.isprambiente.it/ada/scheda/5584/12“L'indicatore fornisce informazioni sui beni culturali esposti a frane e alluvioni sul territorio nazionale. La stima è stata effettuata utilizzando come dati di input: i beni architettonici, monumentali e archeologici della banca dati VIR (Vincoli In Rete) curata dall’ISCR (Istituto Superiore per la Conservazione ed il Restauro); l’Inventario dei Fenomeni Franosi in Italia (Progetto IFFI) realizzato dall’ISPRA e dalle Regioni e Province Autonome; la mosaicatura ISPRA delle aree a pericolosità idraulica elevata P3, media P2 e bassa P1 di cui al D. Lgs. 49/2010 (recepimento della Direttiva Alluvioni 2007/60/CE), redatte dalle Autorità di Bacino, Regioni e Province autonome.” [Fonte: Isprambiente].Visualizzatore dati: http://193.206.192.136/cartanetiffi/
• Acierno Maria, Cacace Carlo, Giovanoli Anna Maria, “La Carta del Rischio: un approccio possibile alla manutenzione programmata. Il caso di Ancona”, in Materiali e Strutture, anno III, n 5-6, 2014, pp. 81-134.
Esempi di applicazioni WebGIS• Risk Data Viewer http://risk.preventionweb.net
“This platform is a multiple agencies effort to share spatial data information on global risk
Conoscenza e tecnologie appropriate per la sostenibilità urbanistica - Knowledge and Appropriate Technologies for Sustainability in Planning - 29 febbraio - 04 marzo 2016 - Modulo 21
from natural hazards, developed to support the 2015 Global Assessment Report (UNISDR, 2015).”
• Global Risk Data Platform http://preview.grid.unep.ch/“The PREVIEW Global Risk Data Platform is a multiple agencies effort to share spatial data information on global risk from natural hazards. Users can visualise, download or extract data on past hazardous events, human & economical hazard exposure and risk from natural hazards.” [Fonte: Global Risk Data Platform ].
• Comune di Venezia - Sistema di Manutenzione Urbana, http://www.smu.insula.it• Inrap – Institut Natiònal de Recherche pour l'Archeologie Preventive - http://www.inrap.fr
Carte des opérations archéologiques de l'Inrap, http://www.inrap.fr/archeologie-preventive/Sites-archeologiques/p-30-Rechercher-un-site.htm
• Università di Pisa, Dipartimento di Civiltà e forme del Sapere, Progetto MAPPA metodologie applicate alla predittività del potenziale archeologico, http://www.mappaproject.org
• Copernicus Emergency Management Service/European Commission, http://emergency.copernicus.eu/mapping/
Standard infrastrutture dati spaziali• INSPIRE – Infrastructure for Spatial Information in the European Community
http://inspire.jrc.ec.europa.eu/• Geoportal http://inspire-geoportal.ec.europa.eu/
Standard per la catalogazione dei beni culturali• Istituto centrale per il catalogo e la documentazione www.iccd.beniculturali.it
Catalogo generale dei beni culturali http://catalogo.beniculturali.it
Repertori di dati, alcuni esempiEuropa
• European data portal www.europeandataportal.eu• European Environment Agency – Data and Maps http://www.eea.europa.eu/data-and-maps
Italia• Portale dei dati aperti della Pubblica Amministrazione http://www.dati.gov.it/• Portale cartografico nazionale http://www.pcn.minambiente.it/GN/• Repertorio nazionale dei dati territoriali http://www.rndt.gov.it/RNDT/home/index.php• Istituto Superiore per la Protezione e la Ricerca Ambientale
http://www.isprambiente.gov.it/itFrancia, U.S.A., Svizzera
• Francia, Portale cartografico nazionale, www.geoportal.gouv• U.S.A., Portale dei dati aperti federali e nazionali, www.data.org• Confederazione Svizzera, visualizzatore mappe https://map.geo.admin.ch


![AL BO 2016 Ghersi.pptx [Sola lettura] · 2019. 6. 21. · Giovanni Costa Angelo D’Errico Daniele Ditaranto Rinaldo Ghersi Olga Menoni Carlo Nava Silvano Sartori Donatella Talini](https://static.fdocumenti.com/doc/165x107/5feb37401c551b23f94d6cb5/al-bo-2016-sola-lettura-2019-6-21-giovanni-costa-angelo-daerrico-daniele.jpg)