
ISTITUTO NAZI ON ALE DI FISICA NUCLEARE
34
ISTITUTO NAZI ON ALE DI FISICA NUCLEARE Sezione eli Trieste INFN/ AE·92117 26 maggio 1992 O. Barbiellini, O. Basini, V. Bidoli, M. Bocciolini, M. Boezio, F. Bongiorno, F. Massimo Brancaccio, M.T. Brunetti, A. Buccheri, M. Candusso, F. Celletti, A. Codino, C. De Fabritiis, M.P. De Pascale, F. Fratnik, A. Incicchitti, M. Menichelli, M. Miozza, A. Morselli, A. Perego, P. Picozza, D. Prosperi,!. Salvadori, P. Schiavon, P. Spillantini, M. Ricci, A. Vacchi and N. Zampa A SILICON IMAGING CALORIMETER PROTOTYPE FOR ANTIMATTER SEARCH IN SPACE: EXPERIMENTAL RESULTS Servlzlo DocumentazJone dei Laboratori Nazionali di Frascati
Transcript of ISTITUTO NAZI ON ALE DI FISICA NUCLEARE

ISTITUTO NAZI ON ALE DI FISICA NUCLEARE
Sezione eli Trieste
INFN/ AE·92117
26 maggio 1992
O. Barbiellini, O. Basini, V. Bidoli, M. Bocciolini, M. Boezio, F. Bongiorno, F. Massimo Brancaccio, M.T. Brunetti, A. Buccheri, M. Candusso, F. Celletti, A. Codino, C. De Fabritiis, M.P. De Pascale, F. Fratnik, A. Incicchitti, M. Menichelli, M. Miozza, A. Morselli, A. Perego, P. Picozza, D. Prosperi,!. Salvadori, P. Schiavon, P. Spillantini, M. Ricci, A. Vacchi and N. Zampa
A SILICON IMAGING CALORIMETER PROTOTYPE
FOR ANTIMATTER SEARCH IN SPACE:
EXPERIMENTAL RESULTS
Servlzlo DocumentazJone dei Laboratori Nazionali di Frascati

A SILICON IMAGING CALORIMETER PROTOTYPE FOR ANTIMATTER SEARCH IN SPACE:
EXPERIMENTAL RESULTS
M. Bocciolini, F. Celletti, A. Perego, P. Spillantini Dipartimento di Fisica dell'Universita di Firenze,ltaly
and Sezione INFN di Firenze
G. Basini, F. Bongiorno*), F. Massimo Brancaccio, M. Ricci Laboratori N azionali di Frascati dell'INFN, Frascati
M.T. Brunetti, A.Codino, M. Menichelli, M.Miozza,1. Salvatori Dipartimento di Fisica dell'Universilli di Perugia,ltaly
and Sezione INFN di Perugia
V. Bidoli, M. Candusso, C. De Fabritiis, M.P. De Pascale, A. Morselli, P. Picozza Dipartimento di Fisica dell'Universilli "Tor Vergata", Roma, Italy
and Sezione INFN di Roma IT
A. Buccheri, A. Incicchitti, D. Prosperi Dipartimento di Fisica dell'Universita "La Sapienza", Roma, Italy
and Sezione INFN di Roma
G. Barbiellini, M. Boezio, F. Fratnik, P. Schiavon, A. Vacchi, N. Zampa Dipartimento di Fisica dell'Universilli di Trieste, Italy
and Sezione INFN di Trieste
Submitted to Nuclear Instruments and Methods in Physics Research
0) Also at Dipartimento di Mctodi c Modelli Matematici dell'Universitil'La Sapienza', Roma, Italy

ABSTRACT
This report presents the results obtained with a prototype silicon- tungsten (Si-W),
electromagnetic calorimeter conceived as a fine-grained imaging device to carry out
studies of the antimatter component in primary cosmic radiation.
The calorimeter prototype contains 20 xy sampling layers interleaved with 19
showering material planes. One sensitive layer is obtained with two silicon strip detectors
(Si-D) (60 x 60) mm2, each divided into 16 strips, 3.6 mm wide; the two detectors are
assembled back to back with perpendicular strips. This allows the transverse distributions
of the shower in both coordinates at each sampling (0.5 Xo) to be pictured. The basic
characteristics of the design and the experimental results obtained on a test beam at the
CERN Proton Synchrotron (PS) for electrons and pions are reported. The main results
presented are the response of the calorimeter to the electron at various energies
(1- 8 GeV), and the transverse show~r profiles at different calorimeter depths as well as
the patterns of the electromagnetic shower and those of the interacting and non-interacting
pions. The capability of the calorimeter in measuring the direction of the incoming
electromagnetic particle from the pattern of the shower has been evaluated at different
energies. These results are encouraging in view of the possible use of this detector to
search for high-energy y sources in space.

1. INTRODUCTION
The detector is a prototype of the electromagnetic calorimeter conceived for the
WiZard [1] experiment to investigate, in a planned space mission, the antimatter
component in primary cosmic radiation. Beside the calorimeter, the WiZard apparatus is
composed of a momentum-analyser superconducting magnet with drift-chamber tracking,
a transition radiation detector, and a time-of-flight system.
Minimum ionizing particles (mip) produce about 80 electron-hole pairs per!-lm of
Si-D crossed; the corresponding charge collection is a process not subject to instabilities
or non-linear effects. The segmentation of each Si-D provides the calorimeter with a high
spatial granularity. The shower profile is measured at each sampling plane in both the
x and y coordinates.
The allowed weight for the mentioned space applications limits the calorimeter
depth to about 10 Xo, which is insufficient for the full energy containment of high-energy
electromagnetic particles. The good granularity and energy resolution of the silicon
detectors makes them capable of measuring the transverse and longitudinal shower
proftles and the tracks of the particles with high accuracy [2], thus allowing good particle
identification also in the absence of the full shower containment.
Experimental data from calorimeters based on silicon as an active material have
already been published [3] - [71 In the present paper more evidence is given about the
results concerning high segmentation and shower-imaging capability; beside its
characteristics as a particle identifier, the calorimeter achieves good accuracy (a few mrad)
in reconstructing the dil'ection of the incoming particle. The use of a large-area Si-D
greatly facilitates the construction of large sensitive surfaces; this prototype calorimeter is
the first constructed with detectors having an area of (60 x 60) mm2. The detectors are
kept in a special package which, when patched together to fonn large surfaces, allow a
minimal dead area for the sampling planes of the calorimeter.
The Si- W calorimeter can playa decisive role in the event definition, especially in
the search for antimatter in cosmic radiation. Moreover, the data from the first few planes
of this calorimeter can be considered as a source of information for the design of a pre
shower detector.
3

2. THE TRACKING CALORIMETER
The calorimeter prototype, whose characteristics are reported in the table 1, consists
of 20 layers of silicon detectors*) alternated with 19 planes of tungsten. The thickness of
the material crossed by the incident beam before the flrst sensitive layer corresponds to
0.2 Xo.
Table 1
Si-W prototype calorimeter characteristics
Active area 59 x 59 mm 2
Number of Si-D x, y sampling 20
Number of tungsten plates 19
Thickness of the Si-D oer sampling 2 X 380 11m
Thickness of the tungsten plates 1.75 mm (0.5 XO)
Total depth (W) 9.5 Xo
Pitch of the strips on the Si-D 3.6mm
Distance between sampling lavers 24.5 mm
Working voltage (>full depletionl 80V
Number of electronic channels 640
Power dissipation per channel l5mW
In the design of this prototype we were bound by the constraints, common to all
experiments in space, of limited weight, low power consumption, and high reliability. In
addition, structural constraints affect the geometrical parameter of the calorimeter and, in
particular, the distance between the sensitive planes. The transverse granularity was
chosen for the aims of the WiZard apparatus through Monte Carlo calculations (MC) [2] .
One sensitive element is composed of two Si detectors mounted back to back with an on
line pin structure and perpendicular strips to give x and y coordinates as shown in flg.l,
for the Si-D this allows the use of a well-established technology suitable for highly
automatized mass production and low costs. The dead area, due to the wire bonding to
the ceramic support, is less than 2% .
• ) Built at Camberra (Belgium), HamamalSu (Japan), and SGS (italy)
4

The general characteristics of one Si-D are listed in table 2.
Total area
Number of strips
Thickness
Strip pitch
Crystal
Read-<lut coupling
Strip capacitance
Table 2
Si-D characteristics
(60 x 60) mm2
16
(380 ± 15) Ilm
3.6mm
n-type, (FZ) Si, R ~ 4 kQ cm
ohmic
~ 70pF
All the Si-D's used in this prototype are analysed before, during, and after the
packaging procedure, and the parameters of each strip are stored in a data base available
for studies of radiation resistance and long-term stability. Figure 2 shows the results from
typical measurements of the dark current and capacity of the strip plotted against the bias
voltage. Each detector assembly is mounted on a multilayer board, which also carries the
front-end electronics and the related wiring. The calorimeter prototype is contained in an
aluminium box which has one of its side walls made of a multilayer board to provide the
connections of the detector's card to the outside electronics (see fig. 3).
The design of the readout electronics [8] has been specifically developed to take into
account the future application of the calorimeter in space research. It has been conceived
for low-power consumption (15 mW/per channel) and low electronic noise, i.e. $ 2700
electrons r.m.s. for 1000 pF input capacitance, the shaping time being 7 Ils. In the final
version of the calorimeter the strips of each detector will be connected to the neighbouring
one to form single strips 48 cm long. Two full-scale outputs are available and give, for an
Si-D of 380 Ilm thickness, a linear response up to 25 or 400 mip, respectively. This
range covers the very large dynamics required in the calorimeter. The readout is
performed by means of a multiplexing system at a maximal frequency of 1 MHz.
An analog fast timing-out bipolar signal allows the auto-triggering based on the
amount of the energy released in a given section of the calorimeter.
5
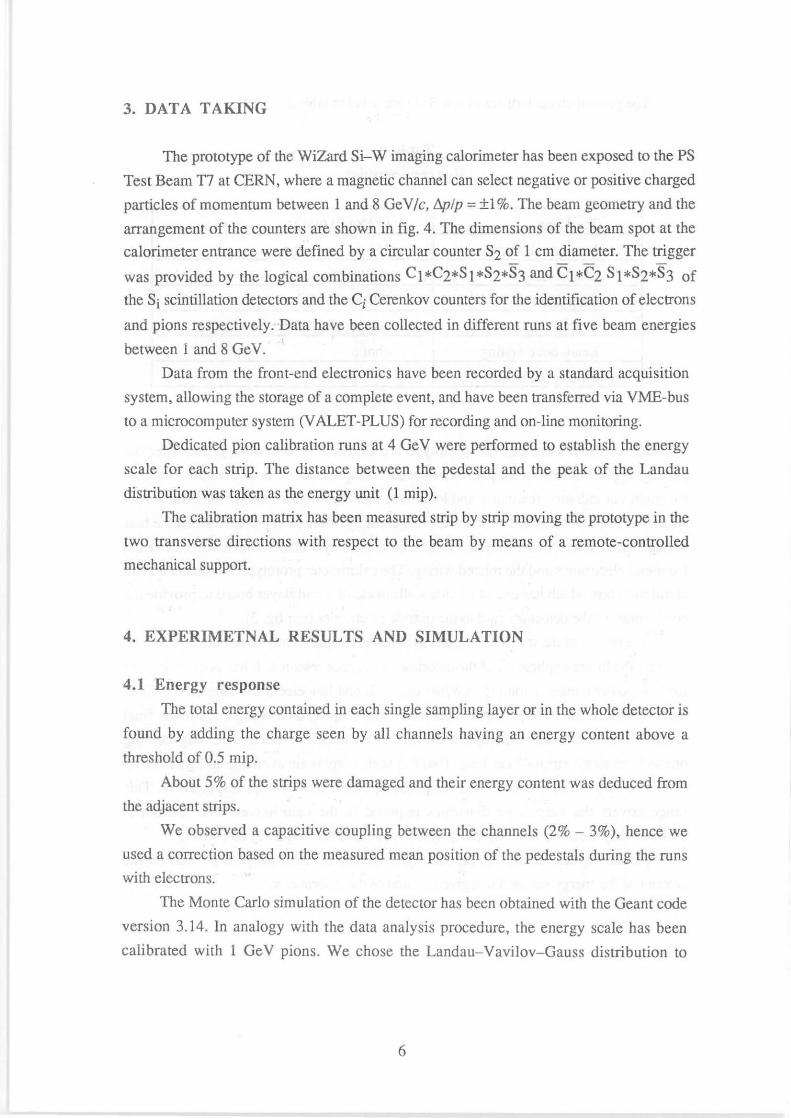
3. DATA TAKING
The prototype of the WiZard Si-W imaging calorimeter has been exposed to the PS
Test Beam n at CERN, where a magnetic channel can select negative or positive charged
particles of momentum between 1 and 8 Ge V /C, IIp/p = ±l %. The beam geometry and the
arrangement of the counters are shown in fig. 4. The dimensions of the beam spot at the
calorimeter entrance were defined by a circular counter S2 of 1 cm diameter. The trigger - - - -
was provided by the logical combinations Cl *C2*SI *S2*S3 and Cl *C2 SI *S2*S3 of
the Sj scintillation detectors and the Ci Cerenkov counters for the identification of electrons
and pions respectively. Data have been collected in different runs at five beam energies
between 1 and 8 GeV.
Data from the front-end electronics have been recorded by a standard acquisition
system, allowing the storage of a complete event, and have been transferred via VME-bus
to a microcomputer system (VALET-PLUS) for recording and on-line monitoring.
Dedicated pion calibration runs at 4 Ge V were performed to establish the energy
scale for each strip. The distance between the pedestal and the peak of the Landau
distribution was taken as the energy unit (1 mip).
The calibmtion matrix has been measured strip by strip moving the prototype in the
two transverse directions with respect to the beam by means of a remote-controlled
mechanical support.
4. EXPERIMETNAL RESULTS AND SIMULATION
4.1 Energy response
The total energy contained in each single sampling layer or in the whole detector is
found by adding the charge seen by all channels having an energy content above a
threshold of 0.5 mip.
About 5% of the strips were damaged and their energy content was deduced from
the adjacent strips.
We observed a capacitive coupling between the channels (2% - 3%), hence we
used a correction based on the measured mean position of the pedestals during the runs
with electrons.
The Monte Carlo simulation of the detector has been obtained with the Geant code
version 3.14. In analogy with the data analysis procedure, the energy scale has been
calibrated with 1 GeV pions. We chose the Landau-Vavilov-Gauss distribution to
6

simulate the fluctuations in the energy deposit. The cuts for the lowest energy were set for
both photons and electrons at 50 ke V.
The transverse and longitudinal energy containments for the prototype at these
energies, as obtained from a MC calculation, can be deduced from table 3 where the
respective percentage of containment is given.
Table 3
Monte Carlo calculated transverse and longitudinal containment of the prototype tower for
sampling steps of 0.5 Xo
Containment
Eine Longitudinal Transversal Total
(GeV) (% of Eine) (% of Einc) (% Eine)
I 96.0 63.9 60.0
2 93.2 65.8 59.0
4 89.7 67.7 57.4
6 87.6 68.5 56.2
8 86.1 69.4 55.5
The typical response of the strips to pions is given in fig. Sa, where the distribution
of the mip energy loss is given in units of analog-to-digital converter (ADC) channels.
From this figure it is also possible to evaluate a signal-to-noise ratio of better than 20,
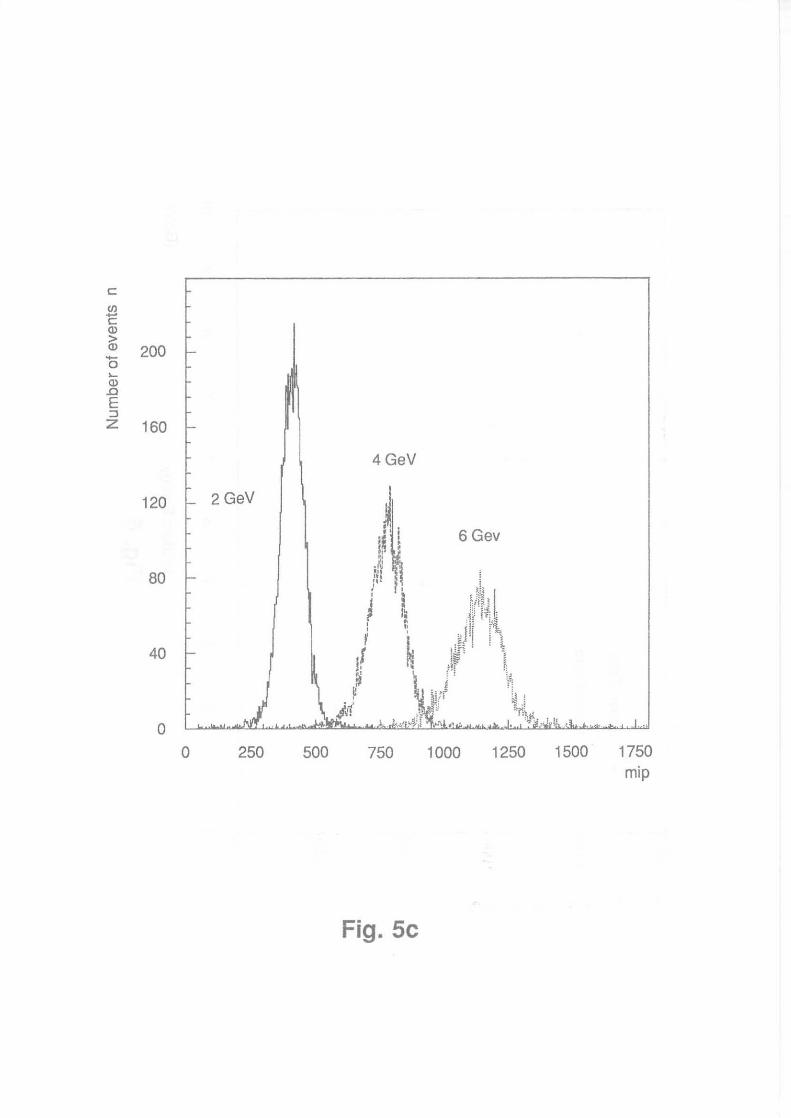
with an input capacitance of 80 pF. Figure 5b shows the distributions of detected energy
for pions and electrons at 4 Ge V whilst fig. 5c gives the distribution of the deposited
energy for electrons at 2, 4, and 6 Ge V.
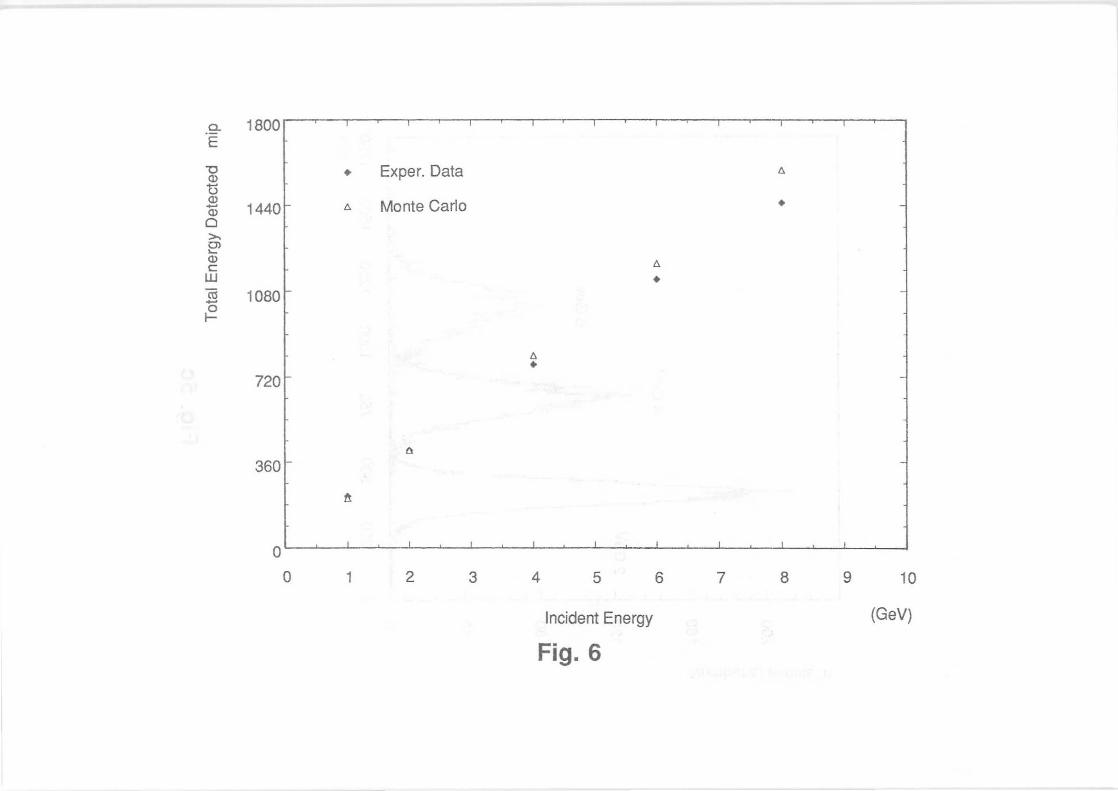
The total charge released in the calorimeter by electrons at different energies
(expressed in mip units) is given in fig. 6 together with data from MC simulation. The
response of the calorimeter, in this energy range, shows a quasi-linear behaviour with
deviations accounting for the partial containment at different energies (see Table 3).
Figure 7 a shows the relative energy resolution for the measured energies compared
with MC simulation. Figure 7b shows the same data versus 1/-V£. The data are divided by
the square root of the sampling step in units of radiation length 0(£)/(£ -Vt), t = 0.5 XO.
The two MC simulations also shown refer to sampling steps t = 0.5 Xo and
t = 1 Xo this last indicates the potential performance of the calorimeter for full
containment.
7

4.2 Shower shape and shower direction measurement
The total energy released by the electron shower is measured with a fine
transverse and longitudinal segmentation. The longitudinal segmentation allows the
identification of the position of the shower maximum along the axis of the shower. On the
other hand, the two transverse coordinates of the shower axis can be derived from the
centre of gravity of the x, y transverse energy distributions at each sampling plane.
Figure 8 shows the longitudinal development (experimental and simulated) of the
showers initiated by 2 GeV electrons; the energy released is sampled over the 20 x, y
sensitive planes.
Figure 9 shows simultaneously the longitudinal and the transverse energy
distributions for 2 Ge V elecu'ons as seen from the y detectors only.
In fig . 10, the transverse shower profiles for 2,4,6 and GeV electrons are shown
at the calorimeter depths of 2, 4, 6, and 8 Xo for the horizontal strips.
From the centres of gravity of the transverse shower profiles measured at different
depth in the calorimeter we have derived the direction of the incoming particle. This
direction is given by the linear fit connecting the centres of gravity of the transverse
shower profiles obtained for each sampling. The center of gravity position has been
evaluated for each event and weighted by the square root of the deposited energy, as an
error on this position the width of the transverse distribution mediated on all events has
been taken.
The distribution of the slopes of these lines, for 4 Ge V electrons, is shown for the
x and y sampling in fig. lla and b.
The mean value of these distributions confirms within the errors the normal
incidence of the beam to the calorimeter entrance face. The cr value indicates the angular
resolution of the imaging calorimeter. This cr is shown for the two views in figs. l2a and
b as a function of the energy of the incoming electrons. As expected, the angular
resolution improves with growing energy like the relative resolution in the energy
measurement.
The same algorithm has been applied to the first four calorimeter planes. The
angular spread of the particles directions so derived is represented in fig. 13 for 4 Ge V
electrons. Again assuming the normal incidence of the original particle, the cr value of the
distribution of the slopes represents the capability for the first four calorimeter's planes of
reconstructing the direction of the impinging particles. This is relevant for the application
of similar structures as preshower detector.
For the aim of evaluating the capability of a single sampling plane of the calorimeter
to identify the shower axis, we have taken as a reference the axis determined by all the
sampling (excluding the one under analysis). The distribution of the differences between
8

the shower-axis reference position and the position obtained from one single sampling
plane, indicates for that sampling plane the shower reconstruction capability. In Fig 14 a
and b the widths of those distributions are reported as function of energy at two different
depth in the calorimeter. Also in this case one notes the 1/-JE behaviour of the position
resolution.
4.3 Event pattern
The Si-W tracking calorimeter also reconstructs the event pattern, giving further
information about the nature of the particle interaction. Some examples of event
reconstruction for 2 GeV/c momentum particles are reported in figs. 14a,b and c, where
the difference between the pattern of the shower induced by electrons and pions is clearly
visible. By sampling the x and y shape of the shower development at each sensitive plane
(0.5 Xo) the tracking calorimeter increases the power of discrimination between electrons
and hadrons.
5. CONCLUSIONS
Tests on the tower prototype of the silicon tracking calorimeter have shown the
capacity of this instrument to give detailed information on the shape of the shower
development, combining the good resolution of the calorimeter and its high granularity.
This allows identification of differently interacting particles, as required in the antimatter
space research programme. The calorimeter can measure the direction of the photon
induced shower with an accuracy of a few millirad and can be used as a directional
detector in the search for a point-like source in space for y rays with energies of a few
GeV.
The adequacy of the first part of this calorimeter as a pre-shower has also been
proved experimentally.
9

Acknowledgements We wish to thank L. Andreanelli and F. Bronzini, of the University 'La Sapienza'
of Rome, for their effort in producing a high-precision automatic mechanical support for
the calorimeter. We also wish to thank the CERN PS machine staff and, in particular, the
PS Coordinator R. Landua. Finally, our warm appreciation goes to K. Batzner for his
help in the beam set-up.
References
[1] R.L. Golden et aI., Nuovo Cimento 1058 (1990) 191 .
[2] M. Meschini et al. , Nuovo Cimento 1028 (1988) 523.
[3] G. Barbiellini el aI., Nuel. lnstrum. Methods A257 (1987) 543.
[4] P.G. Raneoita and A. Seidman, Nuel. lnstrum. Methods A263 (1988) 84.
[5] S. Pensotti et aI., Nuel. lnstrum. Methods A265 (1988) 266.
[6] S. Pensotti et al., Nuel. lnstrum. Methods A270 (1988) 327.
[7] A.L.S. Angelis et aI., preprint CERN- EP/90-73 (1990).
[8] To be published.
10
Figure captions
Fig. 1 Schematic view of the packaging of two detectors with perpendicular strips.
Fig. 2 a) Typical current voltage characteristics for a (3.6 x 58) mm2 area strip
(room temperature).
b) Typical capacity voltage curve, showing the onset of full depletion (room
temperature).
Fig. 3 Pictorial view of the sequence of the sensitive Si-D's and the tungsten planes
of the calorimeter inside the box.
Fig. 4 Schematic view of the beam set-up.
Fig. 5 a) Energy distribution for 4 Ge V pions crossing a single Si-D.
b) Energy distribution for 4 Ge V pions and electrons;
c) Energy distribution for 2, 4, and 6 GeV electrons.
Fig. 6 Energy response of the calorimeter, beam energy as a function of detected
energy for electrons. The collected total mean charge is given in mip units
versus the particle energy.
Fig. 7a
Fig. 7b
Energy resolution compared with a MC simulation.
Energy resolution data plotted against l/-V£. The data are divided by the
square root of the sampling step in units of radiation length, cr(£)/(£ -Vt). The
two MC simulations also reported refer to sampling steps
t = 0.5 Xo and t = I XO; this last shows the potential performance of the
calorimeter for full containment.
Fig. 8 Longitudinal development (experimental and simulated) of a 2 GeV electron
shower. The energy is sampled in 20 sensitive planes.
Fig. 9 Three-dimensional plot of the longitudinal and transverse energy distributions
for 2 Ge V electrons.
Fig. 10 Transverse shower profiles for electrons 2 GeV (dotted lines), 4 GeV (dashed
lines) and 6 Ge V (solid lines). The profiles are analyzed at the calorimeter
depths of: a) 2 Xo, b) 4 Xo, c) 6 Xo, d) 8 Xo.
Fig. 11 Distribution of the slopes of the measured directions of the particles, for
incoming electrons at 4 GeV: a) for x sampling and b) for y sampling. The cr
value of these distributions indicates the angular resolution.
Fig. 12 The angular resolution of the imaging calorimeter is shown for the two views
x and y as a function of the energy of the incoming electrons, the line
corresponds to a l/-VE fit.
11

Fig. 13 Angular spread of the 4 GeV electrons shower axis as derived from the
centres of gravity of the transverse shower profile in the first four contiguous
sampling planes.
Fig. 14 Widths of the distributions of the differences between the shower-axis
reference position and the position obtained from one single sampling plane
reported as function of energy at two different depth in the calorimeter, 14 a
after 2 Xo and b after 4 XO'
Fig. 15 Examples of pattern reconstruction for 2 GeV/c particles:
a) interacting pion; b) electromagnetic shower c) non-interacting pion. The
dimensions of the squares represents the amount of energy released in each
stripe.
12

~-- Y - Strips
iiPl--- Silicon
~~=~------------:;",..--- Silicon
.1JA!:Oo----- X - Strips
----------::o::------:;:~--- Ceramic o 0
o 0 o 0 o o O--::>""S~-'----Bonding holes for X Strips
o o 0 ___ 7""5,...::..j--- Bonding pad for Y Strips
~~~~~~
All other pins are for strips L Polarization pin
Guard ring pin
Fig. 1

~
~ 12 c::
~
10 -c:: ~ 8 ~
::::l 0 Q) 6 OJ
~ <1l a) .3 4
2
0 20 40 60 80 100 V Bias Voltage
N , u. 200 c:: ~
160
120 N
Q ~ 80 b)
40
0 20 40 60 80 100 V Bias Voltage
Fig. 2

(\J
E o
<D X <DOlC
.s ~ e.Ol EOl CIlc (f)"T
>-g> , -Xe.
0"
U3
Ol (f) COl CIlc a:: ->::::::J 0 0 CIl"C .oCll Ol~ -E"C OC _CIl .... ;.. 0_ ue. Ole. c::::J c (f) 0 .... 0$1
Ol 1ii e. c Ol Ui 01 C
~
• C) .-u.

. 1 1
EI gJl .01
1 1 1 1 1 1
N I()
I()
~ __ -J'w!!ml!i~lhmill~~-~r----.--- ...... "Iwntil
"!lI!II1I1
1II1I1!!Im I ___ J'I!WIllJljlljml!' --- J
C'l (J)
N (J)
CD ~
(J)
• C) .-u.

c CIJ
175 -c Q)
> Q) -0 ~
Q) 150 .D E Pedestal ~ < - --z
125
100
75 Pions
50
25
o 80 120 160 200 240 280 320 360 400
ADC channels
Fig. Sa

c: 1000 en -c: (])
> (]) -0 .... (])
800 .0 E ::J Z
600 ·
400
200
o o
< - - Pions
Electrons
200 400 600 800
Fig. 5b
1000 1200 1400 mip
c en -c a> > a> -0 '-a> .0 E :J z
200 t--
I-
160 -
120 r- 2 GeV
I-
80 r
lI-
40 r-
o o 250
4GeV
6Gev
. I . .
500 750 1000 1250 1500 1750 mip
Fig. 5c
a. 18001 E
"0 ~ • Exper. Data 6. C])
1:5 C])
1440r Monte Carlo - 6. • C])
0 >-Ol ~
C])
~ c:: 6.
W • CIl 1080 "0 I-
~ 6. •
720~
" 360~
tl:
0' ! ___ L
0 1 2 3 4 5 6 7 8 9 10
Incident Energy (GeV)
Fig. 6

20
4 , I I I , I
o 1 2 3 4
Fig. 7a
I , I I
5 6 7
I ,
8 9
GeV

0 24 f-
C- O Tower Calorimeter Experimental Data (9.5 Xo)
/'). Tower Calorimeter Monte Carlo (9.5 Xo) e.
20 f- (I Monte Carlo (19 Xo)
c
~ 16 I- A ~
~ .¢. • 12 ! LlJ -~
! ~
ill "6
8 -~
II
4 f-
o I , I , , I , I, ,I , ,I" ,I , I
0.2 0.3 0.4 0.5 0.6 0.7 0.8 0.9 1 1.1
1/-VE (GeVr112
Fig. 7b

40 -• • • 6. 6. •
35 - 6. 6. D. Monte Carlo
• • • Data
30 6.
- • 6.
• ~ 25 - 6.
a. "E • 20 0-
r • 15 0- ~
i • 10 - i ,
~ . 5
=--
0 I I I I
0 4 8 12 16 20
Plane n
Fig. 8

4
3.5
3
2.5
.9-E 2
1.5
1
0.5
o 16
1St 14 ~ 12
10 8
14 16 18 20
8 10 12 6 6 4
2 8 2 4
Fig. 9

0. 0. 'E 10 'E 10
a) b)
8 8 ,--
6 6 , , , , ,
--' 4
L- 4 --:""" ..... •.... , ,
2 2 __ I :"'
-.1 : .... J. _ _ I ,. .••. : _... , .. , ..
0 0 . ;:'.~ ..... ~ .....
0 4 8 12 16 0 4 8 12 16 Strip number Strip number
,Q. 10 0. 10 E 9 'E 9
8 c) 8 d)
7 7 6 6 5 5 4 4 3 3 2 2 1 1 0 0
0 4 8 12 16 0 4 8 12 16 Strip number Strip number
Fig. 10

c 400 I-(/)
~ -c Q)
> Q)
350 f--0 ~ ~
Q) .0 E ::J 300 f-z
~ 250 f-
~ 200 f-
i-
i-150 f-
i-i-
100 I-
50 -
o -0.1
a)
Constant 303.8 Mean -O.8409E-03 Sigma 0.992BE-02
J I .\
o XView
0.1 mrad
400
350
300
250
200
150
100
50
o
Fig. 11
I-
~ b) r l-
I-
I-------f-
l-
f-l-
I-f-l-
f-
I-~
-0.1
Constant Mean Si ma
d, I \ o
YView
320.7 -0.3535E-02
0.9294E-02
,
0.1 mrad

~ 18
¢ a) E b 16
14 ¢
12
10
8
0 1 2 3 4 5 6 7 GeV
18 ~ b) E b 16
¢
14
12
10
8
0 1 2 3 4 5 6 7 GeV
Fig. 12

250 I Mean -0.8768E-02 250 I Mean -0.5313E-02 RMS 0.5002[-01 RMS 0.4685E·-01
225 - 225 -
200 - j 200 -
U"
175 r- 175 -
c: ~ ~ 150 150 I- -
(j) I-> (j) - I-o 125 I- 125 -~
(j) I-00
E ~ 100 r- 100 -
75 I- 75 I- -
I-
50 r- 50 -
25 r-
l) ~, 25 -
I.)' \ l- I I 0 I 0 . ,
-0.2 0 0.2 -0.2 0 0.2 X View rad YView rad
Fig. 13

E 8 E b
6 -
4 i-
2
o
•
•
, I , I
1 2
•
I , I
3 4
Fig. 14a
III Y View
£:, XView
•
I I
5 6 7
GeV

E 8 E l?
6 e-
4 e-
2
o
•
I
1
{'"
•
I
2
I
3
Fig. 14b
6.
•
I , I
m YView
6. X View
I
4 5 6 7
GeV

20
17.5
15
12.5
10
7.5
5
2.5
o o
DO Do
D
o a
00 0 a
o
~
\= L-
0 0
a
a 0
0 a I-
000 1->-0
o a
on 0
Do 00 0
0
r=
00 0 -o a
o
a
4
a a
Do '= -- - 0
a 00 '-0 00 '-
8 X.Electron
0 0 a
a a
o Do
o
12
a
20
17.5
15
12.5
10
7.5
5
2.5
o 16
Fig. lSa
o
0 Do 0 0 a Do 0 0 a a
a a 0 0 0 000 0 00
Do ana
o o[]o a
00 000 0000 a 00 oDD D
Do 00000000 a
o 00000 00 0 o a 0 a 000 a a
00 0 000 0 00 0000 DOD o 0 000000
~ ~o: 0 0
a 0000 000 a
8 12 16 , Y Electron

20 20 0 0
0 0
17.5 ~ 0 17.5 - a
0 0
0 0
15 - 15 -a 0
0 0 -12.5 - 12.5 - 0
a 0
- o 0 0
10 - 10 -0 a
-a 0 a
7.5 - 0 7.5 -0 0 0
0 0
5 - 5 -0 0
0 0
2.5 - " 2.5 - " 0 " -
0 I I I I" I 0 I , 10 , , I , ,
0 4 8 12 16 0 4 8 12 16 X Non-Interacting Pion Y Non-Interacting Pion
Fig. 15b

20 20
D
17.5 - 17.5 - 0
D 0 0 0 00 o 0
DO Do 0 a 0
15 - DO 0
15 -0 0 0
a DOD DO 12.5 - 000 0 12.5 - o a 0
o 0 0 a 0 0 0
10 r- 10 f-0 0 0 0
0 0 0
7.5 I- 0 0 7.5 f- o 0 o 0 a
a a a a a a
0 0
5 r- 5 -a 0 a 0
0 a 0
2.5 f- 0 2.5 - 0
a f- a
f-I 1
0 0 I 1 I
01 1 0
, 1 I I 1
0 4 8 12 16 0 4 8 12 16
X Interacting Pion Y Interacting Pion
Fig. 1Sc

![IL NAZISMO Le idee del nazi-fascismo nazismo\svastica[1].jpnazismo\svastica[1].jp.](https://static.fdocumenti.com/doc/165x107/5542eb4a497959361e8b5aa3/il-nazismo-le-idee-del-nazi-fascismo-nazismosvastica1jpnazismosvastica1jp.jpg)


![B1BLB3 2538 Prof. Franceschini Deter Mi Nazi One Proteine. PDF[1]](https://static.fdocumenti.com/doc/165x107/5571f8c249795991698e06cf/b1blb3-2538-prof-franceschini-deter-mi-nazi-one-proteine-pdf1.jpg)