Informe de la Fao 2013
307
-
Upload
esperanzafernandez -
Category
Documents
-
view
222 -
download
0
Transcript of Informe de la Fao 2013
8/16/2019 Informe de la Fao 2013
http://slidepdf.com/reader/full/informe-de-la-fao-2013 1/307

8/16/2019 Informe de la Fao 2013
http://slidepdf.com/reader/full/informe-de-la-fao-2013 2/307
8/16/2019 Informe de la Fao 2013
http://slidepdf.com/reader/full/informe-de-la-fao-2013 3/307
FAO STATISTICAL YEARBOOK
2013
World Food and Agriculture
Food and Agriculture Organization of the United Nations
Rome, 2013
8/16/2019 Informe de la Fao 2013
http://slidepdf.com/reader/full/informe-de-la-fao-2013 4/307
The designations employed and the presentation of material in this information product do not imply the expression of any
opinion whatsoever on the part of the Food and Agriculture Organization of the United Nations (FAO) concerning the legal
or development status of any country, territory, city or area or of its authorities, or concerning the delimitation of its
frontiers or boundaries. The mention of specific companies or products of manufacturers, whether or not these have been
patented, does not imply that these have been endorsed or recommended by FAO in preference to others of a similar nature
that are not mentioned.
The designations employed and the presentation of material in the maps do not imply the expression of any opinion
whatsoever on the part of FAO concerning the legal or constitutional status of any country, territory or sea area, or
concerning the delimitation of frontiers.
ISBN 978-92-5-107396-4
© FAO 2013
FAO encourages the use, reproduction and dissemination of material in this information product. Except where otherwise
indicated, material may be copied, downloaded and printed for private study, research and teaching purposes, or for use in
non-commercial products or services, provided that appropriate acknowledgement of FAO as the source and copyright
holder is given and that FAO’s endorsement of users’ views, products or services is not implied in any way.
All requests for translation and adaptation rights, and for resale and other commercial use rights should be made via
www.fao.org/contact-us/licence-request or addressed to [email protected].
FAO information products are available on the FAO website (www.fao.org/publications) and can be purchased through
8/16/2019 Informe de la Fao 2013
http://slidepdf.com/reader/full/informe-de-la-fao-2013 5/307
ForewordGood statistics are needed to monitor the progress of development. The better the data, thebetter policies can be designed to protect vulnerable populations. And, without good data,it is impossible to evaluate or determine the impact of policies.
Thereare 867 million chronicallyundernourishedpeople in the world today. Seventy percentof the world’s food insecure live in rural areas, and 60 percent of the world’s population relyon agriculture fortheir livelihoods. Theneed for quality data on agriculture andfood securityis as pressing as ever.
Where do people live? Do they have access to land and water? How much formal schoolingor training do they receive? How much do countries invest in agricultural innovation? What
products do they export or import? How is agriculture affecting their forests, soils andwaterways?
Employing data from global statistical providers, including FAO, this publication presentsa visual synthesis of the major trends and factors shaping the global food and agriculturallandscape and their interplay with broader environmental, social and economic dimensions.In doing so, it strives to serve as a unique reference point on world food and agriculture forpolicy-makers, donor agencies, researchers and analysts as well as the general public.
The data cycle revolves around three key activities: building the capacity of countries toimprove their collection and use of data; collecting data in a timely and efficient manner;and disseminating this information through meaningful products.
Based on key resources, such as FAO flagship publications and others, the FAO StatisticalYearbook is the result of a global collaborative effort among countries, international organi-zations and resource partners. In addition to FAO’s traditional domains – forestry, fisheries,
agricultural production, trade, and resources – this edition of the yearbook features two newdatasets: greenhouse gas emissions and investment.
This global yearbook is just one of the instruments used to disseminate information to awider public. Regional statistical yearbooks, which highlight major trends in a particulararea of the world, are also available. All of the data can be accessed electronically throughthe FAOSTAT data platform.
FAO is deeply committed to helping countries strengthen their statistical systems as, for ex-ample, collect gender-disaggregateddata. FAO and international partners are implementinga Global Strategy to Improve Agricultural andRural Statistics, to address weaknesses in basicdata and information availability in developing countries, as well as emerging data and in-formation needs. This long-term project builds on three major pillars: producing a minimumset of core data and determining national priorities; integrating agricultural statistics intonational statistical systems; and fostering the sustainability of agricultural statistics throughgovernance and statistical capacity development.
We will continue to support these three activities – collection, dissemination and capac-ity building – to improve agriculture and food security statistics, and to advance the fightagainst hunger and poverty.
José Graziano da SilvaFAO Director-General

8/16/2019 Informe de la Fao 2013
http://slidepdf.com/reader/full/informe-de-la-fao-2013 6/307
8/16/2019 Informe de la Fao 2013
http://slidepdf.com/reader/full/informe-de-la-fao-2013 7/307
Acknowledgements
This book was prepared by the Statistics Division (ESS) of the Food and AgricultureOrganization of the United Nations in collaboration with staff at headquarters and inthe regional and decentralized offices. The work was carried out under the direction of Pietro Gennari (Chief Statistician, FAO, and Director, ESS), Naman Keita (CountrySTATManager, ESS) and Josef Schmidhuber (Principal Officer, ESS). The core team was madeup of Amy Heyman, Filippo Gheri and Michael Kao. Principal contributors were NienkeBeintema (the International Food Policy Research Institute – IFPRI), Andrea Borlizzi(ESS), Chiara Brunelli (ESS), Carlo Cafiero (ESS), Cinzia Cerri (ESS), Rocio Condor-Golec(Climate, Energy and Tenure Division – NRC), Piero Conforti (ESS), Jacqueline De-meranville (Gender, Equity and Rural Employment Division – ESW), Elisenda Estruch(ESW), Alessandro Ferrara (NRC), Karen Frenken (Land and Water Division – NRL), Nan-dini Gunewardena (ESW), Gary Jones (ESS), Arvydas Lebedys (Forest Economics, Policyand Products Division – FOE) , Erdgin Mane (ESS), Robert Mayo (ESS), Verena Nowak(Nutrition Division – ESN), Michael Rahija (IFPRI), Simone Rossi (NRC), Mirella Salva-tore (NRC), Nadia Scialabba (Office of Assistant Director-General – NRDD), Gert-JanStads (IFPRI), Nathalie Troubat (ESS), Sachiko Tsuji (Statistics and Information Service– FIPS), Francesco Tubiello (NRC), Stefania Vannuccini (FIPS), Nathan Wanner (ESS) andFiras Yassin (ESS). Special thanks also go to Andrea Alcibiade (ESS), Guido Barbaglia(ESS), Kafkas Caprazli (Office for Communication, Partnerships and Advocacy – OCP),
Giulia Cimino (ESS), Giancarlo De Pol, Giorgia DeSantis (ESS), James Edge (ESS), Car-ola Fabi (ESS), Amanda Gordon (ESS), Nicola Graziani (ESS), Fabio Grita (ESS), MichelleKendrick (ESA), Ana Moltedo (ESS), Gladys Moreno (ESS), Paul N’Goma-Kimbatsa (ESS),Adam Prakash (ESS), Nicholas Sakoff (ESS), Nicola Selleri (ESS), Jane Shaw, MukeshSrivastava (ESS), Sylvaine Thomas (ESS), and Boris Veytsman. Will Prince (World Bank)also provided invaluable information.

8/16/2019 Informe de la Fao 2013
http://slidepdf.com/reader/full/informe-de-la-fao-2013 8/307
8/16/2019 Informe de la Fao 2013
http://slidepdf.com/reader/full/informe-de-la-fao-2013 9/307
How to use this book
The structure
The 2013 FAO Statistical Yearbook continues the process that beganwith the 2012 edition. The book has been created from beginning toend with the statistical software R and the typesetting language LATEX:from data retrieval, to data processing, indicator construction, andblueprint-ready pdf file for distribution. This technique has circum-vented the traditional route of manual production, involving costlysoftware licences, significant labour costs and inefficiencies associ-ated with a lack of integration.
The book is divided into four thematic parts, in an attempt to presentthe full spectrum of issues relevant to the subject matter:
Part 1 The setting measures the state of the agricultural resourcebase by assessing the supply of land, labour, capital and inputs,and examining the pressure on the world food system stemmingfrom demographic and macroeconomic change.
8/16/2019 Informe de la Fao 2013
http://slidepdf.com/reader/full/informe-de-la-fao-2013 10/307
Part 2 Hunger dimensions gauges the state of food insecurity andmalnutrition, measuring the multitude of dimensions that giverise to hunger and shape undernourishment.
Part 3 Feeding the world evaluates the past and present productivecapacity of world agriculture, together with the role of trade inmeeting changing food, feed and other demands.
Part 4 Sustainability dimensions examines the sustainability of agri-culture in the context of the pressure it exerts on the envi-ronment, including the interaction of agriculture with climatechange, and how it can provide ecosystem services through thebio-based economy.
Several page spreads are used to present each thematic issue. Eachspread contains visualizations of the data in maps and charts, alongwith text providing background to the salient issues and an assess-ment of current trends. Tables are provided at the end of each part. Alist of indicators used throughout the book and a section on conceptsand methods can be found in Part 5.
Country definitions and classification
Parts 1, 3 and 4 follow the M49 list from the United Nations Statis-
tics Division. This can be found at “geographical regions for sta-tistical use” (see “Table: Country list” or http://unstats.un.org/unsd/ methods/m49/m49regin.htm). Part 2 adapts the Millennium Devel-opment Goals country classification with the exception of the sec-tions “Poverty”, “Education and health” and “Natural and human-made risks”, which apply M49.
Developing regions, which are referred to throughout the book, con-sist of Africa, the Americas excluding Northern America, Latin Amer-ica and the Caribbean, Asia excluding Japan, and Oceania excludingAustralia and New Zealand. Developed regions are Northern America,
Europe, Japan, Australia and New Zealand.South Sudan declared independence on 9 July 2011. When available,data for the Sudan and South Sudan are shown separately. In the ta-bles, the Sudan (former) is also reported. Based on the data available,the assessment presented in the map of the Sudan and South Sudanreflects the situation up to 2011 of the Sudan (former).
8/16/2019 Informe de la Fao 2013
http://slidepdf.com/reader/full/informe-de-la-fao-2013 11/307
Aggregations
Two types of aggregations are used in the book: sum and weighted
mean. Two restrictions are imposed when computing the aggrega-tion: i) the sufficiency condition – the aggregation is computed onlywhen sufficient countries have reported data, and the current thresh-old is set at 50 percent of the variable and the weighting variable,if present; and ii) the comparability condition – as aggregations areusually computed over time, this condition is designed to ensure thatthe number of countries is comparable over several years; under thecurrent restriction the number of countries may not vary by more than15 over time.
Data presentation conventions
The cutoff date for the data is 31 December 2012.
• When country data have not been reported for the reference year,an asterisk (*) on the year label indicates that the value for themost recent year available is shown. For example, 2008–2010*means that the most recent value for the period from 2008 to2010 is shown. When a growth rate is computed, the specifiedinterval always refers to available data.
• A billion is 1 000 million.
• A trillion is 1 000 billion.
• A blank means that data are not available or that aggregates can-not be calculated because of missing data for the years shown.
• In tables, 0 or 0.0 means zero or a number that is small enoughto round to zero at the displayed number of decimal places.
• A ~ in the maps refers to the range specified in the class intervals.

8/16/2019 Informe de la Fao 2013
http://slidepdf.com/reader/full/informe-de-la-fao-2013 12/307
8/16/2019 Informe de la Fao 2013
http://slidepdf.com/reader/full/informe-de-la-fao-2013 13/307
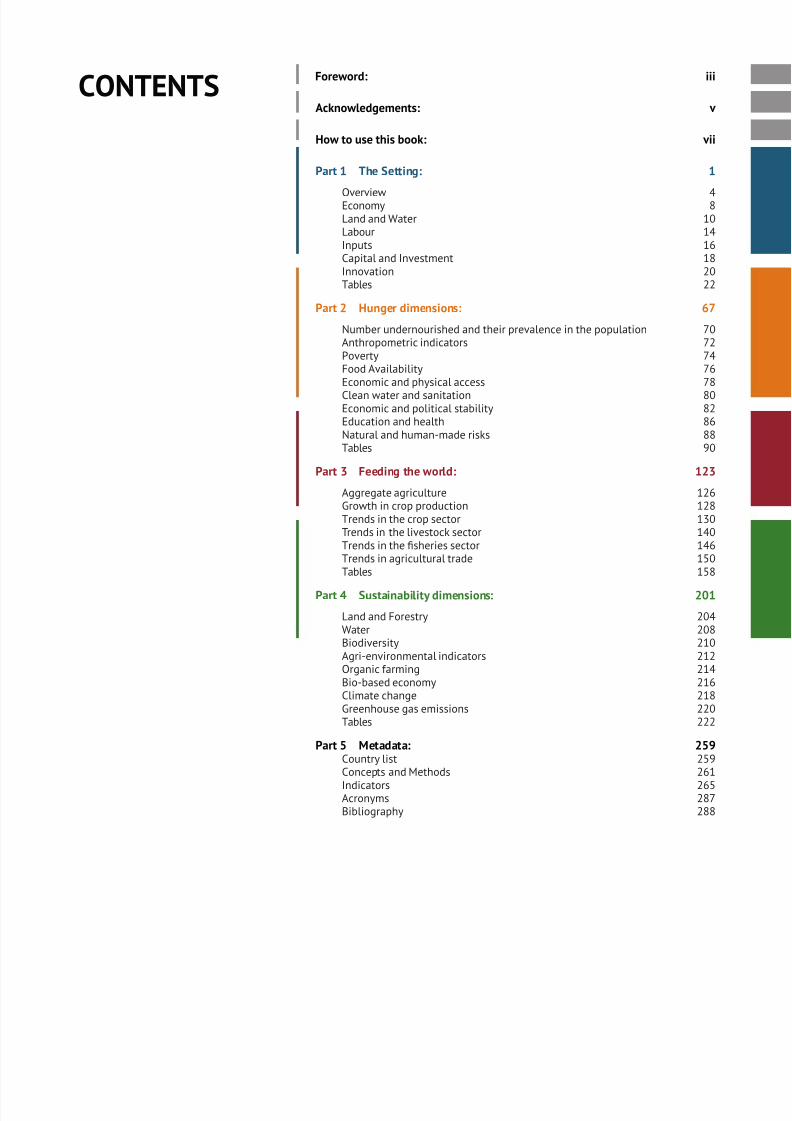
CONTENTS Foreword: iii
Acknowledgements: v
How to use this book: vii
Part 1 The Setting: 1
Overview 4Economy 8Land and Water 10Labour 14Inputs 16Capital and Investment 18Innovation 20Tables 22
Part 2 Hunger dimensions: 67
Number undernourished and their prevalence in the population 70Anthropometric indicators 72Poverty 74Food Availability 76Economic and physical access 78
Clean water and sanitation 80Economic and political stability 82Education and health 86Natural and human-made risks 88Tables 90
Part 3 Feeding the world: 123
Aggregate agriculture 126Growth in crop production 128Trends in the crop sector 130Trends in the livestock sector 140Trends in the fisheries sector 146Trends in agricultural trade 150Tables 158
Part 4 Sustainability dimensions: 201
Land and Forestry 204Water 208Biodiversity 210Agri-environmental indicators 212Organic farming 214Bio-based economy 216Climate change 218Greenhouse gas emissions 220Tables 222
Part 5 Metadata: 259Country list 259Concepts and Methods 261
Indicators 265Acronyms 287Bibliography 288
8/16/2019 Informe de la Fao 2013
http://slidepdf.com/reader/full/informe-de-la-fao-2013 14/307
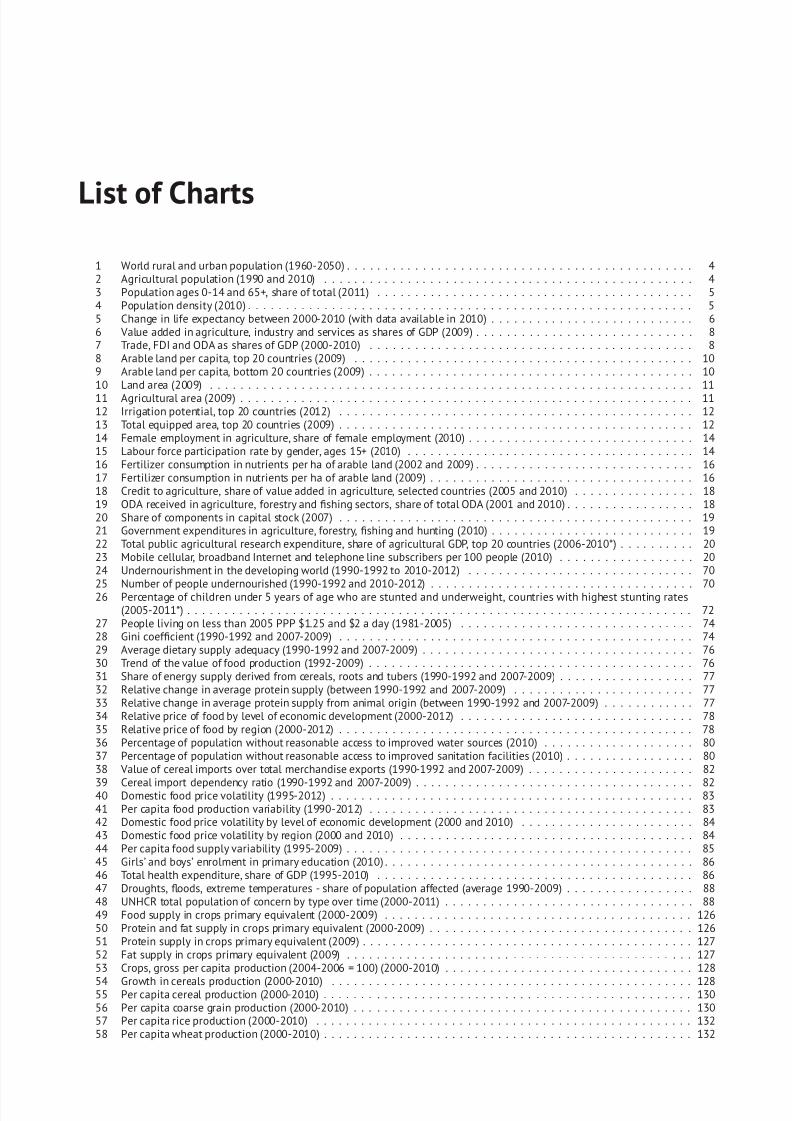
List of Charts
1 World rural and urban population (1960-2050) . . . . . . . . . . . . . . . . . . . . . . . . . . . . . . . . . . . . . . . . . . . . . . 42 Agricultural population (1990 and 2010) . . . . . . . . . . . . . . . . . . . . . . . . . . . . . . . . . . . . . . . . . . . . . . . . . 43 Population ages 0-14 and 65+, share of total (2011) . . . . . . . . . . . . . . . . . . . . . . . . . . . . . . . . . . . . . . . . . . 54 Population density (2010) . . . . . . . . . . . . . . . . . . . . . . . . . . . . . . . . . . . . . . . . . . . . . . . . . . . . . . . . . . . 55 Change in life expectancy between 2000-2010 (with data available in 2010) . . . . . . . . . . . . . . . . . . . . . . . . . . . 66 Value added in agriculture, industry and services as shares of GDP (2009) . . . . . . . . . . . . . . . . . . . . . . . . . . . . . 87 Trade, FDI and ODA as shares of GDP (2000-2010) . . . . . . . . . . . . . . . . . . . . . . . . . . . . . . . . . . . . . . . . . . . 88 Arable land per capita, top 20 countries (2009) . . . . . . . . . . . . . . . . . . . . . . . . . . . . . . . . . . . . . . . . . . . . . 109 Arable land per capita, bottom 20 countries (2009) . . . . . . . . . . . . . . . . . . . . . . . . . . . . . . . . . . . . . . . . . . . 1010 Land area (2009) . . . . . . . . . . . . . . . . . . . . . . . . . . . . . . . . . . . . . . . . . . . . . . . . . . . . . . . . . . . . . . . . 1111 Agricultural area (2009) . . . . . . . . . . . . . . . . . . . . . . . . . . . . . . . . . . . . . . . . . . . . . . . . . . . . . . . . . . . . 1112 Irrigation potential, top 20 countries (2012) . . . . . . . . . . . . . . . . . . . . . . . . . . . . . . . . . . . . . . . . . . . . . . . 1213 Total equipped area, top 20 countries (2009) . . . . . . . . . . . . . . . . . . . . . . . . . . . . . . . . . . . . . . . . . . . . . . . 1214 Female employment in agriculture, share of female employment (2010) . . . . . . . . . . . . . . . . . . . . . . . . . . . . . . 1415 Labour force participation rate by gender, ages 15+ (2010) . . . . . . . . . . . . . . . . . . . . . . . . . . . . . . . . . . . . . . 1416 Fertilizer consumption in nutrients per ha of arable land (2002 and 2009) . . . . . . . . . . . . . . . . . . . . . . . . . . . . . 1617 Fertilizer consumption in nutrients per ha of arable land (2009) . . . . . . . . . . . . . . . . . . . . . . . . . . . . . . . . . . . 1618 Credit to agriculture, share of value added in agriculture, selected countries (2005 and 2010) . . . . . . . . . . . . . . . . 1819 ODA received in agriculture, forestry and fishing sectors, share of total ODA (2001 and 2010) . . . . . . . . . . . . . . . . . 1820 Share of components in capital stock (2007) . . . . . . . . . . . . . . . . . . . . . . . . . . . . . . . . . . . . . . . . . . . . . . . 1921 Government expenditures in agriculture, forestry, fishing and hunting (2010) . . . . . . . . . . . . . . . . . . . . . . . . . . . 1922 Total public agricultural research expenditure, share of agricultural GDP, top 20 countries (2006-2010*) . . . . . . . . . . 2023 Mobile cellular, broadband Internet and telephone line subscribers per 100 people (2010) . . . . . . . . . . . . . . . . . . 2024 Undernourishment in the developing world (1990-1992 to 2010-2012) . . . . . . . . . . . . . . . . . . . . . . . . . . . . . . 70
25 Number of people undernourished (1990-1992 and 2010-2012) . . . . . . . . . . . . . . . . . . . . . . . . . . . . . . . . . . . 7026 Percentage of children under 5 years of age who are stunted and underweight, countries with highest stunting rates(2005-2011*) . . . . . . . . . . . . . . . . . . . . . . . . . . . . . . . . . . . . . . . . . . . . . . . . . . . . . . . . . . . . . . . . . . . 72
27 People living on less than 2005 PPP $1.25 and $2 a day (1981-2005) . . . . . . . . . . . . . . . . . . . . . . . . . . . . . . . 7428 Gini coefficient (1990-1992 and 2007-2009) . . . . . . . . . . . . . . . . . . . . . . . . . . . . . . . . . . . . . . . . . . . . . . . 7429 Average dietary supply adequacy (1990-1992 and 2007-2009) . . . . . . . . . . . . . . . . . . . . . . . . . . . . . . . . . . . . 7630 Trend of the value of food production (1992-2009) . . . . . . . . . . . . . . . . . . . . . . . . . . . . . . . . . . . . . . . . . . . 7631 Share of energy supply derived from cereals, roots and tubers (1990-1992 and 2007-2009) . . . . . . . . . . . . . . . . . . 7732 Relative change in average protein supply (between 1990-1992 and 2007-2009) . . . . . . . . . . . . . . . . . . . . . . . . 7733 Relative change in average protein supply from animal origin (between 1990-1992 and 2007-2009) . . . . . . . . . . . . 7734 Relative price of food by level of economic development (2000-2012) . . . . . . . . . . . . . . . . . . . . . . . . . . . . . . . 7835 Relative price of food by region (2000-2012) . . . . . . . . . . . . . . . . . . . . . . . . . . . . . . . . . . . . . . . . . . . . . . . 7836 Percentage of population without reasonable access to improved water sources (2010) . . . . . . . . . . . . . . . . . . . . 8037 Percentage of population without reasonable access to improved sanitation facilities (2010) . . . . . . . . . . . . . . . . . 8038 Value of cereal imports over total merchandise exports (1990-1992 and 2007-2009) . . . . . . . . . . . . . . . . . . . . . . 82
39 Cereal import dependency ratio (1990-1992 and 2007-2009) . . . . . . . . . . . . . . . . . . . . . . . . . . . . . . . . . . . . . 8240 Domestic food price volatility (1995-2012) . . . . . . . . . . . . . . . . . . . . . . . . . . . . . . . . . . . . . . . . . . . . . . . . 8341 Per capita food production variability (1990-2012) . . . . . . . . . . . . . . . . . . . . . . . . . . . . . . . . . . . . . . . . . . . 8342 Domestic food price volatility by level of economic development (2000 and 2010) . . . . . . . . . . . . . . . . . . . . . . . 8443 Domestic food price volatility by region (2000 and 2010) . . . . . . . . . . . . . . . . . . . . . . . . . . . . . . . . . . . . . . . 8444 Per capita food supply variability (1995-2009) . . . . . . . . . . . . . . . . . . . . . . . . . . . . . . . . . . . . . . . . . . . . . . 8545 Girls’ and boys’ enrolment in primary education (2010) . . . . . . . . . . . . . . . . . . . . . . . . . . . . . . . . . . . . . . . . . 8646 Total health expenditure, share of GDP (1995-2010) . . . . . . . . . . . . . . . . . . . . . . . . . . . . . . . . . . . . . . . . . . 8647 Droughts, floods, extreme temperatures - share of population affected (average 1990-2009) . . . . . . . . . . . . . . . . . 8848 UNHCR total population of concern by type over time (2000-2011) . . . . . . . . . . . . . . . . . . . . . . . . . . . . . . . . . 8849 Food supply in crops primary equivalent (2000-2009) . . . . . . . . . . . . . . . . . . . . . . . . . . . . . . . . . . . . . . . . . 12650 Protein and fat supply in crops primary equivalent (2000-2009) . . . . . . . . . . . . . . . . . . . . . . . . . . . . . . . . . . . 12651 Protein supply in crops primary equivalent (2009) . . . . . . . . . . . . . . . . . . . . . . . . . . . . . . . . . . . . . . . . . . . . 12752 Fat supply in crops primary equivalent (2009) . . . . . . . . . . . . . . . . . . . . . . . . . . . . . . . . . . . . . . . . . . . . . . 12753 Crops, gross per capita production (2004-2006 = 100) (2000-2010) . . . . . . . . . . . . . . . . . . . . . . . . . . . . . . . . . 128
54 Growth in cereals production (2000-2010) . . . . . . . . . . . . . . . . . . . . . . . . . . . . . . . . . . . . . . . . . . . . . . . . 12855 Per capita cereal production (2000-2010) . . . . . . . . . . . . . . . . . . . . . . . . . . . . . . . . . . . . . . . . . . . . . . . . . 13056 Per capita coarse grain production (2000-2010) . . . . . . . . . . . . . . . . . . . . . . . . . . . . . . . . . . . . . . . . . . . . . 13057 Per capita rice production (2000-2010) . . . . . . . . . . . . . . . . . . . . . . . . . . . . . . . . . . . . . . . . . . . . . . . . . . 13258 Per capita wheat production (2000-2010) . . . . . . . . . . . . . . . . . . . . . . . . . . . . . . . . . . . . . . . . . . . . . . . . . 132
8/16/2019 Informe de la Fao 2013
http://slidepdf.com/reader/full/informe-de-la-fao-2013 15/307
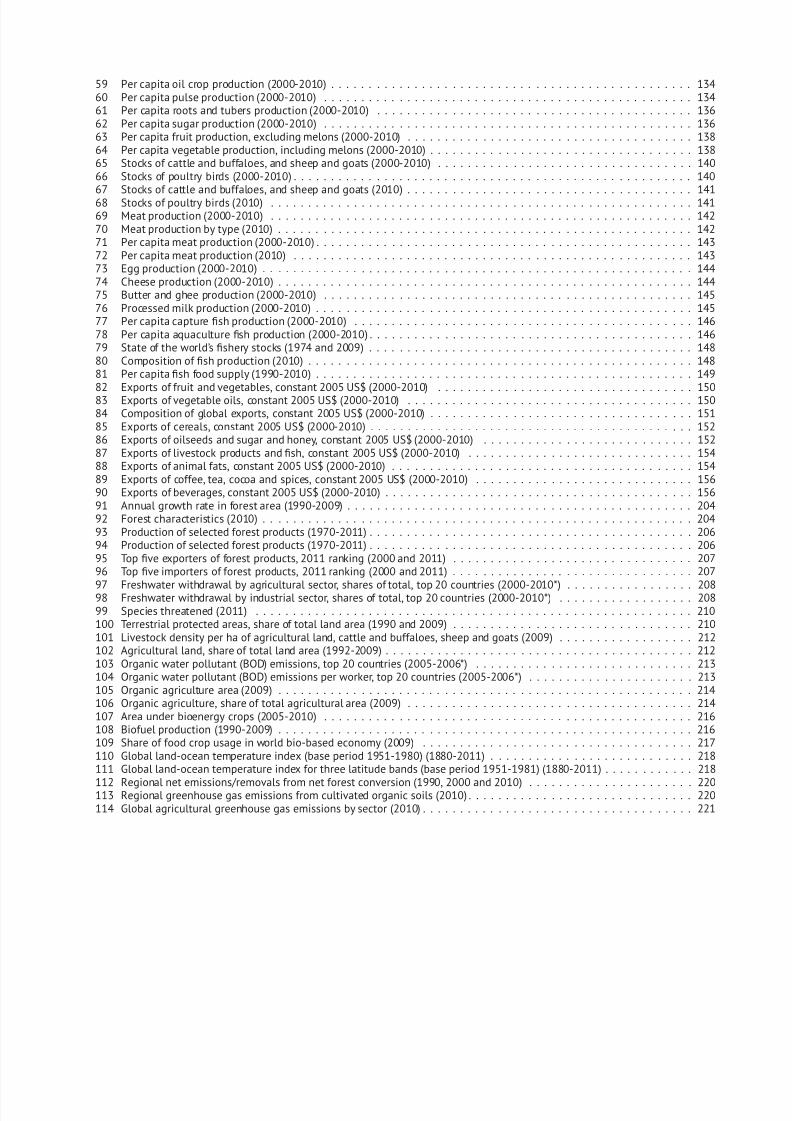
59 Per capita oil crop production (2000-2010) . . . . . . . . . . . . . . . . . . . . . . . . . . . . . . . . . . . . . . . . . . . . . . . . 13460 Per capita pulse production (2000-2010) . . . . . . . . . . . . . . . . . . . . . . . . . . . . . . . . . . . . . . . . . . . . . . . . . 13461 Per capita roots and tubers production (2000-2010) . . . . . . . . . . . . . . . . . . . . . . . . . . . . . . . . . . . . . . . . . . 13662 Per capita sugar production (2000-2010) . . . . . . . . . . . . . . . . . . . . . . . . . . . . . . . . . . . . . . . . . . . . . . . . . 13663 Per capita fruit production, excluding melons (2000-2010) . . . . . . . . . . . . . . . . . . . . . . . . . . . . . . . . . . . . . . 13864 Per capita vegetable production, including melons (2000-2010) . . . . . . . . . . . . . . . . . . . . . . . . . . . . . . . . . . . 13865 Stocks of cattle and buffaloes, and sheep and goats (2000-2010) . . . . . . . . . . . . . . . . . . . . . . . . . . . . . . . . . . 14066 Stocks of poultry birds (2000-2010) . . . . . . . . . . . . . . . . . . . . . . . . . . . . . . . . . . . . . . . . . . . . . . . . . . . . . 14067 Stocks of cattle and buffaloes, and sheep and goats (2010) . . . . . . . . . . . . . . . . . . . . . . . . . . . . . . . . . . . . . . 14168 Stocks of poultry birds (2010) . . . . . . . . . . . . . . . . . . . . . . . . . . . . . . . . . . . . . . . . . . . . . . . . . . . . . . . . 14169 Meat production (2000-2010) . . . . . . . . . . . . . . . . . . . . . . . . . . . . . . . . . . . . . . . . . . . . . . . . . . . . . . . . 14270 Meat production by type (2010) . . . . . . . . . . . . . . . . . . . . . . . . . . . . . . . . . . . . . . . . . . . . . . . . . . . . . . . 14271 Per capita meat production (2000-2010) . . . . . . . . . . . . . . . . . . . . . . . . . . . . . . . . . . . . . . . . . . . . . . . . . . 14372 Per capita meat production (2010) . . . . . . . . . . . . . . . . . . . . . . . . . . . . . . . . . . . . . . . . . . . . . . . . . . . . . 14373 Egg production (2000-2010) . . . . . . . . . . . . . . . . . . . . . . . . . . . . . . . . . . . . . . . . . . . . . . . . . . . . . . . . . 14474 Cheese production (2000-2010) . . . . . . . . . . . . . . . . . . . . . . . . . . . . . . . . . . . . . . . . . . . . . . . . . . . . . . . 14475 Butter and ghee production (2000-2010) . . . . . . . . . . . . . . . . . . . . . . . . . . . . . . . . . . . . . . . . . . . . . . . . . 14576 Processed milk production (2000-2010) . . . . . . . . . . . . . . . . . . . . . . . . . . . . . . . . . . . . . . . . . . . . . . . . . . 14577 Per capita capture fish production (2000-2010) . . . . . . . . . . . . . . . . . . . . . . . . . . . . . . . . . . . . . . . . . . . . . 14678 Per capita aquaculture fish production (2000-2010) . . . . . . . . . . . . . . . . . . . . . . . . . . . . . . . . . . . . . . . . . . . 14679 State of the world’s fishery stocks (1974 and 2009) . . . . . . . . . . . . . . . . . . . . . . . . . . . . . . . . . . . . . . . . . . . 14880 Composition of fish production (2010) . . . . . . . . . . . . . . . . . . . . . . . . . . . . . . . . . . . . . . . . . . . . . . . . . . . 14881 Per capita fish food supply (1990-2010) . . . . . . . . . . . . . . . . . . . . . . . . . . . . . . . . . . . . . . . . . . . . . . . . . . 149
82 Exports of fruit and vegetables, constant 2005 US$ (2000-2010) . . . . . . . . . . . . . . . . . . . . . . . . . . . . . . . . . . 15083 Exports of vegetable oils, constant 2005 US$ (2000-2010) . . . . . . . . . . . . . . . . . . . . . . . . . . . . . . . . . . . . . . 15084 Composition of global exports, constant 2005 US$ (2000-2010) . . . . . . . . . . . . . . . . . . . . . . . . . . . . . . . . . . . 15185 Exports of cereals, constant 2005 US$ (2000-2010) . . . . . . . . . . . . . . . . . . . . . . . . . . . . . . . . . . . . . . . . . . . 15286 Exports of oilseeds and sugar and honey, constant 2005 US$ (2000-2010) . . . . . . . . . . . . . . . . . . . . . . . . . . . . 15287 Exports of livestock products and fish, constant 2005 US$ (2000-2010) . . . . . . . . . . . . . . . . . . . . . . . . . . . . . . 15488 Exports of animal fats, constant 2005 US$ (2000-2010) . . . . . . . . . . . . . . . . . . . . . . . . . . . . . . . . . . . . . . . . 15489 Exports of coffee, tea, cocoa and spices, constant 2005 US$ (2000-2010) . . . . . . . . . . . . . . . . . . . . . . . . . . . . . 15690 Exports of beverages, constant 2005 US$ (2000-2010) . . . . . . . . . . . . . . . . . . . . . . . . . . . . . . . . . . . . . . . . . 15691 Annual growth rate in forest area (1990-2009) . . . . . . . . . . . . . . . . . . . . . . . . . . . . . . . . . . . . . . . . . . . . . . 20492 Forest characteristics (2010) . . . . . . . . . . . . . . . . . . . . . . . . . . . . . . . . . . . . . . . . . . . . . . . . . . . . . . . . . 20493 Production of selected forest products (1970-2011) . . . . . . . . . . . . . . . . . . . . . . . . . . . . . . . . . . . . . . . . . . . 20694 Production of selected forest products (1970-2011) . . . . . . . . . . . . . . . . . . . . . . . . . . . . . . . . . . . . . . . . . . . 20695 Top five exporters of forest products, 2011 ranking (2000 and 2011) . . . . . . . . . . . . . . . . . . . . . . . . . . . . . . . . 20796 Top five importers of forest products, 2011 ranking (2000 and 2011) . . . . . . . . . . . . . . . . . . . . . . . . . . . . . . . . 207
97 Freshwater withdrawal by agricultural sector, shares of total, top 20 countries (2000-2010*) . . . . . . . . . . . . . . . . . 20898 Freshwater withdrawal by industrial sector, shares of total, top 20 countries (2000-2010*) . . . . . . . . . . . . . . . . . . 20899 Species threatened (2011) . . . . . . . . . . . . . . . . . . . . . . . . . . . . . . . . . . . . . . . . . . . . . . . . . . . . . . . . . . 210100 Terrestrial protected areas, share of total land area (1990 and 2009) . . . . . . . . . . . . . . . . . . . . . . . . . . . . . . . . 210101 Livestock density per ha of agricultural land, cattle and buffaloes, sheep and goats (2009) . . . . . . . . . . . . . . . . . . 212102 Agricultural land, share of total land area (1992-2009) . . . . . . . . . . . . . . . . . . . . . . . . . . . . . . . . . . . . . . . . . 212103 Organic water pollutant (BOD) emissions, top 20 countries (2005-2006*) . . . . . . . . . . . . . . . . . . . . . . . . . . . . . 213104 Organic water pollutant (BOD) emissions per worker, top 20 countries (2005-2006*) . . . . . . . . . . . . . . . . . . . . . . 213105 Organic agriculture area (2009) . . . . . . . . . . . . . . . . . . . . . . . . . . . . . . . . . . . . . . . . . . . . . . . . . . . . . . . 214106 Organic agriculture, share of total agricultural area (2009) . . . . . . . . . . . . . . . . . . . . . . . . . . . . . . . . . . . . . . 214107 Area under bioenergy crops (2005-2010) . . . . . . . . . . . . . . . . . . . . . . . . . . . . . . . . . . . . . . . . . . . . . . . . . 216108 Biofuel production (1990-2009) . . . . . . . . . . . . . . . . . . . . . . . . . . . . . . . . . . . . . . . . . . . . . . . . . . . . . . . 216109 Share of food crop usage in world bio-based economy (2009) . . . . . . . . . . . . . . . . . . . . . . . . . . . . . . . . . . . . 217110 Global land-ocean temperature index (base period 1951-1980) (1880-2011) . . . . . . . . . . . . . . . . . . . . . . . . . . . 218111 Global land-ocean temperature index for three latitude bands (base period 1951-1981) (1880-2011) . . . . . . . . . . . . 218
112 Regional net emissions/removals from net forest conversion (1990, 2000 and 2010) . . . . . . . . . . . . . . . . . . . . . . 220113 Regional greenhouse gas emissions from cultivated organic soils (2010) . . . . . . . . . . . . . . . . . . . . . . . . . . . . . . 220114 Global agricultural greenhouse gas emissions by sector (2010) . . . . . . . . . . . . . . . . . . . . . . . . . . . . . . . . . . . . 221
8/16/2019 Informe de la Fao 2013
http://slidepdf.com/reader/full/informe-de-la-fao-2013 16/307
List of Maps
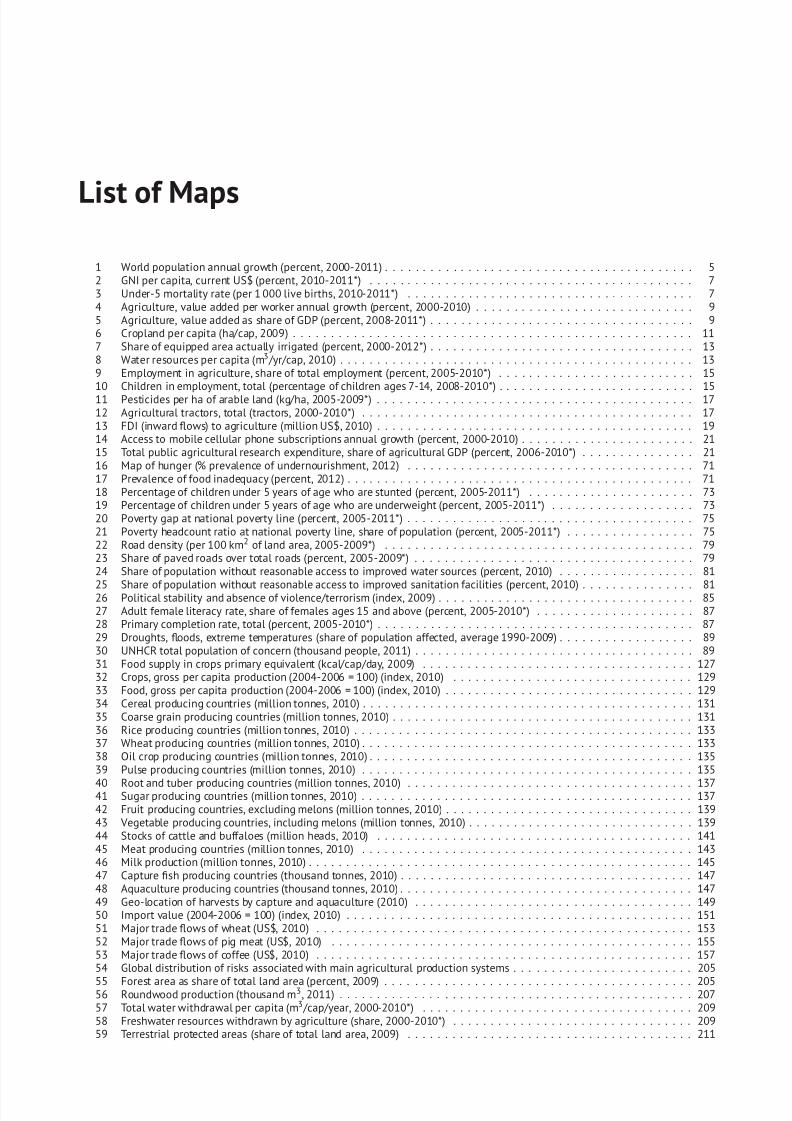
1 World population annual growth (percent, 2000-2011) . . . . . . . . . . . . . . . . . . . . . . . . . . . . . . . . . . . . . . . . . 52 GNI per capita, current US$ (percent, 2010-2011*) . . . . . . . . . . . . . . . . . . . . . . . . . . . . . . . . . . . . . . . . . . . 73 Under-5 mortality rate (per 1 000 live births, 2010-2011*) . . . . . . . . . . . . . . . . . . . . . . . . . . . . . . . . . . . . . . 74 Agriculture, value added per worker annual growth (percent, 2000-2010) . . . . . . . . . . . . . . . . . . . . . . . . . . . . . 95 Agriculture, value added as share of GDP (percent, 2008-2011*) . . . . . . . . . . . . . . . . . . . . . . . . . . . . . . . . . . . 96 Cropland per capita (ha/cap, 2009) . . . . . . . . . . . . . . . . . . . . . . . . . . . . . . . . . . . . . . . . . . . . . . . . . . . . . 117 Share of equipped area actually irrigated (percent, 2000-2012*) . . . . . . . . . . . . . . . . . . . . . . . . . . . . . . . . . . . 138 Water resources per capita (m3 /yr/cap, 2010) . . . . . . . . . . . . . . . . . . . . . . . . . . . . . . . . . . . . . . . . . . . . . . . 139 Employment in agriculture, share of total employment (percent, 2005-2010*) . . . . . . . . . . . . . . . . . . . . . . . . . . 1510 Children in employment, total (percentage of children ages 7-14, 2008-2010*) . . . . . . . . . . . . . . . . . . . . . . . . . . 1511 Pesticides per ha of arable land (kg/ha, 2005-2009*) . . . . . . . . . . . . . . . . . . . . . . . . . . . . . . . . . . . . . . . . . . 1712 Agricultural tractors, total (tractors, 2000-2010*) . . . . . . . . . . . . . . . . . . . . . . . . . . . . . . . . . . . . . . . . . . . . 1713 FDI (inward flows) to agriculture (million US$, 2010) . . . . . . . . . . . . . . . . . . . . . . . . . . . . . . . . . . . . . . . . . . 1914 Access to mobile cellular phone subscriptions annual growth (percent, 2000-2010) . . . . . . . . . . . . . . . . . . . . . . . 2115 Total public agricultural research expenditure, share of agricultural GDP (percent, 2006-2010*) . . . . . . . . . . . . . . . 2116 Map of hunger (% prevalence of undernourishment, 2012) . . . . . . . . . . . . . . . . . . . . . . . . . . . . . . . . . . . . . . 7117 Prevalence of food inadequacy (percent, 2012) . . . . . . . . . . . . . . . . . . . . . . . . . . . . . . . . . . . . . . . . . . . . . . 7118 Percentage of children under 5 years of age who are stunted (percent, 2005-2011*) . . . . . . . . . . . . . . . . . . . . . . 7319 Percentage of children under 5 years of age who are underweight (percent, 2005-2011*) . . . . . . . . . . . . . . . . . . . 7320 Poverty gap at national poverty line (percent, 2005-2011*) . . . . . . . . . . . . . . . . . . . . . . . . . . . . . . . . . . . . . . 7521 Poverty headcount ratio at national poverty line, share of population (percent, 2005-2011*) . . . . . . . . . . . . . . . . . 7522 Road density (per 100 km2 of land area, 2005-2009*) . . . . . . . . . . . . . . . . . . . . . . . . . . . . . . . . . . . . . . . . . 7923 Share of paved roads over total roads (percent, 2005-2009*) . . . . . . . . . . . . . . . . . . . . . . . . . . . . . . . . . . . . . 7924 Share of population without reasonable access to improved water sources (percent, 2010) . . . . . . . . . . . . . . . . . . 81
25 Share of population without reasonable access to improved sanitation facilities (percent, 2010) . . . . . . . . . . . . . . . 8126 Political stability and absence of violence/terrorism (index, 2009) . . . . . . . . . . . . . . . . . . . . . . . . . . . . . . . . . . 8527 Adult female literacy rate, share of females ages 15 and above (percent, 2005-2010*) . . . . . . . . . . . . . . . . . . . . . 8728 Primary completion rate, total (percent, 2005-2010*) . . . . . . . . . . . . . . . . . . . . . . . . . . . . . . . . . . . . . . . . . . 8729 Droughts, floods, extreme temperatures (share of population affected, average 1990-2009) . . . . . . . . . . . . . . . . . . 8930 UNHCR total population of concern (thousand people, 2011) . . . . . . . . . . . . . . . . . . . . . . . . . . . . . . . . . . . . . 8931 Food supply in crops primary equivalent (kcal/cap/day, 2009) . . . . . . . . . . . . . . . . . . . . . . . . . . . . . . . . . . . . 12732 Crops, gross per capita production (2004-2006 = 100) (index, 2010) . . . . . . . . . . . . . . . . . . . . . . . . . . . . . . . . 12933 Food, gross per capita production (2004-2006 = 100) (index, 2010) . . . . . . . . . . . . . . . . . . . . . . . . . . . . . . . . . 12934 Cereal producing countries (million tonnes, 2010) . . . . . . . . . . . . . . . . . . . . . . . . . . . . . . . . . . . . . . . . . . . . 13135 Coarse grain producing countries (million tonnes, 2010) . . . . . . . . . . . . . . . . . . . . . . . . . . . . . . . . . . . . . . . . 13136 Rice producing countries (million tonnes, 2010) . . . . . . . . . . . . . . . . . . . . . . . . . . . . . . . . . . . . . . . . . . . . . 13337 Wheat producing countries (million tonnes, 2010) . . . . . . . . . . . . . . . . . . . . . . . . . . . . . . . . . . . . . . . . . . . . 13338 Oil crop producing countries (million tonnes, 2010) . . . . . . . . . . . . . . . . . . . . . . . . . . . . . . . . . . . . . . . . . . . 13539 Pulse producing countries (million tonnes, 2010) . . . . . . . . . . . . . . . . . . . . . . . . . . . . . . . . . . . . . . . . . . . . 135
40 Root and tuber producing countries (million tonnes, 2010) . . . . . . . . . . . . . . . . . . . . . . . . . . . . . . . . . . . . . . 13741 Sugar producing countries (million tonnes, 2010) . . . . . . . . . . . . . . . . . . . . . . . . . . . . . . . . . . . . . . . . . . . . 13742 Fruit producing countries, excluding melons (million tonnes, 2010) . . . . . . . . . . . . . . . . . . . . . . . . . . . . . . . . . 13943 Vegetable producing countries, including melons (million tonnes, 2010) . . . . . . . . . . . . . . . . . . . . . . . . . . . . . . 13944 Stocks of cattle and buffaloes (million heads, 2010) . . . . . . . . . . . . . . . . . . . . . . . . . . . . . . . . . . . . . . . . . . 14145 Meat producing countries (million tonnes, 2010) . . . . . . . . . . . . . . . . . . . . . . . . . . . . . . . . . . . . . . . . . . . . 14346 Milk production (million tonnes, 2010) . . . . . . . . . . . . . . . . . . . . . . . . . . . . . . . . . . . . . . . . . . . . . . . . . . . 14547 Capture fish producing countries (thousand tonnes, 2010) . . . . . . . . . . . . . . . . . . . . . . . . . . . . . . . . . . . . . . . 14748 Aquaculture producing countries (thousand tonnes, 2010) . . . . . . . . . . . . . . . . . . . . . . . . . . . . . . . . . . . . . . . 14749 Geo-location of harvests by capture and aquaculture (2010) . . . . . . . . . . . . . . . . . . . . . . . . . . . . . . . . . . . . . 14950 Import value (2004-2006 = 100) (index, 2010) . . . . . . . . . . . . . . . . . . . . . . . . . . . . . . . . . . . . . . . . . . . . . . 15151 Major trade flows of wheat (US$, 2010) . . . . . . . . . . . . . . . . . . . . . . . . . . . . . . . . . . . . . . . . . . . . . . . . . . 15352 Major trade flows of pig meat (US$, 2010) . . . . . . . . . . . . . . . . . . . . . . . . . . . . . . . . . . . . . . . . . . . . . . . . 15553 Major trade flows of coffee (US$, 2010) . . . . . . . . . . . . . . . . . . . . . . . . . . . . . . . . . . . . . . . . . . . . . . . . . . 15754 Global distribution of risks associated with main agricultural production systems . . . . . . . . . . . . . . . . . . . . . . . . 205
55 Forest area as share of total land area (percent, 2009) . . . . . . . . . . . . . . . . . . . . . . . . . . . . . . . . . . . . . . . . . 20556 Roundwood production (thousand m3, 2011) . . . . . . . . . . . . . . . . . . . . . . . . . . . . . . . . . . . . . . . . . . . . . . . 20757 Total water withdrawal per capita (m3 /cap/year, 2000-2010*) . . . . . . . . . . . . . . . . . . . . . . . . . . . . . . . . . . . . 20958 Freshwater resources withdrawn by agriculture (share, 2000-2010*) . . . . . . . . . . . . . . . . . . . . . . . . . . . . . . . . 20959 Terrestrial protected areas (share of total land area, 2009) . . . . . . . . . . . . . . . . . . . . . . . . . . . . . . . . . . . . . . 211
8/16/2019 Informe de la Fao 2013
http://slidepdf.com/reader/full/informe-de-la-fao-2013 17/307
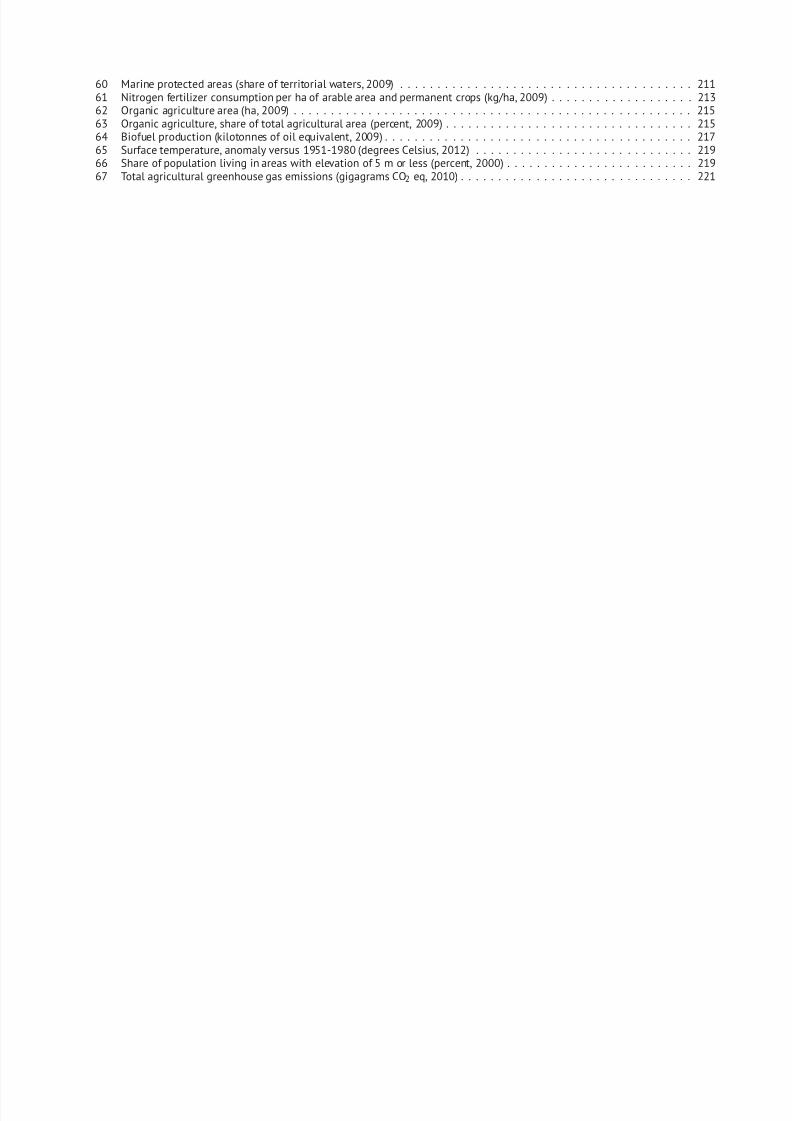
60 Marine protected areas (share of territorial waters, 2009) . . . . . . . . . . . . . . . . . . . . . . . . . . . . . . . . . . . . . . . 21161 Nitrogen fertilizer consumption per ha of arable area and permanent crops (kg/ha, 2009) . . . . . . . . . . . . . . . . . . . 21362 Organic agriculture area (ha, 2009) . . . . . . . . . . . . . . . . . . . . . . . . . . . . . . . . . . . . . . . . . . . . . . . . . . . . . 21563 Organic agriculture, share of total agricultural area (percent, 2009) . . . . . . . . . . . . . . . . . . . . . . . . . . . . . . . . . 21564 Biofuel production (kilotonnes of oil equivalent, 2009) . . . . . . . . . . . . . . . . . . . . . . . . . . . . . . . . . . . . . . . . . 21765 Surface temperature, anomaly versus 1951-1980 (degrees Celsius, 2012) . . . . . . . . . . . . . . . . . . . . . . . . . . . . . 21966 Share of population living in areas with elevation of 5 m or less (percent, 2000) . . . . . . . . . . . . . . . . . . . . . . . . . 21967 Total agricultural greenhouse gas emissions (gigagrams CO2 eq, 2010) . . . . . . . . . . . . . . . . . . . . . . . . . . . . . . . 221
8/16/2019 Informe de la Fao 2013
http://slidepdf.com/reader/full/informe-de-la-fao-2013 18/307
List of Tables
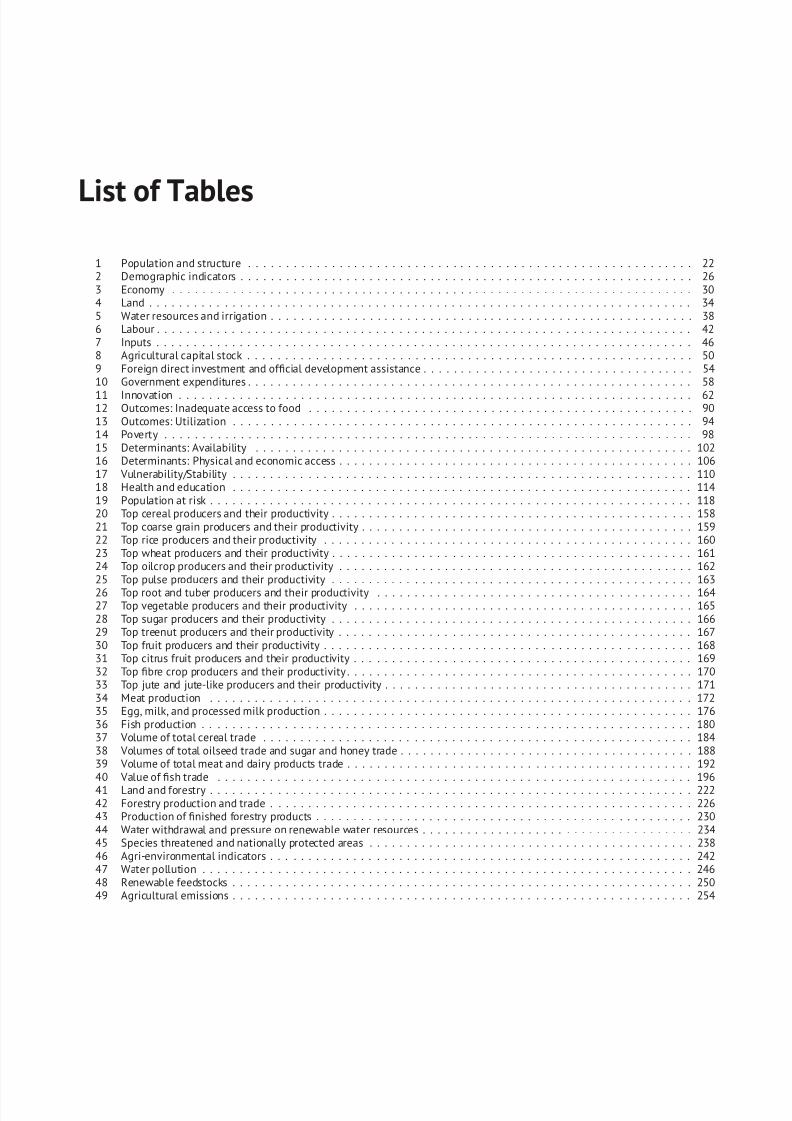
1 Population and structure . . . . . . . . . . . . . . . . . . . . . . . . . . . . . . . . . . . . . . . . . . . . . . . . . . . . . . . . . . . 222 Demographic indicators . . . . . . . . . . . . . . . . . . . . . . . . . . . . . . . . . . . . . . . . . . . . . . . . . . . . . . . . . . . . 263 Economy . . . . . . . . . . . . . . . . . . . . . . . . . . . . . . . . . . . . . . . . . . . . . . . . . . . . . . . . . . . . . . . . . . . . . 304 Land . . . . . . . . . . . . . . . . . . . . . . . . . . . . . . . . . . . . . . . . . . . . . . . . . . . . . . . . . . . . . . . . . . . . . . . . 345 Water resources and irrigation . . . . . . . . . . . . . . . . . . . . . . . . . . . . . . . . . . . . . . . . . . . . . . . . . . . . . . . . 386 Labour . . . . . . . . . . . . . . . . . . . . . . . . . . . . . . . . . . . . . . . . . . . . . . . . . . . . . . . . . . . . . . . . . . . . . . . 427 Inputs . . . . . . . . . . . . . . . . . . . . . . . . . . . . . . . . . . . . . . . . . . . . . . . . . . . . . . . . . . . . . . . . . . . . . . . 468 Agricultural capital stock . . . . . . . . . . . . . . . . . . . . . . . . . . . . . . . . . . . . . . . . . . . . . . . . . . . . . . . . . . . 509 Foreign direct investment and official development assistance . . . . . . . . . . . . . . . . . . . . . . . . . . . . . . . . . . . . 5410 Government expenditures . . . . . . . . . . . . . . . . . . . . . . . . . . . . . . . . . . . . . . . . . . . . . . . . . . . . . . . . . . . 58
11 Innovation . . . . . . . . . . . . . . . . . . . . . . . . . . . . . . . . . . . . . . . . . . . . . . . . . . . . . . . . . . . . . . . . . . . . 6212 Outcomes: Inadequate access to food . . . . . . . . . . . . . . . . . . . . . . . . . . . . . . . . . . . . . . . . . . . . . . . . . . . 9013 Outcomes: Utilization . . . . . . . . . . . . . . . . . . . . . . . . . . . . . . . . . . . . . . . . . . . . . . . . . . . . . . . . . . . . . 9414 Poverty . . . . . . . . . . . . . . . . . . . . . . . . . . . . . . . . . . . . . . . . . . . . . . . . . . . . . . . . . . . . . . . . . . . . . . 9815 Determinants: Availability . . . . . . . . . . . . . . . . . . . . . . . . . . . . . . . . . . . . . . . . . . . . . . . . . . . . . . . . . . 10216 Determinants: Physical and economic access . . . . . . . . . . . . . . . . . . . . . . . . . . . . . . . . . . . . . . . . . . . . . . . 10617 Vulnerability/Stability . . . . . . . . . . . . . . . . . . . . . . . . . . . . . . . . . . . . . . . . . . . . . . . . . . . . . . . . . . . . . 11018 Health and education . . . . . . . . . . . . . . . . . . . . . . . . . . . . . . . . . . . . . . . . . . . . . . . . . . . . . . . . . . . . . 11419 Population at risk . . . . . . . . . . . . . . . . . . . . . . . . . . . . . . . . . . . . . . . . . . . . . . . . . . . . . . . . . . . . . . . . 11820 Top cereal producers and their productivity . . . . . . . . . . . . . . . . . . . . . . . . . . . . . . . . . . . . . . . . . . . . . . . . 15821 Top coarse grain producers and their productivity . . . . . . . . . . . . . . . . . . . . . . . . . . . . . . . . . . . . . . . . . . . . 15922 Top rice producers and their productivity . . . . . . . . . . . . . . . . . . . . . . . . . . . . . . . . . . . . . . . . . . . . . . . . . 16023 Top wheat producers and their productivity . . . . . . . . . . . . . . . . . . . . . . . . . . . . . . . . . . . . . . . . . . . . . . . . 16124 Top oilcrop producers and their productivity . . . . . . . . . . . . . . . . . . . . . . . . . . . . . . . . . . . . . . . . . . . . . . . 16225 Top pulse producers and their productivity . . . . . . . . . . . . . . . . . . . . . . . . . . . . . . . . . . . . . . . . . . . . . . . . 163
26 Top root and tuber producers and their productivity . . . . . . . . . . . . . . . . . . . . . . . . . . . . . . . . . . . . . . . . . . 16427 Top vegetable producers and their productivity . . . . . . . . . . . . . . . . . . . . . . . . . . . . . . . . . . . . . . . . . . . . . 16528 Top sugar producers and their productivity . . . . . . . . . . . . . . . . . . . . . . . . . . . . . . . . . . . . . . . . . . . . . . . . 16629 Top treenut producers and their productivity . . . . . . . . . . . . . . . . . . . . . . . . . . . . . . . . . . . . . . . . . . . . . . . 16730 Top fruit producers and their productivity . . . . . . . . . . . . . . . . . . . . . . . . . . . . . . . . . . . . . . . . . . . . . . . . . 16831 Top citrus fruit producers and their productivity . . . . . . . . . . . . . . . . . . . . . . . . . . . . . . . . . . . . . . . . . . . . . 16932 Top fibre crop producers and their productivity . . . . . . . . . . . . . . . . . . . . . . . . . . . . . . . . . . . . . . . . . . . . . . 17033 Top jute and jute-like producers and their productivity . . . . . . . . . . . . . . . . . . . . . . . . . . . . . . . . . . . . . . . . . 17134 Meat production . . . . . . . . . . . . . . . . . . . . . . . . . . . . . . . . . . . . . . . . . . . . . . . . . . . . . . . . . . . . . . . . 17235 Egg, milk, and processed milk production . . . . . . . . . . . . . . . . . . . . . . . . . . . . . . . . . . . . . . . . . . . . . . . . . 17636 Fish production . . . . . . . . . . . . . . . . . . . . . . . . . . . . . . . . . . . . . . . . . . . . . . . . . . . . . . . . . . . . . . . . . 18037 Volume of total cereal trade . . . . . . . . . . . . . . . . . . . . . . . . . . . . . . . . . . . . . . . . . . . . . . . . . . . . . . . . . 18438 Volumes of total oilseed trade and sugar and honey trade . . . . . . . . . . . . . . . . . . . . . . . . . . . . . . . . . . . . . . . 18839 Volume of total meat and dairy products trade . . . . . . . . . . . . . . . . . . . . . . . . . . . . . . . . . . . . . . . . . . . . . . 19240 Value of fish trade . . . . . . . . . . . . . . . . . . . . . . . . . . . . . . . . . . . . . . . . . . . . . . . . . . . . . . . . . . . . . . . 19641 Land and forestry . . . . . . . . . . . . . . . . . . . . . . . . . . . . . . . . . . . . . . . . . . . . . . . . . . . . . . . . . . . . . . . . 22242 Forestry production and trade . . . . . . . . . . . . . . . . . . . . . . . . . . . . . . . . . . . . . . . . . . . . . . . . . . . . . . . . 22643 Production of finished forestry products . . . . . . . . . . . . . . . . . . . . . . . . . . . . . . . . . . . . . . . . . . . . . . . . . . 23044 Water withdrawal and pressure on renewable water resources . . . . . . . . . . . . . . . . . . . . . . . . . . . . . . . . . . . . 23445 Species threatened and nationally protected areas . . . . . . . . . . . . . . . . . . . . . . . . . . . . . . . . . . . . . . . . . . . 23846 Agri-environmental indicators . . . . . . . . . . . . . . . . . . . . . . . . . . . . . . . . . . . . . . . . . . . . . . . . . . . . . . . . 24247 Water pollution . . . . . . . . . . . . . . . . . . . . . . . . . . . . . . . . . . . . . . . . . . . . . . . . . . . . . . . . . . . . . . . . . 24648 Renewable feedstocks . . . . . . . . . . . . . . . . . . . . . . . . . . . . . . . . . . . . . . . . . . . . . . . . . . . . . . . . . . . . . 25049 Agricultural emissions . . . . . . . . . . . . . . . . . . . . . . . . . . . . . . . . . . . . . . . . . . . . . . . . . . . . . . . . . . . . . 254
8/16/2019 Informe de la Fao 2013
http://slidepdf.com/reader/full/informe-de-la-fao-2013 19/307
PART
The Setting
Introduction
More than 3 billion people – almost half of the world’s population– live in rural areas. Roughly 2.5 billion of these rural people de-rive their livelihoods from agriculture. For many economies, espe-cially those of developing countries, agriculture can be an impor-tant engine of economic growth. Approximately three-quarters of theworld’s agricultural value added is generated in developing countries,and in many of these, the agriculture sector contributes as much as30 percent to gross domestic product (GDP). According to the WorldBank, 1 percent growth in GDP from agriculture increases the expen-
ditures of the three poorest deciles by at least 2.5 times as much as1 percent growth from the rest of the economy. Agriculture can alsoprovide an important haven against global economic and financialturmoil, often more effectively than other sectors.
A look back through history reveals that growth in agriculture hastended to be followed by wider economic development. From the in-dustrial revolution that began in the United Kingdom of Great Britain
8/16/2019 Informe de la Fao 2013
http://slidepdf.com/reader/full/informe-de-la-fao-2013 20/307
and Northern Ireland in the eighteenth century and spread to othernow developed countries, through to more recent examples in Chinaor Viet Nam, growth in agriculture has always been the precursor to
the rise of industry and services.In many poor developing countries, primary activities such as agri-culture still constitute the backbone of the economy. However, thesector often faces many challenges. A profound and prolonged lackof investment in agriculture is evident in many countries. Notably,infrastructure is missing or weak in rural areas, agricultural produc-tivity is stagnant, and lack of opportunities for income diversificationcombines with poorly functioning markets to undermine economicgrowth. There is often a gender divide. Although women make sig-nificant contributions to the rural economy, they often have less ac-
cess to productive resources than men, and families often rely onchildren’s work for survival.
Downward trends in the global economy are slowly turning, withimproved accessibility to financial resources. Agriculture is reapingthe benefits of technological innovation, and there is also a growingrecognition among governments and donor agencies that agriculturemust be the mainstay of any development agenda and of policiespromoting economic growth. The reaffirmation of the sector’s role indevelopment and growth provides fresh impetus for fostering invest-ments that raise productivity and incomes in agriculture.
Within this context, FAO – together with international partners –is promoting the Global Strategy to Improve Agricultural and RuralStatistics. This multi-year, collaborative project builds capacity in de-veloping countries to produce and use agricultural and rural statisticsfor more effective food security, sustainable agricultural and rural de-velopment policies, and helps ensure that information is available tofarmers and policy-makers when and where they need it.
8/16/2019 Informe de la Fao 2013
http://slidepdf.com/reader/full/informe-de-la-fao-2013 21/307
Key Resources
The State of Food and Agriculture
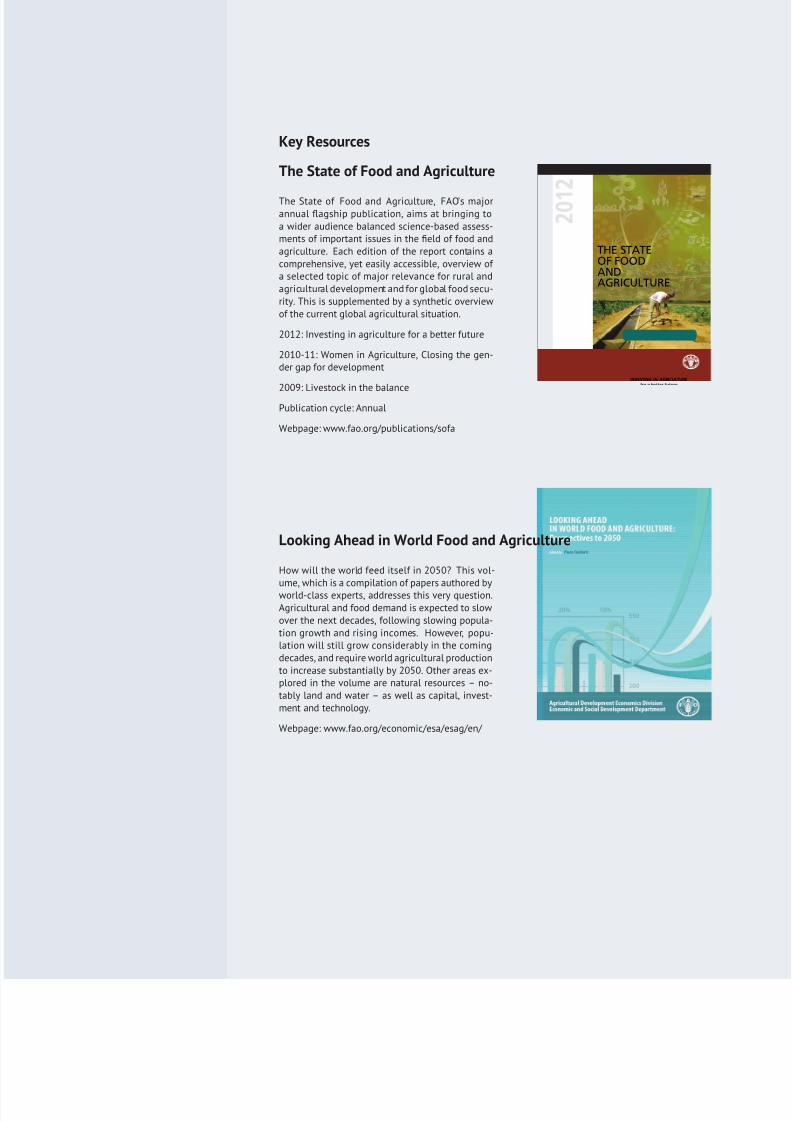
The State of Food and Agriculture, FAO’s majorannual flagship publication, aims at bringing toa wider audience balanced science-based assess-ments of important issues in the field of food andagriculture. Each edition of the report contains acomprehensive, yet easily accessible, overview of a selected topic of major relevance for rural andagricultural development and for global food secu-rity. This is supplemented by a synthetic overviewof the current global agricultural situation.
2012: Investing in agriculture for a better future
2010-11: Women in Agriculture, Closing the gen-der gap for development
2009: Livestock in the balancePublication cycle: Annual
Webpage: www.fao.org/publications/sofa
ISSN0081-4539
THE STATE
OF FOOD
AND
AGRICULTURE
INVESTING IN AGRICULTURE
for a better future
Looking Ahead in World Food and Agriculture
How will the world feed itself in 2050? This vol-ume, which is a compilation of papers authored byworld-class experts, addresses this very question.Agricultural and food demand is expected to slowover the next decades, following slowing popula-tion growth and rising incomes. However, popu-lation will still grow considerably in the comingdecades, and require world agricultural productionto increase substantially by 2050. Other areas ex-plored in the volume are natural resources – no-tably land and water – as well as capital, invest-ment and technology.
Webpage: www.fao.org/economic/esa/esag/en/
8/16/2019 Informe de la Fao 2013
http://slidepdf.com/reader/full/informe-de-la-fao-2013 22/307
Overview
Although demographic growth rates have been slowing
since the late 1970s, the world’s population has doubled
since then – to approximately 7 billion people – and is pro-
jected to increase considerably over the coming decades. In
many developing countries, a combination of declining mor-
tality rates, prolonged life expectancy and age structurescharacterized by youth and high fertility suggests that con-
siderable population increases are likely to continue until
the end of the twenty-first century.
The agricultural population is defined as all people depend-
ing on agriculture, forestry, fishing and hunting for their
livelihoods. It comprises all the people economically ac-
tive in agriculture and their non-working dependants, but
the agricultural population does not necessarily live exclu-
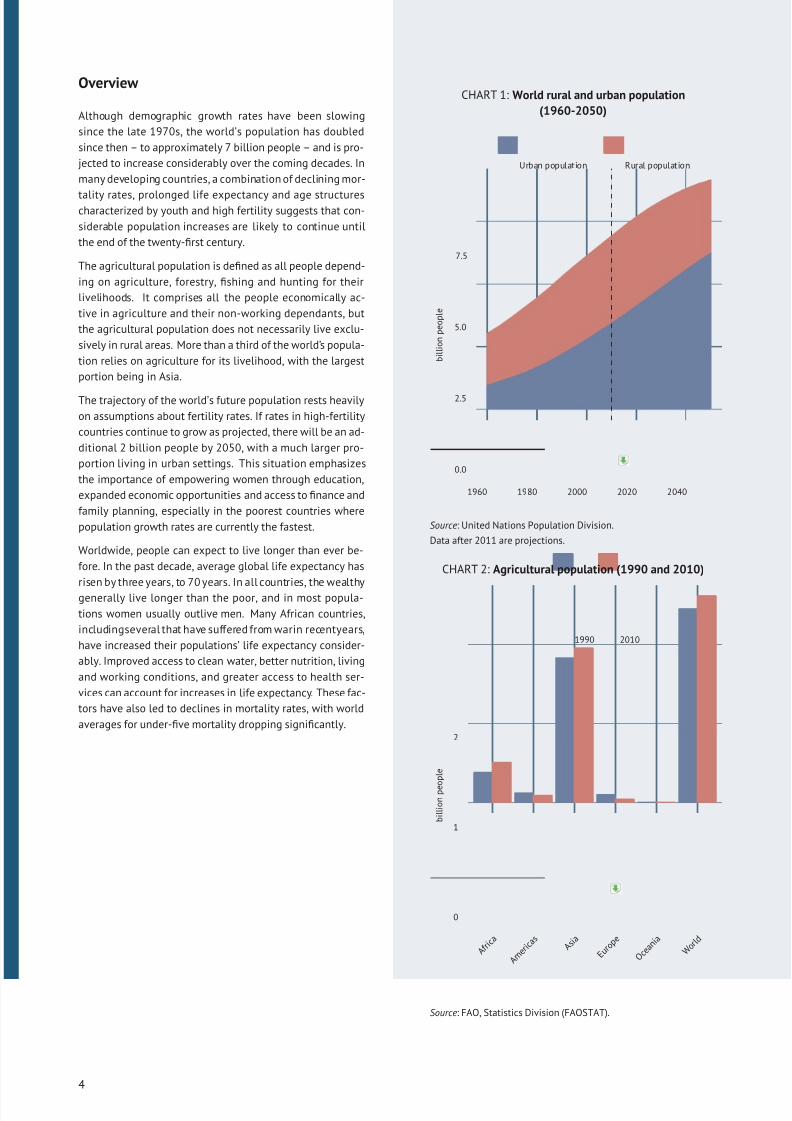
sively in rural areas. More than a third of the world’s popula-
tion relies on agriculture for its livelihood, with the largest
portion being in Asia.
The trajectory of the world’s future population rests heavily
on assumptions about fertility rates. If rates in high-fertility
countries continue to grow as projected, there will be an ad-
ditional 2 billion people by 2050, with a much larger pro-
portion living in urban settings. This situation emphasizes
the importance of empowering women through education,
expanded economic opportunities and access to finance and
family planning, especially in the poorest countries where
population growth rates are currently the fastest.
Worldwide, people can expect to live longer than ever be-
fore. In the past decade, average global life expectancy has
risen by three years, to 70 years. In all countries, the wealthy
generally live longer than the poor, and in most popula-
tions women usually outlive men. Many African countries,
includingseveral that have suffered from warin recentyears,
have increased their populations’ life expectancy consider-
ably. Improved access to clean water, better nutrition, living
and working conditions, and greater access to health ser-
vices can account for increases in life expectancy. These fac-
tors have also led to declines in mortality rates, with world
averages for under-five mortality dropping significantly.
CHART 1: World rural and urban population
(1960-2050)
0.0
2.5
5.0
7.5
1960 1980 2000 2020 2040
b i l l i o n p e o p l e
Urban population Rural population
Source: United Nations Population Division.
Data after 2011 are projections.
CHART 2: Agricultural population (1990 and 2010)
0
1
2
A f r i c a
A m e r i c a s
A s i a
E u r o p e
O c e a n i a
W o r l d
b i l l i o n p e o
p l e
1990 2010
Source: FAO, Statistics Division (FAOSTAT).
4
8/16/2019 Informe de la Fao 2013
http://slidepdf.com/reader/full/informe-de-la-fao-2013 23/307
THE SETTING
MAP 1: World population annual growth (percent, 2000-2011)
No data available −1.1 ~ < 0 0 ~ < 1 1 ~ < 1.5 1.5 ~ < 2.5 2.5 ~ 12
Source: World Bank (WDI).
CHART 3: Population ages 0-14 and 65+, share of total
(2011)
0
10
20
30
40
A f r i c a
A m e r i c a s
A s i a
E u r o p e
O c e a n i a
W o r l d
p e r c e n t
Population 0-14 Population 65+
Source: World Bank (WDI).
CHART 4: Population density (2010)
0
50
100
A f r i c a
A m e r i c a s
A s i a
E u r o p e
O c e a n i a
W o r l d
p e
o p l e / k m
2
Source: World Bank (WDI).
5
8/16/2019 Informe de la Fao 2013
http://slidepdf.com/reader/full/informe-de-la-fao-2013 24/307
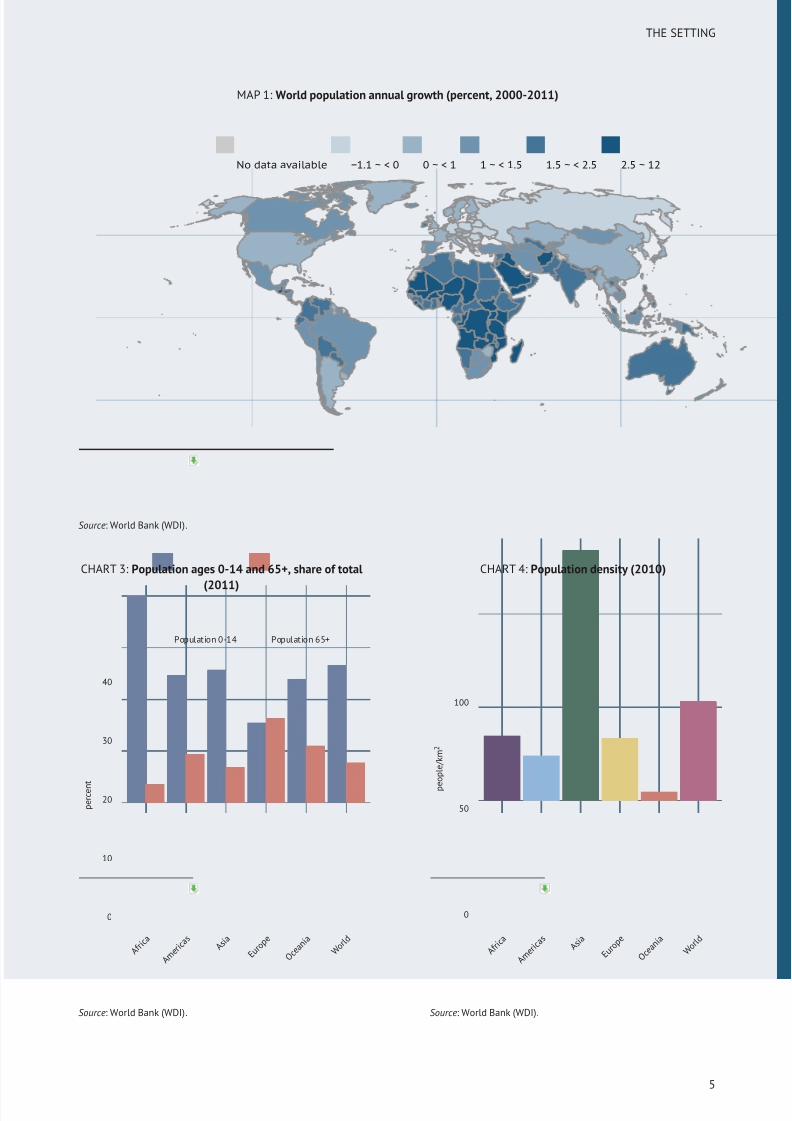
The world’s population is ageing. Today, roughly 27 percent
of people worldwide are below the age of 15, and approx-
imately 8 percent are 65 years or older. Two decades ago,
these statistics stood at 33 and 6 percent, respectively. This
ageing profile is being shaped by rising longevity twinned
with low fertility rates in the more developed countries.
Unprecedented change has also occurred in where people
reside. In 2008 – for the first time – the world’s urban pop-
ulation became larger than its rural population. Now, about
52 percent of the world’s population lives in cities. Only
part of the increase was caused by growing rural-urban mi-
gration; other reasons include the transformation of rural
settlements into urban areas and, most important, natural
growth of urban populations. However, this trend has not
occurred in all regions of the world: 61 percent of people in
Africa and 55 percent in Asia still live in rural settings.
Allied to rising urbanization is an increase in population
densities. In 2010, at the world level, there were an aver-
age of 53 people living in every square kilometre. Regional
differences are significant. In Asia, for instance, population
density stands at 134/km2 compared with 29/km2 in Latin
America and the Caribbean.
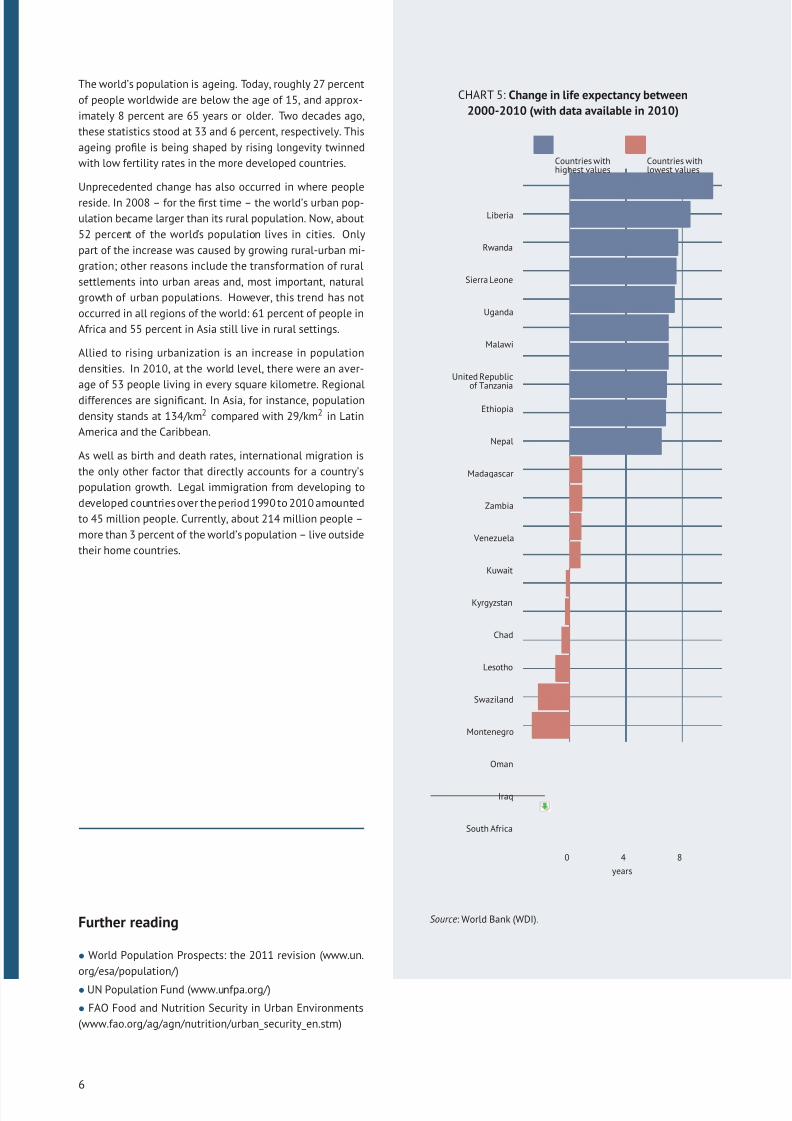
As well as birth and death rates, international migration is
the only other factor that directly accounts for a country’s
population growth. Legal immigration from developing to
developed countries over the period 1990 to 2010 amounted
to 45 million people. Currently, about 214 million people –
more than 3 percent of the world’s population – live outside
their home countries.
Further reading
• World Population Prospects: the 2011 revision (www.un.
org/esa/population/)
• UN Population Fund (www.unfpa.org/)
• FAO Food and Nutrition Security in Urban Environments
(www.fao.org/ag/agn/nutrition/urban_security_en.stm)
CHART 5: Change in life expectancy between
2000-2010 (with data available in 2010)
South Africa
Iraq
Oman
Montenegro
Swaziland
Lesotho
Chad
Kyrgyzstan
Kuwait
Venezuela
Zambia
Madagascar
Nepal
Ethiopia
United Republicof Tanzania
Malawi
Uganda
Sierra Leone
Rwanda
Liberia
0 4 8
years
Countries withhighest values
Countries withlowest values
Source: World Bank (WDI).
6
8/16/2019 Informe de la Fao 2013
http://slidepdf.com/reader/full/informe-de-la-fao-2013 25/307
THE SETTING
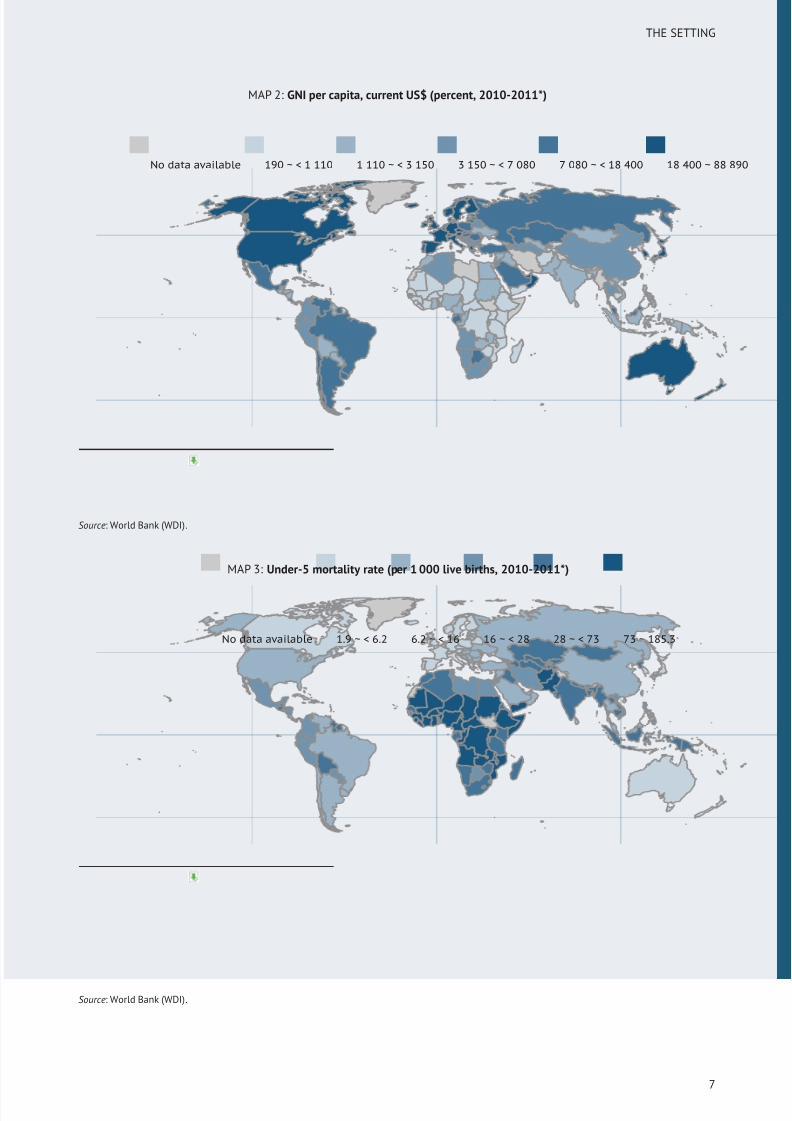
MAP 2: GNI per capita, current US$ (percent, 2010-2011*)
No data available 190 ~ < 1 110 1 110 ~ < 3 150 3 150 ~ < 7 080 7 080 ~ < 18 400 18 400 ~ 88 890
Source: World Bank (WDI).
MAP 3: Under-5 mortality rate (per 1 000 live births, 2010-2011*)
No data available 1.9 ~ < 6.2 6.2 ~ < 16 16 ~ < 28 28 ~ < 73 73 ~ 185.3
Source: World Bank (WDI).
7
8/16/2019 Informe de la Fao 2013
http://slidepdf.com/reader/full/informe-de-la-fao-2013 26/307
Economy
Changes in the wider economy and macroeconomic policies
continue to affect the performance of the agricultural econ-
omy. Although recovery continues, growth in the advanced
economies remains too low to reduce unemployment no-
tably. In particular, fiscal consolidation, a financial system
that is still weak, and a general feeling of uncertainty havehad a negative impact on incomes, and hence demand. This
situation, in turn, affects emerging market and developing
economies through trade and financial channels, including
volatile capital flows. Given the growing integration of the
global economy, macroeconomic policies play an increas-
ingly important role in determining the performance of agri-
culture sectors.
Following the onset of the fastest and deepest slowdown in
global economic activity since the great depression of the
1930s, governments around the world have responded with
an unprecedented array of stimulus measures that may now
be beginning to bear results. However, global current ac-count imbalances still demand decisive policy action. More
adjustment in external-deficit economies and more inter-
nal demand in external-surplus economies would contribute
not only to a safer global economy but also to stronger
growth prospects for all. In emerging market and devel-
oping economies, although policy-makers are increasingly
conscious of the need to rebuild fiscal and monetary policy
space, they are sometimes still uncertain regarding how best
to calibrate policies in the face of continued external down-
side risks that can thwart capital flows and have a negative
impact on future aid flows.
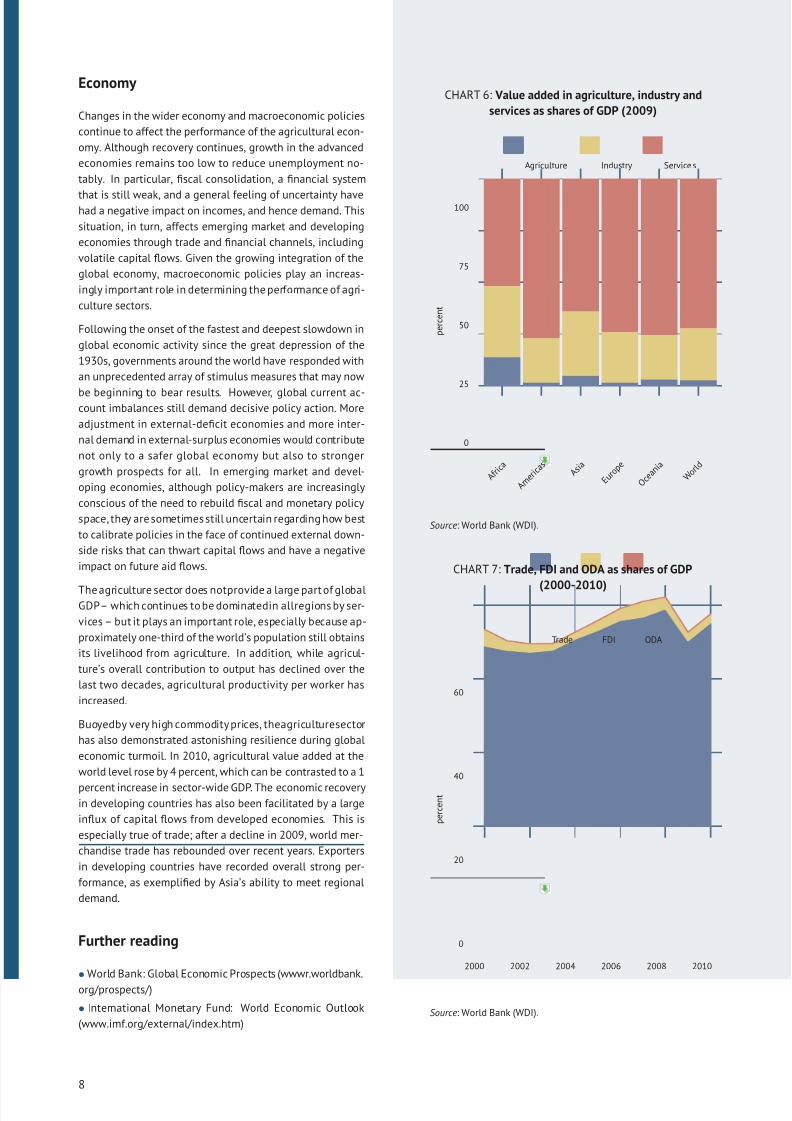
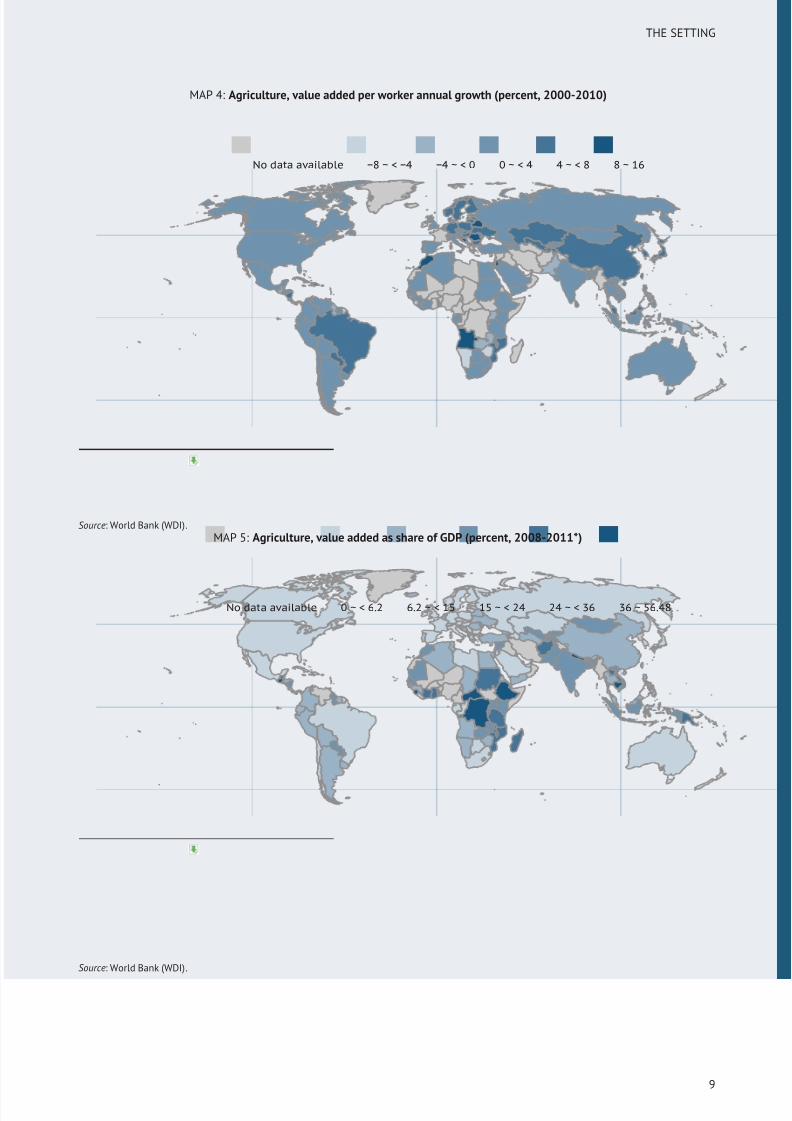
The agriculture sector does notprovide a large part of globalGDP– which continues to be dominatedin allregions by ser-
vices – but it plays an important role, especially because ap-
proximately one-third of the world’s population still obtains
its livelihood from agriculture. In addition, while agricul-
ture’s overall contribution to output has declined over the
last two decades, agricultural productivity per worker has
increased.
Buoyedby very high commodity prices, theagriculturesector
has also demonstrated astonishing resilience during global
economic turmoil. In 2010, agricultural value added at the
world level rose by 4 percent, which can be contrasted to a 1
percent increase in sector-wide GDP. The economic recoveryin developing countries has also been facilitated by a large
influx of capital flows from developed economies. This is
especially true of trade; after a decline in 2009, world mer-
chandise trade has rebounded over recent years. Exporters
in developing countries have recorded overall strong per-
formance, as exemplified by Asia’s ability to meet regional
demand.
Further reading
• World Bank: Global Economic Prospects (wwwr.worldbank.
org/prospects/)
• International Monetary Fund: World Economic Outlook
(www.imf.org/external/index.htm)
CHART 6: Value added in agriculture, industry and
services as shares of GDP (2009)
0
25
50
75
100
A f r i c a
A m e r i c a s
A s i a
E u r o p e
O c e a n i a
W o r l d
p e r c e n t
Agriculture Industry Services
Source: World Bank (WDI).
CHART 7: Trade, FDI and ODA as shares of GDP
(2000-2010)
0
20
40
60
2000 2002 2004 2006 2008 2010
p e r c e n t
Trade FDI ODA
Source: World Bank (WDI).
8
8/16/2019 Informe de la Fao 2013
http://slidepdf.com/reader/full/informe-de-la-fao-2013 27/307
THE SETTING
MAP 4: Agriculture, value added per worker annual growth (percent, 2000-2010)
No data available −8 ~ < −4 −4 ~ < 0 0 ~ < 4 4 ~ < 8 8 ~ 16
Source: World Bank (WDI).MAP 5: Agriculture, value added as share of GDP (percent, 2008-2011*)
No data available 0 ~ < 6.2 6.2 ~ < 15 15 ~ < 24 24 ~ < 36 36 ~ 56.48
Source: World Bank (WDI).
9
8/16/2019 Informe de la Fao 2013
http://slidepdf.com/reader/full/informe-de-la-fao-2013 28/307
Land and Water
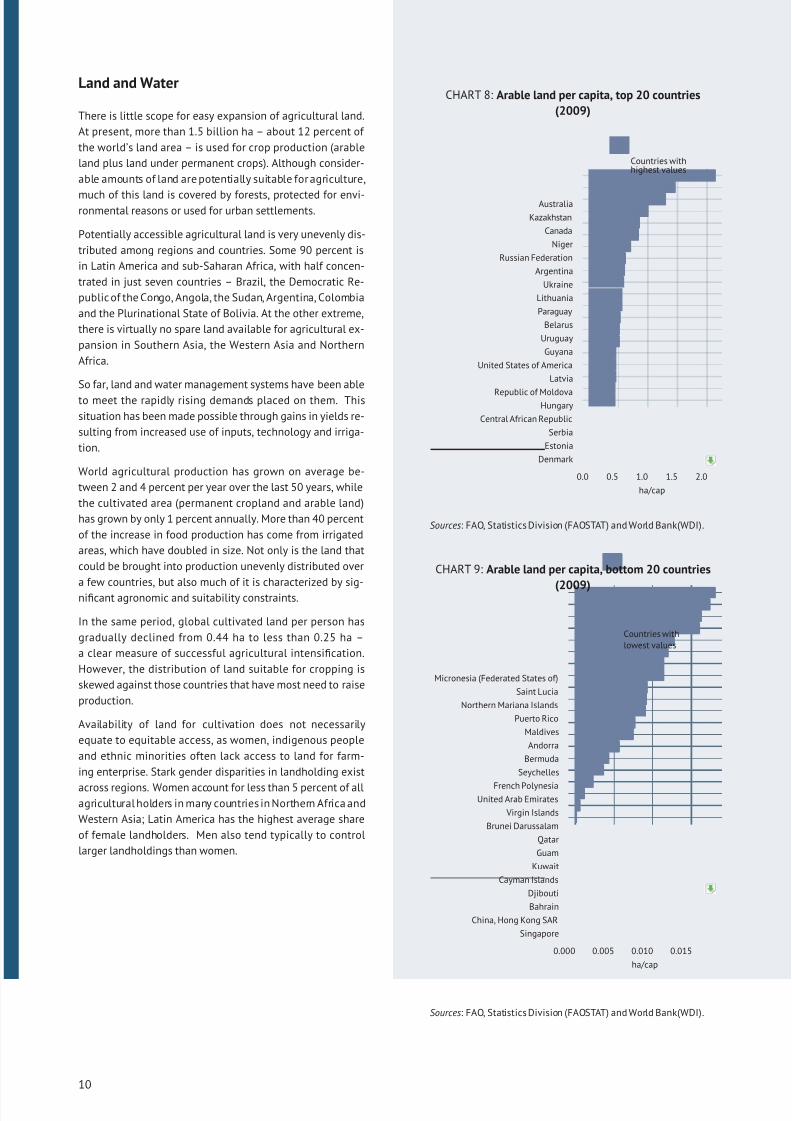
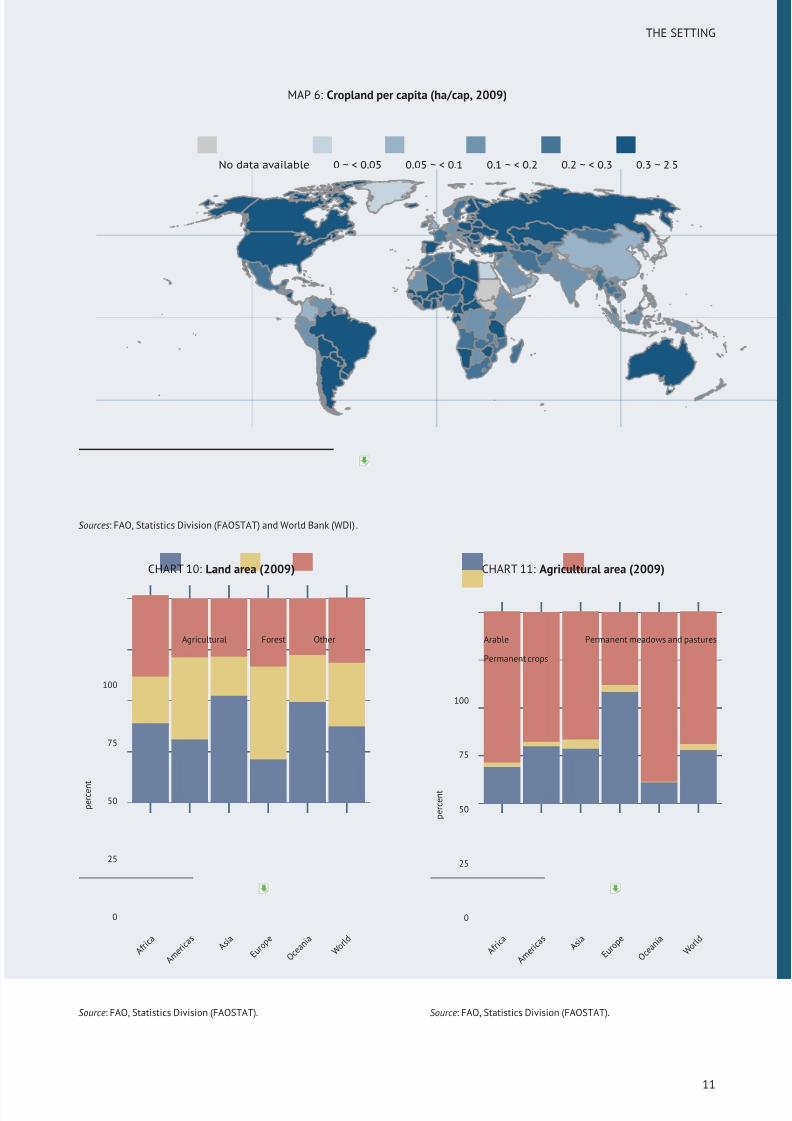
There is little scope for easy expansion of agricultural land.
At present, more than 1.5 billion ha – about 12 percent of
the world’s land area – is used for crop production (arable
land plus land under permanent crops). Although consider-
able amounts of land are potentially suitable for agriculture,
much of this land is covered by forests, protected for envi-ronmental reasons or used for urban settlements.
Potentially accessible agricultural land is very unevenly dis-
tributed among regions and countries. Some 90 percent is
in Latin America and sub-Saharan Africa, with half concen-
trated in just seven countries – Brazil, the Democratic Re-
public of the Congo, Angola, the Sudan, Argentina, Colombia
and the Plurinational State of Bolivia. At the other extreme,
there is virtually no spare land available for agricultural ex-
pansion in Southern Asia, the Western Asia and Northern
Africa.
So far, land and water management systems have been able
to meet the rapidly rising demands placed on them. This
situation has been made possible through gains in yields re-
sulting from increased use of inputs, technology and irriga-
tion.
World agricultural production has grown on average be-
tween 2 and 4 percent per year over the last 50 years, while
the cultivated area (permanent cropland and arable land)
has grown by only 1 percent annually. More than 40 percent
of the increase in food production has come from irrigated
areas, which have doubled in size. Not only is the land that
could be brought into production unevenly distributed over
a few countries, but also much of it is characterized by sig-
nificant agronomic and suitability constraints.
In the same period, global cultivated land per person has
gradually declined from 0.44 ha to less than 0.25 ha –
a clear measure of successful agricultural intensification.
However, the distribution of land suitable for cropping is
skewed against those countries that have most need to raise
production.
Availability of land for cultivation does not necessarily
equate to equitable access, as women, indigenous people
and ethnic minorities often lack access to land for farm-
ing enterprise. Stark gender disparities in landholding exist
across regions. Women account for less than 5 percent of allagricultural holders in many countries in Northern Africa and
Western Asia; Latin America has the highest average share
of female landholders. Men also tend typically to control
larger landholdings than women.
CHART 8: Arable land per capita, top 20 countries
(2009)
Denmark
Estonia
Serbia
Central African Republic
HungaryRepublic of Moldova
Latvia
United States of America
Guyana
Uruguay
Belarus
Paraguay
Lithuania
Ukraine
Argentina
Russian Federation
Niger
Canada
Kazakhstan
Australia
0.0 0.5 1.0 1.5 2.0
ha/cap
Countries withhighest values
Sources: FAO, Statistics Division (FAOSTAT) and World Bank(WDI).
CHART 9: Arable land per capita, bottom 20 countries
(2009)
Singapore
China, Hong Kong SAR
Bahrain
Djibouti
Cayman Islands
Kuwait
Guam
Qatar
Brunei Darussalam
Virgin Islands
United Arab EmiratesFrench Polynesia
Seychelles
Bermuda
Andorra
Maldives
Puerto Rico
Northern Mariana Islands
Saint Lucia
Micronesia (Federated States of)
0.000 0.005 0.010 0.015
ha/cap
Countries withlowest values
Sources: FAO, Statistics Division (FAOSTAT) and World Bank(WDI).
10
8/16/2019 Informe de la Fao 2013
http://slidepdf.com/reader/full/informe-de-la-fao-2013 29/307
8/16/2019 Informe de la Fao 2013
http://slidepdf.com/reader/full/informe-de-la-fao-2013 30/307
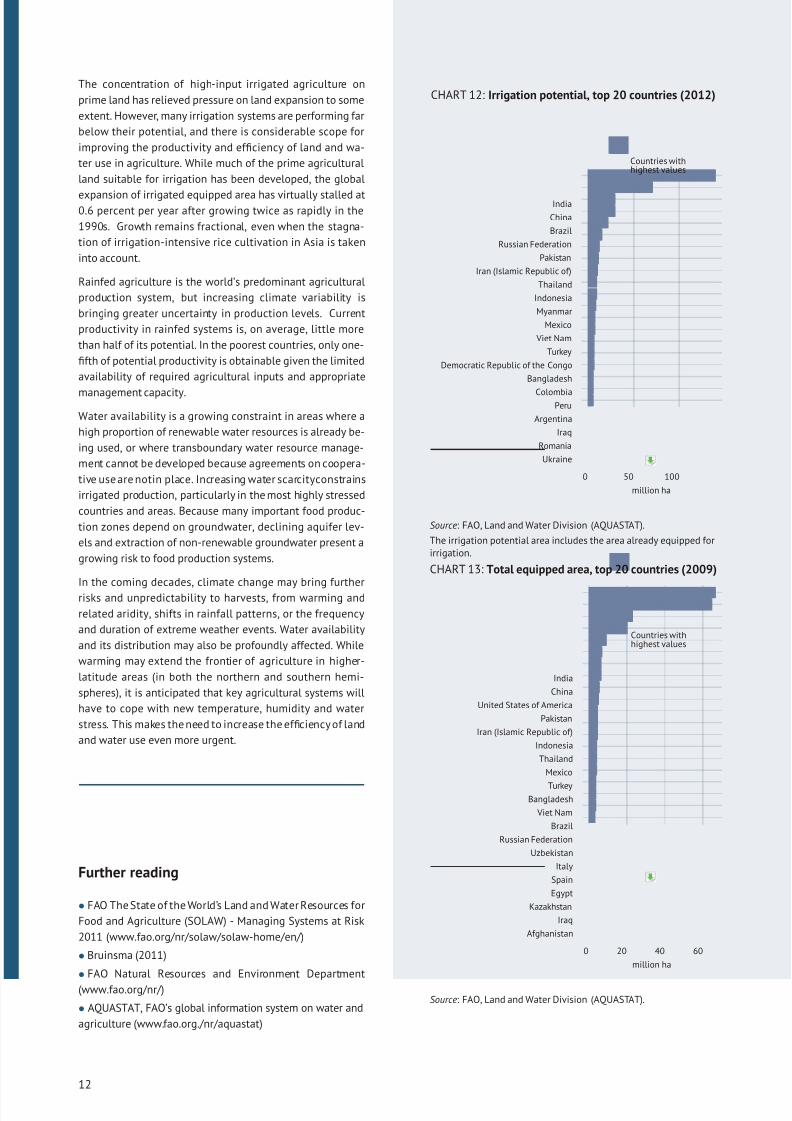
The concentration of high-input irrigated agriculture on
prime land has relieved pressure on land expansion to some
extent. However, many irrigation systems are performing far
below their potential, and there is considerable scope for
improving the productivity and efficiency of land and wa-
ter use in agriculture. While much of the prime agricultural
land suitable for irrigation has been developed, the global
expansion of irrigated equipped area has virtually stalled at0.6 percent per year after growing twice as rapidly in the
1990s. Growth remains fractional, even when the stagna-
tion of irrigation-intensive rice cultivation in Asia is taken
into account.
Rainfed agriculture is the world’s predominant agricultural
production system, but increasing climate variability is
bringing greater uncertainty in production levels. Current
productivity in rainfed systems is, on average, little more
than half of its potential. In the poorest countries, only one-
fifth of potential productivity is obtainable given the limited
availability of required agricultural inputs and appropriate
management capacity.
Water availability is a growing constraint in areas where a
high proportion of renewable water resources is already be-
ing used, or where transboundary water resource manage-
ment cannot be developed because agreements on coopera-
tive use are notin place. Increasing water scarcityconstrains
irrigated production, particularly in the most highly stressed
countries and areas. Because many important food produc-
tion zones depend on groundwater, declining aquifer lev-
els and extraction of non-renewable groundwater present a
growing risk to food production systems.
In the coming decades, climate change may bring further
risks and unpredictability to harvests, from warming and
related aridity, shifts in rainfall patterns, or the frequency
and duration of extreme weather events. Water availability
and its distribution may also be profoundly affected. While
warming may extend the frontier of agriculture in higher-
latitude areas (in both the northern and southern hemi-
spheres), it is anticipated that key agricultural systems will
have to cope with new temperature, humidity and water
stress. This makes the need to increase the efficiency of land
and water use even more urgent.
Further reading
• FAO The State of the World’s Land and Water Resources for
Food and Agriculture (SOLAW) - Managing Systems at Risk
2011 (www.fao.org/nr/solaw/solaw-home/en/)
• Bruinsma (2011)
• FAO Natural Resources and Environment Department
(www.fao.org/nr/)
• AQUASTAT, FAO’s global information system on water and
agriculture (www.fao.org./nr/aquastat)
CHART 12: Irrigation potential, top 20 countries (2012)
Ukraine
Romania
Iraq
Argentina
PeruColombia
Bangladesh
Democratic Republic of the Congo
Turkey
Viet Nam
Mexico
Myanmar
Indonesia
Thailand
Iran (Islamic Republic of)
Pakistan
Russian Federation
Brazil
China
India
0 50 100
million ha
Countries withhighest values
Source: FAO, Land and Water Division (AQUASTAT).
The irrigation potential area includes the area already equipped forirrigation.
CHART 13: Total equipped area, top 20 countries (2009)
Afghanistan
Iraq
Kazakhstan
Egypt
Spain
Italy
Uzbekistan
Russian Federation
Brazil
Viet Nam
BangladeshTurkey
Mexico
Thailand
Indonesia
Iran (Islamic Republic of)
Pakistan
United States of America
China
India
0 20 40 60
million ha
Countries withhighest values
Source: FAO, Land and Water Division (AQUASTAT).
12
8/16/2019 Informe de la Fao 2013
http://slidepdf.com/reader/full/informe-de-la-fao-2013 31/307
THE SETTING
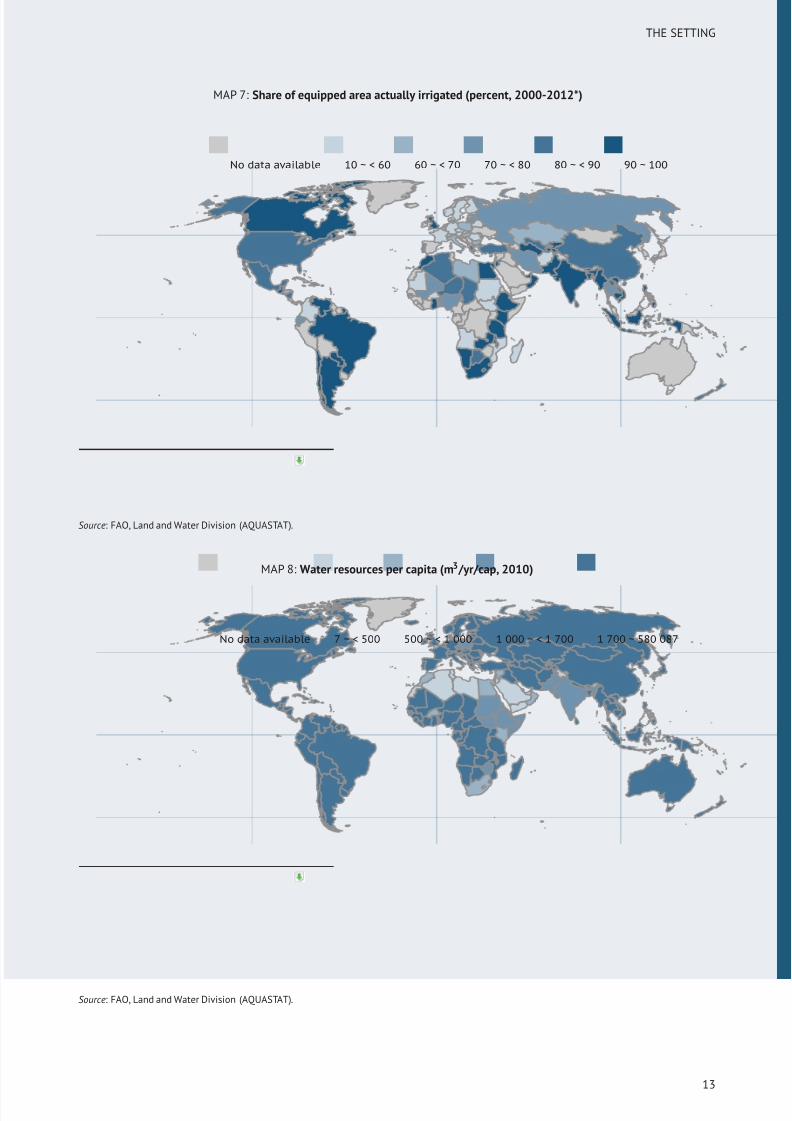
MAP 7: Share of equipped area actually irrigated (percent, 2000-2012*)
No data available 10 ~ < 60 60 ~ < 70 70 ~ < 80 80 ~ < 90 90 ~ 100
Source: FAO, Land and Water Division (AQUASTAT).
MAP 8: Water resources per capita (m3 /yr/cap, 2010)
No data available 7 ~ < 500 500 ~ < 1 000 1 000 ~ < 1 700 1 700 ~ 580 087
Source: FAO, Land and Water Division (AQUASTAT).
13
8/16/2019 Informe de la Fao 2013
http://slidepdf.com/reader/full/informe-de-la-fao-2013 32/307
Labour
In developing regions, employment growth is driven mostly
by demographic changes. The majority of workers do noten-
terinto formalwage employment but instead are engaged in
self-employment or unpaid family work, such as in agricul-
ture, especially subsistence farming. As a large share of the
working poor are involved in agriculture, developments in
this sector have a major impact on welfare throughout much
of the world. Nearly eight out of ten working poor with less
than US$1.25/day live in rural areas. This means that most
jobs in rural areas do not ensure sufficient levels of income
for workers to afford adequate food for themselves and their
families (ILO, 2012).
Labour force participation rates are usually highest in the
poorest countries. In these countries, low unemployment in
conjunction with high labour participation rates results in
large swathes of the population being engaged in vulner-
able employment and many people in working poverty. In
Southern Asia, the region with the highest vulnerable em-
ployment rate in 2011, 51 percent of workers were in the
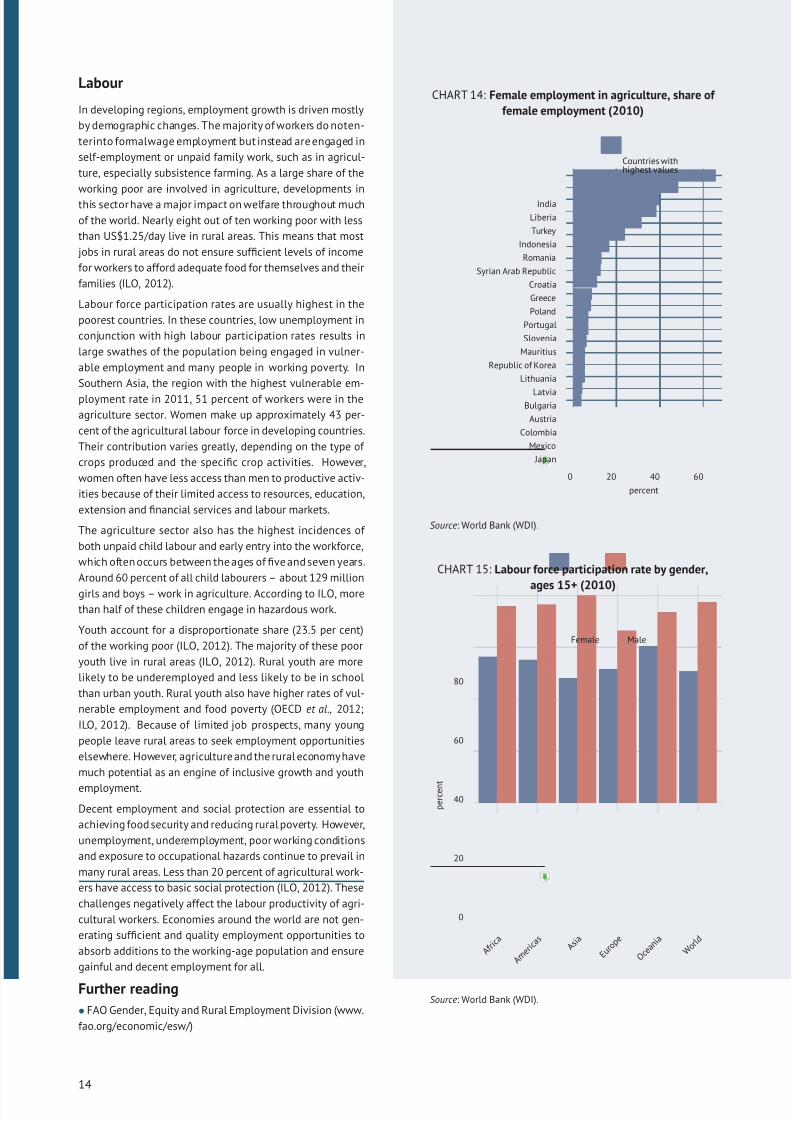
agriculture sector. Women make up approximately 43 per-
cent of the agricultural labour force in developing countries.
Their contribution varies greatly, depending on the type of
crops produced and the specific crop activities. However,
women often have less access than men to productive activ-
ities because of their limited access to resources, education,
extension and financial services and labour markets.
The agriculture sector also has the highest incidences of
both unpaid child labour and early entry into the workforce,
which often occurs between the ages of five and seven years.
Around 60 percent of all child labourers – about 129 million
girls and boys – work in agriculture. According to ILO, morethan half of these children engage in hazardous work.
Youth account for a disproportionate share (23.5 per cent)
of the working poor (ILO, 2012). The majority of these poor
youth live in rural areas (ILO, 2012). Rural youth are more
likely to be underemployed and less likely to be in school
than urban youth. Rural youth also have higher rates of vul-
nerable employment and food poverty (OECD et al., 2012;
ILO, 2012). Because of limited job prospects, many young
people leave rural areas to seek employment opportunities
elsewhere. However, agriculture and the rural economyhave
much potential as an engine of inclusive growth and youth
employment.
Decent employment and social protection are essential to
achieving food security and reducing rural poverty. However,
unemployment, underemployment, poor working conditions
and exposure to occupational hazards continue to prevail in
many rural areas. Less than 20 percent of agricultural work-
ers have access to basic social protection (ILO, 2012). These
challenges negatively affect the labour productivity of agri-
cultural workers. Economies around the world are not gen-
erating sufficient and quality employment opportunities to
absorb additions to the working-age population and ensure
gainful and decent employment for all.
Further reading
• FAO Gender, Equity and Rural Employment Division (www.
fao.org/economic/esw/ )
CHART 14: Female employment in agriculture, share of
female employment (2010)
Japan
Mexico
Colombia
Austria
BulgariaLatvia
Lithuania
Republic of Korea
Mauritius
Slovenia
Portugal
Poland
Greece
Croatia
Syrian Arab Republic
Romania
Indonesia
Turkey
Liberia
India
0 20 40 60
percent
Countries withhighest values
Source: World Bank (WDI).
CHART 15: Labour force participation rate by gender,
ages 15+ (2010)
0
20
40
60
80
A f r i c a
A m e r i c a s
A s i a
E u r o p e
O c e a n i a
W o r l d
p e r c e n t
Female Male
Source: World Bank (WDI).
14
8/16/2019 Informe de la Fao 2013
http://slidepdf.com/reader/full/informe-de-la-fao-2013 33/307
THE SETTING
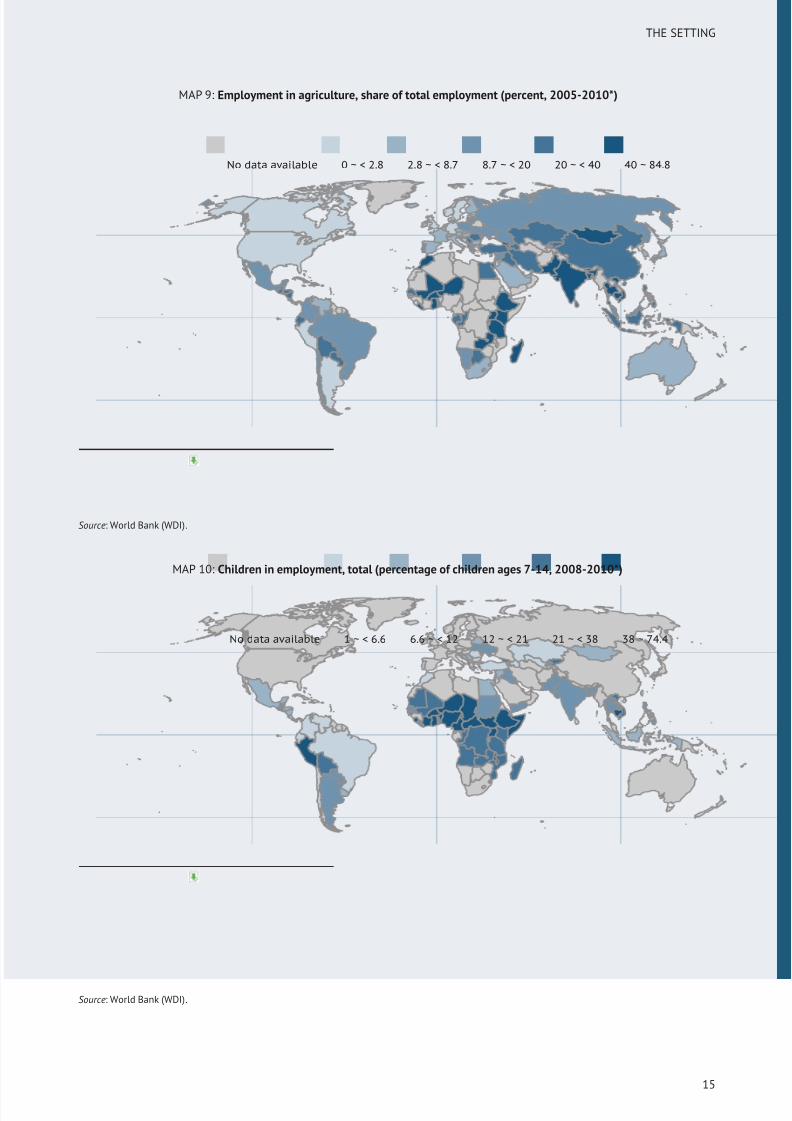
MAP 9: Employment in agriculture, share of total employment (percent, 2005-2010*)
No data available 0 ~ < 2.8 2.8 ~ < 8.7 8.7 ~ < 20 20 ~ < 40 40 ~ 84.8
Source: World Bank (WDI).
MAP 10: Children in employment, total (percentage of children ages 7-14, 2008-2010*)
No data available 1 ~ < 6.6 6.6 ~ < 12 12 ~ < 21 21 ~ < 38 38 ~ 74.4
Source: World Bank (WDI).
15
8/16/2019 Informe de la Fao 2013
http://slidepdf.com/reader/full/informe-de-la-fao-2013 34/307
Inputs
Throughout Asia and in parts of Latin America, expanding
seed and fertilizer use has been accompanied by invest-
ments in irrigation, rural roads, marketing infrastructure and
financial services, paving the way for dynamic commercial
input markets. Developing such markets is essential for agri-
cultural productivity growth. Where data gaps currently ex-ist, having more gender-disaggregated information for in-
puts could lead to more effective policies for achieving this
end.
Machinery is a major input in agriculture and can improve
efficiency. Agricultural tractors are generally wheel-and-
crawler or track-laying tractors (excluding garden tractors)
used in agriculture.
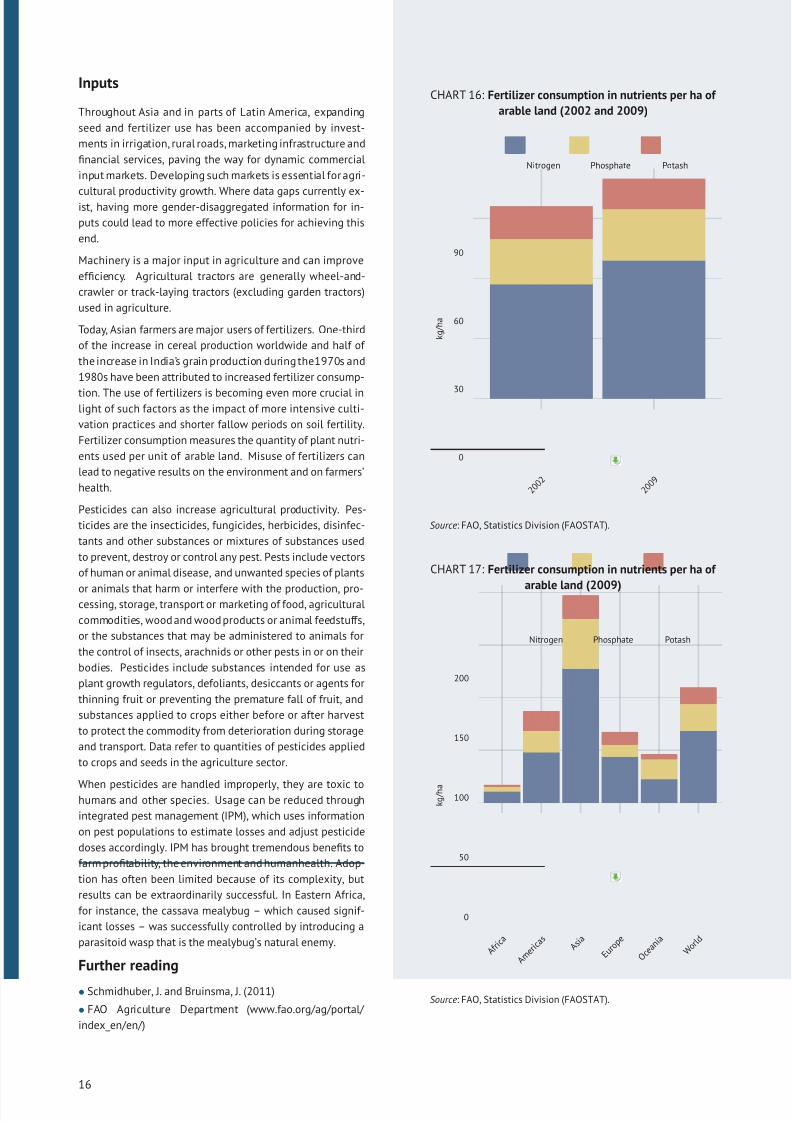
Today, Asian farmers are major users of fertilizers. One-third
of the increase in cereal production worldwide and half of
the increase in India’s grain production during the1970s and
1980s have been attributed to increased fertilizer consump-
tion. The use of fertilizers is becoming even more crucial inlight of such factors as the impact of more intensive culti-
vation practices and shorter fallow periods on soil fertility.
Fertilizer consumption measures the quantity of plant nutri-
ents used per unit of arable land. Misuse of fertilizers can
lead to negative results on the environment and on farmers’
health.
Pesticides can also increase agricultural productivity. Pes-
ticides are the insecticides, fungicides, herbicides, disinfec-
tants and other substances or mixtures of substances used
to prevent, destroy or control any pest. Pests include vectors
of human or animal disease, and unwanted species of plants
or animals that harm or interfere with the production, pro-cessing, storage, transport or marketing of food, agricultural
commodities, wood and wood products or animal feedstuffs,
or the substances that may be administered to animals for
the control of insects, arachnids or other pests in or on their
bodies. Pesticides include substances intended for use as
plant growth regulators, defoliants, desiccants or agents for
thinning fruit or preventing the premature fall of fruit, and
substances applied to crops either before or after harvest
to protect the commodity from deterioration during storage
and transport. Data refer to quantities of pesticides applied
to crops and seeds in the agriculture sector.
When pesticides are handled improperly, they are toxic tohumans and other species. Usage can be reduced through
integrated pest management (IPM), which uses information
on pest populations to estimate losses and adjust pesticide
doses accordingly. IPM has brought tremendous benefits to
farm profitability, the environment and humanhealth. Adop-
tion has often been limited because of its complexity, but
results can be extraordinarily successful. In Eastern Africa,
for instance, the cassava mealybug – which caused signif-
icant losses – was successfully controlled by introducing a
parasitoid wasp that is the mealybug’s natural enemy.
Further reading
• Schmidhuber, J. and Bruinsma, J. (2011)
• FAO Agriculture Department (www.fao.org/ag/portal/
index_en/en/ )
CHART 16: Fertilizer consumption in nutrients per ha of
arable land (2002 and 2009)
0
30
60
90
2 0 0 2
2 0 0 9
k g / h a
Nitrogen Phosphate Potash
Source: FAO, Statistics Division (FAOSTAT).
CHART 17: Fertilizer consumption in nutrients per ha of
arable land (2009)
0
50
100
150
200
A f r i c a
A m e r i c a s
A s i a
E u r o p e
O c e a n i a
W o r l d
k g / h a
Nitrogen Phosphate Potash
Source: FAO, Statistics Division (FAOSTAT).
16
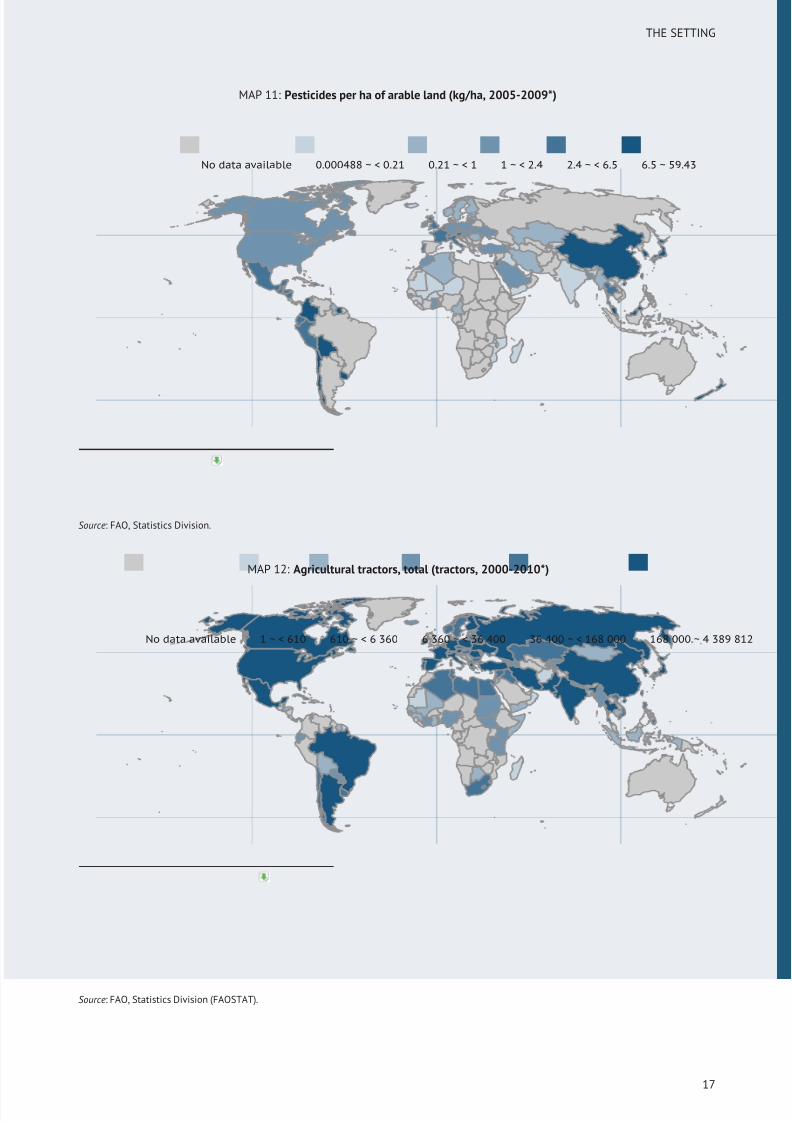
8/16/2019 Informe de la Fao 2013
http://slidepdf.com/reader/full/informe-de-la-fao-2013 35/307
THE SETTING
MAP 11: Pesticides per ha of arable land (kg/ha, 2005-2009*)
No data available 0.000488 ~ < 0.21 0.21 ~ < 1 1 ~ < 2.4 2.4 ~ < 6.5 6.5 ~ 59.43
Source: FAO, Statistics Division.
MAP 12: Agricultural tractors, total (tractors, 2000-2010*)
No data available 1 ~ < 610 610 ~ < 6 360 6 360 ~ < 36 400 36 400 ~ < 168 000 168 000 ~ 4 389 812
Source: FAO, Statistics Division (FAOSTAT).
17
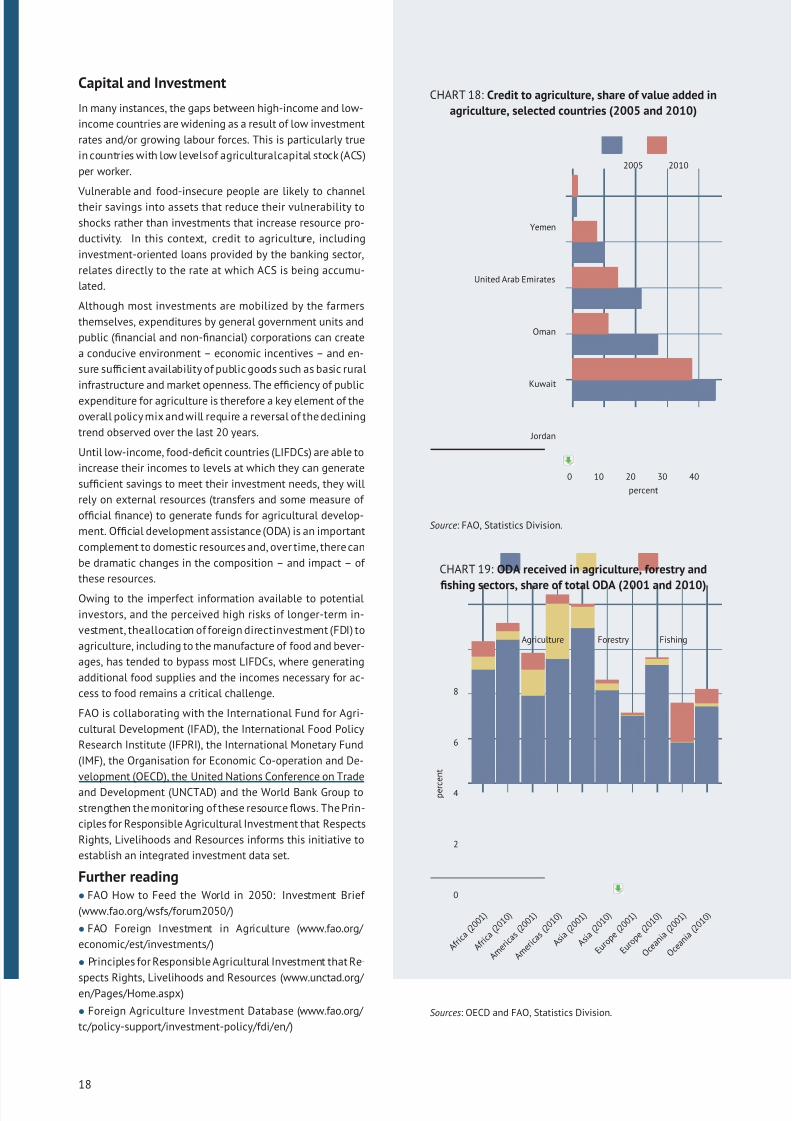
8/16/2019 Informe de la Fao 2013
http://slidepdf.com/reader/full/informe-de-la-fao-2013 36/307
Capital and Investment
In many instances, the gaps between high-income and low-
income countries are widening as a result of low investment
rates and/or growing labour forces. This is particularly true
in countries with low levelsof agriculturalcapital stock (ACS)
per worker.
Vulnerable and food-insecure people are likely to channeltheir savings into assets that reduce their vulnerability to
shocks rather than investments that increase resource pro-
ductivity. In this context, credit to agriculture, including
investment-oriented loans provided by the banking sector,
relates directly to the rate at which ACS is being accumu-
lated.
Although most investments are mobilized by the farmers
themselves, expenditures by general government units and
public (financial and non-financial) corporations can create
a conducive environment – economic incentives – and en-
sure sufficient availability of public goods such as basic rural
infrastructure and market openness. The efficiency of public
expenditure for agriculture is therefore a key element of the
overall policy mix and will require a reversal of the declining
trend observed over the last 20 years.
Until low-income, food-deficit countries (LIFDCs) are able to
increase their incomes to levels at which they can generate
sufficient savings to meet their investment needs, they will
rely on external resources (transfers and some measure of
official finance) to generate funds for agricultural develop-
ment. Official development assistance (ODA) is an important
complement to domestic resources and, over time, there can
be dramatic changes in the composition – and impact – of
these resources.
Owing to the imperfect information available to potential
investors, and the perceived high risks of longer-term in-
vestment, theallocation of foreign directinvestment (FDI) to
agriculture, including to the manufacture of food and bever-
ages, has tended to bypass most LIFDCs, where generating
additional food supplies and the incomes necessary for ac-
cess to food remains a critical challenge.
FAO is collaborating with the International Fund for Agri-
cultural Development (IFAD), the International Food Policy
Research Institute (IFPRI), the International Monetary Fund
(IMF), the Organisation for Economic Co-operation and De-
velopment (OECD), the United Nations Conference on Trade
and Development (UNCTAD) and the World Bank Group to
strengthen the monitoring of these resource flows. The Prin-
ciples for Responsible Agricultural Investment that Respects
Rights, Livelihoods and Resources informs this initiative to
establish an integrated investment data set.
Further reading• FAO How to Feed the World in 2050: Investment Brief
(www.fao.org/wsfs/forum2050/)
• FAO Foreign Investment in Agriculture (www.fao.org/
economic/est/investments/)
• Principles for Responsible Agricultural Investment that Re-
spects Rights, Livelihoods and Resources (www.unctad.org/ en/Pages/Home.aspx)
• Foreign Agriculture Investment Database (www.fao.org/
tc/policy-support/investment-policy/fdi/en/)
CHART 18: Credit to agriculture, share of value added in
agriculture, selected countries (2005 and 2010)
Jordan
Kuwait
Oman
United Arab Emirates
Yemen
0 10 20 30 40
percent
2005 2010
Source: FAO, Statistics Division.
CHART 19: ODA received in agriculture, forestry and
fishing sectors, share of total ODA (2001 and 2010)
0
2
4
6
8
A f r i c a ( 2 0 0 1 )
A f r i c a ( 2 0 1 0 )
A m e r i c a s ( 2 0 0 1 )
A m e r i c a s ( 2 0 1 0 )
A s i a ( 2 0 0 1 )
A s i a ( 2 0 1 0 )
E u r o p e
( 2 0 0 1 )
E u r o p e
( 2 0 1 0 )
O c e a n i a
( 2 0 0 1 )
O c e a n i a
( 2 0 1 0 )
p e r c
e n t
Agriculture Forestry Fishing
Sources: OECD and FAO, Statistics Division.
18
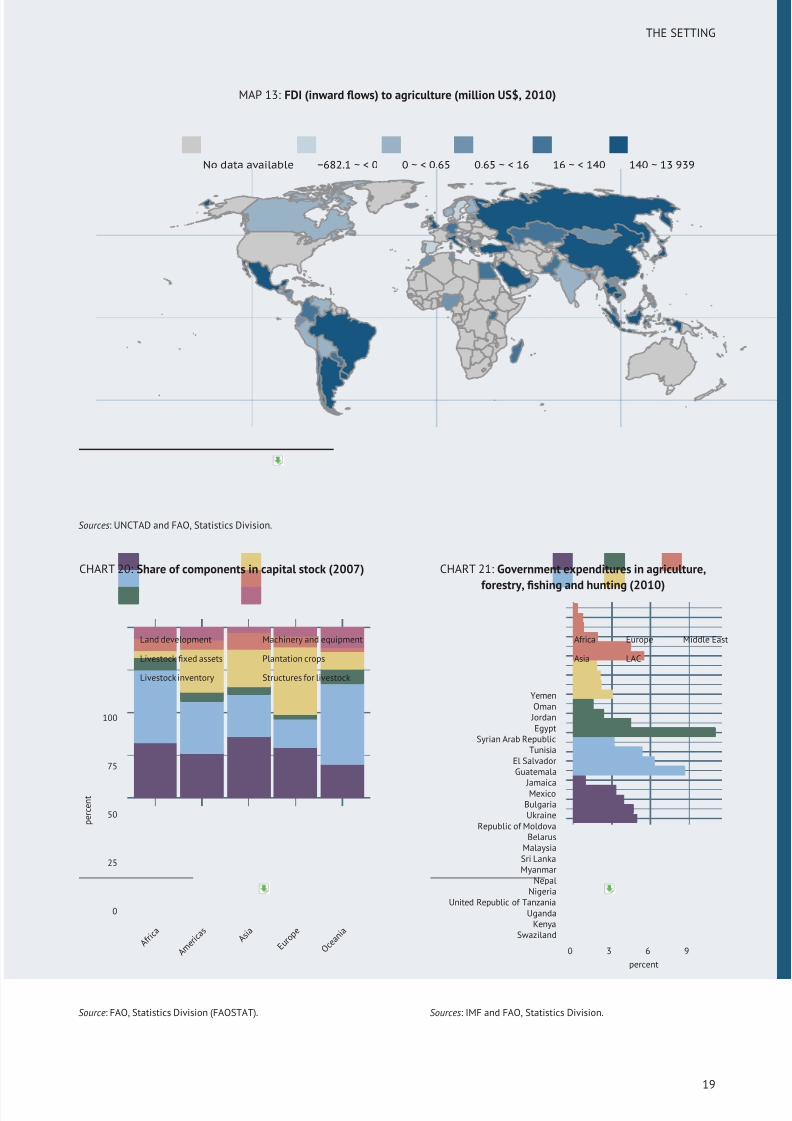
8/16/2019 Informe de la Fao 2013
http://slidepdf.com/reader/full/informe-de-la-fao-2013 37/307
THE SETTING
MAP 13: FDI (inward flows) to agriculture (million US$, 2010)
No data available −682.1 ~ < 0 0 ~ < 0.65 0.65 ~ < 16 16 ~ < 140 140 ~ 13 939
Sources: UNCTAD and FAO, Statistics Division.
CHART 20: Share of components in capital stock (2007)
0
25
50
75
100
A f r i c a
A m e r i c a s
A s i a
E u r o p e
O c e a n i a
p e r c e n t
Land development
Livestock fixed assets
Livestock inventory
Machinery and equipment
Plantation crops
Structures for livestock
Source: FAO, Statistics Division (FAOSTAT).
CHART 21: Government expenditures in agriculture,
forestry, fishing and hunting (2010)
SwazilandKenya
UgandaUnited Republic of Tanzania
NigeriaNepal
MyanmarSri LankaMalaysia
BelarusRepublic of Moldova
UkraineBulgaria
Mexico Jamaica
GuatemalaEl Salvador
TunisiaSyrian Arab Republic
Egypt JordanOman
Yemen
0 3 6 9
percent
Africa
Asia
Europe
LAC
Middle East
Sources: IMF and FAO, Statistics Division.
19
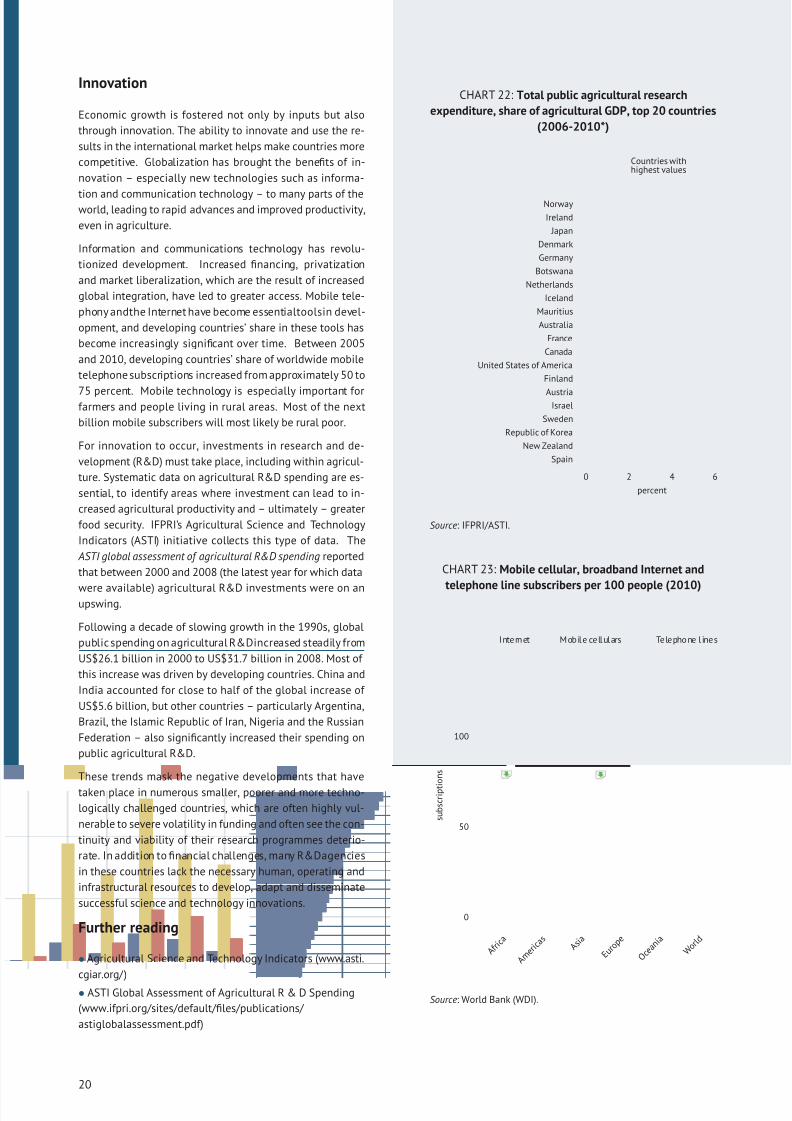
8/16/2019 Informe de la Fao 2013
http://slidepdf.com/reader/full/informe-de-la-fao-2013 38/307
Innovation
Economic growth is fostered not only by inputs but also
through innovation. The ability to innovate and use the re-
sults in the international market helps make countries more
competitive. Globalization has brought the benefits of in-
novation – especially new technologies such as informa-
tion and communication technology – to many parts of theworld, leading to rapid advances and improved productivity,
even in agriculture.
Information and communications technology has revolu-
tionized development. Increased financing, privatization
and market liberalization, which are the result of increased
global integration, have led to greater access. Mobile tele-
phony andthe Internet have become essentialtoolsin devel-
opment, and developing countries’ share in these tools has
become increasingly significant over time. Between 2005
and 2010, developing countries’ share of worldwide mobile
telephone subscriptions increased from approximately 50 to
75 percent. Mobile technology is especially important forfarmers and people living in rural areas. Most of the next
billion mobile subscribers will most likely be rural poor.
For innovation to occur, investments in research and de-
velopment (R&D) must take place, including within agricul-
ture. Systematic data on agricultural R&D spending are es-
sential, to identify areas where investment can lead to in-
creased agricultural productivity and – ultimately – greater
food security. IFPRI’s Agricultural Science and Technology
Indicators (ASTI) initiative collects this type of data. The
ASTI global assessment of agricultural R&D spending reported
that between 2000 and 2008 (the latest year for which data
were available) agricultural R&D investments were on anupswing.
Following a decade of slowing growth in the 1990s, global
public spending on agricultural R&Dincreased steadily from
US$26.1 billion in 2000 to US$31.7 billion in 2008. Most of
this increase was driven by developing countries. China and
India accounted for close to half of the global increase of
US$5.6 billion, but other countries – particularly Argentina,
Brazil, the Islamic Republic of Iran, Nigeria and the Russian
Federation – also significantly increased their spending on
public agricultural R&D.
These trends mask the negative developments that have
taken place in numerous smaller, poorer and more techno-
logically challenged countries, which are often highly vul-
nerable to severe volatility in funding and often see the con-
tinuity and viability of their research programmes deterio-
rate. In addition to financial challenges, many R&Dagencies
in these countries lack the necessary human, operating and
infrastructural resources to develop, adapt and disseminate
successful science and technology innovations.
Further reading
• Agricultural Science and Technology Indicators (www.asti.
cgiar.org/ )
• ASTI Global Assessment of Agricultural R & D Spending
(www.ifpri.org/sites/default/files/publications/
astiglobalassessment.pdf)
CHART 22: Total public agricultural research
expenditure, share of agricultural GDP, top 20 countries
(2006-2010*)
Spain
New Zealand
Republic of Korea
Sweden
IsraelAustria
Finland
United States of America
Canada
France
Australia
Mauritius
Iceland
Netherlands
Botswana
Germany
Denmark
Japan
Ireland
Norway
0 2 4 6
percent
Countries withhighest values
Source: IFPRI/ASTI.
CHART 23: Mobile cellular, broadband Internet and
telephone line subscribers per 100 people (2010)
0
50
100
A f r i c a
A m e r i c a s
A s i a
E u r o p e
O c e a n i a
W o r l d
s u b s c r i p t i
o n s
Internet Mobile cellulars Telephone l ines
Source: World Bank (WDI).
20
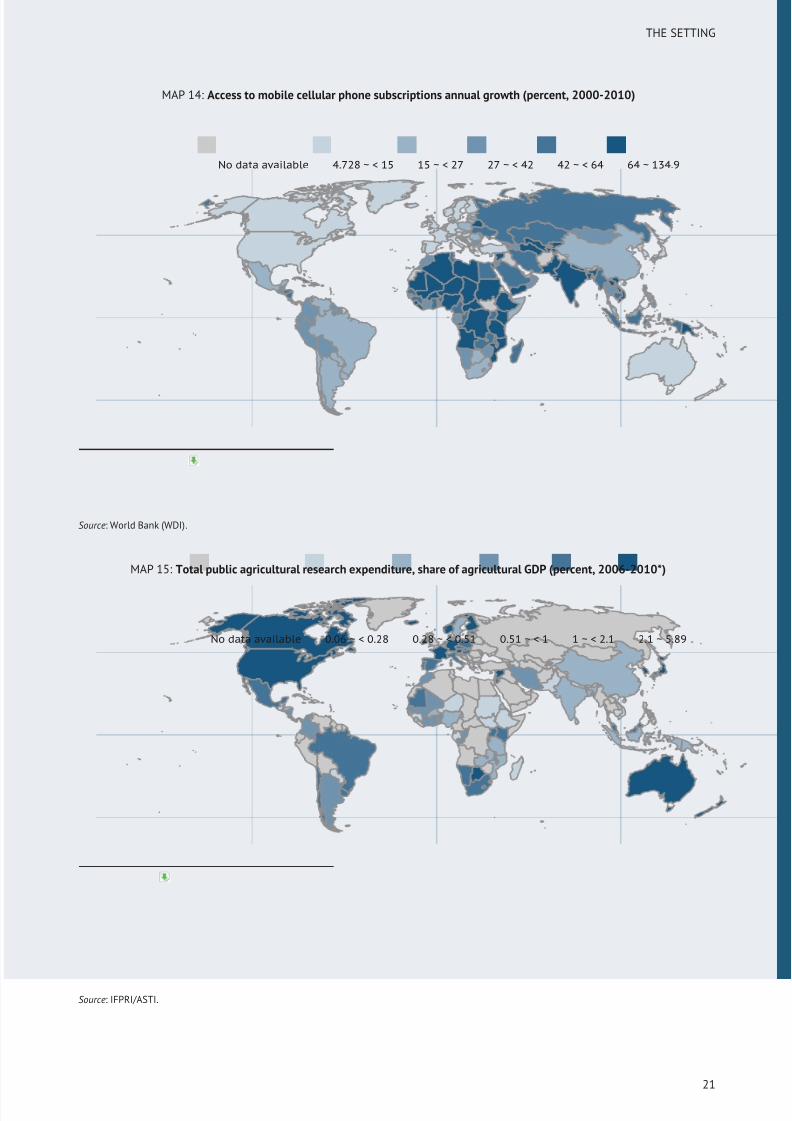
8/16/2019 Informe de la Fao 2013
http://slidepdf.com/reader/full/informe-de-la-fao-2013 39/307
THE SETTING
MAP 14: Access to mobile cellular phone subscriptions annual growth (percent, 2000-2010)
No data available 4.728 ~ < 15 15 ~ < 27 27 ~ < 42 42 ~ < 64 64 ~ 134.9
Source: World Bank (WDI).
MAP 15: Total public agricultural research expenditure, share of agricultural GDP (percent, 2006-2010*)
No data available 0.06 ~ < 0.28 0.28 ~ < 0.51 0.51 ~ < 1 1 ~ < 2.1 2.1 ~ 5.89
Source: IFPRI/ASTI.
21
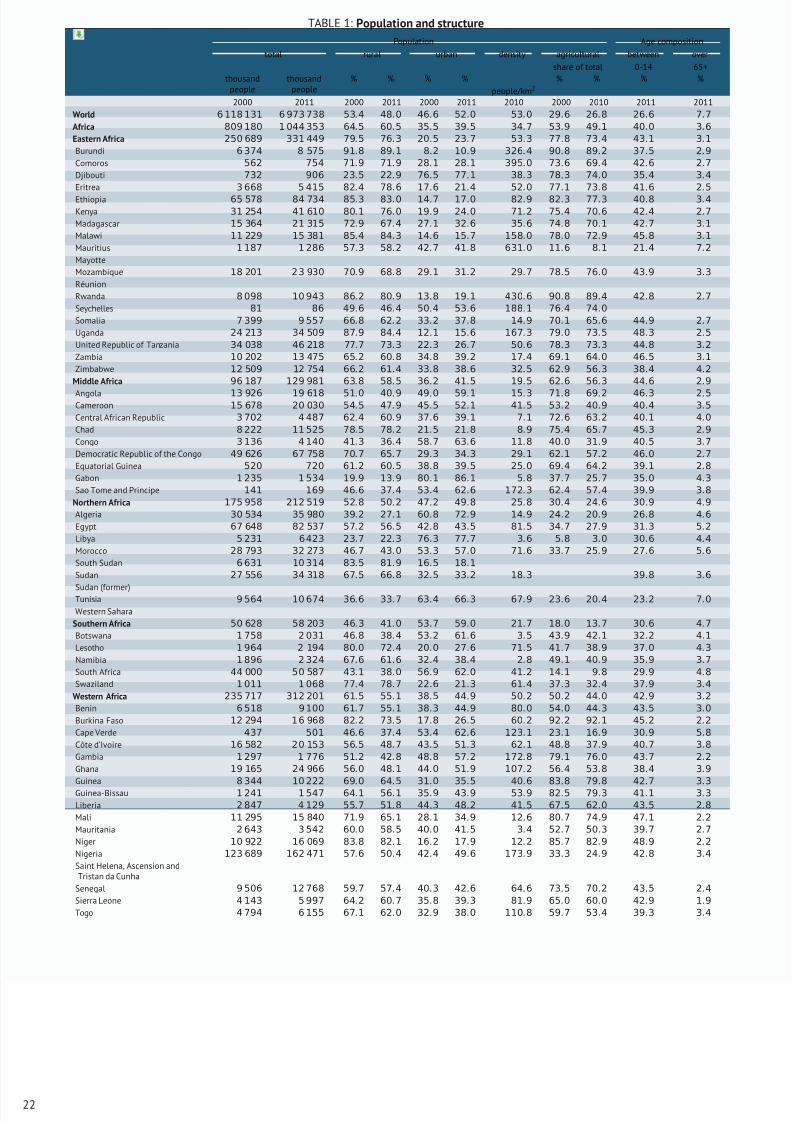
8/16/2019 Informe de la Fao 2013
http://slidepdf.com/reader/full/informe-de-la-fao-2013 40/307
TABLE 1: Population and structure
Population Age composition
total rural urban density agricultural between over
share of total 0-14 65+thousand
peoplethousand
people% % % %
people/km2
% % % %
2000 2011 2000 2011 2000 2011 2010 2000 2010 2011 2011
World 6 118 131 6 973 738 53.4 48.0 46.6 52.0 53.0 29.6 26.8 26.6 7.7
Africa 809 180 1 044 353 64.5 60.5 35.5 39.5 34.7 53.9 49.1 40.0 3.6
Eastern Africa 250 689 331 449 79.5 76.3 20.5 23.7 53.3 77.8 73.4 43.1 3.1
Burundi 6 374 8 575 91.8 89.1 8.2 10.9 326.4 90.8 89.2 37.5 2.9
Comoros 562 754 71.9 71.9 28.1 28.1 395.0 73.6 69.4 42.6 2.7
Djibouti 732 906 23.5 22.9 76.5 77.1 38.3 78.3 74.0 35.4 3.4
Eritrea 3 668 5 415 82.4 78.6 17.6 21.4 52.0 77.1 73.8 41.6 2.5
Ethiopia 65 578 84 734 85.3 83.0 14.7 17.0 82.9 82.3 77.3 40.8 3.4
Kenya 31 254 41 610 80.1 76.0 19.9 24.0 71.2 75.4 70.6 42.4 2.7
Madagascar 15 364 21 315 72.9 67.4 27.1 32.6 35.6 74.8 70.1 42.7 3.1
Malawi 11 229 15 381 85.4 84.3 14.6 15.7 158.0 78.0 72.9 45.8 3.1
Mauritius 1 187 1 286 57.3 58.2 42.7 41.8 631.0 11.6 8.1 21.4 7.2
Mayotte
Mozambique 18 201 2 3 930 70.9 68.8 29.1 31.2 29.7 78.5 76.0 43.9 3.3
Réunion
Rwanda 8 098 10 943 86.2 80.9 13.8 19.1 430.6 90.8 89.4 42.8 2.7
Seychelles 81 86 49.6 46.4 50.4 53.6 188.1 76.4 74.0
Somalia 7 399 9 557 66.8 62.2 33.2 37.8 14.9 70.1 65.6 44.9 2.7
Uganda 24 213 34 509 87.9 84.4 12.1 15.6 167.3 79.0 73.5 48.3 2.5
United Republic of Tanzania 34 038 46 218 77.7 73.3 22.3 26.7 50.6 78.3 73.3 44.8 3.2
Zambia 10 202 13 475 65.2 60.8 34.8 39.2 17.4 69.1 64.0 46.5 3.1
Zimbabwe 12 509 12 754 66.2 61.4 33.8 38.6 32.5 62.9 56.3 38.4 4.2
Middle Africa 96 187 129 981 63.8 58.5 36.2 41.5 19.5 62.6 56.3 44.6 2.9
Angola 13 926 19 618 51.0 40.9 49.0 59.1 15.3 71.8 69.2 46.3 2.5Cameroon 15 678 20 030 54.5 47.9 45.5 52.1 41.5 53.2 40.9 40.4 3.5
Central African Republic 3 702 4 487 62.4 60.9 37.6 39.1 7.1 72.6 63.2 40.1 4.0
Chad 8 222 11 525 78.5 78.2 21.5 21.8 8.9 75.4 65.7 45.3 2.9
Congo 3 136 4 140 41.3 36.4 58.7 63.6 11.8 40.0 31.9 40.5 3.7
Democratic Republic of the Congo 49 626 67 758 70.7 65.7 29.3 34.3 29.1 62.1 57.2 46.0 2.7
Equatorial Guinea 520 720 61.2 60.5 38.8 39.5 25.0 69.4 64.2 39.1 2.8
Gabon 1 235 1 534 19.9 13.9 80.1 86.1 5.8 37.7 25.7 35.0 4.3
Sao Tome and Principe 141 169 46.6 37.4 53.4 62.6 172.3 62.4 57.4 39.9 3.8
Northern Africa 175 958 212 519 52.8 50.2 47.2 49.8 25.8 30.4 24.6 30.9 4.9
Algeria 30 534 35 980 39.2 27.1 60.8 72.9 14.9 24.2 20.9 26.8 4.6
Egypt 67 648 82 537 57.2 56.5 42.8 43.5 81.5 34.7 27.9 31.3 5.2
Libya 5 231 6 423 23.7 22.3 76.3 77.7 3.6 5.8 3.0 30.6 4.4
Morocco 28 793 32 273 46.7 43.0 53.3 57.0 71.6 33.7 25.9 27.6 5.6
South Sudan 6 631 10 314 83.5 81.9 16.5 18.1
Sudan 27 556 34 318 67.5 66.8 32.5 33.2 18.3 39.8 3.6
Sudan (former)Tunisia 9 564 10 674 36.6 33.7 63.4 66.3 67.9 23.6 20.4 23.2 7.0
Western Sahara
Southern Africa 50 628 58 203 46.3 41.0 53.7 59.0 21.7 18.0 13.7 30.6 4.7
Botswana 1 758 2 031 46.8 38.4 53.2 61.6 3.5 43.9 42.1 32.2 4.1
Lesotho 1 964 2 194 80.0 72.4 20.0 27.6 71.5 41.7 38.9 37.0 4.3
Namibia 1 896 2 324 67.6 61.6 32.4 38.4 2.8 49.1 40.9 35.9 3.7
South Africa 44 000 50 587 43.1 38.0 56.9 62.0 41.2 14.1 9.8 29.9 4.8
Swaziland 1 011 1 068 77.4 78.7 22.6 21.3 61.4 37.3 32.4 37.9 3.4
Western Africa 235 717 312 201 61.5 55.1 38.5 44.9 50.2 50.2 44.0 42.9 3.2
Benin 6 518 9 100 61.7 55.1 38.3 44.9 80.0 54.0 44.3 43.5 3.0
Burkina Faso 12 294 1 6 968 82.2 73.5 17.8 26.5 60.2 92.2 92.1 45.2 2.2
Cape Verde 437 501 46.6 37.4 53.4 62.6 123.1 23.1 16.9 30.9 5.8
Côte d’Ivoire 16 582 20 153 56.5 48.7 43.5 51.3 62.1 48.8 37.9 40.7 3.8
Gambia 1 297 1 776 51.2 42.8 48.8 57.2 172.8 79.1 76.0 43.7 2.2
Ghana 19 165 24 966 56.0 48.1 44.0 51.9 107.2 56.4 53.8 38.4 3.9
Guinea 8 344 10 222 69
.0 64
.5 31
.0 35
.5 40
.6 83
.8 79
.8 42
.7 3
.3
Guinea-Bissau 1 241 1 547 64.1 56.1 35.9 43.9 53.9 82.5 79.3 41.1 3.3
Liberia 2 847 4 129 55.7 51.8 44.3 48.2 41.5 67.5 62.0 43.5 2.8
Mali 11 295 15 840 71.9 65.1 28.1 34.9 12.6 80.7 74.9 47.1 2.2
Mauritania 2 643 3 542 60.0 58.5 40.0 41.5 3.4 52.7 50.3 39.7 2.7
Niger 10 922 16 069 83.8 82.1 16.2 17.9 12.2 85.7 82.9 48.9 2.2
Nigeria 123 689 162 471 57.6 50.4 42.4 49.6 173.9 33.3 24.9 42.8 3.4
Saint Helena, Ascension andTristan da Cunha
Senegal 9 506 12 768 59.7 57.4 40.3 42.6 64.6 73.5 70.2 43.5 2.4
Sierra Leone 4 143 5 997 64.2 60.7 35.8 39.3 81.9 65.0 60.0 42.9 1.9
Togo 4 794 6 155 67.1 62.0 32.9 38.0 110.8 59.7 53.4 39.3 3.4
22
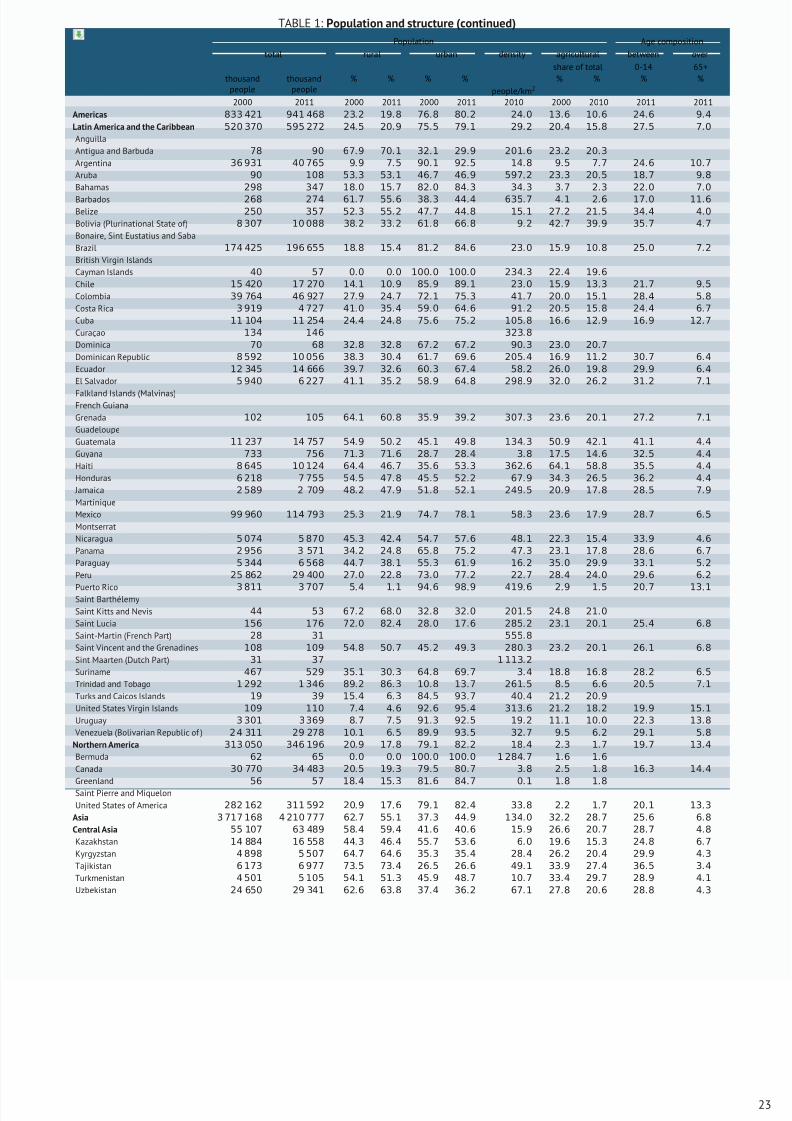
8/16/2019 Informe de la Fao 2013
http://slidepdf.com/reader/full/informe-de-la-fao-2013 41/307
TABLE 1: Population and structure (continued)
Population Age composition
total rural urban density agricultural between over
share of total 0-14 65+thousand
peoplethousand
people% % % %
people/km2
% % % %
2000 2011 2000 2011 2000 2011 2010 2000 2010 2011 2011
Americas 833 421 941 468 23.2 19.8 76.8 80.2 24.0 13.6 10.6 24.6 9.4
Latin America and the Caribbean 520 370 595 272 24.5 20.9 75.5 79.1 29.2 20.4 15.8 27.5 7.0
Anguilla
Antigua and Barbuda 78 90 67.9 70.1 32.1 29.9 201.6 23.2 20.3
Argentina 36 931 40 765 9.9 7.5 90.1 92.5 14.8 9.5 7.7 24.6 10.7
Aruba 90 108 53.3 53.1 46.7 46.9 597.2 23.3 20.5 18.7 9.8
Bahamas 298 347 18.0 15.7 82.0 84.3 34.3 3.7 2.3 22.0 7.0
Barbados 268 274 61.7 55.6 38.3 44.4 635.7 4.1 2.6 17.0 11.6
Belize 250 357 52.3 55.2 47.7 44.8 15.1 27.2 21.5 34.4 4.0
Bolivia (Plurinational State of) 8 307 10 088 38.2 33.2 61.8 66.8 9.2 42.7 39.9 35.7 4.7
Bonaire, Sint Eustatius and Saba
Brazil 174 425 196 655 18.8 15.4 81.2 84.6 23.0 15.9 10.8 25.0 7.2
British Virgin Islands
Cayman Islands 40 57 0.0 0.0 100.0 100.0 234.3 22.4 19.6
Chile 15 420 17 270 14.1 10.9 85.9 89.1 23.0 15.9 13.3 21.7 9.5
Colombia 39 764 46 927 27.9 24.7 72.1 75.3 41.7 20.0 15.1 28.4 5.8
Costa Rica 3 919 4 727 41.0 35.4 59.0 64.6 91.2 20.5 15.8 24.4 6.7
Cuba 11 104 11 254 24.4 24.8 75.6 75.2 105.8 16.6 12.9 16.9 12.7
Curaçao 134 146 323.8
Dominica 70 68 32.8 32.8 67.2 67.2 90.3 23.0 20.7
Dominican Republic 8 592 10 056 38.3 30.4 61.7 69.6 205.4 16.9 11.2 30.7 6.4
Ecuador 12 345 14 666 39.7 32.6 60.3 67.4 58.2 26.0 19.8 29.9 6.4
El Salvador 5 940 6 227 41.1 35.2 58.9 64.8 298.9 32.0 26.2 31.2 7.1
Falkland Islands (Malvinas)French Guiana
Grenada 102 105 64.1 60.8 35.9 39.2 307.3 23.6 20.1 27.2 7.1
Guadeloupe
Guatemala 11 237 14 757 54.9 50.2 45.1 49.8 134.3 50.9 42.1 41.1 4.4
Guyana 733 756 71.3 71.6 28.7 28.4 3.8 17.5 14.6 32.5 4.4
Haiti 8 645 10 124 64.4 46.7 35.6 53.3 362.6 64.1 58.8 35.5 4.4
Honduras 6 218 7 755 54.5 47.8 45.5 52.2 67.9 34.3 26.5 36.2 4.4
Jamaica 2 589 2 709 48.2 47.9 51.8 52.1 249.5 20.9 17.8 28.5 7.9
Martinique
Mexico 99 960 114 793 25.3 21.9 74.7 78.1 58.3 23.6 17.9 28.7 6.5
Montserrat
Nicaragua 5 074 5 870 45.3 42.4 54.7 57.6 48.1 22.3 15.4 33.9 4.6
Panama 2 956 3 571 34.2 24.8 65.8 75.2 47.3 23.1 17.8 28.6 6.7
Paraguay 5 344 6 568 44.7 38.1 55.3 61.9 16.2 35.0 29.9 33.1 5.2
Peru 25 862 29 400 27.0 22.8 73.0 77.2 22.7 28.4 24.0 29.6 6.2
Puerto Rico 3 811 3 707 5.4 1.1 94.6 98.9 419.6 2.9 1.5 20.7 13.1Saint Barthélemy
Saint Kitts and Nevis 44 53 67.2 68.0 32.8 32.0 201.5 24.8 21.0
Saint Lucia 156 176 72.0 82.4 28.0 17.6 285.2 23.1 20.1 25.4 6.8
Saint-Martin (French Part) 28 31 555.8
Saint Vincent and the Grenadines 108 109 54.8 50.7 45.2 49.3 280.3 23.2 20.1 26.1 6.8
Sint Maarten (Dutch Part) 31 37 1 113.2
Suriname 467 529 35.1 30.3 64.8 69.7 3.4 18.8 16.8 28.2 6.5
Trinidad and Tobago 1 292 1 346 89.2 86.3 10.8 13.7 261.5 8.5 6.6 20.5 7.1
Turks and Caicos Islands 19 39 15.4 6.3 84.5 93.7 40.4 21.2 20.9
United States Virgin Islands 109 110 7.4 4.6 92.6 95.4 313.6 21.2 18.2 19.9 15.1
Uruguay 3 301 3 369 8.7 7.5 91.3 92.5 19.2 11.1 10.0 22.3 13.8
Venezuela (Bolivarian Republic of ) 2 4 311 29 278 10.1 6.5 89.9 93.5 32.7 9.5 6.2 29.1 5.8
Northern America 313 050 346 196 20.9 17.8 79.1 82.2 18.4 2.3 1.7 19.7 13.4
Bermuda 62 65 0.0 0.0 100.0 100.0 1 284.7 1.6 1.6
Canada 30 770 34 483 20.5 19.3 79.5 80.7 3.8 2.5 1.8 16.3 14.4
Greenland 56 57 18
.4 15
.3 81
.6 84
.7 0
.1 1
.8 1
.8
Saint Pierre and Miquelon
United States of America 282 162 311 592 20.9 17.6 79.1 82.4 33.8 2.2 1.7 20.1 13.3
Asia 3 717 168 4 210 777 62.7 55.1 37.3 44.9 134.0 32.2 28.7 25.6 6.8
Central Asia 55 107 63 489 58.4 59.4 41.6 40.6 15.9 26.6 20.7 28.7 4.8
Kazakhstan 14 884 16 558 44.3 46.4 55.7 53.6 6.0 19.6 15.3 24.8 6.7
Kyrgyzstan 4 898 5 507 64.7 64.6 35.3 35.4 28.4 26.2 20.4 29.9 4.3
Tajikistan 6 173 6 977 73.5 73.4 26.5 26.6 49.1 33.9 27.4 36.5 3.4
Turkmenistan 4 501 5 105 54.1 51.3 45.9 48.7 10.7 33.4 29.7 28.9 4.1
Uzbekistan 24 650 29 341 62.6 63.8 37.4 36.2 67.1 27.8 20.6 28.8 4.3
23
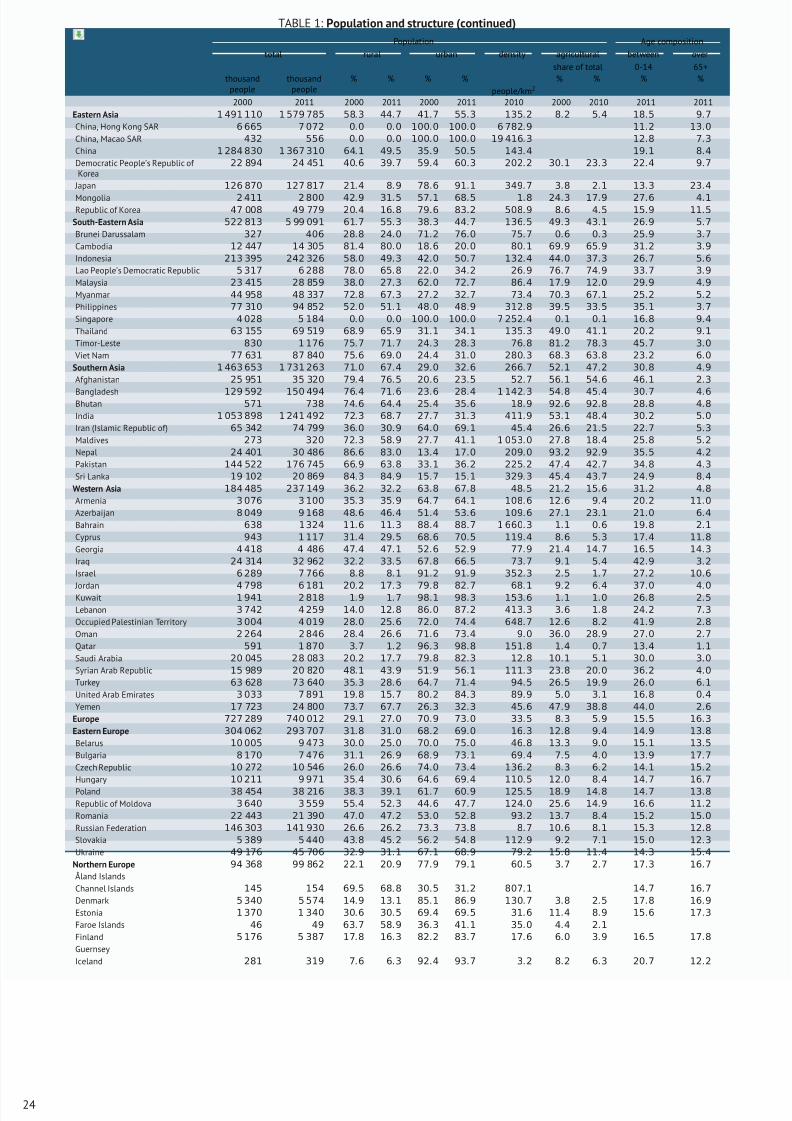
8/16/2019 Informe de la Fao 2013
http://slidepdf.com/reader/full/informe-de-la-fao-2013 42/307
TABLE 1: Population and structure (continued)
Population Age composition
total rural urban density agricultural between over
share of total 0-14 65+thousand
peoplethousand
people% % % %
people/km2
% % % %
2000 2011 2000 2011 2000 2011 2010 2000 2010 2011 2011
Eastern Asia 1 491 110 1 579 785 58.3 44.7 41.7 55.3 135.2 8.2 5.4 18.5 9.7
China, Hong Kong SAR 6 665 7 072 0.0 0.0 100.0 100.0 6 782.9 11.2 13.0
China, Macao SAR 432 556 0.0 0.0 100.0 100.0 19 416.3 12.8 7.3
China 1 284 830 1 367 310 64.1 49.5 35.9 50.5 143.4 19.1 8.4
Democratic People’s Republic of Korea
22 894 24 451 40.6 39.7 59.4 60.3 202.2 30.1 23.3 22.4 9.7
Japan 126 870 127 817 21.4 8.9 78.6 91.1 349.7 3.8 2.1 13.3 23.4
Mongolia 2 411 2 800 42.9 31.5 57.1 68.5 1.8 24.3 17.9 27.6 4.1Republic of Korea 47 008 49 779 20.4 16.8 79.6 83.2 508.9 8.6 4.5 15.9 11.5
South-Eastern Asia 522 813 5 99 091 61.7 55.3 38.3 44.7 136.5 49.3 43.1 26.9 5.7
Brunei Darussalam 327 406 28.8 24.0 71.2 76.0 75.7 0.6 0.3 25.9 3.7
Cambodia 12 447 14 305 81.4 80.0 18.6 20.0 80.1 69.9 65.9 31.2 3.9
Indonesia 213 395 242 326 58.0 49.3 42.0 50.7 132.4 44.0 37.3 26.7 5.6
Lao People’s Democratic Republic 5 317 6 288 78.0 65.8 22.0 34.2 26.9 76.7 74.9 33.7 3.9
Malaysia 23 415 28 859 38.0 27.3 62.0 72.7 86.4 17.9 12.0 29.9 4.9
Myanmar 44 958 48 337 72.8 67.3 27.2 32.7 73.4 70.3 67.1 25.2 5.2
Philippines 77 310 94 852 52.0 51.1 48.0 48.9 312.8 39.5 33.5 35.1 3.7
Singapore 4 028 5 184 0.0 0.0 100.0 100.0 7 252.4 0.1 0.1 16.8 9.4
Thailand 63 155 69 519 68.9 65.9 31.1 34.1 135.3 49.0 41.1 20.2 9.1
Timor-Leste 830 1 176 75.7 71.7 24.3 28.3 76.8 81.2 78.3 45.7 3.0
Viet Nam 77 631 87 840 75.6 69.0 24.4 31.0 280.3 68.3 63.8 23.2 6.0
Southern Asia 1 463 653 1 731 263 71.0 67.4 29.0 32.6 266.7 52.1 47.2 30.8 4.9
Afghanistan 25 951 35 320 79.4 76.5 20.6 23.5 52.7 56.1 54.6 46.1 2.3
Bangladesh 129 592 150 494 76.4 71.6 23.6 28.4 1 142.3 54.8 45.4 30.7 4.6Bhutan 571 738 74.6 64.4 25.4 35.6 18.9 92.6 92.8 28.8 4.8
India 1 053 898 1 241 492 72.3 68.7 27.7 31.3 411.9 53.1 48.4 30.2 5.0
Iran (Islamic Republic of) 65 342 74 799 36.0 30.9 64.0 69.1 45.4 26.6 21.5 22.7 5.3
Maldives 273 320 72.3 58.9 27.7 41.1 1 053.0 27.8 18.4 25.8 5.2
Nepal 24 401 30 486 86.6 83.0 13.4 17.0 209.0 93.2 92.9 35.5 4.2
Pakistan 144 522 176 745 66.9 63.8 33.1 36.2 225.2 47.4 42.7 34.8 4.3
Sri Lanka 19 102 20 869 84.3 84.9 15.7 15.1 329.3 45.4 43.7 24.9 8.4
Western Asia 184 485 237 149 36.2 32.2 63.8 67.8 48.5 21.2 15.6 31.2 4.8
Armenia 3 076 3 100 35.3 35.9 64.7 64.1 108.6 12.6 9.4 20.2 11.0
Azerbaijan 8 049 9 168 48.6 46.4 51.4 53.6 109.6 27.1 23.1 21.0 6.4
Bahrain 638 1 324 11.6 11.3 88.4 88.7 1 660.3 1.1 0.6 19.8 2.1
Cyprus 943 1 117 31.4 29.5 68.6 70.5 119.4 8.6 5.3 17.4 11.8
Georgia 4 418 4 486 47.4 47.1 52.6 52.9 77.9 21.4 14.7 16.5 14.3
Iraq 24 314 32 962 32.2 33.5 67.8 66.5 73.7 9.1 5.4 42.9 3.2
Israel 6 289 7 766 8.8 8.1 91.2 91.9 352.3 2.5 1.7 27.2 10.6
Jordan 4 798 6 181 20
.2 17
.3 79
.8 82
.7 68
.1 9
.2 6
.4 37
.0 4
.0
Kuwait 1 941 2 818 1.9 1.7 98.1 98.3 153.6 1.1 1.0 26.8 2.5
Lebanon 3 742 4 259 14.0 12.8 86.0 87.2 413.3 3.6 1.8 24.2 7.3
Occupied Palestinian Territory 3 004 4 019 28.0 25.6 72.0 74.4 648.7 12.6 8.2 41.9 2.8
Oman 2 264 2 846 28.4 26.6 71.6 73.4 9.0 36.0 28.9 27.0 2.7
Qatar 591 1 870 3.7 1.2 96.3 98.8 151.8 1.4 0.7 13.4 1.1
Saudi Arabia 20 045 28 083 20.2 17.7 79.8 82.3 12.8 10.1 5.1 30.0 3.0
Syrian Arab Republic 15 989 20 820 48.1 43.9 51.9 56.1 111.3 23.8 20.0 36.2 4.0
Turkey 63 628 73 640 35.3 28.6 64.7 71.4 94.5 26.5 19.9 26.0 6.1
United Arab Emirates 3 033 7 891 19.8 15.7 80.2 84.3 89.9 5.0 3.1 16.8 0.4
Yemen 17 723 24 800 73.7 67.7 26.3 32.3 45.6 47.9 38.8 44.0 2.6
Europe 727 289 740 012 29.1 27.0 70.9 73.0 33.5 8.3 5.9 15.5 16.3
Eastern Europe 304 062 293 707 31.8 31.0 68.2 69.0 16.3 12.8 9.4 14.9 13.8
Belarus 10 005 9 473 30.0 25.0 70.0 75.0 46.8 13.3 9.0 15.1 13.5
Bulgaria 8 170 7 476 31.1 26.9 68.9 73.1 69.4 7.5 4.0 13.9 17.7
Czech Republic 10 272 10 546 26.0 26.6 74.0 73.4 136.2 8.3 6.2 14.1 15.2
Hungary 10 211 9 971 35.4 30.6 64.6 69.4 110.5 12.0 8.4 14.7 16.7
Poland 38 454 38 216 38.3 39.1 61.7 60.9 125.5 18.9 14.8 14.7 13.8
Republic of Moldova 3 640 3 559 55.4 52.3 44.6 47.7 124.0 25.6 14.9 16.6 11.2
Romania 22 443 21 390 47.0 47.2 53.0 52.8 93.2 13.7 8.4 15.2 15.0
Russian Federation 146 303 141 930 26.6 26.2 73.3 73.8 8.7 10.6 8.1 15.3 12.8
Slovakia 5 389 5 440 43.8 45.2 56.2 54.8 112.9 9.2 7.1 15.0 12.3
Ukraine 49 176 45 706 32.9 31.1 67.1 68.9 79.2 15.8 11.4 14.3 15.4
Northern Europe 94 368 99 862 22.1 20.9 77.9 79.1 60.5 3.7 2.7 17.3 16.7
Åland Islands
Channel Islands 145 154 69.5 68.8 30.5 31.2 807.1 14.7 16.7
Denmark 5 340 5 574 14.9 13.1 85.1 86.9 130.7 3.8 2.5 17.8 16.9
Estonia 1 370 1 340 30.6 30.5 69.4 69.5 31.6 11.4 8.9 15.6 17.3
Faroe Islands 46 49 63.7 58.9 36.3 41.1 35.0 4.4 2.1
Finland 5 176 5 387 17.8 16.3 82.2 83.7 17.6 6.0 3.9 16.5 17.8
Guernsey
Iceland 281 319 7.6 6.3 92.4 93.7 3.2 8.2 6.3 20.7 12.2
24
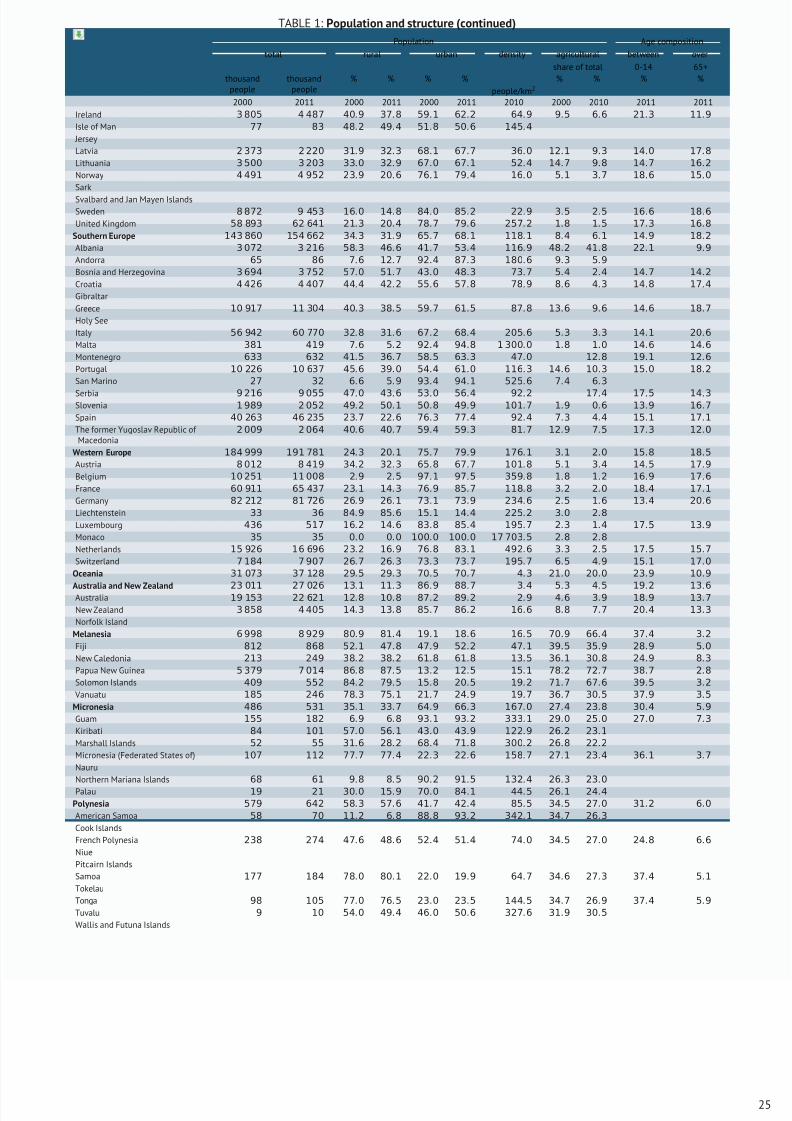
8/16/2019 Informe de la Fao 2013
http://slidepdf.com/reader/full/informe-de-la-fao-2013 43/307
TABLE 1: Population and structure (continued)
Population Age composition
total rural urban density agricultural between over
share of total 0-14 65+thousand
peoplethousand
people% % % %
people/km2
% % % %
2000 2011 2000 2011 2000 2011 2010 2000 2010 2011 2011
Ireland 3 805 4 487 40.9 37.8 59.1 62.2 64.9 9.5 6.6 21.3 11.9
Isle of Man 77 83 48.2 49.4 51.8 50.6 145.4
Jersey
Latvia 2 373 2 220 31.9 32.3 68.1 67.7 36.0 12.1 9.3 14.0 17.8
Lithuania 3 500 3 203 33.0 32.9 67.0 67.1 52.4 14.7 9.8 14.7 16.2
Norway 4 491 4 952 23.9 20.6 76.1 79.4 16.0 5.1 3.7 18.6 15.0
Sark
Svalbard and Jan Mayen IslandsSweden 8 872 9 453 16.0 14.8 84.0 85.2 22.9 3.5 2.5 16.6 18.6
United Kingdom 58 893 62 641 21.3 20.4 78.7 79.6 257.2 1.8 1.5 17.3 16.8
Southern Europe 143 860 154 662 34.3 31.9 65.7 68.1 118.1 8.4 6.1 14.9 18.2
Albania 3 072 3 216 58.3 46.6 41.7 53.4 116.9 48.2 41.8 22.1 9.9
Andorra 65 86 7.6 12.7 92.4 87.3 180.6 9.3 5.9
Bosnia and Herzegovina 3 694 3 752 57.0 51.7 43.0 48.3 73.7 5.4 2.4 14.7 14.2
Croatia 4 426 4 407 44.4 42.2 55.6 57.8 78.9 8.6 4.3 14.8 17.4
Gibraltar
Greece 10 917 11 304 40.3 38.5 59.7 61.5 87.8 13.6 9.6 14.6 18.7
Holy See
Italy 56 942 60 770 32.8 31.6 67.2 68.4 205.6 5.3 3.3 14.1 20.6
Malta 381 419 7.6 5.2 92.4 94.8 1 300.0 1.8 1.0 14.6 14.6
Montenegro 633 632 41.5 36.7 58.5 63.3 47.0 12.8 19.1 12.6
Portugal 10 226 10 637 45.6 39.0 54.4 61.0 116.3 14.6 10.3 15.0 18.2
San Marino 27 32 6.6 5.9 93.4 94.1 525.6 7.4 6.3
Serbia 9 216 9 055 47.0 43.6 53.0 56.4 92.2 17.4 17.5 14.3Slovenia 1 989 2 052 49.2 50.1 50.8 49.9 101.7 1.9 0.6 13.9 16.7
Spain 40 263 46 235 23.7 22.6 76.3 77.4 92.4 7.3 4.4 15.1 17.1
The former Yugoslav Republic of Macedonia
2 009 2 064 40.6 40.7 59.4 59.3 81.7 12.9 7.5 17.3 12.0
Western Europe 184 999 191 781 24.3 20.1 75.7 79.9 176.1 3.1 2.0 15.8 18.5
Austria 8 012 8 419 34.2 32.3 65.8 67.7 101.8 5.1 3.4 14.5 17.9
Belgium 10 251 11 008 2.9 2.5 97.1 97.5 359.8 1.8 1.2 16.9 17.6
France 60 911 65 437 23.1 14.3 76.9 85.7 118.8 3.2 2.0 18.4 17.1
Germany 82 212 81 726 26.9 26.1 73.1 73.9 234.6 2.5 1.6 13.4 20.6
Liechtenstein 33 36 84.9 85.6 15.1 14.4 225.2 3.0 2.8
Luxembourg 436 517 16.2 14.6 83.8 85.4 195.7 2.3 1.4 17.5 13.9
Monaco 35 35 0.0 0.0 100.0 100.0 17 703.5 2.8 2.8
Netherlands 15 926 16 696 23.2 16.9 76.8 83.1 492.6 3.3 2.5 17.5 15.7
Switzerland 7 184 7 907 26.7 26.3 73.3 73.7 195.7 6.5 4.9 15.1 17.0
Oceania 31 073 37 128 29.5 29.3 70.5 70.7 4.3 21.0 20.0 23.9 10.9
Australia and New Zealand 23 011 27 026 13
.1 11
.3 86
.9 88
.7 3
.4 5
.3 4
.5 19
.2 13
.6
Australia 19 153 22 621 12.8 10.8 87.2 89.2 2.9 4.6 3.9 18.9 13.7
New Zealand 3 858 4 405 14.3 13.8 85.7 86.2 16.6 8.8 7.7 20.4 13.3
Norfolk Island
Melanesia 6 998 8 929 80.9 81.4 19.1 18.6 16.5 70.9 66.4 37.4 3.2
Fiji 812 868 52.1 47.8 47.9 52.2 47.1 39.5 35.9 28.9 5.0
New Caledonia 213 249 38.2 38.2 61.8 61.8 13.5 36.1 30.8 24.9 8.3
Papua New Guinea 5 379 7 014 86.8 87.5 13.2 12.5 15.1 78.2 72.7 38.7 2.8
Solomon Islands 409 552 84.2 79.5 15.8 20.5 19.2 71.7 67.6 39.5 3.2
Vanuatu 185 246 78.3 75.1 21.7 24.9 19.7 36.7 30.5 37.9 3.5
Micronesia 486 531 35.1 33.7 64.9 66.3 167.0 27.4 23.8 30.4 5.9
Guam 155 182 6.9 6.8 93.1 93.2 333.1 29.0 25.0 27.0 7.3
Kiribati 84 101 57.0 56.1 43.0 43.9 122.9 26.2 23.1
Marshall Islands 52 55 31.6 28.2 68.4 71.8 300.2 26.8 22.2
Micronesia (Federated States of) 107 112 77.7 77.4 22.3 22.6 158.7 27.1 23.4 36.1 3.7
Nauru
Northern Mariana Islands 68 61 9.8 8.5 90.2 91.5 132.4 26.3 23.0
Palau 19 21 30.0 15.9 70.0 84.1 44.5 26.1 24.4
Polynesia 579 642 58.3 57.6 41.7 42.4 85.5 34.5 27.0 31.2 6.0
American Samoa 58 70 11.2 6.8 88.8 93.2 342.1 34.7 26.3
Cook Islands
French Polynesia 238 274 47.6 48.6 52.4 51.4 74.0 34.5 27.0 24.8 6.6
Niue
Pitcairn Islands
Samoa 177 184 78.0 80.1 22.0 19.9 64.7 34.6 27.3 37.4 5.1
Tokelau
Tonga 98 105 77.0 76.5 23.0 23.5 144.5 34.7 26.9 37.4 5.9
Tuvalu 9 10 54.0 49.4 46.0 50.6 327.6 31.9 30.5
Wallis and Futuna Islands
25
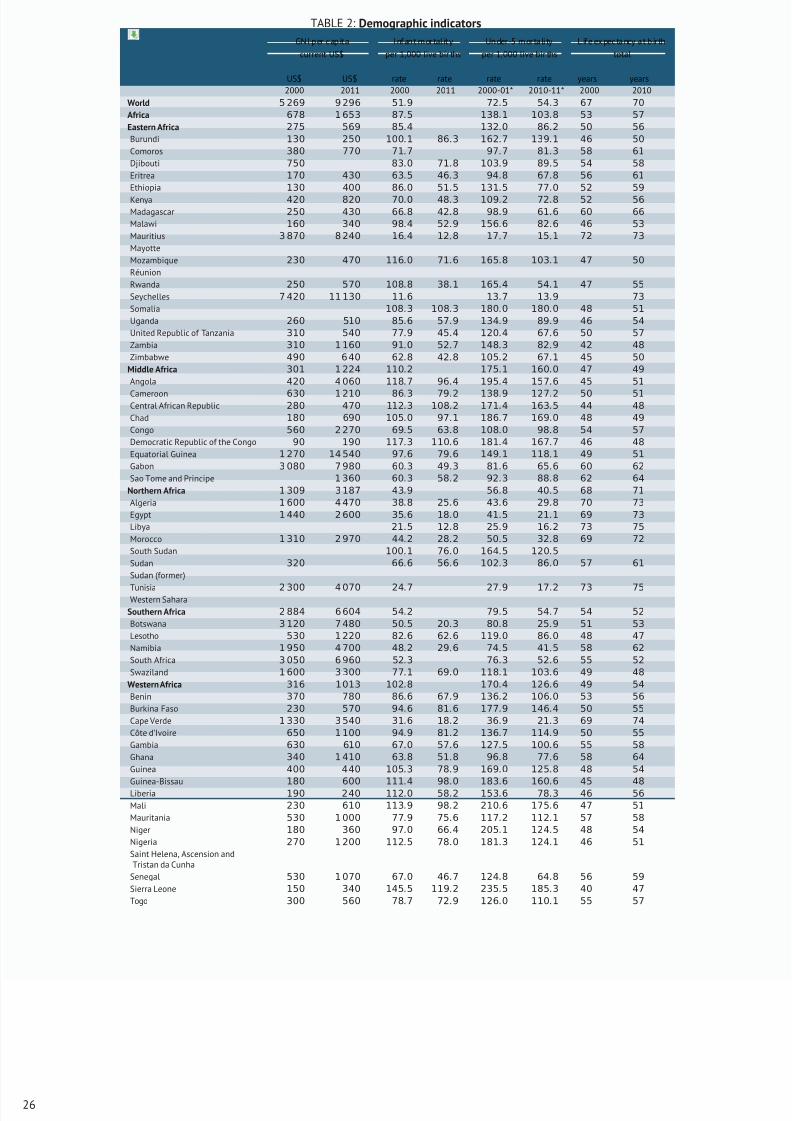
8/16/2019 Informe de la Fao 2013
http://slidepdf.com/reader/full/informe-de-la-fao-2013 44/307
TABLE 2: Demographic indicators
GNI per capita I nfan t mortal ity Un der-5 mortality Life expectancy at birth
current US$ per 1,000 live bir ths per 1,000 live bir ths total
US$ US$ rate rate rate rate years years2000 2011 2000 2011 2000-01* 2010-11* 2000 2010
World 5 269 9 296 51.9 72.5 54.3 67 70
Africa 678 1 653 87.5 138.1 103.8 53 57
Eastern Africa 275 569 85.4 132.0 86.2 50 56
Burundi 130 250 100.1 86.3 162.7 139.1 46 50
Comoros 380 770 71.7 97.7 81.3 58 61
Djibouti 750 83.0 71.8 103.9 89.5 54 58
Eritrea 170 430 63.5 46.3 94.8 67.8 56 61
Ethiopia 130 400 86.0 51.5 131.5 77.0 52 59
Kenya 420 820 70.0 48.3 109.2 72.8 52 56
Madagascar 250 430 66.8 42.8 98.9 61.6 60 66
Malawi 160 340 98.4 52.9 156.6 82.6 46 53
Mauritius 3 870 8 240 16.4 12.8 17.7 15.1 72 73
Mayotte
Mozambique 230 470 116.0 71.6 165.8 103.1 47 50
Réunion
Rwanda 250 570 108.8 38.1 165.4 54.1 47 55
Seychelles 7 420 11 130 11.6 13.7 13.9 73
Somalia 108.3 108.3 180.0 180.0 48 51
Uganda 260 510 85.6 57.9 134.9 89.9 46 54
United Republic of Tanzania 310 540 77.9 45.4 120.4 67.6 50 57
Zambia 310 1 160 91.0 52.7 148.3 82.9 42 48
Zimbabwe 490 6 40 62.8 42.8 105.2 67.1 45 50
Middle Africa 301 1 224 110.2 175.1 160.0 47 49
Angola 420 4 060 118.7 96.4 195.4 157.6 45 51
Cameroon 630 1 210 86.3 79.2 138.9 127.2 50 51Central African Republic 280 470 112.3 108.2 171.4 163.5 44 48
Chad 180 690 105.0 97.1 186.7 169.0 48 49
Congo 560 2 270 69.5 63.8 108.0 98.8 54 57
Democratic Republic of the Congo 90 190 117.3 110.6 181.4 167.7 46 48
Equatorial Guinea 1 270 14 540 97.6 79.6 149.1 118.1 49 51
Gabon 3 080 7 980 60.3 49.3 81.6 65.6 60 62
Sao Tome and Principe 1 360 60.3 58.2 92.3 88.8 62 64
Northern Africa 1 309 3 187 43.9 56.8 40.5 68 71
Algeria 1 600 4 470 38.8 25.6 43.6 29.8 70 73
Egypt 1 440 2 600 35.6 18.0 41.5 21.1 69 73
Libya 21.5 12.8 25.9 16.2 73 75
Morocco 1 310 2 970 44.2 28.2 50.5 32.8 69 72
South Sudan 100.1 76.0 164.5 120.5
Sudan 320 66.6 56.6 102.3 86.0 57 61
Sudan (former)
Tunisia 2 300 4 070 24.7 27.9 17.2 73 75Western Sahara
Southern Africa 2 884 6 604 54.2 79.5 54.7 54 52
Botswana 3 120 7 480 50.5 20.3 80.8 25.9 51 53
Lesotho 530 1 220 82.6 62.6 119.0 86.0 48 47
Namibia 1 950 4 700 48.2 29.6 74.5 41.5 58 62
South Africa 3 050 6 960 52.3 76.3 52.6 55 52
Swaziland 1 600 3 300 77.1 69.0 118.1 103.6 49 48
Western Africa 316 1 013 102.8 170.4 126.6 49 54
Benin 370 780 86.6 67.9 136.2 106.0 53 56
Burkina Faso 230 570 94.6 81.6 177.9 146.4 50 55
Cape Verde 1 330 3 540 31.6 18.2 36.9 21.3 69 74
Côte d’Ivoire 650 1 100 94.9 81.2 136.7 114.9 50 55
Gambia 630 610 67.0 57.6 127.5 100.6 55 58
Ghana 340 1 410 63.8 51.8 96.8 77.6 58 64
Guinea 400 440 105.3 78.9 169.0 125.8 48 54
Guinea-Bissau 180 600 111
.4 98
.0 183
.6 160
.6 45 48
Liberia 190 240 112.0 58.2 153.6 78.3 46 56
Mali 230 610 113.9 98.2 210.6 175.6 47 51
Mauritania 530 1 000 77.9 75.6 117.2 112.1 57 58
Niger 180 360 97.0 66.4 205.1 124.5 48 54
Nigeria 270 1 200 112.5 78.0 181.3 124.1 46 51
Saint Helena, Ascension andTristan da Cunha
Senegal 530 1 070 67.0 46.7 124.8 64.8 56 59
Sierra Leone 150 340 145.5 119.2 235.5 185.3 40 47
Togo 300 560 78.7 72.9 126.0 110.1 55 57
26
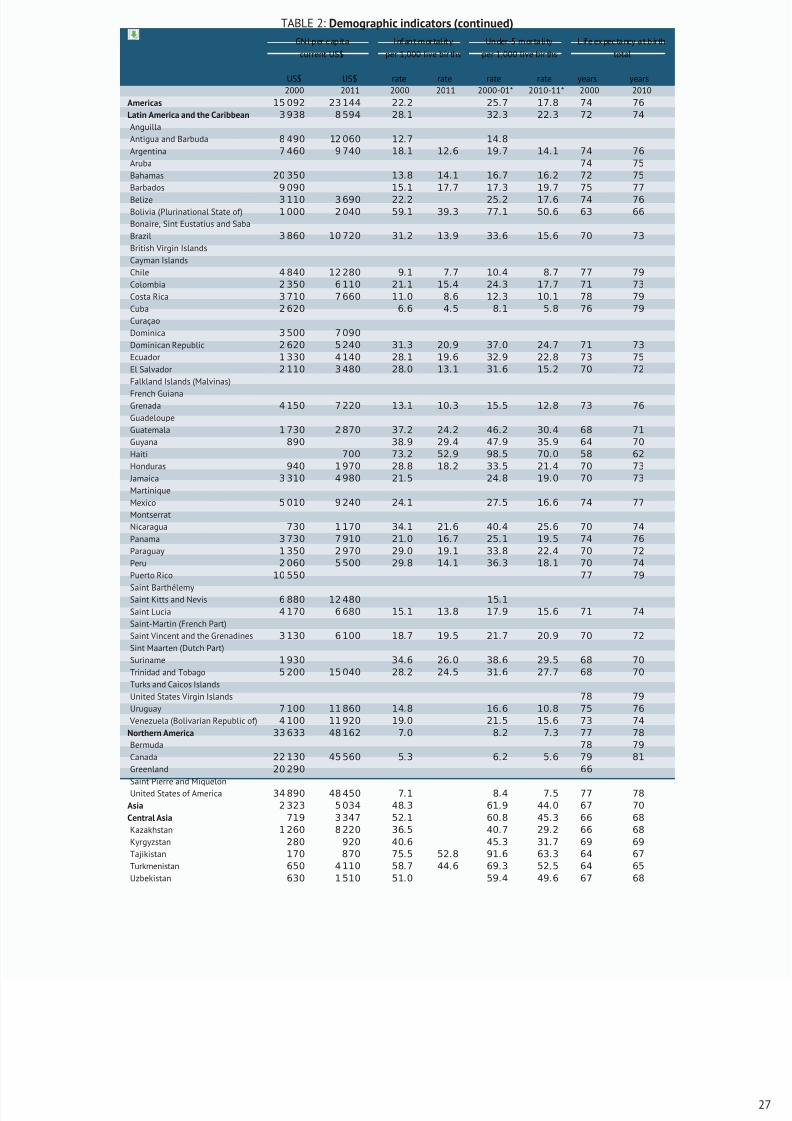
8/16/2019 Informe de la Fao 2013
http://slidepdf.com/reader/full/informe-de-la-fao-2013 45/307
TABLE 2: Demographic indicators (continued)
GNI per capita I nfan t mortal ity Un der-5 mortality Life expectancy at birth
current US$ per 1,000 live bir ths per 1,000 live bir ths total
US$ US$ rate rate rate rate years years2000 2011 2000 2011 2000-01* 2010-11* 2000 2010
Americas 15 092 23 144 22.2 25.7 17.8 74 76
Latin America and the Caribbean 3 938 8 594 28.1 32.3 22.3 72 74
Anguilla
Antigua and Barbuda 8 490 12 060 12.7 14.8
Argentina 7 460 9 740 18.1 12.6 19.7 14.1 74 76
Aruba 74 75
Bahamas 20 350 13.8 14.1 16.7 16.2 72 75
Barbados 9 090 15.1 17.7 17.3 19.7 75 77
Belize 3 110 3 690 22.2 25.2 17.6 74 76
Bolivia (Plurinational State of) 1 000 2 040 59.1 39.3 77.1 50.6 63 66
Bonaire, Sint Eustatius and Saba
Brazil 3 860 10 720 31.2 13.9 33.6 15.6 70 73
British Virgin Islands
Cayman Islands
Chile 4 840 12 280 9.1 7.7 10.4 8.7 77 79
Colombia 2 350 6 110 21.1 15.4 24.3 17.7 71 73
Costa Rica 3 710 7 660 11.0 8.6 12.3 10.1 78 79
Cuba 2 620 6.6 4.5 8.1 5.8 76 79
Curaçao
Dominica 3 500 7 090
Dominican Republic 2 620 5 240 31.3 20.9 37.0 24.7 71 73
Ecuador 1 330 4 140 28.1 19.6 32.9 22.8 73 75
El Salvador 2 110 3 480 28.0 13.1 31.6 15.2 70 72
Falkland Islands (Malvinas)
French GuianaGrenada 4 150 7 220 13.1 10.3 15.5 12.8 73 76
Guadeloupe
Guatemala 1 730 2 870 37.2 24.2 46.2 30.4 68 71
Guyana 890 38.9 29.4 47.9 35.9 64 70
Haiti 700 73.2 52.9 98.5 70.0 58 62
Honduras 940 1 970 28.8 18.2 33.5 21.4 70 73
Jamaica 3 310 4 980 21.5 24.8 19.0 70 73
Martinique
Mexico 5 010 9 240 24.1 27.5 16.6 74 77
Montserrat
Nicaragua 730 1 170 34.1 21.6 40.4 25.6 70 74
Panama 3 730 7 910 21.0 16.7 25.1 19.5 74 76
Paraguay 1 350 2 970 29.0 19.1 33.8 22.4 70 72
Peru 2 060 5 500 29.8 14.1 36.3 18.1 70 74
Puerto Rico 10 550 77 79
Saint BarthélemySaint Kitts and Nevis 6 880 12 480 15.1
Saint Lucia 4 170 6 680 15.1 13.8 17.9 15.6 71 74
Saint-Martin (French Part)
Saint Vincent and the Grenadines 3 130 6 100 18.7 19.5 21.7 20.9 70 72
Sint Maarten (Dutch Part)
Suriname 1 930 34.6 26.0 38.6 29.5 68 70
Trinidad and Tobago 5 200 15 040 28.2 24.5 31.6 27.7 68 70
Turks and Caicos Islands
United States Virgin Islands 78 79
Uruguay 7 100 11 860 14.8 16.6 10.8 75 76
Venezuela (Bolivarian Republic of) 4 100 11 920 19.0 21.5 15.6 73 74
Northern America 33 633 48 162 7.0 8.2 7.3 77 78
Bermuda 78 79
Canada 22 130 45 560 5.3 6.2 5.6 79 81
Greenland 20 290 66
Saint Pierre and MiquelonUnited States of America 34 890 48 450 7.1 8.4 7.5 77 78
Asia 2 323 5 034 48.3 61.9 44.0 67 70
Central Asia 719 3 347 52.1 60.8 45.3 66 68
Kazakhstan 1 260 8 220 36.5 40.7 29.2 66 68
Kyrgyzstan 280 920 40.6 45.3 31.7 69 69
Tajikistan 170 870 75.5 52.8 91.6 63.3 64 67
Turkmenistan 650 4 110 58.7 44.6 69.3 52.5 64 65
Uzbekistan 630 1 510 51.0 59.4 49.6 67 68
27
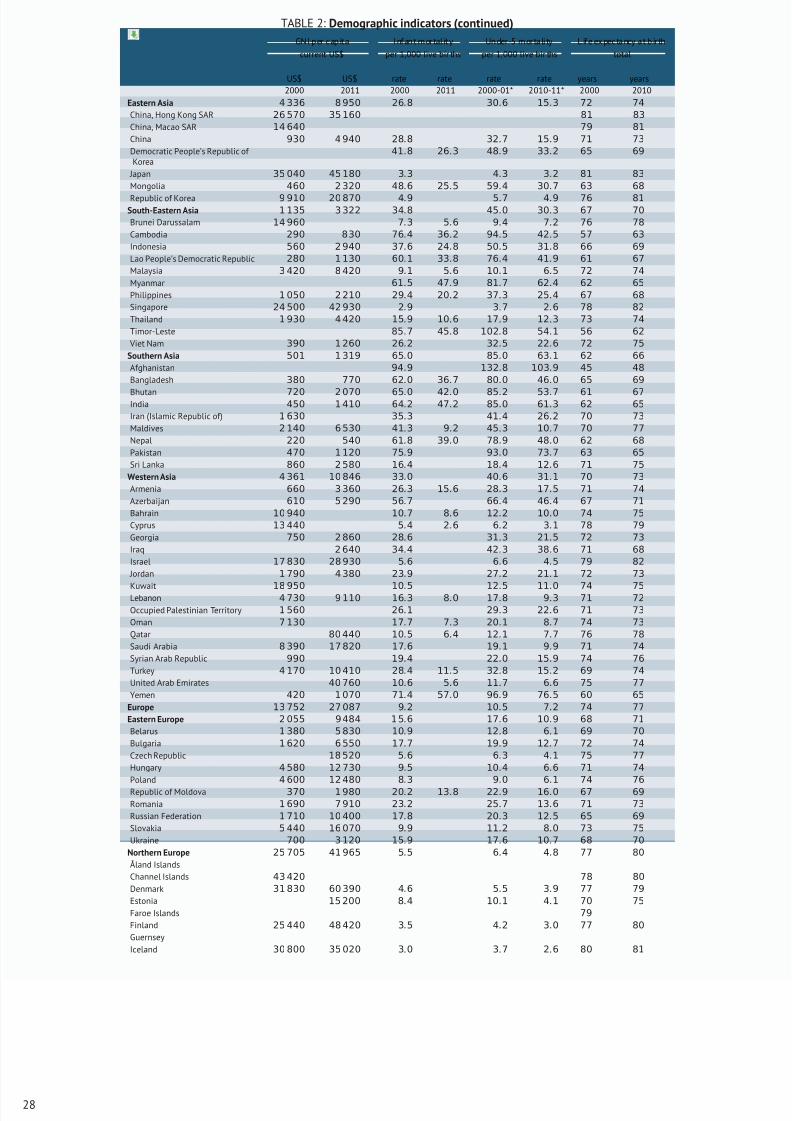
8/16/2019 Informe de la Fao 2013
http://slidepdf.com/reader/full/informe-de-la-fao-2013 46/307
TABLE 2: Demographic indicators (continued)
GNI per capita I nfan t mortal ity Un der-5 mortality Life expectancy at birth
current US$ per 1,000 live bir ths per 1,000 live bir ths total
US$ US$ rate rate rate rate years years2000 2011 2000 2011 2000-01* 2010-11* 2000 2010
Eastern Asia 4 336 8 950 26.8 30.6 15.3 72 74
China, Hong Kong SAR 26 570 35 160 81 83
China, Macao SAR 14 640 79 81
China 930 4 940 28.8 32.7 15.9 71 73
Democratic People’s Republic of Korea
41.8 26.3 48.9 33.2 65 69
Japan 35 040 45 180 3.3 4.3 3.2 81 83
Mongolia 460 2 320 48.6 25.5 59.4 30.7 63 68
Republic of Korea 9 910 20 870 4.9 5.7 4.9 76 81
South-Eastern Asia 1 135 3 322 34.8 45.0 30.3 67 70
Brunei Darussalam 14 960 7.3 5.6 9.4 7.2 76 78
Cambodia 290 830 76.4 36.2 94.5 42.5 57 63
Indonesia 560 2 940 37.6 24.8 50.5 31.8 66 69
Lao People’s Democratic Republic 280 1 130 60.1 33.8 76.4 41.9 61 67
Malaysia 3 420 8 420 9.1 5.6 10.1 6.5 72 74
Myanmar 61.5 47.9 81.7 62.4 62 65
Philippines 1 050 2 210 29.4 20.2 37.3 25.4 67 68
Singapore 24 500 42 930 2.9 3.7 2.6 78 82
Thailand 1 930 4 420 15.9 10.6 17.9 12.3 73 74
Timor-Leste 85.7 45.8 102.8 54.1 56 62
Viet Nam 390 1 260 26.2 32.5 22.6 72 75
Southern Asia 501 1 319 65.0 85.0 63.1 62 66
Afghanistan 94.9 132.8 103.9 45 48
Bangladesh 380 770 62.0 36.7 80.0 46.0 65 69
Bhutan 720 2 070 65.0 42.0 85.2 53.7 61 67India 450 1 410 64.2 47.2 85.0 61.3 62 65
Iran (Islamic Republic of) 1 630 35.3 41.4 26.2 70 73
Maldives 2 140 6 530 41.3 9.2 45.3 10.7 70 77
Nepal 220 540 61.8 39.0 78.9 48.0 62 68
Pakistan 470 1 120 75.9 93.0 73.7 63 65
Sri Lanka 860 2 580 16.4 18.4 12.6 71 75
Western Asia 4 361 10 846 33.0 40.6 31.1 70 73
Armenia 660 3 360 26.3 15.6 28.3 17.5 71 74
Azerbaijan 610 5 290 56.7 66.4 46.4 67 71
Bahrain 10 940 10.7 8.6 12.2 10.0 74 75
Cyprus 13 440 5.4 2.6 6.2 3.1 78 79
Georgia 750 2 860 28.6 31.3 21.5 72 73
Iraq 2 640 34.4 42.3 38.6 71 68
Israel 17 830 28 930 5.6 6.6 4.5 79 82
Jordan 1 790 4 380 23.9 27.2 21.1 72 73
Kuwait 18 950 10
.5 12
.5 11
.0 74 75
Lebanon 4 730 9 110 16.3 8.0 17.8 9.3 71 72
Occupied Palestinian Territory 1 560 26.1 29.3 22.6 71 73
Oman 7 130 17.7 7.3 20.1 8.7 74 73
Qatar 80 440 10.5 6.4 12.1 7.7 76 78
Saudi Arabia 8 390 17 820 17.6 19.1 9.9 71 74
Syrian Arab Republic 990 19.4 22.0 15.9 74 76
Turkey 4 170 10 410 28.4 11.5 32.8 15.2 69 74
United Arab Emirates 40 760 10.6 5.6 11.7 6.6 75 77
Yemen 420 1 070 71.4 57.0 96.9 76.5 60 65
Europe 13 752 27 087 9.2 10.5 7.2 74 77
Eastern Europe 2 055 9 484 1 5.6 17.6 10.9 68 71
Belarus 1 380 5 830 10.9 12.8 6.1 69 70
Bulgaria 1 620 6 550 17.7 19.9 12.7 72 74
Czech Republic 18 520 5.6 6.3 4.1 75 77
Hungary 4 580 12 730 9.5 10.4 6.6 71 74
Poland 4 600 12 480 8.3 9.0 6.1 74 76
Republic of Moldova 370 1 980 20.2 13.8 22.9 16.0 67 69
Romania 1 690 7 910 23.2 25.7 13.6 71 73
Russian Federation 1 710 10 400 17.8 20.3 12.5 65 69
Slovakia 5 440 16 070 9.9 11.2 8.0 73 75
Ukraine 700 3 120 15.9 17.6 10.7 68 70
Northern Europe 25 705 41 965 5.5 6.4 4.8 77 80
Åland Islands
Channel Islands 43 420 78 80
Denmark 31 830 60 390 4.6 5.5 3.9 77 79
Estonia 15 200 8.4 10.1 4.1 70 75
Faroe Islands 79
Finland 25 440 48 420 3.5 4.2 3.0 77 80
Guernsey
Iceland 30 800 35 020 3.0 3.7 2.6 80 81
28
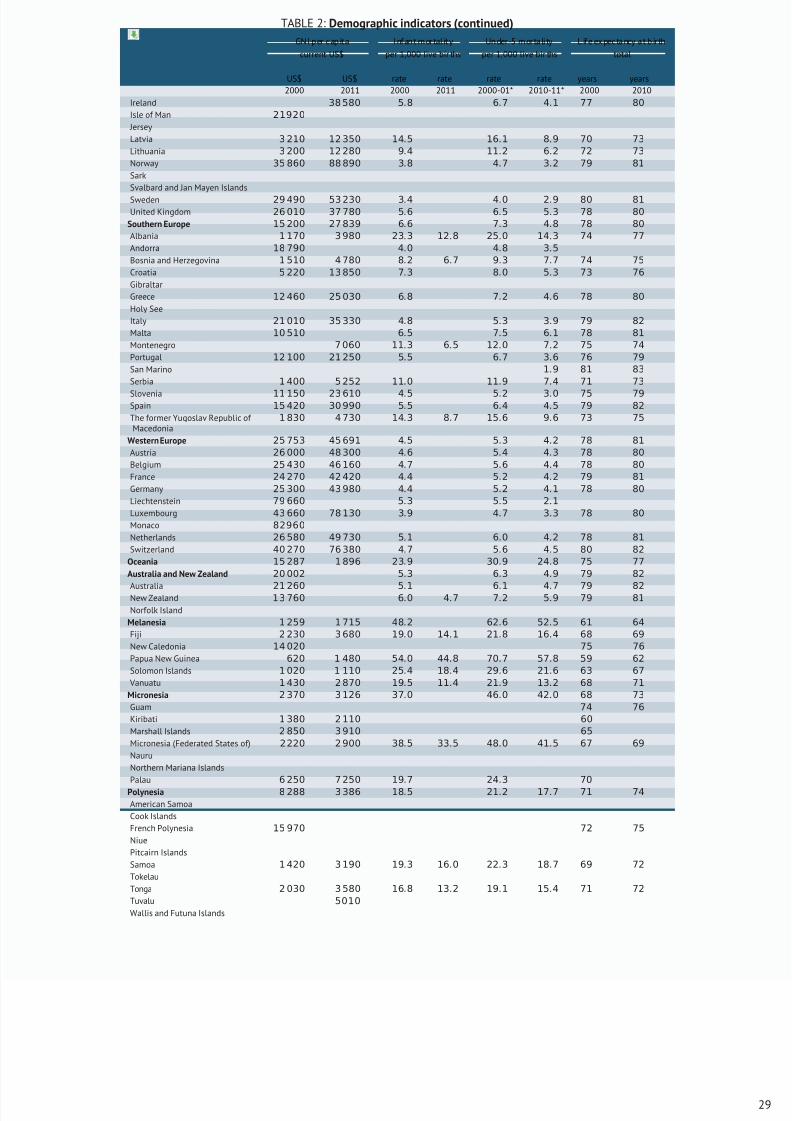
8/16/2019 Informe de la Fao 2013
http://slidepdf.com/reader/full/informe-de-la-fao-2013 47/307
TABLE 2: Demographic indicators (continued)
GNI per capita I nfan t mortal ity Un der-5 mortality Life expectancy at birth
current US$ per 1,000 live bir ths per 1,000 live bir ths total
US$ US$ rate rate rate rate years years2000 2011 2000 2011 2000-01* 2010-11* 2000 2010
Ireland 38 580 5.8 6.7 4.1 77 80
Isle of Man 21920
Jersey
Latvia 3 210 12 350 14.5 16.1 8.9 70 73
Lithuania 3 200 12 280 9.4 11.2 6.2 72 73
Norway 35 860 88 890 3.8 4.7 3.2 79 81
Sark
Svalbard and Jan Mayen Islands
Sweden 29 490 53 230 3.4 4.0 2.9 80 81
United Kingdom 26 010 37 780 5.6 6.5 5.3 78 80
Southern Europe 15 200 27 839 6.6 7.3 4.8 78 80
Albania 1 170 3 980 23.3 12.8 25.0 14.3 74 77
Andorra 18 790 4.0 4.8 3.5
Bosnia and Herzegovina 1 510 4 780 8.2 6.7 9.3 7.7 74 75
Croatia 5 220 13 850 7.3 8.0 5.3 73 76
Gibraltar
Greece 12 460 25 030 6.8 7.2 4.6 78 80
Holy See
Italy 21 010 35 330 4.8 5.3 3.9 79 82
Malta 10 510 6.5 7.5 6.1 78 81
Montenegro 7 060 11.3 6.5 12.0 7.2 75 74
Portugal 12 100 21 250 5.5 6.7 3.6 76 79
San Marino 1.9 81 83
Serbia 1 400 5 252 11.0 11.9 7.4 71 73
Slovenia 11 150 23 610 4.5 5.2 3.0 75 79Spain 15 420 30 990 5.5 6.4 4.5 79 82
The former Yugoslav Republic of Macedonia
1 830 4 730 14.3 8.7 15.6 9.6 73 75
Western Europe 25 753 45 691 4.5 5.3 4.2 78 81
Austria 26 000 48 300 4.6 5.4 4.3 78 80
Belgium 25 430 46 160 4.7 5.6 4.4 78 80
France 24 270 42 420 4.4 5.2 4.2 79 81
Germany 25 300 43 980 4.4 5.2 4.1 78 80
Liechtenstein 79 660 5.3 5.5 2.1
Luxembourg 43 660 78 130 3.9 4.7 3.3 78 80
Monaco 82960
Netherlands 26 580 49 730 5.1 6.0 4.2 78 81
Switzerland 40 270 76 380 4.7 5.6 4.5 80 82
Oceania 15 287 1 896 23.9 30.9 24.8 75 77
Australia and New Zealand 20 002 5.3 6.3 4.9 79 82
Australia 21 260 5
.1 6
.1 4
.7 79 82
New Zealand 13 760 6.0 4.7 7.2 5.9 79 81
Norfolk Island
Melanesia 1 259 1 715 48.2 62.6 52.5 61 64
Fiji 2 230 3 680 19.0 14.1 21.8 16.4 68 69
New Caledonia 14 020 75 76
Papua New Guinea 620 1 480 54.0 44.8 70.7 57.8 59 62
Solomon Islands 1 020 1 110 25.4 18.4 29.6 21.6 63 67
Vanuatu 1 430 2 870 19.5 11.4 21.9 13.2 68 71
Micronesia 2 370 3 126 37.0 46.0 42.0 68 73
Guam 74 76
Kiribati 1 380 2 110 60
Marshall Islands 2 850 3 910 65
Micronesia (Federated States of) 2 220 2 900 38.5 33.5 48.0 41.5 67 69
Nauru
Northern Mariana Islands
Palau 6 250 7 250 19.7 24.3 70
Polynesia 8 288 3 386 18.5 21.2 17.7 71 74
American Samoa
Cook Islands
French Polynesia 15 970 72 75
Niue
Pitcairn Islands
Samoa 1 420 3 190 19.3 16.0 22.3 18.7 69 72
Tokelau
Tonga 2 030 3 580 16.8 13.2 19.1 15.4 71 72
Tuvalu 5010
Wallis and Futuna Islands
29
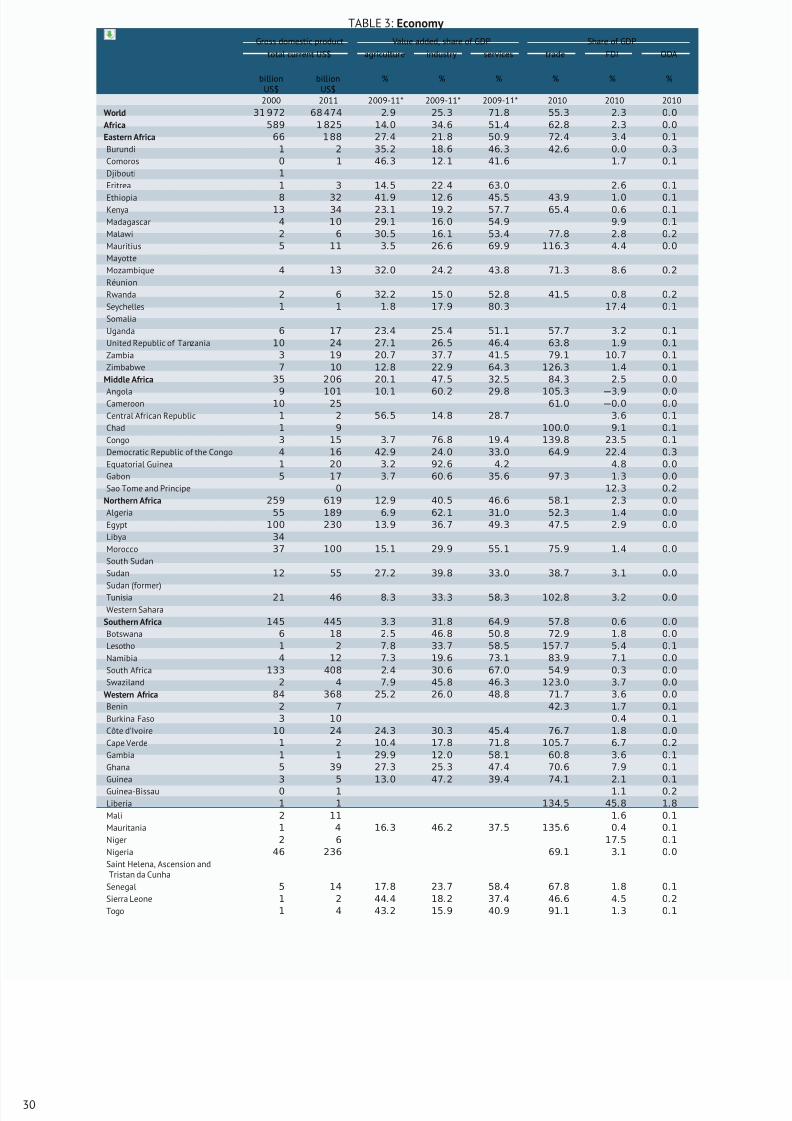
8/16/2019 Informe de la Fao 2013
http://slidepdf.com/reader/full/informe-de-la-fao-2013 48/307
TABLE 3: Economy
Gross domestic product Value added, share of GDP Share of GDP
total current US$ agriculture industry services trade FDI ODA
billionUS$
billionUS$
% % % % % %
2000 2011 2009-11* 2009-11* 2009-11* 2010 2010 2010
World 31 972 68 474 2.9 25.3 71.8 55.3 2.3 0.0
Africa 589 1 825 14.0 34.6 51.4 62.8 2.3 0.0
Eastern Africa 66 1 88 27.4 21.8 50.9 72.4 3.4 0.1
Burundi 1 2 35.2 18.6 46.3 42.6 0.0 0.3
Comoros 0 1 46.3 12.1 41.6 1.7 0.1
Djibouti 1
Eritrea 1 3 14.5 22.4 63.0 2.6 0.1
Ethiopia 8 32 41.9 12.6 45.5 43.9 1.0 0.1Kenya 13 34 23.1 19.2 57.7 65.4 0.6 0.1
Madagascar 4 10 29.1 16.0 54.9 9.9 0.1
Malawi 2 6 30.5 16.1 53.4 77.8 2.8 0.2
Mauritius 5 11 3.5 26.6 69.9 116.3 4.4 0.0
Mayotte
Mozambique 4 13 32.0 24.2 43.8 71.3 8.6 0.2
Réunion
Rwanda 2 6 32.2 15.0 52.8 41.5 0.8 0.2
Seychelles 1 1 1.8 17.9 80.3 17.4 0.1
Somalia
Uganda 6 17 23.4 25.4 51.1 57.7 3.2 0.1
United Republic of Tanzania 10 24 27.1 26.5 46.4 63.8 1.9 0.1
Zambia 3 19 20.7 37.7 41.5 79.1 10.7 0.1
Zimbabwe 7 10 12.8 22.9 64.3 126.3 1.4 0.1
Middle Africa 35 206 20.1 47.5 32.5 84.3 2.5 0.0
Angola 9 101 10.1 60.2 29.8 105.3 −3.9 0.0Cameroon 10 25 61.0 −0.0 0.0
Central African Republic 1 2 56.5 14.8 28.7 3.6 0.1
Chad 1 9 100.0 9.1 0.1
Congo 3 15 3.7 76.8 19.4 139.8 23.5 0.1
Democratic Republic of the Congo 4 16 42.9 24.0 33.0 64.9 22.4 0.3
Equatorial Guinea 1 20 3.2 92.6 4.2 4.8 0.0
Gabon 5 17 3.7 60.6 35.6 97.3 1.3 0.0
Sao Tome and Principe 0 12.3 0.2
Northern Africa 259 619 12.9 40.5 46.6 58.1 2.3 0.0
Algeria 55 189 6.9 62.1 31.0 52.3 1.4 0.0
Egypt 100 230 13.9 36.7 49.3 47.5 2.9 0.0
Libya 34
Morocco 37 100 15.1 29.9 55.1 75.9 1.4 0.0
South Sudan
Sudan 12 55 27.2 39.8 33.0 38.7 3.1 0.0
Sudan (former)Tunisia 21 46 8.3 33.3 58.3 102.8 3.2 0.0
Western Sahara
Southern Africa 145 445 3.3 31.8 64.9 57.8 0.6 0.0
Botswana 6 18 2.5 46.8 50.8 72.9 1.8 0.0
Lesotho 1 2 7.8 33.7 58.5 157.7 5.4 0.1
Namibia 4 12 7.3 19.6 73.1 83.9 7.1 0.0
South Africa 133 408 2.4 30.6 67.0 54.9 0.3 0.0
Swaziland 2 4 7.9 45.8 46.3 123.0 3.7 0.0
Western Africa 84 368 25.2 26.0 48.8 71.7 3.6 0.0
Benin 2 7 42.3 1.7 0.1
Burkina Faso 3 10 0.4 0.1
Côte d’Ivoire 10 24 24.3 30.3 45.4 76.7 1.8 0.0
Cape Verde 1 2 10.4 17.8 71.8 105.7 6.7 0.2
Gambia 1 1 29.9 12.0 58.1 60.8 3.6 0.1
Ghana 5 39 27.3 25.3 47.4 70.6 7.9 0.1
Guinea 3 5 13.0 47.2 39.4 74.1 2.1 0.1
Guinea-Bissau 0 1 1.1 0.2
Liberia 1 1 134.5 45.8 1.8
Mali 2 11 1.6 0.1
Mauritania 1 4 16.3 46.2 37.5 135.6 0.4 0.1
Niger 2 6 17.5 0.1
Nigeria 46 236 69.1 3.1 0.0
Saint Helena, Ascension andTristan da Cunha
Senegal 5 14 17.8 23.7 58.4 67.8 1.8 0.1
Sierra Leone 1 2 44.4 18.2 37.4 46.6 4.5 0.2
Togo 1 4 43.2 15.9 40.9 91.1 1.3 0.1
30
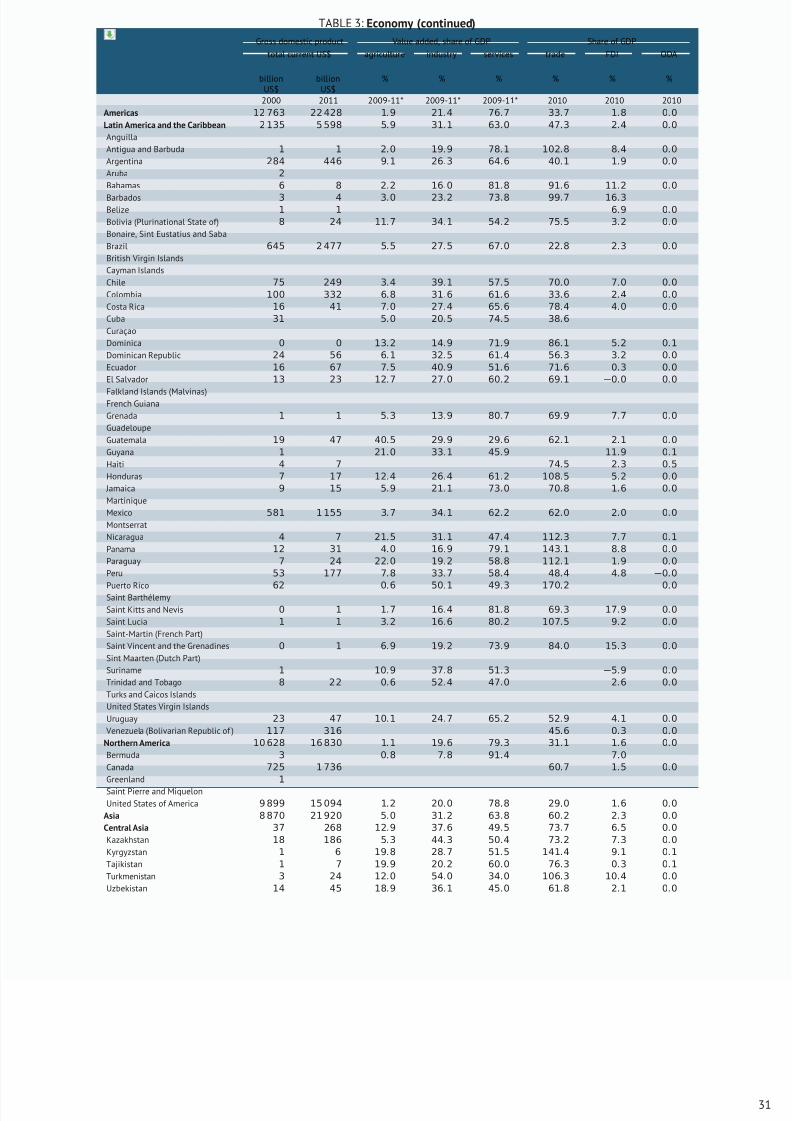
8/16/2019 Informe de la Fao 2013
http://slidepdf.com/reader/full/informe-de-la-fao-2013 49/307
TABLE 3: Economy (continued)
Gross domestic product Value added, share of GDP Share of GDP
total current US$ agriculture industry services trade FDI ODA
billionUS$
billionUS$
% % % % % %
2000 2011 2009-11* 2009-11* 2009-11* 2010 2010 2010
Americas 12 763 22 428 1.9 21.4 76.7 33.7 1.8 0.0
Latin America and the Caribbean 2 135 5 598 5.9 31.1 63.0 47.3 2.4 0.0
Anguilla
Antigua and Barbuda 1 1 2.0 19.9 78.1 102.8 8.4 0.0
Argentina 284 446 9.1 26.3 64.6 40.1 1.9 0.0
Aruba 2
Bahamas 6 8 2.2 16.0 81.8 91.6 11.2 0.0
Barbados 3 4 3.0 23.2 73.8 99.7 16.3Belize 1 1 6.9 0.0
Bolivia (Plurinational State of) 8 24 11.7 34.1 54.2 75.5 3.2 0.0
Bonaire, Sint Eustatius and Saba
Brazil 645 2 477 5.5 27.5 67.0 22.8 2.3 0.0
British Virgin Islands
Cayman Islands
Chile 75 249 3.4 39.1 57.5 70.0 7.0 0.0
Colombia 100 332 6.8 31.6 61.6 33.6 2.4 0.0
Costa Rica 16 41 7.0 27.4 65.6 78.4 4.0 0.0
Cuba 31 5.0 20.5 74.5 38.6
Curaçao
Dominica 0 0 13.2 14.9 71.9 86.1 5.2 0.1
Dominican Republic 24 56 6.1 32.5 61.4 56.3 3.2 0.0
Ecuador 16 67 7.5 40.9 51.6 71.6 0.3 0.0
El Salvador 13 23 12.7 27.0 60.2 69.1 −0.0 0.0
Falkland Islands (Malvinas)French Guiana
Grenada 1 1 5.3 13.9 80.7 69.9 7.7 0.0
Guadeloupe
Guatemala 19 47 40.5 29.9 29.6 62.1 2.1 0.0
Guyana 1 21.0 33.1 45.9 11.9 0.1
Haiti 4 7 74.5 2.3 0.5
Honduras 7 17 12.4 26.4 61.2 108.5 5.2 0.0
Jamaica 9 15 5.9 21.1 73.0 70.8 1.6 0.0
Martinique
Mexico 581 1 155 3.7 34.1 62.2 62.0 2.0 0.0
Montserrat
Nicaragua 4 7 21.5 31.1 47.4 112.3 7.7 0.1
Panama 12 31 4.0 16.9 79.1 143.1 8.8 0.0
Paraguay 7 24 22.0 19.2 58.8 112.1 1.9 0.0
Peru 53 177 7.8 33.7 58.4 48.4 4.8 −0.0
Puerto Rico 62 0
.6 50
.1 49
.3 170
.2 0
.0
Saint Barthélemy
Saint Kitts and Nevis 0 1 1.7 16.4 81.8 69.3 17.9 0.0
Saint Lucia 1 1 3.2 16.6 80.2 107.5 9.2 0.0
Saint-Martin (French Part)
Saint Vincent and the Grenadines 0 1 6.9 19.2 73.9 84.0 15.3 0.0
Sint Maarten (Dutch Part)
Suriname 1 10.9 37.8 51.3 −5.9 0.0
Trinidad and Tobago 8 22 0.6 52.4 47.0 2.6 0.0
Turks and Caicos Islands
United States Virgin Islands
Uruguay 23 47 10.1 24.7 65.2 52.9 4.1 0.0
Venezuela (Bolivarian Republic of ) 117 316 45.6 0.3 0.0
Northern America 10 628 16 830 1.1 19.6 79.3 31.1 1.6 0.0
Bermuda 3 0.8 7.8 91.4 7.0
Canada 725 1 736 60.7 1.5 0.0
Greenland 1
Saint Pierre and Miquelon
United States of America 9 899 15 094 1.2 20.0 78.8 29.0 1.6 0.0
Asia 8 870 21 920 5.0 31.2 63.8 60.2 2.3 0.0
Central Asia 37 268 12.9 37.6 49.5 73.7 6.5 0.0
Kazakhstan 18 186 5.3 44.3 50.4 73.2 7.3 0.0
Kyrgyzstan 1 6 19.8 28.7 51.5 141.4 9.1 0.1
Tajikistan 1 7 19.9 20.2 60.0 76.3 0.3 0.1
Turkmenistan 3 24 12.0 54.0 34.0 106.3 10.4 0.0
Uzbekistan 14 45 18.9 36.1 45.0 61.8 2.1 0.0
31
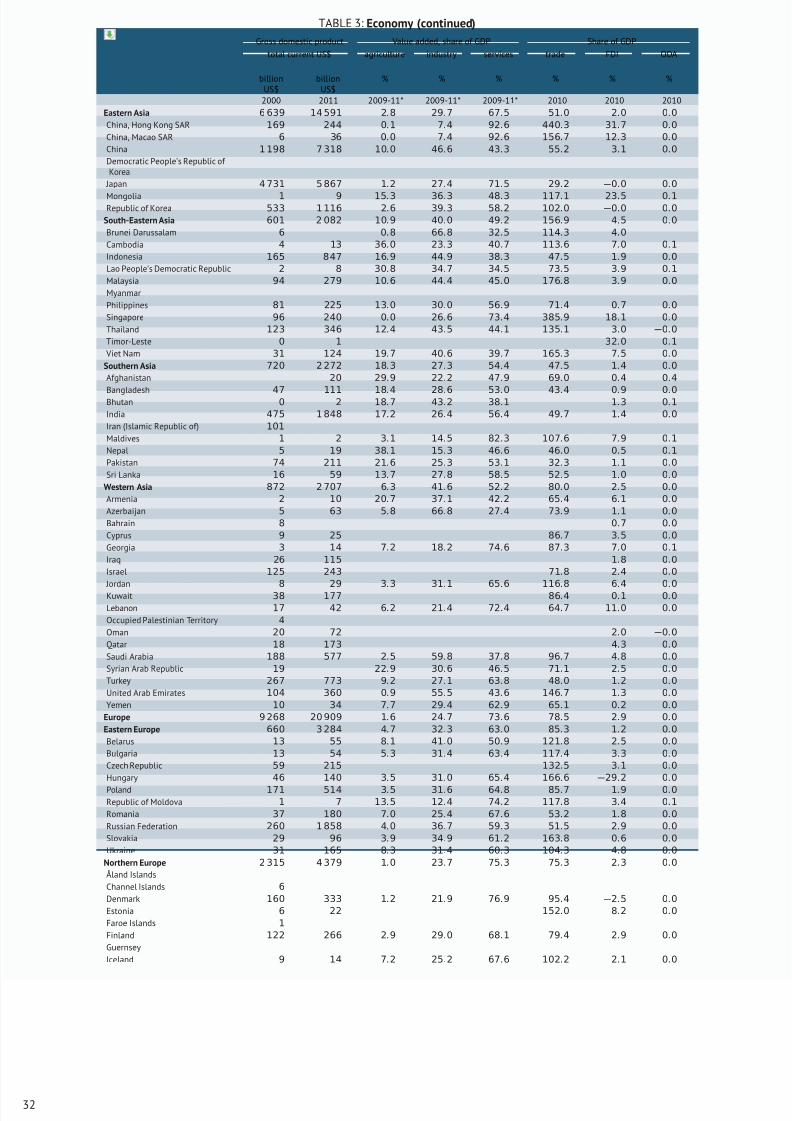
8/16/2019 Informe de la Fao 2013
http://slidepdf.com/reader/full/informe-de-la-fao-2013 50/307
TABLE 3: Economy (continued)
Gross domestic product Value added, share of GDP Share of GDP
total current US$ agriculture industry services trade FDI ODA
billionUS$
billionUS$
% % % % % %
2000 2011 2009-11* 2009-11* 2009-11* 2010 2010 2010
Eastern Asia 6 639 14 591 2.8 29.7 67.5 51.0 2.0 0.0
China, Hong Kong SAR 169 244 0.1 7.4 92.6 440.3 31.7 0.0
China, Macao SAR 6 36 0.0 7.4 92.6 156.7 12.3 0.0
China 1 198 7 318 10.0 46.6 43.3 55.2 3.1 0.0
Democratic People’s Republic of Korea
Japan 4 731 5 867 1.2 27.4 71.5 29.2 −0.0 0.0
Mongolia 1 9 15.3 36.3 48.3 117.1 23.5 0.1Republic of Korea 533 1 116 2.6 39.3 58.2 102.0 −0.0 0.0
South-Eastern Asia 601 2 082 10.9 40.0 49.2 156.9 4.5 0.0
Brunei Darussalam 6 0.8 66.8 32.5 114.3 4.0
Cambodia 4 13 36.0 23.3 40.7 113.6 7.0 0.1
Indonesia 165 847 16.9 44.9 38.3 47.5 1.9 0.0
Lao People’s Democratic Republic 2 8 30.8 34.7 34.5 73.5 3.9 0.1
Malaysia 94 279 10.6 44.4 45.0 176.8 3.9 0.0
Myanmar
Philippines 81 225 13.0 30.0 56.9 71.4 0.7 0.0
Singapore 96 240 0.0 26.6 73.4 385.9 18.1 0.0
Thailand 123 346 12.4 43.5 44.1 135.1 3.0 −0.0
Timor-Leste 0 1 32.0 0.1
Viet Nam 31 124 19.7 40.6 39.7 165.3 7.5 0.0
Southern Asia 720 2 272 18.3 27.3 54.4 47.5 1.4 0.0
Afghanistan 20 29.9 22.2 47.9 69.0 0.4 0.4
Bangladesh 47 111 18.4 28.6 53.0 43.4 0.9 0.0Bhutan 0 2 18.7 43.2 38.1 1.3 0.1
India 475 1 848 17.2 26.4 56.4 49.7 1.4 0.0
Iran (Islamic Republic of) 101
Maldives 1 2 3.1 14.5 82.3 107.6 7.9 0.1
Nepal 5 19 38.1 15.3 46.6 46.0 0.5 0.1
Pakistan 74 211 21.6 25.3 53.1 32.3 1.1 0.0
Sri Lanka 16 59 13.7 27.8 58.5 52.5 1.0 0.0
Western Asia 872 2 707 6.3 41.6 52.2 80.0 2.5 0.0
Armenia 2 10 20.7 37.1 42.2 65.4 6.1 0.0
Azerbaijan 5 63 5.8 66.8 27.4 73.9 1.1 0.0
Bahrain 8 0.7 0.0
Cyprus 9 25 86.7 3.5 0.0
Georgia 3 14 7.2 18.2 74.6 87.3 7.0 0.1
Iraq 26 115 1.8 0.0
Israel 125 243 71.8 2.4 0.0
Jordan 8 29 3.3 31.1 65.6 116.8 6.4 0.0
Kuwait 38 177 86.4 0.1 0.0
Lebanon 17 42 6.2 21.4 72.4 64.7 11.0 0.0
Occupied Palestinian Territory 4
Oman 20 72 2.0 −0.0
Qatar 18 173 4.3 0.0
Saudi Arabia 188 577 2.5 59.8 37.8 96.7 4.8 0.0
Syrian Arab Republic 19 22.9 30.6 46.5 71.1 2.5 0.0
Turkey 267 773 9.2 27.1 63.8 48.0 1.2 0.0
United Arab Emirates 104 360 0.9 55.5 43.6 146.7 1.3 0.0
Yemen 10 34 7.7 29.4 62.9 65.1 0.2 0.0
Europe 9 268 20 909 1.6 24.7 73.6 78.5 2.9 0.0
Eastern Europe 660 3 284 4.7 32.3 63.0 85.3 1.2 0.0
Belarus 13 55 8.1 41.0 50.9 121.8 2.5 0.0
Bulgaria 13 54 5.3 31.4 63.4 117.4 3.3 0.0
Czech Republic 59 215 132.5 3.1 0.0
Hungary 46 140 3.5 31.0 65.4 166.6 −29.2 0.0
Poland 171 514 3.5 31.6 64.8 85.7 1.9 0.0
Republic of Moldova 1 7 13.5 12.4 74.2 117.8 3.4 0.1
Romania 37 180 7.0 25.4 67.6 53.2 1.8 0.0
Russian Federation 260 1 858 4.0 36.7 59.3 51.5 2.9 0.0
Slovakia 29 96 3.9 34.9 61.2 163.8 0.6 0.0
Ukraine 31 165 8.3 31.4 60.3 104.3 4.8 0.0
Northern Europe 2 315 4 379 1.0 23.7 75.3 75.3 2.3 0.0
Åland Islands
Channel Islands 6
Denmark 160 333 1.2 21.9 76.9 95.4 −2.5 0.0
Estonia 6 22 152.0 8.2 0.0
Faroe Islands 1
Finland 122 266 2.9 29.0 68.1 79.4 2.9 0.0
Guernsey
Iceland 9 14 7.2 25.2 67.6 102.2 2.1 0.0
32
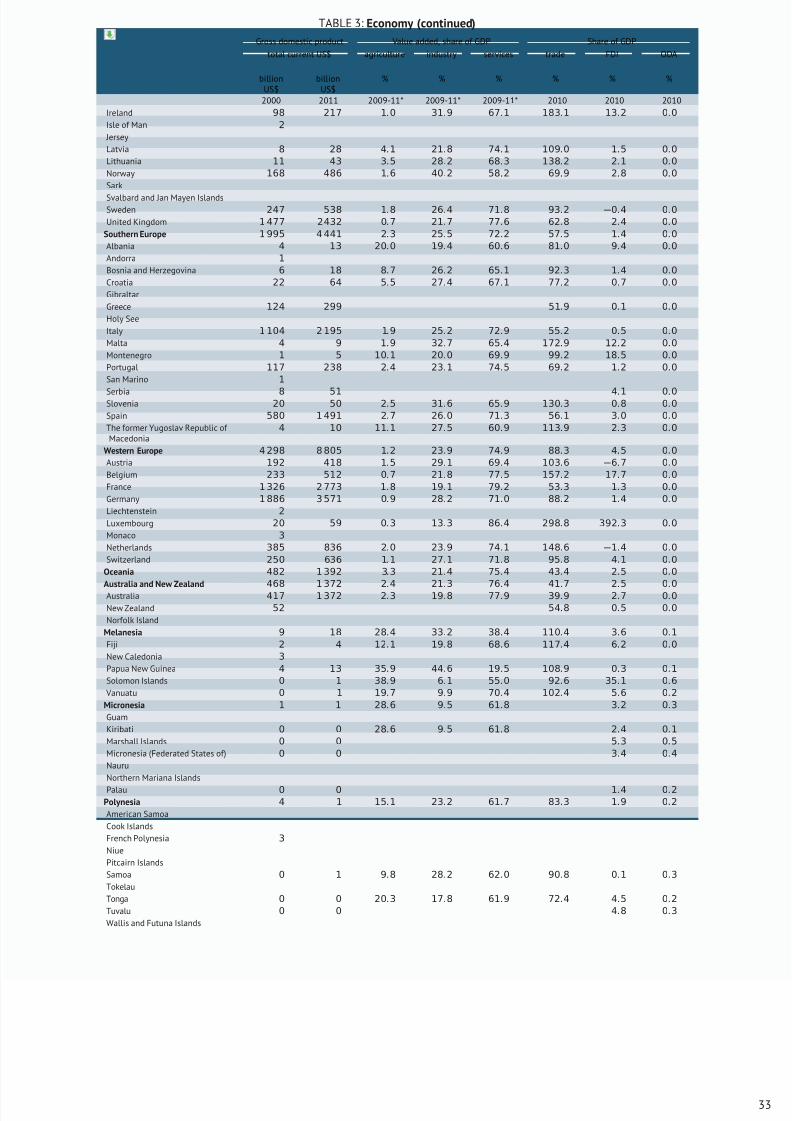
8/16/2019 Informe de la Fao 2013
http://slidepdf.com/reader/full/informe-de-la-fao-2013 51/307
TABLE 3: Economy (continued)
Gross domestic product Value added, share of GDP Share of GDP
total current US$ agriculture industry services trade FDI ODA
billionUS$
billionUS$
% % % % % %
2000 2011 2009-11* 2009-11* 2009-11* 2010 2010 2010
Ireland 98 217 1.0 31.9 67.1 183.1 13.2 0.0
Isle of Man 2
Jersey
Latvia 8 28 4.1 21.8 74.1 109.0 1.5 0.0
Lithuania 11 43 3.5 28.2 68.3 138.2 2.1 0.0
Norway 168 486 1.6 40.2 58.2 69.9 2.8 0.0
Sark
Svalbard and Jan Mayen IslandsSweden 247 538 1.8 26.4 71.8 93.2 −0.4 0.0
United Kingdom 1 477 2432 0.7 21.7 77.6 62.8 2.4 0.0
Southern Europe 1 995 4 441 2.3 25.5 72.2 57.5 1.4 0.0
Albania 4 13 20.0 19.4 60.6 81.0 9.4 0.0
Andorra 1
Bosnia and Herzegovina 6 18 8.7 26.2 65.1 92.3 1.4 0.0
Croatia 22 64 5.5 27.4 67.1 77.2 0.7 0.0
Gibraltar
Greece 124 299 51.9 0.1 0.0
Holy See
Italy 1 104 2 195 1.9 25.2 72.9 55.2 0.5 0.0
Malta 4 9 1.9 32.7 65.4 172.9 12.2 0.0
Montenegro 1 5 10.1 20.0 69.9 99.2 18.5 0.0
Portugal 117 238 2.4 23.1 74.5 69.2 1.2 0.0
San Marino 1
Serbia 8 51 4.1 0.0Slovenia 20 50 2.5 31.6 65.9 130.3 0.8 0.0
Spain 580 1 491 2.7 26.0 71.3 56.1 3.0 0.0
The former Yugoslav Republic of Macedonia
4 10 11.1 27.5 60.9 113.9 2.3 0.0
Western Europe 4 298 8 805 1.2 23.9 74.9 88.3 4.5 0.0
Austria 192 418 1.5 29.1 69.4 103.6 −6.7 0.0
Belgium 233 512 0.7 21.8 77.5 157.2 17.7 0.0
France 1 326 2 773 1.8 19.1 79.2 53.3 1.3 0.0
Germany 1 886 3 571 0.9 28.2 71.0 88.2 1.4 0.0
Liechtenstein 2
Luxembourg 20 59 0.3 13.3 86.4 298.8 392.3 0.0
Monaco 3
Netherlands 385 836 2.0 23.9 74.1 148.6 −1.4 0.0
Switzerland 250 636 1.1 27.1 71.8 95.8 4.1 0.0
Oceania 482 1 392 3.3 21.4 75.4 43.4 2.5 0.0
Australia and New Zealand 468 1 372 2.4 21.3 76.4 41.7 2.5 0.0
Australia 417 1 372 2.3 19.8 77.9 39.9 2.7 0.0
New Zealand 52 54.8 0.5 0.0
Norfolk Island
Melanesia 9 18 28.4 33.2 38.4 110.4 3.6 0.1
Fiji 2 4 12.1 19.8 68.6 117.4 6.2 0.0
New Caledonia 3
Papua New Guinea 4 13 35.9 44.6 19.5 108.9 0.3 0.1
Solomon Islands 0 1 38.9 6.1 55.0 92.6 35.1 0.6
Vanuatu 0 1 19.7 9.9 70.4 102.4 5.6 0.2
Micronesia 1 1 28.6 9.5 61.8 3.2 0.3
Guam
Kiribati 0 0 28.6 9.5 61.8 2.4 0.1
Marshall Islands 0 0 5.3 0.5
Micronesia (Federated States of) 0 0 3.4 0.4
Nauru
Northern Mariana Islands
Palau 0 0 1.4 0.2
Polynesia 4 1 15.1 23.2 61.7 83.3 1.9 0.2
American Samoa
Cook Islands
French Polynesia 3
Niue
Pitcairn Islands
Samoa 0 1 9.8 28.2 62.0 90.8 0.1 0.3
Tokelau
Tonga 0 0 20.3 17.8 61.9 72.4 4.5 0.2
Tuvalu 0 0 4.8 0.3
Wallis and Futuna Islands
33
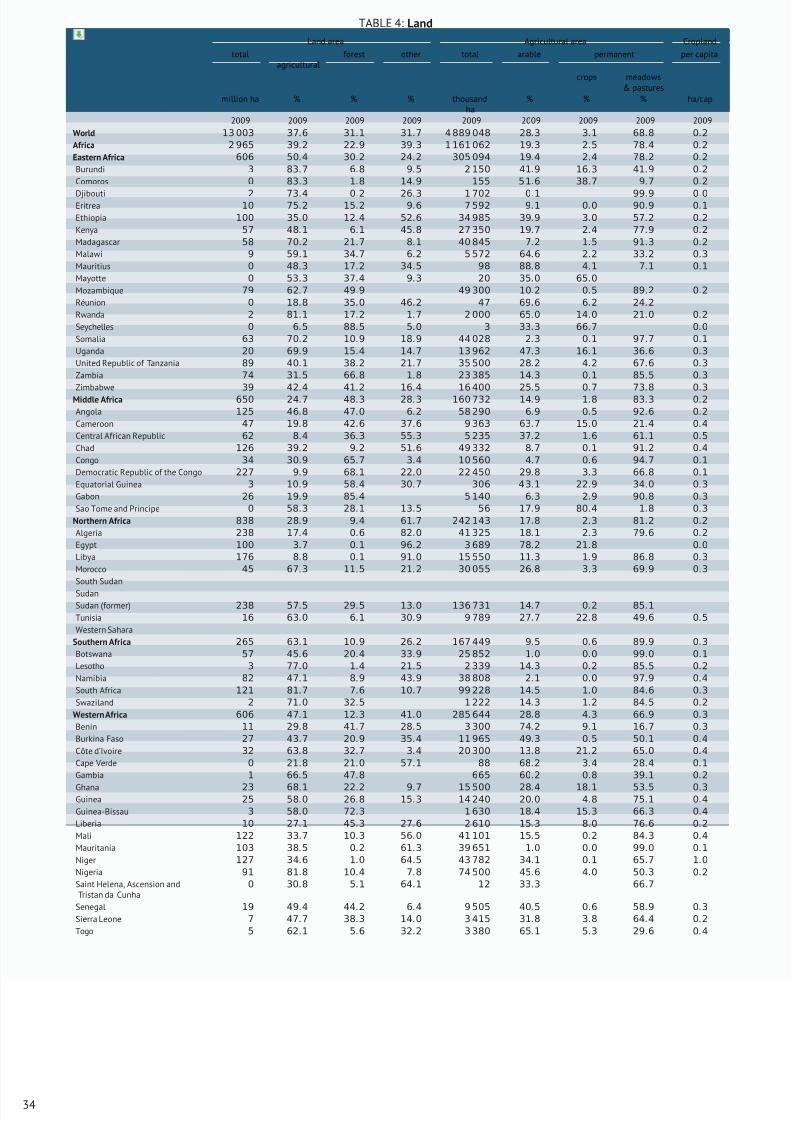
8/16/2019 Informe de la Fao 2013
http://slidepdf.com/reader/full/informe-de-la-fao-2013 52/307
TABLE 4: Land
Land area Agricultural area Cropland
totalagricultural
forest other total arable permanent per capita
crops meadows& pastures
million ha % % % thousandha
% % % ha/cap
2009 2009 2009 2009 2009 2009 2009 2009 2009
World 13 003 37.6 31.1 31.7 4 889 048 28.3 3.1 68.8 0.2
Africa 2 965 39.2 22.9 39.3 1 161 062 19.3 2.5 78.4 0.2
Eastern Africa 606 50.4 30.2 24.2 305 094 19.4 2.4 78.2 0.2
Burundi 3 83.7 6.8 9.5 2 150 41.9 16.3 41.9 0.2
Comoros 0 83.3 1.8 14.9 155 51.6 38.7 9.7 0.2
Djibouti 2 73.4 0.2 26.3 1 702 0.1 99.9 0.0Eritrea 10 75.2 15.2 9.6 7 592 9.1 0.0 90.9 0.1
Ethiopia 100 35.0 12.4 52.6 34 985 39.9 3.0 57.2 0.2
Kenya 57 48.1 6.1 45.8 27 350 19.7 2.4 77.9 0.2
Madagascar 58 70.2 21.7 8.1 40 845 7.2 1.5 91.3 0.2
Malawi 9 59.1 34.7 6.2 5 572 64.6 2.2 33.2 0.3
Mauritius 0 48.3 17.2 34.5 98 88.8 4.1 7.1 0.1
Mayotte 0 53.3 37.4 9.3 20 35.0 65.0
Mozambique 79 62.7 49.9 49 300 10.2 0.5 89.2 0.2
Réunion 0 18.8 35.0 46.2 47 69.6 6.2 24.2
Rwanda 2 81.1 17.2 1.7 2 000 65.0 14.0 21.0 0.2
Seychelles 0 6.5 88.5 5.0 3 33.3 66.7 0.0
Somalia 63 70.2 10.9 18.9 44 028 2.3 0.1 97.7 0.1
Uganda 20 69.9 15.4 14.7 13 962 47.3 16.1 36.6 0.3
United Republic of Tanzania 89 40.1 38.2 21.7 35 500 28.2 4.2 67.6 0.3
Zambia 74 31.5 66.8 1.8 23 385 14.3 0.1 85.5 0.3
Zimbabwe 39 42.4 41.2 16.4 16 400 25.5 0.7 73.8 0.3
Middle Africa 650 24.7 48.3 28.3 160 732 14.9 1.8 83.3 0.2
Angola 125 46.8 47.0 6.2 58 290 6.9 0.5 92.6 0.2
Cameroon 47 19.8 42.6 37.6 9 363 63.7 15.0 21.4 0.4
Central African Republic 62 8.4 36.3 55.3 5 235 37.2 1.6 61.1 0.5
Chad 126 39.2 9.2 51.6 49 332 8.7 0.1 91.2 0.4
Congo 34 30.9 65.7 3.4 10 560 4.7 0.6 94.7 0.1
Democratic Republic of the Congo 227 9.9 68.1 22.0 22 450 29.8 3.3 66.8 0.1
Equatorial Guinea 3 10.9 58.4 30.7 306 43.1 22.9 34.0 0.3
Gabon 26 19.9 85.4 5 140 6.3 2.9 90.8 0.3
Sao Tome and Principe 0 58.3 28.1 13.5 56 17.9 80.4 1.8 0.3
Northern Africa 838 28.9 9.4 61.7 242 143 17.8 2.3 81.2 0.2
Algeria 238 17.4 0.6 82.0 41 325 18.1 2.3 79.6 0.2
Egypt 100 3.7 0.1 96.2 3 689 78.2 21.8 0.0
Libya 176 8.8 0.1 91.0 15 550 11.3 1.9 86.8 0.3
Morocco 45 67.3 11.5 21.2 30 055 26.8 3.3 69.9 0.3
South Sudan
SudanSudan (former) 238 57.5 29.5 13.0 136 731 14.7 0.2 85.1
Tunisia 16 63.0 6.1 30.9 9 789 27.7 22.8 49.6 0.5
Western Sahara
Southern Africa 265 63.1 10.9 26.2 167 449 9.5 0.6 89.9 0.3
Botswana 57 45.6 20.4 33.9 25 852 1.0 0.0 99.0 0.1
Lesotho 3 77.0 1.4 21.5 2 339 14.3 0.2 85.5 0.2
Namibia 82 47.1 8.9 43.9 38 808 2.1 0.0 97.9 0.4
South Africa 121 81.7 7.6 10.7 99 228 14.5 1.0 84.6 0.3
Swaziland 2 71.0 32.5 1 222 14.3 1.2 84.5 0.2
Western Africa 606 47.1 12.3 41.0 285 644 28.8 4.3 66.9 0.3
Benin 11 29.8 41.7 28.5 3 300 74.2 9.1 16.7 0.3
Burkina Faso 27 43.7 20.9 35.4 11 965 49.3 0.5 50.1 0.4
Côte d’Ivoire 32 63.8 32.7 3.4 20 300 13.8 21.2 65.0 0.4
Cape Verde 0 21.8 21.0 57.1 88 68.2 3.4 28.4 0.1
Gambia 1 66.5 47.8 665 60.2 0.8 39.1 0.2
Ghana 23 68.1 22.2 9.7 15 500 28.4 18.1 53.5 0.3Guinea 25 58.0 26.8 15.3 14 240 20.0 4.8 75.1 0.4
Guinea-Bissau 3 58.0 72.3 1 630 18.4 15.3 66.3 0.4
Liberia 10 27.1 45.3 27.6 2 610 15.3 8.0 76.6 0.2
Mali 122 33.7 10.3 56.0 41 101 15.5 0.2 84.3 0.4
Mauritania 103 38.5 0.2 61.3 39 651 1.0 0.0 99.0 0.1
Niger 127 34.6 1.0 64.5 43 782 34.1 0.1 65.7 1.0
Nigeria 91 81.8 10.4 7.8 74 500 45.6 4.0 50.3 0.2
Saint Helena, Ascension andTristan da Cunha
0 30.8 5.1 64.1 12 33.3 66.7
Senegal 19 49.4 44.2 6.4 9 505 40.5 0.6 58.9 0.3
Sierra Leone 7 47.7 38.3 14.0 3 415 31.8 3.8 64.4 0.2
Togo 5 62.1 5.6 32.2 3 380 65.1 5.3 29.6 0.4
34
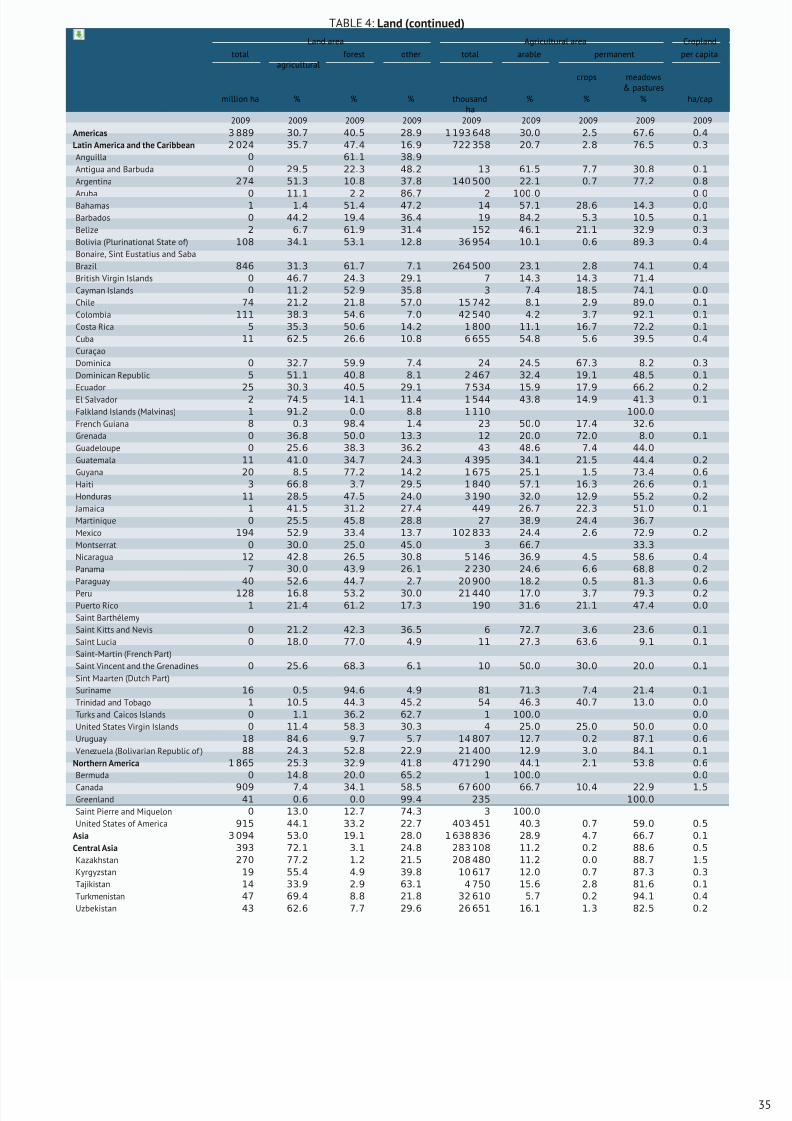
8/16/2019 Informe de la Fao 2013
http://slidepdf.com/reader/full/informe-de-la-fao-2013 53/307
TABLE 4: Land (continued)
Land area Agricultural area Cropland
totalagricultural
forest other total arable permanent per capita
crops meadows& pastures
million ha % % % thousandha
% % % ha/cap
2009 2009 2009 2009 2009 2009 2009 2009 2009
Americas 3 889 30.7 40.5 28.9 1 193 648 30.0 2.5 67.6 0.4
Latin America and the Caribbean 2 024 35.7 47.4 16.9 722 358 20.7 2.8 76.5 0.3
Anguilla 0 61.1 38.9
Antigua and Barbuda 0 29.5 22.3 48.2 13 61.5 7.7 30.8 0.1
Argentina 274 51.3 10.8 37.8 140 500 22.1 0.7 77.2 0.8
Aruba 0 11.1 2.2 86.7 2 100.0 0.0Bahamas 1 1.4 51.4 47.2 14 57.1 28.6 14.3 0.0
Barbados 0 44.2 19.4 36.4 19 84.2 5.3 10.5 0.1
Belize 2 6.7 61.9 31.4 152 46.1 21.1 32.9 0.3
Bolivia (Plurinational State of) 108 34.1 53.1 12.8 36 954 10.1 0.6 89.3 0.4
Bonaire, Sint Eustatius and Saba
Brazil 846 31.3 61.7 7.1 264 500 23.1 2.8 74.1 0.4
British Virgin Islands 0 46.7 24.3 29.1 7 14.3 14.3 71.4
Cayman Islands 0 11.2 52.9 35.8 3 7.4 18.5 74.1 0.0
Chile 74 21.2 21.8 57.0 15 742 8.1 2.9 89.0 0.1
Colombia 111 38.3 54.6 7.0 42 540 4.2 3.7 92.1 0.1
Costa Rica 5 35.3 50.6 14.2 1 800 11.1 16.7 72.2 0.1
Cuba 11 62.5 26.6 10.8 6 655 54.8 5.6 39.5 0.4
Curaçao
Dominica 0 32.7 59.9 7.4 24 24.5 67.3 8.2 0.3
Dominican Republic 5 51.1 40.8 8.1 2 467 32.4 19.1 48.5 0.1
Ecuador 25 30.3 40.5 29.1 7 534 15.9 17.9 66.2 0.2
El Salvador 2 74.5 14.1 11.4 1 544 43.8 14.9 41.3 0.1
Falkland Islands (Malvinas) 1 91.2 0.0 8.8 1 110 100.0
French Guiana 8 0.3 98.4 1.4 23 50.0 17.4 32.6
Grenada 0 36.8 50.0 13.3 12 20.0 72.0 8.0 0.1
Guadeloupe 0 25.6 38.3 36.2 43 48.6 7.4 44.0
Guatemala 11 41.0 34.7 24.3 4 395 34.1 21.5 44.4 0.2
Guyana 20 8.5 77.2 14.2 1 675 25.1 1.5 73.4 0.6
Haiti 3 66.8 3.7 29.5 1 840 57.1 16.3 26.6 0.1
Honduras 11 28.5 47.5 24.0 3 190 32.0 12.9 55.2 0.2
Jamaica 1 41.5 31.2 27.4 449 26.7 22.3 51.0 0.1
Martinique 0 25.5 45.8 28.8 27 38.9 24.4 36.7
Mexico 194 52.9 33.4 13.7 102 833 24.4 2.6 72.9 0.2
Montserrat 0 30.0 25.0 45.0 3 66.7 33.3
Nicaragua 12 42.8 26.5 30.8 5 146 36.9 4.5 58.6 0.4
Panama 7 30.0 43.9 26.1 2 230 24.6 6.6 68.8 0.2
Paraguay 40 52.6 44.7 2.7 20 900 18.2 0.5 81.3 0.6
Peru 128 16.8 53.2 30.0 21 440 17.0 3.7 79.3 0.2
Puerto Rico 1 21.4 61.2 17.3 190 31.6 21.1 47.4 0.0
Saint Barthélemy
Saint Kitts and Nevis 0 21.2 42.3 36.5 6 72.7 3.6 23.6 0.1
Saint Lucia 0 18.0 77.0 4.9 11 27.3 63.6 9.1 0.1
Saint-Martin (French Part)
Saint Vincent and the Grenadines 0 25.6 68.3 6.1 10 50.0 30.0 20.0 0.1
Sint Maarten (Dutch Part)
Suriname 16 0.5 94.6 4.9 81 71.3 7.4 21.4 0.1
Trinidad and Tobago 1 10.5 44.3 45.2 54 46.3 40.7 13.0 0.0
Turks and Caicos Islands 0 1.1 36.2 62.7 1 100.0 0.0
United States Virgin Islands 0 11.4 58.3 30.3 4 25.0 25.0 50.0 0.0
Uruguay 18 84.6 9.7 5.7 14 807 12.7 0.2 87.1 0.6
Venezuela (Bolivarian Republic of ) 88 24.3 52.8 22.9 21 400 12.9 3.0 84.1 0.1
Northern America 1 865 25.3 32.9 41.8 471 290 44.1 2.1 53.8 0.6
Bermuda 0 14.8 20.0 65.2 1 100.0 0.0
Canada 909 7.4 34.1 58.5 67 600 66.7 10.4 22.9 1.5Greenland 41 0.6 0.0 99.4 235 100.0
Saint Pierre and Miquelon 0 13.0 12.7 74.3 3 100.0
United States of America 915 44.1 33.2 22.7 403 451 40.3 0.7 59.0 0.5
Asia 3 094 53.0 19.1 28.0 1 638 836 28.9 4.7 66.7 0.1
Central Asia 393 72.1 3.1 24.8 283 108 11.2 0.2 88.6 0.5
Kazakhstan 270 77.2 1.2 21.5 208 480 11.2 0.0 88.7 1.5
Kyrgyzstan 19 55.4 4.9 39.8 10 617 12.0 0.7 87.3 0.3
Tajikistan 14 33.9 2.9 63.1 4 750 15.6 2.8 81.6 0.1
Turkmenistan 47 69.4 8.8 21.8 32 610 5.7 0.2 94.1 0.4
Uzbekistan 43 62.6 7.7 29.6 26 651 16.1 1.3 82.5 0.2
35
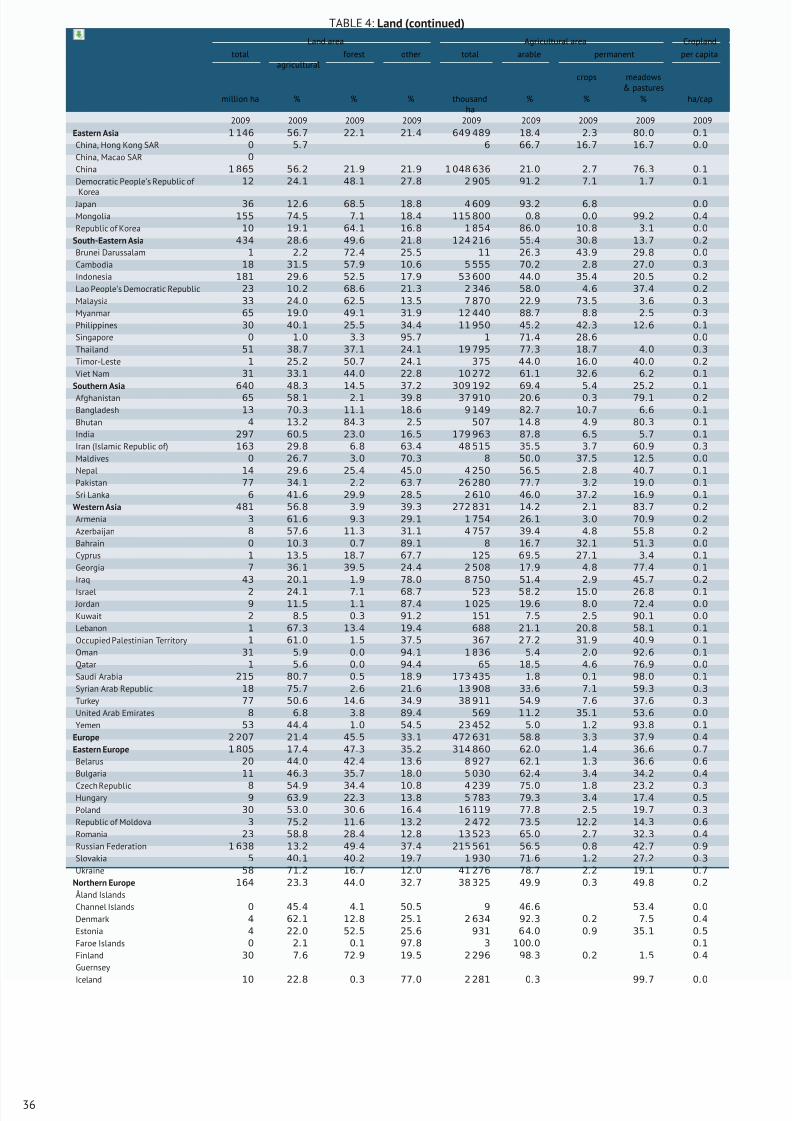
8/16/2019 Informe de la Fao 2013
http://slidepdf.com/reader/full/informe-de-la-fao-2013 54/307
TABLE 4: Land (continued)
Land area Agricultural area Cropland
totalagricultural
forest other total arable permanent per capita
crops meadows& pastures
million ha % % % thousandha
% % % ha/cap
2009 2009 2009 2009 2009 2009 2009 2009 2009
Eastern Asia 1 146 56.7 22.1 21.4 649 489 18.4 2.3 80.0 0.1
China, Hong Kong SAR 0 5.7 6 66.7 16.7 16.7 0.0
China, Macao SAR 0
China 1 865 56.2 21.9 21.9 1 048 636 21.0 2.7 76.3 0.1
Democratic People’s Republic of
Korea
12 24.1 48.1 27.8 2 905 91.2 7.1 1.7 0.1
Japan 36 12.6 68.5 18.8 4 609 93.2 6.8 0.0
Mongolia 155 74.5 7.1 18.4 115 800 0.8 0.0 99.2 0.4
Republic of Korea 10 19.1 64.1 16.8 1 854 86.0 10.8 3.1 0.0
South-Eastern Asia 434 28.6 49.6 21.8 124 216 55.4 30.8 13.7 0.2
Brunei Darussalam 1 2.2 72.4 25.5 11 26.3 43.9 29.8 0.0
Cambodia 18 31.5 57.9 10.6 5 555 70.2 2.8 27.0 0.3
Indonesia 181 29.6 52.5 17.9 53 600 44.0 35.4 20.5 0.2
Lao People’s Democratic Republic 23 10.2 68.6 21.3 2 346 58.0 4.6 37.4 0.2
Malaysia 33 24.0 62.5 13.5 7 870 22.9 73.5 3.6 0.3
Myanmar 65 19.0 49.1 31.9 12 440 88.7 8.8 2.5 0.3
Philippines 30 40.1 25.5 34.4 11 950 45.2 42.3 12.6 0.1
Singapore 0 1.0 3.3 95.7 1 71.4 28.6 0.0
Thailand 51 38.7 37.1 24.1 19 795 77.3 18.7 4.0 0.3
Timor-Leste 1 25.2 50.7 24.1 375 44.0 16.0 40.0 0.2
Viet Nam 31 33.1 44.0 22.8 10 272 61.1 32.6 6.2 0.1
Southern Asia 640 48.3 14.5 37.2 309 192 69.4 5.4 25.2 0.1
Afghanistan 65 58.1 2.1 39.8 37 910 20.6 0.3 79.1 0.2
Bangladesh 13 70.3 11.1 18.6 9 149 82.7 10.7 6.6 0.1
Bhutan 4 13.2 84.3 2.5 507 14.8 4.9 80.3 0.1
India 297 60.5 23.0 16.5 179 963 87.8 6.5 5.7 0.1
Iran (Islamic Republic of) 163 29.8 6.8 63.4 48 515 35.5 3.7 60.9 0.3
Maldives 0 26.7 3.0 70.3 8 50.0 37.5 12.5 0.0
Nepal 14 29.6 25.4 45.0 4 250 56.5 2.8 40.7 0.1
Pakistan 77 34.1 2.2 63.7 26 280 77.7 3.2 19.0 0.1
Sri Lanka 6 41.6 29.9 28.5 2 610 46.0 37.2 16.9 0.1
Western Asia 481 56.8 3.9 39.3 272 831 14.2 2.1 83.7 0.2
Armenia 3 61.6 9.3 29.1 1 754 26.1 3.0 70.9 0.2
Azerbaijan 8 57.6 11.3 31.1 4 757 39.4 4.8 55.8 0.2
Bahrain 0 10.3 0.7 89.1 8 16.7 32.1 51.3 0.0
Cyprus 1 13.5 18.7 67.7 125 69.5 27.1 3.4 0.1
Georgia 7 36.1 39.5 24.4 2 508 17.9 4.8 77.4 0.1
Iraq 43 20.1 1.9 78.0 8 750 51.4 2.9 45.7 0.2
Israel 2 24.1 7.1 68.7 523 58.2 15.0 26.8 0.1
Jordan 9 11.5 1.1 87.4 1 025 19.6 8.0 72.4 0.0
Kuwait 2 8.5 0.3 91.2 151 7.5 2.5 90.1 0.0
Lebanon 1 67.3 13.4 19.4 688 21.1 20.8 58.1 0.1
Occupied Palestinian Territory 1 61.0 1.5 37.5 367 27.2 31.9 40.9 0.1
Oman 31 5.9 0.0 94.1 1 836 5.4 2.0 92.6 0.1
Qatar 1 5.6 0.0 94.4 65 18.5 4.6 76.9 0.0
Saudi Arabia 215 80.7 0.5 18.9 173 435 1.8 0.1 98.0 0.1
Syrian Arab Republic 18 75.7 2.6 21.6 13 908 33.6 7.1 59.3 0.3
Turkey 77 50.6 14.6 34.9 38 911 54.9 7.6 37.6 0.3
United Arab Emirates 8 6.8 3.8 89.4 569 11.2 35.1 53.6 0.0
Yemen 53 44.4 1.0 54.5 23 452 5.0 1.2 93.8 0.1
Europe 2 207 21.4 45.5 33.1 472 631 58.8 3.3 37.9 0.4
Eastern Europe 1 805 17.4 47.3 35.2 314 860 62.0 1.4 36.6 0.7
Belarus 20 44.0 42.4 13.6 8 927 62.1 1.3 36.6 0.6
Bulgaria 11 46.3 35.7 18.0 5 030 62.4 3.4 34.2 0.4
Czech Republic 8 54.9 34.4 10.8 4 239 75.0 1.8 23.2 0.3Hungary 9 63.9 22.3 13.8 5 783 79.3 3.4 17.4 0.5
Poland 30 53.0 30.6 16.4 16 119 77.8 2.5 19.7 0.3
Republic of Moldova 3 75.2 11.6 13.2 2 472 73.5 12.2 14.3 0.6
Romania 23 58.8 28.4 12.8 13 523 65.0 2.7 32.3 0.4
Russian Federation 1 638 13.2 49.4 37.4 215 561 56.5 0.8 42.7 0.9
Slovakia 5 40.1 40.2 19.7 1 930 71.6 1.2 27.2 0.3
Ukraine 58 71.2 16.7 12.0 41 276 78.7 2.2 19.1 0.7
Northern Europe 164 23.3 44.0 32.7 38 325 49.9 0.3 49.8 0.2
Åland Islands
Channel Islands 0 45.4 4.1 50.5 9 46.6 53.4 0.0
Denmark 4 62.1 12.8 25.1 2 634 92.3 0.2 7.5 0.4
Estonia 4 22.0 52.5 25.6 931 64.0 0.9 35.1 0.5
Faroe Islands 0 2.1 0.1 97.8 3 100.0 0.1
Finland 30 7.6 72.9 19.5 2 296 98.3 0.2 1.5 0.4
Guernsey
Iceland 10 22.8 0.3 77.0 2 281 0.3 99.7 0.0
36
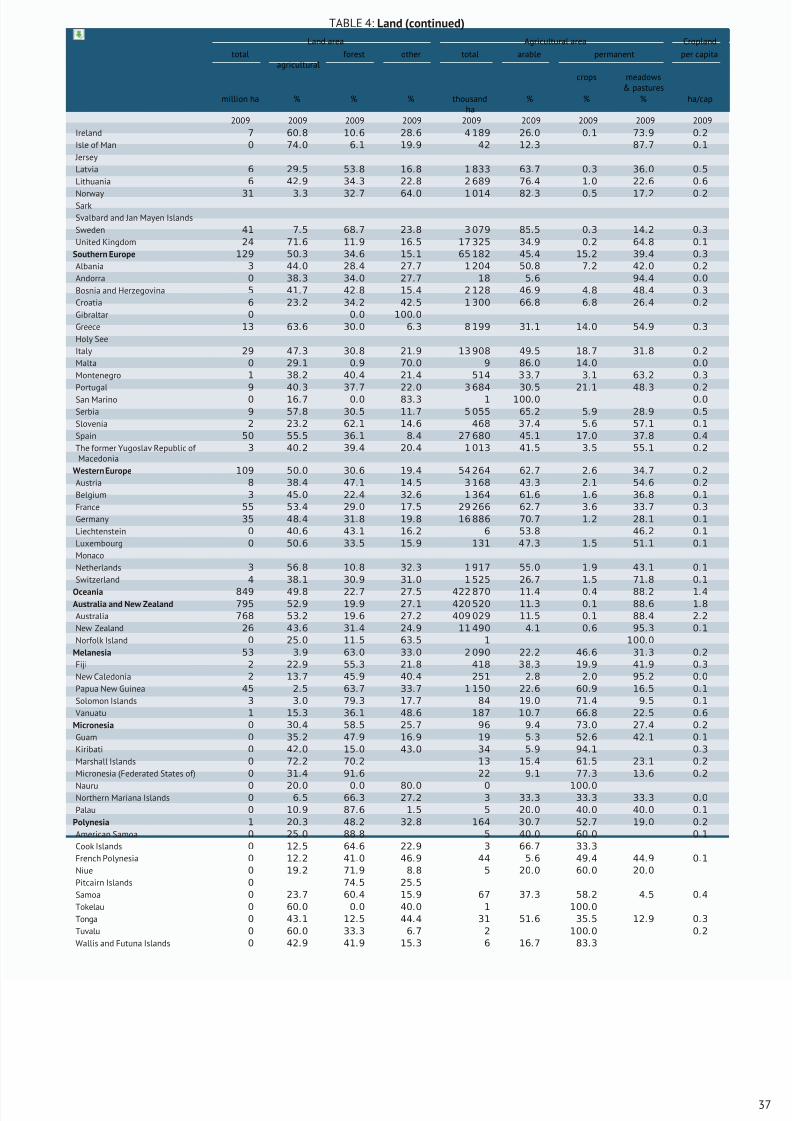
8/16/2019 Informe de la Fao 2013
http://slidepdf.com/reader/full/informe-de-la-fao-2013 55/307
TABLE 4: Land (continued)
Land area Agricultural area Cropland
totalagricultural
forest other total arable permanent per capita
crops meadows& pastures
million ha % % % thousandha
% % % ha/cap
2009 2009 2009 2009 2009 2009 2009 2009 2009
Ireland 7 60.8 10.6 28.6 4 189 26.0 0.1 73.9 0.2
Isle of Man 0 74.0 6.1 19.9 42 12.3 87.7 0.1
Jersey
Latvia 6 29.5 53.8 16.8 1 833 63.7 0.3 36.0 0.5
Lithuania 6 42.9 34.3 22.8 2 689 76.4 1.0 22.6 0.6
Norway 31 3.3 32.7 64.0 1 014 82.3 0.5 17.2 0.2Sark
Svalbard and Jan Mayen Islands
Sweden 41 7.5 68.7 23.8 3 079 85.5 0.3 14.2 0.3
United Kingdom 24 71.6 11.9 16.5 17 325 34.9 0.2 64.8 0.1
Southern Europe 129 50.3 34.6 15.1 65 182 45.4 15.2 39.4 0.3
Albania 3 44.0 28.4 27.7 1 204 50.8 7.2 42.0 0.2
Andorra 0 38.3 34.0 27.7 18 5.6 94.4 0.0
Bosnia and Herzegovina 5 41.7 42.8 15.4 2 128 46.9 4.8 48.4 0.3
Croatia 6 23.2 34.2 42.5 1 300 66.8 6.8 26.4 0.2
Gibraltar 0 0.0 100.0
Greece 13 63.6 30.0 6.3 8 199 31.1 14.0 54.9 0.3
Holy See
Italy 29 47.3 30.8 21.9 13 908 49.5 18.7 31.8 0.2
Malta 0 29.1 0.9 70.0 9 86.0 14.0 0.0
Montenegro 1 38.2 40.4 21.4 514 33.7 3.1 63.2 0.3
Portugal 9 40.3 37.7 22.0 3 684 30.5 21.1 48.3 0.2
San Marino 0 16.7 0.0 83.3 1 100.0 0.0
Serbia 9 57.8 30.5 11.7 5 055 65.2 5.9 28.9 0.5
Slovenia 2 23.2 62.1 14.6 468 37.4 5.6 57.1 0.1
Spain 50 55.5 36.1 8.4 27 680 45.1 17.0 37.8 0.4
The former Yugoslav Republic of Macedonia
3 40.2 39.4 20.4 1 013 41.5 3.5 55.1 0.2
Western Europe 109 50.0 30.6 19.4 54 264 62.7 2.6 34.7 0.2
Austria 8 38.4 47.1 14.5 3 168 43.3 2.1 54.6 0.2
Belgium 3 45.0 22.4 32.6 1 364 61.6 1.6 36.8 0.1
France 55 53.4 29.0 17.5 29 266 62.7 3.6 33.7 0.3
Germany 35 48.4 31.8 19.8 16 886 70.7 1.2 28.1 0.1
Liechtenstein 0 40.6 43.1 16.2 6 53.8 46.2 0.1
Luxembourg 0 50.6 33.5 15.9 131 47.3 1.5 51.1 0.1
Monaco
Netherlands 3 56.8 10.8 32.3 1 917 55.0 1.9 43.1 0.1
Switzerland 4 38.1 30.9 31.0 1 525 26.7 1.5 71.8 0.1
Oceania 849 49.8 22.7 27.5 422 870 11.4 0.4 88.2 1.4
Australia and New Zealand 795 52.9 19.9 27.1 420 520 11.3 0.1 88.6 1.8
Australia 768 53.2 19.6 27.2 409 029 11.5 0.1 88.4 2.2
New Zealand 26 43.6 31.4 24.9 11 490 4.1 0.6 95.3 0.1
Norfolk Island 0 25.0 11.5 63.5 1 100.0
Melanesia 53 3.9 63.0 33.0 2 090 22.2 46.6 31.3 0.2
Fiji 2 22.9 55.3 21.8 418 38.3 19.9 41.9 0.3
New Caledonia 2 13.7 45.9 40.4 251 2.8 2.0 95.2 0.0
Papua New Guinea 45 2.5 63.7 33.7 1 150 22.6 60.9 16.5 0.1
Solomon Islands 3 3.0 79.3 17.7 84 19.0 71.4 9.5 0.1
Vanuatu 1 15.3 36.1 48.6 187 10.7 66.8 22.5 0.6
Micronesia 0 30.4 58.5 25.7 96 9.4 73.0 27.4 0.2
Guam 0 35.2 47.9 16.9 19 5.3 52.6 42.1 0.1
Kiribati 0 42.0 15.0 43.0 34 5.9 94.1 0.3
Marshall Islands 0 72.2 70.2 13 15.4 61.5 23.1 0.2
Micronesia (Federated States of) 0 31.4 91.6 22 9.1 77.3 13.6 0.2
Nauru 0 20.0 0.0 80.0 0 100.0Northern Mariana Islands 0 6.5 66.3 27.2 3 33.3 33.3 33.3 0.0
Palau 0 10.9 87.6 1.5 5 20.0 40.0 40.0 0.1
Polynesia 1 20.3 48.2 32.8 164 30.7 52.7 19.0 0.2
American Samoa 0 25.0 88.8 5 40.0 60.0 0.1
Cook Islands 0 12.5 64.6 22.9 3 66.7 33.3
French Polynesia 0 12.2 41.0 46.9 44 5.6 49.4 44.9 0.1
Niue 0 19.2 71.9 8.8 5 20.0 60.0 20.0
Pitcairn Islands 0 74.5 25.5
Samoa 0 23.7 60.4 15.9 67 37.3 58.2 4.5 0.4
Tokelau 0 60.0 0.0 40.0 1 100.0
Tonga 0 43.1 12.5 44.4 31 51.6 35.5 12.9 0.3
Tuvalu 0 60.0 33.3 6.7 2 100.0 0.2
Wallis and Futuna Islands 0 42.9 41.9 15.3 6 16.7 83.3
37
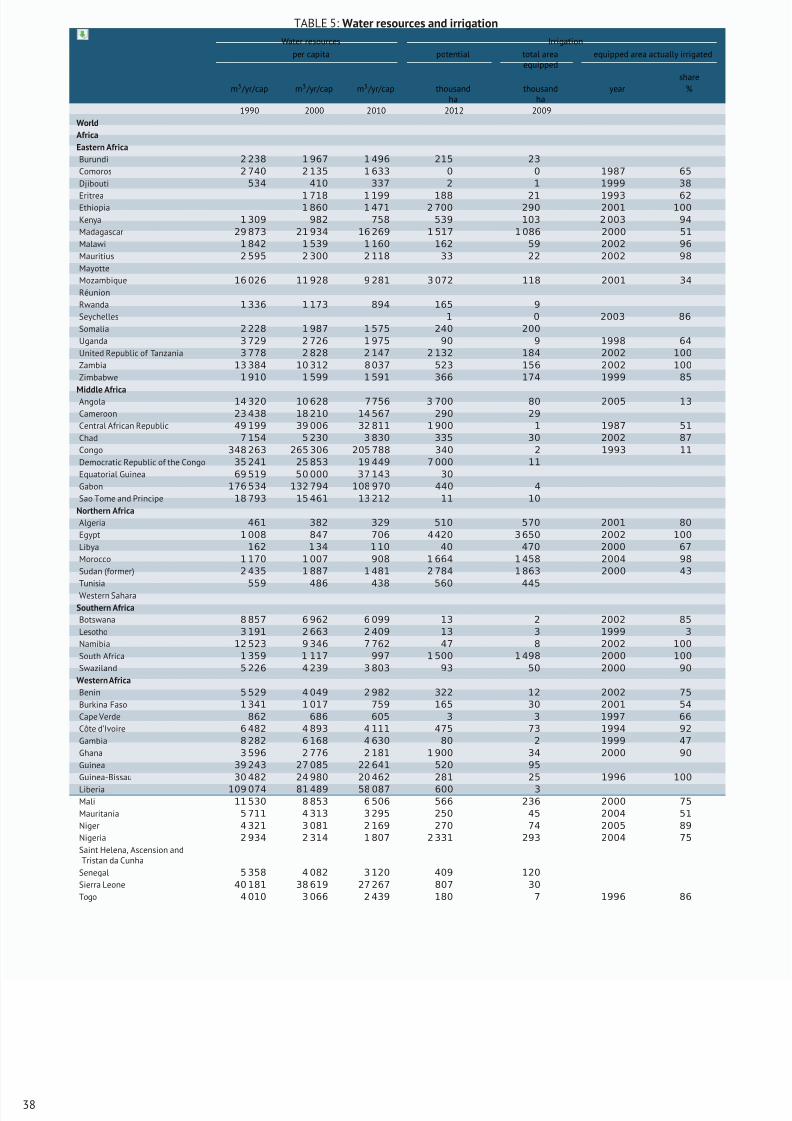
8/16/2019 Informe de la Fao 2013
http://slidepdf.com/reader/full/informe-de-la-fao-2013 56/307
TABLE 5: Water resources and irrigation
Water resources Irrigation
per capita potential total areaequipped
equipped area actually irrigated
sharem3 /yr/cap m3 /yr/cap m3 /yr/cap thousand
hathousand
hayear %
1990 2000 2010 2012 2009
World
Africa
Eastern Africa
Burundi 2 238 1 967 1 496 215 23
Comoros 2 740 2 135 1 633 0 0 1987 65
Djibouti 534 410 337 2 1 1999 38
Eritrea 1 718 1 199 188 21 1993 62Ethiopia 1 860 1 471 2 700 290 2001 100
Kenya 1 309 982 758 539 103 2 003 94
Madagascar 29 873 21 934 16 269 1 517 1 086 2000 51
Malawi 1 842 1 539 1 160 162 59 2002 96
Mauritius 2 595 2 300 2 118 33 22 2002 98
Mayotte
Mozambique 16 026 11 928 9 281 3 072 118 2001 34
Réunion
Rwanda 1 336 1 173 894 165 9
Seychelles 1 0 2003 86
Somalia 2 228 1 987 1 575 240 200
Uganda 3 729 2 726 1 975 90 9 1998 64
United Republic of Tanzania 3 778 2 828 2 147 2 132 184 2002 100
Zambia 13 384 10 312 8 037 523 156 2002 100
Zimbabwe 1 910 1 599 1 591 366 174 1999 85
Middle AfricaAngola 14 320 10 628 7 756 3 700 80 2005 13
Cameroon 23 438 18 210 14 567 290 29
Central African Republic 49 199 39 006 32 811 1 900 1 1987 51
Chad 7 154 5 230 3 830 335 30 2002 87
Congo 348 263 265 306 205 788 340 2 1993 11
Democratic Republic of the Congo 35 241 25 853 19 449 7 000 11
Equatorial Guinea 69 519 50 000 37 143 30
Gabon 176 534 132 794 108 970 440 4
Sao Tome and Principe 18 793 15 461 13 212 11 10
Northern Africa
Algeria 461 382 329 510 570 2001 80
Egypt 1 008 847 706 4 420 3 650 2002 100
Libya 162 1 34 1 10 40 470 2000 67
Morocco 1 170 1 007 908 1 664 1 458 2004 98
Sudan (former) 2 435 1 887 1 481 2 784 1 863 2000 43
Tunisia 559 486 438 560 445
Western Sahara
Southern Africa
Botswana 8 857 6 962 6 099 13 2 2002 85
Lesotho 3 191 2 663 2 409 13 3 1999 3
Namibia 12 523 9 346 7 762 47 8 2002 100
South Africa 1 359 1 117 997 1 500 1 498 2000 100
Swaziland 5 226 4 239 3 803 93 50 2000 90
Western Africa
Benin 5 529 4 049 2 982 322 12 2002 75
Burkina Faso 1 341 1 017 759 165 30 2001 54
Cape Verde 862 686 605 3 3 1997 66
Côte d’Ivoire 6 482 4 893 4 111 475 73 1994 92
Gambia 8 282 6 168 4 630 80 2 1999 47
Ghana 3 596 2 776 2 181 1 900 34 2000 90
Guinea 39 243 27 085 22 641 520 95
Guinea-Bissau 30 482 24 980 20 462 281 25 1996 100
Liberia 109 074 81 489 58 087 600 3
Mali 11 530 8 853 6 506 566 236 2000 75
Mauritania 5 711 4 313 3 295 250 45 2004 51
Niger 4 321 3 081 2 169 270 74 2005 89
Nigeria 2 934 2 314 1 807 2 331 293 2004 75
Saint Helena, Ascension andTristan da Cunha
Senegal 5 358 4 082 3 120 409 120
Sierra Leone 40 181 38 619 27 267 807 30
Togo 4 010 3 066 2 439 180 7 1996 86
38
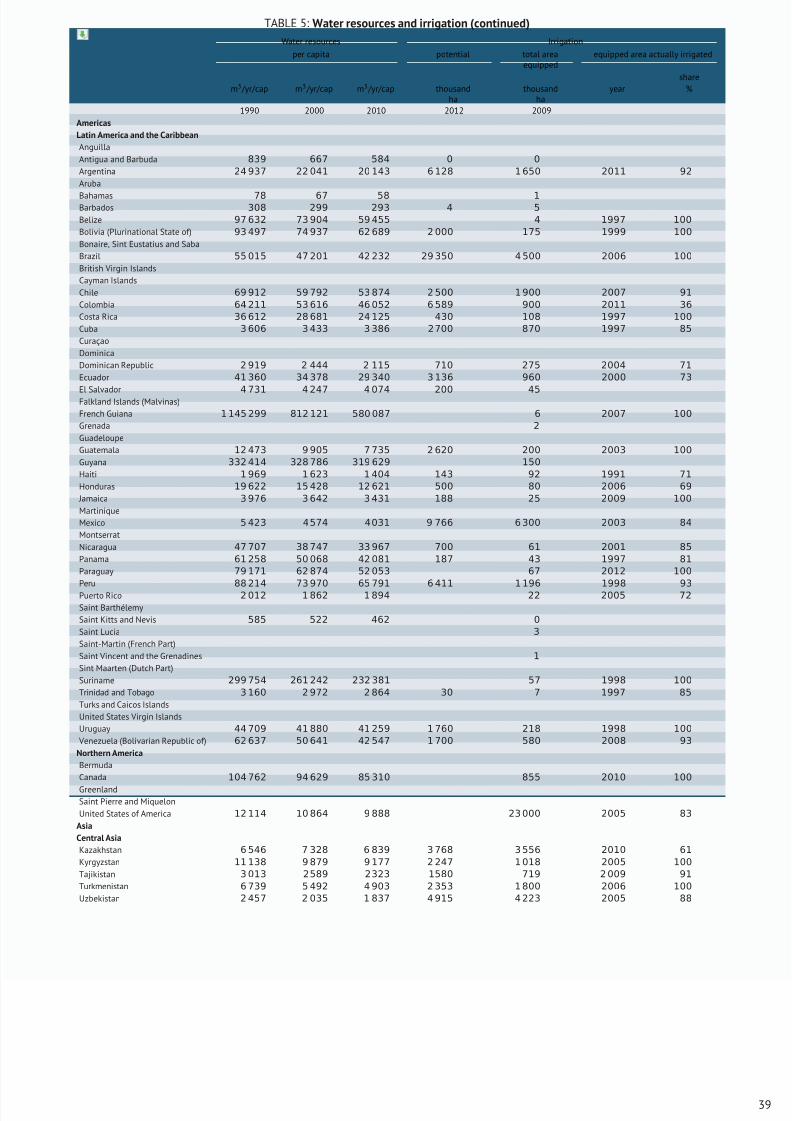
8/16/2019 Informe de la Fao 2013
http://slidepdf.com/reader/full/informe-de-la-fao-2013 57/307
TABLE 5: Water resources and irrigation (continued)
Water resources Irrigation
per capita potential total areaequipped
equipped area actually irrigated
sharem3 /yr/cap m3 /yr/cap m3 /yr/cap thousand
hathousand
hayear %
1990 2000 2010 2012 2009
Americas
Latin America and the Caribbean
Anguilla
Antigua and Barbuda 839 667 584 0 0
Argentina 24 937 22 041 20 143 6 128 1 650 2011 92
Aruba
Bahamas 78 67 58 1Barbados 308 299 293 4 5
Belize 97 632 73 904 59 455 4 1997 100
Bolivia (Plurinational State of) 93 497 74 937 62 689 2 000 175 1999 100
Bonaire, Sint Eustatius and Saba
Brazil 55 015 47 201 42 232 29 350 4 500 2006 100
British Virgin Islands
Cayman Islands
Chile 69 912 59 792 53 874 2 500 1 900 2007 91
Colombia 64 211 53 616 46 052 6 589 900 2011 36
Costa Rica 36 612 28 681 24 125 430 108 1997 100
Cuba 3 606 3 433 3 386 2 700 870 1997 85
Curaçao
Dominica
Dominican Republic 2 919 2 444 2 115 710 275 2004 71
Ecuador 41 360 34 378 29 340 3 136 960 2000 73
El Salvador 4 731 4 247 4 074 200 45
Falkland Islands (Malvinas)
French Guiana 1 145 299 812 121 580 087 6 2007 100
Grenada 2
Guadeloupe
Guatemala 12 473 9 905 7 735 2 620 200 2003 100
Guyana 332 414 328 786 319 629 150
Haiti 1 969 1 623 1 404 143 92 1991 71
Honduras 19 622 15 428 12 621 500 80 2006 69
Jamaica 3 976 3 642 3 431 188 25 2009 100
Martinique
Mexico 5 423 4 574 4 031 9 766 6 300 2003 84
Montserrat
Nicaragua 47 707 38 747 33 967 700 61 2001 85
Panama 61 258 50 068 42 081 187 43 1997 81
Paraguay 79 171 62 874 52 053 67 2012 100
Peru 88 214 73 970 65 791 6 411 1 196 1998 93
Puerto Rico 2 012 1 862 1 894 22 2005 72
Saint Barthélemy
Saint Kitts and Nevis 585 522 462 0
Saint Lucia 3
Saint-Martin (French Part)
Saint Vincent and the Grenadines 1
Sint Maarten (Dutch Part)
Suriname 299 754 261 242 232 381 57 1998 100
Trinidad and Tobago 3 160 2 972 2 864 30 7 1997 85
Turks and Caicos Islands
United States Virgin Islands
Uruguay 44 709 41 880 41 259 1 760 218 1998 100
Venezuela (Bolivarian Republic of) 62 637 50 641 42 547 1 700 580 2008 93
Northern America
Bermuda
Canada 104 762 94 629 85 310 855 2010 100
GreenlandSaint Pierre and Miquelon
United States of America 12 114 10 864 9 888 23 000 2005 83
Asia
Central Asia
Kazakhstan 6 546 7 328 6 839 3 768 3 556 2010 61
Kyrgyzstan 11 138 9 879 9 177 2 247 1 018 2005 100
Tajikistan 3 013 2589 2323 1580 719 2 009 91
Turkmenistan 6 739 5 492 4 903 2 353 1 800 2006 100
Uzbekistan 2 457 2 035 1 837 4 915 4 223 2005 88
39
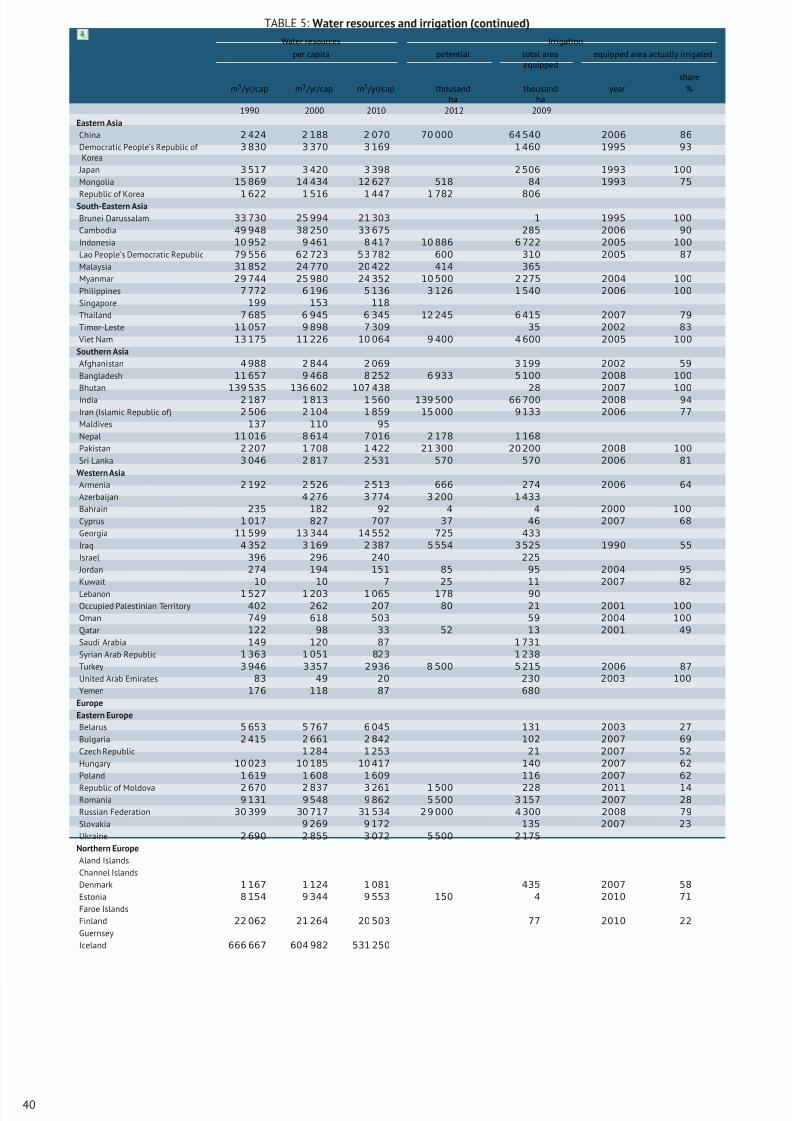
8/16/2019 Informe de la Fao 2013
http://slidepdf.com/reader/full/informe-de-la-fao-2013 58/307
TABLE 5: Water resources and irrigation (continued)
Water resources Irrigation
per capita potential total areaequipped
equipped area actually irrigated
sharem3 /yr/cap m3 /yr/cap m3 /yr/cap thousand
hathousand
hayear %
1990 2000 2010 2012 2009
Eastern Asia
China 2 424 2 188 2 070 70 000 64 540 2006 86
Democratic People’s Republic of Korea
3 830 3 370 3 169 1 460 1995 93
Japan 3 517 3 420 3 398 2 506 1993 100
Mongolia 15 869 14 434 12 627 518 84 1993 75
Republic of Korea 1 622 1 516 1 447 1 782 806South-Eastern Asia
Brunei Darussalam 33 730 25 994 21 303 1 1995 100
Cambodia 49 948 38 250 33 675 285 2006 90
Indonesia 10 952 9 461 8 417 10 886 6 722 2005 100
Lao People’s Democratic Republic 79 556 62 723 53 782 600 310 2005 87
Malaysia 31 852 24 770 20 422 414 365
Myanmar 29 744 25 980 24 352 10 500 2 275 2004 100
Philippines 7 772 6 196 5 136 3 126 1 540 2006 100
Singapore 199 153 118
Thailand 7 685 6 945 6 345 12 245 6 415 2007 79
Timor-Leste 11 057 9 898 7 309 35 2002 83
Viet Nam 13 175 11 226 10 064 9 400 4 600 2005 100
Southern Asia
Afghanistan 4 988 2 844 2 069 3 199 2002 59
Bangladesh 11 657 9 468 8 252 6 933 5 100 2008 100
Bhutan 139 535 136 602 107 438 28 2007 100
India 2 187 1 813 1 560 139 500 66 700 2008 94
Iran (Islamic Republic of) 2 506 2 104 1 859 15 000 9 133 2006 77
Maldives 137 110 95
Nepal 11 016 8 614 7 016 2 178 1 168
Pakistan 2 207 1 708 1 422 21 300 20 200 2008 100
Sri Lanka 3 046 2 817 2 531 570 570 2006 81
Western Asia
Armenia 2 192 2 526 2 513 666 274 2006 64
Azerbaijan 4 276 3 774 3 200 1 433
Bahrain 235 182 92 4 4 2000 100
Cyprus 1 017 827 707 37 46 2007 68
Georgia 11 599 13 344 14 552 725 433
Iraq 4 352 3 169 2 387 5 554 3 525 1990 55
Israel 396 296 240 225
Jordan 274 194 151 85 95 2004 95
Kuwait 10 10 7 25 11 2007 82
Lebanon 1 527 1 203 1 065 178 90
Occupied Palestinian Territory 402 262 207 80 21 2001 100
Oman 749 618 503 59 2004 100
Qatar 122 98 33 52 13 2001 49
Saudi Arabia 149 120 87 1 731
Syrian Arab Republic 1 363 1 051 823 1 238
Turkey 3 946 3357 2936 8 500 5 215 2006 87
United Arab Emirates 83 49 20 230 2003 100
Yemen 176 118 87 680
Europe
Eastern Europe
Belarus 5 653 5 767 6 045 131 2003 27
Bulgaria 2 415 2 661 2 842 102 2007 69
Czech Republic 1 284 1 253 21 2007 52
Hungary 10 023 10 185 10 417 140 2007 62
Poland 1 619 1 608 1 609 116 2007 62
Republic of Moldova 2 670 2 837 3 261 1 500 228 2011 14
Romania 9 131 9 548 9 862 5 500 3 157 2007 28
Russian Federation 30 399 30 717 31 534 2 9 000 4 300 2008 79
Slovakia 9 269 9 172 135 2007 23
Ukraine 2 690 2 855 3 072 5 500 2 175
Northern Europe
Aland Islands
Channel Islands
Denmark 1 167 1 124 1 081 435 2007 58
Estonia 8 154 9 344 9 553 150 4 2010 71
Faroe Islands
Finland 22 062 21 264 20 503 77 2010 22
Guernsey
Iceland 666 667 604 982 531 250
40
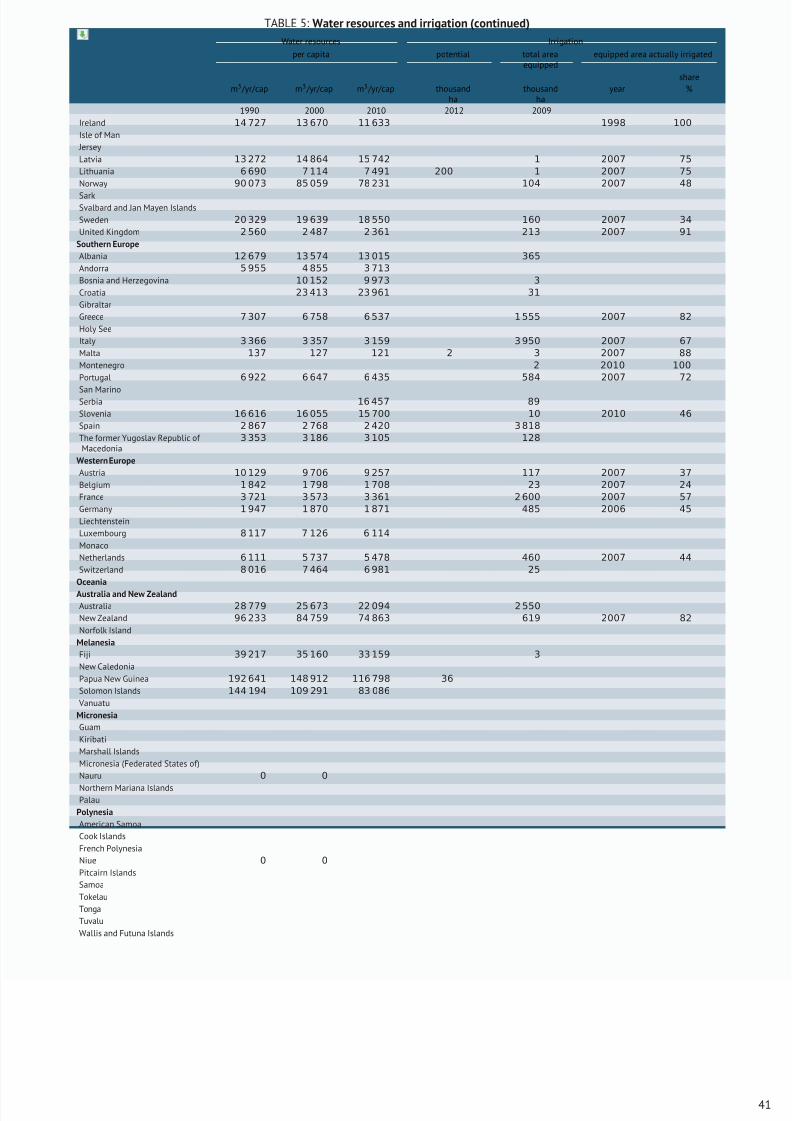
8/16/2019 Informe de la Fao 2013
http://slidepdf.com/reader/full/informe-de-la-fao-2013 59/307
TABLE 5: Water resources and irrigation (continued)
Water resources Irrigation
per capita potential total areaequipped
equipped area actually irrigated
sharem3 /yr/cap m3 /yr/cap m3 /yr/cap thousand
hathousand
hayear %
1990 2000 2010 2012 2009
Ireland 14 727 13 670 11 633 1998 100
Isle of Man
Jersey
Latvia 13 272 14 864 15 742 1 2007 75
Lithuania 6 690 7 114 7 491 200 1 2007 75
Norway 90 073 85 059 78 231 104 2007 48
SarkSvalbard and Jan Mayen Islands
Sweden 20 329 19 639 18 550 160 2007 34
United Kingdom 2 560 2 487 2 361 213 2007 91
Southern Europe
Albania 12 679 13 574 13 015 365
Andorra 5 955 4 855 3 713
Bosnia and Herzegovina 10 152 9 973 3
Croatia 23 413 23 961 31
Gibraltar
Greece 7 307 6 758 6 537 1 555 2007 82
Holy See
Italy 3 366 3 357 3 159 3 950 2007 67
Malta 137 127 121 2 3 2007 88
Montenegro 2 2010 100
Portugal 6 922 6 647 6 435 584 2007 72
San MarinoSerbia 16 457 89
Slovenia 16 616 16 055 15 700 10 2010 46
Spain 2 867 2 768 2 420 3 818
The former Yugoslav Republic of Macedonia
3 353 3 186 3 105 128
Western Europe
Austria 10 129 9 706 9 257 117 2007 37
Belgium 1 842 1 798 1 708 23 2007 24
France 3 721 3 573 3 361 2 600 2007 57
Germany 1 947 1 870 1 871 485 2006 45
Liechtenstein
Luxembourg 8 117 7 126 6 114
Monaco
Netherlands 6 111 5 737 5 478 460 2007 44
Switzerland 8 016 7 464 6 981 25
Oceania
Australia and New Zealand
Australia 28 779 25 673 22 094 2 550
New Zealand 96 233 84 759 74 863 619 2007 82
Norfolk Island
Melanesia
Fiji 39 217 35 160 33 159 3
New Caledonia
Papua New Guinea 192 641 148 912 116 798 36
Solomon Islands 144 194 109 291 83 086
Vanuatu
Micronesia
Guam
Kiribati
Marshall Islands
Micronesia (Federated States of)
Nauru 0 0
Northern Mariana IslandsPalau
Polynesia
American Samoa
Cook Islands
French Polynesia
Niue 0 0
Pitcairn Islands
Samoa
Tokelau
Tonga
Tuvalu
Wallis and Futuna Islands
41
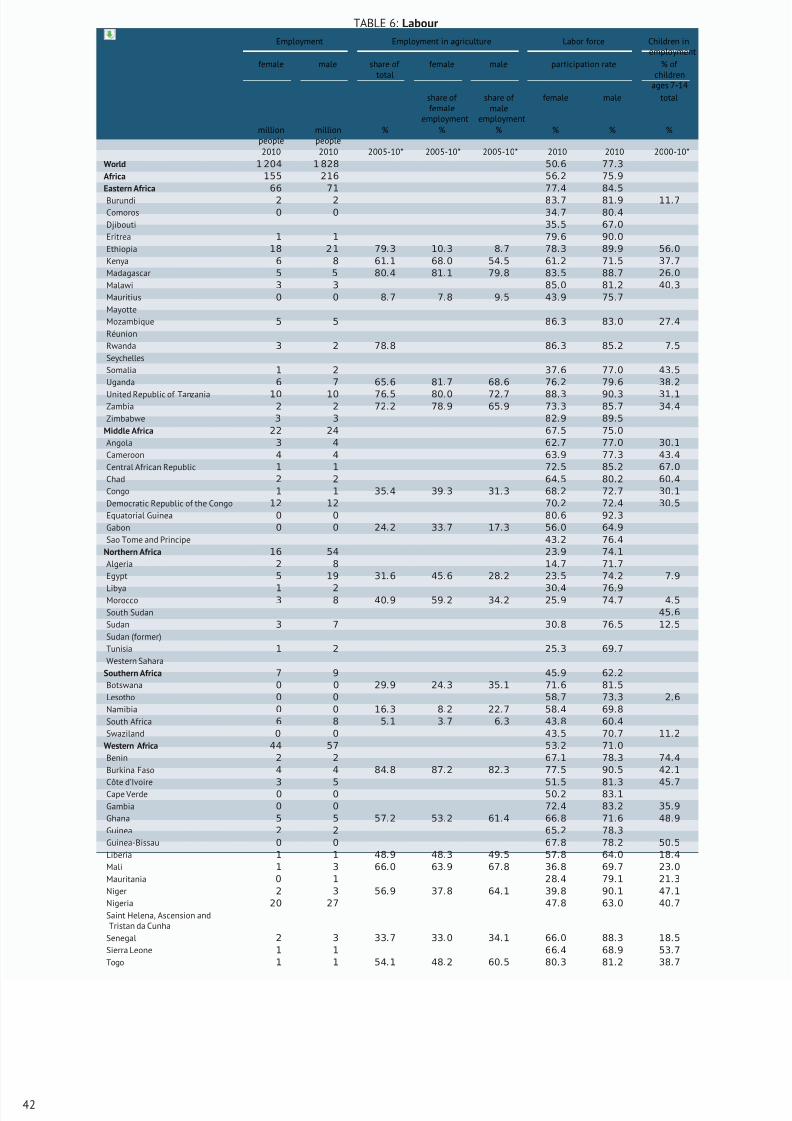
8/16/2019 Informe de la Fao 2013
http://slidepdf.com/reader/full/informe-de-la-fao-2013 60/307
TABLE 6: Labour
Employment Employment in agriculture Labor force Children inemployment
female male share of total
female male participation rate % of children
ages 7-14
share of female
employment
share of male
employment
female male total
millionpeople
millionpeople
% % % % % %
2010 2010 2005-10* 2005-10* 2005-10* 2010 2010 2000-10*
World 1 204 1 828 50.6 77.3
Africa 155 216 56.2 75.9
Eastern Africa 66 71 77.4 84.5
Burundi 2 2 83.7 81.9 11.7
Comoros 0 0 34.7 80.4
Djibouti 35.5 67.0
Eritrea 1 1 79.6 90.0
Ethiopia 18 2 1 79.3 10.3 8.7 78.3 89.9 56.0
Kenya 6 8 61.1 68.0 54.5 61.2 71.5 37.7
Madagascar 5 5 80.4 81.1 79.8 83.5 88.7 26.0
Malawi 3 3 85.0 81.2 40.3
Mauritius 0 0 8.7 7.8 9.5 43.9 75.7
Mayotte
Mozambique 5 5 86.3 83.0 27.4
Réunion
Rwanda 3 2 78.8 86.3 85.2 7.5
Seychelles
Somalia 1 2 37.6 77.0 43.5
Uganda 6 7 65.6 81.7 68.6 76.2 79.6 38.2
United Republic of Tanzania 10 10 76.5 80.0 72.7 88.3 90.3 31.1Zambia 2 2 72.2 78.9 65.9 73.3 85.7 34.4
Zimbabwe 3 3 82.9 89.5
Middle Africa 22 24 67.5 75.0
Angola 3 4 62.7 77.0 30.1
Cameroon 4 4 63.9 77.3 43.4
Central African Republic 1 1 72.5 85.2 67.0
Chad 2 2 64.5 80.2 60.4
Congo 1 1 35.4 39.3 31.3 68.2 72.7 30.1
Democratic Republic of the Congo 12 12 70.2 72.4 30.5
Equatorial Guinea 0 0 80.6 92.3
Gabon 0 0 24.2 33.7 17.3 56.0 64.9
Sao Tome and Principe 43.2 76.4
Northern Africa 16 54 23.9 74.1
Algeria 2 8 14.7 71.7
Egypt 5 19 31.6 45.6 28.2 23.5 74.2 7.9
Libya 1 2 30.4 76.9Morocco 3 8 40.9 59.2 34.2 25.9 74.7 4.5
South Sudan 45.6
Sudan 3 7 30.8 76.5 12.5
Sudan (former)
Tunisia 1 2 25.3 69.7
Western Sahara
Southern Africa 7 9 45.9 62.2
Botswana 0 0 29.9 24.3 35.1 71.6 81.5
Lesotho 0 0 58.7 73.3 2.6
Namibia 0 0 16.3 8.2 22.7 58.4 69.8
South Africa 6 8 5.1 3.7 6.3 43.8 60.4
Swaziland 0 0 43.5 70.7 11.2
Western Africa 44 57 53.2 71.0
Benin 2 2 67.1 78.3 74.4
Burkina Faso 4 4 84.8 87.2 82.3 77.5 90.5 42.1
Côte d’Ivoire 3 5 51
.5 81
.3 45
.7
Cape Verde 0 0 50.2 83.1
Gambia 0 0 72.4 83.2 35.9
Ghana 5 5 57.2 53.2 61.4 66.8 71.6 48.9
Guinea 2 2 65.2 78.3
Guinea-Bissau 0 0 67.8 78.2 50.5
Liberia 1 1 48.9 48.3 49.5 57.8 64.0 18.4
Mali 1 3 66.0 63.9 67.8 36.8 69.7 23.0
Mauritania 0 1 28.4 79.1 21.3
Niger 2 3 56.9 37.8 64.1 39.8 90.1 47.1
Nigeria 20 27 47.8 63.0 40.7
Saint Helena, Ascension andTristan da Cunha
Senegal 2 3 33.7 33.0 34.1 66.0 88.3 18.5
Sierra Leone 1 1 66.4 68.9 53.7
Togo 1 1 54.1 48.2 60.5 80.3 81.2 38.7
42
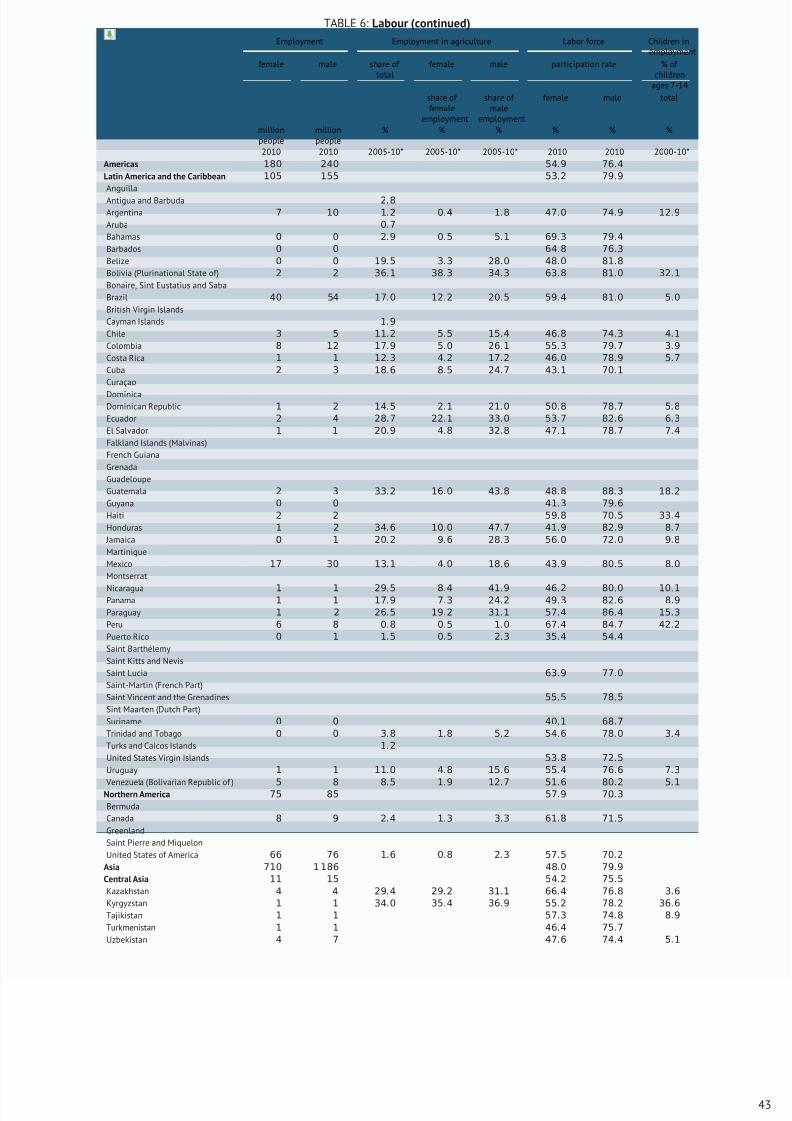
8/16/2019 Informe de la Fao 2013
http://slidepdf.com/reader/full/informe-de-la-fao-2013 61/307
TABLE 6: Labour (continued)
Employment Employment in agriculture Labor force Children inemployment
female male share of total
female male participation rate % of children
ages 7-14
share of female
employment
share of male
employment
female male total
millionpeople
millionpeople
% % % % % %
2010 2010 2005-10* 2005-10* 2005-10* 2010 2010 2000-10*
Americas 180 240 54.9 76.4
Latin America and the Caribbean 105 155 53.2 79.9
Anguilla
Antigua and Barbuda 2.8
Argentina 7 10 1.2 0.4 1.8 47.0 74.9 12.9
Aruba 0.7
Bahamas 0 0 2.9 0.5 5.1 69.3 79.4
Barbados 0 0 64.8 76.3
Belize 0 0 19.5 3.3 28.0 48.0 81.8
Bolivia (Plurinational State of) 2 2 36.1 38.3 34.3 63.8 81.0 32.1
Bonaire, Sint Eustatius and Saba
Brazil 40 54 17.0 12.2 20.5 59.4 81.0 5.0
British Virgin Islands
Cayman Islands 1.9
Chile 3 5 11.2 5.5 15.4 46.8 74.3 4.1
Colombia 8 12 17.9 5.0 26.1 55.3 79.7 3.9
Costa Rica 1 1 12.3 4.2 17.2 46.0 78.9 5.7
Cuba 2 3 18.6 8.5 24.7 43.1 70.1
Curaçao
DominicaDominican Republic 1 2 14.5 2.1 21.0 50.8 78.7 5.8
Ecuador 2 4 28.7 22.1 33.0 53.7 82.6 6.3
El Salvador 1 1 20.9 4.8 32.8 47.1 78.7 7.4
Falkland Islands (Malvinas)
French Guiana
Grenada
Guadeloupe
Guatemala 2 3 33.2 16.0 43.8 48.8 88.3 18.2
Guyana 0 0 41.3 79.6
Haiti 2 2 59.8 70.5 33.4
Honduras 1 2 34.6 10.0 47.7 41.9 82.9 8.7
Jamaica 0 1 20.2 9.6 28.3 56.0 72.0 9.8
Martinique
Mexico 17 30 13.1 4.0 18.6 43.9 80.5 8.0
Montserrat
Nicaragua 1 1 29.5 8.4 41.9 46.2 80.0 10.1Panama 1 1 17.9 7.3 24.2 49.3 82.6 8.9
Paraguay 1 2 26.5 19.2 31.1 57.4 86.4 15.3
Peru 6 8 0.8 0.5 1.0 67.4 84.7 42.2
Puerto Rico 0 1 1.5 0.5 2.3 35.4 54.4
Saint Barthélemy
Saint Kitts and Nevis
Saint Lucia 63.9 77.0
Saint-Martin (French Part)
Saint Vincent and the Grenadines 55.5 78.5
Sint Maarten (Dutch Part)
Suriname 0 0 40.1 68.7
Trinidad and Tobago 0 0 3.8 1.8 5.2 54.6 78.0 3.4
Turks and Caicos Islands 1.2
United States Virgin Islands 53.8 72.5
Uruguay 1 1 11.0 4.8 15.6 55.4 76.6 7.3
Venezuela (Bolivarian Republic of ) 5 8 8
.5 1
.9 12
.7 51
.6 80
.2 5
.1
Northern America 75 85 57.9 70.3
Bermuda
Canada 8 9 2.4 1.3 3.3 61.8 71.5
Greenland
Saint Pierre and Miquelon
United States of America 66 76 1.6 0.8 2.3 57.5 70.2
Asia 710 1 186 48.0 79.9
Central Asia 11 15 54.2 75.5
Kazakhstan 4 4 29.4 29.2 31.1 66.4 76.8 3.6
Kyrgyzstan 1 1 34.0 35.4 36.9 55.2 78.2 36.6
Tajikistan 1 1 57.3 74.8 8.9
Turkmenistan 1 1 46.4 75.7
Uzbekistan 4 7 47.6 74.4 5.1
43
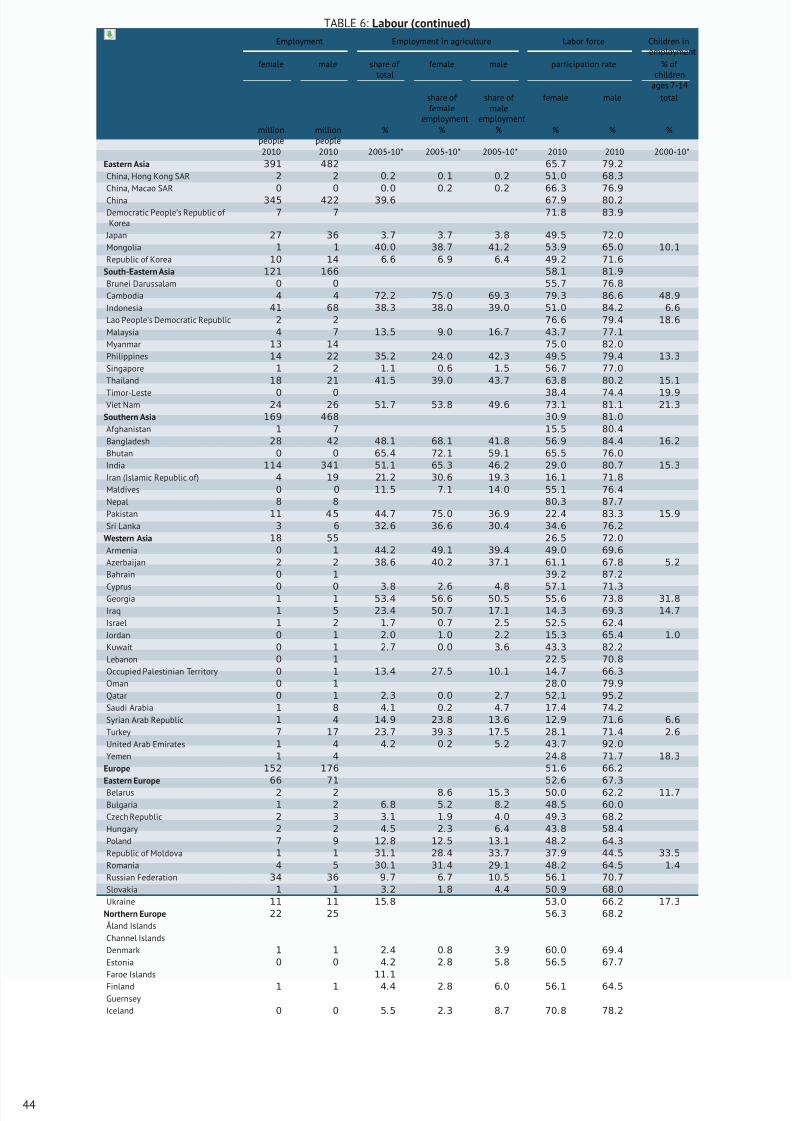
8/16/2019 Informe de la Fao 2013
http://slidepdf.com/reader/full/informe-de-la-fao-2013 62/307
TABLE 6: Labour (continued)
Employment Employment in agriculture Labor force Children inemployment
female male share of total
female male participation rate % of children
ages 7-14
share of female
employment
share of male
employment
female male total
millionpeople
millionpeople
% % % % % %
2010 2010 2005-10* 2005-10* 2005-10* 2010 2010 2000-10*
Eastern Asia 391 482 65.7 79.2
China, Hong Kong SAR 2 2 0.2 0.1 0.2 51.0 68.3
China, Macao SAR 0 0 0.0 0.2 0.2 66.3 76.9
China 345 422 39.6 67.9 80.2
Democratic People’s Republic of Korea
7 7 71.8 83.9
Japan 27 36 3.7 3.7 3.8 49.5 72.0
Mongolia 1 1 40.0 38.7 41.2 53.9 65.0 10.1
Republic of Korea 10 14 6.6 6.9 6.4 49.2 71.6
South-Eastern Asia 121 166 58.1 81.9
Brunei Darussalam 0 0 55.7 76.8
Cambodia 4 4 72.2 75.0 69.3 79.3 86.6 48.9
Indonesia 41 68 38.3 38.0 39.0 51.0 84.2 6.6
Lao People’s Democratic Republic 2 2 76.6 79.4 18.6
Malaysia 4 7 13.5 9.0 16.7 43.7 77.1
Myanmar 13 14 75.0 82.0
Philippines 14 22 35.2 24.0 42.3 49.5 79.4 13.3
Singapore 1 2 1.1 0.6 1.5 56.7 77.0
Thailand 18 21 41.5 39.0 43.7 63.8 80.2 15.1
Timor-Leste 0 0 38.4 74.4 19.9 Viet Nam 24 26 51.7 53.8 49.6 73.1 81.1 21.3
Southern Asia 169 468 30.9 81.0
Afghanistan 1 7 15.5 80.4
Bangladesh 28 42 48.1 68.1 41.8 56.9 84.4 16.2
Bhutan 0 0 65.4 72.1 59.1 65.5 76.0
India 114 341 51.1 65.3 46.2 29.0 80.7 15.3
Iran (Islamic Republic of) 4 19 21.2 30.6 19.3 16.1 71.8
Maldives 0 0 11.5 7.1 14.0 55.1 76.4
Nepal 8 8 80.3 87.7
Pakistan 11 4 5 44.7 75.0 36.9 22.4 83.3 15.9
Sri Lanka 3 6 32.6 36.6 30.4 34.6 76.2
Western Asia 18 55 26.5 72.0
Armenia 0 1 44.2 49.1 39.4 49.0 69.6
Azerbaijan 2 2 38.6 40.2 37.1 61.1 67.8 5.2
Bahrain 0 1 39.2 87.2
Cyprus 0 0 3.8 2.6 4.8 57.1 71.3Georgia 1 1 53.4 56.6 50.5 55.6 73.8 31.8
Iraq 1 5 23.4 50.7 17.1 14.3 69.3 14.7
Israel 1 2 1.7 0.7 2.5 52.5 62.4
Jordan 0 1 2.0 1.0 2.2 15.3 65.4 1.0
Kuwait 0 1 2.7 0.0 3.6 43.3 82.2
Lebanon 0 1 22.5 70.8
Occupied Palestinian Territory 0 1 13.4 27.5 10.1 14.7 66.3
Oman 0 1 28.0 79.9
Qatar 0 1 2.3 0.0 2.7 52.1 95.2
Saudi Arabia 1 8 4.1 0.2 4.7 17.4 74.2
Syrian Arab Republic 1 4 14.9 23.8 13.6 12.9 71.6 6.6
Turkey 7 17 23.7 39.3 17.5 28.1 71.4 2.6
United Arab Emirates 1 4 4.2 0.2 5.2 43.7 92.0
Yemen 1 4 24.8 71.7 18.3
Europe 152 176 51.6 66.2
Eastern Europe 66 71 52.6 67.3
Belarus 2 2 8.6 15.3 50.0 62.2 11.7
Bulgaria 1 2 6.8 5.2 8.2 48.5 60.0
Czech Republic 2 3 3.1 1.9 4.0 49.3 68.2
Hungary 2 2 4.5 2.3 6.4 43.8 58.4
Poland 7 9 12.8 12.5 13.1 48.2 64.3
Republic of Moldova 1 1 31.1 28.4 33.7 37.9 44.5 33.5
Romania 4 5 30.1 31.4 29.1 48.2 64.5 1.4
Russian Federation 34 36 9.7 6.7 10.5 56.1 70.7
Slovakia 1 1 3.2 1.8 4.4 50.9 68.0
Ukraine 11 11 15.8 53.0 66.2 17.3
Northern Europe 22 25 56.3 68.2
Åland Islands
Channel Islands
Denmark 1 1 2.4 0.8 3.9 60.0 69.4
Estonia 0 0 4.2 2.8 5.8 56.5 67.7
Faroe Islands 11.1
Finland 1 1 4.4 2.8 6.0 56.1 64.5
Guernsey
Iceland 0 0 5.5 2.3 8.7 70.8 78.2
44
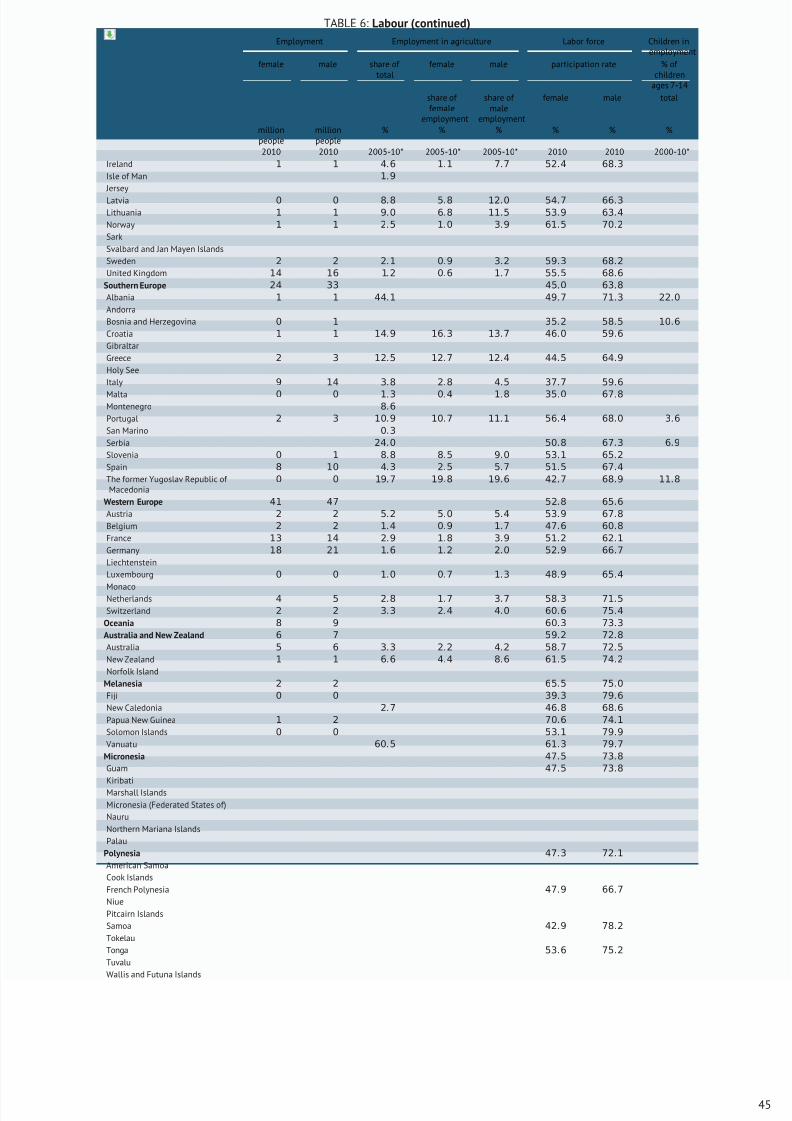
8/16/2019 Informe de la Fao 2013
http://slidepdf.com/reader/full/informe-de-la-fao-2013 63/307
TABLE 6: Labour (continued)
Employment Employment in agriculture Labor force Children inemployment
female male share of total
female male participation rate % of children
ages 7-14
share of female
employment
share of male
employment
female male total
millionpeople
millionpeople
% % % % % %
2010 2010 2005-10* 2005-10* 2005-10* 2010 2010 2000-10*
Ireland 1 1 4.6 1.1 7.7 52.4 68.3
Isle of Man 1.9
Jersey
Latvia 0 0 8.8 5.8 12.0 54.7 66.3
Lithuania 1 1 9.0 6.8 11.5 53.9 63.4
Norway 1 1 2.5 1.0 3.9 61.5 70.2
Sark
Svalbard and Jan Mayen Islands
Sweden 2 2 2.1 0.9 3.2 59.3 68.2
United Kingdom 14 16 1.2 0.6 1.7 55.5 68.6
Southern Europe 24 33 45.0 63.8
Albania 1 1 44.1 49.7 71.3 22.0
Andorra
Bosnia and Herzegovina 0 1 35.2 58.5 10.6
Croatia 1 1 14.9 16.3 13.7 46.0 59.6
Gibraltar
Greece 2 3 12.5 12.7 12.4 44.5 64.9
Holy See
Italy 9 14 3.8 2.8 4.5 37.7 59.6
Malta 0 0 1.3 0.4 1.8 35.0 67.8Montenegro 8.6
Portugal 2 3 10.9 10.7 11.1 56.4 68.0 3.6
San Marino 0.3
Serbia 24.0 50.8 67.3 6.9
Slovenia 0 1 8.8 8.5 9.0 53.1 65.2
Spain 8 10 4.3 2.5 5.7 51.5 67.4
The former Yugoslav Republic of Macedonia
0 0 19.7 19.8 19.6 42.7 68.9 11.8
Western Europe 41 47 52.8 65.6
Austria 2 2 5.2 5.0 5.4 53.9 67.8
Belgium 2 2 1.4 0.9 1.7 47.6 60.8
France 13 14 2.9 1.8 3.9 51.2 62.1
Germany 18 21 1.6 1.2 2.0 52.9 66.7
Liechtenstein
Luxembourg 0 0 1.0 0.7 1.3 48.9 65.4
MonacoNetherlands 4 5 2.8 1.7 3.7 58.3 71.5
Switzerland 2 2 3.3 2.4 4.0 60.6 75.4
Oceania 8 9 60.3 73.3
Australia and New Zealand 6 7 59.2 72.8
Australia 5 6 3.3 2.2 4.2 58.7 72.5
New Zealand 1 1 6.6 4.4 8.6 61.5 74.2
Norfolk Island
Melanesia 2 2 65.5 75.0
Fiji 0 0 39.3 79.6
New Caledonia 2.7 46.8 68.6
Papua New Guinea 1 2 70.6 74.1
Solomon Islands 0 0 53.1 79.9
Vanuatu 60.5 61.3 79.7
Micronesia 47.5 73.8
Guam 47.5 73.8
Kiribati
Marshall Islands
Micronesia (Federated States of)
Nauru
Northern Mariana Islands
Palau
Polynesia 47.3 72.1
American Samoa
Cook Islands
French Polynesia 47.9 66.7
Niue
Pitcairn Islands
Samoa 42.9 78.2
Tokelau
Tonga 53.6 75.2
Tuvalu
Wallis and Futuna Islands
45
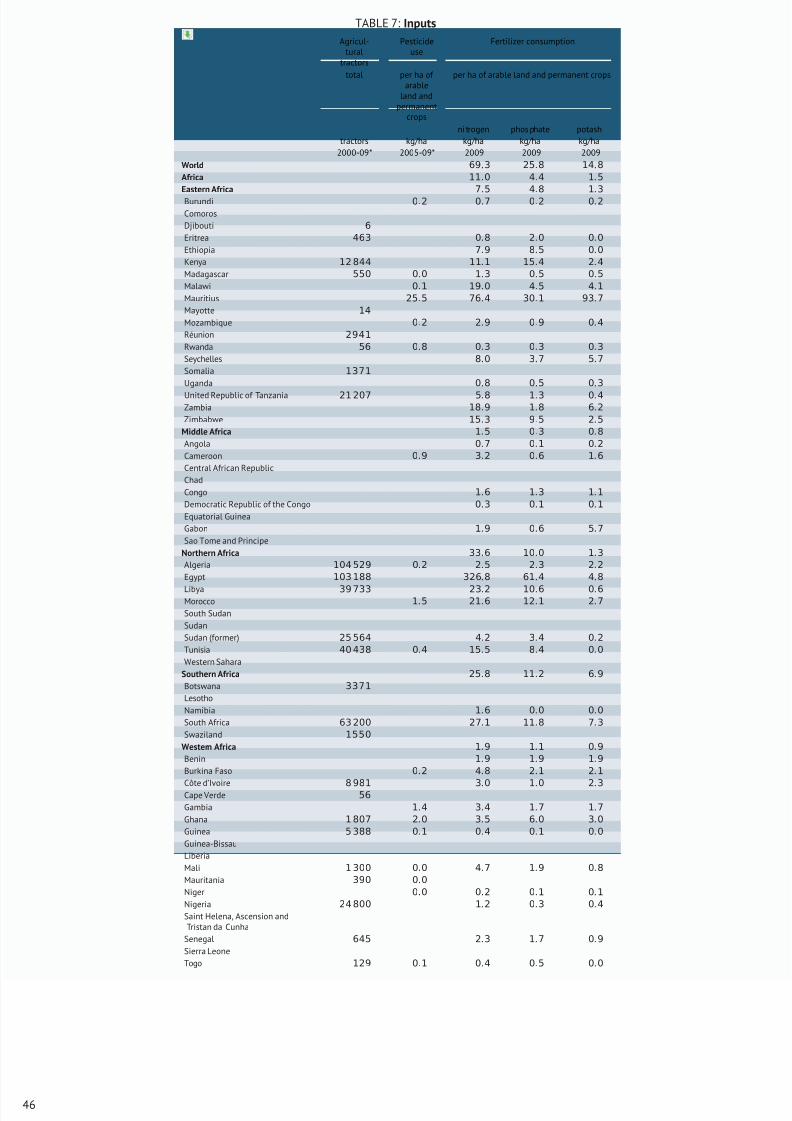
8/16/2019 Informe de la Fao 2013
http://slidepdf.com/reader/full/informe-de-la-fao-2013 64/307
TABLE 7: Inputs
Agricul-tural
tractors
Pesticideuse
Fertilizer consumption
total per ha of arable
land andpermanent
crops
per ha of arable land and permanent crops
ni trogen phos phate potashtractors kg/ha kg/ha kg/ha kg/ha
2000-09* 2005-09* 2009 2009 2009
World 69.3 25.8 14.8
Africa 11.0 4.4 1.5
Eastern Africa 7.5 4.8 1.3
Burundi 0.2 0.7 0.2 0.2
Comoros
Djibouti 6
Eritrea 463 0.8 2.0 0.0
Ethiopia 7.9 8.5 0.0
Kenya 12 844 11.1 15.4 2.4
Madagascar 550 0.0 1.3 0.5 0.5
Malawi 0.1 19.0 4.5 4.1
Mauritius 25.5 76.4 30.1 93.7
Mayotte 14
Mozambique 0.2 2.9 0.9 0.4
Réunion 2941
Rwanda 56 0.8 0.3 0.3 0.3
Seychelles 8.0 3.7 5.7
Somalia 1371
Uganda 0.8 0.5 0.3
United Republic of Tanzania 21 207 5.8 1.3 0.4
Zambia 18.9 1.8 6.2
Zimbabwe 15.3 9.5 2.5
Middle Africa 1.5 0.3 0.8
Angola 0.7 0.1 0.2
Cameroon 0.9 3.2 0.6 1.6
Central African Republic
Chad
Congo 1.6 1.3 1.1
Democratic Republic of the Congo 0.3 0.1 0.1
Equatorial Guinea
Gabon 1.9 0.6 5.7
Sao Tome and Principe
Northern Africa 33.6 10.0 1.3
Algeria 104 529 0.2 2.5 2.3 2.2
Egypt 103 188 326.8 61.4 4.8
Libya 39 733 23.2 10.6 0.6Morocco 1.5 21.6 12.1 2.7
South Sudan
Sudan
Sudan (former) 25 564 4.2 3.4 0.2
Tunisia 40 438 0.4 15.5 8.4 0.0
Western Sahara
Southern Africa 25.8 11.2 6.9
Botswana 3371
Lesotho
Namibia 1.6 0.0 0.0
South Africa 63 200 27.1 11.8 7.3
Swaziland 1550
Western Africa 1.9 1.1 0.9
Benin 1.9 1.9 1.9
Burkina Faso 0.2 4.8 2.1 2.1
Côte d’Ivoire 8 981 3.0 1.0 2.3Cape Verde 56
Gambia 1.4 3.4 1.7 1.7
Ghana 1 807 2.0 3.5 6.0 3.0
Guinea 5 388 0.1 0.4 0.1 0.0
Guinea-Bissau
Liberia
Mali 1 300 0.0 4.7 1.9 0.8
Mauritania 390 0.0
Niger 0.0 0.2 0.1 0.1
Nigeria 24 800 1.2 0.3 0.4
Saint Helena, Ascension andTristan da Cunha
Senegal 645 2.3 1.7 0.9
Sierra Leone
Togo 129 0.1 0.4 0.5 0.0
46
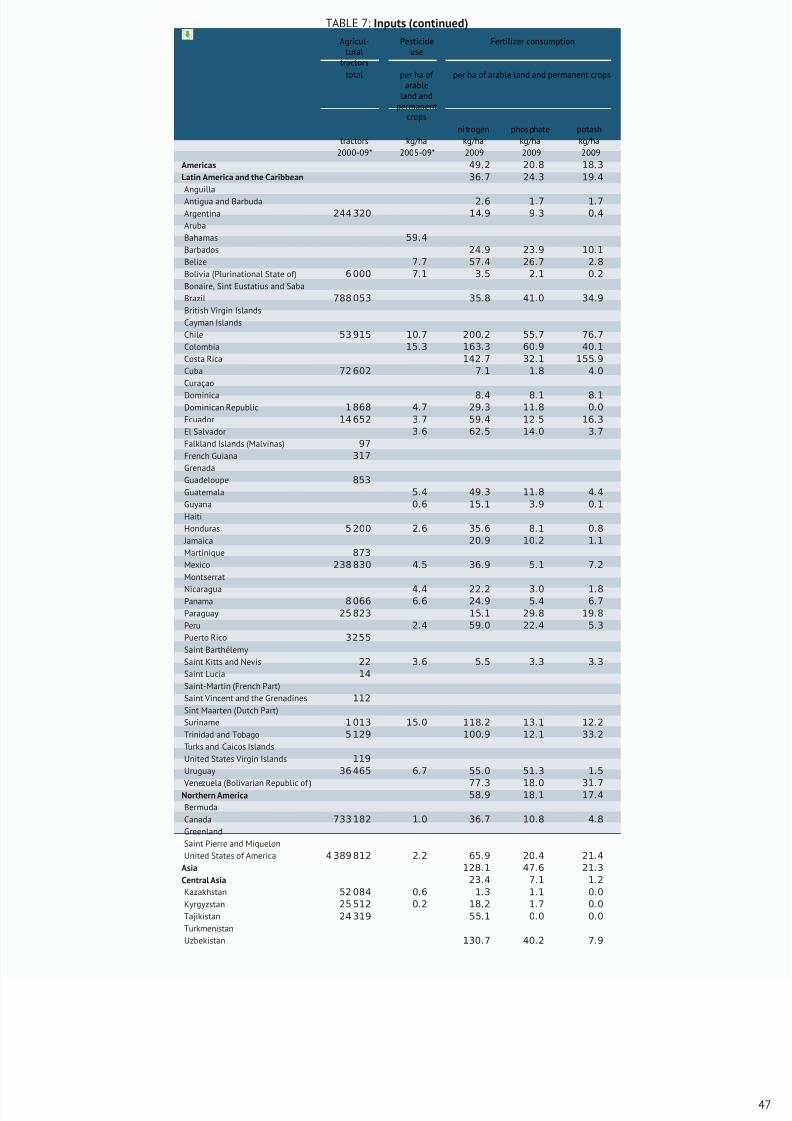
8/16/2019 Informe de la Fao 2013
http://slidepdf.com/reader/full/informe-de-la-fao-2013 65/307
TABLE 7: Inputs (continued)
Agricul-tural
tractors
Pesticideuse
Fertilizer consumption
total per ha of arable
land andpermanent
crops
per ha of arable land and permanent crops
ni trogen phos phate potashtractors kg/ha kg/ha kg/ha kg/ha
2000-09* 2005-09* 2009 2009 2009
Americas 49.2 20.8 18.3
Latin America and the Caribbean 36.7 24.3 19.4
Anguilla
Antigua and Barbuda 2.6 1.7 1.7
Argentina 244 320 14.9 9.3 0.4
Aruba
Bahamas 59.4
Barbados 24.9 23.9 10.1
Belize 7.7 57.4 26.7 2.8
Bolivia (Plurinational State of) 6 000 7.1 3.5 2.1 0.2
Bonaire, Sint Eustatius and Saba
Brazil 788 053 35.8 41.0 34.9
British Virgin Islands
Cayman Islands
Chile 53 915 10.7 200.2 55.7 76.7
Colombia 15.3 163.3 60.9 40.1
Costa Rica 142.7 32.1 155.9
Cuba 72 602 7.1 1.8 4.0
Curaçao
Dominica 8.4 8.1 8.1
Dominican Republic 1 868 4.7 29.3 11.8 0.0
Ecuador 14 652 3.7 59.4 12.5 16.3
El Salvador 3.6 62.5 14.0 3.7
Falkland Islands (Malvinas) 97
French Guiana 317
Grenada
Guadeloupe 853
Guatemala 5.4 49.3 11.8 4.4
Guyana 0.6 15.1 3.9 0.1
Haiti
Honduras 5 200 2.6 35.6 8.1 0.8
Jamaica 20.9 10.2 1.1
Martinique 873
Mexico 238 830 4.5 36.9 5.1 7.2
Montserrat
Nicaragua 4.4 22.2 3.0 1.8Panama 8 066 6.6 24.9 5.4 6.7
Paraguay 25 823 15.1 29.8 19.8
Peru 2.4 59.0 22.4 5.3
Puerto Rico 3255
Saint Barthélemy
Saint Kitts and Nevis 22 3.6 5.5 3.3 3.3
Saint Lucia 14
Saint-Martin (French Part)
Saint Vincent and the Grenadines 112
Sint Maarten (Dutch Part)
Suriname 1 013 15.0 118.2 13.1 12.2
Trinidad and Tobago 5 129 100.9 12.1 33.2
Turks and Caicos Islands
United States Virgin Islands 119
Uruguay 36 465 6.7 55.0 51.3 1.5
Venezuela (Bolivarian Republic of ) 77.3 18.0 31.7Northern America 58.9 18.1 17.4
Bermuda
Canada 733 182 1.0 36.7 10.8 4.8
Greenland
Saint Pierre and Miquelon
United States of America 4 389 812 2.2 65.9 20.4 21.4
Asia 128.1 47.6 21.3
Central Asia 23.4 7.1 1.2
Kazakhstan 52 084 0.6 1.3 1.1 0.0
Kyrgyzstan 25 512 0.2 18.2 1.7 0.0
Tajikistan 24 319 55.1 0.0 0.0
Turkmenistan
Uzbekistan 130.7 40.2 7.9
47
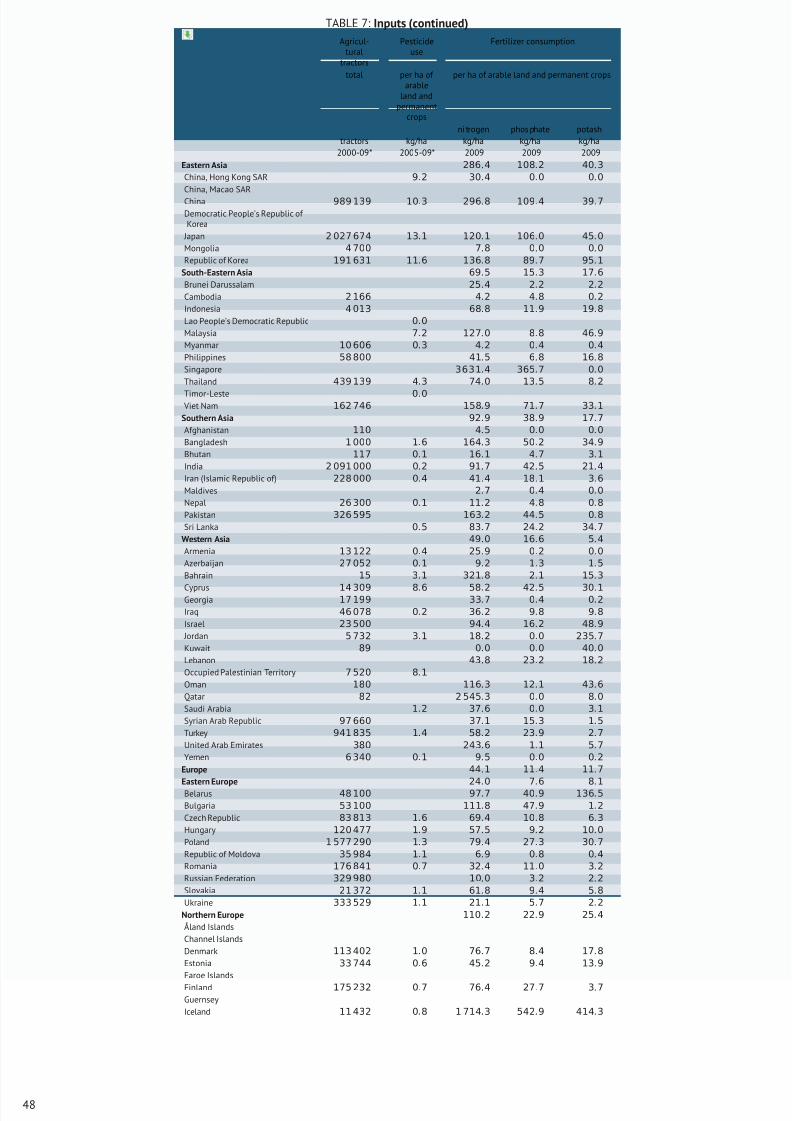
8/16/2019 Informe de la Fao 2013
http://slidepdf.com/reader/full/informe-de-la-fao-2013 66/307
TABLE 7: Inputs (continued)
Agricul-tural
tractors
Pesticideuse
Fertilizer consumption
total per ha of arable
land andpermanent
crops
per ha of arable land and permanent crops
ni trogen phos phate potashtractors kg/ha kg/ha kg/ha kg/ha
2000-09* 2005-09* 2009 2009 2009
Eastern Asia 286.4 108.2 40.3
China, Hong Kong SAR 9.2 30.4 0.0 0.0
China, Macao SAR
China 989 139 10.3 296.8 109.4 39.7
Democratic People’s Republic of Korea
Japan 2 027 674 13.1 120.1 106.0 45.0
Mongolia 4 700 7.8 0.0 0.0
Republic of Korea 191 631 11.6 136.8 89.7 95.1
South-Eastern Asia 69.5 15.3 17.6
Brunei Darussalam 25.4 2.2 2.2
Cambodia 2 166 4.2 4.8 0.2
Indonesia 4 013 68.8 11.9 19.8
Lao People’s Democratic Republic 0.0
Malaysia 7.2 127.0 8.8 46.9
Myanmar 10 606 0.3 4.2 0.4 0.4
Philippines 58 800 41.5 6.8 16.8
Singapore 3631.4 365.7 0.0
Thailand 439 139 4.3 74.0 13.5 8.2
Timor-Leste 0.0 Viet Nam 162 746 158.9 71.7 33.1
Southern Asia 92.9 38.9 17.7
Afghanistan 110 4.5 0.0 0.0
Bangladesh 1 000 1.6 164.3 50.2 34.9
Bhutan 117 0.1 16.1 4.7 3.1
India 2 091 000 0.2 91.7 42.5 21.4
Iran (Islamic Republic of) 228 000 0.4 41.4 18.1 3.6
Maldives 2.7 0.4 0.0
Nepal 26 300 0.1 11.2 4.8 0.8
Pakistan 326 595 163.2 44.5 0.8
Sri Lanka 0.5 83.7 24.2 34.7
Western Asia 49.0 16.6 5.4
Armenia 13 122 0.4 25.9 0.2 0.0
Azerbaijan 27 052 0.1 9.2 1.3 1.5
Bahrain 15 3.1 321.8 2.1 15.3
Cyprus 14 309 8.6 58.2 42.5 30.1Georgia 17 199 33.7 0.4 0.2
Iraq 46 078 0.2 36.2 9.8 9.8
Israel 23 500 94.4 16.2 48.9
Jordan 5 732 3.1 18.2 0.0 235.7
Kuwait 89 0.0 0.0 40.0
Lebanon 43.8 23.2 18.2
Occupied Palestinian Territory 7 520 8.1
Oman 180 116.3 12.1 43.6
Qatar 82 2 545.3 0.0 8.0
Saudi Arabia 1.2 37.6 0.0 3.1
Syrian Arab Republic 97 660 37.1 15.3 1.5
Turkey 941 835 1.4 58.2 23.9 2.7
United Arab Emirates 380 243.6 1.1 5.7
Yemen 6 340 0.1 9.5 0.0 0.2
Europe 44.1 11.4 11.7
Eastern Europe 24
.0 7
.6 8
.1
Belarus 48 100 97.7 40.9 136.5
Bulgaria 53 100 111.8 47.9 1.2
Czech Republic 83 813 1.6 69.4 10.8 6.3
Hungary 120 477 1.9 57.5 9.2 10.0
Poland 1 577 290 1.3 79.4 27.3 30.7
Republic of Moldova 35 984 1.1 6.9 0.8 0.4
Romania 176 841 0.7 32.4 11.0 3.2
Russian Federation 329 980 10.0 3.2 2.2
Slovakia 21 372 1.1 61.8 9.4 5.8
Ukraine 333 529 1.1 21.1 5.7 2.2
Northern Europe 110.2 22.9 25.4
Åland Islands
Channel Islands
Denmark 113 402 1.0 76.7 8.4 17.8
Estonia 33 744 0.6 45.2 9.4 13.9
Faroe Islands
Finland 175 232 0.7 76.4 27.7 3.7
Guernsey
Iceland 11 432 0.8 1 714.3 542.9 414.3
48
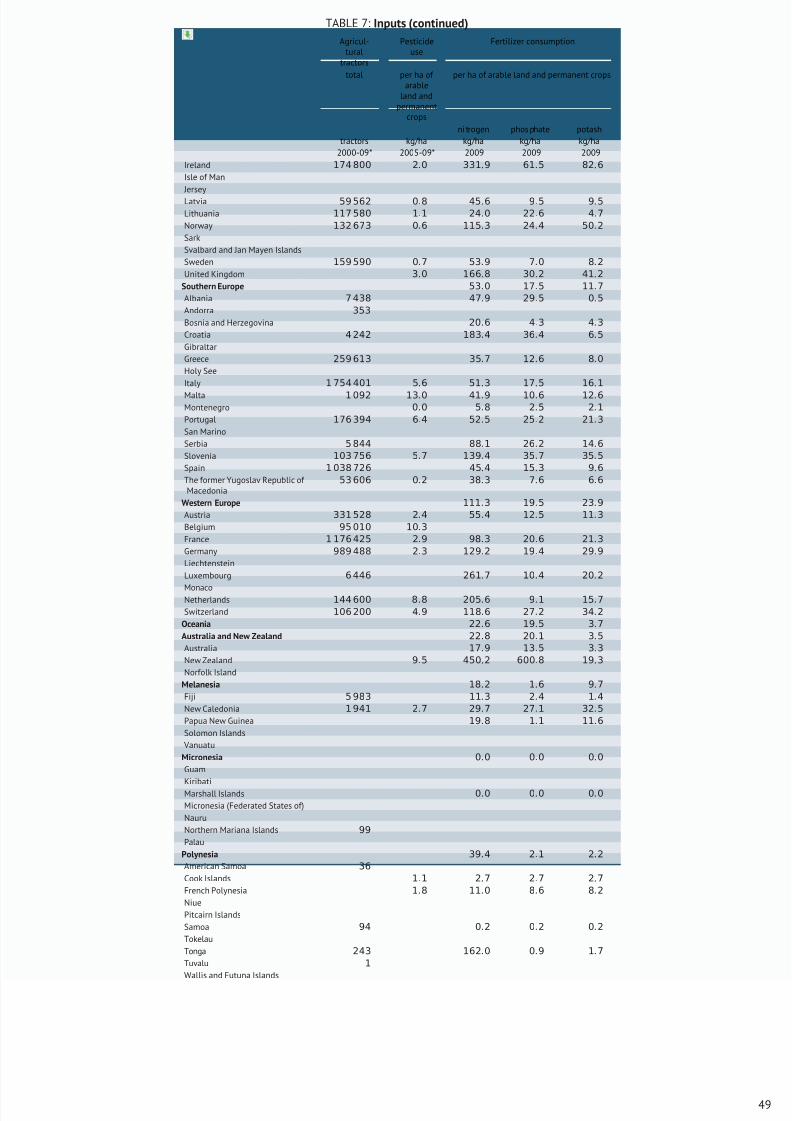
8/16/2019 Informe de la Fao 2013
http://slidepdf.com/reader/full/informe-de-la-fao-2013 67/307
TABLE 7: Inputs (continued)
Agricul-tural
tractors
Pesticideuse
Fertilizer consumption
total per ha of arable
land andpermanent
crops
per ha of arable land and permanent crops
ni trogen phos phate potashtractors kg/ha kg/ha kg/ha kg/ha
2000-09* 2005-09* 2009 2009 2009
Ireland 174 800 2.0 331.9 61.5 82.6
Isle of Man
Jersey
Latvia 59 562 0.8 45.6 9.5 9.5
Lithuania 117 580 1.1 24.0 22.6 4.7
Norway 132 673 0.6 115.3 24.4 50.2
Sark
Svalbard and Jan Mayen Islands
Sweden 159 590 0.7 53.9 7.0 8.2
United Kingdom 3.0 166.8 30.2 41.2
Southern Europe 53.0 17.5 11.7
Albania 7 438 47.9 29.5 0.5
Andorra 353
Bosnia and Herzegovina 20.6 4.3 4.3
Croatia 4 242 183.4 36.4 6.5
Gibraltar
Greece 259 613 35.7 12.6 8.0
Holy See
Italy 1 754 401 5.6 51.3 17.5 16.1
Malta 1 092 13.0 41.9 10.6 12.6
Montenegro 0.0 5.8 2.5 2.1
Portugal 176 394 6.4 52.5 25.2 21.3
San Marino
Serbia 5 844 88.1 26.2 14.6
Slovenia 103 756 5.7 139.4 35.7 35.5
Spain 1 038 726 45.4 15.3 9.6
The former Yugoslav Republic of Macedonia
53 606 0.2 38.3 7.6 6.6
Western Europe 111.3 19.5 23.9
Austria 331 528 2.4 55.4 12.5 11.3
Belgium 95 010 10.3
France 1 176 425 2.9 98.3 20.6 21.3
Germany 989 488 2.3 129.2 19.4 29.9
Liechtenstein
Luxembourg 6 446 261.7 10.4 20.2
MonacoNetherlands 144 600 8.8 205.6 9.1 15.7
Switzerland 106 200 4.9 118.6 27.2 34.2
Oceania 22.6 19.5 3.7
Australia and New Zealand 22.8 20.1 3.5
Australia 17.9 13.5 3.3
New Zealand 9.5 450.2 600.8 19.3
Norfolk Island
Melanesia 18.2 1.6 9.7
Fiji 5 983 11.3 2.4 1.4
New Caledonia 1 941 2.7 29.7 27.1 32.5
Papua New Guinea 19.8 1.1 11.6
Solomon Islands
Vanuatu
Micronesia 0.0 0.0 0.0
Guam
KiribatiMarshall Islands 0.0 0.0 0.0
Micronesia (Federated States of)
Nauru
Northern Mariana Islands 99
Palau
Polynesia 39.4 2.1 2.2
American Samoa 36
Cook Islands 1.1 2.7 2.7 2.7
French Polynesia 1.8 11.0 8.6 8.2
Niue
Pitcairn Islands
Samoa 94 0.2 0.2 0.2
Tokelau
Tonga 243 162.0 0.9 1.7
Tuvalu 1
Wallis and Futuna Islands
49
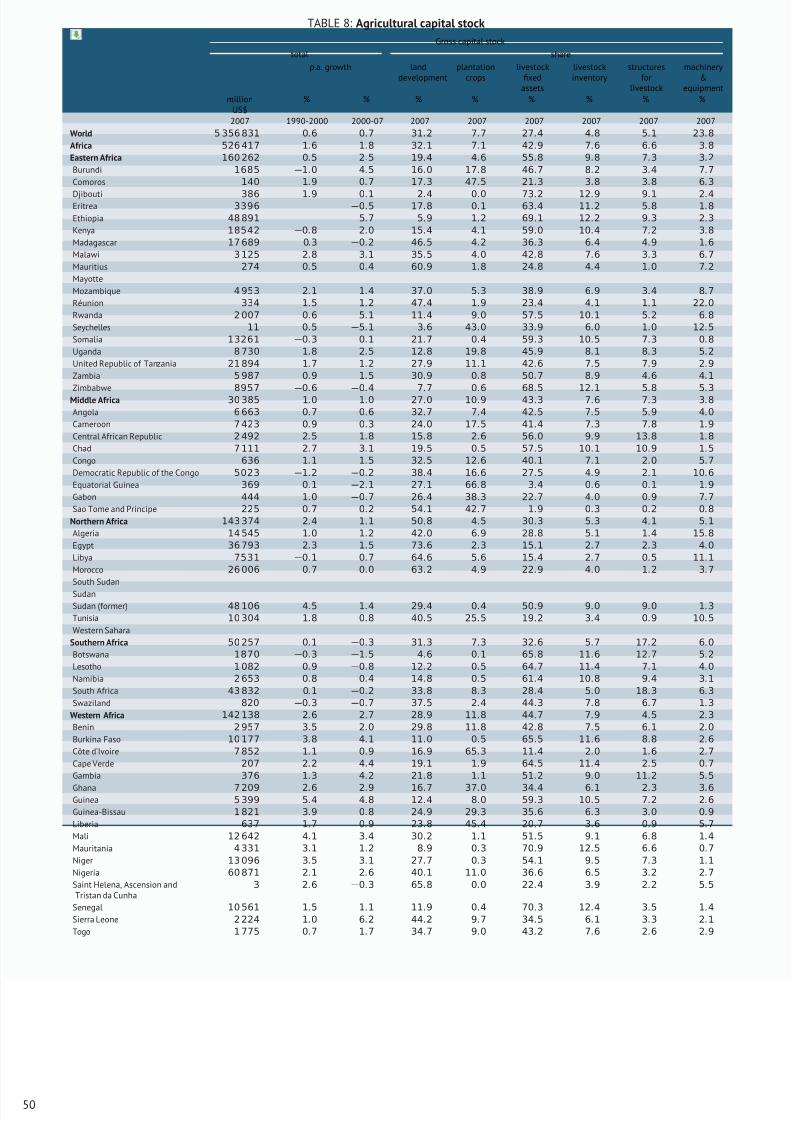
8/16/2019 Informe de la Fao 2013
http://slidepdf.com/reader/full/informe-de-la-fao-2013 68/307
TABLE 8: Agricultural capital stock
Gross capital stock
total share
p.a. growth landdevelopment
plantationcrops
livestockfixed
assets
livestockinventory
structuresfor
livestock
machinery&
equipmentmillion
US$% % % % % % % %
2007 1990-2000 2000-07 2007 2007 2007 2007 2007 2007
World 5 356 831 0.6 0.7 31.2 7.7 27.4 4.8 5.1 23.8
Africa 526 417 1.6 1.8 32.1 7.1 42.9 7.6 6.6 3.8
Eastern Africa 160 262 0.5 2.5 19.4 4.6 55.8 9.8 7.3 3.2
Burundi 1685 −1.0 4.5 16.0 17.8 46.7 8.2 3.4 7.7
Comoros 140 1.9 0.7 17.3 47.5 21.3 3.8 3.8 6.3
Djibouti 386 1.9 0.1 2.4 0.0 73.2 12.9 9.1 2.4Eritrea 3396 −0.5 17.8 0.1 63.4 11.2 5.8 1.8
Ethiopia 48 891 5.7 5.9 1.2 69.1 12.2 9.3 2.3
Kenya 18542 −0.8 2.0 15.4 4.1 59.0 10.4 7.2 3.8
Madagascar 17 689 0.3 −0.2 46.5 4.2 36.3 6.4 4.9 1.6
Malawi 3 125 2.8 3.1 35.5 4.0 42.8 7.6 3.3 6.7
Mauritius 274 0.5 0.4 60.9 1.8 24.8 4.4 1.0 7.2
Mayotte
Mozambique 4 953 2.1 1.4 37.0 5.3 38.9 6.9 3.4 8.7
Réunion 334 1.5 1.2 47.4 1.9 23.4 4.1 1.1 22.0
Rwanda 2 007 0.6 5.1 11.4 9.0 57.5 10.1 5.2 6.8
Seychelles 11 0.5 −5.1 3.6 43.0 33.9 6.0 1.0 12.5
Somalia 13261 −0.3 0.1 21.7 0.4 59.3 10.5 7.3 0.8
Uganda 8 730 1.8 2.5 12.8 19.8 45.9 8.1 8.3 5.2
United Republic of Tanzania 21 894 1.7 1.2 27.9 11.1 42.6 7.5 7.9 2.9
Zambia 5 987 0.9 1.5 30.9 0.8 50.7 8.9 4.6 4.1
Zimbabwe 8957 −0.
6 −0.
4 7.
7 0.
6 68.
5 12.
1 5.
8 5.
3
Middle Africa 30 385 1.0 1.0 27.0 10.9 43.3 7.6 7.3 3.8
Angola 6 663 0.7 0.6 32.7 7.4 42.5 7.5 5.9 4.0
Cameroon 7 423 0.9 0.3 24.0 17.5 41.4 7.3 7.8 1.9
Central African Republic 2 492 2.5 1.8 15.8 2.6 56.0 9.9 13.8 1.8
Chad 7 111 2.7 3.1 19.5 0.5 57.5 10.1 10.9 1.5
Congo 636 1.1 1.5 32.5 12.6 40.1 7.1 2.0 5.7
Democratic Republic of the Congo 5023 −1.2 −0.2 38.4 16.6 27.5 4.9 2.1 10.6
Equatorial Guinea 369 0.1 −2.1 27.1 66.8 3.4 0.6 0.1 1.9
Gabon 444 1.0 −0.7 26.4 38.3 22.7 4.0 0.9 7.7
Sao Tome and Principe 225 0.7 0.2 54.1 42.7 1.9 0.3 0.2 0.8
Northern Africa 143 374 2.4 1.1 50.8 4.5 30.3 5.3 4.1 5.1
Algeria 14 545 1.0 1.2 42.0 6.9 28.8 5.1 1.4 15.8
Egypt 36 793 2.3 1.5 73.6 2.3 15.1 2.7 2.3 4.0
Libya 7531 −0.1 0.7 64.6 5.6 15.4 2.7 0.5 11.1
Morocco 26 006 0.7 0.0 63.2 4.9 22.9 4.0 1.2 3.7
South Sudan
Sudan
Sudan (former) 48 106 4.5 1.4 29.4 0.4 50.9 9.0 9.0 1.3
Tunisia 10 304 1.8 0.8 40.5 25.5 19.2 3.4 0.9 10.5
Western Sahara
Southern Africa 50 257 0.1 −0.3 31.3 7.3 32.6 5.7 17.2 6.0
Botswana 1870 −0.3 −1.5 4.6 0.1 65.8 11.6 12.7 5.2
Lesotho 1 082 0.9 −0.8 12.2 0.5 64.7 11.4 7.1 4.0
Namibia 2 653 0.8 0.4 14.8 0.5 61.4 10.8 9.4 3.1
South Africa 43 832 0.1 −0.2 33.8 8.3 28.4 5.0 18.3 6.3
Swaziland 820 −0.3 −0.7 37.5 2.4 44.3 7.8 6.7 1.3
Western Africa 142 138 2.6 2.7 28.9 11.8 44.7 7.9 4.5 2.3
Benin 2 957 3.5 2.0 29.8 11.8 42.8 7.5 6.1 2.0
Burkina Faso 10 177 3.8 4.1 11.0 0.5 65.5 11.6 8.8 2.6
Côte d’Ivoire 7 852 1.1 0.9 16.9 65.3 11.4 2.0 1.6 2.7
Cape Verde 207 2.2 4.4 19.1 1.9 64.5 11.4 2.5 0.7
Gambia 376 1.3 4.2 21.8 1.1 51.2 9.0 11.2 5.5
Ghana 7 209 2.6 2.9 16.7 37.0 34.4 6.1 2.3 3.6
Guinea 5 399 5.4 4.8 12.4 8.0 59.3 10.5 7.2 2.6
Guinea-Bissau 1 821 3.9 0.8 24.9 29.3 35.6 6.3 3.0 0.9
Liberia 637 1.7 0.9 23.8 45.4 20.7 3.6 0.9 5.7
Mali 12 642 4.1 3.4 30.2 1.1 51.5 9.1 6.8 1.4
Mauritania 4 331 3.1 1.2 8.9 0.3 70.9 12.5 6.6 0.7
Niger 13 096 3.5 3.1 27.7 0.3 54.1 9.5 7.3 1.1
Nigeria 60 871 2.1 2.6 40.1 11.0 36.6 6.5 3.2 2.7
Saint Helena, Ascension andTristan da Cunha
3 2.6 −0.3 65.8 0.0 22.4 3.9 2.2 5.5
Senegal 10 561 1.5 1.1 11.9 0.4 70.3 12.4 3.5 1.4
Sierra Leone 2 224 1.0 6.2 44.2 9.7 34.5 6.1 3.3 2.1
Togo 1 775 0.7 1.7 34.7 9.0 43.2 7.6 2.6 2.9
50
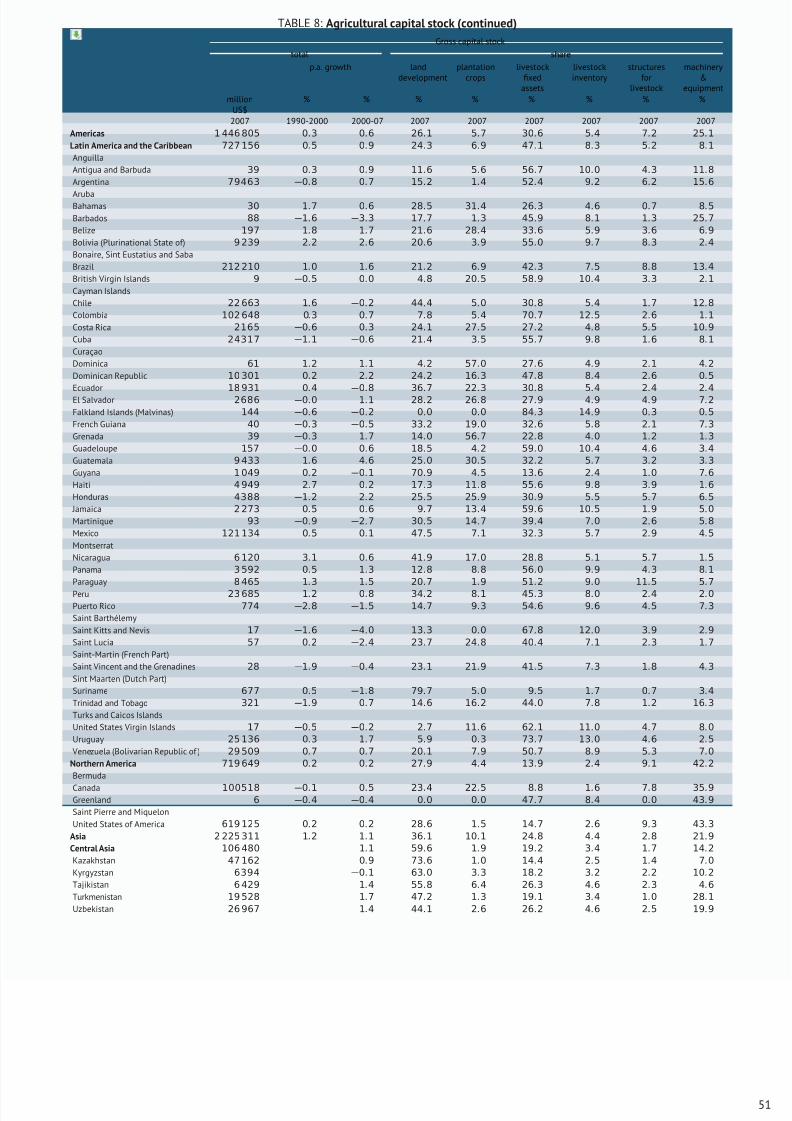
8/16/2019 Informe de la Fao 2013
http://slidepdf.com/reader/full/informe-de-la-fao-2013 69/307
TABLE 8: Agricultural capital stock (continued)
Gross capital stock
total share
p.a. growth landdevelopment
plantationcrops
livestockfixed
assets
livestockinventory
structuresfor
livestock
machinery&
equipmentmillion
US$% % % % % % % %
2007 1990-2000 2000-07 2007 2007 2007 2007 2007 2007
Americas 1 446 805 0.3 0.6 26.1 5.7 30.6 5.4 7.2 25.1
Latin America and the Caribbean 727 156 0.5 0.9 24.3 6.9 47.1 8.3 5.2 8.1
Anguilla
Antigua and Barbuda 39 0.3 0.9 11.6 5.6 56.7 10.0 4.3 11.8
Argentina 79463 −0.8 0.7 15.2 1.4 52.4 9.2 6.2 15.6
ArubaBahamas 30 1.7 0.6 28.5 31.4 26.3 4.6 0.7 8.5
Barbados 88 −1.6 −3.3 17.7 1.3 45.9 8.1 1.3 25.7
Belize 197 1.8 1.7 21.6 28.4 33.6 5.9 3.6 6.9
Bolivia (Plurinational State of) 9 239 2.2 2.6 20.6 3.9 55.0 9.7 8.3 2.4
Bonaire, Sint Eustatius and Saba
Brazil 212 210 1.0 1.6 21.2 6.9 42.3 7.5 8.8 13.4
British Virgin Islands 9 −0.5 0.0 4.8 20.5 58.9 10.4 3.3 2.1
Cayman Islands
Chile 22 663 1.6 −0.2 44.4 5.0 30.8 5.4 1.7 12.8
Colombia 102 648 0.3 0.7 7.8 5.4 70.7 12.5 2.6 1.1
Costa Rica 2165 −0.6 0.3 24.1 27.5 27.2 4.8 5.5 10.9
Cuba 24317 −1.1 −0.6 21.4 3.5 55.7 9.8 1.6 8.1
Curaçao
Dominica 61 1.2 1.1 4.2 57.0 27.6 4.9 2.1 4.2
Dominican Republic 10 301 0.2 2.2 24.2 16.3 47.8 8.4 2.6 0.5
Ecuador 18 931 0.
4 −0.
8 36.
7 22.
3 30.
8 5.
4 2.
4 2.
4
El Salvador 2686 −0.0 1.1 28.2 26.8 27.9 4.9 4.9 7.2
Falkland Islands (Malvinas) 144 −0.6 −0.2 0.0 0.0 84.3 14.9 0.3 0.5
French Guiana 40 −0.3 −0.5 33.2 19.0 32.6 5.8 2.1 7.3
Grenada 39 −0.3 1.7 14.0 56.7 22.8 4.0 1.2 1.3
Guadeloupe 157 −0.0 0.6 18.5 4.2 59.0 10.4 4.6 3.4
Guatemala 9 433 1.6 4.6 25.0 30.5 32.2 5.7 3.2 3.3
Guyana 1 049 0.2 −0.1 70.9 4.5 13.6 2.4 1.0 7.6
Haiti 4 949 2.7 0.2 17.3 11.8 55.6 9.8 3.9 1.6
Honduras 4388 −1.2 2.2 25.5 25.9 30.9 5.5 5.7 6.5
Jamaica 2 273 0.5 0.6 9.7 13.4 59.6 10.5 1.9 5.0
Martinique 93 −0.9 −2.7 30.5 14.7 39.4 7.0 2.6 5.8
Mexico 121 134 0.5 0.1 47.5 7.1 32.3 5.7 2.9 4.5
Montserrat
Nicaragua 6 120 3.1 0.6 41.9 17.0 28.8 5.1 5.7 1.5
Panama 3 592 0.5 1.3 12.8 8.8 56.0 9.9 4.3 8.1
Paraguay 8 465 1.3 1.5 20.7 1.9 51.2 9.0 11.5 5.7
Peru 23 685 1.2 0.8 34.2 8.1 45.3 8.0 2.4 2.0
Puerto Rico 774 −2.8 −1.5 14.7 9.3 54.6 9.6 4.5 7.3
Saint Barthélemy
Saint Kitts and Nevis 17 −1.6 −4.0 13.3 0.0 67.8 12.0 3.9 2.9
Saint Lucia 57 0.2 −2.4 23.7 24.8 40.4 7.1 2.3 1.7
Saint-Martin (French Part)
Saint Vincent and the Grenadines 28 −1.9 −0.4 23.1 21.9 41.5 7.3 1.8 4.3
Sint Maarten (Dutch Part)
Suriname 677 0.5 −1.8 79.7 5.0 9.5 1.7 0.7 3.4
Trinidad and Tobago 321 −1.9 0.7 14.6 16.2 44.0 7.8 1.2 16.3
Turks and Caicos Islands
United States Virgin Islands 17 −0.5 −0.2 2.7 11.6 62.1 11.0 4.7 8.0
Uruguay 25 136 0.3 1.7 5.9 0.3 73.7 13.0 4.6 2.5
Venezuela (Bolivarian Republic of ) 29 509 0.7 0.7 20.1 7.9 50.7 8.9 5.3 7.0
Northern America 719 649 0.2 0.2 27.9 4.4 13.9 2.4 9.1 42.2
Bermuda
Canada 100518 −0.1 0.5 23.4 22.5 8.8 1.6 7.8 35.9
Greenland 6 −0.4 −0.4 0.0 0.0 47.7 8.4 0.0 43.9
Saint Pierre and Miquelon
United States of America 619 125 0.2 0.2 28.6 1.5 14.7 2.6 9.3 43.3
Asia 2 225 311 1.2 1.1 36.1 10.1 24.8 4.4 2.8 21.9
Central Asia 106 480 1.1 59.6 1.9 19.2 3.4 1.7 14.2
Kazakhstan 47 162 0.9 73.6 1.0 14.4 2.5 1.4 7.0
Kyrgyzstan 6394 −0.1 63.0 3.3 18.2 3.2 2.2 10.2
Tajikistan 6 429 1.4 55.8 6.4 26.3 4.6 2.3 4.6
Turkmenistan 19 528 1.7 47.2 1.3 19.1 3.4 1.0 28.1
Uzbekistan 26 967 1.4 44.1 2.6 26.2 4.6 2.5 19.9
51
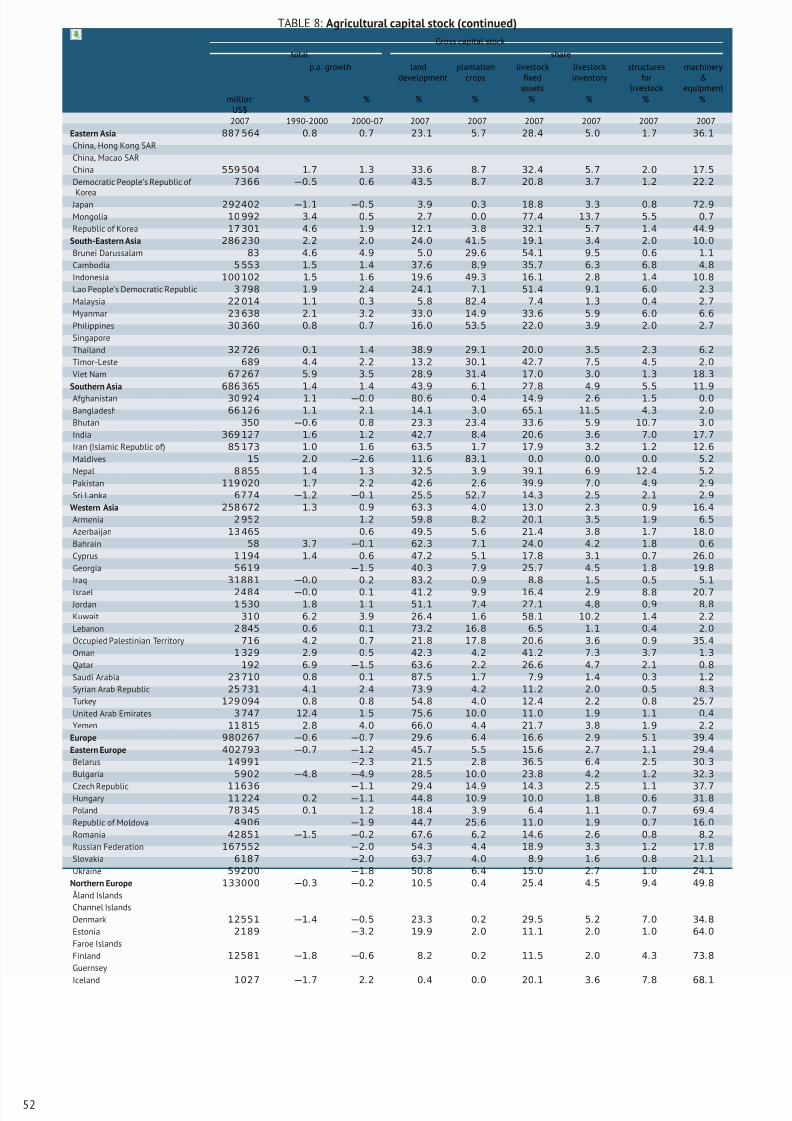
8/16/2019 Informe de la Fao 2013
http://slidepdf.com/reader/full/informe-de-la-fao-2013 70/307
TABLE 8: Agricultural capital stock (continued)
Gross capital stock
total share
p.a. growth landdevelopment
plantationcrops
livestockfixed
assets
livestockinventory
structuresfor
livestock
machinery&
equipmentmillion
US$% % % % % % % %
2007 1990-2000 2000-07 2007 2007 2007 2007 2007 2007
Eastern Asia 887 564 0.8 0.7 23.1 5.7 28.4 5.0 1.7 36.1
China, Hong Kong SAR
China, Macao SAR
China 559 504 1.7 1.3 33.6 8.7 32.4 5.7 2.0 17.5
Democratic People’s Republic of
Korea
7366 −0.5 0.6 43.5 8.7 20.8 3.7 1.2 22.2
Japan 292402 −1.1 −0.5 3.9 0.3 18.8 3.3 0.8 72.9
Mongolia 10 992 3.4 0.5 2.7 0.0 77.4 13.7 5.5 0.7
Republic of Korea 17 301 4.6 1.9 12.1 3.8 32.1 5.7 1.4 44.9
South-Eastern Asia 286 230 2.2 2.0 24.0 41.5 19.1 3.4 2.0 10.0
Brunei Darussalam 83 4.6 4.9 5.0 29.6 54.1 9.5 0.6 1.1
Cambodia 5 553 1.5 1.4 37.6 8.9 35.7 6.3 6.8 4.8
Indonesia 100 102 1.5 1.6 19.6 49.3 16.1 2.8 1.4 10.8
Lao People’s Democratic Republic 3 798 1.9 2.4 24.1 7.1 51.4 9.1 6.0 2.3
Malaysia 22 014 1.1 0.3 5.8 82.4 7.4 1.3 0.4 2.7
Myanmar 23 638 2.1 3.2 33.0 14.9 33.6 5.9 6.0 6.6
Philippines 30 360 0.8 0.7 16.0 53.5 22.0 3.9 2.0 2.7
Singapore
Thailand 32 726 0.1 1.4 38.9 29.1 20.0 3.5 2.3 6.2
Timor-Leste 689 4.4 2.2 13.2 30.1 42.7 7.5 4.5 2.0
Viet Nam 67 267 5.9 3.5 28.9 31.4 17.0 3.0 1.3 18.3
Southern Asia 686 365 1.4 1.4 43.9 6.1 27.8 4.9 5.5 11.9
Afghanistan 30 924 1.1 −0.0 80.6 0.4 14.9 2.6 1.5 0.0
Bangladesh 66 126 1.1 2.1 14.1 3.0 65.1 11.5 4.3 2.0
Bhutan 350 −0.6 0.8 23.3 23.4 33.6 5.9 10.7 3.0
India 369 127 1.6 1.2 42.7 8.4 20.6 3.6 7.0 17.7
Iran (Islamic Republic of) 85 173 1.0 1.6 63.5 1.7 17.9 3.2 1.2 12.6
Maldives 15 2.0 −2.6 11.6 83.1 0.0 0.0 0.0 5.2
Nepal 8 855 1.4 1.3 32.5 3.9 39.1 6.9 12.4 5.2
Pakistan 119 020 1.7 2.2 42.6 2.6 39.9 7.0 4.9 2.9
Sri Lanka 6774 −1.2 −0.1 25.5 52.7 14.3 2.5 2.1 2.9
Western Asia 258 672 1.3 0.9 63.3 4.0 13.0 2.3 0.9 16.4
Armenia 2 952 1.2 59.8 8.2 20.1 3.5 1.9 6.5
Azerbaijan 13 465 0.6 49.5 5.6 21.4 3.8 1.7 18.0
Bahrain 58 3.7 −0.1 62.3 7.1 24.0 4.2 1.8 0.6
Cyprus 1 194 1.4 0.6 47.2 5.1 17.8 3.1 0.7 26.0
Georgia 5619 −1.5 40.3 7.9 25.7 4.5 1.8 19.8
Iraq 31881 −0.0 0.2 83.2 0.9 8.8 1.5 0.5 5.1
Israel 2484 −0.0 0.1 41.2 9.9 16.4 2.9 8.8 20.7
Jordan 1 530 1.8 1.1 51.1 7.4 27.1 4.8 0.9 8.8
Kuwait 310 6.2 3.9 26.4 1.6 58.1 10.2 1.4 2.2
Lebanon 2 845 0.6 0.1 73.2 16.8 6.5 1.1 0.4 2.0
Occupied Palestinian Territory 716 4.2 0.7 21.8 17.8 20.6 3.6 0.9 35.4
Oman 1 329 2.9 0.5 42.3 4.2 41.2 7.3 3.7 1.3
Qatar 192 6.9 −1.5 63.6 2.2 26.6 4.7 2.1 0.8
Saudi Arabia 23 710 0.8 0.1 87.5 1.7 7.9 1.4 0.3 1.2
Syrian Arab Republic 25 731 4.1 2.4 73.9 4.2 11.2 2.0 0.5 8.3
Turkey 129 094 0.8 0.8 54.8 4.0 12.4 2.2 0.8 25.7
United Arab Emirates 3 747 12.4 1.5 75.6 10.0 11.0 1.9 1.1 0.4
Yemen 11 815 2.8 4.0 66.0 4.4 21.7 3.8 1.9 2.2
Europe 980267 −0.6 −0.7 29.6 6.4 16.6 2.9 5.1 39.4
Eastern Europe 402793 −0.7 −1.2 45.7 5.5 15.6 2.7 1.1 29.4
Belarus 14991 −2.3 21.5 2.8 36.5 6.4 2.5 30.3
Bulgaria 5902 −4.8 −4.9 28.5 10.0 23.8 4.2 1.2 32.3
Czech Republic 11636 −1.1 29.4 14.9 14.3 2.5 1.1 37.7Hungary 11 224 0.2 −1.1 44.8 10.9 10.0 1.8 0.6 31.8
Poland 78 345 0.1 1.2 18.4 3.9 6.4 1.1 0.7 69.4
Republic of Moldova 4906 −1.9 44.7 25.6 11.0 1.9 0.7 16.0
Romania 42851 −1.5 −0.2 67.6 6.2 14.6 2.6 0.8 8.2
Russian Federation 167552 −2.0 54.3 4.4 18.9 3.3 1.2 17.8
Slovakia 6187 −2.0 63.7 4.0 8.9 1.6 0.8 21.1
Ukraine 59200 −1.8 50.8 6.4 15.0 2.7 1.0 24.1
Northern Europe 133000 −0.3 −0.2 10.5 0.4 25.4 4.5 9.4 49.8
Åland Islands
Channel Islands
Denmark 12551 −1.4 −0.5 23.3 0.2 29.5 5.2 7.0 34.8
Estonia 2189 −3.2 19.9 2.0 11.1 2.0 1.0 64.0
Faroe Islands
Finland 12581 −1.8 −0.6 8.2 0.2 11.5 2.0 4.3 73.8
Guernsey
Iceland 1027 −1.7 2.2 0.4 0.0 20.1 3.6 7.8 68.1
52
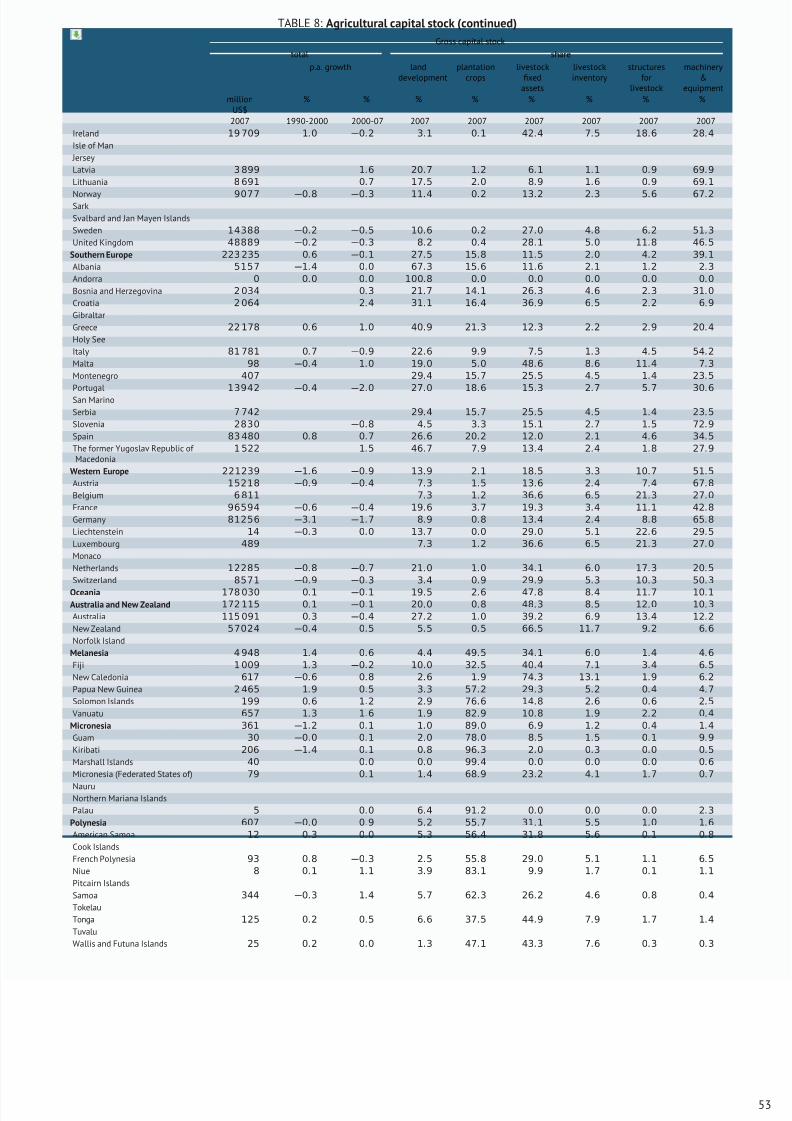
8/16/2019 Informe de la Fao 2013
http://slidepdf.com/reader/full/informe-de-la-fao-2013 71/307
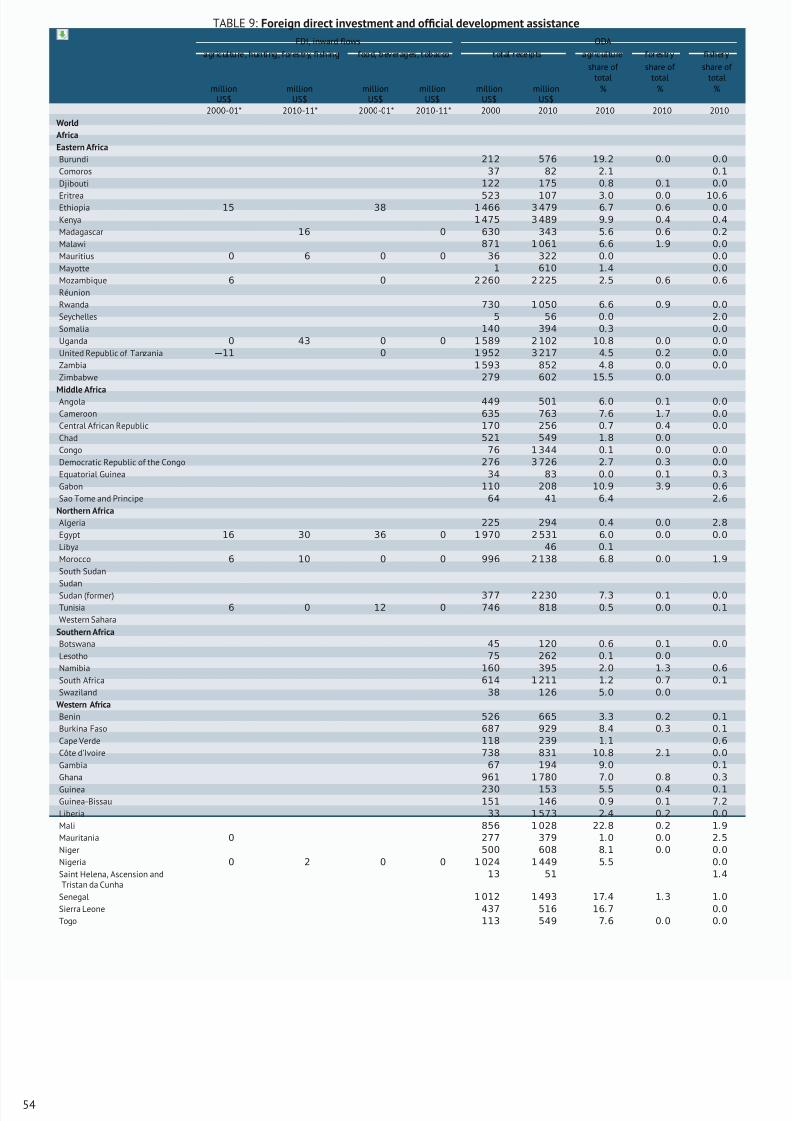
8/16/2019 Informe de la Fao 2013
http://slidepdf.com/reader/full/informe-de-la-fao-2013 72/307
TABLE 9: Foreign direct investment and official development assistance
FDI, inward flows ODA
agriculture, hunting, forestry, fishing food, beverages, tobacco total receipts agriculture forestry fishery
share of total
share of total
share of total
millionUS$
millionUS$
millionUS$
millionUS$
millionUS$
millionUS$
% % %
2000-01* 2010-11* 2000-01* 2010-11* 2000 2010 2010 2010 2010
World
Africa
Eastern Africa
Burundi 212 576 19.2 0.0 0.0
Comoros 37 82 2.1 0.1
Djibouti 122 175 0.8 0.1 0.0
Eritrea 523 107 3.0 0.0 10.6Ethiopia 15 38 1 466 3 479 6.7 0.6 0.0
Kenya 1 475 3 489 9.9 0.4 0.4
Madagascar 16 0 630 343 5.6 0.6 0.2
Malawi 871 1 061 6.6 1.9 0.0
Mauritius 0 6 0 0 36 322 0.0 0.0
Mayotte 1 610 1.4 0.0
Mozambique 6 0 2 260 2 225 2.5 0.6 0.6
Réunion
Rwanda 730 1 050 6.6 0.9 0.0
Seychelles 5 56 0.0 2.0
Somalia 140 394 0.3 0.0
Uganda 0 43 0 0 1 589 2 102 10.8 0.0 0.0
United Republic of Tanzania −11 0 1 952 3 217 4.5 0.2 0.0
Zambia 1 593 852 4.8 0.0 0.0
Zimbabwe 279 602 15.5 0.0
Middle AfricaAngola 449 501 6.0 0.1 0.0
Cameroon 635 763 7.6 1.7 0.0
Central African Republic 170 256 0.7 0.4 0.0
Chad 521 549 1.8 0.0
Congo 76 1 344 0.1 0.0 0.0
Democratic Republic of the Congo 276 3 726 2.7 0.3 0.0
Equatorial Guinea 34 83 0.0 0.1 0.3
Gabon 110 208 10.9 3.9 0.6
Sao Tome and Principe 64 41 6.4 2.6
Northern Africa
Algeria 225 294 0.4 0.0 2.8
Egypt 16 30 36 0 1 970 2 531 6.0 0.0 0.0
Libya 46 0.1
Morocco 6 10 0 0 996 2 138 6.8 0.0 1.9
South Sudan
Sudan
Sudan (former) 377 2 230 7.3 0.1 0.0
Tunisia 6 0 12 0 746 818 0.5 0.0 0.1
Western Sahara
Southern Africa
Botswana 45 120 0.6 0.1 0.0
Lesotho 75 262 0.1 0.0
Namibia 160 395 2.0 1.3 0.6
South Africa 614 1 211 1.2 0.7 0.1
Swaziland 38 126 5.0 0.0
Western Africa
Benin 526 665 3.3 0.2 0.1
Burkina Faso 687 929 8.4 0.3 0.1
Cape Verde 118 239 1.1 0.6
Côte d’Ivoire 738 831 10.8 2.1 0.0
Gambia 67 194 9.0 0.1
Ghana 961 1 780 7.0 0.8 0.3
Guinea 230 153 5.5 0.4 0.1
Guinea-Bissau 151 146 0.9 0.1 7.2
Liberia 33 1 573 2.4 0.2 0.0
Mali 856 1 028 22.8 0.2 1.9
Mauritania 0 277 379 1.0 0.0 2.5
Niger 500 608 8.1 0.0 0.0
Nigeria 0 2 0 0 1 024 1 449 5.5 0.0
Saint Helena, Ascension andTristan da Cunha
13 51 1.4
Senegal 1 012 1 493 17.4 1.3 1.0
Sierra Leone 437 516 16.7 0.0
Togo 113 549 7.6 0.0 0.0
54
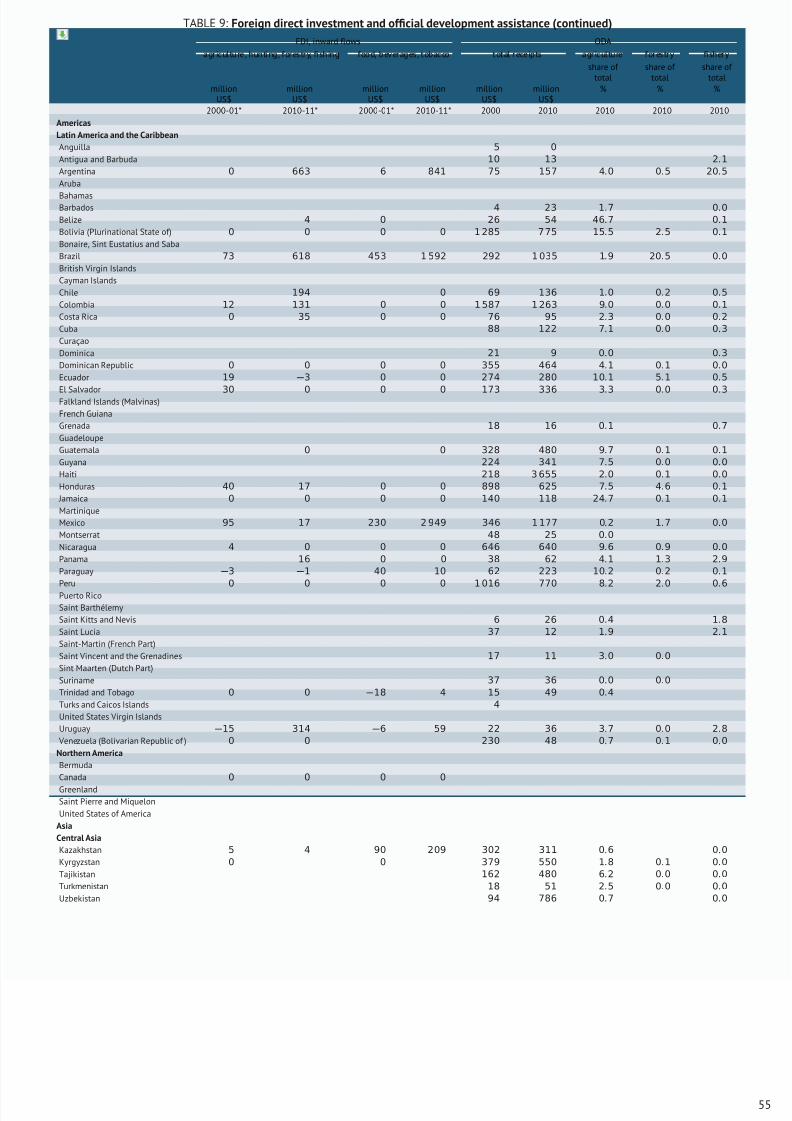
8/16/2019 Informe de la Fao 2013
http://slidepdf.com/reader/full/informe-de-la-fao-2013 73/307
TABLE 9: Foreign direct investment and official development assistance (continued)
FDI, inward flows ODA
agriculture, hunting, forestry, fishing food, beverages, tobacco total receipts agriculture forestry fishery
share of total
share of total
share of total
millionUS$
millionUS$
millionUS$
millionUS$
millionUS$
millionUS$
% % %
2000-01* 2010-11* 2000-01* 2010-11* 2000 2010 2010 2010 2010
Americas
Latin America and the Caribbean
Anguilla 5 0
Antigua and Barbuda 10 13 2.1
Argentina 0 663 6 841 75 157 4.0 0.5 20.5
Aruba
BahamasBarbados 4 23 1.7 0.0
Belize 4 0 26 54 46.7 0.1
Bolivia (Plurinational State of) 0 0 0 0 1 285 7 75 15.5 2.5 0.1
Bonaire, Sint Eustatius and Saba
Brazil 73 618 453 1 592 292 1 035 1.9 20.5 0.0
British Virgin Islands
Cayman Islands
Chile 194 0 69 136 1.0 0.2 0.5
Colombia 12 131 0 0 1 587 1 263 9.0 0.0 0.1
Costa Rica 0 35 0 0 76 95 2.3 0.0 0.2
Cuba 88 122 7.1 0.0 0.3
Curaçao
Dominica 21 9 0.0 0.3
Dominican Republic 0 0 0 0 355 464 4.1 0.1 0.0
Ecuador 19 −3 0 0 274 280 10.1 5.1 0.5
El Salvador 30 0 0 0 173 336 3
.3 0
.0 0
.3
Falkland Islands (Malvinas)
French Guiana
Grenada 18 16 0.1 0.7
Guadeloupe
Guatemala 0 0 328 480 9.7 0.1 0.1
Guyana 224 341 7.5 0.0 0.0
Haiti 218 3 655 2.0 0.1 0.0
Honduras 40 17 0 0 898 625 7.5 4.6 0.1
Jamaica 0 0 0 0 140 118 24.7 0.1 0.1
Martinique
Mexico 95 17 230 2 949 346 1 177 0.2 1.7 0.0
Montserrat 48 25 0.0
Nicaragua 4 0 0 0 646 640 9.6 0.9 0.0
Panama 16 0 0 38 62 4.1 1.3 2.9
Paraguay −3 −1 40 10 62 223 10.2 0.2 0.1
Peru 0 0 0 0 1 016 770 8.2 2.0 0.6
Puerto Rico
Saint Barthélemy
Saint Kitts and Nevis 6 26 0.4 1.8
Saint Lucia 37 12 1.9 2.1
Saint-Martin (French Part)
Saint Vincent and the Grenadines 17 11 3.0 0.0
Sint Maarten (Dutch Part)
Suriname 37 36 0.0 0.0
Trinidad and Tobago 0 0 −18 4 15 49 0.4
Turks and Caicos Islands 4
United States Virgin Islands
Uruguay −15 314 −6 59 22 36 3.7 0.0 2.8
Venezuela (Bolivarian Republic of ) 0 0 230 48 0.7 0.1 0.0
Northern America
Bermuda
Canada 0 0 0 0
GreenlandSaint Pierre and Miquelon
United States of America
Asia
Central Asia
Kazakhstan 5 4 90 209 302 311 0.6 0.0
Kyrgyzstan 0 0 379 550 1.8 0.1 0.0
Tajikistan 162 480 6.2 0.0 0.0
Turkmenistan 18 51 2.5 0.0 0.0
Uzbekistan 94 786 0.7 0.0
55
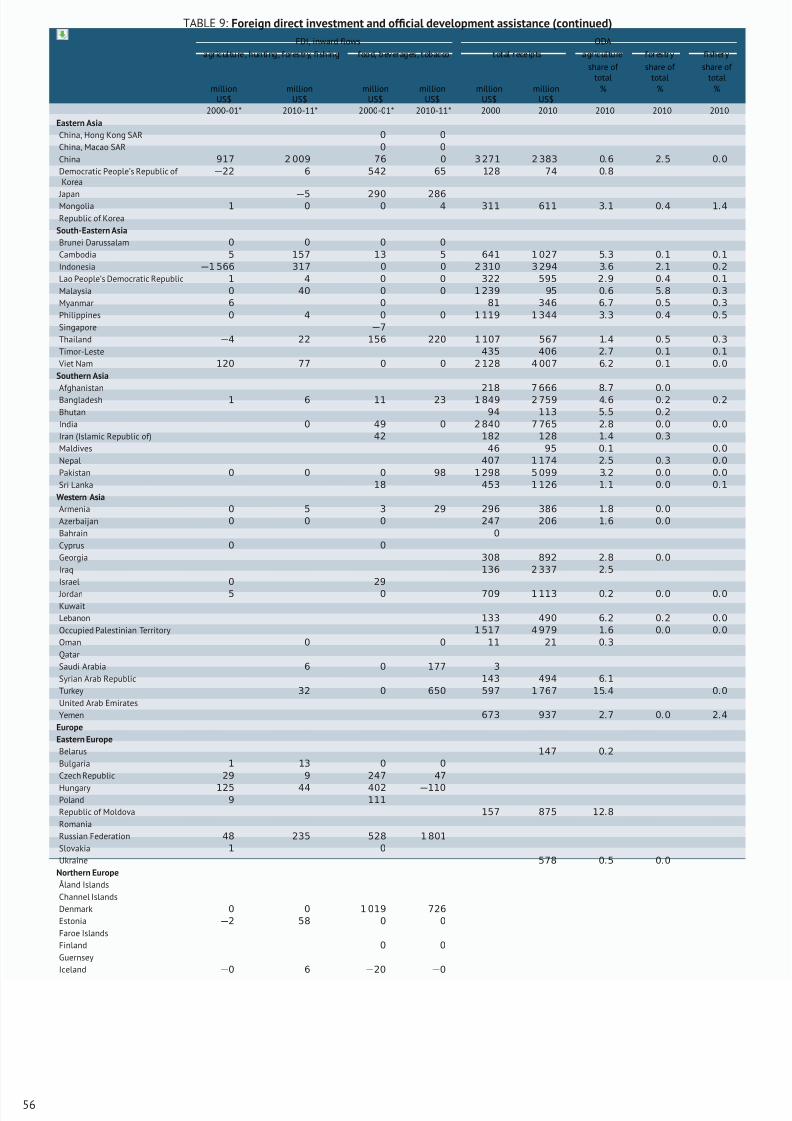
8/16/2019 Informe de la Fao 2013
http://slidepdf.com/reader/full/informe-de-la-fao-2013 74/307
TABLE 9: Foreign direct investment and official development assistance (continued)
FDI, inward flows ODA
agriculture, hunting, forestry, fishing food, beverages, tobacco total receipts agriculture forestry fishery
share of total
share of total
share of total
millionUS$
millionUS$
millionUS$
millionUS$
millionUS$
millionUS$
% % %
2000-01* 2010-11* 2000-01* 2010-11* 2000 2010 2010 2010 2010
Eastern Asia
China, Hong Kong SAR 0 0
China, Macao SAR 0 0
China 917 2 009 76 0 3 271 2 383 0.6 2.5 0.0
Democratic People’s Republic of Korea
−22 6 542 65 128 74 0.8
Japan −5 290 286Mongolia 1 0 0 4 311 611 3.1 0.4 1.4
Republic of Korea
South-Eastern Asia
Brunei Darussalam 0 0 0 0
Cambodia 5 157 13 5 641 1 027 5.3 0.1 0.1
Indonesia −1 566 317 0 0 2 310 3 294 3.6 2.1 0.2
Lao People’s Democratic Republic 1 4 0 0 322 595 2 .9 0.4 0.1
Malaysia 0 40 0 0 1 239 95 0.6 5.8 0.3
Myanmar 6 0 81 346 6.7 0.5 0.3
Philippines 0 4 0 0 1 119 1 344 3.3 0.4 0.5
Singapore −7
Thailand −4 22 156 220 1 107 567 1.4 0.5 0.3
Timor-Leste 435 406 2.7 0.1 0.1
Viet Nam 120 77 0 0 2 128 4 007 6.2 0.1 0.0
Southern Asia
Afghanistan 218 7 666 8.
7 0.
0
Bangladesh 1 6 11 23 1 849 2 759 4.6 0.2 0.2
Bhutan 94 113 5.5 0.2
India 0 49 0 2 840 7 765 2.8 0.0 0.0
Iran (Islamic Republic of) 42 182 128 1.4 0.3
Maldives 46 95 0.1 0.0
Nepal 407 1 174 2.5 0.3 0.0
Pakistan 0 0 0 98 1 298 5 099 3.2 0.0 0.0
Sri Lanka 18 453 1 126 1.1 0.0 0.1
Western Asia
Armenia 0 5 3 29 296 386 1.8 0.0
Azerbaijan 0 0 0 247 206 1.6 0.0
Bahrain 0
Cyprus 0 0
Georgia 308 892 2.8 0.0
Iraq 136 2 337 2.5
Israel 0 29
Jordan 5 0 709 1 113 0.2 0.0 0.0
Kuwait
Lebanon 133 490 6.2 0.2 0.0
Occupied Palestinian Territory 1 517 4 979 1.6 0.0 0.0
Oman 0 0 11 21 0.3
Qatar
Saudi Arabia 6 0 177 3
Syrian Arab Republic 143 494 6.1
Turkey 32 0 650 597 1 767 15.4 0.0
United Arab Emirates
Yemen 673 937 2.7 0.0 2.4
Europe
Eastern Europe
Belarus 147 0.2
Bulgaria 1 13 0 0
Czech Republic 29 9 247 47
Hungary 125 44 402 −110
Poland 9 111
Republic of Moldova 157 875 12.8
Romania
Russian Federation 48 235 528 1 801
Slovakia 1 0
Ukraine 578 0.5 0.0
Northern Europe
Åland Islands
Channel Islands
Denmark 0 0 1 019 726
Estonia −2 58 0 0
Faroe Islands
Finland 0 0
Guernsey
Iceland −0 6 −20 −0
56
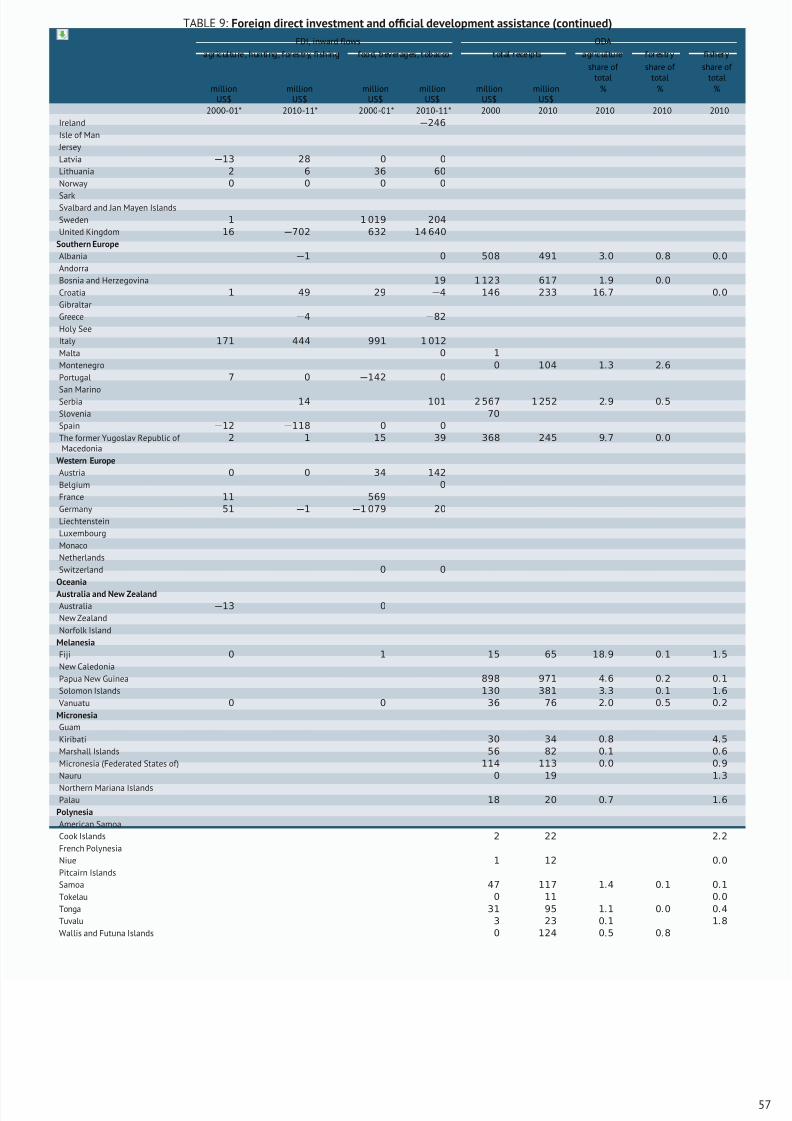
8/16/2019 Informe de la Fao 2013
http://slidepdf.com/reader/full/informe-de-la-fao-2013 75/307
TABLE 9: Foreign direct investment and official development assistance (continued)
FDI, inward flows ODA
agriculture, hunting, forestry, fishing food, beverages, tobacco total receipts agriculture forestry fishery
share of total
share of total
share of total
millionUS$
millionUS$
millionUS$
millionUS$
millionUS$
millionUS$
% % %
2000-01* 2010-11* 2000-01* 2010-11* 2000 2010 2010 2010 2010
Ireland −246
Isle of Man
Jersey
Latvia −13 28 0 0
Lithuania 2 6 36 60
Norway 0 0 0 0
SarkSvalbard and Jan Mayen Islands
Sweden 1 1 019 204
United Kingdom 16 −702 632 14 640
Southern Europe
Albania −1 0 508 491 3.0 0.8 0.0
Andorra
Bosnia and Herzegovina 19 1 123 617 1.9 0.0
Croatia 1 49 29 −4 146 233 16.7 0.0
Gibraltar
Greece −4 −82
Holy See
Italy 171 444 991 1 012
Malta 0 1
Montenegro 0 104 1.3 2.6
Portugal 7 0 −142 0
San MarinoSerbia 14 101 2 567 1 252 2.9 0.5
Slovenia 70
Spain −12 −118 0 0
The former Yugoslav Republic of Macedonia
2 1 15 39 368 245 9.7 0.0
Western Europe
Austria 0 0 34 142
Belgium 0
France 11 569
Germany 51 −1 −1 079 20
Liechtenstein
Luxembourg
Monaco
Netherlands
Switzerland 0 0
Oceania
Australia and New Zealand
Australia −13 0
New Zealand
Norfolk Island
Melanesia
Fiji 0 1 15 65 18.9 0.1 1.5
New Caledonia
Papua New Guinea 898 971 4.6 0.2 0.1
Solomon Islands 130 381 3.3 0.1 1.6
Vanuatu 0 0 36 76 2.0 0.5 0.2
Micronesia
Guam
Kiribati 30 34 0.8 4.5
Marshall Islands 56 82 0.1 0.6
Micronesia (Federated States of) 114 113 0.0 0.9
Nauru 0 19 1.3
Northern Mariana IslandsPalau 18 20 0.7 1.6
Polynesia
American Samoa
Cook Islands 2 22 2.2
French Polynesia
Niue 1 12 0.0
Pitcairn Islands
Samoa 47 117 1.4 0.1 0.1
Tokelau 0 11 0.0
Tonga 31 95 1.1 0.0 0.4
Tuvalu 3 23 0.1 1.8
Wallis and Futuna Islands 0 124 0.5 0.8
57
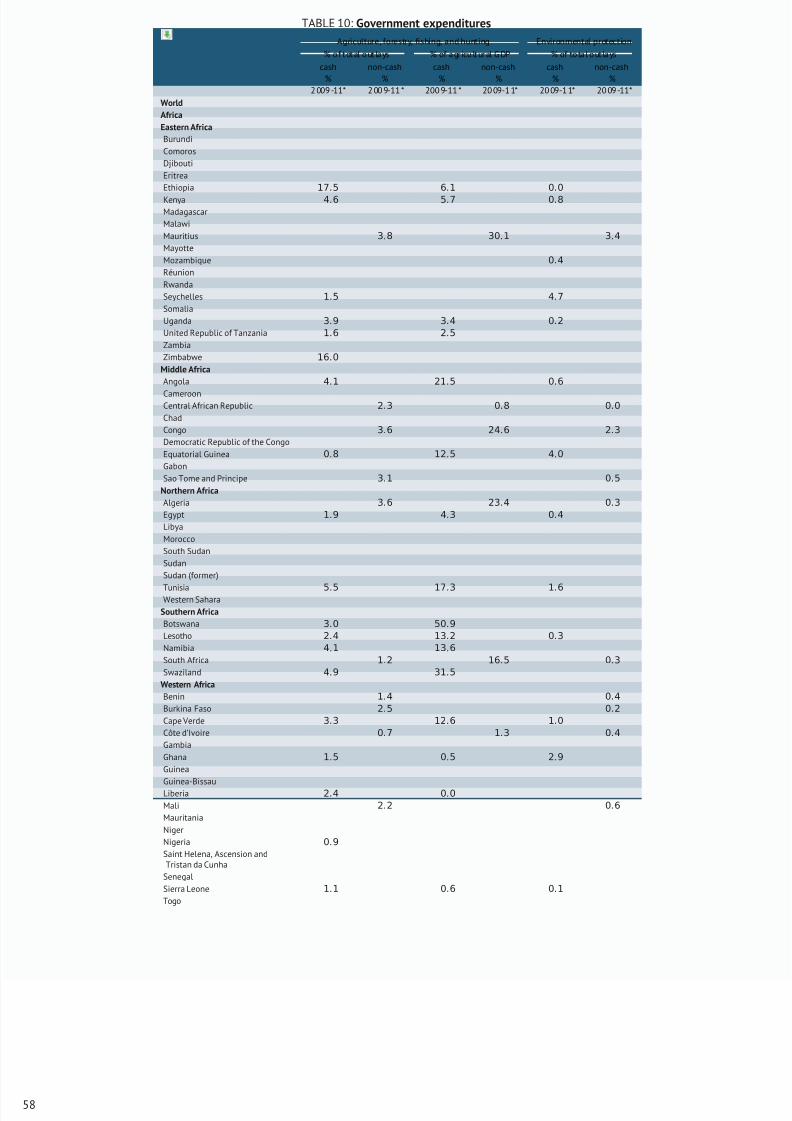
8/16/2019 Informe de la Fao 2013
http://slidepdf.com/reader/full/informe-de-la-fao-2013 76/307
TABLE 10: Government expenditures
Agriculture, forestry, fishing, and hunting Environmental protection
% of total outlays % of agricultural GDP % of total outlays
cash non-cash cash non-cash cash non-cash% % % % % %
2 009 -11* 2 00 9-11 * 200 9-11 * 20 09-1 1* 20 09-1 1* 20 09 -11*
World
Africa
Eastern Africa
Burundi
Comoros
Djibouti
Eritrea
Ethiopia 17.5 6.1 0.0
Kenya 4.6 5.7 0.8
Madagascar
Malawi
Mauritius 3.8 30.1 3.4
Mayotte
Mozambique 0.4
Réunion
Rwanda
Seychelles 1.5 4.7
Somalia
Uganda 3.9 3.4 0.2
United Republic of Tanzania 1.6 2.5
Zambia
Zimbabwe 16.0
Middle Africa
Angola 4.1 21.5 0.6
CameroonCentral African Republic 2.3 0.8 0.0
Chad
Congo 3.6 24.6 2.3
Democratic Republic of the Congo
Equatorial Guinea 0.8 12.5 4.0
Gabon
Sao Tome and Principe 3.1 0.5
Northern Africa
Algeria 3.6 23.4 0.3
Egypt 1.9 4.3 0.4
Libya
Morocco
South Sudan
Sudan
Sudan (former)
Tunisia 5.5 17.3 1.6Western Sahara
Southern Africa
Botswana 3.0 50.9
Lesotho 2.4 13.2 0.3
Namibia 4.1 13.6
South Africa 1.2 16.5 0.3
Swaziland 4.9 31.5
Western Africa
Benin 1.4 0.4
Burkina Faso 2.5 0.2
Cape Verde 3.3 12.6 1.0
Côte d’Ivoire 0.7 1.3 0.4
Gambia
Ghana 1.5 0.5 2.9
Guinea
Guinea-BissauLiberia 2.4 0.0
Mali 2.2 0.6
Mauritania
Niger
Nigeria 0.9
Saint Helena, Ascension andTristan da Cunha
Senegal
Sierra Leone 1.1 0.6 0.1
Togo
58
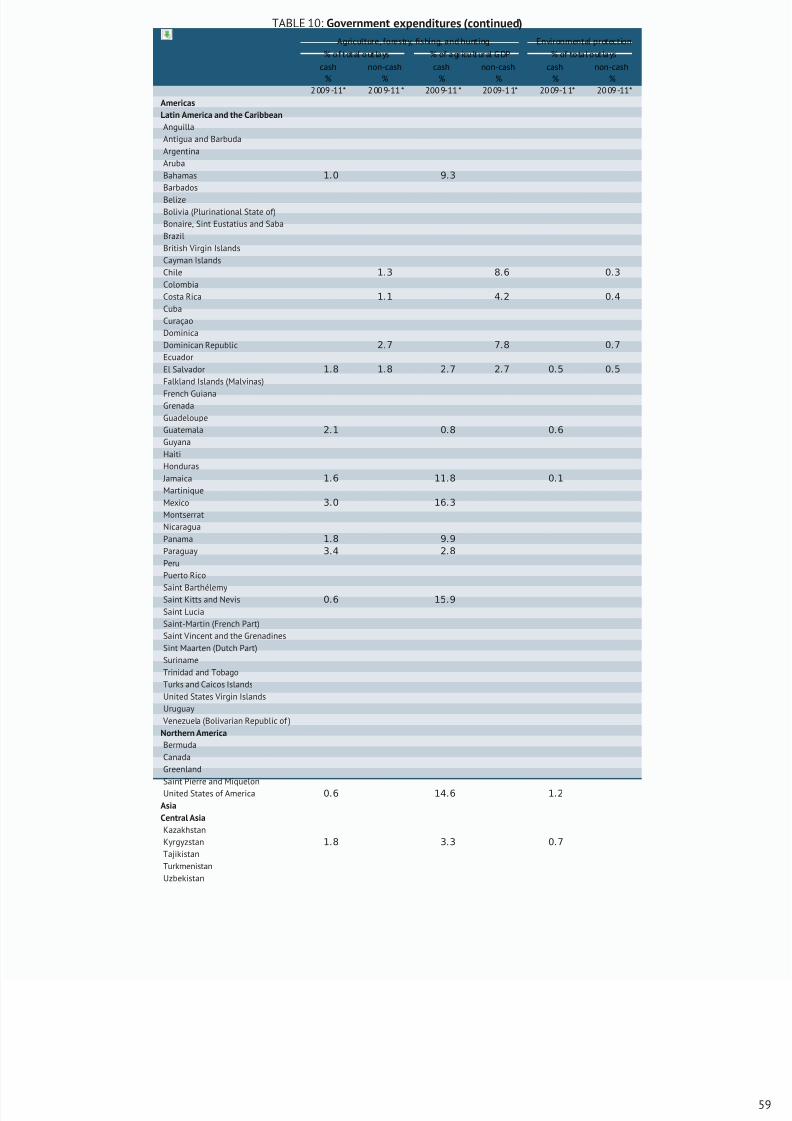
8/16/2019 Informe de la Fao 2013
http://slidepdf.com/reader/full/informe-de-la-fao-2013 77/307
TABLE 10: Government expenditures (continued)
Agriculture, forestry, fishing, and hunting Environmental protection
% of total outlays % of agricultural GDP % of total outlays
cash non-cash cash non-cash cash non-cash% % % % % %
2 009 -11* 2 00 9-11 * 200 9-11 * 20 09-1 1* 20 09-1 1* 20 09 -11*
Americas
Latin America and the Caribbean
Anguilla
Antigua and Barbuda
Argentina
Aruba
Bahamas 1.0 9.3
Barbados
BelizeBolivia (Plurinational State of)
Bonaire, Sint Eustatius and Saba
Brazil
British Virgin Islands
Cayman Islands
Chile 1.3 8.6 0.3
Colombia
Costa Rica 1.1 4.2 0.4
Cuba
Curaçao
Dominica
Dominican Republic 2.7 7.8 0.7
Ecuador
El Salvador 1.8 1.8 2.7 2.7 0.5 0.5
Falkland Islands (Malvinas)
French GuianaGrenada
Guadeloupe
Guatemala 2.1 0.8 0.6
Guyana
Haiti
Honduras
Jamaica 1.6 11.8 0.1
Martinique
Mexico 3.0 16.3
Montserrat
Nicaragua
Panama 1.8 9.9
Paraguay 3.4 2.8
Peru
Puerto Rico
Saint BarthélemySaint Kitts and Nevis 0.6 15.9
Saint Lucia
Saint-Martin (French Part)
Saint Vincent and the Grenadines
Sint Maarten (Dutch Part)
Suriname
Trinidad and Tobago
Turks and Caicos Islands
United States Virgin Islands
Uruguay
Venezuela (Bolivarian Republic of )
Northern America
Bermuda
Canada
Greenland
Saint Pierre and MiquelonUnited States of America 0.6 14.6 1.2
Asia
Central Asia
Kazakhstan
Kyrgyzstan 1.8 3.3 0.7
Tajikistan
Turkmenistan
Uzbekistan
59
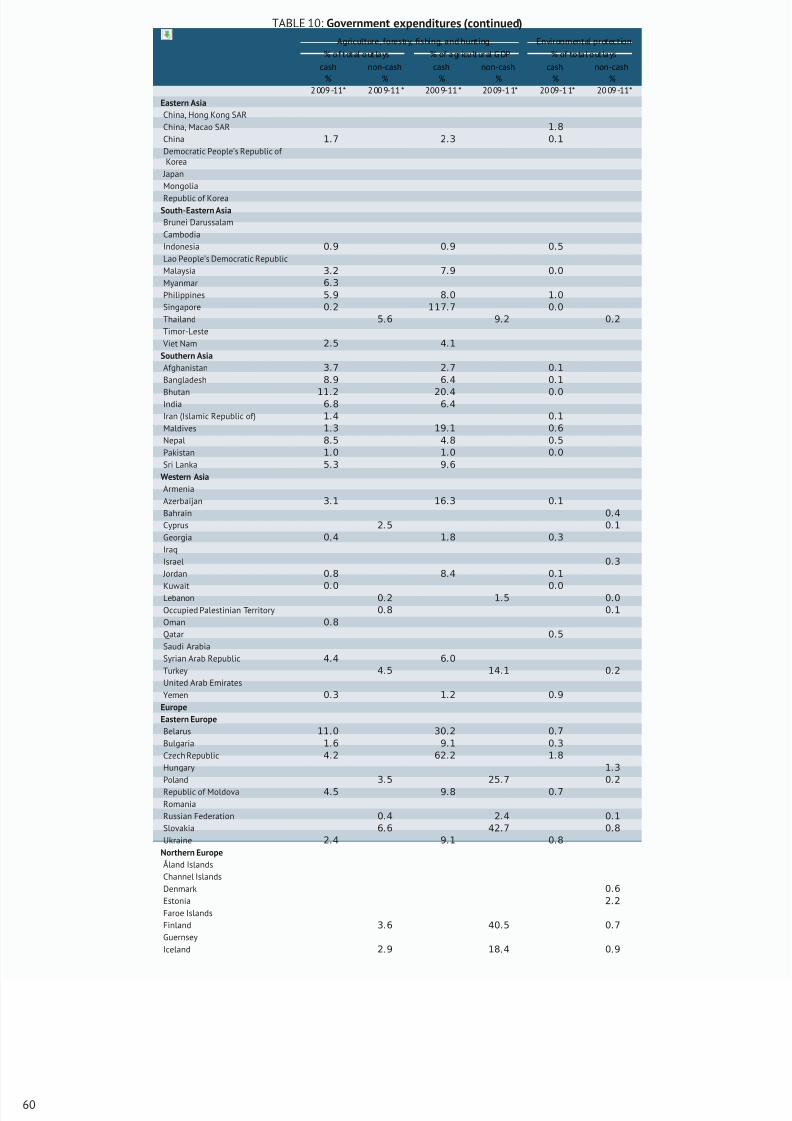
8/16/2019 Informe de la Fao 2013
http://slidepdf.com/reader/full/informe-de-la-fao-2013 78/307
TABLE 10: Government expenditures (continued)
Agriculture, forestry, fishing, and hunting Environmental protection
% of total outlays % of agricultural GDP % of total outlays
cash non-cash cash non-cash cash non-cash% % % % % %
2 009 -11* 2 00 9-11 * 200 9-11 * 20 09-1 1* 20 09-1 1* 20 09 -11*
Eastern Asia
China, Hong Kong SAR
China, Macao SAR 1.8
China 1.7 2.3 0.1
Democratic People’s Republic of Korea
Japan
Mongolia
Republic of KoreaSouth-Eastern Asia
Brunei Darussalam
Cambodia
Indonesia 0.9 0.9 0.5
Lao People’s Democratic Republic
Malaysia 3.2 7.9 0.0
Myanmar 6.3
Philippines 5.9 8.0 1.0
Singapore 0.2 117.7 0.0
Thailand 5.6 9.2 0.2
Timor-Leste
Viet Nam 2.5 4.1
Southern Asia
Afghanistan 3.7 2.7 0.1
Bangladesh 8.9 6.4 0.1
Bhutan 11.2 20.4 0.0India 6.8 6.4
Iran (Islamic Republic of) 1.4 0.1
Maldives 1.3 19.1 0.6
Nepal 8.5 4.8 0.5
Pakistan 1.0 1.0 0.0
Sri Lanka 5.3 9.6
Western Asia
Armenia
Azerbaijan 3.1 16.3 0.1
Bahrain 0.4
Cyprus 2.5 0.1
Georgia 0.4 1.8 0.3
Iraq
Israel 0.3
Jordan 0.8 8.4 0.1
Kuwait 0
.0 0
.0
Lebanon 0.2 1.5 0.0
Occupied Palestinian Territory 0.8 0.1
Oman 0.8
Qatar 0.5
Saudi Arabia
Syrian Arab Republic 4.4 6.0
Turkey 4.5 14.1 0.2
United Arab Emirates
Yemen 0.3 1.2 0.9
Europe
Eastern Europe
Belarus 11.0 30.2 0.7
Bulgaria 1.6 9.1 0.3
Czech Republic 4.2 62.2 1.8
Hungary 1.3
Poland 3.5 25.7 0.2
Republic of Moldova 4.5 9.8 0.7
Romania
Russian Federation 0.4 2.4 0.1
Slovakia 6.6 42.7 0.8
Ukraine 2.4 9.1 0.8
Northern Europe
Åland Islands
Channel Islands
Denmark 0.6
Estonia 2.2
Faroe Islands
Finland 3.6 40.5 0.7
Guernsey
Iceland 2.9 18.4 0.9
60
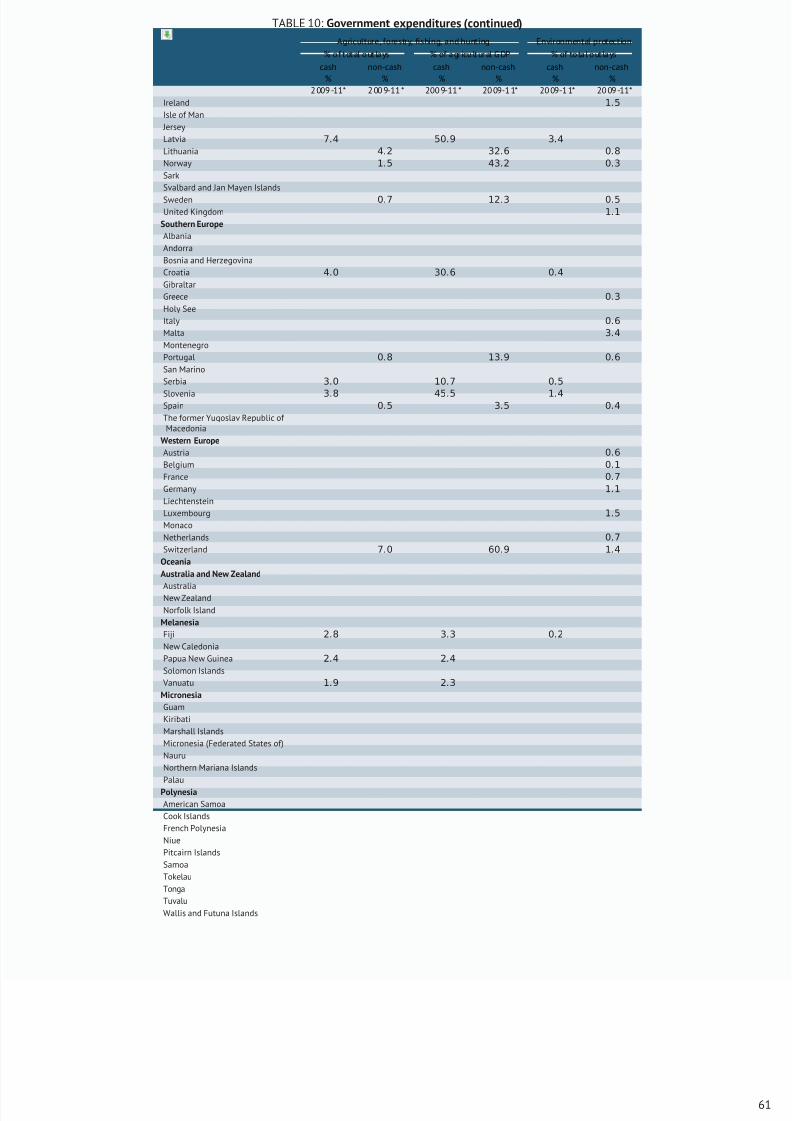
8/16/2019 Informe de la Fao 2013
http://slidepdf.com/reader/full/informe-de-la-fao-2013 79/307
TABLE 10: Government expenditures (continued)
Agriculture, forestry, fishing, and hunting Environmental protection
% of total outlays % of agricultural GDP % of total outlays
cash non-cash cash non-cash cash non-cash% % % % % %
2 009 -11* 2 00 9-11 * 200 9-11 * 20 09-1 1* 20 09-1 1* 20 09 -11*
Ireland 1.5
Isle of Man
Jersey
Latvia 7.4 50.9 3.4
Lithuania 4.2 32.6 0.8
Norway 1.5 43.2 0.3
Sark
Svalbard and Jan Mayen Islands
Sweden 0.7 12.3 0.5
United Kingdom 1.1
Southern Europe
Albania
Andorra
Bosnia and Herzegovina
Croatia 4.0 30.6 0.4
Gibraltar
Greece 0.3
Holy See
Italy 0.6
Malta 3.4
Montenegro
Portugal 0.8 13.9 0.6
San Marino
Serbia 3.0 10.7 0.5
Slovenia 3.8 45.5 1.4Spain 0.5 3.5 0.4
The former Yugoslav Republic of Macedonia
Western Europe
Austria 0.6
Belgium 0.1
France 0.7
Germany 1.1
Liechtenstein
Luxembourg 1.5
Monaco
Netherlands 0.7
Switzerland 7.0 60.9 1.4
Oceania
Australia and New Zealand
AustraliaNew Zealand
Norfolk Island
Melanesia
Fiji 2.8 3.3 0.2
New Caledonia
Papua New Guinea 2.4 2.4
Solomon Islands
Vanuatu 1.9 2.3
Micronesia
Guam
Kiribati
Marshall Islands
Micronesia (Federated States of)
Nauru
Northern Mariana Islands
Palau
Polynesia
American Samoa
Cook Islands
French Polynesia
Niue
Pitcairn Islands
Samoa
Tokelau
Tonga
Tuvalu
Wallis and Futuna Islands
61
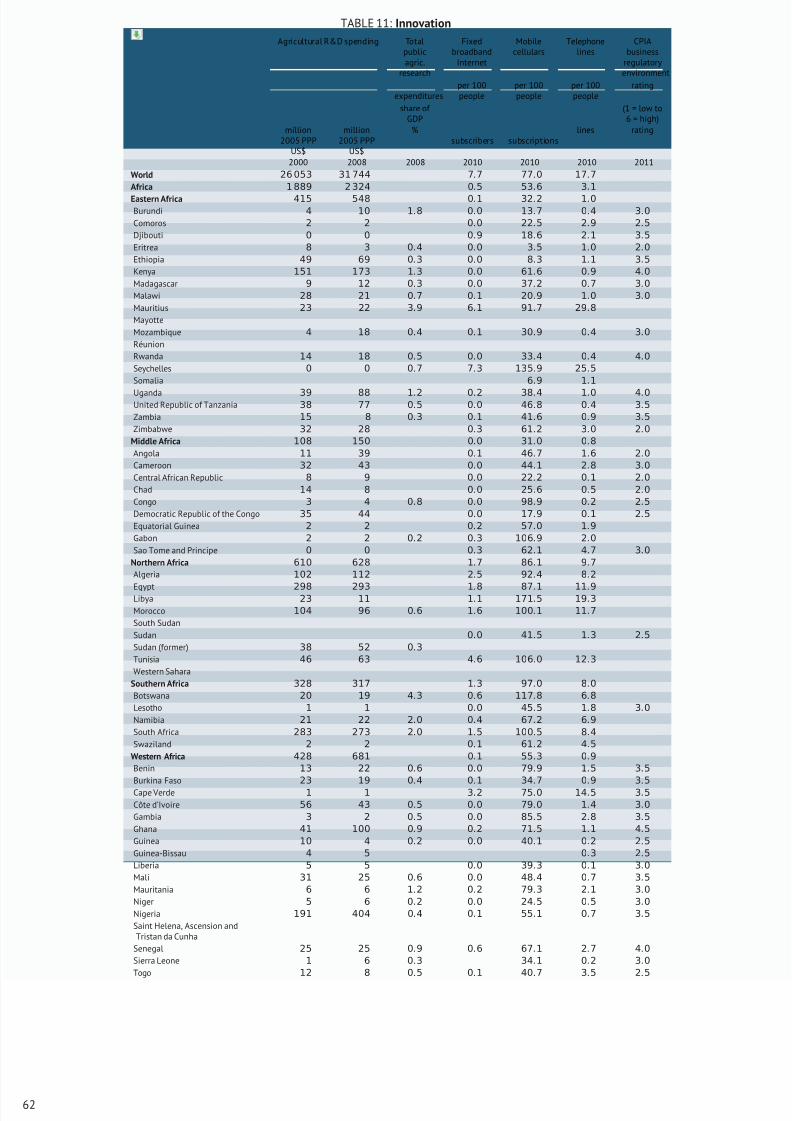
8/16/2019 Informe de la Fao 2013
http://slidepdf.com/reader/full/informe-de-la-fao-2013 80/307
TABLE 11: Innovation
Agricultural R&D spending Totalpublicagric.
research
Fixedbroadband
Internet
Mobilecellulars
Telephonelines
CPIAbusiness
regulatoryenvironment
expendituresper 100people
per 100people
per 100people
rating
share of GDP
(1 = low to6 = high)
million2005 PPP
US$
million2005 PPP
US$
%subscribers subscriptions
lines rating
2000 2008 2008 2010 2010 2010 2011
World 26 053 31 744 7.7 77.0 17.7
Africa 1 889 2 324 0.5 53.6 3.1
Eastern Africa 415 548 0.1 32.2 1.0
Burundi 4 10 1.8 0.0 13.7 0.4 3.0
Comoros 2 2 0.0 22.5 2.9 2.5
Djibouti 0 0 0.9 18.6 2.1 3.5
Eritrea 8 3 0.4 0.0 3.5 1.0 2.0
Ethiopia 49 69 0.3 0.0 8.3 1.1 3.5
Kenya 151 173 1.3 0.0 61.6 0.9 4.0
Madagascar 9 12 0.3 0.0 37.2 0.7 3.0
Malawi 28 21 0.7 0.1 20.9 1.0 3.0
Mauritius 23 22 3.9 6.1 91.7 29.8
Mayotte
Mozambique 4 18 0.4 0.1 30.9 0.4 3.0
Réunion
Rwanda 14 18 0.5 0.0 33.4 0.4 4.0
Seychelles 0 0 0.7 7.3 135.9 25.5
Somalia 6.9 1.1
Uganda 39 88 1.2 0.2 38.4 1.0 4.0United Republic of Tanzania 38 77 0.5 0.0 46.8 0.4 3.5
Zambia 15 8 0.3 0.1 41.6 0.9 3.5
Zimbabwe 32 28 0.3 61.2 3.0 2.0
Middle Africa 108 150 0.0 31.0 0.8
Angola 11 39 0.1 46.7 1.6 2.0
Cameroon 32 43 0.0 44.1 2.8 3.0
Central African Republic 8 9 0.0 22.2 0.1 2.0
Chad 14 8 0.0 25.6 0.5 2.0
Congo 3 4 0.8 0.0 98.9 0.2 2.5
Democratic Republic of the Congo 35 44 0.0 17.9 0.1 2.5
Equatorial Guinea 2 2 0.2 57.0 1.9
Gabon 2 2 0.2 0.3 106.9 2.0
Sao Tome and Principe 0 0 0.3 62.1 4.7 3.0
Northern Africa 610 628 1.7 86.1 9.7
Algeria 102 112 2.5 92.4 8.2
Egypt 298 293 1.8 87.1 11.9Libya 23 11 1.1 171.5 19.3
Morocco 104 96 0.6 1.6 100.1 11.7
South Sudan
Sudan 0.0 41.5 1.3 2.5
Sudan (former) 38 52 0.3
Tunisia 46 63 4.6 106.0 12.3
Western Sahara
Southern Africa 328 317 1.3 97.0 8.0
Botswana 20 19 4.3 0.6 117.8 6.8
Lesotho 1 1 0.0 45.5 1.8 3.0
Namibia 21 22 2.0 0.4 67.2 6.9
South Africa 283 273 2.0 1.5 100.5 8.4
Swaziland 2 2 0.1 61.2 4.5
Western Africa 428 681 0.1 55.3 0.9
Benin 13 22 0.6 0.0 79.9 1.5 3.5
Burkina Faso 23 19 0.4 0.1 34.7 0.9 3.5
Cape Verde 1 1 3.2 75.0 14.5 3.5
Côte d’Ivoire 56 43 0.5 0.0 79.0 1.4 3.0
Gambia 3 2 0.5 0.0 85.5 2.8 3.5
Ghana 41 100 0.9 0.2 71.5 1.1 4.5
Guinea 10 4 0.2 0.0 40.1 0.2 2.5
Guinea-Bissau 4 5 0.3 2.5
Liberia 5 5 0.0 39.3 0.1 3.0
Mali 31 25 0.6 0.0 48.4 0.7 3.5
Mauritania 6 6 1.2 0.2 79.3 2.1 3.0
Niger 5 6 0.2 0.0 24.5 0.5 3.0
Nigeria 191 404 0.4 0.1 55.1 0.7 3.5
Saint Helena, Ascension andTristan da Cunha
Senegal 25 25 0.9 0.6 67.1 2.7 4.0
Sierra Leone 1 6 0.3 34.1 0.2 3.0
Togo 12 8 0.5 0.1 40.7 3.5 2.5
62
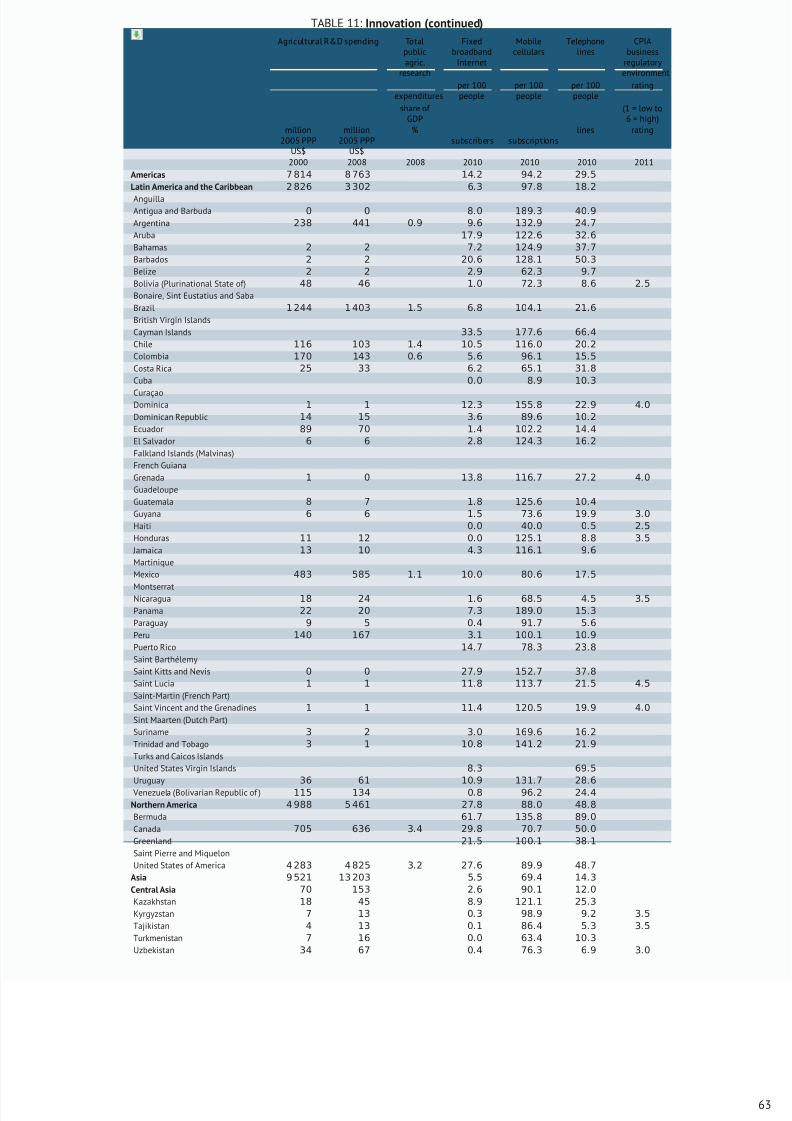
8/16/2019 Informe de la Fao 2013
http://slidepdf.com/reader/full/informe-de-la-fao-2013 81/307
TABLE 11: Innovation (continued)
Agricultural R&D spending Totalpublicagric.
research
Fixedbroadband
Internet
Mobilecellulars
Telephonelines
CPIAbusiness
regulatoryenvironment
expendituresper 100people
per 100people
per 100people
rating
share of GDP
(1 = low to6 = high)
million2005 PPP
US$
million2005 PPP
US$
%subscribers subscriptions
lines rating
2000 2008 2008 2010 2010 2010 2011
Americas 7 814 8 763 14.2 94.2 29.5
Latin America and the Caribbean 2 826 3 302 6.3 97.8 18.2
AnguillaAntigua and Barbuda 0 0 8.0 189.3 40.9
Argentina 238 441 0.9 9.6 132.9 24.7
Aruba 17.9 122.6 32.6
Bahamas 2 2 7.2 124.9 37.7
Barbados 2 2 20.6 128.1 50.3
Belize 2 2 2.9 62.3 9.7
Bolivia (Plurinational State of) 48 46 1.0 72.3 8.6 2.5
Bonaire, Sint Eustatius and Saba
Brazil 1 244 1 403 1.5 6.8 104.1 21.6
British Virgin Islands
Cayman Islands 33.5 177.6 66.4
Chile 116 103 1.4 10.5 116.0 20.2
Colombia 170 143 0.6 5.6 96.1 15.5
Costa Rica 25 33 6.2 65.1 31.8
Cuba 0.0 8.9 10.3
CuraçaoDominica 1 1 12.3 155.8 22.9 4.0
Dominican Republic 14 15 3.6 89.6 10.2
Ecuador 89 70 1.4 102.2 14.4
El Salvador 6 6 2.8 124.3 16.2
Falkland Islands (Malvinas)
French Guiana
Grenada 1 0 13.8 116.7 27.2 4.0
Guadeloupe
Guatemala 8 7 1.8 125.6 10.4
Guyana 6 6 1.5 73.6 19.9 3.0
Haiti 0.0 40.0 0.5 2.5
Honduras 11 12 0.0 125.1 8.8 3.5
Jamaica 13 10 4.3 116.1 9.6
Martinique
Mexico 483 585 1.1 10.0 80.6 17.5
MontserratNicaragua 18 24 1.6 68.5 4.5 3.5
Panama 22 20 7.3 189.0 15.3
Paraguay 9 5 0.4 91.7 5.6
Peru 140 167 3.1 100.1 10.9
Puerto Rico 14.7 78.3 23.8
Saint Barthélemy
Saint Kitts and Nevis 0 0 27.9 152.7 37.8
Saint Lucia 1 1 11.8 113.7 21.5 4.5
Saint-Martin (French Part)
Saint Vincent and the Grenadines 1 1 11.4 120.5 19.9 4.0
Sint Maarten (Dutch Part)
Suriname 3 2 3.0 169.6 16.2
Trinidad and Tobago 3 1 10.8 141.2 21.9
Turks and Caicos Islands
United States Virgin Islands 8.3 69.5
Uruguay 36 61 10.9 131.7 28.6
Venezuela (Bolivarian Republic of ) 115 134 0.8 96.2 24.4
Northern America 4 988 5 461 27.8 88.0 48.8
Bermuda 61.7 135.8 89.0
Canada 705 636 3.4 29.8 70.7 50.0
Greenland 21.5 100.1 38.1
Saint Pierre and Miquelon
United States of America 4 283 4 825 3.2 27.6 89.9 48.7
Asia 9 521 13 203 5.5 69.4 14.3
Central Asia 70 153 2.6 90.1 12.0
Kazakhstan 18 45 8.9 121.1 25.3
Kyrgyzstan 7 13 0.3 98.9 9.2 3.5
Tajikistan 4 13 0.1 86.4 5.3 3.5
Turkmenistan 7 16 0.0 63.4 10.3
Uzbekistan 34 67 0.4 76.3 6.9 3.0
63
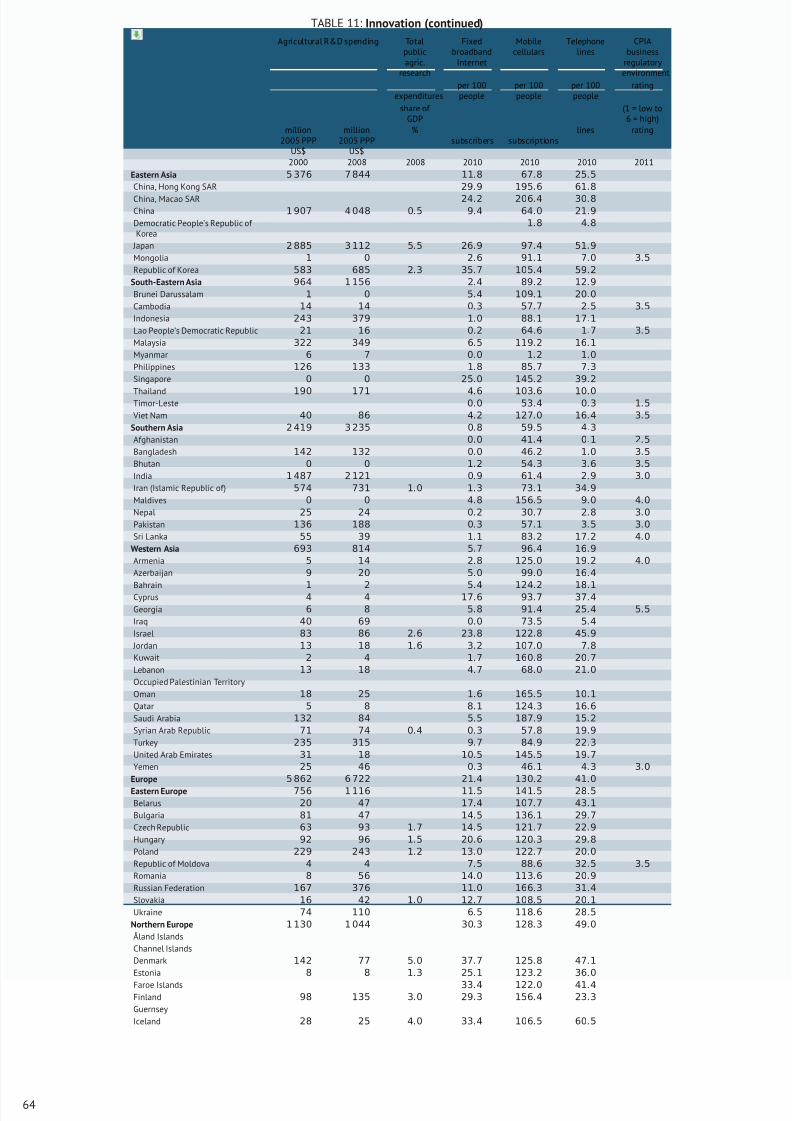
8/16/2019 Informe de la Fao 2013
http://slidepdf.com/reader/full/informe-de-la-fao-2013 82/307
TABLE 11: Innovation (continued)
Agricultural R&D spending Totalpublicagric.
research
Fixedbroadband
Internet
Mobilecellulars
Telephonelines
CPIAbusiness
regulatoryenvironment
expendituresper 100people
per 100people
per 100people
rating
share of GDP
(1 = low to6 = high)
million2005 PPP
US$
million2005 PPP
US$
%subscribers subscriptions
lines rating
2000 2008 2008 2010 2010 2010 2011
Eastern Asia 5 376 7 844 11.8 67.8 25.5
China, Hong Kong SAR 29.9 195.6 61.8
China, Macao SAR 24.2 206.4 30.8
China 1 907 4 048 0.5 9.4 64.0 21.9
Democratic People’s Republic of Korea
1.8 4.8
Japan 2 885 3 112 5.5 26.9 97.4 51.9
Mongolia 1 0 2.6 91.1 7.0 3.5
Republic of Korea 583 685 2.3 35.7 105.4 59.2
South-Eastern Asia 964 1 156 2.4 89.2 12.9
Brunei Darussalam 1 0 5.4 109.1 20.0
Cambodia 14 14 0.3 57.7 2.5 3.5
Indonesia 243 379 1.0 88.1 17.1
Lao People’s Democratic Republic 21 16 0.2 64.6 1.7 3.5
Malaysia 322 349 6.5 119.2 16.1
Myanmar 6 7 0.0 1.2 1.0
Philippines 126 133 1.8 85.7 7.3
Singapore 0 0 25.0 145.2 39.2
Thailand 190 171 4.6 103.6 10.0Timor-Leste 0.0 53.4 0.3 1.5
Viet Nam 40 86 4.2 127.0 16.4 3.5
Southern Asia 2 419 3 235 0.8 59.5 4.3
Afghanistan 0.0 41.4 0.1 2.5
Bangladesh 142 132 0.0 46.2 1.0 3.5
Bhutan 0 0 1.2 54.3 3.6 3.5
India 1 487 2 121 0.9 61.4 2.9 3.0
Iran (Islamic Republic of) 574 731 1.0 1.3 73.1 34.9
Maldives 0 0 4.8 156.5 9.0 4.0
Nepal 25 24 0.2 30.7 2.8 3.0
Pakistan 136 188 0.3 57.1 3.5 3.0
Sri Lanka 55 39 1.1 83.2 17.2 4.0
Western Asia 693 814 5.7 96.4 16.9
Armenia 5 14 2.8 125.0 19.2 4.0
Azerbaijan 9 20 5.0 99.0 16.4
Bahrain 1 2 5
.4 124
.2 18
.1
Cyprus 4 4 17.6 93.7 37.4
Georgia 6 8 5.8 91.4 25.4 5.5
Iraq 40 69 0.0 73.5 5.4
Israel 83 86 2.6 23.8 122.8 45.9
Jordan 13 18 1.6 3.2 107.0 7.8
Kuwait 2 4 1.7 160.8 20.7
Lebanon 13 18 4.7 68.0 21.0
Occupied Palestinian Territory
Oman 18 25 1.6 165.5 10.1
Qatar 5 8 8.1 124.3 16.6
Saudi Arabia 132 84 5.5 187.9 15.2
Syrian Arab Republic 71 74 0.4 0.3 57.8 19.9
Turkey 235 315 9.7 84.9 22.3
United Arab Emirates 31 18 10.5 145.5 19.7
Yemen 25 46 0.3 46.1 4.3 3.0
Europe 5 862 6 722 21.4 130.2 41.0
Eastern Europe 756 1 116 11.5 141.5 28.5
Belarus 20 47 17.4 107.7 43.1
Bulgaria 81 47 14.5 136.1 29.7
Czech Republic 63 93 1.7 14.5 121.7 22.9
Hungary 92 96 1.5 20.6 120.3 29.8
Poland 229 243 1.2 13.0 122.7 20.0
Republic of Moldova 4 4 7.5 88.6 32.5 3.5
Romania 8 56 14.0 113.6 20.9
Russian Federation 167 376 11.0 166.3 31.4
Slovakia 16 42 1.0 12.7 108.5 20.1
Ukraine 74 110 6.5 118.6 28.5
Northern Europe 1 130 1 044 30.3 128.3 49.0
Åland Islands
Channel Islands
Denmark 142 77 5.0 37.7 125.8 47.1
Estonia 8 8 1.3 25.1 123.2 36.0
Faroe Islands 33.4 122.0 41.4
Finland 98 135 3.0 29.3 156.4 23.3
Guernsey
Iceland 28 25 4.0 33.4 106.5 60.5
64
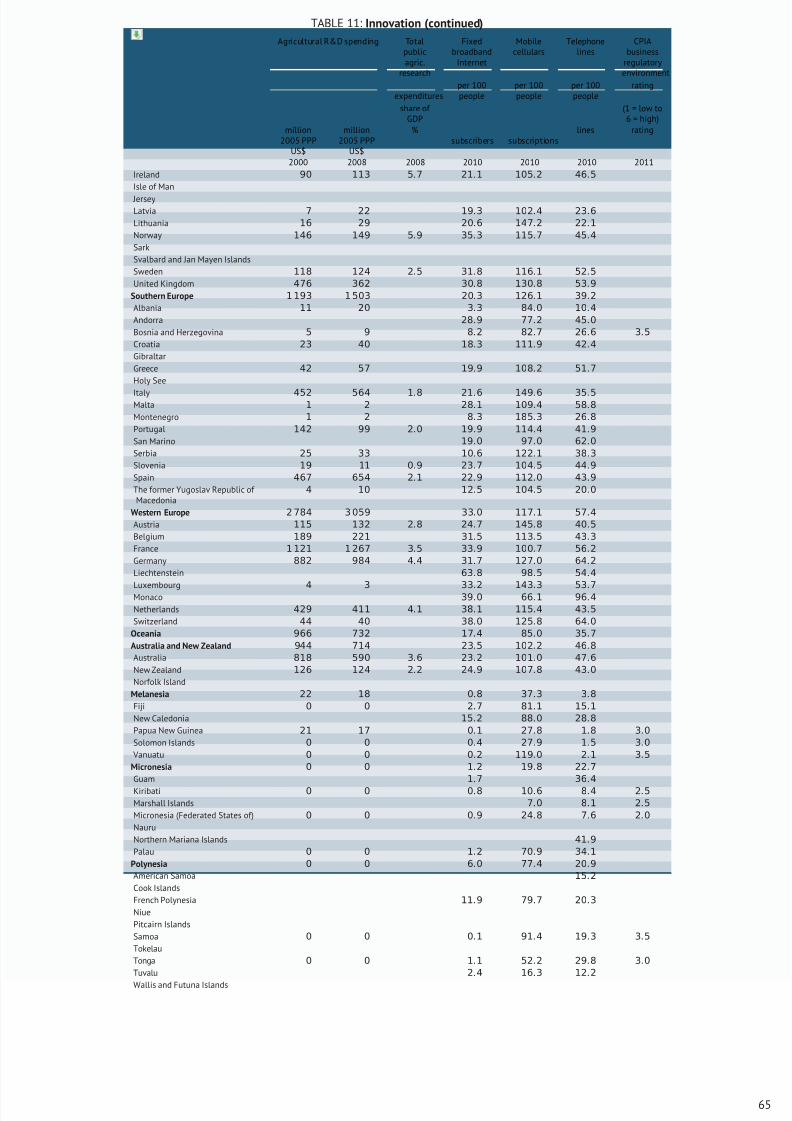
8/16/2019 Informe de la Fao 2013
http://slidepdf.com/reader/full/informe-de-la-fao-2013 83/307
TABLE 11: Innovation (continued)
Agricultural R&D spending Totalpublicagric.
research
Fixedbroadband
Internet
Mobilecellulars
Telephonelines
CPIAbusiness
regulatoryenvironment
expendituresper 100people
per 100people
per 100people
rating
share of GDP
(1 = low to6 = high)
million2005 PPP
US$
million2005 PPP
US$
%subscribers subscriptions
lines rating
2000 2008 2008 2010 2010 2010 2011
Ireland 90 113 5.7 21.1 105.2 46.5
Isle of Man
JerseyLatvia 7 22 19.3 102.4 23.6
Lithuania 16 29 20.6 147.2 22.1
Norway 146 149 5.9 35.3 115.7 45.4
Sark
Svalbard and Jan Mayen Islands
Sweden 118 124 2.5 31.8 116.1 52.5
United Kingdom 476 362 30.8 130.8 53.9
Southern Europe 1 193 1 503 20.3 126.1 39.2
Albania 11 20 3.3 84.0 10.4
Andorra 28.9 77.2 45.0
Bosnia and Herzegovina 5 9 8.2 82.7 26.6 3.5
Croatia 23 40 18.3 111.9 42.4
Gibraltar
Greece 42 57 19.9 108.2 51.7
Holy See
Italy 452 564 1.8 21.6 149.6 35.5Malta 1 2 28.1 109.4 58.8
Montenegro 1 2 8.3 185.3 26.8
Portugal 142 99 2.0 19.9 114.4 41.9
San Marino 19.0 97.0 62.0
Serbia 25 33 10.6 122.1 38.3
Slovenia 19 11 0.9 23.7 104.5 44.9
Spain 467 654 2.1 22.9 112.0 43.9
The former Yugoslav Republic of Macedonia
4 10 12.5 104.5 20.0
Western Europe 2 784 3 059 33.0 117.1 57.4
Austria 115 132 2.8 24.7 145.8 40.5
Belgium 189 221 31.5 113.5 43.3
France 1 121 1 267 3.5 33.9 100.7 56.2
Germany 882 984 4.4 31.7 127.0 64.2
Liechtenstein 63.8 98.5 54.4
Luxembourg 4 3 33
.2 143
.3 53
.7
Monaco 39.0 66.1 96.4
Netherlands 429 411 4.1 38.1 115.4 43.5
Switzerland 44 40 38.0 125.8 64.0
Oceania 966 732 17.4 85.0 35.7
Australia and New Zealand 944 714 23.5 102.2 46.8
Australia 818 590 3.6 23.2 101.0 47.6
New Zealand 126 124 2.2 24.9 107.8 43.0
Norfolk Island
Melanesia 22 18 0.8 37.3 3.8
Fiji 0 0 2.7 81.1 15.1
New Caledonia 15.2 88.0 28.8
Papua New Guinea 21 17 0.1 27.8 1.8 3.0
Solomon Islands 0 0 0.4 27.9 1.5 3.0
Vanuatu 0 0 0.2 119.0 2.1 3.5
Micronesia 0 0 1.2 19.8 22.7
Guam 1.7 36.4
Kiribati 0 0 0.8 10.6 8.4 2.5
Marshall Islands 7.0 8.1 2.5
Micronesia (Federated States of) 0 0 0.9 24.8 7.6 2.0
Nauru
Northern Mariana Islands 41.9
Palau 0 0 1.2 70.9 34.1
Polynesia 0 0 6.0 77.4 20.9
American Samoa 15.2
Cook Islands
French Polynesia 11.9 79.7 20.3
Niue
Pitcairn Islands
Samoa 0 0 0.1 91.4 19.3 3.5
Tokelau
Tonga 0 0 1.1 52.2 29.8 3.0
Tuvalu 2.4 16.3 12.2
Wallis and Futuna Islands
65

8/16/2019 Informe de la Fao 2013
http://slidepdf.com/reader/full/informe-de-la-fao-2013 84/307
8/16/2019 Informe de la Fao 2013
http://slidepdf.com/reader/full/informe-de-la-fao-2013 85/307
PART
Hunger dimensions
In 2010–2012, about 870 million people – or one in eight of thepeople in the world – did not consume enough food to cover theirminimum dietary energy requirements. Of these people, 852 mil-lion were in developing countries, making up 14.9 percent of the to-tal population of these countries. While undernourishment remainsstubbornly high in absolute terms, the prevalence of undernourish-ment has fallen by 36 percent against the 1990–1992 benchmark setby the Millennium Development Goals (MDGs). If current trends con-tinue, developing countries as a group could be close to achievingthe goal of halving the percentage of people suffering from chronic
hunger by 2015.
Although the prevalence of undernourishment offers a first idea of the extent and distribution of hunger in the world, food security istoo complex an issue for all of its dimensions to be caught in a singleindicator. To understand the complexity of the problem and identifymeasures for addressing it, its dimensions and manifestations, theunderlying factors have to be assessed and measured.
8/16/2019 Informe de la Fao 2013
http://slidepdf.com/reader/full/informe-de-la-fao-2013 86/307
Food insecurity arises in different contexts for different reasons. Itcan be driven by insufficient availability of or insufficient access tofood. While it is often portrayed as an access problem, its relation-
ship with poverty is not always straightforward. Its intensity usuallyvaries with social and economic conditions, especially income levelsand food prices, but it is also affected – often to a large extent – bypolitical instability and the presence of natural hazards. An inade-quate diet may also result from a lack of vitamins or micronutrientsor an imbalance in the availability of macronutrients. Food insecuritycan even arise when a sufficient and balanced diet is available, butfood safety and hygiene or access to health care are lacking. Whateverthe causes of food insecurity, it usually takes a huge toll on labourproductivity, and thus perpetuates a vicious circle where food inse-curity causes low labour productivity, low incomes and thus furtherfood insecurity. This is the “hunger trap”.
To capture the multifaceted character of food insecurity and facili-tate its analysis, FAO has recently compiled a suite of indicators thatsupplements measurements of the number and prevalence of under-nourishment. However, the indicators selected are not always idealfor describing food insecurity in all its facets. Indicator selection isalso conditioned by the availability of reliable data and the possibil-ity of establishing meaningful comparisons across regions and timeperiods.
Some indicators look at food insecurity as an outcome: this is thecase of the number of undernourished people, the prevalence of un-dernourishment in the population, the extent of nutrition gaps, andanthropometric evidence. Other indicators focus on the conditionsthat generate food insecurity, such as poverty; food availability, ac-cess, affordability and utilization; and vulnerability and instability.
This chapter presents the main food security indicators computed byFAO, starting from outcomes and moving on to consider the condi-tions that characterize and can generate food insecurity.
The presence of several indicators for one phenomenon poses signif-
icant measurement challenges. One challenge is consistently sum-marizing the information conveyed by multiple indicators; another isunderstanding and tracing how the various indicators relate to eachother. The following sections outline some of the associations andregularities that emerge among different indicators. These are meantto signal areas for further investigation, and do not necessarily implyformal or causal relationships.
8/16/2019 Informe de la Fao 2013
http://slidepdf.com/reader/full/informe-de-la-fao-2013 87/307
Key ResourcesThe State of Food Insecurity in the World (SOFI)
The State of Food Insecurity in the World raises
awareness about global hunger issues, discussesunderlying causes of hunger and malnutrition andmonitors progress towards hunger reduction tar-gets established at the 1996 World Food Summitand the MillenniumSummit. The publicationis tar-geted at a wide audience, including policy-makers,international organizations, academic institutionsand the general public with a general interest inlinkages between food security, and human andeconomic development.
2012: Economic growth is necessary but not suffi-cient to accelerate reduction of hunger and malnu-trition
2011: How does international pricevolatility affectdomestic economies and food security?
2010:
Addressing
food
insecurity
in
protracted
crises
Publication cycle: Annual
Webpage: www.fao.org/publications/sofi/en/
Safeguarding Food Security in Volatile Global Markets
Safeguarding Food Security in Volatile Global Mar-kets is a four-part volume that gathers togetherthe latest thinking on the issues and controver-sies surrounding price volatilityin global food mar-kets. Drawing from theory, empiricism and heuris-tic evidence, the book contributes to the debate onthe causes, consequences, and challenges of foodprice volatility. Food security and vulnerability areplaced at centre stage, especially in their demandson shaping innovative policy design.
Webpage: www.fao.org/economic/est/issues/ volatility/vgm/en/
SAFEGUARDING FOOD SECURITY IN VOLATILE GLOBAL MARKETS
EDITED BY
ADAM PRAKASH
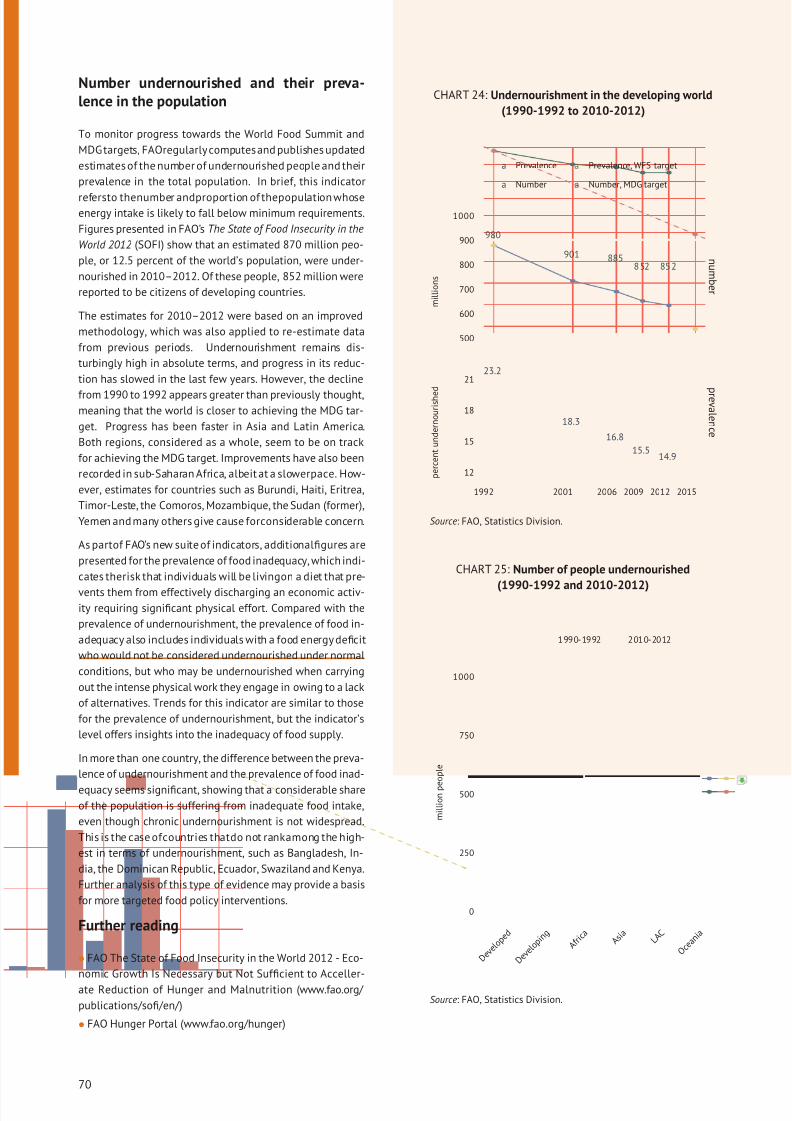
8/16/2019 Informe de la Fao 2013
http://slidepdf.com/reader/full/informe-de-la-fao-2013 88/307
Number undernourished and their preva-lence in the population
To monitor progress towards the World Food Summit and
MDG targets, FAOregularlycomputesand publishes updated
estimates of the number of undernourished people and their
prevalence in the total population. In brief, this indicator
refersto thenumber andproportion of thepopulation whoseenergy intake is likely to fall below minimum requirements.
Figures presented in FAO’s The State of Food Insecurity in the
World 2012 (SOFI) show that an estimated 870 million peo-
ple, or 12.5 percent of the world’s population, were under-
nourished in 2010–2012. Of these people, 852 million were
reported to be citizens of developing countries.
The estimates for 2010–2012 were based on an improved
methodology, which was also applied to re-estimate data
from previous periods. Undernourishment remains dis-
turbingly high in absolute terms, and progress in its reduc-
tion has slowed in the last few years. However, the decline
from 1990 to 1992 appears greater than previously thought,meaning that the world is closer to achieving the MDG tar-
get. Progress has been faster in Asia and Latin America.
Both regions, considered as a whole, seem to be on track
for achieving the MDG target. Improvements have also been
recorded in sub-Saharan Africa, albeit at a slowerpace. How-
ever, estimates for countries such as Burundi, Haiti, Eritrea,
Timor-Leste, the Comoros, Mozambique, the Sudan (former),
Yemen and many others give cause forconsiderable concern.
As partof FAO’s new suite of indicators, additionalfigures are
presented for the prevalence of food inadequacy, which indi-
cates therisk that individuals will be livingon a diet that pre-
vents them from effectively discharging an economic activ-ity requiring significant physical effort. Compared with the
prevalence of undernourishment, the prevalence of food in-
adequacy also includes individuals with a food energy deficit
who would not be considered undernourished under normal
conditions, but who may be undernourished when carrying
out the intense physical work they engage in owing to a lack
of alternatives. Trends for this indicator are similar to those
for the prevalence of undernourishment, but the indicator’s
level offers insights into the inadequacy of food supply.
In more than one country, the difference between the preva-
lence of undernourishment and the prevalence of food inad-
equacy seems significant, showing that a considerable shareof the population is suffering from inadequate food intake,
even though chronic undernourishment is not widespread.
This is the case ofcountries thatdo not rankamong the high-
est in terms of undernourishment, such as Bangladesh, In-
dia, the Dominican Republic, Ecuador, Swaziland and Kenya.
Further analysis of this type of evidence may provide a basis
for more targeted food policy interventions.
Further reading
• FAO The State of Food Insecurity in the World 2012 - Eco-
nomic Growth Is Necessary but Not Sufficient to Acceller-
ate Reduction of Hunger and Malnutrition (www.fao.org/
publications/sofi/en/ )
• FAO Hunger Portal (www.fao.org/hunger)
CHART 24: Undernourishment in the developing world
(1990-1992 to 2010-2012)
980
901 885852 852
23.2
18.3
16.8
15.514.9
500
600
700
800
900
1000
12
15
18
21
n um b e r
pr e v a l e n c e
1992 2001 2006 2009 2012 2015
p e r c e n t u n d e r n o u r i s h e d
m i l l i o n s
a
a
a
a
Prevalence
Number
Prevalence, WFS target
Number, MDG target
Source: FAO, Statistics Division.
CHART 25: Number of people undernourished
(1990-1992 and 2010-2012)
0
250
500
750
1000
D e v e l o p
e d
D e v e l o p i n g
A f r i c a
A s i a
L A C
O c e a n i a
m i l l i o n p e
o p l e
1990-1992 2010-2012
Source: FAO, Statistics Division.
70
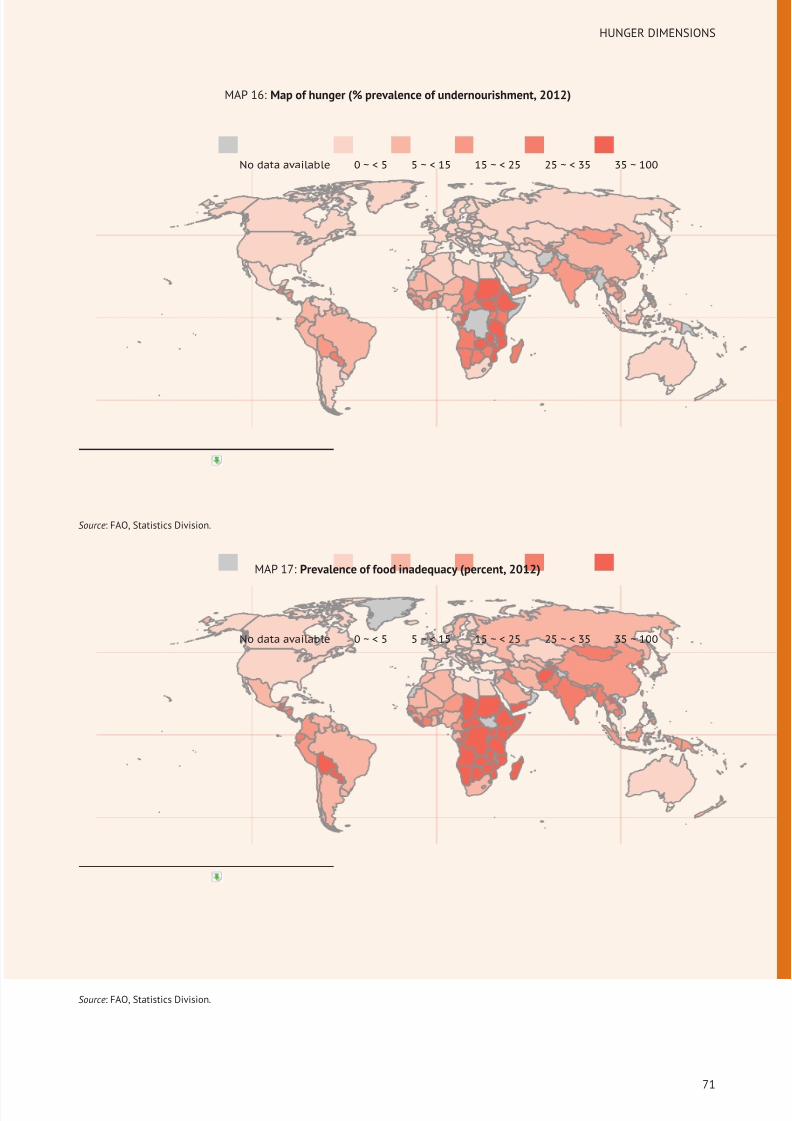
8/16/2019 Informe de la Fao 2013
http://slidepdf.com/reader/full/informe-de-la-fao-2013 89/307
HUNGER DIMENSIONS
MAP 16: Map of hunger (% prevalence of undernourishment, 2012)
No data available 0 ~ < 5 5 ~ < 15 15 ~ < 25 25 ~ < 35 35 ~ 100
Source: FAO, Statistics Division.
MAP 17: Prevalence of food inadequacy (percent, 2012)
No data available 0 ~ < 5 5 ~ < 15 15 ~ < 25 25 ~ < 35 35 ~ 100
Source: FAO, Statistics Division.
71
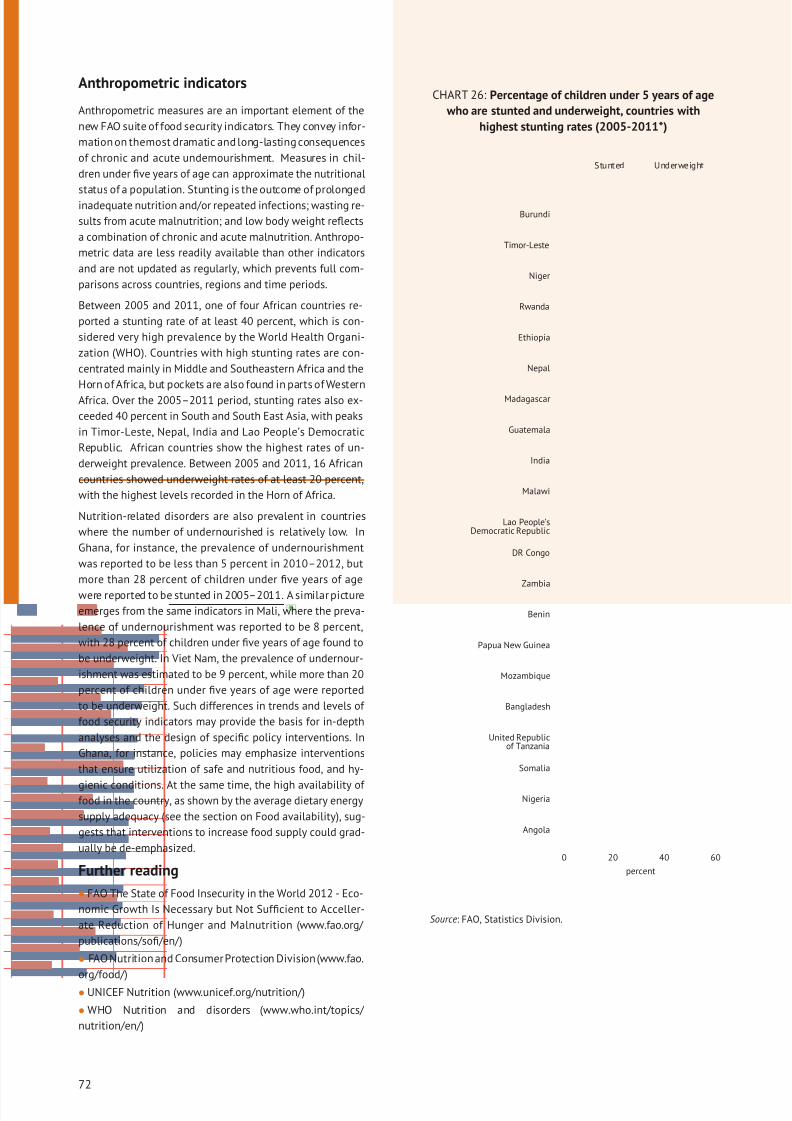
8/16/2019 Informe de la Fao 2013
http://slidepdf.com/reader/full/informe-de-la-fao-2013 90/307
Anthropometric indicators
Anthropometric measures are an important element of the
new FAO suite of food security indicators. They convey infor-
mation on themost dramatic and long-lasting consequences
of chronic and acute undernourishment. Measures in chil-
dren under five years of age can approximate the nutritional
status of a population. Stunting is the outcome of prolonged
inadequate nutrition and/or repeated infections; wasting re-
sults from acute malnutrition; and low body weight reflects
a combination of chronic and acute malnutrition. Anthropo-
metric data are less readily available than other indicators
and are not updated as regularly, which prevents full com-
parisons across countries, regions and time periods.
Between 2005 and 2011, one of four African countries re-
ported a stunting rate of at least 40 percent, which is con-
sidered very high prevalence by the World Health Organi-
zation (WHO). Countries with high stunting rates are con-
centrated mainly in Middle and Southeastern Africa and the
Horn of Africa, but pockets are also found in parts of Western
Africa. Over the 2005–2011 period, stunting rates also ex-
ceeded 40 percent in South and South East Asia, with peaks
in Timor-Leste, Nepal, India and Lao People’s Democratic
Republic. African countries show the highest rates of un-
derweight prevalence. Between 2005 and 2011, 16 African
countries showed underweight rates of at least 20 percent,
with the highest levels recorded in the Horn of Africa.
Nutrition-related disorders are also prevalent in countries
where the number of undernourished is relatively low. In
Ghana, for instance, the prevalence of undernourishment
was reported to be less than 5 percent in 2010–2012, but
more than 28 percent of children under five years of age
were reported to be stunted in 2005–2011. A similar picture
emerges from the same indicators in Mali, where the preva-
lence of undernourishment was reported to be 8 percent,
with 28 percent of children under five years of age found to
be underweight. In Viet Nam, the prevalence of undernour-
ishment was estimated to be 9 percent, while more than 20
percent of children under five years of age were reported
to be underweight. Such differences in trends and levels of
food security indicators may provide the basis for in-depth
analyses and the design of specific policy interventions. In
Ghana, for instance, policies may emphasize interventions
that ensure utilization of safe and nutritious food, and hy-
gienic conditions. At the same time, the high availability of food in the country, as shown by the average dietary energy
supply adequacy (see the section on Food availability), sug-
gests that interventions to increase food supply could grad-
ually be de-emphasized.
Further reading
• FAO The State of Food Insecurity in the World 2012 - Eco-
nomic Growth Is Necessary but Not Sufficient to Acceller-
ate Reduction of Hunger and Malnutrition (www.fao.org/
publications/sofi/en/ )
• FAO Nutrition and ConsumerProtection Division (www.fao.
org/food/)
• UNICEF Nutrition (www.unicef.org/nutrition/)
• WHO Nutrition and disorders (www.who.int/topics/
nutrition/en/)
CHART 26: Percentage of children under 5 years of age
who are stunted and underweight, countries with
highest stunting rates (2005-2011*)
Angola
Nigeria
Somalia
United Republicof Tanzania
Bangladesh
Mozambique
Papua New Guinea
Benin
Zambia
DR Congo
Lao People’sDemocratic Republic
Malawi
India
Guatemala
Madagascar
Nepal
Ethiopia
Rwanda
Niger
Timor-Leste
Burundi
0 20 40 60
percent
Stunted Underweight
Source: FAO, Statistics Division.
72
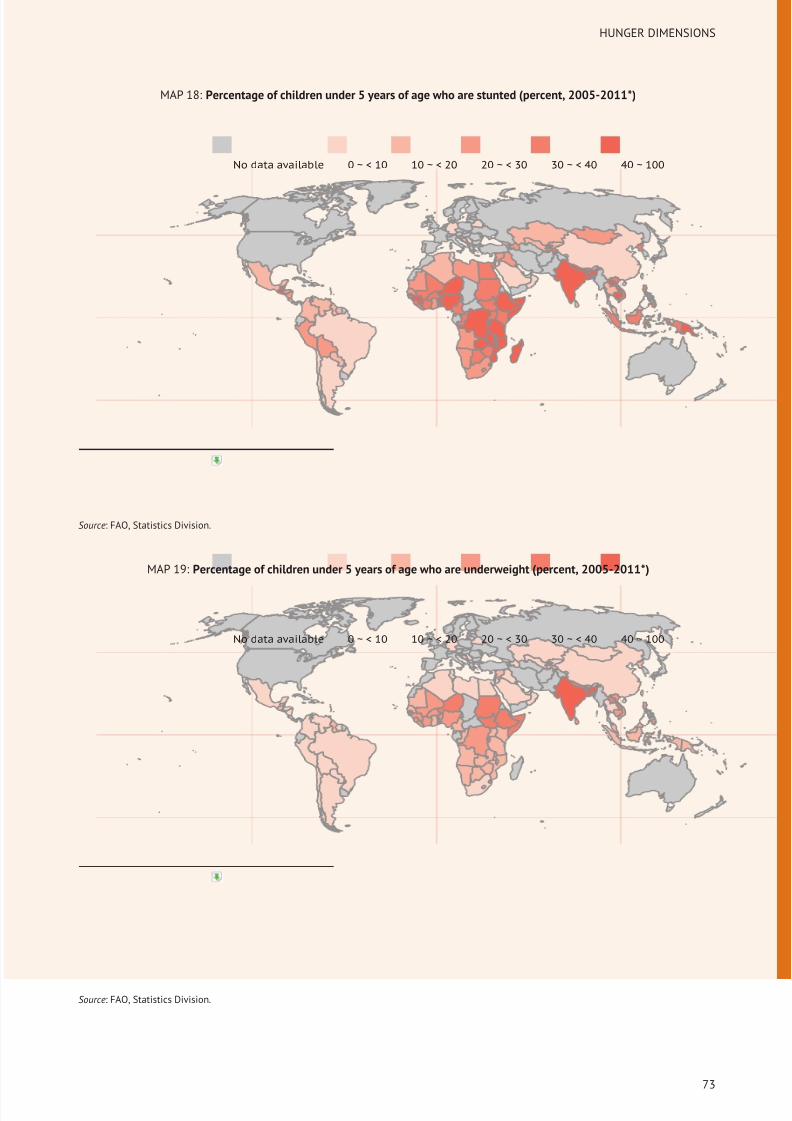
8/16/2019 Informe de la Fao 2013
http://slidepdf.com/reader/full/informe-de-la-fao-2013 91/307
HUNGER DIMENSIONS
MAP 18: Percentage of children under 5 years of age who are stunted (percent, 2005-2011*)
No data available 0 ~ < 10 10 ~ < 20 20 ~ < 30 30 ~ < 40 40 ~ 100
Source: FAO, Statistics Division.
MAP 19: Percentage of children under 5 years of age who are underweight (percent, 2005-2011*)
No data available 0 ~ < 10 10 ~ < 20 20 ~ < 30 30 ~ < 40 40 ~ 100
Source: FAO, Statistics Division.
73
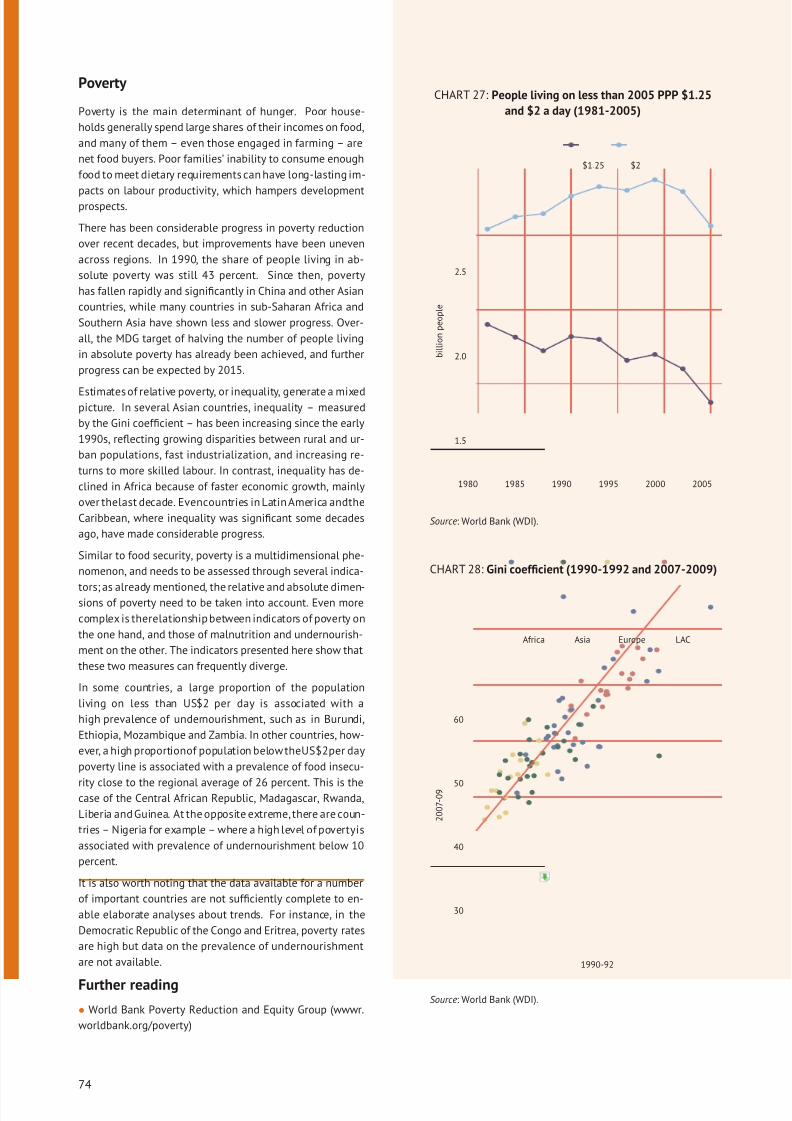
8/16/2019 Informe de la Fao 2013
http://slidepdf.com/reader/full/informe-de-la-fao-2013 92/307
Poverty
Poverty is the main determinant of hunger. Poor house-
holds generally spend large shares of their incomes on food,
and many of them – even those engaged in farming – are
net food buyers. Poor families’ inability to consume enough
food to meet dietary requirements can have long-lasting im-
pacts on labour productivity, which hampers developmentprospects.
There has been considerable progress in poverty reduction
over recent decades, but improvements have been uneven
across regions. In 1990, the share of people living in ab-
solute poverty was still 43 percent. Since then, poverty
has fallen rapidly and significantly in China and other Asian
countries, while many countries in sub-Saharan Africa and
Southern Asia have shown less and slower progress. Over-
all, the MDG target of halving the number of people living
in absolute poverty has already been achieved, and further
progress can be expected by 2015.
Estimates of relative poverty, or inequality, generate a mixedpicture. In several Asian countries, inequality – measured
by the Gini coefficient – has been increasing since the early
1990s, reflecting growing disparities between rural and ur-
ban populations, fast industrialization, and increasing re-
turns to more skilled labour. In contrast, inequality has de-
clined in Africa because of faster economic growth, mainly
over thelast decade. Evencountries in Latin America andthe
Caribbean, where inequality was significant some decades
ago, have made considerable progress.
Similar to food security, poverty is a multidimensional phe-
nomenon, and needs to be assessed through several indica-
tors; as already mentioned, the relative and absolute dimen-sions of poverty need to be taken into account. Even more
complex is therelationship between indicators of poverty on
the one hand, and those of malnutrition and undernourish-
ment on the other. The indicators presented here show that
these two measures can frequently diverge.
In some countries, a large proportion of the population
living on less than US$2 per day is associated with a
high prevalence of undernourishment, such as in Burundi,
Ethiopia, Mozambique and Zambia. In other countries, how-
ever, a high proportionof population below theUS$2per day
poverty line is associated with a prevalence of food insecu-
rity close to the regional average of 26 percent. This is thecase of the Central African Republic, Madagascar, Rwanda,
Liberia and Guinea. At the opposite extreme, there are coun-
tries – Nigeria for example – where a high level of povertyis
associated with prevalence of undernourishment below 10
percent.
It is also worth noting that the data available for a number
of important countries are not sufficiently complete to en-
able elaborate analyses about trends. For instance, in the
Democratic Republic of the Congo and Eritrea, poverty rates
are high but data on the prevalence of undernourishment
are not available.
Further reading
• World Bank Poverty Reduction and Equity Group (wwwr.
worldbank.org/poverty)
CHART 27: People living on less than 2005 PPP $1.25
and $2 a day (1981-2005)
1.5
2.0
2.5
1980 1985 1990 1995 2000 2005
b i l l i o n p e o p l e
$1.25 $2
Source: World Bank (WDI).
CHART 28: Gini coefficient (1990-1992 and 2007-2009)
30
40
50
60
1990-92
2 0 0 7 - 0 9
Africa Asia Europe LAC
Source: World Bank (WDI).
74
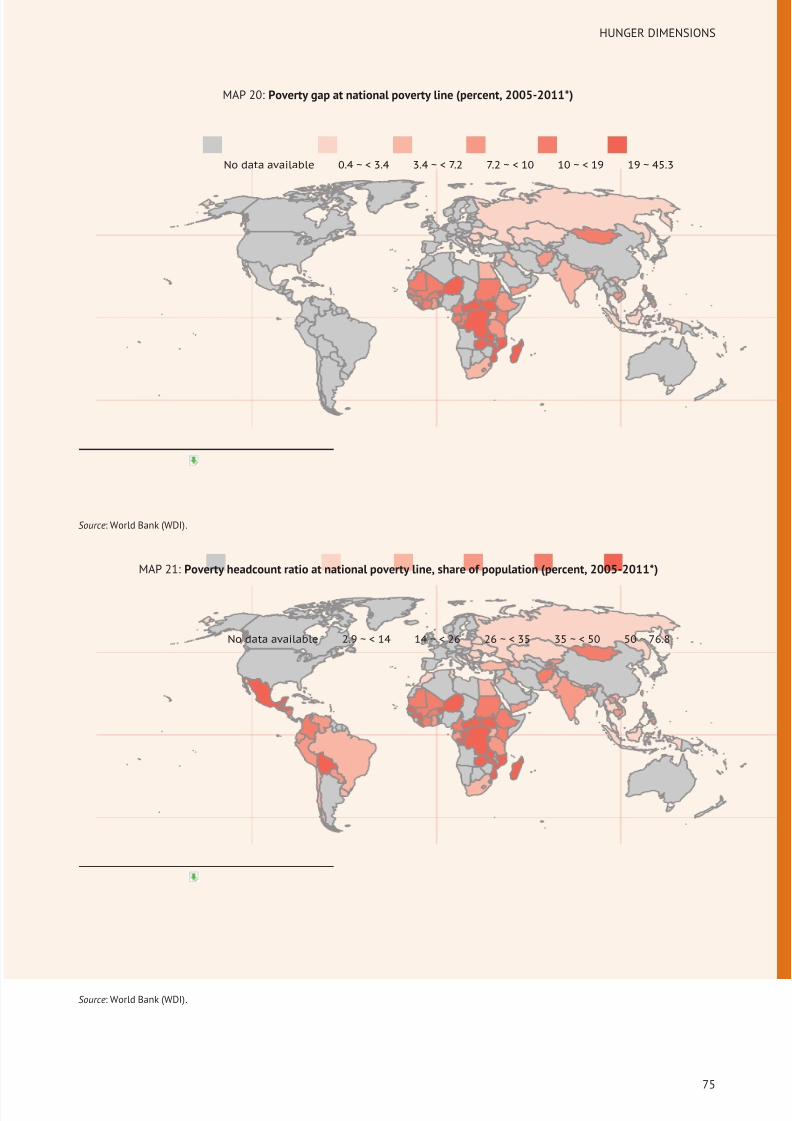
8/16/2019 Informe de la Fao 2013
http://slidepdf.com/reader/full/informe-de-la-fao-2013 93/307
HUNGER DIMENSIONS
MAP 20: Poverty gap at national poverty line (percent, 2005-2011*)
No data available 0.4 ~ < 3.4 3.4 ~ < 7.2 7.2 ~ < 10 10 ~ < 19 19 ~ 45.3
Source: World Bank (WDI).
MAP 21: Poverty headcount ratio at national poverty line, share of population (percent, 2005-2011*)
No data available 2.9 ~ < 14 14 ~ < 26 26 ~ < 35 35 ~ < 50 50 ~ 76.8
Source: World Bank (WDI).
75
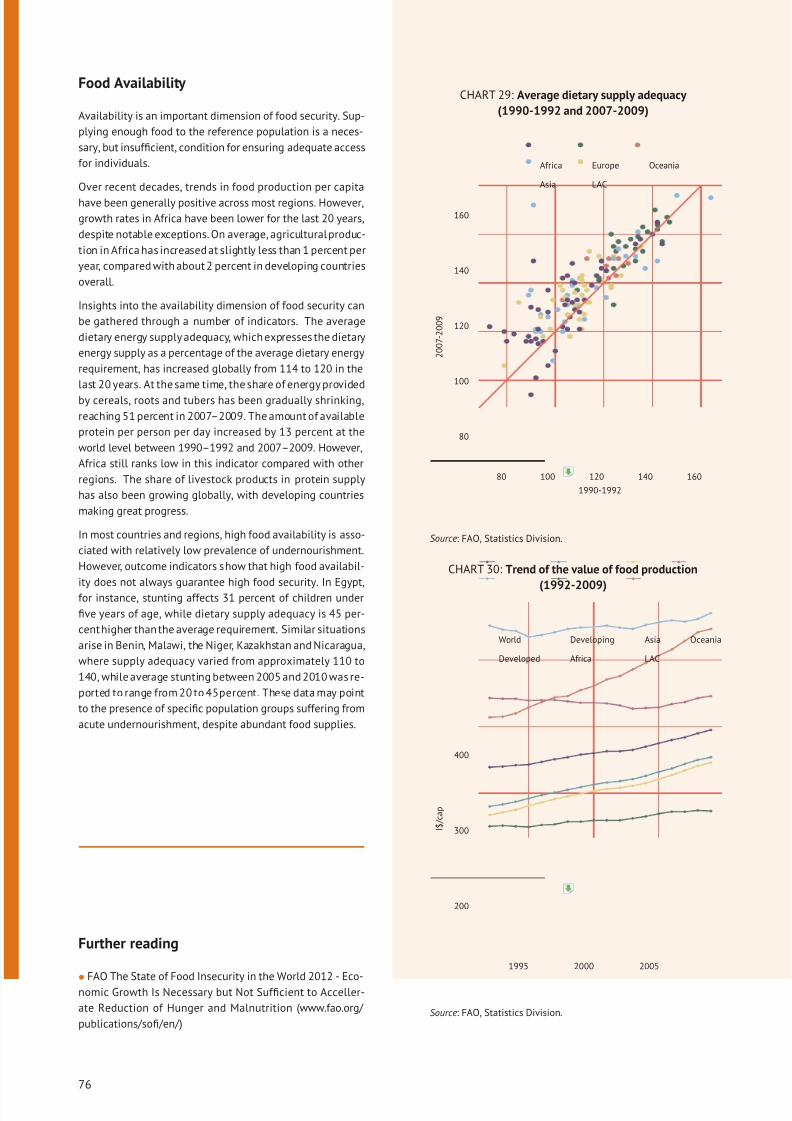
8/16/2019 Informe de la Fao 2013
http://slidepdf.com/reader/full/informe-de-la-fao-2013 94/307
Food Availability
Availability is an important dimension of food security. Sup-
plying enough food to the reference population is a neces-
sary, but insufficient, condition for ensuring adequate access
for individuals.
Over recent decades, trends in food production per capita
have been generally positive across most regions. However,
growth rates in Africa have been lower for the last 20 years,
despite notable exceptions. On average, agricultural produc-
tion in Africa has increased at slightly less than 1 percent per
year, compared with about 2 percent in developing countries
overall.
Insights into the availability dimension of food security can
be gathered through a number of indicators. The average
dietary energy supply adequacy, which expresses the dietary
energy supply as a percentage of the average dietary energy
requirement, has increased globally from 114 to 120 in the
last 20 years. At the same time, the share of energy provided
by cereals, roots and tubers has been gradually shrinking,
reaching 51 percent in 2007–2009. The amount of available
protein per person per day increased by 13 percent at the
world level between 1990–1992 and 2007–2009. However,
Africa still ranks low in this indicator compared with other
regions. The share of livestock products in protein supply
has also been growing globally, with developing countries
making great progress.
In most countries and regions, high food availability is asso-
ciated with relatively low prevalence of undernourishment.
However, outcome indicators show that high food availabil-
ity does not always guarantee high food security. In Egypt,
for instance, stunting affects 31 percent of children under
five years of age, while dietary supply adequacy is 45 per-
centhigher than the average requirement. Similar situations
arise in Benin, Malawi, the Niger, Kazakhstan and Nicaragua,
where supply adequacy varied from approximately 110 to
140, while average stunting between 2005 and 2010 was re-
ported to range from 20 to 45percent. These data may point
to the presence of specific population groups suffering from
acute undernourishment, despite abundant food supplies.
Further reading
•
FAO The State of Food Insecurity in the World 2012 - Eco-nomic Growth Is Necessary but Not Sufficient to Acceller-
ate Reduction of Hunger and Malnutrition (www.fao.org/
publications/sofi/en/ )
CHART 29: Average dietary supply adequacy
(1990-1992 and 2007-2009)
80
100
120
140
160
80 100 120 140 160
1990-1992
2 0 0 7 - 2 0 0 9
Africa
Asia
Europe
LAC
Oceania
Source: FAO, Statistics Division.
CHART 30: Trend of the value of food production
(1992-2009)
200
300
400
1995 2000 2005
I $ / c a p
World
Developed
Developing
Africa
Asia
LAC
Oceania
Source: FAO, Statistics Division.
76
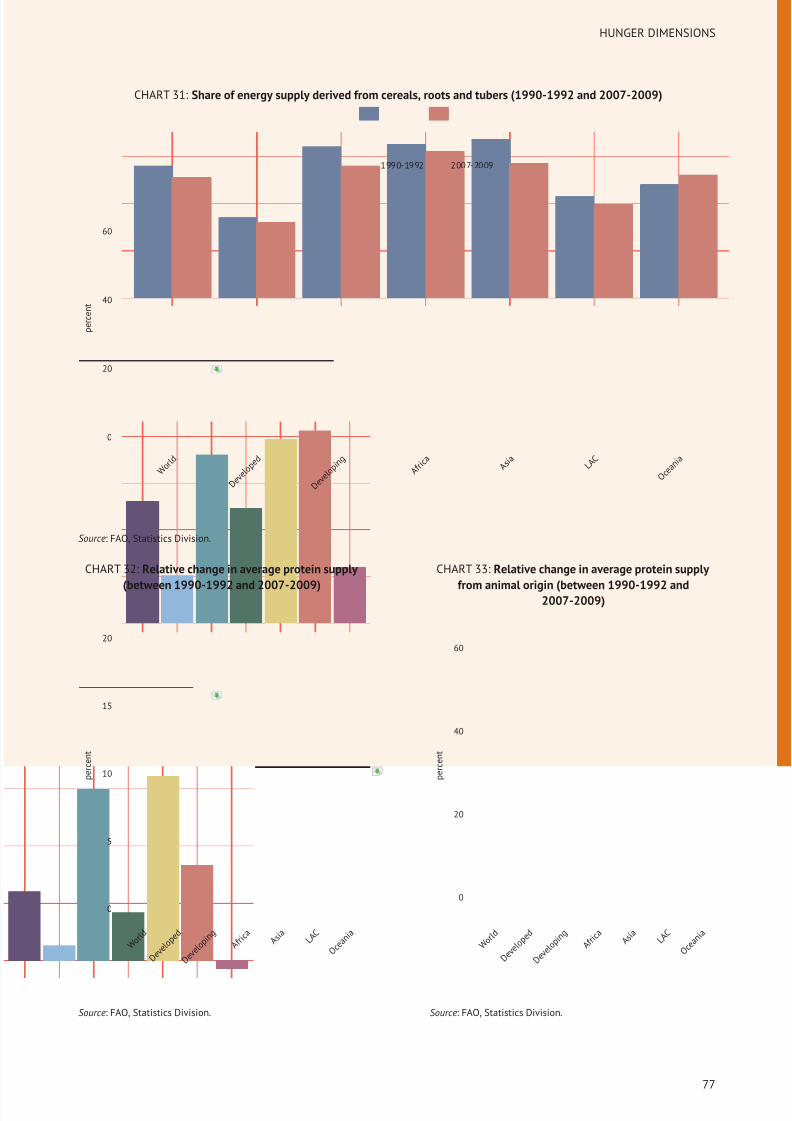
8/16/2019 Informe de la Fao 2013
http://slidepdf.com/reader/full/informe-de-la-fao-2013 95/307
HUNGER DIMENSIONS
CHART 31: Share of energy supply derived from cereals, roots and tubers (1990-1992 and 2007-2009)
0
20
40
60
W o r l d
D e v e l o p
e d
D e v e l o p i n g
A f r i c a
A s i a
L A C
O c e a n i a
p e r c e n t
1990-1992 2007-2009
Source: FAO, Statistics Division.
CHART 32: Relative change in average protein supply
(between 1990-1992 and 2007-2009)
0
5
10
15
20
W o r l d
D e v e l o p
e d
D e v e l o p i n g
A f r i c a
A s i a
L A C
O c e a n i a
p e r c e n t
Source: FAO, Statistics Division.
CHART 33: Relative change in average protein supply
from animal origin (between 1990-1992 and2007-2009)
0
20
40
60
W o r l d
D e v e l o p
e d
D e v e l o p i n g
A f r i c a
A s i a
L A C
O c e a n i a
p e r c e n t
Source: FAO, Statistics Division.
77
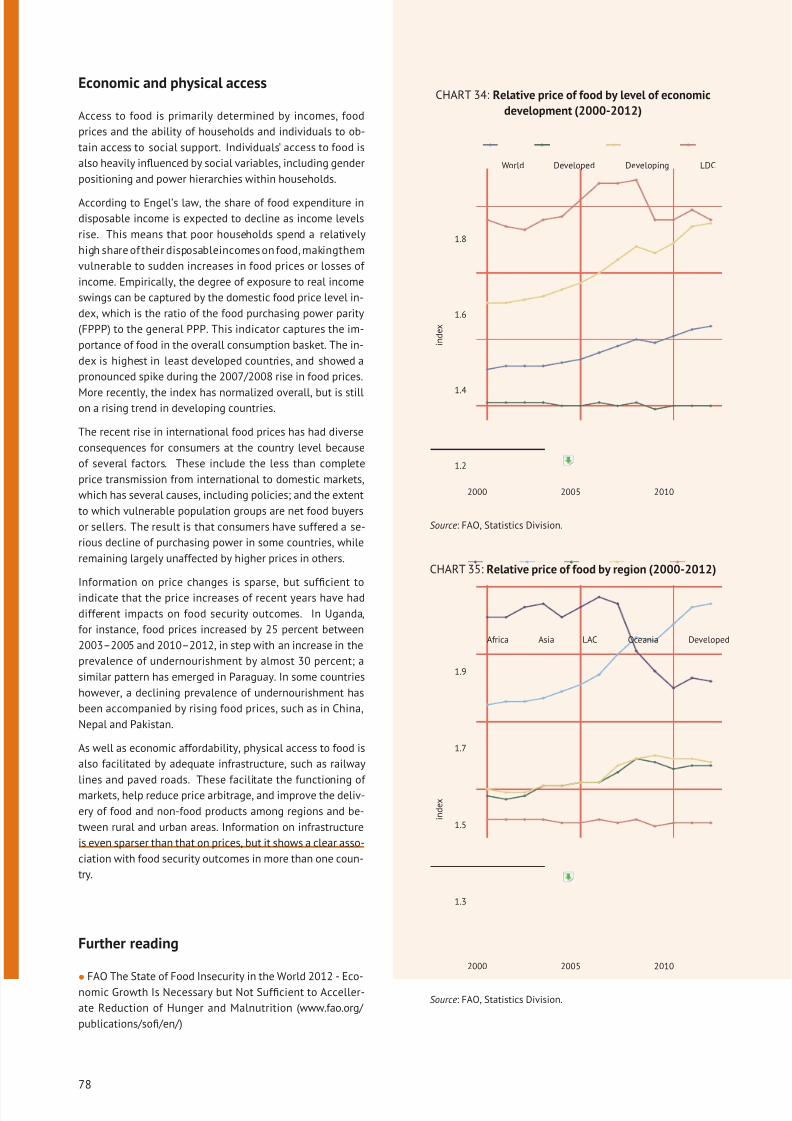
8/16/2019 Informe de la Fao 2013
http://slidepdf.com/reader/full/informe-de-la-fao-2013 96/307
Economic and physical access
Access to food is primarily determined by incomes, food
prices and the ability of households and individuals to ob-
tain access to social support. Individuals’ access to food is
also heavily influenced by social variables, including gender
positioning and power hierarchies within households.
According to Engel’s law, the share of food expenditure in
disposable income is expected to decline as income levels
rise. This means that poor households spend a relatively
high share of their disposableincomes on food, makingthem
vulnerable to sudden increases in food prices or losses of
income. Empirically, the degree of exposure to real income
swings can be captured by the domestic food price level in-
dex, which is the ratio of the food purchasing power parity
(FPPP) to the general PPP. This indicator captures the im-
portance of food in the overall consumption basket. The in-
dex is highest in least developed countries, and showed a
pronounced spike during the 2007/2008 rise in food prices.
More recently, the index has normalized overall, but is stillon a rising trend in developing countries.
The recent rise in international food prices has had diverse
consequences for consumers at the country level because
of several factors. These include the less than complete
price transmission from international to domestic markets,
which has several causes, including policies; and the extent
to which vulnerable population groups are net food buyers
or sellers. The result is that consumers have suffered a se-
rious decline of purchasing power in some countries, while
remaining largely unaffected by higher prices in others.
Information on price changes is sparse, but sufficient to
indicate that the price increases of recent years have had
different impacts on food security outcomes. In Uganda,
for instance, food prices increased by 25 percent between
2003–2005 and 2010–2012, in step with an increase in the
prevalence of undernourishment by almost 30 percent; a
similar pattern has emerged in Paraguay. In some countries
however, a declining prevalence of undernourishment has
been accompanied by rising food prices, such as in China,
Nepal and Pakistan.
As well as economic affordability, physical access to food is
also facilitated by adequate infrastructure, such as railway
lines and paved roads. These facilitate the functioning of markets, help reduce price arbitrage, and improve the deliv-
ery of food and non-food products among regions and be-
tween rural and urban areas. Information on infrastructure
is even sparser than that on prices, but it shows a clear asso-
ciation with food security outcomes in more than one coun-
try.
Further reading
•
FAO The State of Food Insecurity in the World 2012 - Eco-nomic Growth Is Necessary but Not Sufficient to Acceller-
ate Reduction of Hunger and Malnutrition (www.fao.org/
publications/sofi/en/ )
CHART 34: Relative price of food by level of economic
development (2000-2012)
1.2
1.4
1.6
1.8
2000 2005 2010
i n d e x
World Developed Developing LDC
Source: FAO, Statistics Division.
CHART 35: Relative price of food by region (2000-2012)
1.3
1.5
1.7
1.9
2000 2005 2010
i n d e x
Africa Asia LAC Oceania Developed
Source: FAO, Statistics Division.
78
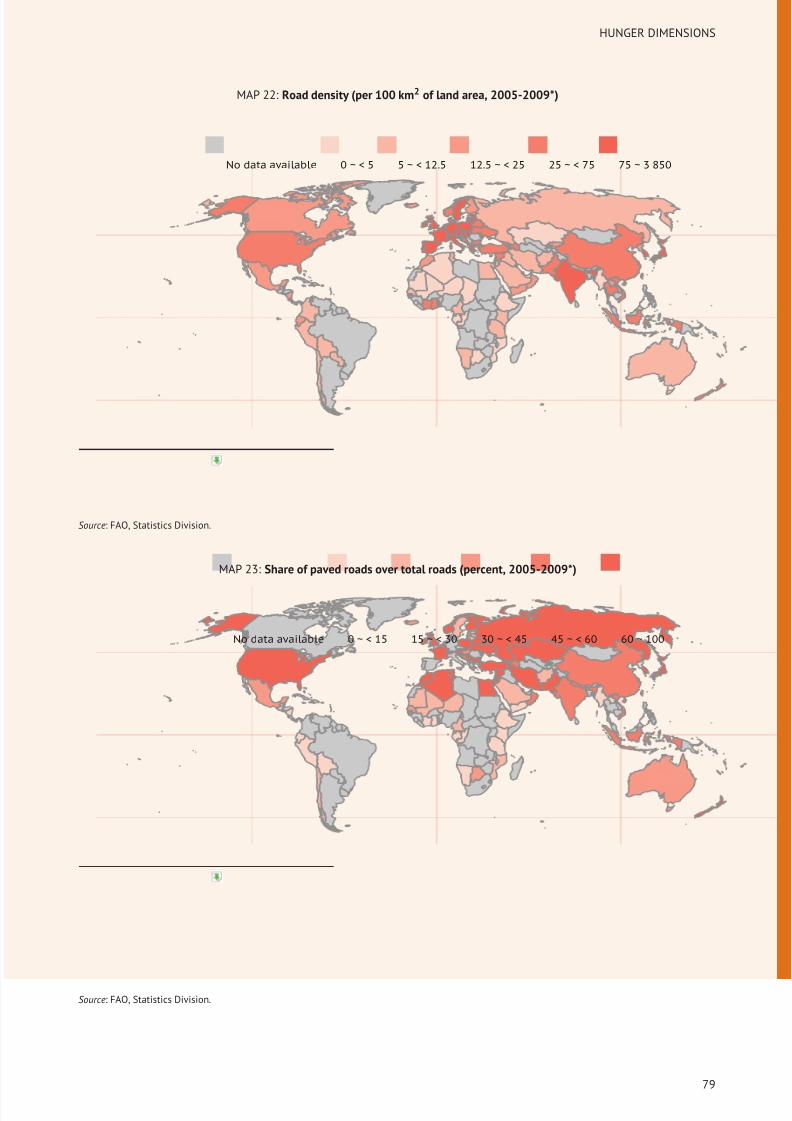
8/16/2019 Informe de la Fao 2013
http://slidepdf.com/reader/full/informe-de-la-fao-2013 97/307
HUNGER DIMENSIONS
MAP 22: Road density (per 100 km2 of land area, 2005-2009*)
No data available 0 ~ < 5 5 ~ < 12.5 12.5 ~ < 25 25 ~ < 75 75 ~ 3 850
Source: FAO, Statistics Division.
MAP 23: Share of paved roads over total roads (percent, 2005-2009*)
No data available 0 ~ < 15 15 ~ < 30 30 ~ < 45 45 ~ < 60 60 ~ 100
Source: FAO, Statistics Division.
79
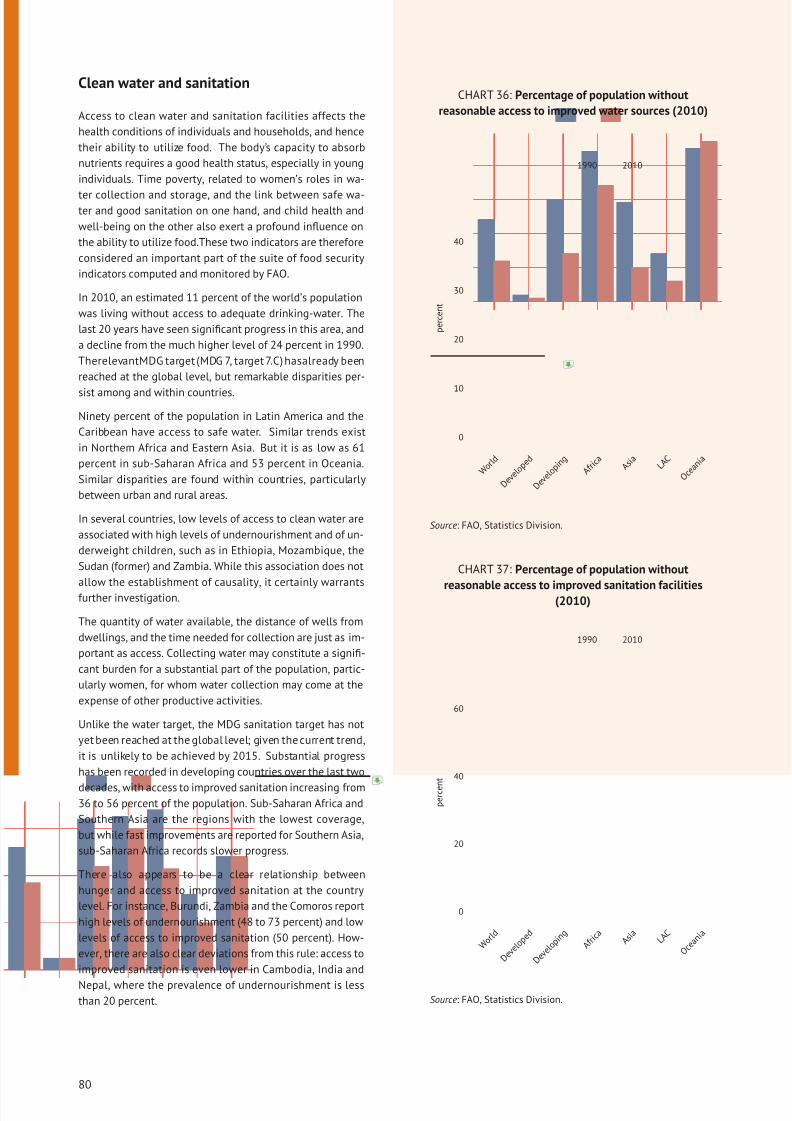
8/16/2019 Informe de la Fao 2013
http://slidepdf.com/reader/full/informe-de-la-fao-2013 98/307
Clean water and sanitation
Access to clean water and sanitation facilities affects the
health conditions of individuals and households, and hence
their ability to utilize food. The body’s capacity to absorb
nutrients requires a good health status, especially in young
individuals. Time poverty, related to women’s roles in wa-
ter collection and storage, and the link between safe wa-ter and good sanitation on one hand, and child health and
well-being on the other also exert a profound influence on
the ability to utilize food.These two indicators are therefore
considered an important part of the suite of food security
indicators computed and monitored by FAO.
In 2010, an estimated 11 percent of the world’s population
was living without access to adequate drinking-water. The
last 20 years have seen significant progress in this area, and
a decline from the much higher level of 24 percent in 1990.
TherelevantMDG target (MDG 7, target 7.C) hasalready been
reached at the global level, but remarkable disparities per-
sist among and within countries.
Ninety percent of the population in Latin America and the
Caribbean have access to safe water. Similar trends exist
in Northern Africa and Eastern Asia. But it is as low as 61
percent in sub-Saharan Africa and 53 percent in Oceania.
Similar disparities are found within countries, particularly
between urban and rural areas.
In several countries, low levels of access to clean water are
associated with high levels of undernourishment and of un-
derweight children, such as in Ethiopia, Mozambique, the
Sudan (former) and Zambia. While this association does not
allow the establishment of causality, it certainly warrants
further investigation.
The quantity of water available, the distance of wells from
dwellings, and the time needed for collection are just as im-
portant as access. Collecting water may constitute a signifi-
cant burden for a substantial part of the population, partic-
ularly women, for whom water collection may come at the
expense of other productive activities.
Unlike the water target, the MDG sanitation target has not
yet been reached at the global level; given the current trend,
it is unlikely to be achieved by 2015. Substantial progress
has been recorded in developing countries over the last two
decades, with access to improved sanitation increasing from36 to 56 percent of the population. Sub-Saharan Africa and
Southern Asia are the regions with the lowest coverage,
but while fast improvements are reported for Southern Asia,
sub-Saharan Africa records slower progress.
There also appears to be a clear relationship between
hunger and access to improved sanitation at the country
level. For instance, Burundi, Zambia and the Comoros report
high levels of undernourishment (48 to 73 percent) and low
levels of access to improved sanitation (50 percent). How-
ever, there are also clear deviations from this rule: access to
improved sanitation is even lower in Cambodia, India and
Nepal, where the prevalence of undernourishment is lessthan 20 percent.
CHART 36: Percentage of population without
reasonable access to improved water sources (2010)
0
10
20
30
40
W o r l d
D e v e l o p
e d
D e v e l o p i n g
A f r i c a
A s i a
L A C
O c e a n i a
p e r c e n t
1990 2010
Source: FAO, Statistics Division.
CHART 37: Percentage of population without
reasonable access to improved sanitation facilities(2010)
0
20
40
60
W o r l d
D e v e l o p
e d
D e v e l o p i n g
A f r i c a
A s i a
L A C
O c e a n i a
p e r c e n
t
1990 2010
Source: FAO, Statistics Division.
80
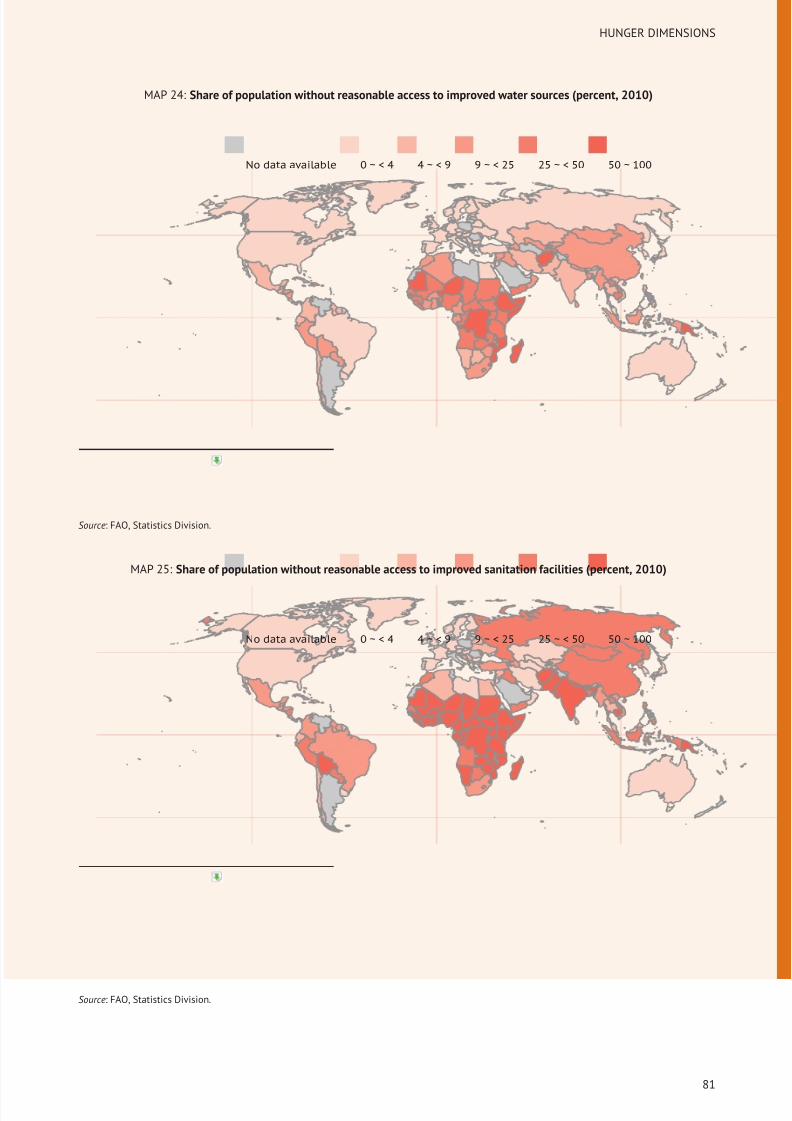
8/16/2019 Informe de la Fao 2013
http://slidepdf.com/reader/full/informe-de-la-fao-2013 99/307
HUNGER DIMENSIONS
MAP 24: Share of population without reasonable access to improved water sources (percent, 2010)
No data available 0 ~ < 4 4 ~ < 9 9 ~ < 25 25 ~ < 50 50 ~ 100
Source: FAO, Statistics Division.
MAP 25: Share of population without reasonable access to improved sanitation facilities (percent, 2010)
No data available 0 ~ < 4 4 ~ < 9 9 ~ < 25 25 ~ < 50 50 ~ 100
Source: FAO, Statistics Division.
81
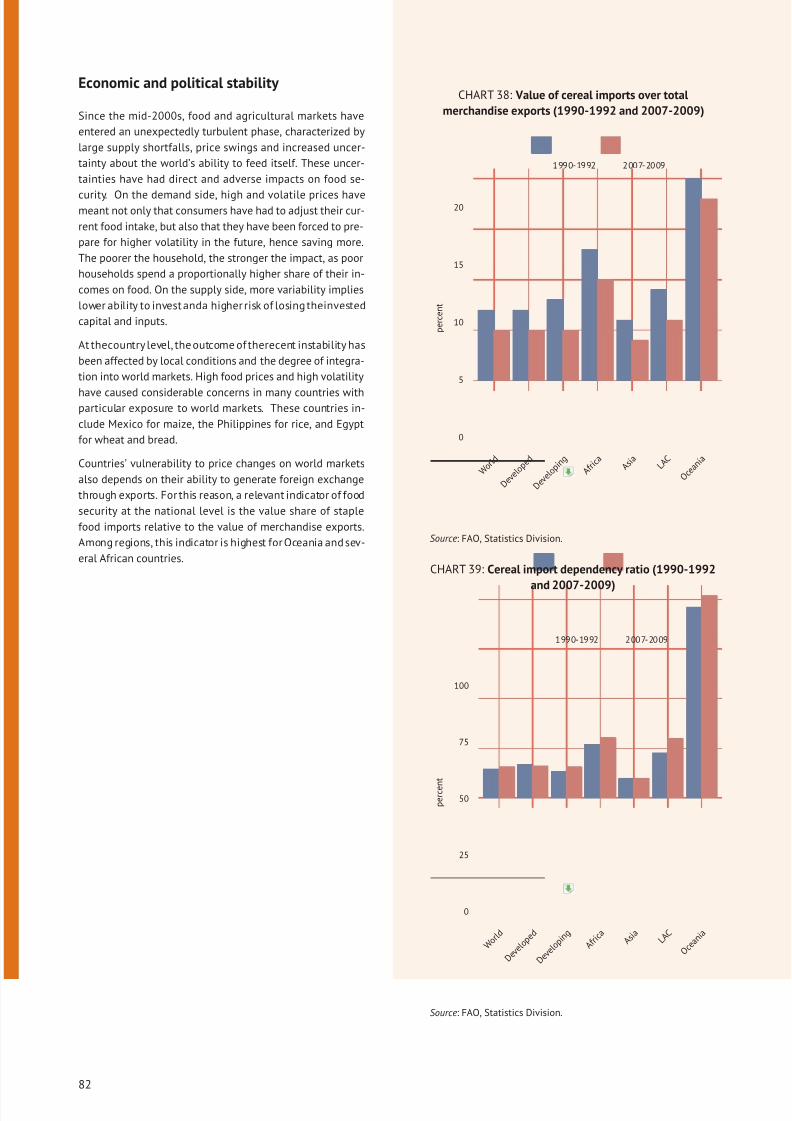
8/16/2019 Informe de la Fao 2013
http://slidepdf.com/reader/full/informe-de-la-fao-2013 100/307
Economic and political stability
Since the mid-2000s, food and agricultural markets have
entered an unexpectedly turbulent phase, characterized by
large supply shortfalls, price swings and increased uncer-
tainty about the world’s ability to feed itself. These uncer-
tainties have had direct and adverse impacts on food se-
curity. On the demand side, high and volatile prices havemeant not only that consumers have had to adjust their cur-
rent food intake, but also that they have been forced to pre-
pare for higher volatility in the future, hence saving more.
The poorer the household, the stronger the impact, as poor
households spend a proportionally higher share of their in-
comes on food. On the supply side, more variability implies
lower ability to invest anda higher risk of losing theinvested
capital and inputs.
At thecountry level, the outcome of therecent instability has
been affected by local conditions and the degree of integra-
tion into world markets. High food prices and high volatility
have caused considerable concerns in many countries withparticular exposure to world markets. These countries in-
clude Mexico for maize, the Philippines for rice, and Egypt
for wheat and bread.
Countries’ vulnerability to price changes on world markets
also depends on their ability to generate foreign exchange
through exports. For this reason, a relevant indicator of food
security at the national level is the value share of staple
food imports relative to the value of merchandise exports.
Among regions, this indicator is highest for Oceania and sev-
eral African countries.
CHART 38: Value of cereal imports over total
merchandise exports (1990-1992 and 2007-2009)
0
5
10
15
20
W o r l d
D e v e l o p
e d
D e v e l o p i n g
A f r i c a
A s i a
L A C
O c e a n i a
p e r c e n t
1990-1992 2007-2009
Source: FAO, Statistics Division.
CHART 39: Cereal import dependency ratio (1990-1992
and 2007-2009)
0
25
50
75
100
W o r l d
D e v e l o p
e d
D e v e l o p i n g
A f r i c a
A s i a
L A C
O c e a n i a
p e r c e n
t
1990-1992 2007-2009
Source: FAO, Statistics Division.
82
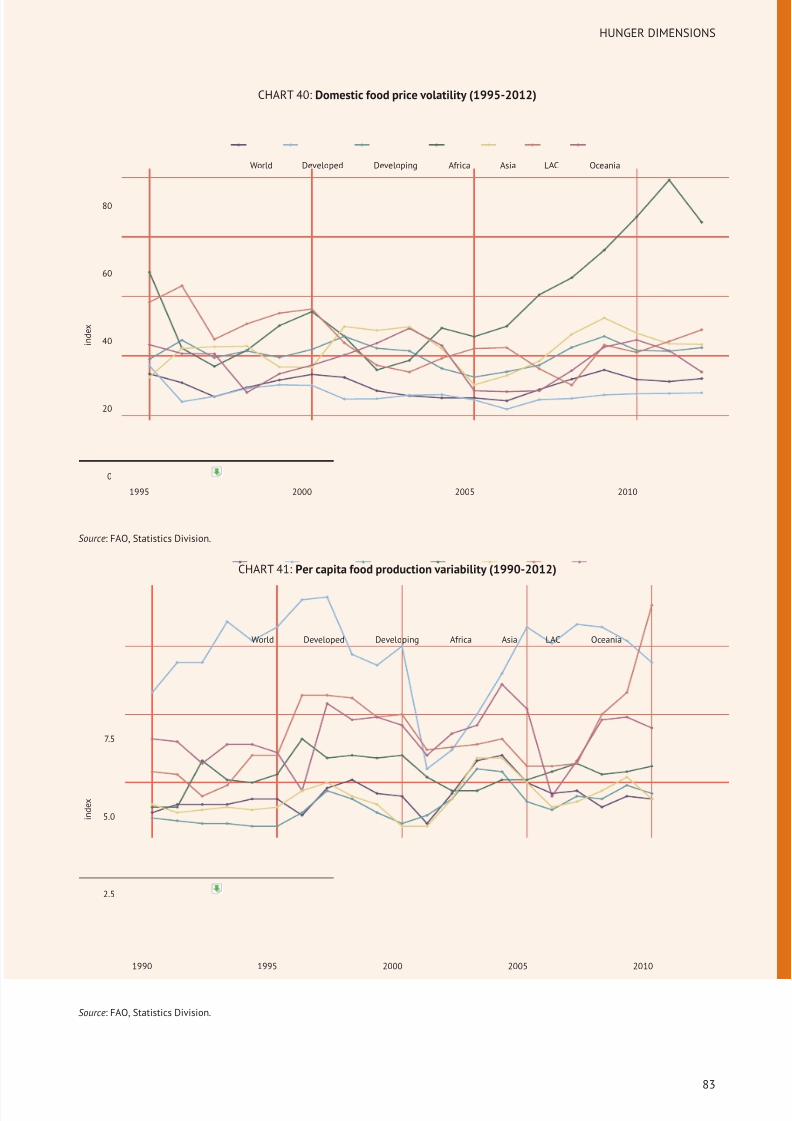
8/16/2019 Informe de la Fao 2013
http://slidepdf.com/reader/full/informe-de-la-fao-2013 101/307
HUNGER DIMENSIONS
CHART 40: Domestic food price volatility (1995-2012)
0
20
40
60
80
1995 2000 2005 2010
i n d e x
World Developed Developing Africa Asia LAC Oceania
Source: FAO, Statistics Division.
CHART 41: Per capita food production variability (1990-2012)
2.5
5.0
7.5
1990 1995 2000 2005 2010
i n d e x
World Developed Developing Africa Asia LAC Oceania
Source: FAO, Statistics Division.
83
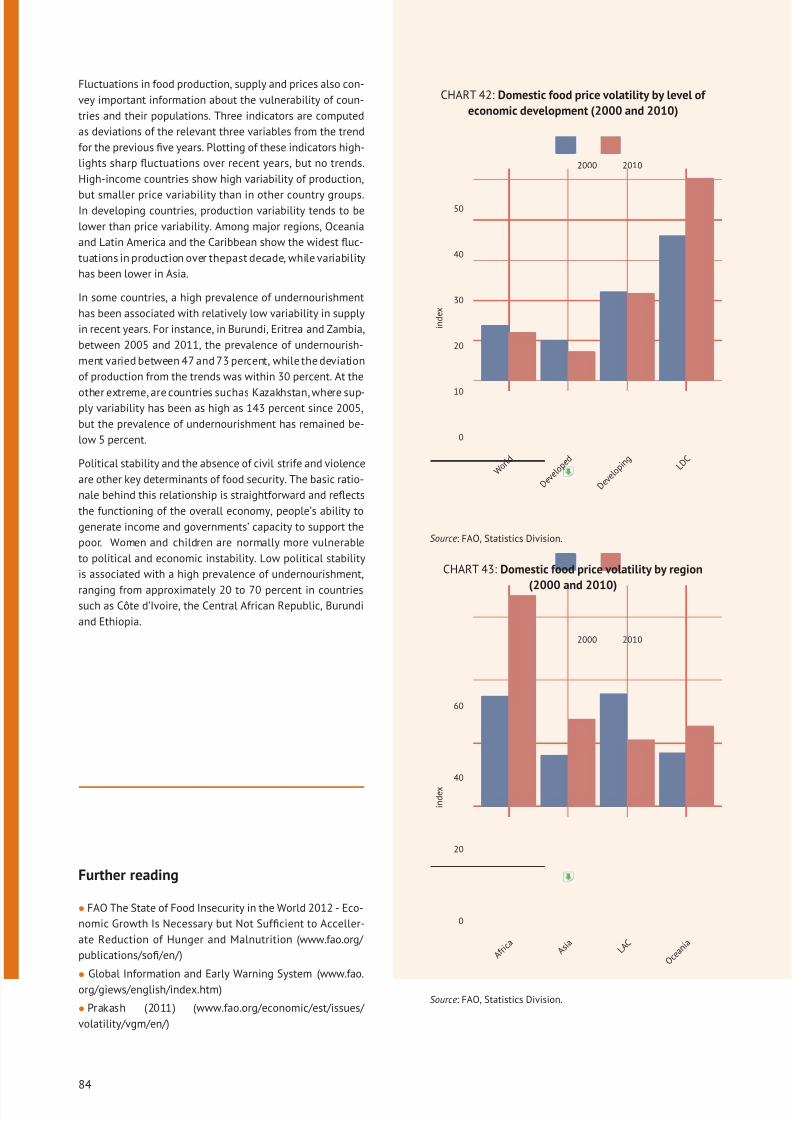
8/16/2019 Informe de la Fao 2013
http://slidepdf.com/reader/full/informe-de-la-fao-2013 102/307
Fluctuations in food production, supply and prices also con-
vey important information about the vulnerability of coun-
tries and their populations. Three indicators are computed
as deviations of the relevant three variables from the trend
for the previous five years. Plotting of these indicators high-
lights sharp fluctuations over recent years, but no trends.
High-income countries show high variability of production,
but smaller price variability than in other country groups.In developing countries, production variability tends to be
lower than price variability. Among major regions, Oceania
and Latin America and the Caribbean show the widest fluc-
tuations in production over thepast decade, while variability
has been lower in Asia.
In some countries, a high prevalence of undernourishment
has been associated with relatively low variability in supply
in recent years. For instance, in Burundi, Eritrea and Zambia,
between 2005 and 2011, the prevalence of undernourish-
ment varied between 47 and 73 percent, while the deviation
of production from the trends was within 30 percent. At the
other extreme, are countries suchas Kazakhstan, where sup-ply variability has been as high as 143 percent since 2005,
but the prevalence of undernourishment has remained be-
low 5 percent.
Political stability and the absence of civil strife and violence
are other key determinants of food security. The basic ratio-
nale behind this relationship is straightforward and reflects
the functioning of the overall economy, people’s ability to
generate income and governments’ capacity to support the
poor. Women and children are normally more vulnerable
to political and economic instability. Low political stability
is associated with a high prevalence of undernourishment,
ranging from approximately 20 to 70 percent in countriessuch as Côte d’Ivoire, the Central African Republic, Burundi
and Ethiopia.
Further reading
• FAO The State of Food Insecurity in the World 2012 - Eco-
nomic Growth Is Necessary but Not Sufficient to Acceller-
ate Reduction of Hunger and Malnutrition (www.fao.org/
publications/sofi/en/ )
• Global Information and Early Warning System (www.fao.
org/giews/english/index.htm)
• Prakash (2011) (www.fao.org/economic/est/issues/
volatility/vgm/en/)
CHART 42: Domestic food price volatility by level of
economic development (2000 and 2010)
0
10
20
30
40
50
W o r l d
D e v e l o p
e d
D e v e l o p i n g L D
C
i n d e x
2000 2010
Source: FAO, Statistics Division.
CHART 43: Domestic food price volatility by region
(2000 and 2010)
0
20
40
60
A f r i c a
A s i a
L A C
O c e a n i a
i n d e x
2000 2010
Source: FAO, Statistics Division.
84
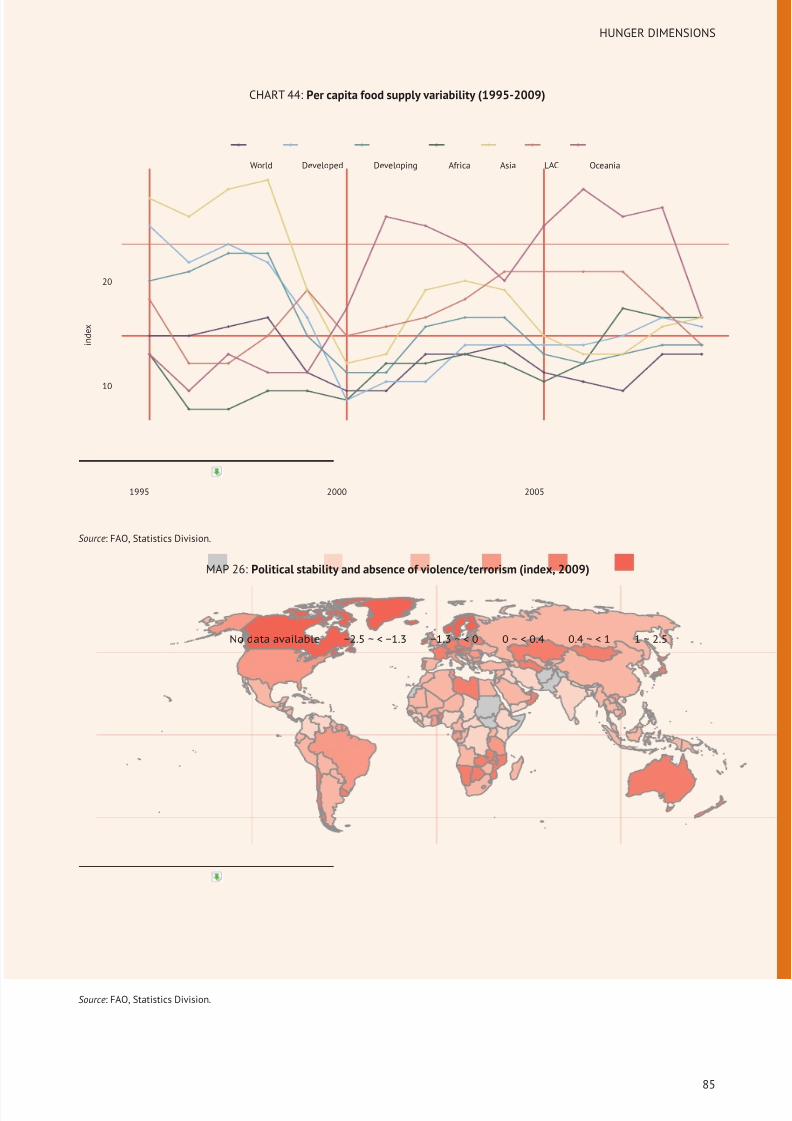
8/16/2019 Informe de la Fao 2013
http://slidepdf.com/reader/full/informe-de-la-fao-2013 103/307
HUNGER DIMENSIONS
CHART 44: Per capita food supply variability (1995-2009)
10
20
1995 2000 2005
i n d e x
World Developed Developing Africa Asia LAC Oceania
Source: FAO, Statistics Division.
MAP 26: Political stability and absence of violence/terrorism (index, 2009)
No data available −2.5 ~ < −1.3 −1.3 ~ < 0 0 ~ < 0.4 0.4 ~ < 1 1 ~ 2.5
Source: FAO, Statistics Division.
85
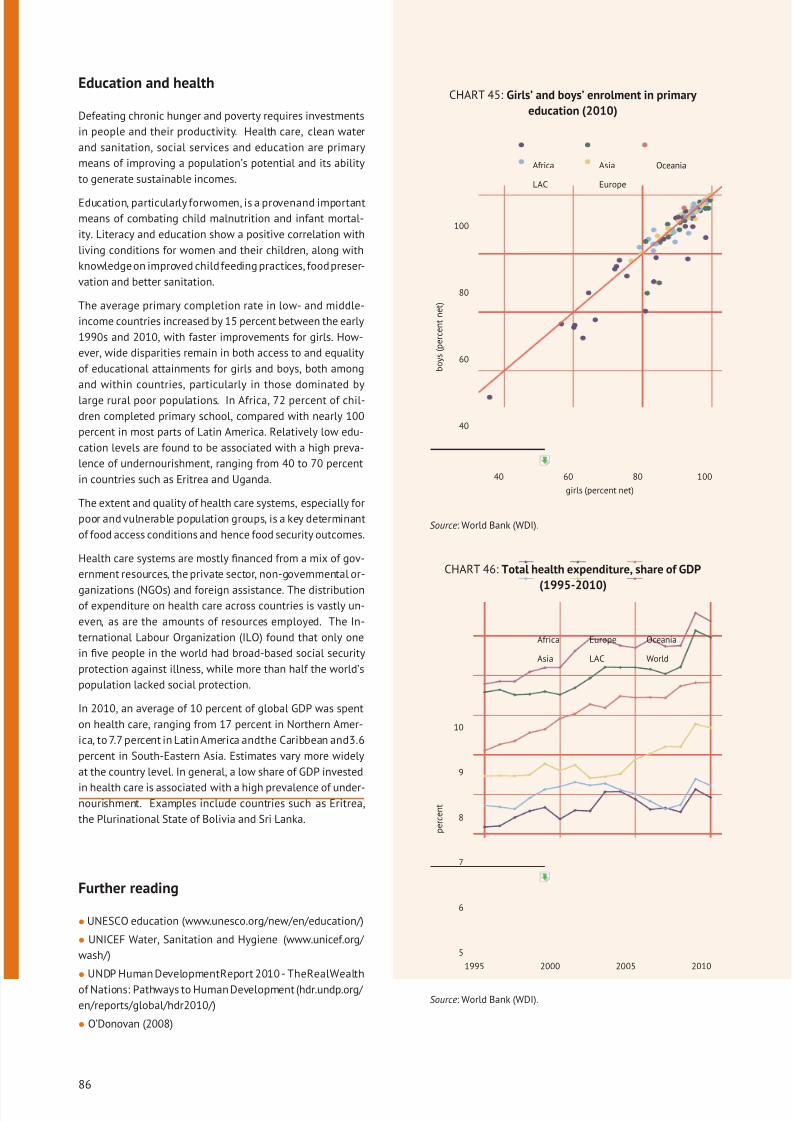
8/16/2019 Informe de la Fao 2013
http://slidepdf.com/reader/full/informe-de-la-fao-2013 104/307
Education and health
Defeating chronic hunger and poverty requires investments
in people and their productivity. Health care, clean water
and sanitation, social services and education are primary
means of improving a population’s potential and its ability
to generate sustainable incomes.
Education, particularly forwomen, is a provenand important
means of combating child malnutrition and infant mortal-
ity. Literacy and education show a positive correlation with
living conditions for women and their children, along with
knowledgeon improved childfeeding practices, foodpreser-
vation and better sanitation.
The average primary completion rate in low- and middle-
income countries increased by 15 percent between the early
1990s and 2010, with faster improvements for girls. How-
ever, wide disparities remain in both access to and equality
of educational attainments for girls and boys, both among
and within countries, particularly in those dominated by
large rural poor populations. In Africa, 72 percent of chil-
dren completed primary school, compared with nearly 100
percent in most parts of Latin America. Relatively low edu-
cation levels are found to be associated with a high preva-
lence of undernourishment, ranging from 40 to 70 percent
in countries such as Eritrea and Uganda.
The extent and quality of health care systems, especially for
poor and vulnerable population groups, is a key determinant
of food access conditions and hence food security outcomes.
Health care systems are mostly financed from a mix of gov-
ernment resources, the private sector, non-governmental or-
ganizations (NGOs) and foreign assistance. The distributionof expenditure on health care across countries is vastly un-
even, as are the amounts of resources employed. The In-
ternational Labour Organization (ILO) found that only one
in five people in the world had broad-based social security
protection against illness, while more than half the world’s
population lacked social protection.
In 2010, an average of 10 percent of global GDP was spent
on health care, ranging from 17 percent in Northern Amer-
ica, to 7.7 percent in Latin America andthe Caribbean and3.6
percent in South-Eastern Asia. Estimates vary more widely
at the country level. In general, a low share of GDP invested
in health care is associated with a high prevalence of under-nourishment. Examples include countries such as Eritrea,
the Plurinational State of Bolivia and Sri Lanka.
Further reading
• UNESCO education (www.unesco.org/new/en/education/ )
• UNICEF Water, Sanitation and Hygiene (www.unicef.org/
wash/)
• UNDP Human DevelopmentReport 2010 - TheRealWealth
of Nations: Pathways to Human Development (hdr.undp.org/
en/reports/global/hdr2010/)
• O’Donovan (2008)
CHART 45: Girls’ and boys’ enrolment in primary
education (2010)
40
60
80
100
40 60 80 100
girls (percent net)
b o y s ( p e r c e n t n e t )
Africa
LAC
Asia
Europe
Oceania
Source: World Bank (WDI).
CHART 46: Total health expenditure, share of GDP
(1995-2010)
5
6
7
8
9
10
1995 2000 2005 2010
p e r c e n t
Africa
Asia
Europe
LAC
Oceania
World
Source: World Bank (WDI).
86
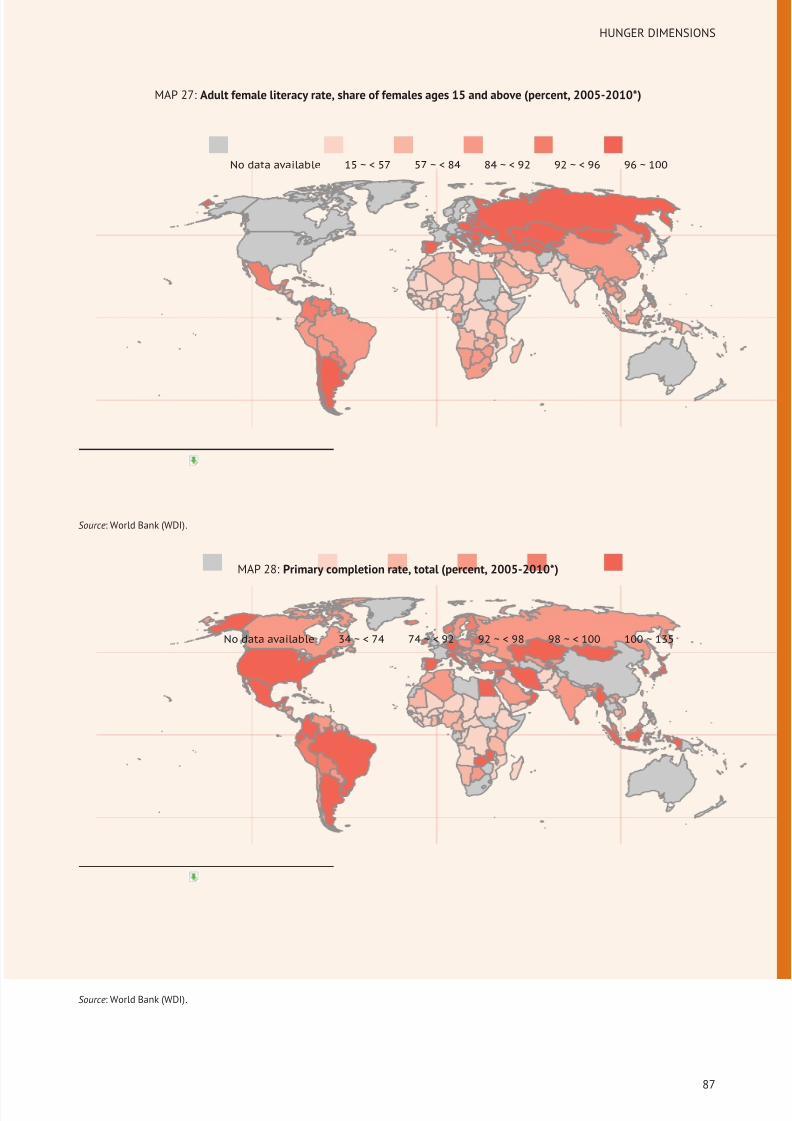
8/16/2019 Informe de la Fao 2013
http://slidepdf.com/reader/full/informe-de-la-fao-2013 105/307
HUNGER DIMENSIONS
MAP 27: Adult female literacy rate, share of females ages 15 and above (percent, 2005-2010*)
No data available 15 ~ < 57 57 ~ < 84 84 ~ < 92 92 ~ < 96 96 ~ 100
Source: World Bank (WDI).
MAP 28: Primary completion rate, total (percent, 2005-2010*)
No data available 34 ~ < 74 74 ~ < 92 92 ~ < 98 98 ~ < 100 100 ~ 135
Source: World Bank (WDI).
87
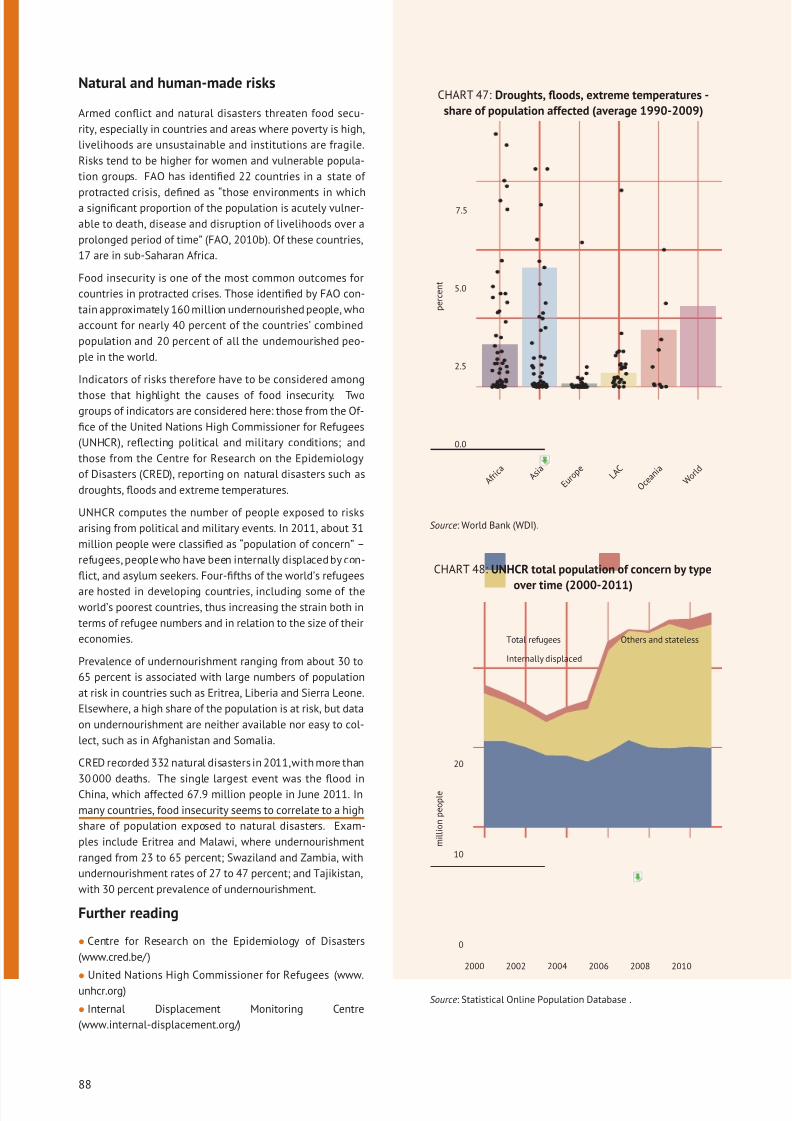
8/16/2019 Informe de la Fao 2013
http://slidepdf.com/reader/full/informe-de-la-fao-2013 106/307
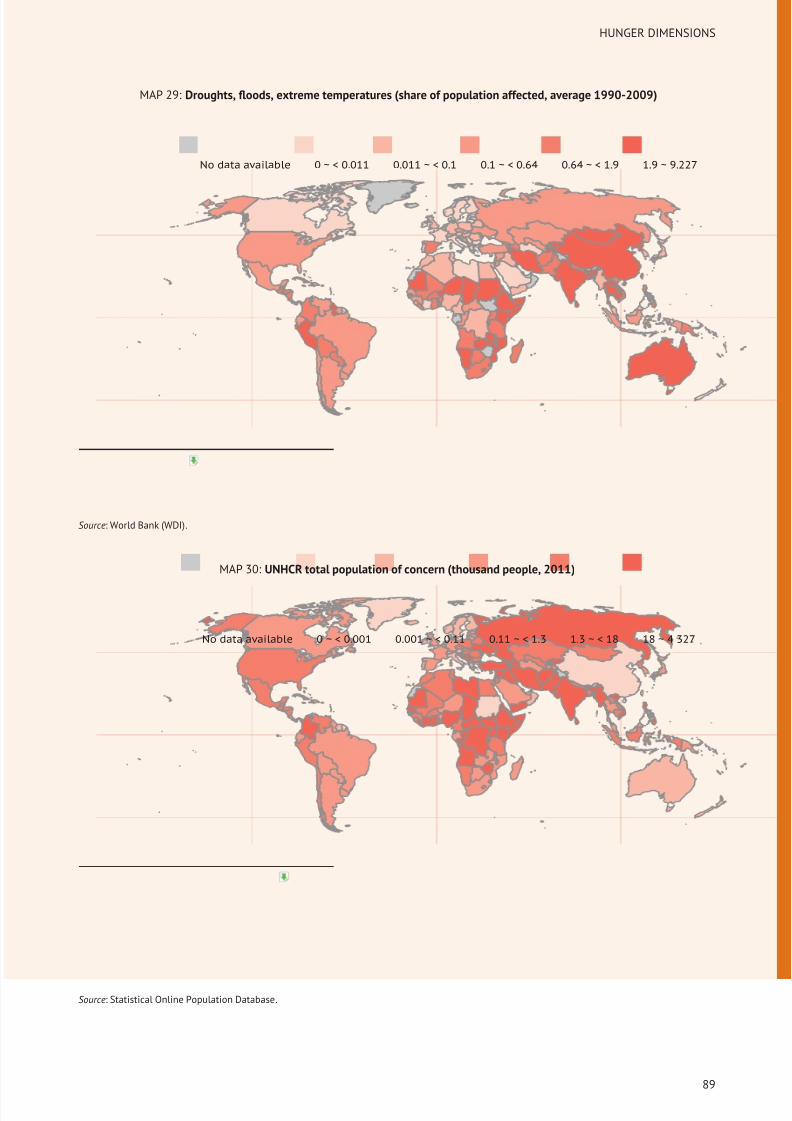
8/16/2019 Informe de la Fao 2013
http://slidepdf.com/reader/full/informe-de-la-fao-2013 107/307
HUNGER DIMENSIONS
MAP 29: Droughts, floods, extreme temperatures (share of population affected, average 1990-2009)
No data available 0 ~ < 0.011 0.011 ~ < 0.1 0.1 ~ < 0.64 0.64 ~ < 1.9 1.9 ~ 9.227
Source: World Bank (WDI).
MAP 30: UNHCR total population of concern (thousand people, 2011)
No data available 0 ~ < 0.001 0.001 ~ < 0.11 0.11 ~ < 1.3 1.3 ~ < 18 18 ~ 4 327
Source: Statistical Online Population Database.
89
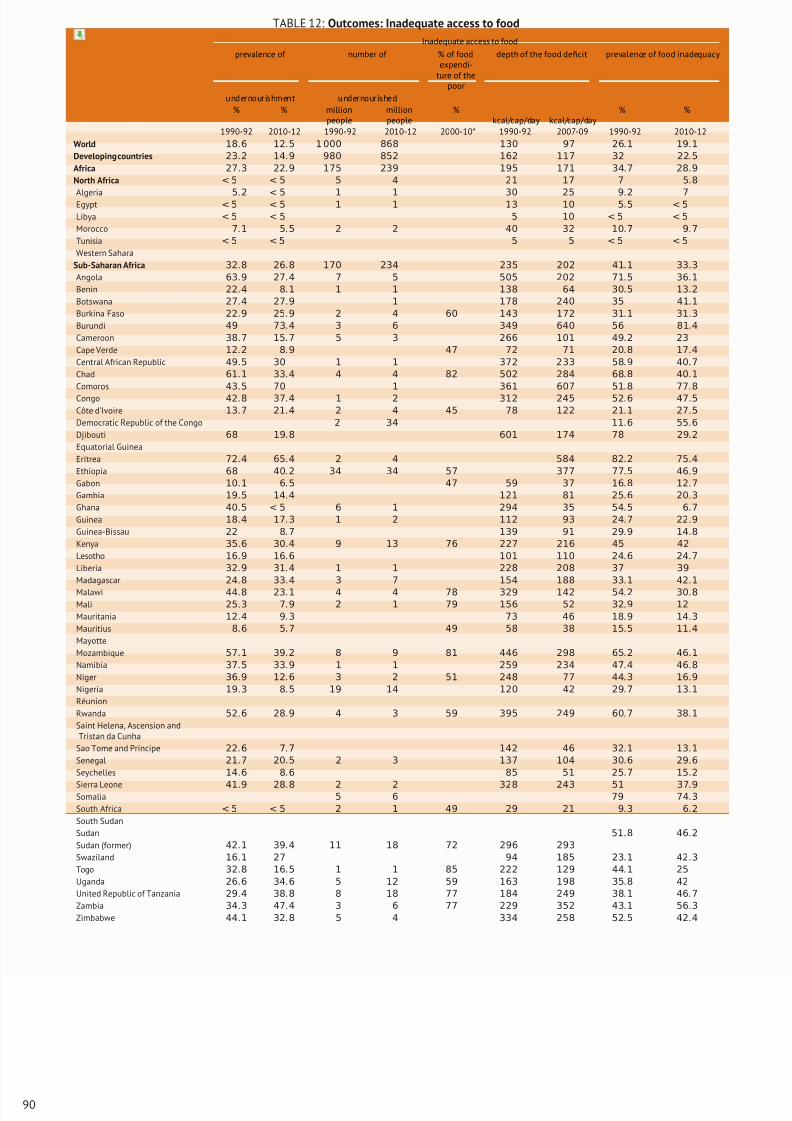
8/16/2019 Informe de la Fao 2013
http://slidepdf.com/reader/full/informe-de-la-fao-2013 108/307
TABLE 12: Outcomes: Inadequate access to food
Inadequate access to food
prevalence of number of % of foodexpendi-
ture of thepoor
depth of the food deficit prevalence of food inadequacy
undernourishment undernourished% % million
peoplemillionpeople
%kcal/cap/day kcal/cap/day
% %
1990-92 2010-12 1990-92 2010-12 2000-10* 1990-92 2007-09 1990-92 2010-12
World 18.6 12.5 1 000 868 130 97 26.1 19.1
Developing countries 23.2 14.9 980 852 162 117 32 22.5
Africa 27.3 22.9 175 239 195 171 34.7 28.9
North Africa < 5 < 5 5 4 21 17 7 5.8
Algeria 5
.2
< 5 1 1 30 25 9
.2 7
Egypt < 5 < 5 1 1 13 10 5.5 < 5
Libya < 5 < 5 5 10 < 5 < 5
Morocco 7.1 5.5 2 2 40 32 10.7 9.7
Tunisia < 5 < 5 5 5 < 5 < 5
Western Sahara
Sub-Saharan Africa 32.8 26.8 170 234 235 202 41.1 33.3
Angola 63.9 27.4 7 5 505 202 71.5 36.1
Benin 22.4 8.1 1 1 138 64 30.5 13.2
Botswana 27.4 27.9 1 178 240 35 41.1
Burkina Faso 22.9 25.9 2 4 60 143 172 31.1 31.3
Burundi 49 73.4 3 6 349 640 56 81.4
Cameroon 38.7 15.7 5 3 266 101 49.2 23
Cape Verde 12.2 8.9 47 72 71 20.8 17.4
Central African Republic 49.5 30 1 1 372 233 58.9 40.7
Chad 61.1 33.4 4 4 82 502 284 68.8 40.1
Comoros 43.5 70 1 361 607 51.8 77.8
Congo 42.8 37.4 1 2 312 245 52.6 47.5
Côte d’Ivoire 13.7 21.4 2 4 45 78 122 21.1 27.5
Democratic Republic of the Congo 2 34 11.6 55.6
Djibouti 68 19.8 601 174 78 29.2
Equatorial Guinea
Eritrea 72.4 65.4 2 4 584 82.2 75.4
Ethiopia 68 40.2 34 34 57 377 77.5 46.9
Gabon 10.1 6.5 47 59 37 16.8 12.7
Gambia 19.5 14.4 121 81 25.6 20.3
Ghana 40.5 < 5 6 1 294 35 54.5 6.7
Guinea 18.4 17.3 1 2 112 93 24.7 22.9
Guinea-Bissau 22 8.7 139 91 29.9 14.8
Kenya 35.6 30.4 9 13 76 227 216 45 42
Lesotho 16.9 16.6 101 110 24.6 24.7
Liberia 32.9 31.4 1 1 228 208 37 39
Madagascar 24.8 33.4 3 7 154 188 33.1 42.1
Malawi 44.8 23.1 4 4 78 329 142 54.2 30.8
Mali 25.3 7.9 2 1 79 156 52 32.9 12
Mauritania 12.4 9.3 73 46 18.9 14.3
Mauritius 8.6 5.7 49 58 38 15.5 11.4
Mayotte
Mozambique 57.1 39.2 8 9 81 446 298 65.2 46.1
Namibia 37.5 33.9 1 1 259 234 47.4 46.8
Niger 36.9 12.6 3 2 51 248 77 44.3 16.9
Nigeria 19.3 8.5 19 14 120 42 29.7 13.1
Réunion
Rwanda 52.6 28.9 4 3 59 395 249 60.7 38.1
Saint Helena, Ascension andTristan da Cunha
Sao Tome and Principe 22.6 7.7 142 46 32.1 13.1
Senegal 21.7 20.5 2 3 137 104 30.6 29.6
Seychelles 14.6 8.6 85 51 25.7 15.2
Sierra Leone 41.9 28.8 2 2 328 243 51 37.9Somalia 5 6 79 74.3
South Africa < 5 < 5 2 1 49 29 21 9.3 6.2
South Sudan
Sudan 51.8 46.2
Sudan (former) 42.1 39.4 11 18 72 296 293
Swaziland 16.1 27 94 185 23.1 42.3
Togo 32.8 16.5 1 1 85 222 129 44.1 25
Uganda 26.6 34.6 5 12 59 163 198 35.8 42
United Republic of Tanzania 29.4 38.8 8 18 77 184 249 38.1 46.7
Zambia 34.3 47.4 3 6 77 229 352 43.1 56.3
Zimbabwe 44.1 32.8 5 4 334 258 52.5 42.4
90
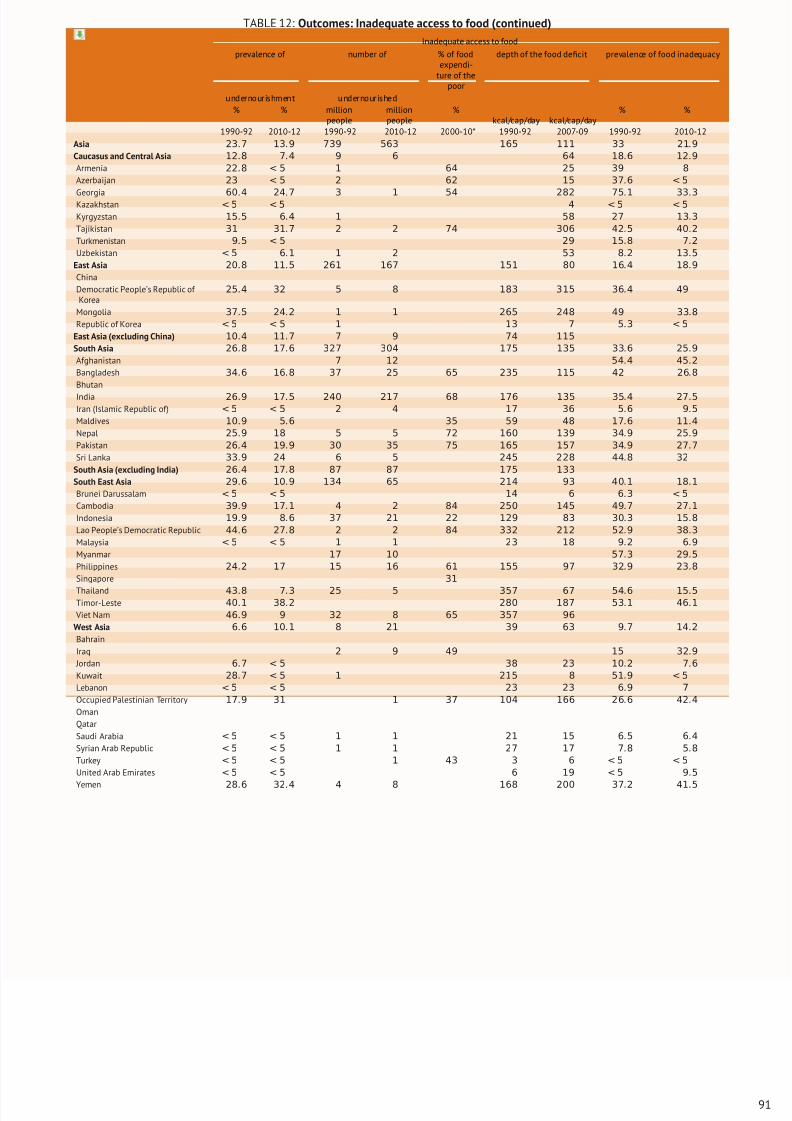
8/16/2019 Informe de la Fao 2013
http://slidepdf.com/reader/full/informe-de-la-fao-2013 109/307
TABLE 12: Outcomes: Inadequate access to food (continued)
Inadequate access to food
prevalence of number of % of foodexpendi-
ture of thepoor
depth of the food deficit prevalence of food inadequacy
undernourishment undernourished% % million
peoplemillionpeople
%kcal/cap/day kcal/cap/day
% %
1990-92 2010-12 1990-92 2010-12 2000-10* 1990-92 2007-09 1990-92 2010-12
Asia 23.7 13.9 739 563 165 111 33 21.9
Caucasus and Central Asia 12.8 7.4 9 6 64 18.6 12.9
Armenia 22.8 < 5 1 64 25 39 8
Azerbaijan 23 < 5 2 62 15 37.6 < 5
Georgia 60
.4 24
.7 3 1 54 282 75
.1 33
.3
Kazakhstan < 5 < 5 4 < 5 < 5
Kyrgyzstan 15.5 6.4 1 58 27 13.3
Tajikistan 31 31.7 2 2 74 306 42.5 40.2
Turkmenistan 9.5 < 5 29 15.8 7.2
Uzbekistan < 5 6.1 1 2 53 8.2 13.5
East Asia 20.8 11.5 261 167 151 80 16.4 18.9
China
Democratic People’s Republic of Korea
25.4 32 5 8 183 315 36.4 49
Mongolia 37.5 24.2 1 1 265 248 49 33.8
Republic of Korea < 5 < 5 1 13 7 5.3 < 5
East Asia (excluding China) 10.4 11.7 7 9 74 115
South Asia 26.8 17.6 327 304 175 135 33.6 25.9
Afghanistan 7 12 54.4 45.2
Bangladesh 34.6 16.8 37 25 65 235 115 42 26.8
Bhutan
India 26.9 17.5 240 217 68 176 135 35.4 27.5
Iran (Islamic Republic of) < 5 < 5 2 4 17 36 5.6 9.5
Maldives 10.9 5.6 35 59 48 17.6 11.4
Nepal 25.9 18 5 5 72 160 139 34.9 25.9
Pakistan 26.4 19.9 30 35 75 165 157 34.9 27.7
Sri Lanka 33.9 24 6 5 245 228 44.8 32
South Asia (excluding India) 26.4 17.8 87 87 175 133
South East Asia 29.6 10.9 134 65 214 93 40.1 18.1
Brunei Darussalam < 5 < 5 14 6 6.3 < 5
Cambodia 39.9 17.1 4 2 84 250 145 49.7 27.1
Indonesia 19.9 8.6 37 21 22 129 83 30.3 15.8
Lao People’s Democratic Republic 44.6 27.8 2 2 84 332 212 52.9 38.3
Malaysia < 5 < 5 1 1 23 18 9.2 6.9
Myanmar 17 10 57.3 29.5
Philippines 24.2 17 15 16 61 155 97 32.9 23.8
Singapore 31
Thailand 43.8 7.3 25 5 357 67 54.6 15.5Timor-Leste 40.1 38.2 280 187 53.1 46.1
Viet Nam 46.9 9 32 8 65 357 96
West Asia 6.6 10.1 8 21 39 63 9.7 14.2
Bahrain
Iraq 2 9 49 15 32.9
Jordan 6.7 < 5 38 23 10.2 7.6
Kuwait 28.7 < 5 1 215 8 51.9 < 5
Lebanon < 5 < 5 23 23 6.9 7
Occupied Palestinian Territory 17.9 31 1 37 104 166 26.6 42.4
Oman
Qatar
Saudi Arabia < 5 < 5 1 1 21 15 6.5 6.4
Syrian Arab Republic < 5 < 5 1 1 27 17 7.8 5.8
Turkey < 5 < 5 1 43 3 6 < 5 < 5
United Arab Emirates < 5 < 5 6 19 < 5 9.5
Yemen 28.6 32.4 4 8 168 200 37.2 41.5
91
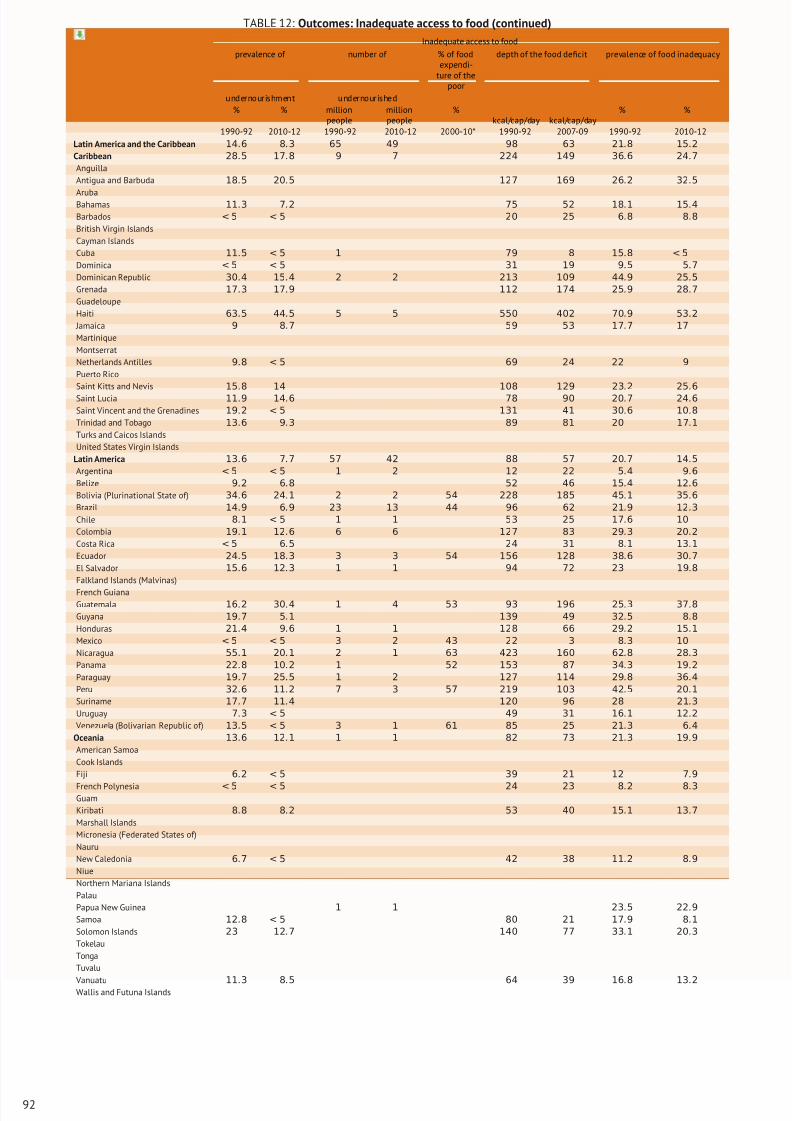
8/16/2019 Informe de la Fao 2013
http://slidepdf.com/reader/full/informe-de-la-fao-2013 110/307
TABLE 12: Outcomes: Inadequate access to food (continued)
Inadequate access to food
prevalence of number of % of foodexpendi-
ture of thepoor
depth of the food deficit prevalence of food inadequacy
undernourishment undernourished% % million
peoplemillionpeople
%kcal/cap/day kcal/cap/day
% %
1990-92 2010-12 1990-92 2010-12 2000-10* 1990-92 2007-09 1990-92 2010-12
Latin America and the Caribbean 14.6 8.3 65 49 98 63 21.8 15.2
Caribbean 28.5 17.8 9 7 224 149 36.6 24.7
Anguilla
Antigua and Barbuda 18.5 20.5 127 169 26.2 32.5
ArubaBahamas 11.3 7.2 75 52 18.1 15.4
Barbados < 5 < 5 20 25 6.8 8.8
British Virgin Islands
Cayman Islands
Cuba 11.5 < 5 1 79 8 15.8 < 5
Dominica < 5 < 5 31 19 9.5 5.7
Dominican Republic 30.4 15.4 2 2 213 109 44.9 25.5
Grenada 17.3 17.9 112 174 25.9 28.7
Guadeloupe
Haiti 63.5 44.5 5 5 550 402 70.9 53.2
Jamaica 9 8.7 59 53 17.7 17
Martinique
Montserrat
Netherlands Antilles 9.8 < 5 69 24 22 9
Puerto Rico
Saint Kitts and Nevis 15.8 14 108 129 23.2 25.6
Saint Lucia 11.9 14.6 78 90 20.7 24.6
Saint Vincent and the Grenadines 19.2 < 5 131 41 30.6 10.8
Trinidad and Tobago 13.6 9.3 89 81 20 17.1
Turks and Caicos Islands
United States Virgin Islands
Latin America 13.6 7.7 57 42 88 57 20.7 14.5
Argentina < 5 < 5 1 2 12 22 5.4 9.6
Belize 9.2 6.8 52 46 15.4 12.6
Bolivia (Plurinational State of) 34.6 24.1 2 2 54 228 185 45.1 35.6
Brazil 14.9 6.9 23 13 44 96 62 21.9 12.3
Chile 8.1 < 5 1 1 53 25 17.6 10
Colombia 19.1 12.6 6 6 127 83 29.3 20.2
Costa Rica < 5 6.5 24 31 8.1 13.1
Ecuador 24.5 18.3 3 3 54 156 128 38.6 30.7
El Salvador 15.6 12.3 1 1 94 72 23 19.8
Falkland Islands (Malvinas)
French GuianaGuatemala 16.2 30.4 1 4 53 93 196 25.3 37.8
Guyana 19.7 5.1 139 49 32.5 8.8
Honduras 21.4 9.6 1 1 128 66 29.2 15.1
Mexico < 5 < 5 3 2 43 22 3 8.3 10
Nicaragua 55.1 20.1 2 1 63 423 160 62.8 28.3
Panama 22.8 10.2 1 52 153 87 34.3 19.2
Paraguay 19.7 25.5 1 2 127 114 29.8 36.4
Peru 32.6 11.2 7 3 57 219 103 42.5 20.1
Suriname 17.7 11.4 120 96 28 21.3
Uruguay 7.3 < 5 49 31 16.1 12.2
Venezuela (Bolivarian Republic of) 13.5 < 5 3 1 61 85 25 21.3 6.4
Oceania 13.6 12.1 1 1 82 73 21.3 19.9
American Samoa
Cook Islands
Fiji 6.2 < 5 39 21 12 7.9
French Polynesia < 5 < 5 24 23 8.2 8.3Guam
Kiribati 8.8 8.2 53 40 15.1 13.7
Marshall Islands
Micronesia (Federated States of)
Nauru
New Caledonia 6.7 < 5 42 38 11.2 8.9
Niue
Northern Mariana Islands
Palau
Papua New Guinea 1 1 23.5 22.9
Samoa 12.8 < 5 80 21 17.9 8.1
Solomon Islands 23 12.7 140 77 33.1 20.3
Tokelau
Tonga
Tuvalu
Vanuatu 11.3 8.5 64 39 16.8 13.2Wallis and Futuna Islands
92
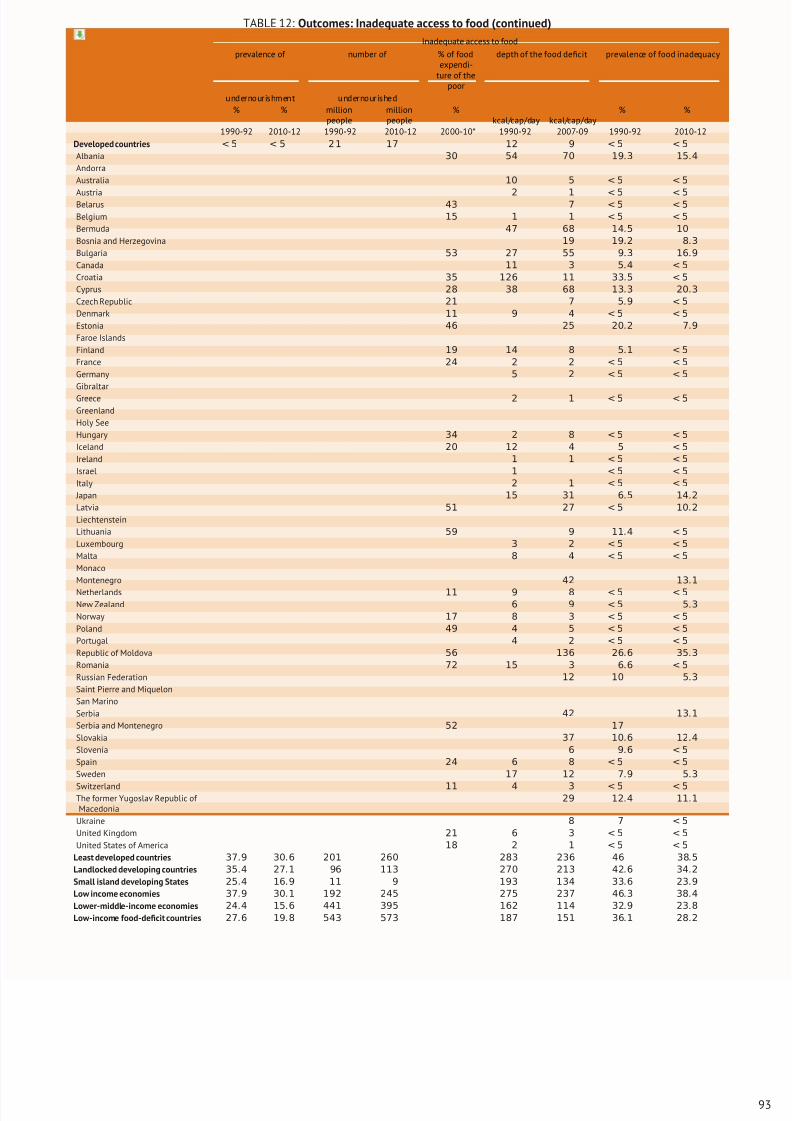
8/16/2019 Informe de la Fao 2013
http://slidepdf.com/reader/full/informe-de-la-fao-2013 111/307
TABLE 12: Outcomes: Inadequate access to food (continued)
Inadequate access to food
prevalence of number of % of foodexpendi-
ture of thepoor
depth of the food deficit prevalence of food inadequacy
undernourishment undernourished% % million
peoplemillionpeople
%kcal/cap/day kcal/cap/day
% %
1990-92 2010-12 1990-92 2010-12 2000-10* 1990-92 2007-09 1990-92 2010-12
Developed countries < 5 < 5 2 1 17 12 9 < 5 < 5
Albania 30 54 70 19.3 15.4
Andorra
Australia 10 5 < 5 < 5
Austria 2 1
< 5
< 5
Belarus 43 7 < 5 < 5
Belgium 15 1 1 < 5 < 5
Bermuda 47 68 14.5 10
Bosnia and Herzegovina 19 19.2 8.3
Bulgaria 53 27 55 9.3 16.9
Canada 11 3 5.4 < 5
Croatia 35 126 11 33.5 < 5
Cyprus 28 38 68 13.3 20.3
Czech Republic 21 7 5.9 < 5
Denmark 11 9 4 < 5 < 5
Estonia 46 25 20.2 7.9
Faroe Islands
Finland 19 14 8 5.1 < 5
France 24 2 2 < 5 < 5
Germany 5 2 < 5 < 5
Gibraltar
Greece 2 1 < 5 < 5
Greenland
Holy See
Hungary 34 2 8 < 5 < 5
Iceland 20 12 4 5 < 5
Ireland 1 1 < 5 < 5
Israel 1 < 5 < 5
Italy 2 1 < 5 < 5
Japan 15 31 6.5 14.2
Latvia 51 27 < 5 10.2
Liechtenstein
Lithuania 59 9 11.4 < 5
Luxembourg 3 2 < 5 < 5
Malta 8 4 < 5 < 5
Monaco
Montenegro 42 13.1
Netherlands 11 9 8 < 5 < 5
New Zealand 6 9 < 5 5.3
Norway 17 8 3 < 5 < 5
Poland 49 4 5 < 5 < 5
Portugal 4 2 < 5 < 5
Republic of Moldova 56 136 26.6 35.3
Romania 72 15 3 6.6 < 5
Russian Federation 12 10 5.3
Saint Pierre and Miquelon
San Marino
Serbia 42 13.1
Serbia and Montenegro 52 17
Slovakia 37 10.6 12.4
Slovenia 6 9.6 < 5
Spain 24 6 8 < 5 < 5
Sweden 17 12 7.9 5.3
Switzerland 11 4 3 < 5 < 5The former Yugoslav Republic of Macedonia
29 12.4 11.1
Ukraine 8 7 < 5
United Kingdom 21 6 3 < 5 < 5
United States of America 18 2 1 < 5 < 5
Least developed countries 37.9 30.6 201 260 283 236 46 38.5
Landlocked developing countries 35.4 27.1 96 113 270 213 42.6 34.2
Small island developing States 25.4 16.9 11 9 193 134 33.6 23.9
Low income economies 37.9 30.1 192 245 275 237 46.3 38.4
Lower-middle-income economies 24.4 15.6 441 395 162 114 32.9 23.8
Low-income food-deficit countries 27.6 19.8 543 573 187 151 36.1 28.2
93
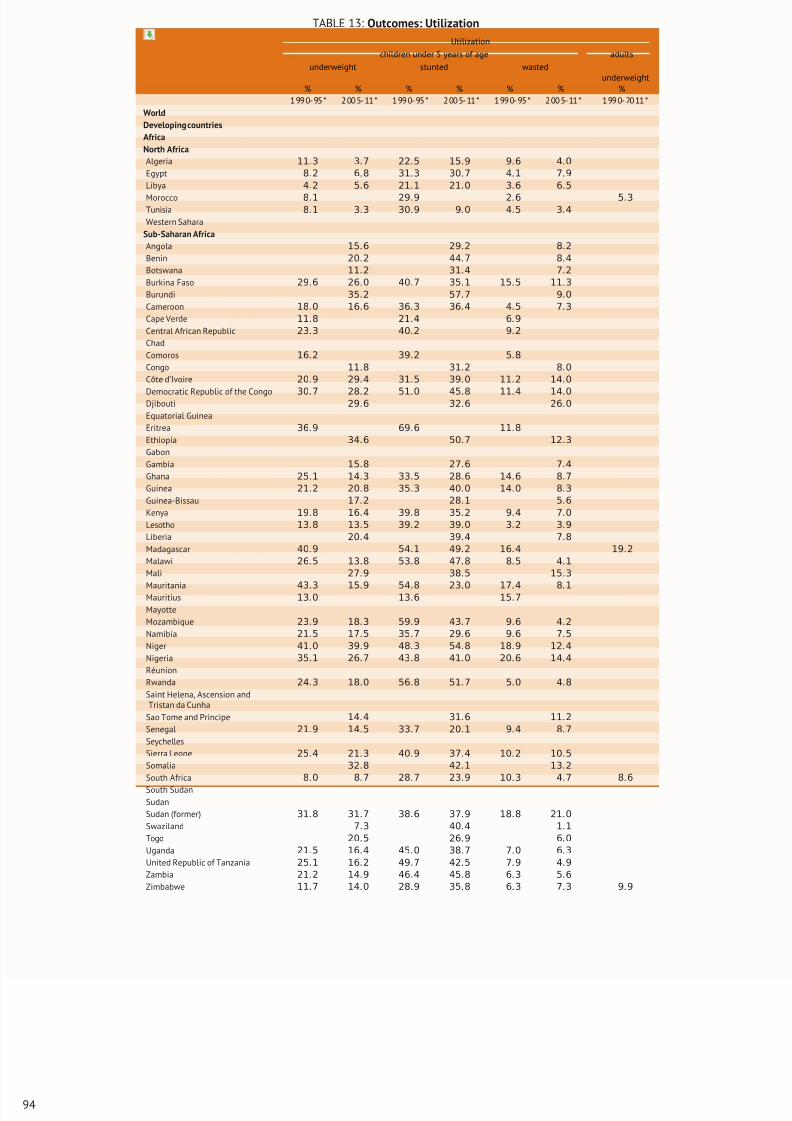
8/16/2019 Informe de la Fao 2013
http://slidepdf.com/reader/full/informe-de-la-fao-2013 112/307
TABLE 13: Outcomes: Utilization
Utilization
children under 5 years of age adults
underweight stunted wastedunderweight
% % % % % % %1990-95* 2005-11* 1990-95* 2005-11* 1990-95* 2005-11* 1990-2011*
World
Developing countries
Africa
North Africa
Algeria 11.3 3.7 22.5 15.9 9.6 4.0
Egypt 8.2 6.8 31.3 30.7 4.1 7.9
Libya 4.2 5.6 21.1 21.0 3.6 6.5
Morocco 8.1 29.9 2.6 5.3Tunisia 8.1 3.3 30.9 9.0 4.5 3.4
Western Sahara
Sub-Saharan Africa
Angola 15.6 29.2 8.2
Benin 20.2 44.7 8.4
Botswana 11.2 31.4 7.2
Burkina Faso 29.6 26.0 40.7 35.1 15.5 11.3
Burundi 35.2 57.7 9.0
Cameroon 18.0 16.6 36.3 36.4 4.5 7.3
Cape Verde 11.8 21.4 6.9
Central African Republic 23.3 40.2 9.2
Chad
Comoros 16.2 39.2 5.8
Congo 11.8 31.2 8.0
Côte d’Ivoire 20.9 29.4 31.5 39.0 11.2 14.0
Democratic Republic of the Congo 30.7 28.2 51.0 45.8 11.4 14.0Djibouti 29.6 32.6 26.0
Equatorial Guinea
Eritrea 36.9 69.6 11.8
Ethiopia 34.6 50.7 12.3
Gabon
Gambia 15.8 27.6 7.4
Ghana 25.1 14.3 33.5 28.6 14.6 8.7
Guinea 21.2 20.8 35.3 40.0 14.0 8.3
Guinea-Bissau 17.2 28.1 5.6
Kenya 19.8 16.4 39.8 35.2 9.4 7.0
Lesotho 13.8 13.5 39.2 39.0 3.2 3.9
Liberia 20.4 39.4 7.8
Madagascar 40.9 54.1 49.2 16.4 19.2
Malawi 26.5 13.8 53.8 47.8 8.5 4.1
Mali 27.9 38.5 15.3
Mauritania 43
.3 15
.9 54
.8 23
.0 17
.4 8
.1
Mauritius 13.0 13.6 15.7
Mayotte
Mozambique 23.9 18.3 59.9 43.7 9.6 4.2
Namibia 21.5 17.5 35.7 29.6 9.6 7.5
Niger 41.0 39.9 48.3 54.8 18.9 12.4
Nigeria 35.1 26.7 43.8 41.0 20.6 14.4
Réunion
Rwanda 24.3 18.0 56.8 51.7 5.0 4.8
Saint Helena, Ascension andTristan da Cunha
Sao Tome and Principe 14.4 31.6 11.2
Senegal 21.9 14.5 33.7 20.1 9.4 8.7
Seychelles
Sierra Leone 25.4 21.3 40.9 37.4 10.2 10.5
Somalia 32.8 42.1 13.2
South Africa 8.0 8.7 28.7 23.9 10.3 4.7 8.6
South SudanSudan
Sudan (former) 31.8 31.7 38.6 37.9 18.8 21.0
Swaziland 7.3 40.4 1.1
Togo 20.5 26.9 6.0
Uganda 21.5 16.4 45.0 38.7 7.0 6.3
United Republic of Tanzania 25.1 16.2 49.7 42.5 7.9 4.9
Zambia 21.2 14.9 46.4 45.8 6.3 5.6
Zimbabwe 11.7 14.0 28.9 35.8 6.3 7.3 9.9
94
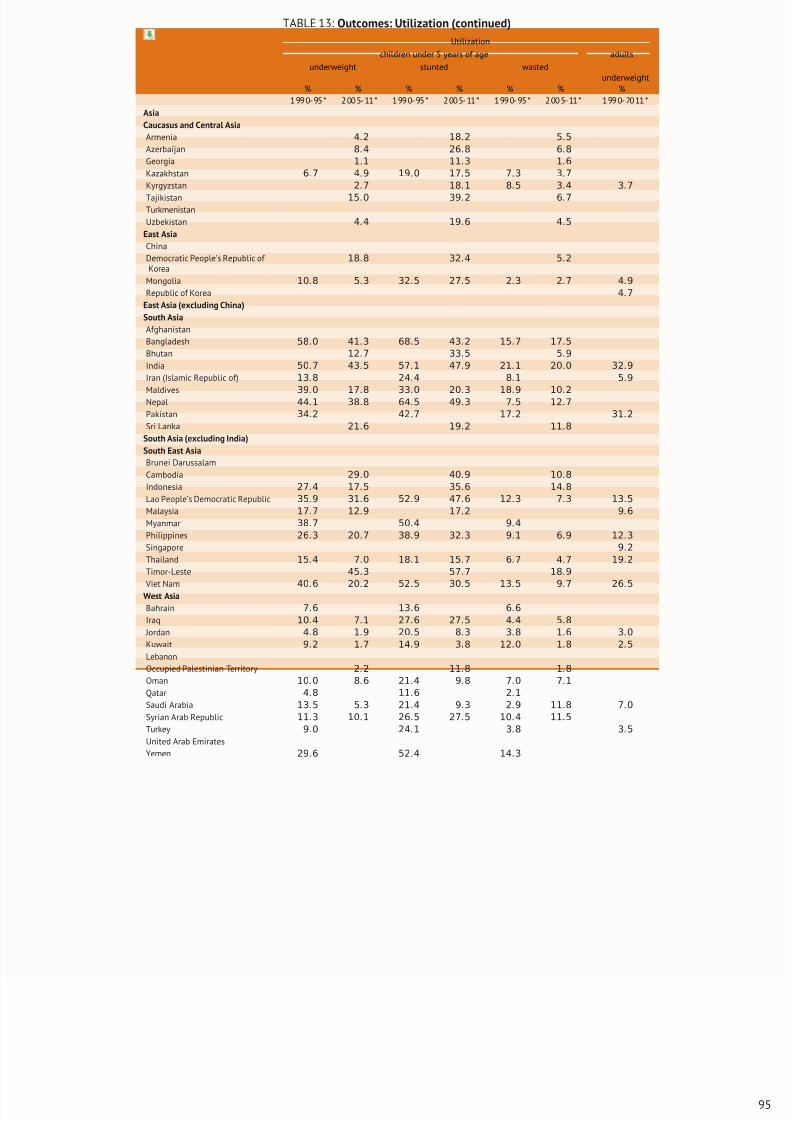
8/16/2019 Informe de la Fao 2013
http://slidepdf.com/reader/full/informe-de-la-fao-2013 113/307
TABLE 13: Outcomes: Utilization (continued)
Utilization
children under 5 years of age adults
underweight stunted wastedunderweight
% % % % % % %1990-95* 2005-11* 1990-95* 2005-11* 1990-95* 2005-11* 1990-2011*
Asia
Caucasus and Central Asia
Armenia 4.2 18.2 5.5
Azerbaijan 8.4 26.8 6.8
Georgia 1.1 11.3 1.6
Kazakhstan 6.7 4.9 19.0 17.5 7.3 3.7
Kyrgyzstan 2.7 18.1 8.5 3.4 3.7
Tajikistan 15.0 39.2 6.7Turkmenistan
Uzbekistan 4.4 19.6 4.5
East Asia
China
Democratic People’s Republic of Korea
18.8 32.4 5.2
Mongolia 10.8 5.3 32.5 27.5 2.3 2.7 4.9
Republic of Korea 4.7
East Asia (excluding China)
South Asia
Afghanistan
Bangladesh 58.0 41.3 68.5 43.2 15.7 17.5
Bhutan 12.7 33.5 5.9
India 50.7 43.5 57.1 47.9 21.1 20.0 32.9
Iran (Islamic Republic of) 13.8 24.4 8.1 5.9
Maldives 39.0 17.8 33.0 20.3 18.9 10.2Nepal 44.1 38.8 64.5 49.3 7.5 12.7
Pakistan 34.2 42.7 17.2 31.2
Sri Lanka 21.6 19.2 11.8
South Asia (excluding India)
South East Asia
Brunei Darussalam
Cambodia 29.0 40.9 10.8
Indonesia 27.4 17.5 35.6 14.8
Lao People’s Democratic Republic 35.9 31.6 52.9 47.6 12.3 7.3 13.5
Malaysia 17.7 12.9 17.2 9.6
Myanmar 38.7 50.4 9.4
Philippines 26.3 20.7 38.9 32.3 9.1 6.9 12.3
Singapore 9.2
Thailand 15.4 7.0 18.1 15.7 6.7 4.7 19.2
Timor-Leste 45.3 57.7 18.9
Viet Nam 40.6 20.2 52.5 30.5 13.5 9.7 26.5
West Asia
Bahrain 7.6 13.6 6.6
Iraq 10.4 7.1 27.6 27.5 4.4 5.8
Jordan 4.8 1.9 20.5 8.3 3.8 1.6 3.0
Kuwait 9.2 1.7 14.9 3.8 12.0 1.8 2.5
Lebanon
Occupied Palestinian Territory 2.2 11.8 1.8
Oman 10.0 8.6 21.4 9.8 7.0 7.1
Qatar 4.8 11.6 2.1
Saudi Arabia 13.5 5.3 21.4 9.3 2.9 11.8 7.0
Syrian Arab Republic 11.3 10.1 26.5 27.5 10.4 11.5
Turkey 9.0 24.1 3.8 3.5
United Arab Emirates
Yemen 29.6 52.4 14.3
95
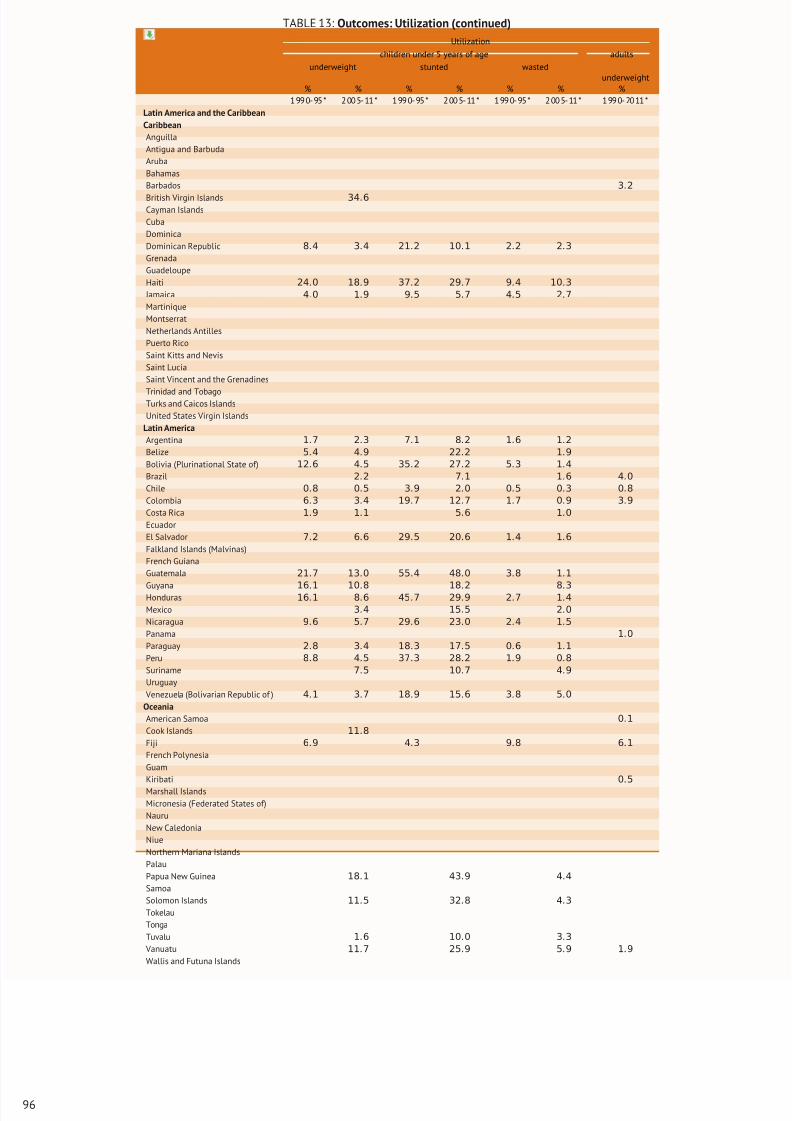
8/16/2019 Informe de la Fao 2013
http://slidepdf.com/reader/full/informe-de-la-fao-2013 114/307
TABLE 13: Outcomes: Utilization (continued)
Utilization
children under 5 years of age adults
underweight stunted wastedunderweight
% % % % % % %1990-95* 2005-11* 1990-95* 2005-11* 1990-95* 2005-11* 1990-2011*
Latin America and the Caribbean
Caribbean
Anguilla
Antigua and Barbuda
Aruba
Bahamas
Barbados 3.2
British Virgin Islands 34.6Cayman Islands
Cuba
Dominica
Dominican Republic 8.4 3.4 21.2 10.1 2.2 2.3
Grenada
Guadeloupe
Haiti 24.0 18.9 37.2 29.7 9.4 10.3
Jamaica 4.0 1.9 9.5 5.7 4.5 2.7
Martinique
Montserrat
Netherlands Antilles
Puerto Rico
Saint Kitts and Nevis
Saint Lucia
Saint Vincent and the Grenadines
Trinidad and TobagoTurks and Caicos Islands
United States Virgin Islands
Latin America
Argentina 1.7 2.3 7.1 8.2 1.6 1.2
Belize 5.4 4.9 22.2 1.9
Bolivia (Plurinational State of) 12.6 4.5 35.2 27.2 5.3 1.4
Brazil 2.2 7.1 1.6 4.0
Chile 0.8 0.5 3.9 2.0 0.5 0.3 0.8
Colombia 6.3 3.4 19.7 12.7 1.7 0.9 3.9
Costa Rica 1.9 1.1 5.6 1.0
Ecuador
El Salvador 7.2 6.6 29.5 20.6 1.4 1.6
Falkland Islands (Malvinas)
French Guiana
Guatemala 21.7 13.0 55.4 48.0 3.8 1.1
Guyana 16
.1 10
.8 18
.2 8
.3
Honduras 16.1 8.6 45.7 29.9 2.7 1.4
Mexico 3.4 15.5 2.0
Nicaragua 9.6 5.7 29.6 23.0 2.4 1.5
Panama 1.0
Paraguay 2.8 3.4 18.3 17.5 0.6 1.1
Peru 8.8 4.5 37.3 28.2 1.9 0.8
Suriname 7.5 10.7 4.9
Uruguay
Venezuela (Bolivarian Republic of ) 4.1 3.7 18.9 15.6 3.8 5.0
Oceania
American Samoa 0.1
Cook Islands 11.8
Fiji 6.9 4.3 9.8 6.1
French Polynesia
Guam
Kiribati 0.5
Marshall Islands
Micronesia (Federated States of)
Nauru
New Caledonia
Niue
Northern Mariana Islands
Palau
Papua New Guinea 18.1 43.9 4.4
Samoa
Solomon Islands 11.5 32.8 4.3
Tokelau
Tonga
Tuvalu 1.6 10.0 3.3
Vanuatu 11.7 25.9 5.9 1.9
Wallis and Futuna Islands
96
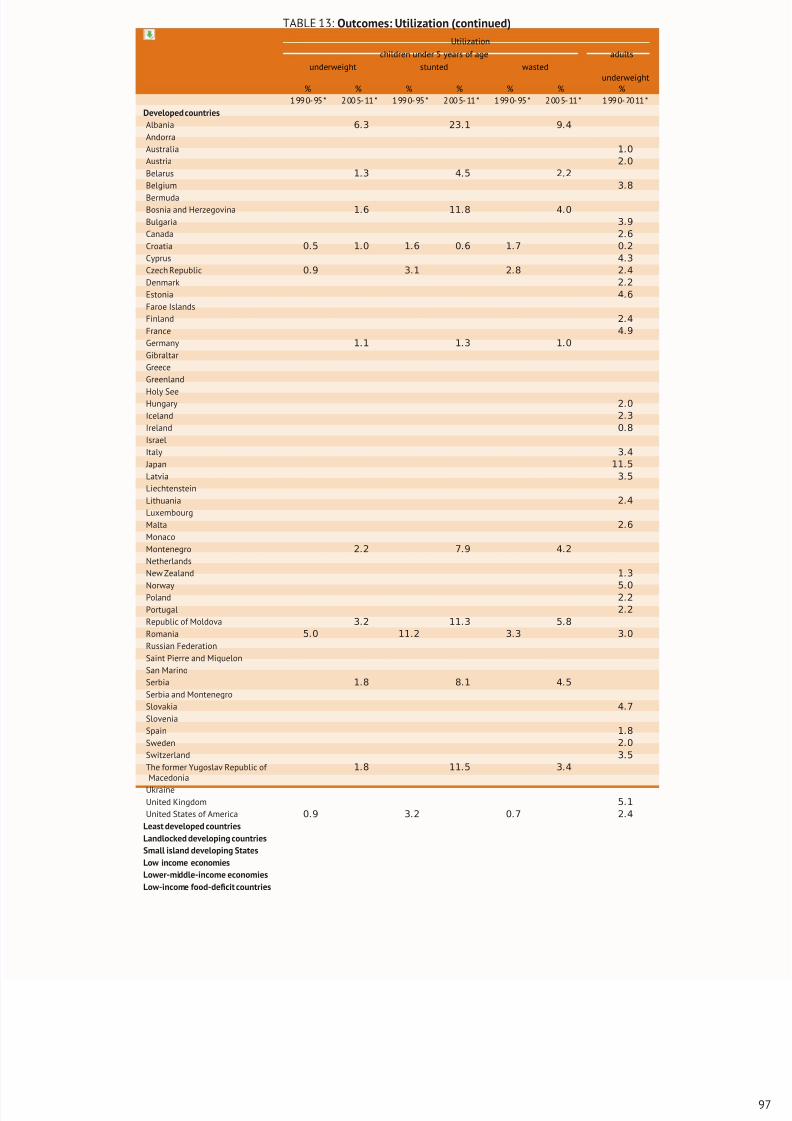
8/16/2019 Informe de la Fao 2013
http://slidepdf.com/reader/full/informe-de-la-fao-2013 115/307
TABLE 13: Outcomes: Utilization (continued)
Utilization
children under 5 years of age adults
underweight stunted wastedunderweight
% % % % % % %1990-95* 2005-11* 1990-95* 2005-11* 1990-95* 2005-11* 1990-2011*
Developed countries
Albania 6.3 23.1 9.4
Andorra
Australia 1.0
Austria 2.0
Belarus 1.3 4.5 2.2
Belgium 3.8
BermudaBosnia and Herzegovina 1.6 11.8 4.0
Bulgaria 3.9
Canada 2.6
Croatia 0.5 1.0 1.6 0.6 1.7 0.2
Cyprus 4.3
Czech Republic 0.9 3.1 2.8 2.4
Denmark 2.2
Estonia 4.6
Faroe Islands
Finland 2.4
France 4.9
Germany 1.1 1.3 1.0
Gibraltar
Greece
Greenland
Holy SeeHungary 2.0
Iceland 2.3
Ireland 0.8
Israel
Italy 3.4
Japan 11.5
Latvia 3.5
Liechtenstein
Lithuania 2.4
Luxembourg
Malta 2.6
Monaco
Montenegro 2.2 7.9 4.2
Netherlands
New Zealand 1.3
Norway 5
.0
Poland 2.2
Portugal 2.2
Republic of Moldova 3.2 11.3 5.8
Romania 5.0 11.2 3.3 3.0
Russian Federation
Saint Pierre and Miquelon
San Marino
Serbia 1.8 8.1 4.5
Serbia and Montenegro
Slovakia 4.7
Slovenia
Spain 1.8
Sweden 2.0
Switzerland 3.5
The former Yugoslav Republic of Macedonia
1.8 11.5 3.4
UkraineUnited Kingdom 5.1
United States of America 0.9 3.2 0.7 2.4
Least developed countries
Landlocked developing countries
Small island developing States
Low income economies
Lower-middle-income economies
Low-income food-deficit countries
97
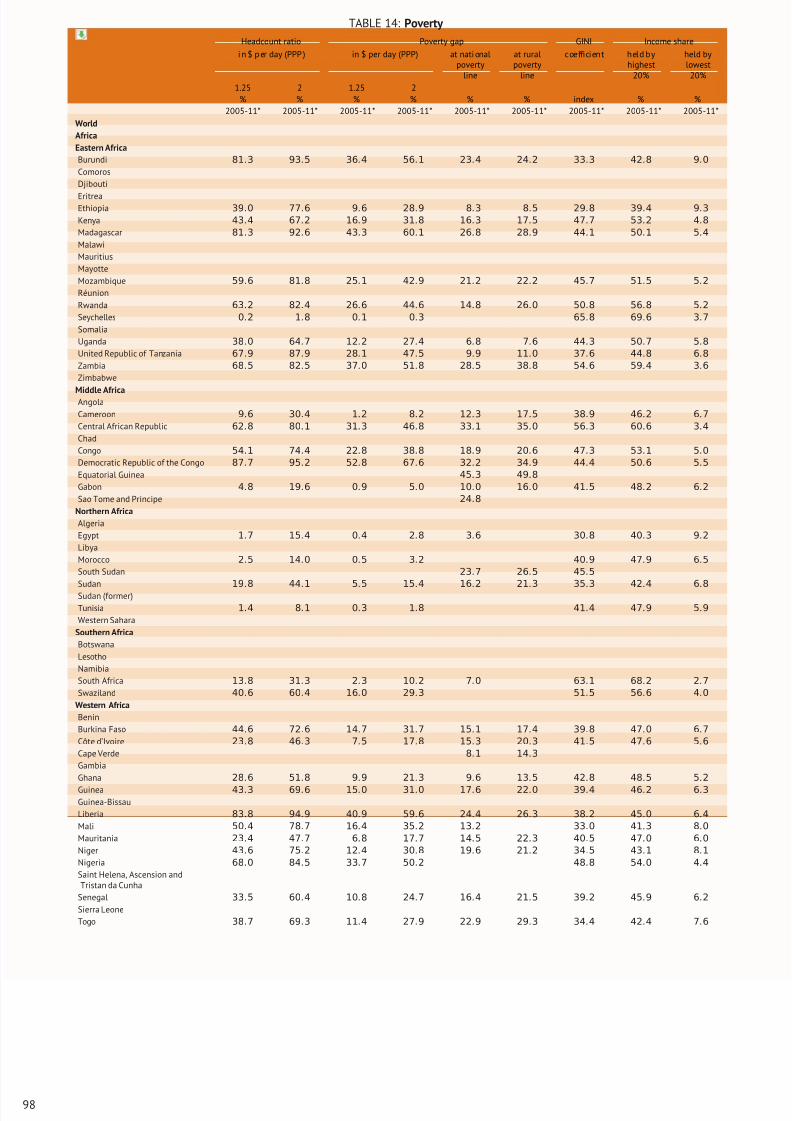
8/16/2019 Informe de la Fao 2013
http://slidepdf.com/reader/full/informe-de-la-fao-2013 116/307
TABLE 14: Poverty
Headcount ratio Poverty gap GINI Income share
i n $ p er day (PPP ) in $ per day (PPP) at nati onalpoverty
line
at ruralpoverty
line
coefficient held byhighest
20%
held bylowest
20%
1.25 2 1.25 2% % % % % % index % %
2005-11* 2005-11* 2005-11* 2005-11* 2005-11* 2005-11* 2005-11* 2005-11* 2005-11*
World
Africa
Eastern Africa
Burundi 81.3 93.5 36.4 56.1 23.4 24.2 33.3 42.8 9.0
Comoros
Djibouti
EritreaEthiopia 39.0 77.6 9.6 28.9 8.3 8.5 29.8 39.4 9.3
Kenya 43.4 67.2 16.9 31.8 16.3 17.5 47.7 53.2 4.8
Madagascar 81.3 92.6 43.3 60.1 26.8 28.9 44.1 50.1 5.4
Malawi
Mauritius
Mayotte
Mozambique 59.6 81.8 25.1 42.9 21.2 22.2 45.7 51.5 5.2
Réunion
Rwanda 63.2 82.4 26.6 44.6 14.8 26.0 50.8 56.8 5.2
Seychelles 0.2 1.8 0.1 0.3 65.8 69.6 3.7
Somalia
Uganda 38.0 64.7 12.2 27.4 6.8 7.6 44.3 50.7 5.8
United Republic of Tanzania 67.9 87.9 28.1 47.5 9.9 11.0 37.6 44.8 6.8
Zambia 68.5 82.5 37.0 51.8 28.5 38.8 54.6 59.4 3.6
Zimbabwe
Middle AfricaAngola
Cameroon 9.6 30.4 1.2 8.2 12.3 17.5 38.9 46.2 6.7
Central African Republic 62.8 80.1 31.3 46.8 33.1 35.0 56.3 60.6 3.4
Chad
Congo 54.1 74.4 22.8 38.8 18.9 20.6 47.3 53.1 5.0
Democratic Republic of the Congo 87.7 95.2 52.8 67.6 32.2 34.9 44.4 50.6 5.5
Equatorial Guinea 45.3 49.8
Gabon 4.8 19.6 0.9 5.0 10.0 16.0 41.5 48.2 6.2
Sao Tome and Principe 24.8
Northern Africa
Algeria
Egypt 1.7 15.4 0.4 2.8 3.6 30.8 40.3 9.2
Libya
Morocco 2.5 14.0 0.5 3.2 40.9 47.9 6.5
South Sudan 23.7 26.5 45.5
Sudan 19.8 44.1 5.5 15.4 16.2 21.3 35.3 42.4 6.8
Sudan (former)
Tunisia 1.4 8.1 0.3 1.8 41.4 47.9 5.9
Western Sahara
Southern Africa
Botswana
Lesotho
Namibia
South Africa 13.8 31.3 2.3 10.2 7.0 63.1 68.2 2.7
Swaziland 40.6 60.4 16.0 29.3 51.5 56.6 4.0
Western Africa
Benin
Burkina Faso 44.6 72.6 14.7 31.7 15.1 17.4 39.8 47.0 6.7
Côte d’Ivoire 23.8 46.3 7.5 17.8 15.3 20.3 41.5 47.6 5.6
Cape Verde 8.1 14.3
Gambia
Ghana 28.6 51.8 9.9 21.3 9.6 13.5 42.8 48.5 5.2
Guinea 43.3 69.6 15.0 31.0 17.6 22.0 39.4 46.2 6.3
Guinea-Bissau
Liberia 83.8 94.9 40.9 59.6 24.4 26.3 38.2 45.0 6.4
Mali 50.4 78.7 16.4 35.2 13.2 33.0 41.3 8.0
Mauritania 23.4 47.7 6.8 17.7 14.5 22.3 40.5 47.0 6.0
Niger 43.6 75.2 12.4 30.8 19.6 21.2 34.5 43.1 8.1
Nigeria 68.0 84.5 33.7 50.2 48.8 54.0 4.4
Saint Helena, Ascension andTristan da Cunha
Senegal 33.5 60.4 10.8 24.7 16.4 21.5 39.2 45.9 6.2
Sierra Leone
Togo 38.7 69.3 11.4 27.9 22.9 29.3 34.4 42.4 7.6
98
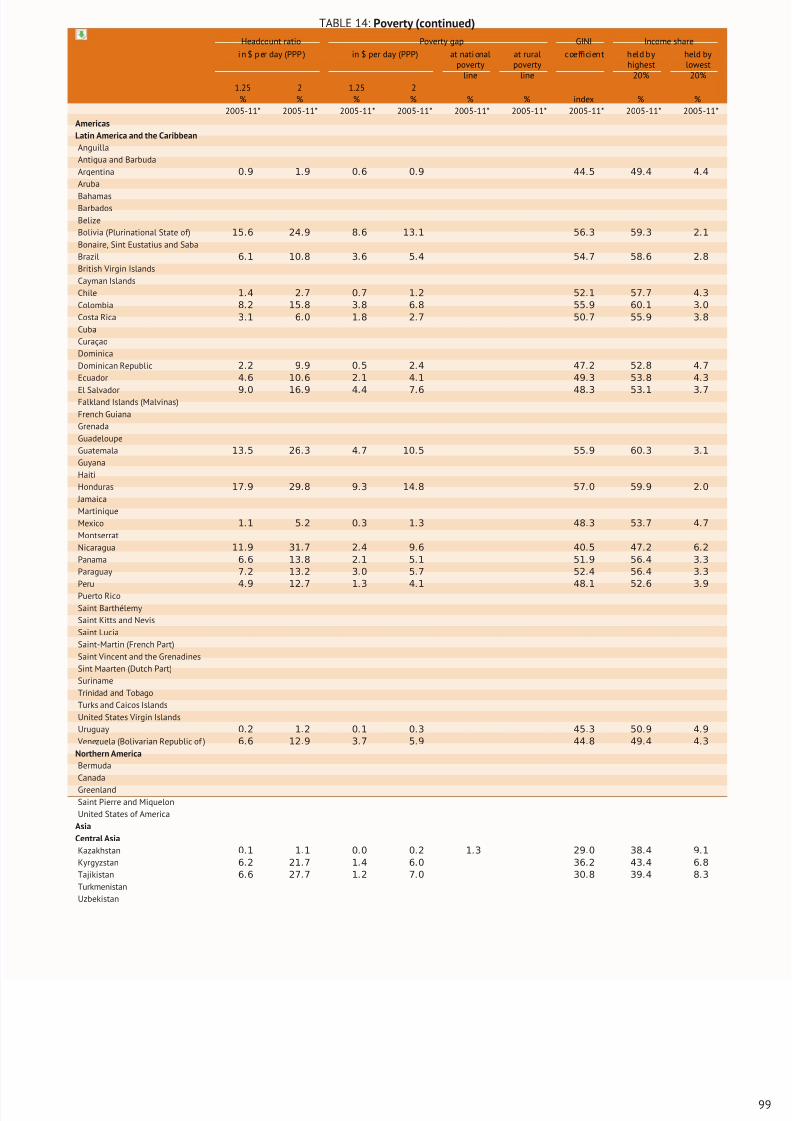
8/16/2019 Informe de la Fao 2013
http://slidepdf.com/reader/full/informe-de-la-fao-2013 117/307
TABLE 14: Poverty (continued)
Headcount ratio Poverty gap GINI Income share
i n $ p er day (PPP ) in $ per day (PPP) at nati onalpoverty
line
at ruralpoverty
line
coefficient held byhighest
20%
held bylowest
20%
1.25 2 1.25 2% % % % % % index % %
2005-11* 2005-11* 2005-11* 2005-11* 2005-11* 2005-11* 2005-11* 2005-11* 2005-11*
Americas
Latin America and the Caribbean
Anguilla
Antigua and Barbuda
Argentina 0.9 1.9 0.6 0.9 44.5 49.4 4.4
Aruba
BahamasBarbados
Belize
Bolivia (Plurinational State of) 15.6 24.9 8.6 13.1 56.3 59.3 2.1
Bonaire, Sint Eustatius and Saba
Brazil 6.1 10.8 3.6 5.4 54.7 58.6 2.8
British Virgin Islands
Cayman Islands
Chile 1.4 2.7 0.7 1.2 52.1 57.7 4.3
Colombia 8.2 15.8 3.8 6.8 55.9 60.1 3.0
Costa Rica 3.1 6.0 1.8 2.7 50.7 55.9 3.8
Cuba
Curaçao
Dominica
Dominican Republic 2.2 9.9 0.5 2.4 47.2 52.8 4.7
Ecuador 4.6 10.6 2.1 4.1 49.3 53.8 4.3
El Salvador 9.0 16.9 4.4 7.6 48.3 53.1 3.7Falkland Islands (Malvinas)
French Guiana
Grenada
Guadeloupe
Guatemala 13.5 26.3 4.7 10.5 55.9 60.3 3.1
Guyana
Haiti
Honduras 17.9 29.8 9.3 14.8 57.0 59.9 2.0
Jamaica
Martinique
Mexico 1.1 5.2 0.3 1.3 48.3 53.7 4.7
Montserrat
Nicaragua 11.9 31.7 2.4 9.6 40.5 47.2 6.2
Panama 6.6 13.8 2.1 5.1 51.9 56.4 3.3
Paraguay 7.2 13.2 3.0 5.7 52.4 56.4 3.3
Peru 4.9 12.7 1.3 4.1 48.1 52.6 3.9
Puerto Rico
Saint Barthélemy
Saint Kitts and Nevis
Saint Lucia
Saint-Martin (French Part)
Saint Vincent and the Grenadines
Sint Maarten (Dutch Part)
Suriname
Trinidad and Tobago
Turks and Caicos Islands
United States Virgin Islands
Uruguay 0.2 1.2 0.1 0.3 45.3 50.9 4.9
Venezuela (Bolivarian Republic of ) 6.6 12.9 3.7 5.9 44.8 49.4 4.3
Northern America
Bermuda
Canada
GreenlandSaint Pierre and Miquelon
United States of America
Asia
Central Asia
Kazakhstan 0.1 1.1 0.0 0.2 1.3 29.0 38.4 9.1
Kyrgyzstan 6.2 21.7 1.4 6.0 36.2 43.4 6.8
Tajikistan 6.6 27.7 1.2 7.0 30.8 39.4 8.3
Turkmenistan
Uzbekistan
99
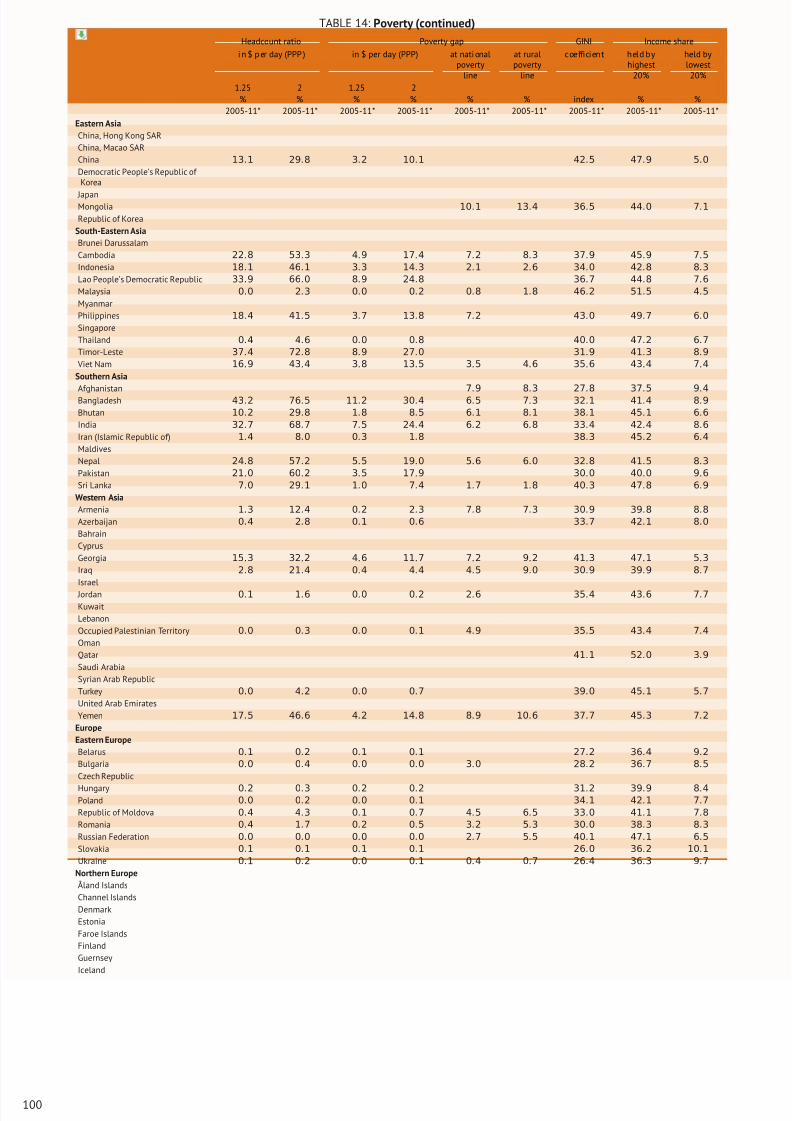
8/16/2019 Informe de la Fao 2013
http://slidepdf.com/reader/full/informe-de-la-fao-2013 118/307
TABLE 14: Poverty (continued)
Headcount ratio Poverty gap GINI Income share
i n $ p er day (PPP ) in $ per day (PPP) at nati onalpoverty
line
at ruralpoverty
line
coefficient held byhighest
20%
held bylowest
20%
1.25 2 1.25 2% % % % % % index % %
2005-11* 2005-11* 2005-11* 2005-11* 2005-11* 2005-11* 2005-11* 2005-11* 2005-11*
Eastern Asia
China, Hong Kong SAR
China, Macao SAR
China 13.1 29.8 3.2 10.1 42.5 47.9 5.0
Democratic People’s Republic of Korea
JapanMongolia 10.1 13.4 36.5 44.0 7.1
Republic of Korea
South-Eastern Asia
Brunei Darussalam
Cambodia 22.8 53.3 4.9 17.4 7.2 8.3 37.9 45.9 7.5
Indonesia 18.1 46.1 3.3 14.3 2.1 2.6 34.0 42.8 8.3
Lao People’s Democratic Republic 33.9 66.0 8.9 24.8 36.7 44.8 7.6
Malaysia 0.0 2.3 0.0 0.2 0.8 1.8 46.2 51.5 4.5
Myanmar
Philippines 18.4 41.5 3.7 13.8 7.2 43.0 49.7 6.0
Singapore
Thailand 0.4 4.6 0.0 0.8 40.0 47.2 6.7
Timor-Leste 37.4 72.8 8.9 27.0 31.9 41.3 8.9
Viet Nam 16.9 43.4 3.8 13.5 3.5 4.6 35.6 43.4 7.4
Southern Asia
Afghanistan 7
.9 8
.3 27
.8 37
.5 9
.4
Bangladesh 43.2 76.5 11.2 30.4 6.5 7.3 32.1 41.4 8.9
Bhutan 10.2 29.8 1.8 8.5 6.1 8.1 38.1 45.1 6.6
India 32.7 68.7 7.5 24.4 6.2 6.8 33.4 42.4 8.6
Iran (Islamic Republic of) 1.4 8.0 0.3 1.8 38.3 45.2 6.4
Maldives
Nepal 24.8 57.2 5.5 19.0 5.6 6.0 32.8 41.5 8.3
Pakistan 21.0 60.2 3.5 17.9 30.0 40.0 9.6
Sri Lanka 7.0 29.1 1.0 7.4 1.7 1.8 40.3 47.8 6.9
Western Asia
Armenia 1.3 12.4 0.2 2.3 7.8 7.3 30.9 39.8 8.8
Azerbaijan 0.4 2.8 0.1 0.6 33.7 42.1 8.0
Bahrain
Cyprus
Georgia 15.3 32.2 4.6 11.7 7.2 9.2 41.3 47.1 5.3
Iraq 2.8 21.4 0.4 4.4 4.5 9.0 30.9 39.9 8.7
Israel
Jordan 0.1 1.6 0.0 0.2 2.6 35.4 43.6 7.7
Kuwait
Lebanon
Occupied Palestinian Territory 0.0 0.3 0.0 0.1 4.9 35.5 43.4 7.4
Oman
Qatar 41.1 52.0 3.9
Saudi Arabia
Syrian Arab Republic
Turkey 0.0 4.2 0.0 0.7 39.0 45.1 5.7
United Arab Emirates
Yemen 17.5 46.6 4.2 14.8 8.9 10.6 37.7 45.3 7.2
Europe
Eastern Europe
Belarus 0.1 0.2 0.1 0.1 27.2 36.4 9.2
Bulgaria 0.0 0.4 0.0 0.0 3.0 28.2 36.7 8.5
Czech Republic
Hungary 0.2 0.3 0.2 0.2 31.2 39.9 8.4
Poland 0.0 0.2 0.0 0.1 34.1 42.1 7.7
Republic of Moldova 0.4 4.3 0.1 0.7 4.5 6.5 33.0 41.1 7.8
Romania 0.4 1.7 0.2 0.5 3.2 5.3 30.0 38.3 8.3
Russian Federation 0.0 0.0 0.0 0.0 2.7 5.5 40.1 47.1 6.5
Slovakia 0.1 0.1 0.1 0.1 26.0 36.2 10.1
Ukraine 0.1 0.2 0.0 0.1 0.4 0.7 26.4 36.3 9.7
Northern Europe
Åland Islands
Channel Islands
Denmark
Estonia
Faroe Islands
Finland
Guernsey
Iceland
100
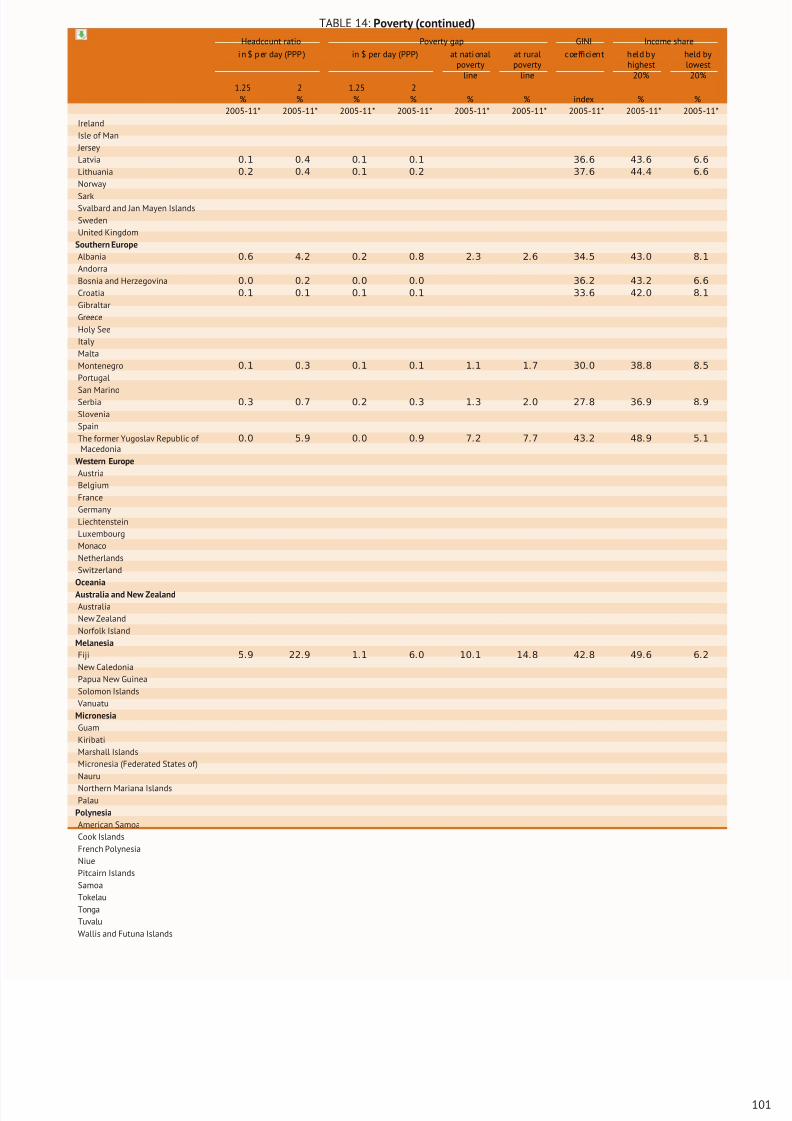
8/16/2019 Informe de la Fao 2013
http://slidepdf.com/reader/full/informe-de-la-fao-2013 119/307
TABLE 14: Poverty (continued)
Headcount ratio Poverty gap GINI Income share
i n $ p er day (PPP ) in $ per day (PPP) at nati onalpoverty
line
at ruralpoverty
line
coefficient held byhighest
20%
held bylowest
20%
1.25 2 1.25 2% % % % % % index % %
2005-11* 2005-11* 2005-11* 2005-11* 2005-11* 2005-11* 2005-11* 2005-11* 2005-11*
Ireland
Isle of Man
Jersey
Latvia 0.1 0.4 0.1 0.1 36.6 43.6 6.6
Lithuania 0.2 0.4 0.1 0.2 37.6 44.4 6.6
Norway
SarkSvalbard and Jan Mayen Islands
Sweden
United Kingdom
Southern Europe
Albania 0.6 4.2 0.2 0.8 2.3 2.6 34.5 43.0 8.1
Andorra
Bosnia and Herzegovina 0.0 0.2 0.0 0.0 36.2 43.2 6.6
Croatia 0.1 0.1 0.1 0.1 33.6 42.0 8.1
Gibraltar
Greece
Holy See
Italy
Malta
Montenegro 0.1 0.3 0.1 0.1 1.1 1.7 30.0 38.8 8.5
Portugal
San MarinoSerbia 0.3 0.7 0.2 0.3 1.3 2.0 27.8 36.9 8.9
Slovenia
Spain
The former Yugoslav Republic of Macedonia
0.0 5.9 0.0 0.9 7.2 7.7 43.2 48.9 5.1
Western Europe
Austria
Belgium
France
Germany
Liechtenstein
Luxembourg
Monaco
Netherlands
Switzerland
Oceania
Australia and New Zealand
Australia
New Zealand
Norfolk Island
Melanesia
Fiji 5.9 22.9 1.1 6.0 10.1 14.8 42.8 49.6 6.2
New Caledonia
Papua New Guinea
Solomon Islands
Vanuatu
Micronesia
Guam
Kiribati
Marshall Islands
Micronesia (Federated States of)
Nauru
Northern Mariana IslandsPalau
Polynesia
American Samoa
Cook Islands
French Polynesia
Niue
Pitcairn Islands
Samoa
Tokelau
Tonga
Tuvalu
Wallis and Futuna Islands
101
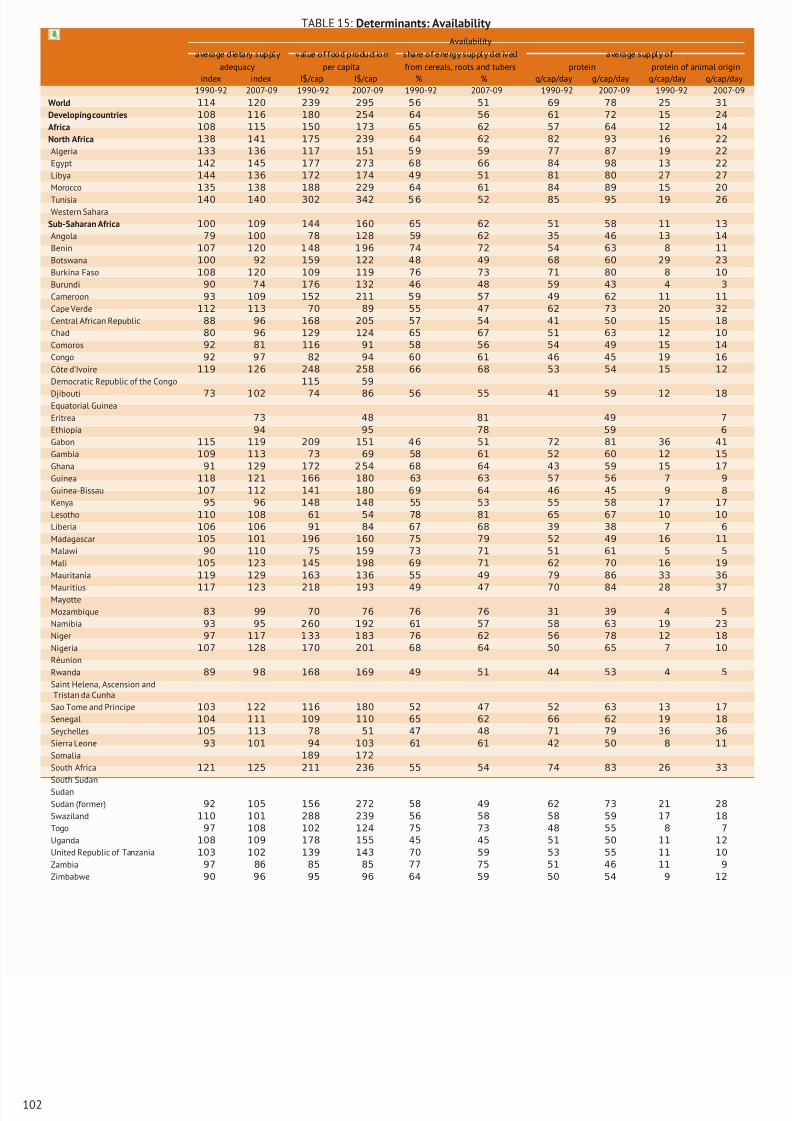
8/16/2019 Informe de la Fao 2013
http://slidepdf.com/reader/full/informe-de-la-fao-2013 120/307
TABLE 15: Determinants: Availability
Availability
average dietary supply value of food production share of energy supply derived average supply of
adequacy per capita from cereals, roots and tubers protein protein of animal originindex index I$/cap I$/cap % % g/cap/day g/cap/day g/cap/day g/cap/day
1990-92 2007-09 1990-92 2007-09 1990-92 2007-09 1990-92 2007-09 1990-92 2007-09
World 114 120 239 295 56 51 69 78 25 31
Developing countries 108 116 180 254 64 56 61 72 15 24
Africa 108 115 150 173 65 62 57 64 12 14
North Africa 138 141 175 239 64 62 82 93 16 22
Algeria 133 136 117 151 5 9 59 77 87 19 22
Egypt 142 145 177 273 68 66 84 98 13 22
Libya 144 136 172 174 49 51 81 80 27 27
Morocco 135 138 188 229 64 61 84 89 15 20
Tunisia 140 140 302 342 5 6 52 85 95 19 26
Western Sahara
Sub-Saharan Africa 100 109 144 160 65 62 51 58 11 13
Angola 79 100 78 128 59 62 35 46 13 14
Benin 107 120 1 48 1 96 74 72 54 63 8 11
Botswana 100 92 159 122 48 49 68 60 29 23
Burkina Faso 108 120 109 119 76 73 71 80 8 10
Burundi 90 7 4 176 132 46 48 59 43 4 3
Cameroon 93 109 152 211 5 9 57 49 62 11 11
Cape Verde 112 113 70 89 55 47 62 73 20 32
Central African Republic 88 96 168 205 57 54 41 50 15 18
Chad 80 96 129 124 65 67 51 63 12 10
Comoros 92 81 116 91 58 56 54 49 15 14
Congo 92 97 82 94 60 61 46 45 19 16
Côte d’Ivoire 119 126 248 258 66 68 53 54 15 12
Democratic Republic of the Congo 115 59
Djibouti 73 102 74 86 56 55 41 59 12 18Equatorial Guinea
Eritrea 73 48 81 49 7
Ethiopia 94 95 78 59 6
Gabon 115 119 209 151 4 6 51 72 81 36 41
Gambia 109 113 73 69 58 61 52 60 12 15
Ghana 91 129 172 2 54 68 64 43 59 15 17
Guinea 118 121 166 180 63 63 57 56 7 9
Guinea-Bissau 107 112 141 180 69 64 46 45 9 8
Kenya 95 96 148 148 55 53 55 58 17 17
Lesotho 110 108 61 54 78 81 65 67 10 10
Liberia 106 106 91 84 67 68 39 38 7 6
Madagascar 105 101 196 160 75 79 52 49 16 11
Malawi 90 110 75 159 73 71 51 61 5 5
Mali 105 123 145 198 69 71 62 70 16 19
Mauritania 119 129 163 136 55 49 79 86 33 36
Mauritius 117 123 218 193 49 47 70 84 28 37Mayotte
Mozambique 83 99 70 76 76 76 31 39 4 5
Namibia 93 95 260 192 61 57 58 63 19 23
Niger 97 117 1 33 1 83 76 62 56 78 12 18
Nigeria 107 128 170 201 68 64 50 65 7 10
Réunion
Rwanda 89 9 8 168 169 49 51 44 53 4 5
Saint Helena, Ascension andTristan da Cunha
Sao Tome and Principe 103 1 22 116 180 52 47 52 63 13 17
Senegal 104 111 109 110 65 62 66 62 19 18
Seychelles 105 113 78 51 47 48 71 79 36 36
Sierra Leone 93 101 94 103 61 61 42 50 8 11
Somalia 189 172
South Africa 121 125 211 236 55 54 74 83 26 33
South Sudan
Sudan
Sudan (former) 92 105 156 272 58 49 62 73 21 28
Swaziland 110 101 288 239 56 58 58 59 17 18
Togo 97 108 102 124 75 73 48 55 8 7
Uganda 108 109 178 155 45 45 51 50 11 12
United Republic of Tanzania 103 102 139 143 70 59 53 55 11 10
Zambia 97 86 85 85 77 75 51 46 11 9
Zimbabwe 90 96 95 96 64 59 50 54 9 12
102
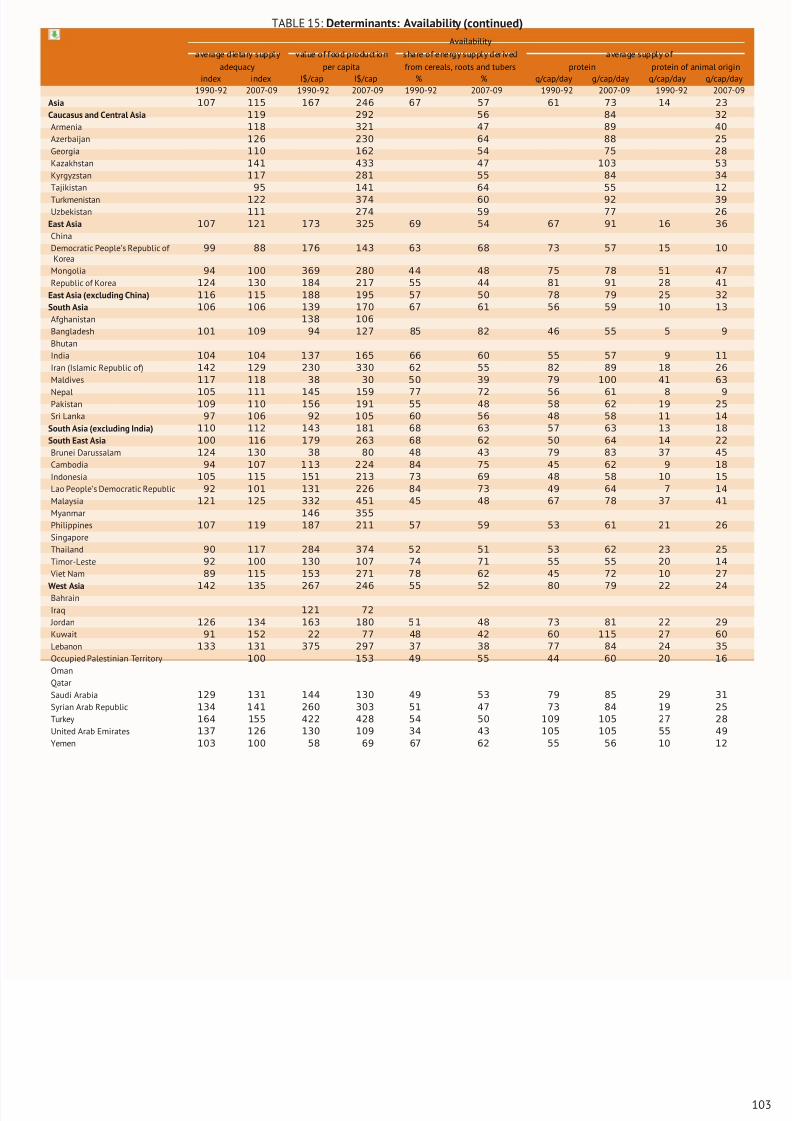
8/16/2019 Informe de la Fao 2013
http://slidepdf.com/reader/full/informe-de-la-fao-2013 121/307
TABLE 15: Determinants: Availability (continued)
Availability
average dietary supply value of food production share of energy supply derived average supply of
adequacy per capita from cereals, roots and tubers protein protein of animal originindex index I$/cap I$/cap % % g/cap/day g/cap/day g/cap/day g/cap/day
1990-92 2007-09 1990-92 2007-09 1990-92 2007-09 1990-92 2007-09 1990-92 2007-09
Asia 107 115 167 246 67 57 61 73 14 23
Caucasus and Central Asia 119 292 56 84 32
Armenia 118 321 47 89 40
Azerbaijan 126 230 64 88 25
Georgia 110 162 54 75 28
Kazakhstan 141 433 47 103 53
Kyrgyzstan 117 281 55 84 34
Tajikistan 95 141 64 55 12
Turkmenistan 122 374 60 92 39
Uzbekistan 111 274 59 77 26
East Asia 107 121 173 325 69 54 67 91 16 36
China
Democratic People’s Republic of Korea
99 88 176 143 63 68 73 57 15 10
Mongolia 94 100 369 280 44 48 75 78 51 47
Republic of Korea 124 130 184 217 55 44 81 91 28 41
East Asia (excluding China) 116 115 188 195 57 50 78 79 25 32
South Asia 106 106 139 170 67 61 56 59 10 13
Afghanistan 138 106
Bangladesh 101 109 94 127 85 82 46 55 5 9
Bhutan
India 104 104 1 37 165 66 60 55 57 9 11
Iran (Islamic Republic of) 142 129 230 330 62 55 82 89 18 26
Maldives 117 118 38 30 50 39 79 100 41 63
Nepal 105 111 145 159 77 72 56 61 8 9Pakistan 109 110 156 191 55 48 58 62 19 25
Sri Lanka 97 106 92 105 60 56 48 58 11 14
South Asia (excluding India) 110 112 143 181 68 63 57 63 13 18
South East Asia 100 116 179 263 68 62 50 64 14 22
Brunei Darussalam 124 130 38 80 48 43 79 83 37 45
Cambodia 94 107 1 13 2 24 84 75 45 62 9 18
Indonesia 105 115 151 213 73 69 48 58 10 15
Lao People’s Democratic Republic 92 101 131 226 84 73 49 64 7 14
Malaysia 121 125 332 451 45 48 67 78 37 41
Myanmar 146 355
Philippines 107 119 187 211 57 59 53 61 21 26
Singapore
Thailand 90 117 284 374 52 51 53 62 23 25
Timor-Leste 92 100 130 107 74 71 55 55 20 14
Viet Nam 89 115 153 271 78 62 45 72 10 27
West Asia 142 135 267 246 55 52 80 79 22 24
Bahrain
Iraq 121 72
Jordan 126 134 163 180 5 1 48 73 81 22 29
Kuwait 91 152 22 77 48 42 60 115 27 60
Lebanon 133 131 375 297 37 38 77 84 24 35
Occupied Palestinian Territory 100 153 49 55 44 60 20 16
Oman
Qatar
Saudi Arabia 129 131 144 130 49 53 79 85 29 31
Syrian Arab Republic 134 141 260 303 51 47 73 84 19 25
Turkey 164 155 422 428 54 50 109 105 27 28
United Arab Emirates 137 126 130 109 34 43 105 105 55 49
Yemen 103 100 58 69 67 62 55 56 10 12
103
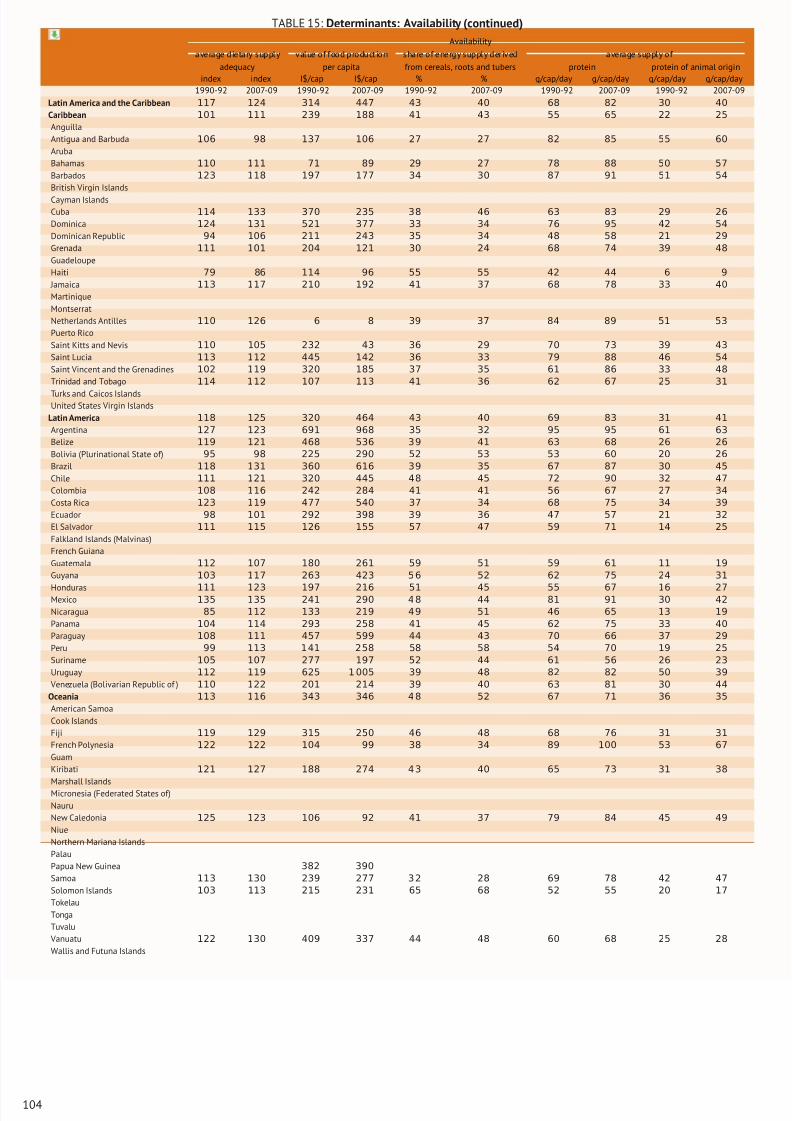
8/16/2019 Informe de la Fao 2013
http://slidepdf.com/reader/full/informe-de-la-fao-2013 122/307
TABLE 15: Determinants: Availability (continued)
Availability
average dietary supply value of food production share of energy supply derived average supply of
adequacy per capita from cereals, roots and tubers protein protein of animal originindex index I$/cap I$/cap % % g/cap/day g/cap/day g/cap/day g/cap/day
1990-92 2007-09 1990-92 2007-09 1990-92 2007-09 1990-92 2007-09 1990-92 2007-09
Latin America and the Caribbean 117 124 314 447 43 40 68 82 30 40
Caribbean 101 111 239 188 41 43 55 65 22 25
Anguilla
Antigua and Barbuda 106 98 137 106 27 27 82 85 55 60
Aruba
Bahamas 110 111 71 89 29 27 78 88 50 57
Barbados 123 118 197 177 34 30 87 91 51 54
British Virgin Islands
Cayman IslandsCuba 114 133 370 235 38 46 63 83 29 26
Dominica 124 131 521 377 33 34 76 95 42 54
Dominican Republic 94 106 211 243 35 34 48 58 21 29
Grenada 111 101 204 121 30 24 68 74 39 48
Guadeloupe
Haiti 79 86 114 96 55 55 42 44 6 9
Jamaica 113 117 210 192 41 37 68 78 33 40
Martinique
Montserrat
Netherlands Antilles 110 126 6 8 39 37 84 89 51 53
Puerto Rico
Saint Kitts and Nevis 110 105 232 43 36 29 70 73 39 43
Saint Lucia 113 112 445 142 36 33 79 88 46 54
Saint Vincent and the Grenadines 102 119 320 185 37 35 61 86 33 48
Trinidad and Tobago 114 112 107 113 41 36 62 67 25 31
Turks and Caicos IslandsUnited States Virgin Islands
Latin America 118 125 320 464 43 40 69 83 31 41
Argentina 127 123 691 968 35 32 95 95 61 63
Belize 119 121 468 536 3 9 41 63 68 26 26
Bolivia (Plurinational State of) 95 98 225 290 52 53 53 60 20 26
Brazil 118 131 360 616 39 35 67 87 30 45
Chile 111 121 320 445 48 45 72 90 32 47
Colombia 108 116 242 284 41 41 56 67 27 34
Costa Rica 123 119 477 540 37 34 68 75 34 39
Ecuador 98 101 292 398 39 36 47 57 21 32
El Salvador 111 115 126 155 57 47 59 71 14 25
Falkland Islands (Malvinas)
French Guiana
Guatemala 112 107 180 261 59 51 59 61 11 19
Guyana 103 117 263 423 5 6 52 62 75 24 31
Honduras 111 123 197 216 51 45 55 67 16 27Mexico 135 135 241 290 4 8 44 81 91 30 42
Nicaragua 85 112 133 219 4 9 51 46 65 13 19
Panama 104 114 293 258 41 45 62 75 33 40
Paraguay 108 111 457 599 44 43 70 66 37 29
Peru 99 113 1 41 258 58 58 54 70 19 25
Suriname 105 107 277 197 52 44 61 56 26 23
Uruguay 112 119 625 1 005 39 48 82 82 50 39
Venezuela (Bolivarian Republic of ) 110 122 201 214 39 40 63 81 30 44
Oceania 113 116 343 346 4 8 52 67 71 36 35
American Samoa
Cook Islands
Fiji 119 129 315 250 46 48 68 76 31 31
French Polynesia 122 122 104 99 38 34 89 100 53 67
Guam
Kiribati 121 127 188 274 4 3 40 65 73 31 38
Marshall IslandsMicronesia (Federated States of)
Nauru
New Caledonia 125 123 106 92 41 37 79 84 45 49
Niue
Northern Mariana Islands
Palau
Papua New Guinea 382 390
Samoa 113 130 239 277 3 2 28 69 78 42 47
Solomon Islands 103 113 215 231 65 68 52 55 20 17
Tokelau
Tonga
Tuvalu
Vanuatu 122 130 409 337 44 48 60 68 25 28
Wallis and Futuna Islands
104
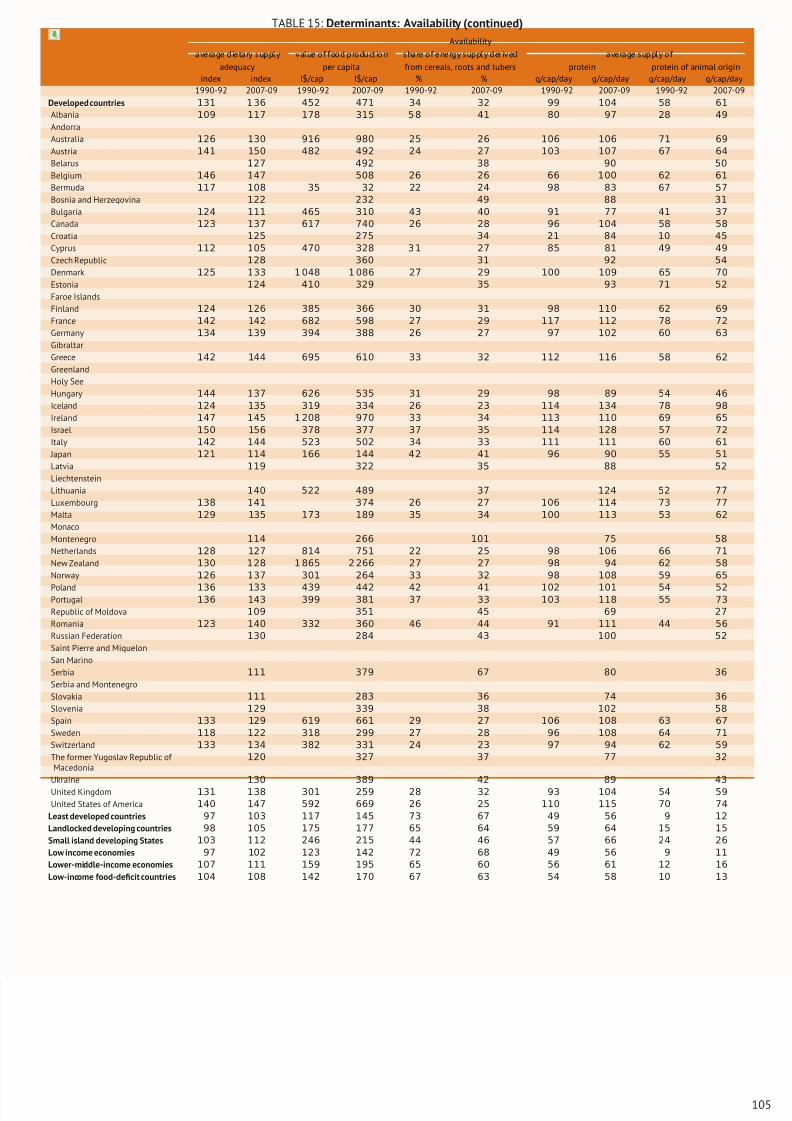
8/16/2019 Informe de la Fao 2013
http://slidepdf.com/reader/full/informe-de-la-fao-2013 123/307
TABLE 15: Determinants: Availability (continued)
Availability
average dietary supply value of food production share of energy supply derived average supply of
adequacy per capita from cereals, roots and tubers protein protein of animal originindex index I$/cap I$/cap % % g/cap/day g/cap/day g/cap/day g/cap/day
1990-92 2007-09 1990-92 2007-09 1990-92 2007-09 1990-92 2007-09 1990-92 2007-09
Developed countries 131 1 36 452 471 34 32 99 104 58 61
Albania 109 117 178 315 5 8 41 80 97 28 49
Andorra
Australia 126 130 916 980 25 26 106 106 71 69
Austria 141 150 482 492 24 27 103 107 67 64
Belarus 127 492 38 90 50
Belgium 146 147 508 26 26 66 100 62 61
Bermuda 117 108 35 32 22 24 98 83 67 57
Bosnia and Herzegovina 122 232 49 88 31
Bulgaria 124 111 465 310 43 40 91 77 41 37
Canada 123 137 617 740 26 28 96 104 58 58
Croatia 125 275 34 21 84 10 45
Cyprus 112 105 470 328 3 1 27 85 81 49 49
Czech Republic 128 360 31 92 54
Denmark 125 133 1 048 1 086 27 29 100 109 65 70
Estonia 124 410 329 35 93 71 52
Faroe Islands
Finland 124 126 385 366 30 31 98 110 62 69
France 142 142 682 598 27 29 117 112 78 72
Germany 134 139 394 388 26 27 97 102 60 63
Gibraltar
Greece 142 144 695 610 33 32 112 116 58 62
Greenland
Holy See
Hungary 144 137 626 535 31 29 98 89 54 46Iceland 124 135 319 334 26 23 114 134 78 98
Ireland 147 145 1 208 970 33 34 113 110 69 65
Israel 150 156 378 377 37 35 114 128 57 72
Italy 142 144 523 502 34 33 111 111 60 61
Japan 121 114 166 144 42 41 96 90 55 51
Latvia 119 322 35 88 52
Liechtenstein
Lithuania 140 522 489 37 124 52 77
Luxembourg 138 141 374 26 27 106 114 73 77
Malta 129 135 173 189 35 34 100 113 53 62
Monaco
Montenegro 114 266 101 75 58
Netherlands 128 127 814 751 22 25 98 106 66 71
New Zealand 130 128 1 865 2 266 27 27 98 94 62 58
Norway 126 137 301 264 33 32 98 108 59 65
Poland 136 133 439 442 42 41 102 101 54 52Portugal 136 143 399 381 37 33 103 118 55 73
Republic of Moldova 109 351 45 69 27
Romania 123 140 332 360 46 44 91 111 44 56
Russian Federation 130 284 43 100 52
Saint Pierre and Miquelon
San Marino
Serbia 111 379 67 80 36
Serbia and Montenegro
Slovakia 111 283 36 74 36
Slovenia 129 339 38 102 58
Spain 133 129 619 661 29 27 106 108 63 67
Sweden 118 122 318 299 27 28 96 108 64 71
Switzerland 133 134 382 331 24 23 97 94 62 59
The former Yugoslav Republic of Macedonia
120 327 37 77 32
Ukraine 130 389 42 89 43
United Kingdom 131 138 301 259 28 32 93 104 54 59
United States of America 140 147 592 669 26 25 110 115 70 74
Least developed countries 97 103 117 145 73 67 49 56 9 12
Landlocked developing countries 98 105 175 177 65 64 59 64 15 15
Small island developing States 103 112 246 215 44 46 57 66 24 26
Low income economies 97 102 123 142 72 68 49 56 9 11
Lower-middle-income economies 107 111 159 195 65 60 56 61 12 16
Low-income food-deficit countries 104 108 142 170 67 63 54 58 10 13
105
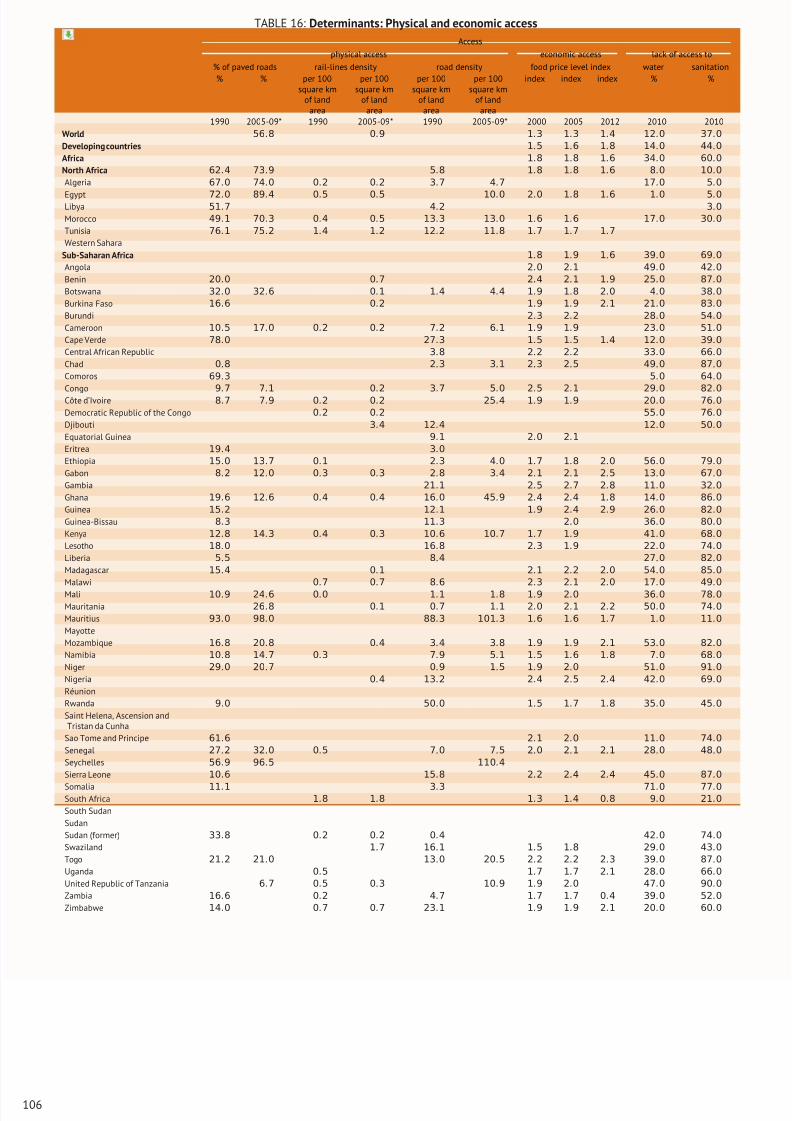
8/16/2019 Informe de la Fao 2013
http://slidepdf.com/reader/full/informe-de-la-fao-2013 124/307
TABLE 16: Determinants: Physical and economic access
Access
physical access economic access lack of access to
% of paved roads rail-lines density road density food price level index water sanitation% % per 100
square kmof land
area
per 100square km
of landarea
per 100square km
of landarea
per 100square km
of landarea
index index index % %
1990 2005-09* 1990 2005-09* 1990 2005-09* 2000 2005 2012 2010 2010
World 56.8 0.9 1.3 1.3 1.4 12.0 37.0
Developing countries 1.5 1.6 1.8 14.0 44.0
Africa 1.8 1.8 1.6 34.0 60.0
North Africa 62.4 73.9 5.8 1.8 1.8 1.6 8.0 10.0
Algeria 67.0 74.0 0.2 0.2 3.7 4.7 17.0 5.0
Egypt 72.0 89.4 0.5 0.5 10.0 2.0 1.8 1.6 1.0 5.0Libya 51.7 4.2 3.0
Morocco 49.1 70.3 0.4 0.5 13.3 13.0 1.6 1.6 17.0 30.0
Tunisia 76.1 75.2 1.4 1.2 12.2 11.8 1.7 1.7 1.7
Western Sahara
Sub-Saharan Africa 1.8 1.9 1.6 39.0 69.0
Angola 2.0 2.1 49.0 42.0
Benin 20.0 0.7 2.4 2.1 1.9 25.0 87.0
Botswana 32.0 32.6 0.1 1.4 4.4 1.9 1.8 2.0 4.0 38.0
Burkina Faso 16.6 0.2 1.9 1.9 2.1 21.0 83.0
Burundi 2.3 2.2 28.0 54.0
Cameroon 10.5 17.0 0.2 0.2 7.2 6.1 1.9 1.9 23.0 51.0
Cape Verde 78.0 27.3 1.5 1.5 1.4 12.0 39.0
Central African Republic 3.8 2.2 2.2 33.0 66.0
Chad 0.8 2.3 3.1 2.3 2.5 49.0 87.0
Comoros 69.3 5.0 64.0
Congo 9
.7 7
.1 0
.2 3
.7 5
.0 2
.5 2
.1 29
.0 82
.0
Côte d’Ivoire 8.7 7.9 0.2 0.2 25.4 1.9 1.9 20.0 76.0
Democratic Republic of the Congo 0.2 0.2 55.0 76.0
Djibouti 3.4 12.4 12.0 50.0
Equatorial Guinea 9.1 2.0 2.1
Eritrea 19.4 3.0
Ethiopia 15.0 13.7 0.1 2.3 4.0 1.7 1.8 2.0 56.0 79.0
Gabon 8.2 12.0 0.3 0.3 2.8 3.4 2.1 2.1 2.5 13.0 67.0
Gambia 21.1 2.5 2.7 2.8 11.0 32.0
Ghana 19.6 12.6 0.4 0.4 16.0 45.9 2.4 2.4 1.8 14.0 86.0
Guinea 15.2 12.1 1.9 2.4 2.9 26.0 82.0
Guinea-Bissau 8.3 11.3 2.0 36.0 80.0
Kenya 12.8 14.3 0.4 0.3 10.6 10.7 1.7 1.9 41.0 68.0
Lesotho 18.0 16.8 2.3 1.9 22.0 74.0
Liberia 5.5 8.4 27.0 82.0
Madagascar 15.4 0.1 2.1 2.2 2.0 54.0 85.0
Malawi 0.7 0.7 8.6 2.3 2.1 2.0 17.0 49.0
Mali 10.9 24.6 0.0 1.1 1.8 1.9 2.0 36.0 78.0
Mauritania 26.8 0.1 0.7 1.1 2.0 2.1 2.2 50.0 74.0
Mauritius 93.0 98.0 88.3 101.3 1.6 1.6 1.7 1.0 11.0
Mayotte
Mozambique 16.8 20.8 0.4 3.4 3.8 1.9 1.9 2.1 53.0 82.0
Namibia 10.8 14.7 0.3 7.9 5.1 1.5 1.6 1.8 7.0 68.0
Niger 29.0 20.7 0.9 1.5 1.9 2.0 51.0 91.0
Nigeria 0.4 13.2 2.4 2.5 2.4 42.0 69.0
Réunion
Rwanda 9.0 50.0 1.5 1.7 1.8 35.0 45.0
Saint Helena, Ascension andTristan da Cunha
Sao Tome and Principe 61.6 2.1 2.0 11.0 74.0
Senegal 27.2 32.0 0.5 7.0 7.5 2.0 2.1 2.1 28.0 48.0
Seychelles 56.9 96.5 110.4
Sierra Leone 10.6 15.8 2.2 2.4 2.4 45.0 87.0
Somalia 11.1 3.3 71.0 77.0South Africa 1.8 1.8 1.3 1.4 0.8 9.0 21.0
South Sudan
Sudan
Sudan (former) 33.8 0.2 0.2 0.4 42.0 74.0
Swaziland 1.7 16.1 1.5 1.8 29.0 43.0
Togo 21.2 21.0 13.0 20.5 2.2 2.2 2.3 39.0 87.0
Uganda 0.5 1.7 1.7 2.1 28.0 66.0
United Republic of Tanzania 6.7 0.5 0.3 10.9 1.9 2.0 47.0 90.0
Zambia 16.6 0.2 4.7 1.7 1.7 0.4 39.0 52.0
Zimbabwe 14.0 0.7 0.7 23.1 1.9 1.9 2.1 20.0 60.0
106
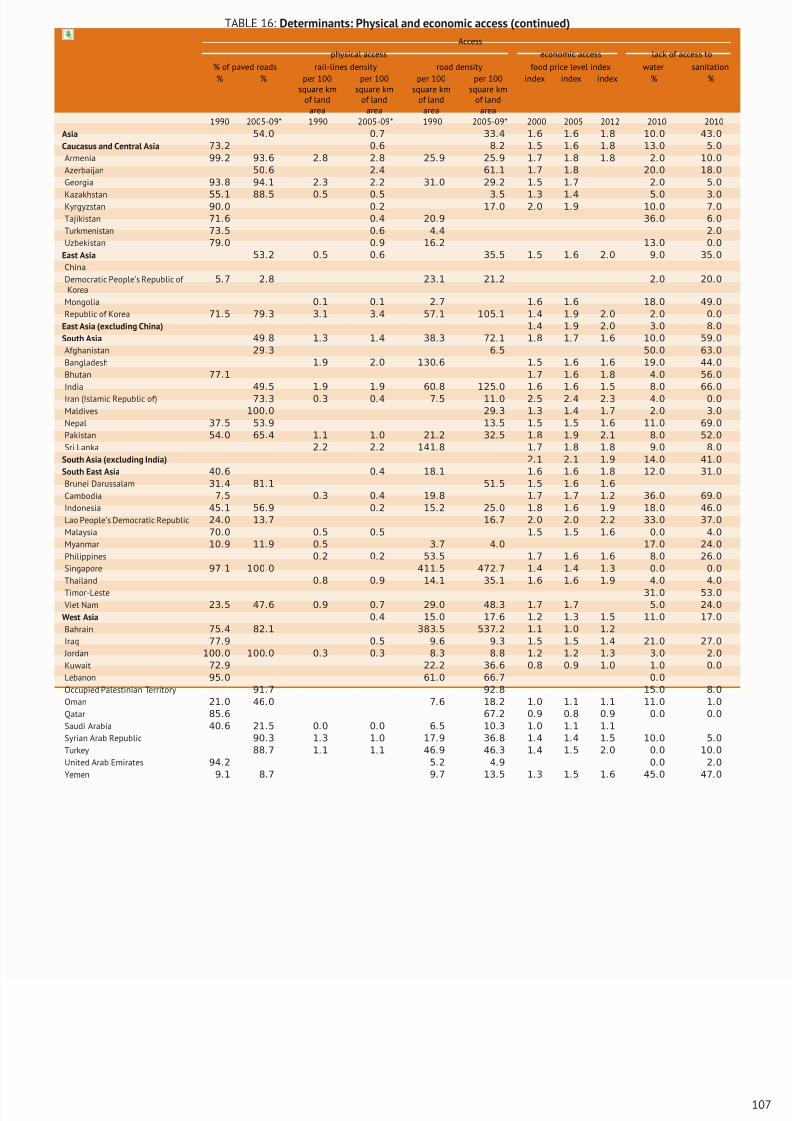
8/16/2019 Informe de la Fao 2013
http://slidepdf.com/reader/full/informe-de-la-fao-2013 125/307
TABLE 16: Determinants: Physical and economic access (continued)
Access
physical access economic access lack of access to
% of paved roads rail-lines density road density food price level index water sanitation% % per 100
square kmof land
area
per 100square km
of landarea
per 100square km
of landarea
per 100square km
of landarea
index index index % %
1990 2005-09* 1990 2005-09* 1990 2005-09* 2000 2005 2012 2010 2010
Asia 54.0 0.7 33.4 1.6 1.6 1.8 10.0 43.0
Caucasus and Central Asia 73.2 0.6 8.2 1.5 1.6 1.8 13.0 5.0
Armenia 99.2 93.6 2.8 2.8 25.9 25.9 1.7 1.8 1.8 2.0 10.0
Azerbaijan 50.6 2.4 61.1 1.7 1.8 20.0 18.0
Georgia 93.8 94.1 2.3 2.2 31.0 29.2 1.5 1.7 2.0 5.0
Kazakhstan 55.1 88.5 0.5 0.5 3.5 1.3 1.4 5.0 3.0Kyrgyzstan 90.0 0.2 17.0 2.0 1.9 10.0 7.0
Tajikistan 71.6 0.4 20.9 36.0 6.0
Turkmenistan 73.5 0.6 4.4 2.0
Uzbekistan 79.0 0.9 16.2 13.0 0.0
East Asia 53.2 0.5 0.6 35.5 1.5 1.6 2.0 9.0 35.0
China
Democratic People’s Republic of Korea
5.7 2.8 23.1 21.2 2.0 20.0
Mongolia 0.1 0.1 2.7 1.6 1.6 18.0 49.0
Republic of Korea 71.5 79.3 3.1 3.4 57.1 105.1 1.4 1.9 2.0 2.0 0.0
East Asia (excluding China) 1.4 1.9 2.0 3.0 8.0
South Asia 49.8 1.3 1.4 38.3 72.1 1.8 1.7 1.6 10.0 59.0
Afghanistan 29.3 6.5 50.0 63.0
Bangladesh 1.9 2.0 130.6 1.5 1.6 1.6 19.0 44.0
Bhutan 77.1 1.7 1.6 1.8 4.0 56.0
India 49.5 1.9 1.9 60.8 125.0 1.6 1.6 1.5 8.0 66.0
Iran (Islamic Republic of) 73.3 0.3 0.4 7.5 11.0 2.5 2.4 2.3 4.0 0.0
Maldives 100.0 29.3 1.3 1.4 1.7 2.0 3.0
Nepal 37.5 53.9 13.5 1.5 1.5 1.6 11.0 69.0
Pakistan 54.0 65.4 1.1 1.0 21.2 32.5 1.8 1.9 2.1 8.0 52.0
Sri Lanka 2.2 2.2 141.8 1.7 1.8 1.8 9.0 8.0
South Asia (excluding India) 2.1 2.1 1.9 14.0 41.0
South East Asia 40.6 0.4 18.1 1.6 1.6 1.8 12.0 31.0
Brunei Darussalam 31.4 81.1 51.5 1.5 1.6 1.6
Cambodia 7.5 0.3 0.4 19.8 1.7 1.7 1.2 36.0 69.0
Indonesia 45.1 56.9 0.2 15.2 25.0 1.8 1.6 1.9 18.0 46.0
Lao People’s Democratic Republic 24.0 13.7 16.7 2.0 2.0 2.2 33.0 37.0
Malaysia 70.0 0.5 0.5 1.5 1.5 1.6 0.0 4.0
Myanmar 10.9 11.9 0.5 3.7 4.0 17.0 24.0
Philippines 0.2 0.2 53.5 1.7 1.6 1.6 8.0 26.0
Singapore 97.1 100.0 411.5 472.7 1.4 1.4 1.3 0.0 0.0
Thailand 0.8 0.9 14.1 35.1 1.6 1.6 1.9 4.0 4.0
Timor-Leste 31.0 53.0
Viet Nam 23.5 47.6 0.9 0.7 29.0 48.3 1.7 1.7 5.0 24.0
West Asia 0.4 15.0 17.6 1.2 1.3 1.5 11.0 17.0
Bahrain 75.4 82.1 383.5 537.2 1.1 1.0 1.2
Iraq 77.9 0.5 9.6 9.3 1.5 1.5 1.4 21.0 27.0
Jordan 100.0 100.0 0.3 0.3 8.3 8.8 1.2 1.2 1.3 3.0 2.0
Kuwait 72.9 22.2 36.6 0.8 0.9 1.0 1.0 0.0
Lebanon 95.0 61.0 66.7 0.0
Occupied Palestinian Territory 91.7 92.8 15.0 8.0
Oman 21.0 46.0 7.6 18.2 1.0 1.1 1.1 11.0 1.0
Qatar 85.6 67.2 0.9 0.8 0.9 0.0 0.0
Saudi Arabia 40.6 21.5 0.0 0.0 6.5 10.3 1.0 1.1 1.1
Syrian Arab Republic 90.3 1.3 1.0 17.9 36.8 1.4 1.4 1.5 10.0 5.0
Turkey 88.7 1.1 1.1 46.9 46.3 1.4 1.5 2.0 0.0 10.0
United Arab Emirates 94.2 5.2 4.9 0.0 2.0
Yemen 9.1 8.7 9.7 13.5 1.3 1.5 1.6 45.0 47.0
107
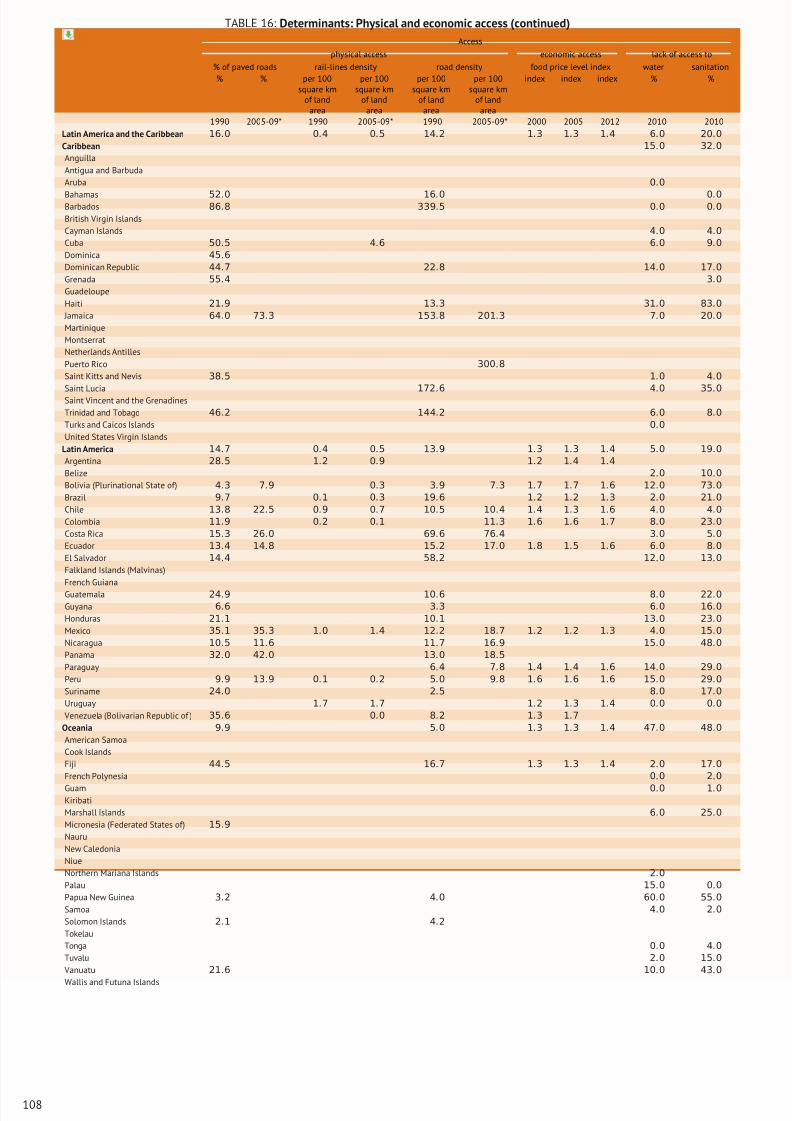
8/16/2019 Informe de la Fao 2013
http://slidepdf.com/reader/full/informe-de-la-fao-2013 126/307
TABLE 16: Determinants: Physical and economic access (continued)
Access
physical access economic access lack of access to
% of paved roads rail-lines density road density food price level index water sanitation% % per 100
square kmof land
area
per 100square km
of landarea
per 100square km
of landarea
per 100square km
of landarea
index index index % %
1990 2005-09* 1990 2005-09* 1990 2005-09* 2000 2005 2012 2010 2010
Latin America and the Caribbean 16.0 0.4 0.5 14.2 1.3 1.3 1.4 6.0 20.0
Caribbean 15.0 32.0
Anguilla
Antigua and Barbuda
Aruba 0.0
Bahamas 52.0 16.0 0.0Barbados 86.8 339.5 0.0 0.0
British Virgin Islands
Cayman Islands 4.0 4.0
Cuba 50.5 4.6 6.0 9.0
Dominica 45.6
Dominican Republic 44.7 22.8 14.0 17.0
Grenada 55.4 3.0
Guadeloupe
Haiti 21.9 13.3 31.0 83.0
Jamaica 64.0 73.3 153.8 201.3 7.0 20.0
Martinique
Montserrat
Netherlands Antilles
Puerto Rico 300.8
Saint Kitts and Nevis 38.5 1.0 4.0
Saint Lucia 172
.6 4
.0 35
.0
Saint Vincent and the Grenadines
Trinidad and Tobago 46.2 144.2 6.0 8.0
Turks and Caicos Islands 0.0
United States Virgin Islands
Latin America 14.7 0.4 0.5 13.9 1.3 1.3 1.4 5.0 19.0
Argentina 28.5 1.2 0.9 1.2 1.4 1.4
Belize 2.0 10.0
Bolivia (Plurinational State of) 4.3 7.9 0.3 3.9 7.3 1.7 1.7 1.6 12.0 73.0
Brazil 9.7 0.1 0.3 19.6 1.2 1.2 1.3 2.0 21.0
Chile 13.8 22.5 0.9 0.7 10.5 10.4 1.4 1.3 1.6 4.0 4.0
Colombia 11.9 0.2 0.1 11.3 1.6 1.6 1.7 8.0 23.0
Costa Rica 15.3 26.0 69.6 76.4 3.0 5.0
Ecuador 13.4 14.8 15.2 17.0 1.8 1.5 1.6 6.0 8.0
El Salvador 14.4 58.2 12.0 13.0
Falkland Islands (Malvinas)
French Guiana
Guatemala 24.9 10.6 8.0 22.0
Guyana 6.6 3.3 6.0 16.0
Honduras 21.1 10.1 13.0 23.0
Mexico 35.1 35.3 1.0 1.4 12.2 18.7 1.2 1.2 1.3 4.0 15.0
Nicaragua 10.5 11.6 11.7 16.9 15.0 48.0
Panama 32.0 42.0 13.0 18.5
Paraguay 6.4 7.8 1.4 1.4 1.6 14.0 29.0
Peru 9.9 13.9 0.1 0.2 5.0 9.8 1.6 1.6 1.6 15.0 29.0
Suriname 24.0 2.5 8.0 17.0
Uruguay 1.7 1.7 1.2 1.3 1.4 0.0 0.0
Venezuela (Bolivarian Republic of ) 35.6 0.0 8.2 1.3 1.7
Oceania 9.9 5.0 1.3 1.3 1.4 47.0 48.0
American Samoa
Cook Islands
Fiji 44.5 16.7 1.3 1.3 1.4 2.0 17.0
French Polynesia 0.0 2.0
Guam 0.0 1.0
Kiribati
Marshall Islands 6.0 25.0
Micronesia (Federated States of) 15.9
Nauru
New Caledonia
Niue
Northern Mariana Islands 2.0
Palau 15.0 0.0
Papua New Guinea 3.2 4.0 60.0 55.0
Samoa 4.0 2.0
Solomon Islands 2.1 4.2
Tokelau
Tonga 0.0 4.0
Tuvalu 2.0 15.0
Vanuatu 21.6 10.0 43.0
Wallis and Futuna Islands
108
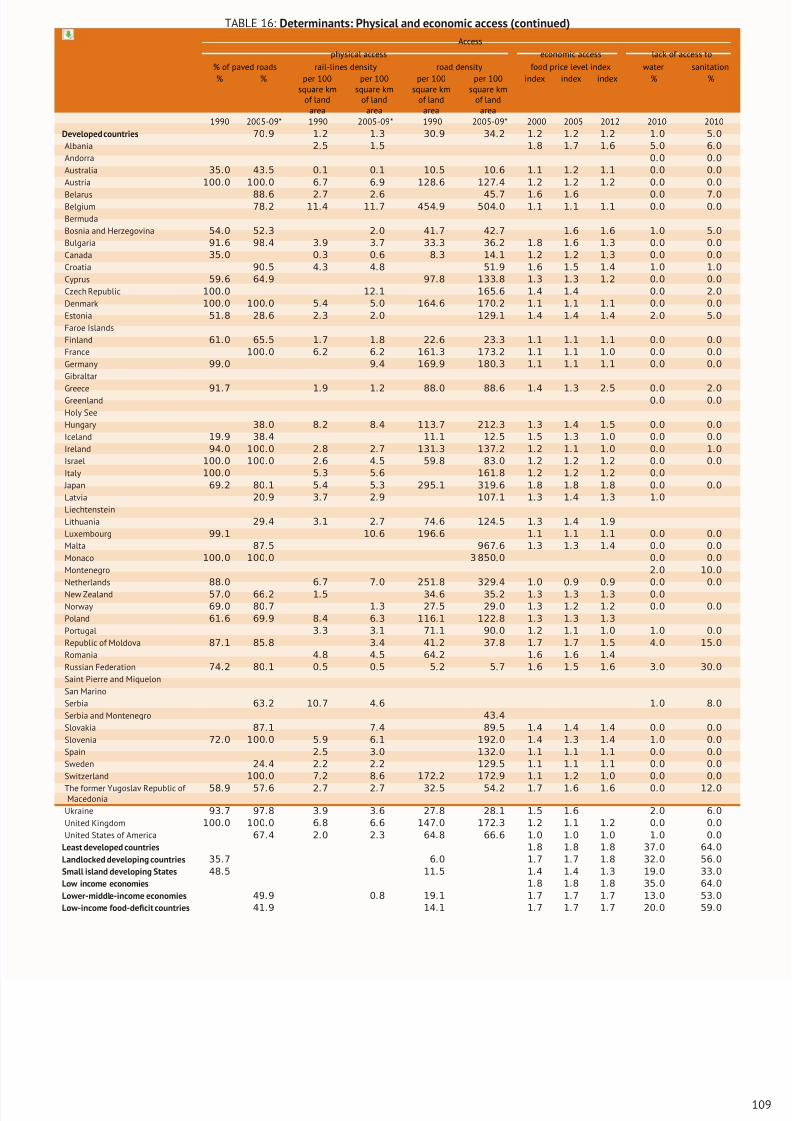
8/16/2019 Informe de la Fao 2013
http://slidepdf.com/reader/full/informe-de-la-fao-2013 127/307
TABLE 16: Determinants: Physical and economic access (continued)
Access
physical access economic access lack of access to
% of paved roads rail-lines density road density food price level index water sanitation% % per 100
square kmof land
area
per 100square km
of landarea
per 100square km
of landarea
per 100square km
of landarea
index index index % %
1990 2005-09* 1990 2005-09* 1990 2005-09* 2000 2005 2012 2010 2010
Developed countries 70.9 1.2 1.3 30.9 34.2 1.2 1.2 1.2 1.0 5.0
Albania 2.5 1.5 1.8 1.7 1.6 5.0 6.0
Andorra 0.0 0.0
Australia 35.0 43.5 0.1 0.1 10.5 10.6 1.1 1.2 1.1 0.0 0.0
Austria 100.0 100.0 6.7 6.9 128.6 127.4 1.2 1.2 1.2 0.0 0.0
Belarus 88.6 2.7 2.6 45.7 1.6 1.6 0.0 7.0Belgium 78.2 11.4 11.7 454.9 504.0 1.1 1.1 1.1 0.0 0.0
Bermuda
Bosnia and Herzegovina 54.0 52.3 2.0 41.7 42.7 1.6 1.6 1.0 5.0
Bulgaria 91.6 98.4 3.9 3.7 33.3 36.2 1.8 1.6 1.3 0.0 0.0
Canada 35.0 0.3 0.6 8.3 14.1 1.2 1.2 1.3 0.0 0.0
Croatia 90.5 4.3 4.8 51.9 1.6 1.5 1.4 1.0 1.0
Cyprus 59.6 64.9 97.8 133.8 1.3 1.3 1.2 0.0 0.0
Czech Republic 100.0 12.1 165.6 1.4 1.4 0.0 2.0
Denmark 100.0 100.0 5.4 5.0 164.6 170.2 1.1 1.1 1.1 0.0 0.0
Estonia 51.8 28.6 2.3 2.0 129.1 1.4 1.4 1.4 2.0 5.0
Faroe Islands
Finland 61.0 65.5 1.7 1.8 22.6 23.3 1.1 1.1 1.1 0.0 0.0
France 100.0 6.2 6.2 161.3 173.2 1.1 1.1 1.0 0.0 0.0
Germany 99.0 9.4 169.9 180.3 1.1 1.1 1.1 0.0 0.0
Gibraltar
Greece 91
.7 1
.9 1
.2 88
.0 88
.6 1
.4 1
.3 2
.5 0
.0 2
.0
Greenland 0.0 0.0
Holy See
Hungary 38.0 8.2 8.4 113.7 212.3 1.3 1.4 1.5 0.0 0.0
Iceland 19.9 38.4 11.1 12.5 1.5 1.3 1.0 0.0 0.0
Ireland 94.0 100.0 2.8 2.7 131.3 137.2 1.2 1.1 1.0 0.0 1.0
Israel 100.0 100.0 2.6 4.5 59.8 83.0 1.2 1.2 1.2 0.0 0.0
Italy 100.0 5.3 5.6 161.8 1.2 1.2 1.2 0.0
Japan 69.2 80.1 5.4 5.3 295.1 319.6 1.8 1.8 1.8 0.0 0.0
Latvia 20.9 3.7 2.9 107.1 1.3 1.4 1.3 1.0
Liechtenstein
Lithuania 29.4 3.1 2.7 74.6 124.5 1.3 1.4 1.9
Luxembourg 99.1 10.6 196.6 1.1 1.1 1.1 0.0 0.0
Malta 87.5 967.6 1.3 1.3 1.4 0.0 0.0
Monaco 100.0 100.0 3 850.0 0.0 0.0
Montenegro 2.0 10.0
Netherlands 88.0 6.7 7.0 251.8 329.4 1.0 0.9 0.9 0.0 0.0
New Zealand 57.0 66.2 1.5 34.6 35.2 1.3 1.3 1.3 0.0
Norway 69.0 80.7 1.3 27.5 29.0 1.3 1.2 1.2 0.0 0.0
Poland 61.6 69.9 8.4 6.3 116.1 122.8 1.3 1.3 1.3
Portugal 3.3 3.1 71.1 90.0 1.2 1.1 1.0 1.0 0.0
Republic of Moldova 87.1 85.8 3.4 41.2 37.8 1.7 1.7 1.5 4.0 15.0
Romania 4.8 4.5 64.2 1.6 1.6 1.4
Russian Federation 74.2 80.1 0.5 0.5 5.2 5.7 1.6 1.5 1.6 3.0 30.0
Saint Pierre and Miquelon
San Marino
Serbia 63.2 10.7 4.6 1.0 8.0
Serbia and Montenegro 43.4
Slovakia 87.1 7.4 89.5 1.4 1.4 1.4 0.0 0.0
Slovenia 72.0 100.0 5.9 6.1 192.0 1.4 1.3 1.4 1.0 0.0
Spain 2.5 3.0 132.0 1.1 1.1 1.1 0.0 0.0
Sweden 24.4 2.2 2.2 129.5 1.1 1.1 1.1 0.0 0.0
Switzerland 100.0 7.2 8.6 172.2 172.9 1.1 1.2 1.0 0.0 0.0
The former Yugoslav Republic of Macedonia
58.9 57.6 2.7 2.7 32.5 54.2 1.7 1.6 1.6 0.0 12.0
Ukraine 93.7 97.8 3.9 3.6 27.8 28.1 1.5 1.6 2.0 6.0
United Kingdom 100.0 100.0 6.8 6.6 147.0 172.3 1.2 1.1 1.2 0.0 0.0
United States of America 67.4 2.0 2.3 64.8 66.6 1.0 1.0 1.0 1.0 0.0
Least developed countries 1.8 1.8 1.8 37.0 64.0
Landlocked developing countries 35.7 6.0 1.7 1.7 1.8 32.0 56.0
Small island developing States 48.5 11.5 1.4 1.4 1.3 19.0 33.0
Low income economies 1.8 1.8 1.8 35.0 64.0
Lower-middle-income economies 49.9 0.8 19.1 1.7 1.7 1.7 13.0 53.0
Low-income food-deficit countries 41.9 14.1 1.7 1.7 1.7 20.0 59.0
109
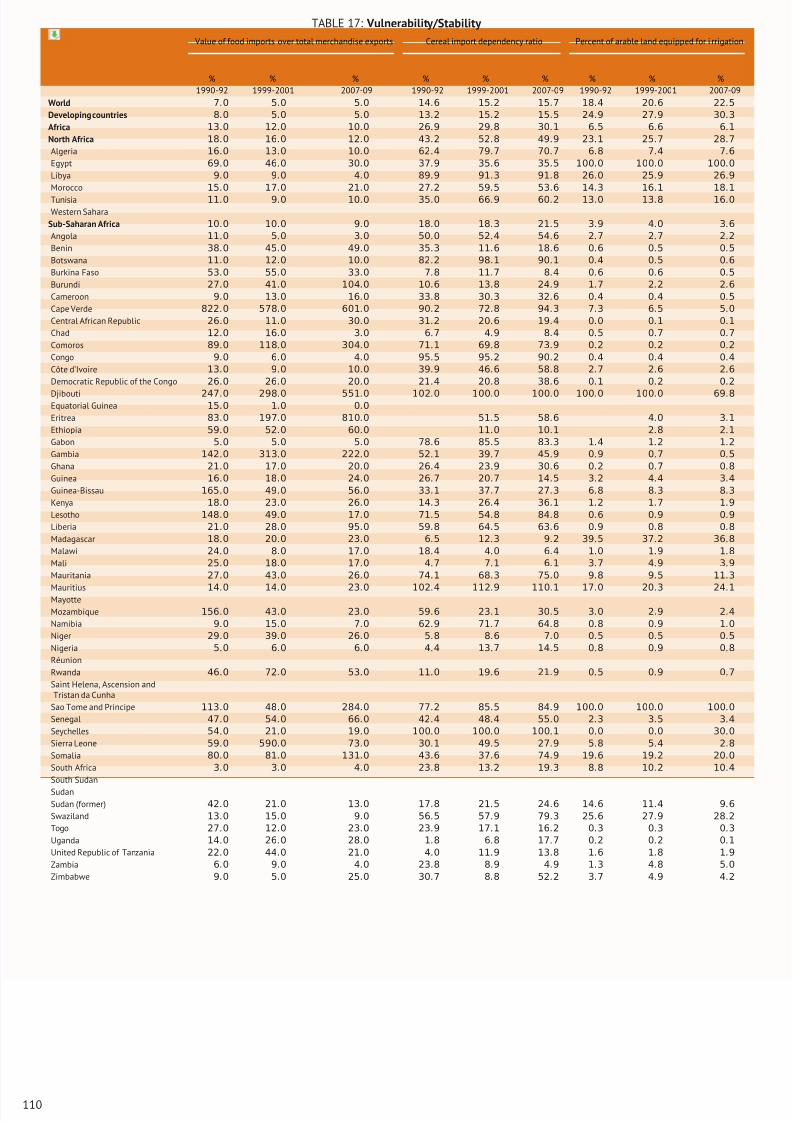
8/16/2019 Informe de la Fao 2013
http://slidepdf.com/reader/full/informe-de-la-fao-2013 128/307
TABLE 17: Vulnerability/Stability
Value of food imports over total merchandise exports Cereal import dependency ratio Percent of arable land equipped for i rrigation
% % % % % % % % %1990-92 1999-2001 2007-09 1990-92 1999-2001 2007-09 1990-92 1999-2001 2007-09
World 7.0 5.0 5.0 14.6 15.2 15.7 18.4 20.6 22.5
Developing countries 8.0 5.0 5.0 13.2 15.2 15.5 24.9 27.9 30.3
Africa 13.0 12.0 10.0 26.9 29.8 30.1 6.5 6.6 6.1
North Africa 18.0 16.0 12.0 43.2 52.8 49.9 23.1 25.7 28.7
Algeria 16.0 13.0 10.0 62.4 79.7 70.7 6.8 7.4 7.6
Egypt 69.0 46.0 30.0 37.9 35.6 35.5 100.0 100.0 100.0
Libya 9.0 9.0 4.0 89.9 91.3 91.8 26.0 25.9 26.9
Morocco 15.0 17.0 21.0 27.2 59.5 53.6 14.3 16.1 18.1
Tunisia 11.0 9.0 10.0 35.0 66.9 60.2 13.0 13.8 16.0
Western Sahara
Sub-Saharan Africa 10.0 10.0 9.0 18.0 18.3 21.5 3.9 4.0 3.6
Angola 11.0 5.0 3.0 50.0 52.4 54.6 2.7 2.7 2.2
Benin 38.0 45.0 49.0 35.3 11.6 18.6 0.6 0.5 0.5
Botswana 11.0 12.0 10.0 82.2 98.1 90.1 0.4 0.5 0.6
Burkina Faso 53.0 55.0 33.0 7.8 11.7 8.4 0.6 0.6 0.5
Burundi 27.0 41.0 104.0 10.6 13.8 24.9 1.7 2.2 2.6
Cameroon 9.0 13.0 16.0 33.8 30.3 32.6 0.4 0.4 0.5
Cape Verde 822.0 578.0 601.0 90.2 72.8 94.3 7.3 6.5 5.0
Central African Republic 26.0 11.0 30.0 31.2 20.6 19.4 0.0 0.1 0.1
Chad 12.0 16.0 3.0 6.7 4.9 8.4 0.5 0.7 0.7
Comoros 89.0 118.0 304.0 71.1 69.8 73.9 0.2 0.2 0.2
Congo 9.0 6.0 4.0 95.5 95.2 90.2 0.4 0.4 0.4
Côte d’Ivoire 13.0 9.0 10.0 39.9 46.6 58.8 2.7 2.6 2.6
Democratic Republic of the Congo 26.0 26.0 20.0 21.4 20.8 38.6 0.1 0.2 0.2
Djibouti 247.0 298.0 551.0 102.0 100.0 100.0 100.0 100.0 69.8Equatorial Guinea 15.0 1.0 0.0
Eritrea 83.0 197.0 810.0 51.5 58.6 4.0 3.1
Ethiopia 59.0 52.0 60.0 11.0 10.1 2.8 2.1
Gabon 5.0 5.0 5.0 78.6 85.5 83.3 1.4 1.2 1.2
Gambia 142.0 313.0 222.0 52.1 39.7 45.9 0.9 0.7 0.5
Ghana 21.0 17.0 20.0 26.4 23.9 30.6 0.2 0.7 0.8
Guinea 16.0 18.0 24.0 26.7 20.7 14.5 3.2 4.4 3.4
Guinea-Bissau 165.0 49.0 56.0 33.1 37.7 27.3 6.8 8.3 8.3
Kenya 18.0 23.0 26.0 14.3 26.4 36.1 1.2 1.7 1.9
Lesotho 148.0 49.0 17.0 71.5 54.8 84.8 0.6 0.9 0.9
Liberia 21.0 28.0 95.0 59.8 64.5 63.6 0.9 0.8 0.8
Madagascar 18.0 20.0 23.0 6.5 12.3 9.2 39.5 37.2 36.8
Malawi 24.0 8.0 17.0 18.4 4.0 6.4 1.0 1.9 1.8
Mali 25.0 18.0 17.0 4.7 7.1 6.1 3.7 4.9 3.9
Mauritania 27.0 43.0 26.0 74.1 68.3 75.0 9.8 9.5 11.3
Mauritius 14.0 14.0 23.0 102.4 112.9 110.1 17.0 20.3 24.1Mayotte
Mozambique 156.0 43.0 23.0 59.6 23.1 30.5 3.0 2.9 2.4
Namibia 9.0 15.0 7.0 62.9 71.7 64.8 0.8 0.9 1.0
Niger 29.0 39.0 26.0 5.8 8.6 7.0 0.5 0.5 0.5
Nigeria 5.0 6.0 6.0 4.4 13.7 14.5 0.8 0.9 0.8
Réunion
Rwanda 46.0 72.0 53.0 11.0 19.6 21.9 0.5 0.9 0.7
Saint Helena, Ascension andTristan da Cunha
Sao Tome and Principe 113.0 48.0 284.0 77.2 85.5 84.9 100.0 100.0 100.0
Senegal 47.0 54.0 66.0 42.4 48.4 55.0 2.3 3.5 3.4
Seychelles 54.0 21.0 19.0 100.0 100.0 100.1 0.0 0.0 30.0
Sierra Leone 59.0 590.0 73.0 30.1 49.5 27.9 5.8 5.4 2.8
Somalia 80.0 81.0 131.0 43.6 37.6 74.9 19.6 19.2 20.0
South Africa 3.0 3.0 4.0 23.8 13.2 19.3 8.8 10.2 10.4
South Sudan
Sudan
Sudan (former) 42.0 21.0 13.0 17.8 21.5 24.6 14.6 11.4 9.6
Swaziland 13.0 15.0 9.0 56.5 57.9 79.3 25.6 27.9 28.2
Togo 27.0 12.0 23.0 23.9 17.1 16.2 0.3 0.3 0.3
Uganda 14.0 26.0 28.0 1.8 6.8 17.7 0.2 0.2 0.1
United Republic of Tanzania 22.0 44.0 21.0 4.0 11.9 13.8 1.6 1.8 1.9
Zambia 6.0 9.0 4.0 23.8 8.9 4.9 1.3 4.8 5.0
Zimbabwe 9.0 5.0 25.0 30.7 8.8 52.2 3.7 4.9 4.2
110
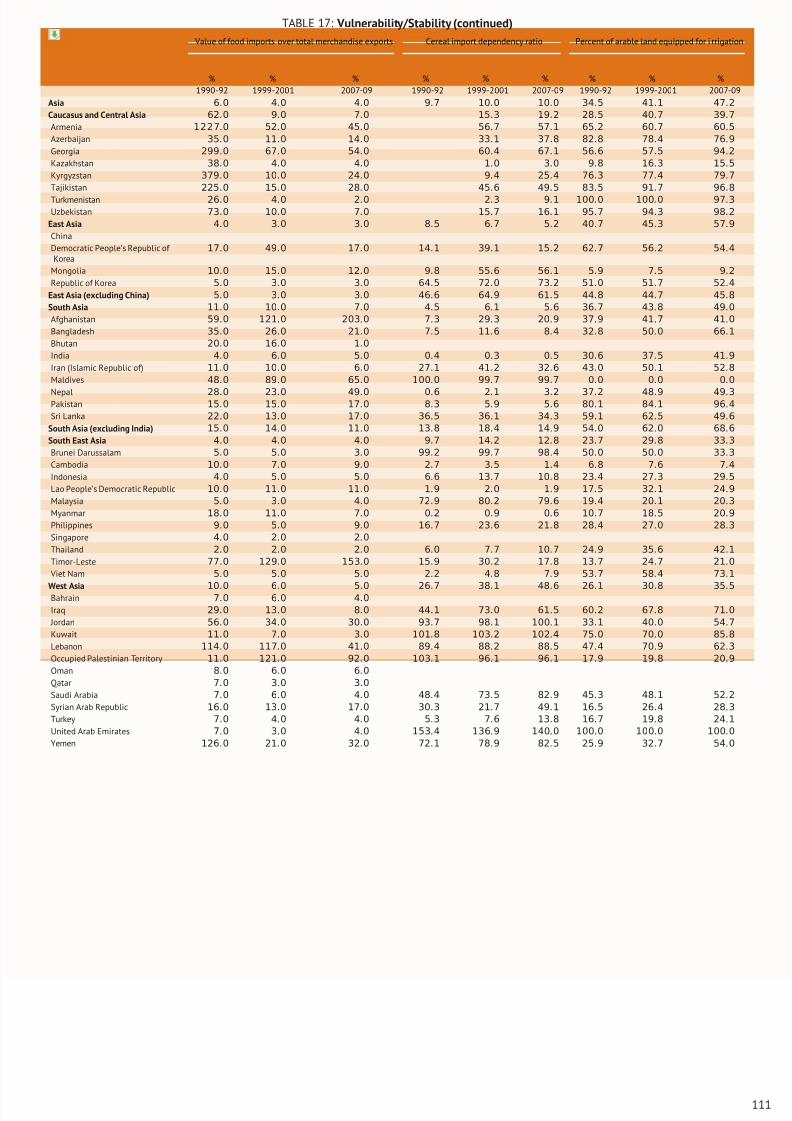
8/16/2019 Informe de la Fao 2013
http://slidepdf.com/reader/full/informe-de-la-fao-2013 129/307
TABLE 17: Vulnerability/Stability (continued)
Value of food imports over total merchandise exports Cereal import dependency ratio Percent of arable land equipped for i rrigation
% % % % % % % % %1990-92 1999-2001 2007-09 1990-92 1999-2001 2007-09 1990-92 1999-2001 2007-09
Asia 6.0 4.0 4.0 9.7 10.0 10.0 34.5 41.1 47.2
Caucasus and Central Asia 62.0 9.0 7.0 15.3 19.2 28.5 40.7 39.7
Armenia 1227.0 52.0 45.0 56.7 57.1 65.2 60.7 60.5
Azerbaijan 35.0 11.0 14.0 33.1 37.8 82.8 78.4 76.9
Georgia 299.0 67.0 54.0 60.4 67.1 56.6 57.5 94.2
Kazakhstan 38.0 4.0 4.0 1.0 3.0 9.8 16.3 15.5
Kyrgyzstan 379.0 10.0 24.0 9.4 25.4 76.3 77.4 79.7
Tajikistan 225.0 15.0 28.0 45.6 49.5 83.5 91.7 96.8
Turkmenistan 26.0 4.0 2.0 2.3 9.1 100.0 100.0 97.3
Uzbekistan 73.0 10.0 7.0 15.7 16.1 95.7 94.3 98.2
East Asia 4.0 3.0 3.0 8.5 6.7 5.2 40.7 45.3 57.9
China
Democratic People’s Republic of Korea
17.0 49.0 17.0 14.1 39.1 15.2 62.7 56.2 54.4
Mongolia 10.0 15.0 12.0 9.8 55.6 56.1 5.9 7.5 9.2
Republic of Korea 5.0 3.0 3.0 64.5 72.0 73.2 51.0 51.7 52.4
East Asia (excluding China) 5.0 3.0 3.0 46.6 64.9 61.5 44.8 44.7 45.8
South Asia 11.0 10.0 7.0 4.5 6.1 5.6 36.7 43.8 49.0
Afghanistan 59.0 121.0 203.0 7.3 29.3 20.9 37.9 41.7 41.0
Bangladesh 35.0 26.0 21.0 7.5 11.6 8.4 32.8 50.0 66.1
Bhutan 20.0 16.0 1.0
India 4.0 6.0 5.0 0.4 0.3 0.5 30.6 37.5 41.9
Iran (Islamic Republic of) 11.0 10.0 6.0 27.1 41.2 32.6 43.0 50.1 52.8
Maldives 48.0 89.0 65.0 100.0 99.7 99.7 0.0 0.0 0.0
Nepal 28.0 23.0 49.0 0.6 2.1 3.2 37.2 48.9 49.3Pakistan 15.0 15.0 17.0 8.3 5.9 5.6 80.1 84.1 96.4
Sri Lanka 22.0 13.0 17.0 36.5 36.1 34.3 59.1 62.5 49.6
South Asia (excluding India) 15.0 14.0 11.0 13.8 18.4 14.9 54.0 62.0 68.6
South East Asia 4.0 4.0 4.0 9.7 14.2 12.8 23.7 29.8 33.3
Brunei Darussalam 5.0 5.0 3.0 99.2 99.7 98.4 50.0 50.0 33.3
Cambodia 10.0 7.0 9.0 2.7 3.5 1.4 6.8 7.6 7.4
Indonesia 4.0 5.0 5.0 6.6 13.7 10.8 23.4 27.3 29.5
Lao People’s Democratic Republic 10.0 11.0 11.0 1.9 2.0 1.9 17.5 32.1 24.9
Malaysia 5.0 3.0 4.0 72.9 80.2 79.6 19.4 20.1 20.3
Myanmar 18.0 11.0 7.0 0.2 0.9 0.6 10.7 18.5 20.9
Philippines 9.0 5.0 9.0 16.7 23.6 21.8 28.4 27.0 28.3
Singapore 4.0 2.0 2.0
Thailand 2.0 2.0 2.0 6.0 7.7 10.7 24.9 35.6 42.1
Timor-Leste 77.0 129.0 153.0 15.9 30.2 17.8 13.7 24.7 21.0
Viet Nam 5.0 5.0 5.0 2.2 4.8 7.9 53.7 58.4 73.1
West Asia 10
.0 6
.0 5
.0 26
.7 38
.1 48
.6 26
.1 30
.8 35
.5
Bahrain 7.0 6.0 4.0
Iraq 29.0 13.0 8.0 44.1 73.0 61.5 60.2 67.8 71.0
Jordan 56.0 34.0 30.0 93.7 98.1 100.1 33.1 40.0 54.7
Kuwait 11.0 7.0 3.0 101.8 103.2 102.4 75.0 70.0 85.8
Lebanon 114.0 117.0 41.0 89.4 88.2 88.5 47.4 70.9 62.3
Occupied Palestinian Territory 11.0 121.0 92.0 103.1 96.1 96.1 17.9 19.8 20.9
Oman 8.0 6.0 6.0
Qatar 7.0 3.0 3.0
Saudi Arabia 7.0 6.0 4.0 48.4 73.5 82.9 45.3 48.1 52.2
Syrian Arab Republic 16.0 13.0 17.0 30.3 21.7 49.1 16.5 26.4 28.3
Turkey 7.0 4.0 4.0 5.3 7.6 13.8 16.7 19.8 24.1
United Arab Emirates 7.0 3.0 4.0 153.4 136.9 140.0 100.0 100.0 100.0
Yemen 126.0 21.0 32.0 72.1 78.9 82.5 25.9 32.7 54.0
111
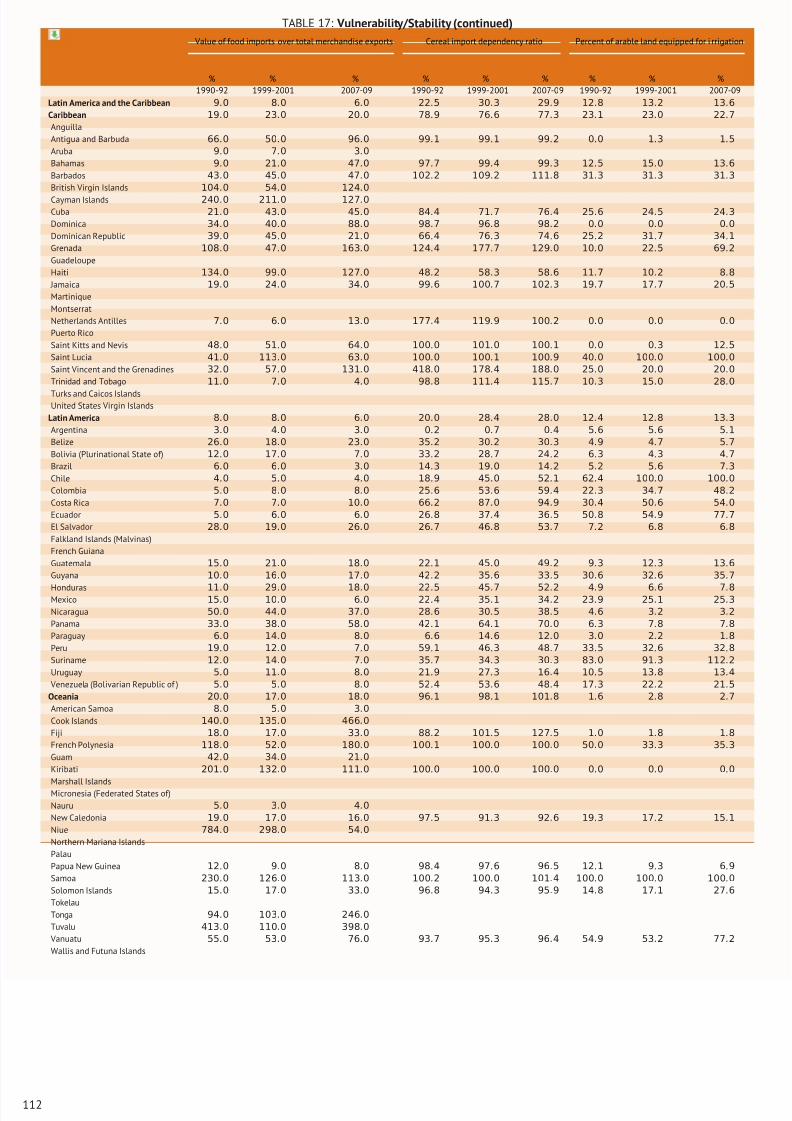
8/16/2019 Informe de la Fao 2013
http://slidepdf.com/reader/full/informe-de-la-fao-2013 130/307
TABLE 17: Vulnerability/Stability (continued)
Value of food imports over total merchandise exports Cereal import dependency ratio Percent of arable land equipped for i rrigation
% % % % % % % % %1990-92 1999-2001 2007-09 1990-92 1999-2001 2007-09 1990-92 1999-2001 2007-09
Latin America and the Caribbean 9.0 8.0 6.0 22.5 30.3 29.9 12.8 13.2 13.6
Caribbean 19.0 23.0 20.0 78.9 76.6 77.3 23.1 23.0 22.7
Anguilla
Antigua and Barbuda 66.0 50.0 96.0 99.1 99.1 99.2 0.0 1.3 1.5
Aruba 9.0 7.0 3.0
Bahamas 9.0 21.0 47.0 97.7 99.4 99.3 12.5 15.0 13.6
Barbados 43.0 45.0 47.0 102.2 109.2 111.8 31.3 31.3 31.3
British Virgin Islands 104.0 54.0 124.0
Cayman Islands 240.0 211.0 127.0
Cuba 21.0 43.0 45.0 84.4 71.7 76.4 25.6 24.5 24.3
Dominica 34.0 40.0 88.0 98.7 96.8 98.2 0.0 0.0 0.0
Dominican Republic 39.0 45.0 21.0 66.4 76.3 74.6 25.2 31.7 34.1
Grenada 108.0 47.0 163.0 124.4 177.7 129.0 10.0 22.5 69.2
Guadeloupe
Haiti 134.0 99.0 127.0 48.2 58.3 58.6 11.7 10.2 8.8
Jamaica 19.0 24.0 34.0 99.6 100.7 102.3 19.7 17.7 20.5
Martinique
Montserrat
Netherlands Antilles 7.0 6.0 13.0 177.4 119.9 100.2 0.0 0.0 0.0
Puerto Rico
Saint Kitts and Nevis 48.0 51.0 64.0 100.0 101.0 100.1 0.0 0.3 12.5
Saint Lucia 41.0 113.0 63.0 100.0 100.1 100.9 40.0 100.0 100.0
Saint Vincent and the Grenadines 32.0 57.0 131.0 418.0 178.4 188.0 25.0 20.0 20.0
Trinidad and Tobago 11.0 7.0 4.0 98.8 111.4 115.7 10.3 15.0 28.0
Turks and Caicos IslandsUnited States Virgin Islands
Latin America 8.0 8.0 6.0 20.0 28.4 28.0 12.4 12.8 13.3
Argentina 3.0 4.0 3.0 0.2 0.7 0.4 5.6 5.6 5.1
Belize 26.0 18.0 23.0 35.2 30.2 30.3 4.9 4.7 5.7
Bolivia (Plurinational State of) 12.0 17.0 7.0 33.2 28.7 24.2 6.3 4.3 4.7
Brazil 6.0 6.0 3.0 14.3 19.0 14.2 5.2 5.6 7.3
Chile 4.0 5.0 4.0 18.9 45.0 52.1 62.4 100.0 100.0
Colombia 5.0 8.0 8.0 25.6 53.6 59.4 22.3 34.7 48.2
Costa Rica 7.0 7.0 10.0 66.2 87.0 94.9 30.4 50.6 54.0
Ecuador 5.0 6.0 6.0 26.8 37.4 36.5 50.8 54.9 77.7
El Salvador 28.0 19.0 26.0 26.7 46.8 53.7 7.2 6.8 6.8
Falkland Islands (Malvinas)
French Guiana
Guatemala 15.0 21.0 18.0 22.1 45.0 49.2 9.3 12.3 13.6
Guyana 10.0 16.0 17.0 42.2 35.6 33.5 30.6 32.6 35.7
Honduras 11.0 29.0 18.0 22.5 45.7 52.2 4.9 6.6 7.8Mexico 15.0 10.0 6.0 22.4 35.1 34.2 23.9 25.1 25.3
Nicaragua 50.0 44.0 37.0 28.6 30.5 38.5 4.6 3.2 3.2
Panama 33.0 38.0 58.0 42.1 64.1 70.0 6.3 7.8 7.8
Paraguay 6.0 14.0 8.0 6.6 14.6 12.0 3.0 2.2 1.8
Peru 19.0 12.0 7.0 59.1 46.3 48.7 33.5 32.6 32.8
Suriname 12.0 14.0 7.0 35.7 34.3 30.3 83.0 91.3 112.2
Uruguay 5.0 11.0 8.0 21.9 27.3 16.4 10.5 13.8 13.4
Venezuela (Bolivarian Republic of ) 5.0 5.0 8.0 52.4 53.6 48.4 17.3 22.2 21.5
Oceania 20.0 17.0 18.0 96.1 98.1 101.8 1.6 2.8 2.7
American Samoa 8.0 5.0 3.0
Cook Islands 140.0 135.0 466.0
Fiji 18.0 17.0 33.0 88.2 101.5 127.5 1.0 1.8 1.8
French Polynesia 118.0 52.0 180.0 100.1 100.0 100.0 50.0 33.3 35.3
Guam 42.0 34.0 21.0
Kiribati 201.0 132.0 111.0 100.0 100.0 100.0 0.0 0.0 0.0
Marshall IslandsMicronesia (Federated States of)
Nauru 5.0 3.0 4.0
New Caledonia 19.0 17.0 16.0 97.5 91.3 92.6 19.3 17.2 15.1
Niue 784.0 298.0 54.0
Northern Mariana Islands
Palau
Papua New Guinea 12.0 9.0 8.0 98.4 97.6 96.5 12.1 9.3 6.9
Samoa 230.0 126.0 113.0 100.2 100.0 101.4 100.0 100.0 100.0
Solomon Islands 15.0 17.0 33.0 96.8 94.3 95.9 14.8 17.1 27.6
Tokelau
Tonga 94.0 103.0 246.0
Tuvalu 413.0 110.0 398.0
Vanuatu 55.0 53.0 76.0 93.7 95.3 96.4 54.9 53.2 77.2
Wallis and Futuna Islands
112
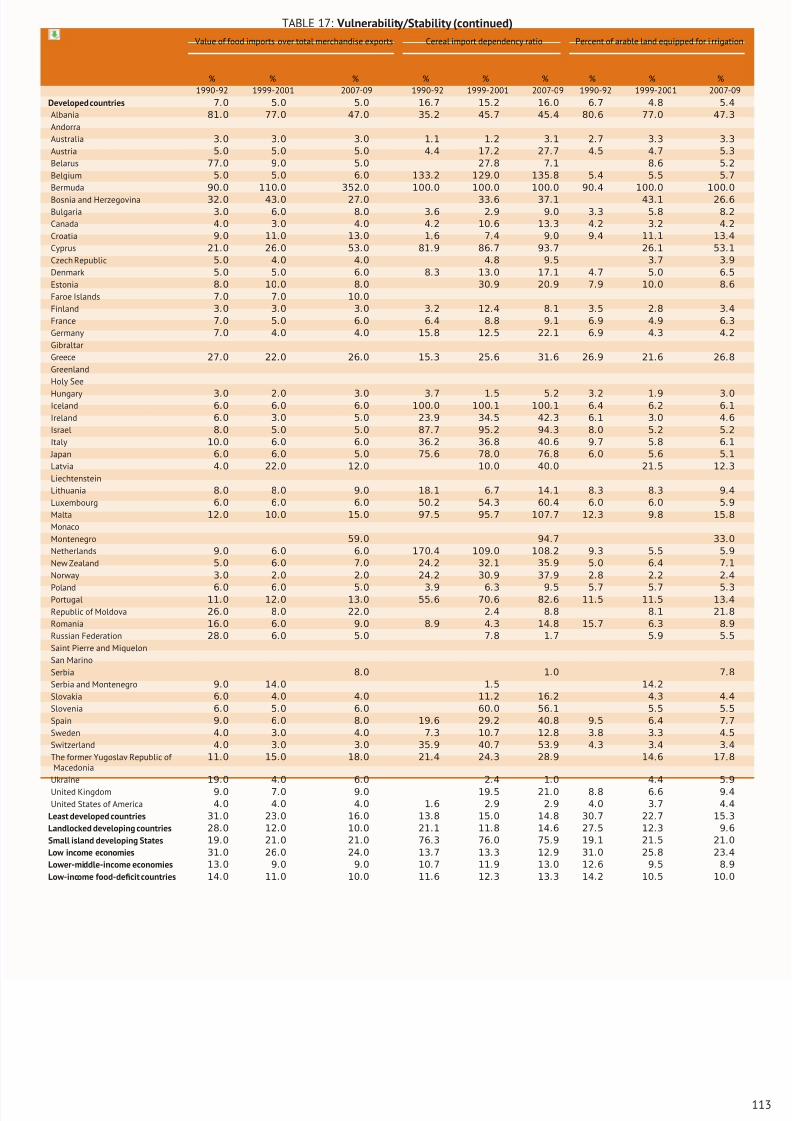
8/16/2019 Informe de la Fao 2013
http://slidepdf.com/reader/full/informe-de-la-fao-2013 131/307
TABLE 17: Vulnerability/Stability (continued)
Value of food imports over total merchandise exports Cereal import dependency ratio Percent of arable land equipped for i rrigation
% % % % % % % % %1990-92 1999-2001 2007-09 1990-92 1999-2001 2007-09 1990-92 1999-2001 2007-09
Developed countries 7.0 5.0 5.0 16.7 15.2 16.0 6.7 4.8 5.4
Albania 81.0 77.0 47.0 35.2 45.7 45.4 80.6 77.0 47.3
Andorra
Australia 3.0 3.0 3.0 1.1 1.2 3.1 2.7 3.3 3.3
Austria 5.0 5.0 5.0 4.4 17.2 27.7 4.5 4.7 5.3
Belarus 77.0 9.0 5.0 27.8 7.1 8.6 5.2
Belgium 5.0 5.0 6.0 133.2 129.0 135.8 5.4 5.5 5.7
Bermuda 90.0 110.0 352.0 100.0 100.0 100.0 90.4 100.0 100.0
Bosnia and Herzegovina 32.0 43.0 27.0 33.6 37.1 43.1 26.6
Bulgaria 3.0 6.0 8.0 3.6 2.9 9.0 3.3 5.8 8.2
Canada 4.0 3.0 4.0 4.2 10.6 13.3 4.2 3.2 4.2
Croatia 9.0 11.0 13.0 1.6 7.4 9.0 9.4 11.1 13.4
Cyprus 21.0 26.0 53.0 81.9 86.7 93.7 26.1 53.1
Czech Republic 5.0 4.0 4.0 4.8 9.5 3.7 3.9
Denmark 5.0 5.0 6.0 8.3 13.0 17.1 4.7 5.0 6.5
Estonia 8.0 10.0 8.0 30.9 20.9 7.9 10.0 8.6
Faroe Islands 7.0 7.0 10.0
Finland 3.0 3.0 3.0 3.2 12.4 8.1 3.5 2.8 3.4
France 7.0 5.0 6.0 6.4 8.8 9.1 6.9 4.9 6.3
Germany 7.0 4.0 4.0 15.8 12.5 22.1 6.9 4.3 4.2
Gibraltar
Greece 27.0 22.0 26.0 15.3 25.6 31.6 26.9 21.6 26.8
Greenland
Holy See
Hungary 3.0 2.0 3.0 3.7 1.5 5.2 3.2 1.9 3.0Iceland 6.0 6.0 6.0 100.0 100.1 100.1 6.4 6.2 6.1
Ireland 6.0 3.0 5.0 23.9 34.5 42.3 6.1 3.0 4.6
Israel 8.0 5.0 5.0 87.7 95.2 94.3 8.0 5.2 5.2
Italy 10.0 6.0 6.0 36.2 36.8 40.6 9.7 5.8 6.1
Japan 6.0 6.0 5.0 75.6 78.0 76.8 6.0 5.6 5.1
Latvia 4.0 22.0 12.0 10.0 40.0 21.5 12.3
Liechtenstein
Lithuania 8.0 8.0 9.0 18.1 6.7 14.1 8.3 8.3 9.4
Luxembourg 6.0 6.0 6.0 50.2 54.3 60.4 6.0 6.0 5.9
Malta 12.0 10.0 15.0 97.5 95.7 107.7 12.3 9.8 15.8
Monaco
Montenegro 59.0 94.7 33.0
Netherlands 9.0 6.0 6.0 170.4 109.0 108.2 9.3 5.5 5.9
New Zealand 5.0 6.0 7.0 24.2 32.1 35.9 5.0 6.4 7.1
Norway 3.0 2.0 2.0 24.2 30.9 37.9 2.8 2.2 2.4
Poland 6.0 6.0 5.0 3.9 6.3 9.5 5.7 5.7 5.3Portugal 11.0 12.0 13.0 55.6 70.6 82.6 11.5 11.5 13.4
Republic of Moldova 26.0 8.0 22.0 2.4 8.8 8.1 21.8
Romania 16.0 6.0 9.0 8.9 4.3 14.8 15.7 6.3 8.9
Russian Federation 28.0 6.0 5.0 7.8 1.7 5.9 5.5
Saint Pierre and Miquelon
San Marino
Serbia 8.0 1.0 7.8
Serbia and Montenegro 9.0 14.0 1.5 14.2
Slovakia 6.0 4.0 4.0 11.2 16.2 4.3 4.4
Slovenia 6.0 5.0 6.0 60.0 56.1 5.5 5.5
Spain 9.0 6.0 8.0 19.6 29.2 40.8 9.5 6.4 7.7
Sweden 4.0 3.0 4.0 7.3 10.7 12.8 3.8 3.3 4.5
Switzerland 4.0 3.0 3.0 35.9 40.7 53.9 4.3 3.4 3.4
The former Yugoslav Republic of Macedonia
11.0 15.0 18.0 21.4 24.3 28.9 14.6 17.8
Ukraine 19.0 4.0 6.0 2.4 1.0 4.4 5.9
United Kingdom 9.0 7.0 9.0 19.5 21.0 8.8 6.6 9.4
United States of America 4.0 4.0 4.0 1.6 2.9 2.9 4.0 3.7 4.4
Least developed countries 31.0 23.0 16.0 13.8 15.0 14.8 30.7 22.7 15.3
Landlocked developing countries 28.0 12.0 10.0 21.1 11.8 14.6 27.5 12.3 9.6
Small island developing States 19.0 21.0 21.0 76.3 76.0 75.9 19.1 21.5 21.0
Low income economies 31.0 26.0 24.0 13.7 13.3 12.9 31.0 25.8 23.4
Lower-middle-income economies 13.0 9.0 9.0 10.7 11.9 13.0 12.6 9.5 8.9
Low-income food-deficit countries 14.0 11.0 10.0 11.6 12.3 13.3 14.2 10.5 10.0
113
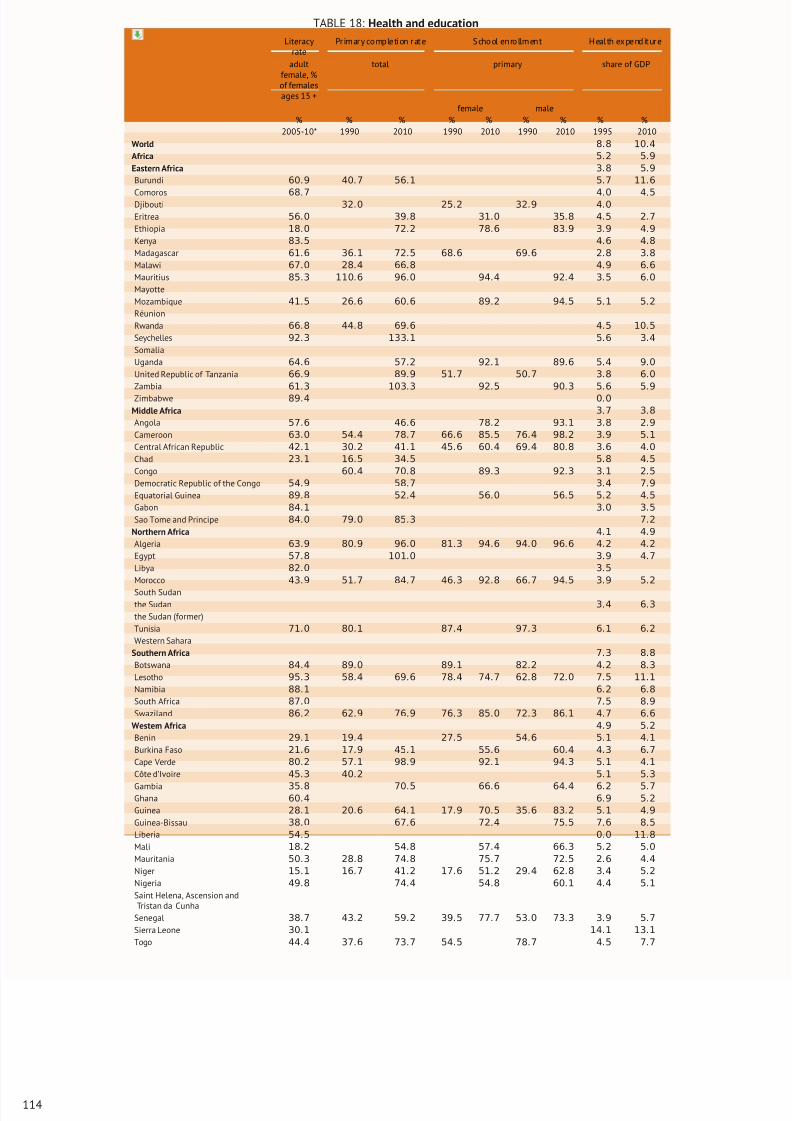
8/16/2019 Informe de la Fao 2013
http://slidepdf.com/reader/full/informe-de-la-fao-2013 132/307
TABLE 18: Health and education
Literacyrate
Primary comple tion rate School en rollmen t Health expe nditure
adultfemale, %of femalesages 15 +
total primary share of GDP
female male% % % % % % % % %
2005-10* 1990 2010 1990 2010 1990 2010 1995 2010
World 8.8 10.4
Africa 5.2 5.9
Eastern Africa 3.8 5.9
Burundi 60.9 40.7 56.1 5.7 11.6
Comoros 68
.7 4
.0 4
.5
Djibouti 32.0 25.2 32.9 4.0
Eritrea 56.0 39.8 31.0 35.8 4.5 2.7
Ethiopia 18.0 72.2 78.6 83.9 3.9 4.9
Kenya 83.5 4.6 4.8
Madagascar 61.6 36.1 72.5 68.6 69.6 2.8 3.8
Malawi 67.0 28.4 66.8 4.9 6.6
Mauritius 85.3 110.6 96.0 94.4 92.4 3.5 6.0
Mayotte
Mozambique 41.5 26.6 60.6 89.2 94.5 5.1 5.2
Réunion
Rwanda 66.8 44.8 69.6 4.5 10.5
Seychelles 92.3 133.1 5.6 3.4
Somalia
Uganda 64.6 57.2 92.1 89.6 5.4 9.0
United Republic of Tanzania 66.9 89.9 51.7 50.7 3.8 6.0
Zambia 61.3 103.3 92.5 90.3 5.6 5.9
Zimbabwe 89.4 0.0
Middle Africa 3.7 3.8
Angola 57.6 46.6 78.2 93.1 3.8 2.9
Cameroon 63.0 54.4 78.7 66.6 85.5 76.4 98.2 3.9 5.1
Central African Republic 42.1 30.2 41.1 45.6 60.4 69.4 80.8 3.6 4.0
Chad 23.1 16.5 34.5 5.8 4.5
Congo 60.4 70.8 89.3 92.3 3.1 2.5
Democratic Republic of the Congo 54.9 58.7 3.4 7.9
Equatorial Guinea 89.8 52.4 56.0 56.5 5.2 4.5
Gabon 84.1 3.0 3.5
Sao Tome and Principe 84.0 79.0 85.3 7.2
Northern Africa 4.1 4.9
Algeria 63.9 80.9 96.0 81.3 94.6 94.0 96.6 4.2 4.2
Egypt 57.8 101.0 3.9 4.7
Libya 82.0 3.5
Morocco 43.9 51.7 84.7 46.3 92.8 66.7 94.5 3.9 5.2
South Sudanthe Sudan 3.4 6.3
the Sudan (former)
Tunisia 71.0 80.1 87.4 97.3 6.1 6.2
Western Sahara
Southern Africa 7.3 8.8
Botswana 84.4 89.0 89.1 82.2 4.2 8.3
Lesotho 95.3 58.4 69.6 78.4 74.7 62.8 72.0 7.5 11.1
Namibia 88.1 6.2 6.8
South Africa 87.0 7.5 8.9
Swaziland 86.2 62.9 76.9 76.3 85.0 72.3 86.1 4.7 6.6
Western Africa 4.9 5.2
Benin 29.1 19.4 27.5 54.6 5.1 4.1
Burkina Faso 21.6 17.9 45.1 55.6 60.4 4.3 6.7
Cape Verde 80.2 57.1 98.9 92.1 94.3 5.1 4.1
Côte d’Ivoire 45.3 40.2 5.1 5.3
Gambia 35.8 70.5 66.6 64.4 6.2 5.7Ghana 60.4 6.9 5.2
Guinea 28.1 20.6 64.1 17.9 70.5 35.6 83.2 5.1 4.9
Guinea-Bissau 38.0 67.6 72.4 75.5 7.6 8.5
Liberia 54.5 0.0 11.8
Mali 18.2 54.8 57.4 66.3 5.2 5.0
Mauritania 50.3 28.8 74.8 75.7 72.5 2.6 4.4
Niger 15.1 16.7 41.2 17.6 51.2 29.4 62.8 3.4 5.2
Nigeria 49.8 74.4 54.8 60.1 4.4 5.1
Saint Helena, Ascension andTristan da Cunha
Senegal 38.7 43.2 59.2 39.5 77.7 53.0 73.3 3.9 5.7
Sierra Leone 30.1 14.1 13.1
Togo 44.4 37.6 73.7 54.5 78.7 4.5 7.7
114
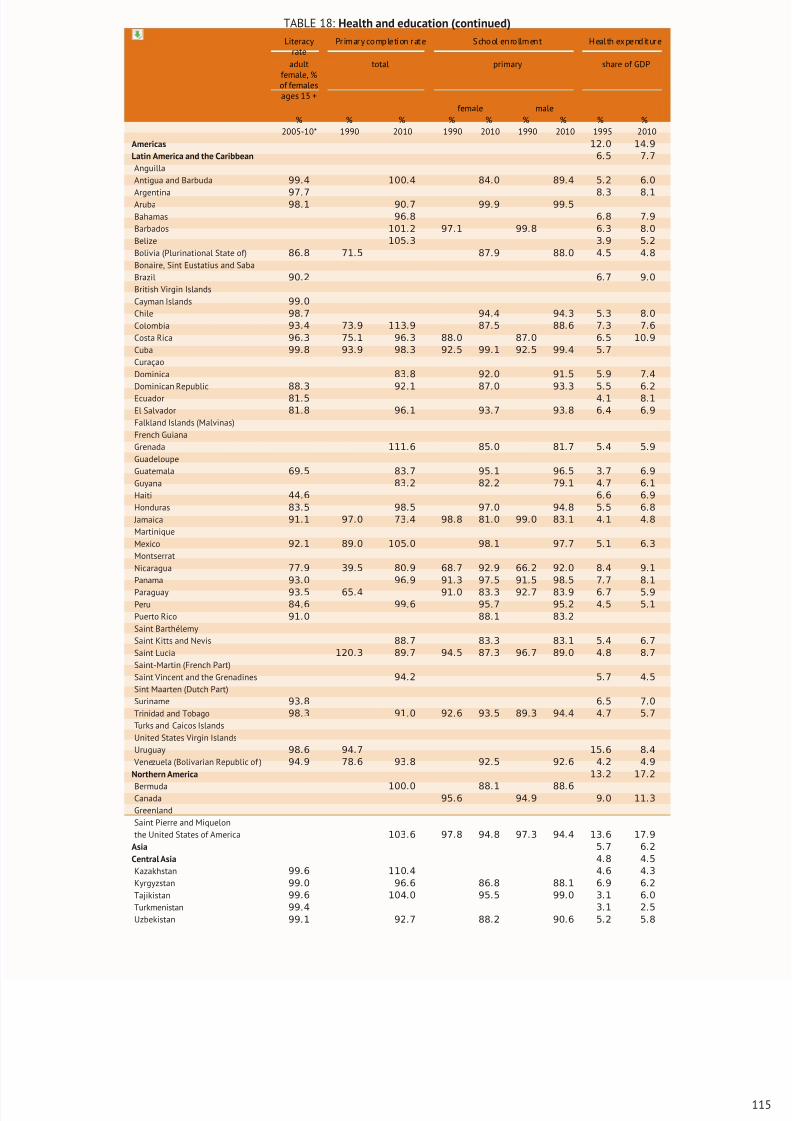
8/16/2019 Informe de la Fao 2013
http://slidepdf.com/reader/full/informe-de-la-fao-2013 133/307
TABLE 18: Health and education (continued)
Literacyrate
Primary comple tion rate School en rollmen t Health expe nditure
adultfemale, %of femalesages 15 +
total primary share of GDP
female male% % % % % % % % %
2005-10* 1990 2010 1990 2010 1990 2010 1995 2010
Americas 12.0 14.9
Latin America and the Caribbean 6.5 7.7
Anguilla
Antigua and Barbuda 99.4 100.4 84.0 89.4 5.2 6.0
Argentina 97
.7 8
.3 8
.1
Aruba 98.1 90.7 99.9 99.5
Bahamas 96.8 6.8 7.9
Barbados 101.2 97.1 99.8 6.3 8.0
Belize 105.3 3.9 5.2
Bolivia (Plurinational State of) 86.8 71.5 87.9 88.0 4.5 4.8
Bonaire, Sint Eustatius and Saba
Brazil 90.2 6.7 9.0
British Virgin Islands
Cayman Islands 99.0
Chile 98.7 94.4 94.3 5.3 8.0
Colombia 93.4 73.9 113.9 87.5 88.6 7.3 7.6
Costa Rica 96.3 75.1 96.3 88.0 87.0 6.5 10.9
Cuba 99.8 93.9 98.3 92.5 99.1 92.5 99.4 5.7
Curaçao
Dominica 83.8 92.0 91.5 5.9 7.4
Dominican Republic 88.3 92.1 87.0 93.3 5.5 6.2
Ecuador 81.5 4.1 8.1
El Salvador 81.8 96.1 93.7 93.8 6.4 6.9
Falkland Islands (Malvinas)
French Guiana
Grenada 111.6 85.0 81.7 5.4 5.9
Guadeloupe
Guatemala 69.5 83.7 95.1 96.5 3.7 6.9
Guyana 83.2 82.2 79.1 4.7 6.1
Haiti 44.6 6.6 6.9
Honduras 83.5 98.5 97.0 94.8 5.5 6.8
Jamaica 91.1 97.0 73.4 98.8 81.0 99.0 83.1 4.1 4.8
Martinique
Mexico 92.1 89.0 105.0 98.1 97.7 5.1 6.3
Montserrat
Nicaragua 77.9 39.5 80.9 68.7 92.9 66.2 92.0 8.4 9.1
Panama 93.0 96.9 91.3 97.5 91.5 98.5 7.7 8.1
Paraguay 93.5 65.4 91.0 83.3 92.7 83.9 6.7 5.9
Peru 84.6 99.6 95.7 95.2 4.5 5.1
Puerto Rico 91.0 88.1 83.2
Saint Barthélemy
Saint Kitts and Nevis 88.7 83.3 83.1 5.4 6.7
Saint Lucia 120.3 89.7 94.5 87.3 96.7 89.0 4.8 8.7
Saint-Martin (French Part)
Saint Vincent and the Grenadines 94.2 5.7 4.5
Sint Maarten (Dutch Part)
Suriname 93.8 6.5 7.0
Trinidad and Tobago 98.3 91.0 92.6 93.5 89.3 94.4 4.7 5.7
Turks and Caicos Islands
United States Virgin Islands
Uruguay 98.6 94.7 15.6 8.4
Venezuela (Bolivarian Republic of ) 94.9 78.6 93.8 92.5 92.6 4.2 4.9
Northern America 13.2 17.2
Bermuda 100.0 88.1 88.6Canada 95.6 94.9 9.0 11.3
Greenland
Saint Pierre and Miquelon
the United States of America 103.6 97.8 94.8 97.3 94.4 13.6 17.9
Asia 5.7 6.2
Central Asia 4.8 4.5
Kazakhstan 99.6 110.4 4.6 4.3
Kyrgyzstan 99.0 96.6 86.8 88.1 6.9 6.2
Tajikistan 99.6 104.0 95.5 99.0 3.1 6.0
Turkmenistan 99.4 3.1 2.5
Uzbekistan 99.1 92.7 88.2 90.6 5.2 5.8
115
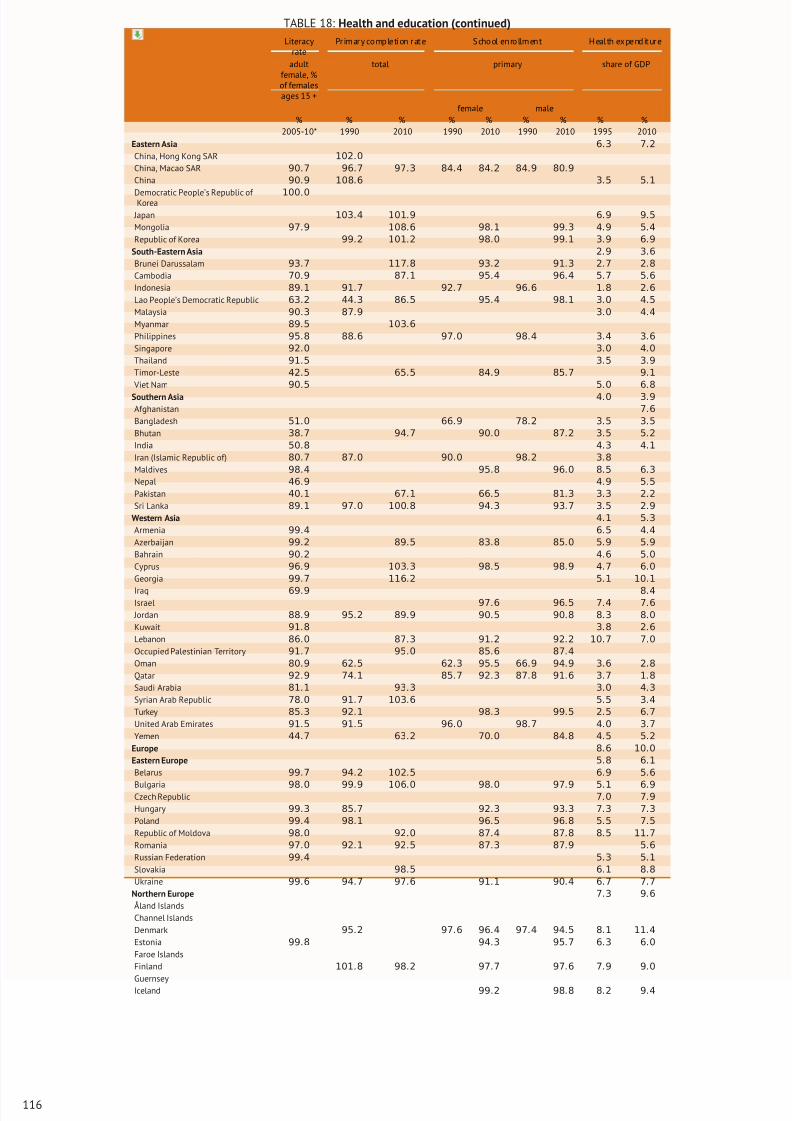
8/16/2019 Informe de la Fao 2013
http://slidepdf.com/reader/full/informe-de-la-fao-2013 134/307
TABLE 18: Health and education (continued)
Literacyrate
Primary comple tion rate School en rollmen t Health expe nditure
adultfemale, %of femalesages 15 +
total primary share of GDP
female male% % % % % % % % %
2005-10* 1990 2010 1990 2010 1990 2010 1995 2010
Eastern Asia 6.3 7.2
China, Hong Kong SAR 102.0
China, Macao SAR 90.7 96.7 97.3 84.4 84.2 84.9 80.9
China 90.9 108.6 3.5 5.1
Democratic People’s Republic of Korea100
.0
Japan 103.4 101.9 6.9 9.5
Mongolia 97.9 108.6 98.1 99.3 4.9 5.4
Republic of Korea 99.2 101.2 98.0 99.1 3.9 6.9
South-Eastern Asia 2.9 3.6
Brunei Darussalam 93.7 117.8 93.2 91.3 2.7 2.8
Cambodia 70.9 87.1 95.4 96.4 5.7 5.6
Indonesia 89.1 91.7 92.7 96.6 1.8 2.6
Lao People’s Democratic Republic 63.2 44.3 86.5 95.4 98.1 3.0 4.5
Malaysia 90.3 87.9 3.0 4.4
Myanmar 89.5 103.6
Philippines 95.8 88.6 97.0 98.4 3.4 3.6
Singapore 92.0 3.0 4.0
Thailand 91.5 3.5 3.9
Timor-Leste 42.5 65.5 84.9 85.7 9.1
Viet Nam 90.5 5.0 6.8
Southern Asia 4.0 3.9
Afghanistan 7.6
Bangladesh 51.0 66.9 78.2 3.5 3.5
Bhutan 38.7 94.7 90.0 87.2 3.5 5.2
India 50.8 4.3 4.1
Iran (Islamic Republic of) 80.7 87.0 90.0 98.2 3.8
Maldives 98.4 95.8 96.0 8.5 6.3
Nepal 46.9 4.9 5.5
Pakistan 40.1 67.1 66.5 81.3 3.3 2.2
Sri Lanka 89.1 97.0 100.8 94.3 93.7 3.5 2.9
Western Asia 4.1 5.3
Armenia 99.4 6.5 4.4
Azerbaijan 99.2 89.5 83.8 85.0 5.9 5.9
Bahrain 90.2 4.6 5.0
Cyprus 96.9 103.3 98.5 98.9 4.7 6.0
Georgia 99.7 116.2 5.1 10.1
Iraq 69.9 8.4Israel 97.6 96.5 7.4 7.6
Jordan 88.9 95.2 89.9 90.5 90.8 8.3 8.0
Kuwait 91.8 3.8 2.6
Lebanon 86.0 87.3 91.2 92.2 10.7 7.0
Occupied Palestinian Territory 91.7 95.0 85.6 87.4
Oman 80.9 62.5 62.3 95.5 66.9 94.9 3.6 2.8
Qatar 92.9 74.1 85.7 92.3 87.8 91.6 3.7 1.8
Saudi Arabia 81.1 93.3 3.0 4.3
Syrian Arab Republic 78.0 91.7 103.6 5.5 3.4
Turkey 85.3 92.1 98.3 99.5 2.5 6.7
United Arab Emirates 91.5 91.5 96.0 98.7 4.0 3.7
Yemen 44.7 63.2 70.0 84.8 4.5 5.2
Europe 8.6 10.0
Eastern Europe 5.8 6.1
Belarus 99.7 94.2 102.5 6.9 5.6
Bulgaria 98.0 99.9 106.0 98.0 97.9 5.1 6.9Czech Republic 7.0 7.9
Hungary 99.3 85.7 92.3 93.3 7.3 7.3
Poland 99.4 98.1 96.5 96.8 5.5 7.5
Republic of Moldova 98.0 92.0 87.4 87.8 8.5 11.7
Romania 97.0 92.1 92.5 87.3 87.9 5.6
Russian Federation 99.4 5.3 5.1
Slovakia 98.5 6.1 8.8
Ukraine 99.6 94.7 97.6 91.1 90.4 6.7 7.7
Northern Europe 7.3 9.6
Åland Islands
Channel Islands
Denmark 95.2 97.6 96.4 97.4 94.5 8.1 11.4
Estonia 99.8 94.3 95.7 6.3 6.0
Faroe Islands
Finland 101.8 98.2 97.7 97.6 7.9 9.0
GuernseyIceland 99.2 98.8 8.2 9.4
116
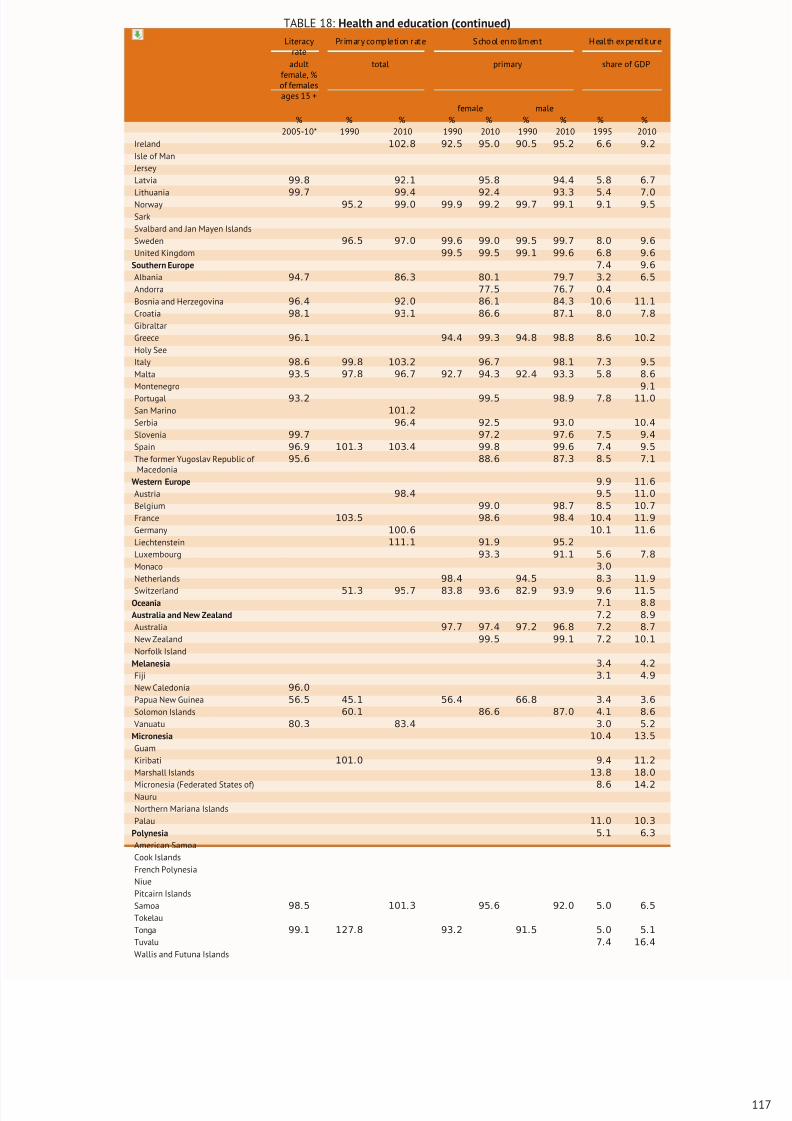
8/16/2019 Informe de la Fao 2013
http://slidepdf.com/reader/full/informe-de-la-fao-2013 135/307
TABLE 18: Health and education (continued)
Literacyrate
Primary comple tion rate School en rollmen t Health expe nditure
adultfemale, %of femalesages 15 +
total primary share of GDP
female male% % % % % % % % %
2005-10* 1990 2010 1990 2010 1990 2010 1995 2010
Ireland 102.8 92.5 95.0 90.5 95.2 6.6 9.2
Isle of Man
Jersey
Latvia 99.8 92.1 95.8 94.4 5.8 6.7
Lithuania 99
.7 99
.4 92
.4 93
.3 5
.4 7
.0
Norway 95.2 99.0 99.9 99.2 99.7 99.1 9.1 9.5
Sark
Svalbard and Jan Mayen Islands
Sweden 96.5 97.0 99.6 99.0 99.5 99.7 8.0 9.6
United Kingdom 99.5 99.5 99.1 99.6 6.8 9.6
Southern Europe 7.4 9.6
Albania 94.7 86.3 80.1 79.7 3.2 6.5
Andorra 77.5 76.7 0.4
Bosnia and Herzegovina 96.4 92.0 86.1 84.3 10.6 11.1
Croatia 98.1 93.1 86.6 87.1 8.0 7.8
Gibraltar
Greece 96.1 94.4 99.3 94.8 98.8 8.6 10.2
Holy See
Italy 98.6 99.8 103.2 96.7 98.1 7.3 9.5
Malta 93.5 97.8 96.7 92.7 94.3 92.4 93.3 5.8 8.6
Montenegro 9.1
Portugal 93.2 99.5 98.9 7.8 11.0
San Marino 101.2
Serbia 96.4 92.5 93.0 10.4
Slovenia 99.7 97.2 97.6 7.5 9.4
Spain 96.9 101.3 103.4 99.8 99.6 7.4 9.5
The former Yugoslav Republic of Macedonia
95.6 88.6 87.3 8.5 7.1
Western Europe 9.9 11.6
Austria 98.4 9.5 11.0
Belgium 99.0 98.7 8.5 10.7
France 103.5 98.6 98.4 10.4 11.9
Germany 100.6 10.1 11.6
Liechtenstein 111.1 91.9 95.2
Luxembourg 93.3 91.1 5.6 7.8
Monaco 3.0
Netherlands 98.4 94.5 8.3 11.9
Switzerland 51.3 95.7 83.8 93.6 82.9 93.9 9.6 11.5Oceania 7.1 8.8
Australia and New Zealand 7.2 8.9
Australia 97.7 97.4 97.2 96.8 7.2 8.7
New Zealand 99.5 99.1 7.2 10.1
Norfolk Island
Melanesia 3.4 4.2
Fiji 3.1 4.9
New Caledonia 96.0
Papua New Guinea 56.5 45.1 56.4 66.8 3.4 3.6
Solomon Islands 60.1 86.6 87.0 4.1 8.6
Vanuatu 80.3 83.4 3.0 5.2
Micronesia 10.4 13.5
Guam
Kiribati 101.0 9.4 11.2
Marshall Islands 13.8 18.0
Micronesia (Federated States of) 8.6 14.2Nauru
Northern Mariana Islands
Palau 11.0 10.3
Polynesia 5.1 6.3
American Samoa
Cook Islands
French Polynesia
Niue
Pitcairn Islands
Samoa 98.5 101.3 95.6 92.0 5.0 6.5
Tokelau
Tonga 99.1 127.8 93.2 91.5 5.0 5.1
Tuvalu 7.4 16.4
Wallis and Futuna Islands
117
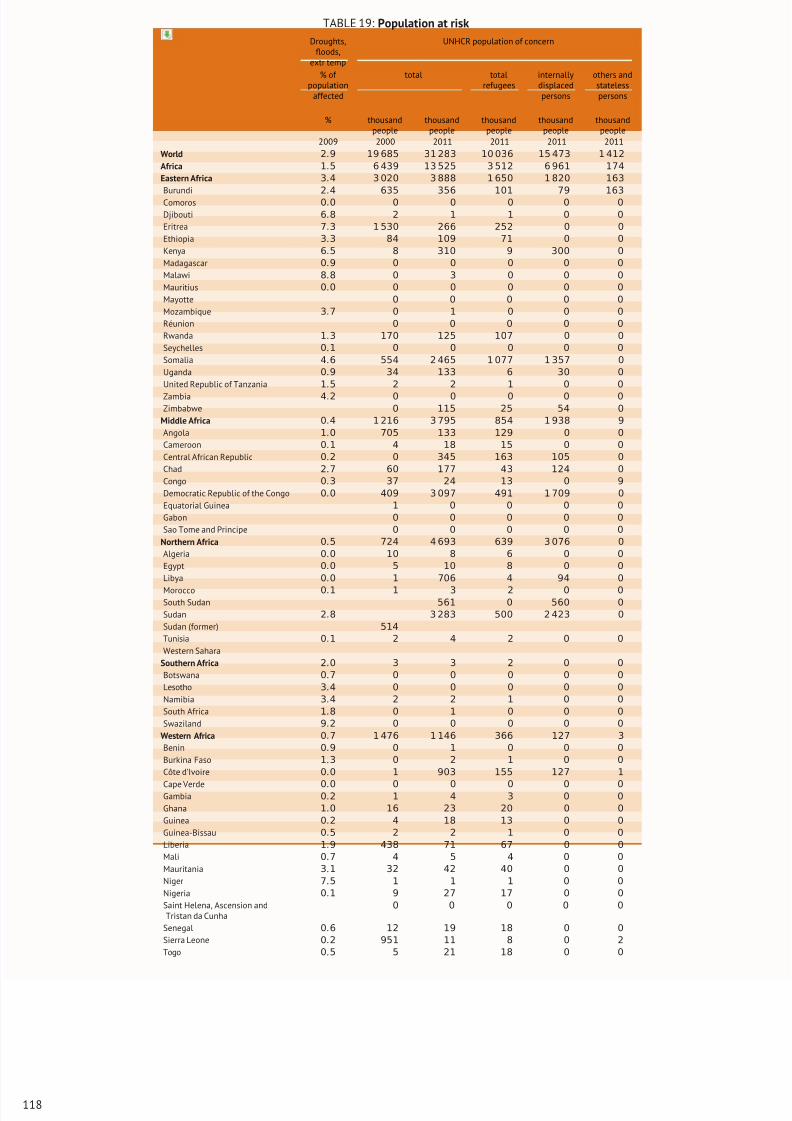
8/16/2019 Informe de la Fao 2013
http://slidepdf.com/reader/full/informe-de-la-fao-2013 136/307
TABLE 19: Population at risk
Droughts,floods,
extr temp
UNHCR population of concern
% of population
affected
total totalrefugees
internallydisplacedpersons
others andstatelesspersons
% thousandpeople
thousandpeople
thousandpeople
thousandpeople
thousandpeople
2009 2000 2011 2011 2011 2011
World 2.9 19 685 31 283 10 036 15 473 1 412
Africa 1.5 6 439 13 525 3 512 6 961 174
Eastern Africa 3.4 3 020 3 888 1 650 1 820 163
Burundi 2.4 635 356 101 79 163
Comoros 0.0 0 0 0 0 0
Djibouti 6.8 2 1 1 0 0
Eritrea 7.3 1 530 266 252 0 0
Ethiopia 3.3 84 109 71 0 0
Kenya 6.5 8 310 9 300 0
Madagascar 0.9 0 0 0 0 0
Malawi 8.8 0 3 0 0 0
Mauritius 0.0 0 0 0 0 0
Mayotte 0 0 0 0 0
Mozambique 3.7 0 1 0 0 0
Réunion 0 0 0 0 0
Rwanda 1.3 170 125 107 0 0
Seychelles 0.1 0 0 0 0 0
Somalia 4.6 554 2 465 1 077 1 357 0
Uganda 0.9 34 133 6 30 0
United Republic of Tanzania 1.5 2 2 1 0 0
Zambia 4.2 0 0 0 0 0
Zimbabwe 0 115 25 54 0
Middle Africa 0.4 1 216 3 795 854 1 938 9
Angola 1.0 705 133 129 0 0
Cameroon 0.1 4 18 15 0 0
Central African Republic 0.2 0 345 163 105 0
Chad 2.7 60 177 43 124 0
Congo 0.3 37 24 13 0 9
Democratic Republic of the Congo 0.0 409 3 097 491 1 709 0
Equatorial Guinea 1 0 0 0 0
Gabon 0 0 0 0 0
Sao Tome and Principe 0 0 0 0 0
Northern Africa 0.5 724 4 693 639 3 076 0
Algeria 0.0 10 8 6 0 0
Egypt 0.0 5 10 8 0 0
Libya 0.0 1 706 4 94 0
Morocco 0.1 1 3 2 0 0South Sudan 561 0 560 0
Sudan 2.8 3 283 500 2 423 0
Sudan (former) 514
Tunisia 0.1 2 4 2 0 0
Western Sahara
Southern Africa 2.0 3 3 2 0 0
Botswana 0.7 0 0 0 0 0
Lesotho 3.4 0 0 0 0 0
Namibia 3.4 2 2 1 0 0
South Africa 1.8 0 1 0 0 0
Swaziland 9.2 0 0 0 0 0
Western Africa 0.7 1 476 1 146 366 127 3
Benin 0.9 0 1 0 0 0
Burkina Faso 1.3 0 2 1 0 0
Côte d’Ivoire 0.0 1 903 155 127 1
Cape Verde 0.0 0 0 0 0 0Gambia 0.2 1 4 3 0 0
Ghana 1.0 16 23 20 0 0
Guinea 0.2 4 18 13 0 0
Guinea-Bissau 0.5 2 2 1 0 0
Liberia 1.9 438 71 67 0 0
Mali 0.7 4 5 4 0 0
Mauritania 3.1 32 42 40 0 0
Niger 7.5 1 1 1 0 0
Nigeria 0.1 9 27 17 0 0
Saint Helena, Ascension andTristan da Cunha
0 0 0 0 0
Senegal 0.6 12 19 18 0 0
Sierra Leone 0.2 951 11 8 0 2
Togo 0.5 5 21 18 0 0
118
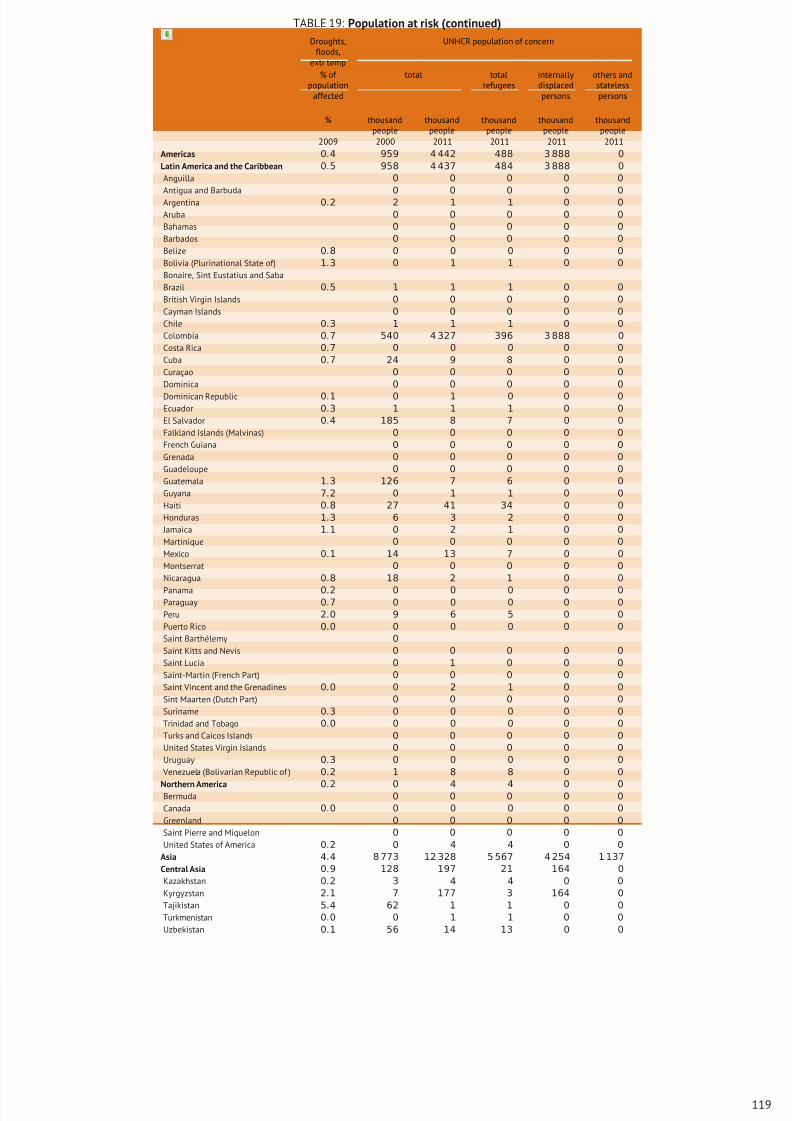
8/16/2019 Informe de la Fao 2013
http://slidepdf.com/reader/full/informe-de-la-fao-2013 137/307
TABLE 19: Population at risk (continued)
Droughts,floods,
extr temp
UNHCR population of concern
% of population
affected
total totalrefugees
internallydisplacedpersons
others andstatelesspersons
% thousandpeople
thousandpeople
thousandpeople
thousandpeople
thousandpeople
2009 2000 2011 2011 2011 2011
Americas 0.4 959 4 442 488 3 888 0
Latin America and the Caribbean 0.5 958 4 437 484 3 888 0
Anguilla 0 0 0 0 0
Antigua and Barbuda 0 0 0 0 0
Argentina 0.2 2 1 1 0 0
Aruba 0 0 0 0 0
Bahamas 0 0 0 0 0
Barbados 0 0 0 0 0
Belize 0.8 0 0 0 0 0
Bolivia (Plurinational State of) 1.3 0 1 1 0 0
Bonaire, Sint Eustatius and Saba
Brazil 0.5 1 1 1 0 0
British Virgin Islands 0 0 0 0 0
Cayman Islands 0 0 0 0 0
Chile 0.3 1 1 1 0 0
Colombia 0.7 540 4 327 396 3 888 0
Costa Rica 0.7 0 0 0 0 0
Cuba 0.7 24 9 8 0 0
Curaçao 0 0 0 0 0
Dominica 0 0 0 0 0
Dominican Republic 0.1 0 1 0 0 0
Ecuador 0.3 1 1 1 0 0
El Salvador 0.4 185 8 7 0 0
Falkland Islands (Malvinas) 0 0 0 0 0
French Guiana 0 0 0 0 0
Grenada 0 0 0 0 0
Guadeloupe 0 0 0 0 0
Guatemala 1.3 126 7 6 0 0
Guyana 7.2 0 1 1 0 0
Haiti 0.8 27 41 34 0 0
Honduras 1.3 6 3 2 0 0
Jamaica 1.1 0 2 1 0 0
Martinique 0 0 0 0 0
Mexico 0.1 14 13 7 0 0
Montserrat 0 0 0 0 0
Nicaragua 0.8 18 2 1 0 0
Panama 0.2 0 0 0 0 0Paraguay 0.7 0 0 0 0 0
Peru 2.0 9 6 5 0 0
Puerto Rico 0.0 0 0 0 0 0
Saint Barthélemy 0
Saint Kitts and Nevis 0 0 0 0 0
Saint Lucia 0 1 0 0 0
Saint-Martin (French Part) 0 0 0 0 0
Saint Vincent and the Grenadines 0.0 0 2 1 0 0
Sint Maarten (Dutch Part) 0 0 0 0 0
Suriname 0.3 0 0 0 0 0
Trinidad and Tobago 0.0 0 0 0 0 0
Turks and Caicos Islands 0 0 0 0 0
United States Virgin Islands 0 0 0 0 0
Uruguay 0.3 0 0 0 0 0
Venezuela (Bolivarian Republic of ) 0.2 1 8 8 0 0
Northern America 0.2 0 4 4 0 0Bermuda 0 0 0 0 0
Canada 0.0 0 0 0 0 0
Greenland 0 0 0 0 0
Saint Pierre and Miquelon 0 0 0 0 0
United States of America 0.2 0 4 4 0 0
Asia 4.4 8 773 12 328 5 567 4 254 1 137
Central Asia 0.9 128 197 21 164 0
Kazakhstan 0.2 3 4 4 0 0
Kyrgyzstan 2.1 7 177 3 164 0
Tajikistan 5.4 62 1 1 0 0
Turkmenistan 0.0 0 1 1 0 0
Uzbekistan 0.1 56 14 13 0 0
119
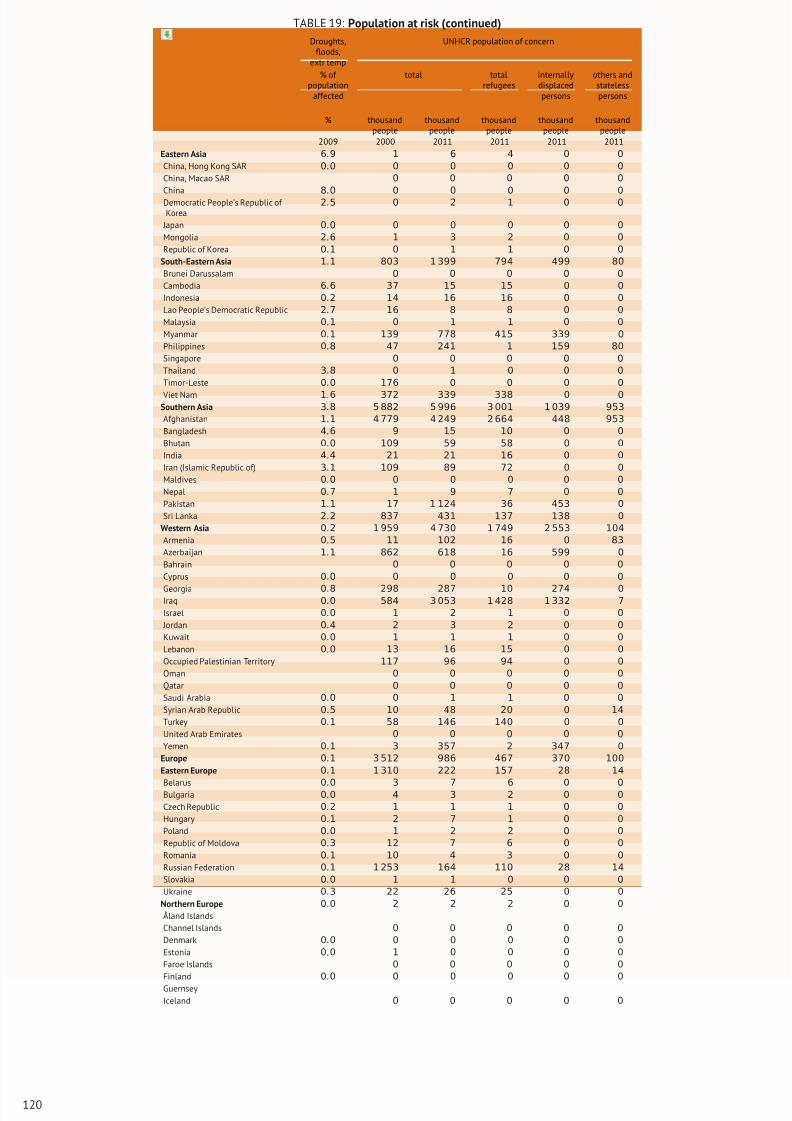
8/16/2019 Informe de la Fao 2013
http://slidepdf.com/reader/full/informe-de-la-fao-2013 138/307
TABLE 19: Population at risk (continued)
Droughts,floods,
extr temp
UNHCR population of concern
% of population
affected
total totalrefugees
internallydisplacedpersons
others andstatelesspersons
% thousandpeople
thousandpeople
thousandpeople
thousandpeople
thousandpeople
2009 2000 2011 2011 2011 2011
Eastern Asia 6.9 1 6 4 0 0
China, Hong Kong SAR 0.0 0 0 0 0 0
China, Macao SAR 0 0 0 0 0
China 8.0 0 0 0 0 0
Democratic People’s Republic of Korea
2.5 0 2 1 0 0
Japan 0.0 0 0 0 0 0
Mongolia 2.6 1 3 2 0 0
Republic of Korea 0.1 0 1 1 0 0
South-Eastern Asia 1.1 803 1 399 794 499 80
Brunei Darussalam 0 0 0 0 0
Cambodia 6.6 37 15 15 0 0
Indonesia 0.2 14 16 16 0 0
Lao People’s Democratic Republic 2.7 16 8 8 0 0
Malaysia 0.1 0 1 1 0 0
Myanmar 0.1 139 778 415 339 0
Philippines 0.8 47 241 1 159 80
Singapore 0 0 0 0 0
Thailand 3.8 0 1 0 0 0
Timor-Leste 0.0 176 0 0 0 0
Viet Nam 1.6 372 339 338 0 0
Southern Asia 3.8 5 882 5 996 3 001 1 039 953
Afghanistan 1.1 4 779 4 249 2 664 448 953
Bangladesh 4.6 9 15 10 0 0
Bhutan 0.0 109 59 58 0 0
India 4.4 21 21 16 0 0
Iran (Islamic Republic of) 3.1 109 89 72 0 0
Maldives 0.0 0 0 0 0 0
Nepal 0.7 1 9 7 0 0
Pakistan 1.1 17 1 124 36 453 0
Sri Lanka 2.2 837 431 137 138 0
Western Asia 0.2 1 959 4 730 1 749 2 553 104
Armenia 0.5 11 102 16 0 83
Azerbaijan 1.1 862 618 16 599 0
Bahrain 0 0 0 0 0
Cyprus 0.0 0 0 0 0 0
Georgia 0.8 298 287 10 274 0Iraq 0.0 584 3 053 1 428 1 332 7
Israel 0.0 1 2 1 0 0
Jordan 0.4 2 3 2 0 0
Kuwait 0.0 1 1 1 0 0
Lebanon 0.0 13 16 15 0 0
Occupied Palestinian Territory 117 96 94 0 0
Oman 0 0 0 0 0
Qatar 0 0 0 0 0
Saudi Arabia 0.0 0 1 1 0 0
Syrian Arab Republic 0.5 10 48 20 0 14
Turkey 0.1 58 146 140 0 0
United Arab Emirates 0 0 0 0 0
Yemen 0.1 3 357 2 347 0
Europe 0.1 3 512 986 467 370 100
Eastern Europe 0.1 1 310 222 157 28 14
Belarus 0
.0 3 7 6 0 0
Bulgaria 0.0 4 3 2 0 0
Czech Republic 0.2 1 1 1 0 0
Hungary 0.1 2 7 1 0 0
Poland 0.0 1 2 2 0 0
Republic of Moldova 0.3 12 7 6 0 0
Romania 0.1 10 4 3 0 0
Russian Federation 0.1 1 253 164 110 28 14
Slovakia 0.0 1 1 0 0 0
Ukraine 0.3 22 26 25 0 0
Northern Europe 0.0 2 2 2 0 0
Åland Islands
Channel Islands 0 0 0 0 0
Denmark 0.0 0 0 0 0 0
Estonia 0.0 1 0 0 0 0
Faroe Islands 0 0 0 0 0
Finland 0.0 0 0 0 0 0
Guernsey
Iceland 0 0 0 0 0
120
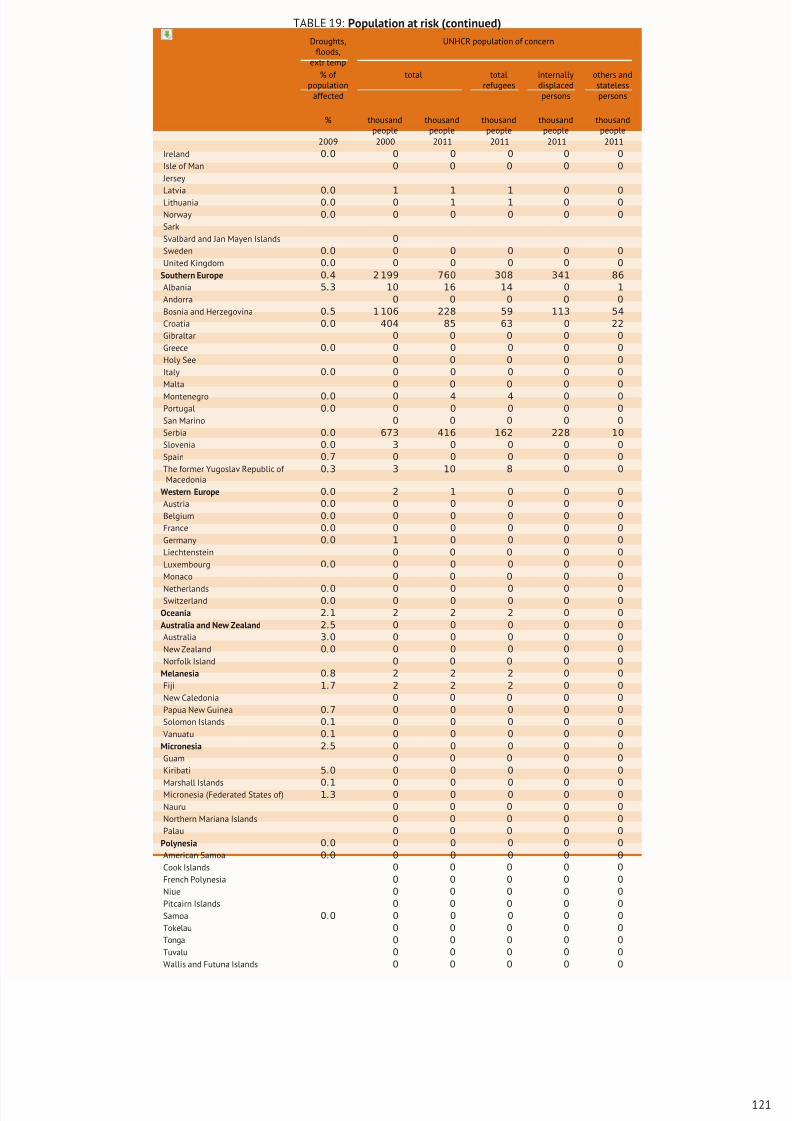
8/16/2019 Informe de la Fao 2013
http://slidepdf.com/reader/full/informe-de-la-fao-2013 139/307
TABLE 19: Population at risk (continued)
Droughts,floods,
extr temp
UNHCR population of concern
% of population
affected
total totalrefugees
internallydisplacedpersons
others andstatelesspersons
% thousandpeople
thousandpeople
thousandpeople
thousandpeople
thousandpeople
2009 2000 2011 2011 2011 2011
Ireland 0.0 0 0 0 0 0
Isle of Man 0 0 0 0 0
Jersey
Latvia 0.0 1 1 1 0 0
Lithuania 0.0 0 1 1 0 0
Norway 0.0 0 0 0 0 0
Sark
Svalbard and Jan Mayen Islands 0
Sweden 0.0 0 0 0 0 0
United Kingdom 0.0 0 0 0 0 0
Southern Europe 0.4 2 199 760 308 341 86
Albania 5.3 10 16 14 0 1
Andorra 0 0 0 0 0
Bosnia and Herzegovina 0.5 1 106 228 59 113 54
Croatia 0.0 404 85 63 0 22
Gibraltar 0 0 0 0 0
Greece 0.0 0 0 0 0 0
Holy See 0 0 0 0 0
Italy 0.0 0 0 0 0 0
Malta 0 0 0 0 0
Montenegro 0.0 0 4 4 0 0
Portugal 0.0 0 0 0 0 0
San Marino 0 0 0 0 0
Serbia 0.0 673 416 162 228 10
Slovenia 0.0 3 0 0 0 0
Spain 0.7 0 0 0 0 0
The former Yugoslav Republic of Macedonia
0.3 3 10 8 0 0
Western Europe 0.0 2 1 0 0 0
Austria 0.0 0 0 0 0 0
Belgium 0.0 0 0 0 0 0
France 0.0 0 0 0 0 0
Germany 0.0 1 0 0 0 0
Liechtenstein 0 0 0 0 0
Luxembourg 0.0 0 0 0 0 0
Monaco 0 0 0 0 0
Netherlands 0.0 0 0 0 0 0Switzerland 0.0 0 0 0 0 0
Oceania 2.1 2 2 2 0 0
Australia and New Zealand 2.5 0 0 0 0 0
Australia 3.0 0 0 0 0 0
New Zealand 0.0 0 0 0 0 0
Norfolk Island 0 0 0 0 0
Melanesia 0.8 2 2 2 0 0
Fiji 1.7 2 2 2 0 0
New Caledonia 0 0 0 0 0
Papua New Guinea 0.7 0 0 0 0 0
Solomon Islands 0.1 0 0 0 0 0
Vanuatu 0.1 0 0 0 0 0
Micronesia 2.5 0 0 0 0 0
Guam 0 0 0 0 0
Kiribati 5.0 0 0 0 0 0
Marshall Islands 0
.1 0 0 0 0 0
Micronesia (Federated States of) 1.3 0 0 0 0 0
Nauru 0 0 0 0 0
Northern Mariana Islands 0 0 0 0 0
Palau 0 0 0 0 0
Polynesia 0.0 0 0 0 0 0
American Samoa 0.0 0 0 0 0 0
Cook Islands 0 0 0 0 0
French Polynesia 0 0 0 0 0
Niue 0 0 0 0 0
Pitcairn Islands 0 0 0 0 0
Samoa 0.0 0 0 0 0 0
Tokelau 0 0 0 0 0
Tonga 0 0 0 0 0
Tuvalu 0 0 0 0 0
Wallis and Futuna Islands 0 0 0 0 0
121

8/16/2019 Informe de la Fao 2013
http://slidepdf.com/reader/full/informe-de-la-fao-2013 140/307
8/16/2019 Informe de la Fao 2013
http://slidepdf.com/reader/full/informe-de-la-fao-2013 141/307
PART
Feeding the world
The world’s population is set to grow considerably over the comingyears, albeit at a slower rate than in the past, and with considerabledifferences across regions. Over the next four decades, the world’spopulation is forecast to increase by 2 billion people to exceed 9 bil-lion people by 2050. Recent FAO estimates indicate that to meetthe projected demand, global agricultural production will have to in-crease by 60 percent from its 2005–2007 levels.
Urbanization and increasing incomes are major drivers of expectedchanges in consumption patterns. Over recent decades, many emerg-ing economies of Western Asia, Northern Africa, Latin America and
Eastern Asia have seen fast and significant changes in food consump-tion levels and patterns. Per capita food availability in these re-gions is now close to 3 000 kcal/day. Roots, tubers and coarse grainshave gradually been replaced by increasing consumption of wheat,rice, sugar, vegetable oils, and meat and dairy products. In contrast,sub-Saharan Africa and Southern Asia are still well below the 2 500kcal/person/day threshold. At the other extreme, Latin America con-sumes high per capita amounts of meat.
8/16/2019 Informe de la Fao 2013
http://slidepdf.com/reader/full/informe-de-la-fao-2013 142/307
Over the coming decades, the burden of undernourishment is ex-pected to decline in most regions. At the same time, changes in con-sumption patterns and shifts towards more sedentary lifestyles are
likely to make other forms of malnutrition more prominent in bothdeveloped and developing countries. Diets are expected to becomericher in fats – especially saturated fat – sugar and salt, while ur-banization and the reduction of physical activities will likely resultin lower calorie expenditures and more widespread obesity. Under-nourishment and overnutrition may coexist, posing a “double burdenof malnutrition” in many developing countries.
Over the past 50 years, growth of world crop production originatedmostly from increased yields and higher cropping intensity. This pat-tern is expected to continue, given the limited opportunities and high
costs associated with expanding agricultural land. At the global level,the rates of yield growth for most crops have been decelerating in re-cent decades, while yields continue to increase in absolute terms.
To date, yield gains have originated mostly from improved croppingtechniques, fertilization and irrigation. Much can be achieved by nar-rowing the gap between average farm yields and potential yields,such as those obtained in experimental fields. In several developingcountries, on the other hand, average yields are estimated to be muchlower than their potential, failing to reach 30 percent in some cases.Depending on the context, low productivity can be the outcome of
poor physical and market infrastructure, and wrong incentives. Inaddition, food availability can be improved by reducing wastage andpost-harvest losses.
However, the intensification of production can be associated with sig-nificant negative environmental effects, including groundwater pol-lution, soil erosion and a loss in biodiversity. More sustainable useof the limited resource base requires substantial improvements inthe management and use of land, water and inputs. Continuous in-vestments are required in improved technologies to reduce losses inbiodiversity and limit carbon emissions from agriculture.
Developing and transferring technology alone will not tackle yieldgaps or reduce wastage or post-harvest losses. An enabling invest-ment environment should also be established. Farmers are likely toadopt technologies only if there are sound incentives to do so: thiscalls for well-functioning input and output markets, improved infras-tructure, and better finance and risk management tools.
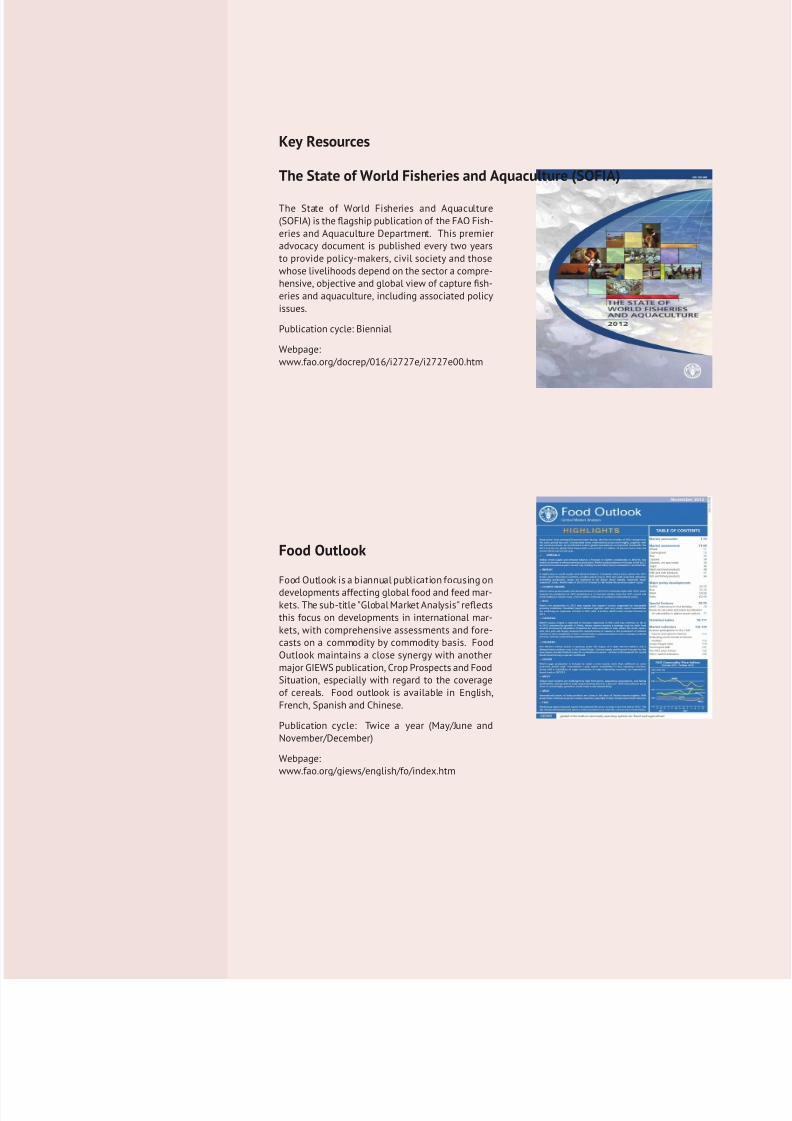
8/16/2019 Informe de la Fao 2013
http://slidepdf.com/reader/full/informe-de-la-fao-2013 143/307
Key Resources
The State of World Fisheries and Aquaculture (SOFIA)
The State of World Fisheries and Aquaculture(SOFIA) is the flagship publication of the FAO Fish-eries and Aquaculture Department. This premieradvocacy document is published every two yearsto provide policy-makers, civil society and thosewhose livelihoods depend on the sector a compre-hensive, objective and global view of capture fish-eries and aquaculture, including associated policyissues.
Publication cycle: Biennial
Webpage:www.fao.org/docrep/016/i2727e/i2727e00.htm
Food Outlook
Food Outlook is a biannual publication focusing on
developments affecting global food and feed mar-kets. The sub-title "Global Market Analysis" reflectsthis focus on developments in international mar-kets, with comprehensive assessments and fore-casts on a commodity by commodity basis. FoodOutlook maintains a close synergy with anothermajor GIEWS publication, Crop Prospects and FoodSituation, especially with regard to the coverageof cereals. Food outlook is available in English,French, Spanish and Chinese.
Publication cycle: Twice a year (May/June andNovember/December)
Webpage:www.fao.org/giews/english/fo/index.htm
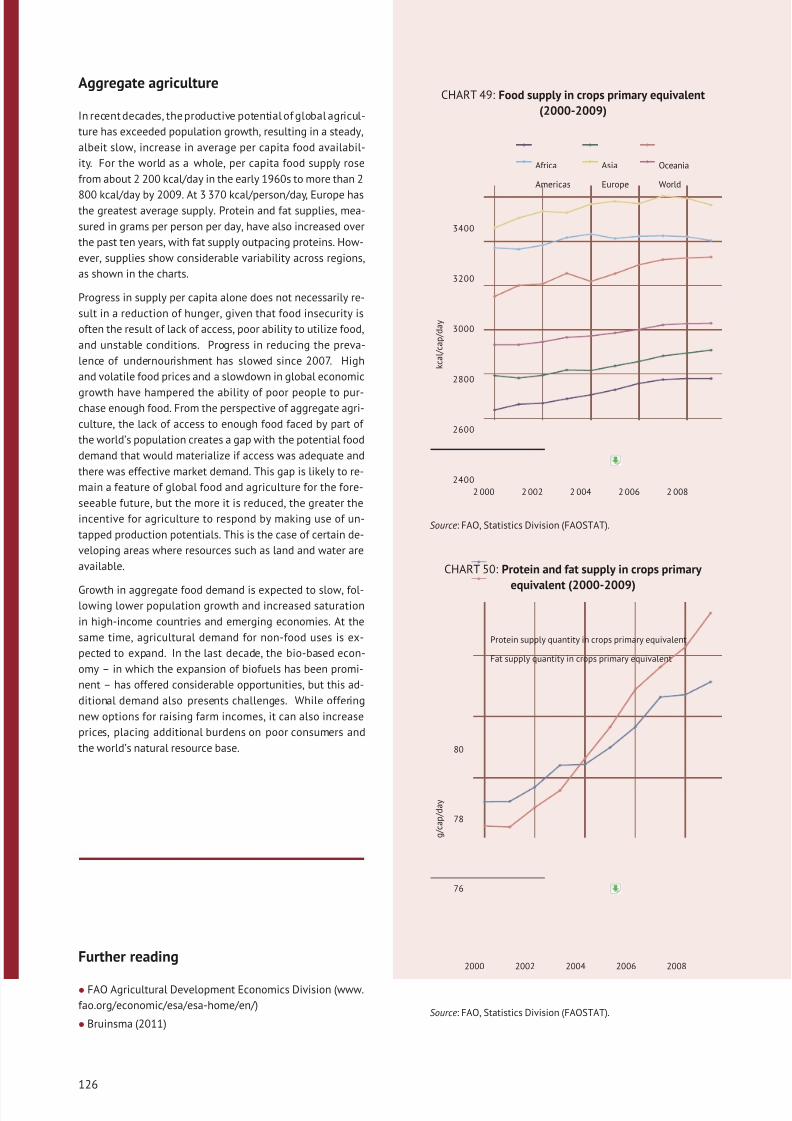
8/16/2019 Informe de la Fao 2013
http://slidepdf.com/reader/full/informe-de-la-fao-2013 144/307
Aggregate agriculture
In recent decades, the productive potential of global agricul-
ture has exceeded population growth, resulting in a steady,
albeit slow, increase in average per capita food availabil-
ity. For the world as a whole, per capita food supply rose
from about 2 200 kcal/day in the early 1960s to more than 2
800 kcal/day by 2009. At 3 370 kcal/person/day, Europe hasthe greatest average supply. Protein and fat supplies, mea-
sured in grams per person per day, have also increased over
the past ten years, with fat supply outpacing proteins. How-
ever, supplies show considerable variability across regions,
as shown in the charts.
Progress in supply per capita alone does not necessarily re-
sult in a reduction of hunger, given that food insecurity is
often the result of lack of access, poor ability to utilize food,
and unstable conditions. Progress in reducing the preva-
lence of undernourishment has slowed since 2007. High
and volatile food prices and a slowdown in global economic
growth have hampered the ability of poor people to pur-chase enough food. From the perspective of aggregate agri-
culture, the lack of access to enough food faced by part of
the world’s population creates a gap with the potential food
demand that would materialize if access was adequate and
there was effective market demand. This gap is likely to re-
main a feature of global food and agriculture for the fore-
seeable future, but the more it is reduced, the greater the
incentive for agriculture to respond by making use of un-
tapped production potentials. This is the case of certain de-
veloping areas where resources such as land and water are
available.
Growth in aggregate food demand is expected to slow, fol-lowing lower population growth and increased saturation
in high-income countries and emerging economies. At the
same time, agricultural demand for non-food uses is ex-
pected to expand. In the last decade, the bio-based econ-
omy – in which the expansion of biofuels has been promi-
nent – has offered considerable opportunities, but this ad-
ditional demand also presents challenges. While offering
new options for raising farm incomes, it can also increase
prices, placing additional burdens on poor consumers and
the world’s natural resource base.
Further reading
• FAO Agricultural Development Economics Division (www.
fao.org/economic/esa/esa-home/en/)
• Bruinsma (2011)
CHART 49: Food supply in crops primary equivalent
(2000-2009)
2400
2600
2800
3000
3200
3400
2 000 2 002 2 004 2 006 2 008
k c a l / c a p / d a y
Africa
Americas
Asia
Europe
Oceania
World
Source: FAO, Statistics Division (FAOSTAT).
CHART 50: Protein and fat supply in crops primary
equivalent (2000-2009)
76
78
80
2000 2002 2004 2006 2008
g / c a p / d a y
Protein supply quantity in crops primary equivalent
Fat supply quantity in crops primary equivalent
Source: FAO, Statistics Division (FAOSTAT).
126
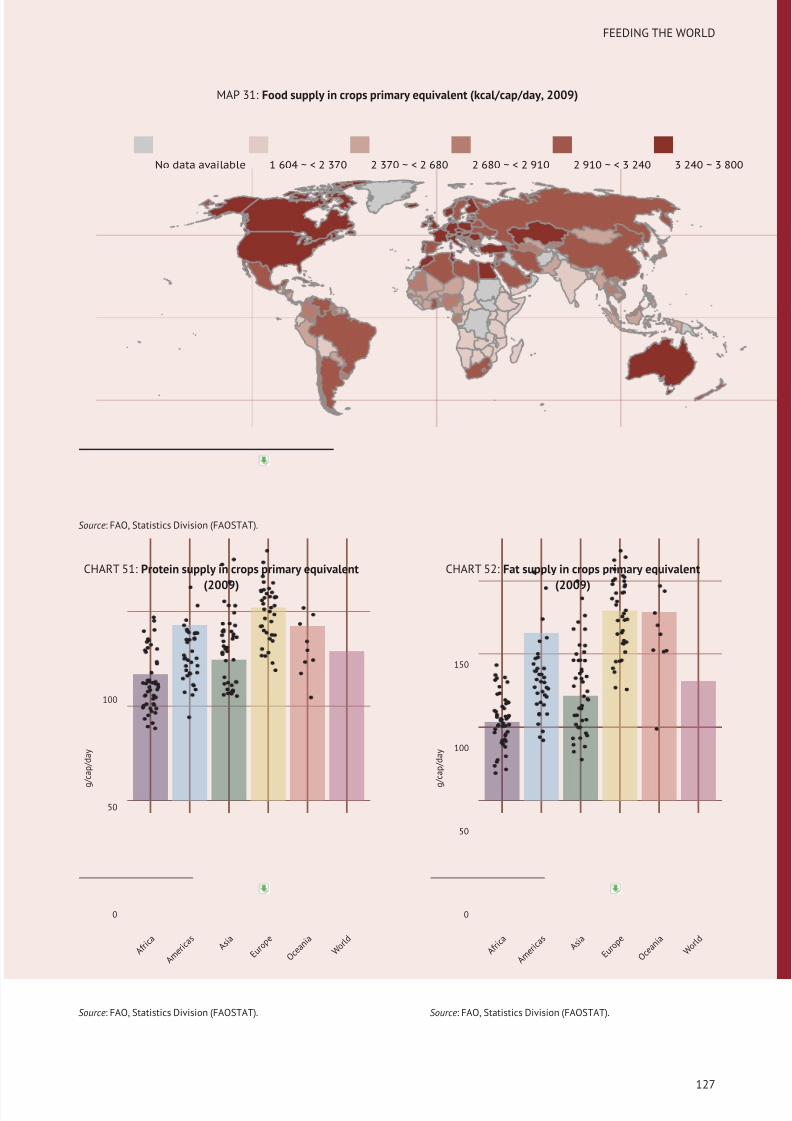
8/16/2019 Informe de la Fao 2013
http://slidepdf.com/reader/full/informe-de-la-fao-2013 145/307
FEEDING THE WORLD
MAP 31: Food supply in crops primary equivalent (kcal/cap/day, 2009)
No data available 1 604 ~ < 2 370 2 370 ~ < 2 680 2 680 ~ < 2 910 2 910 ~ < 3 240 3 240 ~ 3 800
Source: FAO, Statistics Division (FAOSTAT).
CHART 51: Protein supply in crops primary equivalent
(2009)
0
50
100
A f r i c a
A m e r i c a s
A s i a
E u r o p e
O c e a n i a
W o r l d
g
/ c a p / d a y
Source: FAO, Statistics Division (FAOSTAT).
CHART 52: Fat supply in crops primary equivalent
(2009)
0
50
100
150
A f r i c a
A m e r i c a s
A s i a
E u r o p e
O c e a n i a
W o r l d
g
/ c a p / d a y
Source: FAO, Statistics Division (FAOSTAT).
127
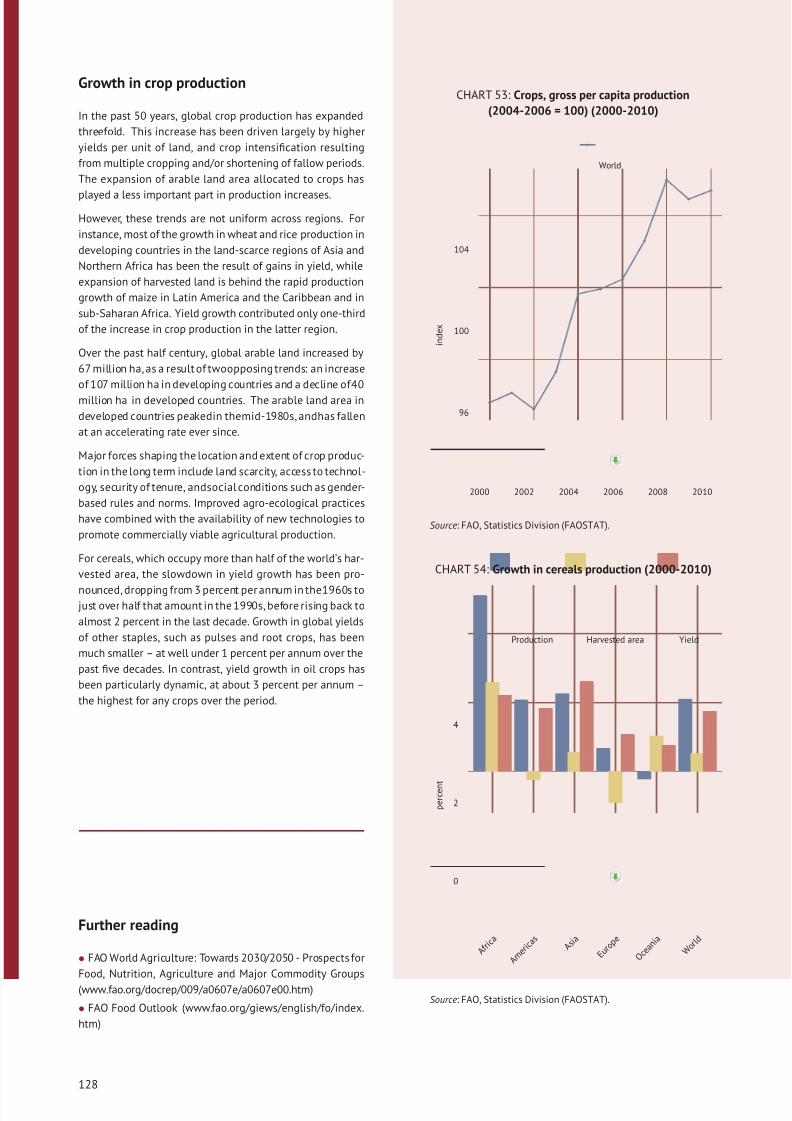
8/16/2019 Informe de la Fao 2013
http://slidepdf.com/reader/full/informe-de-la-fao-2013 146/307
Growth in crop production
In the past 50 years, global crop production has expanded
threefold. This increase has been driven largely by higher
yields per unit of land, and crop intensification resulting
from multiple cropping and/or shortening of fallow periods.
The expansion of arable land area allocated to crops has
played a less important part in production increases.
However, these trends are not uniform across regions. For
instance, most of the growth in wheat and rice production in
developing countries in the land-scarce regions of Asia and
Northern Africa has been the result of gains in yield, while
expansion of harvested land is behind the rapid production
growth of maize in Latin America and the Caribbean and in
sub-Saharan Africa. Yield growth contributed only one-third
of the increase in crop production in the latter region.
Over the past half century, global arable land increased by
67 million ha, as a result of twoopposing trends: an increase
of 107 million ha in developing countries and a decline of40
million ha in developed countries. The arable land area in
developed countries peakedin themid-1980s, andhas fallen
at an accelerating rate ever since.
Major forces shaping the location and extent of crop produc-
tion in the long term include land scarcity, access to technol-
ogy, security of tenure, andsocial conditions such as gender-
based rules and norms. Improved agro-ecological practices
have combined with the availability of new technologies to
promote commercially viable agricultural production.
For cereals, which occupy more than half of the world’s har-
vested area, the slowdown in yield growth has been pro-
nounced, dropping from 3 percent per annum in the1960s tojust over half that amount in the 1990s, before rising back to
almost 2 percent in the last decade. Growth in global yields
of other staples, such as pulses and root crops, has been
much smaller – at well under 1 percent per annum over the
past five decades. In contrast, yield growth in oil crops has
been particularly dynamic, at about 3 percent per annum –
the highest for any crops over the period.
Further reading
• FAO World Agriculture: Towards 2030/2050 - Prospects for
Food, Nutrition, Agriculture and Major Commodity Groups
(www.fao.org/docrep/009/a0607e/a0607e00.htm)
• FAO Food Outlook (www.fao.org/giews/english/fo/index.
htm)
CHART 53: Crops, gross per capita production
(2004-2006 = 100) (2000-2010)
96
100
104
2000 2002 2004 2006 2008 2010
i n d e x
World
Source: FAO, Statistics Division (FAOSTAT).
CHART 54: Growth in cereals production (2000-2010)
0
2
4
A f r i c a
A m e r i c a s
A s i a
E u r o p e
O c e a n i a
W o r l d
p e r c e n t
Production Harvested area Yield
Source: FAO, Statistics Division (FAOSTAT).
128
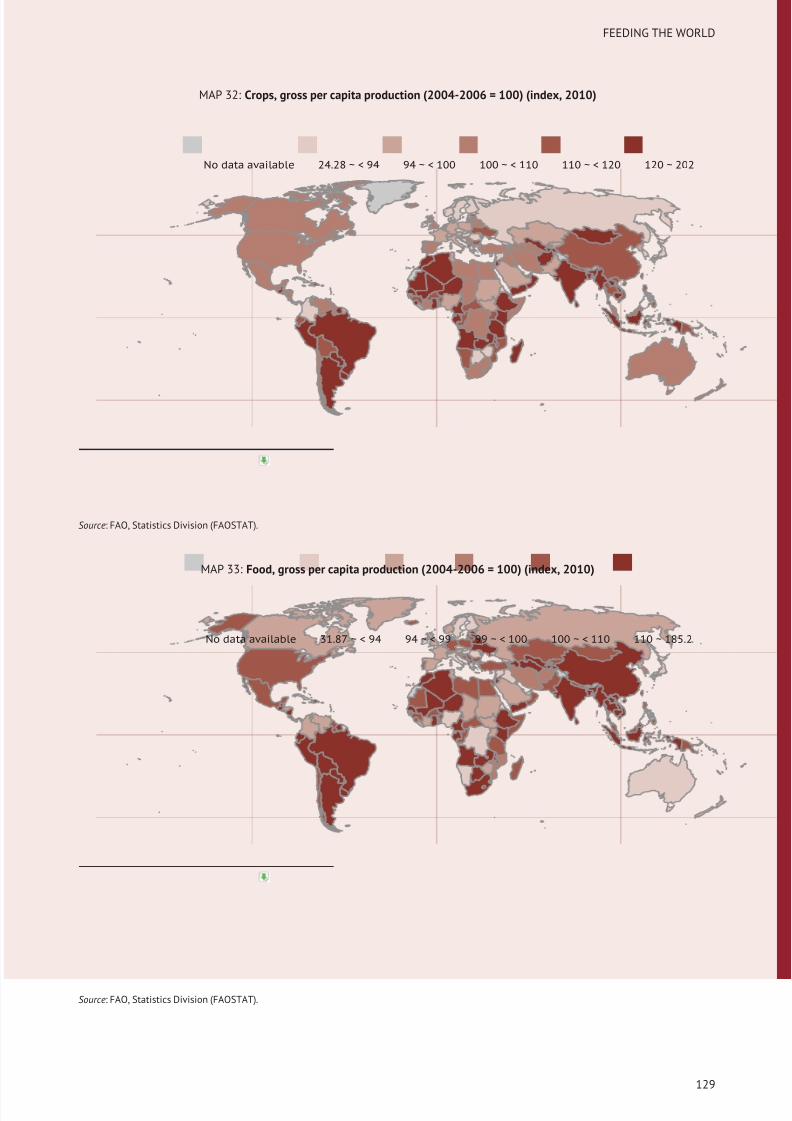
8/16/2019 Informe de la Fao 2013
http://slidepdf.com/reader/full/informe-de-la-fao-2013 147/307
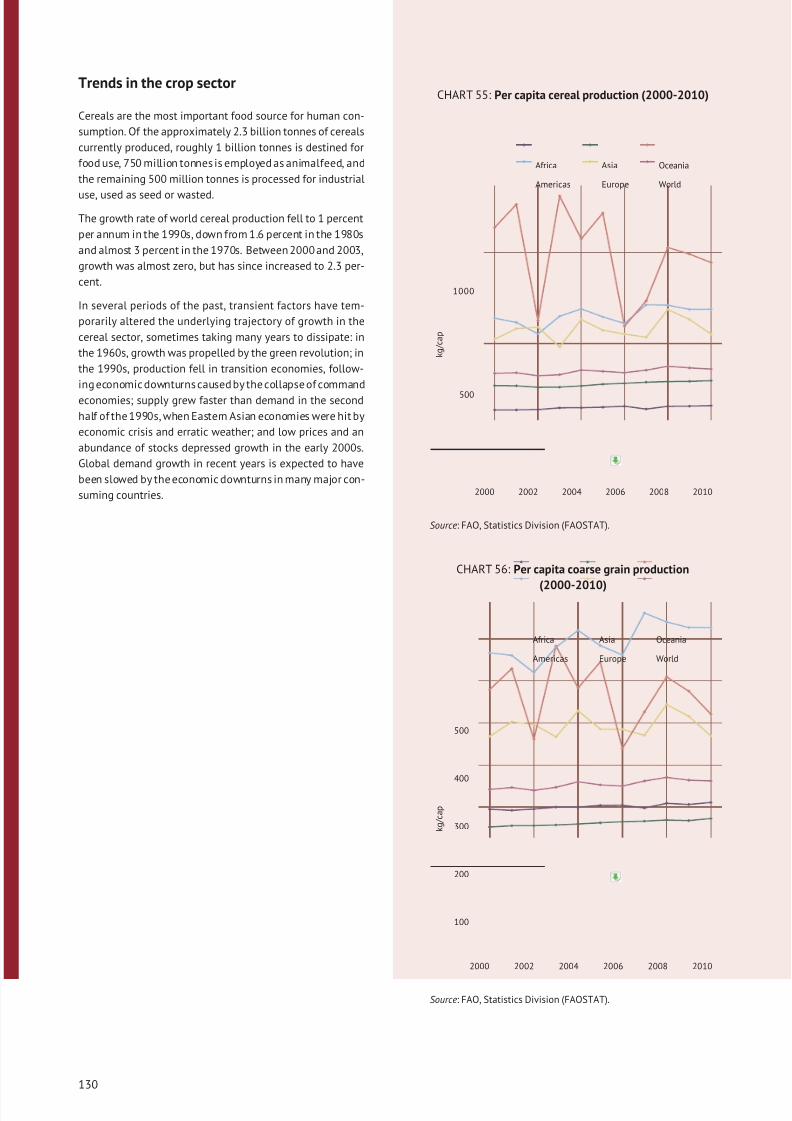
8/16/2019 Informe de la Fao 2013
http://slidepdf.com/reader/full/informe-de-la-fao-2013 148/307
Trends in the crop sector
Cereals are the most important food source for human con-
sumption. Of the approximately 2.3 billion tonnes of cereals
currently produced, roughly 1 billion tonnes is destined for
food use, 750 million tonnes is employed as animalfeed, and
the remaining 500 million tonnes is processed for industrial
use, used as seed or wasted.
The growth rate of world cereal production fell to 1 percent
per annum in the 1990s, down from 1.6 percent in the 1980s
and almost 3 percent in the 1970s. Between 2000 and 2003,
growth was almost zero, but has since increased to 2.3 per-
cent.
In several periods of the past, transient factors have tem-
porarily altered the underlying trajectory of growth in the
cereal sector, sometimes taking many years to dissipate: in
the 1960s, growth was propelled by the green revolution; in
the 1990s, production fell in transition economies, follow-
ing economic downturns caused by the collapse of command
economies; supply grew faster than demand in the second
half of the 1990s, when Eastern Asian economies were hit by
economic crisis and erratic weather; and low prices and an
abundance of stocks depressed growth in the early 2000s.
Global demand growth in recent years is expected to have
been slowed by the economic downturns in many major con-
suming countries.
CHART 55: Per capita cereal production (2000-2010)
500
1000
2000 2002 2004 2006 2008 2010
k g / c a p
Africa
Americas
Asia
Europe
Oceania
World
Source: FAO, Statistics Division (FAOSTAT).
CHART 56: Per capita coarse grain production
(2000-2010)
100
200
300
400
500
2000 2002 2004 2006 2008 2010
k g / c a p
Africa
Americas
Asia
Europe
Oceania
World
Source: FAO, Statistics Division (FAOSTAT).
130
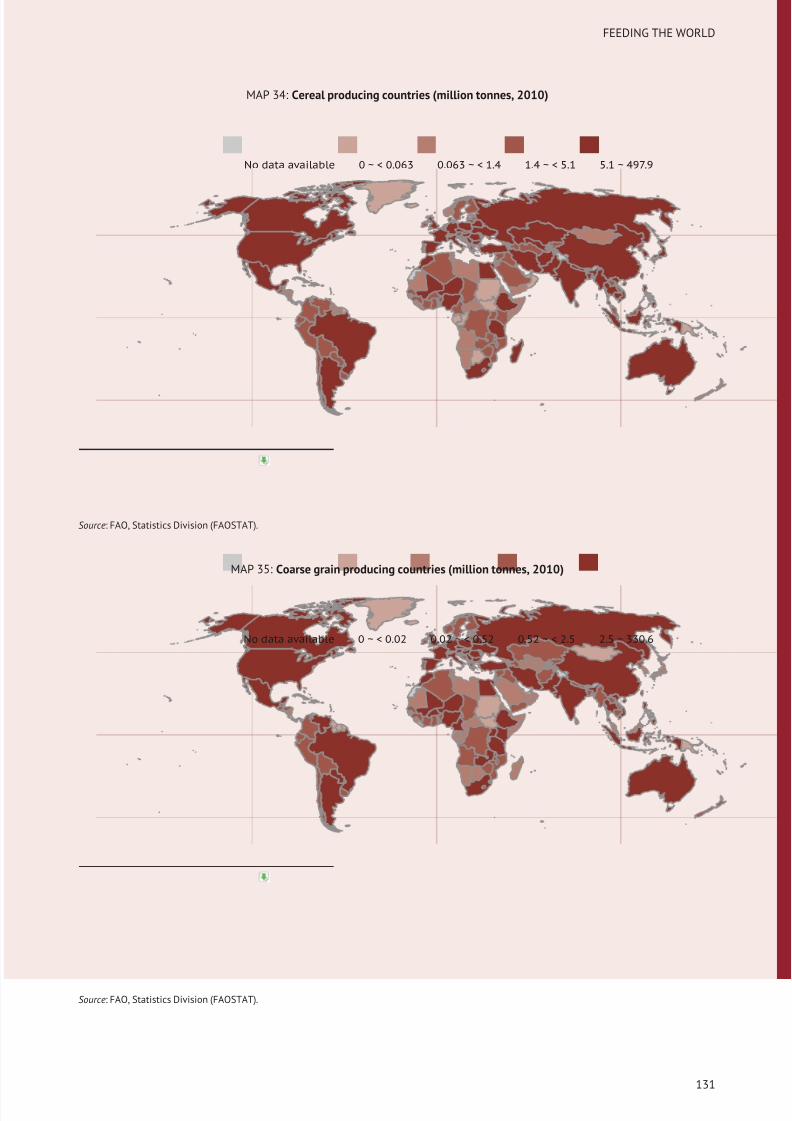
8/16/2019 Informe de la Fao 2013
http://slidepdf.com/reader/full/informe-de-la-fao-2013 149/307
FEEDING THE WORLD
MAP 34: Cereal producing countries (million tonnes, 2010)
No data available 0 ~ < 0.063 0.063 ~ < 1.4 1.4 ~ < 5.1 5.1 ~ 497.9
Source: FAO, Statistics Division (FAOSTAT).
MAP 35: Coarse grain producing countries (million tonnes, 2010)
No data available 0 ~ < 0.02 0.02 ~ < 0.52 0.52 ~ < 2.5 2.5 ~ 330.6
Source: FAO, Statistics Division (FAOSTAT).
131
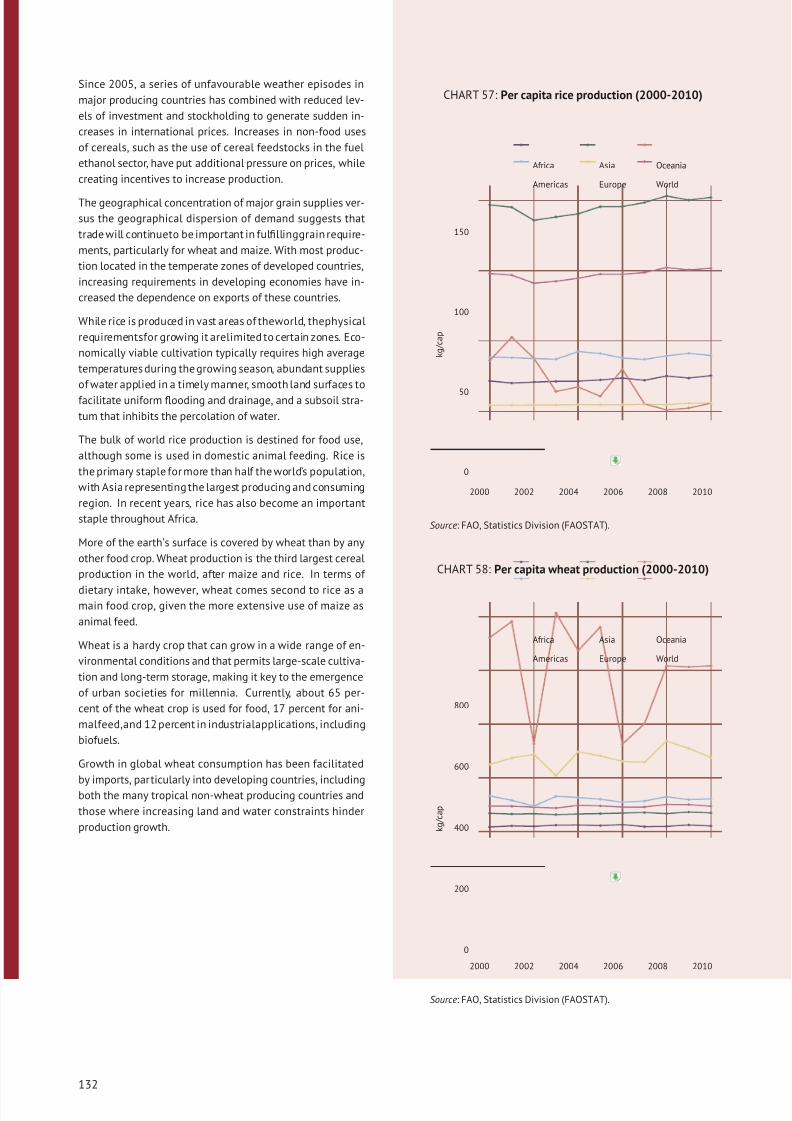
8/16/2019 Informe de la Fao 2013
http://slidepdf.com/reader/full/informe-de-la-fao-2013 150/307
Since 2005, a series of unfavourable weather episodes in
major producing countries has combined with reduced lev-
els of investment and stockholding to generate sudden in-
creases in international prices. Increases in non-food uses
of cereals, such as the use of cereal feedstocks in the fuel
ethanol sector, have put additional pressure on prices, while
creating incentives to increase production.
The geographical concentration of major grain supplies ver-
sus the geographical dispersion of demand suggests that
trade will continueto be important in fulfillinggrain require-
ments, particularly for wheat and maize. With most produc-
tion located in the temperate zones of developed countries,
increasing requirements in developing economies have in-
creased the dependence on exports of these countries.
While rice is produced in vast areas of theworld, thephysical
requirementsfor growing it arelimited to certain zones. Eco-
nomically viable cultivation typically requires high average
temperatures during the growing season, abundant supplies
of water applied in a timely manner, smooth land surfaces to
facilitate uniform flooding and drainage, and a subsoil stra-
tum that inhibits the percolation of water.
The bulk of world rice production is destined for food use,
although some is used in domestic animal feeding. Rice is
the primary staple for more than half the world’s population,
with Asia representing the largest producing and consuming
region. In recent years, rice has also become an important
staple throughout Africa.
More of the earth’s surface is covered by wheat than by any
other food crop. Wheat production is the third largest cereal
production in the world, after maize and rice. In terms of
dietary intake, however, wheat comes second to rice as amain food crop, given the more extensive use of maize as
animal feed.
Wheat is a hardy crop that can grow in a wide range of en-
vironmental conditions and that permits large-scale cultiva-
tion and long-term storage, making it key to the emergence
of urban societies for millennia. Currently, about 65 per-
cent of the wheat crop is used for food, 17 percent for ani-
malfeed,and 12 percent in industrialapplications, including
biofuels.
Growth in global wheat consumption has been facilitated
by imports, particularly into developing countries, includingboth the many tropical non-wheat producing countries and
those where increasing land and water constraints hinder
production growth.
CHART 57: Per capita rice production (2000-2010)
0
50
100
150
2000 2002 2004 2006 2008 2010
k g / c a p
Africa
Americas
Asia
Europe
Oceania
World
Source: FAO, Statistics Division (FAOSTAT).
CHART 58: Per capita wheat production (2000-2010)
0
200
400
600
800
2000 2002 2004 2006 2008 2010
k g / c a p
Africa
Americas
Asia
Europe
Oceania
World
Source: FAO, Statistics Division (FAOSTAT).
132
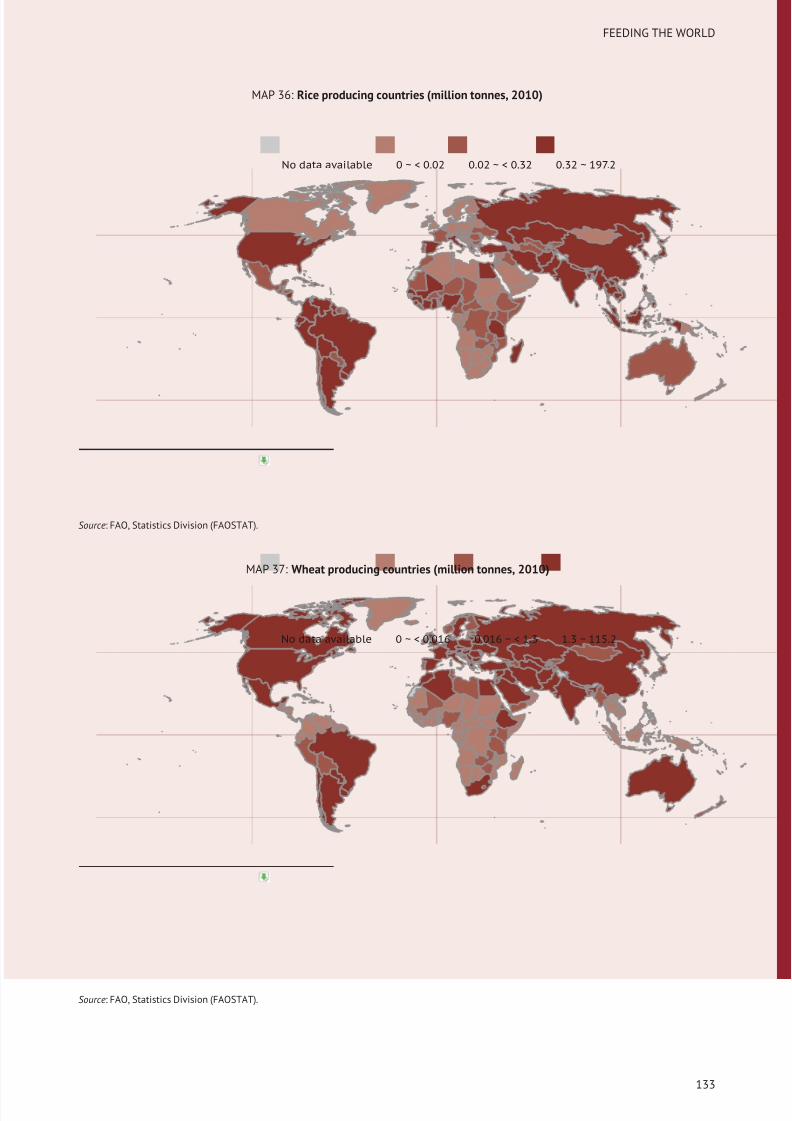
8/16/2019 Informe de la Fao 2013
http://slidepdf.com/reader/full/informe-de-la-fao-2013 151/307
FEEDING THE WORLD
MAP 36: Rice producing countries (million tonnes, 2010)
No data available 0 ~ < 0.02 0.02 ~ < 0.32 0.32 ~ 197.2
Source: FAO, Statistics Division (FAOSTAT).
MAP 37: Wheat producing countries (million tonnes, 2010)
No data available 0 ~ < 0.016 0.016 ~ < 1.3 1.3 ~ 115.2
Source: FAO, Statistics Division (FAOSTAT).
133
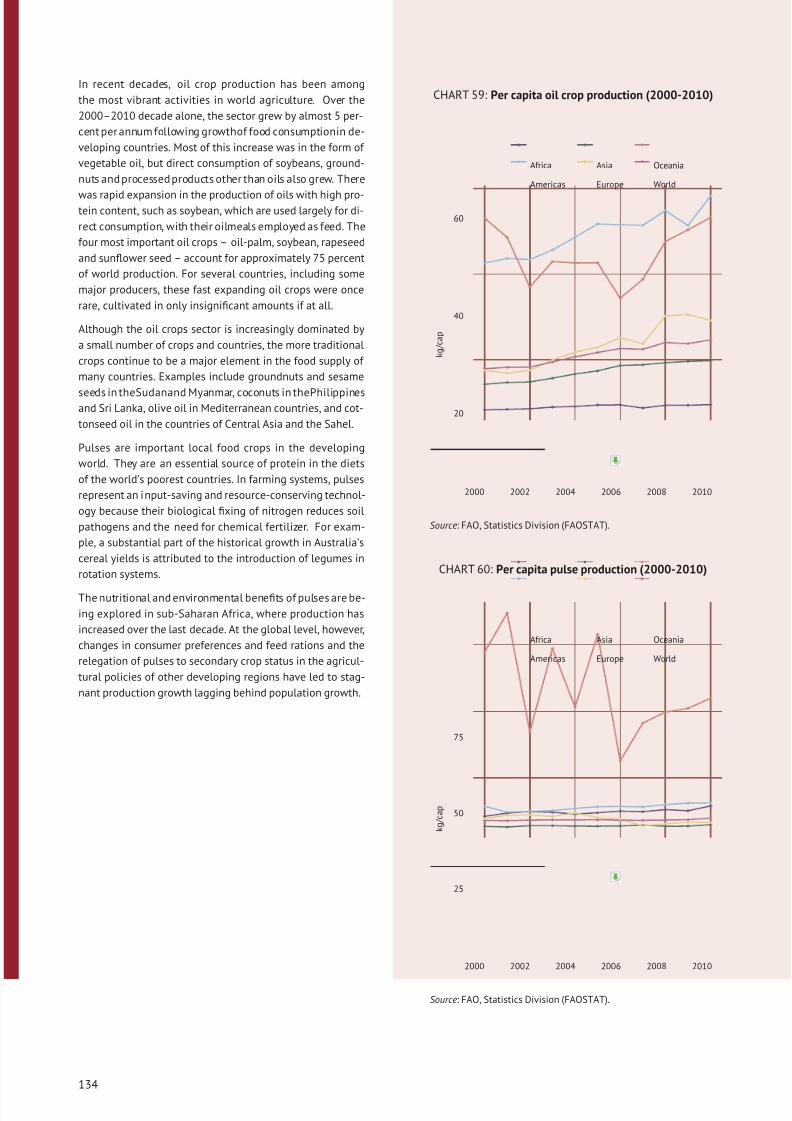
8/16/2019 Informe de la Fao 2013
http://slidepdf.com/reader/full/informe-de-la-fao-2013 152/307
In recent decades, oil crop production has been among
the most vibrant activities in world agriculture. Over the
2000–2010 decade alone, the sector grew by almost 5 per-
cent per annum following growthof food consumptionin de-
veloping countries. Most of this increase was in the form of
vegetable oil, but direct consumption of soybeans, ground-
nuts and processed products other than oils also grew. There
was rapid expansion in the production of oils with high pro-tein content, such as soybean, which are used largely for di-
rect consumption, with their oilmeals employed as feed. The
four most important oil crops – oil-palm, soybean, rapeseed
and sunflower seed – account for approximately 75 percent
of world production. For several countries, including some
major producers, these fast expanding oil crops were once
rare, cultivated in only insignificant amounts if at all.
Although the oil crops sector is increasingly dominated by
a small number of crops and countries, the more traditional
crops continue to be a major element in the food supply of
many countries. Examples include groundnuts and sesame
seeds in theSudanand Myanmar, coconuts in thePhilippinesand Sri Lanka, olive oil in Mediterranean countries, and cot-
tonseed oil in the countries of Central Asia and the Sahel.
Pulses are important local food crops in the developing
world. They are an essential source of protein in the diets
of the world’s poorest countries. In farming systems, pulses
represent an input-saving and resource-conserving technol-
ogy because their biological fixing of nitrogen reduces soil
pathogens and the need for chemical fertilizer. For exam-
ple, a substantial part of the historical growth in Australia’s
cereal yields is attributed to the introduction of legumes in
rotation systems.
The nutritional and environmental benefits of pulses are be-
ing explored in sub-Saharan Africa, where production has
increased over the last decade. At the global level, however,
changes in consumer preferences and feed rations and the
relegation of pulses to secondary crop status in the agricul-
tural policies of other developing regions have led to stag-
nant production growth lagging behind population growth.
CHART 59: Per capita oil crop production (2000-2010)
20
40
60
2000 2002 2004 2006 2008 2010
k g / c a p
Africa
Americas
Asia
Europe
Oceania
World
Source: FAO, Statistics Division (FAOSTAT).
CHART 60: Per capita pulse production (2000-2010)
25
50
75
2000 2002 2004 2006 2008 2010
k g / c a p
Africa
Americas
Asia
Europe
Oceania
World
Source: FAO, Statistics Division (FAOSTAT).
134
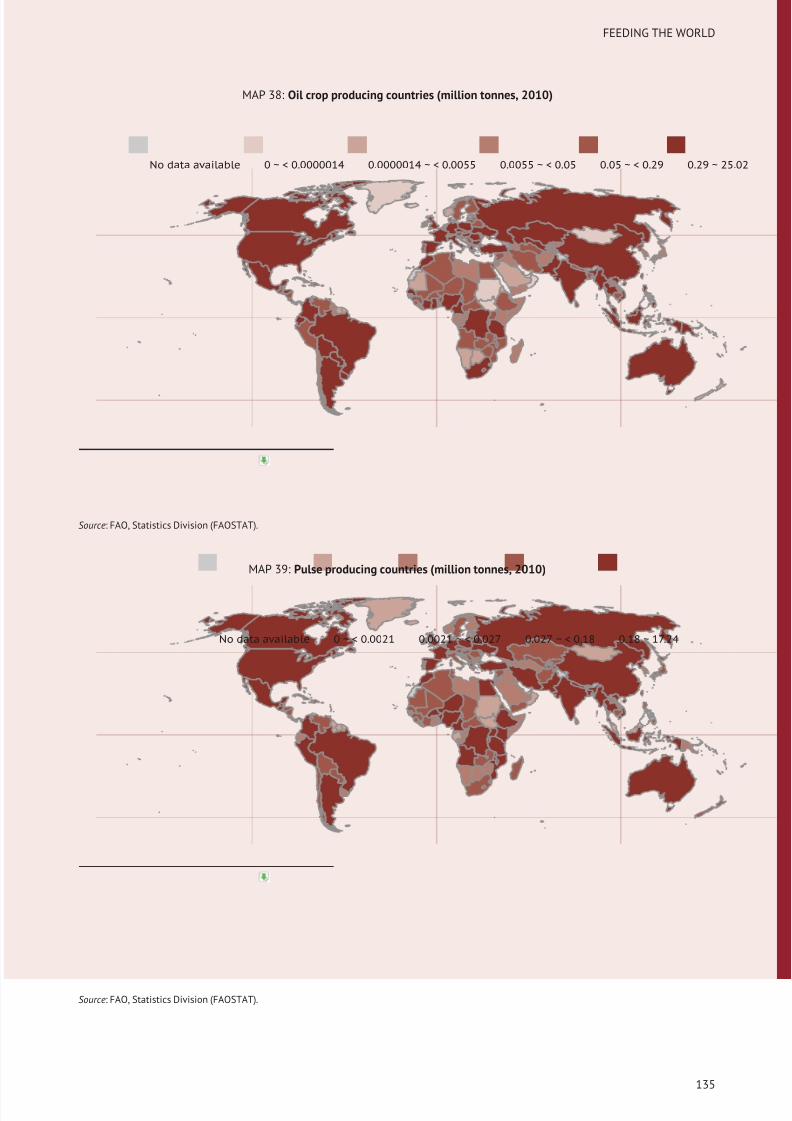
8/16/2019 Informe de la Fao 2013
http://slidepdf.com/reader/full/informe-de-la-fao-2013 153/307
FEEDING THE WORLD
MAP 38: Oil crop producing countries (million tonnes, 2010)
No data available 0 ~ < 0.0000014 0.0000014 ~ < 0.0055 0.0055 ~ < 0.05 0.05 ~ < 0.29 0.29 ~ 25.02
Source: FAO, Statistics Division (FAOSTAT).
MAP 39: Pulse producing countries (million tonnes, 2010)
No data available 0 ~ < 0.0021 0.0021 ~ < 0.027 0.027 ~ < 0.18 0.18 ~ 17.24
Source: FAO, Statistics Division (FAOSTAT).
135
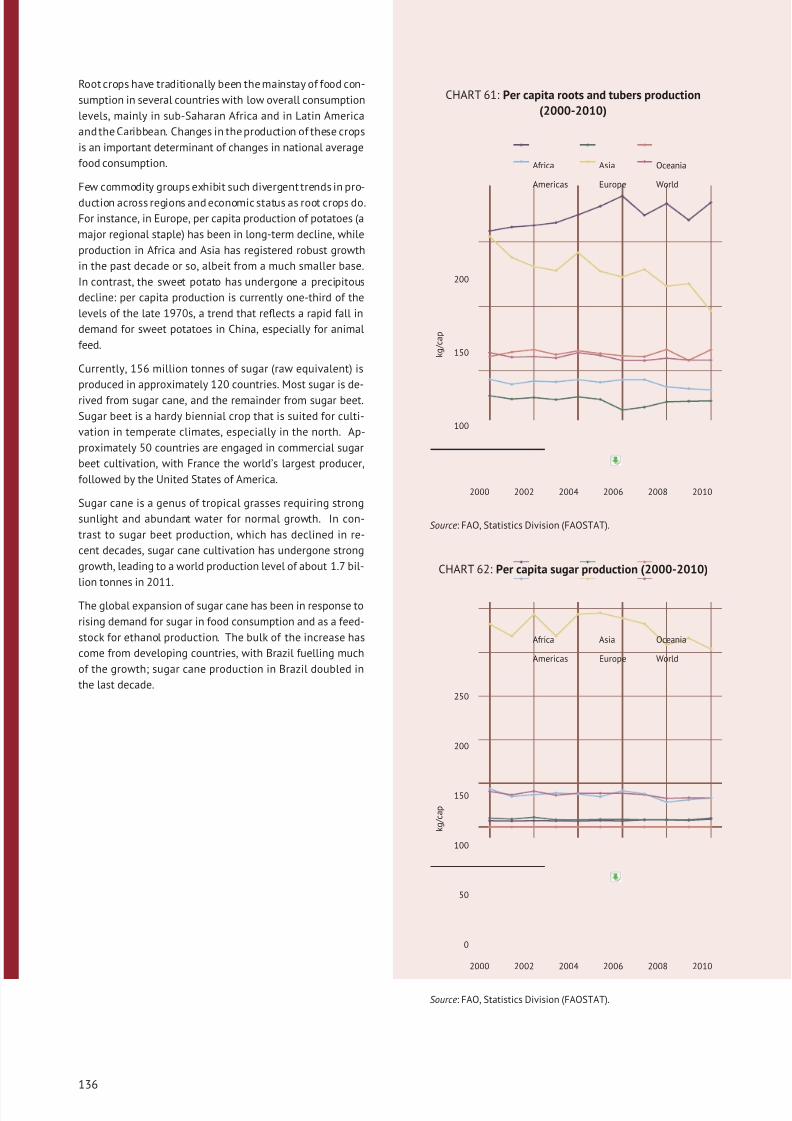
8/16/2019 Informe de la Fao 2013
http://slidepdf.com/reader/full/informe-de-la-fao-2013 154/307
Root crops have traditionally been the mainstay of food con-
sumption in several countries with low overall consumption
levels, mainly in sub-Saharan Africa and in Latin America
and the Caribbean. Changes in the production of these crops
is an important determinant of changes in national average
food consumption.
Few commodity groups exhibit such divergent trends in pro-
duction across regions and economic status as root crops do.
For instance, in Europe, per capita production of potatoes (a
major regional staple) has been in long-term decline, while
production in Africa and Asia has registered robust growth
in the past decade or so, albeit from a much smaller base.
In contrast, the sweet potato has undergone a precipitous
decline: per capita production is currently one-third of the
levels of the late 1970s, a trend that reflects a rapid fall in
demand for sweet potatoes in China, especially for animal
feed.
Currently, 156 million tonnes of sugar (raw equivalent) is
produced in approximately 120 countries. Most sugar is de-
rived from sugar cane, and the remainder from sugar beet.
Sugar beet is a hardy biennial crop that is suited for culti-
vation in temperate climates, especially in the north. Ap-
proximately 50 countries are engaged in commercial sugar
beet cultivation, with France the world’s largest producer,
followed by the United States of America.
Sugar cane is a genus of tropical grasses requiring strong
sunlight and abundant water for normal growth. In con-
trast to sugar beet production, which has declined in re-
cent decades, sugar cane cultivation has undergone strong
growth, leading to a world production level of about 1.7 bil-
lion tonnes in 2011.
The global expansion of sugar cane has been in response to
rising demand for sugar in food consumption and as a feed-
stock for ethanol production. The bulk of the increase has
come from developing countries, with Brazil fuelling much
of the growth; sugar cane production in Brazil doubled in
the last decade.
CHART 61: Per capita roots and tubers production
(2000-2010)
100
150
200
2000 2002 2004 2006 2008 2010
k g / c a p
Africa
Americas
Asia
Europe
Oceania
World
Source: FAO, Statistics Division (FAOSTAT).
CHART 62: Per capita sugar production (2000-2010)
0
50
100
150
200
250
2000 2002 2004 2006 2008 2010
k g / c a p
Africa
Americas
Asia
Europe
Oceania
World
Source: FAO, Statistics Division (FAOSTAT).
136
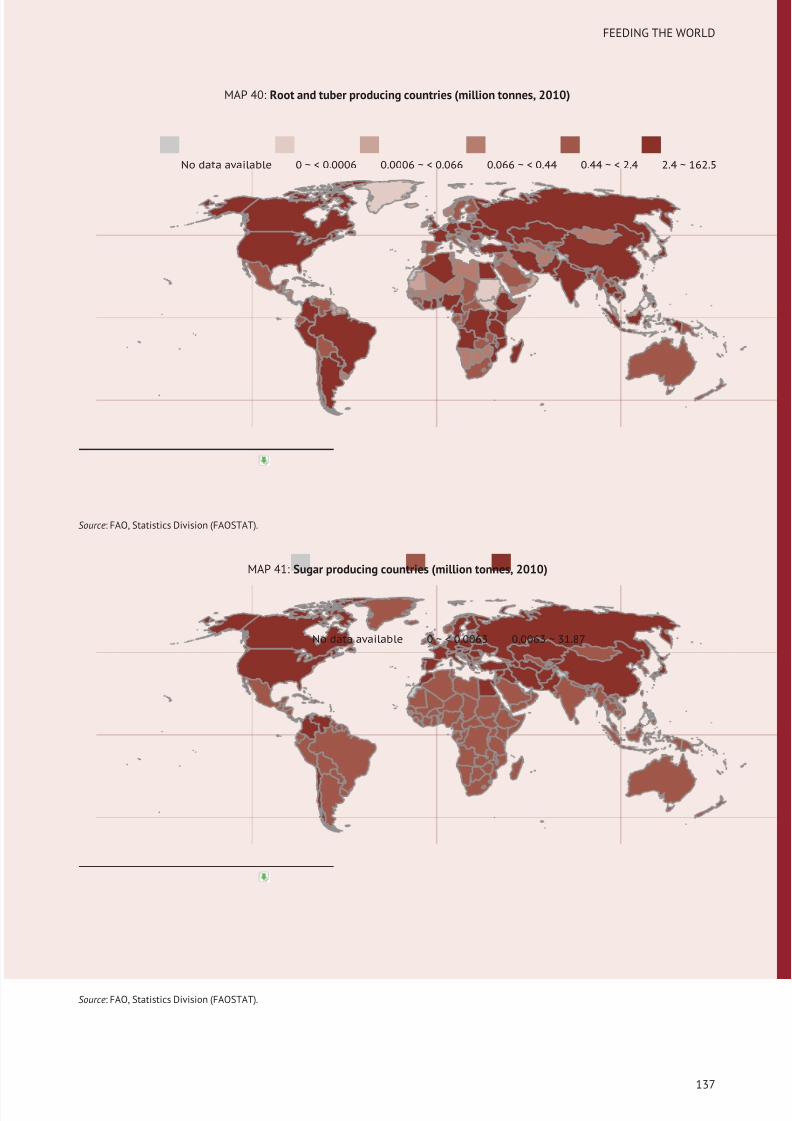
8/16/2019 Informe de la Fao 2013
http://slidepdf.com/reader/full/informe-de-la-fao-2013 155/307
FEEDING THE WORLD
MAP 40: Root and tuber producing countries (million tonnes, 2010)
No data available 0 ~ < 0.0006 0.0006 ~ < 0.066 0.066 ~ < 0.44 0.44 ~ < 2.4 2.4 ~ 162.5
Source: FAO, Statistics Division (FAOSTAT).
MAP 41: Sugar producing countries (million tonnes, 2010)
No data available 0 ~ < 0.0063 0.0063 ~ 31.87
Source: FAO, Statistics Division (FAOSTAT).
137
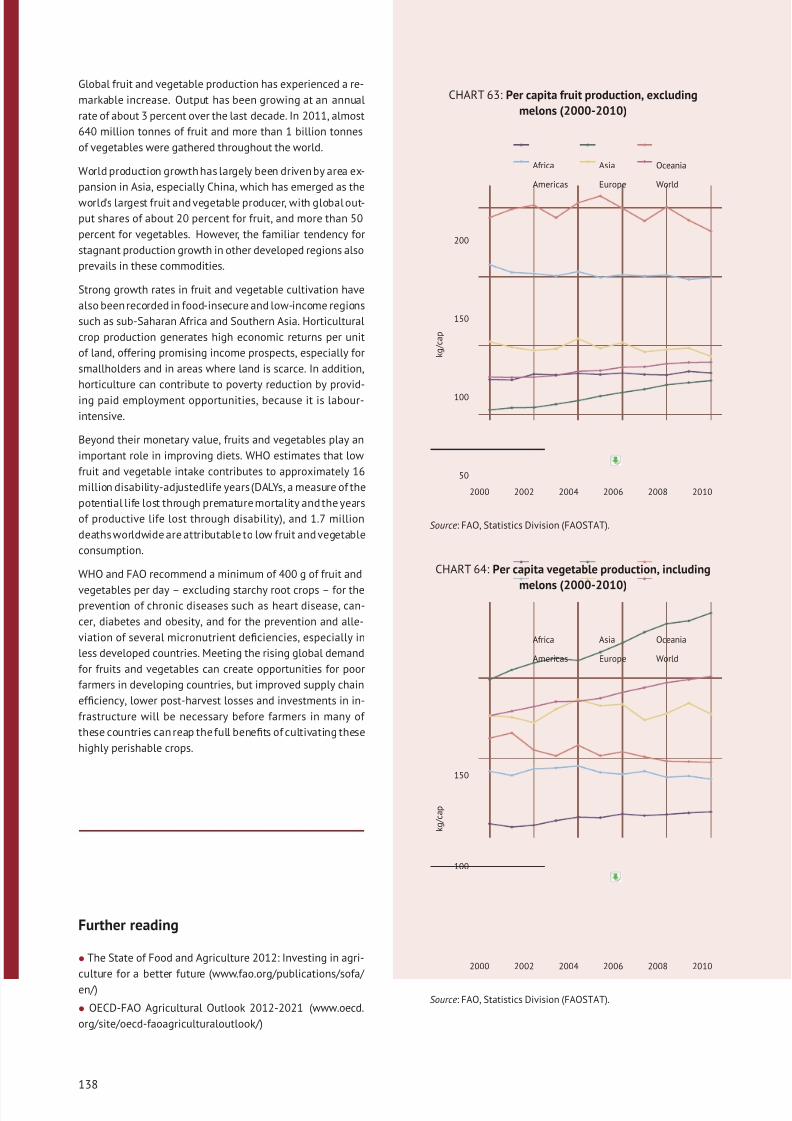
8/16/2019 Informe de la Fao 2013
http://slidepdf.com/reader/full/informe-de-la-fao-2013 156/307
Global fruit and vegetable production has experienced a re-
markable increase. Output has been growing at an annual
rate of about 3 percent over the last decade. In 2011, almost
640 million tonnes of fruit and more than 1 billion tonnes
of vegetables were gathered throughout the world.
World production growth has largely been driven by area ex-
pansion in Asia, especially China, which has emerged as the
world’s largest fruit and vegetable producer, with global out-
put shares of about 20 percent for fruit, and more than 50
percent for vegetables. However, the familiar tendency for
stagnant production growth in other developed regions also
prevails in these commodities.
Strong growth rates in fruit and vegetable cultivation have
also been recorded in food-insecure and low-income regions
such as sub-Saharan Africa and Southern Asia. Horticultural
crop production generates high economic returns per unit
of land, offering promising income prospects, especially for
smallholders and in areas where land is scarce. In addition,
horticulture can contribute to poverty reduction by provid-
ing paid employment opportunities, because it is labour-
intensive.
Beyond their monetary value, fruits and vegetables play an
important role in improving diets. WHO estimates that low
fruit and vegetable intake contributes to approximately 16
million disability-adjustedlife years(DALYs, a measure of the
potential life lost through premature mortality and the years
of productive life lost through disability), and 1.7 million
deaths worldwide are attributable to low fruit and vegetable
consumption.
WHO and FAO recommend a minimum of 400 g of fruit and
vegetables per day – excluding starchy root crops – for theprevention of chronic diseases such as heart disease, can-
cer, diabetes and obesity, and for the prevention and alle-
viation of several micronutrient deficiencies, especially in
less developed countries. Meeting the rising global demand
for fruits and vegetables can create opportunities for poor
farmers in developing countries, but improved supply chain
efficiency, lower post-harvest losses and investments in in-
frastructure will be necessary before farmers in many of
these countries can reap the full benefits of cultivating these
highly perishable crops.
Further reading
• The State of Food and Agriculture 2012: Investing in agri-
culture for a better future (www.fao.org/publications/sofa/
en/)
• OECD-FAO Agricultural Outlook 2012-2021 (www.oecd.
org/site/oecd-faoagriculturaloutlook/)
CHART 63: Per capita fruit production, excluding
melons (2000-2010)
50
100
150
200
2000 2002 2004 2006 2008 2010
k g / c a p
Africa
Americas
Asia
Europe
Oceania
World
Source: FAO, Statistics Division (FAOSTAT).
CHART 64: Per capita vegetable production, including
melons (2000-2010)
100
150
2000 2002 2004 2006 2008 2010
k g / c a p
Africa
Americas
Asia
Europe
Oceania
World
Source: FAO, Statistics Division (FAOSTAT).
138
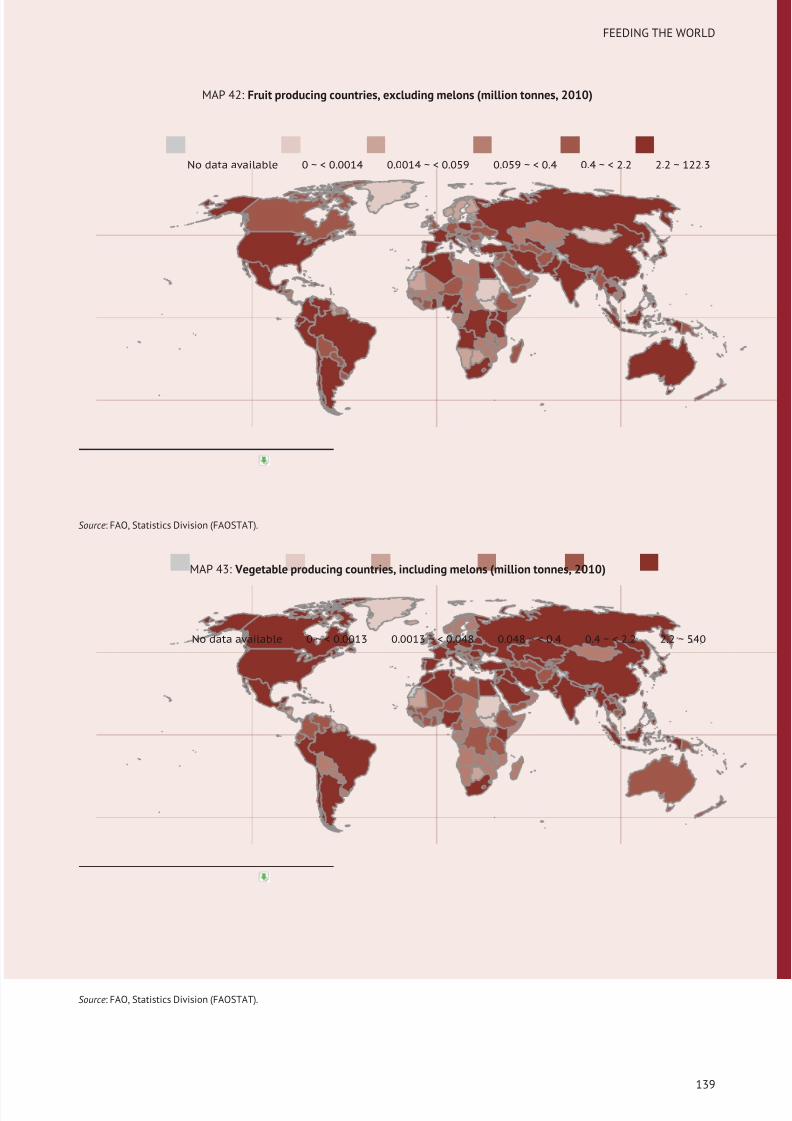
8/16/2019 Informe de la Fao 2013
http://slidepdf.com/reader/full/informe-de-la-fao-2013 157/307
FEEDING THE WORLD
MAP 42: Fruit producing countries, excluding melons (million tonnes, 2010)
No data available 0 ~ < 0.0014 0.0014 ~ < 0.059 0.059 ~ < 0.4 0.4 ~ < 2.2 2.2 ~ 122.3
Source: FAO, Statistics Division (FAOSTAT).
MAP 43: Vegetable producing countries, including melons (million tonnes, 2010)
No data available 0 ~ < 0.0013 0.0013 ~ < 0.048 0.048 ~ < 0.4 0.4 ~ < 2.2 2.2 ~ 540
Source: FAO, Statistics Division (FAOSTAT).
139
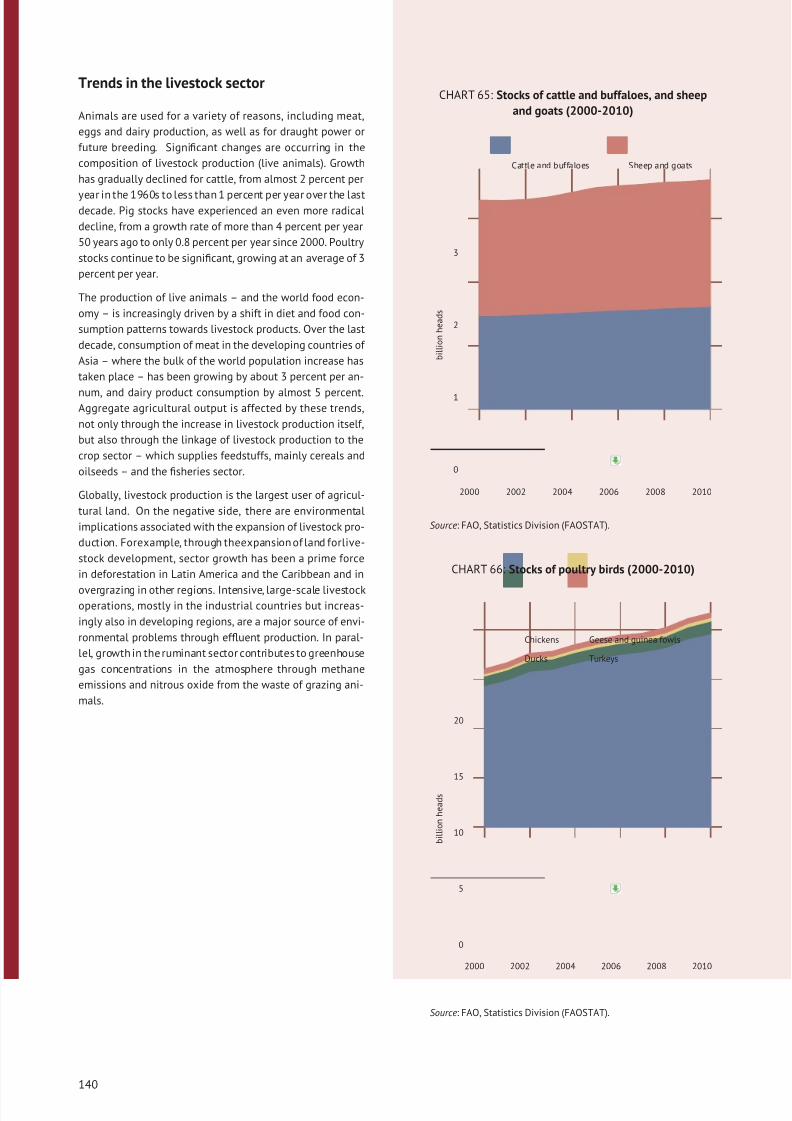
8/16/2019 Informe de la Fao 2013
http://slidepdf.com/reader/full/informe-de-la-fao-2013 158/307
Trends in the livestock sector
Animals are used for a variety of reasons, including meat,
eggs and dairy production, as well as for draught power or
future breeding. Significant changes are occurring in the
composition of livestock production (live animals). Growth
has gradually declined for cattle, from almost 2 percent per
year in the 1960s to less than 1 percent per year over the lastdecade. Pig stocks have experienced an even more radical
decline, from a growth rate of more than 4 percent per year
50 years ago to only 0.8 percent per year since 2000. Poultry
stocks continue to be significant, growing at an average of 3
percent per year.
The production of live animals – and the world food econ-
omy – is increasingly driven by a shift in diet and food con-
sumption patterns towards livestock products. Over the last
decade, consumption of meat in the developing countries of
Asia – where the bulk of the world population increase has
taken place – has been growing by about 3 percent per an-
num, and dairy product consumption by almost 5 percent.Aggregate agricultural output is affected by these trends,
not only through the increase in livestock production itself,
but also through the linkage of livestock production to the
crop sector – which supplies feedstuffs, mainly cereals and
oilseeds – and the fisheries sector.
Globally, livestock production is the largest user of agricul-
tural land. On the negative side, there are environmental
implications associated with the expansion of livestock pro-
duction. Forexample, through theexpansion of land forlive-
stock development, sector growth has been a prime force
in deforestation in Latin America and the Caribbean and in
overgrazing in other regions. Intensive, large-scale livestockoperations, mostly in the industrial countries but increas-
ingly also in developing regions, are a major source of envi-
ronmental problems through effluent production. In paral-
lel, growth in the ruminant sector contributes to greenhouse
gas concentrations in the atmosphere through methane
emissions and nitrous oxide from the waste of grazing ani-
mals.
CHART 65: Stocks of cattle and buffaloes, and sheep
and goats (2000-2010)
0
1
2
3
2000 2002 2004 2006 2008 2010
b i l l i o n h e a d s
Cattle and buffaloes Sheep and goats
Source: FAO, Statistics Division (FAOSTAT).
CHART 66: Stocks of poultry birds (2000-2010)
0
5
10
15
20
2000 2002 2004 2006 2008 2010
b i l l i o n h e a d s
Chickens
Ducks
Geese and guinea fowls
Turkeys
Source: FAO, Statistics Division (FAOSTAT).
140
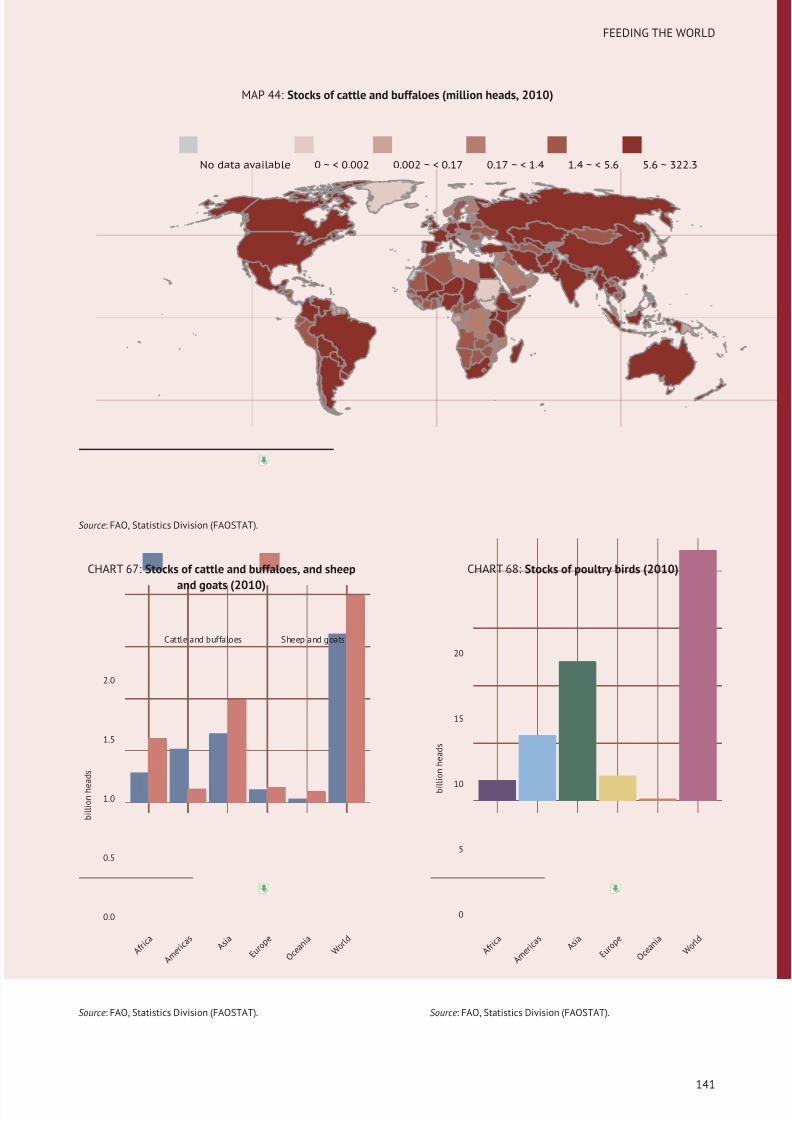
8/16/2019 Informe de la Fao 2013
http://slidepdf.com/reader/full/informe-de-la-fao-2013 159/307
FEEDING THE WORLD
MAP 44: Stocks of cattle and buffaloes (million heads, 2010)
No data available 0 ~ < 0.002 0.002 ~ < 0.17 0.17 ~ < 1.4 1.4 ~ < 5.6 5.6 ~ 322.3
Source: FAO, Statistics Division (FAOSTAT).
CHART 67: Stocks of cattle and buffaloes, and sheep
and goats (2010)
0.0
0.5
1.0
1.5
2.0
A f r i c a
A m e r i c a s
A s i a
E u r o p e
O c e a n i a
W o r l d
b i l l i o n h e
a d s
Cattle and buffaloes Sheep and goats
Source: FAO, Statistics Division (FAOSTAT).
CHART 68: Stocks of poultry birds (2010)
0
5
10
15
20
A f r i c a
A m e r i c a s
A s i a
E u r o p e
O c e a n i a
W o r l d
b i l
l i o n h e a d s
Source: FAO, Statistics Division (FAOSTAT).
141
http://ldvapp07.fao.org:8032/faosyb/rest/get/2013/others/1990-2010/QA.STCK.CB.HD.NO,QA.STCK.SG.HD.NO
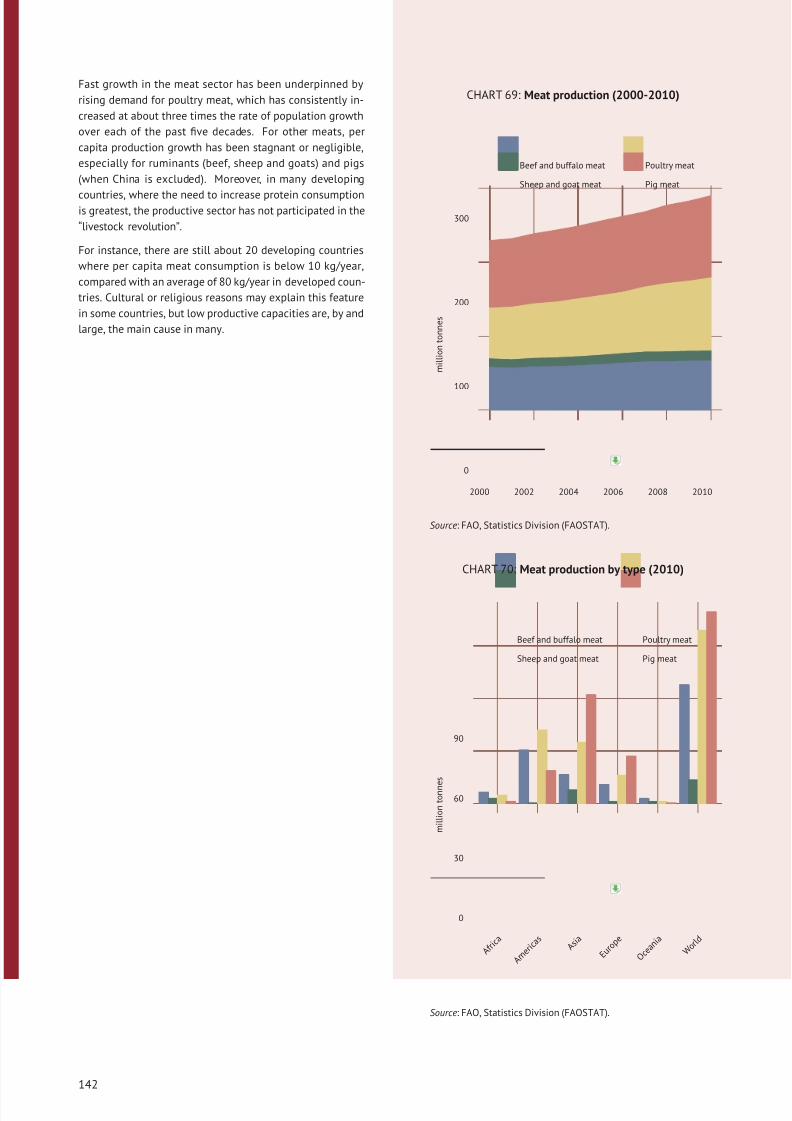
8/16/2019 Informe de la Fao 2013
http://slidepdf.com/reader/full/informe-de-la-fao-2013 160/307
Fast growth in the meat sector has been underpinned by
rising demand for poultry meat, which has consistently in-
creased at about three times the rate of population growth
over each of the past five decades. For other meats, per
capita production growth has been stagnant or negligible,
especially for ruminants (beef, sheep and goats) and pigs
(when China is excluded). Moreover, in many developing
countries, where the need to increase protein consumptionis greatest, the productive sector has not participated in the
“livestock revolution”.
For instance, there are still about 20 developing countries
where per capita meat consumption is below 10 kg/year,
compared with an average of 80 kg/year in developed coun-
tries. Cultural or religious reasons may explain this feature
in some countries, but low productive capacities are, by and
large, the main cause in many.
CHART 69: Meat production (2000-2010)
0
100
200
300
2000 2002 2004 2006 2008 2010
m i l l i o n t o n n e s
Beef and buffalo meat
Sheep and goat meat
Poultry meat
Pig meat
Source: FAO, Statistics Division (FAOSTAT).
CHART 70: Meat production by type (2010)
0
30
60
90
A f r i c a
A m e r i c a s
A s i a
E u r o p e
O c e a n i a
W o r l d
m i l l i o n t o n n e s
Beef and buffalo meat
Sheep and goat meat
Poultry meat
Pig meat
Source: FAO, Statistics Division (FAOSTAT).
142
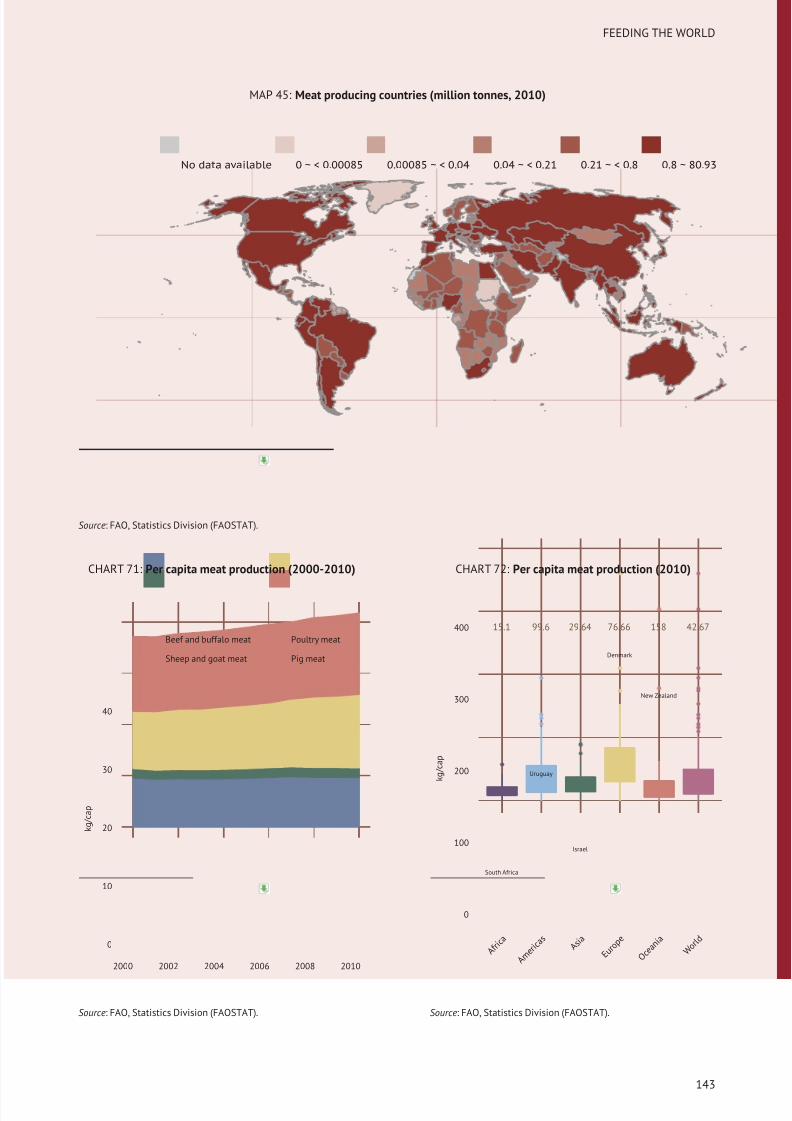
8/16/2019 Informe de la Fao 2013
http://slidepdf.com/reader/full/informe-de-la-fao-2013 161/307
FEEDING THE WORLD
MAP 45: Meat producing countries (million tonnes, 2010)
No data available 0 ~ < 0.00085 0.00085 ~ < 0.04 0.04 ~ < 0.21 0.21 ~ < 0.8 0.8 ~ 80.93
Source: FAO, Statistics Division (FAOSTAT).
CHART 71: Per capita meat production (2000-2010)
0
10
20
30
40
2000 2002 2004 2006 2008 2010
k g / c a p
Beef and buffalo meat
Sheep and goat meat
Poultry meat
Pig meat
Source: FAO, Statistics Division (FAOSTAT).
CHART 72: Per capita meat production (2010)
42.6715.1 15899.6 29.64 76.66
South Africa
Uruguay
Israel
Denmark
New Zealand
0
100
200
300
400
A f r i c a
A m e r i c a s
A s i a
E u r o p e
O c e a n i a
W o r l d
k g / c a p
Source: FAO, Statistics Division (FAOSTAT).
143
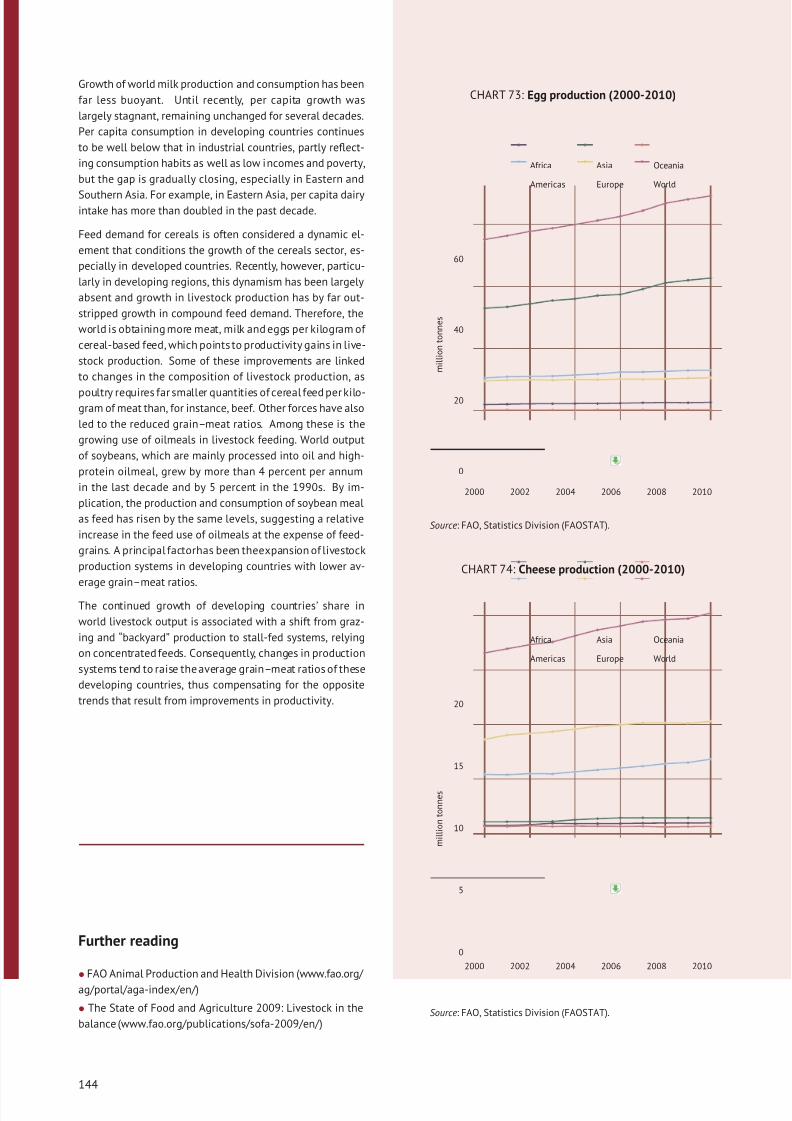
8/16/2019 Informe de la Fao 2013
http://slidepdf.com/reader/full/informe-de-la-fao-2013 162/307
Growth of world milk production and consumption has been
far less buoyant. Until recently, per capita growth was
largely stagnant, remaining unchanged for several decades.
Per capita consumption in developing countries continues
to be well below that in industrial countries, partly reflect-
ing consumption habits as well as low incomes and poverty,
but the gap is gradually closing, especially in Eastern and
Southern Asia. For example, in Eastern Asia, per capita dairyintake has more than doubled in the past decade.
Feed demand for cereals is often considered a dynamic el-
ement that conditions the growth of the cereals sector, es-
pecially in developed countries. Recently, however, particu-
larly in developing regions, this dynamism has been largely
absent and growth in livestock production has by far out-
stripped growth in compound feed demand. Therefore, the
world is obtaining more meat, milk and eggs per kilogram of
cereal-based feed, which points to productivity gains in live-
stock production. Some of these improvements are linked
to changes in the composition of livestock production, as
poultry requires far smaller quantities of cereal feed per kilo-gram of meat than, for instance, beef. Other forces have also
led to the reduced grain–meat ratios. Among these is the
growing use of oilmeals in livestock feeding. World output
of soybeans, which are mainly processed into oil and high-
protein oilmeal, grew by more than 4 percent per annum
in the last decade and by 5 percent in the 1990s. By im-
plication, the production and consumption of soybean meal
as feed has risen by the same levels, suggesting a relative
increase in the feed use of oilmeals at the expense of feed-
grains. A principal factorhas been theexpansion of livestock
production systems in developing countries with lower av-
erage grain–meat ratios.
The continued growth of developing countries’ share in
world livestock output is associated with a shift from graz-
ing and “backyard” production to stall-fed systems, relying
on concentrated feeds. Consequently, changes in production
systems tend to raise the average grain–meat ratios of these
developing countries, thus compensating for the opposite
trends that result from improvements in productivity.
Further reading
• FAO Animal Production and Health Division (www.fao.org/
ag/portal/aga-index/en/)
• The State of Food and Agriculture 2009: Livestock in the
balance (www.fao.org/publications/sofa-2009/en/ )
CHART 73: Egg production (2000-2010)
0
20
40
60
2000 2002 2004 2006 2008 2010
m i l l i o n t o n n e s
Africa
Americas
Asia
Europe
Oceania
World
Source: FAO, Statistics Division (FAOSTAT).
CHART 74: Cheese production (2000-2010)
0
5
10
15
20
2000 2002 2004 2006 2008 2010
m i l l i o n t o n n e s
Africa
Americas
Asia
Europe
Oceania
World
Source: FAO, Statistics Division (FAOSTAT).
144
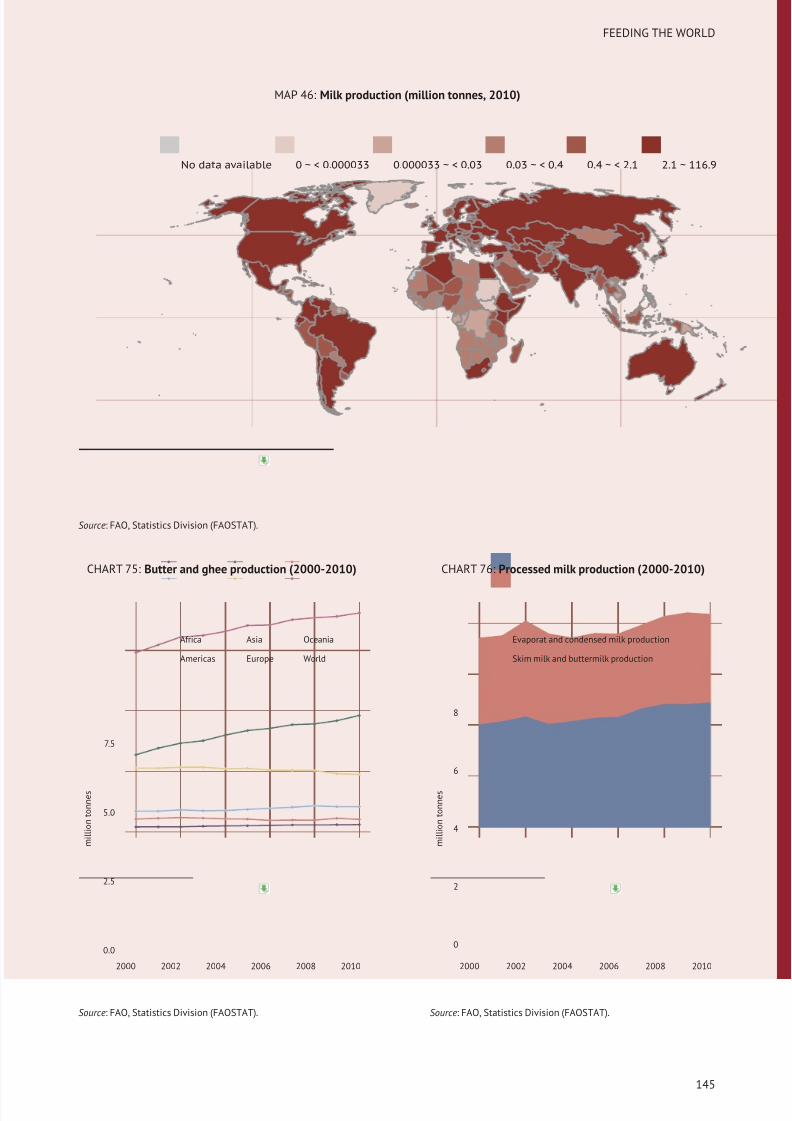
8/16/2019 Informe de la Fao 2013
http://slidepdf.com/reader/full/informe-de-la-fao-2013 163/307
FEEDING THE WORLD
MAP 46: Milk production (million tonnes, 2010)
No data available 0 ~ < 0.000033 0.000033 ~ < 0.03 0.03 ~ < 0.4 0.4 ~ < 2.1 2.1 ~ 116.9
Source: FAO, Statistics Division (FAOSTAT).
CHART 75: Butter and ghee production (2000-2010)
0.0
2.5
5.0
7.5
2000 2002 2004 2006 2008 2010
m i l l i o n t o n n e s
Africa
Americas
Asia
Europe
Oceania
World
Source: FAO, Statistics Division (FAOSTAT).
CHART 76: Processed milk production (2000-2010)
0
2
4
6
8
2000 2002 2004 2006 2008 2010
m i l l i o n t o n n e s
Evaporat and condensed milk production
Skim milk and buttermilk production
Source: FAO, Statistics Division (FAOSTAT).
145
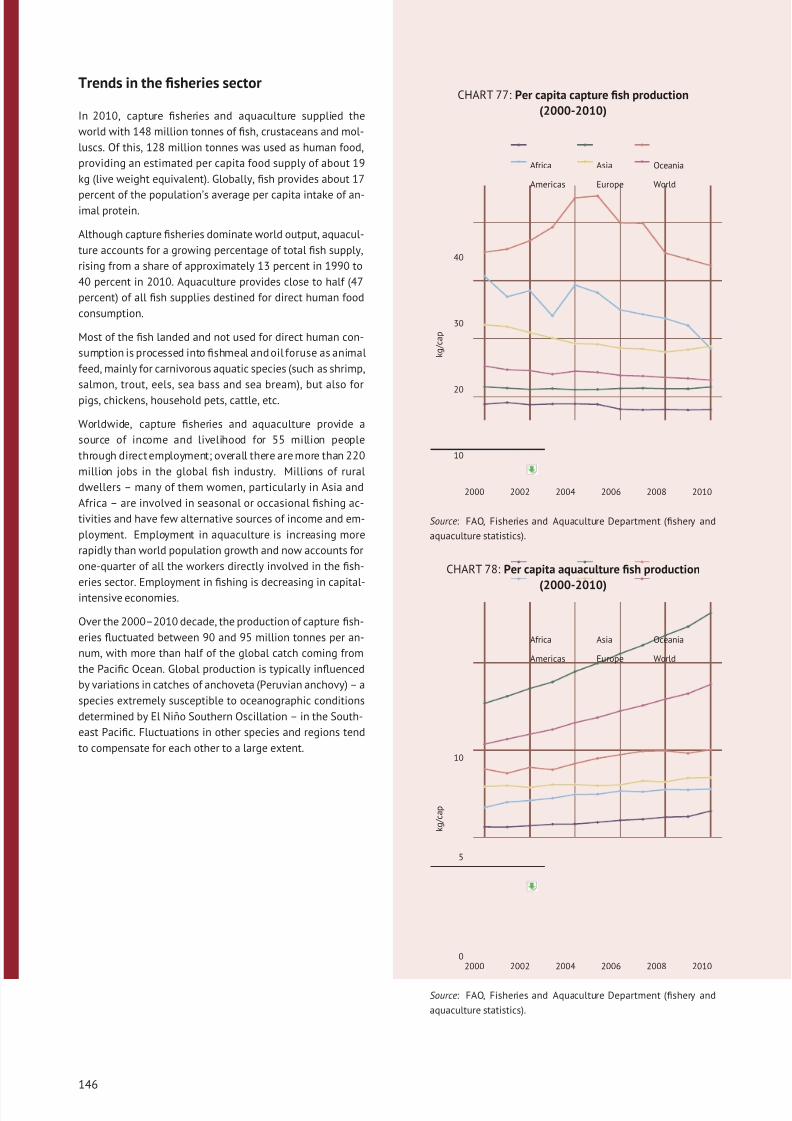
8/16/2019 Informe de la Fao 2013
http://slidepdf.com/reader/full/informe-de-la-fao-2013 164/307
Trends in the fisheries sector
In 2010, capture fisheries and aquaculture supplied the
world with 148 million tonnes of fish, crustaceans and mol-
luscs. Of this, 128 million tonnes was used as human food,
providing an estimated per capita food supply of about 19
kg (live weight equivalent). Globally, fish provides about 17
percent of the population’s average per capita intake of an-imal protein.
Although capture fisheries dominate world output, aquacul-
ture accounts for a growing percentage of total fish supply,
rising from a share of approximately 13 percent in 1990 to
40 percent in 2010. Aquaculture provides close to half (47
percent) of all fish supplies destined for direct human food
consumption.
Most of the fish landed and not used for direct human con-
sumption is processed into fishmeal and oil foruse as animal
feed, mainly for carnivorous aquatic species (such as shrimp,
salmon, trout, eels, sea bass and sea bream), but also for
pigs, chickens, household pets, cattle, etc.
Worldwide, capture fisheries and aquaculture provide a
source of income and livelihood for 55 million people
through direct employment; overall there are more than 220
million jobs in the global fish industry. Millions of rural
dwellers – many of them women, particularly in Asia and
Africa – are involved in seasonal or occasional fishing ac-
tivities and have few alternative sources of income and em-
ployment. Employment in aquaculture is increasing more
rapidly than world population growth and now accounts for
one-quarter of all the workers directly involved in the fish-
eries sector. Employment in fishing is decreasing in capital-
intensive economies.
Over the 2000–2010 decade, the production of capture fish-
eries fluctuated between 90 and 95 million tonnes per an-
num, with more than half of the global catch coming from
the Pacific Ocean. Global production is typically influenced
by variations in catches of anchoveta (Peruvian anchovy) – a
species extremely susceptible to oceanographic conditions
determined by El Niño Southern Oscillation – in the South-
east Pacific. Fluctuations in other species and regions tend
to compensate for each other to a large extent.
CHART 77: Per capita capture fish production
(2000-2010)
10
20
30
40
2000 2002 2004 2006 2008 2010
k g / c a p
Africa
Americas
Asia
Europe
Oceania
World
Source: FAO, Fisheries and Aquaculture Department (fishery and
aquaculture statistics).
CHART 78: Per capita aquaculture fish production
(2000-2010)
0
5
10
2000 2002 2004 2006 2008 2010
k g / c a p
Africa
Americas
Asia
Europe
Oceania
World
Source: FAO, Fisheries and Aquaculture Department (fishery and
aquaculture statistics).
146
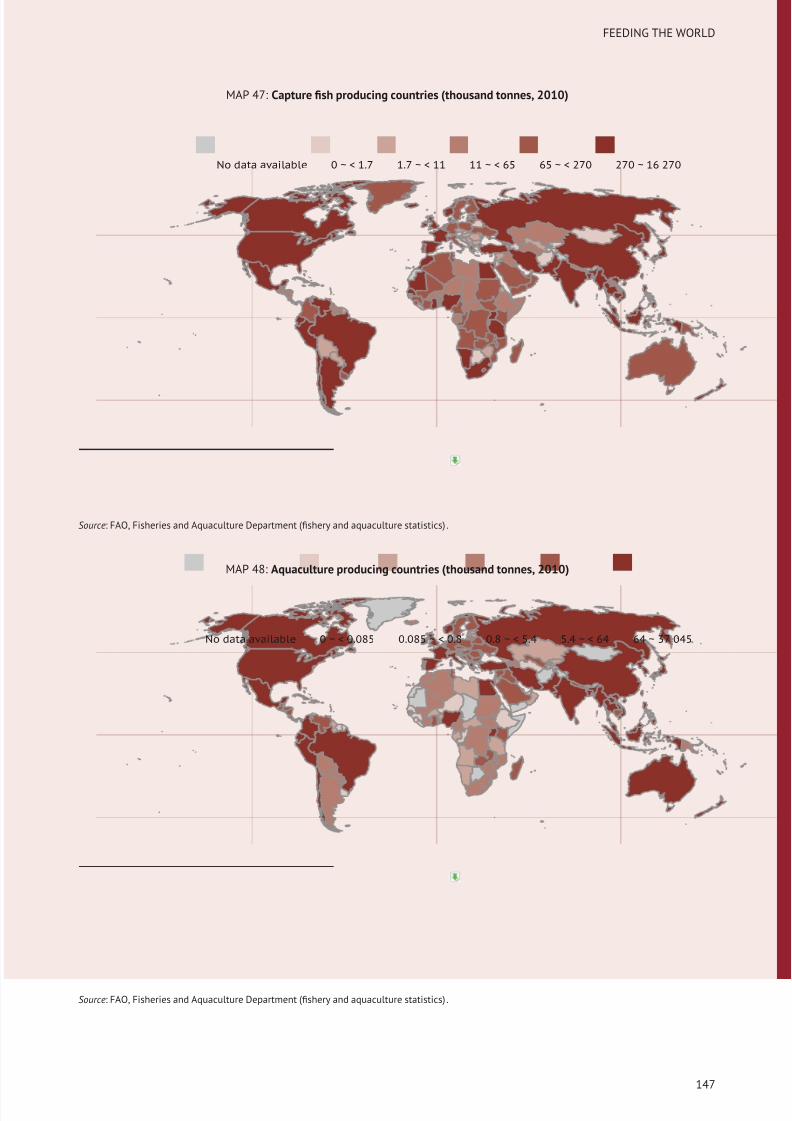
8/16/2019 Informe de la Fao 2013
http://slidepdf.com/reader/full/informe-de-la-fao-2013 165/307
FEEDING THE WORLD
MAP 47: Capture fish producing countries (thousand tonnes, 2010)
No data available 0 ~ < 1.7 1.7 ~ < 11 11 ~ < 65 65 ~ < 270 270 ~ 16 270
Source: FAO, Fisheries and Aquaculture Department (fishery and aquaculture statistics) .
MAP 48: Aquaculture producing countries (thousand tonnes, 2010)
No data available 0 ~ < 0.085 0.085 ~ < 0.8 0.8 ~ < 5.4 5.4 ~ < 64 64 ~ 37 045
Source: FAO, Fisheries and Aquaculture Department (fishery and aquaculture statistics) .
147
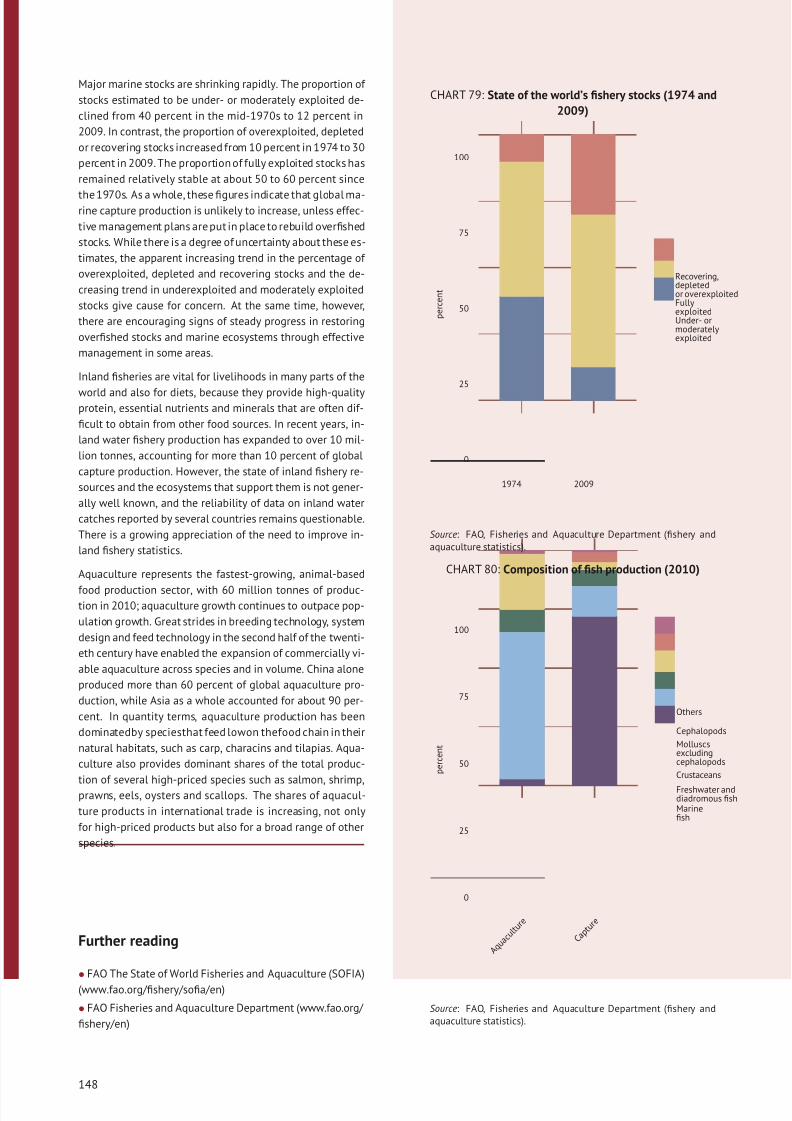
8/16/2019 Informe de la Fao 2013
http://slidepdf.com/reader/full/informe-de-la-fao-2013 166/307
Major marine stocks are shrinking rapidly. The proportion of
stocks estimated to be under- or moderately exploited de-
clined from 40 percent in the mid-1970s to 12 percent in
2009. In contrast, the proportion of overexploited, depleted
or recovering stocks increased from 10 percent in 1974 to 30
percent in 2009. The proportion of fully exploited stocks has
remained relatively stable at about 50 to 60 percent since
the 1970s. As a whole, these figures indicate that global ma-rine capture production is unlikely to increase, unless effec-
tive management plans are put in place to rebuild overfished
stocks. While there is a degree of uncertainty about these es-
timates, the apparent increasing trend in the percentage of
overexploited, depleted and recovering stocks and the de-
creasing trend in underexploited and moderately exploited
stocks give cause for concern. At the same time, however,
there are encouraging signs of steady progress in restoring
overfished stocks and marine ecosystems through effective
management in some areas.
Inland fisheries are vital for livelihoods in many parts of the
world and also for diets, because they provide high-qualityprotein, essential nutrients and minerals that are often dif-
ficult to obtain from other food sources. In recent years, in-
land water fishery production has expanded to over 10 mil-
lion tonnes, accounting for more than 10 percent of global
capture production. However, the state of inland fishery re-
sources and the ecosystems that support them is not gener-
ally well known, and the reliability of data on inland water
catches reported by several countries remains questionable.
There is a growing appreciation of the need to improve in-
land fishery statistics.
Aquaculture represents the fastest-growing, animal-based
food production sector, with 60 million tonnes of produc-tion in 2010; aquaculture growth continues to outpace pop-
ulation growth. Great strides in breeding technology, system
design and feed technology in the second half of the twenti-
eth century have enabled the expansion of commercially vi-
able aquaculture across species and in volume. China alone
produced more than 60 percent of global aquaculture pro-
duction, while Asia as a whole accounted for about 90 per-
cent. In quantity terms, aquaculture production has been
dominatedby speciesthat feed lowon thefood chain in their
natural habitats, such as carp, characins and tilapias. Aqua-
culture also provides dominant shares of the total produc-
tion of several high-priced species such as salmon, shrimp,prawns, eels, oysters and scallops. The shares of aquacul-
ture products in international trade is increasing, not only
for high-priced products but also for a broad range of other
species.
Further reading
• FAO The State of World Fisheries and Aquaculture (SOFIA)
(www.fao.org/fishery/sofia/en)
• FAO Fisheries and Aquaculture Department (www.fao.org/
fishery/en)
CHART 79: State of the world’s fishery stocks (1974 and
2009)
0
25
50
75
100
1974 2009
p e r c e n t
Recovering,depletedor overexploitedFullyexploitedUnder- ormoderatelyexploited
Source: FAO, Fisheries and Aquaculture Department (fishery andaquaculture statistics).
CHART 80: Composition of fish production (2010)
0
25
50
75
100
A q u a c u l t u r e
C a p t u r e
p e r c e n t
Others
Cephalopods
Molluscsexcludingcephalopods
Crustaceans
Freshwater anddiadromous fishMarinefish
Source: FAO, Fisheries and Aquaculture Department (fishery andaquaculture statistics).
148
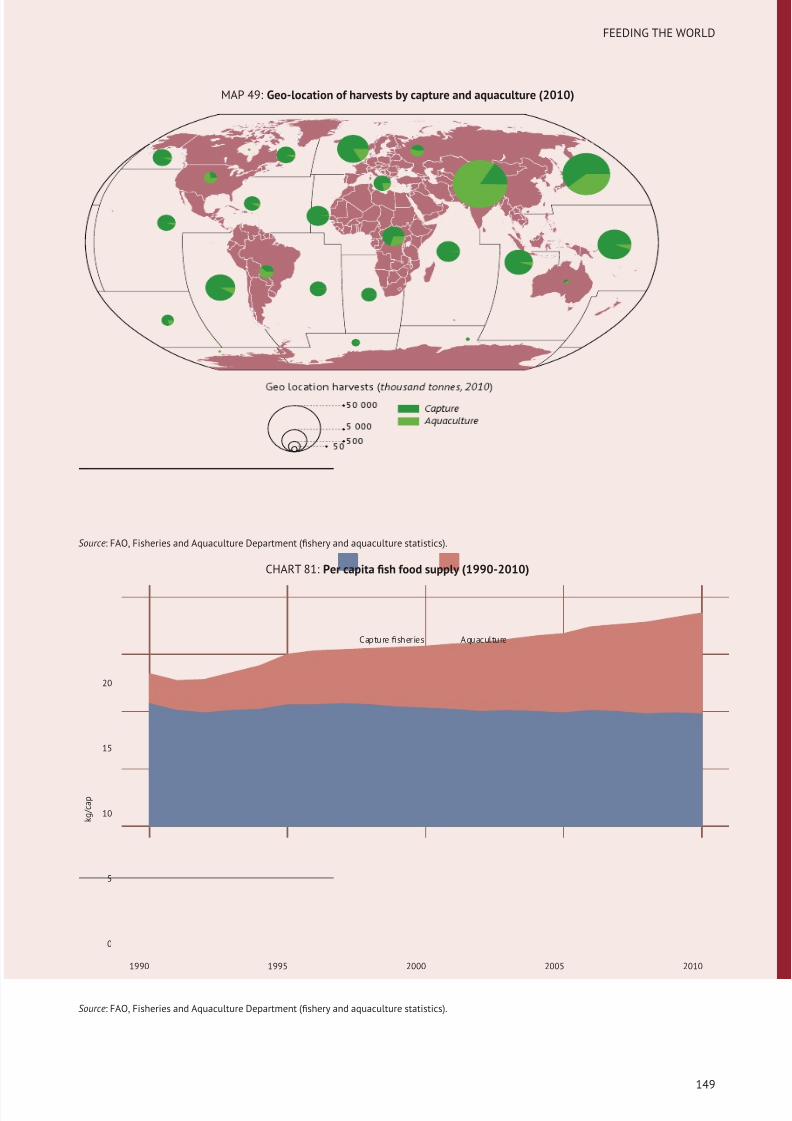
8/16/2019 Informe de la Fao 2013
http://slidepdf.com/reader/full/informe-de-la-fao-2013 167/307
FEEDING THE WORLD
MAP 49: Geo-location of harvests by capture and aquaculture (2010)
Source: FAO, Fisheries and Aquaculture Department (fishery and aquaculture statistics).
CHART 81: Per capita fish food supply (1990-2010)
0
5
10
15
20
1990 1995 2000 2005 2010
k g / c a p
Capture fisheries Aquaculture
Source: FAO, Fisheries and Aquaculture Department (fishery and aquaculture statistics).
149
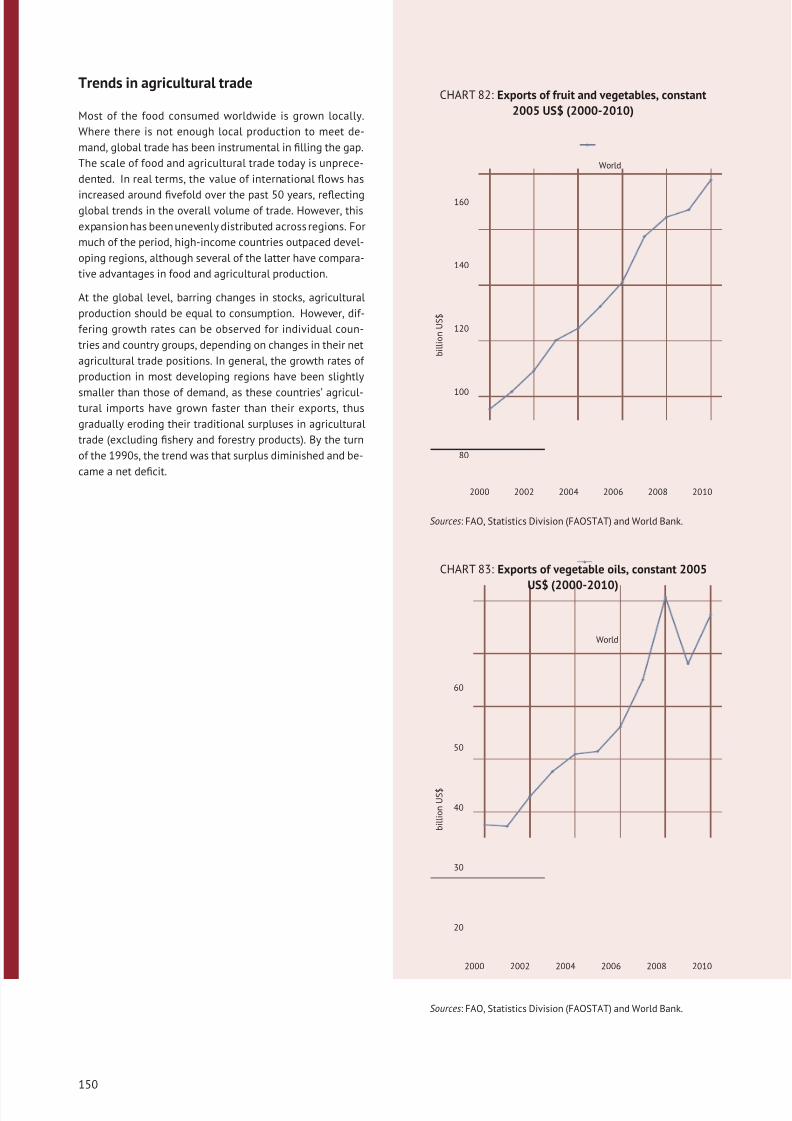
8/16/2019 Informe de la Fao 2013
http://slidepdf.com/reader/full/informe-de-la-fao-2013 168/307
Trends in agricultural trade
Most of the food consumed worldwide is grown locally.
Where there is not enough local production to meet de-
mand, global trade has been instrumental in filling the gap.
The scale of food and agricultural trade today is unprece-
dented. In real terms, the value of international flows has
increased around fivefold over the past 50 years, reflectingglobal trends in the overall volume of trade. However, this
expansion has been unevenly distributed across regions. For
much of the period, high-income countries outpaced devel-
oping regions, although several of the latter have compara-
tive advantages in food and agricultural production.
At the global level, barring changes in stocks, agricultural
production should be equal to consumption. However, dif-
fering growth rates can be observed for individual coun-
tries and country groups, depending on changes in their net
agricultural trade positions. In general, the growth rates of
production in most developing regions have been slightly
smaller than those of demand, as these countries’ agricul-tural imports have grown faster than their exports, thus
gradually eroding their traditional surpluses in agricultural
trade (excluding fishery and forestry products). By the turn
of the 1990s, the trend was that surplus diminished and be-
came a net deficit.
CHART 82: Exports of fruit and vegetables, constant
2005 US$ (2000-2010)
80
100
120
140
160
2000 2002 2004 2006 2008 2010
b i l l i o n U S $
World
Sources: FAO, Statistics Division (FAOSTAT) and World Bank.
CHART 83: Exports of vegetable oils, constant 2005
US$ (2000-2010)
20
30
40
50
60
2000 2002 2004 2006 2008 2010
b i l l i o n U S $
World
Sources: FAO, Statistics Division (FAOSTAT) and World Bank.
150
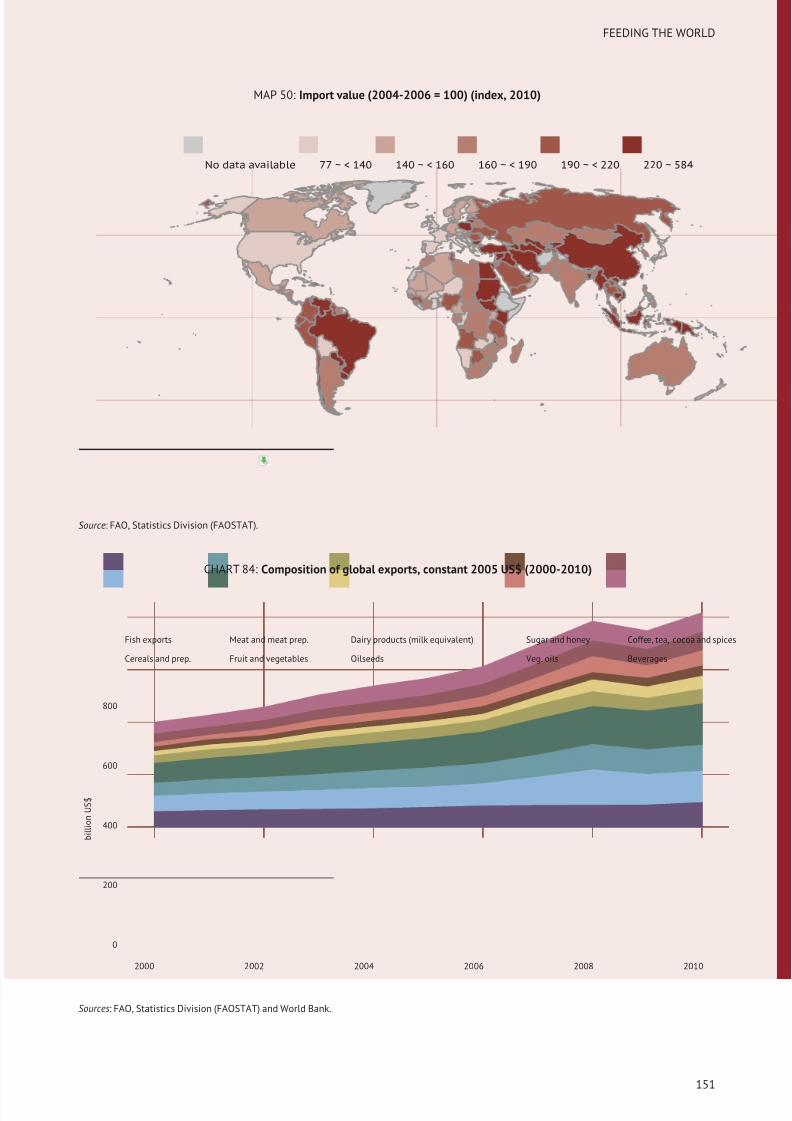
8/16/2019 Informe de la Fao 2013
http://slidepdf.com/reader/full/informe-de-la-fao-2013 169/307
FEEDING THE WORLD
MAP 50: Import value (2004-2006 = 100) (index, 2010)
No data available 77 ~ < 140 140 ~ < 160 160 ~ < 190 190 ~ < 220 220 ~ 584
Source: FAO, Statistics Division (FAOSTAT).
CHART 84: Composition of global exports, constant 2005 US$ (2000-2010)
0
200
400
600
800
2000 2002 2004 2006 2008 2010
b i l l i o n U S $
Fish exports
Cereals and prep.
Meat and meat prep.
Fruit and vegetables
Dairy products (milk equivalent)
Oilseeds
Sugar and honey
Veg. oils
Coffee, tea, cocoa and spices
Beverages
Sources: FAO, Statistics Division (FAOSTAT) and World Bank.
151
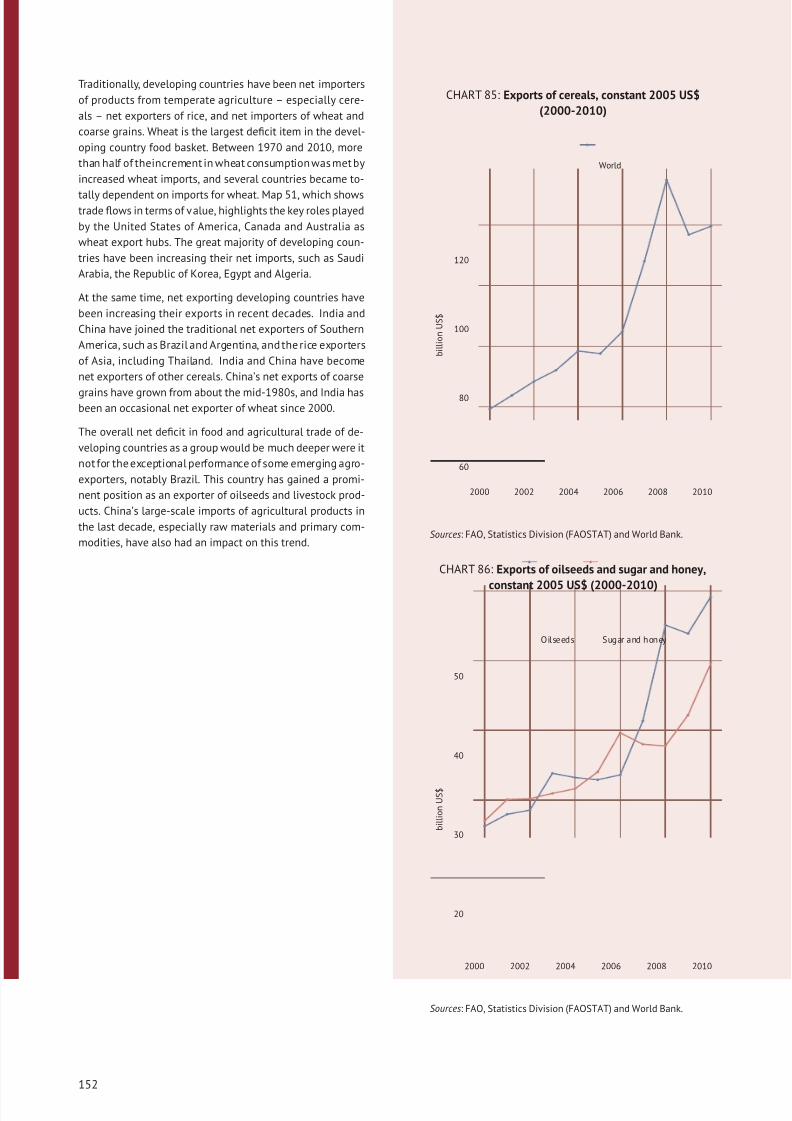
8/16/2019 Informe de la Fao 2013
http://slidepdf.com/reader/full/informe-de-la-fao-2013 170/307
Traditionally, developing countries have been net importers
of products from temperate agriculture – especially cere-
als – net exporters of rice, and net importers of wheat and
coarse grains. Wheat is the largest deficit item in the devel-
oping country food basket. Between 1970 and 2010, more
than half of theincrement in wheat consumption was met by
increased wheat imports, and several countries became to-
tally dependent on imports for wheat. Map 51, which showstrade flows in terms of value, highlights the key roles played
by the United States of America, Canada and Australia as
wheat export hubs. The great majority of developing coun-
tries have been increasing their net imports, such as Saudi
Arabia, the Republic of Korea, Egypt and Algeria.
At the same time, net exporting developing countries have
been increasing their exports in recent decades. India and
China have joined the traditional net exporters of Southern
America, such as Brazil and Argentina, and the rice exporters
of Asia, including Thailand. India and China have become
net exporters of other cereals. China’s net exports of coarse
grains have grown from about the mid-1980s, and India hasbeen an occasional net exporter of wheat since 2000.
The overall net deficit in food and agricultural trade of de-
veloping countries as a group would be much deeper were it
not for the exceptional performance of some emerging agro-
exporters, notably Brazil. This country has gained a promi-
nent position as an exporter of oilseeds and livestock prod-
ucts. China’s large-scale imports of agricultural products in
the last decade, especially raw materials and primary com-
modities, have also had an impact on this trend.
CHART 85: Exports of cereals, constant 2005 US$
(2000-2010)
60
80
100
120
2000 2002 2004 2006 2008 2010
b i l l i o n U S $
World
Sources: FAO, Statistics Division (FAOSTAT) and World Bank.
CHART 86: Exports of oilseeds and sugar and honey,
constant 2005 US$ (2000-2010)
20
30
40
50
2000 2002 2004 2006 2008 2010
b i l l i o n U S $
Oilseeds Sugar and honey
Sources: FAO, Statistics Division (FAOSTAT) and World Bank.
152
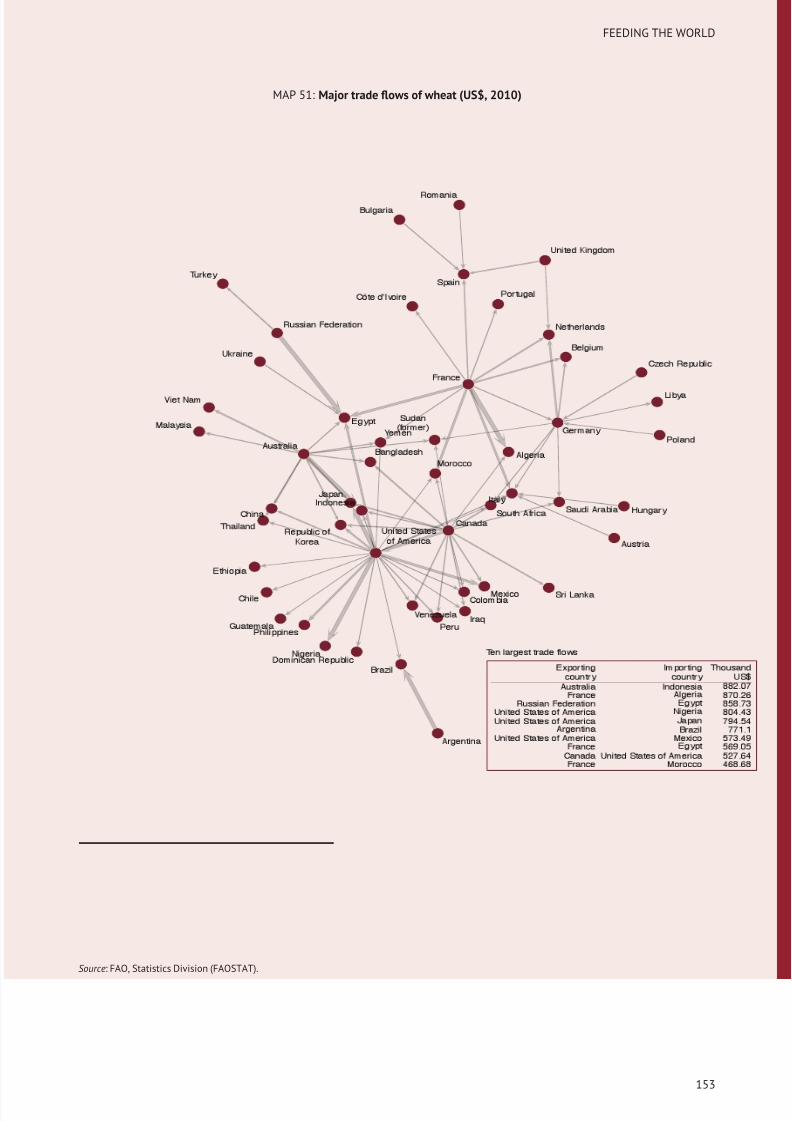
8/16/2019 Informe de la Fao 2013
http://slidepdf.com/reader/full/informe-de-la-fao-2013 171/307
FEEDING THE WORLD
MAP 51: Major trade flows of wheat (US$, 2010)
Source: FAO, Statistics Division (FAOSTAT).
153

8/16/2019 Informe de la Fao 2013
http://slidepdf.com/reader/full/informe-de-la-fao-2013 172/307
Fruit and vegetables have witnessed consistent increases in
the net exporter position of many countries. This product
aggregate has become the most important in value terms.
Over the 2000–2010 decade, the fruit and vegetables sec-
tor has grown by more than 11percent per year at the global
level, by almost 20 percent in Africa and by 17 percent in
Asia, but Europe continues to be the largest exporter. In-
ternational trade in vegetable oils has also grown rapidly,at 17 percent per year. Asian countries accounted for more
than half of global exports in 2010, because of rapidly rising
net exports from countries such as Malaysia and Indonesia.
Imports into China have gained much prominence, and Ar-
gentina and Brazil remain the major exporters from Latin
America.
As a whole, developing countries’ traditionally large trade
surpluses of sugar have diminished rapidly since the early
1990s, as several developing countries became major im-
porters. This shrinkage also reflects domestic support and
trade protection in some major sugar importing countries.
Globally, sugar and honey exports grew by 11 percent overthelast decade. Most ofthis growthwas drivenby theAmeri-
cas and Asia. Oilseed exports also grew very quickly, at more
than 15 percent per year.
In many emerging economies, agriculture has been gradu-
ally moving towards increased commercialization of high-
value foods, such as poultry, pork and fish. For poultry and
fish, trade expansion has far outpaced domestic consump-
tion. The aggregate value of net fishery exports from de-
veloping countries now exceeds the total value of the tradi-
tional mainstays of agricultural exports, such as coffee, tea,
cocoa, bananas and sugar.
CHART 87: Exports of livestock products and fish,
constant 2005 US$ (2000-2010)
40
60
80
100
2000 2002 2004 2006 2008 2010
b i l l i o n U S $
Fish exports
Meat and meat prep.
Dairy products (milk equivalent)
Sources: FAO, Statistics Division (FAOSTAT) and World Bank.
CHART 88: Exports of animal fats, constant 2005 US$
(2000-2010)
1.5
2.0
2.5
2000 2002 2004 2006 2008 2010
b i l l i o n U S $
World
Sources: FAO, Statistics Division (FAOSTAT) and World Bank.
154
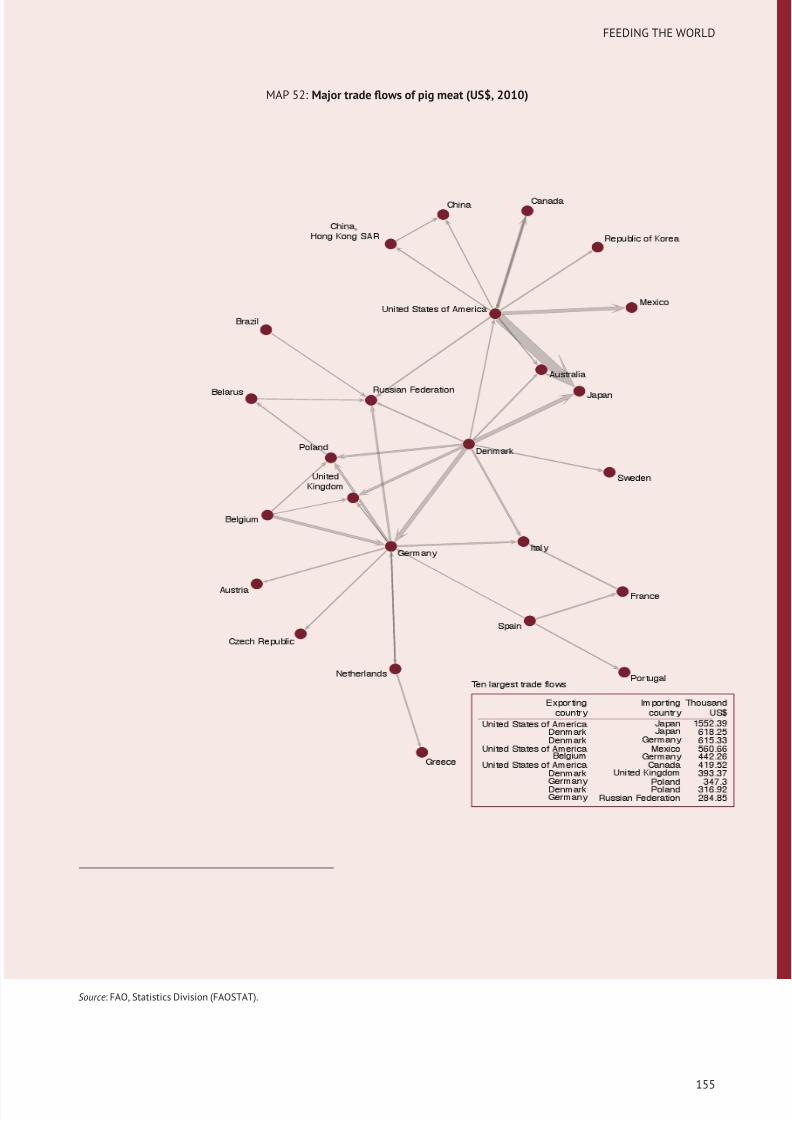
8/16/2019 Informe de la Fao 2013
http://slidepdf.com/reader/full/informe-de-la-fao-2013 173/307
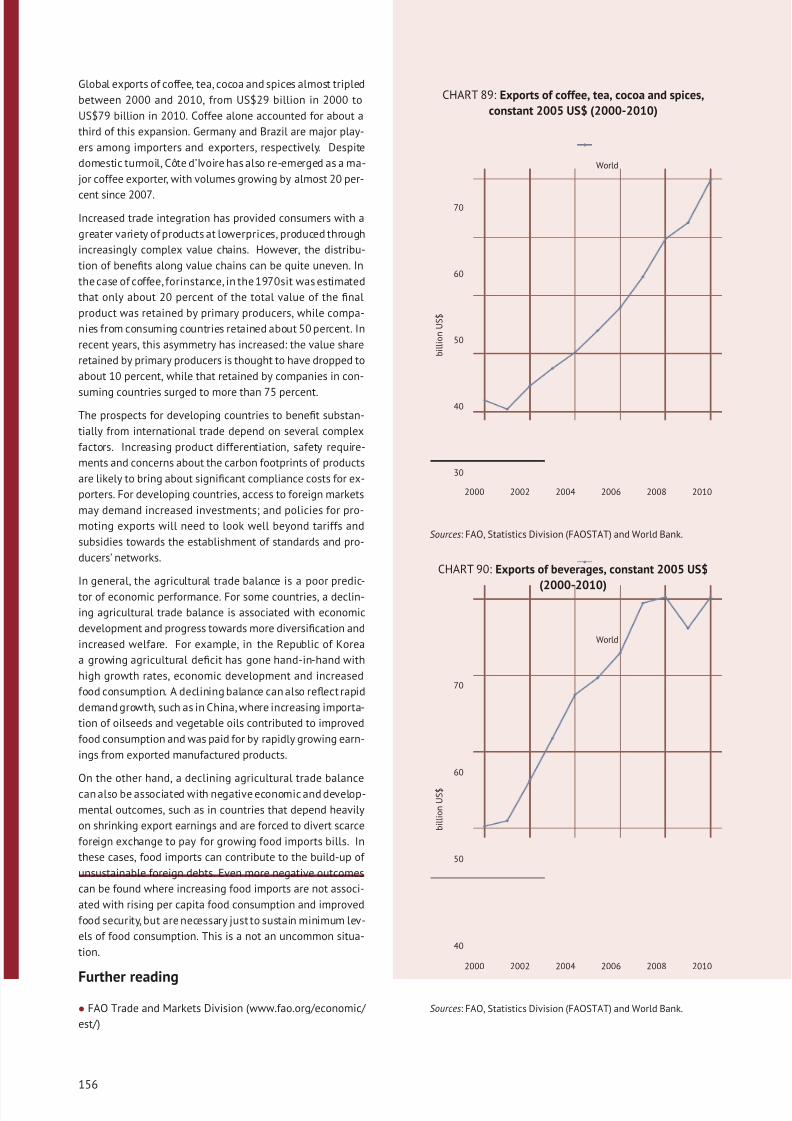
8/16/2019 Informe de la Fao 2013
http://slidepdf.com/reader/full/informe-de-la-fao-2013 174/307
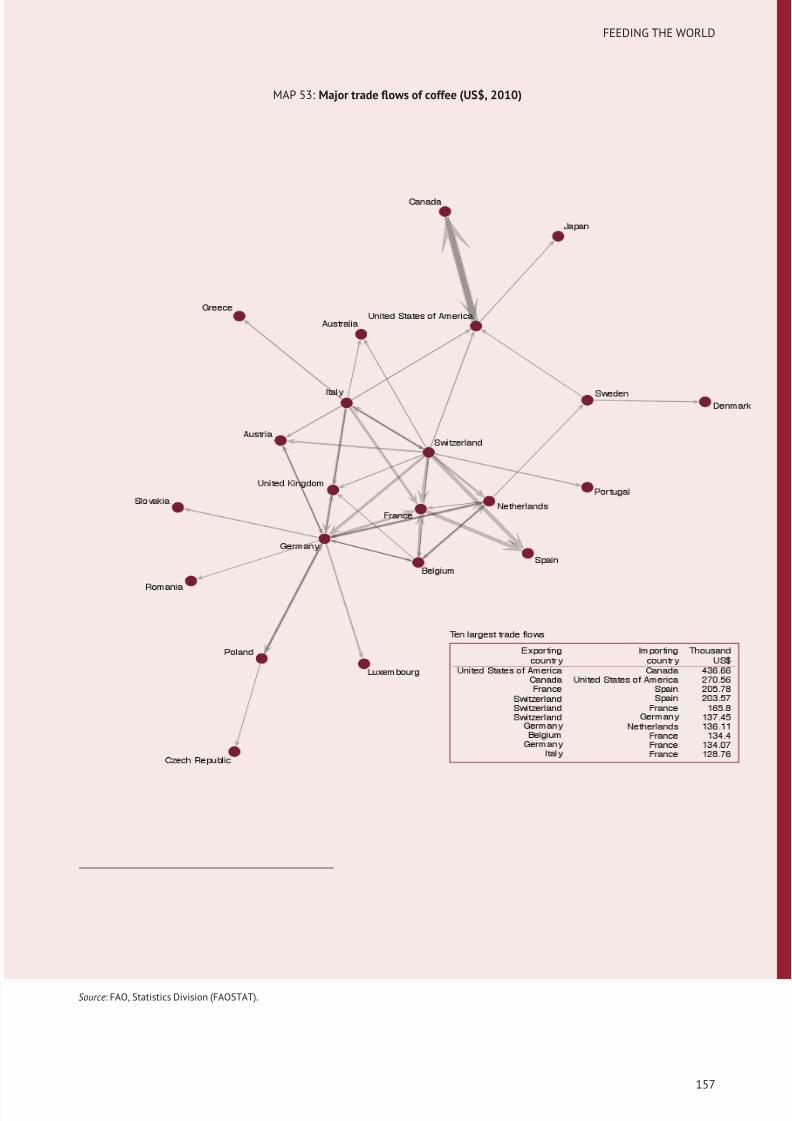
8/16/2019 Informe de la Fao 2013
http://slidepdf.com/reader/full/informe-de-la-fao-2013 175/307
FEEDING THE WORLD
MAP 53: Major trade flows of coffee (US$, 2010)
Source: FAO, Statistics Division (FAOSTAT).
157
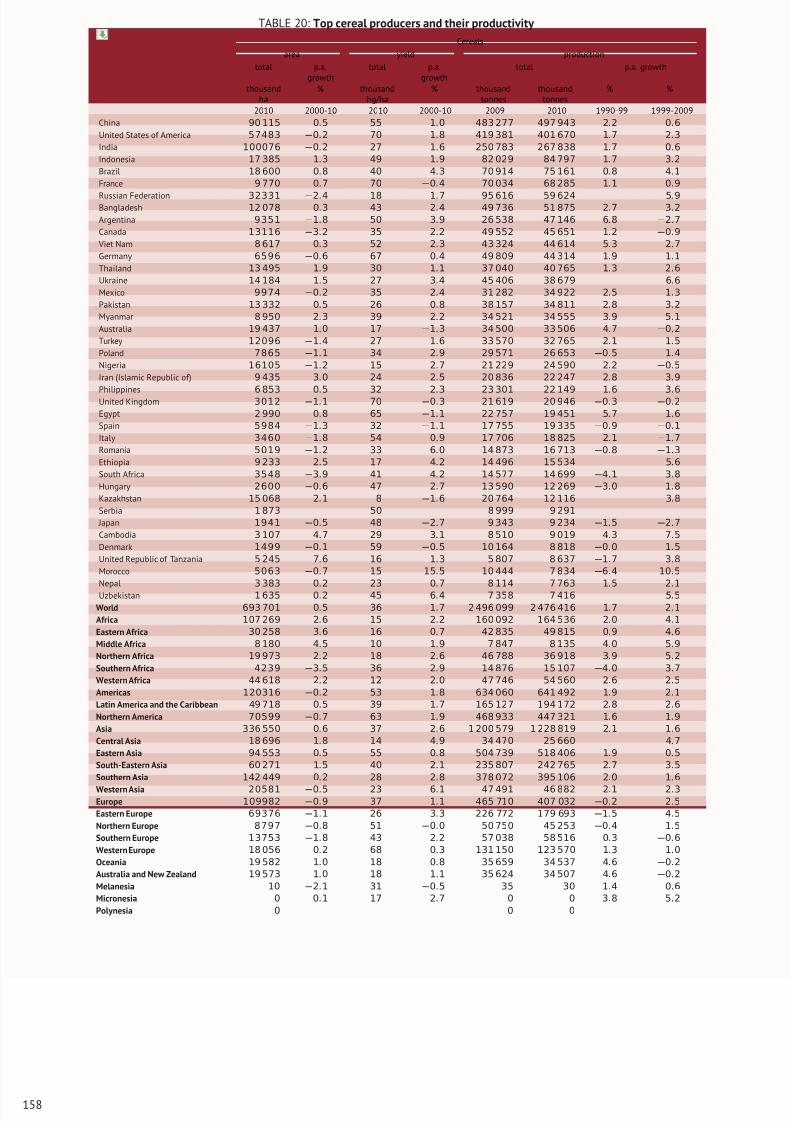
8/16/2019 Informe de la Fao 2013
http://slidepdf.com/reader/full/informe-de-la-fao-2013 176/307
TABLE 20: Top cereal producers and their productivity
Cereals
area yield production
total p.a.growth
total p.a.growth
total p.a. growth
thousandha
% thousandhg/ha
% thousandtonnes
thousandtonnes
% %
2010 2000-10 2010 2000-10 2009 2010 1990-99 1999-2009
China 90 115 0.5 55 1.0 483 277 497 943 2.2 0.6
United States of America 57483 −0.2 70 1.8 419 381 401 670 1.7 2.3
India 100076 −0.2 27 1.6 250 783 267 838 1.7 0.6
Indonesia 17 385 1.3 49 1.9 82 029 84 797 1.7 3.2
Brazil 18 600 0.8 40 4.3 70 914 75 161 0.8 4.1
France 9 770 0.7 70 −0.4 70 034 68 285 1.1 0.9
Russian Federation 32331 −2.4 18 1.7 95 616 59 624 5.9Bangladesh 12 078 0.3 43 2.4 49 736 51 875 2.7 3.2
Argentina 9351 −1.8 50 3.9 26 538 47 146 6.8 −2.7
Canada 13116 −3.2 35 2.2 49 552 45 651 1.2 −0.9
Viet Nam 8 617 0.3 52 2.3 43 324 44 614 5.3 2.7
Germany 6596 −0.6 67 0.4 49 809 44 314 1.9 1.1
Thailand 13 495 1.9 30 1.1 37 040 40 765 1.3 2.6
Ukraine 14 184 1.5 27 3.4 45 406 38 679 6.6
Mexico 9974 −0.2 35 2.4 31 282 34 922 2.5 1.3
Pakistan 13 332 0.5 26 0.8 38 157 34 811 2.8 3.2
Myanmar 8 950 2.3 39 2.2 34 521 34 555 3.9 5.1
Australia 19 437 1.0 17 −1.3 34 500 33 506 4.7 −0.2
Turkey 12096 −1.4 27 1.6 33 570 32 765 2.1 1.5
Poland 7865 −1.1 34 2.9 29 571 26 653 −0.5 1.4
Nigeria 16105 −1.2 15 2.7 21 229 24 590 2.2 −0.5
Iran (Islamic Republic of) 9 435 3.0 24 2.5 20 836 22 247 2.8 3.9
Philippines 6 853 0
.5 32 2
.3 23 301 22 149 1
.6 3
.6
United Kingdom 3012 −1.1 70 −0.3 21 619 20 946 −0.3 −0.2
Egypt 2 990 0.8 65 −1.1 22 757 19 451 5.7 1.6
Spain 5984 −1.3 32 −1.1 17 755 19 335 −0.9 −0.1
Italy 3460 −1.8 54 0.9 17 706 18 825 2.1 −1.7
Romania 5019 −1.2 33 6.0 14 873 16 713 −0.8 −1.3
Ethiopia 9 233 2.5 17 4.2 14 496 15 534 5.6
South Africa 3548 −3.9 41 4.2 14 577 14 699 −4.1 3.8
Hungary 2600 −0.6 47 2.7 13 590 12 269 −3.0 1.8
Kazakhstan 15 068 2.1 8 −1.6 20 764 12 116 3.8
Serbia 1 873 50 8 999 9 291
Japan 1941 −0.5 48 −2.7 9 343 9 234 −1.5 −2.7
Cambodia 3 107 4.7 29 3.1 8 510 9 019 4.3 7.5
Denmark 1499 −0.1 59 −0.5 10 164 8 818 −0.0 1.5
United Republic of Tanzania 5 245 7.6 16 1.3 5 807 8 637 −1.7 3.8
Morocco 5063 −0.7 15 15.5 10 444 7 834 −6.4 10.5
Nepal 3 383 0.2 23 0.7 8 114 7 763 1.5 2.1
Uzbekistan 1 635 0.2 45 6.4 7 358 7 416 5.5
World 693 701 0.5 36 1.7 2 496 099 2 476 416 1.7 2.1
Africa 107 269 2.6 15 2.2 160 092 164 536 2.0 4.1
Eastern Africa 30 258 3.6 16 0.7 42 835 49 815 0.9 4.6
Middle Africa 8 180 4.5 10 1.9 7 847 8 135 4.0 5.9
Northern Africa 19 973 2.2 18 2.6 46 788 36 918 3.9 5.2
Southern Africa 4239 −3.5 36 2.9 14 876 15 107 −4.0 3.7
Western Africa 44 618 2.2 12 2.0 47 746 54 560 2.6 2.5
Americas 120316 −0.2 53 1.8 634 060 641 492 1.9 2.1
Latin America and the Caribbean 49 718 0.5 39 1.7 165 127 194 172 2.8 2.6
Northern America 70599 −0.7 63 1.9 468 933 447 321 1.6 1.9
Asia 336 550 0.6 37 2.6 1 200 579 1 228 819 2.1 1.6
Central Asia 18 696 1.8 14 4.9 34 470 25 660 4.7
Eastern Asia 94 553 0.5 55 0.8 504 739 518 406 1.9 0.5
South-Eastern Asia 60 271 1.5 40 2.1 235 807 242 765 2.7 3.5
Southern Asia 142 449 0.2 28 2.8 378 072 395 106 2.0 1.6
Western Asia 20581 −0.5 23 6.1 47 491 46 882 2.1 2.3
Europe 109982 −0.9 37 1.1 465 710 407 032 −0.2 2.5
Eastern Europe 69376 −1.1 26 3.3 226 772 179 693 −1.5 4.5
Northern Europe 8797 −0.8 51 −0.0 50 750 45 253 −0.4 1.5
Southern Europe 13753 −1.8 43 2.2 57 038 58 516 0.3 −0.6
Western Europe 18 056 0.2 68 0.3 131 150 123 570 1.3 1.0
Oceania 19 582 1.0 18 0.8 35 659 34 537 4.6 −0.2
Australia and New Zealand 19 573 1.0 18 1.1 35 624 34 507 4.6 −0.2
Melanesia 10 −2.1 31 −0.5 35 30 1.4 0.6
Micronesia 0 0.1 17 2.7 0 0 3.8 5.2
Polynesia 0 0 0
158
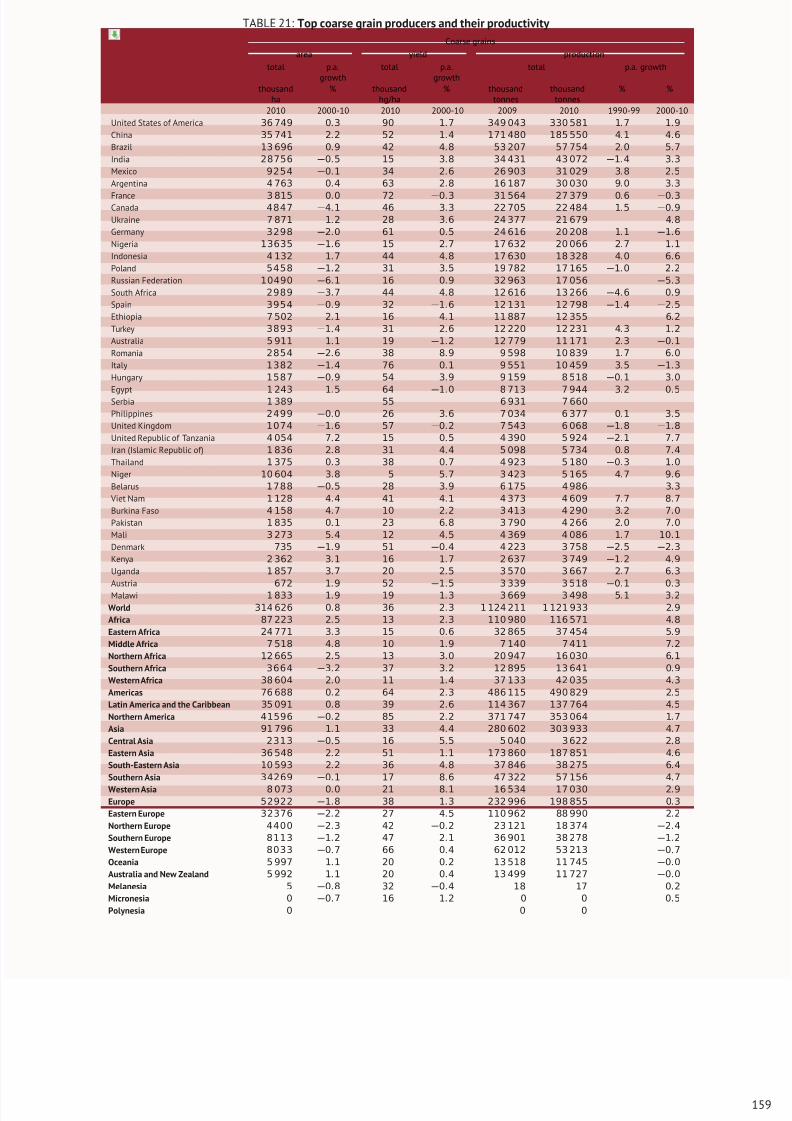
8/16/2019 Informe de la Fao 2013
http://slidepdf.com/reader/full/informe-de-la-fao-2013 177/307
TABLE 21: Top coarse grain producers and their productivity
Coarse grains
area yield production
total p.a.growth
total p.a.growth
total p.a. growth
thousandha
% thousandhg/ha
% thousandtonnes
thousandtonnes
% %
2010 2000-10 2010 2000-10 2009 2010 1990-99 2000-10
United States of America 36 749 0.3 90 1.7 349 043 330 581 1.7 1.9
China 35 741 2.2 52 1.4 171 480 185 550 4.1 4.6
Brazil 13 696 0.9 42 4.8 53 207 57 754 2.0 5.7
India 28756 −0.5 15 3.8 34 431 43 072 −1.4 3.3
Mexico 9254 −0.1 34 2.6 26 903 31 029 3.8 2.5
Argentina 4 763 0.4 63 2.8 16 187 30 030 9.0 3.3
France 3 815 0.0 72 −0.3 31 564 27 379 0.6 −0.3Canada 4847 −4.1 46 3.3 22 705 22 484 1.5 −0.9
Ukraine 7 871 1.2 28 3.6 24 377 21 679 4.8
Germany 3298 −2.0 61 0.5 24 616 20 208 1.1 −1.6
Nigeria 13635 −1.6 15 2.7 17 632 20 066 2.7 1.1
Indonesia 4 132 1.7 44 4.8 17 630 18 328 4.0 6.6
Poland 5458 −1.2 31 3.5 19 782 17 165 −1.0 2.2
Russian Federation 10490 −6.1 16 0.9 32 963 17 056 −5.3
South Africa 2989 −3.7 44 4.8 12 616 13 266 −4.6 0.9
Spain 3954 −0.9 32 −1.6 12 131 12 798 −1.4 −2.5
Ethiopia 7 502 2.1 16 4.1 11 887 12 355 6.2
Turkey 3893 −1.4 31 2.6 12 220 12 231 4.3 1.2
Australia 5 911 1.1 19 −1.2 12 779 11 171 2.3 −0.1
Romania 2854 −2.6 38 8.9 9 598 10 839 1.7 6.0
Italy 1382 −1.4 76 0.1 9 551 10 459 3.5 −1.3
Hungary 1587 −0.9 54 3.9 9 159 8 518 −0.1 3.0
Egypt 1 243 1
.5 64 −1
.0 8 713 7 944 3
.2 0
.5
Serbia 1 389 55 6 931 7 660
Philippines 2499 −0.0 26 3.6 7 034 6 377 0.1 3.5
United Kingdom 1074 −1.6 57 −0.2 7 543 6 068 −1.8 −1.8
United Republic of Tanzania 4 054 7.2 15 0.5 4 390 5 924 −2.1 7.7
Iran (Islamic Republic of) 1 836 2.8 31 4.4 5 098 5 734 0.8 7.4
Thailand 1 375 0.3 38 0.7 4 923 5 180 −0.3 1.0
Niger 10 604 3.8 5 5.7 3 423 5 165 4.7 9.6
Belarus 1788 −0.5 28 3.9 6 175 4 986 3.3
Viet Nam 1 128 4.4 41 4.1 4 373 4 609 7.7 8.7
Burkina Faso 4 158 4.7 10 2.2 3 413 4 290 3.2 7.0
Pakistan 1 835 0.1 23 6.8 3 790 4 266 2.0 7.0
Mali 3 273 5.4 12 4.5 4 369 4 086 1.7 10.1
Denmark 735 −1.9 51 −0.4 4 223 3 758 −2.5 −2.3
Kenya 2 362 3.1 16 1.7 2 637 3 749 −1.2 4.9
Uganda 1 857 3.7 20 2.5 3 570 3 667 2.7 6.3
Austria 672 1.9 52 −1.5 3 339 3 518 −0.1 0.3
Malawi 1 833 1.9 19 1.3 3 669 3 498 5.1 3.2
World 314 626 0.8 36 2.3 1 124 211 1 121 933 2.9
Africa 87 223 2.5 13 2.3 110 980 116 571 4.8
Eastern Africa 24 771 3.3 15 0.6 32 865 37 454 5.9
Middle Africa 7 518 4.8 10 1.9 7 140 7 411 7.2
Northern Africa 12 665 2.5 13 3.0 20 947 16 030 6.1
Southern Africa 3664 −3.2 37 3.2 12 895 13 641 0.9
Western Africa 38 604 2.0 11 1.4 37 133 42 035 4.3
Americas 76 688 0.2 64 2.3 486 115 490 829 2.5
Latin America and the Caribbean 35 091 0.8 39 2.6 114 367 137 764 4.5
Northern America 41596 −0.2 85 2.2 371 747 353 064 1.7
Asia 91 796 1.1 33 4.4 280 602 303 933 4.7
Central Asia 2313 −0.5 16 5.5 5 040 3 622 2.8
Eastern Asia 36 548 2.2 51 1.1 173 860 187 851 4.6
South-Eastern Asia 10 593 2.2 36 4.8 37 846 38 275 6.4
Southern Asia 34269 −0.1 17 8.6 47 322 57 156 4.7
Western Asia 8 073 0.0 21 8.1 16 534 17 030 2.9
Europe 52922 −1.8 38 1.3 232 996 198 855 0.3
Eastern Europe 32376 −2.2 27 4.5 110 962 88 990 2.2
Northern Europe 4400 −2.3 42 −0.2 23 121 18 374 −2.4
Southern Europe 8113 −1.2 47 2.1 36 901 38 278 −1.2
Western Europe 8033 −0.7 66 0.4 62 012 53 213 −0.7
Oceania 5 997 1.1 20 0.2 13 518 11 745 −0.0
Australia and New Zealand 5 992 1.1 20 0.4 13 499 11 727 −0.0
Melanesia 5 −0.8 32 −0.4 18 17 0.2
Micronesia 0 −0.7 16 1.2 0 0 0.5
Polynesia 0 0 0
159
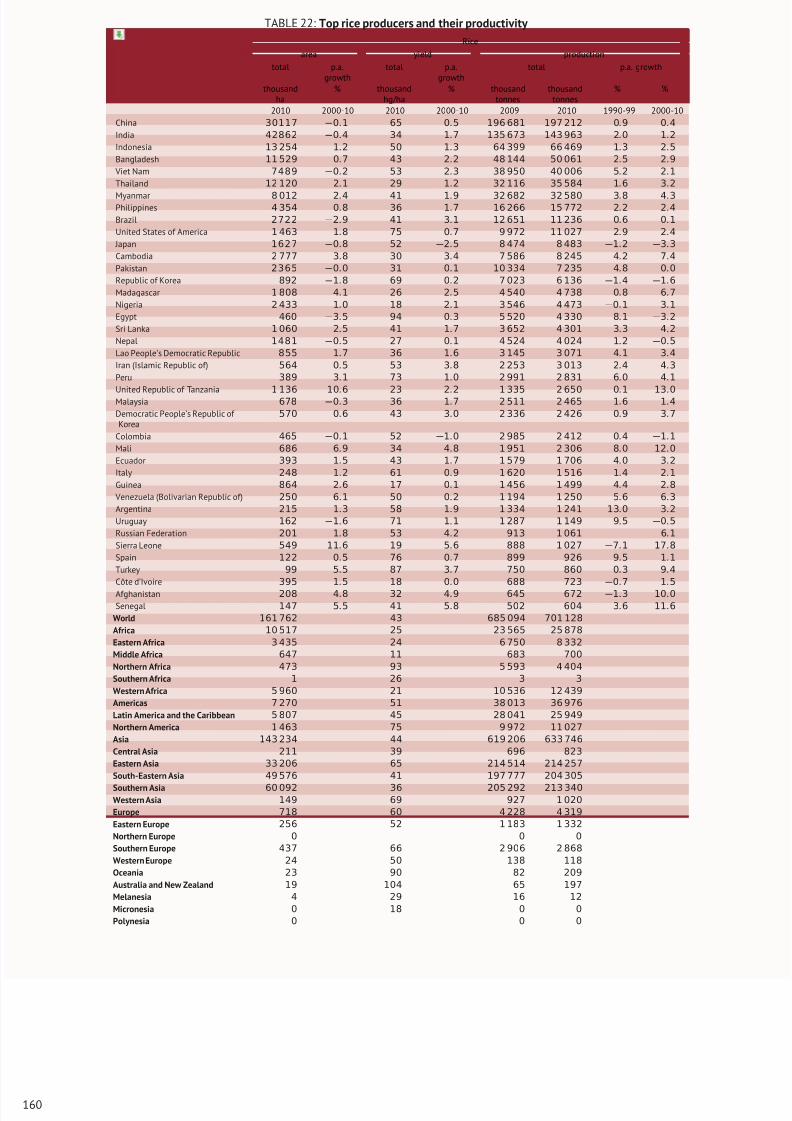
8/16/2019 Informe de la Fao 2013
http://slidepdf.com/reader/full/informe-de-la-fao-2013 178/307
TABLE 22: Top rice producers and their productivity
Rice
area yield production
total p.a.growth
total p.a.growth
total p.a. growth
thousandha
% thousandhg/ha
% thousandtonnes
thousandtonnes
% %
2010 2000-10 2010 2000-10 2009 2010 1990-99 2000-10
China 30117 −0.1 65 0.5 196 681 197 212 0.9 0.4
India 42862 −0.4 34 1.7 135 673 143 963 2.0 1.2
Indonesia 13 254 1.2 50 1.3 64 399 66 469 1.3 2.5
Bangladesh 11 529 0.7 43 2.2 48 144 50 061 2.5 2.9
Viet Nam 7489 −0.2 53 2.3 38 950 40 006 5.2 2.1
Thailand 12 120 2.1 29 1.2 32 116 35 584 1.6 3.2
Myanmar 8 012 2.4 41 1.9 32 682 32 580 3.8 4.3Philippines 4 354 0.8 36 1.7 16 266 15 772 2.2 2.4
Brazil 2722 −2.9 41 3.1 12 651 11 236 0.6 0.1
United States of America 1 463 1.8 75 0.7 9 972 11 027 2.9 2.4
Japan 1627 −0.8 52 −2.5 8 474 8 483 −1.2 −3.3
Cambodia 2 777 3.8 30 3.4 7 586 8 245 4.2 7.4
Pakistan 2365 −0.0 31 0.1 10 334 7 235 4.8 0.0
Republic of Korea 892 −1.8 69 0.2 7 023 6 136 −1.4 −1.6
Madagascar 1 808 4.1 26 2.5 4 540 4 738 0.8 6.7
Nigeria 2 433 1.0 18 2.1 3 546 4 473 −0.1 3.1
Egypt 460 −3.5 94 0.3 5 520 4 330 8.1 −3.2
Sri Lanka 1 060 2.5 41 1.7 3 652 4 301 3.3 4.2
Nepal 1481 −0.5 27 0.1 4 524 4 024 1.2 −0.5
Lao People’s Democratic Republic 855 1.7 36 1.6 3 145 3 071 4.1 3.4
Iran (Islamic Republic of) 564 0.5 53 3.8 2 253 3 013 2.4 4.3
Peru 389 3.1 73 1.0 2 991 2 831 6.0 4.1
United Republic of Tanzania 1 136 10
.6 23 2
.2 1 335 2 650 0
.1 13
.0
Malaysia 678 −0.3 36 1.7 2 511 2 465 1.6 1.4
Democratic People’s Republic of Korea
570 0.6 43 3.0 2 336 2 426 0.9 3.7
Colombia 465 −0.1 52 −1.0 2 985 2 412 0.4 −1.1
Mali 686 6.9 34 4.8 1 951 2 306 8.0 12.0
Ecuador 393 1.5 43 1.7 1 579 1 706 4.0 3.2
Italy 248 1.2 61 0.9 1 620 1 516 1.4 2.1
Guinea 864 2.6 17 0.1 1 456 1 499 4.4 2.8
Venezuela (Bolivarian Republic of) 250 6.1 50 0.2 1 194 1 250 5.6 6.3
Argentina 215 1.3 58 1.9 1 334 1 241 13.0 3.2
Uruguay 162 −1.6 71 1.1 1 287 1 149 9.5 −0.5
Russian Federation 201 1.8 53 4.2 913 1 061 6.1
Sierra Leone 549 11.6 19 5.6 888 1 027 −7.1 17.8
Spain 122 0.5 76 0.7 899 926 9.5 1.1
Turkey 99 5.5 87 3.7 750 860 0.3 9.4
Côte d’Ivoire 395 1.5 18 0.0 688 723 −0.7 1.5
Afghanistan 208 4.8 32 4.9 645 672 −1.3 10.0
Senegal 147 5.5 41 5.8 502 604 3.6 11.6
World 161 762 43 685 094 701 128
Africa 10 517 25 23 565 25 878
Eastern Africa 3 435 24 6 750 8 332
Middle Africa 647 11 683 700
Northern Africa 473 93 5 593 4 404
Southern Africa 1 26 3 3
Western Africa 5 960 21 10 536 12 439
Americas 7 270 51 38 013 36 976
Latin America and the Caribbean 5 807 45 28 041 25 949
Northern America 1 463 75 9 972 11 027
Asia 143 234 44 619 206 633 746
Central Asia 211 39 696 823
Eastern Asia 33 206 65 214 514 214 257
South-Eastern Asia 49 576 41 197 777 204 305
Southern Asia 60 092 36 205 292 213 340
Western Asia 149 69 927 1 020
Europe 718 60 4 228 4 319
Eastern Europe 256 52 1 183 1 332
Northern Europe 0 0 0
Southern Europe 437 66 2 906 2 868
Western Europe 24 50 138 118
Oceania 23 90 82 209
Australia and New Zealand 19 104 65 197
Melanesia 4 29 16 12
Micronesia 0 18 0 0
Polynesia 0 0 0
160
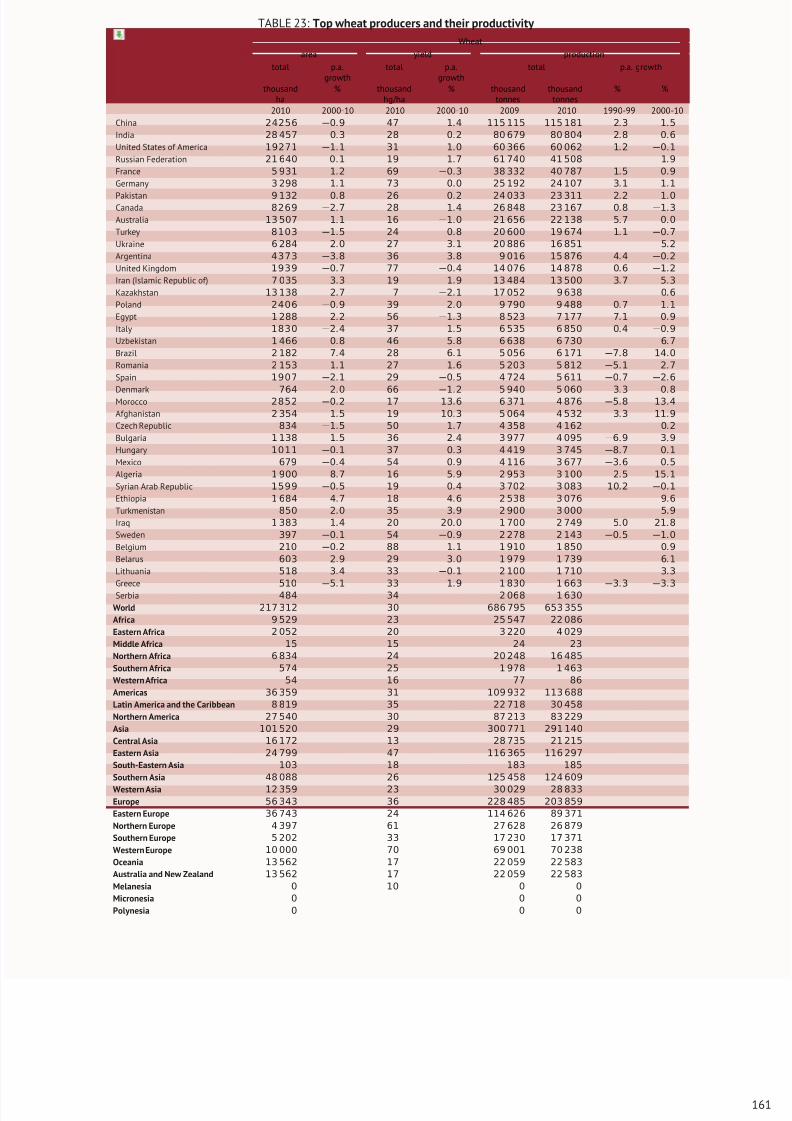
8/16/2019 Informe de la Fao 2013
http://slidepdf.com/reader/full/informe-de-la-fao-2013 179/307
TABLE 23: Top wheat producers and their productivity
Wheat
area yield production
total p.a.growth
total p.a.growth
total p.a. growth
thousandha
% thousandhg/ha
% thousandtonnes
thousandtonnes
% %
2010 2000-10 2010 2000-10 2009 2010 1990-99 2000-10
China 24256 −0.9 47 1.4 115 115 115 181 2.3 1.5
India 28 457 0.3 28 0.2 80 679 80 804 2.8 0.6
United States of America 19271 −1.1 31 1.0 60 366 60 062 1.2 −0.1
Russian Federation 21 640 0.1 19 1.7 61 740 41 508 1.9
France 5 931 1.2 69 −0.3 38 332 40 787 1.5 0.9
Germany 3 298 1.1 73 0.0 25 192 24 107 3.1 1.1
Pakistan 9 132 0.8 26 0.2 24 033 23 311 2.2 1.0Canada 8269 −2.7 28 1.4 26 848 23 167 0.8 −1.3
Australia 13 507 1.1 16 −1.0 21 656 22 138 5.7 0.0
Turkey 8103 −1.5 24 0.8 20 600 19 674 1.1 −0.7
Ukraine 6 284 2.0 27 3.1 20 886 16 851 5.2
Argentina 4373 −3.8 36 3.8 9 016 15 876 4.4 −0.2
United Kingdom 1939 −0.7 77 −0.4 14 076 14 878 0.6 −1.2
Iran (Islamic Republic of) 7 035 3.3 19 1.9 13 484 13 500 3.7 5.3
Kazakhstan 13 138 2.7 7 −2.1 17 052 9 638 0.6
Poland 2406 −0.9 39 2.0 9 790 9 488 0.7 1.1
Egypt 1 288 2.2 56 −1.3 8 523 7 177 7.1 0.9
Italy 1830 −2.4 37 1.5 6 535 6 850 0.4 −0.9
Uzbekistan 1 466 0.8 46 5.8 6 638 6 730 6.7
Brazil 2 182 7.4 28 6.1 5 056 6 171 −7.8 14.0
Romania 2 153 1.1 27 1.6 5 203 5 812 −5.1 2.7
Spain 1907 −2.1 29 −0.5 4 724 5 611 −0.7 −2.6
Denmark 764 2
.0 66 −1
.2 5 940 5 060 3
.3 0
.8
Morocco 2852 −0.2 17 13.6 6 371 4 876 −5.8 13.4
Afghanistan 2 354 1.5 19 10.3 5 064 4 532 3.3 11.9
Czech Republic 834 −1.5 50 1.7 4 358 4 162 0.2
Bulgaria 1 138 1.5 36 2.4 3 977 4 095 −6.9 3.9
Hungary 1011 −0.1 37 0.3 4 419 3 745 −8.7 0.1
Mexico 679 −0.4 54 0.9 4 116 3 677 −3.6 0.5
Algeria 1 900 8.7 16 5.9 2 953 3 100 2.5 15.1
Syrian Arab Republic 1599 −0.5 19 0.4 3 702 3 083 10.2 −0.1
Ethiopia 1 684 4.7 18 4.6 2 538 3 076 9.6
Turkmenistan 850 2.0 35 3.9 2 900 3 000 5.9
Iraq 1 383 1.4 20 20.0 1 700 2 749 5.0 21.8
Sweden 397 −0.1 54 −0.9 2 278 2 143 −0.5 −1.0
Belgium 210 −0.2 88 1.1 1 910 1 850 0.9
Belarus 603 2.9 29 3.0 1 979 1 739 6.1
Lithuania 518 3.4 33 −0.1 2 100 1 710 3.3
Greece 510 −5.1 33 1.9 1 830 1 663 −3.3 −3.3
Serbia 484 34 2 068 1 630
World 217 312 30 686 795 653 355
Africa 9 529 23 25 547 22 086
Eastern Africa 2 052 20 3 220 4 029
Middle Africa 15 15 24 23
Northern Africa 6 834 24 20 248 16 485
Southern Africa 574 25 1 978 1 463
Western Africa 54 16 77 86
Americas 36 359 31 109 932 113 688
Latin America and the Caribbean 8 819 35 22 718 30 458
Northern America 27 540 30 87 213 83 229
Asia 101 520 29 300 771 291 140
Central Asia 16 172 13 28 735 21 215
Eastern Asia 24 799 47 116 365 116 297
South-Eastern Asia 103 18 183 185
Southern Asia 48 088 26 125 458 124 609
Western Asia 12 359 23 30 029 28 833
Europe 56 343 36 228 485 203 859
Eastern Europe 36 743 24 114 626 89 371
Northern Europe 4 397 61 27 628 26 879
Southern Europe 5 202 33 17 230 17 371
Western Europe 10 000 70 69 001 70 238
Oceania 13 562 17 22 059 22 583
Australia and New Zealand 13 562 17 22 059 22 583
Melanesia 0 10 0 0
Micronesia 0 0 0
Polynesia 0 0 0
161
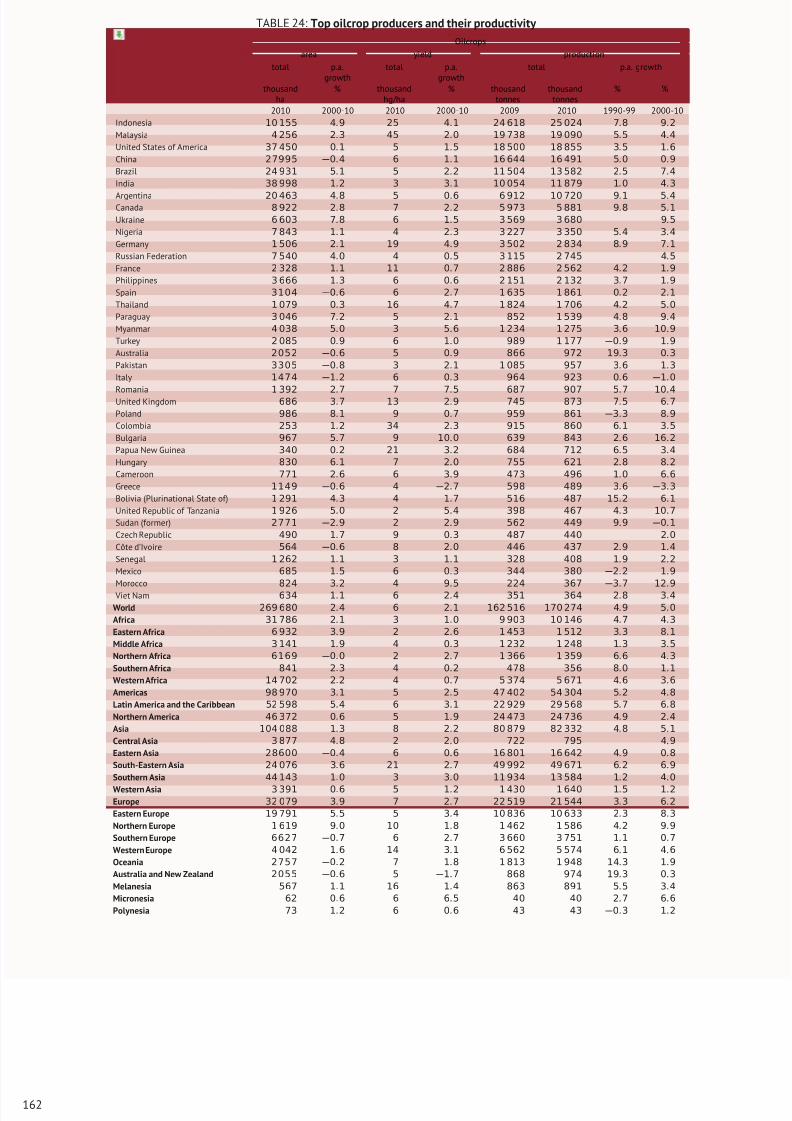
8/16/2019 Informe de la Fao 2013
http://slidepdf.com/reader/full/informe-de-la-fao-2013 180/307
TABLE 24: Top oilcrop producers and their productivity
Oilcrops
area yield production
total p.a.growth
total p.a.growth
total p.a. growth
thousandha
% thousandhg/ha
% thousandtonnes
thousandtonnes
% %
2010 2000-10 2010 2000-10 2009 2010 1990-99 2000-10
Indonesia 10 155 4.9 25 4.1 24 618 25 024 7.8 9.2
Malaysia 4 256 2.3 45 2.0 19 738 19 090 5.5 4.4
United States of America 37 450 0.1 5 1.5 18 500 18 855 3.5 1.6
China 27995 −0.4 6 1.1 16 644 16 491 5.0 0.9
Brazil 24 931 5.1 5 2.2 11 504 13 582 2.5 7.4
India 38 998 1.2 3 3.1 10 054 11 879 1.0 4.3
Argentina 20 463 4.8 5 0.6 6 912 10 720 9.1 5.4Canada 8 922 2.8 7 2.2 5 973 5 881 9.8 5.1
Ukraine 6 603 7.8 6 1.5 3 569 3 680 9.5
Nigeria 7 843 1.1 4 2.3 3 227 3 350 5.4 3.4
Germany 1 506 2.1 19 4.9 3 502 2 834 8.9 7.1
Russian Federation 7 540 4.0 4 0.5 3 115 2 745 4.5
France 2 328 1.1 11 0.7 2 886 2 562 4.2 1.9
Philippines 3 666 1.3 6 0.6 2 151 2 132 3.7 1.9
Spain 3104 −0.6 6 2.7 1 635 1 861 0.2 2.1
Thailand 1 079 0.3 16 4.7 1 824 1 706 4.2 5.0
Paraguay 3 046 7.2 5 2.1 852 1 539 4.8 9.4
Myanmar 4 038 5.0 3 5.6 1 234 1 275 3.6 10.9
Turkey 2 085 0.9 6 1.0 989 1 177 −0.9 1.9
Australia 2052 −0.6 5 0.9 866 972 19.3 0.3
Pakistan 3305 −0.8 3 2.1 1 085 957 3.6 1.3
Italy 1474 −1.2 6 0.3 964 923 0.6 −1.0
Romania 1 392 2
.7 7 7
.5 687 907 5
.7 10
.4
United Kingdom 686 3.7 13 2.9 745 873 7.5 6.7
Poland 986 8.1 9 0.7 959 861 −3.3 8.9
Colombia 253 1.2 34 2.3 915 860 6.1 3.5
Bulgaria 967 5.7 9 10.0 639 843 2.6 16.2
Papua New Guinea 340 0.2 21 3.2 684 712 6.5 3.4
Hungary 830 6.1 7 2.0 755 621 2.8 8.2
Cameroon 771 2.6 6 3.9 473 496 1.0 6.6
Greece 1149 −0.6 4 −2.7 598 489 3.6 −3.3
Bolivia (Plurinational State of) 1 291 4.3 4 1.7 516 487 15.2 6.1
United Republic of Tanzania 1 926 5.0 2 5.4 398 467 4.3 10.7
Sudan (former) 2771 −2.9 2 2.9 562 449 9.9 −0.1
Czech Republic 490 1.7 9 0.3 487 440 2.0
Côte d’Ivoire 564 −0.6 8 2.0 446 437 2.9 1.4
Senegal 1 262 1.1 3 1.1 328 408 1.9 2.2
Mexico 685 1.5 6 0.3 344 380 −2.2 1.9
Morocco 824 3.2 4 9.5 224 367 −3.7 12.9
Viet Nam 634 1.1 6 2.4 351 364 2.8 3.4
World 269 680 2.4 6 2.1 162 516 170 274 4.9 5.0
Africa 31 786 2.1 3 1.0 9 903 10 146 4.7 4.3
Eastern Africa 6 932 3.9 2 2.6 1 453 1 512 3.3 8.1
Middle Africa 3 141 1.9 4 0.3 1 232 1 248 1.3 3.5
Northern Africa 6169 −0.0 2 2.7 1 366 1 359 6.6 4.3
Southern Africa 841 2.3 4 0.2 478 356 8.0 1.1
Western Africa 14 702 2.2 4 0.7 5 374 5 671 4.6 3.6
Americas 98 970 3.1 5 2.5 47 402 54 304 5.2 4.8
Latin America and the Caribbean 52 598 5.4 6 3.1 22 929 29 568 5.7 6.8
Northern America 46 372 0.6 5 1.9 24 473 24 736 4.9 2.4
Asia 104 088 1.3 8 2.2 80 879 82 332 4.8 5.1
Central Asia 3 877 4.8 2 2.0 722 795 4.9
Eastern Asia 28600 −0.4 6 0.6 16 801 16 642 4.9 0.8
South-Eastern Asia 24 076 3.6 21 2.7 49 992 49 671 6.2 6.9
Southern Asia 44 143 1.0 3 3.0 11 934 13 584 1.2 4.0
Western Asia 3 391 0.6 5 1.2 1 430 1 640 1.5 1.2
Europe 32 079 3.9 7 2.7 22 519 21 544 3.3 6.2
Eastern Europe 19 791 5.5 5 3.4 10 836 10 633 2.3 8.3
Northern Europe 1 619 9.0 10 1.8 1 462 1 586 4.2 9.9
Southern Europe 6627 −0.7 6 2.7 3 660 3 751 1.1 0.7
Western Europe 4 042 1.6 14 3.1 6 562 5 574 6.1 4.6
Oceania 2757 −0.2 7 1.8 1 813 1 948 14.3 1.9
Australia and New Zealand 2055 −0.6 5 −1.7 868 974 19.3 0.3
Melanesia 567 1.1 16 1.4 863 891 5.5 3.4
Micronesia 62 0.6 6 6.5 40 40 2.7 6.6
Polynesia 73 1.2 6 0.6 43 43 −0.3 1.2
162
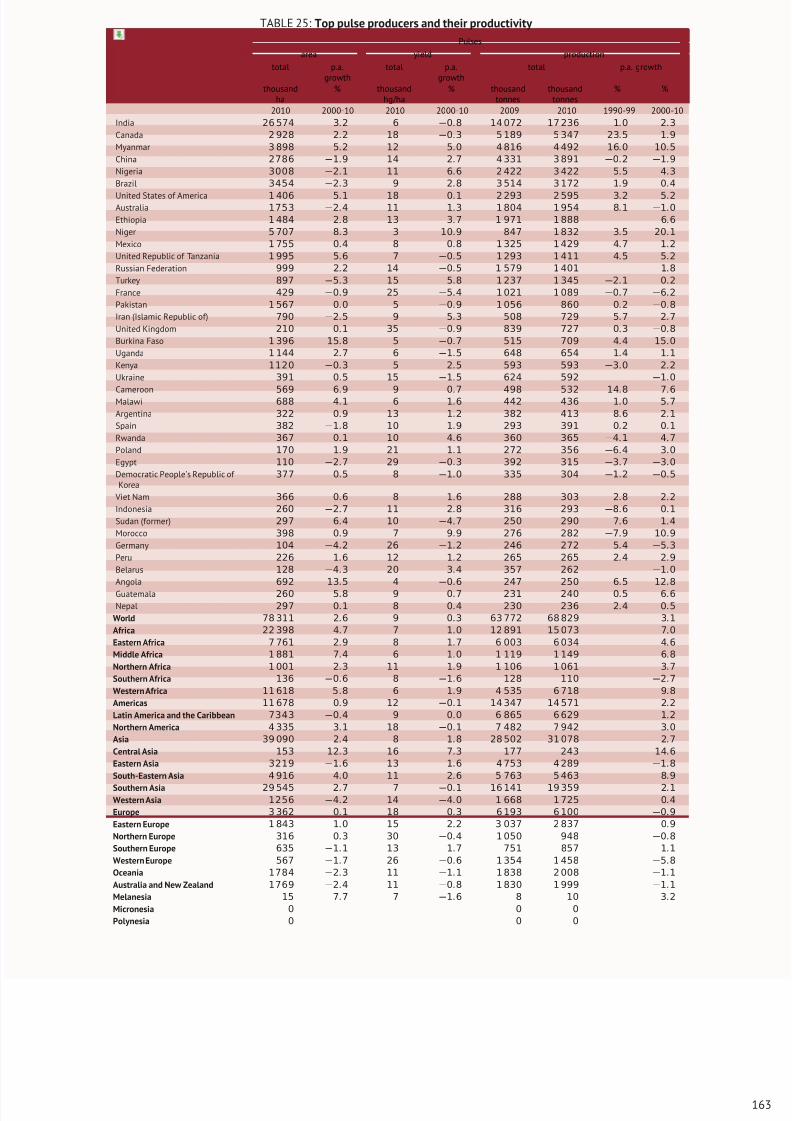
8/16/2019 Informe de la Fao 2013
http://slidepdf.com/reader/full/informe-de-la-fao-2013 181/307
TABLE 25: Top pulse producers and their productivity
Pulses
area yield production
total p.a.growth
total p.a.growth
total p.a. growth
thousandha
% thousandhg/ha
% thousandtonnes
thousandtonnes
% %
2010 2000-10 2010 2000-10 2009 2010 1990-99 2000-10
India 26 574 3.2 6 −0.8 14 072 17 236 1.0 2.3
Canada 2 928 2.2 18 −0.3 5 189 5 347 23.5 1.9
Myanmar 3 898 5.2 12 5.0 4 816 4 492 16.0 10.5
China 2786 −1.9 14 2.7 4 331 3 891 −0.2 −1.9
Nigeria 3008 −2.1 11 6.6 2 422 3 422 5.5 4.3
Brazil 3454 −2.3 9 2.8 3 514 3 172 1.9 0.4
United States of America 1 406 5.1 18 0.1 2 293 2 595 3.2 5.2Australia 1753 −2.4 11 1.3 1 804 1 954 8.1 −1.0
Ethiopia 1 484 2.8 13 3.7 1 971 1 888 6.6
Niger 5 707 8.3 3 10.9 847 1 832 3.5 20.1
Mexico 1 755 0.4 8 0.8 1 325 1 429 4.7 1.2
United Republic of Tanzania 1 995 5.6 7 −0.5 1 293 1 411 4.5 5.2
Russian Federation 999 2.2 14 −0.5 1 579 1 401 1.8
Turkey 897 −5.3 15 5.8 1 237 1 345 −2.1 0.2
France 429 −0.9 25 −5.4 1 021 1 089 −0.7 −6.2
Pakistan 1 567 0.0 5 −0.9 1 056 860 0.2 −0.8
Iran (Islamic Republic of) 790 −2.5 9 5.3 508 729 5.7 2.7
United Kingdom 210 0.1 35 −0.9 839 727 0.3 −0.8
Burkina Faso 1 396 15.8 5 −0.7 515 709 4.4 15.0
Uganda 1 144 2.7 6 −1.5 648 654 1.4 1.1
Kenya 1120 −0.3 5 2.5 593 593 −3.0 2.2
Ukraine 391 0.5 15 −1.5 624 592 −1.0
Cameroon 569 6
.9 9 0
.7 498 532 14
.8 7
.6
Malawi 688 4.1 6 1.6 442 436 1.0 5.7
Argentina 322 0.9 13 1.2 382 413 8.6 2.1
Spain 382 −1.8 10 1.9 293 391 0.2 0.1
Rwanda 367 0.1 10 4.6 360 365 −4.1 4.7
Poland 170 1.9 21 1.1 272 356 −6.4 3.0
Egypt 110 −2.7 29 −0.3 392 315 −3.7 −3.0
Democratic People’s Republic of Korea
377 0.5 8 −1.0 335 304 −1.2 −0.5
Viet Nam 366 0.6 8 1.6 288 303 2.8 2.2
Indonesia 260 −2.7 11 2.8 316 293 −8.6 0.1
Sudan (former) 297 6.4 10 −4.7 250 290 7.6 1.4
Morocco 398 0.9 7 9.9 276 282 −7.9 10.9
Germany 104 −4.2 26 −1.2 246 272 5.4 −5.3
Peru 226 1.6 12 1.2 265 265 2.4 2.9
Belarus 128 −4.3 20 3.4 357 262 −1.0
Angola 692 13.5 4 −0.6 247 250 6.5 12.8
Guatemala 260 5.8 9 0.7 231 240 0.5 6.6
Nepal 297 0.1 8 0.4 230 236 2.4 0.5
World 78 311 2.6 9 0.3 63 772 68 829 3.1
Africa 22 398 4.7 7 1.0 12 891 15 073 7.0
Eastern Africa 7 761 2.9 8 1.7 6 003 6 034 4.6
Middle Africa 1 881 7.4 6 1.0 1 119 1 149 6.8
Northern Africa 1 001 2.3 11 1.9 1 106 1 061 3.7
Southern Africa 136 −0.6 8 −1.6 128 110 −2.7
Western Africa 11 618 5.8 6 1.9 4 535 6 718 9.8
Americas 11 678 0.9 12 −0.1 14 347 14 571 2.2
Latin America and the Caribbean 7343 −0.4 9 0.0 6 865 6 629 1.2
Northern America 4 335 3.1 18 −0.1 7 482 7 942 3.0
Asia 39 090 2.4 8 1.8 28 502 31 078 2.7
Central Asia 153 12.3 16 7.3 177 243 14.6
Eastern Asia 3219 −1.6 13 1.6 4 753 4 289 −1.8
South-Eastern Asia 4 916 4.0 11 2.6 5 763 5 463 8.9
Southern Asia 29 545 2.7 7 −0.1 16 141 19 359 2.1
Western Asia 1256 −4.2 14 −4.0 1 668 1 725 0.4
Europe 3 362 0.1 18 0.3 6 193 6 100 −0.9
Eastern Europe 1 843 1.0 15 2.2 3 037 2 837 0.9
Northern Europe 316 0.3 30 −0.4 1 050 948 −0.8
Southern Europe 635 −1.1 13 1.7 751 857 1.1
Western Europe 567 −1.7 26 −0.6 1 354 1 458 −5.8
Oceania 1784 −2.3 11 −1.1 1 838 2 008 −1.1
Australia and New Zealand 1769 −2.4 11 −0.8 1 830 1 999 −1.1
Melanesia 15 7.7 7 −1.6 8 10 3.2
Micronesia 0 0 0
Polynesia 0 0 0
163
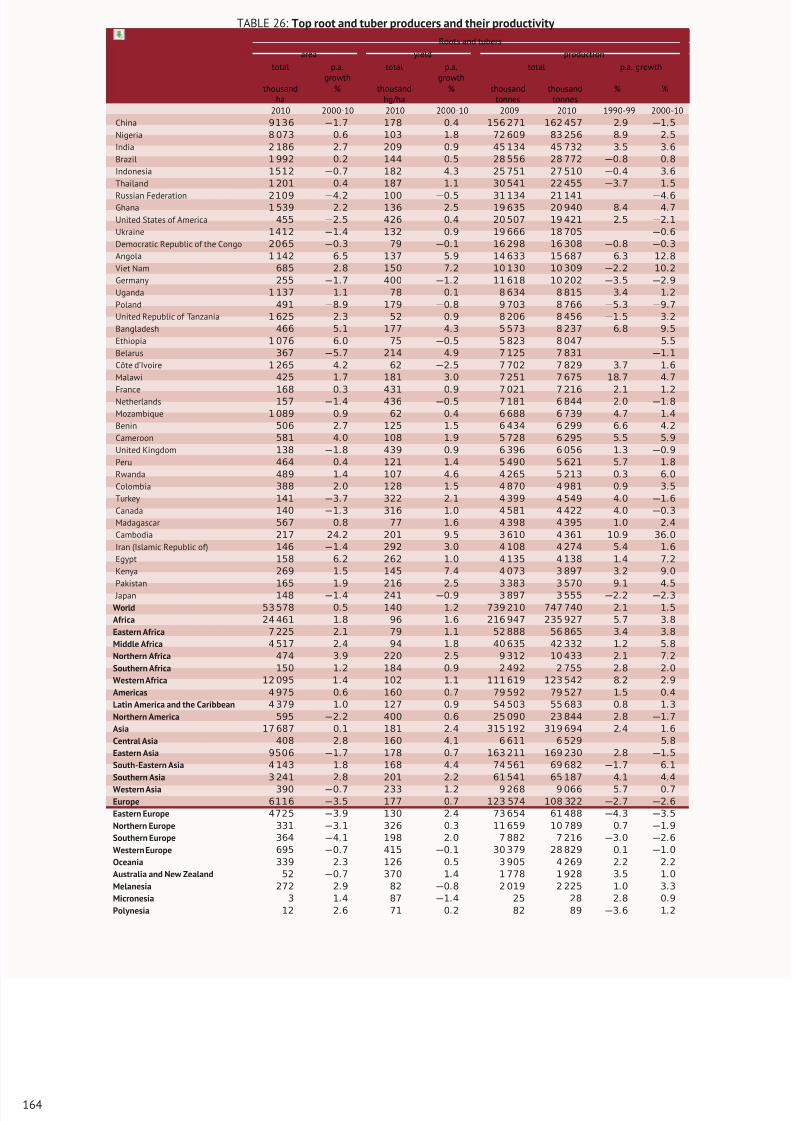
8/16/2019 Informe de la Fao 2013
http://slidepdf.com/reader/full/informe-de-la-fao-2013 182/307
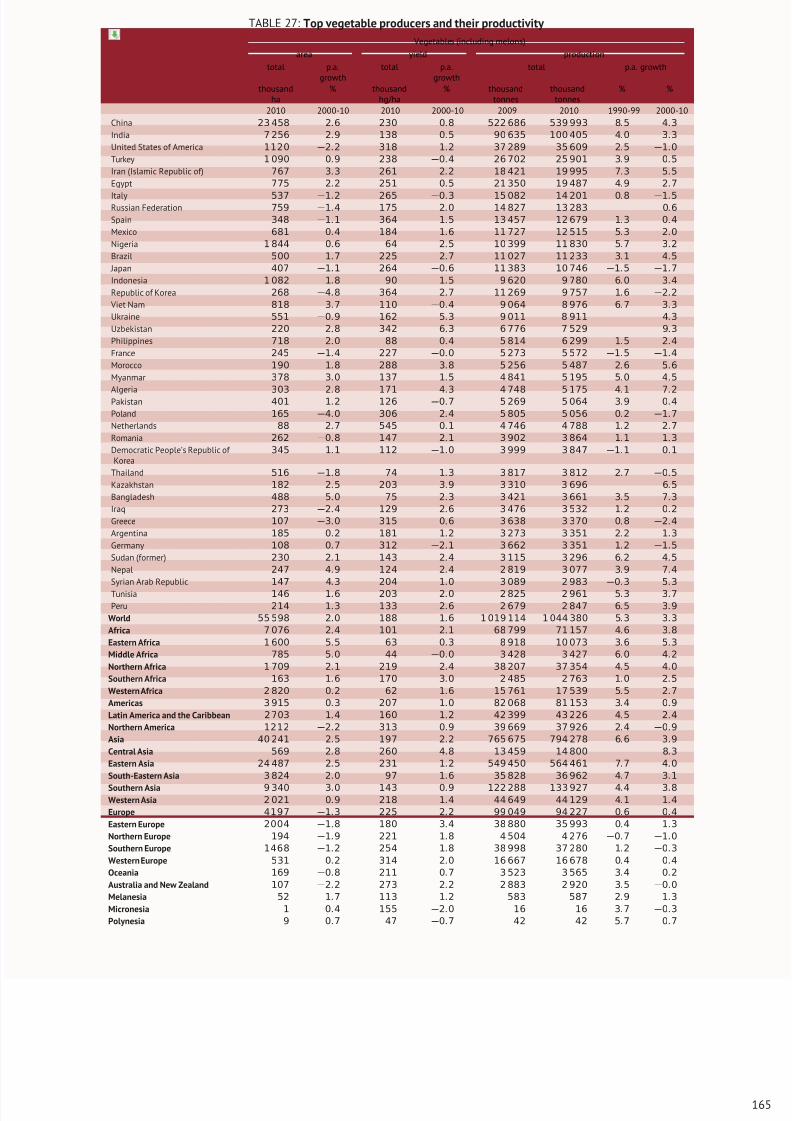
8/16/2019 Informe de la Fao 2013
http://slidepdf.com/reader/full/informe-de-la-fao-2013 183/307
TABLE 27: Top vegetable producers and their productivity
Vegetables (including melons)
area yield production
total p.a.growth
total p.a.growth
total p.a. growth
thousandha
% thousandhg/ha
% thousandtonnes
thousandtonnes
% %
2010 2000-10 2010 2000-10 2009 2010 1990-99 2000-10
China 23 458 2.6 230 0.8 522 686 539 993 8.5 4.3
India 7 256 2.9 138 0.5 90 635 100 405 4.0 3.3
United States of America 1120 −2.2 318 1.2 37 289 35 609 2.5 −1.0
Turkey 1 090 0.9 238 −0.4 26 702 25 901 3.9 0.5
Iran (Islamic Republic of) 767 3.3 261 2.2 18 421 19 995 7.3 5.5
Egypt 775 2.2 251 0.5 21 350 19 487 4.9 2.7
Italy 537 −1.2 265 −0.3 15 082 14 201 0.8 −1.5Russian Federation 759 −1.4 175 2.0 14 827 13 283 0.6
Spain 348 −1.1 364 1.5 13 457 12 679 1.3 0.4
Mexico 681 0.4 184 1.6 11 727 12 515 5.3 2.0
Nigeria 1 844 0.6 64 2.5 10 399 11 830 5.7 3.2
Brazil 500 1.7 225 2.7 11 027 11 233 3.1 4.5
Japan 407 −1.1 264 −0.6 11 383 10 746 −1.5 −1.7
Indonesia 1 082 1.8 90 1.5 9 620 9 780 6.0 3.4
Republic of Korea 268 −4.8 364 2.7 11 269 9 757 1.6 −2.2
Viet Nam 818 3.7 110 −0.4 9 064 8 976 6.7 3.3
Ukraine 551 −0.9 162 5.3 9 011 8 911 4.3
Uzbekistan 220 2.8 342 6.3 6 776 7 529 9.3
Philippines 718 2.0 88 0.4 5 814 6 299 1.5 2.4
France 245 −1.4 227 −0.0 5 273 5 572 −1.5 −1.4
Morocco 190 1.8 288 3.8 5 256 5 487 2.6 5.6
Myanmar 378 3.0 137 1.5 4 841 5 195 5.0 4.5
Algeria 303 2
.8 171 4
.3 4 748 5 175 4
.1 7
.2
Pakistan 401 1.2 126 −0.7 5 269 5 064 3.9 0.4
Poland 165 −4.0 306 2.4 5 805 5 056 0.2 −1.7
Netherlands 88 2.7 545 0.1 4 746 4 788 1.2 2.7
Romania 262 −0.8 147 2.1 3 902 3 864 1.1 1.3
Democratic People’s Republic of Korea
345 1.1 112 −1.0 3 999 3 847 −1.1 0.1
Thailand 516 −1.8 74 1.3 3 817 3 812 2.7 −0.5
Kazakhstan 182 2.5 203 3.9 3 310 3 696 6.5
Bangladesh 488 5.0 75 2.3 3 421 3 661 3.5 7.3
Iraq 273 −2.4 129 2.6 3 476 3 532 1.2 0.2
Greece 107 −3.0 315 0.6 3 638 3 370 0.8 −2.4
Argentina 185 0.2 181 1.2 3 273 3 351 2.2 1.3
Germany 108 0.7 312 −2.1 3 662 3 351 1.2 −1.5
Sudan (former) 230 2.1 143 2.4 3 115 3 296 6.2 4.5
Nepal 247 4.9 124 2.4 2 819 3 077 3.9 7.4
Syrian Arab Republic 147 4.3 204 1.0 3 089 2 983 −0.3 5.3
Tunisia 146 1.6 203 2.0 2 825 2 961 5.3 3.7
Peru 214 1.3 133 2.6 2 679 2 847 6.5 3.9
World 55 598 2.0 188 1.6 1 019 114 1 044 380 5.3 3.3
Africa 7 076 2.4 101 2.1 68 799 71 157 4.6 3.8
Eastern Africa 1 600 5.5 63 0.3 8 918 10 073 3.6 5.3
Middle Africa 785 5.0 44 −0.0 3 428 3 427 6.0 4.2
Northern Africa 1 709 2.1 219 2.4 38 207 37 354 4.5 4.0
Southern Africa 163 1.6 170 3.0 2 485 2 763 1.0 2.5
Western Africa 2 820 0.2 62 1.6 15 761 17 539 5.5 2.7
Americas 3 915 0.3 207 1.0 82 068 81 153 3.4 0.9
Latin America and the Caribbean 2 703 1.4 160 1.2 42 399 43 226 4.5 2.4
Northern America 1212 −2.2 313 0.9 39 669 37 926 2.4 −0.9
Asia 40 241 2.5 197 2.2 765 675 794 278 6.6 3.9
Central Asia 569 2.8 260 4.8 13 459 14 800 8.3
Eastern Asia 24 487 2.5 231 1.2 549 450 564 461 7.7 4.0
South-Eastern Asia 3 824 2.0 97 1.6 35 828 36 962 4.7 3.1
Southern Asia 9 340 3.0 143 0.9 122 288 133 927 4.4 3.8
Western Asia 2 021 0.9 218 1.4 44 649 44 129 4.1 1.4
Europe 4197 −1.3 225 2.2 99 049 94 227 0.6 0.4
Eastern Europe 2004 −1.8 180 3.4 38 880 35 993 0.4 1.3
Northern Europe 194 −1.9 221 1.8 4 504 4 276 −0.7 −1.0
Southern Europe 1468 −1.2 254 1.8 38 998 37 280 1.2 −0.3
Western Europe 531 0.2 314 2.0 16 667 16 678 0.4 0.4
Oceania 169 −0.8 211 0.7 3 523 3 565 3.4 0.2
Australia and New Zealand 107 −2.2 273 2.2 2 883 2 920 3.5 −0.0
Melanesia 52 1.7 113 1.2 583 587 2.9 1.3
Micronesia 1 0.4 155 −2.0 16 16 3.7 −0.3
Polynesia 9 0.7 47 −0.7 42 42 5.7 0.7
165
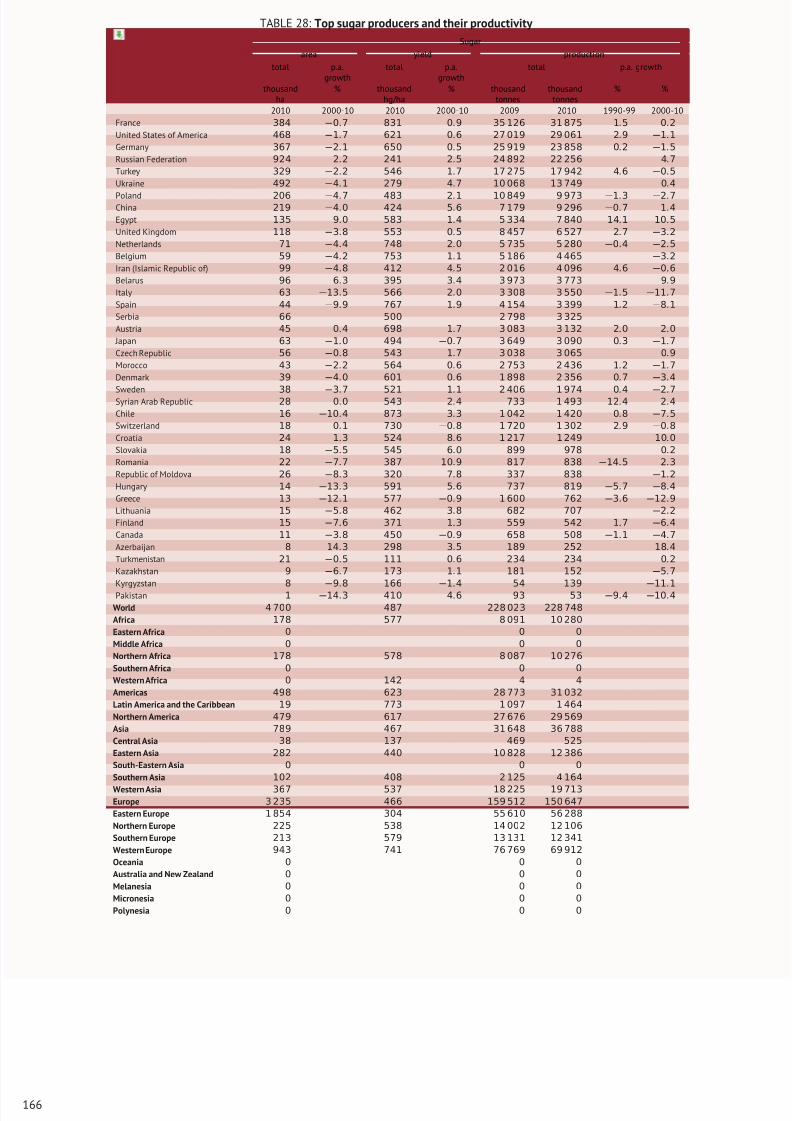
8/16/2019 Informe de la Fao 2013
http://slidepdf.com/reader/full/informe-de-la-fao-2013 184/307
TABLE 28: Top sugar producers and their productivity
Sugar
area yield production
total p.a.growth
total p.a.growth
total p.a. growth
thousandha
% thousandhg/ha
% thousandtonnes
thousandtonnes
% %
2010 2000-10 2010 2000-10 2009 2010 1990-99 2000-10
France 384 −0.7 831 0.9 35 126 31 875 1.5 0.2
United States of America 468 −1.7 621 0.6 27 019 29 061 2.9 −1.1
Germany 367 −2.1 650 0.5 25 919 23 858 0.2 −1.5
Russian Federation 924 2.2 241 2.5 24 892 22 256 4.7
Turkey 329 −2.2 546 1.7 17 275 17 942 4.6 −0.5
Ukraine 492 −4.1 279 4.7 10 068 13 749 0.4
Poland 206 −4.7 483 2.1 10 849 9 973 −1.3 −2.7China 219 −4.0 424 5.6 7 179 9 296 −0.7 1.4
Egypt 135 9.0 583 1.4 5 334 7 840 14.1 10.5
United Kingdom 118 −3.8 553 0.5 8 457 6 527 2.7 −3.2
Netherlands 71 −4.4 748 2.0 5 735 5 280 −0.4 −2.5
Belgium 59 −4.2 753 1.1 5 186 4 465 −3.2
Iran (Islamic Republic of) 99 −4.8 412 4.5 2 016 4 096 4.6 −0.6
Belarus 96 6.3 395 3.4 3 973 3 773 9.9
Italy 63 −13.5 566 2.0 3 308 3 550 −1.5 −11.7
Spain 44 −9.9 767 1.9 4 154 3 399 1.2 −8.1
Serbia 66 500 2 798 3 325
Austria 45 0.4 698 1.7 3 083 3 132 2.0 2.0
Japan 63 −1.0 494 −0.7 3 649 3 090 0.3 −1.7
Czech Republic 56 −0.8 543 1.7 3 038 3 065 0.9
Morocco 43 −2.2 564 0.6 2 753 2 436 1.2 −1.7
Denmark 39 −4.0 601 0.6 1 898 2 356 0.7 −3.4
Sweden 38 −3
.7 521 1
.1 2 406 1 974 0
.4 −2
.7
Syrian Arab Republic 28 0.0 543 2.4 733 1 493 12.4 2.4
Chile 16 −10.4 873 3.3 1 042 1 420 0.8 −7.5
Switzerland 18 0.1 730 −0.8 1 720 1 302 2.9 −0.8
Croatia 24 1.3 524 8.6 1 217 1 249 10.0
Slovakia 18 −5.5 545 6.0 899 978 0.2
Romania 22 −7.7 387 10.9 817 838 −14.5 2.3
Republic of Moldova 26 −8.3 320 7.8 337 838 −1.2
Hungary 14 −13.3 591 5.6 737 819 −5.7 −8.4
Greece 13 −12.1 577 −0.9 1 600 762 −3.6 −12.9
Lithuania 15 −5.8 462 3.8 682 707 −2.2
Finland 15 −7.6 371 1.3 559 542 1.7 −6.4
Canada 11 −3.8 450 −0.9 658 508 −1.1 −4.7
Azerbaijan 8 14.3 298 3.5 189 252 18.4
Turkmenistan 21 −0.5 111 0.6 234 234 0.2
Kazakhstan 9 −6.7 173 1.1 181 152 −5.7
Kyrgyzstan 8 −9.8 166 −1.4 54 139 −11.1
Pakistan 1 −14.3 410 4.6 93 53 −9.4 −10.4
World 4 700 487 228 023 228 748
Africa 178 577 8 091 10 280
Eastern Africa 0 0 0
Middle Africa 0 0 0
Northern Africa 178 578 8 087 10 276
Southern Africa 0 0 0
Western Africa 0 142 4 4
Americas 498 623 28 773 31 032
Latin America and the Caribbean 19 773 1 097 1 464
Northern America 479 617 27 676 29 569
Asia 789 467 31 648 36 788
Central Asia 38 137 469 525
Eastern Asia 282 440 10 828 12 386
South-Eastern Asia 0 0 0
Southern Asia 102 408 2 125 4 164
Western Asia 367 537 18 225 19 713
Europe 3 235 466 159 512 150 647
Eastern Europe 1 854 304 55 610 56 288
Northern Europe 225 538 14 002 12 106
Southern Europe 213 579 13 131 12 341
Western Europe 943 741 76 769 69 912
Oceania 0 0 0
Australia and New Zealand 0 0 0
Melanesia 0 0 0
Micronesia 0 0 0
Polynesia 0 0 0
166
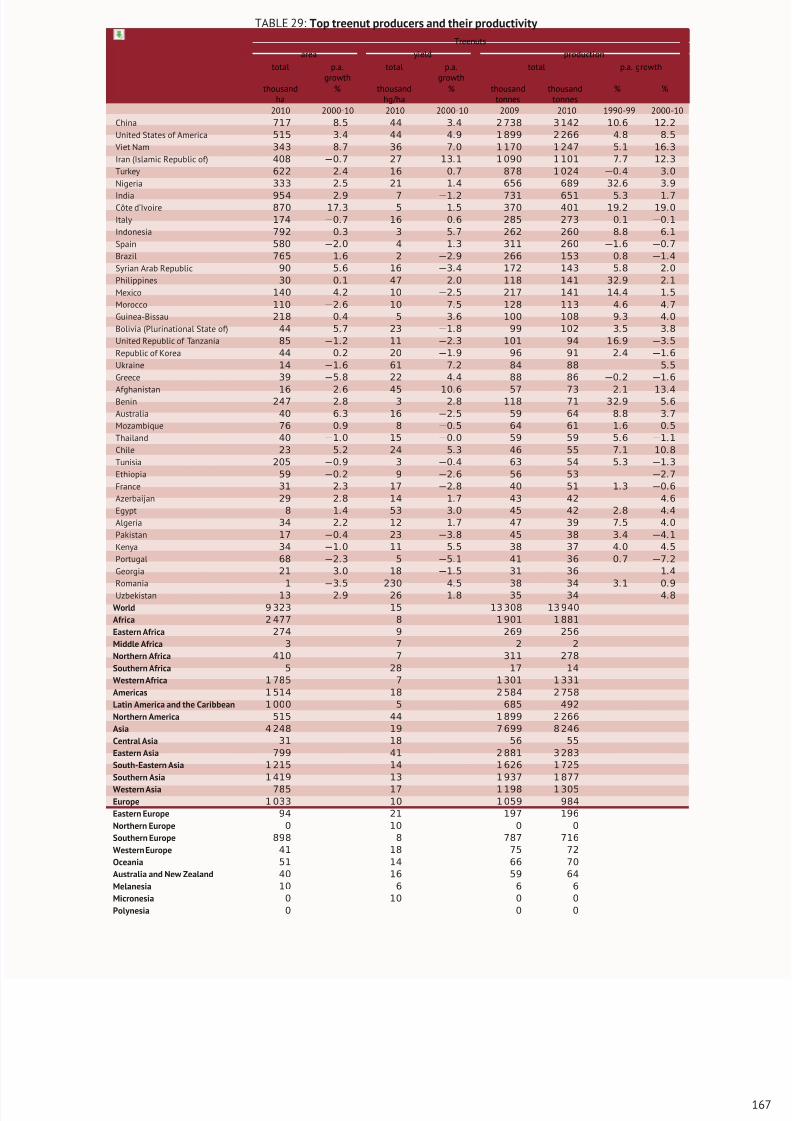
8/16/2019 Informe de la Fao 2013
http://slidepdf.com/reader/full/informe-de-la-fao-2013 185/307
TABLE 29: Top treenut producers and their productivity
Treenuts
area yield production
total p.a.growth
total p.a.growth
total p.a. growth
thousandha
% thousandhg/ha
% thousandtonnes
thousandtonnes
% %
2010 2000-10 2010 2000-10 2009 2010 1990-99 2000-10
China 717 8.5 44 3.4 2 738 3 142 10.6 12.2
United States of America 515 3.4 44 4.9 1 899 2 266 4.8 8.5
Viet Nam 343 8.7 36 7.0 1 170 1 247 5.1 16.3
Iran (Islamic Republic of) 408 −0.7 27 13.1 1 090 1 101 7.7 12.3
Turkey 622 2.4 16 0.7 878 1 024 −0.4 3.0
Nigeria 333 2.5 21 1.4 656 689 32.6 3.9
India 954 2.9 7 −1.2 731 651 5.3 1.7Côte d’Ivoire 870 17.3 5 1.5 370 401 19.2 19.0
Italy 174 −0.7 16 0.6 285 273 0.1 −0.1
Indonesia 792 0.3 3 5.7 262 260 8.8 6.1
Spain 580 −2.0 4 1.3 311 260 −1.6 −0.7
Brazil 765 1.6 2 −2.9 266 153 0.8 −1.4
Syrian Arab Republic 90 5.6 16 −3.4 172 143 5.8 2.0
Philippines 30 0.1 47 2.0 118 141 32.9 2.1
Mexico 140 4.2 10 −2.5 217 141 14.4 1.5
Morocco 110 −2.6 10 7.5 128 113 4.6 4.7
Guinea-Bissau 218 0.4 5 3.6 100 108 9.3 4.0
Bolivia (Plurinational State of) 44 5.7 23 −1.8 99 102 3.5 3.8
United Republic of Tanzania 85 −1.2 11 −2.3 101 94 16.9 −3.5
Republic of Korea 44 0.2 20 −1.9 96 91 2.4 −1.6
Ukraine 14 −1.6 61 7.2 84 88 5.5
Greece 39 −5.8 22 4.4 88 86 −0.2 −1.6
Afghanistan 16 2
.6 45 10
.6 57 73 2
.1 13
.4
Benin 247 2.8 3 2.8 118 71 32.9 5.6
Australia 40 6.3 16 −2.5 59 64 8.8 3.7
Mozambique 76 0.9 8 −0.5 64 61 1.6 0.5
Thailand 40 −1.0 15 −0.0 59 59 5.6 −1.1
Chile 23 5.2 24 5.3 46 55 7.1 10.8
Tunisia 205 −0.9 3 −0.4 63 54 5.3 −1.3
Ethiopia 59 −0.2 9 −2.6 56 53 −2.7
France 31 2.3 17 −2.8 40 51 1.3 −0.6
Azerbaijan 29 2.8 14 1.7 43 42 4.6
Egypt 8 1.4 53 3.0 45 42 2.8 4.4
Algeria 34 2.2 12 1.7 47 39 7.5 4.0
Pakistan 17 −0.4 23 −3.8 45 38 3.4 −4.1
Kenya 34 −1.0 11 5.5 38 37 4.0 4.5
Portugal 68 −2.3 5 −5.1 41 36 0.7 −7.2
Georgia 21 3.0 18 −1.5 31 36 1.4
Romania 1 −3.5 230 4.5 38 34 3.1 0.9
Uzbekistan 13 2.9 26 1.8 35 34 4.8
World 9 323 15 13 308 13 940
Africa 2 477 8 1 901 1 881
Eastern Africa 274 9 269 256
Middle Africa 3 7 2 2
Northern Africa 410 7 311 278
Southern Africa 5 28 17 14
Western Africa 1 785 7 1 301 1 331
Americas 1 514 18 2 584 2 758
Latin America and the Caribbean 1 000 5 685 492
Northern America 515 44 1 899 2 266
Asia 4 248 19 7 699 8 246
Central Asia 31 18 56 55
Eastern Asia 799 41 2 881 3 283
South-Eastern Asia 1 215 14 1 626 1 725
Southern Asia 1 419 13 1 937 1 877
Western Asia 785 17 1 198 1 305
Europe 1 033 10 1 059 984
Eastern Europe 94 21 197 196
Northern Europe 0 10 0 0
Southern Europe 898 8 787 716
Western Europe 41 18 75 72
Oceania 51 14 66 70
Australia and New Zealand 40 16 59 64
Melanesia 10 6 6 6
Micronesia 0 10 0 0
Polynesia 0 0 0
167
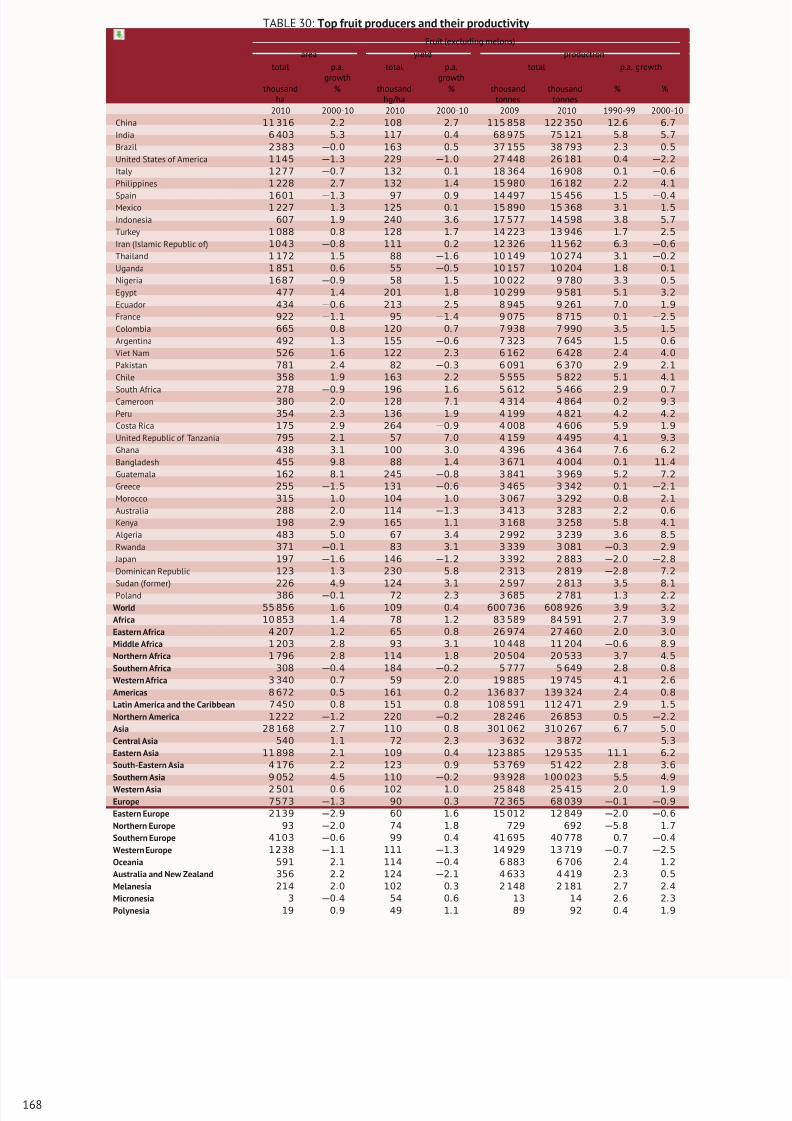
8/16/2019 Informe de la Fao 2013
http://slidepdf.com/reader/full/informe-de-la-fao-2013 186/307
TABLE 30: Top fruit producers and their productivity
Fruit (excluding melons)
area yield production
total p.a.growth
total p.a.growth
total p.a. growth
thousandha
% thousandhg/ha
% thousandtonnes
thousandtonnes
% %
2010 2000-10 2010 2000-10 2009 2010 1990-99 2000-10
China 11 316 2.2 108 2.7 115 858 122 350 12.6 6.7
India 6 403 5.3 117 0.4 68 975 75 121 5.8 5.7
Brazil 2383 −0.0 163 0.5 37 155 38 793 2.3 0.5
United States of America 1145 −1.3 229 −1.0 27 448 26 181 0.4 −2.2
Italy 1277 −0.7 132 0.1 18 364 16 908 0.1 −0.6
Philippines 1 228 2.7 132 1.4 15 980 16 182 2.2 4.1
Spain 1601 −1.3 97 0.9 14 497 15 456 1.5 −0.4Mexico 1 227 1.3 125 0.1 15 890 15 368 3.1 1.5
Indonesia 607 1.9 240 3.6 17 577 14 598 3.8 5.7
Turkey 1 088 0.8 128 1.7 14 223 13 946 1.7 2.5
Iran (Islamic Republic of) 1043 −0.8 111 0.2 12 326 11 562 6.3 −0.6
Thailand 1 172 1.5 88 −1.6 10 149 10 274 3.1 −0.2
Uganda 1 851 0.6 55 −0.5 10 157 10 204 1.8 0.1
Nigeria 1687 −0.9 58 1.5 10 022 9 780 3.3 0.5
Egypt 477 1.4 201 1.8 10 299 9 581 5.1 3.2
Ecuador 434 −0.6 213 2.5 8 945 9 261 7.0 1.9
France 922 −1.1 95 −1.4 9 075 8 715 0.1 −2.5
Colombia 665 0.8 120 0.7 7 938 7 990 3.5 1.5
Argentina 492 1.3 155 −0.6 7 323 7 645 1.5 0.6
Viet Nam 526 1.6 122 2.3 6 162 6 428 2.4 4.0
Pakistan 781 2.4 82 −0.3 6 091 6 370 2.9 2.1
Chile 358 1.9 163 2.2 5 555 5 822 5.1 4.1
South Africa 278 −0
.9 196 1
.6 5 612 5 466 2
.9 0
.7
Cameroon 380 2.0 128 7.1 4 314 4 864 0.2 9.3
Peru 354 2.3 136 1.9 4 199 4 821 4.2 4.2
Costa Rica 175 2.9 264 −0.9 4 008 4 606 5.9 1.9
United Republic of Tanzania 795 2.1 57 7.0 4 159 4 495 4.1 9.3
Ghana 438 3.1 100 3.0 4 396 4 364 7.6 6.2
Bangladesh 455 9.8 88 1.4 3 671 4 004 0.1 11.4
Guatemala 162 8.1 245 −0.8 3 841 3 969 5.2 7.2
Greece 255 −1.5 131 −0.6 3 465 3 342 0.1 −2.1
Morocco 315 1.0 104 1.0 3 067 3 292 0.8 2.1
Australia 288 2.0 114 −1.3 3 413 3 283 2.2 0.6
Kenya 198 2.9 165 1.1 3 168 3 258 5.8 4.1
Algeria 483 5.0 67 3.4 2 992 3 239 3.6 8.5
Rwanda 371 −0.1 83 3.1 3 339 3 081 −0.3 2.9
Japan 197 −1.6 146 −1.2 3 392 2 883 −2.0 −2.8
Dominican Republic 123 1.3 230 5.8 2 313 2 819 −2.8 7.2
Sudan (former) 226 4.9 124 3.1 2 597 2 813 3.5 8.1
Poland 386 −0.1 72 2.3 3 685 2 781 1.3 2.2
World 55 856 1.6 109 0.4 600 736 608 926 3.9 3.2
Africa 10 853 1.4 78 1.2 83 589 84 591 2.7 3.9
Eastern Africa 4 207 1.2 65 0.8 26 974 27 460 2.0 3.0
Middle Africa 1 203 2.8 93 3.1 10 448 11 204 −0.6 8.9
Northern Africa 1 796 2.8 114 1.8 20 504 20 533 3.7 4.5
Southern Africa 308 −0.4 184 −0.2 5 777 5 649 2.8 0.8
Western Africa 3 340 0.7 59 2.0 19 885 19 745 4.1 2.6
Americas 8 672 0.5 161 0.2 136 837 139 324 2.4 0.8
Latin America and the Caribbean 7 450 0.8 151 0.8 108 591 112 471 2.9 1.5
Northern America 1222 −1.2 220 −0.2 28 246 26 853 0.5 −2.2
Asia 28 168 2.7 110 0.8 301 062 310 267 6.7 5.0
Central Asia 540 1.1 72 2.3 3 632 3 872 5.3
Eastern Asia 11 898 2.1 109 0.4 123 885 129 535 11.1 6.2
South-Eastern Asia 4 176 2.2 123 0.9 53 769 51 422 2.8 3.6
Southern Asia 9 052 4.5 110 −0.2 93 928 100 023 5.5 4.9
Western Asia 2 501 0.6 102 1.0 25 848 25 415 2.0 1.9
Europe 7573 −1.3 90 0.3 72 365 68 039 −0.1 −0.9
Eastern Europe 2139 −2.9 60 1.6 15 012 12 849 −2.0 −0.6
Northern Europe 93 −2.0 74 1.8 729 692 −5.8 1.7
Southern Europe 4103 −0.6 99 0.4 41 695 40 778 0.7 −0.4
Western Europe 1238 −1.1 111 −1.3 14 929 13 719 −0.7 −2.5
Oceania 591 2.1 114 −0.4 6 883 6 706 2.4 1.2
Australia and New Zealand 356 2.2 124 −2.1 4 633 4 419 2.3 0.5
Melanesia 214 2.0 102 0.3 2 148 2 181 2.7 2.4
Micronesia 3 −0.4 54 0.6 13 14 2.6 2.3
Polynesia 19 0.9 49 1.1 89 92 0.4 1.9
168
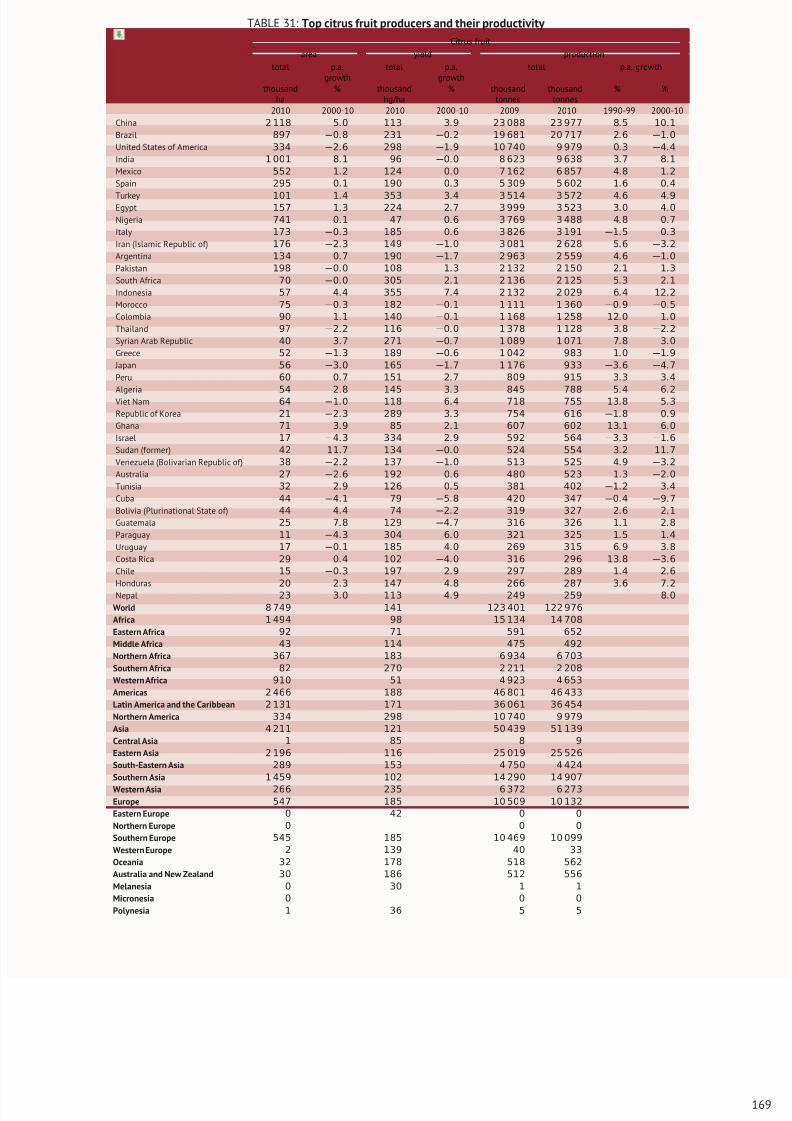
8/16/2019 Informe de la Fao 2013
http://slidepdf.com/reader/full/informe-de-la-fao-2013 187/307
TABLE 31: Top citrus fruit producers and their productivity
Citrus fruit
area yield production
total p.a.growth
total p.a.growth
total p.a. growth
thousandha
% thousandhg/ha
% thousandtonnes
thousandtonnes
% %
2010 2000-10 2010 2000-10 2009 2010 1990-99 2000-10
China 2 118 5.0 113 3.9 23 088 23 977 8.5 10.1
Brazil 897 −0.8 231 −0.2 19 681 20 717 2.6 −1.0
United States of America 334 −2.6 298 −1.9 10 740 9 979 0.3 −4.4
India 1 001 8.1 96 −0.0 8 623 9 638 3.7 8.1
Mexico 552 1.2 124 0.0 7 162 6 857 4.8 1.2
Spain 295 0.1 190 0.3 5 309 5 602 1.6 0.4
Turkey 101 1.4 353 3.4 3 514 3 572 4.6 4.9Egypt 157 1.3 224 2.7 3 999 3 523 3.0 4.0
Nigeria 741 0.1 47 0.6 3 769 3 488 4.8 0.7
Italy 173 −0.3 185 0.6 3 826 3 191 −1.5 0.3
Iran (Islamic Republic of) 176 −2.3 149 −1.0 3 081 2 628 5.6 −3.2
Argentina 134 0.7 190 −1.7 2 963 2 559 4.6 −1.0
Pakistan 198 −0.0 108 1.3 2 132 2 150 2.1 1.3
South Africa 70 −0.0 305 2.1 2 136 2 125 5.3 2.1
Indonesia 57 4.4 355 7.4 2 132 2 029 6.4 12.2
Morocco 75 −0.3 182 −0.1 1 111 1 360 −0.9 −0.5
Colombia 90 1.1 140 −0.1 1 168 1 258 12.0 1.0
Thailand 97 −2.2 116 −0.0 1 378 1 128 3.8 −2.2
Syrian Arab Republic 40 3.7 271 −0.7 1 089 1 071 7.8 3.0
Greece 52 −1.3 189 −0.6 1 042 983 1.0 −1.9
Japan 56 −3.0 165 −1.7 1 176 933 −3.6 −4.7
Peru 60 0.7 151 2.7 809 915 3.3 3.4
Algeria 54 2
.8 145 3
.3 845 788 5
.4 6
.2
Viet Nam 64 −1.0 118 6.4 718 755 13.8 5.3
Republic of Korea 21 −2.3 289 3.3 754 616 −1.8 0.9
Ghana 71 3.9 85 2.1 607 602 13.1 6.0
Israel 17 −4.3 334 2.9 592 564 −3.3 −1.6
Sudan (former) 42 11.7 134 −0.0 524 554 3.2 11.7
Venezuela (Bolivarian Republic of) 38 −2.2 137 −1.0 513 525 4.9 −3.2
Australia 27 −2.6 192 0.6 480 523 1.3 −2.0
Tunisia 32 2.9 126 0.5 381 402 −1.2 3.4
Cuba 44 −4.1 79 −5.8 420 347 −0.4 −9.7
Bolivia (Plurinational State of) 44 4.4 74 −2.2 319 327 2.6 2.1
Guatemala 25 7.8 129 −4.7 316 326 1.1 2.8
Paraguay 11 −4.3 304 6.0 321 325 1.5 1.4
Uruguay 17 −0.1 185 4.0 269 315 6.9 3.8
Costa Rica 29 0.4 102 −4.0 316 296 13.8 −3.6
Chile 15 −0.3 197 2.9 297 289 1.4 2.6
Honduras 20 2.3 147 4.8 266 287 3.6 7.2
Nepal 23 3.0 113 4.9 249 259 8.0
World 8 749 141 123 401 122 976
Africa 1 494 98 15 134 14 708
Eastern Africa 92 71 591 652
Middle Africa 43 114 475 492
Northern Africa 367 183 6 934 6 703
Southern Africa 82 270 2 211 2 208
Western Africa 910 51 4 923 4 653
Americas 2 466 188 46 801 46 433
Latin America and the Caribbean 2 131 171 36 061 36 454
Northern America 334 298 10 740 9 979
Asia 4 211 121 50 439 51 139
Central Asia 1 85 8 9
Eastern Asia 2 196 116 25 019 25 526
South-Eastern Asia 289 153 4 750 4 424
Southern Asia 1 459 102 14 290 14 907
Western Asia 266 235 6 372 6 273
Europe 547 185 10 509 10 132
Eastern Europe 0 42 0 0
Northern Europe 0 0 0
Southern Europe 545 185 10 469 10 099
Western Europe 2 139 40 33
Oceania 32 178 518 562
Australia and New Zealand 30 186 512 556
Melanesia 0 30 1 1
Micronesia 0 0 0
Polynesia 1 36 5 5
169
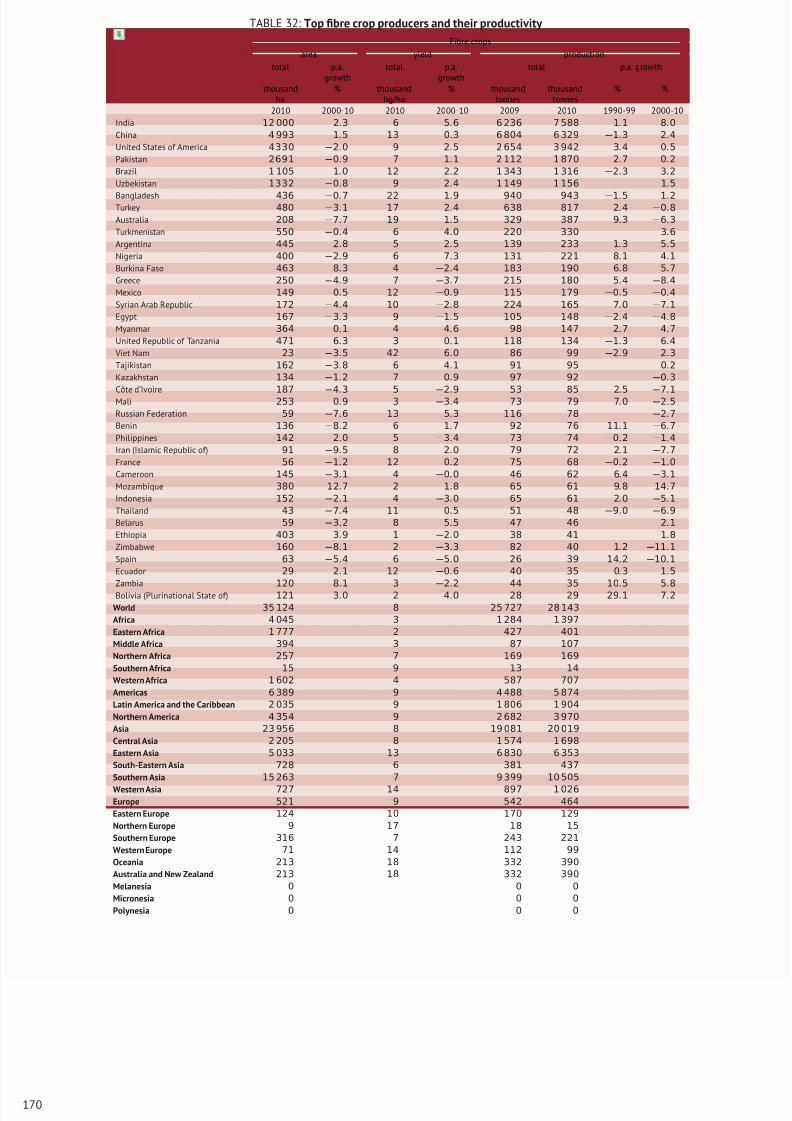
8/16/2019 Informe de la Fao 2013
http://slidepdf.com/reader/full/informe-de-la-fao-2013 188/307
TABLE 32: Top fibre crop producers and their productivity
Fibre crops
area yield production
total p.a.growth
total p.a.growth
total p.a. growth
thousandha
% thousandhg/ha
% thousandtonnes
thousandtonnes
% %
2010 2000-10 2010 2000-10 2009 2010 1990-99 2000-10
India 12 000 2.3 6 5.6 6 236 7 588 1.1 8.0
China 4 993 1.5 13 0.3 6 804 6 329 −1.3 2.4
United States of America 4330 −2.0 9 2.5 2 654 3 942 3.4 0.5
Pakistan 2691 −0.9 7 1.1 2 112 1 870 2.7 0.2
Brazil 1 105 1.0 12 2.2 1 343 1 316 −2.3 3.2
Uzbekistan 1332 −0.8 9 2.4 1 149 1 156 1.5
Bangladesh 436 −0.7 22 1.9 940 943 −1.5 1.2Turkey 480 −3.1 17 2.4 638 817 2.4 −0.8
Australia 208 −7.7 19 1.5 329 387 9.3 −6.3
Turkmenistan 550 −0.4 6 4.0 220 330 3.6
Argentina 445 2.8 5 2.5 139 233 1.3 5.5
Nigeria 400 −2.9 6 7.3 131 221 8.1 4.1
Burkina Faso 463 8.3 4 −2.4 183 190 6.8 5.7
Greece 250 −4.9 7 −3.7 215 180 5.4 −8.4
Mexico 149 0.5 12 −0.9 115 179 −0.5 −0.4
Syrian Arab Republic 172 −4.4 10 −2.8 224 165 7.0 −7.1
Egypt 167 −3.3 9 −1.5 105 148 −2.4 −4.8
Myanmar 364 0.1 4 4.6 98 147 2.7 4.7
United Republic of Tanzania 471 6.3 3 0.1 118 134 −1.3 6.4
Viet Nam 23 −3.5 42 6.0 86 99 −2.9 2.3
Tajikistan 162 −3.8 6 4.1 91 95 0.2
Kazakhstan 134 −1.2 7 0.9 97 92 −0.3
Côte d’Ivoire 187 −4
.3 5 −2
.9 53 85 2
.5 −7
.1
Mali 253 0.9 3 −3.4 73 79 7.0 −2.5
Russian Federation 59 −7.6 13 5.3 116 78 −2.7
Benin 136 −8.2 6 1.7 92 76 11.1 −6.7
Philippines 142 2.0 5 −3.4 73 74 −0.2 −1.4
Iran (Islamic Republic of) 91 −9.5 8 2.0 79 72 2.1 −7.7
France 56 −1.2 12 0.2 75 68 −0.2 −1.0
Cameroon 145 −3.1 4 −0.0 46 62 6.4 −3.1
Mozambique 380 12.7 2 1.8 65 61 9.8 14.7
Indonesia 152 −2.1 4 −3.0 65 61 2.0 −5.1
Thailand 43 −7.4 11 0.5 51 48 −9.0 −6.9
Belarus 59 −3.2 8 5.5 47 46 2.1
Ethiopia 403 3.9 1 −2.0 38 41 1.8
Zimbabwe 160 −8.1 2 −3.3 82 40 1.2 −11.1
Spain 63 −5.4 6 −5.0 26 39 14.2 −10.1
Ecuador 29 2.1 12 −0.6 40 35 0.3 1.5
Zambia 120 8.1 3 −2.2 44 35 10.5 5.8
Bolivia (Plurinational State of) 121 3.0 2 4.0 28 29 29.1 7.2
World 35 124 8 25 727 28 143
Africa 4 045 3 1 284 1 397
Eastern Africa 1 777 2 427 401
Middle Africa 394 3 87 107
Northern Africa 257 7 169 169
Southern Africa 15 9 13 14
Western Africa 1 602 4 587 707
Americas 6 389 9 4 488 5 874
Latin America and the Caribbean 2 035 9 1 806 1 904
Northern America 4 354 9 2 682 3 970
Asia 23 956 8 19 081 20 019
Central Asia 2 205 8 1 574 1 698
Eastern Asia 5 033 13 6 830 6 353
South-Eastern Asia 728 6 381 437
Southern Asia 15 263 7 9 399 10 505
Western Asia 727 14 897 1 026
Europe 521 9 542 464
Eastern Europe 124 10 170 129
Northern Europe 9 17 18 15
Southern Europe 316 7 243 221
Western Europe 71 14 112 99
Oceania 213 18 332 390
Australia and New Zealand 213 18 332 390
Melanesia 0 0 0
Micronesia 0 0 0
Polynesia 0 0 0
170
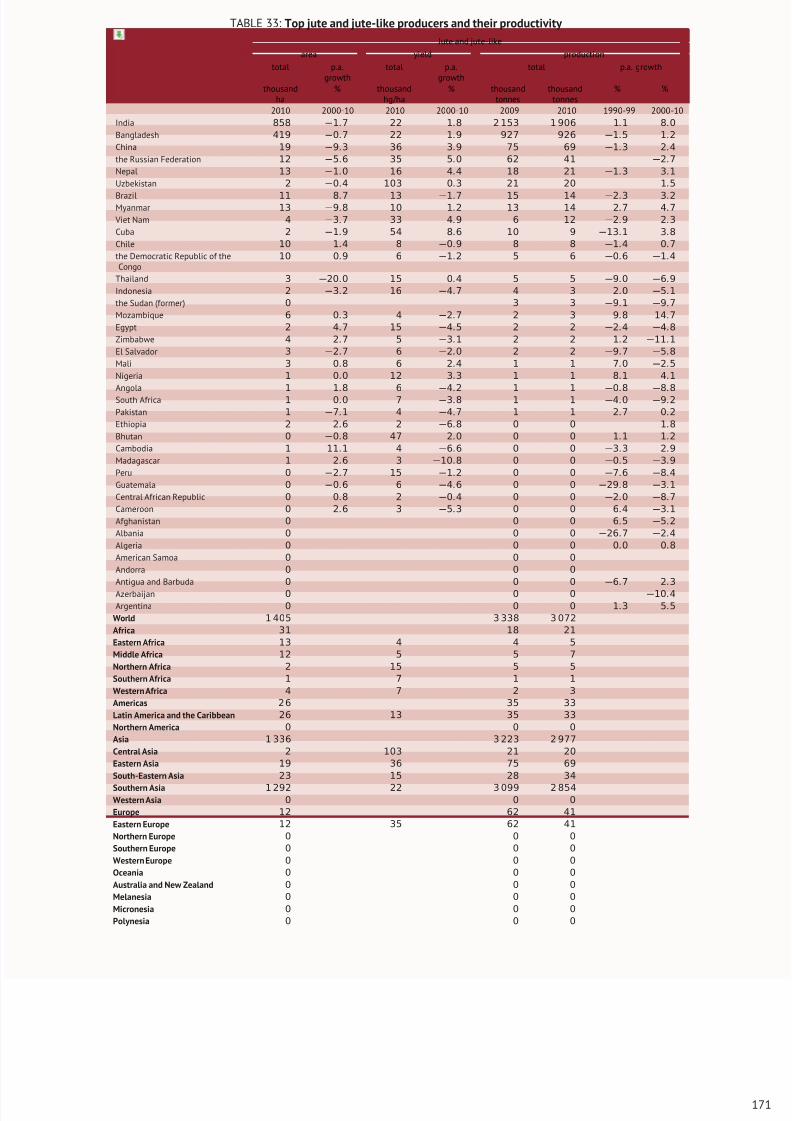
8/16/2019 Informe de la Fao 2013
http://slidepdf.com/reader/full/informe-de-la-fao-2013 189/307
TABLE 33: Top jute and jute-like producers and their productivity
Jute and jute-like
area yield production
total p.a.growth
total p.a.growth
total p.a. growth
thousandha
% thousandhg/ha
% thousandtonnes
thousandtonnes
% %
2010 2000-10 2010 2000-10 2009 2010 1990-99 2000-10
India 858 −1.7 22 1.8 2 153 1 906 1.1 8.0
Bangladesh 419 −0.7 22 1.9 927 926 −1.5 1.2
China 19 −9.3 36 3.9 75 69 −1.3 2.4
the Russian Federation 12 −5.6 35 5.0 62 41 −2.7
Nepal 13 −1.0 16 4.4 18 21 −1.3 3.1
Uzbekistan 2 −0.4 103 0.3 21 20 1.5
Brazil 11 8.7 13 −1.7 15 14 −2.3 3.2Myanmar 13 −9.8 10 1.2 13 14 2.7 4.7
Viet Nam 4 −3.7 33 4.9 6 12 −2.9 2.3
Cuba 2 −1.9 54 8.6 10 9 −13.1 3.8
Chile 10 1.4 8 −0.9 8 8 −1.4 0.7
the Democratic Republic of theCongo
10 0.9 6 −1.2 5 6 −0.6 −1.4
Thailand 3 −20.0 15 0.4 5 5 −9.0 −6.9
Indonesia 2 −3.2 16 −4.7 4 3 2.0 −5.1
the Sudan (former) 0 3 3 −9.1 −9.7
Mozambique 6 0.3 4 −2.7 2 3 9.8 14.7
Egypt 2 4.7 15 −4.5 2 2 −2.4 −4.8
Zimbabwe 4 2.7 5 −3.1 2 2 1.2 −11.1
El Salvador 3 −2.7 6 −2.0 2 2 −9.7 −5.8
Mali 3 0.8 6 2.4 1 1 7.0 −2.5
Nigeria 1 0.0 12 3.3 1 1 8.1 4.1
Angola 1 1.
8 6 −4.
2 1 1 −0.
8 −8.
8
South Africa 1 0.0 7 −3.8 1 1 −4.0 −9.2
Pakistan 1 −7.1 4 −4.7 1 1 2.7 0.2
Ethiopia 2 2.6 2 −6.8 0 0 1.8
Bhutan 0 −0.8 47 2.0 0 0 1.1 1.2
Cambodia 1 11.1 4 −6.6 0 0 −3.3 2.9
Madagascar 1 2.6 3 −10.8 0 0 −0.5 −3.9
Peru 0 −2.7 15 −1.2 0 0 −7.6 −8.4
Guatemala 0 −0.6 6 −4.6 0 0 −29.8 −3.1
Central African Republic 0 0.8 2 −0.4 0 0 −2.0 −8.7
Cameroon 0 2.6 3 −5.3 0 0 6.4 −3.1
Afghanistan 0 0 0 6.5 −5.2
Albania 0 0 0 −26.7 −2.4
Algeria 0 0 0 0.0 0.8
American Samoa 0 0 0
Andorra 0 0 0
Antigua and Barbuda 0 0 0 −6.7 2.3
Azerbaijan 0 0 0 −10.4
Argentina 0 0 0 1.3 5.5
World 1 405 3 338 3 072
Africa 31 18 21
Eastern Africa 13 4 4 5
Middle Africa 12 5 5 7
Northern Africa 2 15 5 5
Southern Africa 1 7 1 1
Western Africa 4 7 2 3
Americas 2 6 35 33
Latin America and the Caribbean 26 13 35 33
Northern America 0 0 0
Asia 1 336 3 223 2 977
Central Asia 2 103 21 20
Eastern Asia 19 36 75 69
South-Eastern Asia 23 15 28 34
Southern Asia 1 292 22 3 099 2 854
Western Asia 0 0 0
Europe 12 62 41
Eastern Europe 12 35 62 41
Northern Europe 0 0 0
Southern Europe 0 0 0
Western Europe 0 0 0
Oceania 0 0 0
Australia and New Zealand 0 0 0
Melanesia 0 0 0
Micronesia 0 0 0
Polynesia 0 0 0
171
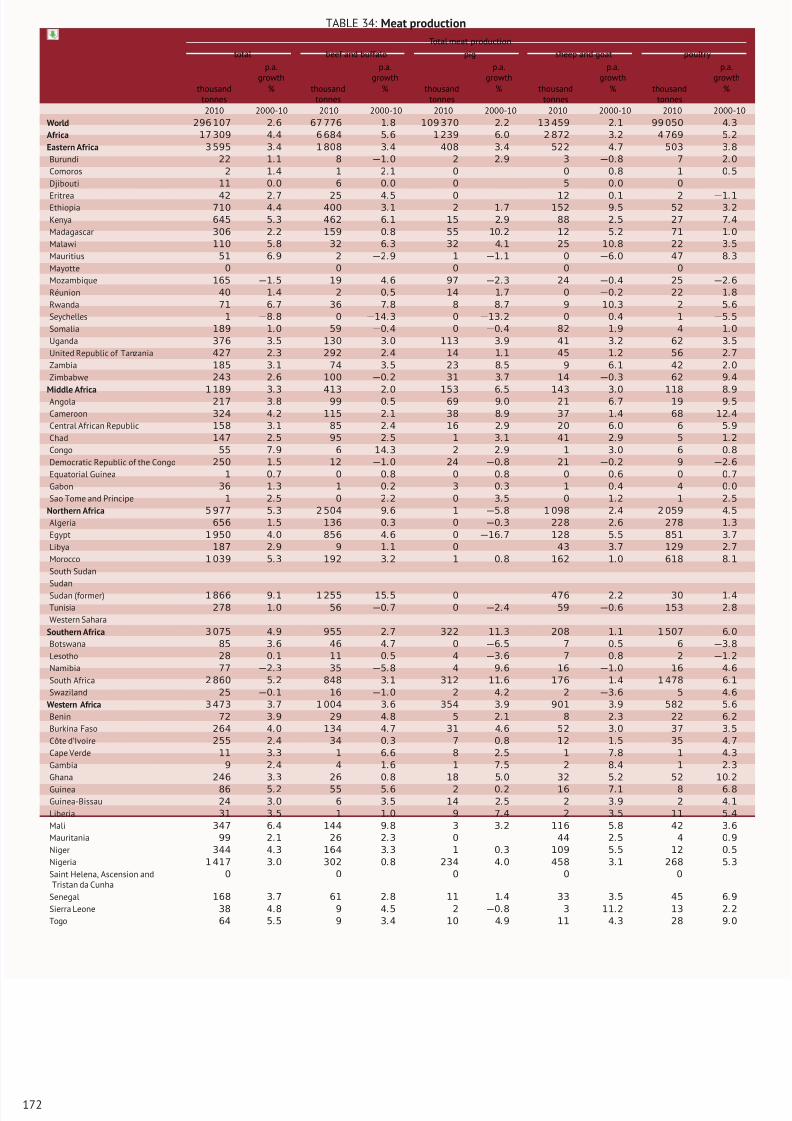
8/16/2019 Informe de la Fao 2013
http://slidepdf.com/reader/full/informe-de-la-fao-2013 190/307
TABLE 34: Meat production
Total meat production
total beef and buffalo pig sheep and goat poultry
p.a.growth
p.a.growth
p.a.growth
p.a.growth
p.a.growth
thousandtonnes
% thousandtonnes
% thousandtonnes
% thousandtonnes
% thousandtonnes
%
2010 2000-10 2010 2000-10 2010 2000-10 2010 2000-10 2010 2000-10
World 296 107 2.6 67 776 1.8 109 370 2.2 13 459 2.1 99 050 4.3
Africa 17 309 4.4 6 684 5.6 1 239 6.0 2 872 3.2 4 769 5.2
Eastern Africa 3 595 3.4 1 808 3.4 408 3.4 522 4.7 503 3.8
Burundi 22 1.1 8 −1.0 2 2.9 3 −0.8 7 2.0
Comoros 2 1.4 1 2.1 0 0 0.8 1 0.5
Djibouti 11 0.0 6 0.0 0 5 0.0 0
Eritrea 42 2.7 25 4.5 0 12 0.1 2 −1.1Ethiopia 710 4.4 400 3.1 2 1.7 152 9.5 52 3.2
Kenya 645 5.3 462 6.1 15 2.9 88 2.5 27 7.4
Madagascar 306 2.2 159 0.8 55 10.2 12 5.2 71 1.0
Malawi 110 5.8 32 6.3 32 4.1 25 10.8 22 3.5
Mauritius 51 6.9 2 −2.9 1 −1.1 0 −6.0 47 8.3
Mayotte 0 0 0 0 0
Mozambique 165 −1.5 19 4.6 97 −2.3 24 −0.4 25 −2.6
Réunion 40 1.4 2 0.5 14 1.7 0 −0.2 22 1.8
Rwanda 71 6.7 36 7.8 8 8.7 9 10.3 2 5.6
Seychelles 1 −8.8 0 −14.3 0 −13.2 0 0.4 1 −5.5
Somalia 189 1.0 59 −0.4 0 −0.4 82 1.9 4 1.0
Uganda 376 3.5 130 3.0 113 3.9 41 3.2 62 3.5
United Republic of Tanzania 427 2.3 292 2.4 14 1.1 45 1.2 56 2.7
Zambia 185 3.1 74 3.5 23 8.5 9 6.1 42 2.0
Zimbabwe 243 2.6 100 −0.2 31 3.7 14 −0.3 62 9.4
Middle Africa 1 189 3
.3 413 2
.0 153 6
.5 143 3
.0 118 8
.9
Angola 217 3.8 99 0.5 69 9.0 21 6.7 19 9.5
Cameroon 324 4.2 115 2.1 38 8.9 37 1.4 68 12.4
Central African Republic 158 3.1 85 2.4 16 2.9 20 6.0 6 5.9
Chad 147 2.5 95 2.5 1 3.1 41 2.9 5 1.2
Congo 55 7.9 6 14.3 2 2.9 1 3.0 6 0.8
Democratic Republic of the Congo 250 1.5 12 −1.0 24 −0.8 21 −0.2 9 −2.6
Equatorial Guinea 1 0.7 0 0.8 0 0.8 0 0.6 0 0.7
Gabon 36 1.3 1 0.2 3 0.3 1 0.4 4 0.0
Sao Tome and Principe 1 2.5 0 2.2 0 3.5 0 1.2 1 2.5
Northern Africa 5 977 5.3 2 504 9.6 1 −5.8 1 098 2.4 2 059 4.5
Algeria 656 1.5 136 0.3 0 −0.3 228 2.6 278 1.3
Egypt 1 950 4.0 856 4.6 0 −16.7 128 5.5 851 3.7
Libya 187 2.9 9 1.1 0 43 3.7 129 2.7
Morocco 1 039 5.3 192 3.2 1 0.8 162 1.0 618 8.1
South Sudan
Sudan
Sudan (former) 1 866 9.1 1 255 15.5 0 476 2.2 30 1.4
Tunisia 278 1.0 56 −0.7 0 −2.4 59 −0.6 153 2.8
Western Sahara
Southern Africa 3 075 4.9 955 2.7 322 11.3 208 1.1 1 507 6.0
Botswana 85 3.6 46 4.7 0 −6.5 7 0.5 6 −3.8
Lesotho 28 0.1 11 0.5 4 −3.6 7 0.8 2 −1.2
Namibia 77 −2.3 35 −5.8 4 9.6 16 −1.0 16 4.6
South Africa 2 860 5.2 848 3.1 312 11.6 176 1.4 1 478 6.1
Swaziland 25 −0.1 16 −1.0 2 4.2 2 −3.6 5 4.6
Western Africa 3 473 3.7 1 004 3.6 354 3.9 901 3.9 582 5.6
Benin 72 3.9 29 4.8 5 2.1 8 2.3 22 6.2
Burkina Faso 264 4.0 134 4.7 31 4.6 52 3.0 37 3.5
Côte d’Ivoire 255 2.4 34 0.3 7 0.8 12 1.5 35 4.7
Cape Verde 11 3.3 1 6.6 8 2.5 1 7.8 1 4.3
Gambia 9 2.4 4 1.6 1 7.5 2 8.4 1 2.3
Ghana 246 3.3 26 0.8 18 5.0 32 5.2 52 10.2
Guinea 86 5.2 55 5.6 2 0.2 16 7.1 8 6.8
Guinea-Bissau 24 3.0 6 3.5 14 2.5 2 3.9 2 4.1
Liberia 31 3.5 1 1.0 9 7.4 2 3.5 11 5.4
Mali 347 6.4 144 9.8 3 3.2 116 5.8 42 3.6
Mauritania 99 2.1 26 2.3 0 44 2.5 4 0.9
Niger 344 4.3 164 3.3 1 0.3 109 5.5 12 0.5
Nigeria 1 417 3.0 302 0.8 234 4.0 458 3.1 268 5.3
Saint Helena, Ascension andTristan da Cunha
0 0 0 0 0
Senegal 168 3.7 61 2.8 11 1.4 33 3.5 45 6.9
Sierra Leone 38 4.8 9 4.5 2 −0.8 3 11.2 13 2.2
Togo 64 5.5 9 3.4 10 4.9 11 4.3 28 9.0
172
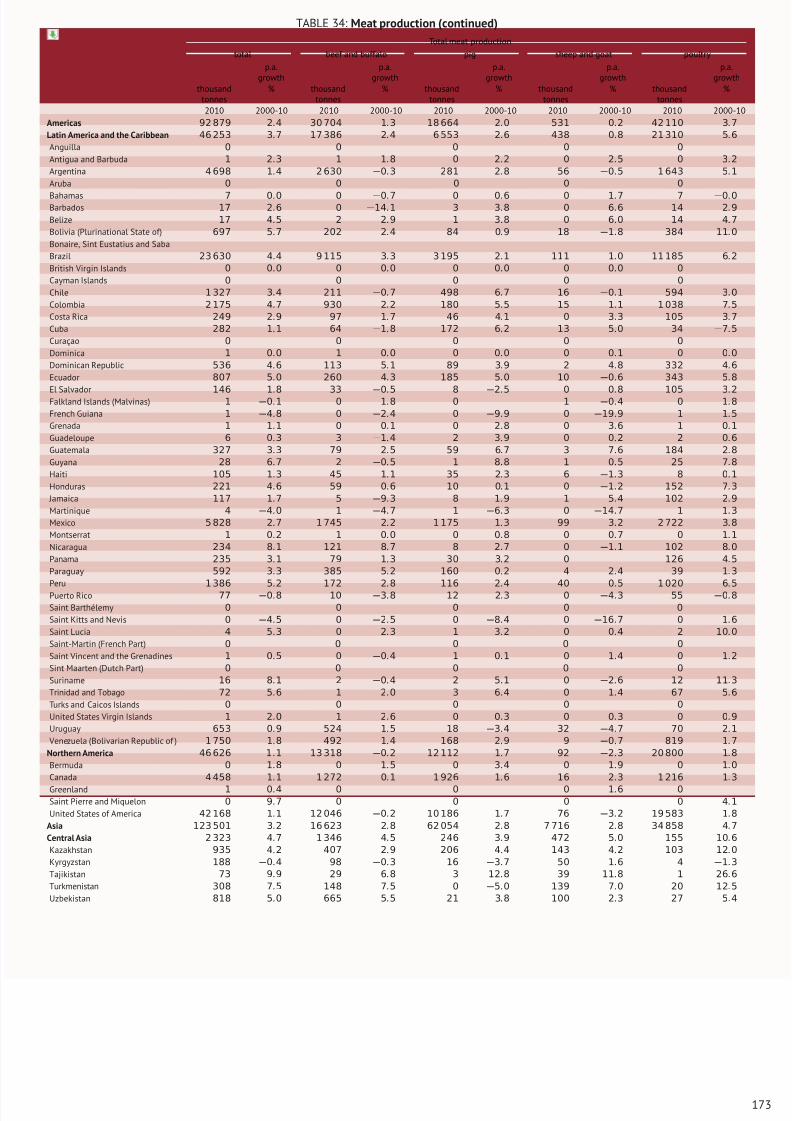
8/16/2019 Informe de la Fao 2013
http://slidepdf.com/reader/full/informe-de-la-fao-2013 191/307
TABLE 34: Meat production (continued)
Total meat production
total beef and buffalo pig sheep and goat poultry
p.a.growth
p.a.growth
p.a.growth
p.a.growth
p.a.growth
thousandtonnes
% thousandtonnes
% thousandtonnes
% thousandtonnes
% thousandtonnes
%
2010 2000-10 2010 2000-10 2010 2000-10 2010 2000-10 2010 2000-10
Americas 92 879 2.4 30 704 1.3 18 664 2.0 531 0.2 42 110 3.7
Latin America and the Caribbean 46 253 3.7 17 386 2.4 6 553 2.6 438 0.8 21 310 5.6
Anguilla 0 0 0 0 0
Antigua and Barbuda 1 2.3 1 1.8 0 2.2 0 2.5 0 3.2
Argentina 4 698 1.4 2 630 −0.3 281 2.8 56 −0.5 1 643 5.1
Aruba 0 0 0 0 0
Bahamas 7 0.0 0 −0.7 0 0.6 0 1.7 7 −0.0Barbados 17 2.6 0 −14.1 3 3.8 0 6.6 14 2.9
Belize 17 4.5 2 2.9 1 3.8 0 6.0 14 4.7
Bolivia (Plurinational State of) 697 5.7 202 2.4 84 0.9 18 −1.8 384 11.0
Bonaire, Sint Eustatius and Saba
Brazil 23 630 4.4 9 115 3.3 3 195 2.1 111 1.0 11 185 6.2
British Virgin Islands 0 0.0 0 0.0 0 0.0 0 0.0 0
Cayman Islands 0 0 0 0 0
Chile 1 327 3.4 211 −0.7 498 6.7 16 −0.1 594 3.0
Colombia 2 175 4.7 930 2.2 180 5.5 15 1.1 1 038 7.5
Costa Rica 249 2.9 97 1.7 46 4.1 0 3.3 105 3.7
Cuba 282 1.1 64 −1.8 172 6.2 13 5.0 34 −7.5
Curaçao 0 0 0 0 0
Dominica 1 0.0 1 0.0 0 0.0 0 0.1 0 0.0
Dominican Republic 536 4.6 113 5.1 89 3.9 2 4.8 332 4.6
Ecuador 807 5.0 260 4.3 185 5.0 10 −0.6 343 5.8
El Salvador 146 1
.8 33 −0
.5 8 −2
.5 0 0
.8 105 3
.2
Falkland Islands (Malvinas) 1 −0.1 0 1.8 0 1 −0.4 0 1.8
French Guiana 1 −4.8 0 −2.4 0 −9.9 0 −19.9 1 1.5
Grenada 1 1.1 0 0.1 0 2.8 0 3.6 1 0.1
Guadeloupe 6 0.3 3 −1.4 2 3.9 0 0.2 2 0.6
Guatemala 327 3.3 79 2.5 59 6.7 3 7.6 184 2.8
Guyana 28 6.7 2 −0.5 1 8.8 1 0.5 25 7.8
Haiti 105 1.3 45 1.1 35 2.3 6 −1.3 8 0.1
Honduras 221 4.6 59 0.6 10 0.1 0 −1.2 152 7.3
Jamaica 117 1.7 5 −9.3 8 1.9 1 5.4 102 2.9
Martinique 4 −4.0 1 −4.7 1 −6.3 0 −14.7 1 1.3
Mexico 5 828 2.7 1 745 2.2 1 175 1.3 99 3.2 2 722 3.8
Montserrat 1 0.2 1 0.0 0 0.8 0 0.7 0 1.1
Nicaragua 234 8.1 121 8.7 8 2.7 0 −1.1 102 8.0
Panama 235 3.1 79 1.3 30 3.2 0 126 4.5
Paraguay 592 3.3 385 5.2 160 0.2 4 2.4 39 1.3
Peru 1 386 5.2 172 2.8 116 2.4 40 0.5 1 020 6.5
Puerto Rico 77 −0.8 10 −3.8 12 2.3 0 −4.3 55 −0.8
Saint Barthélemy 0 0 0 0 0
Saint Kitts and Nevis 0 −4.5 0 −2.5 0 −8.4 0 −16.7 0 1.6
Saint Lucia 4 5.3 0 2.3 1 3.2 0 0.4 2 10.0
Saint-Martin (French Part) 0 0 0 0 0
Saint Vincent and the Grenadines 1 0.5 0 −0.4 1 0.1 0 1.4 0 1.2
Sint Maarten (Dutch Part) 0 0 0 0 0
Suriname 16 8.1 2 −0.4 2 5.1 0 −2.6 12 11.3
Trinidad and Tobago 72 5.6 1 2.0 3 6.4 0 1.4 67 5.6
Turks and Caicos Islands 0 0 0 0 0
United States Virgin Islands 1 2.0 1 2.6 0 0.3 0 0.3 0 0.9
Uruguay 653 0.9 524 1.5 18 −3.4 32 −4.7 70 2.1
Venezuela (Bolivarian Republic of ) 1 750 1.8 492 1.4 168 2.9 9 −0.7 819 1.7
Northern America 46 626 1 .1 13 318 −0.2 12 112 1.7 92 −2.3 20 800 1.8
Bermuda 0 1.8 0 1.5 0 3.4 0 1.9 0 1.0
Canada 4 458 1.1 1 272 0.1 1 926 1.6 16 2.3 1 216 1.3
Greenland 1 0.4 0 0 0 1.6 0
Saint Pierre and Miquelon 0 9.7 0 0 0 0 4.1
United States of America 42 168 1.1 12 046 −0.2 10 186 1.7 76 −3.2 19 583 1.8
Asia 123 501 3.2 16 623 2.8 62 054 2.8 7 716 2.8 34 858 4.7
Central Asia 2 323 4.7 1 346 4.5 246 3.9 472 5.0 155 10.6
Kazakhstan 935 4.2 407 2.9 206 4.4 143 4.2 103 12.0
Kyrgyzstan 188 −0.4 98 −0.3 16 −3.7 50 1.6 4 −1.3
Tajikistan 73 9.9 29 6.8 3 12.8 39 11.8 1 26.6
Turkmenistan 308 7.5 148 7.5 0 −5.0 139 7.0 20 12.5
Uzbekistan 818 5.0 665 5.5 21 3.8 100 2.3 27 5.4
173
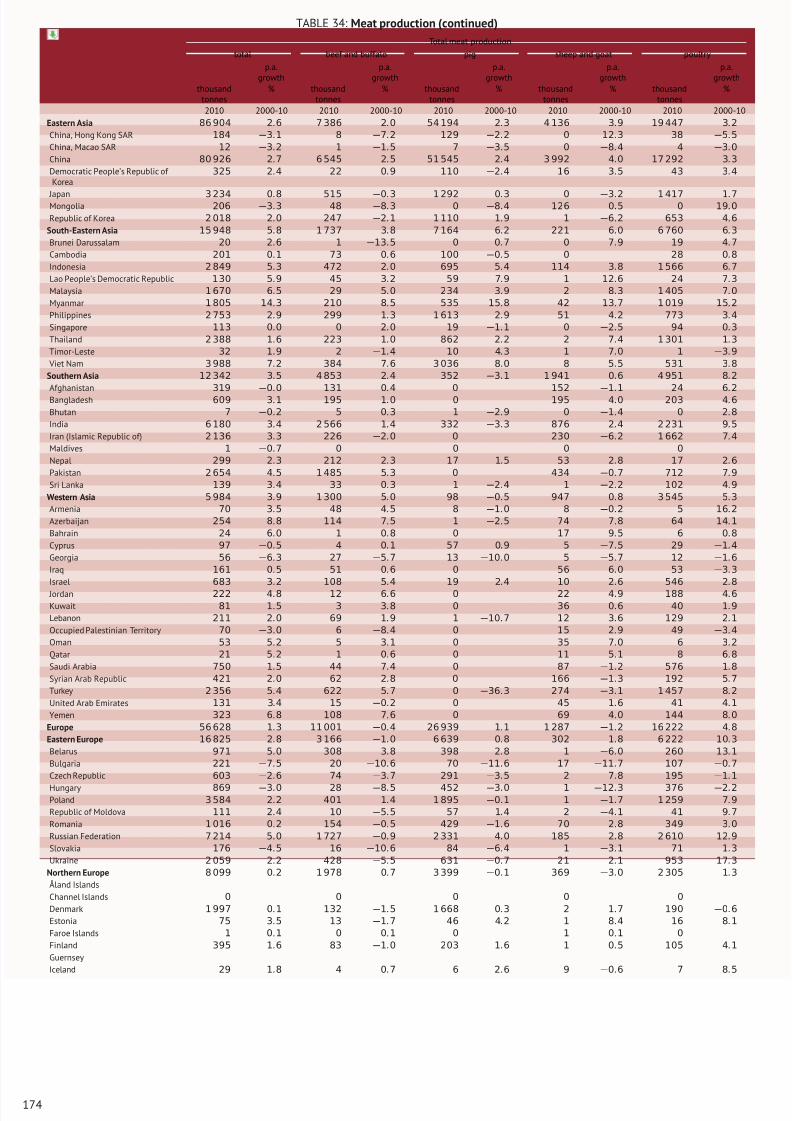
8/16/2019 Informe de la Fao 2013
http://slidepdf.com/reader/full/informe-de-la-fao-2013 192/307
TABLE 34: Meat production (continued)
Total meat production
total beef and buffalo pig sheep and goat poultry
p.a.growth
p.a.growth
p.a.growth
p.a.growth
p.a.growth
thousandtonnes
% thousandtonnes
% thousandtonnes
% thousandtonnes
% thousandtonnes
%
2010 2000-10 2010 2000-10 2010 2000-10 2010 2000-10 2010 2000-10
Eastern Asia 86 904 2.6 7 386 2.0 54 194 2.3 4 136 3.9 19 447 3.2
China, Hong Kong SAR 184 −3.1 8 −7.2 129 −2.2 0 12.3 38 −5.5
China, Macao SAR 12 −3.2 1 −1.5 7 −3.5 0 −8.4 4 −3.0
China 80 926 2.7 6 545 2.5 51 545 2.4 3 992 4.0 17 292 3.3
Democratic People’s Republic of Korea
325 2.4 22 0.9 110 −2.4 16 3.5 43 3.4
Japan 3 234 0.8 515 −0.3 1 292 0.3 0 −3.2 1 417 1.7Mongolia 206 −3.3 48 −8.3 0 −8.4 126 0.5 0 19.0
Republic of Korea 2 018 2.0 247 −2.1 1 110 1.9 1 −6.2 653 4.6
South-Eastern Asia 15 948 5.8 1 737 3.8 7 164 6.2 221 6.0 6 760 6.3
Brunei Darussalam 20 2.6 1 −13.5 0 0.7 0 7.9 19 4.7
Cambodia 201 0.1 73 0.6 100 −0.5 0 28 0.8
Indonesia 2 849 5.3 472 2.0 695 5.4 114 3.8 1 566 6.7
Lao People’s Democratic Republic 130 5.9 45 3.2 59 7.9 1 12.6 24 7.3
Malaysia 1 670 6.5 29 5.0 234 3.9 2 8.3 1 405 7.0
Myanmar 1 805 14.3 210 8.5 535 15.8 42 13.7 1 019 15.2
Philippines 2 753 2.9 299 1.3 1 613 2.9 51 4.2 773 3.4
Singapore 113 0.0 0 2.0 19 −1.1 0 −2.5 94 0.3
Thailand 2 388 1.6 223 1.0 862 2.2 2 7.4 1 301 1.3
Timor-Leste 32 1.9 2 −1.4 10 4.3 1 7.0 1 −3.9
Viet Nam 3 988 7.2 384 7.6 3 036 8.0 8 5.5 531 3.8
Southern Asia 12 342 3.5 4 853 2.4 352 −3.1 1 941 0.6 4 951 8.2
Afghanistan 319 −0.
0 131 0.
4 0 152 −1.
1 24 6.
2
Bangladesh 609 3.1 195 1.0 0 195 4.0 203 4.6
Bhutan 7 −0.2 5 0.3 1 −2.9 0 −1.4 0 2.8
India 6 180 3.4 2 566 1.4 332 −3.3 876 2.4 2 231 9.5
Iran (Islamic Republic of) 2 136 3.3 226 −2.0 0 230 −6.2 1 662 7.4
Maldives 1 −0.7 0 0 0 0
Nepal 299 2.3 212 2.3 17 1.5 53 2.8 17 2.6
Pakistan 2 654 4.5 1 485 5.3 0 434 −0.7 712 7.9
Sri Lanka 139 3.4 33 0.3 1 −2.4 1 −2.2 102 4.9
Western Asia 5 984 3.9 1 300 5.0 98 −0.5 947 0.8 3 545 5.3
Armenia 70 3.5 48 4.5 8 −1.0 8 −0.2 5 16.2
Azerbaijan 254 8.8 114 7.5 1 −2.5 74 7.8 64 14.1
Bahrain 24 6.0 1 0.8 0 17 9.5 6 0.8
Cyprus 97 −0.5 4 0.1 57 0.9 5 −7.5 29 −1.4
Georgia 56 −6.3 27 −5.7 13 −10.0 5 −5.7 12 −1.6
Iraq 161 0.5 51 0.6 0 56 6.0 53 −3.3
Israel 683 3.2 108 5.4 19 2.4 10 2.6 546 2.8
Jordan 222 4.8 12 6.6 0 22 4.9 188 4.6
Kuwait 81 1.5 3 3.8 0 36 0.6 40 1.9
Lebanon 211 2.0 69 1.9 1 −10.7 12 3.6 129 2.1
Occupied Palestinian Territory 70 −3.0 6 −8.4 0 15 2.9 49 −3.4
Oman 53 5.2 5 3.1 0 35 7.0 6 3.2
Qatar 21 5.2 1 0.6 0 11 5.1 8 6.8
Saudi Arabia 750 1.5 44 7.4 0 87 −1.2 576 1.8
Syrian Arab Republic 421 2.0 62 2.8 0 166 −1.3 192 5.7
Turkey 2 356 5.4 622 5.7 0 −36.3 274 −3.1 1 457 8.2
United Arab Emirates 131 3.4 15 −0.2 0 45 1.6 41 4.1
Yemen 323 6.8 108 7.6 0 69 4.0 144 8.0
Europe 56 628 1.3 11 001 −0.4 26 939 1.1 1 287 −1.2 16 222 4.8
Eastern Europe 16 825 2.8 3 166 −1.0 6 639 0.8 302 1.8 6 222 10.3
Belarus 971 5.0 308 3.8 398 2.8 1 −6.0 260 13.1
Bulgaria 221 −7.5 20 −10.6 70 −11.6 17 −11.7 107 −0.7
Czech Republic 603 −2.6 74 −3.7 291 −3.5 2 7.8 195 −1.1
Hungary 869 −3.0 28 −8.5 452 −3.0 1 −12.3 376 −2.2
Poland 3 584 2.2 401 1.4 1 895 −0.1 1 −1.7 1 259 7.9
Republic of Moldova 111 2.4 10 −5.5 57 1.4 2 −4.1 41 9.7
Romania 1 016 0.2 154 −0.5 429 −1.6 70 2.8 349 3.0
Russian Federation 7 214 5.0 1 727 −0.9 2 331 4.0 185 2.8 2 610 12.9
Slovakia 176 −4.5 16 −10.6 84 −6.4 1 −3.1 71 1.3
Ukraine 2 059 2.2 428 −5.5 631 −0.7 21 2.1 953 17.3
Northern Europe 8 099 0.2 1 978 0.7 3 399 −0.1 369 −3.0 2 305 1.3
Åland Islands
Channel Islands 0 0 0 0 0
Denmark 1 997 0.1 132 −1.5 1 668 0.3 2 1.7 190 −0.6
Estonia 75 3.5 13 −1.7 46 4.2 1 8.4 16 8.1
Faroe Islands 1 0.1 0 0.1 0 1 0.1 0
Finland 395 1.6 83 −1.0 203 1.6 1 0.5 105 4.1
Guernsey
Iceland 29 1.8 4 0.7 6 2.6 9 −0.6 7 8.5
174
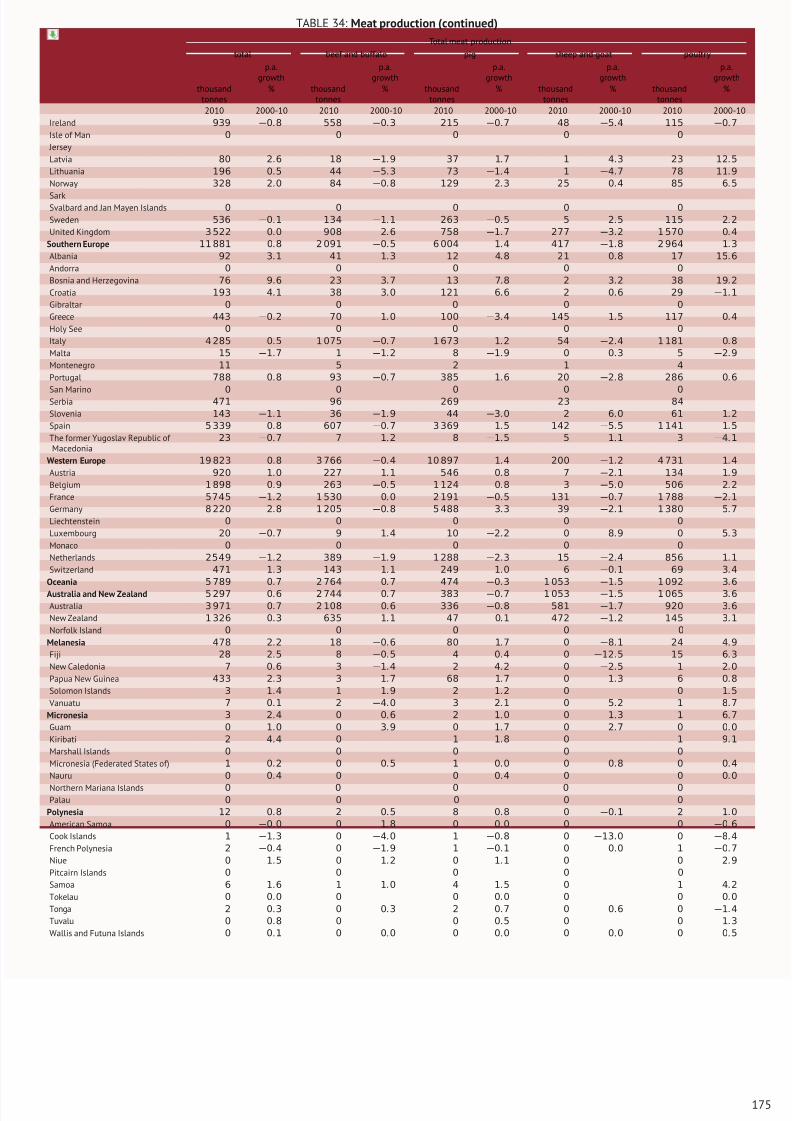
8/16/2019 Informe de la Fao 2013
http://slidepdf.com/reader/full/informe-de-la-fao-2013 193/307
TABLE 34: Meat production (continued)
Total meat production
total beef and buffalo pig sheep and goat poultry
p.a.growth
p.a.growth
p.a.growth
p.a.growth
p.a.growth
thousandtonnes
% thousandtonnes
% thousandtonnes
% thousandtonnes
% thousandtonnes
%
2010 2000-10 2010 2000-10 2010 2000-10 2010 2000-10 2010 2000-10
Ireland 939 −0.8 558 −0.3 215 −0.7 48 −5.4 115 −0.7
Isle of Man 0 0 0 0 0
Jersey
Latvia 80 2.6 18 −1.9 37 1.7 1 4.3 23 12.5
Lithuania 196 0.5 44 −5.3 73 −1.4 1 −4.7 78 11.9
Norway 328 2.0 84 −0.8 129 2.3 25 0.4 85 6.5
SarkSvalbard and Jan Mayen Islands 0 0 0 0 0
Sweden 536 −0.1 134 −1.1 263 −0.5 5 2.5 115 2.2
United Kingdom 3 522 0.0 908 2.6 758 −1.7 277 −3.2 1 570 0.4
Southern Europe 11 881 0.8 2 091 −0.5 6 004 1.4 417 −1.8 2 964 1.3
Albania 92 3.1 41 1.3 12 4.8 21 0.8 17 15.6
Andorra 0 0 0 0 0
Bosnia and Herzegovina 76 9.6 23 3.7 13 7.8 2 3.2 38 19.2
Croatia 193 4.1 38 3.0 121 6.6 2 0.6 29 −1.1
Gibraltar 0 0 0 0 0
Greece 443 −0.2 70 1.0 100 −3.4 145 1.5 117 0.4
Holy See 0 0 0 0 0
Italy 4 285 0.5 1 075 −0.7 1 673 1.2 54 −2.4 1 181 0.8
Malta 15 −1.7 1 −1.2 8 −1.9 0 0.3 5 −2.9
Montenegro 11 5 2 1 4
Portugal 788 0.8 93 −0.7 385 1.6 20 −2.8 286 0.6
San Marino 0 0 0 0 0
Serbia 471 96 269 23 84
Slovenia 143 −1.1 36 −1.9 44 −3.0 2 6.0 61 1.2
Spain 5 339 0.8 607 −0.7 3 369 1.5 142 −5.5 1 141 1.5
The former Yugoslav Republic of Macedonia
23 −0.7 7 1.2 8 −1.5 5 1.1 3 −4.1
Western Europe 19 823 0.8 3 766 −0.4 10 897 1.4 200 −1.2 4 731 1.4
Austria 920 1.0 227 1.1 546 0.8 7 −2.1 134 1.9
Belgium 1 898 0.9 263 −0.5 1 124 0.8 3 −5.0 506 2.2
France 5745 −1.2 1 530 0.0 2 191 −0.5 131 −0.7 1 788 −2.1
Germany 8 220 2.8 1 205 −0.8 5 488 3.3 39 −2.1 1 380 5.7
Liechtenstein 0 0 0 0 0
Luxembourg 20 −0.7 9 1.4 10 −2.2 0 8.9 0 5.3
Monaco 0 0 0 0 0
Netherlands 2549 −1.2 389 −1.9 1 288 −2.3 15 −2.4 856 1.1
Switzerland 471 1.3 143 1.1 249 1.0 6 −0.1 69 3.4
Oceania 5 789 0.7 2 764 0.7 474 −0.3 1 053 −1.5 1 092 3.6
Australia and New Zealand 5 297 0.6 2 744 0.7 383 −0.7 1 053 −1.5 1 065 3.6
Australia 3 971 0.7 2 108 0.6 336 −0.8 581 −1.7 920 3.6
New Zealand 1 326 0.3 635 1.1 47 0.1 472 −1.2 145 3.1
Norfolk Island 0 0 0 0 0
Melanesia 478 2.2 18 −0.6 80 1.7 0 −8.1 24 4.9
Fiji 28 2.5 8 −0.5 4 0.4 0 −12.5 15 6.3
New Caledonia 7 0.6 3 −1.4 2 4.2 0 −2.5 1 2.0
Papua New Guinea 433 2.3 3 1.7 68 1.7 0 1.3 6 0.8
Solomon Islands 3 1.4 1 1.9 2 1.2 0 0 1.5
Vanuatu 7 0.1 2 −4.0 3 2.1 0 5.2 1 8.7
Micronesia 3 2.4 0 0.6 2 1.0 0 1.3 1 6.7
Guam 0 1.0 0 3.9 0 1.7 0 2.7 0 0.0
Kiribati 2 4.4 0 1 1.8 0 1 9.1
Marshall Islands 0 0 0 0 0
Micronesia (Federated States of) 1 0.2 0 0.5 1 0.0 0 0.8 0 0.4
Nauru 0 0.4 0 0 0.4 0 0 0.0
Northern Mariana Islands 0 0 0 0 0
Palau 0 0 0 0 0
Polynesia 12 0.8 2 0.5 8 0.8 0 −0.1 2 1.0
American Samoa 0 −0.0 0 1.8 0 0.0 0 0 −0.6
Cook Islands 1 −1.3 0 −4.0 1 −0.8 0 −13.0 0 −8.4
French Polynesia 2 −0.4 0 −1.9 1 −0.1 0 0.0 1 −0.7
Niue 0 1.5 0 1.2 0 1.1 0 0 2.9
Pitcairn Islands 0 0 0 0 0
Samoa 6 1.6 1 1.0 4 1.5 0 1 4.2
Tokelau 0 0.0 0 0 0.0 0 0 0.0
Tonga 2 0.3 0 0.3 2 0.7 0 0.6 0 −1.4
Tuvalu 0 0.8 0 0 0.5 0 0 1.3
Wallis and Futuna Islands 0 0.1 0 0.0 0 0.0 0 0.0 0 0.5
175
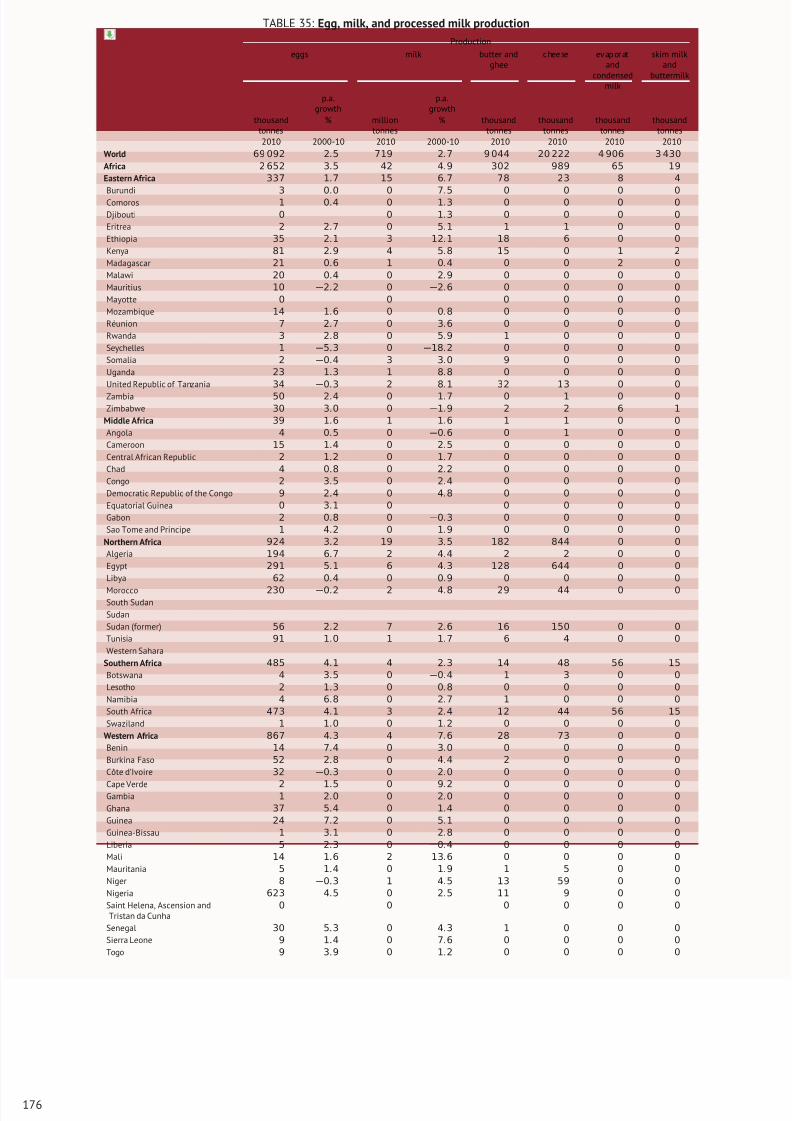
8/16/2019 Informe de la Fao 2013
http://slidepdf.com/reader/full/informe-de-la-fao-2013 194/307
TABLE 35: Egg, milk, and processed milk production
Production
eggs milk butter andghee
chee se evaporatand
condensedmilk
skim milkand
buttermilk
p.a.growth
p.a.growth
thousandtonnes
% milliontonnes
% thousandtonnes
thousandtonnes
thousandtonnes
thousandtonnes
2010 2000-10 2010 2000-10 2010 2010 2010 2010
World 69 092 2.5 719 2.7 9 044 20 222 4 906 3 430
Africa 2 652 3.5 42 4.9 302 989 65 19
Eastern Africa 337 1.7 15 6.7 78 23 8 4
Burundi 3 0.0 0 7.5 0 0 0 0
Comoros 1 0.4 0 1.3 0 0 0 0
Djibouti 0 0 1.3 0 0 0 0
Eritrea 2 2.7 0 5.1 1 1 0 0
Ethiopia 35 2.1 3 12.1 18 6 0 0
Kenya 81 2.9 4 5.8 15 0 1 2
Madagascar 21 0.6 1 0.4 0 0 2 0
Malawi 20 0.4 0 2.9 0 0 0 0
Mauritius 10 −2.2 0 −2.6 0 0 0 0
Mayotte 0 0 0 0 0 0
Mozambique 14 1.6 0 0.8 0 0 0 0
Réunion 7 2.7 0 3.6 0 0 0 0
Rwanda 3 2.8 0 5.9 1 0 0 0
Seychelles 1 −5.3 0 −18.2 0 0 0 0
Somalia 2 −0.4 3 3.0 9 0 0 0
Uganda 23 1.3 1 8.8 0 0 0 0
United Republic of Tanzania 34 −0.3 2 8.1 32 13 0 0
Zambia 50 2.4 0 1.7 0 1 0 0
Zimbabwe 30 3.0 0 −1.9 2 2 6 1
Middle Africa 39 1.6 1 1.6 1 1 0 0
Angola 4 0.5 0 −0.6 0 1 0 0
Cameroon 15 1.4 0 2.5 0 0 0 0
Central African Republic 2 1.2 0 1.7 0 0 0 0
Chad 4 0.8 0 2.2 0 0 0 0
Congo 2 3.5 0 2.4 0 0 0 0
Democratic Republic of the Congo 9 2.4 0 4.8 0 0 0 0
Equatorial Guinea 0 3.1 0 0 0 0 0
Gabon 2 0.8 0 −0.3 0 0 0 0
Sao Tome and Principe 1 4.2 0 1.9 0 0 0 0
Northern Africa 924 3.2 19 3.5 182 844 0 0
Algeria 194 6.7 2 4.4 2 2 0 0
Egypt 291 5.1 6 4.3 128 644 0 0
Libya 62 0.4 0 0.9 0 0 0 0
Morocco 230 −0.2 2 4.8 29 44 0 0South Sudan
Sudan
Sudan (former) 56 2.2 7 2.6 16 150 0 0
Tunisia 91 1.0 1 1.7 6 4 0 0
Western Sahara
Southern Africa 485 4.1 4 2.3 14 48 56 15
Botswana 4 3.5 0 −0.4 1 3 0 0
Lesotho 2 1.3 0 0.8 0 0 0 0
Namibia 4 6.8 0 2.7 1 0 0 0
South Africa 473 4.1 3 2.4 12 44 56 15
Swaziland 1 1.0 0 1.2 0 0 0 0
Western Africa 867 4.3 4 7.6 28 73 0 0
Benin 14 7.4 0 3.0 0 0 0 0
Burkina Faso 52 2.8 0 4.4 2 0 0 0
Côte d’Ivoire 32 −0.3 0 2.0 0 0 0 0
Cape Verde 2 1.5 0 9.2 0 0 0 0Gambia 1 2.0 0 2.0 0 0 0 0
Ghana 37 5.4 0 1.4 0 0 0 0
Guinea 24 7.2 0 5.1 0 0 0 0
Guinea-Bissau 1 3.1 0 2.8 0 0 0 0
Liberia 5 2.3 0 −0.4 0 0 0 0
Mali 14 1.6 2 13.6 0 0 0 0
Mauritania 5 1.4 0 1.9 1 5 0 0
Niger 8 −0.3 1 4.5 13 59 0 0
Nigeria 623 4.5 0 2.5 11 9 0 0
Saint Helena, Ascension andTristan da Cunha
0 0 0 0 0 0
Senegal 30 5.3 0 4.3 1 0 0 0
Sierra Leone 9 1.4 0 7.6 0 0 0 0
Togo 9 3.9 0 1.2 0 0 0 0
176
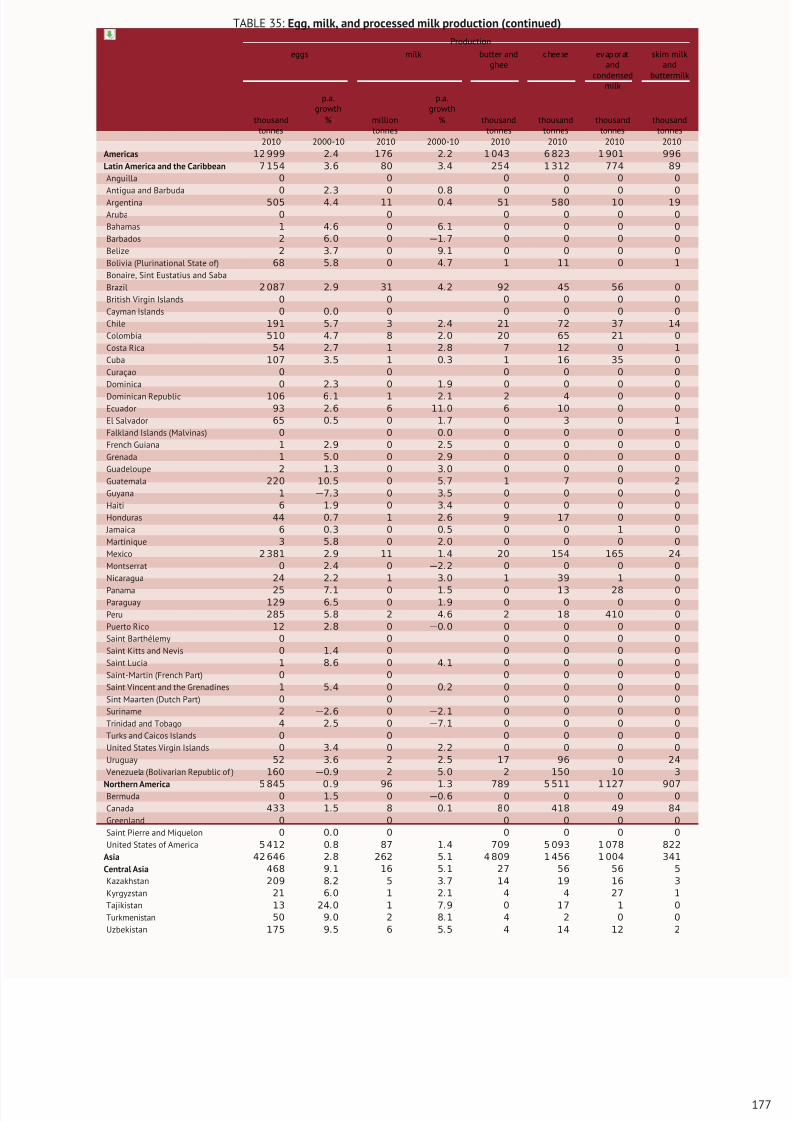
8/16/2019 Informe de la Fao 2013
http://slidepdf.com/reader/full/informe-de-la-fao-2013 195/307
TABLE 35: Egg, milk, and processed milk production (continued)
Production
eggs milk butter andghee
chee se evaporatand
condensedmilk
skim milkand
buttermilk
p.a.growth
p.a.growth
thousandtonnes
% milliontonnes
% thousandtonnes
thousandtonnes
thousandtonnes
thousandtonnes
2010 2000-10 2010 2000-10 2010 2010 2010 2010
Americas 12 999 2.4 176 2.2 1 043 6 823 1 901 996
Latin America and the Caribbean 7 154 3.6 80 3.4 254 1 312 774 89
Anguilla 0 0 0 0 0 0
Antigua and Barbuda 0 2.3 0 0.8 0 0 0 0
Argentina 505 4.4 11 0.4 51 580 10 19
Aruba 0 0 0 0 0 0
Bahamas 1 4.6 0 6.1 0 0 0 0
Barbados 2 6.0 0 −1.7 0 0 0 0
Belize 2 3.7 0 9.1 0 0 0 0
Bolivia (Plurinational State of) 68 5.8 0 4.7 1 11 0 1
Bonaire, Sint Eustatius and Saba
Brazil 2 087 2.9 31 4.2 92 45 56 0
British Virgin Islands 0 0 0 0 0 0
Cayman Islands 0 0.0 0 0 0 0 0
Chile 191 5.7 3 2.4 21 72 37 14
Colombia 510 4.7 8 2.0 20 65 21 0
Costa Rica 54 2.7 1 2.8 7 12 0 1
Cuba 107 3.5 1 0.3 1 16 35 0
Curaçao 0 0 0 0 0 0
Dominica 0 2.3 0 1.9 0 0 0 0
Dominican Republic 106 6.1 1 2.1 2 4 0 0
Ecuador 93 2.6 6 11.0 6 10 0 0
El Salvador 65 0.5 0 1.7 0 3 0 1
Falkland Islands (Malvinas) 0 0 0.0 0 0 0 0
French Guiana 1 2.9 0 2.5 0 0 0 0
Grenada 1 5.0 0 2.9 0 0 0 0
Guadeloupe 2 1.3 0 3.0 0 0 0 0
Guatemala 220 10.5 0 5.7 1 7 0 2
Guyana 1 −7.3 0 3.5 0 0 0 0
Haiti 6 1.9 0 3.4 0 0 0 0
Honduras 44 0.7 1 2.6 9 17 0 0
Jamaica 6 0.3 0 0.5 0 0 1 0
Martinique 3 5.8 0 2.0 0 0 0 0
Mexico 2 381 2.9 11 1.4 20 154 165 24
Montserrat 0 2.4 0 −2.2 0 0 0 0
Nicaragua 24 2.2 1 3.0 1 39 1 0
Panama 25 7.1 0 1.5 0 13 28 0Paraguay 129 6.5 0 1.9 0 0 0 0
Peru 285 5.8 2 4.6 2 18 410 0
Puerto Rico 12 2.8 0 −0.0 0 0 0 0
Saint Barthélemy 0 0 0 0 0 0
Saint Kitts and Nevis 0 1.4 0 0 0 0 0
Saint Lucia 1 8.6 0 4.1 0 0 0 0
Saint-Martin (French Part) 0 0 0 0 0 0
Saint Vincent and the Grenadines 1 5.4 0 0.2 0 0 0 0
Sint Maarten (Dutch Part) 0 0 0 0 0 0
Suriname 2 −2.6 0 −2.1 0 0 0 0
Trinidad and Tobago 4 2.5 0 −7.1 0 0 0 0
Turks and Caicos Islands 0 0 0 0 0 0
United States Virgin Islands 0 3.4 0 2.2 0 0 0 0
Uruguay 52 3.6 2 2.5 17 96 0 24
Venezuela (Bolivarian Republic of ) 160 −0.9 2 5.0 2 150 10 3
Northern America 5 845 0 .9 96 1.3 789 5 511 1 127 907Bermuda 0 1.5 0 −0.6 0 0 0 0
Canada 433 1.5 8 0.1 80 418 49 84
Greenland 0 0 0 0 0 0
Saint Pierre and Miquelon 0 0.0 0 0 0 0 0
United States of America 5 412 0.8 87 1.4 709 5 093 1 078 822
Asia 42 646 2.8 262 5.1 4 809 1 456 1 004 341
Central Asia 468 9.1 16 5.1 27 56 56 5
Kazakhstan 209 8.2 5 3.7 14 19 16 3
Kyrgyzstan 21 6.0 1 2.1 4 4 27 1
Tajikistan 13 24.0 1 7.9 0 17 1 0
Turkmenistan 50 9.0 2 8.1 4 2 0 0
Uzbekistan 175 9.5 6 5.5 4 14 12 2
177
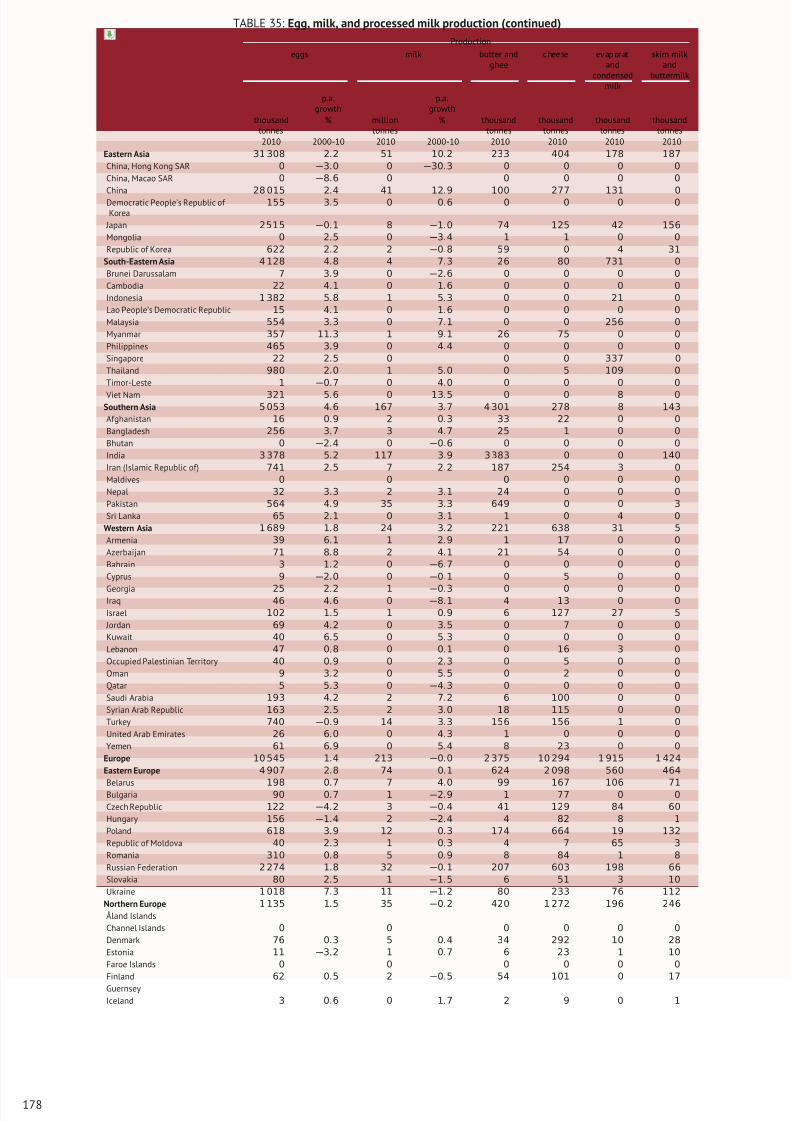
8/16/2019 Informe de la Fao 2013
http://slidepdf.com/reader/full/informe-de-la-fao-2013 196/307
TABLE 35: Egg, milk, and processed milk production (continued)
Production
eggs milk butter andghee
chee se evaporatand
condensedmilk
skim milkand
buttermilk
p.a.growth
p.a.growth
thousandtonnes
% milliontonnes
% thousandtonnes
thousandtonnes
thousandtonnes
thousandtonnes
2010 2000-10 2010 2000-10 2010 2010 2010 2010
Eastern Asia 31 308 2.2 51 10.2 233 404 178 187
China, Hong Kong SAR 0 −3.0 0 −30.3 0 0 0 0
China, Macao SAR 0 −8.6 0 0 0 0 0
China 28 015 2.4 41 12.9 100 277 131 0
Democratic People’s Republic of Korea
155 3.5 0 0.6 0 0 0 0
Japan 2515 −0.1 8 −1.0 74 125 42 156
Mongolia 0 2.5 0 −3.4 1 1 0 0
Republic of Korea 622 2.2 2 −0.8 59 0 4 31
South-Eastern Asia 4 128 4.8 4 7.3 26 80 731 0
Brunei Darussalam 7 3.9 0 −2.6 0 0 0 0
Cambodia 22 4.1 0 1.6 0 0 0 0
Indonesia 1 382 5.8 1 5.3 0 0 21 0
Lao People’s Democratic Republic 15 4.1 0 1.6 0 0 0 0
Malaysia 554 3.3 0 7.1 0 0 256 0
Myanmar 357 11.3 1 9.1 26 75 0 0
Philippines 465 3.9 0 4.4 0 0 0 0
Singapore 22 2.5 0 0 0 337 0
Thailand 980 2.0 1 5.0 0 5 109 0
Timor-Leste 1 −0.7 0 4.0 0 0 0 0
Viet Nam 321 5.6 0 13.5 0 0 8 0
Southern Asia 5 053 4.6 167 3.7 4 301 278 8 143
Afghanistan 16 0.9 2 0.3 33 22 0 0
Bangladesh 256 3.7 3 4.7 25 1 0 0
Bhutan 0 −2.4 0 −0.6 0 0 0 0
India 3 378 5.2 117 3.9 3 383 0 0 140
Iran (Islamic Republic of) 741 2.5 7 2.2 187 254 3 0
Maldives 0 0 0 0 0 0
Nepal 32 3.3 2 3.1 24 0 0 0
Pakistan 564 4.9 35 3.3 649 0 0 3
Sri Lanka 65 2.1 0 3.1 1 0 4 0
Western Asia 1 689 1.8 24 3.2 221 638 31 5
Armenia 39 6.1 1 2.9 1 17 0 0
Azerbaijan 71 8.8 2 4.1 21 54 0 0
Bahrain 3 1.2 0 −6.7 0 0 0 0
Cyprus 9 −2.0 0 −0.1 0 5 0 0
Georgia 25 2.2 1 −0.3 0 0 0 0Iraq 46 4.6 0 −8.1 4 13 0 0
Israel 102 1.5 1 0.9 6 127 27 5
Jordan 69 4.2 0 3.5 0 7 0 0
Kuwait 40 6.5 0 5.3 0 0 0 0
Lebanon 47 0.8 0 0.1 0 16 3 0
Occupied Palestinian Territory 40 0.9 0 2.3 0 5 0 0
Oman 9 3.2 0 5.5 0 2 0 0
Qatar 5 5.3 0 −4.3 0 0 0 0
Saudi Arabia 193 4.2 2 7.2 6 100 0 0
Syrian Arab Republic 163 2.5 2 3.0 18 115 0 0
Turkey 740 −0.9 14 3.3 156 156 1 0
United Arab Emirates 26 6.0 0 4.3 1 0 0 0
Yemen 61 6.9 0 5.4 8 23 0 0
Europe 10 545 1.4 213 −0.0 2 375 10 294 1 915 1 424
Eastern Europe 4 907 2.8 74 0.1 624 2 098 560 464
Belarus 198 0
.7 7 4
.0 99 167 106 71
Bulgaria 90 0.7 1 −2.9 1 77 0 0
Czech Republic 122 −4.2 3 −0.4 41 129 84 60
Hungary 156 −1.4 2 −2.4 4 82 8 1
Poland 618 3.9 12 0.3 174 664 19 132
Republic of Moldova 40 2.3 1 0.3 4 7 65 3
Romania 310 0.8 5 0.9 8 84 1 8
Russian Federation 2 274 1.8 32 −0.1 207 603 198 66
Slovakia 80 2.5 1 −1.5 6 51 3 10
Ukraine 1 018 7.3 11 −1.2 80 233 76 112
Northern Europe 1 135 1.5 35 −0.2 420 1 272 196 246
Åland Islands
Channel Islands 0 0 0 0 0 0
Denmark 76 0.3 5 0.4 34 292 10 28
Estonia 11 −3.2 1 0.7 6 23 1 10
Faroe Islands 0 0 0 0 0 0
Finland 62 0.5 2 −0.5 54 101 0 17
Guernsey
Iceland 3 0.6 0 1.7 2 9 0 1
178
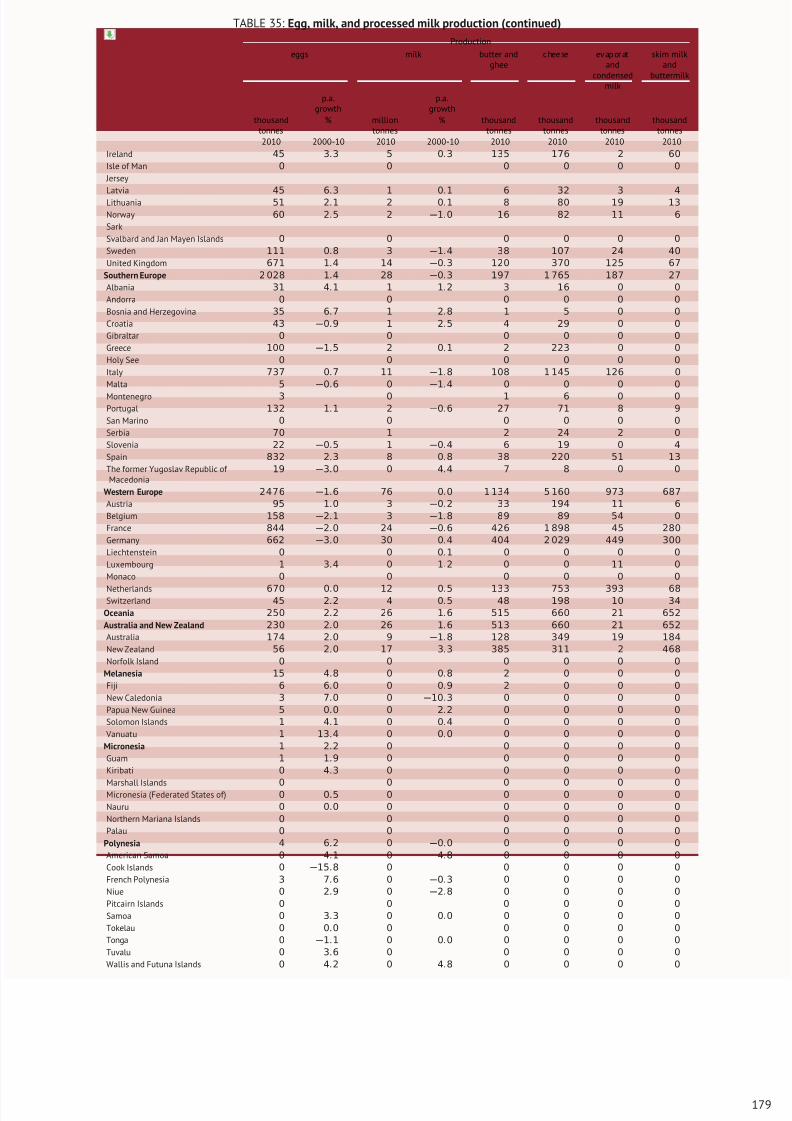
8/16/2019 Informe de la Fao 2013
http://slidepdf.com/reader/full/informe-de-la-fao-2013 197/307
TABLE 35: Egg, milk, and processed milk production (continued)
Production
eggs milk butter andghee
chee se evaporatand
condensedmilk
skim milkand
buttermilk
p.a.growth
p.a.growth
thousandtonnes
% milliontonnes
% thousandtonnes
thousandtonnes
thousandtonnes
thousandtonnes
2010 2000-10 2010 2000-10 2010 2010 2010 2010
Ireland 45 3.3 5 0.3 135 176 2 60
Isle of Man 0 0 0 0 0 0
Jersey
Latvia 45 6.3 1 0.1 6 32 3 4
Lithuania 51 2.1 2 0.1 8 80 19 13
Norway 60 2.5 2 −1.0 16 82 11 6
Sark
Svalbard and Jan Mayen Islands 0 0 0 0 0 0
Sweden 111 0.8 3 −1.4 38 107 24 40
United Kingdom 671 1.4 14 −0.3 120 370 125 67
Southern Europe 2 028 1.4 28 −0.3 197 1 765 187 27
Albania 31 4.1 1 1.2 3 16 0 0
Andorra 0 0 0 0 0 0
Bosnia and Herzegovina 35 6.7 1 2.8 1 5 0 0
Croatia 43 −0.9 1 2.5 4 29 0 0
Gibraltar 0 0 0 0 0 0
Greece 100 −1.5 2 0.1 2 223 0 0
Holy See 0 0 0 0 0 0
Italy 737 0.7 11 −1.8 108 1 145 126 0
Malta 5 −0.6 0 −1.4 0 0 0 0
Montenegro 3 0 1 6 0 0
Portugal 132 1.1 2 −0.6 27 71 8 9
San Marino 0 0 0 0 0 0
Serbia 70 1 2 24 2 0
Slovenia 22 −0.5 1 −0.4 6 19 0 4
Spain 832 2.3 8 0.8 38 220 51 13
The former Yugoslav Republic of Macedonia
19 −3.0 0 4.4 7 8 0 0
Western Europe 2476 −1.6 76 0.0 1 134 5 160 973 687
Austria 95 1.0 3 −0.2 33 194 11 6
Belgium 158 −2.1 3 −1.8 89 89 54 0
France 844 −2.0 24 −0.6 426 1 898 45 280
Germany 662 −3.0 30 0.4 404 2 029 449 300
Liechtenstein 0 0 0.1 0 0 0 0
Luxembourg 1 3.4 0 1.2 0 0 11 0
Monaco 0 0 0 0 0 0
Netherlands 670 0.0 12 0.5 133 753 393 68Switzerland 45 2.2 4 0.5 48 198 10 34
Oceania 250 2.2 26 1.6 515 660 21 652
Australia and New Zealand 230 2.0 26 1.6 513 660 21 652
Australia 174 2.0 9 −1.8 128 349 19 184
New Zealand 56 2.0 17 3.3 385 311 2 468
Norfolk Island 0 0 0 0 0 0
Melanesia 15 4.8 0 0.8 2 0 0 0
Fiji 6 6.0 0 0.9 2 0 0 0
New Caledonia 3 7.0 0 −10.3 0 0 0 0
Papua New Guinea 5 0.0 0 2.2 0 0 0 0
Solomon Islands 1 4.1 0 0.4 0 0 0 0
Vanuatu 1 13.4 0 0.0 0 0 0 0
Micronesia 1 2.2 0 0 0 0 0
Guam 1 1.9 0 0 0 0 0
Kiribati 0 4.3 0 0 0 0 0
Marshall Islands 0 0 0 0 0 0
Micronesia (Federated States of) 0 0.5 0 0 0 0 0
Nauru 0 0.0 0 0 0 0 0
Northern Mariana Islands 0 0 0 0 0 0
Palau 0 0 0 0 0 0
Polynesia 4 6.2 0 −0.0 0 0 0 0
American Samoa 0 4.1 0 4.8 0 0 0 0
Cook Islands 0 −15.8 0 0 0 0 0
French Polynesia 3 7.6 0 −0.3 0 0 0 0
Niue 0 2.9 0 −2.8 0 0 0 0
Pitcairn Islands 0 0 0 0 0 0
Samoa 0 3.3 0 0.0 0 0 0 0
Tokelau 0 0.0 0 0 0 0 0
Tonga 0 −1.1 0 0.0 0 0 0 0
Tuvalu 0 3.6 0 0 0 0 0
Wallis and Futuna Islands 0 4.2 0 4.8 0 0 0 0
179
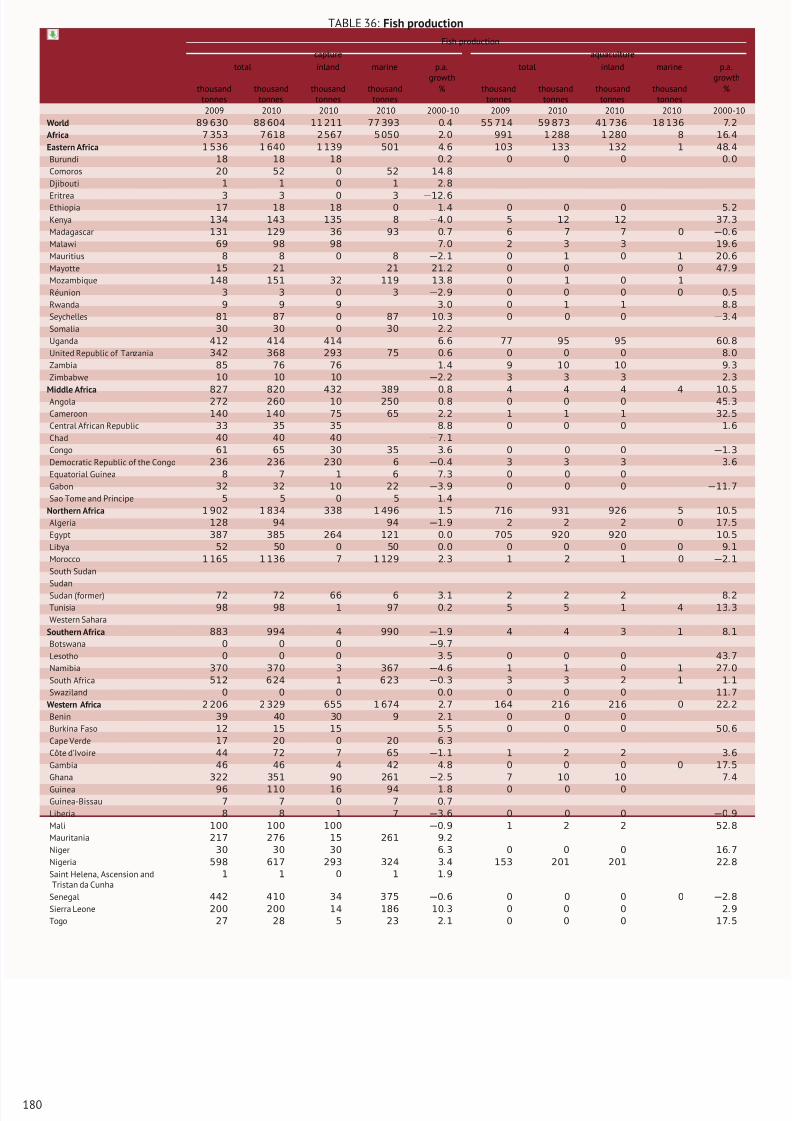
8/16/2019 Informe de la Fao 2013
http://slidepdf.com/reader/full/informe-de-la-fao-2013 198/307
TABLE 36: Fish production
Fish production
capture aquaculture
total inland marine p.a.growth
total inland marine p.a.growth
thousandtonnes
thousandtonnes
thousandtonnes
thousandtonnes
% thousandtonnes
thousandtonnes
thousandtonnes
thousandtonnes
%
2009 2010 2010 2010 2000-10 2009 2010 2010 2010 2000-10
World 89 630 88 604 11 211 77 393 0.4 55 714 59 873 41 736 18 136 7.2
Africa 7 353 7 618 2 567 5 050 2.0 991 1 288 1 280 8 16.4
Eastern Africa 1 536 1 640 1 139 501 4.6 103 133 132 1 48.4
Burundi 18 18 18 0.2 0 0 0 0.0
Comoros 20 52 0 52 14.8
Djibouti 1 1 0 1 2.8
Eritrea 3 3 0 3 −12.6Ethiopia 17 18 18 0 1.4 0 0 0 5.2
Kenya 134 143 135 8 −4.0 5 12 12 37.3
Madagascar 131 129 36 93 0.7 6 7 7 0 −0.6
Malawi 69 98 98 7.0 2 3 3 19.6
Mauritius 8 8 0 8 −2.1 0 1 0 1 20.6
Mayotte 15 21 21 21.2 0 0 0 47.9
Mozambique 148 151 32 119 13.8 0 1 0 1
Réunion 3 3 0 3 −2.9 0 0 0 0 0.5
Rwanda 9 9 9 3.0 0 1 1 8.8
Seychelles 81 87 0 87 10.3 0 0 0 −3.4
Somalia 30 30 0 30 2.2
Uganda 412 414 414 6.6 77 95 95 60.8
United Republic of Tanzania 342 368 293 75 0.6 0 0 0 8.0
Zambia 85 76 76 1.4 9 10 10 9.3
Zimbabwe 10 10 10 −2.2 3 3 3 2.3
Middle Africa 827 820 432 389 0
.8 4 4 4 4 10
.5
Angola 272 260 10 250 0.8 0 0 0 45.3
Cameroon 140 1 40 75 65 2.2 1 1 1 32.5
Central African Republic 33 35 35 8.8 0 0 0 1.6
Chad 40 40 40 −7.1
Congo 61 65 30 35 3.6 0 0 0 −1.3
Democratic Republic of the Congo 236 236 230 6 −0.4 3 3 3 3.6
Equatorial Guinea 8 7 1 6 7.3 0 0 0
Gabon 32 32 10 22 −3.9 0 0 0 −11.7
Sao Tome and Principe 5 5 0 5 1.4
Northern Africa 1 902 1 834 338 1 496 1.5 716 931 926 5 10.5
Algeria 128 94 94 −1.9 2 2 2 0 17.5
Egypt 387 385 264 121 0.0 705 920 920 10.5
Libya 52 50 0 50 0.0 0 0 0 0 9.1
Morocco 1 165 1 136 7 1 129 2.3 1 2 1 0 −2.1
South Sudan
Sudan
Sudan (former) 72 72 66 6 3.1 2 2 2 8.2
Tunisia 98 98 1 97 0.2 5 5 1 4 13.3
Western Sahara
Southern Africa 883 994 4 990 −1.9 4 4 3 1 8.1
Botswana 0 0 0 −9.7
Lesotho 0 0 0 3.5 0 0 0 43.7
Namibia 370 370 3 367 −4.6 1 1 0 1 27.0
South Africa 512 6 24 1 6 23 −0.3 3 3 2 1 1.1
Swaziland 0 0 0 0.0 0 0 0 11.7
Western Africa 2 206 2 329 655 1 674 2.7 164 216 216 0 22.2
Benin 39 40 30 9 2.1 0 0 0
Burkina Faso 12 15 15 5.5 0 0 0 50.6
Cape Verde 17 20 0 20 6.3
Côte d’Ivoire 44 72 7 65 −1.1 1 2 2 3.6
Gambia 46 46 4 42 4.8 0 0 0 0 17.5
Ghana 322 351 90 261 −2.5 7 10 10 7.4
Guinea 96 110 16 94 1.8 0 0 0
Guinea-Bissau 7 7 0 7 0.7
Liberia 8 8 1 7 −3.6 0 0 0 −0.9
Mali 100 100 100 −0.9 1 2 2 52.8
Mauritania 217 276 15 261 9.2
Niger 30 30 30 6.3 0 0 0 16.7
Nigeria 598 617 293 324 3.4 153 201 201 22.8
Saint Helena, Ascension andTristan da Cunha
1 1 0 1 1.9
Senegal 442 410 34 375 −0.6 0 0 0 0 −2.8
Sierra Leone 200 200 14 186 10.3 0 0 0 2.9
Togo 27 28 5 23 2.1 0 0 0 17.5
180
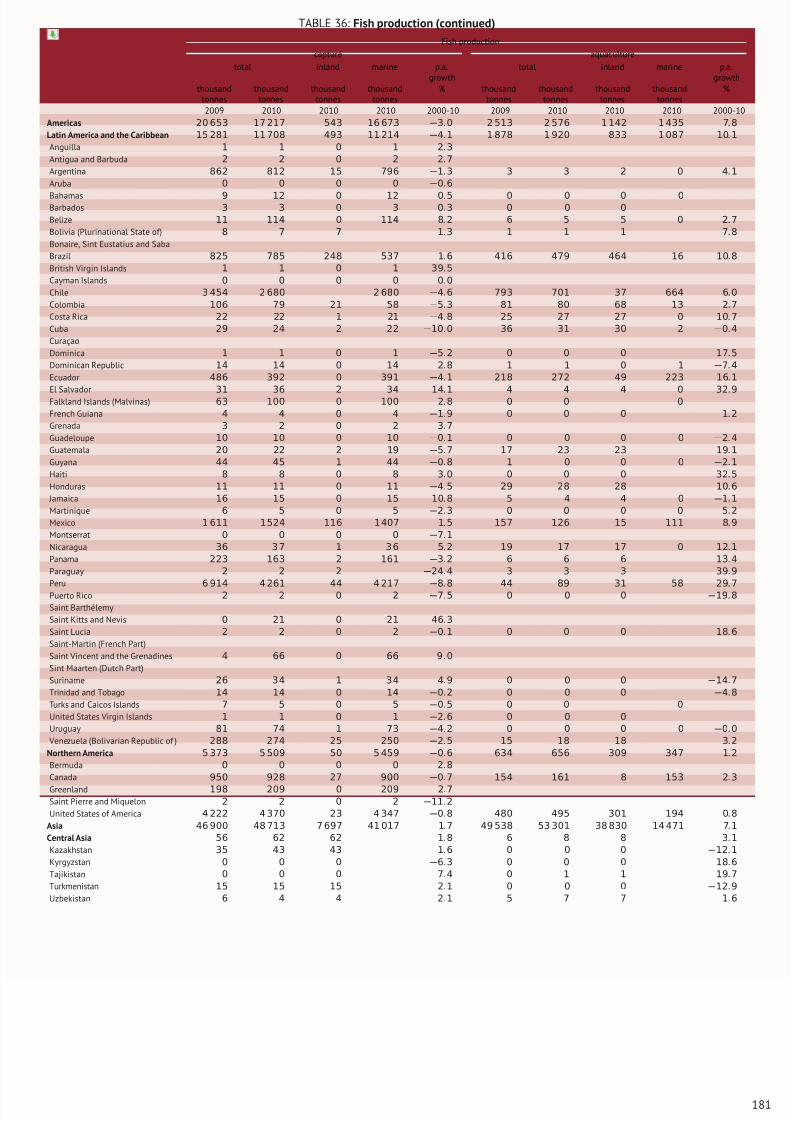
8/16/2019 Informe de la Fao 2013
http://slidepdf.com/reader/full/informe-de-la-fao-2013 199/307
TABLE 36: Fish production (continued)
Fish production
capture aquaculture
total inland marine p.a.growth
total inland marine p.a.growth
thousandtonnes
thousandtonnes
thousandtonnes
thousandtonnes
% thousandtonnes
thousandtonnes
thousandtonnes
thousandtonnes
%
2009 2010 2010 2010 2000-10 2009 2010 2010 2010 2000-10
Americas 20 653 17 217 543 16 673 −3.0 2 513 2 576 1 142 1 435 7.8
Latin America and the Caribbean 15 281 11 708 493 11 214 −4.1 1 878 1 920 833 1 087 10.1
Anguilla 1 1 0 1 2.3
Antigua and Barbuda 2 2 0 2 2.7
Argentina 862 812 15 796 −1.3 3 3 2 0 4.1
Aruba 0 0 0 0 −0.6
Bahamas 9 12 0 12 0.5 0 0 0 0Barbados 3 3 0 3 0.3 0 0 0
Belize 11 114 0 114 8.2 6 5 5 0 2.7
Bolivia (Plurinational State of) 8 7 7 1.3 1 1 1 7.8
Bonaire, Sint Eustatius and Saba
Brazil 825 785 248 537 1.6 416 479 464 16 10.8
British Virgin Islands 1 1 0 1 39.5
Cayman Islands 0 0 0 0 0.0
Chile 3 454 2 680 2 680 −4.6 793 701 37 664 6.0
Colombia 106 79 21 58 −5.3 81 80 68 13 2.7
Costa Rica 22 22 1 21 −4.8 25 27 27 0 10.7
Cuba 29 24 2 22 −10.0 36 31 30 2 −0.4
Curaçao
Dominica 1 1 0 1 −5.2 0 0 0 17.5
Dominican Republic 14 14 0 14 2.8 1 1 0 1 −7.4
Ecuador 486 392 0 391 −4.1 218 272 49 223 16.1
El Salvador 31 36 2 34 14
.1 4 4 4 0 32
.9
Falkland Islands (Malvinas) 63 100 0 100 2.8 0 0 0
French Guiana 4 4 0 4 −1.9 0 0 0 1.2
Grenada 3 2 0 2 3.7
Guadeloupe 10 10 0 10 −0.1 0 0 0 0 −2.4
Guatemala 20 22 2 19 −5.7 17 23 23 19.1
Guyana 44 45 1 44 −0.8 1 0 0 0 −2.1
Haiti 8 8 0 8 3.0 0 0 0 32.5
Honduras 11 11 0 11 −4.5 29 28 28 10.6
Jamaica 16 15 0 15 10.8 5 4 4 0 −1.1
Martinique 6 5 0 5 −2.3 0 0 0 0 5.2
Mexico 1 611 1524 116 1 407 1.5 157 126 15 111 8.9
Montserrat 0 0 0 0 −7.1
Nicaragua 36 3 7 1 3 6 5.2 19 17 17 0 12.1
Panama 223 163 2 161 −3.2 6 6 6 13.4
Paraguay 2 2 2 −24.4 3 3 3 39.9
Peru 6 914 4 261 44 4 217 −8.8 44 89 31 58 29.7
Puerto Rico 2 2 0 2 −7.5 0 0 0 −19.8
Saint Barthélemy
Saint Kitts and Nevis 0 21 0 21 46.3
Saint Lucia 2 2 0 2 −0.1 0 0 0 18.6
Saint-Martin (French Part)
Saint Vincent and the Grenadines 4 66 0 66 9 .0
Sint Maarten (Dutch Part)
Suriname 26 34 1 34 4.9 0 0 0 −14.7
Trinidad and Tobago 14 14 0 14 −0.2 0 0 0 −4.8
Turks and Caicos Islands 7 5 0 5 −0.5 0 0 0
United States Virgin Islands 1 1 0 1 −2.6 0 0 0
Uruguay 81 74 1 73 −4.2 0 0 0 0 −0.0
Venezuela (Bolivarian Republic of ) 288 274 25 250 −2.5 15 18 18 3.2
Northern America 5 373 5 509 50 5 459 −0.6 634 656 309 347 1.2
Bermuda 0 0 0 0 2.8
Canada 950 928 27 900 −0.7 154 161 8 153 2.3
Greenland 198 209 0 209 2.7
Saint Pierre and Miquelon 2 2 0 2 −11.2
United States of America 4 222 4 370 23 4 347 −0.8 480 495 301 194 0.8
Asia 46 900 48 713 7 697 41 017 1.7 49 538 53 301 38 830 14 471 7.1
Central Asia 56 62 62 1.8 6 8 8 3.1
Kazakhstan 35 43 43 1.6 0 0 0 −12.1
Kyrgyzstan 0 0 0 −6.3 0 0 0 18.6
Tajikistan 0 0 0 7.4 0 1 1 19.7
Turkmenistan 15 15 15 2.1 0 0 0 −12.9
Uzbekistan 6 4 4 2.1 5 7 7 1.6
181
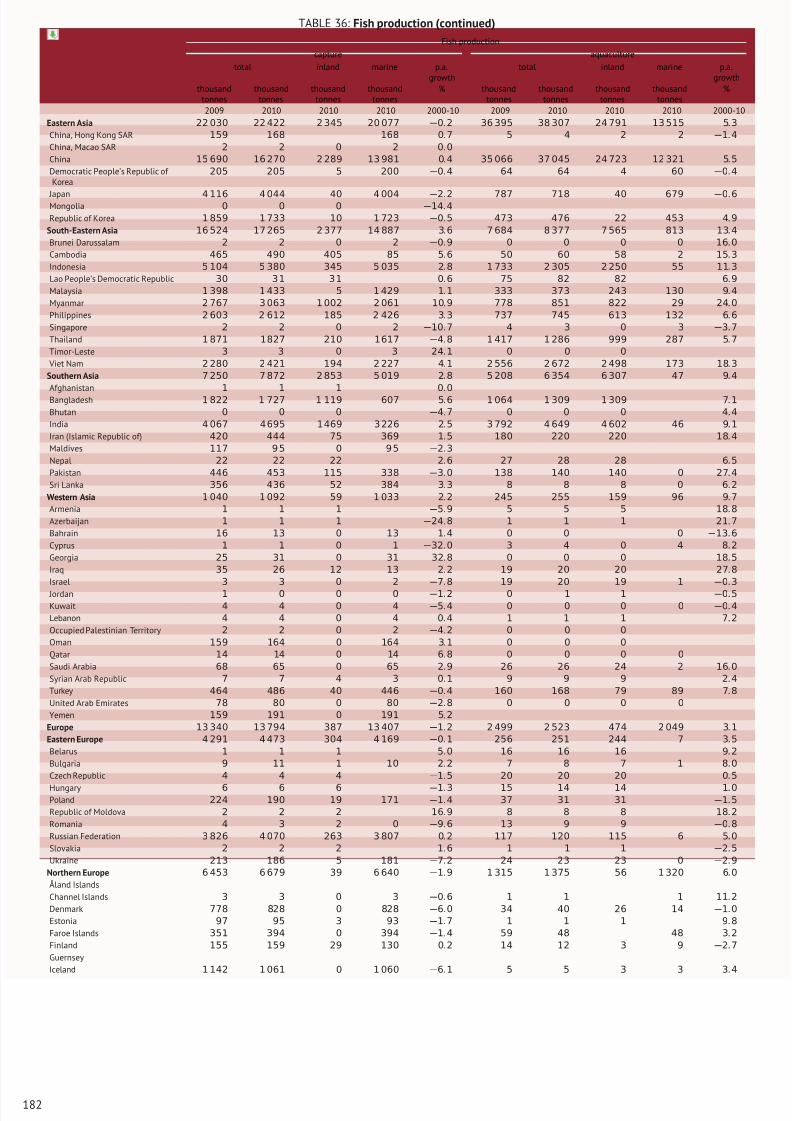
8/16/2019 Informe de la Fao 2013
http://slidepdf.com/reader/full/informe-de-la-fao-2013 200/307
TABLE 36: Fish production (continued)
Fish production
capture aquaculture
total inland marine p.a.growth
total inland marine p.a.growth
thousandtonnes
thousandtonnes
thousandtonnes
thousandtonnes
% thousandtonnes
thousandtonnes
thousandtonnes
thousandtonnes
%
2009 2010 2010 2010 2000-10 2009 2010 2010 2010 2000-10
Eastern Asia 22 030 22 422 2 345 20 077 −0.2 36 395 38 307 24 791 13 515 5.3
China, Hong Kong SAR 159 168 168 0.7 5 4 2 2 −1.4
China, Macao SAR 2 2 0 2 0.0
China 15 690 16 270 2 289 13 981 0.4 35 066 37 045 24 723 12 321 5.5
Democratic People’s Republic of Korea
205 205 5 200 −0.4 64 64 4 60 −0.4
Japan 4 116 4 044 40 4 004 −2.2 787 718 40 679 −0.6Mongolia 0 0 0 −14.4
Republic of Korea 1 859 1 733 10 1 723 −0.5 473 476 22 453 4.9
South-Eastern Asia 16 524 17 265 2 377 14 887 3.6 7 684 8 377 7 565 813 13.4
Brunei Darussalam 2 2 0 2 −0.9 0 0 0 0 16.0
Cambodia 465 490 405 85 5.6 50 60 58 2 15.3
Indonesia 5 104 5 380 345 5 035 2.8 1 733 2 305 2 250 55 11.3
Lao People’s Democratic Republic 30 3 1 3 1 0.6 75 82 82 6.9
Malaysia 1 398 1 433 5 1 429 1.1 333 373 243 130 9.4
Myanmar 2 767 3 063 1 002 2 061 10.9 778 851 822 29 24.0
Philippines 2 603 2 612 185 2 426 3.3 737 745 613 132 6.6
Singapore 2 2 0 2 −10.7 4 3 0 3 −3.7
Thailand 1 871 1827 210 1617 −4.8 1 417 1 286 999 287 5.7
Timor-Leste 3 3 0 3 24.1 0 0 0
Viet Nam 2 280 2 421 194 2 227 4.1 2 556 2 672 2 498 173 18.3
Southern Asia 7 250 7 872 2 853 5 019 2.8 5 208 6 354 6 307 47 9.4
Afghanistan 1 1 1 0.
0
Bangladesh 1 822 1 727 1 119 607 5.6 1 064 1 309 1 309 7.1
Bhutan 0 0 0 −4.7 0 0 0 4.4
India 4 067 4 695 1 469 3 226 2.5 3 792 4 649 4 602 46 9.1
Iran (Islamic Republic of) 420 444 75 369 1.5 180 220 220 18.4
Maldives 117 9 5 0 9 5 −2.3
Nepal 22 22 22 2.6 27 28 28 6.5
Pakistan 446 453 115 338 −3.0 138 140 140 0 27.4
Sri Lanka 356 436 52 384 3.3 8 8 8 0 6.2
Western Asia 1 040 1 092 59 1 033 2.2 245 255 159 96 9.7
Armenia 1 1 1 −5.9 5 5 5 18.8
Azerbaijan 1 1 1 −24.8 1 1 1 21.7
Bahrain 16 13 0 13 1.4 0 0 0 −13.6
Cyprus 1 1 0 1 −32.0 3 4 0 4 8.2
Georgia 25 31 0 31 32.8 0 0 0 18.5
Iraq 35 26 12 13 2.2 19 20 20 27.8
Israel 3 3 0 2 −7.8 19 20 19 1 −0.3
Jordan 1 0 0 0 −1.2 0 1 1 −0.5
Kuwait 4 4 0 4 −5.4 0 0 0 0 −0.4
Lebanon 4 4 0 4 0.4 1 1 1 7.2
Occupied Palestinian Territory 2 2 0 2 −4.2 0 0 0
Oman 159 164 0 164 3.1 0 0 0
Qatar 14 14 0 14 6.8 0 0 0 0
Saudi Arabia 68 65 0 65 2.9 26 26 24 2 16.0
Syrian Arab Republic 7 7 4 3 0.1 9 9 9 2.4
Turkey 464 486 40 446 −0.4 160 168 79 89 7.8
United Arab Emirates 78 80 0 80 −2.8 0 0 0 0
Yemen 159 191 0 191 5.2
Europe 13 340 13 794 387 13 407 −1.2 2 499 2 523 474 2 049 3.1
Eastern Europe 4 291 4 473 304 4 169 −0.1 256 251 244 7 3.5
Belarus 1 1 1 5.0 16 16 16 9.2
Bulgaria 9 11 1 10 2.2 7 8 7 1 8.0
Czech Republic 4 4 4 −1.5 20 20 20 0.5
Hungary 6 6 6 −1.3 15 14 14 1.0
Poland 224 190 19 171 −1.4 37 31 31 −1.5
Republic of Moldova 2 2 2 16.9 8 8 8 18.2
Romania 4 3 2 0 −9.6 13 9 9 −0.8
Russian Federation 3 826 4 070 263 3 807 0.2 117 120 115 6 5.0
Slovakia 2 2 2 1.6 1 1 1 −2.5
Ukraine 213 186 5 181 −7.2 24 23 23 0 −2.9
Northern Europe 6 453 6 679 39 6 640 −1.9 1 315 1 375 56 1 320 6.0
Åland Islands
Channel Islands 3 3 0 3 −0.6 1 1 1 11.2
Denmark 778 828 0 828 −6.0 34 40 26 14 −1.0
Estonia 97 95 3 93 −1.7 1 1 1 9.8
Faroe Islands 351 394 0 394 −1.4 59 48 48 3.2
Finland 155 159 29 130 0.2 14 12 3 9 −2.7
Guernsey
Iceland 1 142 1 061 0 1 060 −6.1 5 5 3 3 3.4
182
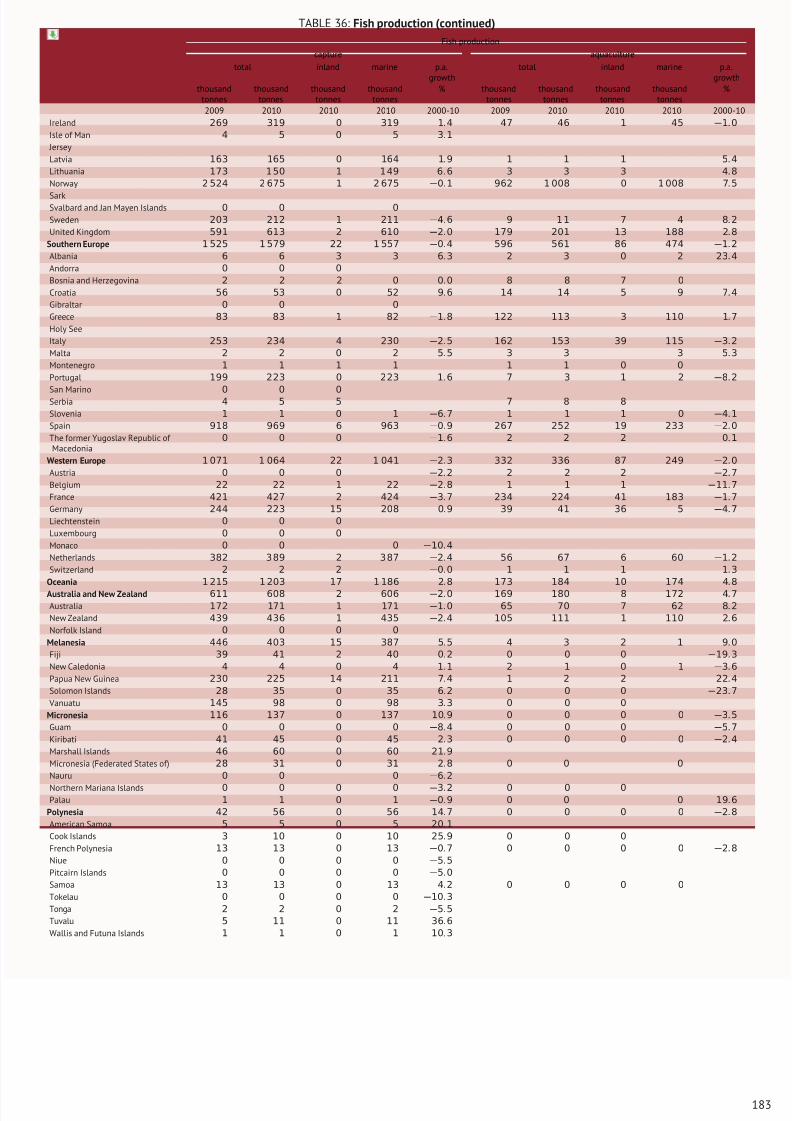
8/16/2019 Informe de la Fao 2013
http://slidepdf.com/reader/full/informe-de-la-fao-2013 201/307
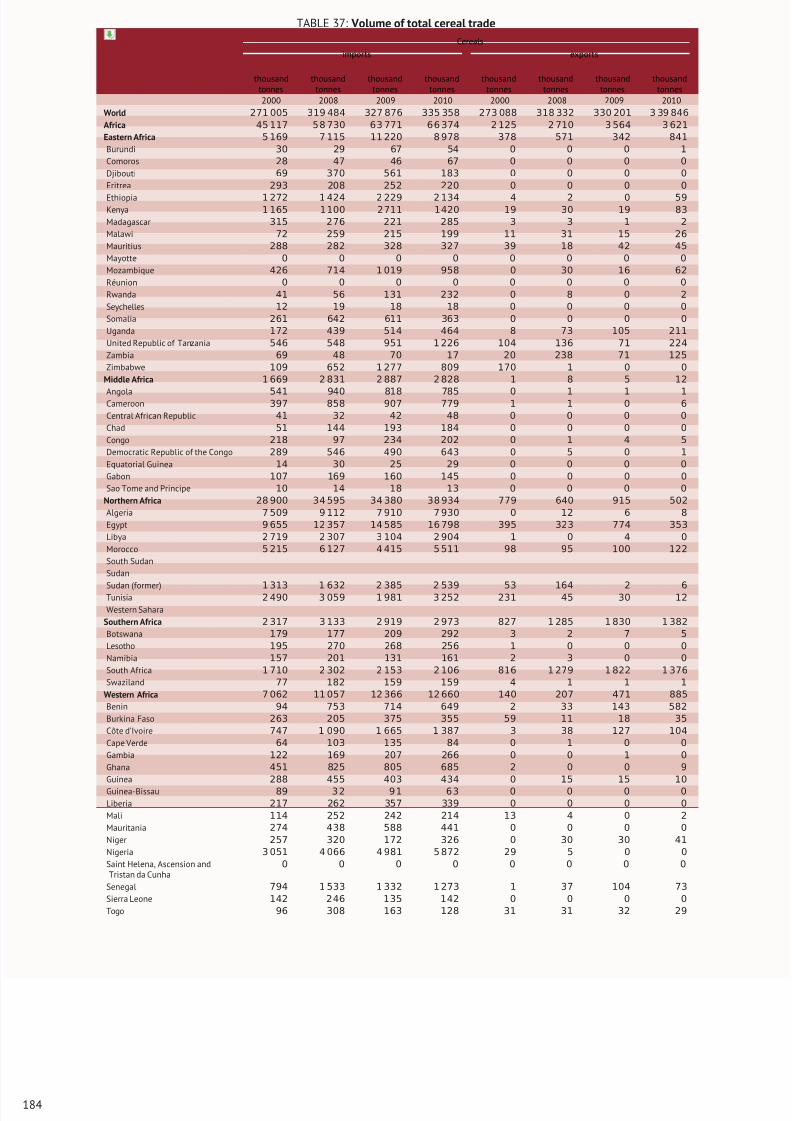
8/16/2019 Informe de la Fao 2013
http://slidepdf.com/reader/full/informe-de-la-fao-2013 202/307
TABLE 37: Volume of total cereal trade
Cereals
imports exports
thousandtonnes
thousandtonnes
thousandtonnes
thousandtonnes
thousandtonnes
thousandtonnes
thousandtonnes
thousandtonnes
2000 2008 2009 2010 2000 2008 2009 2010
World 271 005 319 484 327 876 335 358 273 088 318 332 330 201 3 39 846
Africa 45 117 5 8 730 63 771 6 6 374 2 125 2 710 3 564 3 621
Eastern Africa 5 169 7 115 11 220 8 978 378 571 342 841
Burundi 30 29 67 54 0 0 0 1
Comoros 28 47 46 67 0 0 0 0
Djibouti 69 370 561 183 0 0 0 0
Eritrea 293 208 252 220 0 0 0 0
Ethiopia 1 272 1 424 2 229 2 134 4 2 0 59Kenya 1 165 1 100 2711 1420 19 30 19 83
Madagascar 315 276 221 285 3 3 1 2
Malawi 72 259 215 199 11 31 15 26
Mauritius 288 282 328 327 39 18 42 45
Mayotte 0 0 0 0 0 0 0 0
Mozambique 426 714 1 019 958 0 30 16 62
Réunion 0 0 0 0 0 0 0 0
Rwanda 41 56 131 232 0 8 0 2
Seychelles 12 19 18 18 0 0 0 0
Somalia 261 642 611 363 0 0 0 0
Uganda 172 439 514 464 8 73 105 211
United Republic of Tanzania 546 548 951 1 226 104 136 71 224
Zambia 69 48 70 17 20 238 71 125
Zimbabwe 109 652 1 277 809 170 1 0 0
Middle Africa 1 669 2 831 2 887 2 828 1 8 5 12
Angola 541 940 818 785 0 1 1 1Cameroon 397 858 907 779 1 1 0 6
Central African Republic 41 32 42 48 0 0 0 0
Chad 51 144 193 184 0 0 0 0
Congo 218 97 234 202 0 1 4 5
Democratic Republic of the Congo 289 546 490 643 0 5 0 1
Equatorial Guinea 14 30 25 29 0 0 0 0
Gabon 107 169 160 145 0 0 0 0
Sao Tome and Principe 10 14 18 13 0 0 0 0
Northern Africa 28 900 34 595 34 380 38 934 779 640 915 502
Algeria 7 509 9 112 7 910 7 930 0 12 6 8
Egypt 9 655 12 357 14 585 16 798 395 323 774 353
Libya 2 719 2 307 3 104 2 904 1 0 4 0
Morocco 5 215 6 127 4 415 5 511 98 95 100 122
South Sudan
Sudan
Sudan (former) 1 313 1 632 2 385 2 539 53 164 2 6
Tunisia 2 490 3 059 1 981 3 252 231 45 30 12
Western Sahara
Southern Africa 2 317 3 133 2 919 2 973 827 1 285 1 830 1 382
Botswana 179 177 209 292 3 2 7 5
Lesotho 195 270 268 256 1 0 0 0
Namibia 157 201 131 161 2 3 0 0
South Africa 1 710 2 302 2 153 2 106 816 1 279 1 822 1 376
Swaziland 77 182 159 159 4 1 1 1
Western Africa 7 062 11 057 12 366 12 660 140 207 471 885
Benin 94 753 714 649 2 33 143 582
Burkina Faso 263 205 375 355 59 11 18 35
Côte d’Ivoire 747 1 090 1 665 1 387 3 38 127 104
Cape Verde 64 103 135 84 0 1 0 0
Gambia 122 169 207 266 0 0 1 0
Ghana 451 825 805 685 2 0 0 9
Guinea 288 455 403 434 0 15 15 10
Guinea-Bissau 89 3 2 9 1 6 3 0 0 0 0
Liberia 217 262 357 339 0 0 0 0
Mali 114 252 242 214 13 4 0 2
Mauritania 274 438 588 441 0 0 0 0
Niger 257 320 172 326 0 30 30 41
Nigeria 3 051 4 066 4 981 5 872 29 5 0 0
Saint Helena, Ascension andTristan da Cunha
0 0 0 0 0 0 0 0
Senegal 794 1 533 1 332 1 273 1 37 104 73
Sierra Leone 142 246 135 142 0 0 0 0
Togo 96 308 163 128 31 31 32 29
184
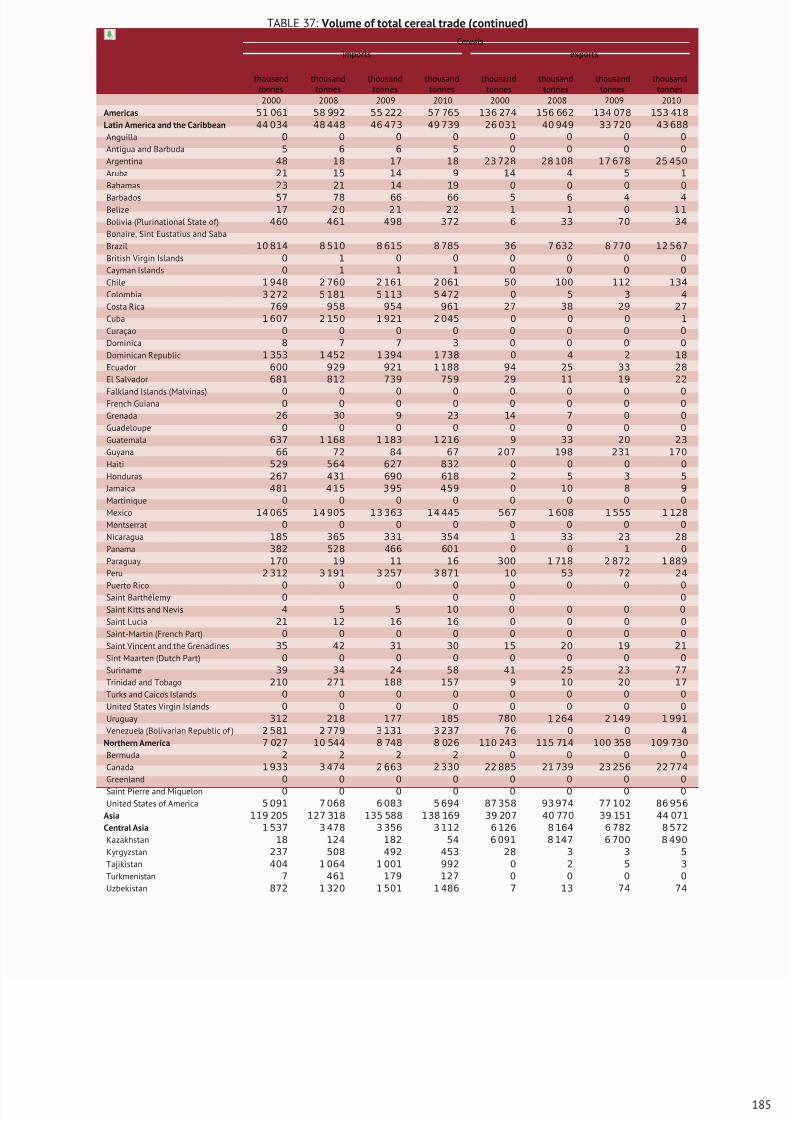
8/16/2019 Informe de la Fao 2013
http://slidepdf.com/reader/full/informe-de-la-fao-2013 203/307
TABLE 37: Volume of total cereal trade (continued)
Cereals
imports exports
thousandtonnes
thousandtonnes
thousandtonnes
thousandtonnes
thousandtonnes
thousandtonnes
thousandtonnes
thousandtonnes
2000 2008 2009 2010 2000 2008 2009 2010
Americas 51 061 58 992 55 222 57 765 136 274 156 662 134 078 153 418
Latin America and the Caribbean 44 034 48 448 46 473 49 739 26 031 40 949 33 720 43 688
Anguilla 0 0 0 0 0 0 0 0
Antigua and Barbuda 5 6 6 5 0 0 0 0
Argentina 48 18 17 18 23 728 28 108 17 678 25 450
Aruba 21 15 14 9 14 4 5 1
Bahamas 23 21 14 19 0 0 0 0
Barbados 57 78 66 66 5 6 4 4Belize 17 2 0 2 1 2 2 1 1 0 1 1
Bolivia (Plurinational State of) 460 461 498 372 6 33 70 34
Bonaire, Sint Eustatius and Saba
Brazil 10 814 8 510 8 615 8 785 36 7 632 8 770 12 567
British Virgin Islands 0 1 0 0 0 0 0 0
Cayman Islands 0 1 1 1 0 0 0 0
Chile 1 948 2 760 2 161 2 061 50 100 112 134
Colombia 3 272 5 181 5 113 5 472 0 5 3 4
Costa Rica 769 958 954 961 27 38 29 27
Cuba 1 607 2 150 1 921 2 045 0 0 0 1
Curaçao 0 0 0 0 0 0 0 0
Dominica 8 7 7 3 0 0 0 0
Dominican Republic 1 353 1 452 1 394 1 738 0 4 2 18
Ecuador 600 929 921 1 188 94 25 33 28
El Salvador 681 812 739 759 29 11 19 22
Falkland Islands (Malvinas) 0 0 0 0 0 0 0 0French Guiana 0 0 0 0 0 0 0 0
Grenada 26 30 9 23 14 7 0 0
Guadeloupe 0 0 0 0 0 0 0 0
Guatemala 637 1 168 1 183 1 216 9 33 20 23
Guyana 66 72 84 67 207 198 231 170
Haiti 529 564 627 832 0 0 0 0
Honduras 267 431 690 618 2 5 3 5
Jamaica 481 4 15 395 459 0 10 8 9
Martinique 0 0 0 0 0 0 0 0
Mexico 14 065 14 905 13 363 14 445 567 1 608 1 555 1 128
Montserrat 0 0 0 0 0 0 0 0
Nicaragua 185 365 331 354 1 33 23 28
Panama 382 528 466 601 0 0 1 0
Paraguay 170 19 11 16 300 1 718 2 872 1 889
Peru 2 312 3 191 3 257 3 871 10 53 72 24
Puerto Rico 0 0 0 0 0 0 0 0
Saint Barthélemy 0 0 0 0
Saint Kitts and Nevis 4 5 5 10 0 0 0 0
Saint Lucia 21 12 16 16 0 0 0 0
Saint-Martin (French Part) 0 0 0 0 0 0 0 0
Saint Vincent and the Grenadines 35 42 31 30 15 20 19 21
Sint Maarten (Dutch Part) 0 0 0 0 0 0 0 0
Suriname 39 34 24 58 41 25 23 77
Trinidad and Tobago 210 271 188 157 9 10 20 17
Turks and Caicos Islands 0 0 0 0 0 0 0 0
United States Virgin Islands 0 0 0 0 0 0 0 0
Uruguay 312 218 177 185 780 1 264 2 149 1 991
Venezuela (Bolivarian Republic of ) 2 581 2 779 3 131 3 237 76 0 0 4
Northern America 7 027 10 544 8 748 8 026 110 243 115 714 100 358 109 730
Bermuda 2 2 2 2 0 0 0 0
Canada 1 933 3 474 2 663 2 330 22 885 21 739 23 256 22 774
Greenland 0 0 0 0 0 0 0 0
Saint Pierre and Miquelon 0 0 0 0 0 0 0 0
United States of America 5 091 7 068 6 083 5 694 87 358 93 974 77 102 86 956
Asia 119 205 127 318 135 588 138 169 39 207 40 770 39 151 44 071
Central Asia 1 537 3 478 3 356 3 112 6 126 8 164 6 782 8 572
Kazakhstan 18 124 182 54 6 091 8 147 6 700 8 490
Kyrgyzstan 237 508 492 453 28 3 3 5
Tajikistan 404 1 064 1 001 992 0 2 5 3
Turkmenistan 7 461 179 127 0 0 0 0
Uzbekistan 872 1 320 1 501 1 486 7 13 74 74
185
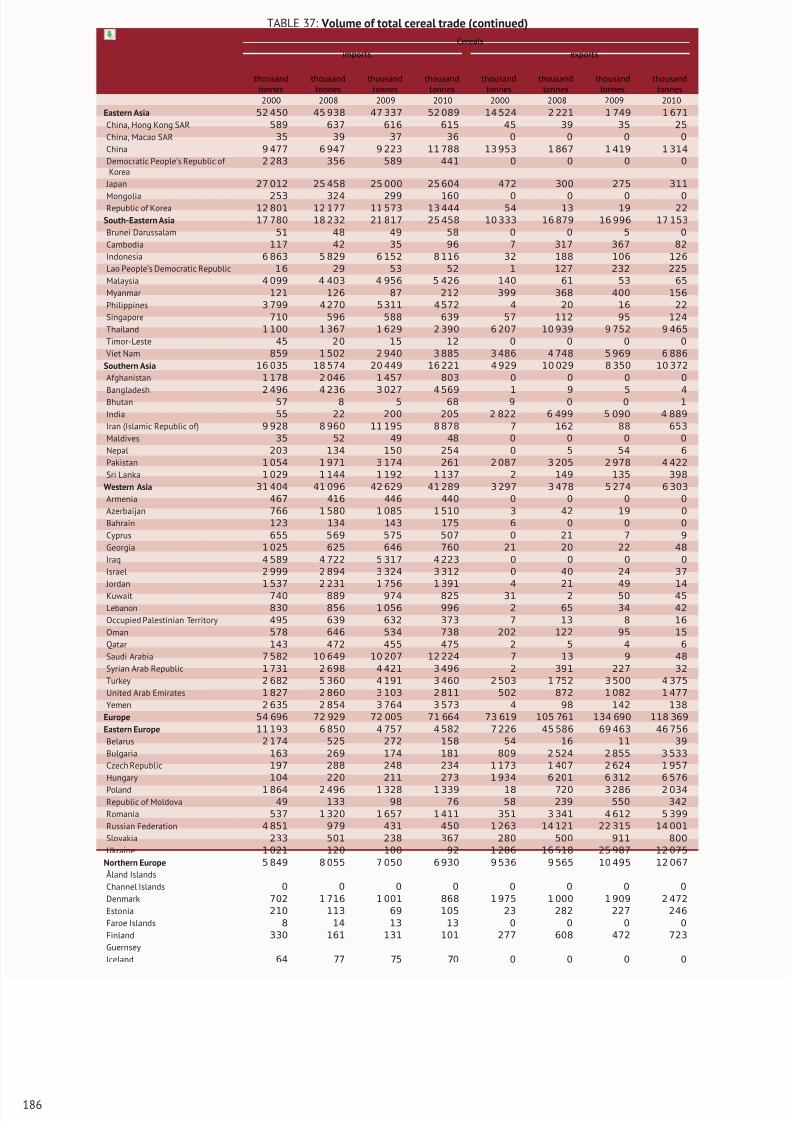
8/16/2019 Informe de la Fao 2013
http://slidepdf.com/reader/full/informe-de-la-fao-2013 204/307
TABLE 37: Volume of total cereal trade (continued)
Cereals
imports exports
thousandtonnes
thousandtonnes
thousandtonnes
thousandtonnes
thousandtonnes
thousandtonnes
thousandtonnes
thousandtonnes
2000 2008 2009 2010 2000 2008 2009 2010
Eastern Asia 52 450 45 938 47 337 52 089 14 524 2 221 1 749 1 671
China, Hong Kong SAR 589 637 616 615 45 39 35 25
China, Macao SAR 35 39 37 36 0 0 0 0
China 9 477 6 947 9 223 11 788 13 953 1 867 1 419 1 314
Democratic People’s Republic of Korea
2 283 356 589 441 0 0 0 0
Japan 27 012 25 458 25 000 25 604 472 300 275 311
Mongolia 253 324 299 160 0 0 0 0Republic of Korea 12 801 12 177 11 573 13 444 54 13 19 22
South-Eastern Asia 17 780 18 232 21 817 25 458 10 333 16 879 16 996 17 153
Brunei Darussalam 51 48 49 58 0 0 5 0
Cambodia 117 42 35 96 7 317 367 82
Indonesia 6 863 5 829 6 152 8 116 32 188 106 126
Lao People’s Democratic Republic 16 29 53 52 1 127 232 225
Malaysia 4 099 4 403 4 956 5 426 140 61 53 65
Myanmar 121 126 87 212 399 368 400 156
Philippines 3 799 4 270 5 311 4 572 4 20 16 22
Singapore 710 596 588 639 57 112 95 124
Thailand 1 100 1 367 1 629 2 390 6 207 10 939 9 752 9 465
Timor-Leste 45 20 15 12 0 0 0 0
Viet Nam 859 1 502 2 940 3 885 3 486 4 748 5 969 6 886
Southern Asia 16 035 18 574 20 449 16 221 4 929 10 029 8 350 10 372
Afghanistan 1 178 2 046 1 457 803 0 0 0 0
Bangladesh 2 496 4 236 3 027 4 569 1 9 5 4Bhutan 57 8 5 68 9 0 0 1
India 55 22 200 205 2 822 6 499 5 090 4 889
Iran (Islamic Republic of) 9 928 8 960 11 195 8 878 7 162 88 653
Maldives 35 52 49 48 0 0 0 0
Nepal 203 134 150 254 0 5 54 6
Pakistan 1 054 1 971 3 174 261 2 087 3 205 2 978 4 422
Sri Lanka 1 029 1 144 1 192 1 137 2 149 135 398
Western Asia 31 404 41 096 42 629 41 289 3 297 3 478 5 274 6 303
Armenia 467 416 446 440 0 0 0 0
Azerbaijan 766 1 580 1 085 1 510 3 42 19 0
Bahrain 123 134 143 175 6 0 0 0
Cyprus 655 569 575 507 0 21 7 9
Georgia 1 025 625 646 760 21 20 22 48
Iraq 4 589 4 722 5 317 4 223 0 0 0 0
Israel 2 999 2 894 3 324 3 312 0 40 24 37
Jordan 1 537 2 231 1 756 1 391 4 21 49 14
Kuwait 740 889 974 825 31 2 50 45
Lebanon 830 856 1 056 996 2 65 34 42
Occupied Palestinian Territory 495 639 632 373 7 13 8 16
Oman 578 646 534 738 202 122 95 15
Qatar 143 472 455 475 2 5 4 6
Saudi Arabia 7 582 10 649 10 207 12 224 7 13 9 48
Syrian Arab Republic 1 731 2 698 4 421 3 496 2 391 227 32
Turkey 2 682 5 360 4 191 3 460 2 503 1 752 3 500 4 375
United Arab Emirates 1 827 2 860 3 103 2 811 502 872 1 082 1 477
Yemen 2 635 2 854 3 764 3 573 4 98 142 138
Europe 54 696 72 929 72 005 71 664 73 619 105 761 134 690 118 369
Eastern Europe 11 193 6 850 4 757 4 582 7 226 45 586 69 463 46 756
Belarus 2 174 525 272 158 54 16 11 39
Bulgaria 163 269 174 181 809 2 524 2 855 3 533
Czech Republic 197 288 248 234 1 173 1 407 2 624 1 957
Hungary 104 220 211 273 1 934 6 201 6 312 6 576
Poland 1 864 2 496 1 328 1 339 18 720 3 286 2 034
Republic of Moldova 49 133 98 76 58 239 550 342
Romania 537 1 320 1 657 1 411 351 3 341 4 612 5 399
Russian Federation 4 851 979 431 450 1 263 14 121 22 315 14 001
Slovakia 233 501 238 367 280 500 911 800
Ukraine 1 021 120 100 92 1 286 16 518 25 987 12 075
Northern Europe 5 849 8 055 7 050 6 930 9 536 9 565 10 495 12 067
Åland Islands
Channel Islands 0 0 0 0 0 0 0 0
Denmark 702 1 716 1 001 868 1 975 1 000 1 909 2 472
Estonia 210 113 69 105 23 282 227 246
Faroe Islands 8 14 13 13 0 0 0 0
Finland 330 161 131 101 277 608 472 723
Guernsey
Iceland 64 77 75 70 0 0 0 0
186
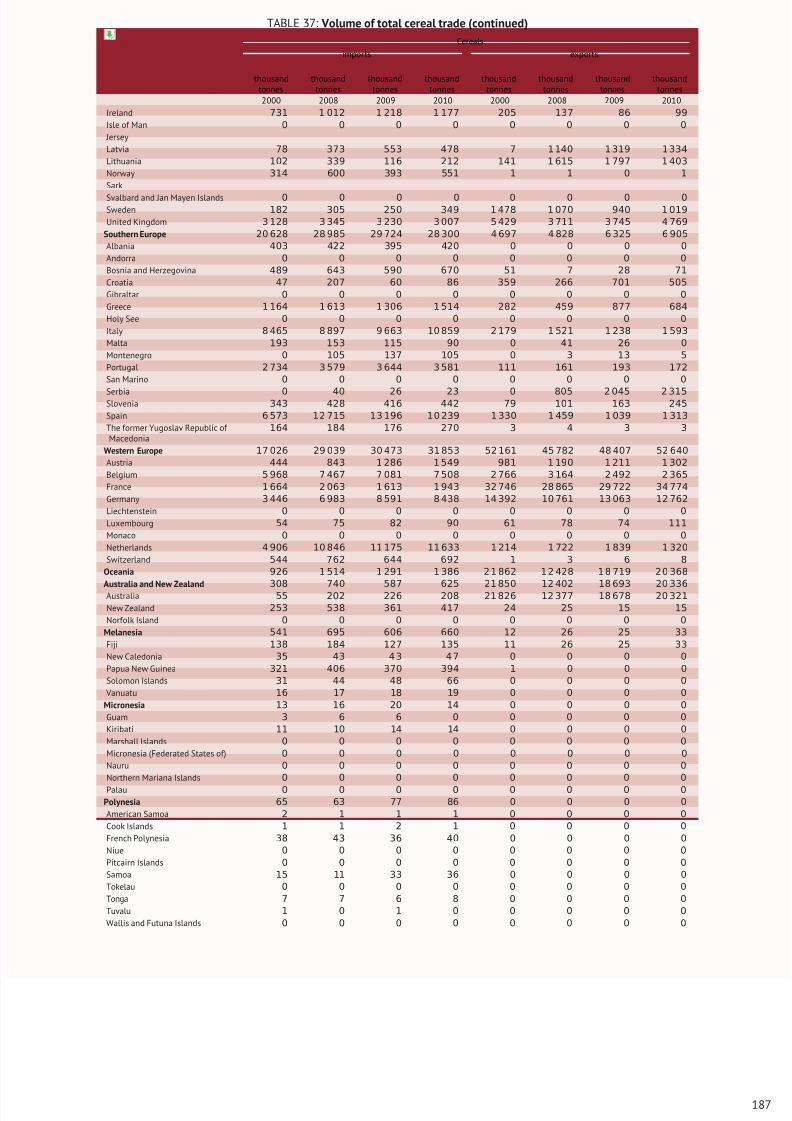
8/16/2019 Informe de la Fao 2013
http://slidepdf.com/reader/full/informe-de-la-fao-2013 205/307
TABLE 37: Volume of total cereal trade (continued)
Cereals
imports exports
thousandtonnes
thousandtonnes
thousandtonnes
thousandtonnes
thousandtonnes
thousandtonnes
thousandtonnes
thousandtonnes
2000 2008 2009 2010 2000 2008 2009 2010
Ireland 731 1 012 1 218 1 177 205 137 86 99
Isle of Man 0 0 0 0 0 0 0 0
Jersey
Latvia 78 373 553 478 7 1 140 1 319 1 334
Lithuania 102 339 116 212 141 1 615 1 797 1 403
Norway 314 600 393 551 1 1 0 1
Sark
Svalbard and Jan Mayen Islands 0 0 0 0 0 0 0 0Sweden 182 305 250 349 1 478 1 070 940 1 019
United Kingdom 3 128 3 345 3 230 3 007 5 429 3 711 3 745 4 769
Southern Europe 20 628 28 985 29 724 28 300 4 697 4 828 6 325 6 905
Albania 403 422 395 420 0 0 0 0
Andorra 0 0 0 0 0 0 0 0
Bosnia and Herzegovina 489 643 590 670 51 7 28 71
Croatia 47 207 60 86 359 266 701 505
Gibraltar 0 0 0 0 0 0 0 0
Greece 1 164 1 613 1 306 1 514 282 459 877 684
Holy See 0 0 0 0 0 0 0 0
Italy 8 465 8 897 9 663 10 859 2 179 1 521 1 238 1 593
Malta 193 153 115 90 0 41 26 0
Montenegro 0 105 137 105 0 3 13 5
Portugal 2 734 3 579 3 644 3 581 111 161 193 172
San Marino 0 0 0 0 0 0 0 0
Serbia 0 40 26 23 0 805 2 045 2 315Slovenia 343 428 416 442 79 101 163 245
Spain 6 573 12 715 13 196 10 239 1 330 1 459 1 039 1 313
The former Yugoslav Republic of Macedonia
164 184 176 270 3 4 3 3
Western Europe 17 026 29 039 30 473 31 853 52 161 45 782 48 407 52 640
Austria 444 843 1 286 1 549 981 1 190 1 211 1 302
Belgium 5 968 7 467 7 081 7 508 2 766 3 164 2 492 2 365
France 1 664 2 063 1 613 1 943 32 746 28 865 29 722 34 774
Germany 3 446 6 983 8 591 8 438 14 392 10 761 13 063 12 762
Liechtenstein 0 0 0 0 0 0 0 0
Luxembourg 54 75 82 90 61 78 74 111
Monaco 0 0 0 0 0 0 0 0
Netherlands 4 906 10 846 11 175 11 633 1 214 1 722 1 839 1 320
Switzerland 544 762 644 692 1 3 6 8
Oceania 926 1 514 1 291 1 386 2 1 862 1 2 428 1 8 719 2 0 368
Australia and New Zealand 308 740 587 625 21 850 12 402 18 693 20 336
Australia 55 202 226 208 21 826 12 377 18 678 20 321
New Zealand 253 538 361 417 24 25 15 15
Norfolk Island 0 0 0 0 0 0 0 0
Melanesia 541 695 606 660 12 26 25 33
Fiji 138 184 127 135 11 26 25 33
New Caledonia 35 43 4 3 4 7 0 0 0 0
Papua New Guinea 321 406 370 394 1 0 0 0
Solomon Islands 31 44 48 66 0 0 0 0
Vanuatu 16 17 18 19 0 0 0 0
Micronesia 13 16 20 14 0 0 0 0
Guam 3 6 6 0 0 0 0 0
Kiribati 11 10 14 14 0 0 0 0
Marshall Islands 0 0 0 0 0 0 0 0
Micronesia (Federated States of) 0 0 0 0 0 0 0 0
Nauru 0 0 0 0 0 0 0 0
Northern Mariana Islands 0 0 0 0 0 0 0 0
Palau 0 0 0 0 0 0 0 0
Polynesia 65 63 77 86 0 0 0 0
American Samoa 2 1 1 1 0 0 0 0
Cook Islands 1 1 2 1 0 0 0 0
French Polynesia 38 43 36 40 0 0 0 0
Niue 0 0 0 0 0 0 0 0
Pitcairn Islands 0 0 0 0 0 0 0 0
Samoa 15 11 33 36 0 0 0 0
Tokelau 0 0 0 0 0 0 0 0
Tonga 7 7 6 8 0 0 0 0
Tuvalu 1 0 1 0 0 0 0 0
Wallis and Futuna Islands 0 0 0 0 0 0 0 0
187
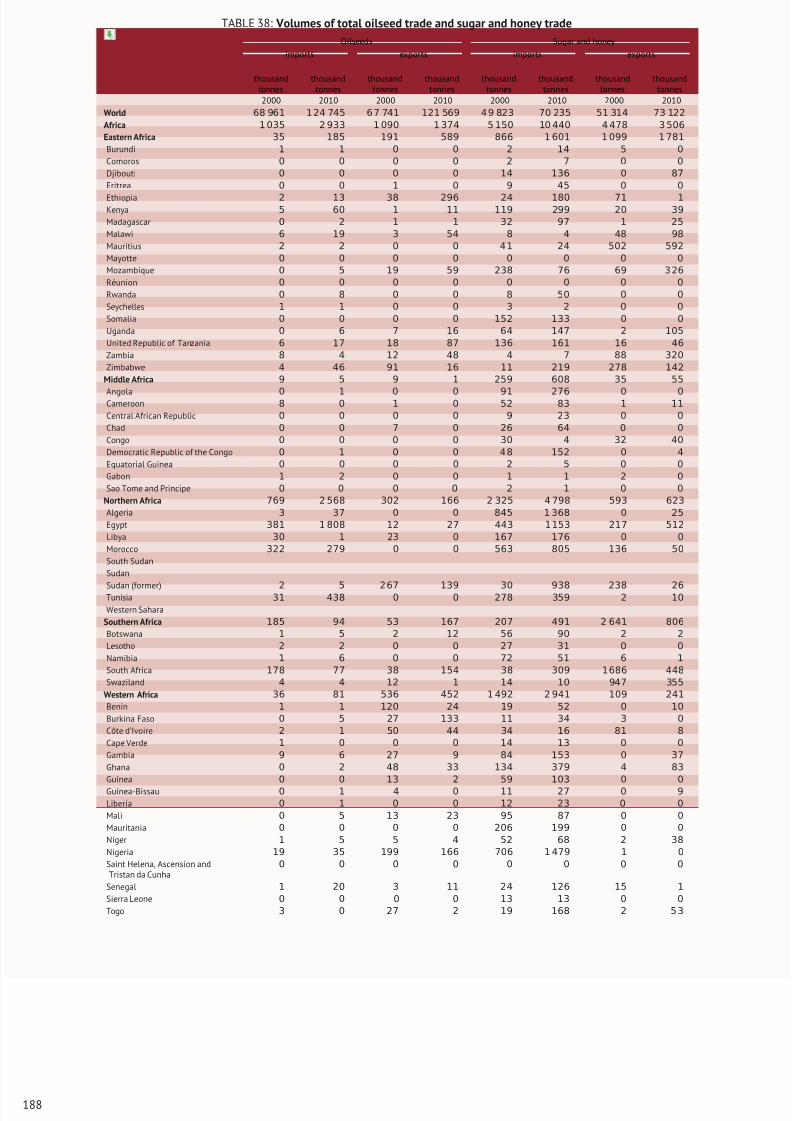
8/16/2019 Informe de la Fao 2013
http://slidepdf.com/reader/full/informe-de-la-fao-2013 206/307
TABLE 38: Volumes of total oilseed trade and sugar and honey trade
Oilseeds Sugar and honey
imports exports imports exports
thousandtonnes
thousandtonnes
thousandtonnes
thousandtonnes
thousandtonnes
thousandtonnes
thousandtonnes
thousandtonnes
2000 2010 2000 2010 2000 2010 2000 2010
World 68 961 1 24 745 6 7 741 121 569 4 9 823 70 235 51 314 73 122
Africa 1 035 2 933 1 090 1 374 5 150 10 440 4 478 3 506
Eastern Africa 35 185 191 589 866 1 601 1 099 1 781
Burundi 1 1 0 0 2 14 5 0
Comoros 0 0 0 0 2 7 0 0
Djibouti 0 0 0 0 14 136 0 87
Eritrea 0 0 1 0 9 45 0 0
Ethiopia 2 13 38 296 24 180 71 1Kenya 5 60 1 11 119 299 20 39
Madagascar 0 2 1 1 32 97 1 25
Malawi 6 19 3 54 8 4 48 98
Mauritius 2 2 0 0 4 1 24 502 592
Mayotte 0 0 0 0 0 0 0 0
Mozambique 0 5 19 59 238 76 69 3 26
Réunion 0 0 0 0 0 0 0 0
Rwanda 0 8 0 0 8 50 0 0
Seychelles 1 1 0 0 3 2 0 0
Somalia 0 0 0 0 152 133 0 0
Uganda 0 6 7 16 64 147 2 105
United Republic of Tanzania 6 17 18 87 136 161 16 46
Zambia 8 4 12 48 4 7 88 320
Zimbabwe 4 46 91 16 11 219 278 142
Middle Africa 9 5 9 1 259 608 35 55
Angola 0 1 0 0 91 276 0 0Cameroon 8 0 1 0 52 83 1 11
Central African Republic 0 0 0 0 9 23 0 0
Chad 0 0 7 0 26 64 0 0
Congo 0 0 0 0 30 4 32 40
Democratic Republic of the Congo 0 1 0 0 4 8 152 0 4
Equatorial Guinea 0 0 0 0 2 5 0 0
Gabon 1 2 0 0 1 1 2 0
Sao Tome and Principe 0 0 0 0 2 1 0 0
Northern Africa 769 2 568 302 166 2 325 4 798 593 623
Algeria 3 37 0 0 845 1 368 0 25
Egypt 381 1 808 12 27 443 1 153 217 512
Libya 30 1 23 0 167 176 0 0
Morocco 322 279 0 0 563 805 136 50
South Sudan
Sudan
Sudan (former) 2 5 2 67 139 30 938 238 26
Tunisia 31 438 0 0 278 359 2 10
Western Sahara
Southern Africa 185 94 53 167 207 491 2 641 806
Botswana 1 5 2 12 56 90 2 2
Lesotho 2 2 0 0 27 31 0 0
Namibia 1 6 0 0 72 51 6 1
South Africa 178 77 38 154 38 309 1686 448
Swaziland 4 4 12 1 14 10 947 355
Western Africa 36 81 536 452 1 492 2 941 109 241
Benin 1 1 120 24 19 52 0 10
Burkina Faso 0 5 27 133 11 34 3 0
Côte d’Ivoire 2 1 50 44 34 16 81 8
Cape Verde 1 0 0 0 14 13 0 0
Gambia 9 6 27 9 84 153 0 37
Ghana 0 2 48 33 134 379 4 83
Guinea 0 0 13 2 59 103 0 0
Guinea-Bissau 0 1 4 0 11 27 0 9
Liberia 0 1 0 0 12 23 0 0
Mali 0 5 13 23 95 87 0 0
Mauritania 0 0 0 0 206 199 0 0
Niger 1 5 5 4 52 68 2 38
Nigeria 19 35 199 166 706 1 479 1 0
Saint Helena, Ascension andTristan da Cunha
0 0 0 0 0 0 0 0
Senegal 1 20 3 11 24 126 15 1
Sierra Leone 0 0 0 0 13 13 0 0
Togo 3 0 27 2 19 168 2 5 3
188
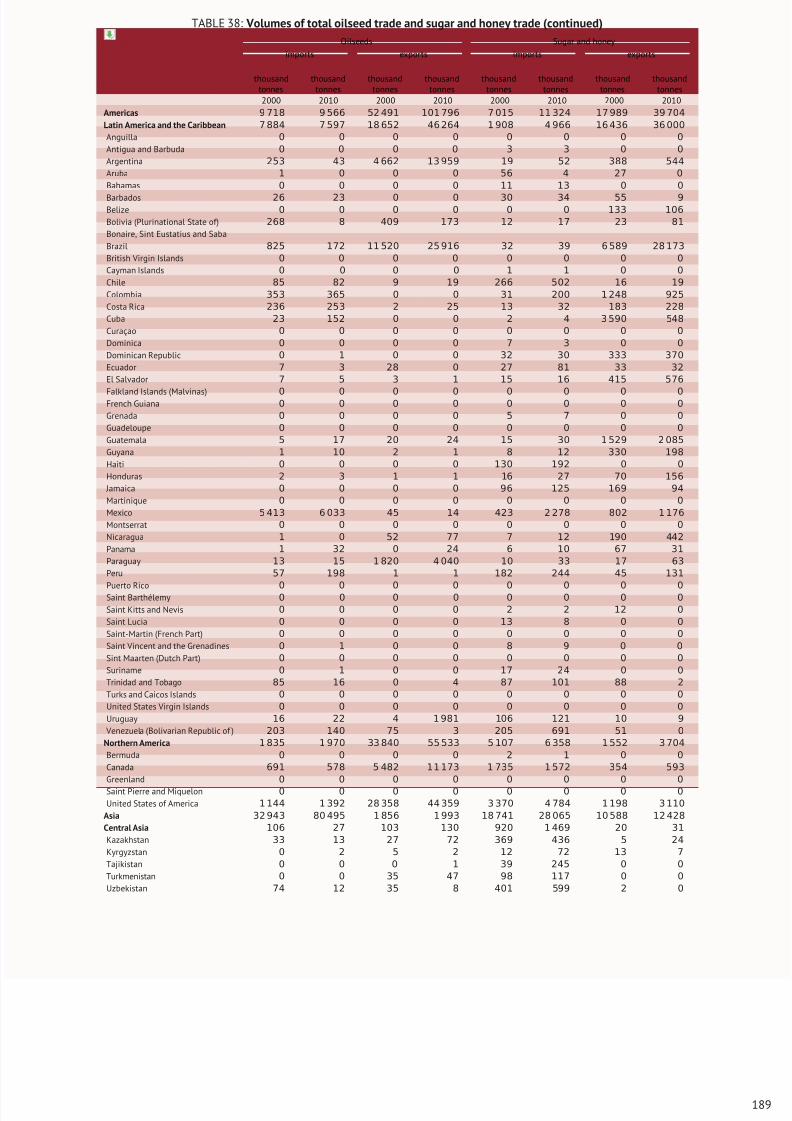
8/16/2019 Informe de la Fao 2013
http://slidepdf.com/reader/full/informe-de-la-fao-2013 207/307
TABLE 38: Volumes of total oilseed trade and sugar and honey trade (continued)
Oilseeds Sugar and honey
imports exports imports exports
thousandtonnes
thousandtonnes
thousandtonnes
thousandtonnes
thousandtonnes
thousandtonnes
thousandtonnes
thousandtonnes
2000 2010 2000 2010 2000 2010 2000 2010
Americas 9 718 9 566 52 491 101 796 7 015 11 324 17 989 39 704
Latin America and the Caribbean 7 884 7 597 18 652 46 264 1 908 4 966 16 436 36 000
Anguilla 0 0 0 0 0 0 0 0
Antigua and Barbuda 0 0 0 0 3 3 0 0
Argentina 253 43 4 662 13 959 19 52 388 544
Aruba 1 0 0 0 56 4 27 0
Bahamas 0 0 0 0 11 13 0 0
Barbados 26 23 0 0 30 34 55 9Belize 0 0 0 0 0 0 133 106
Bolivia (Plurinational State of) 268 8 409 173 12 17 23 81
Bonaire, Sint Eustatius and Saba
Brazil 825 172 11 520 25 916 32 39 6 589 28 173
British Virgin Islands 0 0 0 0 0 0 0 0
Cayman Islands 0 0 0 0 1 1 0 0
Chile 85 82 9 19 266 502 16 19
Colombia 353 365 0 0 31 200 1 248 925
Costa Rica 236 253 2 25 13 32 183 228
Cuba 23 152 0 0 2 4 3 590 548
Curaçao 0 0 0 0 0 0 0 0
Dominica 0 0 0 0 7 3 0 0
Dominican Republic 0 1 0 0 32 30 333 370
Ecuador 7 3 28 0 27 81 33 32
El Salvador 7 5 3 1 15 16 415 576
Falkland Islands (Malvinas) 0 0 0 0 0 0 0 0French Guiana 0 0 0 0 0 0 0 0
Grenada 0 0 0 0 5 7 0 0
Guadeloupe 0 0 0 0 0 0 0 0
Guatemala 5 17 20 24 15 30 1 529 2 085
Guyana 1 10 2 1 8 12 330 198
Haiti 0 0 0 0 130 192 0 0
Honduras 2 3 1 1 16 27 70 156
Jamaica 0 0 0 0 96 125 169 94
Martinique 0 0 0 0 0 0 0 0
Mexico 5 413 6 033 45 14 423 2 278 802 1 176
Montserrat 0 0 0 0 0 0 0 0
Nicaragua 1 0 52 77 7 12 190 442
Panama 1 32 0 24 6 10 67 31
Paraguay 13 15 1 820 4 040 10 33 17 63
Peru 57 198 1 1 182 244 45 131
Puerto Rico 0 0 0 0 0 0 0 0
Saint Barthélemy 0 0 0 0 0 0 0 0
Saint Kitts and Nevis 0 0 0 0 2 2 12 0
Saint Lucia 0 0 0 0 13 8 0 0
Saint-Martin (French Part) 0 0 0 0 0 0 0 0
Saint Vincent and the Grenadines 0 1 0 0 8 9 0 0
Sint Maarten (Dutch Part) 0 0 0 0 0 0 0 0
Suriname 0 1 0 0 17 24 0 0
Trinidad and Tobago 85 16 0 4 87 101 88 2
Turks and Caicos Islands 0 0 0 0 0 0 0 0
United States Virgin Islands 0 0 0 0 0 0 0 0
Uruguay 16 22 4 1 981 106 121 10 9
Venezuela (Bolivarian Republic of ) 203 140 75 3 205 691 51 0
Northern America 1 835 1 970 33 840 55 533 5 107 6 358 1 552 3 704
Bermuda 0 0 0 0 2 1 0 0
Canada 691 578 5 482 11 173 1 735 1 572 354 593
Greenland 0 0 0 0 0 0 0 0
Saint Pierre and Miquelon 0 0 0 0 0 0 0 0
United States of America 1 144 1 392 28 358 44 359 3 370 4 784 1 198 3 110
Asia 32 943 80 495 1 856 1 993 18 741 28 065 10 588 12 428
Central Asia 106 27 103 130 920 1 469 20 31
Kazakhstan 33 13 27 72 369 436 5 24
Kyrgyzstan 0 2 5 2 12 72 13 7
Tajikistan 0 0 0 1 39 245 0 0
Turkmenistan 0 0 35 47 98 117 0 0
Uzbekistan 74 12 35 8 401 599 2 0
189
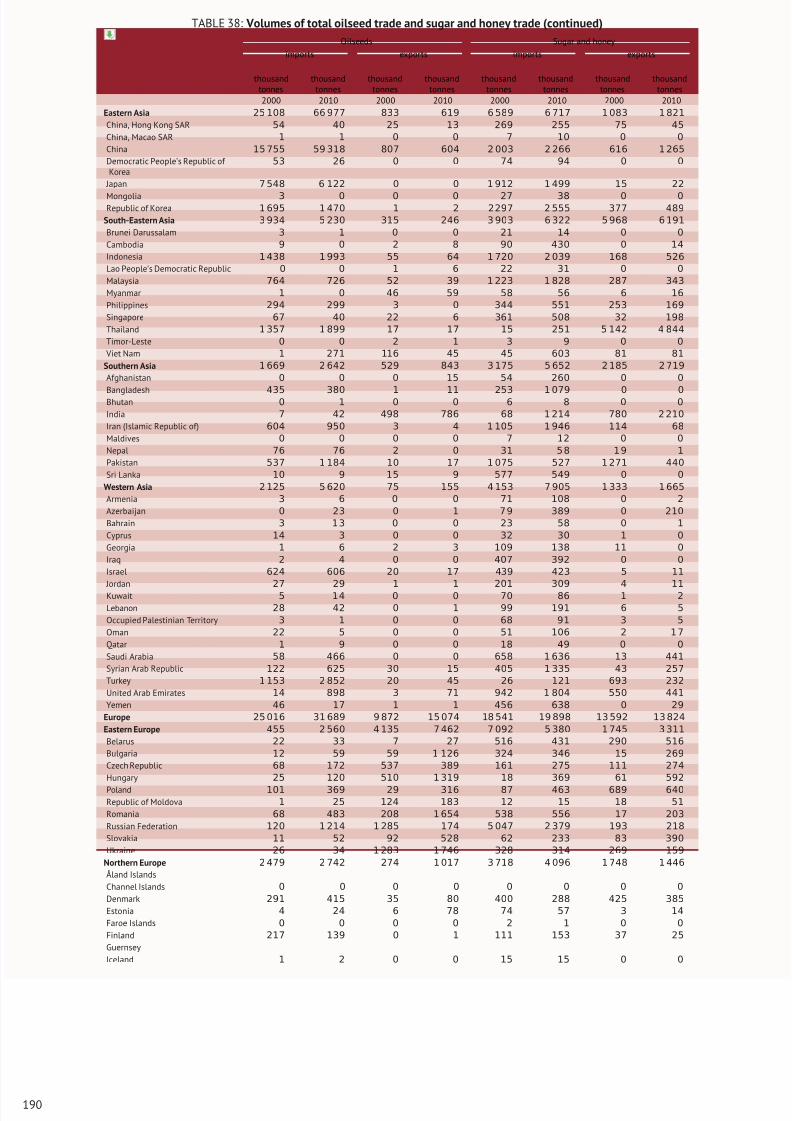
8/16/2019 Informe de la Fao 2013
http://slidepdf.com/reader/full/informe-de-la-fao-2013 208/307
TABLE 38: Volumes of total oilseed trade and sugar and honey trade (continued)
Oilseeds Sugar and honey
imports exports imports exports
thousandtonnes
thousandtonnes
thousandtonnes
thousandtonnes
thousandtonnes
thousandtonnes
thousandtonnes
thousandtonnes
2000 2010 2000 2010 2000 2010 2000 2010
Eastern Asia 25 108 66 977 833 619 6 589 6 717 1 083 1 821
China, Hong Kong SAR 54 40 25 13 269 255 75 45
China, Macao SAR 1 1 0 0 7 10 0 0
China 15 755 59 318 807 604 2 003 2 266 616 1 265
Democratic People’s Republic of Korea
53 26 0 0 74 94 0 0
Japan 7 548 6 122 0 0 1 912 1 499 15 22
Mongolia 3 0 0 0 27 38 0 0Republic of Korea 1 695 1 470 1 2 2297 2 555 377 489
South-Eastern Asia 3 934 5 230 315 246 3 903 6 322 5 968 6 191
Brunei Darussalam 3 1 0 0 21 14 0 0
Cambodia 9 0 2 8 90 430 0 14
Indonesia 1 438 1 993 55 64 1 720 2 039 168 526
Lao People’s Democratic Republic 0 0 1 6 22 31 0 0
Malaysia 764 726 52 39 1 223 1 828 287 343
Myanmar 1 0 46 59 58 56 6 16
Philippines 294 299 3 0 344 551 253 169
Singapore 67 40 22 6 361 508 32 198
Thailand 1 357 1 899 17 17 15 251 5 142 4 844
Timor-Leste 0 0 2 1 3 9 0 0
Viet Nam 1 271 116 45 45 603 81 81
Southern Asia 1 669 2 642 529 843 3 175 5 652 2 185 2 719
Afghanistan 0 0 0 15 54 260 0 0
Bangladesh 435 380 1 11 253 1 079 0 0Bhutan 0 1 0 0 6 8 0 0
India 7 42 498 786 68 1 214 780 2 210
Iran (Islamic Republic of) 604 950 3 4 1 105 1 946 114 68
Maldives 0 0 0 0 7 12 0 0
Nepal 76 76 2 0 31 5 8 1 9 1
Pakistan 537 1 184 10 17 1 075 527 1 271 440
Sri Lanka 10 9 15 9 577 549 0 0
Western Asia 2 125 5 620 75 155 4 153 7 905 1 333 1 665
Armenia 3 6 0 0 71 108 0 2
Azerbaijan 0 23 0 1 7 9 389 0 210
Bahrain 3 1 3 0 0 23 58 0 1
Cyprus 14 3 0 0 32 30 1 0
Georgia 1 6 2 3 109 138 11 0
Iraq 2 4 0 0 407 392 0 0
Israel 624 606 20 17 439 423 5 11
Jordan 27 29 1 1 201 309 4 11
Kuwait 5 14 0 0 70 86 1 2
Lebanon 28 42 0 1 99 191 6 5
Occupied Palestinian Territory 3 1 0 0 68 91 3 5
Oman 22 5 0 0 51 106 2 1 7
Qatar 1 9 0 0 18 49 0 0
Saudi Arabia 58 466 0 0 658 1 636 13 441
Syrian Arab Republic 122 625 30 15 405 1 335 43 257
Turkey 1 153 2 852 20 45 26 121 693 232
United Arab Emirates 14 898 3 71 942 1 804 550 441
Yemen 46 17 1 1 456 638 0 29
Europe 25 016 31 689 9 872 15 074 18 541 19 898 13 592 13 824
Eastern Europe 455 2 560 4 135 7 462 7 092 5 380 1 745 3 311
Belarus 22 33 7 27 516 431 290 516
Bulgaria 12 59 59 1 126 324 346 15 269
Czech Republic 68 172 537 389 161 275 111 274
Hungary 25 120 510 1 319 18 369 61 592
Poland 101 369 29 316 87 463 689 640
Republic of Moldova 1 25 124 183 12 15 18 51
Romania 68 483 208 1 654 538 556 17 203
Russian Federation 120 1 214 1 285 174 5 047 2 379 193 218
Slovakia 11 52 92 528 62 233 83 390
Ukraine 26 34 1 283 1 746 328 314 269 159
Northern Europe 2 479 2 742 274 1 017 3 718 4 096 1 748 1 446
Åland Islands
Channel Islands 0 0 0 0 0 0 0 0
Denmark 291 415 35 80 400 288 425 385
Estonia 4 24 6 78 74 57 3 14
Faroe Islands 0 0 0 0 2 1 0 0
Finland 217 139 0 1 111 153 37 25
Guernsey
Iceland 1 2 0 0 15 15 0 0
190
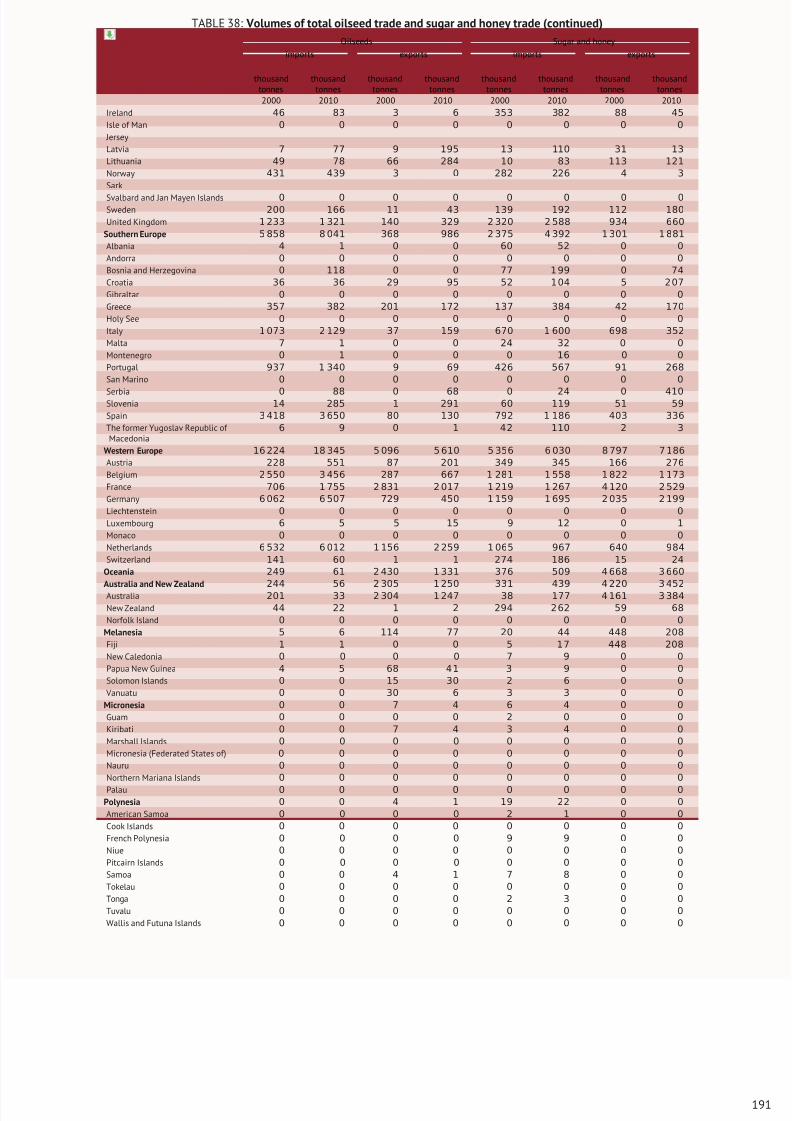
8/16/2019 Informe de la Fao 2013
http://slidepdf.com/reader/full/informe-de-la-fao-2013 209/307
TABLE 38: Volumes of total oilseed trade and sugar and honey trade (continued)
Oilseeds Sugar and honey
imports exports imports exports
thousandtonnes
thousandtonnes
thousandtonnes
thousandtonnes
thousandtonnes
thousandtonnes
thousandtonnes
thousandtonnes
2000 2010 2000 2010 2000 2010 2000 2010
Ireland 46 83 3 6 353 382 88 45
Isle of Man 0 0 0 0 0 0 0 0
Jersey
Latvia 7 77 9 195 13 110 31 13
Lithuania 49 78 66 284 10 83 113 121
Norway 431 439 3 0 282 226 4 3
Sark
Svalbard and Jan Mayen Islands 0 0 0 0 0 0 0 0Sweden 200 166 11 43 139 192 112 180
United Kingdom 1 233 1 321 140 329 2 320 2 588 934 660
Southern Europe 5 858 8 041 368 986 2 375 4 392 1 301 1 881
Albania 4 1 0 0 60 52 0 0
Andorra 0 0 0 0 0 0 0 0
Bosnia and Herzegovina 0 118 0 0 77 1 99 0 74
Croatia 36 36 29 95 52 1 04 5 2 07
Gibraltar 0 0 0 0 0 0 0 0
Greece 357 382 201 172 137 384 42 170
Holy See 0 0 0 0 0 0 0 0
Italy 1 073 2 129 37 159 670 1 600 698 352
Malta 7 1 0 0 24 32 0 0
Montenegro 0 1 0 0 0 16 0 0
Portugal 937 1 340 9 69 426 567 91 268
San Marino 0 0 0 0 0 0 0 0
Serbia 0 88 0 68 0 24 0 410Slovenia 14 285 1 291 60 119 51 59
Spain 3 418 3 650 80 130 792 1 186 403 336
The former Yugoslav Republic of Macedonia
6 9 0 1 42 110 2 3
Western Europe 16 224 18 345 5 096 5 610 5 356 6 030 8 797 7 186
Austria 228 551 87 201 349 345 166 276
Belgium 2 550 3 456 287 667 1 281 1 558 1 822 1 173
France 706 1 755 2 831 2 017 1 219 1 267 4 120 2 529
Germany 6 062 6 507 729 450 1 159 1 695 2 035 2 199
Liechtenstein 0 0 0 0 0 0 0 0
Luxembourg 6 5 5 15 9 12 0 1
Monaco 0 0 0 0 0 0 0 0
Netherlands 6 532 6 012 1 156 2 259 1 065 967 640 984
Switzerland 141 60 1 1 274 186 15 24
Oceania 249 61 2 430 1 331 376 509 4 668 3 660
Australia and New Zealand 244 56 2 305 1 250 331 439 4 220 3 452
Australia 201 33 2 304 1 247 38 177 4 161 3 384
New Zealand 44 22 1 2 294 2 62 59 68
Norfolk Island 0 0 0 0 0 0 0 0
Melanesia 5 6 114 77 20 44 448 208
Fiji 1 1 0 0 5 17 448 208
New Caledonia 0 0 0 0 7 9 0 0
Papua New Guinea 4 5 68 4 1 3 9 0 0
Solomon Islands 0 0 15 30 2 6 0 0
Vanuatu 0 0 30 6 3 3 0 0
Micronesia 0 0 7 4 6 4 0 0
Guam 0 0 0 0 2 0 0 0
Kiribati 0 0 7 4 3 4 0 0
Marshall Islands 0 0 0 0 0 0 0 0
Micronesia (Federated States of) 0 0 0 0 0 0 0 0
Nauru 0 0 0 0 0 0 0 0
Northern Mariana Islands 0 0 0 0 0 0 0 0
Palau 0 0 0 0 0 0 0 0
Polynesia 0 0 4 1 19 22 0 0
American Samoa 0 0 0 0 2 1 0 0
Cook Islands 0 0 0 0 0 0 0 0
French Polynesia 0 0 0 0 9 9 0 0
Niue 0 0 0 0 0 0 0 0
Pitcairn Islands 0 0 0 0 0 0 0 0
Samoa 0 0 4 1 7 8 0 0
Tokelau 0 0 0 0 0 0 0 0
Tonga 0 0 0 0 2 3 0 0
Tuvalu 0 0 0 0 0 0 0 0
Wallis and Futuna Islands 0 0 0 0 0 0 0 0
191
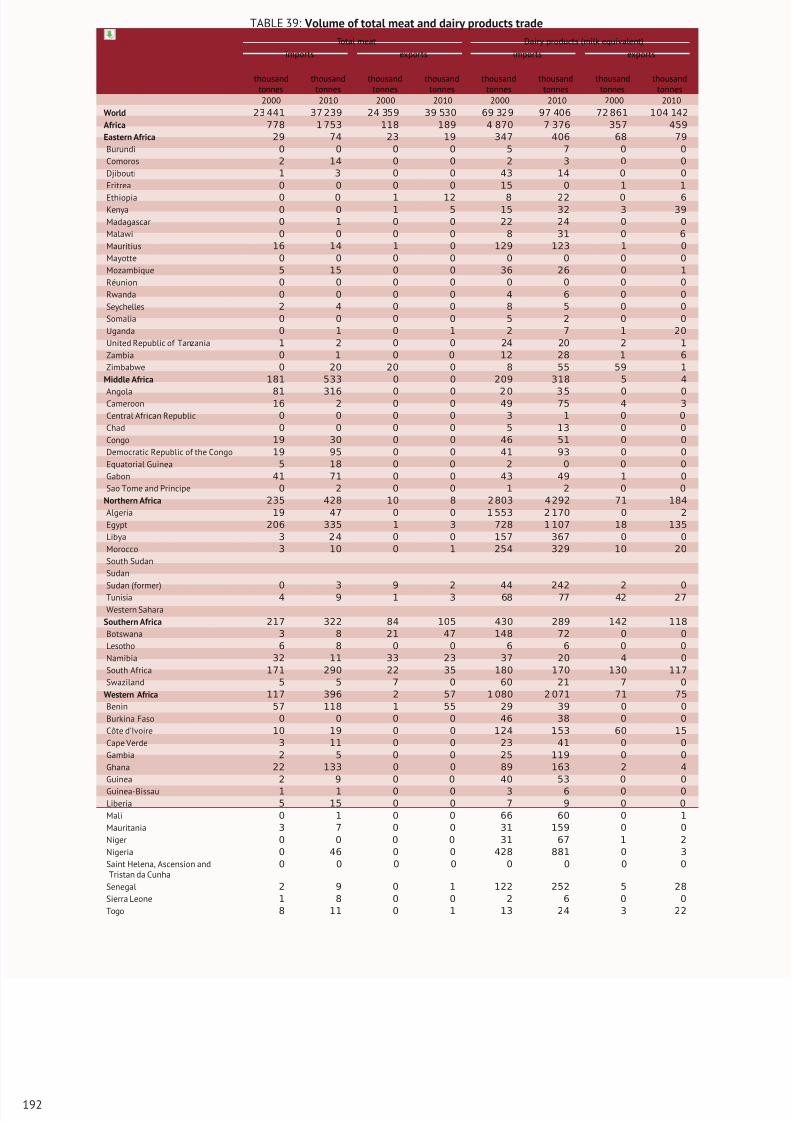
8/16/2019 Informe de la Fao 2013
http://slidepdf.com/reader/full/informe-de-la-fao-2013 210/307
TABLE 39: Volume of total meat and dairy products trade
Total meat Dairy products (milk equivalent)
imports exports imports exports
thousandtonnes
thousandtonnes
thousandtonnes
thousandtonnes
thousandtonnes
thousandtonnes
thousandtonnes
thousandtonnes
2000 2010 2000 2010 2000 2010 2000 2010
World 23 441 37 239 24 359 39 530 69 329 97 406 72 861 104 142
Africa 778 1 753 118 189 4 870 7 376 357 459
Eastern Africa 29 74 23 19 347 406 68 79
Burundi 0 0 0 0 5 7 0 0
Comoros 2 14 0 0 2 3 0 0
Djibouti 1 3 0 0 43 14 0 0
Eritrea 0 0 0 0 15 0 1 1
Ethiopia 0 0 1 12 8 22 0 6Kenya 0 0 1 5 15 32 3 39
Madagascar 0 1 0 0 22 24 0 0
Malawi 0 0 0 0 8 31 0 6
Mauritius 16 14 1 0 129 123 1 0
Mayotte 0 0 0 0 0 0 0 0
Mozambique 5 15 0 0 36 26 0 1
Réunion 0 0 0 0 0 0 0 0
Rwanda 0 0 0 0 4 6 0 0
Seychelles 2 4 0 0 8 5 0 0
Somalia 0 0 0 0 5 2 0 0
Uganda 0 1 0 1 2 7 1 20
United Republic of Tanzania 1 2 0 0 24 20 2 1
Zambia 0 1 0 0 12 28 1 6
Zimbabwe 0 20 20 0 8 55 59 1
Middle Africa 181 533 0 0 209 318 5 4
Angola 81 316 0 0 2 0 3 5 0 0Cameroon 16 2 0 0 49 75 4 3
Central African Republic 0 0 0 0 3 1 0 0
Chad 0 0 0 0 5 13 0 0
Congo 19 30 0 0 46 51 0 0
Democratic Republic of the Congo 19 95 0 0 41 93 0 0
Equatorial Guinea 5 18 0 0 2 0 0 0
Gabon 41 71 0 0 43 49 1 0
Sao Tome and Principe 0 2 0 0 1 2 0 0
Northern Africa 235 428 10 8 2 803 4 292 71 184
Algeria 19 47 0 0 1 553 2 170 0 2
Egypt 206 335 1 3 728 1 107 18 135
Libya 3 2 4 0 0 157 367 0 0
Morocco 3 10 0 1 254 329 10 20
South Sudan
Sudan
Sudan (former) 0 3 9 2 44 242 2 0
Tunisia 4 9 1 3 68 77 42 27
Western Sahara
Southern Africa 217 322 84 105 430 289 142 118
Botswana 3 8 21 47 148 72 0 0
Lesotho 6 8 0 0 6 6 0 0
Namibia 32 11 33 23 37 20 4 0
South Africa 171 290 22 35 180 170 130 117
Swaziland 5 5 7 0 60 21 7 0
Western Africa 117 396 2 57 1 080 2 071 71 75
Benin 57 118 1 55 29 39 0 0
Burkina Faso 0 0 0 0 46 38 0 0
Côte d’Ivoire 10 19 0 0 124 153 60 15
Cape Verde 3 11 0 0 23 41 0 0
Gambia 2 5 0 0 25 119 0 0
Ghana 22 133 0 0 89 163 2 4
Guinea 2 9 0 0 40 53 0 0
Guinea-Bissau 1 1 0 0 3 6 0 0
Liberia 5 15 0 0 7 9 0 0
Mali 0 1 0 0 66 60 0 1
Mauritania 3 7 0 0 31 159 0 0
Niger 0 0 0 0 31 67 1 2
Nigeria 0 46 0 0 428 881 0 3
Saint Helena, Ascension andTristan da Cunha
0 0 0 0 0 0 0 0
Senegal 2 9 0 1 122 252 5 28
Sierra Leone 1 8 0 0 2 6 0 0
Togo 8 11 0 1 13 24 3 22
192
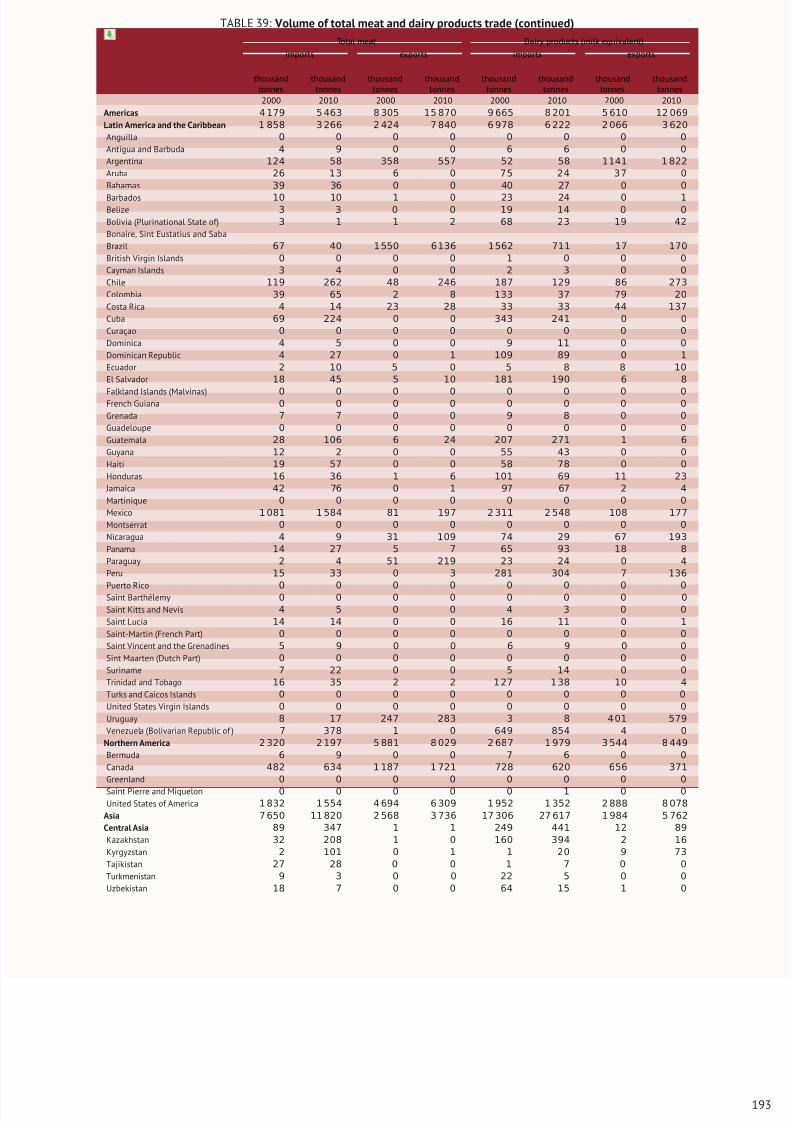
8/16/2019 Informe de la Fao 2013
http://slidepdf.com/reader/full/informe-de-la-fao-2013 211/307
TABLE 39: Volume of total meat and dairy products trade (continued)
Total meat Dairy products (milk equivalent)
imports exports imports exports
thousandtonnes
thousandtonnes
thousandtonnes
thousandtonnes
thousandtonnes
thousandtonnes
thousandtonnes
thousandtonnes
2000 2010 2000 2010 2000 2010 2000 2010
Americas 4 179 5 463 8 305 15 870 9 665 8 201 5 610 12 069
Latin America and the Caribbean 1 858 3 266 2 424 7 840 6 978 6 222 2 066 3 620
Anguilla 0 0 0 0 0 0 0 0
Antigua and Barbuda 4 9 0 0 6 6 0 0
Argentina 124 58 358 557 52 58 1141 1 822
Aruba 26 13 6 0 75 24 37 0
Bahamas 39 36 0 0 40 27 0 0
Barbados 10 10 1 0 23 24 0 1Belize 3 3 0 0 19 14 0 0
Bolivia (Plurinational State of) 3 1 1 2 68 23 19 42
Bonaire, Sint Eustatius and Saba
Brazil 67 40 1 550 6 136 1562 711 17 170
British Virgin Islands 0 0 0 0 1 0 0 0
Cayman Islands 3 4 0 0 2 3 0 0
Chile 119 262 48 246 187 129 86 273
Colombia 39 65 2 8 133 37 79 20
Costa Rica 4 14 23 28 33 33 44 137
Cuba 69 224 0 0 343 241 0 0
Curaçao 0 0 0 0 0 0 0 0
Dominica 4 5 0 0 9 11 0 0
Dominican Republic 4 27 0 1 109 89 0 1
Ecuador 2 10 5 0 5 8 8 10
El Salvador 18 45 5 10 181 190 6 8
Falkland Islands (Malvinas) 0 0 0 0 0 0 0 0French Guiana 0 0 0 0 0 0 0 0
Grenada 7 7 0 0 9 8 0 0
Guadeloupe 0 0 0 0 0 0 0 0
Guatemala 28 106 6 24 207 271 1 6
Guyana 12 2 0 0 55 43 0 0
Haiti 19 57 0 0 58 78 0 0
Honduras 16 36 1 6 101 69 11 23
Jamaica 42 76 0 1 97 67 2 4
Martinique 0 0 0 0 0 0 0 0
Mexico 1 081 1 584 81 197 2 311 2 548 108 177
Montserrat 0 0 0 0 0 0 0 0
Nicaragua 4 9 31 109 74 29 67 193
Panama 14 27 5 7 65 93 18 8
Paraguay 2 4 51 219 23 24 0 4
Peru 15 33 0 3 281 304 7 136
Puerto Rico 0 0 0 0 0 0 0 0
Saint Barthélemy 0 0 0 0 0 0 0 0
Saint Kitts and Nevis 4 5 0 0 4 3 0 0
Saint Lucia 14 14 0 0 16 11 0 1
Saint-Martin (French Part) 0 0 0 0 0 0 0 0
Saint Vincent and the Grenadines 5 9 0 0 6 9 0 0
Sint Maarten (Dutch Part) 0 0 0 0 0 0 0 0
Suriname 7 22 0 0 5 14 0 0
Trinidad and Tobago 16 35 2 2 1 27 1 38 10 4
Turks and Caicos Islands 0 0 0 0 0 0 0 0
United States Virgin Islands 0 0 0 0 0 0 0 0
Uruguay 8 17 247 283 3 8 4 01 579
Venezuela (Bolivarian Republic of ) 7 378 1 0 649 854 4 0
Northern America 2 320 2 197 5 881 8 029 2 687 1 979 3 544 8 449
Bermuda 6 9 0 0 7 6 0 0
Canada 482 634 1 187 1 721 728 620 656 371
Greenland 0 0 0 0 0 0 0 0
Saint Pierre and Miquelon 0 0 0 0 0 1 0 0
United States of America 1 832 1 554 4 694 6 309 1 952 1 352 2 888 8 078
Asia 7 650 11 820 2 568 3 736 17 306 27 617 1 984 5 762
Central Asia 89 347 1 1 249 441 12 89
Kazakhstan 32 208 1 0 160 394 2 16
Kyrgyzstan 2 101 0 1 1 20 9 73
Tajikistan 27 28 0 0 1 7 0 0
Turkmenistan 9 3 0 0 22 5 0 0
Uzbekistan 18 7 0 0 64 15 1 0
193
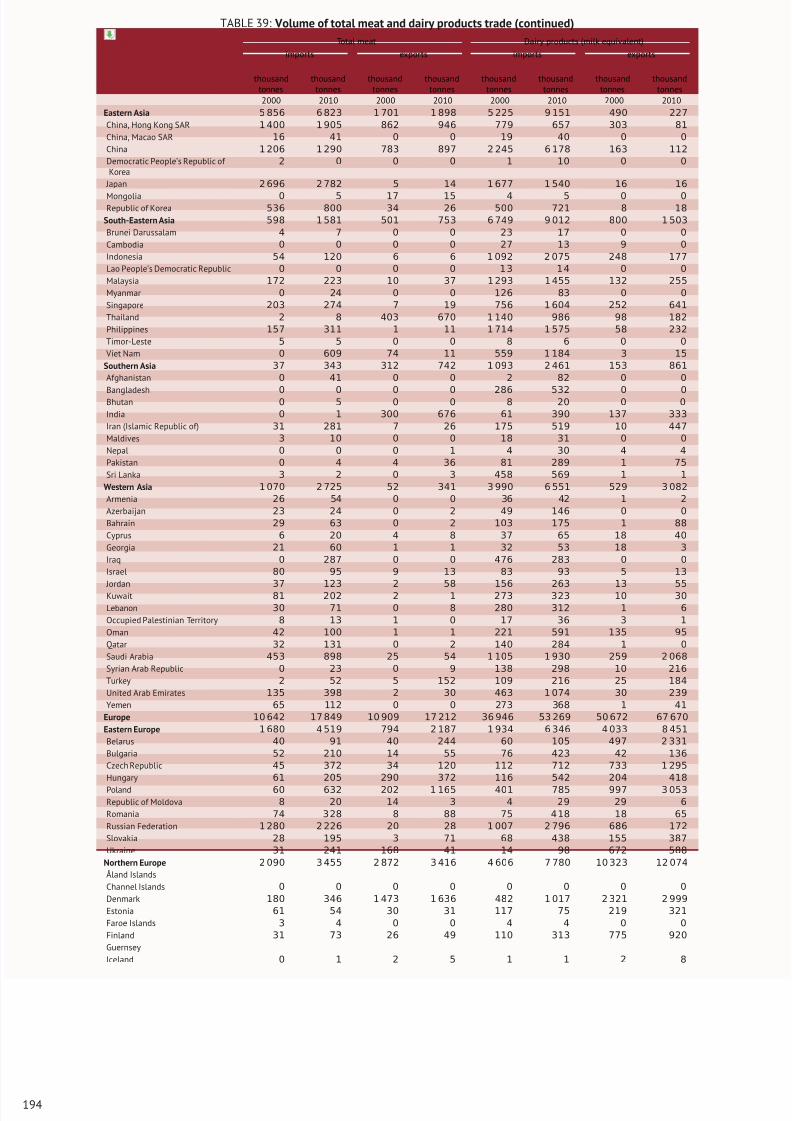
8/16/2019 Informe de la Fao 2013
http://slidepdf.com/reader/full/informe-de-la-fao-2013 212/307
TABLE 39: Volume of total meat and dairy products trade (continued)
Total meat Dairy products (milk equivalent)
imports exports imports exports
thousandtonnes
thousandtonnes
thousandtonnes
thousandtonnes
thousandtonnes
thousandtonnes
thousandtonnes
thousandtonnes
2000 2010 2000 2010 2000 2010 2000 2010
Eastern Asia 5 856 6 823 1 701 1 898 5 225 9 151 490 227
China, Hong Kong SAR 1 400 1 905 862 946 779 657 303 81
China, Macao SAR 16 41 0 0 19 40 0 0
China 1 206 1 290 783 897 2 245 6 178 163 112
Democratic People’s Republic of Korea
2 0 0 0 1 10 0 0
Japan 2 696 2 782 5 14 1 677 1 540 16 16
Mongolia 0 5 17 15 4 5 0 0Republic of Korea 536 800 34 26 500 721 8 18
South-Eastern Asia 598 1 581 501 753 6 749 9 012 800 1 503
Brunei Darussalam 4 7 0 0 23 17 0 0
Cambodia 0 0 0 0 27 13 9 0
Indonesia 54 120 6 6 1 092 2 075 248 177
Lao People’s Democratic Republic 0 0 0 0 1 3 1 4 0 0
Malaysia 172 223 10 37 1 293 1 455 132 255
Myanmar 0 24 0 0 126 83 0 0
Singapore 203 274 7 19 756 1 604 252 641
Thailand 2 8 403 670 1 140 986 98 182
Philippines 157 311 1 11 1 714 1 575 58 232
Timor-Leste 5 5 0 0 8 6 0 0
Viet Nam 0 609 74 11 559 1 184 3 15
Southern Asia 37 343 312 742 1 093 2 461 153 861
Afghanistan 0 41 0 0 2 82 0 0
Bangladesh 0 0 0 0 286 532 0 0Bhutan 0 5 0 0 8 20 0 0
India 0 1 300 676 61 390 137 333
Iran (Islamic Republic of) 31 281 7 26 175 519 10 447
Maldives 3 10 0 0 18 31 0 0
Nepal 0 0 0 1 4 30 4 4
Pakistan 0 4 4 36 81 289 1 75
Sri Lanka 3 2 0 3 458 569 1 1
Western Asia 1 070 2 725 52 341 3 990 6 551 529 3 082
Armenia 26 54 0 0 36 42 1 2
Azerbaijan 23 24 0 2 49 146 0 0
Bahrain 29 63 0 2 103 175 1 88
Cyprus 6 20 4 8 37 65 18 40
Georgia 21 60 1 1 32 53 18 3
Iraq 0 287 0 0 476 283 0 0
Israel 80 95 9 13 83 93 5 13
Jordan 37 123 2 58 156 263 13 55
Kuwait 81 202 2 1 273 323 10 30
Lebanon 30 71 0 8 280 312 1 6
Occupied Palestinian Territory 8 13 1 0 17 36 3 1
Oman 42 100 1 1 221 591 135 95
Qatar 32 131 0 2 140 284 1 0
Saudi Arabia 453 898 25 54 1 105 1 930 259 2 068
Syrian Arab Republic 0 23 0 9 138 298 10 216
Turkey 2 52 5 152 109 216 25 184
United Arab Emirates 135 398 2 30 463 1 074 30 239
Yemen 65 112 0 0 273 368 1 41
Europe 10 642 17 849 10 909 17 212 36 946 53 269 50 672 67 670
Eastern Europe 1 680 4 519 794 2 187 1 934 6 346 4 033 8 451
Belarus 40 91 40 244 60 105 497 2 331
Bulgaria 52 210 14 55 76 423 42 136
Czech Republic 45 372 34 120 112 712 733 1 295
Hungary 61 205 290 372 116 542 204 418
Poland 60 632 202 1 165 401 785 997 3 053
Republic of Moldova 8 20 14 3 4 29 29 6
Romania 74 3 28 8 88 75 4 18 18 65
Russian Federation 1 280 2 226 20 28 1 007 2 796 686 172
Slovakia 28 195 3 71 68 438 155 387
Ukraine 31 241 168 41 14 98 672 588
Northern Europe 2 090 3 455 2 872 3 416 4 606 7 780 10 323 12 074
Åland Islands
Channel Islands 0 0 0 0 0 0 0 0
Denmark 180 346 1 473 1 636 482 1 017 2 321 2 999
Estonia 61 54 30 31 117 75 219 321
Faroe Islands 3 4 0 0 4 4 0 0
Finland 31 73 26 49 110 313 775 920
Guernsey
Iceland 0 1 2 5 1 1 2 8
194
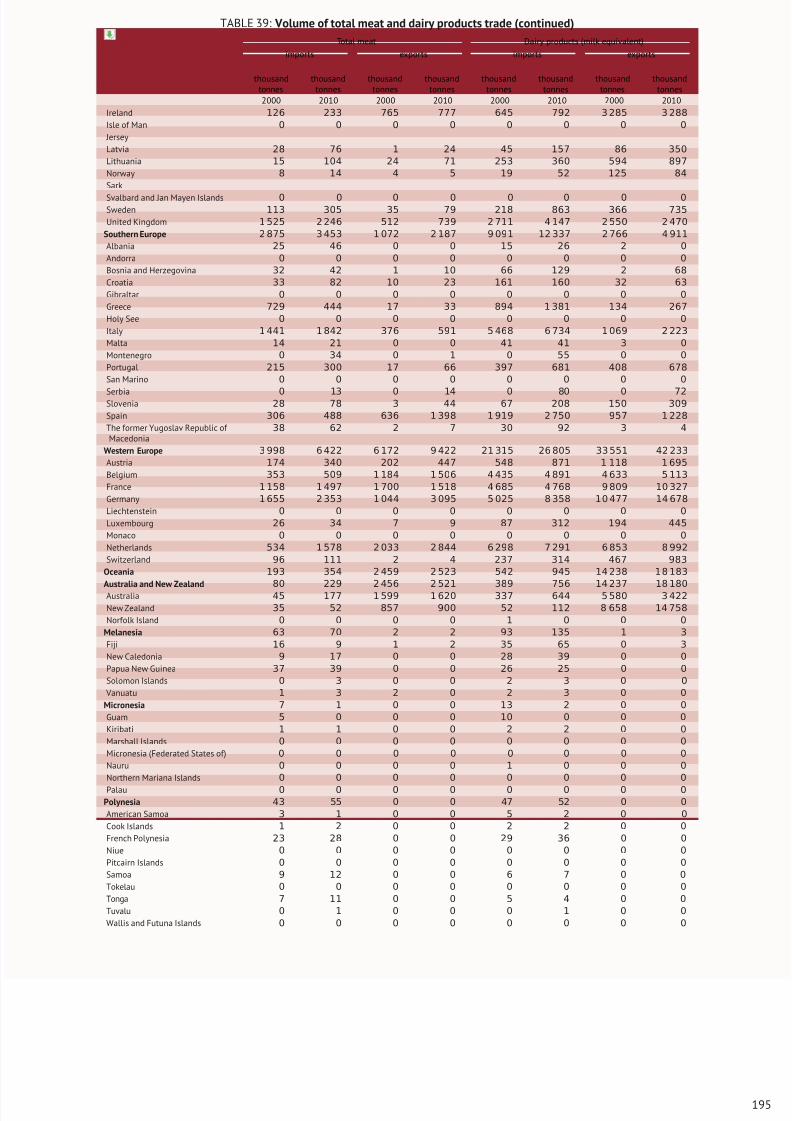
8/16/2019 Informe de la Fao 2013
http://slidepdf.com/reader/full/informe-de-la-fao-2013 213/307
TABLE 39: Volume of total meat and dairy products trade (continued)
Total meat Dairy products (milk equivalent)
imports exports imports exports
thousandtonnes
thousandtonnes
thousandtonnes
thousandtonnes
thousandtonnes
thousandtonnes
thousandtonnes
thousandtonnes
2000 2010 2000 2010 2000 2010 2000 2010
Ireland 126 233 765 777 645 792 3 285 3 288
Isle of Man 0 0 0 0 0 0 0 0
Jersey
Latvia 28 76 1 24 45 157 86 350
Lithuania 15 104 24 71 253 360 594 897
Norway 8 14 4 5 19 52 125 84
Sark
Svalbard and Jan Mayen Islands 0 0 0 0 0 0 0 0Sweden 113 305 35 79 218 863 366 735
United Kingdom 1 525 2 246 512 739 2 711 4 147 2 550 2 470
Southern Europe 2 875 3 453 1 072 2 187 9 091 12 337 2 766 4 911
Albania 25 46 0 0 15 26 2 0
Andorra 0 0 0 0 0 0 0 0
Bosnia and Herzegovina 32 42 1 10 66 129 2 68
Croatia 33 82 10 23 161 160 32 63
Gibraltar 0 0 0 0 0 0 0 0
Greece 729 444 17 33 894 1 381 134 267
Holy See 0 0 0 0 0 0 0 0
Italy 1 441 1 842 376 591 5 468 6 734 1 069 2 223
Malta 14 21 0 0 41 41 3 0
Montenegro 0 34 0 1 0 55 0 0
Portugal 215 300 17 66 397 681 408 678
San Marino 0 0 0 0 0 0 0 0
Serbia 0 13 0 14 0 80 0 72Slovenia 28 78 3 44 67 208 150 309
Spain 306 488 636 1 398 1 919 2 750 957 1 228
The former Yugoslav Republic of Macedonia
38 62 2 7 30 92 3 4
Western Europe 3 998 6 422 6 172 9 422 21 315 26 805 33 551 42 233
Austria 174 340 202 447 548 871 1 118 1 695
Belgium 353 509 1 184 1 506 4 435 4 891 4 633 5 113
France 1 158 1 497 1 700 1 518 4 685 4 768 9 809 10 327
Germany 1 655 2 353 1 044 3 095 5 025 8 358 10 477 14 678
Liechtenstein 0 0 0 0 0 0 0 0
Luxembourg 26 34 7 9 87 312 194 445
Monaco 0 0 0 0 0 0 0 0
Netherlands 534 1 578 2 033 2 844 6 298 7 291 6 853 8 992
Switzerland 96 111 2 4 237 314 467 983
Oceania 193 354 2 459 2 523 542 945 14 238 1 8 183
Australia and New Zealand 80 229 2 456 2 521 389 756 14 237 18 180
Australia 45 177 1 599 1 620 337 644 5 580 3 422
New Zealand 35 52 857 900 52 112 8 658 14 758
Norfolk Island 0 0 0 0 1 0 0 0
Melanesia 63 70 2 2 93 135 1 3
Fiji 16 9 1 2 35 65 0 3
New Caledonia 9 17 0 0 28 39 0 0
Papua New Guinea 37 39 0 0 26 25 0 0
Solomon Islands 0 3 0 0 2 3 0 0
Vanuatu 1 3 2 0 2 3 0 0
Micronesia 7 1 0 0 13 2 0 0
Guam 5 0 0 0 10 0 0 0
Kiribati 1 1 0 0 2 2 0 0
Marshall Islands 0 0 0 0 0 0 0 0
Micronesia (Federated States of) 0 0 0 0 0 0 0 0
Nauru 0 0 0 0 1 0 0 0
Northern Mariana Islands 0 0 0 0 0 0 0 0
Palau 0 0 0 0 0 0 0 0
Polynesia 43 55 0 0 47 52 0 0
American Samoa 3 1 0 0 5 2 0 0
Cook Islands 1 2 0 0 2 2 0 0
French Polynesia 23 28 0 0 29 36 0 0
Niue 0 0 0 0 0 0 0 0
Pitcairn Islands 0 0 0 0 0 0 0 0
Samoa 9 12 0 0 6 7 0 0
Tokelau 0 0 0 0 0 0 0 0
Tonga 7 11 0 0 5 4 0 0
Tuvalu 0 1 0 0 0 1 0 0
Wallis and Futuna Islands 0 0 0 0 0 0 0 0
195
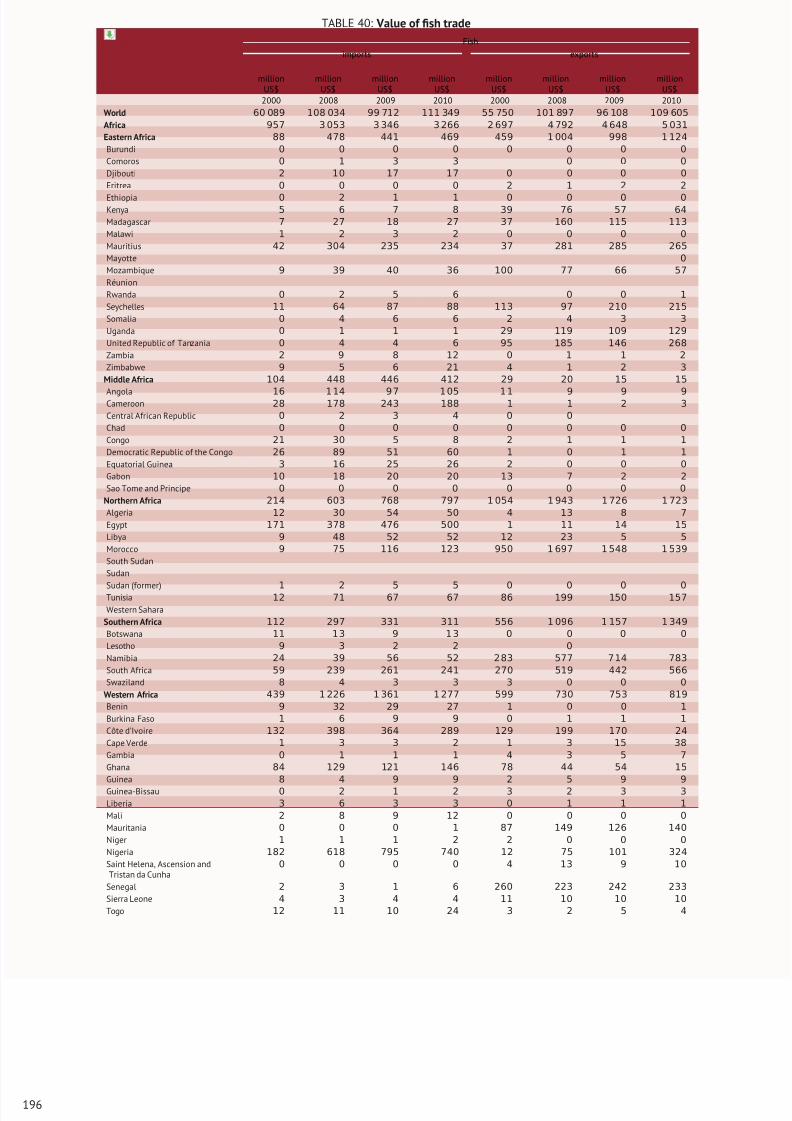
8/16/2019 Informe de la Fao 2013
http://slidepdf.com/reader/full/informe-de-la-fao-2013 214/307
TABLE 40: Value of fish trade
Fish
imports exports
millionUS$
millionUS$
millionUS$
millionUS$
millionUS$
millionUS$
millionUS$
millionUS$
2000 2008 2009 2010 2000 2008 2009 2010
World 60 089 108 034 99 712 111 349 55 750 101 897 96 108 109 605
Africa 957 3 053 3 346 3 266 2 697 4 792 4 648 5 031
Eastern Africa 88 478 441 469 459 1 004 998 1 124
Burundi 0 0 0 0 0 0 0 0
Comoros 0 1 3 3 0 0 0
Djibouti 2 10 17 17 0 0 0 0
Eritrea 0 0 0 0 2 1 2 2
Ethiopia 0 2 1 1 0 0 0 0Kenya 5 6 7 8 39 76 57 64
Madagascar 7 27 18 27 37 160 115 113
Malawi 1 2 3 2 0 0 0 0
Mauritius 42 304 235 234 37 281 285 265
Mayotte 0
Mozambique 9 39 40 36 100 77 66 57
Réunion
Rwanda 0 2 5 6 0 0 1
Seychelles 11 64 87 88 113 97 210 215
Somalia 0 4 6 6 2 4 3 3
Uganda 0 1 1 1 29 119 109 129
United Republic of Tanzania 0 4 4 6 95 185 146 268
Zambia 2 9 8 12 0 1 1 2
Zimbabwe 9 5 6 21 4 1 2 3
Middle Africa 104 448 446 412 29 20 15 15
Angola 16 1 14 9 7 1 05 1 1 9 9 9Cameroon 28 178 243 188 1 1 2 3
Central African Republic 0 2 3 4 0 0
Chad 0 0 0 0 0 0 0 0
Congo 21 30 5 8 2 1 1 1
Democratic Republic of the Congo 26 89 51 60 1 0 1 1
Equatorial Guinea 3 16 25 26 2 0 0 0
Gabon 10 18 20 20 13 7 2 2
Sao Tome and Principe 0 0 0 0 0 0 0 0
Northern Africa 214 603 768 797 1 054 1 943 1 726 1 723
Algeria 12 30 54 50 4 13 8 7
Egypt 171 378 476 500 1 11 14 15
Libya 9 48 52 52 12 23 5 5
Morocco 9 75 116 123 950 1 697 1 548 1 539
South Sudan
Sudan
Sudan (former) 1 2 5 5 0 0 0 0
Tunisia 12 71 67 67 86 199 150 157
Western Sahara
Southern Africa 112 297 331 311 556 1 096 1 157 1 349
Botswana 11 13 9 1 3 0 0 0 0
Lesotho 9 3 2 2 0
Namibia 24 39 56 52 2 83 577 7 14 783
South Africa 59 239 261 241 270 519 442 566
Swaziland 8 4 3 3 3 0 0 0
Western Africa 439 1 226 1 361 1 277 599 730 753 819
Benin 9 32 29 27 1 0 0 1
Burkina Faso 1 6 9 9 0 1 1 1
Côte d’Ivoire 132 398 364 289 129 199 170 24
Cape Verde 1 3 3 2 1 3 15 38
Gambia 0 1 1 1 4 3 5 7
Ghana 84 129 121 146 78 44 54 15
Guinea 8 4 9 9 2 5 9 9
Guinea-Bissau 0 2 1 2 3 2 3 3
Liberia 3 6 3 3 0 1 1 1
Mali 2 8 9 12 0 0 0 0
Mauritania 0 0 0 1 87 149 126 140
Niger 1 1 1 2 2 0 0 0
Nigeria 182 618 795 740 12 75 101 324
Saint Helena, Ascension andTristan da Cunha
0 0 0 0 4 13 9 10
Senegal 2 3 1 6 260 223 242 233
Sierra Leone 4 3 4 4 11 10 10 10
Togo 12 11 10 24 3 2 5 4
196
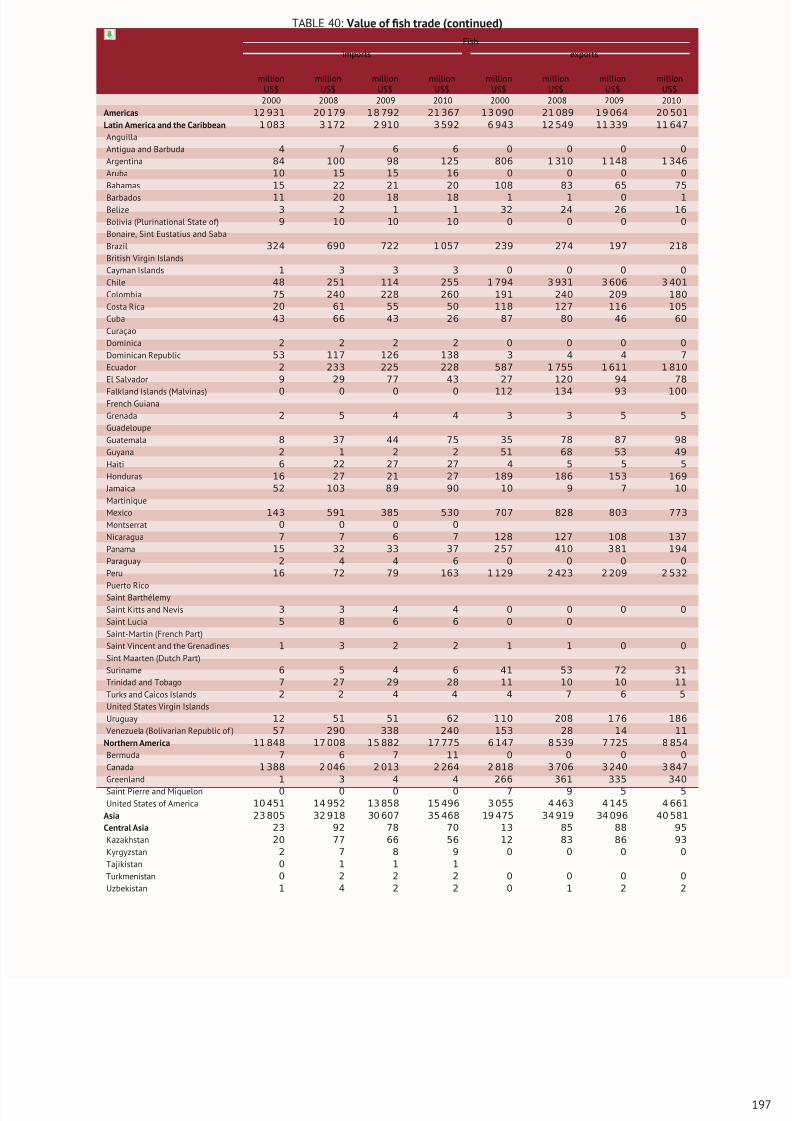
8/16/2019 Informe de la Fao 2013
http://slidepdf.com/reader/full/informe-de-la-fao-2013 215/307
TABLE 40: Value of fish trade (continued)
Fish
imports exports
millionUS$
millionUS$
millionUS$
millionUS$
millionUS$
millionUS$
millionUS$
millionUS$
2000 2008 2009 2010 2000 2008 2009 2010
Americas 12 931 20 179 18 792 21 367 13 090 21 089 1 9 064 20 501
Latin America and the Caribbean 1 083 3 172 2 910 3 592 6 943 12 549 11 339 11 647
Anguilla
Antigua and Barbuda 4 7 6 6 0 0 0 0
Argentina 84 100 98 125 806 1 310 1 148 1 346
Aruba 10 15 15 16 0 0 0 0
Bahamas 15 22 21 20 108 83 65 75
Barbados 11 20 18 18 1 1 0 1Belize 3 2 1 1 32 24 26 16
Bolivia (Plurinational State of) 9 10 10 10 0 0 0 0
Bonaire, Sint Eustatius and Saba
Brazil 324 690 722 1 057 239 274 197 218
British Virgin Islands
Cayman Islands 1 3 3 3 0 0 0 0
Chile 48 251 114 255 1 794 3 931 3 606 3 401
Colombia 75 240 228 260 191 240 209 180
Costa Rica 20 61 55 50 118 127 116 105
Cuba 43 66 43 26 87 80 46 60
Curaçao
Dominica 2 2 2 2 0 0 0 0
Dominican Republic 53 117 126 138 3 4 4 7
Ecuador 2 233 225 228 587 1 755 1 611 1 810
El Salvador 9 29 77 43 27 120 94 78
Falkland Islands (Malvinas) 0 0 0 0 112 134 93 100French Guiana
Grenada 2 5 4 4 3 3 5 5
Guadeloupe
Guatemala 8 37 44 75 35 78 87 98
Guyana 2 1 2 2 51 68 53 49
Haiti 6 22 27 27 4 5 5 5
Honduras 16 27 21 27 189 186 153 169
Jamaica 52 103 8 9 90 10 9 7 10
Martinique
Mexico 143 591 385 530 707 828 803 773
Montserrat 0 0 0 0
Nicaragua 7 7 6 7 128 127 108 137
Panama 15 32 33 37 2 57 410 3 81 194
Paraguay 2 4 4 6 0 0 0 0
Peru 16 72 79 163 1 129 2 423 2 209 2 532
Puerto RicoSaint Barthélemy
Saint Kitts and Nevis 3 3 4 4 0 0 0 0
Saint Lucia 5 8 6 6 0 0
Saint-Martin (French Part)
Saint Vincent and the Grenadines 1 3 2 2 1 1 0 0
Sint Maarten (Dutch Part)
Suriname 6 5 4 6 41 53 72 31
Trinidad and Tobago 7 27 29 28 11 10 10 11
Turks and Caicos Islands 2 2 4 4 4 7 6 5
United States Virgin Islands
Uruguay 12 51 51 62 1 10 208 1 76 186
Venezuela (Bolivarian Republic of ) 57 290 338 240 153 28 14 11
Northern America 11 848 17 008 15 882 17 775 6 147 8 539 7 725 8 854
Bermuda 7 6 7 11 0 0 0 0
Canada 1 388 2 046 2 013 2 264 2 818 3 706 3 240 3 847
Greenland 1 3 4 4 266 361 335 340
Saint Pierre and Miquelon 0 0 0 0 7 9 5 5
United States of America 10 451 14 952 13 858 15 496 3 055 4 463 4 145 4 661
Asia 23 805 32 918 30 607 35 468 19 475 34 919 34 096 40 581
Central Asia 23 92 78 70 13 85 88 95
Kazakhstan 20 77 66 56 12 83 86 93
Kyrgyzstan 2 7 8 9 0 0 0 0
Tajikistan 0 1 1 1
Turkmenistan 0 2 2 2 0 0 0 0
Uzbekistan 1 4 2 2 0 1 2 2
197
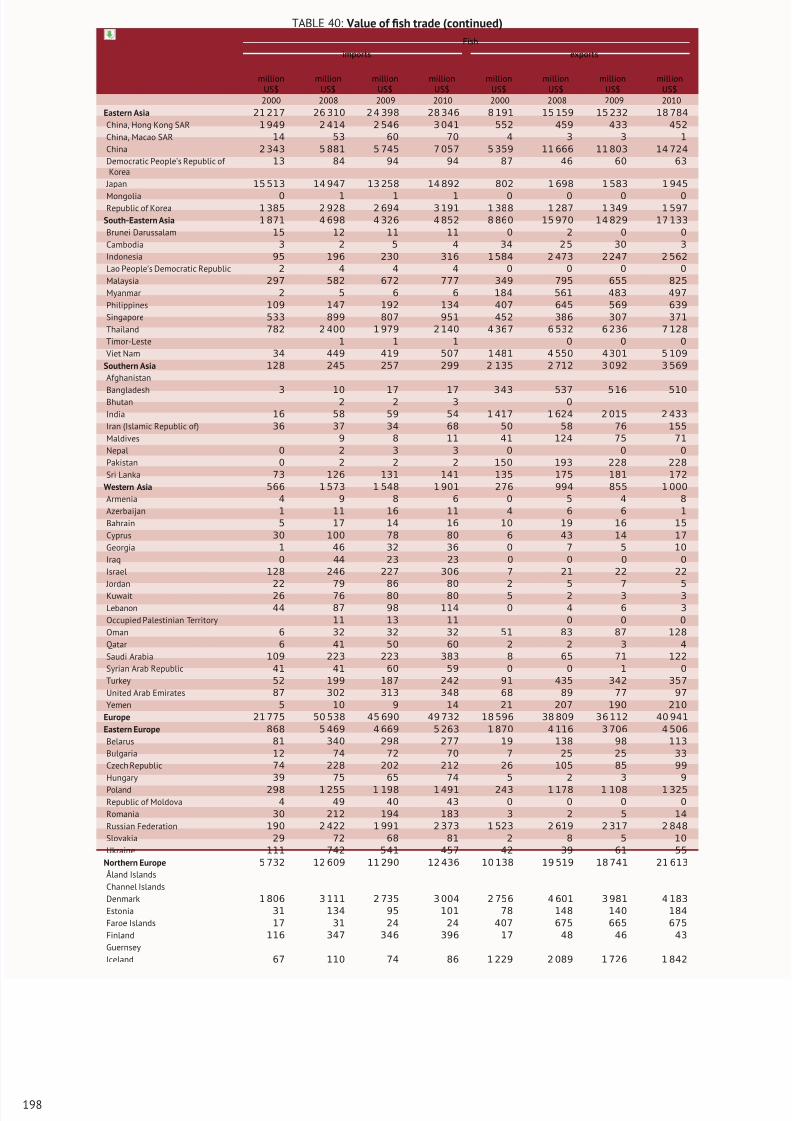
8/16/2019 Informe de la Fao 2013
http://slidepdf.com/reader/full/informe-de-la-fao-2013 216/307
TABLE 40: Value of fish trade (continued)
Fish
imports exports
millionUS$
millionUS$
millionUS$
millionUS$
millionUS$
millionUS$
millionUS$
millionUS$
2000 2008 2009 2010 2000 2008 2009 2010
Eastern Asia 21 217 26 310 2 4 398 28 346 8 191 15 159 15 232 18 784
China, Hong Kong SAR 1 949 2 414 2 546 3 041 552 459 433 452
China, Macao SAR 14 53 60 70 4 3 3 1
China 2 343 5 881 5 745 7 057 5 359 11 666 11 803 14 724
Democratic People’s Republic of Korea
13 84 94 94 87 46 60 63
Japan 15 513 14 947 13 258 14 892 802 1 698 1 583 1 945
Mongolia 0 1 1 1 0 0 0 0Republic of Korea 1 385 2 928 2 694 3 191 1 388 1 287 1 349 1 597
South-Eastern Asia 1 871 4 698 4 326 4 852 8 860 15 970 14 829 17 133
Brunei Darussalam 15 12 11 11 0 2 0 0
Cambodia 3 2 5 4 34 2 5 30 3
Indonesia 95 196 230 316 1 584 2 473 2 247 2 562
Lao People’s Democratic Republic 2 4 4 4 0 0 0 0
Malaysia 297 582 672 777 349 795 655 825
Myanmar 2 5 6 6 184 561 483 497
Philippines 109 147 192 134 407 645 569 639
Singapore 533 899 807 951 452 386 307 371
Thailand 782 2 400 1 979 2 140 4 367 6 532 6 236 7 128
Timor-Leste 1 1 1 0 0 0
Viet Nam 34 449 419 507 1 481 4 550 4 301 5 109
Southern Asia 128 245 257 299 2 135 2 712 3 092 3 569
Afghanistan
Bangladesh 3 10 17 17 3 43 537 5 16 510Bhutan 2 2 3 0
India 16 58 59 54 1 417 1 624 2 015 2 433
Iran (Islamic Republic of) 36 37 34 68 50 58 76 155
Maldives 9 8 11 41 124 75 71
Nepal 0 2 3 3 0 0 0
Pakistan 0 2 2 2 150 193 228 228
Sri Lanka 73 126 131 141 135 175 181 172
Western Asia 566 1 573 1 548 1 901 276 994 855 1 000
Armenia 4 9 8 6 0 5 4 8
Azerbaijan 1 11 16 11 4 6 6 1
Bahrain 5 17 14 16 10 19 16 15
Cyprus 30 100 78 80 6 43 14 17
Georgia 1 46 32 36 0 7 5 10
Iraq 0 44 23 23 0 0 0 0
Israel 128 246 227 306 7 21 22 22
Jordan 22 79 86 80 2 5 7 5
Kuwait 26 76 80 80 5 2 3 3
Lebanon 44 87 98 114 0 4 6 3
Occupied Palestinian Territory 11 13 11 0 0 0
Oman 6 32 32 32 51 83 87 128
Qatar 6 41 50 60 2 2 3 4
Saudi Arabia 109 223 223 383 8 65 71 122
Syrian Arab Republic 41 41 60 59 0 0 1 0
Turkey 52 199 187 242 91 435 342 357
United Arab Emirates 87 302 313 348 68 89 77 97
Yemen 5 10 9 14 21 207 190 210
Europe 21 775 50 538 45 690 49 732 18 596 38 809 36 112 40 941
Eastern Europe 868 5 469 4 669 5 263 1 870 4 116 3 706 4 506
Belarus 81 340 298 277 19 138 98 113
Bulgaria 12 74 72 70 7 25 25 33
Czech Republic 74 228 202 212 26 105 85 99
Hungary 39 75 65 74 5 2 3 9
Poland 298 1 255 1 198 1 491 243 1 178 1 108 1 325
Republic of Moldova 4 49 40 43 0 0 0 0
Romania 30 212 194 183 3 2 5 14
Russian Federation 190 2 422 1 991 2 373 1 523 2 619 2 317 2 848
Slovakia 29 72 68 81 2 8 5 10
Ukraine 111 742 541 457 42 39 61 55
Northern Europe 5 732 12 609 11 290 12 436 10 138 19 519 18 741 21 613
Åland Islands
Channel Islands
Denmark 1 806 3 111 2 735 3 004 2 756 4 601 3 981 4 183
Estonia 31 134 95 101 78 148 140 184
Faroe Islands 17 31 24 24 407 675 665 675
Finland 116 347 346 396 17 48 46 43
Guernsey
Iceland 67 110 74 86 1 229 2 089 1 726 1 842
198
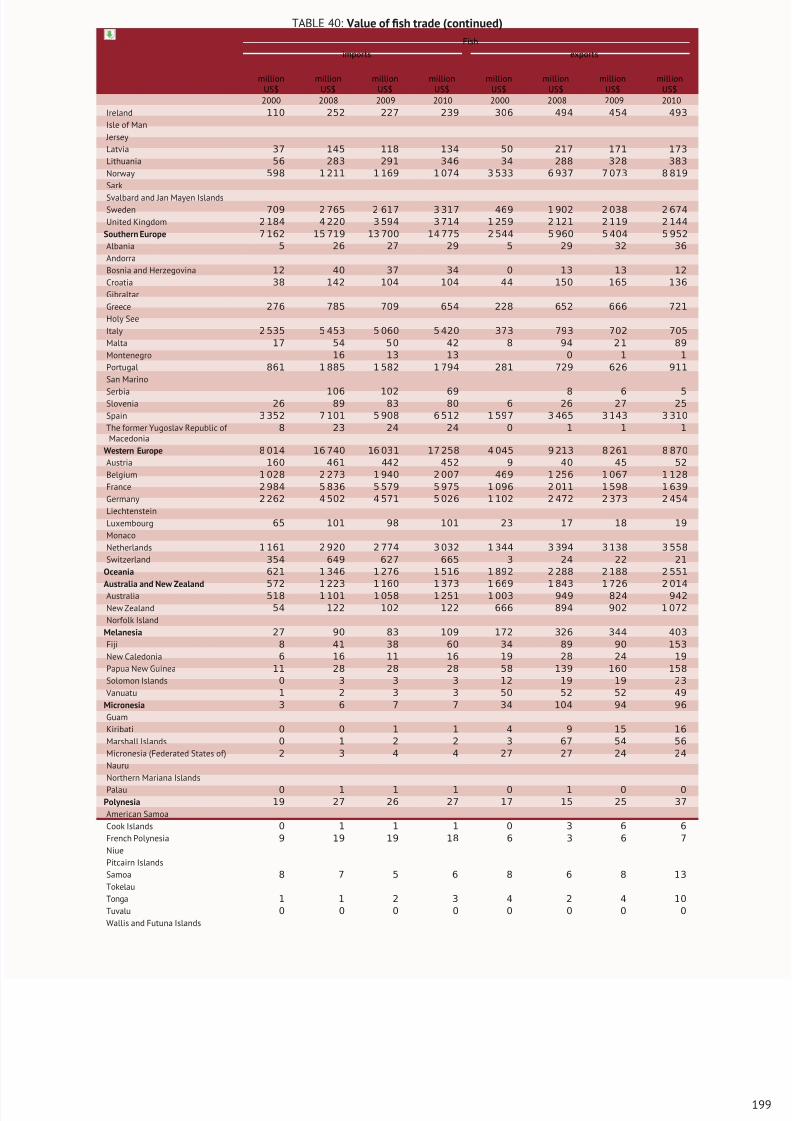
8/16/2019 Informe de la Fao 2013
http://slidepdf.com/reader/full/informe-de-la-fao-2013 217/307
TABLE 40: Value of fish trade (continued)
Fish
imports exports
millionUS$
millionUS$
millionUS$
millionUS$
millionUS$
millionUS$
millionUS$
millionUS$
2000 2008 2009 2010 2000 2008 2009 2010
Ireland 110 252 227 239 306 494 454 493
Isle of Man
Jersey
Latvia 37 145 118 134 50 217 171 173
Lithuania 56 283 291 346 34 288 328 383
Norway 598 1 211 1 169 1 074 3 533 6 937 7 073 8 819
Sark
Svalbard and Jan Mayen IslandsSweden 709 2 765 2 617 3 317 469 1 902 2 038 2 674
United Kingdom 2 184 4 220 3 594 3 714 1 259 2 121 2 119 2 144
Southern Europe 7 162 15 719 13 700 14 775 2 544 5 960 5 404 5 952
Albania 5 26 27 29 5 29 32 36
Andorra
Bosnia and Herzegovina 12 40 37 34 0 13 13 12
Croatia 38 142 104 104 44 150 165 136
Gibraltar
Greece 276 785 709 654 228 652 666 721
Holy See
Italy 2 535 5 453 5 060 5 420 373 793 702 705
Malta 17 54 50 42 8 94 2 1 89
Montenegro 16 13 13 0 1 1
Portugal 861 1 885 1 582 1 794 281 729 626 911
San Marino
Serbia 106 102 69 8 6 5Slovenia 26 89 83 80 6 26 27 25
Spain 3 352 7 101 5 908 6 512 1 597 3 465 3 143 3 310
The former Yugoslav Republic of Macedonia
8 23 24 24 0 1 1 1
Western Europe 8 014 16 740 16 031 17 258 4 045 9 213 8 261 8 870
Austria 160 461 442 452 9 40 45 52
Belgium 1 028 2 273 1 940 2 007 469 1 256 1 067 1 128
France 2 984 5 836 5 579 5 975 1 096 2 011 1 598 1 639
Germany 2 262 4 502 4 571 5 026 1 102 2 472 2 373 2 454
Liechtenstein
Luxembourg 65 101 98 101 23 17 18 19
Monaco
Netherlands 1 161 2 920 2 774 3 032 1 344 3 394 3 138 3 558
Switzerland 354 649 627 665 3 24 22 21
Oceania 621 1 346 1 276 1 516 1 892 2 288 2 188 2 551
Australia and New Zealand 572 1 223 1 160 1 373 1 669 1 843 1 726 2 014
Australia 518 1 101 1 058 1 251 1 003 949 824 942
New Zealand 54 122 102 122 666 894 902 1 072
Norfolk Island
Melanesia 27 90 83 109 172 326 344 403
Fiji 8 41 38 60 34 89 90 153
New Caledonia 6 16 11 16 19 28 24 19
Papua New Guinea 11 28 28 28 58 139 160 158
Solomon Islands 0 3 3 3 12 19 19 23
Vanuatu 1 2 3 3 50 52 52 49
Micronesia 3 6 7 7 34 104 94 96
Guam
Kiribati 0 0 1 1 4 9 15 16
Marshall Islands 0 1 2 2 3 67 54 56
Micronesia (Federated States of) 2 3 4 4 27 27 24 24
Nauru
Northern Mariana Islands
Palau 0 1 1 1 0 1 0 0
Polynesia 19 27 26 27 17 15 25 37
American Samoa
Cook Islands 0 1 1 1 0 3 6 6
French Polynesia 9 19 19 18 6 3 6 7
Niue
Pitcairn Islands
Samoa 8 7 5 6 8 6 8 13
Tokelau
Tonga 1 1 2 3 4 2 4 10
Tuvalu 0 0 0 0 0 0 0 0
Wallis and Futuna Islands
199

8/16/2019 Informe de la Fao 2013
http://slidepdf.com/reader/full/informe-de-la-fao-2013 218/307
8/16/2019 Informe de la Fao 2013
http://slidepdf.com/reader/full/informe-de-la-fao-2013 219/307
PART
Sustainability dimensions
Agriculture – including crops, livestock, forest, fisheries and aqua-culture – is the main human activity responsible for natural resourcemanagement at the local and regional levels. Thirty percent of theearth’s land is used for crops and pastures, and 70 percent of all ab-stracted freshwater is directed towards irrigation to produce the foodthat people and livestock need for a stable food supply. The results of such large-scale utilization of land and water resources are increas-ingly threatening environments.
Indiscriminate use of fertilizers and other chemicals can lead to sig-nificant pollution of air, water and soils, putting at risk pristine ter-
restrial and marine ecosystems downstream, and human health. Forinstance, agriculture is the main source of nitrate and ammonia pol-lution in both ground- and surface water and is a major contributorto phosphate pollution of waterways.
Emissions of greenhouse gases (GHGs) from agriculture, forestry andother land uses contribute significantly to the threat of global warm-ing. The land sectors are responsible for nearly 30 percent of all
8/16/2019 Informe de la Fao 2013
http://slidepdf.com/reader/full/informe-de-la-fao-2013 220/307
human-induced GHG emissions into the atmosphere, a contributioncomparable to that of the energy sector and far exceeding total emis-sions from transportation. Crop and livestock production alone is re-
sponsible for half of the methane and two-thirds of the nitrous oxideemitted into the atmosphere by human activity.
Such negative impacts on air, soils and water have, in turn, a negativeimpact on agricultural production and human well-being. Increasedsoil salinity, aquifer depletion and land degradation reduce achiev-able yields, thus putting at risk farmers’ ability to bridge productiongaps and improve food security. Deforestation and unsustainable for-est management lead to ecosystem degradation, with negative reper-cussions on the overall potential for a wide range of ecosystem ser-vices. Waste and nitrogen loads in aquaculture ponds, or genetic pol-
lution of marine resources reduce resilience of the underlying natu-ral systems without which aquaculture and marine resources cannotfunction.
However, it is increasingly recognized that with proper management,agricultural sectors have crucial positive externalities. In addition tofood and fibre, these benefits include the provision of environmentalservices and amenities through water storage and purification, car-bon sequestration and the maintenance of rural landscapes. In thiscontext, research-driven sustainable pathways to agricultural inten-sification can save vast areas of natural forest and grasslands that
would be developed in the absence of higher crop, meat and milkyields.
Both new and traditional demands for produce increase the pres-sure on scarce agricultural resources. While the agriculture sectorwill be forced to compete for land and water with expanding urbansettlements and industrial zones, it will also be required to meet thegrowing demands of the emerging bio-based economy, increasinglythrough bioenergy and new emerging markets for renewable and sus-tainable industrial products.
Although agriculture will continue to be a major user of land and
water, it will need to seek new ways of maintaining these resourcesto stay viable, and to minimize negative impacts on ecosystems andhuman well-being. Ensuring adequate food and water for all whileachieving sustainable rural development hinges on renewed stew-ardship for the responsible management of natural resources, andtherefore on a fully sustainable agriculture system.
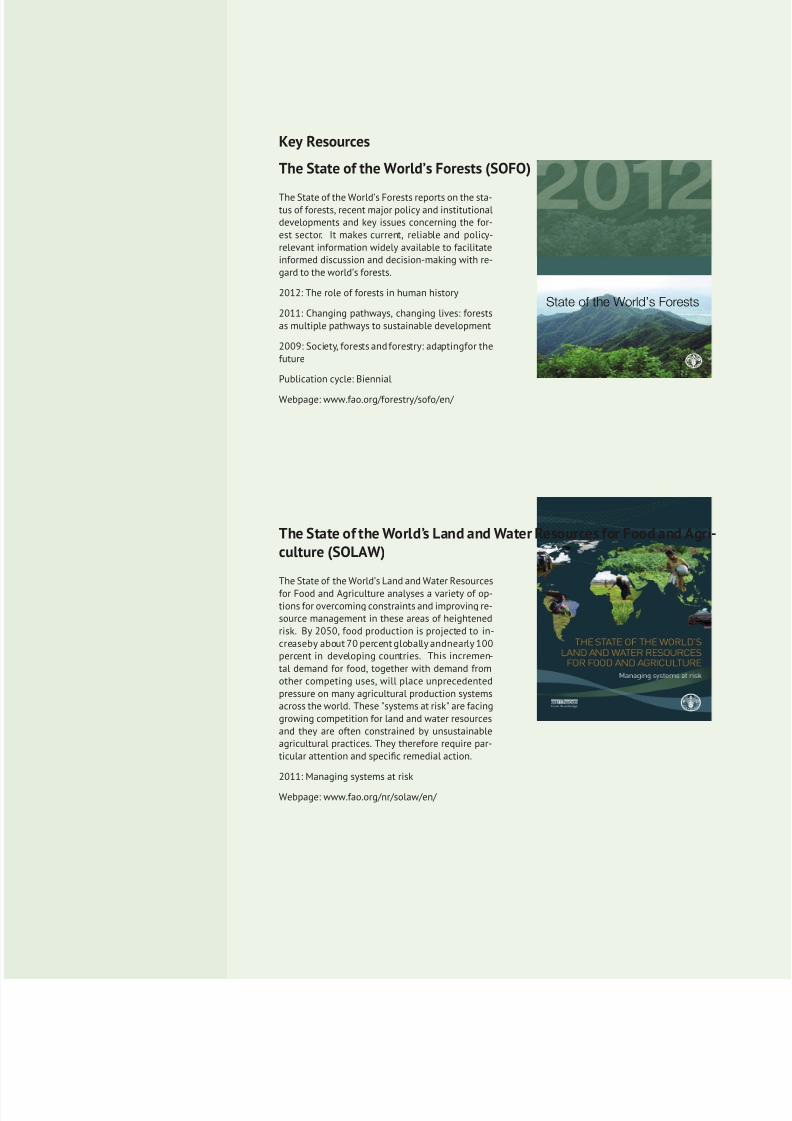
8/16/2019 Informe de la Fao 2013
http://slidepdf.com/reader/full/informe-de-la-fao-2013 221/307
Key Resources
The State of the World’s Forests (SOFO)
The State of the World’s Forests reports on the sta-tus of forests, recent major policy and institutionaldevelopments and key issues concerning the for-est sector. It makes current, reliable and policy-relevant information widely available to facilitateinformed discussion and decision-making with re-gard to the world’s forests.
2012: The role of forests in human history
2011: Changing pathways, changing lives: forestsas multiple pathways to sustainable development
2009: Society, forests and forestry: adaptingfor thefuture
Publication cycle: Biennial
Webpage: www.fao.org/forestry/sofo/en/
State of the World’s Forests
The State of the World’s Land and Water Resources for Food and Agri-culture (SOLAW)
The State of the World’s Land and Water Resources
for Food and Agriculture analyses a variety of op-tions for overcoming constraints and improving re-source management in these areas of heightenedrisk. By 2050, food production is projected to in-creaseby about 70 percent globally andnearly 100percent in developing countries. This incremen-tal demand for food, together with demand fromother competing uses, will place unprecedentedpressure on many agricultural production systemsacross the world. These "systems at risk" are facinggrowing competition for land and water resourcesand they are often constrained by unsustainableagricultural practices. They therefore require par-ticular attention and specific remedial action.
2011: Managing systems at risk
Webpage: www.fao.org/nr/solaw/en/
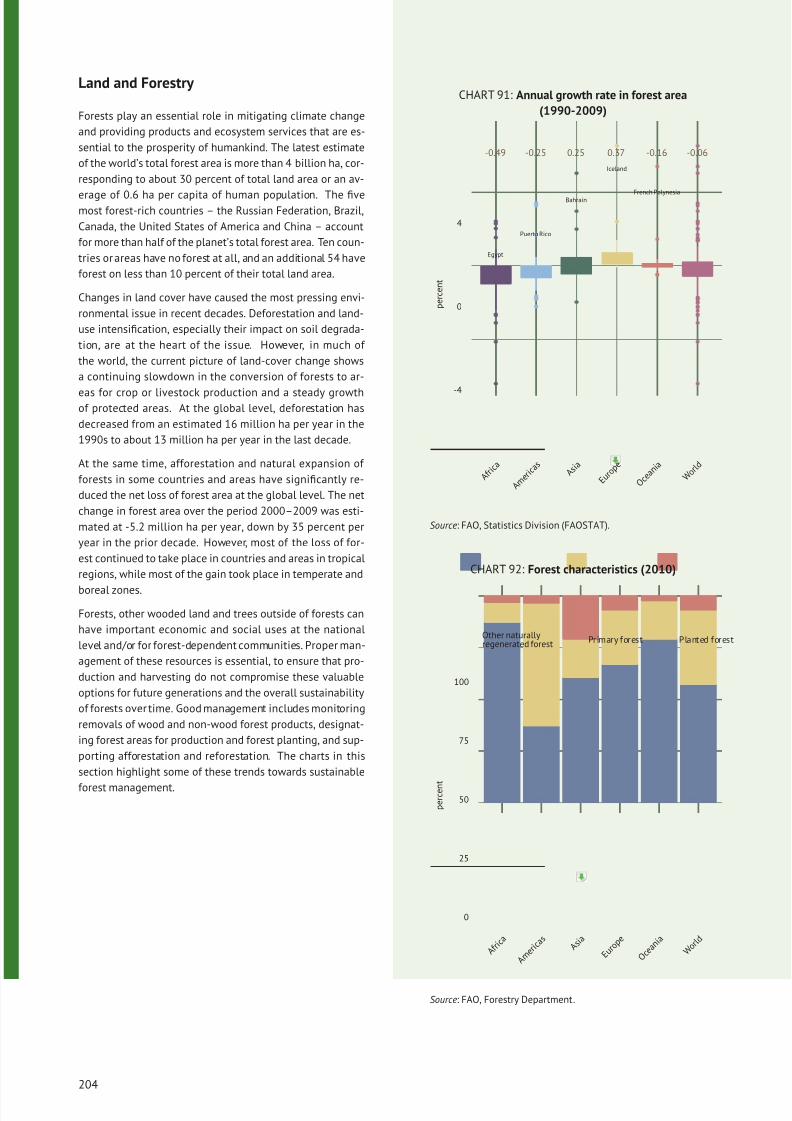
8/16/2019 Informe de la Fao 2013
http://slidepdf.com/reader/full/informe-de-la-fao-2013 222/307
Land and Forestry
Forests play an essential role in mitigating climate change
and providing products and ecosystem services that are es-
sential to the prosperity of humankind. The latest estimate
of the world’s total forest area is more than 4 billion ha, cor-
responding to about 30 percent of total land area or an av-
erage of 0.6 ha per capita of human population. The fivemost forest-rich countries – the Russian Federation, Brazil,
Canada, the United States of America and China – account
for more than half of the planet’s total forest area. Ten coun-
tries or areas have no forest at all, and an additional 54 have
forest on less than 10 percent of their total land area.
Changes in land cover have caused the most pressing envi-
ronmental issue in recent decades. Deforestation and land-
use intensification, especially their impact on soil degrada-
tion, are at the heart of the issue. However, in much of
the world, the current picture of land-cover change shows
a continuing slowdown in the conversion of forests to ar-
eas for crop or livestock production and a steady growthof protected areas. At the global level, deforestation has
decreased from an estimated 16 million ha per year in the
1990s to about 13 million ha per year in the last decade.
At the same time, afforestation and natural expansion of
forests in some countries and areas have significantly re-
duced the net loss of forest area at the global level. The net
change in forest area over the period 2000–2009 was esti-
mated at -5.2 million ha per year, down by 35 percent per
year in the prior decade. However, most of the loss of for-
est continued to take place in countries and areas in tropical
regions, while most of the gain took place in temperate and
boreal zones.
Forests, other wooded land and trees outside of forests can
have important economic and social uses at the national
level and/or for forest-dependent communities. Proper man-
agement of these resources is essential, to ensure that pro-
duction and harvesting do not compromise these valuable
options for future generations and the overall sustainability
of forests over time. Good management includes monitoring
removals of wood and non-wood forest products, designat-
ing forest areas for production and forest planting, and sup-
porting afforestation and reforestation. The charts in this
section highlight some of these trends towards sustainable
forest management.
CHART 91: Annual growth rate in forest area
(1990-2009)
-0.06-0.49 -0.16-0.25 0.25 0.37
Egypt
Puerto Rico
Bahrain
Iceland
French Polynesia
-4
0
4
A f r i c a
A m e r i c a s
A s i a
E u r o p e
O c e a n i a
W o r l d
p e r c e n t
Source: FAO, Statistics Division (FAOSTAT).
CHART 92: Forest characteristics (2010)
0
25
50
75
100
A f r i c a
A m e r i c a s
A s i a
E u r o p e
O c e a n i a
W o r l d
p e r c e n t
Other naturallyregenerated forest Primary forest Planted forest
Source: FAO, Forestry Department.
204
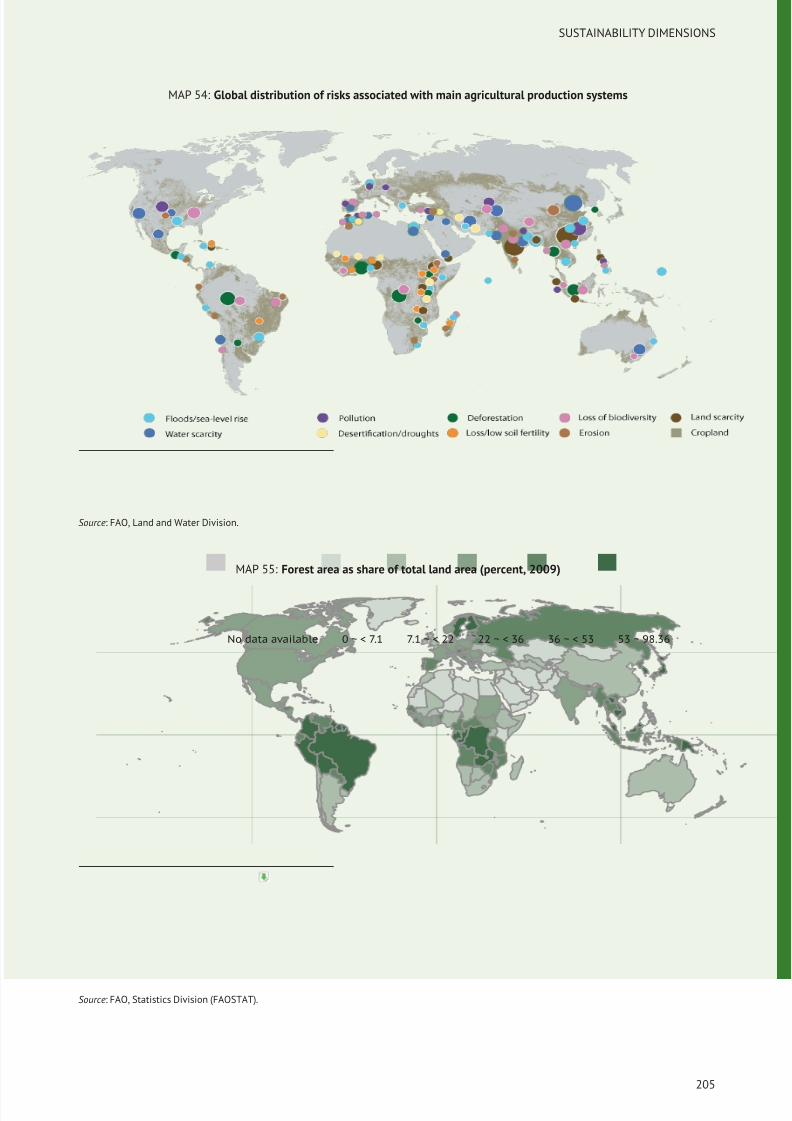
8/16/2019 Informe de la Fao 2013
http://slidepdf.com/reader/full/informe-de-la-fao-2013 223/307
SUSTAINABILITY DIMENSIONS
MAP 54: Global distribution of risks associated with main agricultural production systems
Source: FAO, Land and Water Division.
MAP 55: Forest area as share of total land area (percent, 2009)
No data available 0 ~ < 7.1 7.1 ~ < 22 22 ~ < 36 36 ~ < 53 53 ~ 98.36
Source: FAO, Statistics Division (FAOSTAT).
205
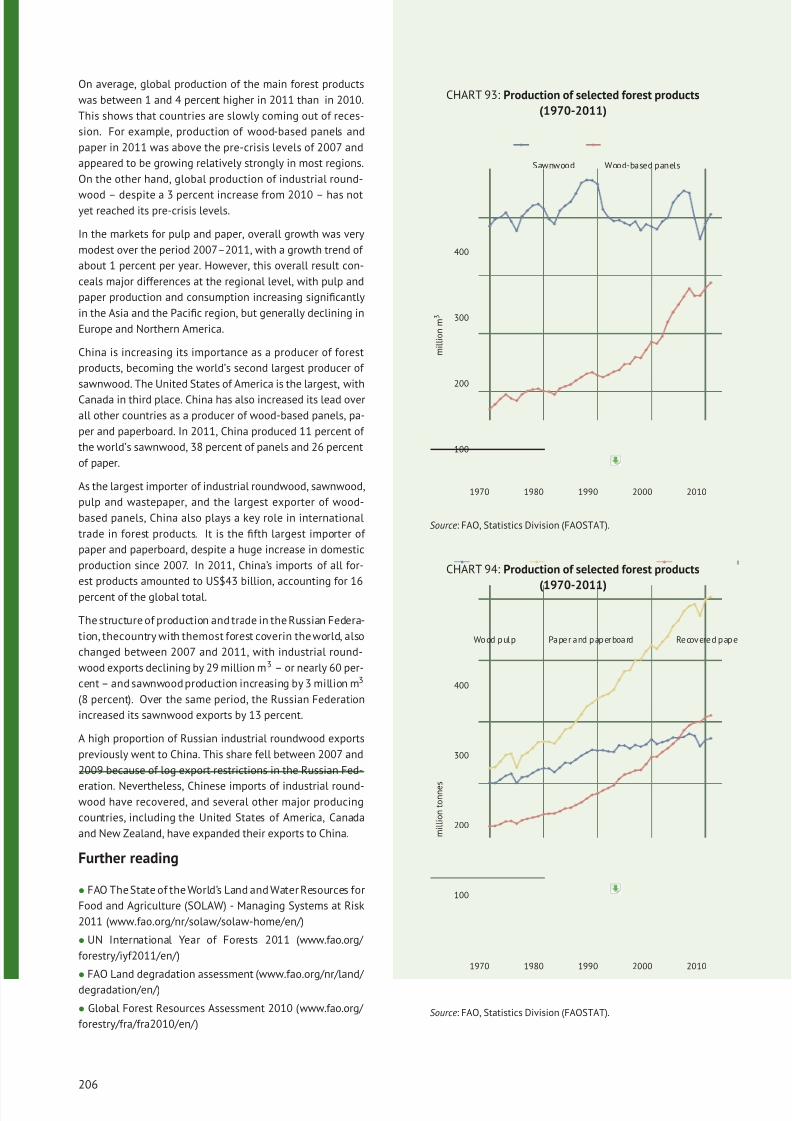
8/16/2019 Informe de la Fao 2013
http://slidepdf.com/reader/full/informe-de-la-fao-2013 224/307
On average, global production of the main forest products
was between 1 and 4 percent higher in 2011 than in 2010.
This shows that countries are slowly coming out of reces-
sion. For example, production of wood-based panels and
paper in 2011 was above the pre-crisis levels of 2007 and
appeared to be growing relatively strongly in most regions.
On the other hand, global production of industrial round-
wood – despite a 3 percent increase from 2010 – has notyet reached its pre-crisis levels.
In the markets for pulp and paper, overall growth was very
modest over the period 2007–2011, with a growth trend of
about 1 percent per year. However, this overall result con-
ceals major differences at the regional level, with pulp and
paper production and consumption increasing significantly
in the Asia and the Pacific region, but generally declining in
Europe and Northern America.
China is increasing its importance as a producer of forest
products, becoming the world’s second largest producer of
sawnwood. The United States of America is the largest, with
Canada in third place. China has also increased its lead over
all other countries as a producer of wood-based panels, pa-
per and paperboard. In 2011, China produced 11 percent of
the world’s sawnwood, 38 percent of panels and 26 percent
of paper.
As the largest importer of industrial roundwood, sawnwood,
pulp and wastepaper, and the largest exporter of wood-
based panels, China also plays a key role in international
trade in forest products. It is the fifth largest importer of
paper and paperboard, despite a huge increase in domestic
production since 2007. In 2011, China’s imports of all for-
est products amounted to US$43 billion, accounting for 16
percent of the global total.
The structure of production and trade in the Russian Federa-
tion, thecountry with themost forest coverin the world, also
changed between 2007 and 2011, with industrial round-
wood exports declining by 29 million m3 – or nearly 60 per-
cent – and sawnwood production increasing by 3 million m3
(8 percent). Over the same period, the Russian Federation
increased its sawnwood exports by 13 percent.
A high proportion of Russian industrial roundwood exports
previously went to China. This share fell between 2007 and
2009 because of log export restrictions in the Russian Fed-
eration. Nevertheless, Chinese imports of industrial round-wood have recovered, and several other major producing
countries, including the United States of America, Canada
and New Zealand, have expanded their exports to China.
Further reading
• FAO The State of the World’s Land and Water Resources for
Food and Agriculture (SOLAW) - Managing Systems at Risk
2011 (www.fao.org/nr/solaw/solaw-home/en/)
• UN International Year of Forests 2011 (www.fao.org/
forestry/iyf2011/en/ )
• FAO Land degradation assessment (www.fao.org/nr/land/
degradation/en/)
• Global Forest Resources Assessment 2010 (www.fao.org/
forestry/fra/fra2010/en/ )
CHART 93: Production of selected forest products
(1970-2011)
100
200
300
400
1970 1980 1990 2000 2010
m i l l i o n m
3
Sawnwood Wood-based panels
Source: FAO, Statistics Division (FAOSTAT).
CHART 94: Production of selected forest products
(1970-2011)
100
200
300
400
1970 1980 1990 2000 2010
m i l l i o n t o n n e s
Wood pulp Paper and paperboard Recovered pape
Source: FAO, Statistics Division (FAOSTAT).
206
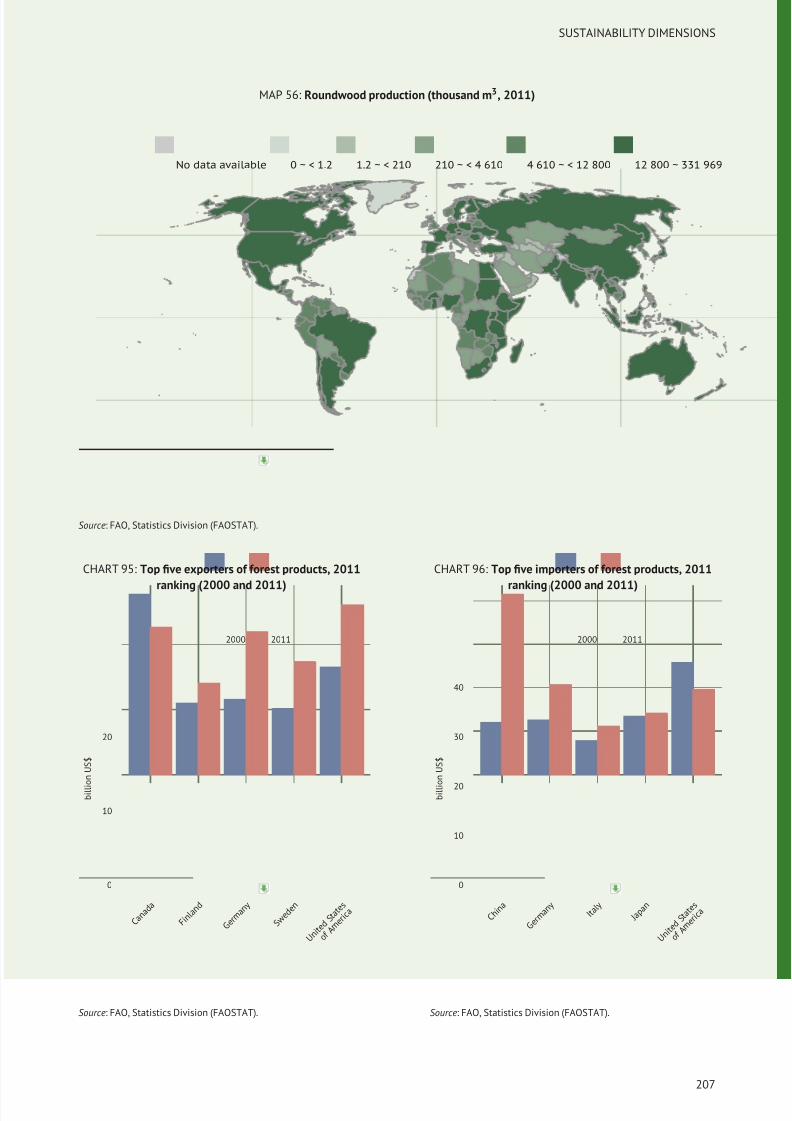
8/16/2019 Informe de la Fao 2013
http://slidepdf.com/reader/full/informe-de-la-fao-2013 225/307
SUSTAINABILITY DIMENSIONS
MAP 56: Roundwood production (thousand m3, 2011)
No data available 0 ~ < 1.2 1.2 ~ < 210 210 ~ < 4 610 4 610 ~ < 12 800 12 800 ~ 331 969
Source: FAO, Statistics Division (FAOSTAT).
CHART 95: Top five exporters of forest products, 2011
ranking (2000 and 2011)
0
10
20
C a n a d a
F i n l a n
d
G e r m a n y
S w e d e n
U n i t e d S t a t e s
o f A m e r i c a
b i l l i o n U S $
2000 2011
Source: FAO, Statistics Division (FAOSTAT).
CHART 96: Top five importers of forest products, 2011
ranking (2000 and 2011)
0
10
20
30
40
C h i n a
G e r m a n y
I t a l y
J a p a n
U n i t e d S t a t e s
o f A m e r i c a
b i l l i o n U S $
2000 2011
Source: FAO, Statistics Division (FAOSTAT).
207
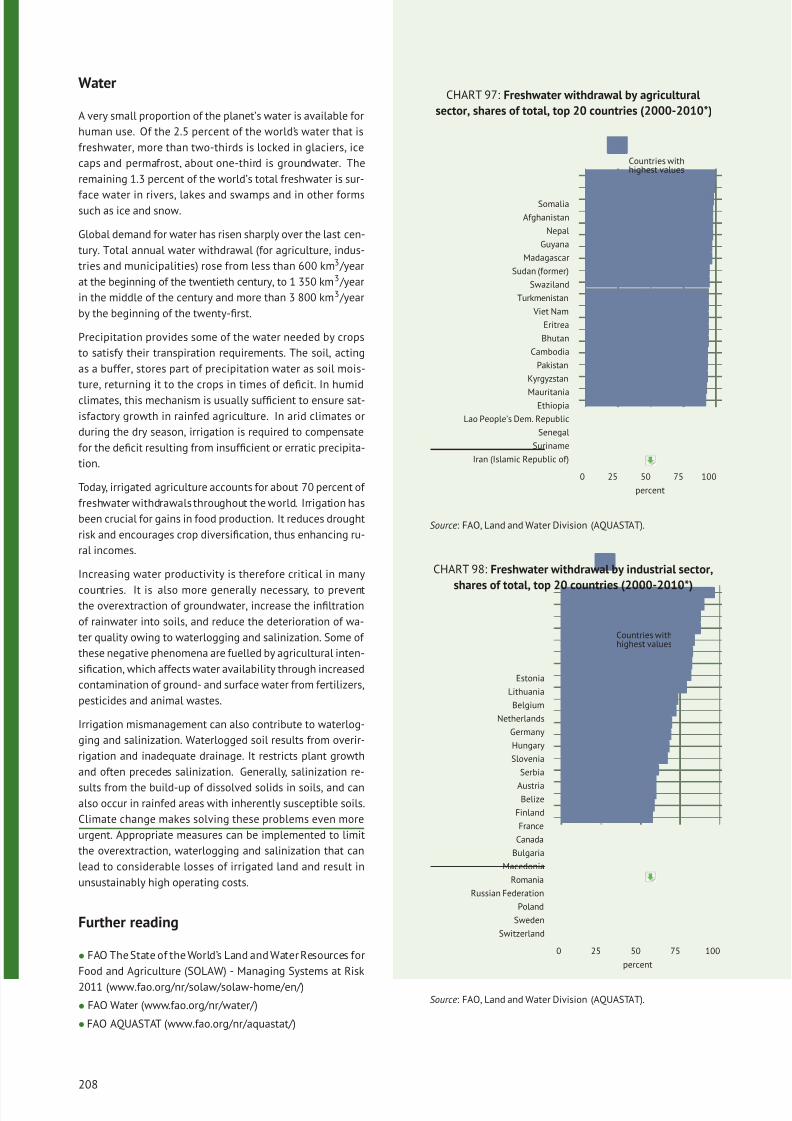
8/16/2019 Informe de la Fao 2013
http://slidepdf.com/reader/full/informe-de-la-fao-2013 226/307
Water
A very small proportion of the planet’s water is available for
human use. Of the 2.5 percent of the world’s water that is
freshwater, more than two-thirds is locked in glaciers, ice
caps and permafrost, about one-third is groundwater. The
remaining 1.3 percent of the world’s total freshwater is sur-
face water in rivers, lakes and swamps and in other formssuch as ice and snow.
Global demand for water has risen sharply over the last cen-
tury. Total annual water withdrawal (for agriculture, indus-
tries and municipalities) rose from less than 600 km3 /year
at the beginning of the twentieth century, to 1 350 km3 /year
in the middle of the century and more than 3 800 km3 /year
by the beginning of the twenty-first.
Precipitation provides some of the water needed by crops
to satisfy their transpiration requirements. The soil, acting
as a buffer, stores part of precipitation water as soil mois-
ture, returning it to the crops in times of deficit. In humid
climates, this mechanism is usually sufficient to ensure sat-
isfactory growth in rainfed agriculture. In arid climates or
during the dry season, irrigation is required to compensate
for the deficit resulting from insufficient or erratic precipita-
tion.
Today, irrigated agriculture accounts for about 70 percent of
freshwater withdrawals throughout the world. Irrigation has
been crucial for gains in food production. It reduces drought
risk and encourages crop diversification, thus enhancing ru-
ral incomes.
Increasing water productivity is therefore critical in many
countries. It is also more generally necessary, to preventthe overextraction of groundwater, increase the infiltration
of rainwater into soils, and reduce the deterioration of wa-
ter quality owing to waterlogging and salinization. Some of
these negative phenomena are fuelled by agricultural inten-
sification, which affects water availability through increased
contamination of ground- and surface water from fertilizers,
pesticides and animal wastes.
Irrigation mismanagement can also contribute to waterlog-
ging and salinization. Waterlogged soil results from overir-
rigation and inadequate drainage. It restricts plant growth
and often precedes salinization. Generally, salinization re-
sults from the build-up of dissolved solids in soils, and canalso occur in rainfed areas with inherently susceptible soils.
Climate change makes solving these problems even more
urgent. Appropriate measures can be implemented to limit
the overextraction, waterlogging and salinization that can
lead to considerable losses of irrigated land and result in
unsustainably high operating costs.
Further reading
• FAO The State of the World’s Land and Water Resources for
Food and Agriculture (SOLAW) - Managing Systems at Risk
2011 (www.fao.org/nr/solaw/solaw-home/en/)
• FAO Water (www.fao.org/nr/water/ )
• FAO AQUASTAT (www.fao.org/nr/aquastat/)
CHART 97: Freshwater withdrawal by agricultural
sector, shares of total, top 20 countries (2000-2010*)
Iran (Islamic Republic of)
Suriname
Senegal
Lao People’s Dem. Republic
EthiopiaMauritania
Kyrgyzstan
Pakistan
Cambodia
Bhutan
Eritrea
Viet Nam
Turkmenistan
Swaziland
Sudan (former)
Madagascar
Guyana
Nepal
Afghanistan
Somalia
0 25 50 75 100
percent
Countries withhighest values
Source: FAO, Land and Water Division (AQUASTAT).
CHART 98: Freshwater withdrawal by industrial sector,
shares of total, top 20 countries (2000-2010*)
Switzerland
Sweden
Poland
Russian Federation
Romania
Macedonia
Bulgaria
Canada
France
Finland
BelizeAustria
Serbia
Slovenia
Hungary
Germany
Netherlands
Belgium
Lithuania
Estonia
0 25 50 75 100
percent
Countries withhighest values
Source: FAO, Land and Water Division (AQUASTAT).
208
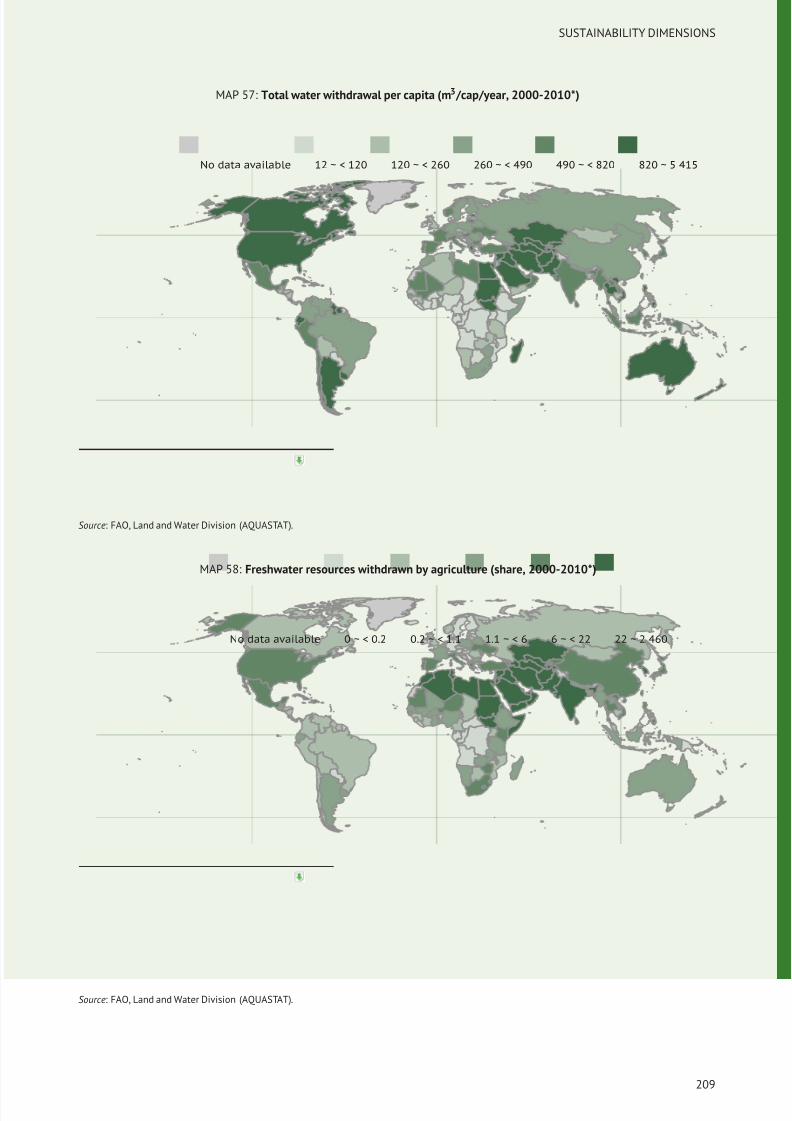
8/16/2019 Informe de la Fao 2013
http://slidepdf.com/reader/full/informe-de-la-fao-2013 227/307
SUSTAINABILITY DIMENSIONS
MAP 57: Total water withdrawal per capita (m3 /cap/year, 2000-2010*)
No data available 12 ~ < 120 120 ~ < 260 260 ~ < 490 490 ~ < 820 820 ~ 5 415
Source: FAO, Land and Water Division (AQUASTAT).
MAP 58: Freshwater resources withdrawn by agriculture (share, 2000-2010*)
No data available 0 ~ < 0.2 0.2 ~ < 1.1 1.1 ~ < 6 6 ~ < 22 22 ~ 2 460
Source: FAO, Land and Water Division (AQUASTAT).
209
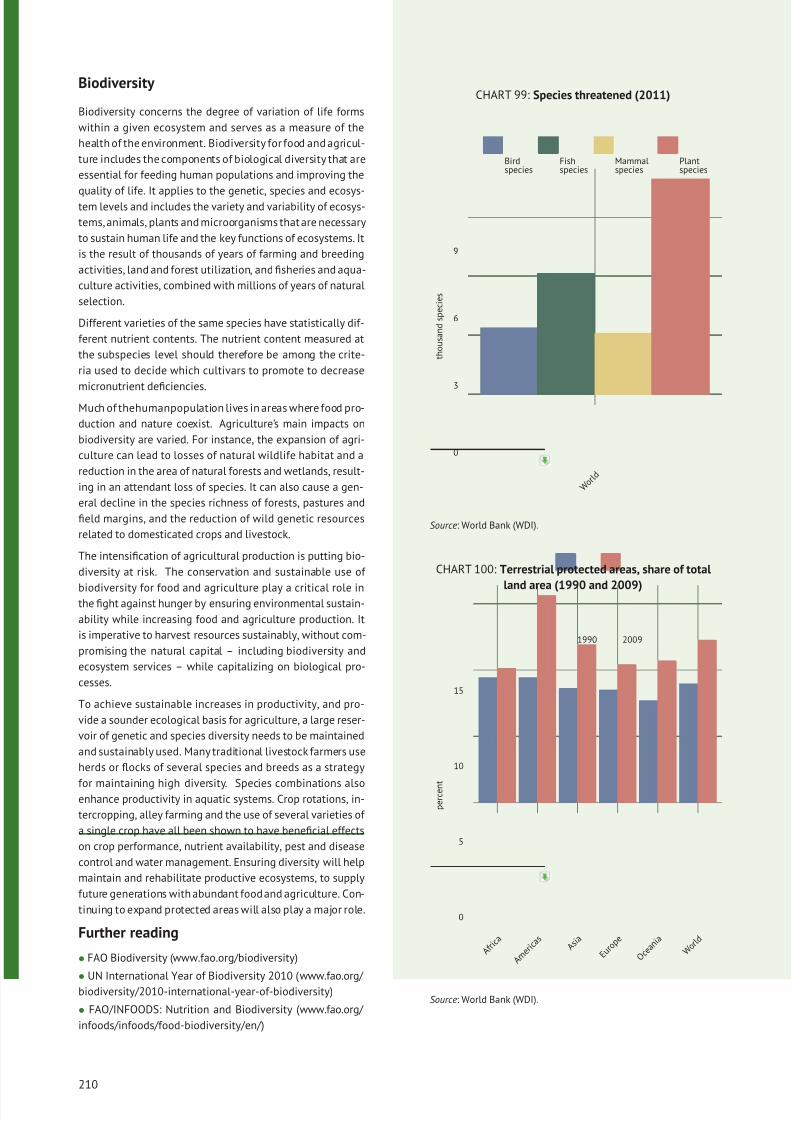
8/16/2019 Informe de la Fao 2013
http://slidepdf.com/reader/full/informe-de-la-fao-2013 228/307
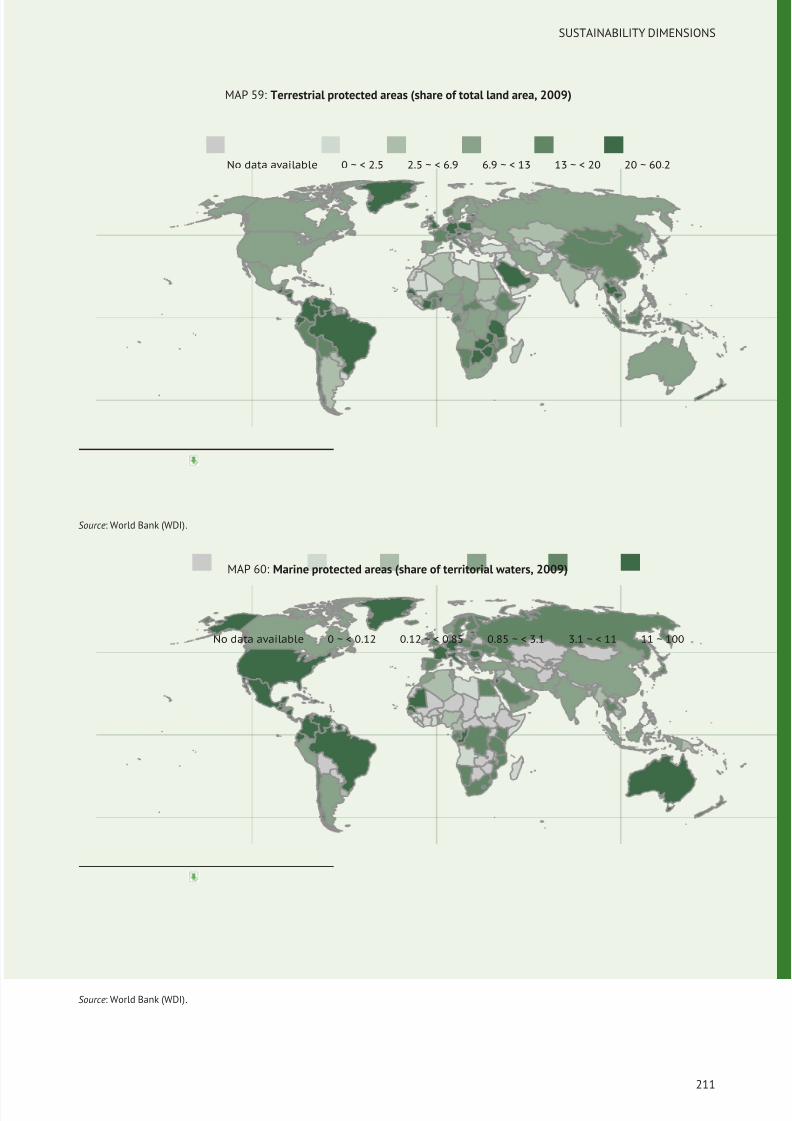
8/16/2019 Informe de la Fao 2013
http://slidepdf.com/reader/full/informe-de-la-fao-2013 229/307
SUSTAINABILITY DIMENSIONS
MAP 59: Terrestrial protected areas (share of total land area, 2009)
No data available 0 ~ < 2.5 2.5 ~ < 6.9 6.9 ~ < 13 13 ~ < 20 20 ~ 60.2
Source: World Bank (WDI).
MAP 60: Marine protected areas (share of territorial waters, 2009)
No data available 0 ~ < 0.12 0.12 ~ < 0.85 0.85 ~ < 3.1 3.1 ~ < 11 11 ~ 100
Source: World Bank (WDI).
211
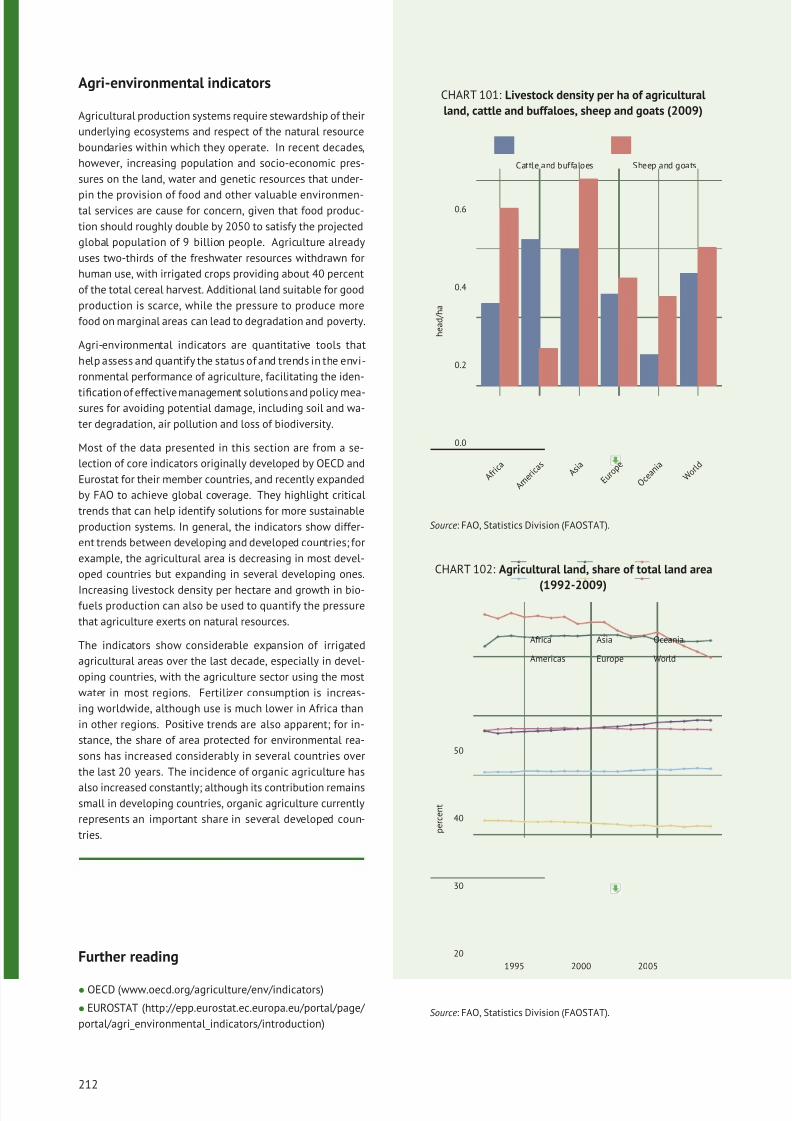
8/16/2019 Informe de la Fao 2013
http://slidepdf.com/reader/full/informe-de-la-fao-2013 230/307
Agri-environmental indicators
Agricultural production systems require stewardship of their
underlying ecosystems and respect of the natural resource
boundaries within which they operate. In recent decades,
however, increasing population and socio-economic pres-
sures on the land, water and genetic resources that under-
pin the provision of food and other valuable environmen-tal services are cause for concern, given that food produc-
tion should roughly double by 2050 to satisfy the projected
global population of 9 billion people. Agriculture already
uses two-thirds of the freshwater resources withdrawn for
human use, with irrigated crops providing about 40 percent
of the total cereal harvest. Additional land suitable for good
production is scarce, while the pressure to produce more
food on marginal areas can lead to degradation and poverty.
Agri-environmental indicators are quantitative tools that
help assess and quantify the status of and trends in the envi-
ronmental performance of agriculture, facilitating the iden-
tification of effectivemanagement solutions and policy mea-sures for avoiding potential damage, including soil and wa-
ter degradation, air pollution and loss of biodiversity.
Most of the data presented in this section are from a se-
lection of core indicators originally developed by OECD and
Eurostat for their member countries, and recently expanded
by FAO to achieve global coverage. They highlight critical
trends that can help identify solutions for more sustainable
production systems. In general, the indicators show differ-
ent trends between developing and developed countries; for
example, the agricultural area is decreasing in most devel-
oped countries but expanding in several developing ones.
Increasing livestock density per hectare and growth in bio-fuels production can also be used to quantify the pressure
that agriculture exerts on natural resources.
The indicators show considerable expansion of irrigated
agricultural areas over the last decade, especially in devel-
oping countries, with the agriculture sector using the most
water in most regions. Fertilizer consumption is increas-
ing worldwide, although use is much lower in Africa than
in other regions. Positive trends are also apparent; for in-
stance, the share of area protected for environmental rea-
sons has increased considerably in several countries over
the last 20 years. The incidence of organic agriculture has
also increased constantly; although its contribution remainssmall in developing countries, organic agriculture currently
represents an important share in several developed coun-
tries.
Further reading
• OECD (www.oecd.org/agriculture/env/indicators)
• EUROSTAT (http://epp.eurostat.ec.europa.eu/portal/page/
portal/agri_environmental_indicators/introduction)
CHART 101: Livestock density per ha of agricultural
land, cattle and buffaloes, sheep and goats (2009)
0.0
0.2
0.4
0.6
A f r i c a
A m e r i c a s
A s i a
E u r o p e
O c e a n i a
W o r l d
h e a d / h a
Cattle and buffaloes Sheep and goats
Source: FAO, Statistics Division (FAOSTAT).
CHART 102: Agricultural land, share of total land area
(1992-2009)
20
30
40
50
1995 2000 2005
p e r c e n t
Africa
Americas
Asia
Europe
Oceania
World
Source: FAO, Statistics Division (FAOSTAT).
212
http://ldvapp07.fao.org:8032/faosyb/rest/get/2013/others/1990-2009/QA.STCK.CB.HD.SH,QA.STCK.SG.HD.SH
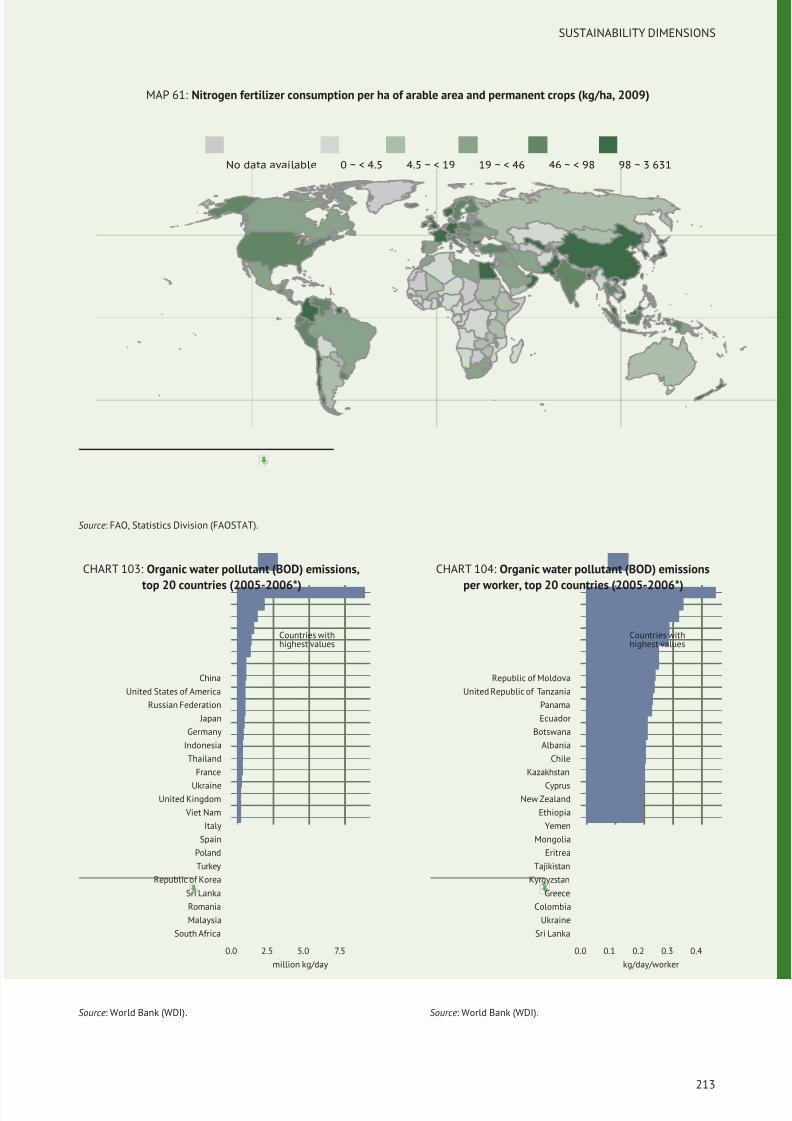
8/16/2019 Informe de la Fao 2013
http://slidepdf.com/reader/full/informe-de-la-fao-2013 231/307
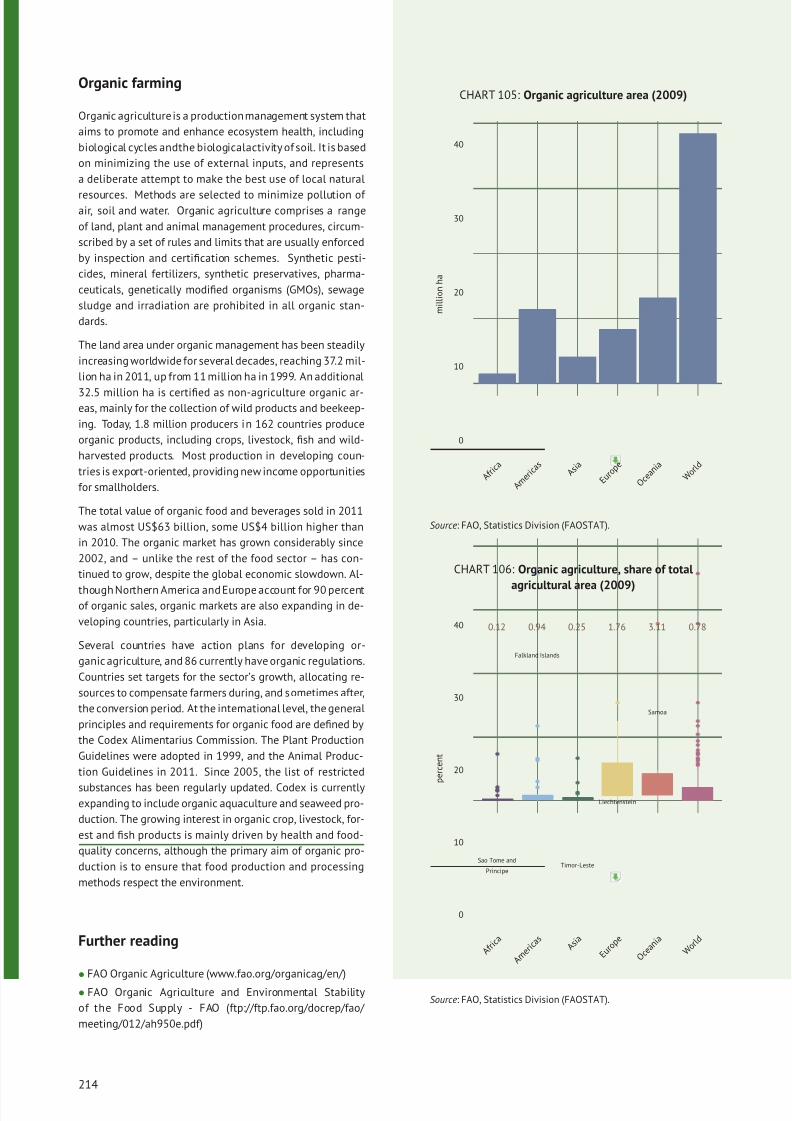
8/16/2019 Informe de la Fao 2013
http://slidepdf.com/reader/full/informe-de-la-fao-2013 232/307
Organic farming
Organic agricultureis a production management system that
aims to promote and enhance ecosystem health, including
biological cycles andthe biologicalactivity of soil. It is based
on minimizing the use of external inputs, and represents
a deliberate attempt to make the best use of local natural
resources. Methods are selected to minimize pollution of air, soil and water. Organic agriculture comprises a range
of land, plant and animal management procedures, circum-
scribed by a set of rules and limits that are usually enforced
by inspection and certification schemes. Synthetic pesti-
cides, mineral fertilizers, synthetic preservatives, pharma-
ceuticals, genetically modified organisms (GMOs), sewage
sludge and irradiation are prohibited in all organic stan-
dards.
The land area under organic management has been steadily
increasing worldwide for several decades, reaching 37.2 mil-
lion ha in 2011, up from 11 million ha in 1999. An additional
32.5 million ha is certified as non-agriculture organic ar-eas, mainly for the collection of wild products and beekeep-
ing. Today, 1.8 million producers in 162 countries produce
organic products, including crops, livestock, fish and wild-
harvested products. Most production in developing coun-
tries is export-oriented, providing new income opportunities
for smallholders.
The total value of organic food and beverages sold in 2011
was almost US$63 billion, some US$4 billion higher than
in 2010. The organic market has grown considerably since
2002, and – unlike the rest of the food sector – has con-
tinued to grow, despite the global economic slowdown. Al-
though Northern America and Europe account for 90 percentof organic sales, organic markets are also expanding in de-
veloping countries, particularly in Asia.
Several countries have action plans for developing or-
ganic agriculture, and 86 currently have organic regulations.
Countries set targets for the sector’s growth, allocating re-
sources to compensate farmers during, and sometimes after,
the conversion period. At the international level, the general
principles and requirements for organic food are defined by
the Codex Alimentarius Commission. The Plant Production
Guidelines were adopted in 1999, and the Animal Produc-
tion Guidelines in 2011. Since 2005, the list of restricted
substances has been regularly updated. Codex is currentlyexpanding to include organic aquaculture and seaweed pro-
duction. The growing interest in organic crop, livestock, for-
est and fish products is mainly driven by health and food-
quality concerns, although the primary aim of organic pro-
duction is to ensure that food production and processing
methods respect the environment.
Further reading
• FAO Organic Agriculture (www.fao.org/organicag/en/)
• FAO Organic Agriculture and Environmental Stability
of the Food Supply - FAO (ftp://ftp.fao.org/docrep/fao/
meeting/012/ah950e.pdf)
CHART 105: Organic agriculture area (2009)
0
10
20
30
40
A f r i c a
A m e r i c a s
A s i a
E u r o p e
O c e a n i a
W o r l d
m i l l i o n h a
Source: FAO, Statistics Division (FAOSTAT).
CHART 106: Organic agriculture, share of total
agricultural area (2009)
0.780.12 3.110.94 0.25 1.76
Sao Tome and
Principe
Falkland Islands
Timor-Leste
Liechtenstein
Samoa
0
10
20
30
40
A f r i c a
A m e r i c a s
A s i a
E u r o p e
O c e a n i a
W o r l d
p e r c e n t
Source: FAO, Statistics Division (FAOSTAT).
214
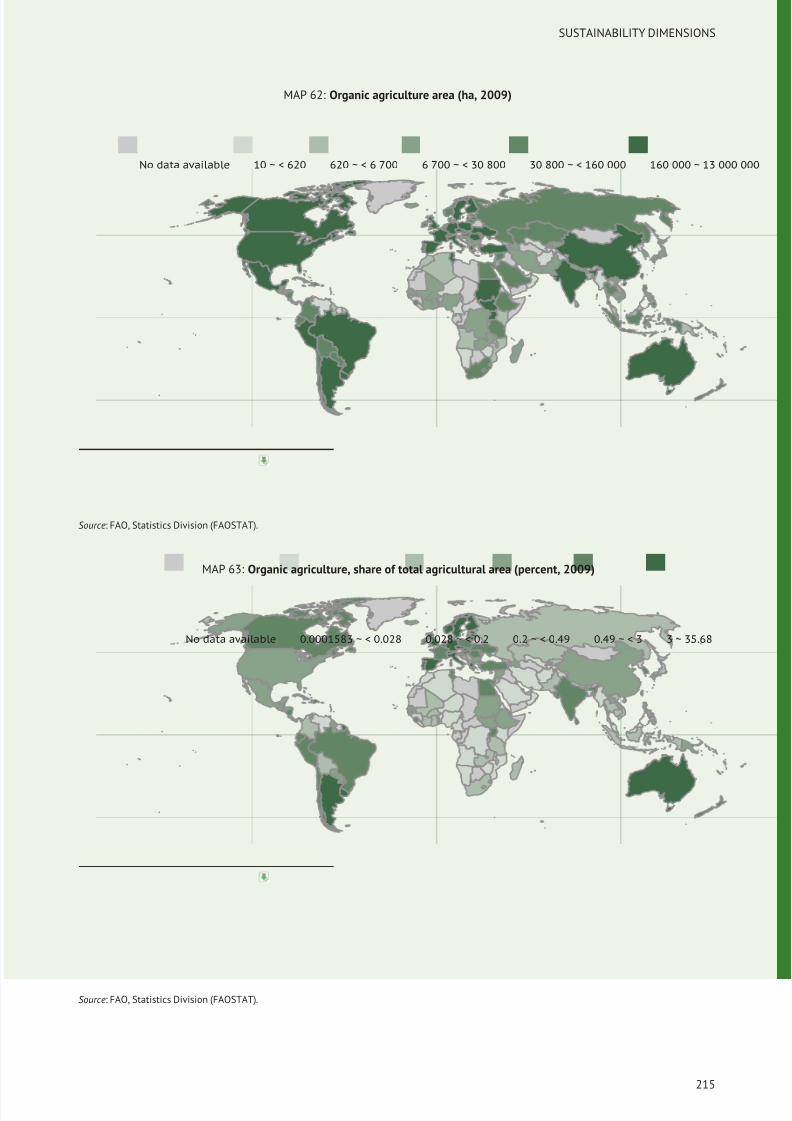
8/16/2019 Informe de la Fao 2013
http://slidepdf.com/reader/full/informe-de-la-fao-2013 233/307
SUSTAINABILITY DIMENSIONS
MAP 62: Organic agriculture area (ha, 2009)
No data available 10 ~ < 620 620 ~ < 6 700 6 700 ~ < 30 800 30 800 ~ < 160 000 160 000 ~ 13 000 000
Source: FAO, Statistics Division (FAOSTAT).
MAP 63: Organic agriculture, share of total agricultural area (percent, 2009)
No data available 0.0001583 ~ < 0.028 0.028 ~ < 0.2 0.2 ~ < 0.49 0.49 ~ < 3 3 ~ 35.68
Source: FAO, Statistics Division (FAOSTAT).
215
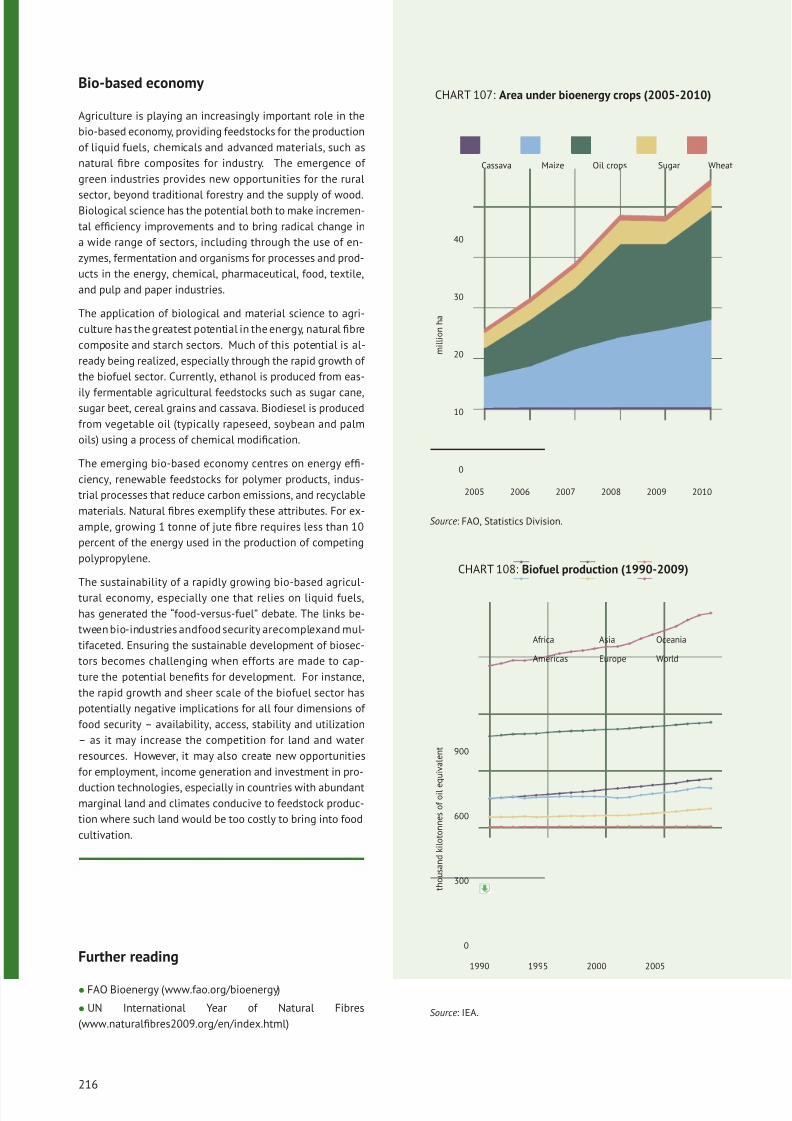
8/16/2019 Informe de la Fao 2013
http://slidepdf.com/reader/full/informe-de-la-fao-2013 234/307
Bio-based economy
Agriculture is playing an increasingly important role in the
bio-based economy, providing feedstocks for the production
of liquid fuels, chemicals and advanced materials, such as
natural fibre composites for industry. The emergence of
green industries provides new opportunities for the rural
sector, beyond traditional forestry and the supply of wood.Biological science has the potential both to make incremen-
tal efficiency improvements and to bring radical change in
a wide range of sectors, including through the use of en-
zymes, fermentation and organisms for processes and prod-
ucts in the energy, chemical, pharmaceutical, food, textile,
and pulp and paper industries.
The application of biological and material science to agri-
culture has the greatest potential in the energy, natural fibre
composite and starch sectors. Much of this potential is al-
ready being realized, especially through the rapid growth of
the biofuel sector. Currently, ethanol is produced from eas-
ily fermentable agricultural feedstocks such as sugar cane,sugar beet, cereal grains and cassava. Biodiesel is produced
from vegetable oil (typically rapeseed, soybean and palm
oils) using a process of chemical modification.
The emerging bio-based economy centres on energy effi-
ciency, renewable feedstocks for polymer products, indus-
trial processes that reduce carbon emissions, and recyclable
materials. Natural fibres exemplify these attributes. For ex-
ample, growing 1 tonne of jute fibre requires less than 10
percent of the energy used in the production of competing
polypropylene.
The sustainability of a rapidly growing bio-based agricul-
tural economy, especially one that relies on liquid fuels,
has generated the “food-versus-fuel” debate. The links be-
tween bio-industries andfood security arecomplexand mul-
tifaceted. Ensuring the sustainable development of biosec-
tors becomes challenging when efforts are made to cap-
ture the potential benefits for development. For instance,
the rapid growth and sheer scale of the biofuel sector has
potentially negative implications for all four dimensions of
food security – availability, access, stability and utilization
– as it may increase the competition for land and water
resources. However, it may also create new opportunities
for employment, income generation and investment in pro-
duction technologies, especially in countries with abundantmarginal land and climates conducive to feedstock produc-
tion where such land would be too costly to bring into food
cultivation.
Further reading
• FAO Bioenergy (www.fao.org/bioenergy)
• UN International Year of Natural Fibres
(www.naturalfibres2009.org/en/index.html)
CHART 107: Area under bioenergy crops (2005-2010)
0
10
20
30
40
2005 2006 2007 2008 2009 2010
m i l l i o n h a
Cassava Maize Oil crops Sugar Wheat
Source: FAO, Statistics Division.
CHART 108: Biofuel production (1990-2009)
0
300
600
900
1990 1995 2000 2005
t h o u s a n d k i l o t o n n e s o f o i l e
q u i v a l e n t
Africa
Americas
Asia
Europe
Oceania
World
Source: IEA.
216
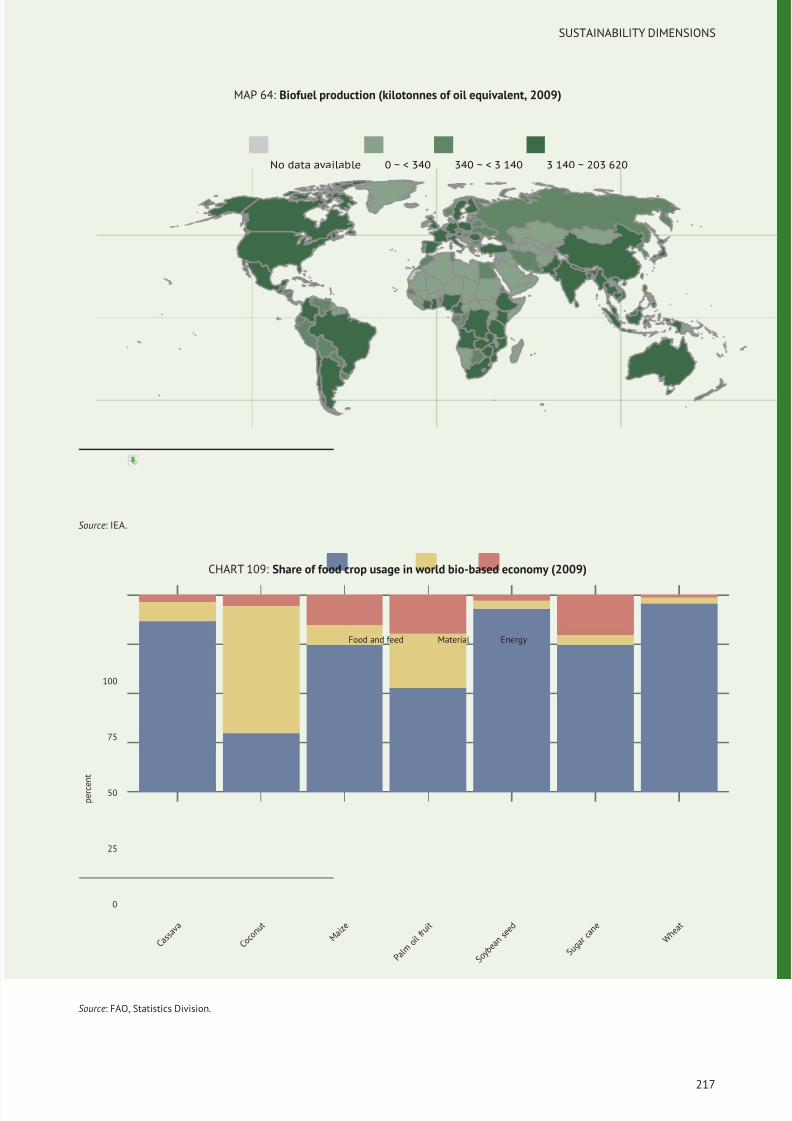
8/16/2019 Informe de la Fao 2013
http://slidepdf.com/reader/full/informe-de-la-fao-2013 235/307
SUSTAINABILITY DIMENSIONS
MAP 64: Biofuel production (kilotonnes of oil equivalent, 2009)
No data available 0 ~ < 340 340 ~ < 3 140 3 140 ~ 203 620
Source: IEA.
CHART 109: Share of food crop usage in world bio-based economy (2009)
0
25
50
75
100
C a s s a v a
C o c o n u t
M a i z e
P a l m
o i l f r u i t
S o y b e a n s e e d
S u g a r c a n e
W h e a t
p e r c e
n t
Food and feed Material Energy
Source: FAO, Statistics Division.
217
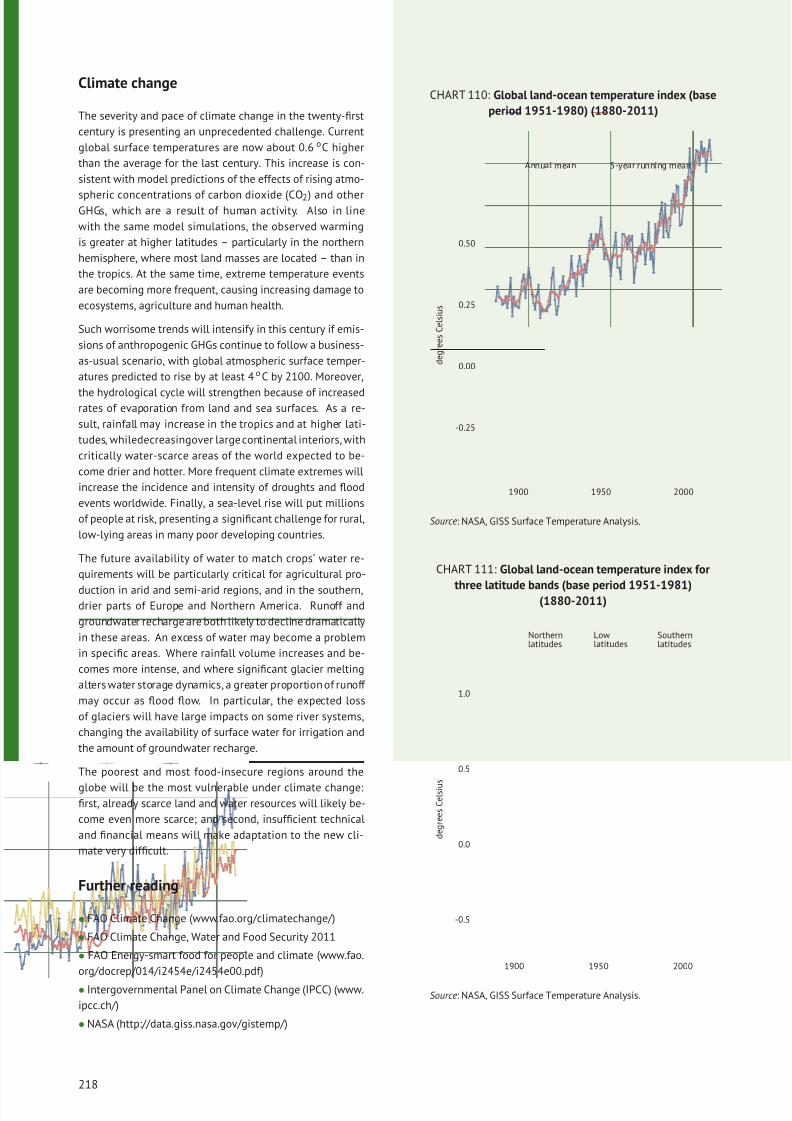
8/16/2019 Informe de la Fao 2013
http://slidepdf.com/reader/full/informe-de-la-fao-2013 236/307
Climate change
The severity and pace of climate change in the twenty-first
century is presenting an unprecedented challenge. Current
global surface temperatures are now about 0.6 oC higher
than the average for the last century. This increase is con-
sistent with model predictions of the effects of rising atmo-
spheric concentrations of carbon dioxide (CO2) and otherGHGs, which are a result of human activity. Also in line
with the same model simulations, the observed warming
is greater at higher latitudes – particularly in the northern
hemisphere, where most land masses are located – than in
the tropics. At the same time, extreme temperature events
are becoming more frequent, causing increasing damage to
ecosystems, agriculture and human health.
Such worrisome trends will intensify in this century if emis-
sions of anthropogenic GHGs continue to follow a business-
as-usual scenario, with global atmospheric surface temper-
atures predicted to rise by at least 4 o C by 2100. Moreover,
the hydrological cycle will strengthen because of increasedrates of evaporation from land and sea surfaces. As a re-
sult, rainfall may increase in the tropics and at higher lati-
tudes, whiledecreasingover largecontinental interiors, with
critically water-scarce areas of the world expected to be-
come drier and hotter. More frequent climate extremes will
increase the incidence and intensity of droughts and flood
events worldwide. Finally, a sea-level rise will put millions
of people at risk, presenting a significant challenge for rural,
low-lying areas in many poor developing countries.
The future availability of water to match crops’ water re-
quirements will be particularly critical for agricultural pro-
duction in arid and semi-arid regions, and in the southern,drier parts of Europe and Northern America. Runoff and
groundwater recharge are both likely to decline dramatically
in these areas. An excess of water may become a problem
in specific areas. Where rainfall volume increases and be-
comes more intense, and where significant glacier melting
alters water storage dynamics, a greater proportion of runoff
may occur as flood flow. In particular, the expected loss
of glaciers will have large impacts on some river systems,
changing the availability of surface water for irrigation and
the amount of groundwater recharge.
The poorest and most food-insecure regions around the
globe will be the most vulnerable under climate change:first, already scarce land and water resources will likely be-
come even more scarce; and second, insufficient technical
and financial means will make adaptation to the new cli-
mate very difficult.
Further reading
• FAO Climate Change (www.fao.org/climatechange/)
• FAO Climate Change, Water and Food Security 2011
• FAO Energy-smart food for people and climate (www.fao.
org/docrep/014/i2454e/i2454e00.pdf)
• Intergovernmental Panel on Climate Change (IPCC) (www.
ipcc.ch/)
• NASA (http://data.giss.nasa.gov/gistemp/)
CHART 110: Global land-ocean temperature index (base
period 1951-1980) (1880-2011)
-0.25
0.00
0.25
0.50
1900 1950 2000
d e g r e e s C e l s i u s
Annual mean 5-year running mean
Source: NASA, GISS Surface Temperature Analysis.
CHART 111: Global land-ocean temperature index for
three latitude bands (base period 1951-1981)(1880-2011)
-0.5
0.0
0.5
1.0
1900 1950 2000
d e g r e e s C e l s i u
s
Northernlatitudes
Lowlatitudes
Southernlatitudes
Source: NASA, GISS Surface Temperature Analysis.
218
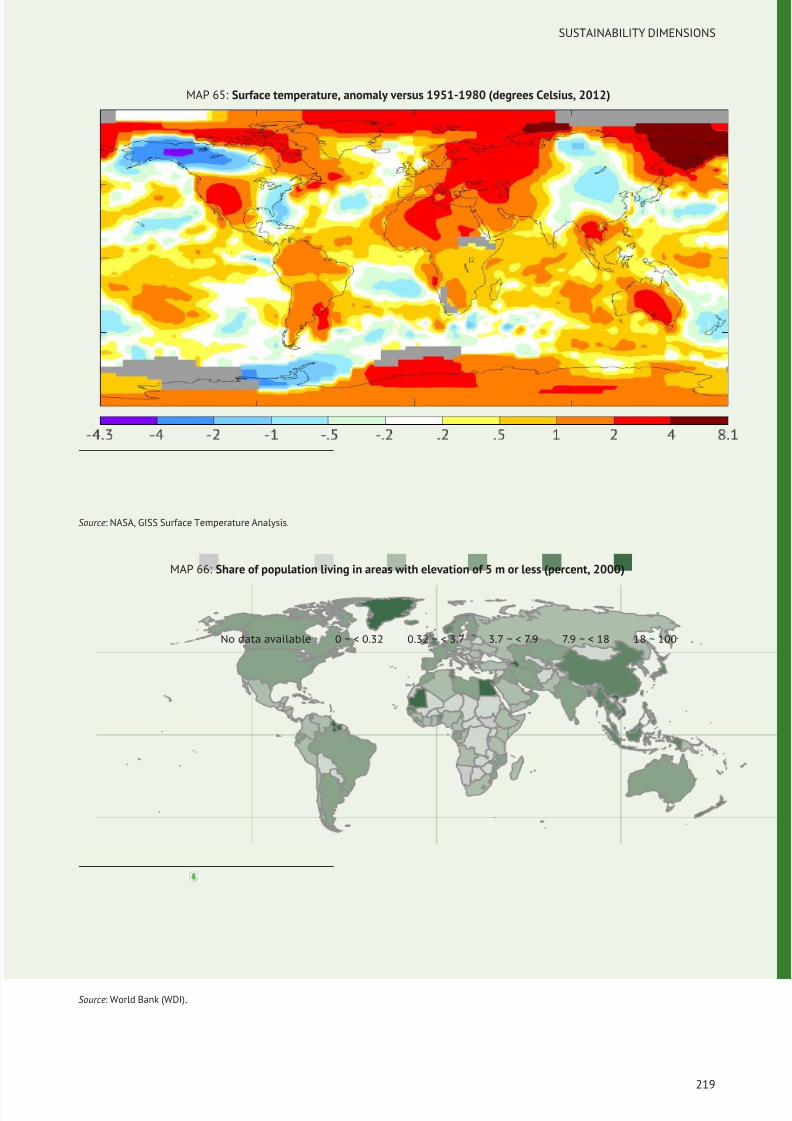
8/16/2019 Informe de la Fao 2013
http://slidepdf.com/reader/full/informe-de-la-fao-2013 237/307
SUSTAINABILITY DIMENSIONS
MAP 65: Surface temperature, anomaly versus 1951-1980 (degrees Celsius, 2012)
Source: NASA, GISS Surface Temperature Analysis.
MAP 66: Share of population living in areas with elevation of 5 m or less (percent, 2000)
No data available 0 ~ < 0.32 0.32 ~ < 3.7 3.7 ~ < 7.9 7.9 ~ < 18 18 ~ 100
Source: World Bank (WDI).
219
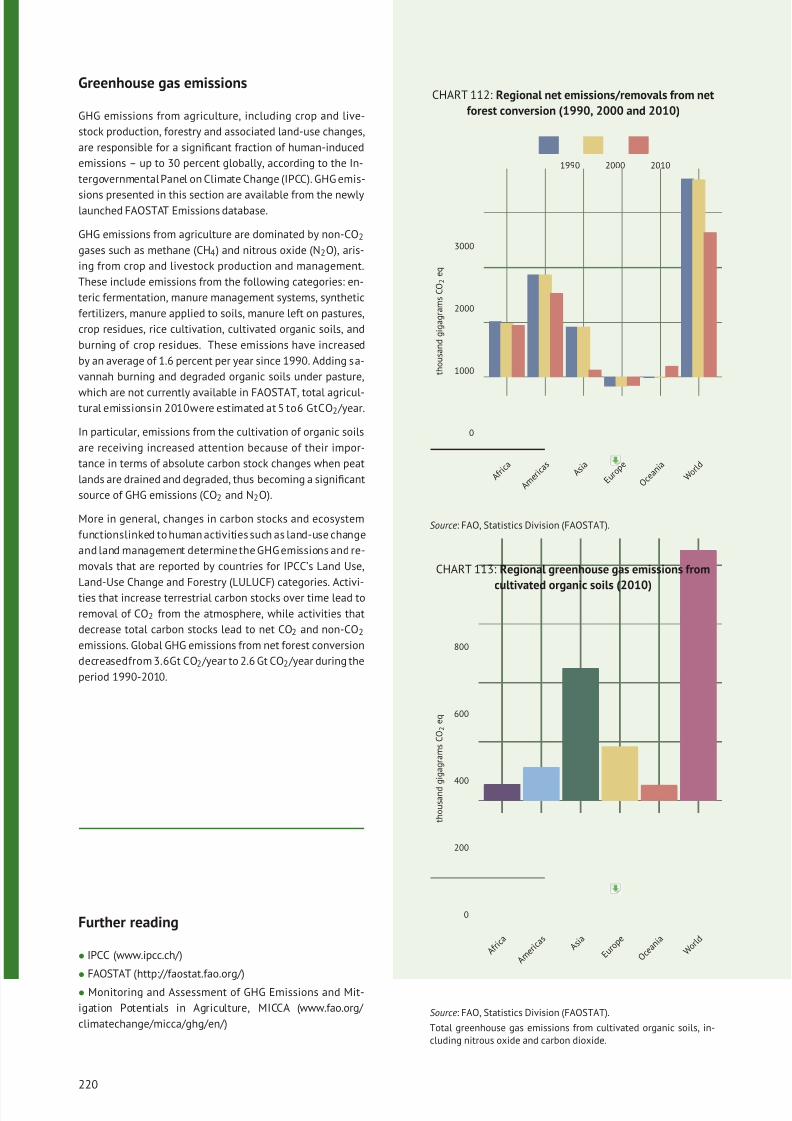
8/16/2019 Informe de la Fao 2013
http://slidepdf.com/reader/full/informe-de-la-fao-2013 238/307
Greenhouse gas emissions
GHG emissions from agriculture, including crop and live-
stock production, forestry and associated land-use changes,
are responsible for a significant fraction of human-induced
emissions – up to 30 percent globally, according to the In-
tergovernmental Panel on Climate Change (IPCC). GHG emis-
sions presented in this section are available from the newlylaunched FAOSTAT Emissions database.
GHG emissions from agriculture are dominated by non-CO2
gases such as methane (CH4) and nitrous oxide (N2O), aris-
ing from crop and livestock production and management.
These include emissions from the following categories: en-
teric fermentation, manure management systems, synthetic
fertilizers, manure applied to soils, manure left on pastures,
crop residues, rice cultivation, cultivated organic soils, and
burning of crop residues. These emissions have increased
by an average of 1.6 percent per year since 1990. Adding sa-
vannah burning and degraded organic soils under pasture,
which are not currently available in FAOSTAT, total agricul-tural emissionsin 2010were estimated at 5 to6 GtCO2 /year.
In particular, emissions from the cultivation of organic soils
are receiving increased attention because of their impor-
tance in terms of absolute carbon stock changes when peat
lands are drained and degraded, thus becoming a significant
source of GHG emissions (CO2 and N2O).
More in general, changes in carbon stocks and ecosystem
functionslinked to human activities such as land-use change
and land management determine the GHG emissions and re-
movals that are reported by countries for IPCC’s Land Use,
Land-Use Change and Forestry (LULUCF) categories. Activi-
ties that increase terrestrial carbon stocks over time lead to
removal of CO2 from the atmosphere, while activities that
decrease total carbon stocks lead to net CO2 and non-CO2
emissions. Global GHG emissions from net forest conversion
decreasedfrom 3.6Gt CO2 /year to 2.6 Gt CO2 /year during the
period 1990-2010.
Further reading
• IPCC (www.ipcc.ch/ )
• FAOSTAT (http://faostat.fao.org/ )
• Monitoring and Assessment of GHG Emissions and Mit-
igation Potentials in Agriculture, MICCA (www.fao.org/
climatechange/micca/ghg/en/)
CHART 112: Regional net emissions/removals from net
forest conversion (1990, 2000 and 2010)
0
1000
2000
3000
A f r i c a
A m e r i c a s
A s i a
E u r o p e
O c e a n i a
W o r l d
t h o u s a n d g i g a g r a m s C O 2 e q
1990 2000 2010
Source: FAO, Statistics Division (FAOSTAT).
CHART 113: Regional greenhouse gas emissions from
cultivated organic soils (2010)
0
200
400
600
800
A f r i c a
A m e r i c a s
A s i a
E u r o p e
O c e a n i a
W o r l d
t h o u s a n d g i g a g r a m s C O 2 e q
Source: FAO, Statistics Division (FAOSTAT).
Total greenhouse gas emissions from cultivated organic soils, in-cluding nitrous oxide and carbon dioxide.
220
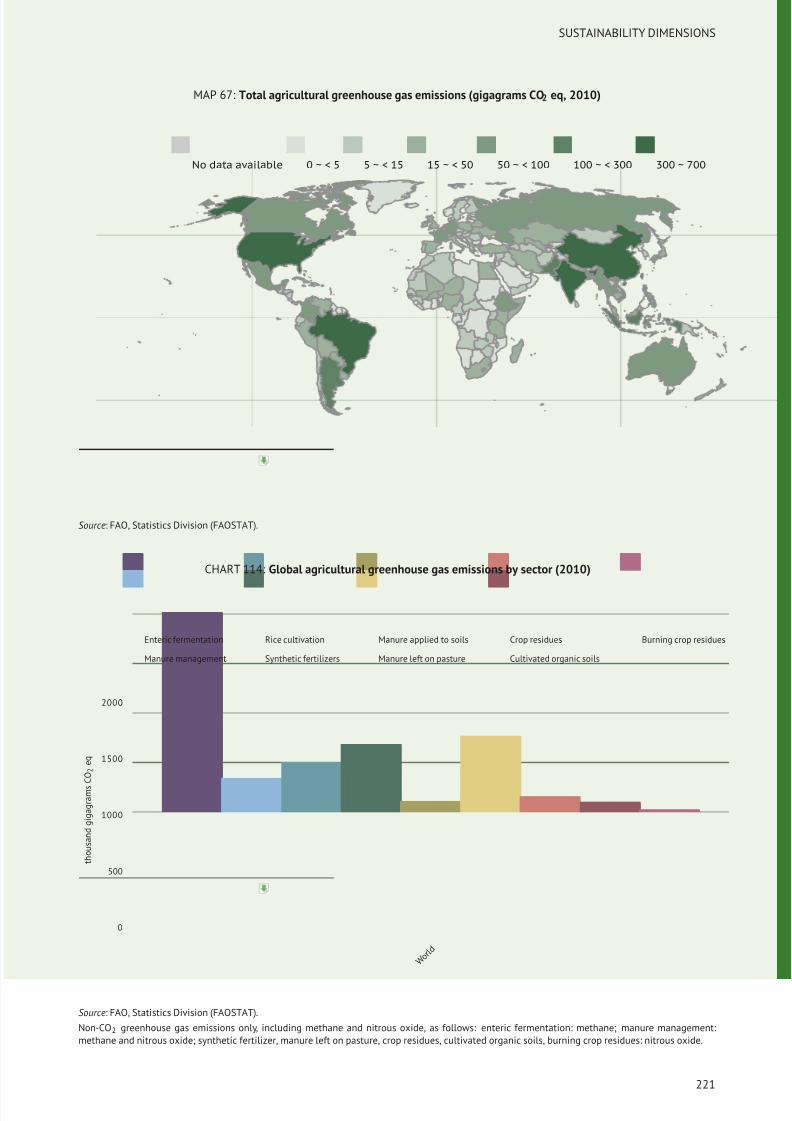
8/16/2019 Informe de la Fao 2013
http://slidepdf.com/reader/full/informe-de-la-fao-2013 239/307
SUSTAINABILITY DIMENSIONS
MAP 67: Total agricultural greenhouse gas emissions (gigagrams CO2 eq, 2010)
No data available 0 ~ < 5 5 ~ < 15 15 ~ < 50 50 ~ < 100 100 ~ < 300 300 ~ 700
Source: FAO, Statistics Division (FAOSTAT).
CHART 114: Global agricultural greenhouse gas emissions by sector (2010)
0
500
1000
1500
2000
W o r l d
t h o u s a n d g i g a g r a m s
C O 2 e q
Enteric fermentation
Manure management
Rice cultivation
Synthetic fertilizers
Manure applied to soils
Manure left on pasture
Crop residues
Cultivated organic soils
Burning crop residues
Source: FAO, Statistics Division (FAOSTAT).
Non-CO2 greenhouse gas emissions only, including methane and nitrous oxide, as follows: enteric fermentation: methane; manure management:methane and nitrous oxide; synthetic fertilizer, manure left on pasture, crop residues, cultivated organic soils, burning crop residues: nitrous oxide.
221
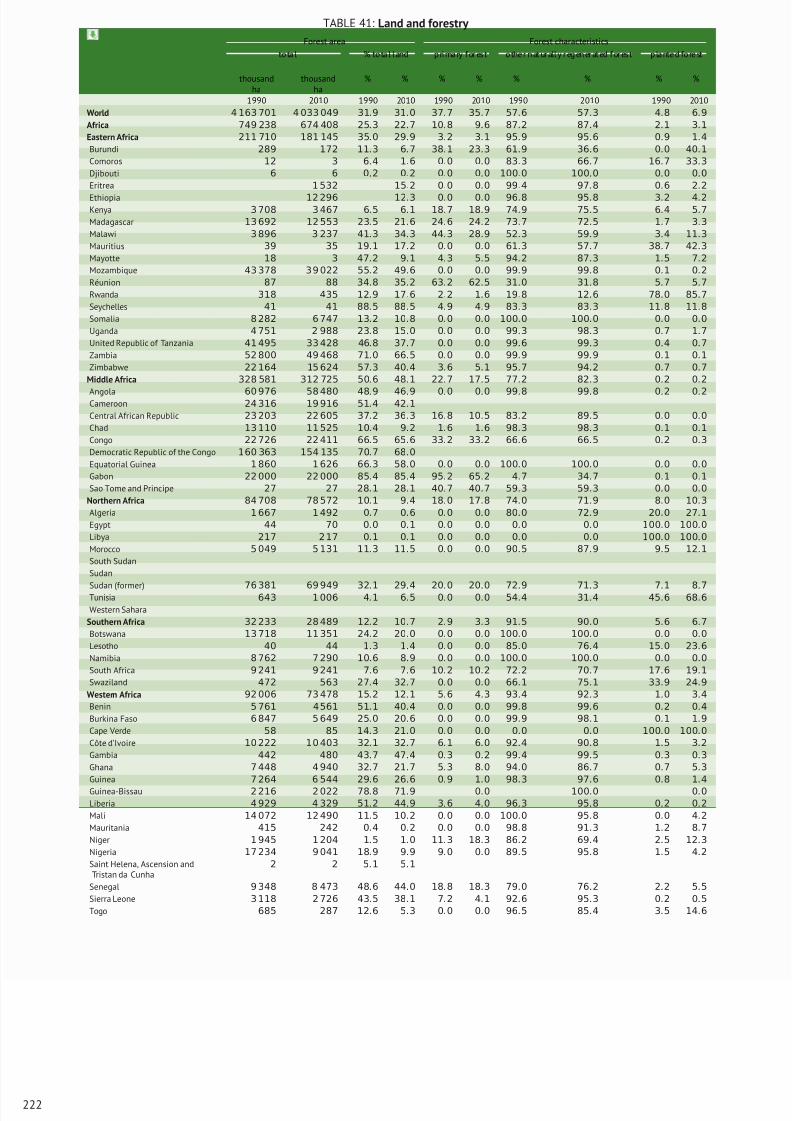
8/16/2019 Informe de la Fao 2013
http://slidepdf.com/reader/full/informe-de-la-fao-2013 240/307
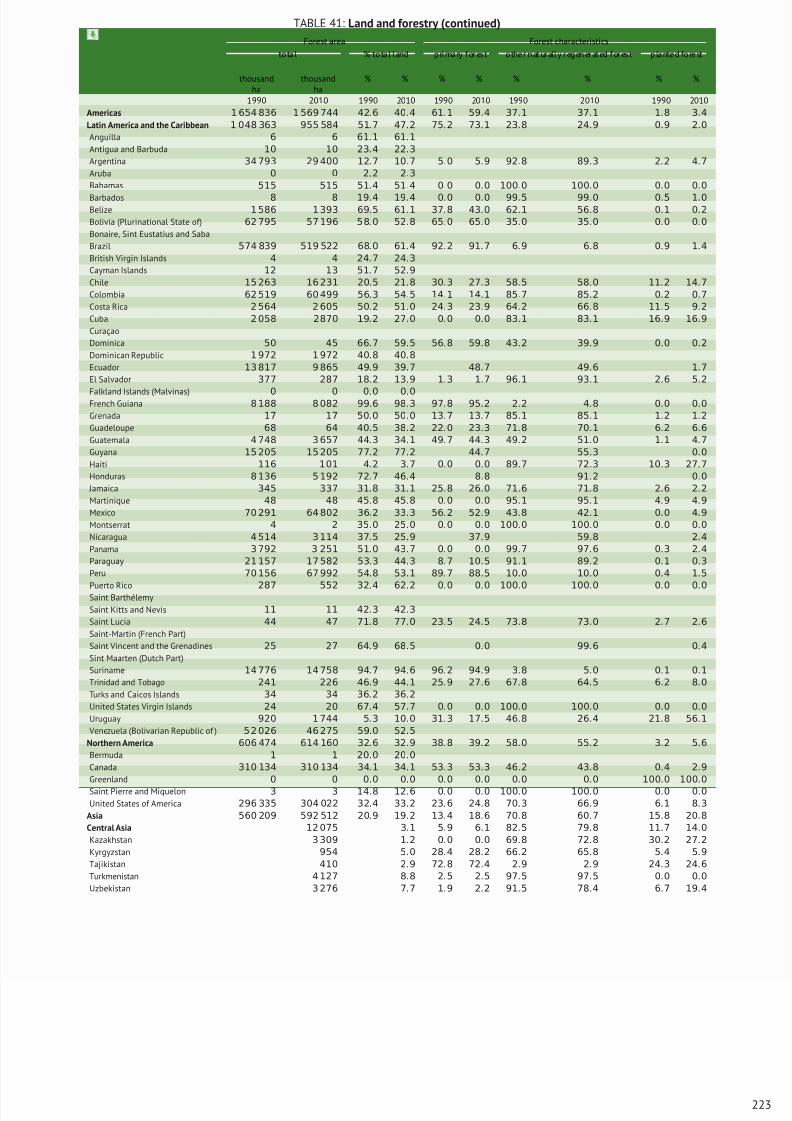
8/16/2019 Informe de la Fao 2013
http://slidepdf.com/reader/full/informe-de-la-fao-2013 241/307
TABLE 41: Land and forestry (continued)
Forest area Forest characteristics
total % total land primary forest othe r n aturally regen erated forest plante d fore st
thousandha
thousandha
% % % % % % % %
1990 2010 1990 2010 1990 2010 1990 2010 1990 2010
Americas 1 654 836 1 569 744 42.6 40.4 61.1 59.4 37.1 37.1 1.8 3.4
Latin America and the Caribbean 1 048 363 955 584 51.7 47.2 75.2 73.1 23.8 24.9 0.9 2.0
Anguilla 6 6 61.1 61.1
Antigua and Barbuda 10 10 23.4 22.3
Argentina 34 793 29 400 12.7 10.7 5.0 5.9 92.8 89.3 2.2 4.7
Aruba 0 0 2.2 2.3
Bahamas 515 515 51.4 51.4 0.0 0.0 100.0 100.0 0.0 0.0
Barbados 8 8 19.4 19.4 0.0 0.0 99.5 99.0 0.5 1.0Belize 1 586 1 393 69.5 61.1 37.8 43.0 62.1 56.8 0.1 0.2
Bolivia (Plurinational State of) 62 795 57 196 5 8.0 52.8 65.0 65.0 35.0 35.0 0.0 0.0
Bonaire, Sint Eustatius and Saba
Brazil 574 839 519 522 68.0 61.4 92.2 91.7 6.9 6.8 0.9 1.4
British Virgin Islands 4 4 24.7 24.3
Cayman Islands 12 13 51.7 52.9
Chile 15 263 16 231 20.5 21.8 30.3 27.3 58.5 58.0 11.2 14.7
Colombia 62 519 60 499 56.3 54.5 14.1 14.1 85.7 85.2 0.2 0.7
Costa Rica 2 564 2 605 50.2 51.0 24.3 23.9 64.2 66.8 11.5 9.2
Cuba 2 058 2870 19.2 27.0 0.0 0.0 83.1 83.1 16.9 16.9
Curaçao
Dominica 50 45 66.7 59.5 56.8 59.8 43.2 39.9 0.0 0.2
Dominican Republic 1 972 1 972 40.8 40.8
Ecuador 13 817 9 865 49.9 39.7 48.7 49.6 1.7
El Salvador 377 287 18.2 13.9 1.3 1.7 96.1 93.1 2.6 5.2
Falkland Islands (Malvinas) 0 0 0.0 0.0French Guiana 8 188 8 082 99.6 98.3 97.8 95.2 2.2 4.8 0.0 0.0
Grenada 17 17 50.0 50.0 13.7 13.7 85.1 85.1 1.2 1.2
Guadeloupe 68 64 40.5 38.2 22.0 23.3 71.8 70.1 6.2 6.6
Guatemala 4 748 3 657 44.3 34.1 49.7 44.3 49.2 51.0 1.1 4.7
Guyana 15 205 15 205 77.2 77.2 44.7 55.3 0.0
Haiti 116 101 4.2 3.7 0.0 0.0 89.7 72.3 10.3 27.7
Honduras 8 136 5 192 72.7 46.4 8.8 91.2 0.0
Jamaica 345 337 31.8 31.1 25.8 26.0 71.6 71.8 2.6 2.2
Martinique 48 48 45.8 45.8 0.0 0.0 95.1 95.1 4.9 4.9
Mexico 70 291 64 802 36.2 33.3 56.2 52.9 43.8 42.1 0.0 4.9
Montserrat 4 2 35.0 25.0 0.0 0.0 100.0 100.0 0.0 0.0
Nicaragua 4 514 3 114 37.5 25.9 37.9 59.8 2.4
Panama 3 792 3 251 51.0 43.7 0.0 0.0 99.7 97.6 0.3 2.4
Paraguay 21 157 17 582 53.3 44.3 8.7 10.5 91.1 89.2 0.1 0.3
Peru 70 156 67 992 54.8 53.1 89.7 88.5 10.0 10.0 0.4 1.5
Puerto Rico 287 552 32
.4 62
.2 0
.0 0
.0 100
.0 100
.0 0
.0 0
.0
Saint Barthélemy
Saint Kitts and Nevis 11 11 42.3 42.3
Saint Lucia 44 47 71.8 77.0 23.5 24.5 73.8 73.0 2.7 2.6
Saint-Martin (French Part)
Saint Vincent and the Grenadines 25 27 64.9 68.5 0.0 99.6 0.4
Sint Maarten (Dutch Part)
Suriname 14 776 14 758 94.7 94.6 96.2 94.9 3.8 5.0 0.1 0.1
Trinidad and Tobago 241 226 46.9 44.1 25.9 27.6 67.8 64.5 6.2 8.0
Turks and Caicos Islands 34 34 36.2 36.2
United States Virgin Islands 24 20 67.4 57.7 0.0 0.0 100.0 100.0 0.0 0.0
Uruguay 920 1 744 5.3 10.0 31.3 17.5 46.8 26.4 21.8 56.1
Venezuela (Bolivarian Republic of ) 5 2 026 46 275 59.0 52.5
Northern America 606 474 614 160 32.6 32.9 38.8 39.2 58.0 55.2 3.2 5.6
Bermuda 1 1 20.0 20.0
Canada 310 134 310 134 34.1 34.1 53.3 53.3 46.2 43.8 0.4 2.9
Greenland 0 0 0.0 0.0 0.0 0.0 0.0 0.0 100.0 100.0
Saint Pierre and Miquelon 3 3 14.8 12.6 0.0 0.0 100.0 100.0 0.0 0.0
United States of America 296 335 304 022 32.4 33.2 23.6 24.8 70.3 66.9 6.1 8.3
Asia 560 209 592 512 20.9 19.2 13.4 18.6 70.8 60.7 15.8 20.8
Central Asia 12 075 3.1 5.9 6.1 82.5 79.8 11.7 14.0
Kazakhstan 3 309 1.2 0.0 0.0 69.8 72.8 30.2 27.2
Kyrgyzstan 954 5.0 28.4 28.2 66.2 65.8 5.4 5.9
Tajikistan 410 2.9 72.8 72.4 2.9 2.9 24.3 24.6
Turkmenistan 4 127 8.8 2.5 2.5 97.5 97.5 0.0 0.0
Uzbekistan 3 276 7.7 1.9 2.2 91.5 78.4 6.7 19.4
223
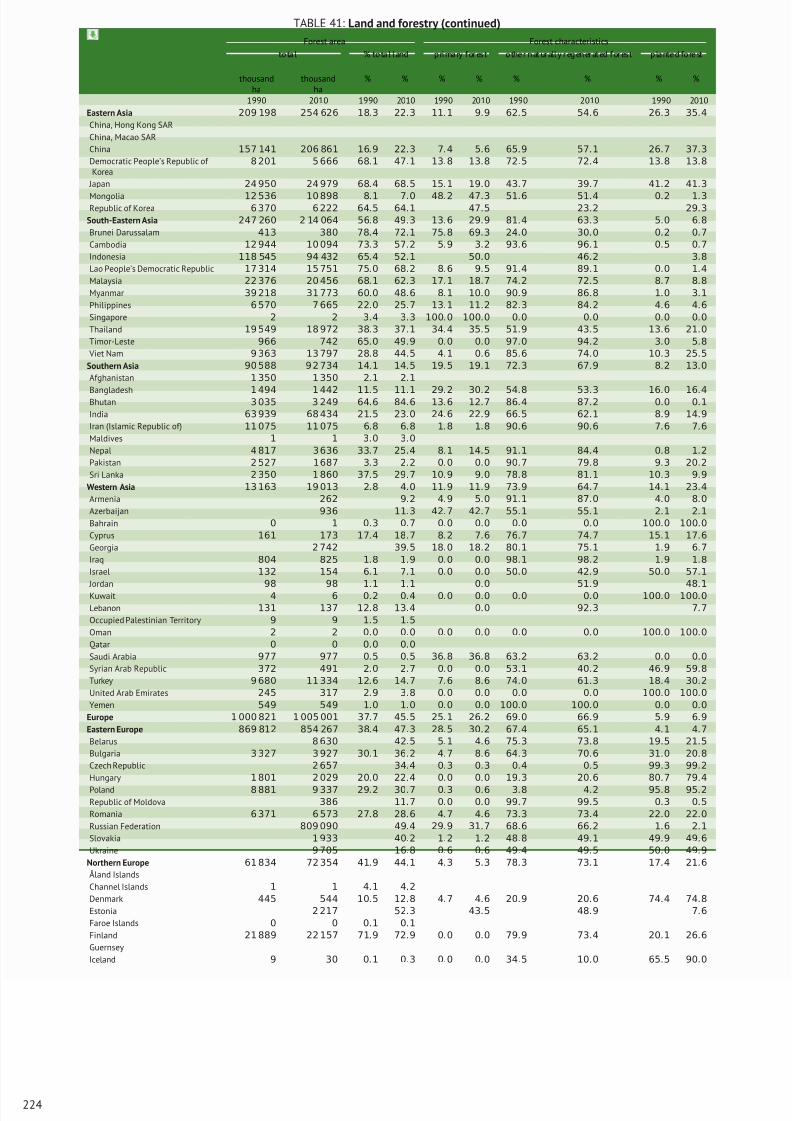
8/16/2019 Informe de la Fao 2013
http://slidepdf.com/reader/full/informe-de-la-fao-2013 242/307
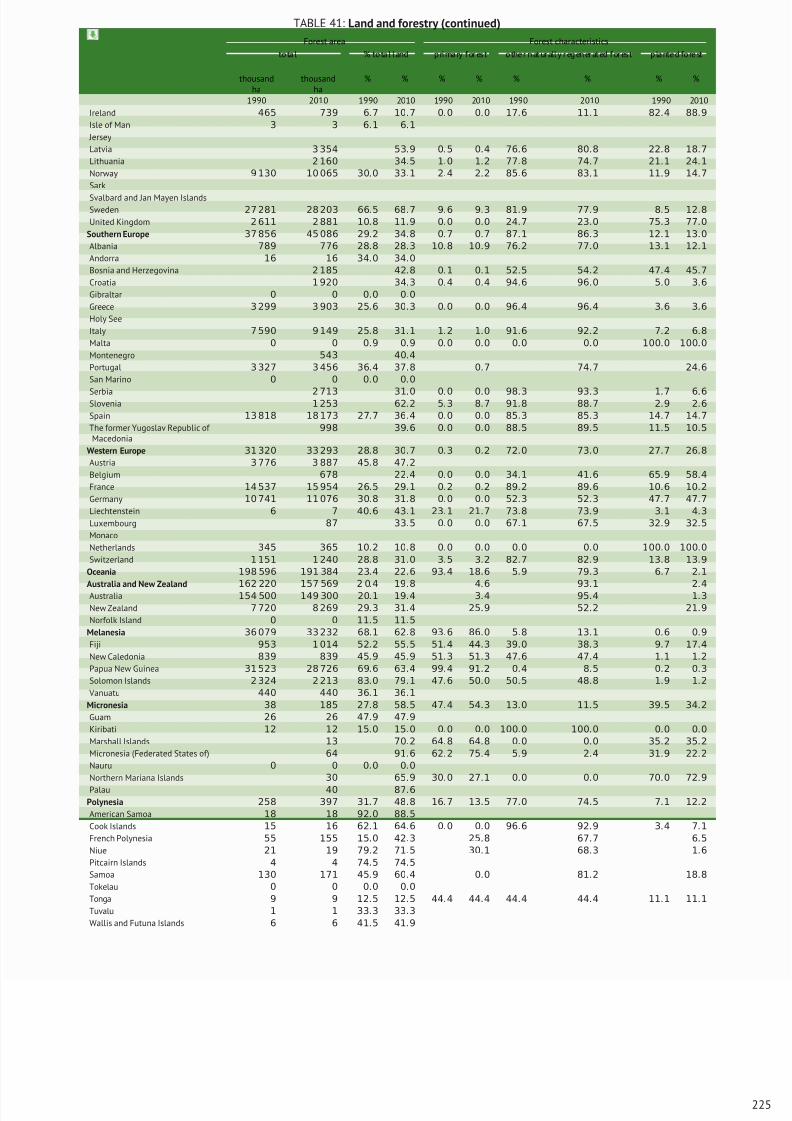
8/16/2019 Informe de la Fao 2013
http://slidepdf.com/reader/full/informe-de-la-fao-2013 243/307
TABLE 41: Land and forestry (continued)
Forest area Forest characteristics
total % total land primary forest othe r n aturally regen erated forest plante d fore st
thousandha
thousandha
% % % % % % % %
1990 2010 1990 2010 1990 2010 1990 2010 1990 2010
Ireland 465 739 6.7 10.7 0.0 0.0 17.6 11.1 82.4 88.9
Isle of Man 3 3 6.1 6.1
Jersey
Latvia 3 354 53.9 0.5 0.4 76.6 80.8 22.8 18.7
Lithuania 2 160 34.5 1.0 1.2 77.8 74.7 21.1 24.1
Norway 9 130 10 065 30.0 33.1 2.4 2.2 85.6 83.1 11.9 14.7
Sark
Svalbard and Jan Mayen IslandsSweden 27 281 28 203 66.5 68.7 9.6 9.3 81.9 77.9 8.5 12.8
United Kingdom 2 611 2 881 10.8 11.9 0.0 0.0 24.7 23.0 75.3 77.0
Southern Europe 37 856 45 086 29.2 34.8 0.7 0.7 87.1 86.3 12.1 13.0
Albania 789 776 28.8 28.3 10.8 10.9 76.2 77.0 13.1 12.1
Andorra 16 16 34.0 34.0
Bosnia and Herzegovina 2 185 42.8 0.1 0.1 52.5 54.2 47.4 45.7
Croatia 1 920 34.3 0.4 0.4 94.6 96.0 5.0 3.6
Gibraltar 0 0 0.0 0.0
Greece 3 299 3 903 25.6 30.3 0.0 0.0 96.4 96.4 3.6 3.6
Holy See
Italy 7 590 9 149 25.8 31.1 1.2 1.0 91.6 92.2 7.2 6.8
Malta 0 0 0.9 0.9 0.0 0.0 0.0 0.0 100.0 100.0
Montenegro 543 40.4
Portugal 3 327 3 456 36.4 37.8 0.7 74.7 24.6
San Marino 0 0 0.0 0.0
Serbia 2 713 31.0 0.0 0.0 98.3 93.3 1.7 6.6Slovenia 1 253 62.2 5.3 8.7 91.8 88.7 2.9 2.6
Spain 13 818 18 173 27.7 36.4 0.0 0.0 85.3 85.3 14.7 14.7
The former Yugoslav Republic of Macedonia
998 39.6 0.0 0.0 88.5 89.5 11.5 10.5
Western Europe 31 320 33 293 28.8 30.7 0.3 0.2 72.0 73.0 27.7 26.8
Austria 3 776 3 887 45.8 47.2
Belgium 678 22.4 0.0 0.0 34.1 41.6 65.9 58.4
France 14 537 15 954 26.5 29.1 0.2 0.2 89.2 89.6 10.6 10.2
Germany 10 741 11 076 30.8 31.8 0.0 0.0 52.3 52.3 47.7 47.7
Liechtenstein 6 7 40.6 43.1 23.1 21.7 73.8 73.9 3.1 4.3
Luxembourg 87 33.5 0.0 0.0 67.1 67.5 32.9 32.5
Monaco
Netherlands 345 365 10.2 10.8 0.0 0.0 0.0 0.0 100.0 100.0
Switzerland 1 151 1 240 28.8 31.0 3.5 3.2 82.7 82.9 13.8 13.9
Oceania 198 596 191 384 23.4 22.6 93.4 18.6 5.9 79.3 6.7 2.1
Australia and New Zealand 162 220 157 569 2 0.4 19.8 4.6 93.1 2.4
Australia 154 500 149 300 20.1 19.4 3.4 95.4 1.3
New Zealand 7 720 8 269 29.3 31.4 25.9 52.2 21.9
Norfolk Island 0 0 11.5 11.5
Melanesia 36 079 33 232 68.1 62.8 93.6 86.0 5.8 13.1 0.6 0.9
Fiji 953 1 014 52.2 55.5 51.4 44.3 39.0 38.3 9.7 17.4
New Caledonia 839 839 45.9 45.9 51.3 51.3 47.6 47.4 1.1 1.2
Papua New Guinea 31 523 28 726 69.6 63.4 99.4 91.2 0.4 8.5 0.2 0.3
Solomon Islands 2 324 2 213 83.0 79.1 47.6 50.0 50.5 48.8 1.9 1.2
Vanuatu 440 440 36.1 36.1
Micronesia 38 185 27.8 58.5 47.4 54.3 13.0 11.5 39.5 34.2
Guam 26 26 47.9 47.9
Kiribati 12 12 15.0 15.0 0.0 0.0 100.0 100.0 0.0 0.0
Marshall Islands 13 70.2 64.8 64.8 0.0 0.0 35.2 35.2
Micronesia (Federated States of) 64 91.6 62.2 75.4 5.9 2.4 31.9 22.2
Nauru 0 0 0.0 0.0
Northern Mariana Islands 30 65.9 30.0 27.1 0.0 0.0 70.0 72.9
Palau 40 87.6
Polynesia 258 397 31.7 48.8 16.7 13.5 77.0 74.5 7.1 12.2
American Samoa 18 18 92.0 88.5
Cook Islands 15 16 62.1 64.6 0.0 0.0 96.6 92.9 3.4 7.1
French Polynesia 55 155 15.0 42.3 25.8 67.7 6.5
Niue 21 19 79.2 71.5 30.1 68.3 1.6
Pitcairn Islands 4 4 74.5 74.5
Samoa 130 171 45.9 60.4 0.0 81.2 18.8
Tokelau 0 0 0.0 0.0
Tonga 9 9 12.5 12.5 44.4 44.4 44.4 44.4 11.1 11.1
Tuvalu 1 1 33.3 33.3
Wallis and Futuna Islands 6 6 41.5 41.9
225
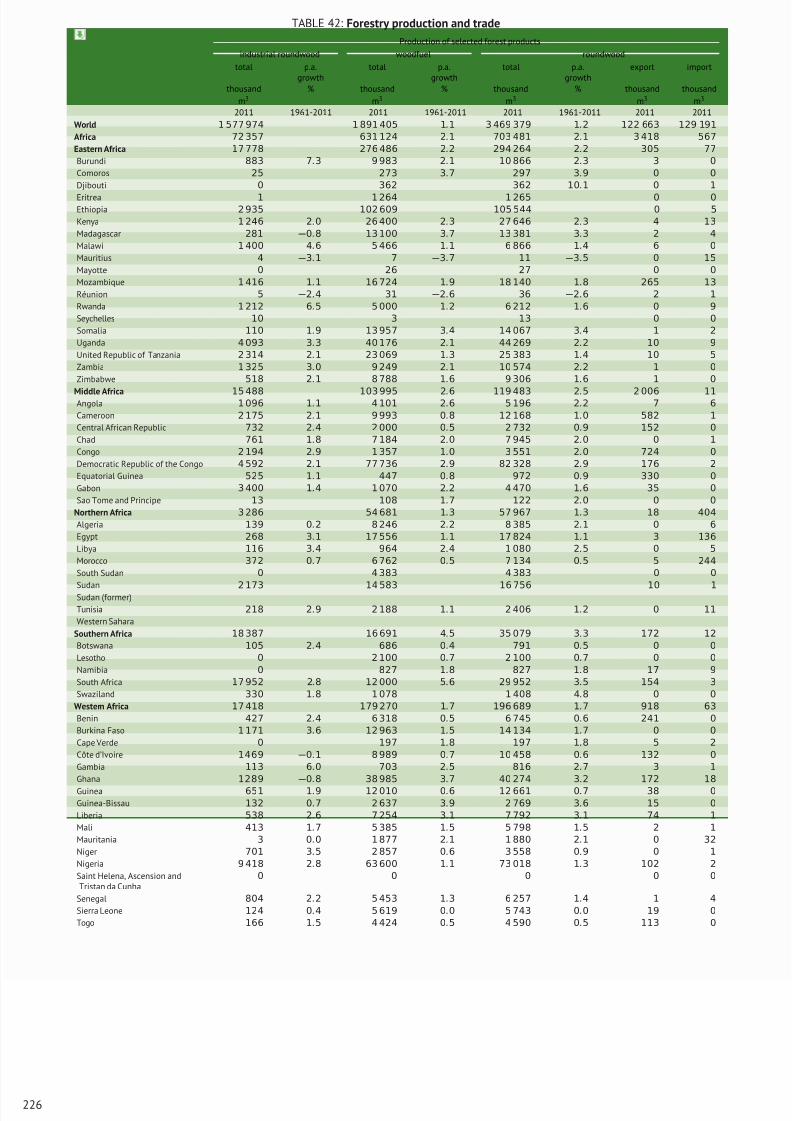
8/16/2019 Informe de la Fao 2013
http://slidepdf.com/reader/full/informe-de-la-fao-2013 244/307
TABLE 42: Forestry production and trade
Production of selected forest products
industrial roundwood woodfuel roundwood
total p.a.growth
total p.a.growth
total p.a.growth
export import
thousand
m3
% thousand
m3
% thousand
m3
% thousand
m3
thousand
m3
2011 1961-2011 2011 1961-2011 2011 1961-2011 2011 2011
World 1 577 974 1 891 405 1.1 3 469 379 1.2 122 663 129 191
Africa 72 357 631 124 2.1 703 481 2.1 3 418 567
Eastern Africa 17 778 276 486 2.2 294 264 2.2 305 77
Burundi 883 7.3 9 983 2.1 10 866 2.3 3 0
Comoros 25 273 3.7 297 3.9 0 0
Djibouti 0 362 362 10.1 0 1
Eritrea 1 1 264 1 265 0 0Ethiopia 2 935 102 609 105 544 0 5
Kenya 1 246 2.0 26 400 2.3 27 646 2.3 4 13
Madagascar 281 −0.8 13 100 3.7 13 381 3.3 2 4
Malawi 1 400 4.6 5 466 1.1 6 866 1.4 6 0
Mauritius 4 −3.1 7 −3.7 11 −3.5 0 15
Mayotte 0 26 27 0 0
Mozambique 1 416 1.1 16 724 1.9 18 140 1.8 265 13
Réunion 5 −2.4 31 −2.6 36 −2.6 2 1
Rwanda 1 212 6.5 5 000 1.2 6 212 1.6 0 9
Seychelles 10 3 13 0 0
Somalia 110 1.9 13 957 3.4 14 067 3.4 1 2
Uganda 4 093 3.3 40 176 2.1 44 269 2.2 10 9
United Republic of Tanzania 2 314 2.1 23 069 1.3 25 383 1.4 10 5
Zambia 1 325 3.0 9 249 2.1 10 574 2.2 1 0
Zimbabwe 518 2.1 8 788 1.6 9 306 1.6 1 0
Middle Africa 15 488 103 995 2.6 119 483 2.5 2 006 11Angola 1 096 1.1 4 101 2.6 5 196 2.2 7 6
Cameroon 2 175 2.1 9 993 0.8 12 168 1.0 582 1
Central African Republic 732 2.4 2 000 0.5 2 732 0.9 152 0
Chad 761 1.8 7 184 2.0 7 945 2.0 0 1
Congo 2 194 2.9 1 357 1.0 3 551 2.0 724 0
Democratic Republic of the Congo 4 592 2.1 77 736 2.9 82 328 2.9 176 2
Equatorial Guinea 525 1.1 447 0.8 972 0.9 330 0
Gabon 3 400 1.4 1 070 2.2 4 470 1.6 35 0
Sao Tome and Principe 13 108 1.7 122 2.0 0 0
Northern Africa 3 286 54 681 1.3 57 967 1.3 18 404
Algeria 139 0.2 8 246 2.2 8 385 2.1 0 6
Egypt 268 3.1 17 556 1.1 17 824 1.1 3 136
Libya 116 3.4 964 2.4 1 080 2.5 0 5
Morocco 372 0.7 6 762 0.5 7 134 0.5 5 244
South Sudan 0 4 383 4 383 0 0
Sudan 2 173 14 583 16 756 10 1
Sudan (former)
Tunisia 218 2.9 2 188 1.1 2 406 1.2 0 11
Western Sahara
Southern Africa 18 387 16 691 4.5 35 079 3.3 172 12
Botswana 105 2.4 686 0.4 791 0.5 0 0
Lesotho 0 2 100 0.7 2 100 0.7 0 0
Namibia 0 827 1.8 827 1.8 17 9
South Africa 17 952 2.8 12 000 5.6 29 952 3.5 154 3
Swaziland 330 1.8 1 078 1 408 4.8 0 0
Western Africa 17 418 179 270 1.7 196 689 1.7 918 63
Benin 427 2.4 6 318 0.5 6 745 0.6 241 0
Burkina Faso 1 171 3.6 12 963 1.5 14 134 1.7 0 0
Cape Verde 0 197 1.8 197 1.8 5 2
Côte d’Ivoire 1469 −0.1 8 989 0.7 10 458 0.6 132 0
Gambia 113 6.0 703 2.5 816 2.7 3 1
Ghana 1289 −0.8 38 985 3.7 40 274 3.2 172 18
Guinea 651 1.9 12 010 0.6 12 661 0.7 38 0
Guinea-Bissau 132 0.7 2 637 3.9 2 769 3.6 15 0
Liberia 538 2.6 7 254 3.1 7 792 3.1 74 1
Mali 413 1.7 5 385 1.5 5 798 1.5 2 1
Mauritania 3 0.0 1 877 2.1 1 880 2.1 0 32
Niger 701 3.5 2 857 0.6 3 558 0.9 0 1
Nigeria 9 418 2.8 63 600 1.1 73 018 1.3 102 2
Saint Helena, Ascension andTristan da Cunha
0 0 0 0 0
Senegal 804 2.2 5 453 1.3 6 257 1.4 1 4
Sierra Leone 124 0.4 5 619 0.0 5 743 0.0 19 0
Togo 166 1.5 4 424 0.5 4 590 0.5 113 0
226
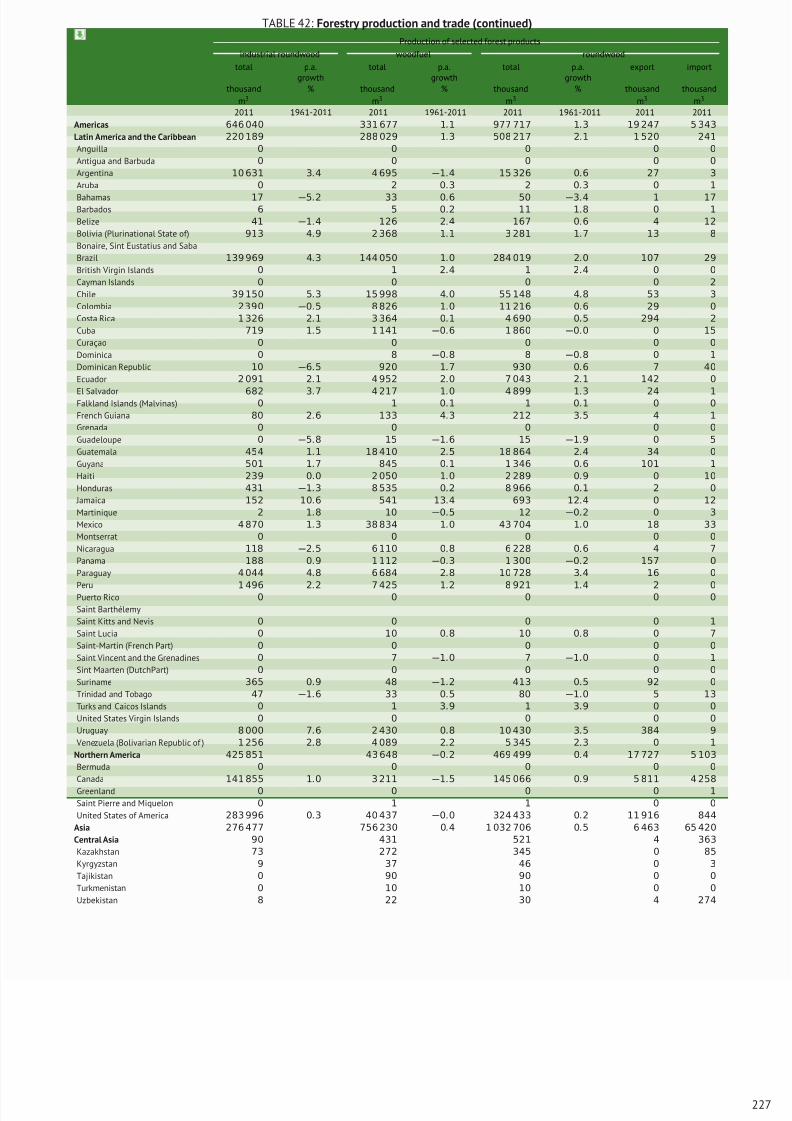
8/16/2019 Informe de la Fao 2013
http://slidepdf.com/reader/full/informe-de-la-fao-2013 245/307
TABLE 42: Forestry production and trade (continued)
Production of selected forest products
industrial roundwood woodfuel roundwood
total p.a.growth
total p.a.growth
total p.a.growth
export import
thousand
m3
% thousand
m3
% thousand
m3
% thousand
m3
thousand
m3
2011 1961-2011 2011 1961-2011 2011 1961-2011 2011 2011
Americas 646 040 331 677 1.1 977 717 1.3 19 247 5 343
Latin America and the Caribbean 220 189 288 029 1.3 508 217 2.1 1 520 241
Anguilla 0 0 0 0 0
Antigua and Barbuda 0 0 0 0 0
Argentina 10 631 3.4 4 695 −1.4 15 326 0.6 27 3
Aruba 0 2 0.3 2 0.3 0 1
Bahamas 17 −5.2 33 0.6 50 −3.4 1 17Barbados 6 5 0.2 11 1.8 0 1
Belize 41 −1.4 126 2.4 167 0.6 4 12
Bolivia (Plurinational State of) 913 4.9 2 368 1.1 3 281 1.7 13 8
Bonaire, Sint Eustatius and Saba
Brazil 139 969 4.3 144 050 1.0 284 019 2.0 107 29
British Virgin Islands 0 1 2.4 1 2.4 0 0
Cayman Islands 0 0 0 0 2
Chile 39 150 5.3 15 998 4.0 55 148 4.8 53 3
Colombia 2390 −0.5 8 826 1.0 11 216 0.6 29 0
Costa Rica 1 326 2.1 3 364 0.1 4 690 0.5 294 2
Cuba 719 1.5 1 141 −0.6 1 860 −0.0 0 15
Curaçao 0 0 0 0 0
Dominica 0 8 −0.8 8 −0.8 0 1
Dominican Republic 10 −6.5 920 1.7 930 0.6 7 40
Ecuador 2 091 2.1 4 952 2.0 7 043 2.1 142 0
El Salvador 682 3.7 4 217 1.0 4 899 1.3 24 1Falkland Islands (Malvinas) 0 1 0.1 1 0.1 0 0
French Guiana 80 2.6 133 4.3 212 3.5 4 1
Grenada 0 0 0 0 0
Guadeloupe 0 −5.8 15 −1.6 15 −1.9 0 5
Guatemala 454 1.1 18 410 2.5 18 864 2.4 34 0
Guyana 501 1.7 845 0.1 1 346 0.6 101 1
Haiti 239 0.0 2 050 1.0 2 289 0.9 0 10
Honduras 431 −1.3 8 535 0.2 8 966 0.1 2 0
Jamaica 152 10.6 541 13.4 693 12.4 0 12
Martinique 2 1.8 10 −0.5 12 −0.2 0 3
Mexico 4 870 1.3 38 834 1.0 43 704 1.0 18 33
Montserrat 0 0 0 0 0
Nicaragua 118 −2.5 6 110 0.8 6 228 0.6 4 7
Panama 188 0.9 1 112 −0.3 1 300 −0.2 157 0
Paraguay 4 044 4.8 6 684 2.8 10 728 3.4 16 0
Peru 1 496 2
.2 7 425 1
.2 8 921 1
.4 2 0
Puerto Rico 0 0 0 0 0
Saint Barthélemy
Saint Kitts and Nevis 0 0 0 0 1
Saint Lucia 0 10 0.8 10 0.8 0 7
Saint-Martin (French Part) 0 0 0 0 0
Saint Vincent and the Grenadines 0 7 −1.0 7 −1.0 0 1
Sint Maarten (DutchPart) 0 0 0 0 0
Suriname 365 0.9 48 −1.2 413 0.5 92 0
Trinidad and Tobago 47 −1.6 33 0.5 80 −1.0 5 13
Turks and Caicos Islands 0 1 3.9 1 3.9 0 0
United States Virgin Islands 0 0 0 0 0
Uruguay 8 000 7.6 2 430 0.8 10 430 3.5 384 9
Venezuela (Bolivarian Republic of ) 1 256 2.8 4 089 2.2 5 345 2.3 0 1
Northern America 425 851 43 648 −0.2 469 499 0.4 17 727 5 103
Bermuda 0 0 0 0 0
Canada 141 855 1.0 3 211 −1.5 145 066 0.9 5 811 4 258
Greenland 0 0 0 0 1
Saint Pierre and Miquelon 0 1 1 0 0
United States of America 283 996 0.3 40 437 −0.0 324 433 0.2 11 916 844
Asia 276 477 756 230 0.4 1 032 706 0.5 6 463 65 420
Central Asia 90 431 521 4 363
Kazakhstan 73 272 345 0 85
Kyrgyzstan 9 37 46 0 3
Tajikistan 0 90 90 0 0
Turkmenistan 0 10 10 0 0
Uzbekistan 8 22 30 4 274
227
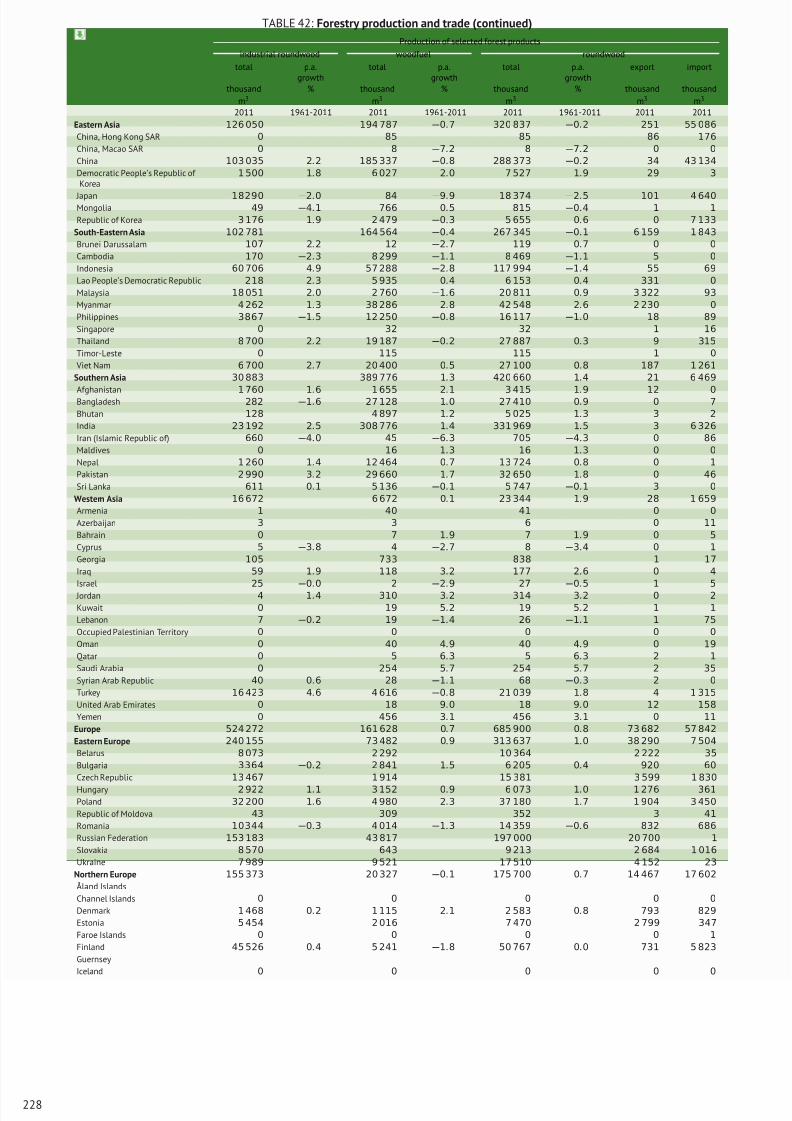
8/16/2019 Informe de la Fao 2013
http://slidepdf.com/reader/full/informe-de-la-fao-2013 246/307
TABLE 42: Forestry production and trade (continued)
Production of selected forest products
industrial roundwood woodfuel roundwood
total p.a.growth
total p.a.growth
total p.a.growth
export import
thousand
m3
% thousand
m3
% thousand
m3
% thousand
m3
thousand
m3
2011 1961-2011 2011 1961-2011 2011 1961-2011 2011 2011
Eastern Asia 126 050 194 787 −0.7 320 837 −0.2 251 55 086
China, Hong Kong SAR 0 85 85 86 176
China, Macao SAR 0 8 −7.2 8 −7.2 0 0
China 103 035 2.2 185 337 −0.8 288 373 −0.2 34 43 134
Democratic People’s Republic of Korea
1 500 1.8 6 027 2.0 7 527 1.9 29 3
Japan 18290 −2.0 84 −9.9 18 374 −2.5 101 4 640Mongolia 49 −4.1 766 0.5 815 −0.4 1 1
Republic of Korea 3 176 1.9 2 479 −0.3 5 655 0.6 0 7 133
South-Eastern Asia 102 781 164 564 −0.4 267 345 −0.1 6 159 1 843
Brunei Darussalam 107 2.2 12 −2.7 119 0.7 0 0
Cambodia 170 −2.3 8 299 −1.1 8 469 −1.1 5 0
Indonesia 60 706 4.9 57 288 −2.8 117 994 −1.4 55 69
Lao People’s Democratic Republic 218 2.3 5 935 0.4 6 153 0.4 331 0
Malaysia 18 051 2.0 2 760 −1.6 20 811 0.9 3 322 93
Myanmar 4 262 1.3 38 286 2.8 42 548 2.6 2 230 0
Philippines 3867 −1.5 12 250 −0.8 16 117 −1.0 18 89
Singapore 0 32 32 1 16
Thailand 8 700 2.2 19 187 −0.2 27 887 0.3 9 315
Timor-Leste 0 115 115 1 0
Viet Nam 6 700 2.7 20 400 0.5 27 100 0.8 187 1 261
Southern Asia 30 883 389 776 1.3 420 660 1.4 21 6 469
Afghanistan 1 760 1.6 1 655 2.1 3 415 1.9 12 0Bangladesh 282 −1.6 27 128 1.0 27 410 0.9 0 7
Bhutan 128 4 897 1.2 5 025 1.3 3 2
India 23 192 2.5 308 776 1.4 331 969 1.5 3 6 326
Iran (Islamic Republic of) 660 −4.0 45 −6.3 705 −4.3 0 86
Maldives 0 16 1.3 16 1.3 0 0
Nepal 1 260 1.4 12 464 0.7 13 724 0.8 0 1
Pakistan 2 990 3.2 29 660 1.7 32 650 1.8 0 46
Sri Lanka 611 0.1 5 136 −0.1 5 747 −0.1 3 0
Western Asia 16 672 6 672 0.1 23 344 1.9 28 1 659
Armenia 1 40 41 0 0
Azerbaijan 3 3 6 0 11
Bahrain 0 7 1.9 7 1.9 0 5
Cyprus 5 −3.8 4 −2.7 8 −3.4 0 1
Georgia 105 733 838 1 17
Iraq 59 1.9 118 3.2 177 2.6 0 4
Israel 25 −0.0 2 −2.9 27 −0.5 1 5
Jordan 4 1.4 310 3.2 314 3.2 0 2
Kuwait 0 19 5.2 19 5.2 1 1
Lebanon 7 −0.2 19 −1.4 26 −1.1 1 75
Occupied Palestinian Territory 0 0 0 0 0
Oman 0 40 4.9 40 4.9 0 19
Qatar 0 5 6.3 5 6.3 2 1
Saudi Arabia 0 254 5.7 254 5.7 2 35
Syrian Arab Republic 40 0.6 28 −1.1 68 −0.3 2 0
Turkey 16 423 4.6 4 616 −0.8 21 039 1.8 4 1 315
United Arab Emirates 0 18 9.0 18 9.0 12 158
Yemen 0 456 3.1 456 3.1 0 11
Europe 524 272 161 628 0.7 685 900 0.8 73 682 57 842
Eastern Europe 240 155 73 482 0.9 313 637 1.0 38 290 7 504
Belarus 8 073 2 292 10 364 2 222 35
Bulgaria 3364 −0.2 2 841 1.5 6 205 0.4 920 60
Czech Republic 13 467 1 914 15 381 3 599 1 830
Hungary 2 922 1.1 3 152 0.9 6 073 1.0 1 276 361
Poland 32 200 1.6 4 980 2.3 37 180 1.7 1 904 3 450
Republic of Moldova 43 309 352 3 41
Romania 10344 −0.3 4 014 −1.3 14 359 −0.6 832 686
Russian Federation 153 183 43 817 197 000 20 700 1
Slovakia 8 570 643 9 213 2 684 1 016
Ukraine 7 989 9 521 17 510 4 152 23
Northern Europe 155 373 20 327 −0.1 175 700 0.7 14 467 17 602
Åland Islands
Channel Islands 0 0 0 0 0
Denmark 1 468 0.2 1 115 2.1 2 583 0.8 793 829
Estonia 5 454 2 016 7 470 2 799 347
Faroe Islands 0 0 0 0 1
Finland 45 526 0.4 5 241 −1.8 50 767 0.0 731 5 823
Guernsey
Iceland 0 0 0 0 0
228
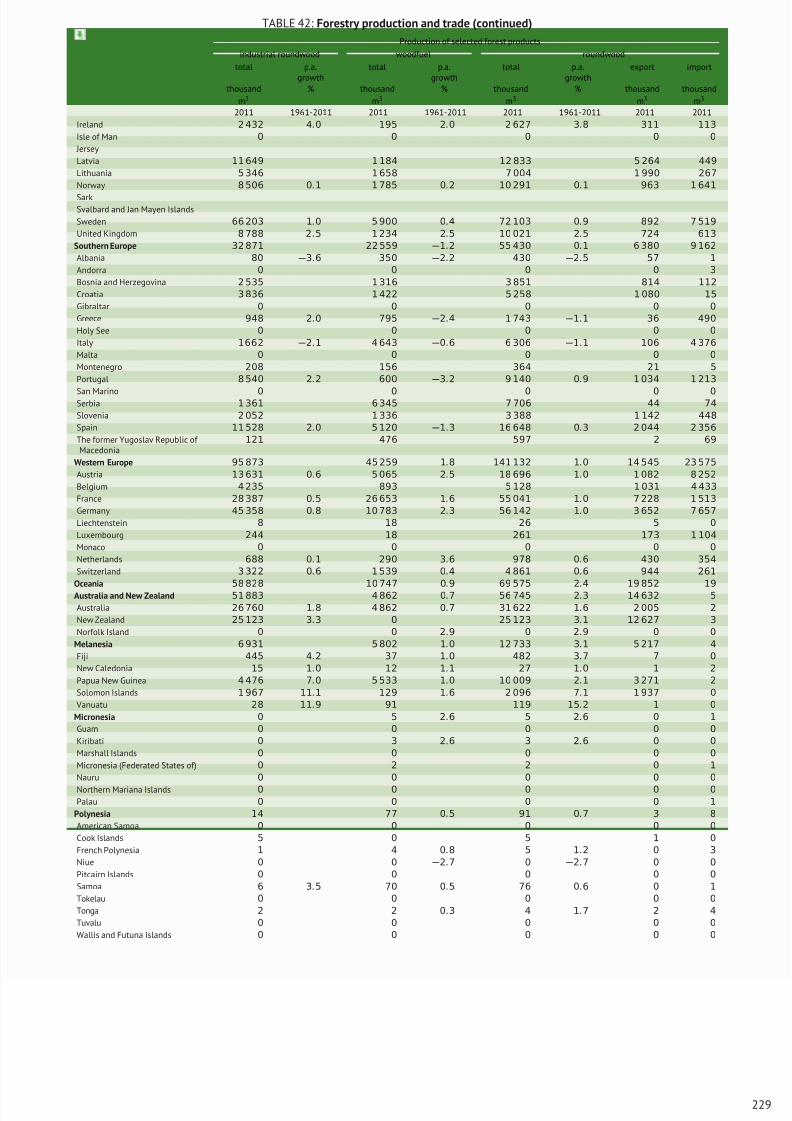
8/16/2019 Informe de la Fao 2013
http://slidepdf.com/reader/full/informe-de-la-fao-2013 247/307
TABLE 42: Forestry production and trade (continued)
Production of selected forest products
industrial roundwood woodfuel roundwood
total p.a.growth
total p.a.growth
total p.a.growth
export import
thousand
m3
% thousand
m3
% thousand
m3
% thousand
m3
thousand
m3
2011 1961-2011 2011 1961-2011 2011 1961-2011 2011 2011
Ireland 2 432 4.0 195 2.0 2 627 3.8 311 113
Isle of Man 0 0 0 0 0
Jersey
Latvia 11 649 1 184 12 833 5 264 449
Lithuania 5 346 1 658 7 004 1 990 267
Norway 8 506 0.1 1 785 0.2 10 291 0.1 963 1 641
SarkSvalbard and Jan Mayen Islands
Sweden 66 203 1.0 5 900 0.4 72 103 0.9 892 7 519
United Kingdom 8 788 2.5 1 234 2.5 10 021 2.5 724 613
Southern Europe 32 871 22 559 −1.2 55 430 0.1 6 380 9 162
Albania 80 −3.6 350 −2.2 430 −2.5 57 1
Andorra 0 0 0 0 3
Bosnia and Herzegovina 2 535 1 316 3 851 814 112
Croatia 3 836 1 422 5 258 1 080 15
Gibraltar 0 0 0 0 0
Greece 948 2.0 795 −2.4 1 743 −1.1 36 490
Holy See 0 0 0 0 0
Italy 1662 −2.1 4 643 −0.6 6 306 −1.1 106 4 376
Malta 0 0 0 0 0
Montenegro 208 156 364 21 5
Portugal 8 540 2.2 600 −3.2 9 140 0.9 1 034 1 213
San Marino 0 0 0 0 0Serbia 1 361 6 345 7 706 44 74
Slovenia 2 052 1 336 3 388 1 142 448
Spain 11 528 2.0 5 120 −1.3 16 648 0.3 2 044 2 356
The former Yugoslav Republic of Macedonia
121 476 597 2 69
Western Europe 95 873 45 259 1.8 141 132 1.0 14 545 23 575
Austria 13 631 0.6 5 065 2.5 18 696 1.0 1 082 8 252
Belgium 4 235 893 5 128 1 031 4 433
France 28 387 0.5 26 653 1.6 55 041 1.0 7 228 1 513
Germany 45 358 0.8 10 783 2.3 56 142 1.0 3 652 7 657
Liechtenstein 8 18 26 5 0
Luxembourg 244 18 261 173 1 104
Monaco 0 0 0 0 0
Netherlands 688 0.1 290 3.6 978 0.6 430 354
Switzerland 3 322 0.6 1 539 0.4 4 861 0.6 944 261
Oceania 58 828 10 747 0.9 69 575 2.4 19 852 19
Australia and New Zealand 51 883 4 862 0.7 56 745 2.3 14 632 5
Australia 26 760 1.8 4 862 0.7 31 622 1.6 2 005 2
New Zealand 25 123 3.3 0 25 123 3.1 12 627 3
Norfolk Island 0 0 2.9 0 2.9 0 0
Melanesia 6 931 5 802 1.0 12 733 3.1 5 217 4
Fiji 445 4.2 37 1.0 482 3.7 7 0
New Caledonia 15 1.0 12 1.1 27 1.0 1 2
Papua New Guinea 4 476 7.0 5 533 1.0 10 009 2.1 3 271 2
Solomon Islands 1 967 11.1 129 1.6 2 096 7.1 1 937 0
Vanuatu 28 11.9 91 119 15.2 1 0
Micronesia 0 5 2.6 5 2.6 0 1
Guam 0 0 0 0 0
Kiribati 0 3 2.6 3 2.6 0 0
Marshall Islands 0 0 0 0 0
Micronesia (Federated States of) 0 2 2 0 1
Nauru 0 0 0 0 0
Northern Mariana Islands 0 0 0 0 0
Palau 0 0 0 0 1
Polynesia 14 77 0.5 91 0.7 3 8
American Samoa 0 0 0 0 0
Cook Islands 5 0 5 1 0
French Polynesia 1 4 0.8 5 1.2 0 3
Niue 0 0 −2.7 0 −2.7 0 0
Pitcairn Islands 0 0 0 0 0
Samoa 6 3.5 70 0.5 76 0.6 0 1
Tokelau 0 0 0 0 0
Tonga 2 2 0.3 4 1.7 2 4
Tuvalu 0 0 0 0 0
Wallis and Futuna Islands 0 0 0 0 0
229
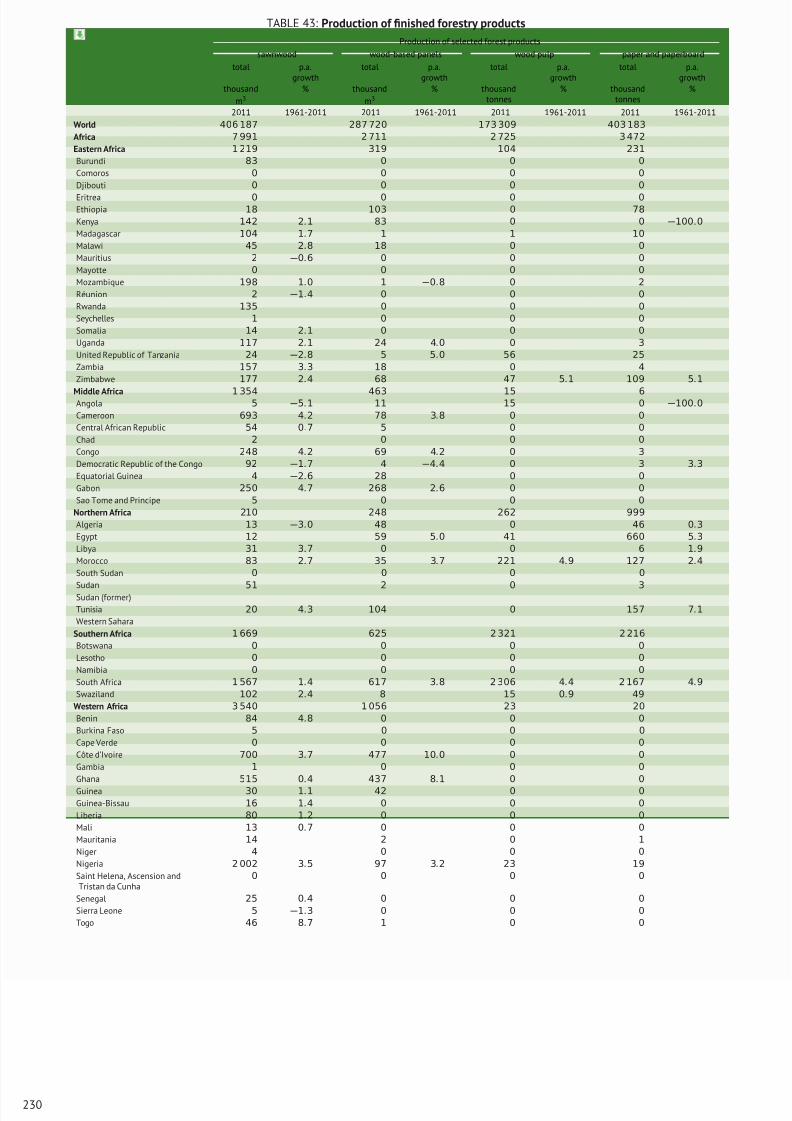
8/16/2019 Informe de la Fao 2013
http://slidepdf.com/reader/full/informe-de-la-fao-2013 248/307
TABLE 43: Production of finished forestry products
Production of selected forest products
sawnwood wood-based panels wood pulp paper and paperboard
total p.a.growth
total p.a.growth
total p.a.growth
total p.a.growth
thousand
m3
% thousand
m3
% thousandtonnes
% thousandtonnes
%
2011 1961-2011 2011 1961-2011 2011 1961-2011 2011 1961-2011
World 406 187 287 720 173 309 403 183
Africa 7 991 2 711 2 725 3 472
Eastern Africa 1 219 319 104 231
Burundi 83 0 0 0
Comoros 0 0 0 0
Djibouti 0 0 0 0
Eritrea 0 0 0 0Ethiopia 18 103 0 78
Kenya 142 2.1 83 0 0 −100.0
Madagascar 104 1.7 1 1 10
Malawi 45 2.8 18 0 0
Mauritius 2 −0.6 0 0 0
Mayotte 0 0 0 0
Mozambique 198 1.0 1 −0.8 0 2
Réunion 2 −1.4 0 0 0
Rwanda 135 0 0 0
Seychelles 1 0 0 0
Somalia 14 2.1 0 0 0
Uganda 117 2.1 24 4.0 0 3
United Republic of Tanzania 24 −2.8 5 5.0 56 25
Zambia 157 3.3 18 0 4
Zimbabwe 177 2.4 68 47 5.1 109 5.1
Middle Africa 1 354 463 15 6Angola 5 −5.1 11 15 0 −100.0
Cameroon 693 4.2 78 3.8 0 0
Central African Republic 54 0.7 5 0 0
Chad 2 0 0 0
Congo 248 4.2 69 4.2 0 3
Democratic Republic of the Congo 92 −1.7 4 −4.4 0 3 3.3
Equatorial Guinea 4 −2.6 28 0 0
Gabon 250 4.7 268 2.6 0 0
Sao Tome and Principe 5 0 0 0
Northern Africa 210 248 262 999
Algeria 13 −3.0 48 0 46 0.3
Egypt 12 59 5.0 41 660 5.3
Libya 31 3.7 0 0 6 1.9
Morocco 83 2.7 35 3.7 221 4.9 127 2.4
South Sudan 0 0 0 0
Sudan 51 2 0 3
Sudan (former)
Tunisia 20 4.3 104 0 157 7.1
Western Sahara
Southern Africa 1 669 625 2 321 2 216
Botswana 0 0 0 0
Lesotho 0 0 0 0
Namibia 0 0 0 0
South Africa 1 567 1.4 617 3.8 2 306 4.4 2 167 4.9
Swaziland 102 2.4 8 15 0.9 49
Western Africa 3 540 1 056 23 20
Benin 84 4.8 0 0 0
Burkina Faso 5 0 0 0
Cape Verde 0 0 0 0
Côte d’Ivoire 700 3.7 477 10.0 0 0
Gambia 1 0 0 0
Ghana 515 0.4 437 8.1 0 0
Guinea 30 1.1 42 0 0
Guinea-Bissau 16 1.4 0 0 0
Liberia 80 1.2 0 0 0
Mali 13 0.7 0 0 0
Mauritania 14 2 0 1
Niger 4 0 0 0
Nigeria 2 002 3.5 97 3.2 23 19
Saint Helena, Ascension andTristan da Cunha
0 0 0 0
Senegal 25 0.4 0 0 0
Sierra Leone 5 −1.3 0 0 0
Togo 46 8.7 1 0 0
230
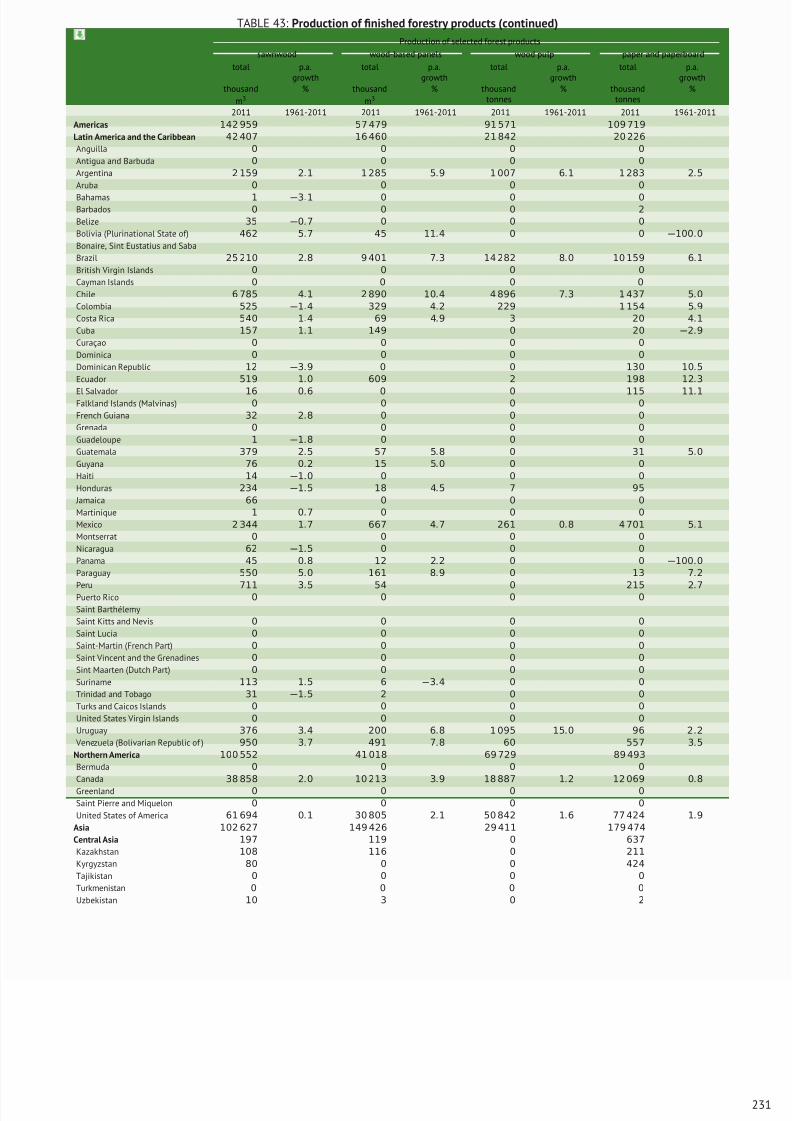
8/16/2019 Informe de la Fao 2013
http://slidepdf.com/reader/full/informe-de-la-fao-2013 249/307
TABLE 43: Production of finished forestry products (continued)
Production of selected forest products
sawnwood wood-based panels wood pulp paper and paperboard
total p.a.growth
total p.a.growth
total p.a.growth
total p.a.growth
thousand
m3
% thousand
m3
% thousandtonnes
% thousandtonnes
%
2011 1961-2011 2011 1961-2011 2011 1961-2011 2011 1961-2011
Americas 142 959 57 479 91 571 109 719
Latin America and the Caribbean 42 407 16 460 21 842 20 226
Anguilla 0 0 0 0
Antigua and Barbuda 0 0 0 0
Argentina 2 159 2.1 1 285 5.9 1 007 6.1 1 283 2.5
Aruba 0 0 0 0
Bahamas 1 −3.1 0 0 0Barbados 0 0 0 2
Belize 35 −0.7 0 0 0
Bolivia (Plurinational State of) 462 5.7 45 11.4 0 0 −100.0
Bonaire, Sint Eustatius and Saba
Brazil 25 210 2.8 9 401 7.3 14 282 8.0 10 159 6.1
British Virgin Islands 0 0 0 0
Cayman Islands 0 0 0 0
Chile 6 785 4.1 2 890 10.4 4 896 7.3 1 437 5.0
Colombia 525 −1.4 329 4.2 229 1 154 5.9
Costa Rica 540 1.4 69 4.9 3 20 4.1
Cuba 157 1.1 149 0 20 −2.9
Curaçao 0 0 0 0
Dominica 0 0 0 0
Dominican Republic 12 −3.9 0 0 130 10.5
Ecuador 519 1.0 609 2 198 12.3
El Salvador 16 0.6 0 0 115 11.1Falkland Islands (Malvinas) 0 0 0 0
French Guiana 32 2.8 0 0 0
Grenada 0 0 0 0
Guadeloupe 1 −1.8 0 0 0
Guatemala 379 2.5 57 5.8 0 31 5.0
Guyana 76 0.2 15 5.0 0 0
Haiti 14 −1.0 0 0 0
Honduras 234 −1.5 18 4.5 7 95
Jamaica 66 0 0 0
Martinique 1 0.7 0 0 0
Mexico 2 344 1.7 667 4.7 261 0.8 4 701 5.1
Montserrat 0 0 0 0
Nicaragua 62 −1.5 0 0 0
Panama 45 0.8 12 2.2 0 0 −100.0
Paraguay 550 5.0 161 8.9 0 13 7.2
Peru 711 3
.5 54 0 215 2
.7
Puerto Rico 0 0 0 0
Saint Barthélemy
Saint Kitts and Nevis 0 0 0 0
Saint Lucia 0 0 0 0
Saint-Martin (French Part) 0 0 0 0
Saint Vincent and the Grenadines 0 0 0 0
Sint Maarten (Dutch Part) 0 0 0 0
Suriname 113 1.5 6 −3.4 0 0
Trinidad and Tobago 31 −1.5 2 0 0
Turks and Caicos Islands 0 0 0 0
United States Virgin Islands 0 0 0 0
Uruguay 376 3.4 200 6.8 1 095 15.0 96 2.2
Venezuela (Bolivarian Republic of ) 950 3.7 491 7.8 60 557 3.5
Northern America 100 552 41 018 69 729 89 493
Bermuda 0 0 0 0
Canada 38 858 2.0 10 213 3.9 18 887 1.2 12 069 0.8
Greenland 0 0 0 0
Saint Pierre and Miquelon 0 0 0 0
United States of America 61 694 0.1 30 805 2.1 50 842 1.6 77 424 1.9
Asia 102 627 149 426 29 411 179 474
Central Asia 197 119 0 637
Kazakhstan 108 116 0 211
Kyrgyzstan 80 0 0 424
Tajikistan 0 0 0 0
Turkmenistan 0 0 0 0
Uzbekistan 10 3 0 2
231
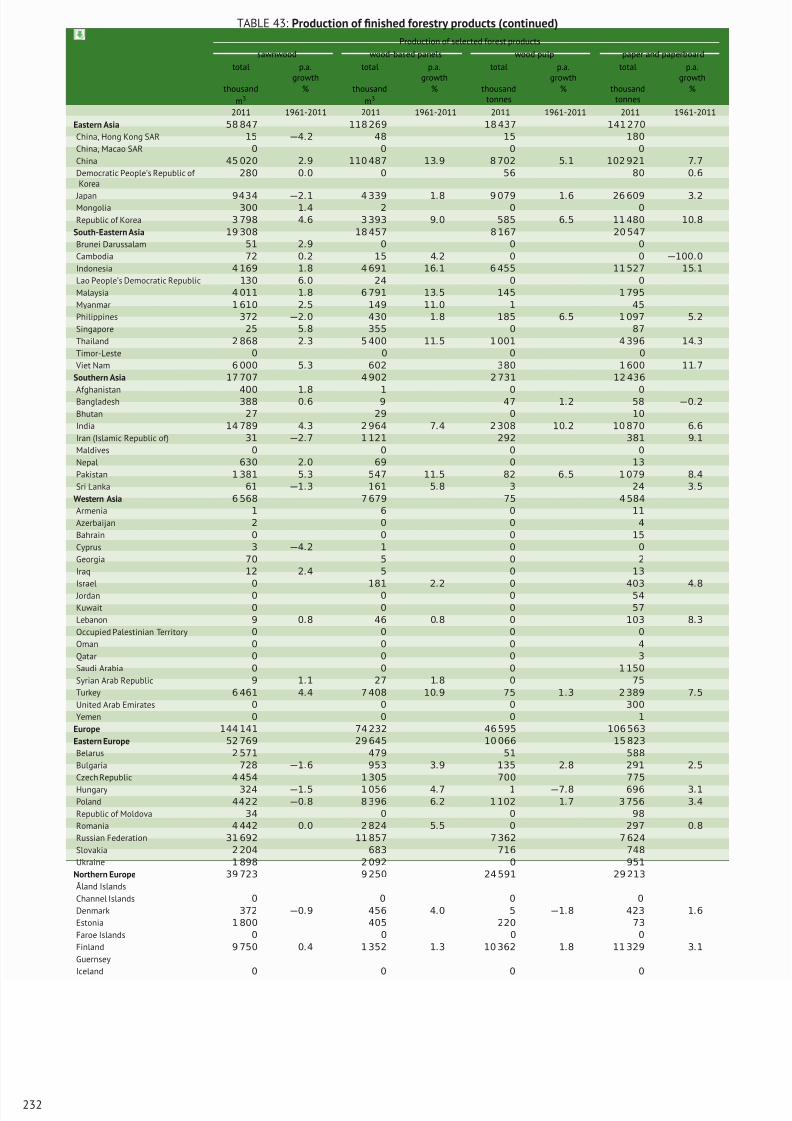
8/16/2019 Informe de la Fao 2013
http://slidepdf.com/reader/full/informe-de-la-fao-2013 250/307
TABLE 43: Production of finished forestry products (continued)
Production of selected forest products
sawnwood wood-based panels wood pulp paper and paperboard
total p.a.growth
total p.a.growth
total p.a.growth
total p.a.growth
thousand
m3
% thousand
m3
% thousandtonnes
% thousandtonnes
%
2011 1961-2011 2011 1961-2011 2011 1961-2011 2011 1961-2011
Eastern Asia 58 847 118 269 18 437 141 270
China, Hong Kong SAR 15 −4.2 48 15 180
China, Macao SAR 0 0 0 0
China 45 020 2.9 110 487 13.9 8 702 5.1 102 921 7.7
Democratic People’s Republic of Korea
280 0.0 0 56 80 0.6
Japan 9434 −2.1 4 339 1.8 9 079 1.6 26 609 3.2Mongolia 300 1.4 2 0 0
Republic of Korea 3 798 4.6 3 393 9.0 585 6.5 11 480 10.8
South-Eastern Asia 19 308 18 457 8 167 20 547
Brunei Darussalam 51 2.9 0 0 0
Cambodia 72 0.2 15 4.2 0 0 −100.0
Indonesia 4 169 1.8 4 691 16.1 6 455 11 527 15.1
Lao People’s Democratic Republic 130 6.0 24 0 0
Malaysia 4 011 1.8 6 791 13.5 145 1 795
Myanmar 1 610 2.5 149 11.0 1 45
Philippines 372 −2.0 430 1.8 185 6.5 1 097 5.2
Singapore 25 5.8 355 0 87
Thailand 2 868 2.3 5 400 11.5 1 001 4 396 14.3
Timor-Leste 0 0 0 0
Viet Nam 6 000 5.3 602 380 1 600 11.7
Southern Asia 17 707 4 902 2 731 12 436
Afghanistan 400 1.8 1 0 0Bangladesh 388 0.6 9 47 1.2 58 −0.2
Bhutan 27 29 0 10
India 14 789 4.3 2 964 7.4 2 308 10.2 10 870 6.6
Iran (Islamic Republic of) 31 −2.7 1 121 292 381 9.1
Maldives 0 0 0 0
Nepal 630 2.0 69 0 13
Pakistan 1 381 5.3 547 11.5 82 6.5 1 079 8.4
Sri Lanka 61 −1.3 161 5.8 3 24 3.5
Western Asia 6 568 7 679 75 4 584
Armenia 1 6 0 11
Azerbaijan 2 0 0 4
Bahrain 0 0 0 15
Cyprus 3 −4.2 1 0 0
Georgia 70 5 0 2
Iraq 12 2.4 5 0 13
Israel 0 181 2.2 0 403 4.8
Jordan 0 0 0 54
Kuwait 0 0 0 57
Lebanon 9 0.8 46 0.8 0 103 8.3
Occupied Palestinian Territory 0 0 0 0
Oman 0 0 0 4
Qatar 0 0 0 3
Saudi Arabia 0 0 0 1 150
Syrian Arab Republic 9 1.1 27 1.8 0 75
Turkey 6 461 4.4 7 408 10.9 75 1.3 2 389 7.5
United Arab Emirates 0 0 0 300
Yemen 0 0 0 1
Europe 144 141 74 232 46 595 106 563
Eastern Europe 52 769 29 645 10 066 15 823
Belarus 2 571 479 51 588
Bulgaria 728 −1.6 953 3.9 135 2.8 291 2.5
Czech Republic 4 454 1 305 700 775
Hungary 324 −1.5 1 056 4.7 1 −7.8 696 3.1
Poland 4422 −0.8 8 396 6.2 1 102 1.7 3 756 3.4
Republic of Moldova 34 0 0 98
Romania 4 442 0.0 2 824 5.5 0 297 0.8
Russian Federation 31 692 11 857 7 362 7 624
Slovakia 2 204 683 716 748
Ukraine 1 898 2 092 0 951
Northern Europe 39 723 9 250 24 591 29 213
Åland Islands
Channel Islands 0 0 0 0
Denmark 372 −0.9 456 4.0 5 −1.8 423 1.6
Estonia 1 800 405 220 73
Faroe Islands 0 0 0 0
Finland 9 750 0.4 1 352 1.3 10 362 1.8 11 329 3.1
Guernsey
Iceland 0 0 0 0
232
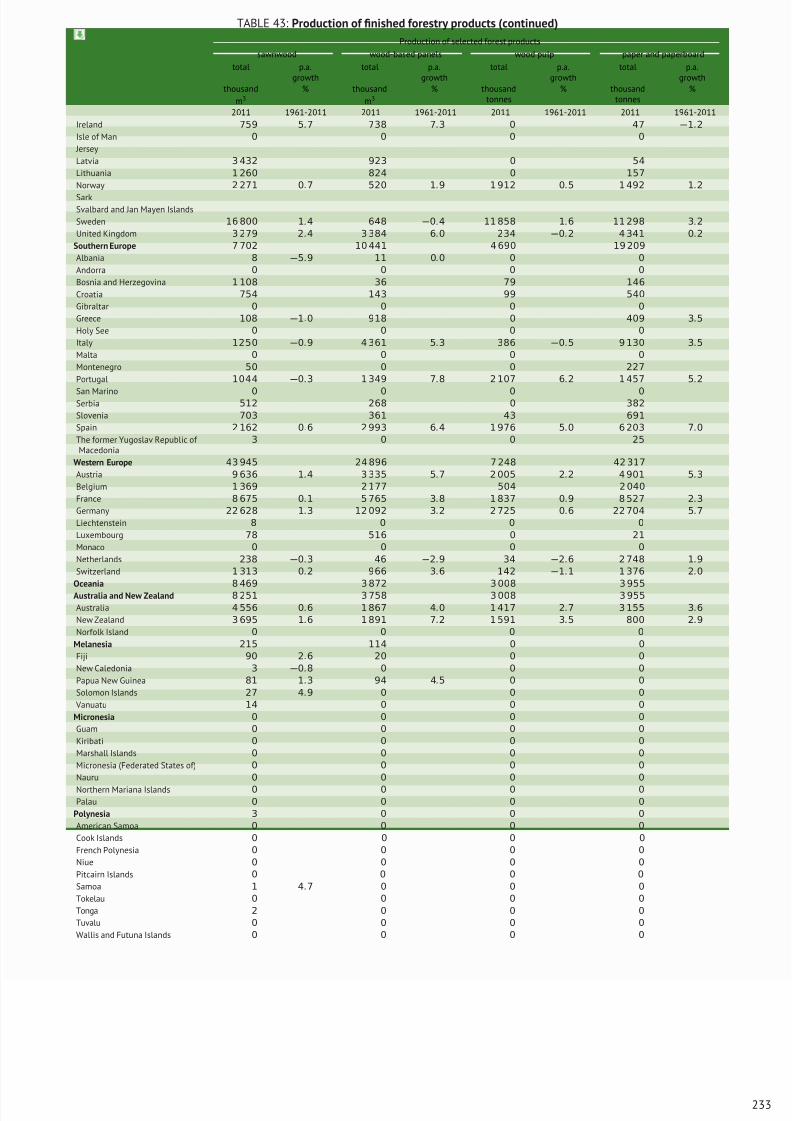
8/16/2019 Informe de la Fao 2013
http://slidepdf.com/reader/full/informe-de-la-fao-2013 251/307
TABLE 43: Production of finished forestry products (continued)
Production of selected forest products
sawnwood wood-based panels wood pulp paper and paperboard
total p.a.growth
total p.a.growth
total p.a.growth
total p.a.growth
thousand
m3
% thousand
m3
% thousandtonnes
% thousandtonnes
%
2011 1961-2011 2011 1961-2011 2011 1961-2011 2011 1961-2011
Ireland 759 5.7 738 7.3 0 47 −1.2
Isle of Man 0 0 0 0
Jersey
Latvia 3 432 923 0 54
Lithuania 1 260 824 0 157
Norway 2 271 0.7 520 1.9 1 912 0.5 1 492 1.2
SarkSvalbard and Jan Mayen Islands
Sweden 16 800 1.4 648 −0.4 11 858 1.6 11 298 3.2
United Kingdom 3 279 2.4 3 384 6.0 234 −0.2 4 341 0.2
Southern Europe 7 702 10 441 4 690 19 209
Albania 8 −5.9 11 0.0 0 0
Andorra 0 0 0 0
Bosnia and Herzegovina 1 108 36 79 146
Croatia 754 143 99 540
Gibraltar 0 0 0 0
Greece 108 −1.0 918 0 409 3.5
Holy See 0 0 0 0
Italy 1250 −0.9 4 361 5.3 386 −0.5 9 130 3.5
Malta 0 0 0 0
Montenegro 50 0 0 227
Portugal 1044 −0.3 1 349 7.8 2 107 6.2 1 457 5.2
San Marino 0 0 0 0Serbia 512 268 0 382
Slovenia 703 361 43 691
Spain 2 162 0.6 2 993 6.4 1 976 5.0 6 203 7.0
The former Yugoslav Republic of Macedonia
3 0 0 25
Western Europe 43 945 24 896 7 248 42 317
Austria 9 636 1.4 3 335 5.7 2 005 2.2 4 901 5.3
Belgium 1 369 2 177 504 2 040
France 8 675 0.1 5 765 3.8 1 837 0.9 8 527 2.3
Germany 22 628 1.3 12 092 3.2 2 725 0.6 22 704 5.7
Liechtenstein 8 0 0 0
Luxembourg 78 516 0 21
Monaco 0 0 0 0
Netherlands 238 −0.3 46 −2.9 34 −2.6 2 748 1.9
Switzerland 1 313 0.2 966 3.6 142 −1.1 1 376 2.0
Oceania 8 469 3 872 3 008 3 955
Australia and New Zealand 8 251 3 758 3 008 3 955
Australia 4 556 0.6 1 867 4.0 1 417 2.7 3 155 3.6
New Zealand 3 695 1.6 1 891 7.2 1 591 3.5 800 2.9
Norfolk Island 0 0 0 0
Melanesia 215 114 0 0
Fiji 90 2.6 20 0 0
New Caledonia 3 −0.8 0 0 0
Papua New Guinea 81 1.3 94 4.5 0 0
Solomon Islands 27 4.9 0 0 0
Vanuatu 14 0 0 0
Micronesia 0 0 0 0
Guam 0 0 0 0
Kiribati 0 0 0 0
Marshall Islands 0 0 0 0
Micronesia (Federated States of) 0 0 0 0
Nauru 0 0 0 0
Northern Mariana Islands 0 0 0 0
Palau 0 0 0 0
Polynesia 3 0 0 0
American Samoa 0 0 0 0
Cook Islands 0 0 0 0
French Polynesia 0 0 0 0
Niue 0 0 0 0
Pitcairn Islands 0 0 0 0
Samoa 1 4.7 0 0 0
Tokelau 0 0 0 0
Tonga 2 0 0 0
Tuvalu 0 0 0 0
Wallis and Futuna Islands 0 0 0 0
233
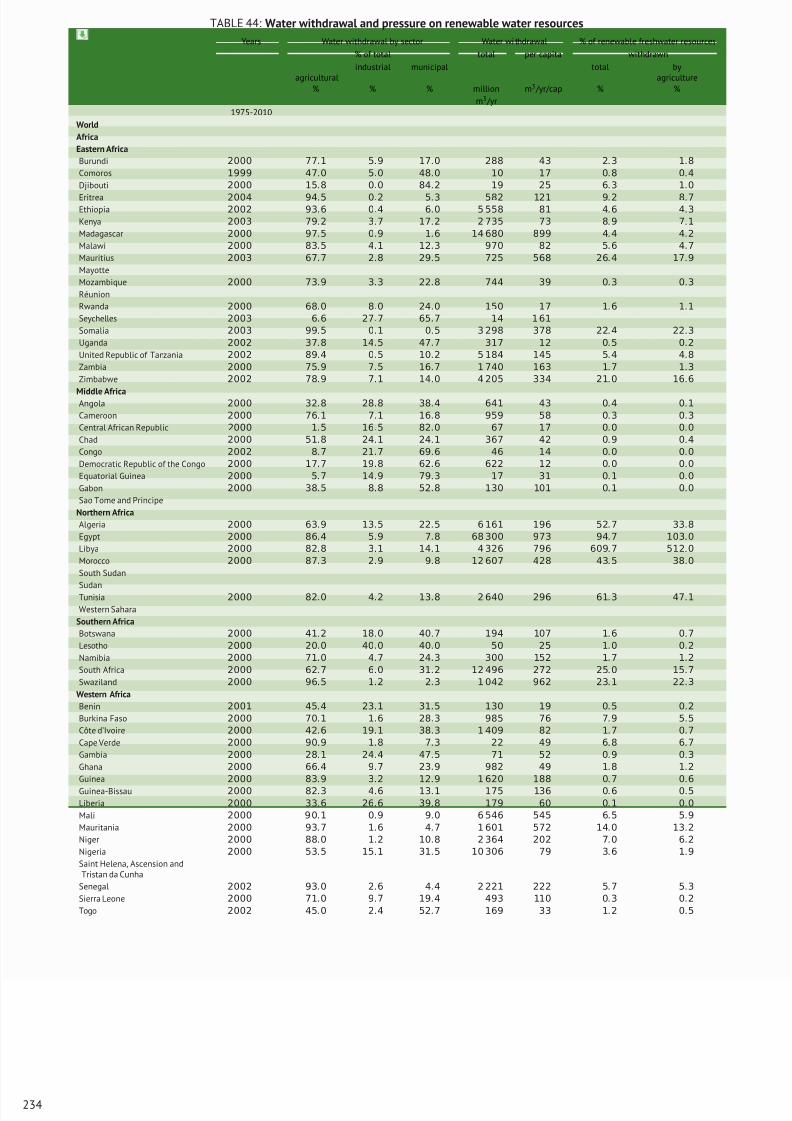
8/16/2019 Informe de la Fao 2013
http://slidepdf.com/reader/full/informe-de-la-fao-2013 252/307
TABLE 44: Water withdrawal and pressure on renewable water resources
Years Water withdrawal by sector Water wi thdrawal % of renewable freshwater resources
% of total total per capita withdrawn
agriculturalindustrial municipal total by
agriculture% % % million
m3 /yr
m3 /yr/cap % %
1975-2010
World
Africa
Eastern Africa
Burundi 2000 77.1 5.9 17.0 288 43 2.3 1.8
Comoros 1999 47.0 5.0 48.0 10 17 0.8 0.4
Djibouti 2000 15.8 0.0 84.2 19 25 6.3 1.0
Eritrea 2004 94.5 0.2 5.3 582 121 9.2 8.7Ethiopia 2002 93.6 0.4 6.0 5 558 81 4.6 4.3
Kenya 2003 79.2 3.7 17.2 2 735 73 8.9 7.1
Madagascar 2000 97.5 0.9 1.6 14 680 899 4.4 4.2
Malawi 2000 83.5 4.1 12.3 970 82 5.6 4.7
Mauritius 2003 67.7 2.8 29.5 725 568 26.4 17.9
Mayotte
Mozambique 2000 73.9 3.3 22.8 744 39 0.3 0.3
Réunion
Rwanda 2000 68.0 8.0 24.0 150 17 1.6 1.1
Seychelles 2003 6.6 27.7 65.7 14 1 61
Somalia 2003 99.5 0.1 0.5 3 298 378 22.4 22.3
Uganda 2002 37.8 14.5 47.7 317 12 0.5 0.2
United Republic of Tanzania 2002 89.4 0.5 10.2 5 184 145 5.4 4.8
Zambia 2000 75.9 7.5 16.7 1 740 163 1.7 1.3
Zimbabwe 2002 78.9 7.1 14.0 4 205 334 21.0 16.6
Middle AfricaAngola 2000 32.8 28.8 38.4 641 43 0.4 0.1
Cameroon 2000 76.1 7.1 16.8 959 58 0.3 0.3
Central African Republic 2000 1.5 16.5 82.0 67 17 0.0 0.0
Chad 2000 51.8 24.1 24.1 367 42 0.9 0.4
Congo 2002 8.7 21.7 69.6 46 14 0.0 0.0
Democratic Republic of the Congo 2000 17.7 19.8 62.6 622 12 0.0 0.0
Equatorial Guinea 2000 5.7 14.9 79.3 17 31 0.1 0.0
Gabon 2000 38.5 8.8 52.8 130 101 0.1 0.0
Sao Tome and Principe
Northern Africa
Algeria 2000 63.9 13.5 22.5 6 161 196 52.7 33.8
Egypt 2000 86.4 5.9 7.8 68 300 973 94.7 103.0
Libya 2000 82.8 3.1 14.1 4 326 796 609.7 512.0
Morocco 2000 87.3 2.9 9.8 12 607 428 43.5 38.0
South Sudan
SudanTunisia 2000 82.0 4.2 13.8 2 640 296 61.3 47.1
Western Sahara
Southern Africa
Botswana 2000 41.2 18.0 40.7 194 107 1.6 0.7
Lesotho 2000 20.0 40.0 40.0 50 25 1.0 0.2
Namibia 2000 71.0 4.7 24.3 300 152 1.7 1.2
South Africa 2000 62.7 6.0 31.2 12 496 272 25.0 15.7
Swaziland 2000 96.5 1.2 2.3 1 042 962 23.1 22.3
Western Africa
Benin 2001 45.4 23.1 31.5 130 19 0.5 0.2
Burkina Faso 2000 70.1 1.6 28.3 985 76 7.9 5.5
Côte d’Ivoire 2000 42.6 19.1 38.3 1 409 82 1.7 0.7
Cape Verde 2000 90.9 1.8 7.3 22 49 6.8 6.7
Gambia 2000 28.1 24.4 47.5 71 52 0.9 0.3
Ghana 2000 66.4 9.7 23.9 982 49 1.8 1.2
Guinea 2000 83.9 3.2 12.9 1 620 188 0.7 0.6
Guinea-Bissau 2000 82.3 4.6 13.1 175 136 0.6 0.5
Liberia 2000 33.6 26.6 39.8 179 60 0.1 0.0
Mali 2000 9 0.1 0.9 9.0 6 546 545 6.5 5.9
Mauritania 2000 93.7 1.6 4.7 1 601 572 14.0 13.2
Niger 2000 88.0 1.2 10.8 2 364 202 7.0 6.2
Nigeria 2000 53.5 15.1 31.5 10 306 79 3.6 1.9
Saint Helena, Ascension andTristan da Cunha
Senegal 2002 93.0 2.6 4.4 2 221 222 5.7 5.3
Sierra Leone 2000 71.0 9.7 19.4 493 110 0.3 0.2
Togo 2002 45.0 2.4 52.7 169 33 1.2 0.5
234
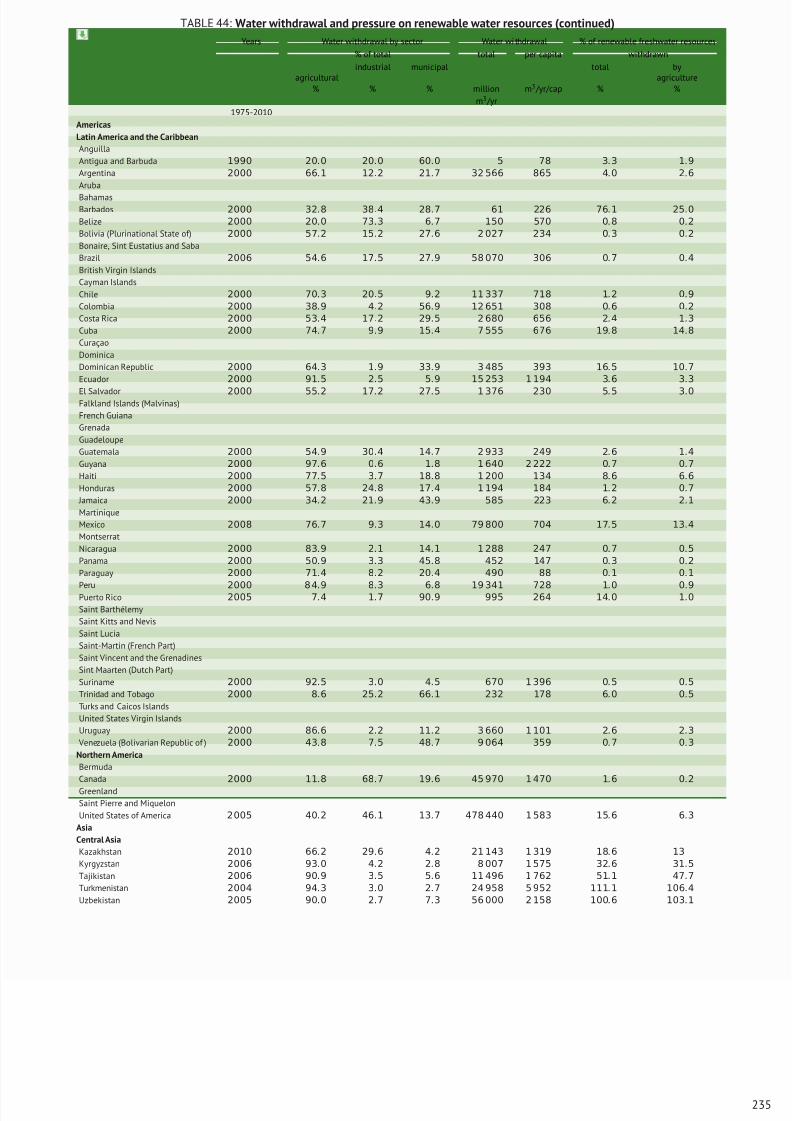
8/16/2019 Informe de la Fao 2013
http://slidepdf.com/reader/full/informe-de-la-fao-2013 253/307
TABLE 44: Water withdrawal and pressure on renewable water resources (continued)
Years Water withdrawal by sector Water wi thdrawal % of renewable freshwater resources
% of total total per capita withdrawn
agriculturalindustrial municipal total by
agriculture% % % million
m3 /yr
m3 /yr/cap % %
1975-2010
Americas
Latin America and the Caribbean
Anguilla
Antigua and Barbuda 1990 20.0 20.0 60.0 5 78 3.3 1.9
Argentina 2000 66.1 12.2 21.7 32 566 865 4.0 2.6
Aruba
BahamasBarbados 2000 32.8 38.4 28.7 61 226 76.1 25.0
Belize 2000 20.0 73.3 6.7 150 570 0.8 0.2
Bolivia (Plurinational State of) 2000 57.2 15.2 27.6 2 027 234 0.3 0.2
Bonaire, Sint Eustatius and Saba
Brazil 2006 54.6 17.5 27.9 58 070 306 0.7 0.4
British Virgin Islands
Cayman Islands
Chile 2000 70.3 20.5 9.2 11 337 718 1.2 0.9
Colombia 2000 38.9 4.2 56.9 12 651 308 0.6 0.2
Costa Rica 2000 53.4 17.2 29.5 2 680 656 2.4 1.3
Cuba 2000 74.7 9.9 15.4 7 555 676 19.8 14.8
Curaçao
Dominica
Dominican Republic 2000 64.3 1.9 33.9 3 485 393 16.5 10.7
Ecuador 2000 91.5 2.5 5.9 15 253 1 194 3.6 3.3
El Salvador 2000 55.2 17.2 27.5 1 376 230 5.5 3.0Falkland Islands (Malvinas)
French Guiana
Grenada
Guadeloupe
Guatemala 2000 54.9 30.4 14.7 2 933 249 2.6 1.4
Guyana 2000 97.6 0.6 1.8 1 640 2 222 0.7 0.7
Haiti 2000 77.5 3.7 18.8 1 200 134 8.6 6.6
Honduras 2000 57.8 24.8 17.4 1 194 184 1.2 0.7
Jamaica 2000 34.2 21.9 43.9 585 223 6.2 2.1
Martinique
Mexico 2008 76.7 9.3 14.0 79 800 704 17.5 13.4
Montserrat
Nicaragua 2000 83.9 2.1 14.1 1 288 247 0.7 0.5
Panama 2000 50.9 3.3 45.8 452 147 0.3 0.2
Paraguay 2000 71.4 8.2 20.4 490 88 0.1 0.1
Peru 2000 8 4
.9 8
.3 6
.8 19 341 728 1
.0 0
.9
Puerto Rico 2005 7.4 1.7 90.9 995 264 14.0 1.0
Saint Barthélemy
Saint Kitts and Nevis
Saint Lucia
Saint-Martin (French Part)
Saint Vincent and the Grenadines
Sint Maarten (Dutch Part)
Suriname 2000 92.5 3.0 4.5 670 1 396 0.5 0.5
Trinidad and Tobago 2000 8.6 25.2 66.1 232 178 6.0 0.5
Turks and Caicos Islands
United States Virgin Islands
Uruguay 2000 86.6 2.2 11.2 3 660 1 101 2.6 2.3
Venezuela (Bolivarian Republic of ) 2000 43.8 7.5 48.7 9 064 359 0.7 0.3
Northern America
Bermuda
Canada 2000 11.8 68.7 19.6 45 970 1 470 1.6 0.2
Greenland
Saint Pierre and Miquelon
United States of America 2005 40.2 46.1 13.7 478 440 1 583 15.6 6.3
Asia
Central Asia
Kazakhstan 2010 66.2 29.6 4.2 21 143 1 319 18.6 13
Kyrgyzstan 2006 93.0 4.2 2.8 8 007 1 575 32.6 31.5
Tajikistan 2006 90.9 3.5 5.6 11 496 1 762 51.1 47.7
Turkmenistan 2004 94.3 3.0 2.7 24 958 5 952 111.1 106.4
Uzbekistan 2005 90.0 2.7 7.3 56 000 2 158 100.6 103.1
235
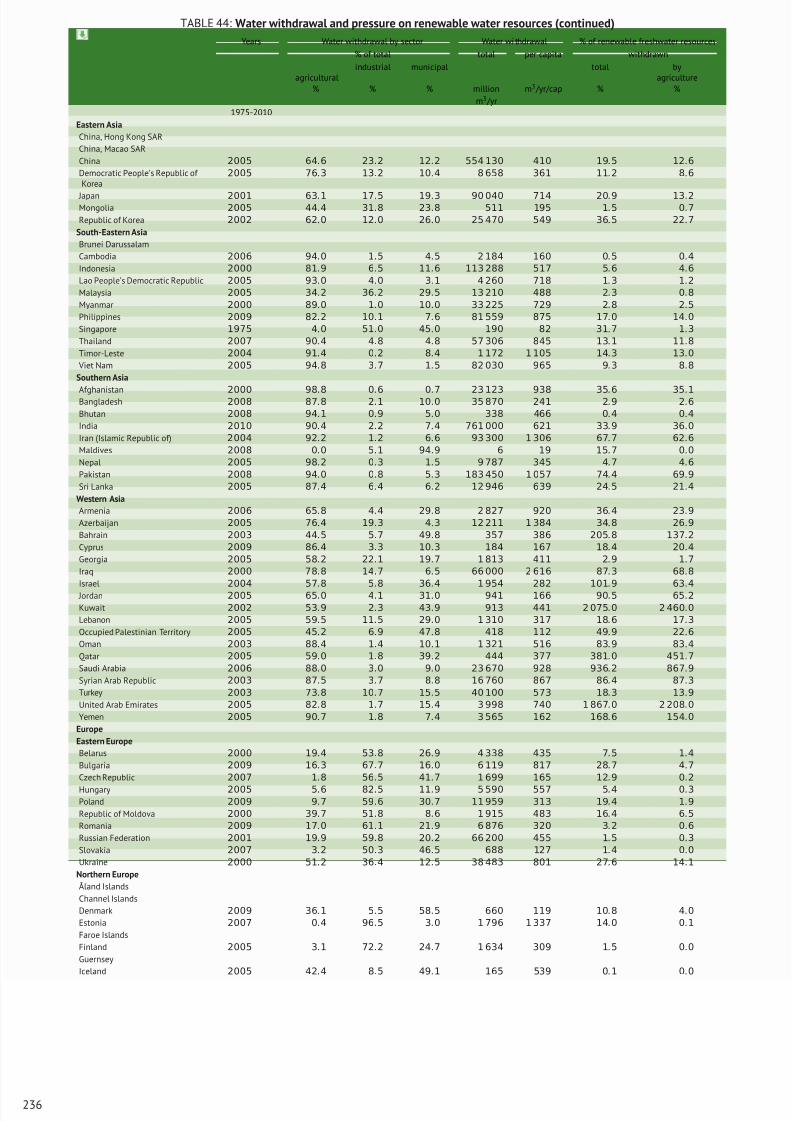
8/16/2019 Informe de la Fao 2013
http://slidepdf.com/reader/full/informe-de-la-fao-2013 254/307
TABLE 44: Water withdrawal and pressure on renewable water resources (continued)
Years Water withdrawal by sector Water wi thdrawal % of renewable freshwater resources
% of total total per capita withdrawn
agriculturalindustrial municipal total by
agriculture% % % million
m3 /yr
m3 /yr/cap % %
1975-2010
Eastern Asia
China, Hong Kong SAR
China, Macao SAR
China 2005 64.6 23.2 12.2 554 130 410 19.5 12.6
Democratic People’s Republic of Korea
2005 76.3 13.2 10.4 8 658 361 11.2 8.6
Japan 2001 63.1 17.5 19.3 90 040 714 20.9 13.2Mongolia 2005 44.4 31.8 23.8 511 195 1.5 0.7
Republic of Korea 2002 62.0 12.0 26.0 25 470 549 36.5 22.7
South-Eastern Asia
Brunei Darussalam
Cambodia 2006 94.0 1.5 4.5 2 184 160 0.5 0.4
Indonesia 2000 81.9 6.5 11.6 113 288 517 5.6 4.6
Lao People’s Democratic Republic 2005 93.0 4.0 3.1 4 260 718 1.3 1.2
Malaysia 2005 34.2 36.2 29.5 13 210 488 2.3 0.8
Myanmar 2000 89.0 1.0 10.0 33 225 729 2.8 2.5
Philippines 2009 82.2 10.1 7.6 81 559 875 17.0 14.0
Singapore 1975 4.0 51.0 45.0 190 82 31.7 1.3
Thailand 2007 90.4 4.8 4.8 57 306 845 13.1 11.8
Timor-Leste 2004 91.4 0.2 8.4 1 172 1 105 14.3 13.0
Viet Nam 2005 94.8 3.7 1.5 82 030 965 9.3 8.8
Southern Asia
Afghanistan 2000 98.8 0.6 0.7 23 123 938 35.6 35.1Bangladesh 2008 87.8 2.1 10.0 35 870 241 2.9 2.6
Bhutan 2008 94.1 0.9 5.0 338 466 0.4 0.4
India 2010 90.4 2.2 7.4 761 000 621 33.9 36.0
Iran (Islamic Republic of) 2004 92.2 1.2 6.6 93 300 1 306 67.7 62.6
Maldives 2008 0.0 5.1 94.9 6 19 15.7 0.0
Nepal 2005 98.2 0.3 1.5 9 787 345 4.7 4.6
Pakistan 2008 94.0 0.8 5.3 183 450 1 057 74.4 69.9
Sri Lanka 2005 87.4 6.4 6.2 12 946 639 24.5 21.4
Western Asia
Armenia 2006 65.8 4.4 29.8 2 827 920 36.4 23.9
Azerbaijan 2005 76.4 19.3 4.3 12 211 1 384 34.8 26.9
Bahrain 2003 44.5 5.7 49.8 357 386 205.8 137.2
Cyprus 2009 86.4 3.3 10.3 184 167 18.4 20.4
Georgia 2005 58.2 22.1 19.7 1 813 411 2.9 1.7
Iraq 2000 78.8 14.7 6.5 66 000 2 616 87.3 68.8
Israel 2004 57.8 5.8 36.4 1 954 282 101.9 63.4
Jordan 2005 65.0 4.1 31.0 941 166 90.5 65.2
Kuwait 2002 53.9 2.3 43.9 913 441 2 075.0 2 460.0
Lebanon 2005 59.5 11.5 29.0 1 310 317 18.6 17.3
Occupied Palestinian Territory 2005 45.2 6.9 47.8 418 112 49.9 22.6
Oman 2003 88.4 1.4 10.1 1 321 516 83.9 83.4
Qatar 2005 59.0 1.8 39.2 444 377 381.0 451.7
Saudi Arabia 2006 88.0 3.0 9.0 23 670 928 936.2 867.9
Syrian Arab Republic 2003 87.5 3.7 8.8 16 760 867 86.4 87.3
Turkey 2003 73.8 10.7 15.5 40 100 573 18.3 13.9
United Arab Emirates 2005 82.8 1.7 15.4 3 998 740 1 867.0 2 208.0
Yemen 2005 90.7 1.8 7.4 3 565 162 168.6 154.0
Europe
Eastern Europe
Belarus 2000 19.4 53.8 26.9 4 338 435 7.5 1.4
Bulgaria 2009 16.3 67.7 16.0 6 119 817 28.7 4.7
Czech Republic 2007 1.8 56.5 41.7 1 699 165 12.9 0.2
Hungary 2005 5.6 82.5 11.9 5 590 557 5.4 0.3
Poland 2009 9.7 59.6 30.7 11 959 313 19.4 1.9
Republic of Moldova 2000 39.7 51.8 8.6 1 915 483 16.4 6.5
Romania 2009 17.0 61.1 21.9 6 876 320 3.2 0.6
Russian Federation 2001 19.9 59.8 20.2 66 200 455 1.5 0.3
Slovakia 2007 3.2 50.3 46.5 688 127 1.4 0.0
Ukraine 2000 51.2 36.4 12.5 38 483 801 27.6 14.1
Northern Europe
Åland Islands
Channel Islands
Denmark 2009 36.1 5.5 58.5 660 119 10.8 4.0
Estonia 2007 0.4 96.5 3.0 1 796 1 337 14.0 0.1
Faroe Islands
Finland 2005 3.1 72.2 24.7 1 634 309 1.5 0.0
Guernsey
Iceland 2005 42.4 8.5 49.1 165 539 0.1 0.0
236
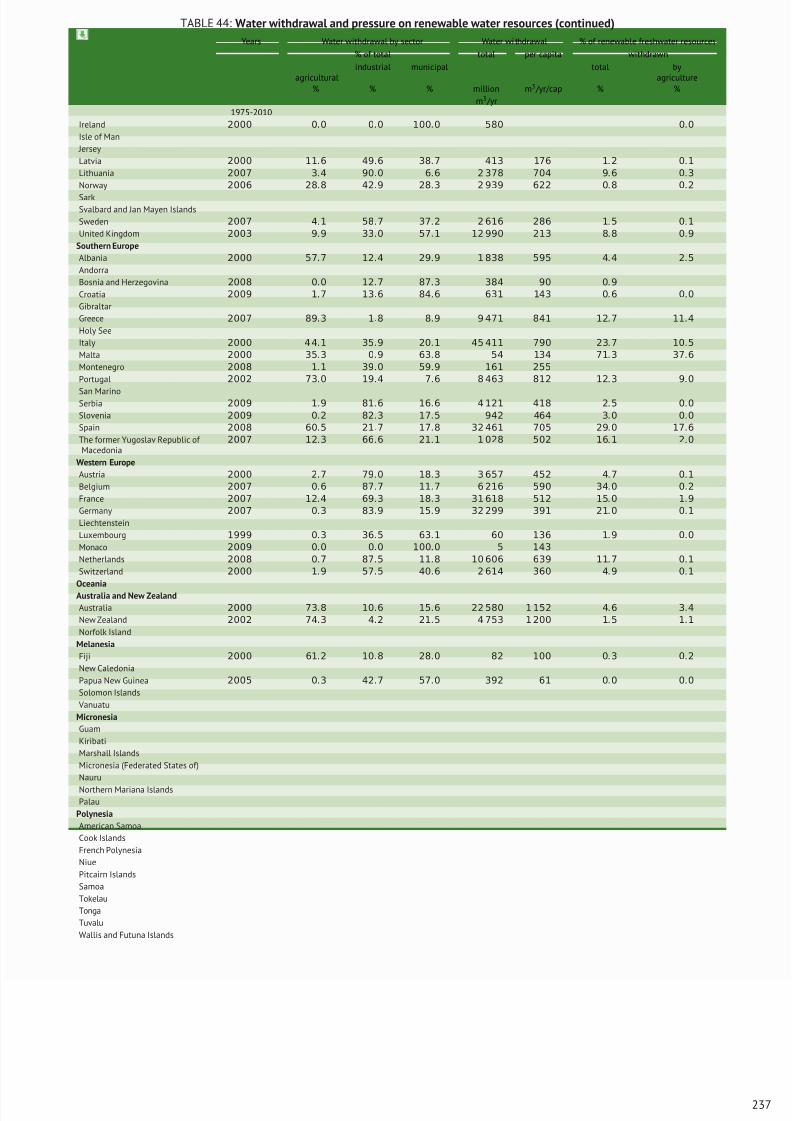
8/16/2019 Informe de la Fao 2013
http://slidepdf.com/reader/full/informe-de-la-fao-2013 255/307
TABLE 44: Water withdrawal and pressure on renewable water resources (continued)
Years Water withdrawal by sector Water wi thdrawal % of renewable freshwater resources
% of total total per capita withdrawn
agriculturalindustrial municipal total by
agriculture% % % million
m3 /yr
m3 /yr/cap % %
1975-2010
Ireland 2000 0.0 0.0 100.0 580 0.0
Isle of Man
Jersey
Latvia 2000 11.6 49.6 38.7 413 176 1.2 0.1
Lithuania 2007 3.4 90.0 6.6 2 378 704 9.6 0.3
Norway 2006 28.8 42.9 28.3 2 939 622 0.8 0.2
SarkSvalbard and Jan Mayen Islands
Sweden 2007 4.1 58.7 37.2 2 616 286 1.5 0.1
United Kingdom 2003 9.9 33.0 57.1 12 990 213 8.8 0.9
Southern Europe
Albania 2000 57.7 12.4 29.9 1 838 595 4.4 2.5
Andorra
Bosnia and Herzegovina 2008 0.0 12.7 87.3 384 90 0.9
Croatia 2009 1.7 13.6 84.6 631 143 0.6 0.0
Gibraltar
Greece 2007 89.3 1.8 8.9 9 471 841 12.7 11.4
Holy See
Italy 2000 4 4.1 35.9 20.1 45 411 790 23.7 10.5
Malta 2000 35.3 0.9 63.8 54 134 71.3 37.6
Montenegro 2008 1.1 39.0 59.9 161 255
Portugal 2002 73.0 19.4 7.6 8 463 812 12.3 9.0
San MarinoSerbia 2009 1.9 81.6 16.6 4 121 418 2.5 0.0
Slovenia 2009 0.2 82.3 17.5 942 464 3.0 0.0
Spain 2008 60.5 21.7 17.8 32 461 705 29.0 17.6
The former Yugoslav Republic of Macedonia
2007 12.3 66.6 21.1 1 028 502 16.1 2.0
Western Europe
Austria 2000 2.7 79.0 18.3 3 657 452 4.7 0.1
Belgium 2007 0.6 87.7 11.7 6 216 590 34.0 0.2
France 2007 12.4 69.3 18.3 31 618 512 15.0 1.9
Germany 2007 0.3 83.9 15.9 32 299 391 21.0 0.1
Liechtenstein
Luxembourg 1999 0.3 36.5 63.1 60 136 1.9 0.0
Monaco 2009 0.0 0.0 100.0 5 143
Netherlands 2008 0.7 87.5 11.8 10 606 639 11.7 0.1
Switzerland 2000 1.9 57.5 40.6 2 614 360 4.9 0.1
Oceania
Australia and New Zealand
Australia 2000 73.8 10.6 15.6 22 580 1 152 4.6 3.4
New Zealand 2002 74.3 4.2 21.5 4 753 1 200 1.5 1.1
Norfolk Island
Melanesia
Fiji 2000 61.2 10.8 28.0 82 100 0.3 0.2
New Caledonia
Papua New Guinea 2005 0.3 42.7 57.0 392 61 0.0 0.0
Solomon Islands
Vanuatu
Micronesia
Guam
Kiribati
Marshall Islands
Micronesia (Federated States of)
Nauru
Northern Mariana IslandsPalau
Polynesia
American Samoa
Cook Islands
French Polynesia
Niue
Pitcairn Islands
Samoa
Tokelau
Tonga
Tuvalu
Wallis and Futuna Islands
237
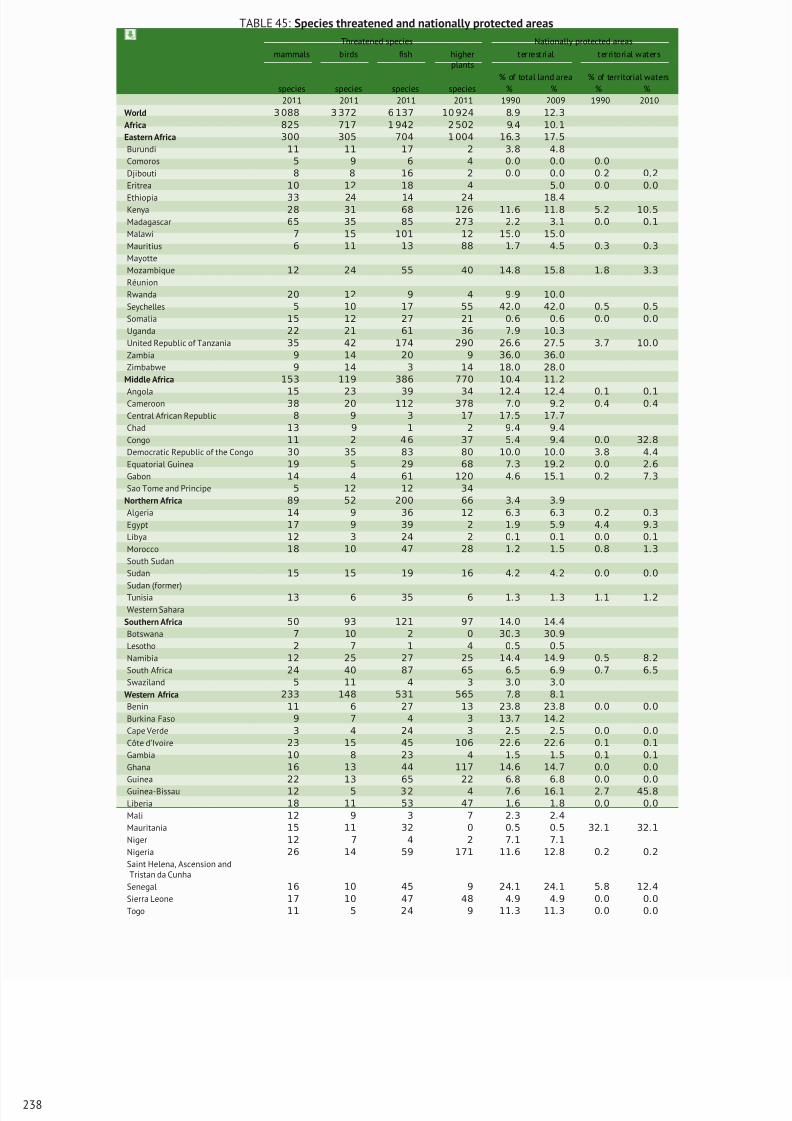
8/16/2019 Informe de la Fao 2013
http://slidepdf.com/reader/full/informe-de-la-fao-2013 256/307
TABLE 45: Species threatened and nationally protected areas
Threatened species Nationally protected areas
mammals birds fish higherplants
terrestrial territorial waters
% of total land area % of territorial watersspecies species species species % % % %
2011 2011 2011 2011 1990 2009 1990 2010
World 3 088 3 372 6 137 10 924 8.9 12.3
Africa 825 717 1 942 2 502 9.4 10.1
Eastern Africa 300 305 704 1 004 16.3 17.5
Burundi 11 11 17 2 3.8 4.8
Comoros 5 9 6 4 0.0 0.0 0.0
Djibouti 8 8 16 2 0.0 0.0 0.2 0.2
Eritrea 10 12 18 4 5.0 0.0 0.0
Ethiopia 33 24 14 24 18.4Kenya 28 31 68 126 11.6 11.8 5.2 10.5
Madagascar 65 35 85 273 2.2 3.1 0.0 0.1
Malawi 7 15 101 12 15.0 15.0
Mauritius 6 11 13 88 1.7 4.5 0.3 0.3
Mayotte
Mozambique 12 24 55 40 14.8 15.8 1.8 3.3
Réunion
Rwanda 20 12 9 4 9.9 10.0
Seychelles 5 10 17 55 42.0 42.0 0.5 0.5
Somalia 15 12 27 21 0.6 0.6 0.0 0.0
Uganda 22 21 61 36 7.9 10.3
United Republic of Tanzania 35 42 174 290 26.6 27.5 3.7 10.0
Zambia 9 14 20 9 36.0 36.0
Zimbabwe 9 14 3 14 18.0 28.0
Middle Africa 153 119 386 770 10.4 11.2
Angola 15 23 39 34 12.4 12.4 0.1 0.1Cameroon 38 20 112 378 7.0 9.2 0.4 0.4
Central African Republic 8 9 3 17 17.5 17.7
Chad 13 9 1 2 9.4 9.4
Congo 11 2 4 6 37 5.4 9.4 0.0 32.8
Democratic Republic of the Congo 30 35 83 80 10.0 10.0 3.8 4.4
Equatorial Guinea 19 5 29 68 7.3 19.2 0.0 2.6
Gabon 14 4 61 120 4.6 15.1 0.2 7.3
Sao Tome and Principe 5 12 12 34
Northern Africa 89 52 200 66 3.4 3.9
Algeria 14 9 36 12 6.3 6.3 0.2 0.3
Egypt 17 9 39 2 1.9 5.9 4.4 9.3
Libya 12 3 24 2 0.1 0.1 0.0 0.1
Morocco 18 10 47 28 1.2 1.5 0.8 1.3
South Sudan
Sudan 15 15 19 16 4.2 4.2 0.0 0.0
Sudan (former)Tunisia 13 6 35 6 1.3 1.3 1.1 1.2
Western Sahara
Southern Africa 50 93 121 97 14.0 14.4
Botswana 7 10 2 0 30.3 30.9
Lesotho 2 7 1 4 0.5 0.5
Namibia 12 25 27 25 14.4 14.9 0.5 8.2
South Africa 24 40 87 65 6.5 6.9 0.7 6.5
Swaziland 5 11 4 3 3.0 3.0
Western Africa 233 148 531 565 7.8 8.1
Benin 11 6 27 13 23.8 23.8 0.0 0.0
Burkina Faso 9 7 4 3 13.7 14.2
Cape Verde 3 4 24 3 2.5 2.5 0.0 0.0
Côte d’Ivoire 23 15 45 106 22.6 22.6 0.1 0.1
Gambia 10 8 23 4 1.5 1.5 0.1 0.1
Ghana 16 13 44 117 14.6 14.7 0.0 0.0
Guinea 22 13 65 22 6.8 6.8 0.0 0.0
Guinea-Bissau 12 5 3 2 4 7.6 16.1 2.7 45.8
Liberia 18 11 53 47 1.6 1.8 0.0 0.0
Mali 12 9 3 7 2.3 2.4
Mauritania 15 11 32 0 0.5 0.5 32.1 32.1
Niger 12 7 4 2 7.1 7.1
Nigeria 26 14 59 171 11.6 12.8 0.2 0.2
Saint Helena, Ascension andTristan da Cunha
Senegal 16 10 45 9 24.1 24.1 5.8 12.4
Sierra Leone 17 10 47 48 4.9 4.9 0.0 0.0
Togo 11 5 24 9 11.3 11.3 0.0 0.0
238
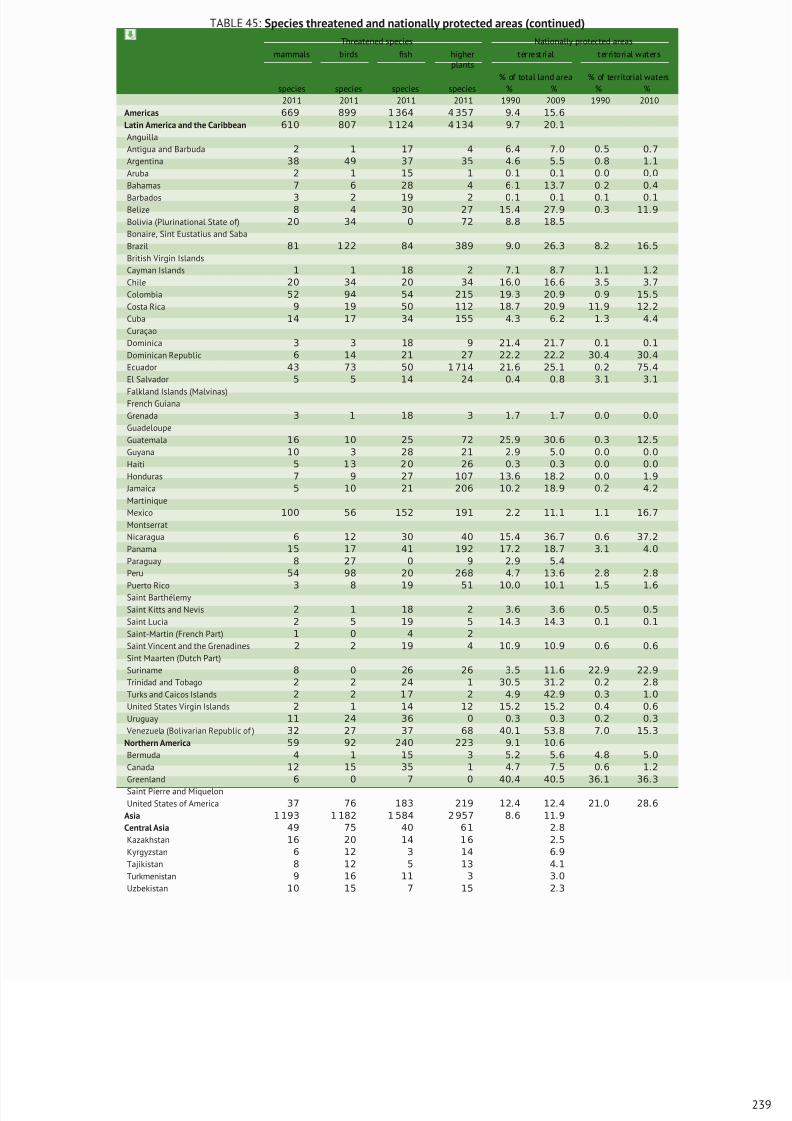
8/16/2019 Informe de la Fao 2013
http://slidepdf.com/reader/full/informe-de-la-fao-2013 257/307
TABLE 45: Species threatened and nationally protected areas (continued)
Threatened species Nationally protected areas
mammals birds fish higherplants
terrestrial territorial waters
% of total land area % of territorial watersspecies species species species % % % %
2011 2011 2011 2011 1990 2009 1990 2010
Americas 669 899 1 364 4 357 9.4 15.6
Latin America and the Caribbean 610 807 1 124 4 134 9.7 20.1
Anguilla
Antigua and Barbuda 2 1 17 4 6.4 7.0 0.5 0.7
Argentina 38 49 37 35 4.6 5.5 0.8 1.1
Aruba 2 1 15 1 0.1 0.1 0.0 0.0
Bahamas 7 6 28 4 6.1 13.7 0.2 0.4
Barbados 3 2 19 2 0.1 0.1 0.1 0.1Belize 8 4 30 27 15.4 27.9 0.3 11.9
Bolivia (Plurinational State of) 20 34 0 72 8.8 18.5
Bonaire, Sint Eustatius and Saba
Brazil 81 1 22 84 389 9.0 26.3 8.2 16.5
British Virgin Islands
Cayman Islands 1 1 18 2 7.1 8.7 1.1 1.2
Chile 20 34 20 34 16.0 16.6 3.5 3.7
Colombia 52 94 54 215 19.3 20.9 0.9 15.5
Costa Rica 9 19 50 112 18.7 20.9 11.9 12.2
Cuba 14 17 34 155 4.3 6.2 1.3 4.4
Curaçao
Dominica 3 3 18 9 21.4 21.7 0.1 0.1
Dominican Republic 6 14 21 27 22.2 22.2 30.4 30.4
Ecuador 43 73 50 1 714 21.6 25.1 0.2 75.4
El Salvador 5 5 14 24 0.4 0.8 3.1 3.1
Falkland Islands (Malvinas)French Guiana
Grenada 3 1 18 3 1.7 1.7 0.0 0.0
Guadeloupe
Guatemala 16 10 25 72 25.9 30.6 0.3 12.5
Guyana 10 3 28 21 2.9 5.0 0.0 0.0
Haiti 5 13 2 0 26 0.3 0.3 0.0 0.0
Honduras 7 9 27 107 13.6 18.2 0.0 1.9
Jamaica 5 10 21 206 10.2 18.9 0.2 4.2
Martinique
Mexico 100 56 152 191 2.2 11.1 1.1 16.7
Montserrat
Nicaragua 6 12 30 40 15.4 36.7 0.6 37.2
Panama 15 17 41 192 17.2 18.7 3.1 4.0
Paraguay 8 27 0 9 2.9 5.4
Peru 54 98 20 268 4.7 13.6 2.8 2.8
Puerto Rico 3 8 19 51 10
.0 10
.1 1
.5 1
.6
Saint Barthélemy
Saint Kitts and Nevis 2 1 18 2 3.6 3.6 0.5 0.5
Saint Lucia 2 5 19 5 14.3 14.3 0.1 0.1
Saint-Martin (French Part) 1 0 4 2
Saint Vincent and the Grenadines 2 2 19 4 10.9 10.9 0.6 0.6
Sint Maarten (Dutch Part)
Suriname 8 0 26 26 3.5 11.6 22.9 22.9
Trinidad and Tobago 2 2 24 1 30.5 31.2 0.2 2.8
Turks and Caicos Islands 2 2 1 7 2 4.9 42.9 0.3 1.0
United States Virgin Islands 2 1 14 12 15.2 15.2 0.4 0.6
Uruguay 11 24 36 0 0.3 0.3 0.2 0.3
Venezuela (Bolivarian Republic of ) 32 27 37 68 40.1 53.8 7.0 15.3
Northern America 59 92 240 223 9.1 10.6
Bermuda 4 1 15 3 5.2 5.6 4.8 5.0
Canada 12 15 35 1 4.7 7.5 0.6 1.2
Greenland 6 0 7 0 40.4 40.5 36.1 36.3
Saint Pierre and Miquelon
United States of America 37 76 183 219 12.4 12.4 21.0 28.6
Asia 1 193 1 182 1 584 2 957 8 .6 11.9
Central Asia 49 75 40 6 1 2.8
Kazakhstan 16 20 14 1 6 2.5
Kyrgyzstan 6 12 3 14 6.9
Tajikistan 8 12 5 13 4.1
Turkmenistan 9 16 11 3 3.0
Uzbekistan 10 15 7 15 2.3
239
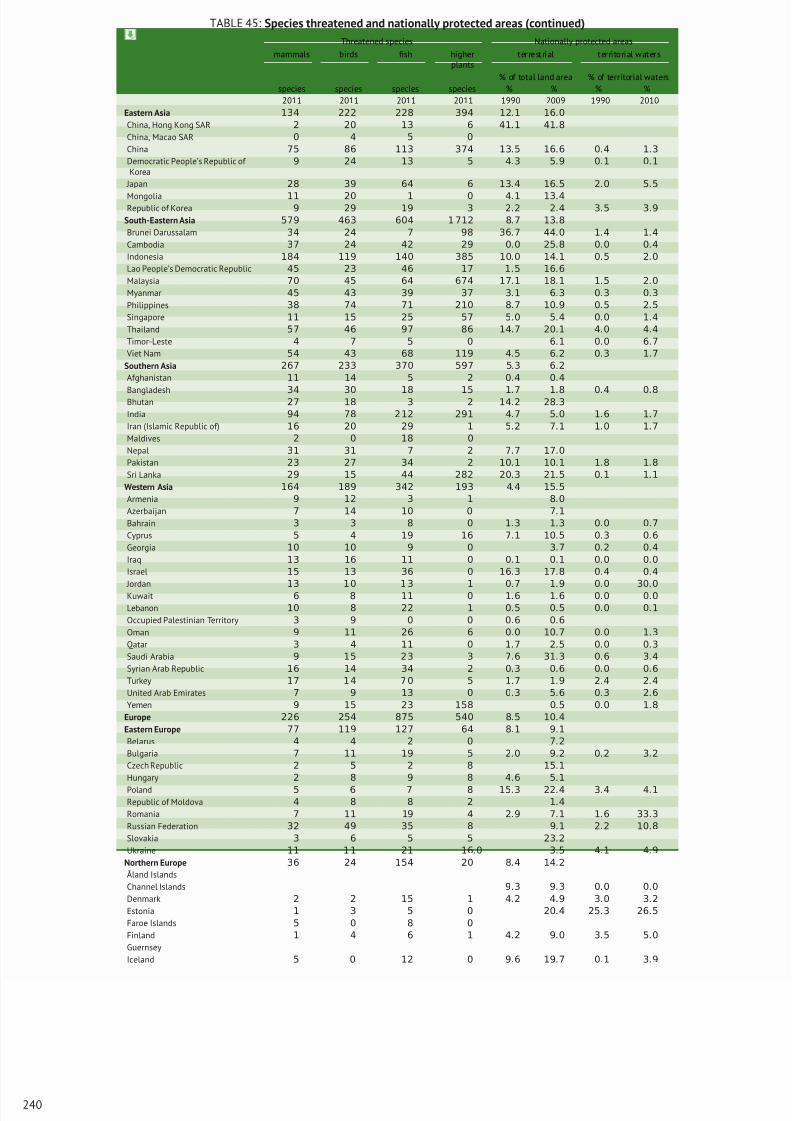
8/16/2019 Informe de la Fao 2013
http://slidepdf.com/reader/full/informe-de-la-fao-2013 258/307
TABLE 45: Species threatened and nationally protected areas (continued)
Threatened species Nationally protected areas
mammals birds fish higherplants
terrestrial territorial waters
% of total land area % of territorial watersspecies species species species % % % %
2011 2011 2011 2011 1990 2009 1990 2010
Eastern Asia 134 222 228 394 12.1 16.0
China, Hong Kong SAR 2 20 13 6 41.1 41.8
China, Macao SAR 0 4 5 0
China 75 86 113 374 13.5 16.6 0.4 1.3
Democratic People’s Republic of Korea
9 24 13 5 4.3 5.9 0.1 0.1
Japan 28 39 64 6 13.4 16.5 2.0 5.5
Mongolia 11 20 1 0 4.1 13.4Republic of Korea 9 29 19 3 2.2 2.4 3.5 3.9
South-Eastern Asia 579 463 604 1 712 8.7 13.8
Brunei Darussalam 34 24 7 98 36.7 44.0 1.4 1.4
Cambodia 37 24 42 29 0.0 25.8 0.0 0.4
Indonesia 184 119 140 385 10.0 14.1 0.5 2.0
Lao People’s Democratic Republic 45 23 46 17 1.5 16.6
Malaysia 70 45 64 674 17.1 18.1 1.5 2.0
Myanmar 45 43 39 37 3.1 6.3 0.3 0.3
Philippines 38 74 71 210 8.7 10.9 0.5 2.5
Singapore 11 15 25 57 5.0 5.4 0.0 1.4
Thailand 57 46 97 86 14.7 20.1 4.0 4.4
Timor-Leste 4 7 5 0 6.1 0.0 6.7
Viet Nam 54 43 68 119 4.5 6.2 0.3 1.7
Southern Asia 267 233 370 597 5.3 6.2
Afghanistan 11 14 5 2 0.4 0.4
Bangladesh 34 30 18 15 1.7 1.8 0.4 0.8Bhutan 27 18 3 2 14.2 28.3
India 94 78 2 12 291 4.7 5.0 1.6 1.7
Iran (Islamic Republic of) 16 20 29 1 5.2 7.1 1.0 1.7
Maldives 2 0 18 0
Nepal 31 31 7 2 7.7 17.0
Pakistan 23 27 34 2 10.1 10.1 1.8 1.8
Sri Lanka 29 15 44 282 20.3 21.5 0.1 1.1
Western Asia 164 189 342 193 4.4 15.5
Armenia 9 12 3 1 8.0
Azerbaijan 7 14 10 0 7.1
Bahrain 3 3 8 0 1.3 1.3 0.0 0.7
Cyprus 5 4 19 16 7.1 10.5 0.3 0.6
Georgia 10 10 9 0 3.7 0.2 0.4
Iraq 13 16 11 0 0.1 0.1 0.0 0.0
Israel 15 13 36 0 16.3 17.8 0.4 0.4
Jordan 13 1 0 1 3 1 0.7 1.9 0.0 30.0
Kuwait 6 8 11 0 1.6 1.6 0.0 0.0
Lebanon 10 8 22 1 0.5 0.5 0.0 0.1
Occupied Palestinian Territory 3 9 0 0 0.6 0.6
Oman 9 11 26 6 0.0 10.7 0.0 1.3
Qatar 3 4 11 0 1.7 2.5 0.0 0.3
Saudi Arabia 9 15 23 3 7.6 31.3 0.6 3.4
Syrian Arab Republic 16 14 34 2 0.3 0.6 0.0 0.6
Turkey 17 1 4 7 0 5 1.7 1.9 2.4 2.4
United Arab Emirates 7 9 13 0 0.3 5.6 0.3 2.6
Yemen 9 15 23 158 0.5 0.0 1.8
Europe 226 254 875 540 8.5 10.4
Eastern Europe 77 119 127 64 8.1 9.1
Belarus 4 4 2 0 7.2
Bulgaria 7 11 19 5 2.0 9.2 0.2 3.2
Czech Republic 2 5 2 8 15.1
Hungary 2 8 9 8 4.6 5.1
Poland 5 6 7 8 15.3 22.4 3.4 4.1
Republic of Moldova 4 8 8 2 1.4
Romania 7 11 19 4 2.9 7.1 1.6 33.3
Russian Federation 32 49 35 8 9.1 2.2 10.8
Slovakia 3 6 5 5 23.2
Ukraine 11 1 1 21 16.0 3.5 4.1 4.9
Northern Europe 36 24 154 20 8.4 14.2
Åland Islands
Channel Islands 9.3 9.3 0.0 0.0
Denmark 2 2 15 1 4.2 4.9 3.0 3.2
Estonia 1 3 5 0 20.4 25.3 26.5
Faroe Islands 5 0 8 0
Finland 1 4 6 1 4.2 9.0 3.5 5.0
Guernsey
Iceland 5 0 12 0 9.6 19.7 0.1 3.9
240
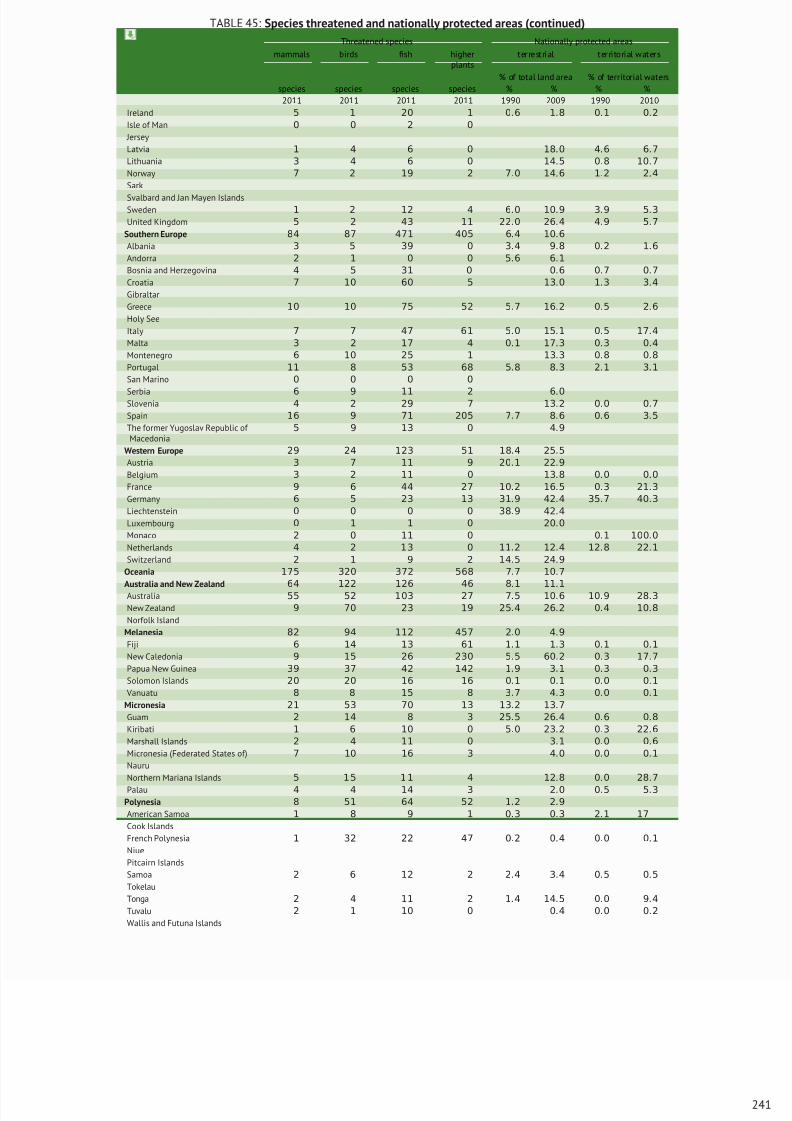
8/16/2019 Informe de la Fao 2013
http://slidepdf.com/reader/full/informe-de-la-fao-2013 259/307
TABLE 45: Species threatened and nationally protected areas (continued)
Threatened species Nationally protected areas
mammals birds fish higherplants
terrestrial territorial waters
% of total land area % of territorial watersspecies species species species % % % %
2011 2011 2011 2011 1990 2009 1990 2010
Ireland 5 1 20 1 0.6 1.8 0.1 0.2
Isle of Man 0 0 2 0
Jersey
Latvia 1 4 6 0 18.0 4.6 6.7
Lithuania 3 4 6 0 14.5 0.8 10.7
Norway 7 2 19 2 7.0 14.6 1.2 2.4
Sark
Svalbard and Jan Mayen IslandsSweden 1 2 12 4 6.0 10.9 3.9 5.3
United Kingdom 5 2 43 11 22.0 26.4 4.9 5.7
Southern Europe 84 87 471 405 6.4 10.6
Albania 3 5 39 0 3.4 9.8 0.2 1.6
Andorra 2 1 0 0 5.6 6.1
Bosnia and Herzegovina 4 5 31 0 0.6 0.7 0.7
Croatia 7 10 60 5 13.0 1.3 3.4
Gibraltar
Greece 10 10 75 52 5.7 16.2 0.5 2.6
Holy See
Italy 7 7 47 61 5.0 15.1 0.5 17.4
Malta 3 2 17 4 0.1 17.3 0.3 0.4
Montenegro 6 10 25 1 13.3 0.8 0.8
Portugal 11 8 53 68 5.8 8.3 2.1 3.1
San Marino 0 0 0 0
Serbia 6 9 11 2 6.0Slovenia 4 2 29 7 13.2 0.0 0.7
Spain 16 9 71 205 7.7 8.6 0.6 3.5
The former Yugoslav Republic of Macedonia
5 9 13 0 4.9
Western Europe 29 24 123 51 18.4 25.5
Austria 3 7 11 9 20.1 22.9
Belgium 3 2 11 0 13.8 0.0 0.0
France 9 6 44 27 10.2 16.5 0.3 21.3
Germany 6 5 23 13 31.9 42.4 35.7 40.3
Liechtenstein 0 0 0 0 38.9 42.4
Luxembourg 0 1 1 0 20.0
Monaco 2 0 11 0 0.1 100.0
Netherlands 4 2 13 0 11.2 12.4 12.8 22.1
Switzerland 2 1 9 2 14.5 24.9
Oceania 175 320 372 568 7.7 10.7
Australia and New Zealand 64 122 126 46 8.1 11.1
Australia 55 52 103 27 7.5 10.6 10.9 28.3
New Zealand 9 70 23 19 25.4 26.2 0.4 10.8
Norfolk Island
Melanesia 82 94 112 457 2.0 4.9
Fiji 6 14 13 61 1.1 1.3 0.1 0.1
New Caledonia 9 15 26 230 5.5 60.2 0.3 17.7
Papua New Guinea 39 37 42 142 1.9 3.1 0.3 0.3
Solomon Islands 20 20 16 16 0.1 0.1 0.0 0.1
Vanuatu 8 8 15 8 3.7 4.3 0.0 0.1
Micronesia 21 53 70 13 13.2 13.7
Guam 2 14 8 3 25.5 26.4 0.6 0.8
Kiribati 1 6 10 0 5.0 23.2 0.3 22.6
Marshall Islands 2 4 11 0 3.1 0.0 0.6
Micronesia (Federated States of) 7 10 16 3 4.0 0.0 0.1
Nauru
Northern Mariana Islands 5 1 5 1 1 4 12.8 0.0 28.7
Palau 4 4 14 3 2.0 0.5 5.3
Polynesia 8 51 64 52 1.2 2.9
American Samoa 1 8 9 1 0.3 0.3 2.1 17
Cook Islands
French Polynesia 1 32 22 47 0.2 0.4 0.0 0.1
Niue
Pitcairn Islands
Samoa 2 6 12 2 2.4 3.4 0.5 0.5
Tokelau
Tonga 2 4 11 2 1.4 14.5 0.0 9.4
Tuvalu 2 1 10 0 0.4 0.0 0.2
Wallis and Futuna Islands
241
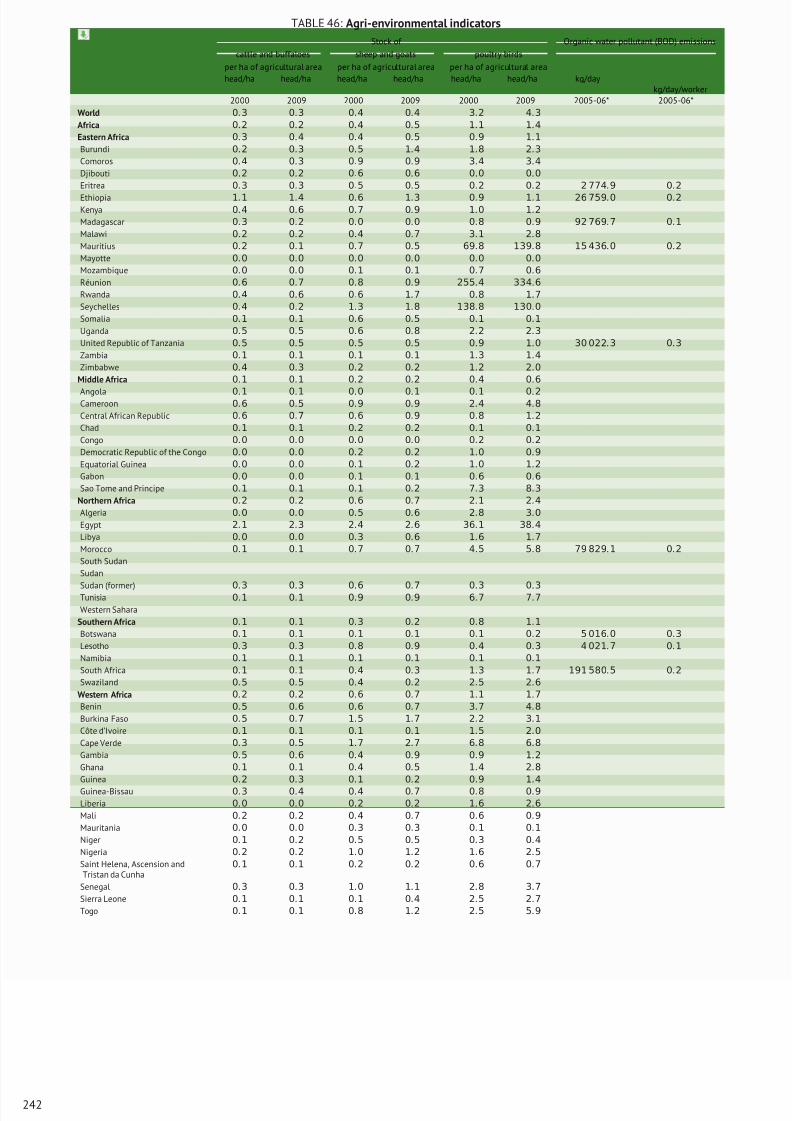
8/16/2019 Informe de la Fao 2013
http://slidepdf.com/reader/full/informe-de-la-fao-2013 260/307
TABLE 46: Agri-environmental indicators
Stock of Organic water pollutant (BOD) emissions
cattle and buffaloes sheep and goats poultry birds
per ha of agricultural area per ha of agricultural area per ha of agricultural areahead/ha head/ha head/ha head/ha head/ha head/ha kg/day
kg/day/worker2000 2009 2000 2009 2000 2009 2005-06* 2005-06*
World 0.3 0.3 0.4 0.4 3.2 4.3
Africa 0.2 0.2 0.4 0.5 1.1 1.4
Eastern Africa 0.3 0.4 0.4 0.5 0.9 1.1
Burundi 0.2 0.3 0.5 1.4 1.8 2.3
Comoros 0.4 0.3 0.9 0.9 3.4 3.4
Djibouti 0.2 0.2 0.6 0.6 0.0 0.0
Eritrea 0.3 0.3 0.5 0.5 0.2 0.2 2 774.9 0.2
Ethiopia 1.1 1.4 0.6 1.3 0.9 1.1 26 759.0 0.2Kenya 0.4 0.6 0.7 0.9 1.0 1.2
Madagascar 0.3 0.2 0.0 0.0 0.8 0.9 92 769.7 0.1
Malawi 0.2 0.2 0.4 0.7 3.1 2.8
Mauritius 0.2 0.1 0.7 0.5 69.8 139.8 15 436.0 0.2
Mayotte 0.0 0.0 0.0 0.0 0.0 0.0
Mozambique 0.0 0.0 0.1 0.1 0.7 0.6
Réunion 0.6 0.7 0.8 0.9 255.4 334.6
Rwanda 0.4 0.6 0.6 1.7 0.8 1.7
Seychelles 0.4 0.2 1.3 1.8 138.8 130.0
Somalia 0.1 0.1 0.6 0.5 0.1 0.1
Uganda 0.5 0.5 0.6 0.8 2.2 2.3
United Republic of Tanzania 0.5 0.5 0.5 0.5 0.9 1.0 30 022.3 0.3
Zambia 0.1 0.1 0.1 0.1 1.3 1.4
Zimbabwe 0.4 0.3 0.2 0.2 1.2 2.0
Middle Africa 0.1 0.1 0.2 0.2 0.4 0.6
Angola 0.1 0.1 0.0 0.1 0.1 0.2Cameroon 0.6 0.5 0.9 0.9 2.4 4.8
Central African Republic 0.6 0.7 0.6 0.9 0.8 1.2
Chad 0.1 0.1 0.2 0.2 0.1 0.1
Congo 0.0 0.0 0.0 0.0 0.2 0.2
Democratic Republic of the Congo 0.0 0.0 0.2 0.2 1.0 0.9
Equatorial Guinea 0.0 0.0 0.1 0.2 1.0 1.2
Gabon 0.0 0.0 0.1 0.1 0.6 0.6
Sao Tome and Principe 0.1 0.1 0.1 0.2 7.3 8.3
Northern Africa 0.2 0.2 0.6 0.7 2.1 2.4
Algeria 0.0 0.0 0.5 0.6 2.8 3.0
Egypt 2.1 2.3 2.4 2.6 36.1 38.4
Libya 0.0 0.0 0.3 0.6 1.6 1.7
Morocco 0.1 0.1 0.7 0.7 4.5 5.8 79 829.1 0.2
South Sudan
Sudan
Sudan (former) 0
.3 0
.3 0
.6 0
.7 0
.3 0
.3
Tunisia 0.1 0.1 0.9 0.9 6.7 7.7
Western Sahara
Southern Africa 0.1 0.1 0.3 0.2 0.8 1.1
Botswana 0.1 0.1 0.1 0.1 0.1 0.2 5 016.0 0.3
Lesotho 0.3 0.3 0.8 0.9 0.4 0.3 4 021.7 0.1
Namibia 0.1 0.1 0.1 0.1 0.1 0.1
South Africa 0.1 0.1 0.4 0.3 1.3 1.7 191 580.5 0.2
Swaziland 0.5 0.5 0.4 0.2 2.5 2.6
Western Africa 0.2 0.2 0.6 0.7 1.1 1.7
Benin 0.5 0.6 0.6 0.7 3.7 4.8
Burkina Faso 0.5 0.7 1.5 1.7 2.2 3.1
Côte d’Ivoire 0.1 0.1 0.1 0.1 1.5 2.0
Cape Verde 0.3 0.5 1.7 2.7 6.8 6.8
Gambia 0.5 0.6 0.4 0.9 0.9 1.2
Ghana 0.1 0.1 0.4 0.5 1.4 2.8
Guinea 0.2 0.3 0.1 0.2 0.9 1.4
Guinea-Bissau 0.3 0.4 0.4 0.7 0.8 0.9
Liberia 0.0 0.0 0.2 0.2 1.6 2.6
Mali 0.2 0.2 0.4 0.7 0.6 0.9
Mauritania 0.0 0.0 0.3 0.3 0.1 0.1
Niger 0.1 0.2 0.5 0.5 0.3 0.4
Nigeria 0.2 0.2 1.0 1.2 1.6 2.5
Saint Helena, Ascension andTristan da Cunha
0.1 0.1 0.2 0.2 0.6 0.7
Senegal 0.3 0.3 1.0 1.1 2.8 3.7
Sierra Leone 0.1 0.1 0.1 0.4 2.5 2.7
Togo 0.1 0.1 0.8 1.2 2.5 5.9
242
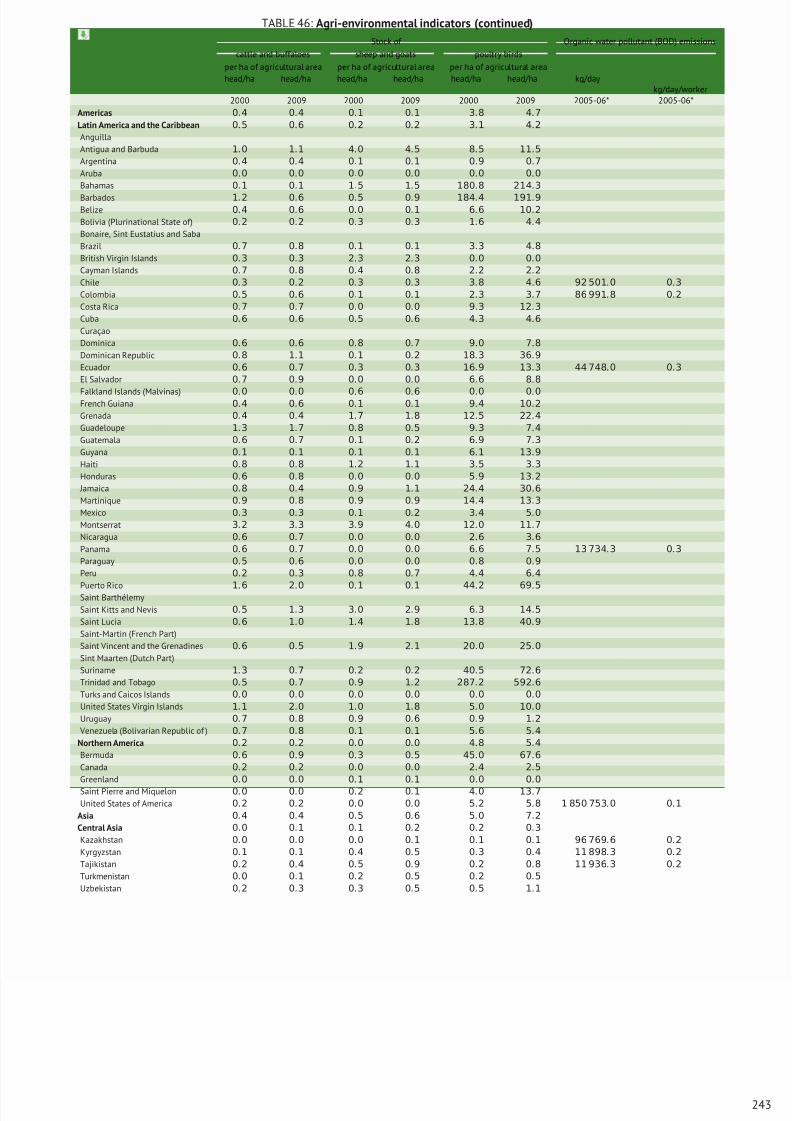
8/16/2019 Informe de la Fao 2013
http://slidepdf.com/reader/full/informe-de-la-fao-2013 261/307
TABLE 46: Agri-environmental indicators (continued)
Stock of Organic water pollutant (BOD) emissions
cattle and buffaloes sheep and goats poultry birds
per ha of agricultural area per ha of agricultural area per ha of agricultural areahead/ha head/ha head/ha head/ha head/ha head/ha kg/day
kg/day/worker2000 2009 2000 2009 2000 2009 2005-06* 2005-06*
Americas 0.4 0.4 0.1 0.1 3.8 4.7
Latin America and the Caribbean 0.5 0.6 0.2 0.2 3.1 4.2
Anguilla
Antigua and Barbuda 1.0 1.1 4.0 4.5 8.5 11.5
Argentina 0.4 0.4 0.1 0.1 0.9 0.7
Aruba 0.0 0.0 0.0 0.0 0.0 0.0
Bahamas 0.1 0.1 1.5 1.5 180.8 214.3
Barbados 1.2 0.6 0.5 0.9 184.4 191.9Belize 0.4 0.6 0.0 0.1 6.6 10.2
Bolivia (Plurinational State of) 0.2 0.2 0.3 0.3 1.6 4.4
Bonaire, Sint Eustatius and Saba
Brazil 0.7 0.8 0.1 0.1 3.3 4.8
British Virgin Islands 0.3 0.3 2.3 2.3 0.0 0.0
Cayman Islands 0.7 0.8 0.4 0.8 2.2 2.2
Chile 0.3 0.2 0.3 0.3 3.8 4.6 92 501.0 0.3
Colombia 0.5 0.6 0.1 0.1 2.3 3.7 86 991.8 0.2
Costa Rica 0.7 0.7 0.0 0.0 9.3 12.3
Cuba 0.6 0.6 0.5 0.6 4.3 4.6
Curaçao
Dominica 0.6 0.6 0.8 0.7 9.0 7.8
Dominican Republic 0.8 1.1 0.1 0.2 18.3 36.9
Ecuador 0.6 0.7 0.3 0.3 16.9 13.3 44 748.0 0.3
El Salvador 0.7 0.9 0.0 0.0 6.6 8.8
Falkland Islands (Malvinas) 0.0 0.0 0.6 0.6 0.0 0.0French Guiana 0.4 0.6 0.1 0.1 9.4 10.2
Grenada 0.4 0.4 1.7 1.8 12.5 22.4
Guadeloupe 1.3 1.7 0.8 0.5 9.3 7.4
Guatemala 0.6 0.7 0.1 0.2 6.9 7.3
Guyana 0.1 0.1 0.1 0.1 6.1 13.9
Haiti 0.8 0.8 1.2 1.1 3.5 3.3
Honduras 0.6 0.8 0.0 0.0 5.9 13.2
Jamaica 0.8 0.4 0.9 1.1 24.4 30.6
Martinique 0.9 0.8 0.9 0.9 14.4 13.3
Mexico 0.3 0.3 0.1 0.2 3.4 5.0
Montserrat 3.2 3.3 3.9 4.0 12.0 11.7
Nicaragua 0.6 0.7 0.0 0.0 2.6 3.6
Panama 0.6 0.7 0.0 0.0 6.6 7.5 13 734.3 0.3
Paraguay 0.5 0.6 0.0 0.0 0.8 0.9
Peru 0.2 0.3 0.8 0.7 4.4 6.4
Puerto Rico 1
.6 2
.0 0
.1 0
.1 44
.2 69
.5
Saint Barthélemy
Saint Kitts and Nevis 0.5 1.3 3.0 2.9 6.3 14.5
Saint Lucia 0.6 1.0 1.4 1.8 13.8 40.9
Saint-Martin (French Part)
Saint Vincent and the Grenadines 0.6 0.5 1.9 2.1 20.0 25.0
Sint Maarten (Dutch Part)
Suriname 1.3 0.7 0.2 0.2 40.5 72.6
Trinidad and Tobago 0.5 0.7 0.9 1.2 287.2 592.6
Turks and Caicos Islands 0.0 0.0 0.0 0.0 0.0 0.0
United States Virgin Islands 1.1 2.0 1.0 1.8 5.0 10.0
Uruguay 0.7 0.8 0.9 0.6 0.9 1.2
Venezuela (Bolivarian Republic of ) 0.7 0.8 0.1 0.1 5.6 5.4
Northern America 0.2 0.2 0.0 0.0 4.8 5.4
Bermuda 0.6 0.9 0.3 0.5 45.0 67.6
Canada 0.2 0.2 0.0 0.0 2.4 2.5
Greenland 0.0 0.0 0.1 0.1 0.0 0.0
Saint Pierre and Miquelon 0.0 0.0 0.2 0.1 4.0 13.7
United States of America 0.2 0.2 0.0 0.0 5.2 5.8 1 850 753.0 0.1
Asia 0.4 0.4 0.5 0.6 5.0 7.2
Central Asia 0.0 0.1 0.1 0.2 0.2 0.3
Kazakhstan 0.0 0.0 0.0 0.1 0.1 0.1 96 769.6 0.2
Kyrgyzstan 0.1 0.1 0.4 0.5 0.3 0.4 11 898.3 0.2
Tajikistan 0.2 0.4 0.5 0.9 0.2 0.8 11 936.3 0.2
Turkmenistan 0.0 0.1 0.2 0.5 0.2 0.5
Uzbekistan 0.2 0.3 0.3 0.5 0.5 1.1
243
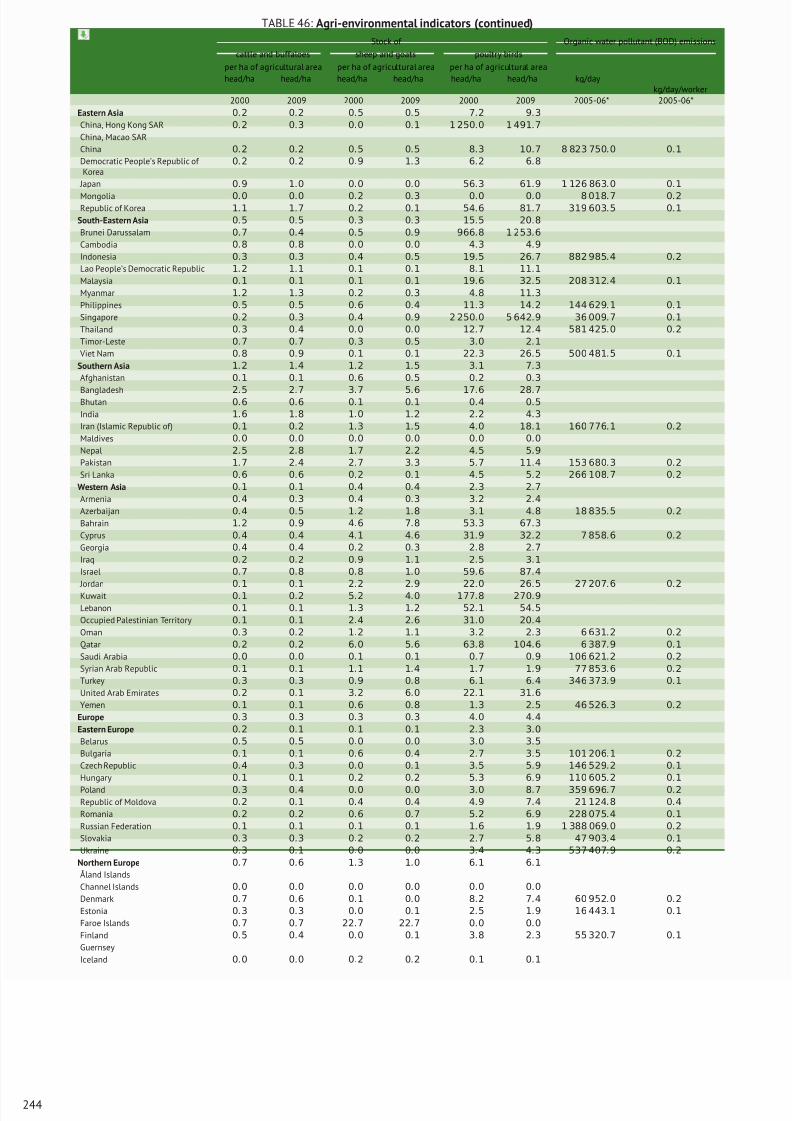
8/16/2019 Informe de la Fao 2013
http://slidepdf.com/reader/full/informe-de-la-fao-2013 262/307
TABLE 46: Agri-environmental indicators (continued)
Stock of Organic water pollutant (BOD) emissions
cattle and buffaloes sheep and goats poultry birds
per ha of agricultural area per ha of agricultural area per ha of agricultural areahead/ha head/ha head/ha head/ha head/ha head/ha kg/day
kg/day/worker2000 2009 2000 2009 2000 2009 2005-06* 2005-06*
Eastern Asia 0.2 0.2 0.5 0.5 7.2 9.3
China, Hong Kong SAR 0.2 0.3 0.0 0.1 1 250.0 1 491.7
China, Macao SAR
China 0.2 0.2 0.5 0.5 8.3 10.7 8 823 750.0 0.1
Democratic People’s Republic of Korea
0.2 0.2 0.9 1.3 6.2 6.8
Japan 0.9 1.0 0.0 0.0 56.3 61.9 1 126 863.0 0.1
Mongolia 0.0 0.0 0.2 0.3 0.0 0.0 8 018.7 0.2Republic of Korea 1.1 1.7 0.2 0.1 54.6 81.7 319 603.5 0.1
South-Eastern Asia 0.5 0.5 0.3 0.3 15.5 20.8
Brunei Darussalam 0.7 0.4 0.5 0.9 966.8 1 253.6
Cambodia 0.8 0.8 0.0 0.0 4.3 4.9
Indonesia 0.3 0.3 0.4 0.5 19.5 26.7 882 985.4 0.2
Lao People’s Democratic Republic 1.2 1.1 0.1 0.1 8.1 11.1
Malaysia 0.1 0.1 0.1 0.1 19.6 32.5 208 312.4 0.1
Myanmar 1.2 1.3 0.2 0.3 4.8 11.3
Philippines 0.5 0.5 0.6 0.4 11.3 14.2 144 629.1 0.1
Singapore 0.2 0.3 0.4 0.9 2 250.0 5 642.9 36 009.7 0.1
Thailand 0.3 0.4 0.0 0.0 12.7 12.4 581 425.0 0.2
Timor-Leste 0.7 0.7 0.3 0.5 3.0 2.1
Viet Nam 0.8 0.9 0.1 0.1 22.3 26.5 500 481.5 0.1
Southern Asia 1.2 1.4 1.2 1.5 3.1 7.3
Afghanistan 0.1 0.1 0.6 0.5 0.2 0.3
Bangladesh 2.5 2.7 3.7 5.6 17.6 28.7Bhutan 0.6 0.6 0.1 0.1 0.4 0.5
India 1.6 1.8 1.0 1.2 2.2 4.3
Iran (Islamic Republic of) 0.1 0.2 1.3 1.5 4.0 18.1 160 776.1 0.2
Maldives 0.0 0.0 0.0 0.0 0.0 0.0
Nepal 2.5 2.8 1.7 2.2 4.5 5.9
Pakistan 1.7 2.4 2.7 3.3 5.7 11.4 153 680.3 0.2
Sri Lanka 0.6 0.6 0.2 0.1 4.5 5.2 266 108.7 0.2
Western Asia 0.1 0.1 0.4 0.4 2.3 2.7
Armenia 0.4 0.3 0.4 0.3 3.2 2.4
Azerbaijan 0.4 0.5 1.2 1.8 3.1 4.8 18 835.5 0.2
Bahrain 1.2 0.9 4.6 7.8 53.3 67.3
Cyprus 0.4 0.4 4.1 4.6 31.9 32.2 7 858.6 0.2
Georgia 0.4 0.4 0.2 0.3 2.8 2.7
Iraq 0.2 0.2 0.9 1.1 2.5 3.1
Israel 0.7 0.8 0.8 1.0 59.6 87.4
Jordan 0.1 0.1 2.2 2.9 22.0 26.5 27 207.6 0.2
Kuwait 0.1 0.2 5.2 4.0 177.8 270.9
Lebanon 0.1 0.1 1.3 1.2 52.1 54.5
Occupied Palestinian Territory 0.1 0.1 2.4 2.6 31.0 20.4
Oman 0.3 0.2 1.2 1.1 3.2 2.3 6 631.2 0.2
Qatar 0.2 0.2 6.0 5.6 63.8 104.6 6 387.9 0.1
Saudi Arabia 0.0 0.0 0.1 0.1 0.7 0.9 106 621.2 0.2
Syrian Arab Republic 0.1 0.1 1.1 1.4 1.7 1.9 77 853.6 0.2
Turkey 0.3 0.3 0.9 0.8 6.1 6.4 346 373.9 0.1
United Arab Emirates 0.2 0.1 3.2 6.0 22.1 31.6
Yemen 0.1 0.1 0.6 0.8 1.3 2.5 46 526.3 0.2
Europe 0.3 0.3 0.3 0.3 4.0 4.4
Eastern Europe 0.2 0.1 0.1 0.1 2.3 3.0
Belarus 0.5 0.5 0.0 0.0 3.0 3.5
Bulgaria 0.1 0.1 0.6 0.4 2.7 3.5 101 206.1 0.2
Czech Republic 0.4 0.3 0.0 0.1 3.5 5.9 146 529.2 0.1
Hungary 0.1 0.1 0.2 0.2 5.3 6.9 110 605.2 0.1
Poland 0.3 0.4 0.0 0.0 3.0 8.7 359 696.7 0.2
Republic of Moldova 0.2 0.1 0.4 0.4 4.9 7.4 21 124.8 0.4
Romania 0.2 0.2 0.6 0.7 5.2 6.9 228 075.4 0.1
Russian Federation 0.1 0.1 0.1 0.1 1.6 1.9 1 388 069.0 0.2
Slovakia 0.3 0.3 0.2 0.2 2.7 5.8 47 903.4 0.1
Ukraine 0.3 0.1 0.0 0.0 3.4 4.3 537 407.9 0.2
Northern Europe 0.7 0.6 1.3 1.0 6.1 6.1
Åland Islands
Channel Islands 0.0 0.0 0.0 0.0 0.0 0.0
Denmark 0.7 0.6 0.1 0.0 8.2 7.4 60 952.0 0.2
Estonia 0.3 0.3 0.0 0.1 2.5 1.9 16 443.1 0.1
Faroe Islands 0.7 0.7 22.7 22.7 0.0 0.0
Finland 0.5 0.4 0.0 0.1 3.8 2.3 55 320.7 0.1
Guernsey
Iceland 0.0 0.0 0.2 0.2 0.1 0.1
244
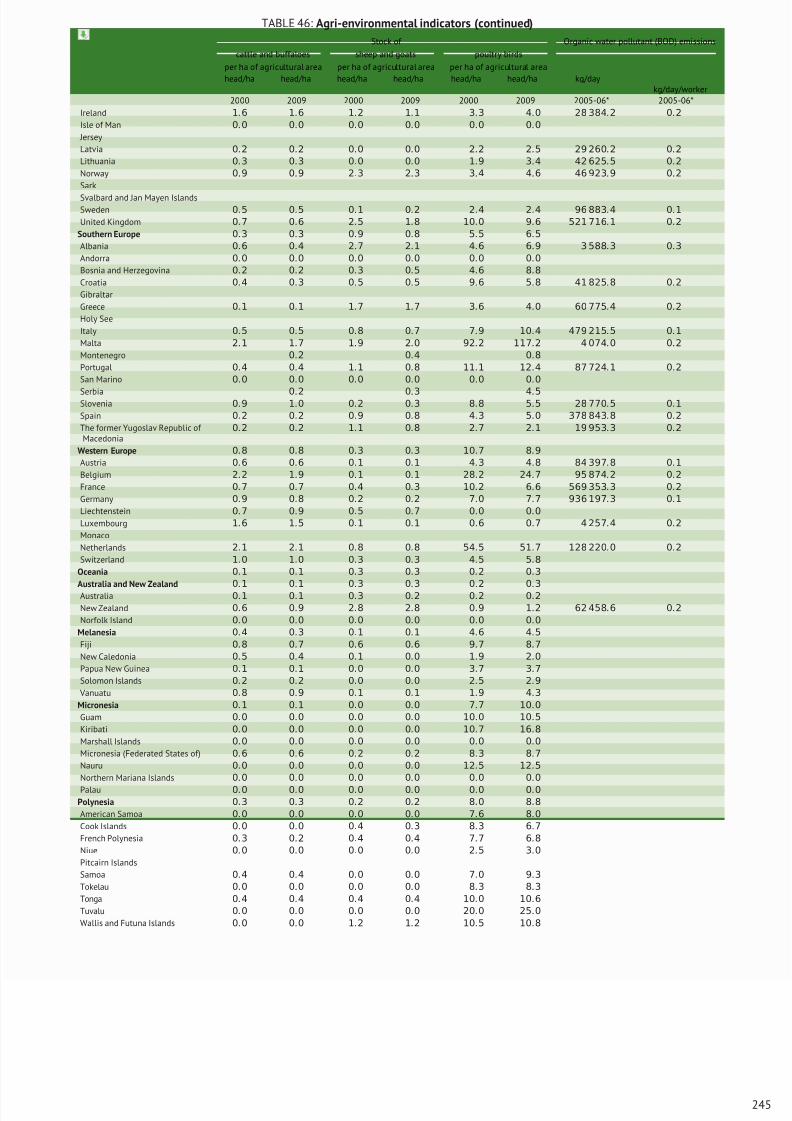
8/16/2019 Informe de la Fao 2013
http://slidepdf.com/reader/full/informe-de-la-fao-2013 263/307
TABLE 46: Agri-environmental indicators (continued)
Stock of Organic water pollutant (BOD) emissions
cattle and buffaloes sheep and goats poultry birds
per ha of agricultural area per ha of agricultural area per ha of agricultural areahead/ha head/ha head/ha head/ha head/ha head/ha kg/day
kg/day/worker2000 2009 2000 2009 2000 2009 2005-06* 2005-06*
Ireland 1.6 1.6 1.2 1.1 3.3 4.0 28 384.2 0.2
Isle of Man 0.0 0.0 0.0 0.0 0.0 0.0
Jersey
Latvia 0.2 0.2 0.0 0.0 2.2 2.5 29 260.2 0.2
Lithuania 0.3 0.3 0.0 0.0 1.9 3.4 42 625.5 0.2
Norway 0.9 0.9 2.3 2.3 3.4 4.6 46 923.9 0.2
Sark
Svalbard and Jan Mayen IslandsSweden 0.5 0.5 0.1 0.2 2.4 2.4 96 883.4 0.1
United Kingdom 0.7 0.6 2.5 1.8 10.0 9.6 521 716.1 0.2
Southern Europe 0.3 0.3 0.9 0.8 5.5 6.5
Albania 0.6 0.4 2.7 2.1 4.6 6.9 3 588.3 0.3
Andorra 0.0 0.0 0.0 0.0 0.0 0.0
Bosnia and Herzegovina 0.2 0.2 0.3 0.5 4.6 8.8
Croatia 0.4 0.3 0.5 0.5 9.6 5.8 41 825.8 0.2
Gibraltar
Greece 0.1 0.1 1.7 1.7 3.6 4.0 60 775.4 0.2
Holy See
Italy 0.5 0.5 0.8 0.7 7.9 10.4 479 215.5 0.1
Malta 2.1 1.7 1.9 2.0 92.2 117.2 4 074.0 0.2
Montenegro 0.2 0.4 0.8
Portugal 0.4 0.4 1.1 0.8 11.1 12.4 87 724.1 0.2
San Marino 0.0 0.0 0.0 0.0 0.0 0.0
Serbia 0.2 0.3 4.5Slovenia 0.9 1.0 0.2 0.3 8.8 5.5 28 770.5 0.1
Spain 0.2 0.2 0.9 0.8 4.3 5.0 378 843.8 0.2
The former Yugoslav Republic of Macedonia
0.2 0.2 1.1 0.8 2.7 2.1 19 953.3 0.2
Western Europe 0.8 0.8 0.3 0.3 10.7 8.9
Austria 0.6 0.6 0.1 0.1 4.3 4.8 84 397.8 0.1
Belgium 2.2 1.9 0.1 0.1 28.2 24.7 95 874.2 0.2
France 0.7 0.7 0.4 0.3 10.2 6.6 569 353.3 0.2
Germany 0.9 0.8 0.2 0.2 7.0 7.7 936 197.3 0.1
Liechtenstein 0.7 0.9 0.5 0.7 0.0 0.0
Luxembourg 1.6 1.5 0.1 0.1 0.6 0.7 4 257.4 0.2
Monaco
Netherlands 2.1 2.1 0.8 0.8 54.5 51.7 128 220.0 0.2
Switzerland 1.0 1.0 0.3 0.3 4.5 5.8
Oceania 0.1 0.1 0.3 0.3 0.2 0.3
Australia and New Zealand 0.1 0.1 0.3 0.3 0.2 0.3
Australia 0.1 0.1 0.3 0.2 0.2 0.2
New Zealand 0.6 0.9 2.8 2.8 0.9 1.2 62 458.6 0.2
Norfolk Island 0.0 0.0 0.0 0.0 0.0 0.0
Melanesia 0.4 0.3 0.1 0.1 4.6 4.5
Fiji 0.8 0.7 0.6 0.6 9.7 8.7
New Caledonia 0.5 0.4 0.1 0.0 1.9 2.0
Papua New Guinea 0.1 0.1 0.0 0.0 3.7 3.7
Solomon Islands 0.2 0.2 0.0 0.0 2.5 2.9
Vanuatu 0.8 0.9 0.1 0.1 1.9 4.3
Micronesia 0.1 0.1 0.0 0.0 7.7 10.0
Guam 0.0 0.0 0.0 0.0 10.0 10.5
Kiribati 0.0 0.0 0.0 0.0 10.7 16.8
Marshall Islands 0.0 0.0 0.0 0.0 0.0 0.0
Micronesia (Federated States of) 0.6 0.6 0.2 0.2 8.3 8.7
Nauru 0.0 0.0 0.0 0.0 12.5 12.5
Northern Mariana Islands 0.0 0.0 0.0 0.0 0.0 0.0
Palau 0.0 0.0 0.0 0.0 0.0 0.0
Polynesia 0.3 0.3 0.2 0.2 8.0 8.8
American Samoa 0.0 0.0 0.0 0.0 7.6 8.0
Cook Islands 0.0 0.0 0.4 0.3 8.3 6.7
French Polynesia 0.3 0.2 0.4 0.4 7.7 6.8
Niue 0.0 0.0 0.0 0.0 2.5 3.0
Pitcairn Islands
Samoa 0.4 0.4 0.0 0.0 7.0 9.3
Tokelau 0.0 0.0 0.0 0.0 8.3 8.3
Tonga 0.4 0.4 0.4 0.4 10.0 10.6
Tuvalu 0.0 0.0 0.0 0.0 20.0 25.0
Wallis and Futuna Islands 0.0 0.0 1.2 1.2 10.5 10.8
245
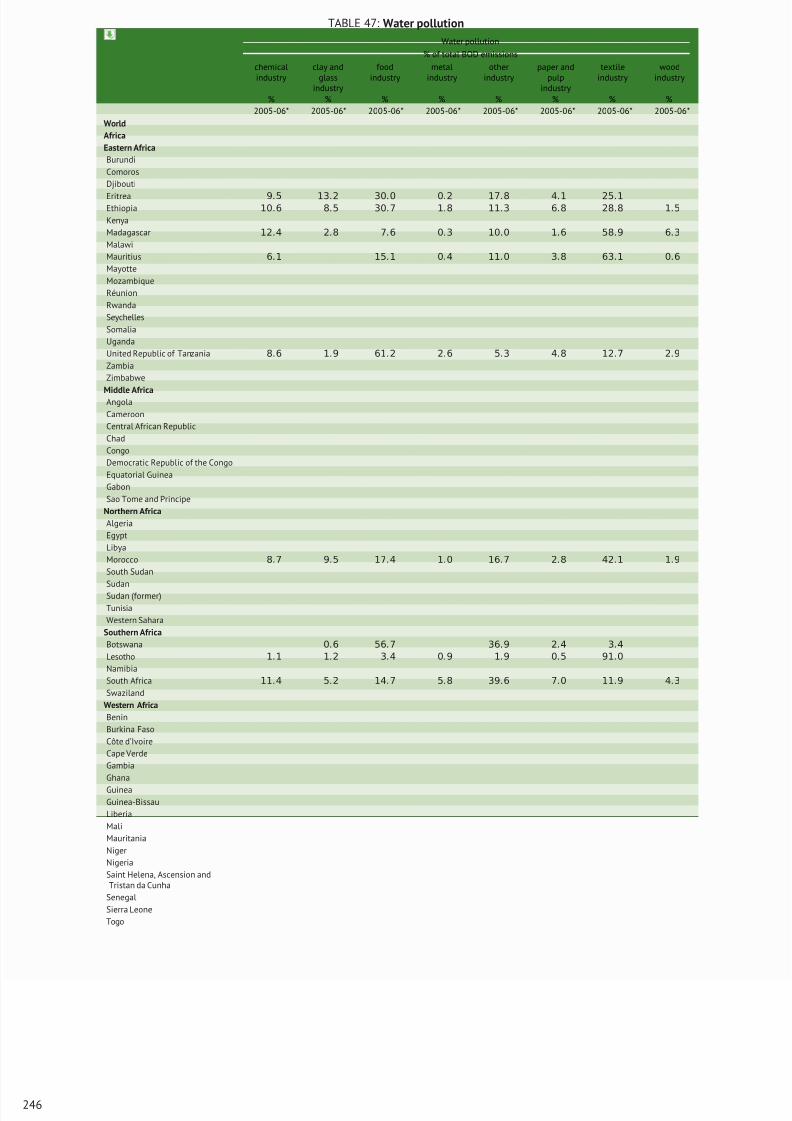
8/16/2019 Informe de la Fao 2013
http://slidepdf.com/reader/full/informe-de-la-fao-2013 264/307
TABLE 47: Water pollution
Water pollution
% of total BOD emissions
chemicalindustry
clay andglass
industry
foodindustry
metalindustry
otherindustry
paper andpulp
industry
textileindustry
woodindustry
% % % % % % % %2005-06* 2005-06* 2005-06* 2005-06* 2005-06* 2005-06* 2005-06* 2005-06*
World
Africa
Eastern Africa
Burundi
Comoros
Djibouti
Eritrea 9.5 13.2 30.0 0.2 17.8 4.1 25.1Ethiopia 10.6 8.5 30.7 1.8 11.3 6.8 28.8 1.5
Kenya
Madagascar 12.4 2.8 7.6 0.3 10.0 1.6 58.9 6.3
Malawi
Mauritius 6.1 15.1 0.4 11.0 3.8 63.1 0.6
Mayotte
Mozambique
Réunion
Rwanda
Seychelles
Somalia
Uganda
United Republic of Tanzania 8.6 1.9 61.2 2.6 5.3 4.8 12.7 2.9
Zambia
Zimbabwe
Middle AfricaAngola
Cameroon
Central African Republic
Chad
Congo
Democratic Republic of the Congo
Equatorial Guinea
Gabon
Sao Tome and Principe
Northern Africa
Algeria
Egypt
Libya
Morocco 8.7 9.5 17.4 1.0 16.7 2.8 42.1 1.9
South Sudan
Sudan
Sudan (former)
Tunisia
Western Sahara
Southern Africa
Botswana 0.6 56.7 36.9 2.4 3.4
Lesotho 1.1 1.2 3.4 0.9 1.9 0.5 91.0
Namibia
South Africa 11.4 5.2 14.7 5.8 39.6 7.0 11.9 4.3
Swaziland
Western Africa
Benin
Burkina Faso
Côte d’Ivoire
Cape Verde
Gambia
Ghana
GuineaGuinea-Bissau
Liberia
Mali
Mauritania
Niger
Nigeria
Saint Helena, Ascension andTristan da Cunha
Senegal
Sierra Leone
Togo
246
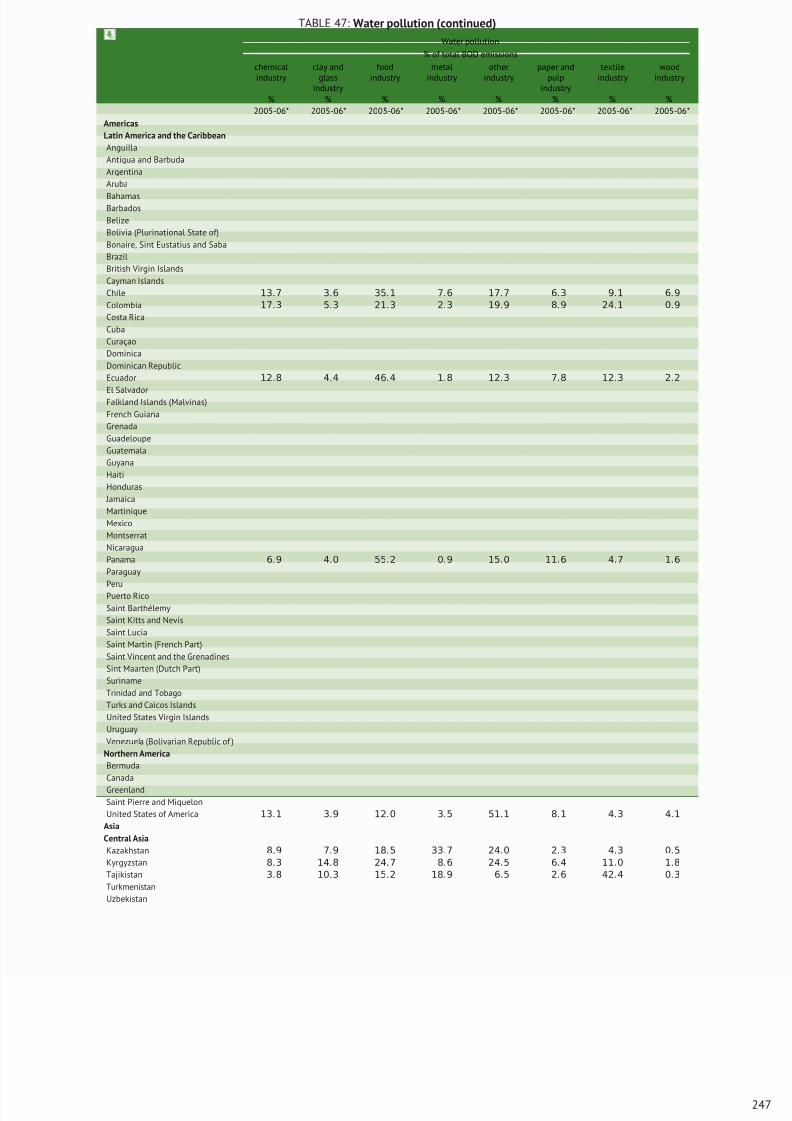
8/16/2019 Informe de la Fao 2013
http://slidepdf.com/reader/full/informe-de-la-fao-2013 265/307
TABLE 47: Water pollution (continued)
Water pollution
% of total BOD emissions
chemicalindustry
clay andglass
industry
foodindustry
metalindustry
otherindustry
paper andpulp
industry
textileindustry
woodindustry
% % % % % % % %2005-06* 2005-06* 2005-06* 2005-06* 2005-06* 2005-06* 2005-06* 2005-06*
Americas
Latin America and the Caribbean
Anguilla
Antigua and Barbuda
Argentina
Aruba
BahamasBarbados
Belize
Bolivia (Plurinational State of)
Bonaire, Sint Eustatius and Saba
Brazil
British Virgin Islands
Cayman Islands
Chile 13.7 3.6 35.1 7.6 17.7 6.3 9.1 6.9
Colombia 17.3 5.3 21.3 2.3 19.9 8.9 24.1 0.9
Costa Rica
Cuba
Curaçao
Dominica
Dominican Republic
Ecuador 12.8 4.4 46.4 1.8 12.3 7.8 12.3 2.2
El SalvadorFalkland Islands (Malvinas)
French Guiana
Grenada
Guadeloupe
Guatemala
Guyana
Haiti
Honduras
Jamaica
Martinique
Mexico
Montserrat
Nicaragua
Panama 6.9 4.0 55.2 0.9 15.0 11.6 4.7 1.6
Paraguay
Peru
Puerto Rico
Saint Barthélemy
Saint Kitts and Nevis
Saint Lucia
Saint Martin (French Part)
Saint Vincent and the Grenadines
Sint Maarten (Dutch Part)
Suriname
Trinidad and Tobago
Turks and Caicos Islands
United States Virgin Islands
Uruguay
Venezuela (Bolivarian Republic of )
Northern America
Bermuda
Canada
GreenlandSaint Pierre and Miquelon
United States of America 13.1 3.9 12.0 3.5 51.1 8.1 4.3 4.1
Asia
Central Asia
Kazakhstan 8.9 7.9 18.5 33.7 24.0 2.3 4.3 0.5
Kyrgyzstan 8.3 14.8 24.7 8.6 24.5 6.4 11.0 1.8
Tajikistan 3.8 10.3 15.2 18.9 6.5 2.6 42.4 0.3
Turkmenistan
Uzbekistan
247
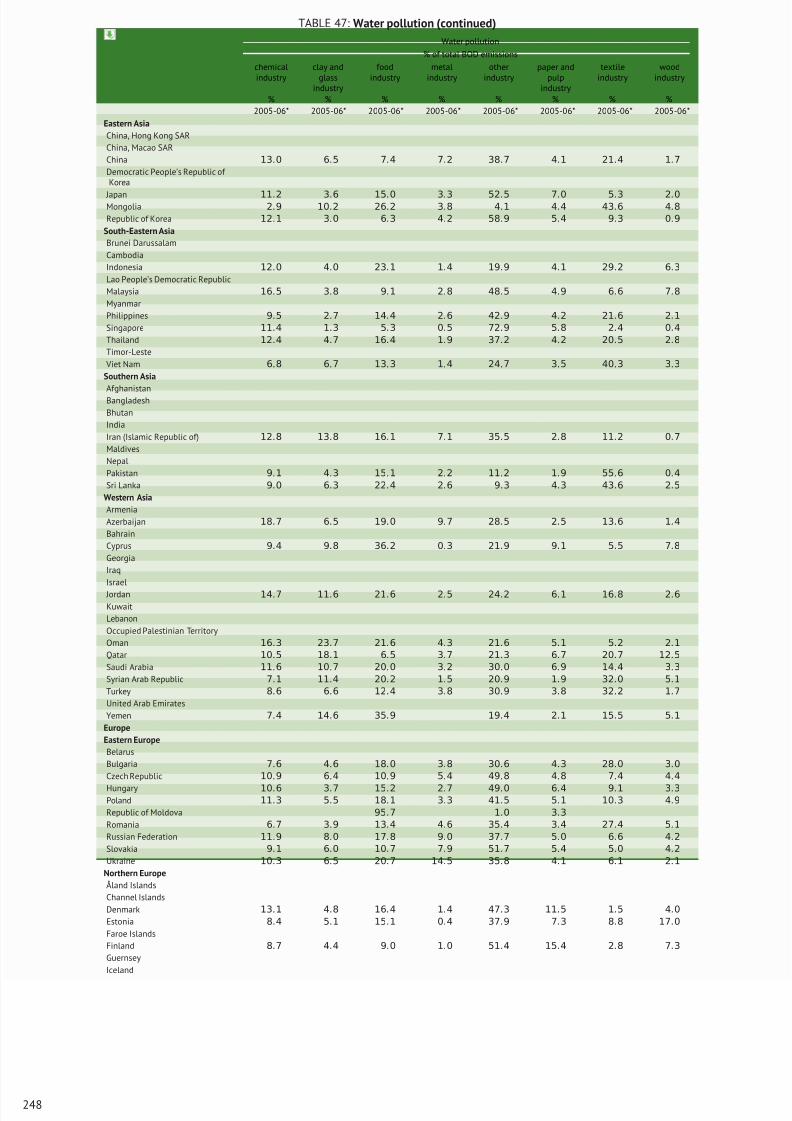
8/16/2019 Informe de la Fao 2013
http://slidepdf.com/reader/full/informe-de-la-fao-2013 266/307
TABLE 47: Water pollution (continued)
Water pollution
% of total BOD emissions
chemicalindustry
clay andglass
industry
foodindustry
metalindustry
otherindustry
paper andpulp
industry
textileindustry
woodindustry
% % % % % % % %2005-06* 2005-06* 2005-06* 2005-06* 2005-06* 2005-06* 2005-06* 2005-06*
Eastern Asia
China, Hong Kong SAR
China, Macao SAR
China 13.0 6.5 7.4 7.2 38.7 4.1 21.4 1.7
Democratic People’s Republic of Korea
Japan 11.2 3.6 15.0 3.3 52.5 7.0 5.3 2.0Mongolia 2.9 10.2 26.2 3.8 4.1 4.4 43.6 4.8
Republic of Korea 12.1 3.0 6.3 4.2 58.9 5.4 9.3 0.9
South-Eastern Asia
Brunei Darussalam
Cambodia
Indonesia 12.0 4.0 23.1 1.4 19.9 4.1 29.2 6.3
Lao People’s Democratic Republic
Malaysia 16.5 3.8 9.1 2.8 48.5 4.9 6.6 7.8
Myanmar
Philippines 9.5 2.7 14.4 2.6 42.9 4.2 21.6 2.1
Singapore 11.4 1.3 5.3 0.5 72.9 5.8 2.4 0.4
Thailand 12.4 4.7 16.4 1.9 37.2 4.2 20.5 2.8
Timor-Leste
Viet Nam 6.8 6.7 13.3 1.4 24.7 3.5 40.3 3.3
Southern Asia
AfghanistanBangladesh
Bhutan
India
Iran (Islamic Republic of) 12.8 13.8 16.1 7.1 35.5 2.8 11.2 0.7
Maldives
Nepal
Pakistan 9.1 4.3 15.1 2.2 11.2 1.9 55.6 0.4
Sri Lanka 9.0 6.3 22.4 2.6 9.3 4.3 43.6 2.5
Western Asia
Armenia
Azerbaijan 18.7 6.5 19.0 9.7 28.5 2.5 13.6 1.4
Bahrain
Cyprus 9.4 9.8 36.2 0.3 21.9 9.1 5.5 7.8
Georgia
Iraq
Israel
Jordan 14.7 11.6 21.6 2.5 24.2 6.1 16.8 2.6
Kuwait
Lebanon
Occupied Palestinian Territory
Oman 16.3 23.7 21.6 4.3 21.6 5.1 5.2 2.1
Qatar 10.5 18.1 6.5 3.7 21.3 6.7 20.7 12.5
Saudi Arabia 11.6 10.7 20.0 3.2 30.0 6.9 14.4 3.3
Syrian Arab Republic 7.1 11.4 20.2 1.5 20.9 1.9 32.0 5.1
Turkey 8.6 6.6 12.4 3.8 30.9 3.8 32.2 1.7
United Arab Emirates
Yemen 7.4 14.6 35.9 19.4 2.1 15.5 5.1
Europe
Eastern Europe
Belarus
Bulgaria 7.6 4.6 18.0 3.8 30.6 4.3 28.0 3.0
Czech Republic 10.9 6.4 10.9 5.4 49.8 4.8 7.4 4.4
Hungary 10.6 3.7 15.2 2.7 49.0 6.4 9.1 3.3
Poland 11.3 5.5 18.1 3.3 41.5 5.1 10.3 4.9
Republic of Moldova 95.7 1.0 3.3
Romania 6.7 3.9 13.4 4.6 35.4 3.4 27.4 5.1
Russian Federation 11.9 8.0 17.8 9.0 37.7 5.0 6.6 4.2
Slovakia 9.1 6.0 10.7 7.9 51.7 5.4 5.0 4.2
Ukraine 10.3 6.5 20.7 14.5 35.8 4.1 6.1 2.1
Northern Europe
Åland Islands
Channel Islands
Denmark 13.1 4.8 16.4 1.4 47.3 11.5 1.5 4.0
Estonia 8.4 5.1 15.1 0.4 37.9 7.3 8.8 17.0
Faroe Islands
Finland 8.7 4.4 9.0 1.0 51.4 15.4 2.8 7.3
Guernsey
Iceland
248
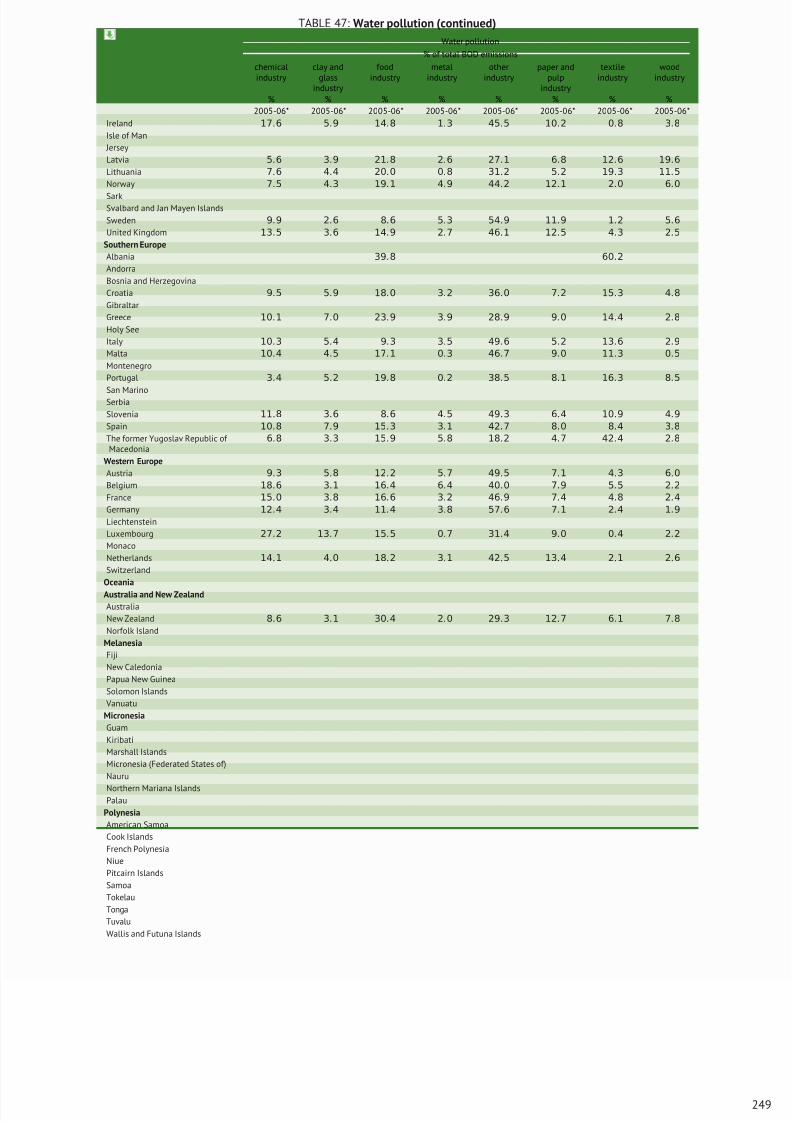
8/16/2019 Informe de la Fao 2013
http://slidepdf.com/reader/full/informe-de-la-fao-2013 267/307
TABLE 47: Water pollution (continued)
Water pollution
% of total BOD emissions
chemicalindustry
clay andglass
industry
foodindustry
metalindustry
otherindustry
paper andpulp
industry
textileindustry
woodindustry
% % % % % % % %2005-06* 2005-06* 2005-06* 2005-06* 2005-06* 2005-06* 2005-06* 2005-06*
Ireland 17.6 5.9 14.8 1.3 45.5 10.2 0.8 3.8
Isle of Man
Jersey
Latvia 5.6 3.9 21.8 2.6 27.1 6.8 12.6 19.6
Lithuania 7.6 4.4 20.0 0.8 31.2 5.2 19.3 11.5
Norway 7.5 4.3 19.1 4.9 44.2 12.1 2.0 6.0
SarkSvalbard and Jan Mayen Islands
Sweden 9.9 2.6 8.6 5.3 54.9 11.9 1.2 5.6
United Kingdom 13.5 3.6 14.9 2.7 46.1 12.5 4.3 2.5
Southern Europe
Albania 39.8 60.2
Andorra
Bosnia and Herzegovina
Croatia 9.5 5.9 18.0 3.2 36.0 7.2 15.3 4.8
Gibraltar
Greece 10.1 7.0 23.9 3.9 28.9 9.0 14.4 2.8
Holy See
Italy 10.3 5.4 9.3 3.5 49.6 5.2 13.6 2.9
Malta 10.4 4.5 17.1 0.3 46.7 9.0 11.3 0.5
Montenegro
Portugal 3.4 5.2 19.8 0.2 38.5 8.1 16.3 8.5
San MarinoSerbia
Slovenia 11.8 3.6 8.6 4.5 49.3 6.4 10.9 4.9
Spain 10.8 7.9 15.3 3.1 42.7 8.0 8.4 3.8
The former Yugoslav Republic of Macedonia
6.8 3.3 15.9 5.8 18.2 4.7 42.4 2.8
Western Europe
Austria 9.3 5.8 12.2 5.7 49.5 7.1 4.3 6.0
Belgium 18.6 3.1 16.4 6.4 40.0 7.9 5.5 2.2
France 15.0 3.8 16.6 3.2 46.9 7.4 4.8 2.4
Germany 12.4 3.4 11.4 3.8 57.6 7.1 2.4 1.9
Liechtenstein
Luxembourg 27.2 13.7 15.5 0.7 31.4 9.0 0.4 2.2
Monaco
Netherlands 14.1 4.0 18.2 3.1 42.5 13.4 2.1 2.6
Switzerland
Oceania
Australia and New Zealand
Australia
New Zealand 8.6 3.1 30.4 2.0 29.3 12.7 6.1 7.8
Norfolk Island
Melanesia
Fiji
New Caledonia
Papua New Guinea
Solomon Islands
Vanuatu
Micronesia
Guam
Kiribati
Marshall Islands
Micronesia (Federated States of)
Nauru
Northern Mariana IslandsPalau
Polynesia
American Samoa
Cook Islands
French Polynesia
Niue
Pitcairn Islands
Samoa
Tokelau
Tonga
Tuvalu
Wallis and Futuna Islands
249
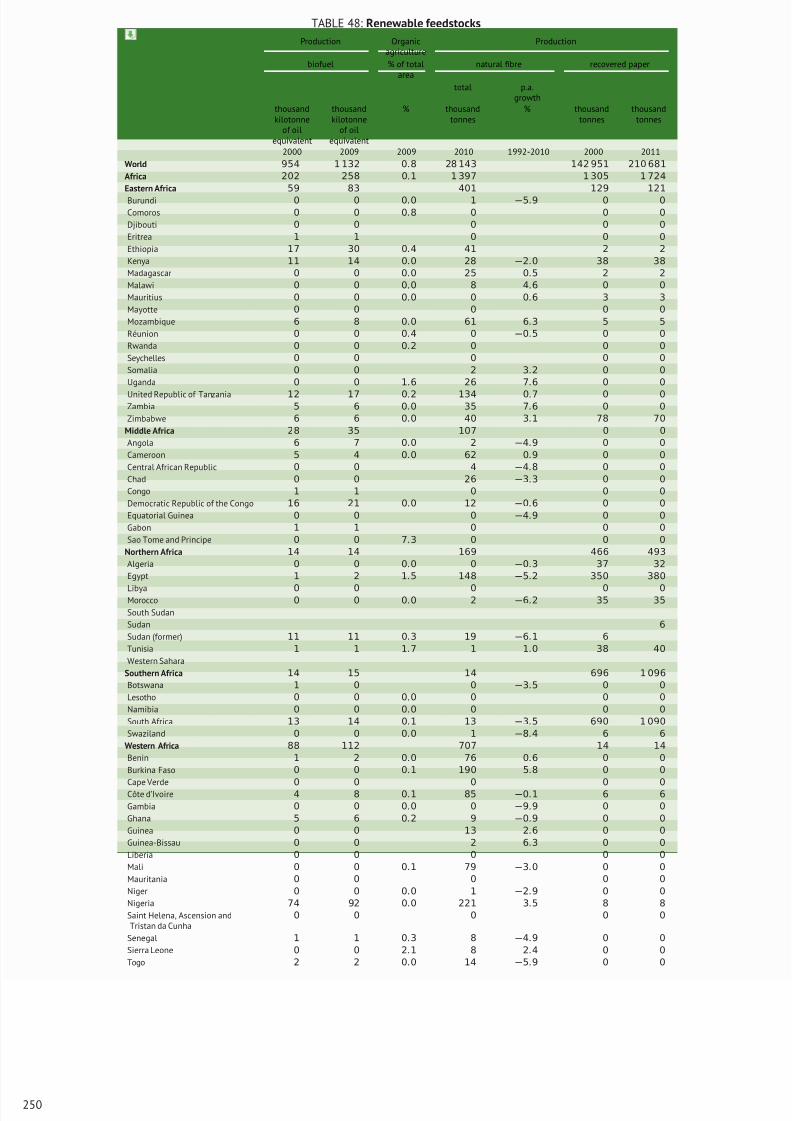
8/16/2019 Informe de la Fao 2013
http://slidepdf.com/reader/full/informe-de-la-fao-2013 268/307
TABLE 48: Renewable feedstocks
Production Organicagriculture
Production
biofuel % of totalarea
natural fibre recovered paper
total p.a.growth
thousandkilotonne
of oilequivalent
thousandkilotonne
of oilequivalent
% thousandtonnes
% thousandtonnes
thousandtonnes
2000 2009 2009 2010 1992-2010 2000 2011
World 954 1 132 0.8 28 143 142 951 210 681
Africa 202 258 0.1 1 397 1 305 1 724
Eastern Africa 59 83 401 129 121
Burundi 0 0 0.0 1 −5.9 0 0
Comoros 0 0 0.8 0 0 0
Djibouti 0 0 0 0 0
Eritrea 1 1 0 0 0
Ethiopia 17 30 0.4 41 2 2
Kenya 11 14 0.0 28 −2.0 38 38
Madagascar 0 0 0.0 25 0.5 2 2
Malawi 0 0 0.0 8 4.6 0 0
Mauritius 0 0 0.0 0 0.6 3 3
Mayotte 0 0 0 0 0
Mozambique 6 8 0.0 61 6.3 5 5
Réunion 0 0 0.4 0 −0.5 0 0
Rwanda 0 0 0.2 0 0 0
Seychelles 0 0 0 0 0
Somalia 0 0 2 3.2 0 0
Uganda 0 0 1.6 26 7.6 0 0
United Republic of Tanzania 12 17 0.2 134 0.7 0 0Zambia 5 6 0.0 35 7.6 0 0
Zimbabwe 6 6 0.0 40 3.1 78 70
Middle Africa 28 35 107 0 0
Angola 6 7 0.0 2 −4.9 0 0
Cameroon 5 4 0.0 62 0.9 0 0
Central African Republic 0 0 4 −4.8 0 0
Chad 0 0 26 −3.3 0 0
Congo 1 1 0 0 0
Democratic Republic of the Congo 16 21 0.0 12 −0.6 0 0
Equatorial Guinea 0 0 0 −4.9 0 0
Gabon 1 1 0 0 0
Sao Tome and Principe 0 0 7.3 0 0 0
Northern Africa 14 14 169 466 493
Algeria 0 0 0.0 0 −0.3 37 32
Egypt 1 2 1.5 148 −5.2 350 380
Libya 0 0 0 0 0Morocco 0 0 0.0 2 −6.2 35 35
South Sudan
Sudan 6
Sudan (former) 11 11 0.3 19 −6.1 6
Tunisia 1 1 1.7 1 1.0 38 40
Western Sahara
Southern Africa 14 15 14 696 1 096
Botswana 1 0 0 −3.5 0 0
Lesotho 0 0 0.0 0 0 0
Namibia 0 0 0.0 0 0 0
South Africa 13 14 0.1 13 −3.5 690 1 090
Swaziland 0 0 0.0 1 −8.4 6 6
Western Africa 88 112 707 14 14
Benin 1 2 0.0 76 0.6 0 0
Burkina Faso 0 0 0.1 190 5.8 0 0
Cape Verde 0 0 0 0 0
Côte d’Ivoire 4 8 0.1 85 −0.1 6 6
Gambia 0 0 0.0 0 −9.9 0 0
Ghana 5 6 0.2 9 −0.9 0 0
Guinea 0 0 13 2.6 0 0
Guinea-Bissau 0 0 2 6.3 0 0
Liberia 0 0 0 0 0
Mali 0 0 0.1 79 −3.0 0 0
Mauritania 0 0 0 0 0
Niger 0 0 0.0 1 −2.9 0 0
Nigeria 74 92 0.0 221 3.5 8 8
Saint Helena, Ascension andTristan da Cunha
0 0 0 0 0
Senegal 1 1 0.3 8 −4.9 0 0
Sierra Leone 0 0 2.1 8 2.4 0 0
Togo 2 2 0.0 14 −5.9 0 0
250
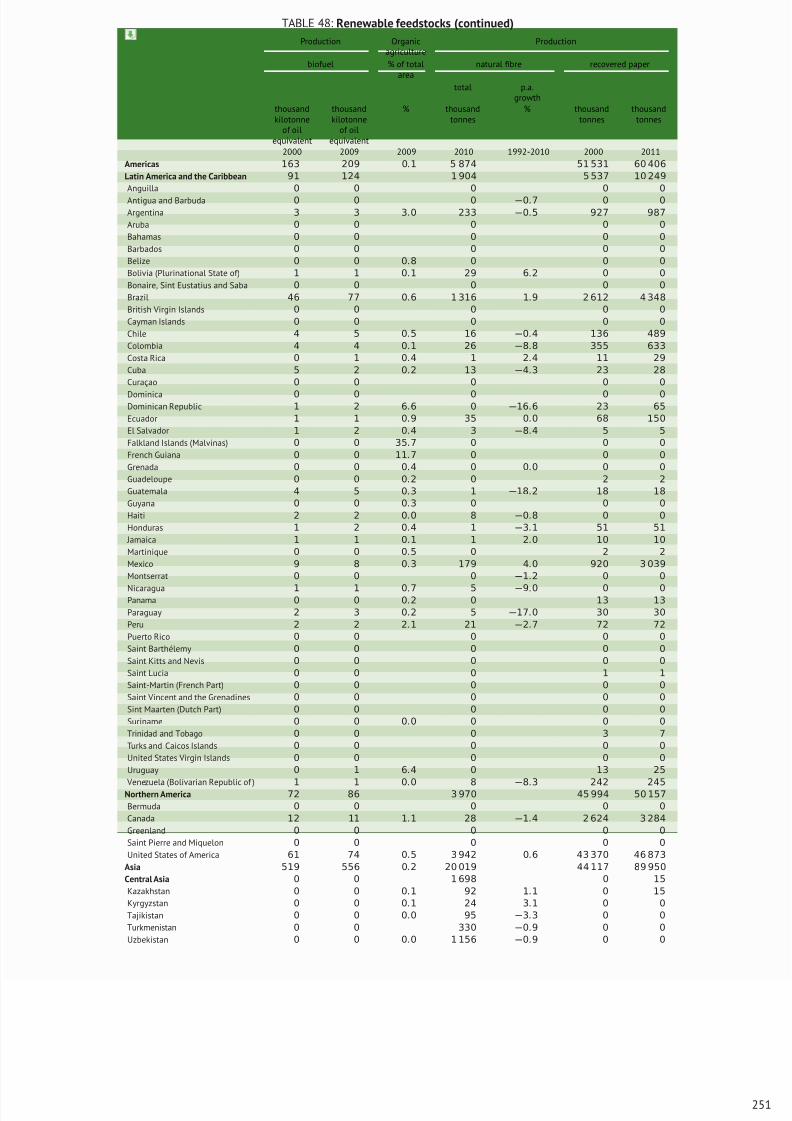
8/16/2019 Informe de la Fao 2013
http://slidepdf.com/reader/full/informe-de-la-fao-2013 269/307
TABLE 48: Renewable feedstocks (continued)
Production Organicagriculture
Production
biofuel % of totalarea
natural fibre recovered paper
total p.a.growth
thousandkilotonne
of oilequivalent
thousandkilotonne
of oilequivalent
% thousandtonnes
% thousandtonnes
thousandtonnes
2000 2009 2009 2010 1992-2010 2000 2011
Americas 163 209 0.1 5 874 51 531 60 406
Latin America and the Caribbean 91 124 1 904 5 537 10 249
Anguilla 0 0 0 0 0
Antigua and Barbuda 0 0 0 −0.7 0 0
Argentina 3 3 3.0 233 −0.5 927 987
Aruba 0 0 0 0 0
Bahamas 0 0 0 0 0
Barbados 0 0 0 0 0
Belize 0 0 0.8 0 0 0
Bolivia (Plurinational State of) 1 1 0.1 29 6.2 0 0
Bonaire, Sint Eustatius and Saba 0 0 0 0 0
Brazil 46 77 0.6 1 316 1.9 2 612 4 348
British Virgin Islands 0 0 0 0 0
Cayman Islands 0 0 0 0 0
Chile 4 5 0.5 16 −0.4 136 489
Colombia 4 4 0.1 26 −8.8 355 633
Costa Rica 0 1 0.4 1 2.4 11 29
Cuba 5 2 0.2 13 −4.3 23 28
Curaçao 0 0 0 0 0
Dominica 0 0 0 0 0Dominican Republic 1 2 6.6 0 −16.6 23 65
Ecuador 1 1 0.9 35 0.0 68 150
El Salvador 1 2 0.4 3 −8.4 5 5
Falkland Islands (Malvinas) 0 0 35.7 0 0 0
French Guiana 0 0 11.7 0 0 0
Grenada 0 0 0.4 0 0.0 0 0
Guadeloupe 0 0 0.2 0 2 2
Guatemala 4 5 0.3 1 −18.2 18 18
Guyana 0 0 0.3 0 0 0
Haiti 2 2 0.0 8 −0.8 0 0
Honduras 1 2 0.4 1 −3.1 51 51
Jamaica 1 1 0.1 1 2.0 10 10
Martinique 0 0 0.5 0 2 2
Mexico 9 8 0.3 179 4.0 920 3 039
Montserrat 0 0 0 −1.2 0 0
Nicaragua 1 1 0.7 5 −9.0 0 0Panama 0 0 0.2 0 13 13
Paraguay 2 3 0.2 5 −17.0 30 30
Peru 2 2 2.1 21 −2.7 72 72
Puerto Rico 0 0 0 0 0
Saint Barthélemy 0 0 0 0 0
Saint Kitts and Nevis 0 0 0 0 0
Saint Lucia 0 0 0 1 1
Saint-Martin (French Part) 0 0 0 0 0
Saint Vincent and the Grenadines 0 0 0 0 0
Sint Maarten (Dutch Part) 0 0 0 0 0
Suriname 0 0 0.0 0 0 0
Trinidad and Tobago 0 0 0 3 7
Turks and Caicos Islands 0 0 0 0 0
United States Virgin Islands 0 0 0 0 0
Uruguay 0 1 6.4 0 13 25
Venezuela (Bolivarian Republic of ) 1 1 0
.0 8 −8
.3 242 245
Northern America 72 86 3 970 45 994 50 157
Bermuda 0 0 0 0 0
Canada 12 11 1.1 28 −1.4 2 624 3 284
Greenland 0 0 0 0 0
Saint Pierre and Miquelon 0 0 0 0 0
United States of America 61 74 0.5 3 942 0.6 43 370 46 873
Asia 519 556 0.2 20 019 44 117 89 950
Central Asia 0 0 1 698 0 15
Kazakhstan 0 0 0.1 92 1.1 0 15
Kyrgyzstan 0 0 0.1 24 3.1 0 0
Tajikistan 0 0 0.0 95 −3.3 0 0
Turkmenistan 0 0 330 −0.9 0 0
Uzbekistan 0 0 0.0 1 156 −0.9 0 0
251
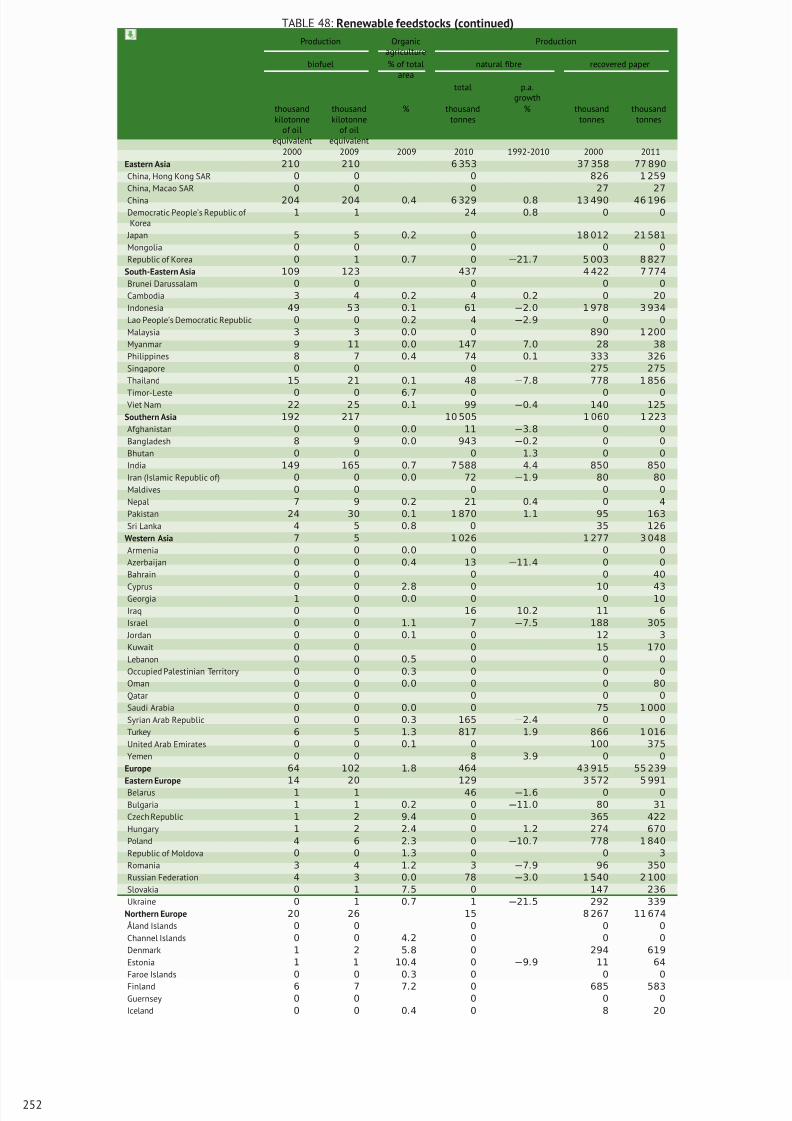
8/16/2019 Informe de la Fao 2013
http://slidepdf.com/reader/full/informe-de-la-fao-2013 270/307
TABLE 48: Renewable feedstocks (continued)
Production Organicagriculture
Production
biofuel % of totalarea
natural fibre recovered paper
total p.a.growth
thousandkilotonne
of oilequivalent
thousandkilotonne
of oilequivalent
% thousandtonnes
% thousandtonnes
thousandtonnes
2000 2009 2009 2010 1992-2010 2000 2011
Eastern Asia 210 210 6 353 37 358 77 890
China, Hong Kong SAR 0 0 0 826 1 259
China, Macao SAR 0 0 0 27 27
China 204 204 0.4 6 329 0.8 13 490 46 196
Democratic People’s Republic of Korea
1 1 24 0.8 0 0
Japan 5 5 0.2 0 18 012 21 581
Mongolia 0 0 0 0 0
Republic of Korea 0 1 0.7 0 −21.7 5 003 8 827
South-Eastern Asia 109 123 437 4 422 7 774
Brunei Darussalam 0 0 0 0 0
Cambodia 3 4 0.2 4 0.2 0 20
Indonesia 49 5 3 0.1 61 −2.0 1 978 3 934
Lao People’s Democratic Republic 0 0 0.2 4 −2.9 0 0
Malaysia 3 3 0.0 0 890 1 200
Myanmar 9 11 0.0 147 7.0 28 38
Philippines 8 7 0.4 74 0.1 333 326
Singapore 0 0 0 275 275
Thailand 15 21 0.1 48 −7.8 778 1 856
Timor-Leste 0 0 6.7 0 0 0 Viet Nam 22 25 0.1 99 −0.4 140 125
Southern Asia 192 217 10 505 1 060 1 223
Afghanistan 0 0 0.0 11 −3.8 0 0
Bangladesh 8 9 0.0 943 −0.2 0 0
Bhutan 0 0 0 1.3 0 0
India 149 165 0.7 7 588 4.4 850 850
Iran (Islamic Republic of) 0 0 0.0 72 −1.9 80 80
Maldives 0 0 0 0 0
Nepal 7 9 0.2 21 0.4 0 4
Pakistan 24 30 0.1 1 870 1.1 95 163
Sri Lanka 4 5 0.8 0 35 126
Western Asia 7 5 1 026 1 277 3 048
Armenia 0 0 0.0 0 0 0
Azerbaijan 0 0 0.4 13 −11.4 0 0
Bahrain 0 0 0 0 40
Cyprus 0 0 2.8 0 10 43Georgia 1 0 0.0 0 0 10
Iraq 0 0 16 10.2 11 6
Israel 0 0 1.1 7 −7.5 188 305
Jordan 0 0 0.1 0 12 3
Kuwait 0 0 0 15 170
Lebanon 0 0 0.5 0 0 0
Occupied Palestinian Territory 0 0 0.3 0 0 0
Oman 0 0 0.0 0 0 80
Qatar 0 0 0 0 0
Saudi Arabia 0 0 0.0 0 75 1 000
Syrian Arab Republic 0 0 0.3 165 −2.4 0 0
Turkey 6 5 1.3 817 1.9 866 1 016
United Arab Emirates 0 0 0.1 0 100 375
Yemen 0 0 8 3.9 0 0
Europe 64 102 1.8 464 43 915 55 239
Eastern Europe 14 20 129 3 572 5 991
Belarus 1 1 46 −1.6 0 0
Bulgaria 1 1 0.2 0 −11.0 80 31
Czech Republic 1 2 9.4 0 365 422
Hungary 1 2 2.4 0 1.2 274 670
Poland 4 6 2.3 0 −10.7 778 1 840
Republic of Moldova 0 0 1.3 0 0 3
Romania 3 4 1.2 3 −7.9 96 350
Russian Federation 4 3 0.0 78 −3.0 1 540 2 100
Slovakia 0 1 7.5 0 147 236
Ukraine 0 1 0.7 1 −21.5 292 339
Northern Europe 20 26 15 8 267 11 674
Åland Islands 0 0 0 0 0
Channel Islands 0 0 4.2 0 0 0
Denmark 1 2 5.8 0 294 619
Estonia 1 1 10.4 0 −9.9 11 64
Faroe Islands 0 0 0.3 0 0 0
Finland 6 7 7.2 0 685 583
Guernsey 0 0 0 0 0
Iceland 0 0 0.4 0 8 20
252
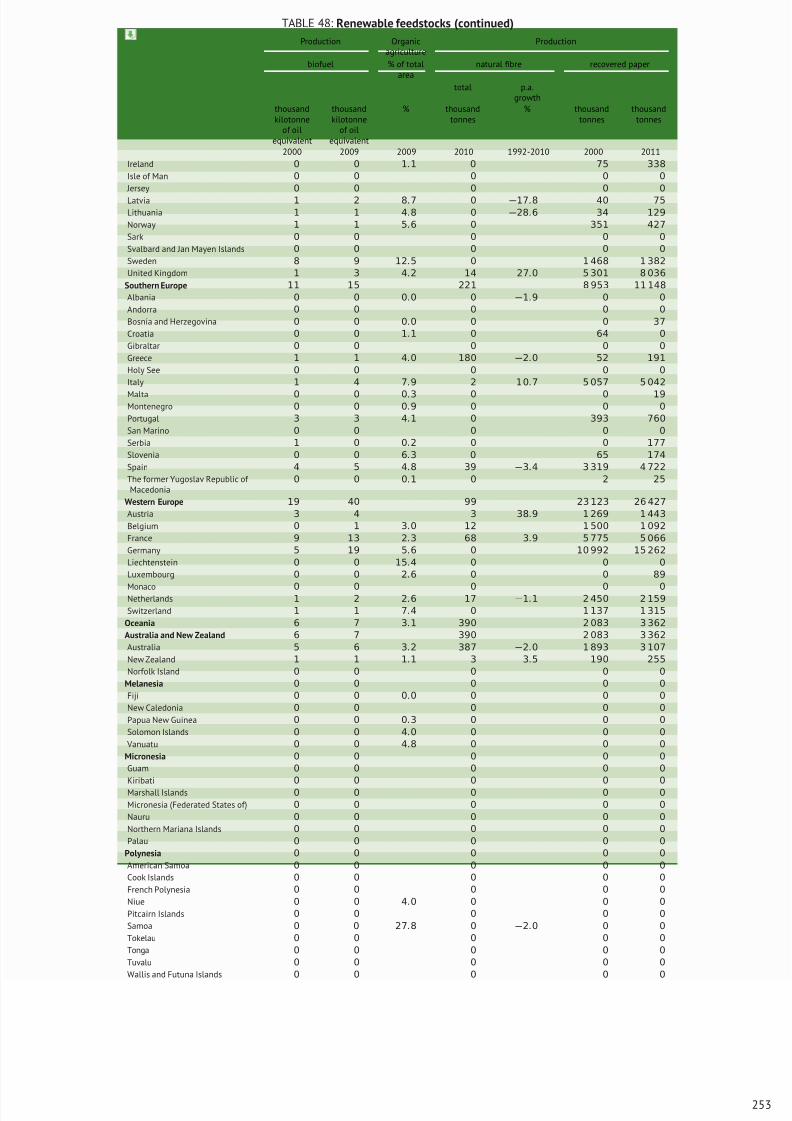
8/16/2019 Informe de la Fao 2013
http://slidepdf.com/reader/full/informe-de-la-fao-2013 271/307
TABLE 48: Renewable feedstocks (continued)
Production Organicagriculture
Production
biofuel % of totalarea
natural fibre recovered paper
total p.a.growth
thousandkilotonne
of oilequivalent
thousandkilotonne
of oilequivalent
% thousandtonnes
% thousandtonnes
thousandtonnes
2000 2009 2009 2010 1992-2010 2000 2011
Ireland 0 0 1.1 0 75 338
Isle of Man 0 0 0 0 0
Jersey 0 0 0 0 0
Latvia 1 2 8.7 0 −17.8 40 75
Lithuania 1 1 4.8 0 −28.6 34 129
Norway 1 1 5.6 0 351 427
Sark 0 0 0 0 0
Svalbard and Jan Mayen Islands 0 0 0 0 0
Sweden 8 9 12.5 0 1 468 1 382
United Kingdom 1 3 4.2 14 27.0 5 301 8 036
Southern Europe 11 15 221 8 953 11 148
Albania 0 0 0.0 0 −1.9 0 0
Andorra 0 0 0 0 0
Bosnia and Herzegovina 0 0 0.0 0 0 37
Croatia 0 0 1.1 0 64 0
Gibraltar 0 0 0 0 0
Greece 1 1 4.0 180 −2.0 52 191
Holy See 0 0 0 0 0
Italy 1 4 7.9 2 1 0.7 5 057 5 042
Malta 0 0 0.3 0 0 19Montenegro 0 0 0.9 0 0 0
Portugal 3 3 4.1 0 393 760
San Marino 0 0 0 0 0
Serbia 1 0 0.2 0 0 177
Slovenia 0 0 6.3 0 65 174
Spain 4 5 4.8 39 −3.4 3 319 4 722
The former Yugoslav Republic of Macedonia
0 0 0.1 0 2 25
Western Europe 19 40 99 23 123 26 427
Austria 3 4 3 38.9 1 269 1 443
Belgium 0 1 3.0 12 1 500 1 092
France 9 13 2.3 68 3.9 5 775 5 066
Germany 5 19 5.6 0 10 992 15 262
Liechtenstein 0 0 15.4 0 0 0
Luxembourg 0 0 2.6 0 0 89
Monaco 0 0 0 0 0Netherlands 1 2 2.6 17 −1.1 2 450 2 159
Switzerland 1 1 7.4 0 1 137 1 315
Oceania 6 7 3.1 390 2 083 3 362
Australia and New Zealand 6 7 390 2 083 3 362
Australia 5 6 3.2 387 −2.0 1 893 3 107
New Zealand 1 1 1.1 3 3.5 190 255
Norfolk Island 0 0 0 0 0
Melanesia 0 0 0 0 0
Fiji 0 0 0.0 0 0 0
New Caledonia 0 0 0 0 0
Papua New Guinea 0 0 0.3 0 0 0
Solomon Islands 0 0 4.0 0 0 0
Vanuatu 0 0 4.8 0 0 0
Micronesia 0 0 0 0 0
Guam 0 0 0 0 0
Kiribati 0 0 0 0 0
Marshall Islands 0 0 0 0 0
Micronesia (Federated States of) 0 0 0 0 0
Nauru 0 0 0 0 0
Northern Mariana Islands 0 0 0 0 0
Palau 0 0 0 0 0
Polynesia 0 0 0 0 0
American Samoa 0 0 0 0 0
Cook Islands 0 0 0 0 0
French Polynesia 0 0 0 0 0
Niue 0 0 4.0 0 0 0
Pitcairn Islands 0 0 0 0 0
Samoa 0 0 27.8 0 −2.0 0 0
Tokelau 0 0 0 0 0
Tonga 0 0 0 0 0
Tuvalu 0 0 0 0 0
Wallis and Futuna Islands 0 0 0 0 0
253
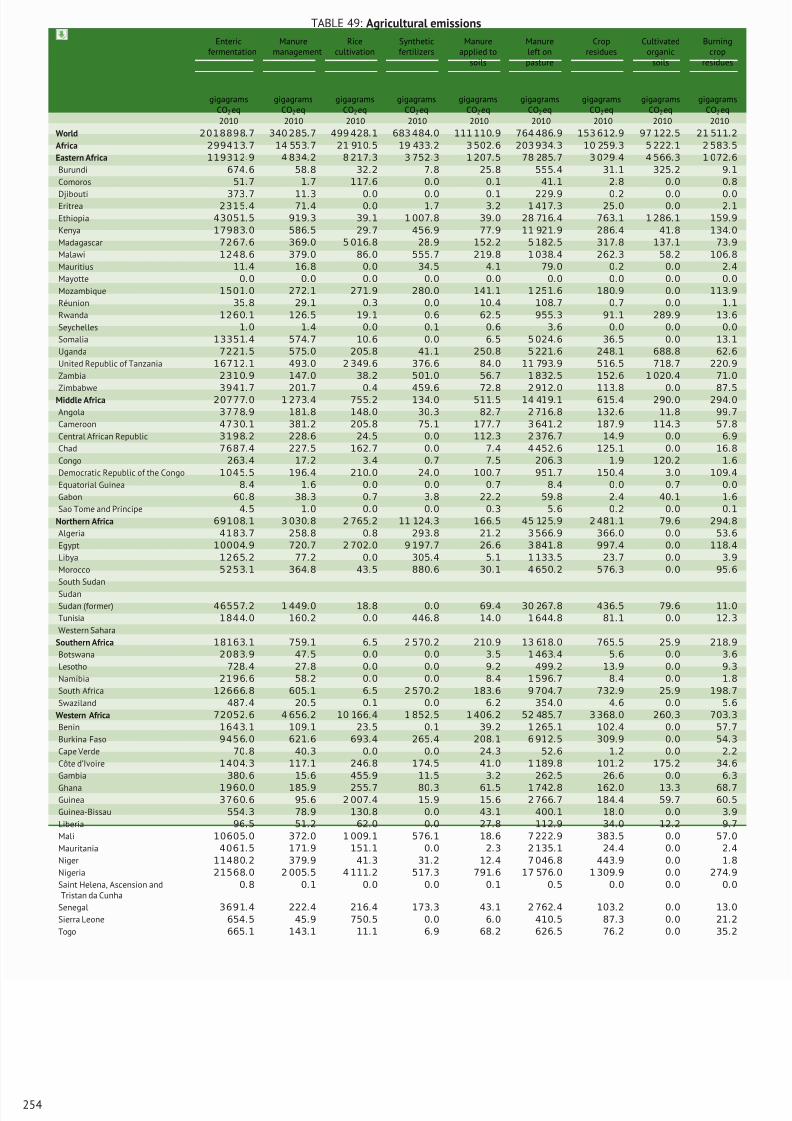
8/16/2019 Informe de la Fao 2013
http://slidepdf.com/reader/full/informe-de-la-fao-2013 272/307
TABLE 49: Agricultural emissions
Entericfermentation
Manuremanagement
Ricecultivation
Syntheticfertilizers
Manureapplied to
soils
Manureleft onpasture
Cropresidues
Cultivatedorganic
soils
Burningcrop
residues
gigagramsCO2eq
gigagramsCO2eq
gigagramsCO2eq
gigagramsCO2eq
gigagramsCO2eq
gigagramsCO2eq
gigagramsCO2eq
gigagramsCO2eq
gigagramsCO2eq
2010 2010 2010 2010 2010 2010 2010 2010 2010
World 2018898.7 340 285.7 499 428.1 683 484.0 111 110.9 764 486.9 153 612.9 97 122.5 21 511.2
Africa 299413.7 14 553.7 21 910.5 19 433.2 3 502.6 203 934.3 10 259.3 5 222.1 2 583.5
Eastern Africa 119312.9 4 834.2 8 217.3 3 752.3 1 207.5 78 285.7 3 029.4 4 566.3 1 072.6
Burundi 674.6 58.8 32.2 7.8 25.8 555.4 31.1 325.2 9.1
Comoros 51.7 1.7 117.6 0.0 0.1 41.1 2.8 0.0 0.8
Djibouti 373.7 11.3 0.0 0.0 0.1 229.9 0.2 0.0 0.0Eritrea 2315.4 71.4 0.0 1.7 3.2 1 417.3 25.0 0.0 2.1
Ethiopia 43051.5 919.3 39.1 1 007.8 39.0 28 716.4 763.1 1 286.1 159.9
Kenya 17983.0 586.5 29.7 456.9 77.9 11 921.9 286.4 41.8 134.0
Madagascar 7267.6 369.0 5 016.8 28.9 152.2 5 182.5 317.8 137.1 73.9
Malawi 1248.6 379.0 86.0 555.7 219.8 1 038.4 262.3 58.2 106.8
Mauritius 11.4 16.8 0.0 34.5 4.1 79.0 0.2 0.0 2.4
Mayotte 0.0 0.0 0.0 0.0 0.0 0.0 0.0 0.0 0.0
Mozambique 1501.0 272.1 271.9 280.0 141.1 1 251.6 180.9 0.0 113.9
Réunion 35.8 29.1 0.3 0.0 10.4 108.7 0.7 0.0 1.1
Rwanda 1260.1 126.5 19.1 0.6 62.5 955.3 91.1 289.9 13.6
Seychelles 1.0 1.4 0.0 0.1 0.6 3.6 0.0 0.0 0.0
Somalia 13351.4 574.7 10.6 0.0 6.5 5 024.6 36.5 0.0 13.1
Uganda 7221.5 575.0 205.8 41.1 250.8 5 221.6 248.1 688.8 62.6
United Republic of Tanzania 16712.1 493.0 2 349.6 376.6 84.0 11 793.9 516.5 718.7 220.9
Zambia 2310.9 147.0 38.2 501.0 56.7 1 832.5 152.6 1 020.4 71.0
Zimbabwe 3941.
7 201.
7 0.
4 459.
6 72.
8 2 912.
0 113.
8 0.
0 87.
5
Middle Africa 20777.0 1 273.4 755.2 134.0 511.5 14 419.1 615.4 290.0 294.0
Angola 3778.9 181.8 148.0 30.3 82.7 2 716.8 132.6 11.8 99.7
Cameroon 4730.1 381.2 205.8 75.1 177.7 3 641.2 187.9 114.3 57.8
Central African Republic 3198.2 228.6 24.5 0.0 112.3 2 376.7 14.9 0.0 6.9
Chad 7687.4 227.5 162.7 0.0 7.4 4 452.6 125.1 0.0 16.8
Congo 263.4 17.2 3.4 0.7 7.5 206.3 1.9 120.2 1.6
Democratic Republic of the Congo 1045.5 196.4 210.0 24.0 100.7 951.7 150.4 3.0 109.4
Equatorial Guinea 8.4 1.6 0.0 0.0 0.7 8.4 0.0 0.7 0.0
Gabon 60.8 38.3 0.7 3.8 22.2 59.8 2.4 40.1 1.6
Sao Tome and Principe 4.5 1.0 0.0 0.0 0.3 5.6 0.2 0.0 0.1
Northern Africa 69108.1 3 030.8 2 765.2 11 124.3 166.5 45 125.9 2 481.1 79.6 294.8
Algeria 4183.7 258.8 0.8 293.8 21.2 3 566.9 366.0 0.0 53.6
Egypt 10004.9 720.7 2 702.0 9 197.7 26.6 3 841.8 997.4 0.0 118.4
Libya 1265.2 77.2 0.0 305.4 5.1 1 133.5 23.7 0.0 3.9
Morocco 5253.1 364.8 43.5 880.6 30.1 4 650.2 576.3 0.0 95.6
South Sudan
Sudan
Sudan (former) 46557.2 1 449.0 18.8 0.0 69.4 30 267.8 436.5 79.6 11.0
Tunisia 1844.0 160.2 0.0 446.8 14.0 1 644.8 81.1 0.0 12.3
Western Sahara
Southern Africa 18163.1 759.1 6.5 2 570.2 210.9 13 618.0 765.5 25.9 218.9
Botswana 2083.9 47.5 0.0 0.0 3.5 1 463.4 5.6 0.0 3.6
Lesotho 728.4 27.8 0.0 0.0 9.2 499.2 13.9 0.0 9.3
Namibia 2196.6 58.2 0.0 0.0 8.4 1 596.7 8.4 0.0 1.8
South Africa 12666.8 605.1 6.5 2 570.2 183.6 9 704.7 732.9 25.9 198.7
Swaziland 487.4 20.5 0.1 0.0 6.2 354.0 4.6 0.0 5.6
Western Africa 72052.6 4 656.2 10 166.4 1 852.5 1 406.2 52 485.7 3 368.0 260.3 703.3
Benin 1643.1 109.1 23.5 0.1 39.2 1 265.1 102.4 0.0 57.7
Burkina Faso 9456.0 621.6 693.4 265.4 208.1 6 912.5 309.9 0.0 54.3
Cape Verde 70.8 40.3 0.0 0.0 24.3 52.6 1.2 0.0 2.2
Côte d’Ivoire 1404.3 117.1 246.8 174.5 41.0 1 189.8 101.2 175.2 34.6
Gambia 380.6 15.6 455.9 11.5 3.2 262.5 26.6 0.0 6.3
Ghana 1960.0 185.9 255.7 80.3 61.5 1 742.8 162.0 13.3 68.7
Guinea 3760.6 95.6 2 007.4 15.9 15.6 2 766.7 184.4 59.7 60.5
Guinea-Bissau 554.3 78.9 130.8 0.0 43.1 400.1 18.0 0.0 3.9
Liberia 96.5 51.2 62.0 0.0 27.8 112.9 34.0 12.2 9.7
Mali 10605.0 372.0 1 009.1 576.1 18.6 7 222.9 383.5 0.0 57.0
Mauritania 4061.5 171.9 151.1 0.0 2.3 2 135.1 24.4 0.0 2.4
Niger 11480.2 379.9 41.3 31.2 12.4 7 046.8 443.9 0.0 1.8
Nigeria 21568.0 2 005.5 4 111.2 517.3 791.6 17 576.0 1 309.9 0.0 274.9
Saint Helena, Ascension andTristan da Cunha
0.8 0.1 0.0 0.0 0.1 0.5 0.0 0.0 0.0
Senegal 3691.4 222.4 216.4 173.3 43.1 2 762.4 103.2 0.0 13.0
Sierra Leone 654.5 45.9 750.5 0.0 6.0 410.5 87.3 0.0 21.2
Togo 665.1 143.1 11.1 6.9 68.2 626.5 76.2 0.0 35.2
254
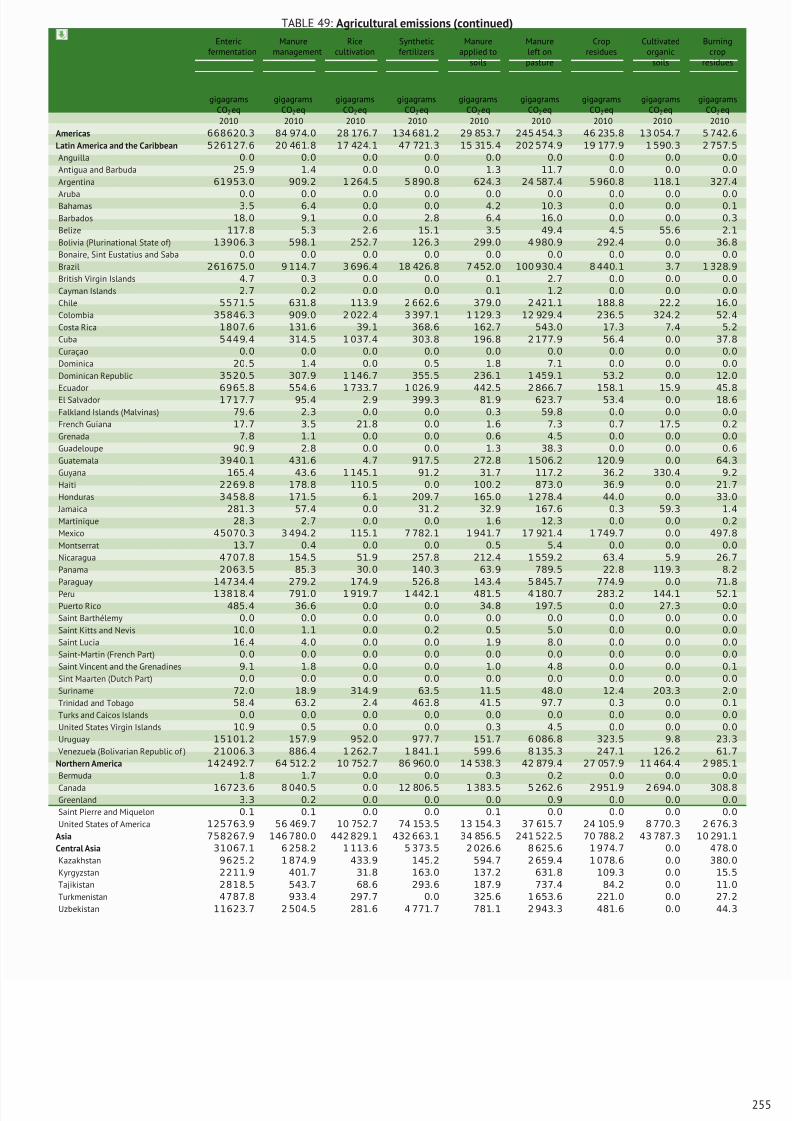
8/16/2019 Informe de la Fao 2013
http://slidepdf.com/reader/full/informe-de-la-fao-2013 273/307
TABLE 49: Agricultural emissions (continued)
Entericfermentation
Manuremanagement
Ricecultivation
Syntheticfertilizers
Manureapplied to
soils
Manureleft onpasture
Cropresidues
Cultivatedorganic
soils
Burningcrop
residues
gigagramsCO2eq
gigagramsCO2eq
gigagramsCO2eq
gigagramsCO2eq
gigagramsCO2eq
gigagramsCO2eq
gigagramsCO2eq
gigagramsCO2eq
gigagramsCO2eq
2010 2010 2010 2010 2010 2010 2010 2010 2010
Americas 668620.3 84 974.0 28 176.7 134 681.2 29 853.7 245 454.3 46 235.8 13 054.7 5 742.6
Latin America and the Caribbean 526127.6 20 461.8 17 424.1 47 721.3 15 315.4 202 574.9 19 177.9 1 590.3 2 757.5
Anguilla 0.0 0.0 0.0 0.0 0.0 0.0 0.0 0.0 0.0
Antigua and Barbuda 25.9 1.4 0.0 0.0 1.3 11.7 0.0 0.0 0.0
Argentina 61953.0 909.2 1 264.5 5 890.8 624.3 24 587.4 5 960.8 118.1 327.4
Aruba 0.0 0.0 0.0 0.0 0.0 0.0 0.0 0.0 0.0Bahamas 3.5 6.4 0.0 0.0 4.2 10.3 0.0 0.0 0.1
Barbados 18.0 9.1 0.0 2.8 6.4 16.0 0.0 0.0 0.3
Belize 117.8 5.3 2.6 15.1 3.5 49.4 4.5 55.6 2.1
Bolivia (Plurinational State of) 13906.3 598.1 252.7 126.3 299.0 4 980.9 292.4 0.0 36.8
Bonaire, Sint Eustatius and Saba 0.0 0.0 0.0 0.0 0.0 0.0 0.0 0.0 0.0
Brazil 261675.0 9 114.7 3 696.4 18 426.8 7 452.0 100 930.4 8 440.1 3.7 1 328.9
British Virgin Islands 4.7 0.3 0.0 0.0 0.1 2.7 0.0 0.0 0.0
Cayman Islands 2.7 0.2 0.0 0.0 0.1 1.2 0.0 0.0 0.0
Chile 5571.5 631.8 113.9 2 662.6 379.0 2 421.1 188.8 22.2 16.0
Colombia 35846.3 909.0 2 022.4 3 397.1 1 129.3 12 929.4 236.5 324.2 52.4
Costa Rica 1807.6 131.6 39.1 368.6 162.7 543.0 17.3 7.4 5.2
Cuba 5449.4 314.5 1 037.4 303.8 196.8 2 177.9 56.4 0.0 37.8
Curaçao 0.0 0.0 0.0 0.0 0.0 0.0 0.0 0.0 0.0
Dominica 20.5 1.4 0.0 0.5 1.8 7.1 0.0 0.0 0.0
Dominican Republic 3520.5 307.9 1 146.7 355.5 236.1 1 459.1 53.2 0.0 12.0
Ecuador 6965.
8 554.
6 1 733.
7 1 026.
9 442.
5 2 866.
7 158.
1 15.
9 45.
8
El Salvador 1717.7 95.4 2.9 399.3 81.9 623.7 53.4 0.0 18.6
Falkland Islands (Malvinas) 79.6 2.3 0.0 0.0 0.3 59.8 0.0 0.0 0.0
French Guiana 17.7 3.5 21.8 0.0 1.6 7.3 0.7 17.5 0.2
Grenada 7.8 1.1 0.0 0.0 0.6 4.5 0.0 0.0 0.0
Guadeloupe 90.9 2.8 0.0 0.0 1.3 38.3 0.0 0.0 0.6
Guatemala 3940.1 431.6 4.7 917.5 272.8 1 506.2 120.9 0.0 64.3
Guyana 165.4 43.6 1 145.1 91.2 31.7 117.2 36.2 330.4 9.2
Haiti 2269.8 178.8 110.5 0.0 100.2 873.0 36.9 0.0 21.7
Honduras 3458.8 171.5 6.1 209.7 165.0 1 278.4 44.0 0.0 33.0
Jamaica 281.3 57.4 0.0 31.2 32.9 167.6 0.3 59.3 1.4
Martinique 28.3 2.7 0.0 0.0 1.6 12.3 0.0 0.0 0.2
Mexico 45070.3 3 494.2 115.1 7 782.1 1 941.7 17 921.4 1 749.7 0.0 497.8
Montserrat 13.7 0.4 0.0 0.0 0.5 5.4 0.0 0.0 0.0
Nicaragua 4707.8 154.5 51.9 257.8 212.4 1 559.2 63.4 5.9 26.7
Panama 2063.5 85.3 30.0 140.3 63.9 789.5 22.8 119.3 8.2
Paraguay 14734.4 279.2 174.9 526.8 143.4 5 845.7 774.9 0.0 71.8
Peru 13818.4 791.0 1 919.7 1 442.1 481.5 4 180.7 283.2 144.1 52.1
Puerto Rico 485.4 36.6 0.0 0.0 34.8 197.5 0.0 27.3 0.0
Saint Barthélemy 0.0 0.0 0.0 0.0 0.0 0.0 0.0 0.0 0.0
Saint Kitts and Nevis 10.0 1.1 0.0 0.2 0.5 5.0 0.0 0.0 0.0
Saint Lucia 16.4 4.0 0.0 0.0 1.9 8.0 0.0 0.0 0.0
Saint-Martin (French Part) 0.0 0.0 0.0 0.0 0.0 0.0 0.0 0.0 0.0
Saint Vincent and the Grenadines 9.1 1.8 0.0 0.0 1.0 4.8 0.0 0.0 0.1
Sint Maarten (Dutch Part) 0.0 0.0 0.0 0.0 0.0 0.0 0.0 0.0 0.0
Suriname 72.0 18.9 314.9 63.5 11.5 48.0 12.4 203.3 2.0
Trinidad and Tobago 58.4 63.2 2.4 463.8 41.5 97.7 0.3 0.0 0.1
Turks and Caicos Islands 0.0 0.0 0.0 0.0 0.0 0.0 0.0 0.0 0.0
United States Virgin Islands 10.9 0.5 0.0 0.0 0.3 4.5 0.0 0.0 0.0
Uruguay 15101.2 157.9 952.0 977.7 151.7 6 086.8 323.5 9.8 23.3
Venezuela (Bolivarian Republic of ) 21006.3 886.4 1 262.7 1 841.1 599.6 8 135.3 247.1 126.2 61.7
Northern America 142492.7 64 512.2 10 752.7 86 960.0 14 538.3 42 879.4 27 057.9 11 464.4 2 985.1
Bermuda 1.8 1.7 0.0 0.0 0.3 0.2 0.0 0.0 0.0
Canada 16723.6 8 040.5 0.0 12 806.5 1 383.5 5 262.6 2 951.9 2 694.0 308.8
Greenland 3.3 0.2 0.0 0.0 0.0 0.9 0.0 0.0 0.0
Saint Pierre and Miquelon 0.1 0.1 0.0 0.0 0.1 0.0 0.0 0.0 0.0
United States of America 125763.9 56 469.7 10 752.7 74 153.5 13 154.3 37 615.7 24 105.9 8 770.3 2 676.3
Asia 758267.9 146 780.0 442 829.1 432 663.1 34 856.5 241 522.5 70 788.2 43 787.3 10 291.1
Central Asia 31067.1 6 258.2 1 113.6 5 373.5 2 026.6 8 625.6 1 974.7 0.0 478.0
Kazakhstan 9625.2 1 874.9 433.9 145.2 594.7 2 659.4 1 078.6 0.0 380.0
Kyrgyzstan 2211.9 401.7 31.8 163.0 137.2 631.8 109.3 0.0 15.5
Tajikistan 2818.5 543.7 68.6 293.6 187.9 737.4 84.2 0.0 11.0
Turkmenistan 4787.8 933.4 297.7 0.0 325.6 1 653.6 221.0 0.0 27.2
Uzbekistan 11623.7 2 504.5 281.6 4 771.7 781.1 2 943.3 481.6 0.0 44.3
255
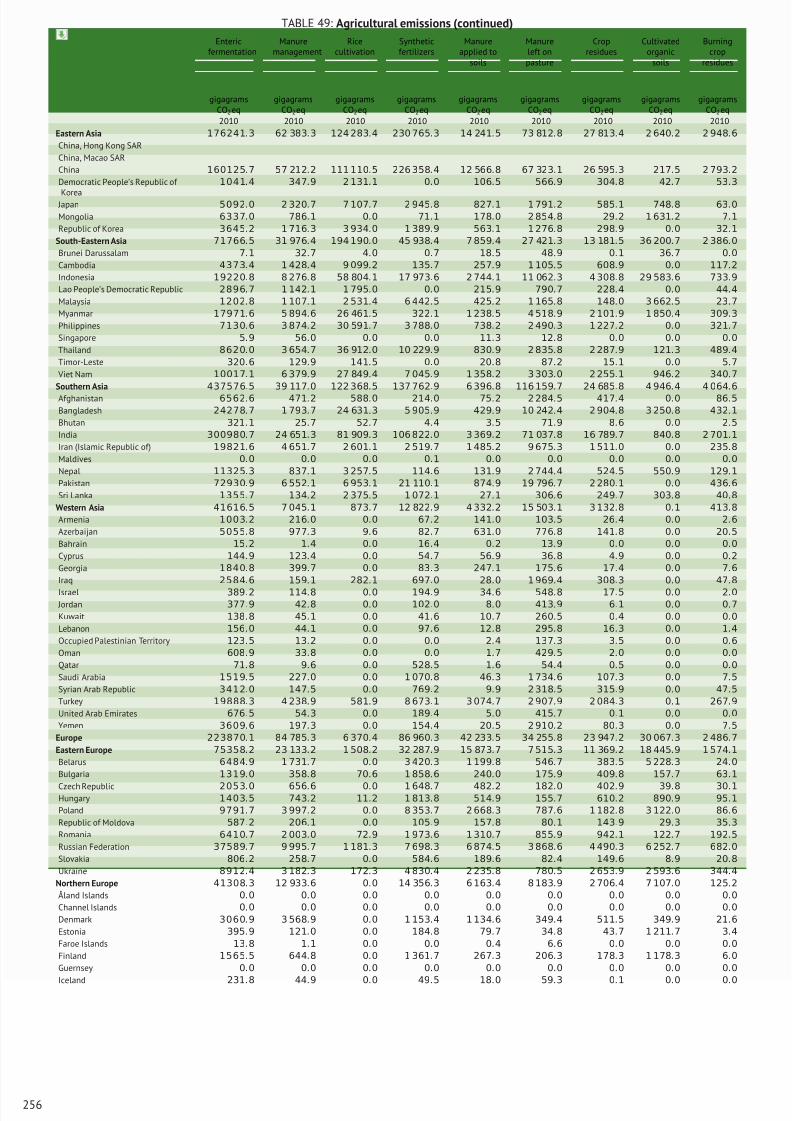
8/16/2019 Informe de la Fao 2013
http://slidepdf.com/reader/full/informe-de-la-fao-2013 274/307
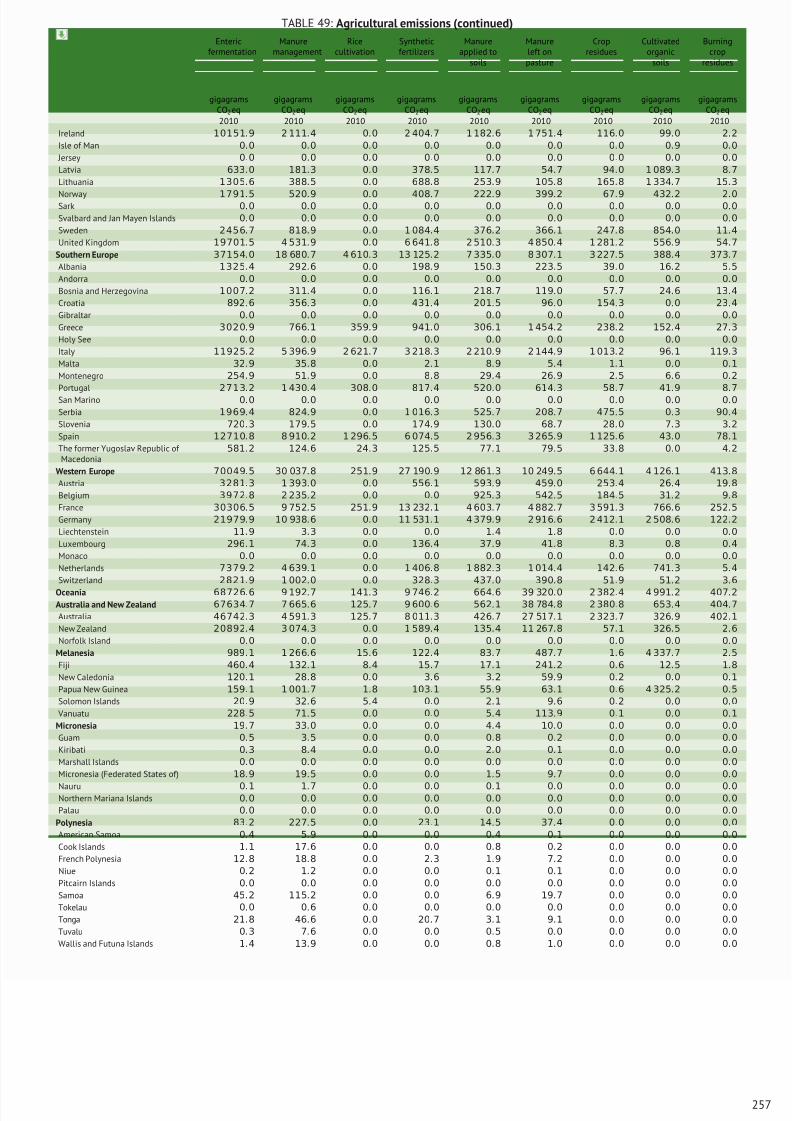
8/16/2019 Informe de la Fao 2013
http://slidepdf.com/reader/full/informe-de-la-fao-2013 275/307
TABLE 49: Agricultural emissions (continued)
Entericfermentation
Manuremanagement
Ricecultivation
Syntheticfertilizers
Manureapplied to
soils
Manureleft onpasture
Cropresidues
Cultivatedorganic
soils
Burningcrop
residues
gigagramsCO2eq
gigagramsCO2eq
gigagramsCO2eq
gigagramsCO2eq
gigagramsCO2eq
gigagramsCO2eq
gigagramsCO2eq
gigagramsCO2eq
gigagramsCO2eq
2010 2010 2010 2010 2010 2010 2010 2010 2010
Ireland 10151.9 2 111.4 0.0 2 404.7 1 182.6 1 751.4 116.0 99.0 2.2
Isle of Man 0.0 0.0 0.0 0.0 0.0 0.0 0.0 0.9 0.0
Jersey 0.0 0.0 0.0 0.0 0.0 0.0 0.0 0.0 0.0
Latvia 633.0 181.3 0.0 378.5 117.7 54.7 94.0 1 089.3 8.7
Lithuania 1305.6 388.5 0.0 688.8 253.9 105.8 165.8 1 334.7 15.3
Norway 1791.5 520.9 0.0 408.7 222.9 399.2 67.9 432.2 2.0Sark 0.0 0.0 0.0 0.0 0.0 0.0 0.0 0.0 0.0
Svalbard and Jan Mayen Islands 0.0 0.0 0.0 0.0 0.0 0.0 0.0 0.0 0.0
Sweden 2456.7 818.9 0.0 1 084.4 376.2 366.1 247.8 854.0 11.4
United Kingdom 19701.5 4 531.9 0.0 6 641.8 2 510.3 4 850.4 1 281.2 556.9 54.7
Southern Europe 37154.0 18 680.7 4 610.3 13 125.2 7 335.0 8 307.1 3 227.5 388.4 373.7
Albania 1325.4 292.6 0.0 198.9 150.3 223.5 39.0 16.2 5.5
Andorra 0.0 0.0 0.0 0.0 0.0 0.0 0.0 0.0 0.0
Bosnia and Herzegovina 1007.2 311.4 0.0 116.1 218.7 119.0 57.7 24.6 13.4
Croatia 892.6 356.3 0.0 431.4 201.5 96.0 154.3 0.0 23.4
Gibraltar 0.0 0.0 0.0 0.0 0.0 0.0 0.0 0.0 0.0
Greece 3020.9 766.1 359.9 941.0 306.1 1 454.2 238.2 152.4 27.3
Holy See 0.0 0.0 0.0 0.0 0.0 0.0 0.0 0.0 0.0
Italy 11925.2 5 396.9 2 621.7 3 218.3 2 210.9 2 144.9 1 013.2 96.1 119.3
Malta 32.9 35.8 0.0 2.1 8.9 5.4 1.1 0.0 0.1
Montenegro 254.9 51.9 0.0 8.8 29.4 26.9 2.5 6.6 0.2
Portugal 2713.
2 1 430.
4 308.
0 817.
4 520.
0 614.
3 58.
7 41.
9 8.
7
San Marino 0.0 0.0 0.0 0.0 0.0 0.0 0.0 0.0 0.0
Serbia 1969.4 824.9 0.0 1 016.3 525.7 208.7 475.5 0.3 90.4
Slovenia 720.3 179.5 0.0 174.9 130.0 68.7 28.0 7.3 3.2
Spain 12710.8 8 910.2 1 296.5 6 074.5 2 956.3 3 265.9 1 125.6 43.0 78.1
The former Yugoslav Republic of Macedonia
581.2 124.6 24.3 125.5 77.1 79.5 33.8 0.0 4.2
Western Europe 70049.5 30 037.8 251.9 27 190.9 12 861.3 10 249.5 6 644.1 4 126.1 413.8
Austria 3281.3 1 393.0 0.0 556.1 593.9 459.0 253.4 26.4 19.8
Belgium 3972.8 2 235.2 0.0 0.0 925.3 542.5 184.5 31.2 9.8
France 30306.5 9 752.5 251.9 13 232.1 4 603.7 4 882.7 3 591.3 766.6 252.5
Germany 21979.9 10 938.6 0.0 11 531.1 4 379.9 2 916.6 2 412.1 2 508.6 122.2
Liechtenstein 11.9 3.3 0.0 0.0 1.4 1.8 0.0 0.0 0.0
Luxembourg 296.1 74.3 0.0 136.4 37.9 41.8 8.3 0.8 0.4
Monaco 0.0 0.0 0.0 0.0 0.0 0.0 0.0 0.0 0.0
Netherlands 7379.2 4 639.1 0.0 1 406.8 1 882.3 1 014.4 142.6 741.3 5.4
Switzerland 2821.9 1 002.0 0.0 328.3 437.0 390.8 51.9 51.2 3.6
Oceania 68726.6 9 192.7 141.3 9 746.2 664.6 39 320.0 2 382.4 4 991.2 407.2
Australia and New Zealand 67634.7 7 665.6 125.7 9 600.6 562.1 38 784.8 2 380.8 653.4 404.7
Australia 46742.3 4 591.3 125.7 8 011.3 426.7 27 517.1 2 323.7 326.9 402.1
New Zealand 20892.4 3 074.3 0.0 1 589.4 135.4 11 267.8 57.1 326.5 2.6
Norfolk Island 0.0 0.0 0.0 0.0 0.0 0.0 0.0 0.0 0.0
Melanesia 989.1 1 266.6 15.6 122.4 83.7 487.7 1.6 4 337.7 2.5
Fiji 460.4 132.1 8.4 15.7 17.1 241.2 0.6 12.5 1.8
New Caledonia 120.1 28.8 0.0 3.6 3.2 59.9 0.2 0.0 0.1
Papua New Guinea 159.1 1 001.7 1.8 103.1 55.9 63.1 0.6 4 325.2 0.5
Solomon Islands 20.9 32.6 5.4 0.0 2.1 9.6 0.2 0.0 0.0
Vanuatu 228.5 71.5 0.0 0.0 5.4 113.9 0.1 0.0 0.1
Micronesia 19.7 33.0 0.0 0.0 4.4 10.0 0.0 0.0 0.0
Guam 0.5 3.5 0.0 0.0 0.8 0.2 0.0 0.0 0.0
Kiribati 0.3 8.4 0.0 0.0 2.0 0.1 0.0 0.0 0.0
Marshall Islands 0.0 0.0 0.0 0.0 0.0 0.0 0.0 0.0 0.0
Micronesia (Federated States of) 18.9 19.5 0.0 0.0 1.5 9.7 0.0 0.0 0.0
Nauru 0.1 1.7 0.0 0.0 0.1 0.0 0.0 0.0 0.0Northern Mariana Islands 0.0 0.0 0.0 0.0 0.0 0.0 0.0 0.0 0.0
Palau 0.0 0.0 0.0 0.0 0.0 0.0 0.0 0.0 0.0
Polynesia 83.2 227.5 0.0 23.1 14.5 37.4 0.0 0.0 0.0
American Samoa 0.4 5.9 0.0 0.0 0.4 0.1 0.0 0.0 0.0
Cook Islands 1.1 17.6 0.0 0.0 0.8 0.2 0.0 0.0 0.0
French Polynesia 12.8 18.8 0.0 2.3 1.9 7.2 0.0 0.0 0.0
Niue 0.2 1.2 0.0 0.0 0.1 0.1 0.0 0.0 0.0
Pitcairn Islands 0.0 0.0 0.0 0.0 0.0 0.0 0.0 0.0 0.0
Samoa 45.2 115.2 0.0 0.0 6.9 19.7 0.0 0.0 0.0
Tokelau 0.0 0.6 0.0 0.0 0.0 0.0 0.0 0.0 0.0
Tonga 21.8 46.6 0.0 20.7 3.1 9.1 0.0 0.0 0.0
Tuvalu 0.3 7.6 0.0 0.0 0.5 0.0 0.0 0.0 0.0
Wallis and Futuna Islands 1.4 13.9 0.0 0.0 0.8 1.0 0.0 0.0 0.0
257

8/16/2019 Informe de la Fao 2013
http://slidepdf.com/reader/full/informe-de-la-fao-2013 276/307

8/16/2019 Informe de la Fao 2013
http://slidepdf.com/reader/full/informe-de-la-fao-2013 277/307
PART
Metadata
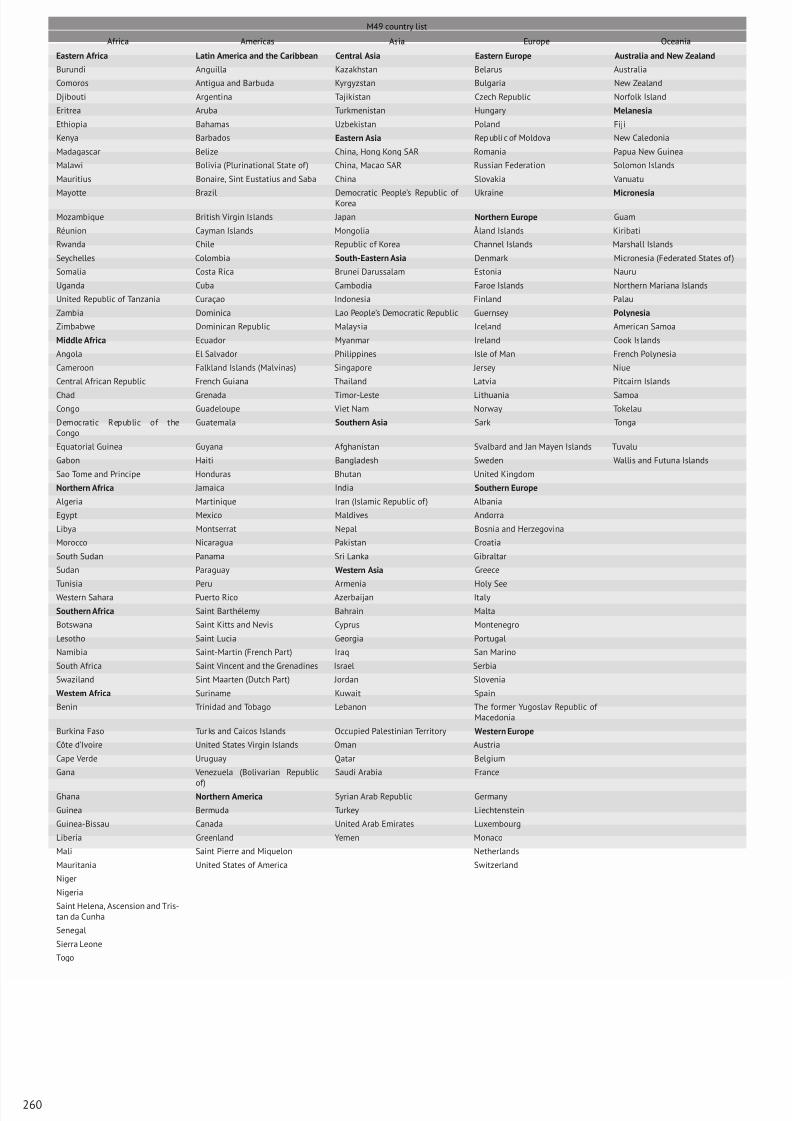
8/16/2019 Informe de la Fao 2013
http://slidepdf.com/reader/full/informe-de-la-fao-2013 278/307
M49 country list
Africa Americas Asia Europe Oceania
Eastern Africa Latin America and the Caribbean Central Asia Eastern Europe Australia and New Zealand
Burundi Anguilla Kazakhstan Belarus Australia
Comoros Antigua and Barbuda Kyrgyzstan Bulgaria New Zealand
Djibouti Argentina Tajikistan Czech Republic Norfolk Island
Eritrea Aruba Turkmenistan Hungary Melanesia
Ethiopia Bahamas Uzbekistan Poland Fiji
Kenya Barbados Eastern Asia Rep ubli c of Moldova New Caledonia
Madagascar Belize China, Hong Kong SAR Romania Papua New Guinea
Malawi Bolivia (Plurinational State of) China, Macao SAR Russian Federation Solomon Islands
Mauritius Bonaire, Sint Eustatius and Saba China Slovakia Vanuatu
Mayotte Brazil Democratic People’s Republic of Korea Ukraine Micronesia
Mozambique British Virgin Islands Japan Northern Europe Guam
Réunion Cayman Islands Mongolia Åland Islands Kiribati
Rwanda Chile Republic of Korea Channel Islands Marshall Islands
Seychelles Colombia South-Eastern Asia Denmark Micronesia (Federated States of)
Somalia Costa Rica Brunei Darussalam Estonia Nauru
Uganda Cuba Cambodia Faroe Islands Northern Mariana Islands
United Republic of Tanzania Curaçao Indonesia Finland Palau
Zambia Dominica Lao People’s Democratic Republic Guernsey Polynesia
Zimbabwe Dominican Republic Malaysia Iceland American Samoa
Middle Africa Ecuador Myanmar Ireland Cook Islands
Angola El Salvador Philippines Isle of Man French Polynesia
Cameroon Falkland Islands (Malvinas) Singapore Jersey Niue
Central African Republic French Guiana Thailand Latvia Pitcairn Islands
Chad Grenada Timor-Leste Lithuania SamoaCongo Guadeloupe Viet Nam Norway Tokelau
Democratic Republic of theCongo
Guatemala Southern Asia Sark Tonga
Equatorial Guinea Guyana Afghanistan Svalbard and Jan Mayen Islands Tuvalu
Gabon Haiti Bangladesh Sweden Wallis and Futuna Islands
Sao Tome and Principe Honduras Bhutan United Kingdom
Northern Africa Jamaica India Southern Europe
Algeria Martinique Iran (Islamic Republic of) Albania
Egypt Mexico Maldives Andorra
Libya Montserrat Nepal Bosnia and Herzegovina
Morocco Nicaragua Pakistan Croatia
South Sudan Panama Sri Lanka Gibraltar
Sudan Paraguay Western Asia Greece
Tunisia Peru Armenia Holy See
Western Sahara Puerto Rico Azerbaijan Italy
Southern Africa Saint Barthélemy Bahrain Malta
Botswana Saint Kitts and Nevis Cyprus Montenegro
Lesotho Saint Lucia Georgia Portugal
Namibia Saint-Martin (French Part) Iraq San Marino
South Africa Saint Vincent and the Grenadines Israel Serbia
Swaziland Sint Maarten (Dutch Part) Jordan Slovenia
Western Africa Suriname Kuwait Spain
Benin Trinidad and Tobago Lebanon The former Yugoslav Republic of Macedonia
Burkina Faso Tur ks and Caicos Islands Occupied Palestinian Territory Western Europe
Côte d’Ivoire United States Virgin Islands Oman Austria
Cape Verde Uruguay Qatar Belgium
Gana Venezuela (Bolivarian Republic
of)
Saudi Arabia France
Ghana Northern America Syrian Arab Republic Germany
Guinea Bermuda Turkey Liechtenstein
Guinea-Bissau Canada United Arab Emirates Luxembourg
Liberia Greenland Yemen Monaco
Mali Saint Pierre and Miquelon Netherlands
Mauritania United States of America Switzerland
Niger
Nigeria
Saint Helena, Ascension and Tris-tan da Cunha
Senegal
Sierra Leone
Togo
260
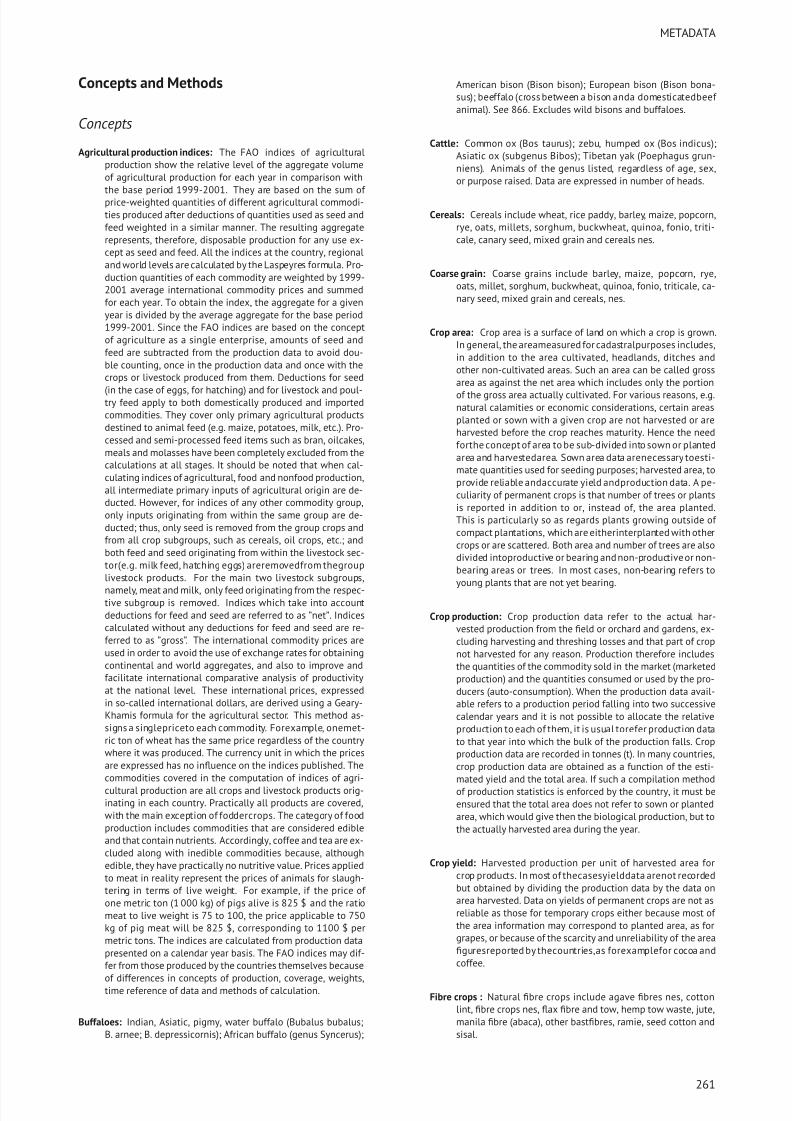
8/16/2019 Informe de la Fao 2013
http://slidepdf.com/reader/full/informe-de-la-fao-2013 279/307
METADATA
Concepts and Methods
Concepts
Agricultural production indices: The FAO indices of agriculturalproduction show the relative level of the aggregate volumeof agricultural production for each year in comparison withthe base period 1999-2001. They are based on the sum of price-weighted quantities of different agricultural commodi-ties produced after deductions of quantities used as seed andfeed weighted in a similar manner. The resulting aggregaterepresents, therefore, disposable production for any use ex-cept as seed and feed. All the indices at the country, regionaland world levels are calculated by the Laspeyres formula. Pro-duction quantities of each commodity are weighted by 1999-2001 average international commodity prices and summedfor each year. To obtain the index, the aggregate for a givenyear is divided by the average aggregate for the base period1999-2001. Since the FAO indices are based on the conceptof agriculture as a single enterprise, amounts of seed andfeed are subtracted from the production data to avoid dou-ble counting, once in the production data and once with thecrops or livestock produced from them. Deductions for seed
(in the case of eggs, for hatching) and for livestock and poul-try feed apply to both domestically produced and importedcommodities. They cover only primary agricultural productsdestined to animal feed (e.g. maize, potatoes, milk, etc.). Pro-cessed and semi-processed feed items such as bran, oilcakes,meals and molasses have been completely excluded from thecalculations at all stages. It should be noted that when cal-culating indices of agricultural, food and nonfood production,all intermediate primary inputs of agricultural origin are de-ducted. However, for indices of any other commodity group,only inputs originating from within the same group are de-ducted; thus, only seed is removed from the group crops andfrom all crop subgroups, such as cereals, oil crops, etc.; andboth feed and seed originating from within the livestock sec-tor(e.g. milk feed, hatching eggs) areremovedfrom thegrouplivestock products. For the main two livestock subgroups,
namely, meat and milk, only feed originating from the respec-tive subgroup is removed. Indices which take into accountdeductions for feed and seed are referred to as ”net”. Indicescalculated without any deductions for feed and seed are re-ferred to as ”gross”. The international commodity prices areused in order to avoid the use of exchange rates for obtainingcontinental and world aggregates, and also to improve andfacilitate international comparative analysis of productivityat the national level. These international prices, expressedin so-called international dollars, are derived using a Geary-Khamis formula for the agricultural sector. This method as-signs a singlepriceto each commodity. Forexample, onemet-ric ton of wheat has the same price regardless of the countrywhere it was produced. The currency unit in which the pricesare expressed has no influence on the indices published. Thecommodities covered in the computation of indices of agri-cultural production are all crops and livestock products orig-inating in each country. Practically all products are covered,with the main exception of foddercrops. The category of foodproduction includes commodities that are considered edibleand that contain nutrients. Accordingly, coffee and tea are ex-cluded along with inedible commodities because, althoughedible, they have practically no nutritive value. Prices appliedto meat in reality represent the prices of animals for slaugh-tering in terms of live weight. For example, if the price of one metric ton (1 000 kg) of pigs alive is 825 $ and the ratiomeat to live weight is 75 to 100, the price applicable to 750kg of pig meat will be 825 $, corresponding to 1100 $ permetric tons. The indices are calculated from production datapresented on a calendar year basis. The FAO indices may dif-fer from those produced by the countries themselves because
of differences in concepts of production, coverage, weights,time reference of data and methods of calculation.
Buffaloes: Indian, Asiatic, pigmy, water buffalo (Bubalus bubalus;B. arnee; B. depressicornis); African buffalo (genus Syncerus);
American bison (Bison bison); European bison (Bison bona-sus); beeffalo (cross between a bison anda domesticatedbeef animal). See 866. Excludes wild bisons and buffaloes.
Cattle: Common ox (Bos taurus); zebu, humped ox (Bos indicus);Asiatic ox (subgenus Bibos); Tibetan yak (Poephagus grun-niens). Animals of the genus listed, regardless of age, sex,or purpose raised. Data are expressed in number of heads.
Cereals: Cereals include wheat, rice paddy, barley, maize, popcorn,rye, oats, millets, sorghum, buckwheat, quinoa, fonio, triti-cale, canary seed, mixed grain and cereals nes.
Coarse grain: Coarse grains include barley, maize, popcorn, rye,oats, millet, sorghum, buckwheat, quinoa, fonio, triticale, ca-nary seed, mixed grain and cereals, nes.
Crop area: Crop area is a surface of land on which a crop is grown.In general, the areameasured for cadastralpurposes includes,in addition to the area cultivated, headlands, ditches andother non-cultivated areas. Such an area can be called grossarea as against the net area which includes only the portion
of the gross area actually cultivated. For various reasons, e.g.natural calamities or economic considerations, certain areasplanted or sown with a given crop are not harvested or areharvested before the crop reaches maturity. Hence the needforthe concept of area to be sub-divided into sown or plantedarea and harvestedarea. Sown area data arenecessary toesti-mate quantities used for seeding purposes; harvested area, toprovide reliable andaccurate yield andproduction data. A pe-culiarity of permanent crops is that number of trees or plantsis reported in addition to or, instead of, the area planted.This is particularly so as regards plants growing outside of compact plantations, which are eitherinterplanted with othercrops or are scattered. Both area and number of trees are alsodivided intoproductive or bearing and non-productive or non-bearing areas or trees. In most cases, non-bearing refers toyoung plants that are not yet bearing.
Crop production: Crop production data refer to the actual har-vested production from the field or orchard and gardens, ex-cluding harvesting and threshing losses and that part of cropnot harvested for any reason. Production therefore includesthe quantities of the commodity sold in the market (marketedproduction) and the quantities consumed or used by the pro-ducers (auto-consumption). When the production data avail-able refers to a production period falling into two successivecalendar years and it is not possible to allocate the relativeproduction to each of them, it is usual torefer production datato that year into which the bulk of the production falls. Cropproduction data are recorded in tonnes (t). In many countries,crop production data are obtained as a function of the esti-mated yield and the total area. If such a compilation methodof production statistics is enforced by the country, it must beensured that the total area does not refer to sown or plantedarea, which would give then the biological production, but tothe actually harvested area during the year.
Crop yield: Harvested production per unit of harvested area forcrop products. In most of thecasesyielddata arenot recordedbut obtained by dividing the production data by the data onarea harvested. Data on yields of permanent crops are not asreliable as those for temporary crops either because most of the area information may correspond to planted area, as forgrapes, or because of the scarcity and unreliability of the areafiguresreported by thecountries,as forexamplefor cocoa andcoffee.
Fibre crops : Natural fibre crops include agave fibres nes, cottonlint, fibre crops nes, flax fibre and tow, hemp tow waste, jute,manila fibre (abaca), other bastfibres, ramie, seed cotton andsisal.
261
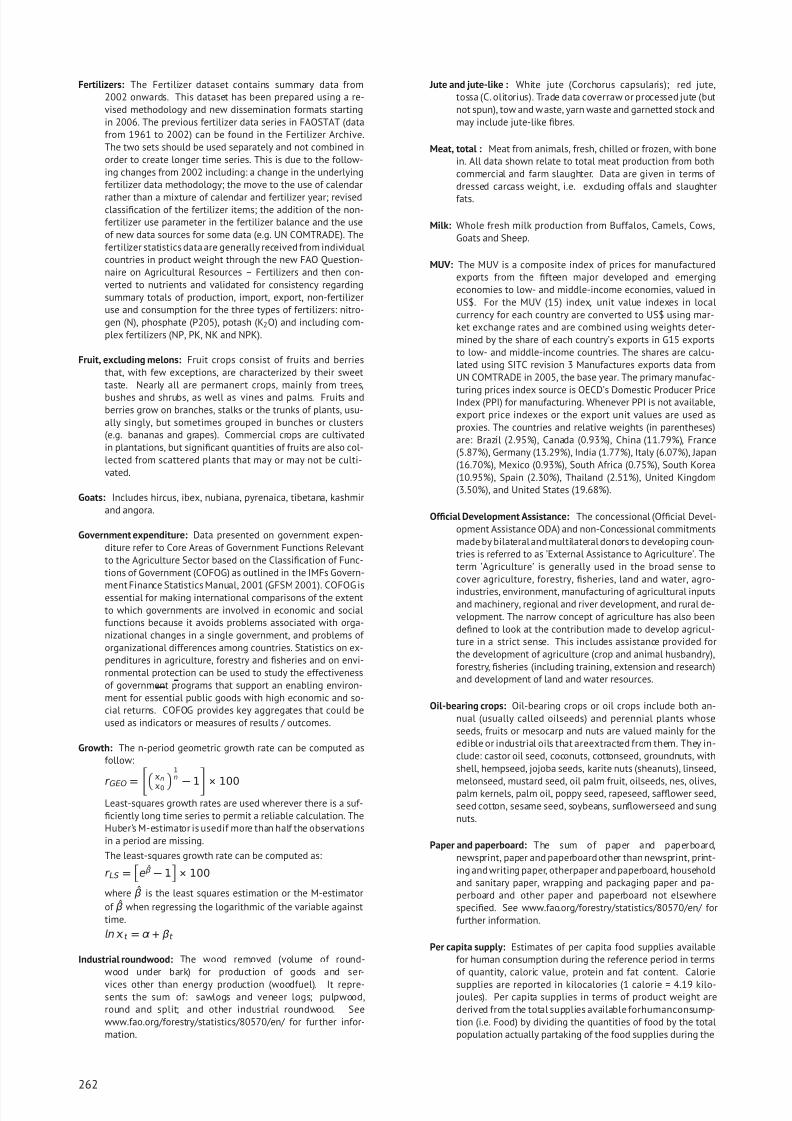
8/16/2019 Informe de la Fao 2013
http://slidepdf.com/reader/full/informe-de-la-fao-2013 280/307
Fertilizers: The Fertilizer dataset contains summary data from2002 onwards. This dataset has been prepared using a re-vised methodology and new dissemination formats startingin 2006. The previous fertilizer data series in FAOSTAT (datafrom 1961 to 2002) can be found in the Fertilizer Archive.The two sets should be used separately and not combined inorder to create longer time series. This is due to the follow-ing changes from 2002 including: a change in the underlyingfertilizer data methodology; the move to the use of calendar
rather than a mixture of calendar and fertilizer year; revisedclassification of the fertilizer items; the addition of the non-fertilizer use parameter in the fertilizer balance and the useof new data sources for some data (e.g. UN COMTRADE). Thefertilizer statistics data are generally received from individualcountries in product weight through the new FAO Question-naire on Agricultural Resources – Fertilizers and then con-verted to nutrients and validated for consistency regardingsummary totals of production, import, export, non-fertilizeruse and consumption for the three types of fertilizers: nitro-gen (N), phosphate (P205), potash (K2O) and including com-plex fertilizers (NP, PK, NK and NPK).
Fruit, excluding melons: Fruit crops consist of fruits and berriesthat, with few exceptions, are characterized by their sweettaste. Nearly all are permanent crops, mainly from trees,bushes and shrubs, as well as vines and palms. Fruits andberries grow on branches, stalks or the trunks of plants, usu-ally singly, but sometimes grouped in bunches or clusters(e.g. bananas and grapes). Commercial crops are cultivatedin plantations, but significant quantities of fruits are also col-lected from scattered plants that may or may not be culti-vated.
Goats: Includes hircus, ibex, nubiana, pyrenaica, tibetana, kashmirand angora.
Government expenditure: Data presented on government expen-diture refer to Core Areas of Government Functions Relevantto the Agriculture Sector based on the Classification of Func-tions of Government (COFOG) as outlined in the IMFs Govern-
ment Finance Statistics Manual, 2001 (GFSM 2001). COFOG isessential for making international comparisons of the extentto which governments are involved in economic and socialfunctions because it avoids problems associated with orga-nizational changes in a single government, and problems of organizational differences among countries. Statistics on ex-penditures in agriculture, forestry and fisheries and on envi-ronmental protection can be used to study the effectivenessof government programs that support an enabling environ-ment for essential public goods with high economic and so-cial returns. COFOG provides key aggregates that could beused as indicators or measures of results / outcomes.
Growth: The n-period geometric growth rate can be computed asfollow:
r GEO = n
0
1
n− 1× 100
Least-squares growth rates are used wherever there is a suf-ficiently long time series to permit a reliable calculation. TheHuber’s M-estimator is usedif more than half the observationsin a period are missing.
The least-squares growth rate can be computed as:
r LS =
e
ˆ β− 1
× 100
where ˆ β is the least squares estimation or the M-estimator
of ˆ β when regressing the logarithmic of the variable againsttime.
n t = α + βt
Industrial roundwood: The wood removed (volume of round-wood under bark) for production of goods and ser-
vices other than energy production (woodfuel). It repre-sents the sum of: sawlogs and veneer logs; pulpwood,round and split; and other industrial roundwood. Seewww.fao.org/forestry/statistics/80570/en/ for fur ther infor-mation.
Jute and jute-like : White jute (Corchorus capsularis); red jute,tossa (C. olitorius). Trade data coverraw or processed jute (butnot spun), tow and waste, yarn waste and garnetted stock andmay include jute-like fibres.
Meat, total : Meat from animals, fresh, chilled or frozen, with bonein. All data shown relate to total meat production from bothcommercial and farm slaughter. Data are given in terms of dressed carcass weight, i.e. excluding offals and slaughter
fats.
Milk: Whole fresh milk production from Buffalos, Camels, Cows,Goats and Sheep.
MUV: The MUV is a composite index of prices for manufacturedexports from the fifteen major developed and emergingeconomies to low- and middle-income economies, valued inUS$. For the MUV (15) index, unit value indexes in localcurrency for each country are converted to US$ using mar-ket exchange rates and are combined using weights deter-mined by the share of each country’s exports in G15 exportsto low- and middle-income countries. The shares are calcu-lated using SITC revision 3 Manufactures exports data fromUN COMTRADE in 2005, the base year. The primary manufac-
turing prices index source is OECD’s Domestic Producer PriceIndex (PPI) for manufacturing. Whenever PPI is not available,export price indexes or the export unit values are used asproxies. The countries and relative weights (in parentheses)are: Brazil (2.95%), Canada (0.93%), China (11.79%), France(5.87%), Germany (13.29%), India (1.77%), Italy (6.07%), Japan(16.70%), Mexico (0.93%), South Africa (0.75%), South Korea(10.95%), Spain (2.30%), Thailand (2.51%), United Kingdom(3.50%), and United States (19.68%).
Official Development Assistance: The concessional (Official Devel-opment Assistance ODA) and non-Concessional commitmentsmade by bilateral and multilateral donors to developing coun-tries is referred to as ’External Assistance to Agriculture’. Theterm ’Agriculture’ is generally used in the broad sense tocover agriculture, forestry, fisheries, land and water, agro-
industries, environment, manufacturing of agricultural inputsand machinery, regional and river development, and rural de-velopment. The narrow concept of agriculture has also beendefined to look at the contribution made to develop agricul-ture in a strict sense. This includes assistance provided forthe development of agriculture (crop and animal husbandry),forestry, fisheries (including training, extension and research)and development of land and water resources.
Oil-bearing crops: Oil-bearing crops or oil crops include both an-nual (usually called oilseeds) and perennial plants whoseseeds, fruits or mesocarp and nuts are valued mainly for theedible or industrial oils that areextracted from them. They in-clude: castor oil seed, coconuts, cottonseed, groundnuts, withshell, hempseed, jojoba seeds, karite nuts (sheanuts), linseed,
melonseed, mustard seed, oil palm fruit, oilseeds, nes, olives,palm kernels, palm oil, poppy seed, rapeseed, safflower seed,seed cotton, sesame seed, soybeans, sunflowerseed and sungnuts.
Paper and paperboard: The sum of paper and paperboard,newsprint, paper and paperboard other than newsprint, print-ing and writing paper, otherpaper and paperboard, householdand sanitary paper, wrapping and packaging paper and pa-perboard and other paper and paperboard not elsewherespecified. See www.fao.org/forestry/statistics/80570/en/ forfurther information.
Per capita supply: Estimates of per capita food supplies availablefor human consumption during the reference period in termsof quantity, caloric value, protein and fat content. Calorie
supplies are reported in kilocalories (1 calorie = 4.19 kilo-joules). Per capita supplies in terms of product weight arederived from the total supplies available forhumanconsump-tion (i.e. Food) by dividing the quantities of food by the totalpopulation actually partaking of the food supplies during the
262
8/16/2019 Informe de la Fao 2013
http://slidepdf.com/reader/full/informe-de-la-fao-2013 281/307
METADATA
reference period, i.e. the present in-area (de facto) popula-tion within the present geographical boundaries of the coun-try. In other words, nationals living abroad during the refer-ence period are excluded, but foreigners living in the countryare included. Adjustments are made wherever possible forpart-time presence or absence, such as temporary migrants,tourists and refugees supported by special schemes (if it hasnot been possible to allow for the amounts provided by suchschemes under imports). In almost all cases, the popula-
tion figures used are the mid-year estimates published by theUnited Nations Population Division. Per capita supply figuresshown in the commodity balances therefore represent onlythe average supply available for the population as a wholeand do not necessarily indicate what is actually consumed byindividuals. Even if they are taken as approximation to percapita consumption, it is important to note that the amountof food actually consumed may be lower than the quantityshown here, depending on the degree of losses of edible foodand nutrients in the household, e.g. during storage, in prepa-ration and cooking etc. In many cases commodities are notconsumed in the primary form in which they are presentedin the commodity balance, e.g. cereals enter the householdmainly in processed form like flour, meal, husked or milledrice. To take this fact into account, the caloric value, the pro-tein and fat content shown against primary commodities inthe commodity balances have been derived by applying theappropriate food composition factors to the quantities of theprocessed commodities and not by multiplying the quantitiesshown in the commodity balance with the food compositionfactors relating to primary commodities.
Pig meat: Meat,with thebone in,of domestic or wild pigs (e.g. wildboars),whether fresh, chilled or frozen.
Poultry meat: Poultry birds, fresh, chilled or frozen, with bone in.Alldatashownrelate tototalmeatproduction from both com-mercial andfarmslaughter. Data aregivenin terms of dressedcarcass weight, i.e. excluding offals and slaughter fats. Poul-try meat includes Bird meat, nes, Chicken meat, Duck meat,Goose and guinea fowl meat and Turkey meat.
Production: Figures relate to the total domestic productionwhether inside or outside the agricultural sector, i.e. itincludes non-commercial production and production fromkitchen gardens. Unless otherwise indicated, production isreported at the farm level for crop and livestock products (i.e.in thecase of crops, excluding harvesting losses) and in termsof live weight for fish items (i.e. the actual ex-water weight atthe time of the harvest). All data shown relate to total meatproduction from both commercial and farm slaughter. Dataof meat production are expressed in terms of dressed carcassweight, excluding offal and slaughter fats. Production of beef and buffalo meat includes veal; mutton and goat meat in-cludes meat from lambs and kids; pig meat includes baconandham in fresh equivalent. Poultry meat includes meat fromall domestic birds and refers, wherever possible, to ready-to-
cook weight.
Production - Livestock primary: Livestock primary products in-clude products from live and slaughtered animals. Productsfrom slaughtered animals include meat, offals, raw fats, freshhides and skins. Products from live animals include milk,eggs, honey, beeswax and fibres of animal origin. All datashown relate to total meat production from both commer-cial and farm slaughter. Data are given in terms of dressedcarcass weight, i.e. excluding offals and slaughter fats. Pro-duction of beef and buffalo meat includes veal; mutton andgoat meat includes meat from lambs and kids, respectively;pig meat includes bacon and ham in fresh equivalent. Poultrymeat includes meat from all domestic birds and refers, wher-ever possible, to ready-to-cook weight. Cow milk productionrelates to total production of whole fresh milk, excluding the
milk sucked by young animals but including amounts fed tolivestock. The concept of production of buffalo, sheep andgoat milk is the same as for cow milk; however, the cover-age is probably less adequate. Egg production covers all do-mestic birds which have contributed to eggproduction during
the year, wherever they lay and the corresponding total pro-duction, including eggs intended to be used for hatching butexcluding waste on farms.
Pulses: Pulses are annualleguminous crops yielding from oneto 12grainsor seeds of variable size, shape andcolour withina pod.They areused forboth food andfeed. Theterm "pulses" is lim-ited to crops harvested solely for dry grain, thereby excludingcrops harvested green for food (green peas, green beans, etc.)
which are classified as vegetable crops. Also excluded arethose crops used mainly for oil extraction (e.g. soybean andgroundnuts) and leguminous crops (e.g. seeds of clover andalfalfa) that are used exclusively for sowing purposes. Theyinclude bambara beans, beans, dry, broad beans, horse beans,dry, chick peas, cow peas, dry, lentils, lupins, peas, dry, pigeonpeas, pulses, nes, and vetches.
Recovered paper: Waste and scraps of paper or paperboard thathave been collected for re-use as a raw material for themanufacture of paper and paperboard. It includes: paperand paperboard that has been used for its original purposeand residues from paper and paperboard production. Seewww.fao.org/forestry/statistics/80570/en/ for fur ther infor-mation.
Rice (paddy): Oryza spp., mainly oryza sativa. Rice grain afterthreshing and winnowing. Also known as rice in the husk andrough rice. Used mainly for human food.
Root and tuber crops: Roots and tubers are plants yielding starchyroots, tubers, rhizomes, corms and stems. They include pota-toes, sweet potatoes, cassava, yautia (cocoyam), taro (co-coyam), yams, roots and tubers nes.
Roundwood: All roundwood felled or otherwise harvested and re-moved. It comprises all wood obtained from removals, i.e.the quantities removed from forests and from trees outsidethe forest, including wood recovered from natural, felling andlogging losses during the period, calendar year or forest year.It includes: all wood removed with or without bark, including
wood removed in its round form, or split, roughly squared orin other form (e.g. branches, roots, stumps and burls (wherethese are harvested) and wood that is roughly shaped orpointed. In the production statistics, it represents the sum of:wood fuel, including wood for charcoal; sawlogs and veneerlogs; pulpwood, round and split; and other industrial round-wood. See www.fao.org/forestry/statistics/80570/en/ for fur-ther information.
Sawnwood: Wood that has been produced from both domesticand imported roundwood, either by sawing lengthways orby a profile-chipping process and that, with a few excep-tions, exceeds 5 mm in thickness. It includes: planks, beams,joists, boards, rafters, scantlings, laths, boxboards, sleep-ers and "lumber", etc., in the following forms: unplaned,
planed, grooved, tongued, fingerjointed, chamfered, rab-beted, V-jointed, beaded, etc. It excludes: wooden flooring.See www.fao.org/forestry/statistics/80570/en/ for further in-formation.
Sheep: Ovis spp.. See ’Cattle’. Includes uriel, argali, bighorn,karakul and astrakhan.
Sugar: Beta vulgaris var. altissima. In some producing countries,marginal quantities are consumed, either directly as food orin the preparation of jams.
Vegetable, including melons: Vegetables, as classified in thisgroup, are mainly annual plants cultivated as field and gar-den crops in the open and under glass, and used almost ex-clusively for food. Vegetables grown principally for animal
feed or seed should be excluded. Certain plants, normallyclassified as cereals and pulses, belong to this group whenharvested green, such as green maize, green peas, etc. Thisgrouping differs from international trade classifications forvegetables in that it includes melonsand watermelons, which
263
8/16/2019 Informe de la Fao 2013
http://slidepdf.com/reader/full/informe-de-la-fao-2013 282/307
are normally considered to be fruit crops. But, whereas fruitcrops are virtually all permanent crops, melons and water-melons are similar to vegetables in that they are temporarycrops. Chillies and green peppers are included in this group-ing when they are harvested for consumption as vegetablesand not processed into spices. FAO production data for greenpeas andgreenbeansreferto thetotal weightincluding pods,although some countries report on a shelled weight basis.The weight of the pods ranges from 40 to 50 percent for peas
to up to 70 percent for broad beans. Area data on small veg-etable gardens are often omitted in agricultural surveys, al-though production estimates may be reported. Trade data forfresh vegetables also include chilled vegetables, meaning thetemperature of the products has been reduced to around 0◦Cwithout the products being frozen.
Wheat: Triticum spp.: common (T. aestivum) durum (T. durum) spelt(T. spelta). Common and durum wheat are the main types.Among common wheat,the main varieties arespring andwin-ter, hard and soft, and redand white. At the national level, dif-ferent varieties should be reported separately, reflecting theirdifferent uses. Used mainly for human food.
Wood-based panels: The wood-based panels category is an aggre-
gate category. In the production and trade statistics, it rep-resents the sum of: veneer sheets, plywood, particle board,and fibreboard. See http://www.fao.org/forestry/62283/en/ for further information.
Wood pulp: Wood pulp is a fibrous material prepared from pulp-wood, wood chips, particles, residues or recovered paper bymechanical and/or chemical process for further manufactureinto paper, paperboard, fibreboard or other cellulose prod-ucts. In the production and trade statistics, it representsthe sum of: mechanical wood pulp; semi-chemical woodpulp; chemical wood pulp; and dissolving wood pulp. Seewww.fao.org/forestry/statistics/80570/en/ for fur ther infor-mation.
Woodfuel: Roundwood that will be used as fuel for purposes such
as cooking, heating or power production. It includes: woodharvested from main stems, branches and other parts of trees (where these are harvested for fuel) and wood thatwill be used for charcoal production (e.g. in pit kilns andportable ovens). The volume of roundwood used in char-coal production, is estimated by using a factor of 6.0 to con-vert from the weight (MT) of charcoal produced to the solidvolume (CUM) of roundwood used in production. It is re-ported in cubic meters underbark (i.e. excluding bark). Seewww.fao.org/forestry/statistics/80570/en/ for fur ther infor-mation.
264
8/16/2019 Informe de la Fao 2013
http://slidepdf.com/reader/full/informe-de-la-fao-2013 283/307
METADATA
Indicators
Agricultural area (ha)
Agricultural area is the sum of areas under ’Arable land’, and ’Perma-nent crops’, and ’Permanent pastures’.
Source: FAO, Statistics Division (FAOSTAT)
Owner: FAO
Referenced in: table 4
Agricultural area (share of total land)
See ’Agricultural area (ha)’.
Referenced in: chart 10, table 4
Agricultural population, total
Agricultural population is defined as all persons depending for theirlivelihood on agriculture, hunting, fishing and forestry. It comprisesall persons economically active in agriculture as well as their non-working dependents. It is not necessary that this referred populationexclusively come from rural population.
Source: FAO, Statistics Division (FAOSTAT)
Owner: FAO
Referenced in: chart 2, table 1
Agricultural tractors, total (tractors)
Agricultural tractors, total generally refer to total wheel, crawler ortrack-laying type tractors and pedestrian tractors used in agriculture.Data are available for numbers in use in the agricultural sector as of 2000. Data on import and export in value and number are also avail-able as of 1961.
Source: FAO, Statistics Division (FAOSTAT)
Owner: FAO
Referenced in: map 12, table 7
Agricultural water withdrawal (share of total water withdrawal)
Agricultural water withdrawalas percentage of total water withdrawal.
Source: Land and Water Division (AQUASTAT)
Owner: FAO
Referenced in: chart 97, table 44
Agricultural water withdrawal (m3 /yr)
Annual quantity of water withdrawn for irrigation, livestock and aqua-culture purposes. It includes renewable freshwater resources as wellas over-abstraction of renewable groundwater or withdrawal of fossilgroundwater, use of agricultural drainage water, (treated) wastewaterand desalinated water. .
Source: Land and Water Division (AQUASTAT)
Owner: FAO
Agriculture value added per worker (constant 2000 US$)
Agriculture valueadded per worker is a measure of agricultural produc-tivity. Value added in agriculture measures the output of the agricul-
tural sector (ISIC divisions 1-5) less the value of intermediate inputs.Agriculture comprises value added from forestry, hunting, and fishingas well as cultivation of crops and livestock production. Data are inconstant 2000 US$.
Source: World Bank (WDI)
Owner: Derived from World Bank national accounts files and FAO, Pro-duction Yearbook and data files.
Agriculture value added per worker p.a. growth (%)
See ’Agriculture value added per worker (constant 2000 US$)’ and’Growth’ in Concepts and Methods.
Referenced in: map 4
Agriculture, Forestry, Fishing, and Hunting, Cash (Budg. Cen. Govt.)(share of agricultural GDP)
See ’Government expenditure’ in Concepts and Methods.Source: FAO, Statistics Division (FAOSTAT)
Owner: FAO and IMF
Referenced in: table 10
Agriculture, Forestry, Fishing, and Hunting, Cash (Budg. Cen. Govt.)(share of total outlays)
See ’Government expenditure’ in Concepts and Methods.
Source: FAO, Statistics Division (FAOSTAT)
Owner: FAO and IMF
Referenced in: chart 21, table 10
Agriculture, Forestry, Fishing, and Hunting, Noncash (Budg. Cen.
Govt.) (share of agricultural GDP)See ’Government expenditure’ in Concepts and Methods.
Source: FAO, Statistics Division (FAOSTAT)
Owner: FAO and IMF
Referenced in: table 10
Agriculture, Forestry, Fishing, and Hunting, Noncash (Budg. Cen.Govt.) (share of total outlays)
See ’Government expenditure’ in Concepts and Methods.
Source: FAO, Statistics Division (FAOSTAT)
Owner: FAO and IMF
Referenced in: table 10
Agriculture, value added (share of GDP)
Agriculture corresponds to ISIC divisions 1-5 and includes forestry,hunting, and fishing, as well as cultivation of crops and livestock pro-duction. Value added is the net output of a sector after adding up alloutputs and subtracting intermediate inputs. It is calculated withoutmaking deductions for depreciation of fabricated assets or depletionand degradation of natural resources. The origin of value added is de-termined by the International Standard Industrial Classification (ISIC),revision 3. Note: For VAB countries, gross value added at factor cost isused as the denominator.
Source: World Bank (WDI)
Owner: World Bank national accounts data, and OECD National Ac-counts data files.
Referenced in: chart 6, map 5, table 3
All GHG agricultural sectors, total emissions in CO2eq (gigagrams)
Agriculture Total contains all the emissions produced in the differentagricultural emissions sub-domains, providing a picture of the con-tribution to the total amount of GHG emissions from agriculture. GHGEmissions from agriculture consist of non-CO2 gases, namely methane(CH4) and nitrous oxide (N2O), produced by crop and livestock produc-tion and management activities.
Source: FAO, Statistics Division (FAOSTAT)
Owner: FAO
Referenced in: map 67
Exports of animal fats (real 2005 US$)
Exports of animal fats in constant US$.
Source: FAO, Statistics Division (FAOSTAT)
Owner: FAO
Referenced in: chart 88
Aquaculture fish production (tonnes)
Aquaculture is defined as the farming of aquatic organisms. Farmingimplies some form of intervention in the rearing process to enhanceproduction, such as regular stocking, feeding, protection from preda-tors, etc. Farming also implies individual or corporate ownership of the stock being cultivated. For statistical purposes, aquatic organ-isms which are harvested by an individual or corporate body whichhas owned them throughout their rearing period contribute to aqua-culture, while aquatic organisms which are exploitable by the publicas a common property resource, with or without appropriate licenses,are the harvest of fisheries. In the case of capture-based aquaculture,only the incremental growth (or weight gain) in captivity, could andshould be reported as the production from aquaculture. Data includedhere covers an aquaculture production of fish, molluscs, crustaceansand miscellaneous aquatic animals but excluding production for ma-
rine mammals, crocodiles, corals, pearls, sponges and aquatic plants.Source: Fisheries and Aquaculture Department (Fishery and Aquacul-ture statistics)
Owner: FAO
Referenced in: map 48, table 36
265
8/16/2019 Informe de la Fao 2013
http://slidepdf.com/reader/full/informe-de-la-fao-2013 284/307
Aquaculture fish production inland (tonnes)
Aquaculture production from inland areas.
Source: Fisheries and Aquaculture Department (Fishery and Aquacul-ture statistics)
Owner: FAO
Referenced in: table 36
Aquaculture fish production marine (tonnes)
Aquaculture production from marine areas.
Source: Fisheries and Aquaculture Department (Fishery and Aquacul-ture statistics)
Owner: FAO
Referenced in: table 36
Aquaculture fish production p.a. growth (%)
See ’Aquaculture fish production(tonnes)’ and ’Growth’ in Concepts andMethods.
Referenced in: table 36
Aquaculture fish production per capita (tonne/cap)
See ’Aquaculture fish production (tonnes)’.
Referenced in: chart 78, chart 81
Arable land (share of agricultural area)
See ’Arable land (ha)’.
Referenced in: chart 11, table 4
Arable land (ha)
Arable land is the land under temporary agricultural crops (multiple-cropped areas are counted only once), temporary meadows for mowingor pasture, land under market and kitchen gardens and land temporar-ily fallow (less than five years). The abandoned land resulting fromshifting cultivation is not included in this category. Data for ’Arableland’ are not meant to indicate the amount of land that is potentiallycultivable.
Source: FAO, Statistics Division (FAOSTAT)
Owner: FAO
Arable land and permanent crops (ha)
This category is the sum of areas under ’Arable land’ and ’Permanentcrops’.
Source: FAO, Statistics Division (FAOSTAT)
Owner: FAO
Area under bioenergy crops (ha)
The assumed land area required to produce a given annual quantity of biofuel production.
Source: FAO
Owner: Based on IEA biofuel production dataReferenced in: chart 107
Average dietary supply adequacy (index)
The indicator expresses the Dietary Energy Supply (DES) as a percent-age of the Average Dietary Energy Requirement (ADER) in the coun-try. Each country’s or region’s average supply of calories for food con-sumption is normalized by the average dietary energy requirement es-timated for its population, to provide an index of adequacy of the foodsupply in terms of calories. Analyzed together with the prevalence of undernourishment, it allows discerning whether undernourishment ismainly due to insufficiency of the food supply or to particularly baddistribution. The indicator is calculated as an average over 3 years toreduce the impact of possible errors in estimated DES, due to the diffi-culties in properly accounting of stock variations in major food. It thus
provides an indicator of structural food supply adequacySource: FAO, Statistics Division
Owner: FAO
Referenced in: chart 29, table 15
Average protein supply (g/cap/day)
National average protein supply (expressed in grams per capita perday). As other indicators based on Food balance Sheets data, it is cal-culated on 3 year averages, to reduce the impact of errors in recordingof annual stock variations.
Source: FAO, Statistics Division
Owner: FAO
Referenced in: table 15
Average supply of protein of animal origin (g/cap/day)
National average protein supply (expressed in grams per capita perday). It includes the following groups: Meat; Offals; Animal Fats andProducts; Milk and Products; Eggs, Fish, Seafood and Products; and Ac-quatic Products, other. The indicator is calculated on 3 year averages.
Source: FAO, Statistics Division
Owner: FAO
Referenced in: table 15
Beef and buffalo meat (tonnes)
See ’Buffalos’, ’Meat, total’, and ’Production’ in Concepts and Methods.
Source: FAO, Statistics Division (FAOSTAT)
Owner: FAO
Referenced in: chart 69, chart 70, table 34
Beef and buffalo meat p.a. growth (%)
See ’Beef and buffalo meat (tonnes)’ and ’Growth’ in Concepts andMethods.
Referenced in: table 34
Beef and buffalo meat per capita (tonne/cap)
See ’Beef and buffalo meat (tonnes)’.
Referenced in: chart 71
Exports of beverages (real 2005 US$)
Exports of beverages in constant US$.
Source: FAO, Statistics Division (FAOSTAT)
Owner: FAO
Referenced in: chart 84, chart 90
Biofuel production (energy, kilotonne of oil equivalent)
Sum of ethanol and biodiesel production, reported in kilotonne of oilequivalent.
Source: IEA
Owner: Energy Balances of OECD Countries and Energy Balances of Non-OECD Countries, 2011 editions
Referenced in: chart 108, map 64, table 48
Bird species, threatened
Birds are listed for countries included within their breeding or winter-ing ranges. Threatened species are the number of species classified bythe IUCN as endangered, vulnerable, rare, indeterminate, out of dan-ger, or insufficiently known.
Source: World Bank (WDI)
Owner: United Nations Environmental Program and the World Conser-vation Monitoring Centre, and International Union for Conservation of Nature, Red List of Threatened Species.
Referenced in: chart 99, table 45
Burning crop residues, total emissions in CO2eq (gigagrams)
Greenhouse Gas (GHG) emissions from burning crop residues consistof methane and nitrous oxide gases produced by the combustion of apercentage of the crop residues burnt on-site.
Source: FAO, Statistics Division (FAOSTAT)
Owner: FAO
Referenced in: chart 114, table 49
Butter and ghee production (tonnes)See ’Butter and ghee’ and ’Production’ in Concepts and Methods.
Source: FAO, Statistics Division (FAOSTAT)
Owner: FAO
Referenced in: chart 75, table 35
266
8/16/2019 Informe de la Fao 2013
http://slidepdf.com/reader/full/informe-de-la-fao-2013 285/307
METADATA
Capture fish production (tonnes)
Capture fishery is defined as the hunting, collecting and gathering ac-tivities directed at removing or collecting live wild aquatic organisms.The capture productionstatistics here indicates the nominal catches of aquatic organisms, killed, caught, trapped or collected for all commer-cial, industrial, recreational and subsistence purposes in live weightequivalent. Data included here covers capture production of fish, mol-luscs, crustaceans and miscellaneous aquatic animals but excludingproduction for marine mammals, crocodiles, corals, pearls, sponges
and aquatic plants.Source: Fisheries and Aquaculture Department (Fishery and Aquacul-ture statistics)
Owner: FAO
Referenced in: map 47, table 36
Capture fish production inland (tonnes)
Capture fishery production from inland areas.
Source: Fisheries and Aquaculture Department (Fishery and Aquacul-ture statistics)
Owner: FAO
Referenced in: table 36
Capture fish production marine (tonnes)
Capture fishery production from marine areas.
Source: Fisheries and Aquaculture Department (Fishery and Aquacul-ture statistics)
Owner: FAO
Referenced in: table 36
Capture fish production p.a. growth (%)
See ’Capture fish production (tonnes)’ and ’Growth’ in Concepts andMethods.
Referenced in: table 36
Capture fish production per capita (tonne/cap)
See ’Capture fish production (tonnes)’.
Referenced in: chart 77, chart 81
Cattle and buffaloes (heads)
See ’Cattle’, ’Buffaloes’, and ’Stocks’ in Concepts and Methods.
Source: FAO, Statistics Division (FAOSTAT)
Owner: FAO
Referenced in: chart 65, map 44, chart 67
Cattle and buffaloes per ha of agricultural area (head/ha)
See ’Cattle and buffaloes (heads)’.
Referenced in: chart 101, table 46
Cereal exports (tonnes)
Exports (volume) of cereals.
Source: FAO, Statistics Division (FAOSTAT)
Owner: FAO
Referenced in: table 37
Cereal import dependency ratio (%)
Cereal imports/(cereal production + cereal import - cereal export). Theindicator is calculated on 3 year averages.
Source: Statistics Division
Owner: FAO
Referenced in: chart 39, table 17
Cereal imports (tonnes)
Imports (volume) of cereals.Source: FAO, Statistics Division (FAOSTAT)
Owner: FAO
Referenced in: table 37
Cereals harvested area (ha)
See ’Cereals’ and ’Crop area’ in Concepts and Methods.
Source: FAO, Statistics Division (FAOSTAT)
Owner: FAO
Referenced in: table 20
Cereals harvested area p.a. growth (%)
See ’Cereals harvestedarea (ha)’ and ’Growth’ in Conceptsand Methods.
Referenced in: table 20
Cereals production (tonnes)
See ’Cereals’ and ’Crop production’ in Concepts and Methods.
Source: FAO, Statistics Division (FAOSTAT)
Owner: FAO
Referenced in: map 34, table 20
Cereals production p.a. growth (%)
See ’Cereals production (tonnes)’ and ’Growth’ in Concepts and Meth-ods.
Referenced in: table 20
Cereals production per capita (tonne/cap)
See ’Cereals production (tonnes)’.
Referenced in: chart 55
Cereals yield (hg/ha)
See ’Cereals’ and ’Crop yield’ in Concepts and Methods.
Source: FAO, Statistics Division (FAOSTAT)
Owner: FAO
Referenced in: table 20
Cereals yield p.a. growth (%)
See ’Cereals yield (hg/ha)’ and ’Growth’ in Concepts and Methods.
Referenced in: table 20
Change in life expectancy at birth, total (years)
See ’Life expectancy at birth, total (years)’.
Referenced in: chart 5
Cheese (all kinds) production (tonnes)
See ’Cheese (all kinds)’ and ’Production’ in Concepts and Methods.
Source: FAO, Statistics Division (FAOSTAT)
Owner: FAO
Referenced in: chart 74, table 35
Children in employment, total (share of children ages 7-14)
Children in employment refer to children involved in economicactivityfor at least one hour in the reference week of the survey.
Source: World Bank (WDI)
Owner: Understanding Children’s Work Project based on data from ILO,UNICEF and the World Bank.
Referenced in: map 10, table 6
Citrus fruit harvested area (ha)
See ’Citrus fruit’ and ’Crop area’ in Concepts and Methods.
Source: FAO, Statistics Division (FAOSTAT)
Owner: FAO
Referenced in: table 31
Citrus fruit harvested area p.a. growth (%)
See ’Citrus fruitharvested area(ha)’ and ’Growth’ in Concepts andMeth-ods.
Owner: FAO
Referenced in: table 31
267
8/16/2019 Informe de la Fao 2013
http://slidepdf.com/reader/full/informe-de-la-fao-2013 286/307
Citrus fruit production (tonnes)
See ’Citrus fruit’ and ’Crop production’ in Concepts and Methods.
Source: FAO, Statistics Division (FAOSTAT)
Owner: FAO
Referenced in: table 31
Citrus fruit production p.a. growth (%)
See ’Citrus fruit production (tonnes)’ and ’Growth’ in Concepts andMethods.
Referenced in: table 31
Citrus fruit yield (hg/ha)
See ’Citrus fruit’ and ’Crop yield’ in Concepts and Methods.
Source: FAO, Statistics Division (FAOSTAT)
Owner: FAO
Referenced in: table 31
Citrus fruit yield p.a. growth (%)
See ’Citrus fruit yield (hg/ha)’ and ’Growth’ in Concepts and Methods.
Referenced in: table 31
Coarse grain harvested area (ha)
See ’Coarse grain’ and ’Crop area’ in Concepts and Methods.
Source: FAO, Statistics Division (FAOSTAT)
Owner: FAO
Referenced in: table 21
Coarse grain harvested area p.a. growth (%)
See ’Coarse grain harvested area (ha)’ and ’Growth’ in Concepts andMethods.
Referenced in: table 21
Coarse grain production (tonnes)
See ’Coarse grain’ and ’Crop production’ in Concepts and Methods.
Source: FAO, Statistics Division (FAOSTAT)Owner: FAO
Referenced in: map 35, table 21
Coarse grain production p.a. growth (%)
See ’Coarse grain production (tonnes)’ and ’Growth’ in Concepts andMethods.
Referenced in: table 21
Coarse grain production per capita (tonne/cap)
See ’Coarse grain production (tonnes)’.
Referenced in: chart 56
Coarse grain yield (hg/ha)See ’Coarse grain’ and ’Crop yield’ in Concepts and Methods.
Source: FAO, Statistics Division (FAOSTAT)
Owner: FAO
Referenced in: table 21
Coarse grain yield p.a. growth (%)
See ’Coarse grain yield (hg/ha)’ and ’Growth’ in Concepts and Methods.
Referenced in: table 21
CPIA business regulatory environment rating (1=low to 6=high)
Business regulatory environment assesses the extent to which the le-gal, regulatory, and policy environments help or hinder private busi-nesses in investing, creating jobs, and becoming more productive.
Source: World Bank (WDI)
Owner: World Bank Group, CPIA database(http://www.worldbank.org/ida).
Referenced in: table 11
Credit to agriculture (current LCU)
Credit to Agriculture fromthe banking system includes farmcredit ded-icated to financing agricultural related activities such as input supply(for seed, fertilizers, irrigation, machinery, implements etc.), produc-tion, distribution, wholesale, processing and marketing activities thatsupport commercialized agricultural production. It may also include“bridging” farmer’s incomes which are seasonal and working expensesthat are spread over time. For example, the seasonal nature of pro-duction and the dependence on biological processes and natural re-
sources leaves producers subject to events beyond their control suchas droughts, floods or diseases.
Source: FAO, Statistics Division
Owner: FAO
Credit to agriculture, share of agriculture value added (%)
See ’Credit to agriculture (current LCU)’.
Referenced in: chart 18
Crop residues, total emissions in CO2eq (gigagrams)
Greenhouse Gas (GHG) emissions from crop residues consist of nitrousoxidegas from decomposition ofnitrogenin crop residues left on man-aged soils.
Source: FAO, Statistics Division (FAOSTAT)
Owner: FAO
Referenced in: chart 114, table 49
Cropland per capita (ha)
See ’Arable land and permanent crops (ha)’.
Referenced in: map 6, table 4
Crops Gross Production Index Number (2004-2006 = 100)
See ’Agricultural production indices’ in Concepts and Methods.
Source: FAO, Statistics Division (FAOSTAT)
Owner: FAO
Referenced in: chart 53, map 32
Cultivated organic soils in CO2eq (gigagrams)
Sum of ’Cultivated organic soils, total emissions in CO2eq (gigagrams)’and ’Cultivated organic soils, net emissions/removal in CO2eq (giga-grams)’.
Owner: FAO
Referenced in: chart 113
Cultivated organic soils, total emissions in CO2eq (gigagrams)
Greenhouse gas (GHG) emissions from manure applied to soils consistof nitrous oxide gas from nitrogen additions to managed soils from
treated manure.Source: FAO, Statistics Division (FAOSTAT)
Owner: FAO
Referenced in: chart 114, table 49
Dairy products (milk equivalent) exports (tonnes)
Exports (volume) of dairy products (milk equivalent).
Source: FAO, Statistics Division (FAOSTAT)
Owner: FAO
Referenced in: table 39
Dairy products (milk equivalent) imports (tonnes)
Imports (volume) of dairy products (milk equivalent).Source: FAO, Statistics Division (FAOSTAT)
Owner: FAO
Referenced in: table 39
268
8/16/2019 Informe de la Fao 2013
http://slidepdf.com/reader/full/informe-de-la-fao-2013 287/307
METADATA
Depth of the food deficit (kcal/cap/day)
The depth of the food deficit indicates how many calories would beneeded to lift the undernourished from their status, everything elsebeing constant. The average intensity of food deprivation of the un-dernourished, estimated as the difference between the average dietaryenergy requirement and the average dietary energy consumption of the undernourished population (food-deprived), is multiplied by thenumber of undernourished to provide an estimate of the total fooddeficit in the country, which is then normalized by the total popula-
tion. The indicator is calculated as an average over 3 years.Source: Statistics Division
Owner: FAO
Referenced in: chart 24, table 12
Domestic food price volatility (index)
The Domestic Food Price Volatility is a measure of variation of theDomestic FoodPrice Level Index. It has beencomputed as the StandardDeviation (SD) of the deviations from the trend over the previous fiveyears.
Source: Statistics Division
Owner: ILO and World Bank ICP (International Comparison Project)
Referenced in: chart 40, chart 42, chart 43
Droughts, floods, extreme temperatures (share of population affected,average 1990-2009)
Droughts, floods and extreme temperatures is the annual average per-centage of the population that is affected by natural disasters clas-sified as either droughts, floods, or extreme temperature events. Adrought is an extended period of time characterized by a deficiencyin a region’s water supply that is the result of constantly below aver-age precipitation. A drought can lead to losses to agriculture, affectinland navigation and hydropower plants, and cause a lack of drink-ing water and famine. A flood is a significant rise of water level in astream, lake, reservoir or coastal region. Extreme temperature eventsare either cold waves or heat waves. A cold wave can be both a pro-longed period of excessively cold weather and the sudden invasion of very cold air over a large area. Along with frost it can cause damage toagriculture, infrastructure, and property. A heat wave is a prolongedperiod of excessively hot and sometimes also humid weather relative
to normal climate patterns of a certain region. Population affectedis the number of people injured, left homeless or requiring immedi-ate assistance during a period of emergency resulting from a naturaldisaster; it can also include displaced or evacuated people. Averagepercentage of population affected is calculated by dividing the sum of total affected for the periodstated bythe sumof the annualpopulationfigures for the period stated.
Source: World Bank (WDI)
Owner: EM-DAT: The OFDA/CRED International Disaster Database:www.emdat.be, Universit Catholique de Louvain, Brussels (Belgium),World Bank.
Referenced in: chart 47, map 29, table 19
Eggs primary production (tonnes)
See ’Eggs primary’ and ’Production’ in Concepts and Methods.
Source: FAO, Statistics Division (FAOSTAT)Owner: FAO
Referenced in: chart 73, table 35
Eggs primary production p.a. growth (%)
See ’Eggs primary production (tonnes)’ and ’Growth’ in Concepts andMethods.
Referenced in: table 35
Employees, agriculture, female (share of female employment)
See ’Female employment, total’.
Source: World Bank (WDI)
Referenced in: chart 14, table 6
Employees, agriculture, male (share of male employment)
See ’Female employment, total’.
Source: World Bank (WDI)
Referenced in: table 6
Employment in agriculture (share of total employment)
See ’Employment, total’.
Source: World Bank (WDI)
Referenced in: map 9, table 6
Employment in industry (share of total employment)
See ’Employment, total’.
Source: World Bank (WDI)
Employment in services (share of total employment)
See ’Employment, total’.
Source: World Bank (WDI)
Employment, total
Employees are people who work for a public or private employer andreceive remuneration in wages, salary, commission, tips, piece rates,or pay in-kind.
Source: World Bank
Owner: InternationalLabourOrganization, Key Indicators of the LabourMarket (KILM) database.
Enteric fermentation, total emissions in CO2eq (gigagrams)
Greenhouse gas (GHG) emissions from enteric fermentation consistof methane gas produced in digestive systems of ruminants and to alesser extent of non-ruminants.
Source: FAO, Statistics Division (FAOSTAT)
Owner: FAO
Referenced in: chart 114, table 49
Environmental Protection, Cash (Budg. Cen. Govt.) (share of total out-lays)
See ’Government expenditure’ in Concepts and Methods.
Source: FAO, Statistics Division (FAOSTAT)
Referenced in: table 10
Environmental Protection, Noncash (Budg. Cen. Govt.) (share of totaloutlays)
See ’Government expenditure’ in Concepts and Methods.
Source: FAO, Statistics Division (FAOSTAT)
Referenced in: table 10
Evaporated and condensed milk production (tonnes)
See ’Evaporated and condensed milk’ and ’Production’ in Concepts andMethods.
Source: FAO, Statistics Division (FAOSTAT)
Owner: FAO
Referenced in: chart 76, table 35
Export of forest products (US$)
See ’Forest products’ in Concepts and Methods.
Source: FAO, Statistics Division (FAOSTAT)
Owner: FAO
Referenced in: chart 95
Export of roundwood (m3)
See ’Roundwood’ in Concepts and Methods.
Source: FAO, Statistics Division (FAOSTAT)
Owner: FAO
Referenced in: table 42
Exports of animal fats (US$)
Value of exports of animal fats in current US$.
Source: FAO, Statistics Division (FAOSTAT)
Owner: FAO
269
8/16/2019 Informe de la Fao 2013
http://slidepdf.com/reader/full/informe-de-la-fao-2013 288/307
Exports of animal fats (constant 2005 US$)
See ’Exports of animal fats (US$)’ and ’MUV’ in Concepts and Methods.
Source: FAO, Statistics Division (FAOSTAT) and World Bank
Owner: FAO, Statistics Division (FAOSTAT) and World Bank
Referenced in: chart 88
Exports of beverages (US$)
Value of exports of beverages in current US$.
Source: FAO, Statistics Division (FAOSTAT)Owner: FAO
Exports of beverages (constant 2005 US$)
See ’Exports of beverages (US$)’ and ’MUV’ in Concepts and Methods.
Source: FAO, Statistics Division (FAOSTAT) and World Bank
Owner: FAO, Statistics Division (FAOSTAT) and World Bank
Referenced in: chart 84, chart 90
Exports of cereals (US$)
Value of exports of cereals in current US$.
Source: FAO, Statistics Division (FAOSTAT)
Owner: FAO
Exports of cereals and prep. (US$)
Value of exports of cereals and prep. in current US$.
Source: FAO, Statistics Division (FAOSTAT)
Owner: FAO
Exports of cereals and prep. (constant 2005 US$)
See ’Exports of cereals and prep. (US$)’ and ’MUV’ in Concepts andMethods.
Source: FAO, Statistics Division (FAOSTAT) and World Bank
Owner: FAO, Statistics Division (FAOSTAT) and World Bank
Referenced in: chart 84, chart 85
Exports of coffee, tea, cocoa, and spices (US$)
Value of exports of coffee, tea, cocoa, and spices in current US$.Source: FAO, Statistics Division (FAOSTAT)
Owner: FAO
Exports of coffee, tea, cocoa, and spices (US$)
See ’Exports of coffee, tea, cocoa, and spices (US$)’ and ’MUV’ in Con-cepts and Methods.
Source: FAO, Statistics Division (FAOSTAT) and World Bank
Owner: FAO, Statistics Division (FAOSTAT) and World Bank
Referenced in: chart 84, chart 89
Exports of dairy products (milk equivalent) (US$)
Value of exports of milk equivalent in current US$.
Source: FAO, Statistics Division (FAOSTAT)
Owner: FAO
Exports of dairy products (milk equivalent) (constant 2005 US$)
See ’Exports of dairy products (milk equivalent) (US$)’ and ’MUV’ inConcepts and Methods.
Source: FAO, Statistics Division (FAOSTAT) and World Bank
Owner: FAO, Statistics Division (FAOSTAT) and World Bank
Referenced in: chart 84, chart 87
Exports of fish (US$)
Value of exports of fish in current US$ (data reported include fish,molluscs, crustaceans, and miscellaneous aquatic animals but exclud-ing marine mammals, crocodiles, corals, pearls, sponges and aquaticplants, miscellaneous aquatic animal products and fish waste).
Source: Fisheries and Aquaculture Department (Fishery and Aquacul-ture statistics)
Owner: FAO
Referenced in: table 40
Exports of fish (constant 2005 US$)
See ’Exports of fish (US$)’ and ’MUV’ in Concepts and Methods.
Source: Fisheries and Aquaculture Department (Fishery and Aquacul-ture statistics) and World Bank
Owner: Fisheries and Aquaculture Department (Fishery and Aquacul-ture statistics) and World Bank
Referenced in: chart 84, chart 87
Exports of food (US$)
Value of exports of food in current US$.
Source: FAO, Statistics Division (FAOSTAT)
Owner: FAO
Exports of fruit and vegetables (US$)
Value of exports of fruit and vegetables in current US$.
Source: FAO, Statistics Division (FAOSTAT)
Owner: FAO
Exports of fruit and vegetables (constant 2005 US$)
See ’Exports of fruit and vegetables (US$)’ and ’MUV’ in Concepts andMethods.
Source: FAO, Statistics Division (FAOSTAT) and World BankOwner: FAO, Statistics Division (FAOSTAT) and World Bank
Referenced in: chart 82, chart 84
Exports of meat and meat prep. (US$)
Value of exports of meat and meat prep. in current US$.
Source: FAO, Statistics Division (FAOSTAT)
Owner: FAO
Exports of meat and meat prep. (constant 2005 US$)
See ’Exports of meat and meat prep. (US$)’ and ’MUV’ in Concepts andMethods.
Source: FAO, Statistics Division (FAOSTAT) and World Bank
Owner: FAO, Statistics Division (FAOSTAT) and World BankReferenced in: chart 84, chart 87
Exports of oilseeds (US$)
Value of exports of oilseeds in current US$.
Source: FAO, Statistics Division (FAOSTAT)
Owner: FAO
Exports of oilseeds (constant 2005 US$)
See ’Exports of oilseeds (US$)’ and ’MUV’ in Concepts and Methods.
Source: FAO, Statistics Division (FAOSTAT) and World Bank
Owner: FAO, Statistics Division (FAOSTAT) and World Bank
Referenced in: chart 84, chart 86
Exports of sugar and honey (US$)
Value of exports of sugar and honey in current US$.
Source: FAO, Statistics Division (FAOSTAT)
Owner: FAO
Exports of sugar and honey (constant 2005 US$)
See ’Exports of sugar and honey (US$)’ and ’MUV’ in Concepts andMethods.
Source: FAO, Statistics Division (FAOSTAT) and World Bank
Owner: FAO, Statistics Division (FAOSTAT) and World Bank
Referenced in: chart 84, chart 86
Exports of veg. oils (US$)
Value of exports of veg. oils in current US$.
Source: FAO, Statistics Division (FAOSTAT)
Owner: FAO
270
8/16/2019 Informe de la Fao 2013
http://slidepdf.com/reader/full/informe-de-la-fao-2013 289/307
METADATA
Exports of veg. oils (constant 2005 US$)
See ’Exports of veg. oils (US$)’ and ’MUV’ in Concepts and Methods.
Source: FAO, Statistics Division (FAOSTAT) and World Bank
Owner: FAO, Statistics Division (FAOSTAT) and World Bank
Referenced in: chart 83, chart 84
Fat supply quantity in crops primary equivalent (g/cap/day)
See ’Per capita supply’ in Concepts and Methods.
Source: FAO, Statistics Division (FAOSTAT)
Owner: FAO
Referenced in: chart 50, chart 52
FDI inflows - Agriculture, hunting, forestry, fishing (current US$)
Inflows of foreign direct investment (FDI) in agriculture, hunting,forestry, and fishing.
Source: Foreign agriculture investment database
Owner: UNCTAD
Referenced in: table 9
FDI inflows - Agriculture, hunting, forestry, fishing + Food, beverages,tobacco (current US$)
Inflows of foreign direct investment (FDI) in agriculture, hunting,forestry, and fishing + food, beverages, tobacco.
Source: Foreign agriculture investment database
Owner: UNCTAD
Referenced in: map 13
FDI inflows - Food, beverages, tobacco (current US$)
Inflows of foreign direct investment (FDI) in food, beverages, tobacco.
Source: Foreign agriculture investment database
Owner: UNCTAD
Referenced in: table 9
Female employment, total
Employees are people who work for a public or private employer andreceive remuneration in wages, salary, commission, tips, piece rates,or pay in kind.
Source: World Bank
Owner: International Labour Organization,Key Indicators of the LabourMarket database.
Referenced in: table 6
Fertility rate, total (births per woman)
Total fertility rate represents the number of children who would beborn to a woman if she were to live to the end of her childbearingyears and bear children in accordance withcurrent age-specific fertilityrates.
Source: World Bank (WDI)
Owner: UNPD World Population Prospects 2010
Fibre crop harvested area (ha)
See ’Fibre crops’ and ’Crop area’ in Concepts and Methods.
Source: FAO, Statistics Division (FAOSTAT)
Owner: FAO
Referenced in: table 32
Fibre crop harvested area p.a. growth (%)
See ’Fibre crops harvested area (ha)’ and ’Growth’ in Concepts andMethods.
Referenced in: table 32
Fibre crop production p.a. growth (%)
See ’Fibre crops production (tonnes)’ and ’Growth’ in Concepts andMethods.
Referenced in: table 32
Fibre crop yield (hg/ha)
See ’Fibre crops’ and ’Crop yield’ in Concepts and Methods.
Source: FAO, Statistics Division (FAOSTAT)
Owner: FAO
Referenced in: table 32
Fibre crop yield p.a. growth (%)
See ’Fibre crops yield (hg/ha)’ and ’Growth’ in Concepts and Methods.
Referenced in: table 32
Fibre crops primary production (tonnes)
See ’Fibre crops primary’ and ’Production’ in Concepts and Methods.
Source: FAO, Statistics Division (FAOSTAT)
Owner: FAO
Referenced in: table 48
Fibre crops primary production p.a. growth (%)
See ’Fibre crops primary production (tonnes)’ and ’Growth’ in Conceptsand Methods.
Referenced in: table 48
Fibre crops production (tonnes)
See ’Fibre crops’ and ’Crop production’ in Concepts and Methods.Source: FAO, Statistics Division (FAOSTAT)
Owner: FAO
Referenced in: table 32
Fish species, threatened
Fish species are based on Froese, R. and Pauly, D. (eds). 2008. Threat-ened species are the number of species classified by the IUCN as en-dangered, vulnerable, rare, indeterminate, out of danger, or insuffi-ciently known.
Source: World Bank (WDI)
Owner: Froese, R. and Pauly, D. (eds). 2008. FishBase database,www.fishbase.org.
Referenced in: chart 99, table 45
Fixed broadband Internet subscribers (per 100 people)
Fixed broadband Internet subscribers are the number of broadbandsubscribers with a digital subscriber line, cable modem, or other high-speed technology.
Source: World Bank (WDI)
Owner: International Telecommunication Union, World Telecommuni-cation/ICT Development Report and database, and World Bank esti-mates.
Referenced in: chart 23, table 11
Food Gross per capita production index number (2004-2006 = 100)
See ’Agricultural production indices’ in Concepts and Methods.
Source: FAO, Statistics Division (FAOSTAT)
Owner: FAO
Referenced in: chart 54, map 33
Food Price Level Index (index)
TheDomesticFood Price Level Indexis calculated by dividing theFoodPurchasing Power Parity (FPPP) by the General PPP, thus providing anindex of the price of food in the country relative to the price of thegeneric cosnumption basket. Data are available for 2005 from the ICPProgram . It is then extended to other years by adjusting both nu-merator and denominator using the relative chenges in Food CPI andGeneral CPI as provided by ILO.
Source: Statistics Division
Owner: ILO and World Bank ICP (International Comparison Project)
Referenced in: chart 34, chart 35, table 16
Food supply in crops primary equivalent (kcal/cap/day)See ’Per capita supply’ in Concepts and Methods.
Source: FAO, Statistics Division (FAOSTAT)
Owner: FAO
Referenced in: chart 49, map 31
271
8/16/2019 Informe de la Fao 2013
http://slidepdf.com/reader/full/informe-de-la-fao-2013 290/307
Foreign direct investment, net inflows (% of GDP)
Foreign direct investment are the net inflows of investment to acquirea lasting management interest (10 percent or more of voting stock)in an enterprise operating in an economy other than that of the in-vestor. It is the sum of equity capital, reinvestment of earnings, otherlong-term capital, and short-term capital as shown in the balance of payments. This series shows net inflows (new investment inflows lessdisinvestment) in the reporting economy from foreign investors, andis divided by GDP.
Source: World Bank (WDI)Owner: International Monetary Fund, International Financial Statisticsand Balance of Payments databases, World Bank, Global DevelopmentFinance, and World Bank and OECD GDP estimates.
Referenced in: chart 7, table 3
Forest area (share of total land)
See ’Forest area (ha)’.
Referenced in: chart 10, table 4, map 55, table 41
Forest area (ha)
Forest area is the land spanning more than 0.5 hectares with treeshigher than 5 meters and a canopy cover of more than 10 percent, ortrees able to reach these thresholds in situ. It does not include landthat is predominantly under agricultural or urban land use. Forest is
determined both by the presence of trees and the absence of otherpredominant land uses. The trees should be able to reach a minimumheight of 5 metres (m) in situ. Areas under reforestation that have notyetreached butare expectedto reach a canopycover of 10 percent anda tree height of 5 m are included, as are temporarily unstocked areas,resulting from human intervention or natural causes, which are ex-pected to regenerate. Includes: areaswith bamboo andpalms providedthat height and canopy cover criteria are met; forest roads, firebreaksand other small open areas; forest in national parks, nature reservesand otherprotected areas such as thoseof specific scientific, historical,cultural or spiritual interest; windbreaks, shelterbelts and corridors of trees with an area of more than 0.5 ha and width of more than 20 m;plantations primarily used for forestry or protective purposes, such as:rubber-wood plantations and cork, oak stands. Excludes: treestands inagricultural production systems, for example in fruit plantations andagroforestry systems. The term also excludes trees in urban parks and
gardens.Source: FAO, Statistics Division (FAOSTAT)
Owner: FAO
Referenced in: table 41
Forest area p.a. growth (%)
See ’Forest area (ha)’ and ’Growth’ in Concepts and Methods.
Referenced in: chart 91
Fruit harvested area (ha)
See ’Fruit, excluding melons’ and ’Crop area’ in Concepts and Methods.
Source: FAO, Statistics Division (FAOSTAT)
Owner: FAO
Referenced in: table 30
Fruit harvested area p.a. growth (%)
See ’Fruit harvested area (ha)’ and ’Growth’ in Concepts and Methods.
Referenced in: table 30
Fruit production p.a. growth (%)
See ’Fruit production (tonnes)’ and ’Growth’ in Concepts and Methods.
Referenced in: table 30
Fruit production, excluding melons (tonne/cap)
See ’Fruit production (tonnes)’.
Referenced in: chart 63
Fruit production, excluding melons (tonnes)
See ’Fruit, excluding melons’ and ’Crop production’ in Concepts andMethods.
Source: FAO, Statistics Division (FAOSTAT)
Owner: FAO
Referenced in: map 42, table 30
Fruit yield (hg/ha)
See ’Fruit, excluding melons’ and ’Crop yield’ in Concepts and Methods.
Source: FAO, Statistics Division (FAOSTAT)
Owner: FAO
Referenced in: table 30
Fruit yield p.a. growth (%)
See ’Fruit yield (hg/ha)’ and ’Growth’ in Concepts and Methods.
Referenced in: table 30
Fungicides and Bactericides use (tonnes)
See ’Total pesticides use (tonnes)’.
Source: FAO, Statistics Division (FAOSTAT)
GDP (current US$)
GDP at purchaser’s prices is the sum of gross value added by all resi-dent producers in the economy plus any product taxes and minus anysubsidies not included in the value of the products. It is calculatedwithout making deductions for depreciation of fabricated assets or fordepletion and degradation of natural resources. Data are in currentUS$. Dollar figures for GDP are converted from domestic currenciesusing single year official exchange rates. For a few countries wherethe official exchange rate does not reflect the rate effectively applied
to actual foreign exchange transactions, an alternative conversion fac-tor is used.
Source: World Bank (WDI)
Owner: World Bank national accounts data, and OECD National Ac-counts data files.
Referenced in: table 3
GINI index
Gini index measures the extent to which the distribution of income (or,in some cases, consumption expenditure) among individuals or house-holds within an economy deviates from a perfectly equal distribution.A Lorenz curve plots the cumulative percentages of total income re-ceived against the cumulative number of recipients, starting with thepoorest individual or household. The Gini index measures the areabetween the Lorenz curve and a hypothetical line of absolute equality,
expressed as a percentage of the maximum area under the line. Thusa Gini index of 0 represents perfect equality, while an index of 100implies perfect inequality.
Source: World Bank (WDI)
Owner: World Bank, Development Research Group. Data are basedon primary household survey data obtained from government sta-tistical agencies and World Bank country departments. Data forhigh-income economies are from the Luxembourg Income Studydatabase. For more information and methodology, please see Povcal-Net (http://iresearch.worldbank.org/PovcalNet/index.htm).
Referenced in: chart 28, table 14
Global 5-Year running mean land-ocean temperature index (degreeCelsius)
Global 5-years running mean land-ocean temperature index, withbase
period 1951-1980.Source: NASA, GISS Surface Temperature Analysis
Owner: NASA
Referenced in: chart 110
Global annual mean land-ocean temperature index (degree Celsius)
Global annual mean land-ocean temperature index, with base period1951-1980.
Source: NASA, GISS Surface Temperature Analysis
Owner: NASA
Referenced in: chart 110
Global annual mean land-ocean temperature index, low latitudes23.6N-23.6S (degree Celsius)
Global annual mean land-ocean temperature index, low latitudes23.6N-23.6S with base period 1951-1980.
Source: NASA, GISS Surface Temperature Analysis
Owner: NASA
Referenced in: chart 111
272
8/16/2019 Informe de la Fao 2013
http://slidepdf.com/reader/full/informe-de-la-fao-2013 291/307
METADATA
Global annual mean land-ocean temperature index, northern latitudes90N-23.6N (degree Celsius)
Global annual mean land-ocean temperature index, northern latitudes90N-23.6N with base period 1951-1980.
Source: NASA, GISS Surface Temperature Analysis
Owner: NASA
Referenced in: chart 111
Global annual mean land-ocean temperature index, southern latitudes23.6S-90S (degree Celsius)
Global annual mean land-ocean temperature index, southern latitudes23.6S-90S with base period 1951-1980.
Source: NASA, GISS Surface Temperature Analysis
Owner: NASA
Referenced in: chart 111
GNI per capita p.a. growth (%)
GNI per capita is gross national income divided by mid-year popula-tion. GNI (formerly GNP) is the sum of value added by all residentproducers plus any product taxes (less subsidies) not included in thevaluation of output plus net receipts of primary income (compensationof employees and property income) from abroad.
Source: World Bank (WDI)
Owner: World Bank national accounts data, and OECD National Ac-counts data files.
Referenced in: map 2
GNI per capita, Atlas method (current US$)
GNI per capita (formerly GNP per capita) is the gross national income,converted to US$ using the World Bank Atlas method, divided by themidyear population. GNI is the sum of value added by all residentproducers plus any product taxes (less subsidies) not included in thevaluation of output plus net receipts of primary income (compensa-tion of employees and property income) from abroad. GNI, calculatedin national currency, is usually converted to US$ at official exchangerates for comparisons across economies, although an alternative rateis
used when the official exchange rate is judged to diverge by an excep-tionally large margin from the rate actually applied in internationaltransactions. To smooth fluctuations in prices and exchange rates, aspecial Atlas method of conversion is used by the World Bank. This ap-plies a conversion factor that averages the exchange rate for a givenyear and the two preceding years, adjusted for differences in rates of inflation between the country, and through 2000, the G-5 countries(France, Germany, Japan, the United Kingdom, and the United States).From 2001, these countries include the Euro area, Japan, the UnitedKingdom, and the United States.
Source: World Bank (WDI)
Owner: World Bank national accounts data, and OECD national ac-counts data files.
Referenced in: table 2
GNI, Atlas method (current US$)
GNI (formerly GNP) is the sum of value added by all resident producersplus any product taxes (less subsidies) not included in the valuationof output plus net receipts of primary income (compensation of em-ployees and property income) from abroad. Data are in current US$.GNI, calculated in national currency, is usually converted to US$ at of-ficial exchange rates for comparisons across economies, although analternative rate is used when the official exchange rate is judged todiverge by an exceptionally large margin from the rate actually ap-plied in international transactions. To smooth fluctuations in pricesand exchange rates, a special Atlas method of conversion is used bythe World Bank. This applies a conversion factor that averages theexchange rate for a given year and the two preceding years, adjustedfor differences in rates of inflation between the country, and through2000, the G-5 countries (France, Germany, Japan, the United Kingdom,and the United States). From 2001, these countries include the Euroarea, Japan, the United Kingdom, and the United States.
Source: World Bank (WDI)
Owner: World Bank national accounts data, and OECD National Ac-counts data files.
Gross capital stock (constant 2005 prices)
The estimate of capital stock in agriculture refers to a value that is at-tached to the total physical capital capacity available for repeated usein the production of other goods, in existence at specific point in timein the economy of agriculture sector. The estimates of investment inagriculture have indirectly been derived by the FAO Statistics Divisionusingphysical dataon livestock, tractors,irrigatedland and land underpermanent crops etc., and the average prices for the year 1995. Thesedata enabled the derivation of the capital stock in agriculture which
is the gross, and the annual change in the latter is taken to reflectinvestment in agriculture.
Source: FAO, Statistics Division (FAOSTAT)
Owner: FAO
Referenced in: table 8
Gross capital stock p.a. growth (%)
See ’Gross capital stock (constant 2005 prices)’ and ’Growth’ in Con-cepts and Methods.
Referenced in: table 8
Gross capital stock, land development (% gross capital stock)
See ’Gross capital stock (constant 2005 prices)’.
Referenced in: chart 20, table 8
Gross capital stock, livestock fixed assets (% gross capital stock)
See ’Gross capital stock (constant 2005 prices)’.
Owner: FAO
Referenced in: chart 20, table 8
Gross capital stock, livestock inventory (% gross capital stock)
See ’Gross capital stock (constant 2005 prices)’.
Owner: FAO
Referenced in: chart 20, table 8
Gross capital stock, machinery & equipment (% gross capital stock)
See ’Gross capital stock (constant 2005 prices)’.
Owner: FAO
Referenced in: chart 20, table 8
Gross capital stock, plantation crops (% gross capital stock)
See ’Gross capital stock (constant 2005 prices)’.
Owner: FAO
Referenced in: chart 20, table 8
Gross capital stock, structures for livestock (% gross capital stock)
See ’Gross capital stock (constant 2005 prices)’.
Owner: FAO
Referenced in: chart 20, table 8
Health expenditure, total (% of GDP)
Total healthexpenditure is thesum ofpublic andprivatehealth expen-
diture. It covers the provision of health services (preventive and cura-tive), family planning activities, nutritionactivities, and emergency aiddesignated for health but does not include provision of water and san-itation.
Source: World Bank (WDI)
Owner: World Health Organization National Health Account database(see http://apps.who.int/nha/database for the most recent updates).
Referenced in: chart 46, table 18
Herbicides use (tonnes)
See ’Total pesticides use (tonnes)’.
Source: FAO, Statistics Division (FAOSTAT)
Owner: FAO
Import of forest products (US$)See ’Forest products’ in Concepts and Methods.
Source: FAO, Statistics Division (FAOSTAT)
Owner: FAO
Referenced in: chart 96
273
8/16/2019 Informe de la Fao 2013
http://slidepdf.com/reader/full/informe-de-la-fao-2013 292/307
Import of roundwood (m3)
See ’Roundwood’ in Concepts and Methods.
Source: FAO, Statistics Division (FAOSTAT)
Owner: FAO
Referenced in: table 42
Import value index (2004-2006 = 100)
Import value index.Source: FAO, Statistics Division (FAOSTAT)
Owner: FAO
Referenced in: map 50
Imports of fish (US$)
Value of imports of fish in current US$ (data reported include fish,molluscs, crustaceans, and miscellaneous aquatic animals but exclud-ing marine mammals, crocodiles, corals, pearls, sponges and aquaticplants, miscellaneous aquatic animal products and fish waste).
Source: Fisheries and Aquaculture Department (Fishery and Aquacul-ture statistics)
Owner: FAO
Referenced in: table 40
Income share held by highest 20%
Percentageshareof incomeor consumptionis thesharethataccruestosubgroups of population indicated by deciles or quintiles. Percentageshares by quintile may not sum to 100 because of rounding.
Source: World Bank (WDI)
Owner: World Bank, Development Research Group. Data are basedon primary household survey data obtained from government sta-tistical agencies and World Bank country departments. Data forhigh-income economies are from the Luxembourg Income Studydatabase. For more information and methodology, please see Povcal-Net (http://iresearch.worldbank.org/PovcalNet/index.htm).
Referenced in: table 14
Income share held by lowest 20%
Percentageshareof incomeor consumptionis thesharethataccruestosubgroups of population indicated by deciles or quintiles. Percentageshares by quintile may not sum to 100 because of rounding.
Source: World Bank (WDI)
Owner: World Bank, Development Research Group. Data are basedon primary household survey data obtained from government sta-tistical agencies and World Bank country departments. Data forhigh-income economies are from the Luxembourg Income Studydatabase. For more information and methodology, please see Povcal-Net (http://iresearch.worldbank.org/PovcalNet/index.htm).
Referenced in: table 14
Industrial roundwood production (m3)
See ’Industrial roundwood’ and ’Production’ in Concepts and Methods.
Source: FAO, Statistics Division (FAOSTAT)
Owner: FAO
Referenced in: table 42
Industrial roundwood production p.a. growth (%)
See ’Industrial roundwood production (m3)’ and ’Growth’ in Conceptsand Methods.
Referenced in: table 42
Industrial water withdrawal (% of total water withdrawal)
Industrial water withdrawal as percentage of total water withdrawal.Source: Land and Water Division (AQUASTAT)
Owner: FAO
Referenced in: chart 98, table 44
Industrial water withdrawal (m3 /yr)
Annual quantity of water withdrawn for industrial uses. It includesrenewable water resources as well as potential over-abstraction of re-newable groundwater or withdrawal of fossil groundwater and poten-tial use of desalinated water or treated wastewater. This sector refersto self-supplied industriesnot connectedto the public distribution net-work. The ratiobetween net consumption and withdrawal is estimatedat less than 5 percent. It includes water for the cooling of thermoelec-tric plants, but it does not include hydropower.
Source: Land and Water Division (AQUASTAT)Owner: FAO
Industry, value added (% of GDP)
Industry corresponds to ISIC divisions 10-45 and includes manufactur-ing (ISIC divisions 15-37). It comprises value added in mining, man-ufacturing (also reported as a separate subgroup), construction, elec-tricity, water, and gas. Value added is the net output of a sector afteradding up all outputs and subtracting intermediate inputs. It is calcu-lated without making deductions for depreciation of fabricated assetsor depletion and degradation of natural resources. The origin of valueadded is determined by the International Standard Industrial Classifi-cation (ISIC), revision 3.
Source: World Bank (WDI)
Owner: World Bank national accounts data, and OECD National Ac-
counts data files.Referenced in: chart 6, table 3
Insecticides use (tonnes)
See ’Total pesticides use (tonnes)’.
Source: FAO, Statistics Division (FAOSTAT)
Internally displaced persons (IDPs), total
Internally Displaced Persons are people or groups of individuals whohave been forced to leave their homes or places of habitual residence,in particular as a result of, or in order to avoid the effects of armedconflict, situations of generalized violence, violations of human rightsor natural- or human-made disasters, and who have not crossed an in-ternational border. For purposes of UNHCR’s statistics, this populationonly includes conflict-generated IDPs to whom the Office extends pro-tection and/or assistance. As such, UNHCR statistics do not provide acomprehensive picture of global internal displacement. Moreover, UN-HCR’s IDP statistics are not necessarily representative of the entire IDPpopulation in a given country but are exclusively limited to the oneswho are protected and/or assisted by the Office. For global IDP esti-mates, consult the Internal Displacement Monitoring Centre (IDMC) of the Norwegian Refugee Council (NRC) website. The 2007 IDP popu-lation category also includes people in IDP-like situations. This sub-category is descriptive in nature and includes groups of persons whoare inside their country of nationality or habitual residence and whoface protection risks similar to those of IDPs but who, for practical orother reasons, could not be reported as such.
Source: Statistical Online Population Database
Owner: UNHCR
Referenced in: chart 48, table 19
Irrigation potential (ha)
Area of land which is potentially irrigable. Country/regional studiesassess this value according to different methods. For example, someconsider only land resources, others consider land resources plus wa-ter availability, others include economical aspects in theirassessments(such as distance and/or difference in elevation between the suitableland and the available water) or environmental aspects, etc. If avail-able, this information is given in the individual country profiles. Thefigureincludes the area already underagricultural water management.
Source: Land and Water Division (AQUASTAT)
Owner: FAO
Referenced in: chart 12, table 5
Jute and jute-like harvested area (ha)
See ’Jute and jute-like’ and ’Crop area’ in Concepts and Methods.Source: FAO, Statistics Division (FAOSTAT)
Owner: FAO
Referenced in: table 33
274
8/16/2019 Informe de la Fao 2013
http://slidepdf.com/reader/full/informe-de-la-fao-2013 293/307
METADATA
Jute and jute-like harvested area p.a. growth (%)
See ’Jute and jute-like harvested area (ha)’ and ’Growth’ in Conceptsand Methods.
Referenced in: table 33
Jute and jute-like production (tonnes)
See ’Jute and jute-like’ and ’Crop production’ in Concepts and Methods.
Source: FAO, Statistics Division (FAOSTAT)
Owner: FAOReferenced in: table 33
Jute and jute-like production p.a. growth (%)
See ’Jute and jute-like production (tonnes)’ and ’Growth’ in Conceptsand Methods.
Referenced in: table 33
Jute and jute-like yield (hg/ha)
See ’Jute and jute-like’ and ’Crop yield’ in Concepts and Methods.
Source: FAO, Statistics Division (FAOSTAT)
Owner: FAO
Referenced in: table 33
Jute and jute-like yield p.a. growth (%)
See ’Juteand jute-likeyield (hg/ha)’and ’Growth’ in Conceptsand Meth-ods.
Referenced in: table 33
Labor participation rate, female (% of female population ages 15+)
Labor force participation rate is the proportion of the population ages15 and older that is economically active: all people who supply laborfor the production of goods and services during a specified period.
Source: World Bank (WDI)
Owner: International Labour Organization,Key Indicators of the LabourMarket (KILM) database.
Referenced in: chart 15, table 6
Labor participation rate, male (% of male population ages 15+)
See ’Labor participation rate, female (% of female population ages15+)’.
Referenced in: chart 15, table 6
Life expectancy at birth, total (years)
Life expectancy atbirthindicates thenumber ofyearsa newborn infantwould live if prevailing patterns of mortality at the time of its birthwere to stay the same throughout its life.
Source: World Bank (WDI)
Owner: UNPD World Population Prospects 2010
Referenced in: table 2
Literacy rate, adult female (% of females ages 15 and above)
Adult literacy rate is the percentage of people ages 15 and above whocan, with understanding, read and write a short, simple statement on
their everyday life.Source: World Bank (WDI)
Owner: United Nations Educational, Scientific, and Cultural Organiza-tion (UNESCO) Institute for Statistics.
Referenced in: map 27, table 18
Male employment, total
See ’Female employment, total’.
Referenced in: table 6
Mammal species, threatened
Mammal species are mammals excluding whales and porpoises.Threatened species are the number of species classified by the IUCNas endangered, vulnerable, rare, indeterminate, out of danger, or in-sufficiently known.
Source: World Bank (WDI)Owner: United Nations Environmental Program and the World Conser-vation Monitoring Centre, and International Union for Conservation of Nature, Red List of Threatened Species.
Referenced in: chart 99, table 45
Manure applied to soils, total emissions in CO2eq (gigagrams)
Greenhouse gas (GHG) emissions from manure applied to soils consistof nitrous oxide gas from nitrogen additions to managed soils fromtreated manure.
Source: FAO, Statistics Division (FAOSTAT)
Owner: FAO
Referenced in: chart 114, table 49
Manure left on pasture, total emissions in CO2eq (gigagrams)Greenhouse Gases (GHG) emissions data from manure left on pastureconsist of nitrous oxide gas from nitrogen additions to managed soilsfrom grazing livestock.
Source: FAO, Statistics Division (FAOSTAT)
Owner: FAO
Referenced in: chart 114, table 49
Manure management, total emissions in CO2eq (gigagrams)
Greenhouse gas (GHG) emissions from manure management consist of methane and nitrous oxide gases from aerobic and anaerobic decom-position processes.
Source: FAO, Statistics Division (FAOSTAT)
Owner: FAO
Referenced in: chart 114, table 49
Marine protected areas (share of territorial waters)
Marine protected areas are areas of intertidal or subtidal terrain–andoverlying water and associated flora and fauna and historical and cul-turalfeatures–thathave beenreserved by law or othereffective meansto protect part or all of the enclosed environment.
Source: World Bank
Owner: United Nations Environmental Program and the World Conser-vation Monitoring Centre, as compiled by the World Resources Insti-tute, based on data from national authorities, national legislation andinternational agreements.
Referenced in: map 60, table 45
Meat, total (tonnes)
See ’Meat, total’ and ’Production’ in Concepts and Methods.Source: FAO, Statistics Division (FAOSTAT)
Owner: FAO
Referenced in: map 45, table 34
Meat, total p.a. growth (%)
See ’Meat, total’ and ’Growth’ in Concepts and Methods.
Referenced in: table 34
Meat, total per capita (tonne/cap)
See ’Meat, total’.
Referenced in: chart 72
Milk production (tonnes)
See ’Milk’ and ’Production’ in Concepts and Methods.Source: FAO, Statistics Division (FAOSTAT)
Owner: FAO
Referenced in: map 46, table 35
Milk production p.a. growth (%)
See ’Milk production (tonnes)’ and ’Growth’ in Concepts and Methods.
Referenced in: table 35
Mobile cellular subscriptions (per 100 people)
Mobile cellular telephone subscriptions are subscriptions to a publicmobile telephone service using cellular technology, which provide ac-cess to the public switched telephone network. Post-paid and prepaidsubscriptions are included.
Source: World Bank (WDI)Owner: International Telecommunication Union, World Telecommuni-cation/ICT Development Report and database, and World Bank esti-mates.
Referenced in: chart 23, table 11
275
8/16/2019 Informe de la Fao 2013
http://slidepdf.com/reader/full/informe-de-la-fao-2013 294/307
Mobile cellular subscriptions (subscriptions)
Mobile cellular telephone subscriptions are subscriptions to a publicmobile telephone service using cellular technology, which provide ac-cess to the public switched telephone network. Post-paid and prepaidsubscriptions are included.
Source: World Bank (WDI)
Owner: International Telecommunication Union, World Telecommuni-cation/ICT Development Report and database, and World Bank esti-mates.
Mobile cellular subscriptions p.a. growth (%)
See ’Mobile cellular subscriptions (subscriptions)’ and ’Growth’ in Con-cepts and Methods.
Referenced in: map 14
Mortality rate, infant (per 1000 live births)
Infant mortality rate is the number of infants dying before reachingone year of age, per 1 000 live births in a given year.
Source: World Bank (WDI)
Owner: UNICEF, WHO, World Bank and UNPD
Referenced in: table 2
Mortality rate, under-5 (per 1 000 live births)
Under-five mortality rate is the probability per 1000 that a newbornbaby will die before reaching agefive, if subject to current age-specificmortality rates.
Source: World Bank (WDI)
Owner: Level & Trends in Child Mortality. Report 2011. Estimates De-veloped by the UN Inter-agency Group for Child Mortality Estimation(UNICEF, WHO, World Bank, UN DESA, UNPD).
Referenced in: map 3, table 2
Municipal water withdrawal (share of total water withdrawal)
Municipal water withdrawal as percentage of total water withdrawal.
Source: Land and Water Division (AQUASTAT)
Owner: FAO
Referenced in: table 44
Municipal water withdrawal (m3 /yr)
Annual quantity of water withdrawn primarily for the direct use bythe population. It includes renewable freshwater resources as well aspotential over-abstraction of renewable groundwater or withdrawalof fossil groundwater and the potential use of desalinated water ortreated wastewater. It is usually computed as the total water with-drawn by the public distribution network. It can include that part of the industries, which is connected to the municipal network. The ratiobetween the net consumption and the water withdrawn can vary from5 to 15 percent in urban areas and from 10 to 50 percent in rural areas.
Source: Land and Water Division (AQUASTAT)
Owner: FAO
Net forest conversion, net emissions/removal in CO2eq (gigagrams)
GHG emissions data from forest land are currently limited to emis-sions from net forest conversion to non-forest land. They consist of the balance of CO2 sources and sinks associated with deforestationand afforestation activities within a country.
Source: FAO, Statistics Division (FAOSTAT)
Owner: FAO
Referenced in: chart 112
Net ODA received (% of GDP)
See ’Net ODA received (% of GNI).’
Referenced in: table 3
Net ODA received (% of GNI)
Net official development assistance (ODA) consists of disbursements
of loans made on concessional terms (net of repayments of principal)andgrants by official agencies of themembers of theDevelopment As-sistance Committee (DAC), by multilateral institutions, and by non-DACcountries to promote economic development and welfare in countriesand territories in the DAC list of ODA recipients. It includes loans with
a grant element of at least 25 percent (calculated at a rate of discountof 10 percent).
Source: World Bank (WDI)
Owner: Net official development assistance (ODA) consists of disburse-ments of loans made on concessional terms (net of repayments ofprin-cipal) and grants by official agencies of the members of the Develop-ment Assistance Committee (DAC), by multilateral institutions, and bynon-DAC countries to promote economic development and welfare incountries and territories in the DAC list of ODA recipients. It includes
loans with a grant element of at least 25 percent (calculated at a rateof discount of 10 percent).
Net official development assistance and official aid received (currentUS$)
Net official development assistance (ODA) consists of disbursementsof loans made on concessional terms (net of repayments of principal)andgrants by official agencies of themembers of theDevelopment As-sistance Committee (DAC), by multilateral institutions, and by non-DACcountries to promote economic development and welfare in countriesand territories in the DAC list of ODA recipients. It includes loans witha grant element of at least 25 percent (calculated at a rate of discountof 10 percent). Net official aid refers to aid flows (net of repayments)from official donors to countries and territories in part II of the DAC listof recipients: more advanced countries of Central and Eastern Europe,
the countries of the former Soviet Union, and certain advanced devel-opingcountries and territories. Official aid is provided underterms andconditions similar to those for ODA. Part II of the DAC List was abol-ished in 2005. The collection of data on official aid and other resourceflows to Part II countries ended with 2004 data. Data are in currentUS$.
Source: World Bank (WDI)
Owner: Development Assistance Committee of the Organisation forEconomic Co-operation and Development, Geographical Distribu-tion of Financial Flows to Developing Countries, Development Co-operation Report, and International Development Statistics database.Data
Referenced in: chart 7
Nitrogen fertilizers consumption (tonnes of N total nutrients)
See ’Fertilizers’ in Concepts and Methods.Source: FAO, Statistics Division (FAOSTAT)
Owner: FAO
Nitrogen fertilizers consumption per ha of arable area and permanentcrops (tonne/ha)
See ’Nitrogen fertilizers consumption (tonnes of N total nutrients)’.
Referenced in: chart 16, chart 17, table 7, map 61
Number of people undernourished, total
Estimated number of people at risk of undernourishment. It is calcu-lated by applying the estimated prevalence of undernourishment tothe total population in each period.
Source: FAO, Statistics Division
Owner: OECDReferenced in: chart 25, table 12
ODA received for agriculture sector, share of total ODA (%)
See ’Official Development Assistance’ in Concepts and Methods.
Source: FAO, Statistics Division
Owner: OECD
Referenced in: chart 19, table 9
ODA received for fishing sector, share of total ODA (%)
See ’Official Development Assistance’ in Concepts and Methods.
Source: FAO, Statistics Division
Owner: OECD
Referenced in: chart 19, table 9
ODA received for forestry sector, share of total ODA (US$)
See ’Official Development Assistance’ in Concepts and Methods.
Referenced in: chart 19, table 9
276
8/16/2019 Informe de la Fao 2013
http://slidepdf.com/reader/full/informe-de-la-fao-2013 295/307
METADATA
Oil-bearing crops harvested area (ha)
See ’Oil-bearing crops’ and ’Crop area’ in Concepts and Methods.
Source: FAO, Statistics Division (FAOSTAT)
Owner: FAO
Referenced in: table 24
Oil-bearing crops harvested area p.a. growth (%)
See ’Oil-bearing crops harvested area (ha)’ and ’Growth’ in Concepts
and Methods.Referenced in: table 24
Oil-bearing crops production (tonnes)
See ’Oil-bearing crops’ and ’Crop production’ in Concepts and Methods.
Source: FAO, Statistics Division (FAOSTAT)
Owner: FAO
Referenced in: map 38, table 24
Oil-bearing crops production p.a. growth (%)
See ’Oil-bearing crops production (tonnes)’ and ’Growth’ in Conceptsand Methods.
Referenced in: table 24
Oil-bearing crops production per capita (tonne/cap)
See ’Oil-bearing crops production (tonnes)’.
Referenced in: chart 59
Oil-bearing crops yield (hg/ha)
See ’Oil-bearing crops’ and ’Crop yield’ in Concepts and Methods.
Source: FAO, Statistics Division (FAOSTAT)
Owner: FAO
Referenced in: table 24
Oil-bearing crops yield p.a. growth (%)
See ’Oil-bearing crops yield (hg/ha)’ and ’Growth’ in Concepts andMethods.
Referenced in: table 24
Oilseeds exports (tonnes)
Exports (volume) of oilseeds
Source: FAO, Statistics Division (FAOSTAT)
Owner: FAO
Referenced in: table 38
Oilseeds imports (tonnes)
Imports (volume) of oilseeds
Source: FAO, Statistics Division (FAOSTAT)
Owner: FAO
Referenced in: table 38
Organic agriculture (ha)
Sum of areasunder ’Agricultural areacertified organic’ and ’Agriculturalarea in conversion to organic’. The first one includes the land areaexclusively dedicated to organic agriculture and managed by applyingorganic agriculture methods. It refers to the land area fully convertedto organic agriculture. It is the portion of land area (including arablelands, pastures or wild areas) managed (cultivated) or wild harvestedin accordance with specific organic standards or technical regulationsand that has been inspected and approved by a certification body. Thesecond one includes the land area which is going through the organicconversion process, usually two years period of conversion to organicland.
Source: FAO, FAO, Statistics Division (FAOSTAT)
Owner: FAO
Referenced in: chart 105, map 62
Organic agriculture, share of total agricultural area (%)
See ’Organic agriculture (ha)’.
Referenced in: chart 106, map 63
Organic water pollutant (BOD) emissions (kg per day per worker)
Emissions per worker are total emissions of organic water pollutantsdivided by the number of industrial workers. Organic water pollu-tants are measured by biochemical oxygen demand, which refers tothe amount of oxygen that bacteria in water will consume in breakingdown waste. This is a standard water-treatment test for the presenceof organic pollutants.
Source: World Bank (WDI)
Owner: World Bank and UNIDO’s industry database.
Referenced in: chart 104, table 46
Organic water pollutant (BOD) emissions (kg per day)
Emissions of organic water pollutants are measured by biochemicaloxygen demand, which refers to the amount of oxygen that bacteria inwater will consume in breaking down waste. This is a standard water-treatment test for the presence of organic pollutants.
Source: World Bank (WDI)
Owner: 1998 study by Hemamala Hettige, Muthukumara Mani,and David Wheeler, "Industrial Pollution in Economic Development:Kuznets Revisited" (available at www.worldbank.org/nipr). The datawere updated by the World Bank’s Development Research Group usingthe same methodology as the initial study.
Referenced in: chart 103, table 46
Other land (% of total land)
See ’Other land (ha)’.
Referenced in: chart 10, table 4
Other land (ha)
Other land is thelandnot classifiedas agriculturallandand forestarea.It includes built-up and related land, barren land, other wooded land,etc.
Source: FAO, Statistics Division (FAOSTAT)
Owner: FAO
Other naturally regenerated forest (ha)
Naturallyregenerated forest is forest predominantlycomposedof trees
establishedthroughnatural regeneration. Othernaturally regeneratedforest is forest where there are clearly visible indications of humanactivities.
Source: Global Forest Resources Assessment
Owner: FAO
Other naturally regenerated forest, share of total forest (%)
See ’Other naturally regenerated forest (ha)’.
Referenced in: chart 92, table 41
Paper and paperboard production (tonnes)
See ’Paper and paperboard’ and ’Production’ in Concepts and Methods.
Source: FAO, Statistics Division (FAOSTAT)
Owner: FAO
Referenced in: chart 94, table 43
Paper and paperboard production p.a. growth (%)
See ’Paper and paperboard production (tonnes)’ and ’Growth’ in Con-cepts and Methods.
Referenced in: table 43
Part of equipped area actually irrigated (%)
Percent of area equipped for irrigation that is actually irrigated in anygiven year, expressed in percentage. Irrigated land that is cultivatedmore than once a year is counted only once.
Source: Land and Water Division (AQUASTAT)
Owner: FAO
Referenced in: map 7, table 5
Per capita arable land (ha/cap)
See ’Arable land (ha)’.
Referenced in: chart 8, chart 9
277
8/16/2019 Informe de la Fao 2013
http://slidepdf.com/reader/full/informe-de-la-fao-2013 296/307
Per Capita food production variability (index)
Per capita food production variability corresponds to the variability of the net food production value in constant 2004-2006 1 000 Interna-tional $ (Net Food PIN) divided by the population number as from UN2010 estimates. Variability is based on the trend of the Net Food PINper capita over the period 1985 to 2010 and corresponds to the stan-dard deviation of the deviation from the trend over a period of 5 years.Missing values for Eritrea/Ethiopia, former Yugoslavia and Caucasuscountries for 1985 to 1992 are estimated backward using the share of
the value of food production of each country in the total value of theregion it belonged to prior to 1992.
Source: Statistics Division
Owner: FAO
Referenced in: chart 41
Per Capita food supply variability (index)
Food supply variability correspond to the variable food supply total inkcal/person/day as estimated by the FAO Statistic Division. The vari-ability is obtained as the standard deviation over 5 years of the de-viation from the trend of per capita food supply observed during theperiod 1990 to 2010.
Source: Statistics Division
Owner: FAO
Referenced in: chart 44
Percent of adults who are underweight (%)
Percentage of adults who are underweight, as defined by a Body MassIndex (BMI) below the international reference standard of 18.5. To cal-culate an individuals BMI, weight and height data are need. The BMIis weight (kg) divided by squared height (m).
Source: Statistics Division
Owner: World Health Organization (WHO)
Referenced in: table 13
Percent of arable land equipped for irrigation (%)
Percent of arable land equipped for irrigation. The indicator is calcu-lated on 3 year averages.
Source: Statistics Division
Owner: FAOReferenced in: table 17
Percent of paved roads over total roads (%)
Paved roads are those surfaced with crushed stone (macadam) and hy-drocarbon binder or bituminized agents, withconcrete, or with cobble-stones, as a percentage of all the country’s roads, measured in length.Regional aggregates are computed as weighted average using totalroad network as weight. Because of the low coverage, missing val-ues were interpolated using linear trend between two points or ex-trapolated backward and forward using the closest point. Note thatregional aggregates were calculated only if countries for which datawere available represented more than 70 percent of the total lenghtof road network of the region they belong to.
Source: Statistics Division
Owner: International Road Federation, World Road Statistics and elec-tronic files, except where noted.
Referenced in: map 23, table 16
Percentage of children under 5 years of age who are stunted (%)
Percentage of stunting (height-for-age less than-2 standard deviationsof the WHO Child Growth Standards median) among children aged 0-5years.
Source: Statistics Division
Owner: World Health Organization (WHO)
Referenced in: chart 26, map 18, table 13
Percentage of children under 5 years of age who are underweight (%)
Percentage of underweight (weight-for-age less than -2 standard de-
viations of the WHO Child Growth Standards median) among childrenaged 0-5 years.
Source: Statistics Division
Owner: World Health Organization (WHO)
Referenced in: map 19, table 13
Percentage of children under 5 years of age who are wasted (%)
Percentage of (weight-for-height less than -2 standard deviations of the WHO Child Growth Standards median) among children aged 0-5years.
Source: Statistics Division
Owner: World Health Organization (WHO)
Referenced in: table 13
Percentage of population with no reasonable access to improved san-itation facilities (%)
Access to improved sanitation facilities refers to the percentage of thepopulation with at least adequate access to excreta disposal facilitiesthat can effectively prevent human, animal, and insect contact withexcreta. Improved facilities range from simple but protected pit la-trines to flush toilets with a sewerage connection. To be effective, fa-cilities must be correctly constructed and properly maintained.
Source: Statistics Division
Owner: World Health Organization (WHO)
Referenced in: chart 37, map 25, table 16
Percentage of populationwith no reasonable access to improved watersources (%)
Access to an improved water source refers to the percentage of thepopulation with reasonable access to an adequate amount of waterfrom an improved source, such as a household connection, publicstandpipe, borehole, protectedwell or spring, and rainwater collection.Unimproved sources include vendors, tanker trucks, and unprotectedwells and springs. Reasonable access is defined as the availability of at least 20 liters a person a day from a source within one kilometer of the dwelling.
Source: Statistics Division
Owner: World Health Organization (WHO)
Referenced in: chart 36, map 24, table 16
Permanent crops (% of agricultural area)
See ’Permanent crops (ha)’.
Referenced in: chart 11, table 4
Permanent crops (ha)
Permanent crops is the land cultivated with long-term crops which donot have to be replanted for several years (such as cocoa and coffee);land under trees and shrubs producing flowers, such as roses and jas-mine; and nurseries (except those for forest trees, which should beclassified under "forest"). Permanent meadows and pastures are ex-cluded from land under permanent crops.
Source: FAO, Statistics Division (FAOSTAT)
Owner: FAO
Permanent meadows and pastures (% of agricultural area)
See ’Permanent meadows and pastures (ha)’.
Referenced in: chart 11, table 4
Permanent meadows and pastures (ha)
Permanent meadows and pastures is the land used permanently (fiveyears or more) to grow herbaceous forage crops, either cultivated orgrowing wild (wild prairie or grazing land).
Source: FAO, Statistics Division (FAOSTAT)
Owner: FAO
Phosphate fertilizers consumption (tonnes of P205 total nutrients)
See ’Fertilizers’ in Concepts and Methods.
Source: FAO, Statistics Division (FAOSTAT)
Owner: FAO
Phosphate fertilizers consumption per ha of arable area and perma-nent crops (tonne/ha)
See ’Phosphate fertilizers consumption (tonnes of P205 total nutri-ents)’.
Referenced in: chart 16, chart 17, table 7
278
8/16/2019 Informe de la Fao 2013
http://slidepdf.com/reader/full/informe-de-la-fao-2013 297/307
METADATA
Pig meat (tonnes)
See ’Poultry meat (tonnes)’.
Referenced in: chart 71
Pig meat p.a. growth (%)
See ’Poultry meat (tonnes)’ and ’Growth’ in Concepts and Methods.
Referenced in: table 34
Pig meat per capita (tonne/cap)
See ’Pig meat’ and ’Production’ in Concepts and Methods.
Source: FAO, Statistics Division (FAOSTAT)
Owner: FAO
Referenced in: chart 69, chart 70, table 34
Plant species (higher), threatened
Higher plants are native vascular plant species. Threatened speciesare the number of species classified by the IUCN as endangered, vul-nerable, rare, indeterminate, out of danger, or insufficiently known.
Source: World Bank (WDI)
Owner: United Nations Environmental Program and the World Conser-vation Monitoring Centre, and International Union for Conservation of Nature, Red List of Threatened Species.
Referenced in: chart 99, table 45
Planted forest (ha)
Planted forest is forest predominantly composed of trees establishedthrough planting and/or deliberate seeding.
Source: Global Forest Resources Assessment
Owner: FAO
Planted forest, share of total forest (%)
See ’Planted forest (ha)’.
Referenced in: chart 92, table 41
Political stability and absence of violence/terrorism (index)
Political stability and absence of violence measures perceptions of the
likelihood that the government will be destabilized or overthrown byunconstitutional or violent means, including politically-motivated vi-olence and terrorism.
Source: FAO, Statistics Division
Owner: WorldWide Governance Indicators
Referenced in: map 26
Population ages 0-14 (% of total)
Population between the ages 0 to 14 as a percentage of the total pop-ulation. Population is based on the de facto definition of population.
Source: World Bank (WDI)
Owner: The United Nations Population Division’s World PopulationProspects.
Referenced in: chart 3, table 1
Population ages 65 and above (% of total)
Population ages 65 and above as a percentage of the total population.Population is based on the de facto definition of population, whichcounts all residents regardless of legal status or citizenship–exceptforrefugees not permanently settled in thecountryof asylum, whoaregenerally considered part of the population of the country of origin.
Source: World Bank (WDI)
Owner: The United Nations Population Division’s World PopulationProspects.
Referenced in: chart 3, table 1
Population density (people per sq. km of land area)
Population density is midyear population divided by land area insquare kilometers. Population is based on the de facto definition of
population, which counts all residents regardless of legal status orcitizenship–except for refugees not permanently settled in the coun-try of asylum, who are generally considered part of the population of their country of origin. Land area is a country’s total area, excludingarea under inland water bodies, national claims to continental shelf,
and exclusive economic zones. In most cases the definition of inlandwater bodies includes major rivers and lakes.
Source: World Bank (WDI)
Owner: FAO and World Bank population estimates.
Referenced in: chart 4, table 1
Populationlivingin areaswhereelevation isbelow5 meters(% oftotalpopulation)
Population below 5 m is the percentage of the total population livingin areas where the elevation is 5 meters or less.
Source: World Bank (WDI)
Owner: Center for International Earth Science Information Network(CIESIN), Place II dataset.
Referenced in: map 66
Population p.a. growth (%)
See ’Population, total’ and ’Growth’ in Concepts and Methods
Referenced in: map 1
Population, total
Total population is based on the de facto definition of population,which counts all residents regardless of legal status or citizenship–
except for refugees not permanently settled in the country of asylum,who are generally considered part of the population of their countryof origin. The values shown are midyear estimates.
Source: World Bank (WDI)
Owner: (1) United Nations Population Division. World PopulationProspects, (2) United Nations Statistical Division. Population and Vi-tal Statistics Report (various years), (3) Census reports and other sta-tistical publications from national statistical offices, (4) Eurostat: De-mographic Statistics, (5) Secretariat of the Pacific Community: Statis-tics and Demography Programme, and (6) U.S. Census Bureau: Interna-tional Database.
Referenced in: table 1
Potash fertilizers consumption (tonnes of K2O total nutrients)
See ’Fertilizers’ in Concepts and Methods.
Source: FAO, Statistics Division (FAOSTAT)Owner: FAO
Potash fertilizers consumption per ha of arable area and permanentcrops (tonne/ha)
See ’Potash fertilizers consumption (tonnes of K2O total nutrients)’.
Referenced in: chart 16, chart 17, table 7
Poultry birds (heads)
See ’Poultry birds’ and ’Stocks’ in Concepts and Methods.
Source: FAO, Statistics Division (FAOSTAT)
Owner: FAO
Referenced in: chart 66, chart 68
Poultry birds per ha of agricultural area (head/ha)
See ’Poultry birds’.
Referenced in: chart 102, table 46
Poultry meat (tonnes)
See ’Poultry meat’ and ’Production’ in Concepts and Methods.
Source: FAO, Statistics Division (FAOSTAT)
Owner: FAO
Referenced in: chart 69, chart 70, table 34
Poultry meat p.a. growth (%)
See ’Poultry meat (tonnes)’ and ’Growth’ in Concepts and Methods.
Referenced in: table 34
Poultry meat per capita (tonne/cap)
See ’Poultry meat (tonnes)’.
Referenced in: chart 71
279
8/16/2019 Informe de la Fao 2013
http://slidepdf.com/reader/full/informe-de-la-fao-2013 298/307
Poverty gap at $1.25 a day (PPP) (%)
Poverty gap is the mean shortfall from the poverty line (counting thenonpoor as having zero shortfall), expressed as a percentage of thepoverty line. This measure reflects the depth of poverty as well as itsincidence.
Source: World Bank (WDI)
Owner: World Bank, Development Research Group. Data are basedon primary household survey data obtained from government sta-tistical agencies and World Bank country departments. Data for
high-income economies are from the Luxembourg Income Studydatabase. For more information and methodology, please see Povcal-Net (http://iresearch.worldbank.org/PovcalNet/index.htm).
Referenced in: table 14
Poverty gap at $2 a day (PPP) (%)
Poverty gap is the mean shortfall from the poverty line (counting thenonpoor as having zero shortfall), expressed as a percentage of thepoverty line. This measure reflects the depth of poverty as well as itsincidence.
Source: World Bank (WDI)
Owner: World Bank, Development Research Group. Data are basedon primary household survey data obtained from government sta-tistical agencies and World Bank country departments. Data forhigh-income economies are from the Luxembourg Income Study
database. For more information and methodology, please see Povcal-Net (http://iresearch.worldbank.org/PovcalNet/index.htm).
Referenced in: table 14
Poverty gap at national poverty line (%)
Poverty gap at national poverty line is the mean shortfall from thepoverty line (counting the nonpoor as having zero shortfall) as a per-centage of the poverty line. This measure reflects the depth of povertyas well as its incidence.
Source: World Bank (WDI)
Owner: Global Poverty Working Group. Data are based on World Bank’scountry poverty assessments and country Poverty Reduction Strate-gies.
Referenced in: map 20, table 14
Poverty gap at rural poverty line (%)
Poverty gapat rural povertyline is the mean shortfall from the povertyline (counting the nonpoor as having zero shortfall) as a percentageof the national rural poverty line. This measure reflects the depth of poverty as well as its incidence.
Source: World Bank (WDI)
Owner: Global Poverty Working Group. Data are based on World Bank’scountry poverty assessments and country Poverty Reduction Strate-gies.
Referenced in: table 14
Poverty headcount ratio at $1.25 a day (PPP) (% of population)
Population below $1.25 a day is the percentage of the population liv-ing on less than $1.25 a day at 2005 international prices. As a result of
revisions in PPP exchange rates, poverty rates for individual countriescannot be compared with poverty rates reported in earlier editions.
Source: World Bank (WDI)
Owner: World Bank, Development Research Group. Data are basedon primary household survey data obtained from government sta-tistical agencies and World Bank country departments. Data forhigh-income economies are from the Luxembourg Income Studydatabase. For more information and methodology, please see Povcal-Net (http://iresearch.worldbank.org/PovcalNet/index.htm).
Referenced in: chart 27, table 14
Poverty headcount ratio at $2 a day (PPP) (% of population)
Populationbelow$2 a dayis the percentage ofthe population livingonless than $2 a day at 2005 international prices. As a result of revisionsin PPP exchange rates, poverty rates for individual countries cannot be
compared with poverty rates reported in earlier editions.Source: World Bank (WDI)
Owner: World Bank, Development Research Group. Data are basedon primary household survey data obtained from government sta-tistical agencies and World Bank country departments. Data for
high-income economies are from the Luxembourg Income Studydatabase. For more information and methodology, please see Povcal-Net (http://iresearch.worldbank.org/PovcalNet/index.htm).
Referenced in: chart 27, table 14
Poverty headcount ratio at national poverty line (% of population)
Poverty headcount ratio at national poverty line (% of population)
Source: World Bank (WDI)
Owner: Global Poverty Working Group. Data are based on World Bank’scountry poverty assessments and country Poverty Reduction Strate-gies.
Referenced in: map 21
Poverty headcount ratio at rural poverty line (% of rural population)
Rural poverty rate is the percentage of the rural population living be-low the national rural poverty line.
Source: World Bank (WDI)
Owner: Global Poverty Working Group. Data are based on World Bank’scountry poverty assessments and country Poverty Reduction Strate-gies.
Prevalence of food inadequacy (%)It is conceptually analogous to the prevalence of undernourishment,but calculated setting the caloric threshold to a higher level, by usinga Physical Activity Level (PAL) coefficient of 1.75, as opposed to 1.55.It measures the percentage of the population that is at risk of not cov-ering the food requirements associated with normal physical activity,and thereforeincluding also those who,even though cannot be consid-ered chronically undernourished, are likely being conditioned in theireconomic activity by insufficient food. While the prevalence of under-nourishment is an estimator of chronic food deprivation (hunger), thisnew estimator is a less conservative measure of food inadequacy inthe population. The indicator is calculated on 3 year averages.
Source: Statistics Division
Owner: FAO
Referenced in: map 17, table 12
Prevalence of undernourishment (%)
Proportion of the population estimated to be at risk of caloric inade-quacy. This is the traditional FAO hunger indicator, adopted as officialMillennium Development Goal indicator for goal 1, target 1.9. The in-dicator is calculated on 3 year averages.
Source: Statistics Division
Owner: FAO
Referenced in: map 16, table 12
Primary completion rate, total (% of relevant age group)
Primary completion rate is the percentage of students completing thelast year of primary school. It is calculated by taking the total num-ber of students in the last grade of primary school, minus the numberof repeaters in that grade, divided by the total number of children of official graduation age.
Source: World Bank (WDI)
Owner: United Nations Educational, Scientific, and Cultural Organiza-tion (UNESCO) Institute for Statistics.
Referenced in: map 28, table 18
Primary forest (ha)
Primary forest is naturally regenerated forest of native species, wherethere areno clearly visible indications of humanactivities and theeco-logical processes are not significantly disturbed.
Source: Global Forest Resources Assessment
Owner: FAO
Primary forest, share of total forest (%)
See ’Primary forest (ha)’.
Referenced in: chart 92, table 41
280
8/16/2019 Informe de la Fao 2013
http://slidepdf.com/reader/full/informe-de-la-fao-2013 299/307
METADATA
Protein supply quantity in crops primary equivalent (g/cap/day)
See ’Per capita supply’ in Concepts and Methods.
Source: FAO, Statistics Division (FAOSTAT)
Owner: FAO
Referenced in: chart 50, chart 51
Pulses harvested area (ha)
See ’Pulses’ and ’Crop area’ in Concepts and Methods.
Source: FAO, Statistics Division (FAOSTAT)Owner: FAO
Referenced in: table 25
Pulses harvested area p.a. growth (%)
See ’Pulses harvested area (ha)’ and ’Growth’ in Concepts and Methods.
Referenced in: table 25
Pulses production (tonnes)
See ’Pulses’ and ’Crop production’ in Concepts and Methods.
Source: FAO, Statistics Division (FAOSTAT)
Owner: FAO
Referenced in: map 39, table 25
Pulses production p.a. growth (%)
See ’Pulses production(tonnes)’ and ’Growth’ in Conceptsand Methods.
Referenced in: table 25
Pulses production per capita (tonne/cap)
See ’Pulses production (tonnes)’.
Referenced in: chart 60
Pulses yield (hg/ha)
See ’Pulses’ and ’Crop yield’ in Concepts and Methods.
Source: FAO, Statistics Division (FAOSTAT)
Owner: FAO
Referenced in: table 25
Pulses yield p.a. growth (%)
See ’Pulses yield (hg/ha)’ and ’Growth’ in Concepts and Methods.
Referenced in: table 25
Rail lines density (%)
Rail lines density corresponds to the ratio between the length of rail-way route available for train service, irrespective of the number of par-allel tracks (rail lines, total route in km) with the area of the country.Regional aggregates are computed as weighted average using surfacearea as weight. Because of the low coverage, missing values wereinterpolated using linear trend between two points or extrapolatedbackward and forward using closest point. Note that regional aggre-gates were calculated only if countries for which data were availablerepresented more than 70 percent of the total area of the region they
belong to.Source: FAO, Statistics Division
Owner: International Road Federation and World Road Statistics
Referenced in: table 16
Recovered paper production (tonnes)
See ’Recovered paper’ and ’Production’ in Concepts and Methods.
Source: FAO, Statistics Division (FAOSTAT)
Owner: FAO
Referenced in: chart 94, table 48
Relative change in average protein supply (%)
See ’Average protein supply (g/cap/day)’.
Referenced in: chart 32
Relative change in the average protein supply from animal origin (%)
See ’Average supply of protein of animal origin (g/cap/day)’.
Referenced in: chart 33
Rice (paddy) production (tonnes)
See ’Rice (paddy)’ and ’Crop production’ in Concepts and Methods.
Source: FAO, Statistics Division (FAOSTAT)
Owner: FAO
Referenced in: map 36, table 22
Rice (paddy) production p.a. growth (%)
See ’Rice (paddy) production (tonnes)’ and ’Growth’ in Concepts andMethods.
Referenced in: table 22
Rice (paddy) production per capita (tonne/cap)
See ’Rice (paddy) production (tonnes)’.
Referenced in: chart 57
Rice cultivation, total emissions in CO2eq (gigagrams)
Greenhouse gas (GHG) emissions from rice cultivation consist of methane gas from the anaerobic decomposition of organic matter inpaddy fields.
Source: FAO, Statistics Division (FAOSTAT)
Owner: FAO
Referenced in: chart 114, table 49
Rice harvested area (ha)
See ’Rice (paddy)’ and ’Crop area’ in Concepts and Methods.
Source: FAO, Statistics Division (FAOSTAT)
Owner: FAO
Referenced in: table 22
Rice harvested area p.a. growth (%)
See ’Rice harvested area (ha)’ and ’Growth’ in Concepts and Methods.
Referenced in: table 22
Rice yield (hg/ha)See ’Rice (paddy)’ and ’Crop yield’ in Concepts and Methods.
Source: FAO, Statistics Division (FAOSTAT)
Owner: FAO
Referenced in: table 22
Rice yield p.a. growth (%)
See ’Rice yield (hg/ha)’ and ’Growth’ in Concepts and Methods.
Referenced in: table 22
Road density (%)
Road density is the ratio of the length of the country’s total road net-work to the country’s land area. The road network includes all roads in
the country: motorways, highways, main or national roads, secondaryor regional roads, and other urban and rural roads. Regional aggre-gates are computed as weighted average using surface area as weight.Because of the low coverage, missing values were interpolated usinglinear trendbetween two points or extrapolated backward and forwardusing the closest point. Note that regional aggregates were calculatedonly if countries for which data were available represented more than70 percent of the total area of the region they belong to.
Source: FAO, Statistics Division
Owner: International Road Federation and World Road Statistics
Referenced in: map 22, table 16
Roads, paved (% of total roads)
Paved roads are those surfaced with crushed stone (macadam) and hy-drocarbonbinder or bituminized agents, with concrete, or withcobble-
stones, as a percentage of all the country’s roads, measured in length.Source: World Bank (WDI)
Owner: International Road Federation, World Road Statistics and elec-tronic files, except where noted.
281
8/16/2019 Informe de la Fao 2013
http://slidepdf.com/reader/full/informe-de-la-fao-2013 300/307
Root and tuber crops production (tonnes)
See’Root and tuber crops’ and ’Cropproduction’in Concepts andMeth-ods.
Source: FAO, Statistics Division (FAOSTAT)
Owner: FAO
Referenced in: map 40, table 26
Root and tuber crops production per capita(tonne/cap)
See ’Root and tuber crops production (tonnes)’.Referenced in: chart 61
Roots and tubers harvested area (ha)
See ’Root and tuber crops’ and ’Crop area’ in Concepts and Methods.
Source: FAO, Statistics Division (FAOSTAT)
Owner: FAO
Referenced in: table 26
Roots and tubers harvested area p.a. growth (%)
See’Root andtubercrops harvested area (ha)’ and’Growth’ in Conceptsand Methods.
Referenced in: table 26
Roots and tubers production p.a. growth (%)
See ’Root and tubercrops production(tonnes)’ and’Growth’ in Conceptsand Methods.
Referenced in: table 26
Roots and tubers yield (hg/ha)
See ’Root and tuber crops’ and ’Crop yield’ in Concepts and Methods.
Source: FAO, Statistics Division (FAOSTAT)
Owner: FAO
Referenced in: table 26
Roots and tubers yield p.a. growth (%)
See ’Root and tuber crops yield (hg/ha)’ and ’Growth’ in Concepts andMethods.
Referenced in: table 26
Roundwood production (m3)
See ’Roundwood’ and ’Production’ in Concepts and Methods.
Source: FAO, Statistics Division (FAOSTAT)
Owner: FAO
Referenced in: map 56, table 42
Roundwood production p.a. growth (%)
See ’Roundwood production (m3)’ and ’Growth’ in Concepts and Meth-ods.
Referenced in: table 42
Rural population (% of total population)
See ’Rural population, total’.
Referenced in: table 1
Rural population, total
Rural population refers to people living in rural areas as defined bynational statistical offices. It is calculated as the difference betweentotal population and urban population.
Source: World Bank (WDI)
Owner: The data on urban population shares used to estimate ru-ral population come from the United Nations, World UrbanizationProspects. Total population figures are World Bank estimates.
Referenced in: chart 1
Sawnwood production (m3)
See ’Sawnwood’ and ’Production’ in Concepts and Methods.Source: FAO, Statistics Division (FAOSTAT)
Owner: FAO
Referenced in: chart 93, table 43
Sawnwood production p.a. growth (%)
See ’Sawnwood production (m3)’ and ’Growth’ in Concepts and Meth-ods.
Referenced in: table 43
School enrollment, primary, female (% net)
Netenrollment ratio is the ratio of children of official schoolage basedon the International Standard Classification of Education 1997 who
are enrolled in school to the population of the corresponding officialschool age. Primary education provides children with basic reading,writing, and mathematics skills along with an elementary understand-ing of such subjects as history, geography, natural science, social sci-ence, art, and music.
Source: World Bank (WDI)
Owner: United Nations Educational, Scientific, and Cultural Organiza-tion (UNESCO) Institute for Statistics.
Referenced in: chart 45, table 18
School enrollment, primary, male (% net)
See ’School enrollment, primary, female (% net)’.
Source: World Bank (WDI)
Owner: United Nations Educational, Scientific, and Cultural Organiza-
tion (UNESCO) Institute for Statistics.Referenced in: chart 45, table 18
Services, etc., value added (% of GDP)
Services correspond to ISIC divisions 50-99 and they include valueadded in wholesale and retail trade (including hotels and restaurants),transport, and government, financial, professional, and personal ser-vices such as education, health care, and real estate services. Alsoincluded are imputed bankservice charges, import duties, and any sta-tistical discrepancies noted by national compilers as well as discrep-ancies arising from rescaling. Value added is the net output of a sectorafter adding up all outputs and subtracting intermediate inputs. It iscalculated without making deductions for depreciation of fabricatedassets or depletion and degradation of natural resources. The indus-trial origin of value added is determined by the International Stan-
dard Industrial Classification (ISIC), revision 3. Note: For VAB countries,gross value added at factor cost is used as the denominator.
Source: World Bank (WDI)
Owner: World Bank national accounts data, and OECD National Ac-counts data files.
Referenced in: chart 6, table 3
Share of energy supply derived from cereals, roots and tubers (%)
Energy supply (in kcal/cap/day) provided by cereals, roots and tubersdivided by total Dietary Energy Supply (DES) (in kcal/caput/day) calcu-lated from the correponding categories in the FAOSTAT Food BalanceSheets. As other indicators based on Food Balance Sheets data, it iscalculated on 3 year averages, to reduce the errors due to the difficul-ties in recording annual stock changes.
Source: Statistics DivisionOwner: FAO
Referenced in: chart 31, table 15
Share of feedstocks used in bioenergy production (%)
Estimated shares of commodity globally used in non-food sectors, in-cluding industrial renewable materials and bioenergy.
Source: Statistics Division
Owner: FAO
Referenced in: chart 109
Share of food expenditure of the poor (%)
Proportion of foodconsumption overtotal consumption (food and non-
food) for the lowest income quintile of the population.Source: Statistics Division
Owner: FAO
Referenced in: table 12
282
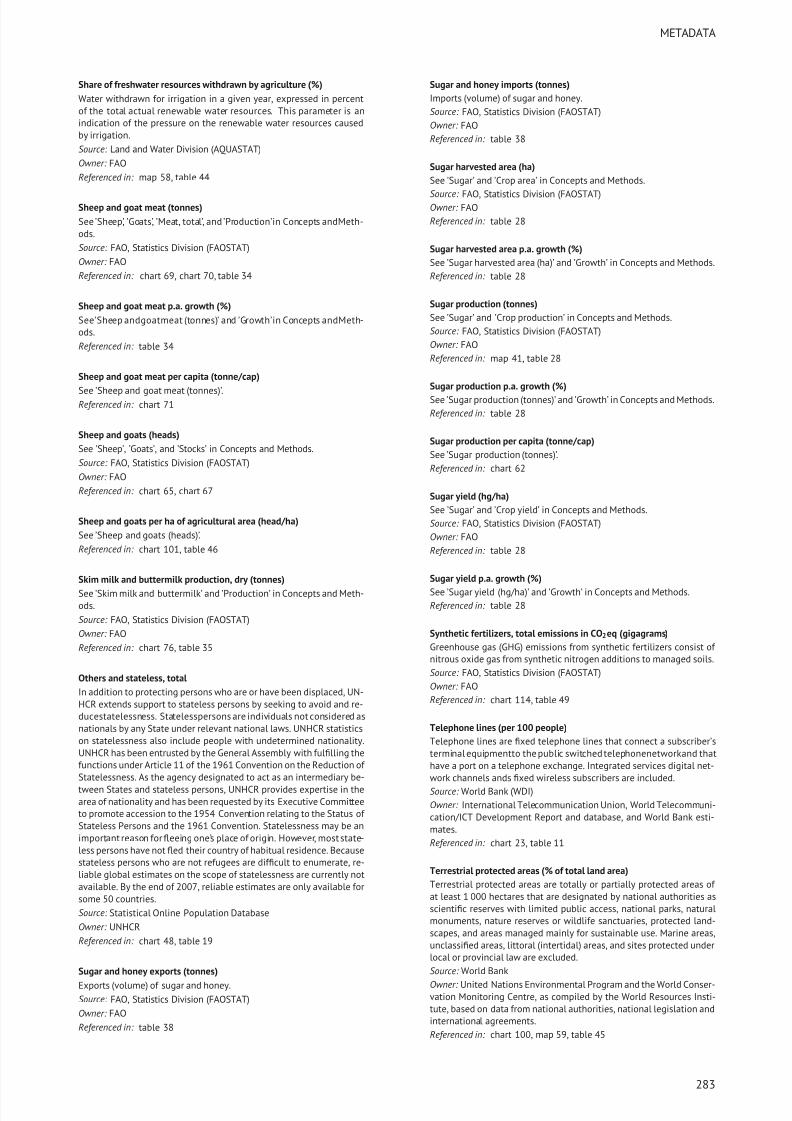
8/16/2019 Informe de la Fao 2013
http://slidepdf.com/reader/full/informe-de-la-fao-2013 301/307
METADATA
Share of freshwater resources withdrawn by agriculture (%)
Water withdrawn for irrigation in a given year, expressed in percentof the total actual renewable water resources. This parameter is anindication of the pressure on the renewable water resources causedby irrigation.
Source: Land and Water Division (AQUASTAT)
Owner: FAO
Referenced in: map 58, table 44
Sheep and goat meat (tonnes)
See ’Sheep’, ’Goats’, ’Meat, total’, and ’Production’in Concepts andMeth-ods.
Source: FAO, Statistics Division (FAOSTAT)
Owner: FAO
Referenced in: chart 69, chart 70, table 34
Sheep and goat meat p.a. growth (%)
See’Sheep andgoatmeat (tonnes)’ and ’Growth’in Concepts andMeth-ods.
Referenced in: table 34
Sheep and goat meat per capita (tonne/cap)
See ’Sheep and goat meat (tonnes)’.Referenced in: chart 71
Sheep and goats (heads)
See ’Sheep’, ’Goats’, and ’Stocks’ in Concepts and Methods.
Source: FAO, Statistics Division (FAOSTAT)
Owner: FAO
Referenced in: chart 65, chart 67
Sheep and goats per ha of agricultural area (head/ha)
See ’Sheep and goats (heads)’.
Referenced in: chart 101, table 46
Skim milk and buttermilk production, dry (tonnes)
See ’Skim milk and buttermilk’ and ’Production’ in Concepts and Meth-ods.
Source: FAO, Statistics Division (FAOSTAT)
Owner: FAO
Referenced in: chart 76, table 35
Others and stateless, total
In addition to protecting persons who are or have been displaced, UN-HCR extends support to stateless persons by seeking to avoid and re-ducestatelessness. Statelesspersons are individuals not considered asnationals by any State under relevant national laws. UNHCR statisticson statelessness also include people with undetermined nationality.UNHCR has been entrusted by the General Assembly with fulfilling thefunctions under Article 11 of the 1961 Convention on the Reduction of Statelessness. As the agency designated to act as an intermediary be-
tween States and stateless persons, UNHCR provides expertise in thearea of nationality and has been requested by its Executive Committeeto promote accession to the 1954 Convention relating to the Status of Stateless Persons and the 1961 Convention. Statelessness may be animportant reason for fleeing one’s place of origin. However, most state-less persons have not fled their country of habitual residence. Becausestateless persons who are not refugees are difficult to enumerate, re-liable global estimates on the scope of statelessness are currently notavailable. By the end of 2007, reliable estimates are only available forsome 50 countries.
Source: Statistical Online Population Database
Owner: UNHCR
Referenced in: chart 48, table 19
Sugar and honey exports (tonnes)
Exports (volume) of sugar and honey.Source: FAO, Statistics Division (FAOSTAT)
Owner: FAO
Referenced in: table 38
Sugar and honey imports (tonnes)
Imports (volume) of sugar and honey.
Source: FAO, Statistics Division (FAOSTAT)
Owner: FAO
Referenced in: table 38
Sugar harvested area (ha)
See ’Sugar’ and ’Crop area’ in Concepts and Methods.
Source: FAO, Statistics Division (FAOSTAT)Owner: FAO
Referenced in: table 28
Sugar harvested area p.a. growth (%)
See ’Sugar harvested area (ha)’ and ’Growth’ in Concepts and Methods.
Referenced in: table 28
Sugar production (tonnes)
See ’Sugar’ and ’Crop production’ in Concepts and Methods.
Source: FAO, Statistics Division (FAOSTAT)
Owner: FAO
Referenced in: map 41, table 28
Sugar production p.a. growth (%)
See ’Sugar production (tonnes)’ and ’Growth’ in Concepts and Methods.
Referenced in: table 28
Sugar production per capita (tonne/cap)
See ’Sugar production (tonnes)’.
Referenced in: chart 62
Sugar yield (hg/ha)
See ’Sugar’ and ’Crop yield’ in Concepts and Methods.
Source: FAO, Statistics Division (FAOSTAT)
Owner: FAO
Referenced in: table 28
Sugar yield p.a. growth (%)
See ’Sugar yield (hg/ha)’ and ’Growth’ in Concepts and Methods.Referenced in: table 28
Synthetic fertilizers, total emissions in CO2eq (gigagrams)
Greenhouse gas (GHG) emissions from synthetic fertilizers consist of nitrous oxide gas from synthetic nitrogen additions to managed soils.
Source: FAO, Statistics Division (FAOSTAT)
Owner: FAO
Referenced in: chart 114, table 49
Telephone lines (per 100 people)
Telephone lines are fixed telephone lines that connect a subscriber’sterminal equipmentto the public switched telephonenetworkand thathave a port on a telephone exchange. Integrated services digital net-work channels ands fixed wireless subscribers are included.
Source: World Bank (WDI)
Owner: International Telecommunication Union, World Telecommuni-cation/ICT Development Report and database, and World Bank esti-mates.
Referenced in: chart 23, table 11
Terrestrial protected areas (% of total land area)
Terrestrial protected areas are totally or partially protected areas of at least 1 000 hectares that are designated by national authorities asscientific reserves with limited public access, national parks, naturalmonuments, nature reserves or wildlife sanctuaries, protected land-scapes, and areas managed mainly for sustainable use. Marine areas,unclassified areas, littoral (intertidal) areas, and sites protected underlocal or provincial law are excluded.
Source: World Bank
Owner: United Nations Environmental Program and the World Conser-vation Monitoring Centre, as compiled by the World Resources Insti-tute, based on data from national authorities, national legislation andinternational agreements.
Referenced in: chart 100, map 59, table 45
283
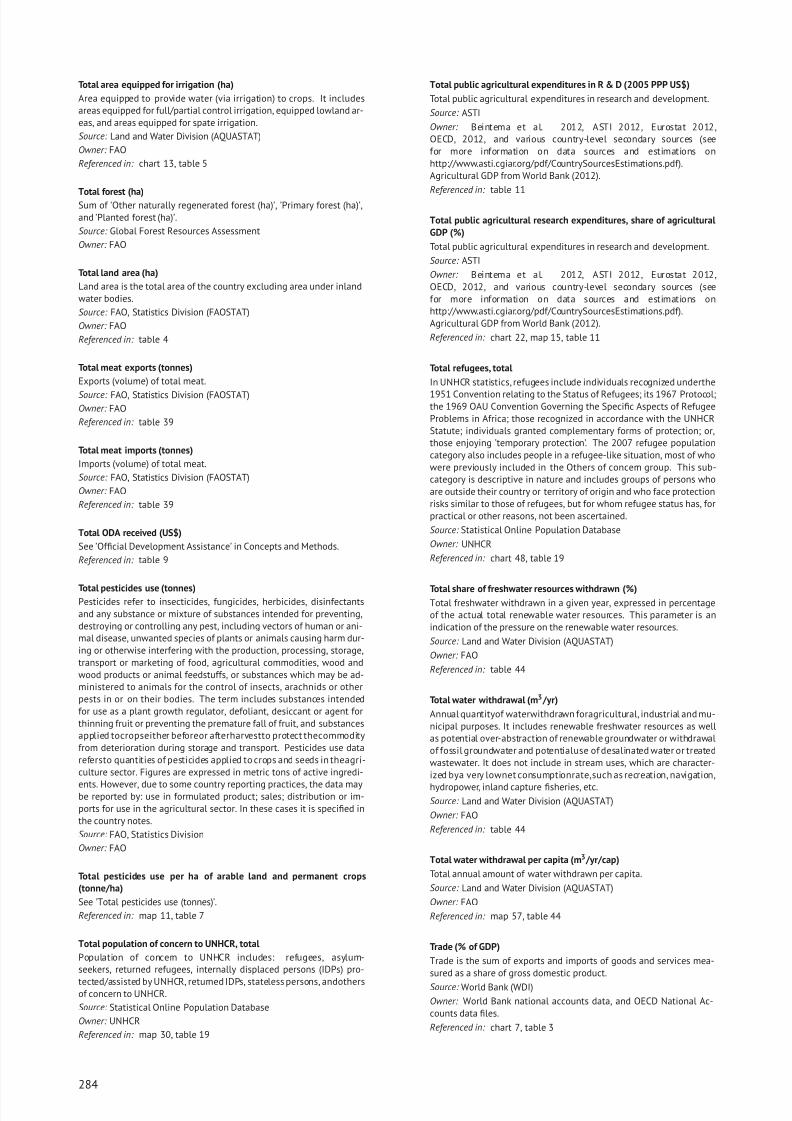
8/16/2019 Informe de la Fao 2013
http://slidepdf.com/reader/full/informe-de-la-fao-2013 302/307
Total area equipped for irrigation (ha)
Area equipped to provide water (via irrigation) to crops. It includesareas equipped for full/partial control irrigation, equipped lowland ar-eas, and areas equipped for spate irrigation.
Source: Land and Water Division (AQUASTAT)
Owner: FAO
Referenced in: chart 13, table 5
Total forest (ha)Sum of ’Other naturally regenerated forest (ha)’, ’Primary forest (ha)’,and ’Planted forest (ha)’.
Source: Global Forest Resources Assessment
Owner: FAO
Total land area (ha)
Land area is the total area of the country excluding area under inlandwater bodies.
Source: FAO, Statistics Division (FAOSTAT)
Owner: FAO
Referenced in: table 4
Total meat exports (tonnes)
Exports (volume) of total meat.
Source: FAO, Statistics Division (FAOSTAT)Owner: FAO
Referenced in: table 39
Total meat imports (tonnes)
Imports (volume) of total meat.
Source: FAO, Statistics Division (FAOSTAT)
Owner: FAO
Referenced in: table 39
Total ODA received (US$)
See ’Official Development Assistance’ in Concepts and Methods.
Referenced in: table 9
Total pesticides use (tonnes)Pesticides refer to insecticides, fungicides, herbicides, disinfectantsand any substance or mixture of substances intended for preventing,destroying or controlling any pest, including vectors of human or ani-mal disease, unwanted species of plants or animals causing harm dur-ing or otherwise interfering with the production, processing, storage,transport or marketing of food, agricultural commodities, wood andwood products or animal feedstuffs, or substances which may be ad-ministered to animals for the control of insects, arachnids or otherpests in or on their bodies. The term includes substances intendedfor use as a plant growth regulator, defoliant, desiccant or agent forthinning fruit or preventing the premature fall of fruit, and substancesapplied tocropseither beforeor afterharvestto protect thecommodityfrom deterioration during storage and transport. Pesticides use datarefersto quantities of pesticides applied to crops and seeds in theagri-culture sector. Figures are expressed in metric tons of active ingredi-
ents. However, due to some country reporting practices, the data maybe reported by: use in formulated product; sales; distribution or im-ports for use in the agricultural sector. In these cases it is specified inthe country notes.
Source: FAO, Statistics Division
Owner: FAO
Total pesticides use per ha of arable land and permanent crops(tonne/ha)
See ’Total pesticides use (tonnes)’.
Referenced in: map 11, table 7
Total population of concern to UNHCR, total
Population of concern to UNHCR includes: refugees, asylum-seekers, returned refugees, internally displaced persons (IDPs) pro-
tected/assisted by UNHCR, returned IDPs, stateless persons, andothersof concern to UNHCR.
Source: Statistical Online Population Database
Owner: UNHCR
Referenced in: map 30, table 19
Total public agricultural expenditures in R & D (2005 PPP US$)
Total public agricultural expenditures in research and development.
Source: ASTI
Owner: Beintema et al. 2012, ASTI 2012, Eurostat 2012,OECD, 2012, and various country-level secondary sources (seefor more information on data sources and estimations onhttp://www.asti.cgiar.org/pdf/CountrySourcesEstimations.pdf).Agricultural GDP from World Bank (2012).
Referenced in: table 11
Total public agricultural research expenditures, share of agriculturalGDP (%)
Total public agricultural expenditures in research and development.
Source: ASTI
Owner: Beintema et al. 2012, ASTI 2012, Eurostat 2012,OECD, 2012, and various country-level secondary sources (seefor more information on data sources and estimations onhttp://www.asti.cgiar.org/pdf/CountrySourcesEstimations.pdf).Agricultural GDP from World Bank (2012).
Referenced in: chart 22, map 15, table 11
Total refugees, total
In UNHCR statistics, refugees include individuals recognized underthe
1951 Convention relating to the Status of Refugees; its 1967 Protocol;the 1969 OAU Convention Governing the Specific Aspects of RefugeeProblems in Africa; those recognized in accordance with the UNHCRStatute; individuals granted complementary forms of protection; or,those enjoying ’temporary protection’. The 2007 refugee populationcategory also includes people in a refugee-like situation, most of whowere previously included in the Others of concern group. This sub-category is descriptive in nature and includes groups of persons whoare outside their country or territory of origin and who face protectionrisks similar to those of refugees, but for whom refugee status has, forpractical or other reasons, not been ascertained.
Source: Statistical Online Population Database
Owner: UNHCR
Referenced in: chart 48, table 19
Total share of freshwater resources withdrawn (%)Total freshwater withdrawn in a given year, expressed in percentageof the actual total renewable water resources. This parameter is anindication of the pressure on the renewable water resources.
Source: Land and Water Division (AQUASTAT)
Owner: FAO
Referenced in: table 44
Total water withdrawal (m3 /yr)
Annual quantityof waterwithdrawn foragricultural, industrial and mu-nicipal purposes. It includes renewable freshwater resources as wellas potential over-abstraction of renewable groundwater or withdrawalof fossil groundwater and potentialuse of desalinated water or treatedwastewater. It does not include in stream uses, which are character-ized bya very lownet consumptionrate,such as recreation, navigation,
hydropower, inland capture fisheries, etc.Source: Land and Water Division (AQUASTAT)
Owner: FAO
Referenced in: table 44
Total water withdrawal per capita (m3 /yr/cap)
Total annual amount of water withdrawn per capita.
Source: Land and Water Division (AQUASTAT)
Owner: FAO
Referenced in: map 57, table 44
Trade (% of GDP)
Trade is the sum of exports and imports of goods and services mea-sured as a share of gross domestic product.
Source: World Bank (WDI)
Owner: World Bank national accounts data, and OECD National Ac-counts data files.
Referenced in: chart 7, table 3
284
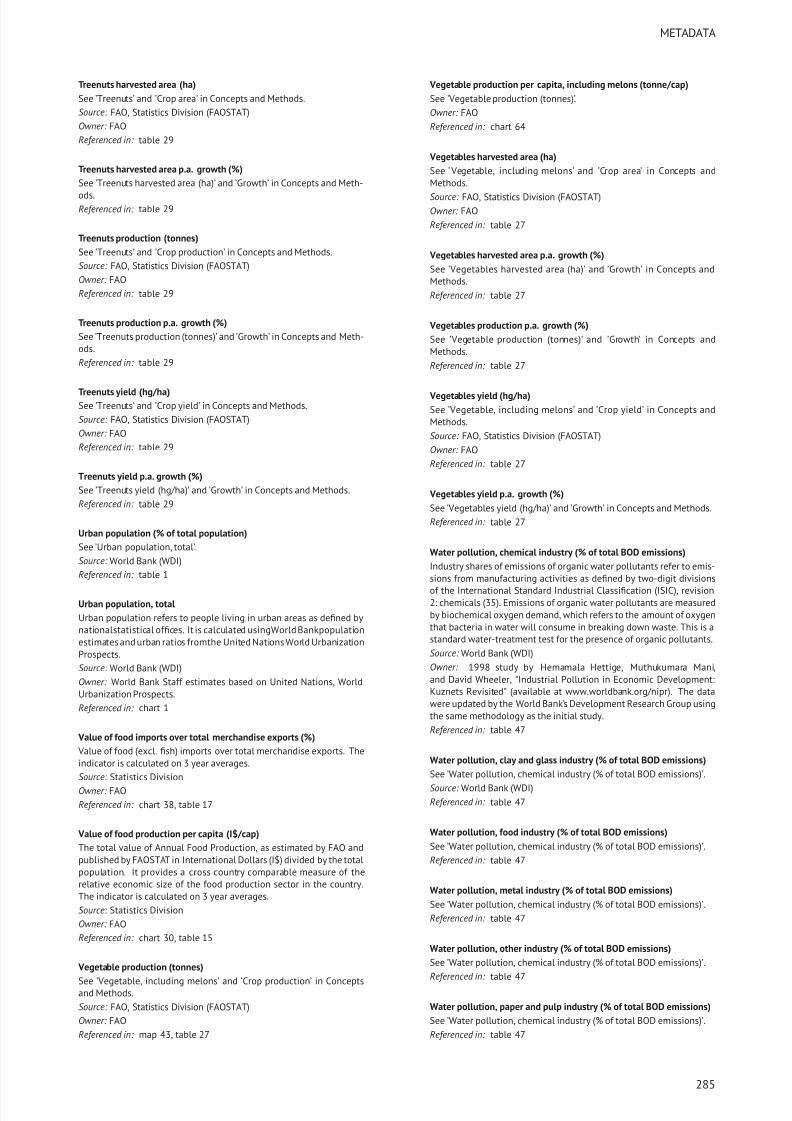
8/16/2019 Informe de la Fao 2013
http://slidepdf.com/reader/full/informe-de-la-fao-2013 303/307
METADATA
Treenuts harvested area (ha)
See ’Treenuts’ and ’Crop area’ in Concepts and Methods.
Source: FAO, Statistics Division (FAOSTAT)
Owner: FAO
Referenced in: table 29
Treenuts harvested area p.a. growth (%)
See ’Treenuts harvested area (ha)’ and ’Growth’ in Concepts and Meth-
ods.Referenced in: table 29
Treenuts production (tonnes)
See ’Treenuts’ and ’Crop production’ in Concepts and Methods.
Source: FAO, Statistics Division (FAOSTAT)
Owner: FAO
Referenced in: table 29
Treenuts production p.a. growth (%)
See ’Treenuts production (tonnes)’ and ’Growth’ in Concepts and Meth-ods.
Referenced in: table 29
Treenuts yield (hg/ha)See ’Treenuts’ and ’Crop yield’ in Concepts and Methods.
Source: FAO, Statistics Division (FAOSTAT)
Owner: FAO
Referenced in: table 29
Treenuts yield p.a. growth (%)
See ’Treenuts yield (hg/ha)’ and ’Growth’ in Concepts and Methods.
Referenced in: table 29
Urban population (% of total population)
See ’Urban population, total’.
Source: World Bank (WDI)
Referenced in: table 1
Urban population, total
Urban population refers to people living in urban areas as defined bynationalstatistical offices. It is calculated usingWorld Bankpopulationestimates and urban ratios fromthe United Nations World UrbanizationProspects.
Source: World Bank (WDI)
Owner: World Bank Staff estimates based on United Nations, WorldUrbanization Prospects.
Referenced in: chart 1
Value of food imports over total merchandise exports (%)
Value of food (excl. fish) imports over total merchandise exports. Theindicator is calculated on 3 year averages.
Source: Statistics Division
Owner: FAO
Referenced in: chart 38, table 17
Value of food production per capita (I$/cap)
The total value of Annual Food Production, as estimated by FAO andpublished by FAOSTAT in International Dollars (I$) divided by the totalpopulation. It provides a cross country comparable measure of therelative economic size of the food production sector in the country.The indicator is calculated on 3 year averages.
Source: Statistics Division
Owner: FAO
Referenced in: chart 30, table 15
Vegetable production (tonnes)
See ’Vegetable, including melons’ and ’Crop production’ in Conceptsand Methods.
Source: FAO, Statistics Division (FAOSTAT)
Owner: FAO
Referenced in: map 43, table 27
Vegetable production per capita, including melons (tonne/cap)
See ’Vegetable production (tonnes)’.
Owner: FAO
Referenced in: chart 64
Vegetables harvested area (ha)
See ’ Vegetable, including melons’ and ’Crop area’ in Concepts andMethods.
Source: FAO, Statistics Division (FAOSTAT)Owner: FAO
Referenced in: table 27
Vegetables harvested area p.a. growth (%)
See ’Vegetables harvested area (ha)’ and ’Growth’ in Concepts andMethods.
Referenced in: table 27
Vegetables production p.a. growth (%)
See ’Vegetable production (tonnes)’ and ’Growth’ in Concepts andMethods.
Referenced in: table 27
Vegetables yield (hg/ha)See ’Vegetable, including melons’ and ’Crop yield’ in Concepts andMethods.
Source: FAO, Statistics Division (FAOSTAT)
Owner: FAO
Referenced in: table 27
Vegetables yield p.a. growth (%)
See ’Vegetables yield (hg/ha)’ and ’Growth’ in Concepts and Methods.
Referenced in: table 27
Water pollution, chemical industry (% of total BOD emissions)
Industry shares of emissions of organic water pollutants refer to emis-sions from manufacturing activities as defined by two-digit divisions
of the International Standard Industrial Classification (ISIC), revision2: chemicals (35). Emissions of organic water pollutants are measuredby biochemical oxygen demand, which refers to the amount of oxygenthat bacteria in water will consume in breaking down waste. This is astandard water-treatment test for the presence of organic pollutants.
Source: World Bank (WDI)
Owner: 1998 study by Hemamala Hettige, Muthukumara Mani,and David Wheeler, "Industrial Pollution in Economic Development:Kuznets Revisited" (available at www.worldbank.org/nipr). The datawere updated by the World Bank’s Development Research Group usingthe same methodology as the initial study.
Referenced in: table 47
Water pollution, clay and glass industry (% of total BOD emissions)
See ’Water pollution, chemical industry (% of total BOD emissions)’.
Source: World Bank (WDI)Referenced in: table 47
Water pollution, food industry (% of total BOD emissions)
See ’Water pollution, chemical industry (% of total BOD emissions)’.
Referenced in: table 47
Water pollution, metal industry (% of total BOD emissions)
See ’Water pollution, chemical industry (% of total BOD emissions)’.
Referenced in: table 47
Water pollution, other industry (% of total BOD emissions)
See ’Water pollution, chemical industry (% of total BOD emissions)’.
Referenced in: table 47
Water pollution, paper and pulp industry (% of total BOD emissions)
See ’Water pollution, chemical industry (% of total BOD emissions)’.
Referenced in: table 47
285
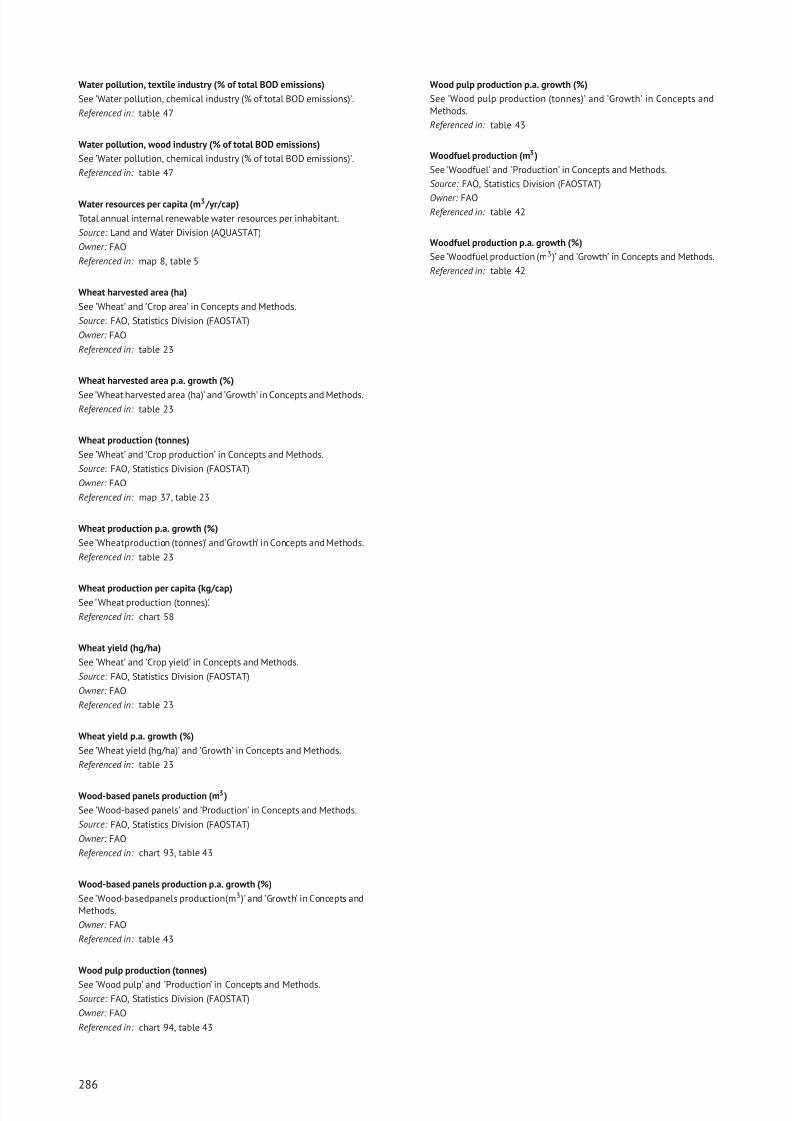
8/16/2019 Informe de la Fao 2013
http://slidepdf.com/reader/full/informe-de-la-fao-2013 304/307
Water pollution, textile industry (% of total BOD emissions)
See ’Water pollution, chemical industry (% of total BOD emissions)’.
Referenced in: table 47
Water pollution, wood industry (% of total BOD emissions)
See ’Water pollution, chemical industry (% of total BOD emissions)’.
Referenced in: table 47
Water resources per capita (m3 /yr/cap)
Total annual internal renewable water resources per inhabitant.
Source: Land and Water Division (AQUASTAT)
Owner: FAO
Referenced in: map 8, table 5
Wheat harvested area (ha)
See ’Wheat’ and ’Crop area’ in Concepts and Methods.
Source: FAO, Statistics Division (FAOSTAT)
Owner: FAO
Referenced in: table 23
Wheat harvested area p.a. growth (%)
See ’Wheat harvested area (ha)’ and ’Growth’ in Concepts and Methods.Referenced in: table 23
Wheat production (tonnes)
See ’Wheat’ and ’Crop production’ in Concepts and Methods.
Source: FAO, Statistics Division (FAOSTAT)
Owner: FAO
Referenced in: map 37, table 23
Wheat production p.a. growth (%)
See ’Wheatproduction (tonnes)’ and’Growth’ in Concepts and Methods.
Referenced in: table 23
Wheat production per capita (kg/cap)See ’ Wheat production (tonnes)’.
Referenced in: chart 58
Wheat yield (hg/ha)
See ’Wheat’ and ’Crop yield’ in Concepts and Methods.
Source: FAO, Statistics Division (FAOSTAT)
Owner: FAO
Referenced in: table 23
Wheat yield p.a. growth (%)
See ’Wheat yield (hg/ha)’ and ’Growth’ in Concepts and Methods.
Referenced in: table 23
Wood-based panels production (m3)
See ’Wood-based panels’ and ’Production’ in Concepts and Methods.
Source: FAO, Statistics Division (FAOSTAT)
Owner: FAO
Referenced in: chart 93, table 43
Wood-based panels production p.a. growth (%)
See ’Wood-basedpanels production(m3)’ and ’Growth’ in Concepts andMethods.
Owner: FAO
Referenced in: table 43
Wood pulp production (tonnes)
See ’Wood pulp’ and ’Production’ in Concepts and Methods.Source: FAO, Statistics Division (FAOSTAT)
Owner: FAO
Referenced in: chart 94, table 43
Wood pulp production p.a. growth (%)
See ’Wood pulp production (tonnes)’ and ’Growth’ in Concepts andMethods.
Referenced in: table 43
Woodfuel production (m3)
See ’Woodfuel’ and ’Production’ in Concepts and Methods.
Source: FAO, Statistics Division (FAOSTAT)
Owner: FAOReferenced in: table 42
Woodfuel production p.a. growth (%)
See ’Woodfuel production (m3)’ and ’Growth’ in Concepts and Methods.
Referenced in: table 42
286
8/16/2019 Informe de la Fao 2013
http://slidepdf.com/reader/full/informe-de-la-fao-2013 305/307
METADATA
Acronyms
ACS agricultural capital stock
ADER average dietary energy requirement
ASTI Agricultural Science and Technology Indicators (IFPRI)
BOD organic water pollutant (biochemical oxygen demand)
CH4 methane
CIESIN Center for International Earth Science Information Network
CO2 carbon dioxide
CPIA country policy and institutional assessment
CRED Centre for Research on the Epidemiology of Disasters
DAC Development Assistance Committee
DALY disability-adjusted life years
DES dietary energy supply
FAOSTAT FAO statistical databases
FDI foreign direct investment
FiBL Research Institute of Organic Agriculture
FPPP food purchasing power parity
GDP gross domestic product
GFSM Government Finance Statistics Manual
GHG greenhouse gas
GIEWS Global Information and EarlyWarning System on Foodand Agri-culture (FAO)
GMOs genetically modified organism
GNI gross national income
ha hectare(s)
ICP International Comparison Program
IDMC Internal Displacement Monitoring CentreIDPs internally displaced person
IEA International Energy Agency
IFAD International Fund for Agricultural Development
IFOAM International Federation of Organic Agriculture Movements
IFPRI International Food Policy ResearchInstitute
ILO International Labour Organization
IMF International Monetary Fund
INFOODS International Network of Food Data Systems
IPCC Intergovernmental Panel on Climate Change
IPM integrated pest management
ISIC International StandardIndustrial Classification of all Economic Ac-tivities
IUCN International Union for Conservation of Nature
KILM Key Indicators of the Labour Market
LADA Land Degradation Assessment in Drylands
LDC least developed country
LIFDC low-income food deficit country
LULUCF Land Use, Land-Use Change and Forestry
M49 standard country or area codes for statistical use
MDG Millennium Development Goal
MICCA Mitigation of Climate Change in Agriculture Programme
N2O nitrous oxide
NASA National Aeronautics and Space Administration (United Statesof America
nes not elsewhere specified
NGO non-governmental organization
ODA official development assistance
OECD Organisation for Economic Co-operation and Development
p.a. per annum
PAL physical activity level
PPP purchasing power parity
R language and environment for statistical computing and graphics
R&D research and development
SD standard deviation
SOFI State of Food Insecurity in the World (FAO)
SOFIA State of World Fisheries and Aquaculture (FAO)
SOFO State of the World’s Forests (FAO)
SOLAW State of the World’s Land and Water Resources for Food andAgriculture (FAO)
UN COMTRADE United Nations Commodity Trade Statistics Database
UNCTAD United Nations Conference on Trade and Development
UNDP United Nations Development Programme
UNESCO United Nations Educational, Scientific, and Cultural Organi-zation
UNHCR Office of the United Nations High Commissioner for Refugees
UNICEF United Nations Children’s Fund
UNIDO United Nations Industrial Development Organization
UNPD United Nations Population Division
WB World Bank
WDI World Development Indicators (World Bank)
WFS World Food Summit
WHO World Health Organization
287
8/16/2019 Informe de la Fao 2013
http://slidepdf.com/reader/full/informe-de-la-fao-2013 306/307
Bibliography
African Development Bank 2012. The African Economic Outlook: Promoting Youth Employment, OECD publishing.
Bruinsma, J. 2011. The Resources Outlook: By How Much Do Land, Water and Crop Yields Need to Increase by 2050?, in Looking Ahead in World Food and
Agriculture: Perspectives to 2050 , ed. by Conforti, P. FAO, Rome.
CIESIN 2005. Gridded Population of the World, Center for International Earth Science Information Network (CIESIN), Columbia University and Centro Interna-cional de Agricultura Tropical, New York.
2007. National Aggregates of Geospatial Data: Population, Landscape and Climate Estimates, v. 2 (PLACE II), CIESIN, Columbia University, Earth Institute,Palisades, New York.
FAO 2006. World Agriculture: Towards 2030/2050 - Prospects for Food, Nutrition, Agriculture and Major Commodity Groups, FAO, Rome.
2009a. State of the World’s Forests 2009 - Society, Forests and Forestry: Adapting for the Future, FAO, Rome.
2009b. The State of Food and Agriculture 2009 - Livestock in the Balance, FAO, Rome.
2010a. Global Forest Resources Assessment 2010 - Main Report, FAO, Rome.
2010b. The State of World Fisheries and Aquaculture 2010, FAO, Rome.
2011a. Climate Change, Water and Food Security, FAO, Rome.
2011b. State of the World’s Forests 2011 - Changing Pathways, Changing Lives, Forests as Multiple Pathways to Sustainable Development, FAO, Rome.
2011c. The State of Food and Agriculture 2010-11 - Women in Agriculture: Closing the Gender Gap for Development, FAO, Rome.
2011d. The State of the World’s Land and Water Resources for Food and Agriculture - Managing Systems at Risk, FAO, Rome.
2012a. State of the World’s Forests 2012 - The Role of Forests in Human History, FAO, Rome.
2012b. The State of Food and Agriculture 2012 - Investing in Agriculture for a Better Future, FAO, Rome.
2012c. The State of World Fisheries and Aquaculture 2012, FAO, Rome.
FAO, IFAD and WFP 2010. The State of Food Insecurity in the World 2010 - Addressing Food Insecurity in Protracted Crises, FAO, Rome.
2011. The State of Food Insecurity in the World 2011 - How Does International Price Volatility Affect Domestic Economies and Food Security?, FAO, Rome.
2012. The State of Food Insecurity in the World 2012 - Economic Growth Is Necessary but Not Sufficient to Accelerate Reduction of Hunger and Malnutrition,
FAO, Rome.
IEA 2009. World Energy Outlook 2009 Fact Sheet: Why Is Our Current Pathway Unsustainable?, International Energy Agency (IEA), Paris.
2010. World Energy Outlook 2010, IEA, Paris.
Various years a. Energy Balances of Non-OECD Countries, IEA, Paris.
Various years b. Energy Balances of OECD Countries, IEA, Paris.
Various years c. Energy Statistics of Non-OECD Countries, IEA, Paris.
Various years d. Energy Statistics of OECD Countries, IEA, Paris.
IFAD 2011. Rural Poverty Report 2011 - New Realities, New Challenges: New Opportunities for Tomorrow’s Generation, International Fund for AgriculturalDevelopment (IFAD), Rome.
ILO 2009. Guide to the New Millennium Development Goals Employment Indicators, International Labour Organization (ILO), Geneva.
2012. Global Employment Trends 2012. Preventing a deeper job crisis, ILO, Geneva.
Various years a. Key Indicators of the Labour Market (KILM), ILO, Geneva.
Various years b. Yearbook of Labour Statistics, ILO, Geneva.
IMF Various years . International Financial Statistics Yearbook, International Monetary Fund (IMF), Washington, D.C.
IUCN 2011. 2011 IUCN Red List of Threatened Species, International Union for Conservation of Nature (IUCN), Switzerland.
288
8/16/2019 Informe de la Fao 2013
http://slidepdf.com/reader/full/informe-de-la-fao-2013 307/307
BIBLIOGRAPHY