Dottorato di ricerca in fisicaDottorato di ricerca in fisica XIX XIX...
126
Universit Universit Universit UniversitÀ degli studi di bologna degli studi di bologna degli studi di bologna degli studi di bologna Facolt Facolt Facolt FacoltÀ di scienze matematiche fisiche e naturali di scienze matematiche fisiche e naturali di scienze matematiche fisiche e naturali di scienze matematiche fisiche e naturali Anno accademico 2006/2007 Anno accademico 2006/2007 Anno accademico 2006/2007 Anno accademico 2006/2007 Dottorato di ricerca in fisica Dottorato di ricerca in fisica Dottorato di ricerca in fisica Dottorato di ricerca in fisica XIX XIX XIX XIX Ciclo Ciclo Ciclo Ciclo IMPROVEMENTS AND MPROVEMENTS AND MPROVEMENTS AND MPROVEMENTS AND CALIBRATIONS OF ALIBRATIONS OF ALIBRATIONS OF ALIBRATIONS OF NUCLEAR UCLEAR UCLEAR UCLEAR TRACK RACK RACK RACK DETECTORS FOR RARE PA ETECTORS FOR RARE PA ETECTORS FOR RARE PA ETECTORS FOR RARE PARTICLE RTICLE RTICLE RTICLE SEARCHES AND SEARCHES AND SEARCHES AND SEARCHES AND FRAGMENTA RAGMENTA RAGMENTA RAGMENTATION STUDIES TION STUDIES TION STUDIES TION STUDIES Presented Presented Presented Presented: Shahid Manzoor Shahid Manzoor Shahid Manzoor Shahid Manzoor Supervisors: Supervisors: Supervisors: Supervisors: Coordinator Coordinator Coordinator Coordinator: Prof. Giorgio Giacomelli Prof. Giorgio Giacomelli Prof. Giorgio Giacomelli Prof. Giorgio Giacomelli Prof Prof Prof Prof. Fabio Ortolani Fabio Ortolani Fabio Ortolani Fabio Ortolani Prof. Prof. Prof. Prof. Imtinan Imtinan Imtinan Imtinan E. Qureshi E. Qureshi E. Qureshi E. Qureshi Dot Dot Dot Dott.ssa Laura Patrizii t.ssa Laura Patrizii t.ssa Laura Patrizii t.ssa Laura Patrizii Bologna, March 2007 Bologna, March 2007 Bologna, March 2007 Bologna, March 2007
Transcript of Dottorato di ricerca in fisicaDottorato di ricerca in fisica XIX XIX...

UniversitUniversitUniversitUniversitÀ degli studi di bologna degli studi di bologna degli studi di bologna degli studi di bologna
FacoltFacoltFacoltFacoltÀ di scienze matematiche fisiche e naturali di scienze matematiche fisiche e naturali di scienze matematiche fisiche e naturali di scienze matematiche fisiche e naturali
Anno accademico 2006/2007Anno accademico 2006/2007Anno accademico 2006/2007Anno accademico 2006/2007
Dottorato di ricerca in fisicaDottorato di ricerca in fisicaDottorato di ricerca in fisicaDottorato di ricerca in fisica
XIX XIX XIX XIX Ciclo Ciclo Ciclo Ciclo
IIIIMPROVEMENTS AND MPROVEMENTS AND MPROVEMENTS AND MPROVEMENTS AND CCCCALIBRATIONS OF ALIBRATIONS OF ALIBRATIONS OF ALIBRATIONS OF NNNNUCLEAR UCLEAR UCLEAR UCLEAR
TTTTRACK RACK RACK RACK DDDDETECTORS FOR RARE PAETECTORS FOR RARE PAETECTORS FOR RARE PAETECTORS FOR RARE PARTICLE RTICLE RTICLE RTICLE
SEARCHES AND SEARCHES AND SEARCHES AND SEARCHES AND FFFFRAGMENTARAGMENTARAGMENTARAGMENTATION STUDIESTION STUDIESTION STUDIESTION STUDIES
PresentedPresentedPresentedPresented:::: Shahid ManzoorShahid ManzoorShahid ManzoorShahid Manzoor
Supervisors:Supervisors:Supervisors:Supervisors: CoordinatorCoordinatorCoordinatorCoordinator::::
Prof. Giorgio GiacomelliProf. Giorgio GiacomelliProf. Giorgio GiacomelliProf. Giorgio Giacomelli ProfProfProfProf.... Fabio OrtolaniFabio OrtolaniFabio OrtolaniFabio Ortolani
Prof. Prof. Prof. Prof. ImtinanImtinanImtinanImtinan E. Qureshi E. Qureshi E. Qureshi E. Qureshi
DotDotDotDott.ssa Laura Patriziit.ssa Laura Patriziit.ssa Laura Patriziit.ssa Laura Patrizii
Bologna, March 2007Bologna, March 2007Bologna, March 2007Bologna, March 2007

DedicationDedicationDedicationDedication
This thesis is dedicated to my parents, to my wife Alia and to the two
sweet daughters, Sidra and Areeba without whom none of this would have
been even possible. It is also dedicated to those who speak the truth to
power and make it their business to do so.
In remembrance to my late sweety, Yusho, She was my own "soul out
of my soul," you are always with me, please forgive me…….
I
Contents
1. Introduction 1
2. Nuclear Track Detectors 4
2.1 Introduction 4
2.2 Track Registration Mechanisms 7
2.2.1 Total energy loss (dE/dx) 7
2.2.2 Primary ionization loss (dJ/dx) 8
2.2.3 Restricted Energy Loss (REL) 9
2.3 Methodology of Track Detection and Visualization 9
2.3.1 Track detection 9
2.3.2 Bulk etch rate (vB) 10
2.3.2.1 Thickness measurement method 10
2.3.2.2 Track diameter measurement method 11
2.3.2.3 Mass change method 11
2.3.3 Track etch rate (vT) 12
2.3.4 Critical angle of etching (θc) and registration efficiency (η) 12
2.3.5 Track geometry at normal incidence 13
2.3.6 Track geometry at oblique incidence 15
3. Magnetic Monopoles and Nuclearites 18
3.1 Magnetic Monopoles 18
3.1.1 Properties of magnetic Monopoles 19
3.2 GUT Magnetic Monopoles 21
3.3 Intermediate mass monopoles (IMMs) 24
3.4 Astrophysical and Cosmological Limits 25
3.5 Monopole Detectors 25
3.6 Interaction of magnetic monopoles with matter 26
3.6.1 Energy losses of magnetic monopoles in atmosphere 27
3.6.2 Energy losses of magnetic monopoles in CR39 29
II
3.7 Nuclearites (Strange Quark Matter) 30
3.7.1 Energy Loss of Nuclearites in atmosphere 33
3.7.2 Accessibility region of Nuclearites 34
4. Experimental 36
4.1 Calibration 36
4.1.1. Chemical etching 36
4.2 Chemical Etching of CR39 NTDs 41
4.2.1 “Soft” Chemical Etching 41
4.2.2 “Strong” Chemical Etching 44
4.3 Chemical Etching of Makrofol NTDs 45
4.3.1 “Soft” Chemical Etching 45
4.4 Response Curves for CR39 and Makrofol NTDs 47
4.4.1 “Standard” measurement of vB 48
4.4.2 The vB measurement from the cone height and base diameter 49
4.5 Response Curves for CR39 52
4.6 Response Curve for Makrofol 58
4.7 Response Curves of CR39 to Relativistic Pb, Fe, Si and C ions 62
4.8 Charge Resolution 68
5. The SLIM experiment 72
5.1 Introuction 72
5.2 Analysis of SLIM NTDs 74
5.2.1 Non Confirmable Strange Event 76
5.3 SLIM Acceptance and Limits for the search of IMMs 81
and Nuclearites
5.3.1 Acceptance of the Detector 81
5.3.2 SLIM Limits 82
6. Projectile Fragmentation Cross Sections 84
6.1 Introduction 84
6.2 Nucleus-Nucleus Total Charge Changing Cross sections 85
6.2.1 Exposure and Data Analysis 86
III
6.3 Partial Charge Changing Cross Sections 96
7. Conclusions 101
References 103
Figure Captions 108
Table Captions 116
Acknowledgements 118
Publications 119
1
1. Introduction
D.A. Young [1] was the first to observe tracks in LiF crystals. Later, Silk and
Barnes [2] made direct observations of heavy charged particles tracks in mica using a
transmission electron microscope. The pioneers in the nuclear track detector field, P.
B. Price, R. M. Walker and R. L. Fleischer [3], made extensive developments of the
technique, observing nuclear tracks in dielectric solid crystals, plastics and glasses.
Because of their properties, like lightweight, large geometrical factor, simplicity,
flexibility and the ability to discriminate against lightly ionizing particles, in certain
fields of physics, these detectors have potential advantages over other detectors [4-8].
In NTDs, the path of an individual heavily ionizing charged particle is revealed by a
suitable chemical etching of the damaged trail.
Cartwright et al, [9] first discovered the CR-39 polyallyldiglycol carbonate a
NTD; CR stands for Columbia Resin. CR39 has the widest dynamic range for
detecting charged particles for a large range of Z values, and from low energy
protons to relativistic U ions. For the registration of heavy ions in a wide angular
range, NTDs have marked advantages over other detectors. A single CR39 NTD
can be used to detect nuclei in a wide range of charges down to Z = 5e, even in the
relativistic energy region. This needs a carefully designed calibration procedure based
on high energy heavy ions and their fragments. Tarlè et al. [10] demonstrated that
for high Z nuclei CR39 has a charge resolution superior to scintillators, nuclear
emulsions and ionization chambers of equivalent thickness. CR39 has an intrinsic
charge resolution of σz ∼0.2 – 0.3e on a single sheet diameter measurement [11]; the
charge resolution can be improved to a value of σz ∼0.05e by measuring the tracks
on many sheets [12]. It should, however, be noted that the particle detection
characteristics of CR-39 depend strongly on the etching and measuring procedures.
NTDs should be carefully calibrated before using them for quantitative measurements.
2
CR39 and Makrofol NTDs have been used successfully for many years as
charged particle detectors. The knowledge of the relationship between the response
of the detectors and the energy deposition by a charged particle is important to fully
characterise the particle registration process that takes place in the detector. The
dynamics of nuclear track formation in polymers is quite complex and depends on
the charge and energy of the incident particles. Benton proposed the Restricted
Energy Loss (REL) model to explain the formation of the track core of relativistic
high and low energy heavy ions; it uses a cut-off delta ray energy (200 eV for CR39
and 350 eV for Makrofol), considering that the outer part of the track does not take
part in the etching process and does not contribute to the track formation [13].
The study of the fragmentation properties of high energy atomic nuclei is of
relevance for nuclear physics, cosmic ray physics and astrophysics. For instance,
fragmentation cross sections are needed to evaluate the changes in composition
undergone by cosmic ray particles in the collisions with the interstellar medium.
The fragmentation of relativistic heavy ions from accelerators has been studied
by many research groups using NTDs [14-18]. Several heavy ion experiments at
relativistic energies have been performed with Si (14.6A GeV/c) and Au (11.6A GeV/c)
ions at the BNL-AGS and with O (200A GeV/c), S (200A GeV/c) and Pb (158A GeV/c)
ions at the CERN-SPS.
Heavy ion reactions like relativistic Pb82+
in different targets are of great
interest since various reaction products covering a wide range of mass and charge are
emitted after the fragmentation of beam ions. Experimental studies of energetic Fe26+
ions are of interest for space radiation research, especially to quantify the risk related
to the exposure to the galactic cosmic radiation [34-38]. The reactions of light ion
beams C6+, Si
14+ with light targets like CH2 offer favourable conditions for the study
of fragmentation in the treatment of deep-seated tumours in cancer therapy [39-40].
Thus, fragmentation processes of atomic nuclei induced by energetic ions have
recently been getting more attention then ever.
The response of NTDs exposed to a wide spectrum of charges and energies has
been established in many papers [7, 12, 18]. The major focus in this work lies in the

3
identification of charged fragments produces in the collisions of relativistic heavy ions
with thick targets. Such identification leads to the determination of the total and partial
charge-changing fragmentation cross sections, useful for applications in different
disciplines [18-24].
H. Dreschel et al. [25] used NTDs as targets and detectors to measure the
mean free path of relativistic heavy ions. A. Noll and collaborators [26-27]
developed an automatic scanning system for applications in high energy heavy ions
for calibrating NTDs, for measuring the total and partial charge changing
fragmentation cross section relevant in nuclear and cosmic ray physics, and for
radiobiological studies [28-30]. Westphal et al. used BP-1 glass detectors calibrated
with relativistic gold and lead beams (the detector provided charge resolutions of
0.3< σz < 0.4) for the analysis of cosmic ray composition [31-33].
In this thesis, after a theoretical introduction, I shall first discuss the
improvements made on etching and measuring methods for CR39 and Makrofol
nuclear track detectors. Then their calibrations performed with different ions of
different energies are considered in detail.
The use of CR39 and Makrofol detectors in the search for intermediate mass
magnetic monopoles, nuclearites and q-balls in a large area experiment at high
altitudes (SLIM) is then discussed, and strong limits are presented. Finally the
measurements of the fragmentation cross sections of different ions of various
energies in different targets are considered and the results obtained are discussed.
4
2. Nuclear Track Detectors
2.1 Introduction
When an ion crosses a nuclear track detector foil, it produces damages at the
level of molecular bonds (~ few tens of nm) along its trajectory, as a result of the
excitation and ionization of atoms, forming the so called “latent track”. In crystals, the
latent tracks consist of atomic displacements whereas in plastic materials the damage
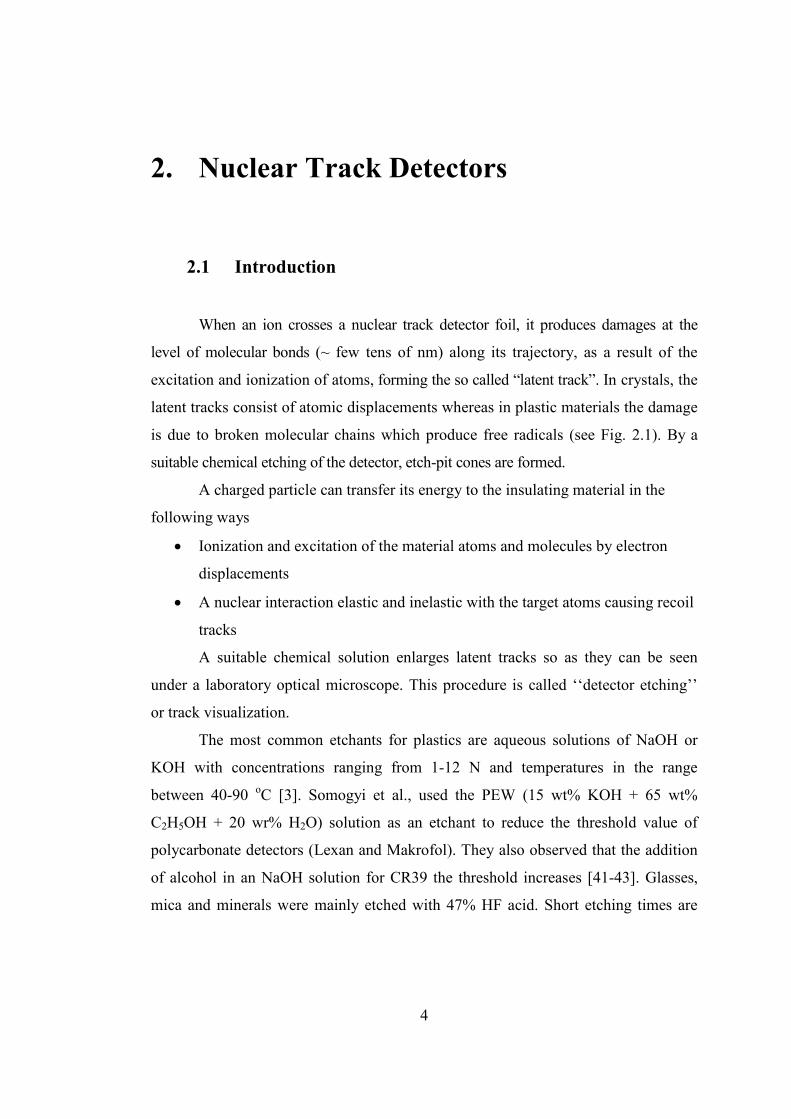
is due to broken molecular chains which produce free radicals (see Fig. 2.1). By a
suitable chemical etching of the detector, etch-pit cones are formed.
A charged particle can transfer its energy to the insulating material in the
following ways
• Ionization and excitation of the material atoms and molecules by electron
displacements
• A nuclear interaction elastic and inelastic with the target atoms causing recoil
tracks
A suitable chemical solution enlarges latent tracks so as they can be seen
under a laboratory optical microscope. This procedure is called ‘‘detector etching’’
or track visualization.
The most common etchants for plastics are aqueous solutions of NaOH or
KOH with concentrations ranging from 1-12 N and temperatures in the range
between 40-90 oC [3]. Somogyi et al., used the PEW (15 wt% KOH + 65 wt%
C2H5OH + 20 wr% H2O) solution as an etchant to reduce the threshold value of
polycarbonate detectors (Lexan and Makrofol). They also observed that the addition
of alcohol in an NaOH solution for CR39 the threshold increases [41-43]. Glasses,
mica and minerals were mainly etched with 47% HF acid. Short etching times are
5
adequate for the observation of high REL particles and long etching times are
required for low REL particles [44].
CR39 NTDs were successfully applied to observe nuclei with Z/β values
from 5 to 83 [7-8]. The sensitivity, resolution and optical properties of CR39 are the
best among other track recording detectors. Even after dissolving 500 µm thickness
by etching, the surface of the detector remains smooth. It is widely used in heavy ion
research, e.g. composition of cosmic rays, heavy ion nuclear reactions, radiation dose
due to heavy particles, explorations of extra heavy elements and search for magnetic
monopoles, etc.
Fig. 2.1 A latent track is formed in (a) inorganic solids by the ionization and
production of dense positive ions along the ion path and (b) the breakage of polymeric
chains by the passage of charged particle.

6
CR39 ® MAKROFOL ®
Poly-allyl-diglycol-carbonate Polycarbonate films
Composition: C12H18O7 C16H14O3
Density: 1.32 (g cm-3) 1.29 (g cm
-3)
Refrective index (ηηηη): 1.504 1.584
High light transmission, High light transmission
High surface uniformity
Table 2.1 Etching conditions for some commonly used nuclear track detector.
Material Etching Condition Time
Makrofol polycarbonates manufactured by a casting process into the form of
thin sheets by Bayer AG of Leverkussen, West Germany, have the same chemical
composition (C16H14O3) as Lexan, a polycarbonate manufactured by the General
Electric Co. of USA. The shape of tracks produced by heavy ions and fission
fragments in Makrofol are needle like with a slight spread towards their tail. They
also offer a very convenient way of detecting heavy ions in the study of the
7
composition of very heavy cosmic rays, heavy ion nuclear reactions, exploration of
super heavy elements, etc.
The shape of an etched track in a certain NTD depends on the charge, mass
and velocity of the incident particle and also on the track detection conditions, the
type of chemical solution, normality and temperature of the etchant. A
comprehensive summary of the materials that show the track effect is given in Table
1 [45].
2.2 Track Registration Mechanisms
Many track registration criteria have been proposed for the formation of an
etchable latent track in the detector material, which mainly depends on the charge,
mass and velocity of the incoming particle plus the detector characteristics i.e. the
density and chemical composition. Here we quote briefly only three of them.
2.2.1 Total Energy Loss (dE/dx)
According to this criterion the formation of an etchabale track is possible if
the total energy loss (dE/dx)>critical exceeds a certain critical value which depends on
the detector material. Fleischer et al., [46], first proposed it; they used different
projectiles having different Z/β values in mica and polycarbonate detectors. The
criterion explains the track formation for low energy ions but at high energy it seems
to fail to reproduce some experimental data. The main shortcoming of this criterion
is that it neglects the primary ionization for the track formation.
The total energy loss is given by [46]
∆+−−
= L
I
cmZ
A
ZrcmN
dxdE e
eeA2
2ln4 2
222
2
2
1
2
222 δβ
γββ
π (2.1)
where
NA = Avogadro’s number

8
re = classical electron radius
Z2 = Target atomic number
A2 = target mass number
I = mean ionization potential of the target material
Z1 = effective charge of the incident ions; ( )[ ]32
111 130exp1 ZZZ β−−=
δ = correction for the density effect
∆L = sum of corrections needed for precision measurements
2.2.2 Primary Ionization loss (J)
A new criterion was proposed by Fleischer et al., [47]: the δ-rays are
produced directly by the incident ion and this is based on the ion explosion spike
model. The material can record an etchable track only if the linear ion density
produced by the primary particle along its trajectory is greater than a critical value
for that material. The primary ionization (dJ/dx) is given by [47]
+−−
= K
I
cm
I
fZ
A
ZrcmN
dxdJ
outer
e
outer
outereeA δβ
γββ
π 2222
2
2
1
2
222 2ln2 (2.2)
where
Iouter = binding energy of the outermost electron (~2 eV)
fouter = fraction of electrons in the outer state (0.05)
K = constant for target properties (3.04)
The other quantities have the same meaning as in eq. (2.1). Primary
ionization fits the experimental data for heavy ions, but it is subjected to the
following criticisms:
• It does not take into account the primary ionization for the emission of very
low energy δ-rays.
• The value Iouter ~ 2 eV may be sufficient to excite the atoms but not enough to
ionize the atoms. To ionize an atoms one needs about 10-15 eV.
9
• The model neglects the higher order of ionization produced by the δ-rays
(which is controversial).
2.2.3 Restricted Energy Loss (REL)
Benton et al., [13] proposed in 1955 that only the δ-rays emitted with an
energy less than a value ωo contribute to the track formation. An etchable track is
formed only if the REL exceeds a critical value of the detecting material. The REL
(MeV cm2 g
-1) is calculated as [13]
−−
=
=< 2
2ln4 2
2
222
2
2
1
2
222 δβ
ωγββ
πωω I
cmZ
A
ZrcmN
dxdE
REL oeeeA
o
(2.3)
where
ωo = the energy cut-off value; ~ 200 eV in CR39 and ~ 350 eV in Makrofol or
Lexan. The other quantities have the same meaning as in eq. (2.1).
The REL model fits better the experimental data at low and relativistic
energies for a wide range of incident ions [7, 8, 12].
2.3 Methodology of Track Detection and Visualization
2.3.1 Track detection
The latent damage trail formed in NTDs may be enlarged and detected by
preferential chemical etching or electrochemical etching.
The shape of a track formed by a charged particle is governed by the
simultaneous actions of the etchant along the latent track and on the bulk material. A
schematic diagram of chemical etching of a charged particle in a NTD is shown in
Figure 2.1. For reproducibility of results, the quality of etchant should be controlled

10
carefully: fresh etchants and uniform stirring should be used to avoid deposits of etch
products on the detector surface and in its build up inside the solution [48-49].
2.3.2 Bulk etch rate (vB)
The bulk etch rate vB is defined as the rate at which the undamaged material
of the detector is etched out. It depends on the types of the etching condition; it may
vary with depth below the original surface.
Generally, the following techniques are employed for the measurement of the
bulk etch rate of the detector:
i. Thickness measurement method
ii. Track diameter method
iii. Change in detector mass method
Fig. 2.2 (a) Sketch of a NTD track and (b) etched α tracks in a CR39 detector.
2.3.2.1 Thickness measurement method
For the determination of vB the thickness of the detector is measured in
selected points. The detector is then etched for fixed intervals of time ∆t and the
thickness is measured after each successive etching step. The bulk etch rate is given
by
(b)
(a)
11
vB = ∆x /2∆t (2.4)
where ∆x is the thickness variation after etching time ∆t. It is assumed that the bulk
etching is the same on both sides of the detector. By plotting ∆x as a function of
etching time t and by a given it of the data points the bulk etch rate can be
determined.
2.3.2.2 Track diameter measurement method
If vT/vB >> 1 as in the case of fission fragments from a 252
Cf source in CR39,
the track diameter measurement technique can be applied for the determination of vB
as [44].
1
12
+−
=p
phD ff (2.5)
where Dff is the diameter of fission fragments, p = vT/vB and h is the thickness
removed from both sides of the detector during an etching time t. If p >> 1 the above
eq. can be written as
Dff ≅ 2h (h = vBt)
Dff ≅ 2 vBt
vB = Dff/2t (2.6)
2.3.2.3 Mass Change method
The bulk etch rate may be determined from the change in the mass of the
detector ∆m before and after etching. From the measurements of ∆m and the density
of the detector material, vB can be calculated as
tAm
vB ρ2
∆= (2.7)

12
where A is the surface area, ρ is the density of the detector and t is the etching time.
Care must be taken in determining ∆m of the same relative humidity.
2.3.3 Track etch rate (vT)
The track etch rate vT is defined as the rate at which the detector material is
chemically etched along the damage trail of the particle trajectory, i.e. as the rate at
which the tip of the etch cone moves along the latent track during the etching
process. The track etch rate depends on the energy loss of the incoming particle, the
temperature and concentration of the etchant.
2.3.4 Critical angle of etching (θc) and registration efficiency (η)
Fig. 2.3a shows the trajectory of a charged particle incident at an angle θ with
respect to the detector surface. After an etching time t, the etched track length along
the particle trajectory is vTt and the thickness of the bulk material removed is vBt; the
trajectory is observed as an etched cone if the vertical component of (vTt) > vBt. For
(vTt) = vBt one has the critical angle θc; measured with respect to the detector
surface. Particles incident with θ < θc cannot be detected. θc is an important
parameter for NTDs, since it is connected with the detector efficiency. The track
registration efficiency existence strongly depends on the critical angle.
NTDs have low critical angles for high REL nuclei like fission fragments and
large critical angles for low REL particles, like protons and low Z nuclei (for these in
CR39 θc varies from 2o to 5
o) [50, 51].
The track registration efficiency η of NTDs is defined as
cθη sin1−= (2.8)
From this expression it is clear that for small critical angles one has large
track registration efficiencies. High registration efficiencies (85-99%) are found for
most plastic NTDs having critical angles of 2 - 5o.

13
Fig. 2.3 Track geometry at different dip angle conditions: (a) formation of the post
etched cone for a particle with an incident angle θ > θc (vTt > vBt), (b) limiting case when the
incident angle θ =θc (vTt > vBt) and (c) no track is detected if the incident angle θ <θc (vTt <
vBt).
2.3.5 Track geometry at normal incidence
Fig. 2.4 shows the track geometry in NTDs for particles at normal incidence
and constant REL: the basic quantities are the base cone diameter, major and minor
axes, the cone height of the etched track, the “bulk” etch rate “vB” and the track-etch
rate vT. The ratio of track-etch rate to bulk-etch rate is the “signal” or sensitivity “p”
of the detector material (p= vT/vB). In general the chemical solution etches the
surface of the detector material at a lower rate (vB at both sides of the detector)
compared to the damaged region where the etchant attacks at faster rate vT. Since it is
difficult to measure the track etch rate during etching, its value is determined from
the geometry of an etch-pit [43].

14
Fig. 2.4 Track geometry for a charged particle impinging at normal incidence in a
nuclear track detector.
The following relations hold for normal incidence geometry (Fig. 2.4):
Le = (vT − vB )t (2.9)
vB = ∆x /2∆t (2.10)
The semi cone angle δ of the etched cone is
pv
v
T
B 1sin ==δ (2.11)
From eq. 2.9 the track etch rate vT is
Original surface
Etched surface

15
vT = vB +Let (2.12)
The relations between ‘D’ ‘vT’, ‘vB’ and ‘p’ are
D = 2vB t(vT − vB )(vT + vB )
(2.13)
( )( )2
2
2/1
2/1
tvDtvD
pB
B
−+
= (2.14)
)(1
)(122
22
tvA
tvAp
B
B
ππ
−
+= (2.15)
The error on p can be calculated from the following relations
2
22
22
2
22
222
1
.2
41
.
−
∆=∆
−
∆=∆
∆=∆
tvA
tv
Ap
tv
Dtv
DDp
tv
Lp
BB
BB
B
e
ππ
(2.16)
Eq. 2.9-2.15 are apply to any particle of constant energy loss such as
relativistic ions, magnetic monopoles and nuclearites.
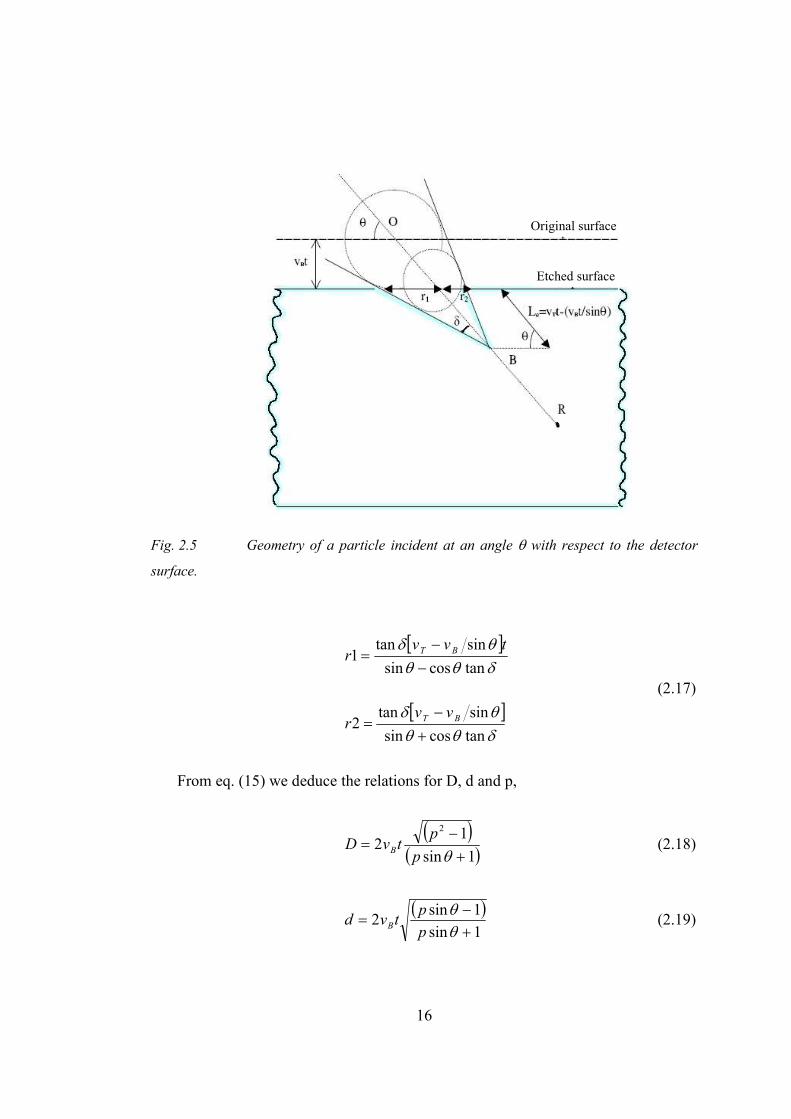
2.3.6 Track Geometry at Oblique Incidence
Fig. 2.5 shows the geometry of a particle incident at an angle θ w.r.t. the
detector surface and constant REL. The following geometrical relations can be
deduced from Fig. 2.5:
16
Fig. 2.5 Geometry of a particle incident at an angle θ with respect to the detector
surface.
[ ]
[ ]δθθθδ
δθθθδ
tancossin
sintan2
tancossin
sintan1
+
−=
−
−=
BT
BT
vvr
tvvr
(2.17)
From eq. (15) we deduce the relations for D, d and p,
( )( )1sin
12
2
+
−=
θp
ptvD B (2.18)
( )1sin
1sin2
+−
=θθ
pp
tvd B (2.19)
Original surface
Etched surface

17
( )22
2
1
41
B
Ap
−+= (2.20)
where A = (D/2vBt) and B = (d/2vBt) and
−+
=2
2
1
1.
1arcsin
B
B
pθ (2.21)
18
3. Magnetic Monopoles and Nuclearites
3.1 Magnetic Monopoles
In 1931, P.A.M. Dirac proposed that particles with magnetic charge could
exist and that the existence of these particles would in turn imply quantization of
electric charge [52]. He established a relation between the elementary electric charge
‘e’ and a basic magnetic charge ‘g’:
eg = nħc/2 (3.1)
nn
e
gn
c
ge5.68
22≈=⇔=
αh
Dirac magnetic monopoles lose much energy in matter because of the large value of
the charge ‘g’; n is an integer, n = 1, 2, 3,…
There was no prediction for the MM mass; a rough estimate, obtained
assuming that the classical monopole radius is equal to the classical electron radius,
yields mM ≃ g2me /e
2 ≃ n 4700 me ≃ n 2.4 GeV/c
2. From 1931 searches for “classical
Dirac monopoles” were carried out at every new accelerator using simple setups, and
recently also large collider detectors.
Electric charge is naturally quantized in Grand Unified Theories (GUT) of the
basic interactions; they imply the existence of GUT monopoles with calculable
properties. The MMs appear in the Early Universe at the phase transition
corresponding to the breaking of the unified group into subgroups, one of which is
U(1) [53]. The MM mass is related to the mass of the X, Y carriers of the unified
interaction, mM ≥ mX/G, where G is the dimensionless unified coupling constant at
the energy E ≃ mX. If mX ≃ 1014 - 10
15 GeV and G ≃ 0.025, mM > 10
16 - 10
17 GeV.

19
This is an enormous mass: GUT MMs cannot be produced at any man made
accelerator, existing or conceivable. They may have been produced only in the first
instants of our Universe.
Intermediate Mass Monopoles (IMMs) with mM∼107÷10
13 GeV may have
been produced in later phase transitions in the early Universe and may be accelerated
to relativistic velocities in one galactic coherent magnetic field domain. Relativistic
IMMs could yield the highest energy cosmic rays [54-58].
The lowest mass MM is stable, since magnetic charge is conserved like
electric charge. Thus the poles produced in the Early Universe should still exist as
cosmic relics; their kinetic energy was affected by the Universe expansion and by
travel through galactic and intergalactic magnetic fields. GUT poles are best
searched for underground in the penetrating cosmic radiation (CR). IMMs may be
searched for at high altitude laboratories.
3.1.1 Properties of Magnetic Monopoles
The main properties of MMs are obtained from the Dirac relation:
Magnetic Charge: If n =1 and the basic electric charge is that of the electron, then
the basic magnetic charge is gD = h c/2e = 137e/2; the charge is larger if n > 1 and if
the basic electric charge is e/3, see eq. 3.1.
Magnetic Coupling Constant: Similarly the fine structure constant, α = e2/h c ⋍
1/137, the dimensionless magnetic coupling constant is obtained as αg = g2D/h c ⋍
34.25.
Energy: In a magnetic field B, a MM can gain the energy W = ngDBℓ = n 20.5
keV/G cm. In a coherent galactic length (ℓ ⋍ 1 kpc, B ⋍ 3 µG), the energy gained by
a MM with g = gD is W ⋍ 1.8 × 10¹¹ GeV. Classical poles and IMMs in the CR may
be accelerated to relativistic velocities.
Energy Losses of Fast MMs: A fast MM with magnetic charge gD and
velocity v = βc behaves like an electric charge (ze)eq = gDβ
20
Energy Losses of Slow MMs: (10-4 < β < 10
-2) MMs may lose energy by
ionization or excitation of atoms and molecules of the medium (“electronic” energy
loss) or to recoiling atoms or nuclei (“atomic” or “nuclear” energy loss). Electronic
energy loss predominates for β > 10-3.
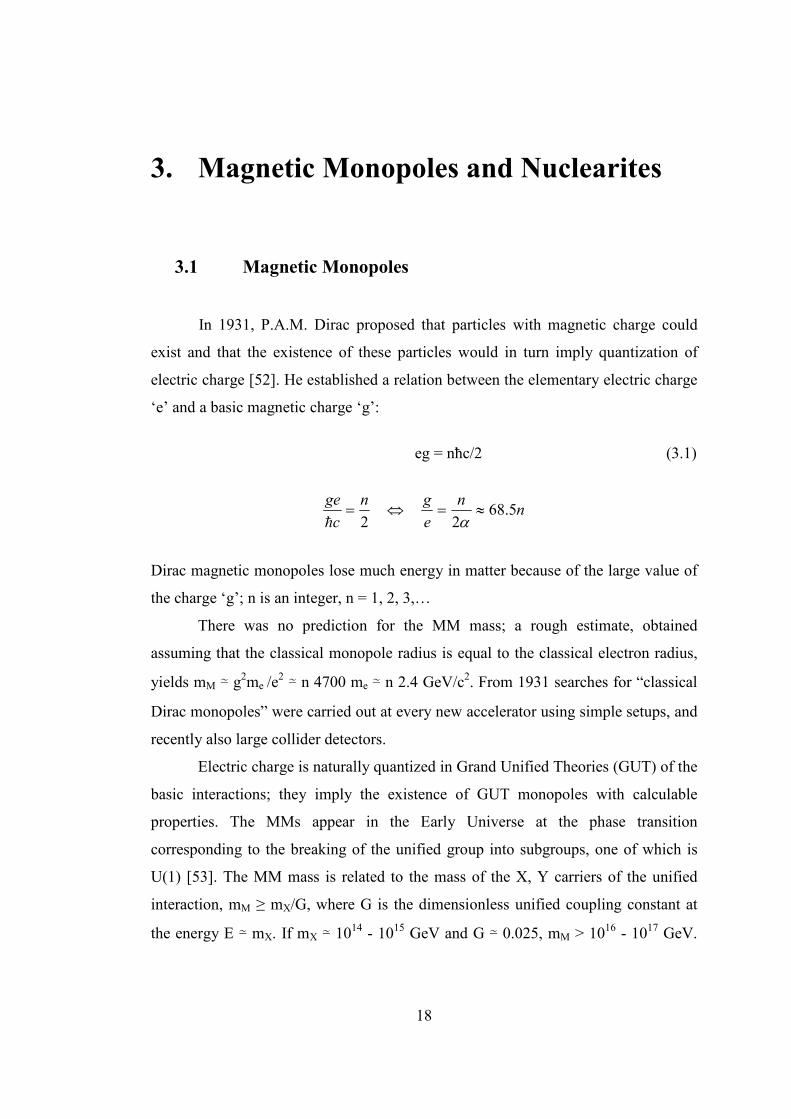
Energy losses of very low velocities MMs: MMs with v < 10-4c may lose
energy in elastic collisions with atoms or with nuclei. The energy is released to the
medium in the form of elastic vibrations and/or infra–red radiation [59]. Fig. 3.1
shows the energy loss in liquid hydrogen of a g = gD MM vs β [55].
Energy Loss of MMs in Celestial Bodies: For β < 10-4 the dE/dx in the Earth is due
to pole-atom elastic scattering, eddy currents, and nuclear stopping power. MMs may
be stopped by celestial bodies if they have velocities less than the escape velocity
for:
Moon: β ≤ 5 × 10⁻⁵, Earth: β ≤ 10
-4, Sun: β ≤ 10
-3.
Fig. 3.1 The energy losses, in MeV/cm, of g = gD MMs in liquid hydrogen vs β. Curve
a) corresponds to elastic monopole–hydrogen atom scattering; curve b) to interactions with
level crossings; curve c) describes the ionization energy loss.
21
3.2 GUT Magnetic Monopoles
According to the standard model of the Big Bang, the Universe started as a
very small size state of extremely high density and high temperature. As time
progressed, the dimension of the Universe increased, the density and temperature
decreased, while the particle composition changed. The Grand Unification of strong
and electroweak interactions ended when the temperature dropped below ~1032
K
(∼1016 - 10
17GeV). At that moment, ~10
-35s after the Big Bang, the phase
transition is thought to have occurred during which the GUT monopoles were created
as topological defects.
The simplest GUT theories yield too many monopoles, while the inflationary
scenario leads to a very small number of monopoles.
( ) emc
GeV
YL
GeV USUUSUSUSU )1()3())1()2(()3(5215 1010 × →×× →
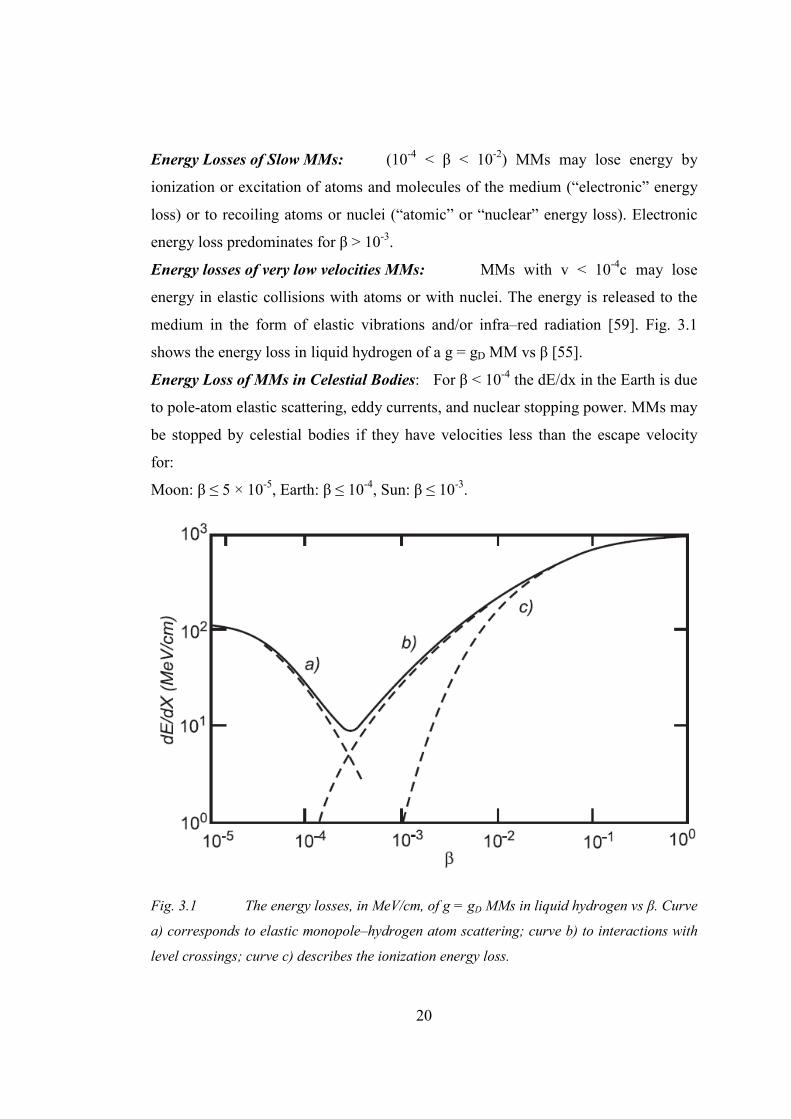
Fig. 3.2 A massive GUT MM structure with different regions (for details see text).
22
GUT MMs can be searched for as remnant particles in the penetrating cosmic
radiation.
The spatial structure of a GUT pole (with mM ~ 1019 GeV) may be pictured
as (see Fig. 3.2): i) a core with radius rc ≈ 1/mX ≈ 10-29 cm, virtual X and Y particles
are inside this region; ii) a region up to r ≈ 10-16 cm, where virtual W+ , W
- and Z
0
may be present; iii) a confinement region with rconf. ≈ 1 fm; iv) a fermion–
antifermion condensate region up to rf = 1/mf ; the condensate may contain 4-fermion
baryon number violating terms; v) for r ≥ 3 fm a GUT MM behaves as a point
particle which generates a field B = g/r2.
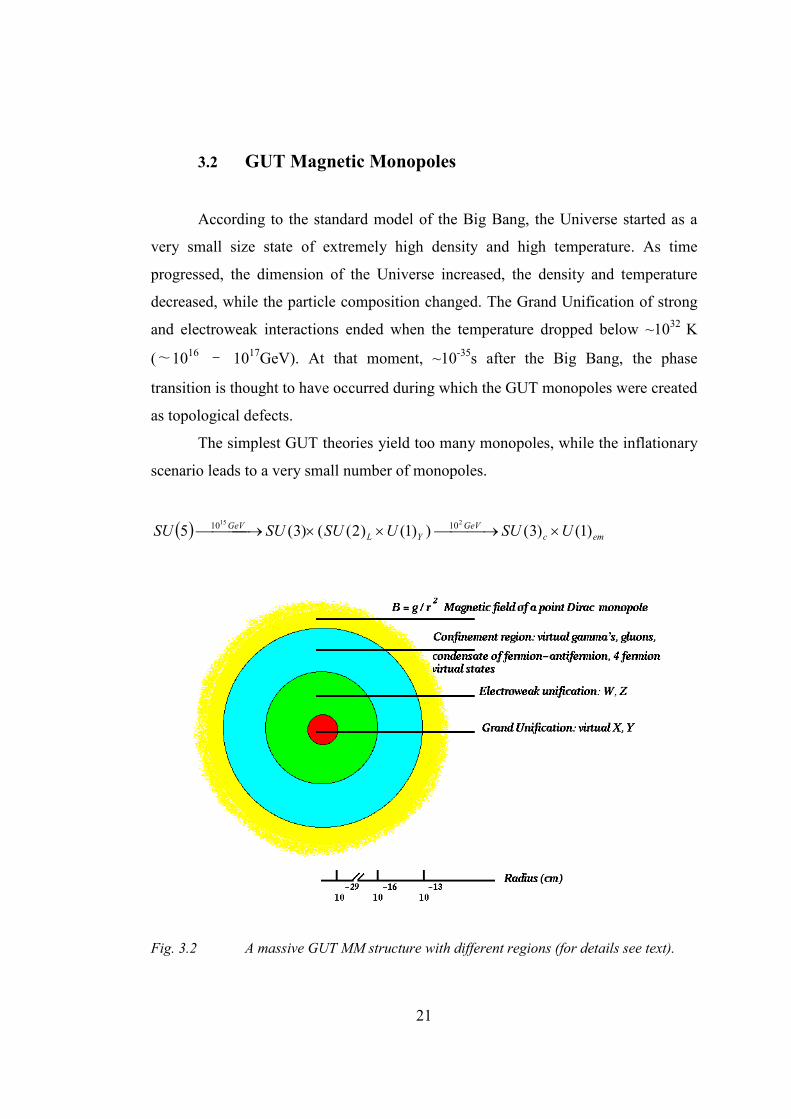
Fig. 3.3 The experimental 90% C.L. upper flux limits for magnetic monopoles
obtained with MACRO electronic and passive detectors; also the results obtained by other
experiments, are shown.
A flux of GUT MMs may reach the Earth with a velocity spectrum in the
range 4x10⁻⁵ < β < 0.1, with possible peaks corresponding to the escape velocities of
the Earth, Moon, Sun and the Galaxy. Searches have been performed for MMs in the
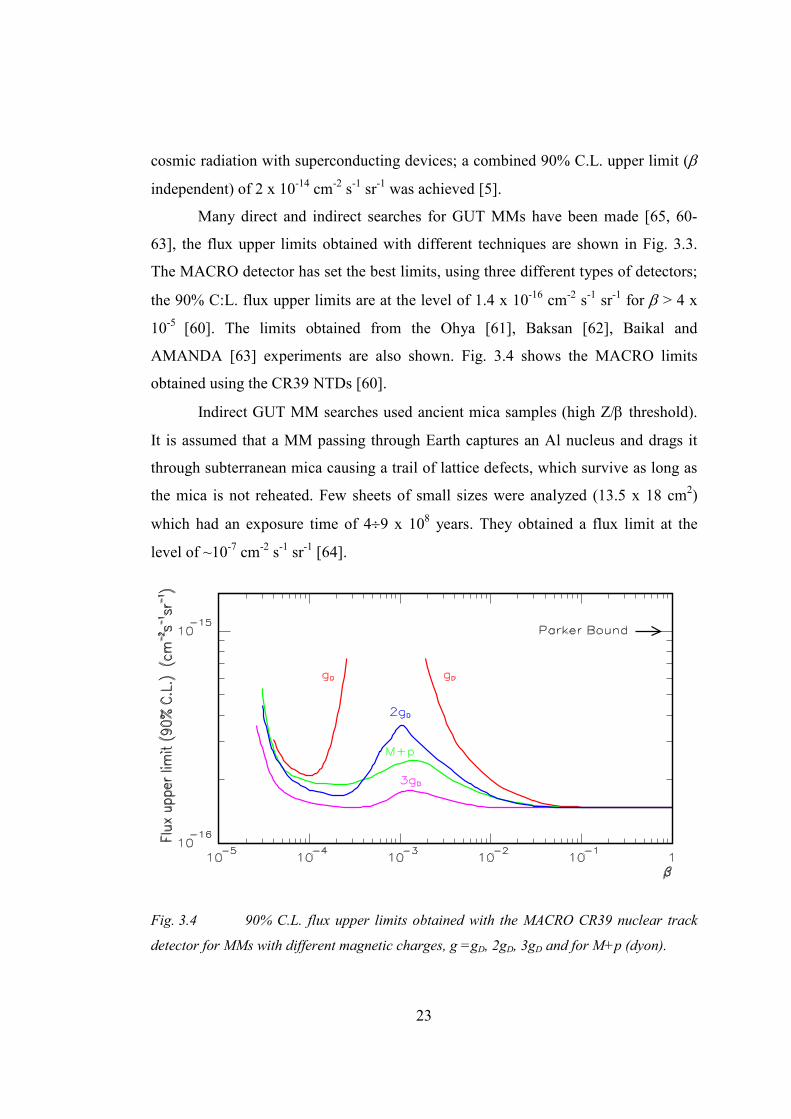
23
cosmic radiation with superconducting devices; a combined 90% C.L. upper limit (β
independent) of 2 x 10-14 cm
-2 s-1 sr
-1 was achieved [5].
Many direct and indirect searches for GUT MMs have been made [65, 60-
63], the flux upper limits obtained with different techniques are shown in Fig. 3.3.
The MACRO detector has set the best limits, using three different types of detectors;
the 90% C:L. flux upper limits are at the level of 1.4 x 10⁻¹⁶ cm
-2 s
-1 sr
-1 for β > 4 x
10-5
[60]. The limits obtained from the Ohya [61], Baksan [62], Baikal and
AMANDA [63] experiments are also shown. Fig. 3.4 shows the MACRO limits
obtained using the CR39 NTDs [60].
Indirect GUT MM searches used ancient mica samples (high Z/β threshold).
It is assumed that a MM passing through Earth captures an Al nucleus and drags it
through subterranean mica causing a trail of lattice defects, which survive as long as
the mica is not reheated. Few sheets of small sizes were analyzed (13.5 x 18 cm2)
which had an exposure time of 4÷9 x 10⁸ years. They obtained a flux limit at the
level of ~10-7 cm
-2 s-1 sr
-1 [64].
Fig. 3.4 90% C.L. flux upper limits obtained with the MACRO CR39 nuclear track
detector for MMs with different magnetic charges, g =gD, 2gD, 3gD and for M+p (dyon).
24
Detectors at the earth surface could detect the MMs coming from above with
masses larger than 105 to 10
6 GeV [59]. Lower mass MMs can be detected with
detectors installed at the high altitudes, with balloon experiments and in space. Few
experimental results are available, The SLIM experiment will provide the best limits
for the detections of IMMs for g = gD in the β range 4 x 10⁻⁵ < β < 3 x 10⁻⁴ and for β
> 2 x 10⁻³, and for g > 2gD for all beta range.
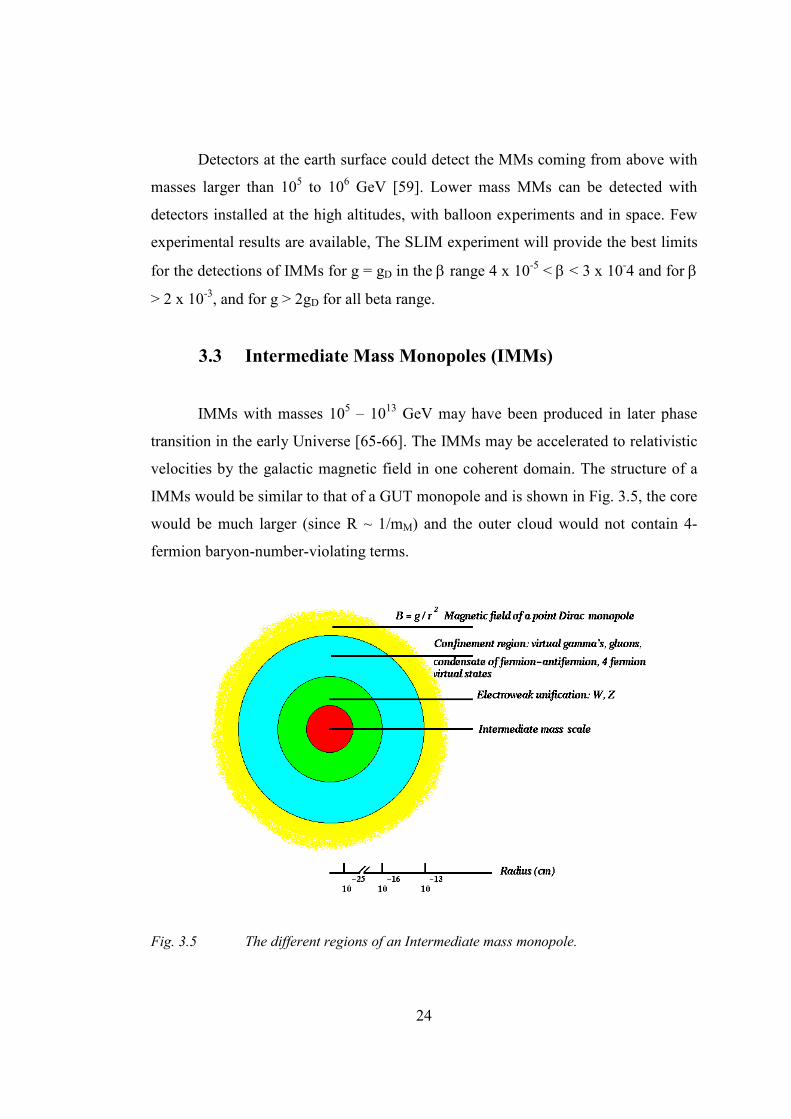
3.3 Intermediate Mass Monopoles (IMMs)
IMMs with masses 105 – 10
13 GeV may have been produced in later phase
transition in the early Universe [65-66]. The IMMs may be accelerated to relativistic
velocities by the galactic magnetic field in one coherent domain. The structure of a
IMMs would be similar to that of a GUT monopole and is shown in Fig. 3.5, the core
would be much larger (since R ~ 1/mM) and the outer cloud would not contain 4-
fermion baryon-number-violating terms.
Fig. 3.5 The different regions of an Intermediate mass monopole.
25
3.4 Astrophysical and Cosmological Limits
Rough upper limits for a GUT monopole flux in the CR were obtained on
the basis of cosmological and astrophysical considerations.
Mass Density Limit: Flux limits for GUT monopoles are obtained assuming
that the magnetic monopoles are uniformely distributed in the universe and their
mass density does not exceed to the critical mass density of the universe. For mM
~1017 GeV one has the limit:
).(cm 10x 3 4
112-212- −−<=Φ srshcn
oM ββπ
It is valid for poles uniformly distributed in
the Universe. If poles are clustered in galaxies the limit is weaker [58].
Parker Limit: The ~3 µG magnetic field in our Galaxy is probably due to
the non–uniform rotation of the Galaxy, which generates a field with a time–scale
of the order of the rotation period of the Galaxy (τ ~108 yr). An upper bound for the
MM flux is obtained by requiring that the kinetic energy gained per unit time by
MMs be less than the magnetic energy generated by the dynamo effect; one
obtaines: F < 10-15
cm-2 s-1 sr
-1 [68]; taking into account the almost chaotic nature of
the field, with domains of l ~ 1 kpc, the limit becomes mass dependent [69]. An
“extended Parker bound”, obtained by considering the survival of an early seed
field [68], yields Φ ~1.2 × 10⁻¹⁶ (mM/10
17GeV ) cm
-2 s-1 sr
-1.
3.5 Monopole Detectors
Monopole detectors are based on MM properties given by the Dirac relation.
Superconducting induction devices are sensitive to MMs of any velocity [57]. A
moving MM induces in a ring an electromotive force and a current change (∆i). For a
coil with N turns and inductance L, ∆i = 4πNngD/L = 2∆io, where ∆io is the current
change corresponding to a change of one unit of the flux quantum of
superconductivity. This method of detection is based only on the long–range
26
electromagnetic interaction between the magnetic charge and the macroscopic
quantum state of a superconducting ring.
Scintillation counters for MMs have a threshold β ~10-4, above which the
light signal is larger than that of a minimum ionizing particle [59, 70].
Gaseous detectors of various types have been used. MACRO used a gas
mixture of 73% helium and 27% n–pentane [70]. This allows exploitation of the
Drell [71] and Penning effects [58]: a MM leaves a helium atom in a metastable state
(He*) with excitation energy of ~20 eV, which is transferred as ionisation to a large
organic molecule.
It was shown that both the electronic and the nuclear energy losses are
effective in producing etchable tracks in the CR39 NTD [73]; CR39 allows to search
for MMs with g = gD for β around 10-4 and > 10-3, the whole β-range of 4 × 10⁻⁵ < β
< 1 for MMs with g ≥ 2gD [72]. The Lexan and Makrofol polycarbonates are
sensitive for Z/β ≥ 50 [73].
3.6 Interaction of Magnetic Monopoles with Matter
There is interest to know whether the quantity and quality of energy lost by
magnetic monopoles in the detectors is adequate for their detection. Classical poles
and IMMs can be accelerated to relativistic velocities. For such velocities the energy
losses are (g/e)2 ~ 4700 times the energy loss of a minimum ionizing electric charge.
Thus, the energy loss of a classical monopole would be enormous, more than enough
to be easily detected with almost any kind of particle detectors. Instead GUT poles
have large masses and are expected to have relatively low velocities, 10-4 < β < 10-1.
The study of energy losses of slow moving monopoles is thus of great practical
interest.
The interaction with matter of fast poles having velocities > 10-2 c is well
understood; a monopole with magnetic charge g behaves as an equivalent electric
charge (Ze)2 = g
2 β2
. The ionization energy losses may be described by the Bethe-

27
Bock formula as corrected by Ahlen [74, 75]; For an incoming particle with electric
charge Ze one has
−−−=
ee
e
e
e
e
e
BI
cm
cm
eZN
dx
dE2/
2ln
4 2
222
22
42
δβγβ
βπ
(3.2)
and for a magnetic monopole in a non conducting material
−−+−=
mm
m
m
e
e
e
m
BK
I
cm
cm
egN
dx
dE2/
22
12ln
4 222
2
22
δγβπ
(3.3)
where Km = 0.406 for poles with g = gD (0.346 for g = 2gD), β=v/c, γ2 = 1/(1 - β2
),
Ne is the number density of electrons, me is the electron mass, Ie,m and δe,m are the
mean ionization potential and density effect corrections for the electric and magnetic
projectiles.
For slow monopoles (10-4 < β < 10-2), it is important to distinguish the energy
lost in ionization or excitation of atoms and molecules of the medium (“electronic”
energy loss) from that lost to yield kinetic energy to recoiling atoms or nuclei
(“atomic” or “nuclear” energy loss). Electronic energy loss predominates for
electrically or magnetically charged particles for β > 10-2. The dE/dx of MMs with
10-4 < β < 10-3 is mainly due to excitations of atoms.
Energy losses of very low velocity monopoles, i.e. with β < 10-4, cannot
excite atoms; they can only lose energy in elastic collisions with atoms or with
nuclei.
3.6.1 Energy losses of magnetic monopoles in the Atmosphere
We use the same approach as the one used by the MACRO collaboration for
their detection in the streamer tubes. This approximation can be reasonable for the
lowest layers of atmosphere where the density is of the same order as in the steamer
tube one.
28
At high velocities: β > 0.05, the formula that holds for the MM ionization energy
losses is the usual one, used by Derkaoui et al. [59]
−+−
γβπ=− m
e
e
e BkI
cmLn
cm
egN
dxdE
22124 222
2
22
(3.4)
where Ne is the density of electrons in the medium, me the electron mass, g the
magnetic charge of the monopole (g = n × gD) and I the mean ionization potential in
air. The QED correction k and the Block correction Bm parameters are given by [59].
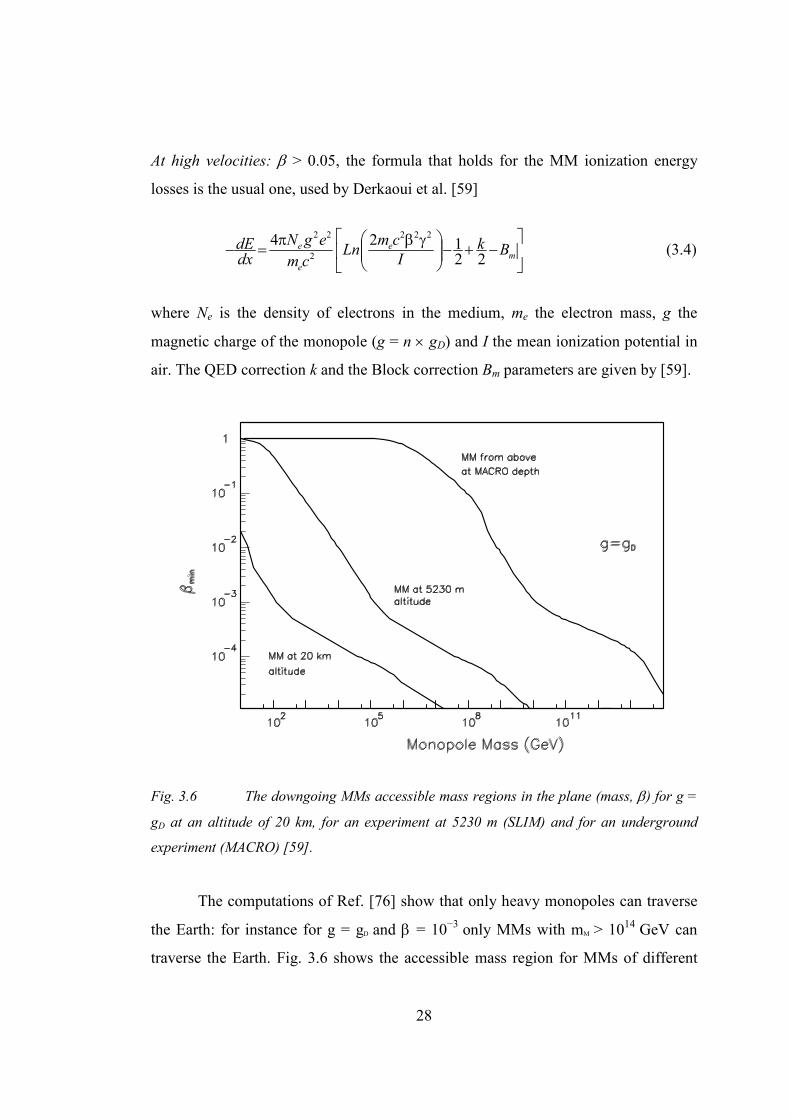
Fig. 3.6 The downgoing MMs accessible mass regions in the plane (mass, β) for g =
gD at an altitude of 20 km, for an experiment at 5230 m (SLIM) and for an underground
experiment (MACRO) [59].
The computations of Ref. [76] show that only heavy monopoles can traverse
the Earth: for instance for g = gD and β = 10−3 only MMs with mM > 1014
GeV can
traverse the Earth. Fig. 3.6 shows the accessible mass region for MMs of different

29
velocities coming from above; for g = gD and β = 10−3 a MM must have mM > 1010
GeV, 105 GeV, 10
2 GeV in order to reach the underground MACRO detector; the
SLIM detector at 5230 m altitude and for a detector at a height of 20 km, respectively
[77, 78, 29].
3.6.2 Energy losses of magnetic monopoles in CR39
The REL in CR39 has been calculated for MMs [88, 31]. For β > 0.05, the
REL for MMs are obtained excluding the energy transfer due to high energy δ-rays.
( )
>
−
−−
<
−
−
=
εβεβ
ω
ω
εβω
εγβω
112
11123.1
12
11123.1
2
2
22
2
22
ifb
cLn
c
g
ifb
cLn
c
g
REL
p
p
p
p
(3.5)
where ωp is the plasma frequency given by: e
epm
eN
22 4πω = , Ne is the electronic
density in the medium and me the electron mass. ε is given by
pI ωεε h562.01 =− , I being the mean ionization potential,
0
22
123.1
ωcm
cb
e
h= is the
minimum impact parameter below which production of δ-rays occur. For CR39: ω0 =
200 eV, I = 73 eV, ε = 1.6 and ρ = 1.32 g/cm3.
For β < 0.05 there are two contributions to the restricted energy loss: the
contribution due to ionization and the contribution due to elastic recoils. In the range
3×10⁻⁴ <β < 10-2, the Ahlen-Kinoshita formula [78] for non conductors is used:
−= 5.02
ln2 0
22
h
avm
mcv
egN
dx
dE Fe
F
e βπ (3.6)

30
where Ne is the density of electrons, a0 is the Bohr radius and ( ) 3/123 e
e
F Nm
v πh
= is
the Fermi velocity of the free electrons in the medium. For Lexan, vF ~ 2.59×10⁸
cm/s. The result in REL vs β is shown in Fig. 3.7. The bump in REL is due to elastic
recoil contribution at low velocity
Fig. 3.7 The Restricted energy loss of MMs vs β in CR39 NTDs. The solid and doted
lines show the different detector threshold.
3.7 Nuclearites (Strange Quark Matter)
Witten proposed the possible existence of the Strange Quark Matter (SQM)
[79]; namely an aggregate consisting of approximately equal numbers of u (up), d
(down) and s (strange) quarks. SQM has an integer electric charge which is
SLIM CR39 (soft)
SLIM CR39 (strong)
SLIM Makrofol (soft)

31
neutralised by an electron cloud surrounding it and forming a sort of atom, see Fig.
3.8.
SQM could have been produced in the early Universe just after the Big Bang
and may have survived as remnant or it may also be produced in violent
astrophysical processes such as in neutron stars collisions and quarks stars [80-83].
Their existence may address the problem of cold dark matter and of exotic events in
the cosmic radiation, also other possibilities have been mentioned [37]
SQM is expected to have a density slightly larger than ordinary nuclear
matter; the relation between the mass M of SQM lumps and their baryonic number A
(one third of the number of constituent quarks) would be
M(GeV) ≤ 0.93A (3.7)
An upper limit for the flux of SQM in the CR (also called nuclearite) may
be obtained assuming that they represent the main contribution to the local Dark
Matter (DM) density,
M
vDM
πρ2
max =Φ (3.8)
where v and M are the nuclearite average velocity and mass, respectively and the
density of the dark matter is 324 /10 cmgDM
−≈ρ
Searches for nuclearites were performed by different experiments [61-64].
The best flux upper limit was set by the MACRO experiment: for nuclearites with
β ~10-3, the 90% C.L. upper limit is at the level of 2 × 10-16
cm-2sr
-1s-1 for the mass
range 1014 GeV < M < 10
22 GeV [60,61].
If RN is the radius of the nuclearite core the system core + electronic cloud
(nuclearite) should have a constant radius of ~ 1 Aº for RN ≤1A
o
. For greater radii all
electrons must be inside the quark bag, see Fig. 3.8.
32
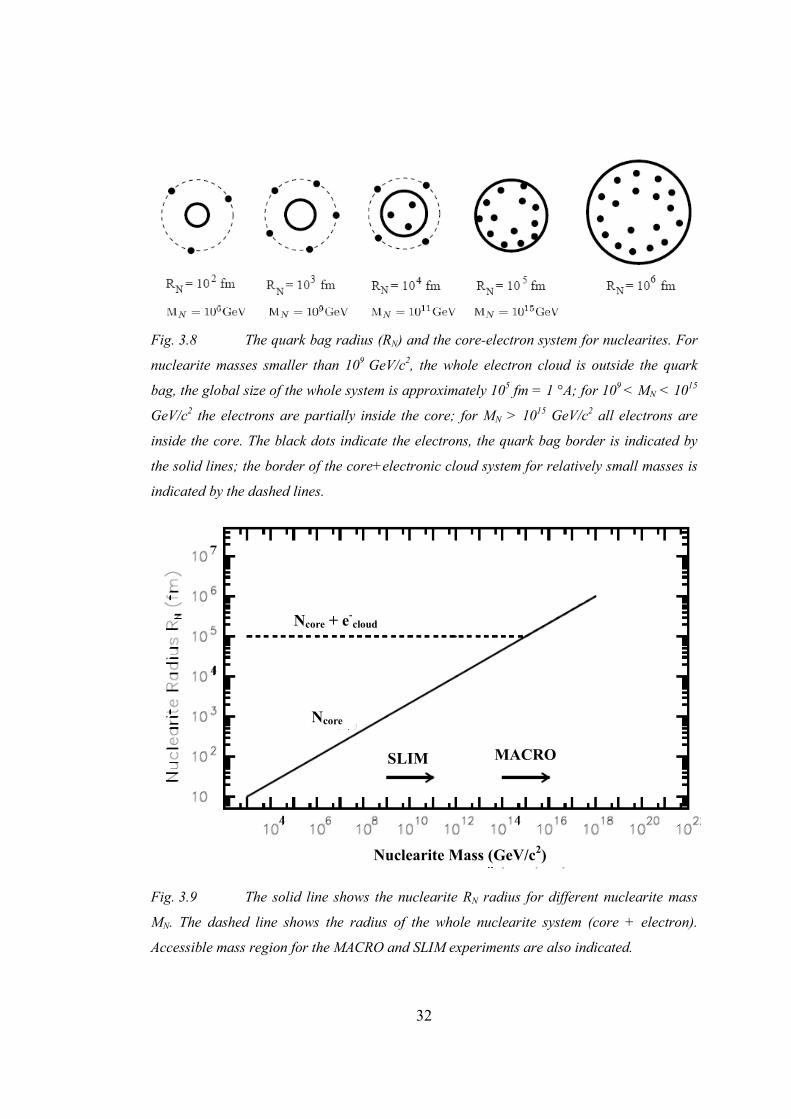
Fig. 3.8 The quark bag radius (RN) and the core-electron system for nuclearites. For
nuclearite masses smaller than 109 GeV/c
2, the whole electron cloud is outside the quark
bag, the global size of the whole system is approximately 105 fm = 1 °A; for 10
9 < MN < 10
15
GeV/c2 the electrons are partially inside the core; for MN > 10
15 GeV/c
2 all electrons are
inside the core. The black dots indicate the electrons, the quark bag border is indicated by
the solid lines; the border of the core+electronic cloud system for relatively small masses is
indicated by the dashed lines.
Fig. 3.9 The solid line shows the nuclearite RN radius for different nuclearite mass
MN. The dashed line shows the radius of the whole nuclearite system (core + electron).
Accessible mass region for the MACRO and SLIM experiments are also indicated.
Ncore + e-cloud
MACRO SLIM
Ncore
Nuclearite Mass (GeV/c2)
33
The radius of the nuclearite core can be computed as follow:
3/1
4
3
=
N
NN
MR
πρ (3.9)
where MN is the Nuclearite mass. For gM N
9105.1 −×= the nuclearite should have a
radius of 1 Å.
Nuclearites should be stable for any baryon number A in the range between
ordinary heavy nuclei and neutron stars ( 5710≈A ).
3.7.1 Energy Loss of Nuclearites in the Atmosphere
Nuclearites of galactic velocities are protected by their electron atmosphere
and coulomb repulsion from direct nuclear interactions with the atoms they may hit
along their path and the same for nuclearites that have come to rest in matter [84].
Thus, he considers that the principal energy-loss mechanism for a nuclearite passing
through matter is that of atomic collisions. These collisions are mainly elastic or
quasi-elastic for velocities ~10-3c and the rate of energy loss for a massive nuclearite
is [84]:
2vdx
dEρσ−= (3.10)
where σ is the effective cross-section of the nuclearite, v its velocity and ρ the
density of the medium. Considering what was discussed above concerning
nuclearites dimensions, one will have [84]:
≥°≥
≤°≤°
=)5.1(1
4
3
)5.1(13/2
2
ngMARforM
ngMARforA
Nπρπ
πσ (3.11)
34
3.7.2 Accessibility region of Nuclearites
For galactic nuclearites, the velocity decreases exponentially with distance L:
−= ∫
L
dxM
vLv0
exp)0()( ρσ
(3.12)
where M is the mass of nuclearite and v(0) its velocity at the top of the atmosphere.
The range of nuclearite can be computed considering that the nuclearite is
quickly brought to rest when its velocity becomes smaller than velocity of sound in
the medium ρε=cv , so the material will resist interpenetration; ε ~ 109 ergs/cm3
~ 0.1 MeV per molecular bound, is the structural energy density for integrity of rocks
(Young’s modulus). The range of nuclearites is given by
=∫
c
L
v
vLn
Mdx
)0(
0σ
ρ (3.13)
We consider the parameterization of the standard atmosphere from [85]:
( ) b
hH
b
h
aeaeh
−−−
==ρ (3.14)
where the constants are a = 1.2 × 10⁻³g cm
-3 and b ≈ 8.57 × 10
5 cm; H is the total
height of the atmosphere (≈ 50 km). The integral in eq. 34 may be solved
analytically
∫
=
−=
−L
b
hH
b
H
eabedx0
1
ρ (3.15)
Fig. 3.10 shows the accessible region of nuclearites in the (mass,β ) plane at
different experimental depths for their detections. Typical balloon experiments
(CAKE, 40 km), civilian airplanes (11 km), the Chacaltaya high altitude
laboratory (SLIM, 5.23 km), at sea level and experiment at underground

35
laboratory (MACRO at a depth of 3400 mwe) are also included. The CR39 and
Makrofol detection thresholds for the SLIM NTDs corresponding to REL = 300
MeV g-1 cm
2 and 2500 MeV g
-1 cm
2 values are also shown as dashed curves
[86,87].
Fig. 3.10 Accessibility region in the (mass, β) plan for Nuclearites at different depths,
assuming the initial velocity of the outer atmosphere of β = 10-3 (Chatalcaya altitude, 5230m
(540 g/cm2); sea level (1033 g/cm
2) and MACRO depth (3700 hg/cm
2). The detection
thresholds of CR39 and Makrofol NTDs are shown with the dashed lines.
The decrease of the velocity thresholds for nuclearite masses larger than
8.4x10¹⁴ GeV is due to the change in the nuclearite cross section, according to
eq. 3.12.
An experiment at the Chacaltaya altitude lowers the minimum detectable
nuclearite mass by a factor of about 2 with respect to an experiment performed at
sea level. If the mass abundance of nuclearites decreases strongly with increasing
mass this could yield an important increase in sensitivity.
36
4 Experimental
4.1 Calibration
The identification of a relativistic charged fragment with the help of a NTD
relies on two sources of information. First, we have a fairly good knowledge of how
a charged ion loses energy while propagating in a stopping medium of well-known
chemical and physical properties. Secondly, the ion trajectory leaves a physically
observable signature that can be experimentally observed with a high degree of
accuracy. The first of these inputs is derived from the expression of Relative Energy
Loss (as discussed in section 2.2.3), which is a function of Z/β, and the second input
is obtained through the measurement of the reduced etch-rate of the ion. A
correlation between the two quantities constitutes the 'calibration curve'. With the
help of this curve, a purely geometrical measurement ( i.e the cone-length of a track
or the area of its base) can be translated into a physical parameter, namely, the charge
of the ion (if all fragments are highly relativistic). In this chapter, the methodology
and results of the calibration in two different detector systems are described, by using
data based on the exposures of detectors to a variety of relativistic energy ion beams
and their fragments.
4.1.1. Chemical etching
An important item is the determination of the optimal etching conditions to
achieve the best surface quality and reduce the number of fake tracks in CR39 and
Makrofol NTDs used in the SLIM experiment as well as in other experiments.
Previously we used aqueous solutions of NaOH and KOH. Extensive studies have
been done on the improvements of etching conditions with improved stirring and
temperature control of the etching solution and with addition of fraction percentages

37
of ethyl alcohol. The addition of ethyl alcohol in the etchant improves the etched
surface quality and reduces the number of surface defects and background tracks.
A stack composed of CR39 NTDs of size 11.5 x 11.5 cm2 with 1 cm thick
lead target was exposed to the CERN-SPS lead beam (158 A GeV Pb82+) ions (see
Fig 4.1 & 4.3). Stacks composed of CR39 of the same size with 1 cm thick
polyethylene (CH2) target were exposed to 5 AGeV Fe26+ and 1 A GeV Fe
26+ and
Si14+ ions in 2005 at BNL, USA (see Fig. 4.4). More stacks of CR39 detectors were
exposed to 0.41 AGeV Fe+26 and 0.29 A GeV C
6+ beams at HIMAC, Japan (see Fig.
4.5). Most of the exposures were carried out at normal incidence and with a nominal
density of 1500 to 2000 ions/cm2. The CR39 material was manufactured by Intercast
Europe Co., Parma, Italy using a specially designed line of production. The CR39
thickness was 700 µm or 1400 µm. The Makrofol detectors were manufactured by
Bayer A.G., Germany. The Makrofol thickness was 500 µm; CR39 and Makrofol
detector sheets were covered by a 30 µm plastic film to protect them from exposure
to ambient radon. The protective layers were removed before etching the NTDs.
The etchants used were water solutions of: 6N NaOH, 6N KOH at 70 and 60
oC, respectively, with different fractions of ethyl alcohol. These are called “soft”
(normal) etching conditions. We also used “strong” etching conditions in order to
fastly reduce the thickness of the detectors for the analysis of the SLIM CR39 and
Makrofol NTDs. For strong etching, we used mainly 8N NaOH, 7N KOH, 8N KOH
water solution at 75 and 77 oC, with the addition of different fractions of ethyl
alcohol in the solution.
To avoid the deposit of etched products on the detector surfaces and to have
homogeneous solution, the stirring was kept constant during etching. After etching
the bulk etch velocity vB was measured (from the change-in-thickness method) for all
the detectors, and also by another method (measuring the track cone height and
diameter) for those detectors having tracks of measurable cone length.
For the study of the bulk etch velocity variations and of the effects from
stirring and evaporation of alcohol we used unexposed Makrofol and CR39 detectors
of various thicknesses and sizes.

38
Fig. 4.1 Exposure set-up for the calibration of CR39 and Makrofol NTDs to relativistic
ions.
Fig. 4.2 (a) Tracks of beam ions before the target and (b) beam and fragment tracks after
the target (from the 0.41 A GeV Fe26+
exposure). The tracks marked with a red circle are
from a Iron nuclei (a) and its fragment (b), respectively.
Fig. 4.3 Photograph of the detector stacks exposed at the CERN 158 A GeV Pb82+
beam.
Target
50 cm
Air gap CR39
CR39 sheets after target CR39 sheets before target
Survived beam
Fragments
Target
Incident beam
(a) (b)
39
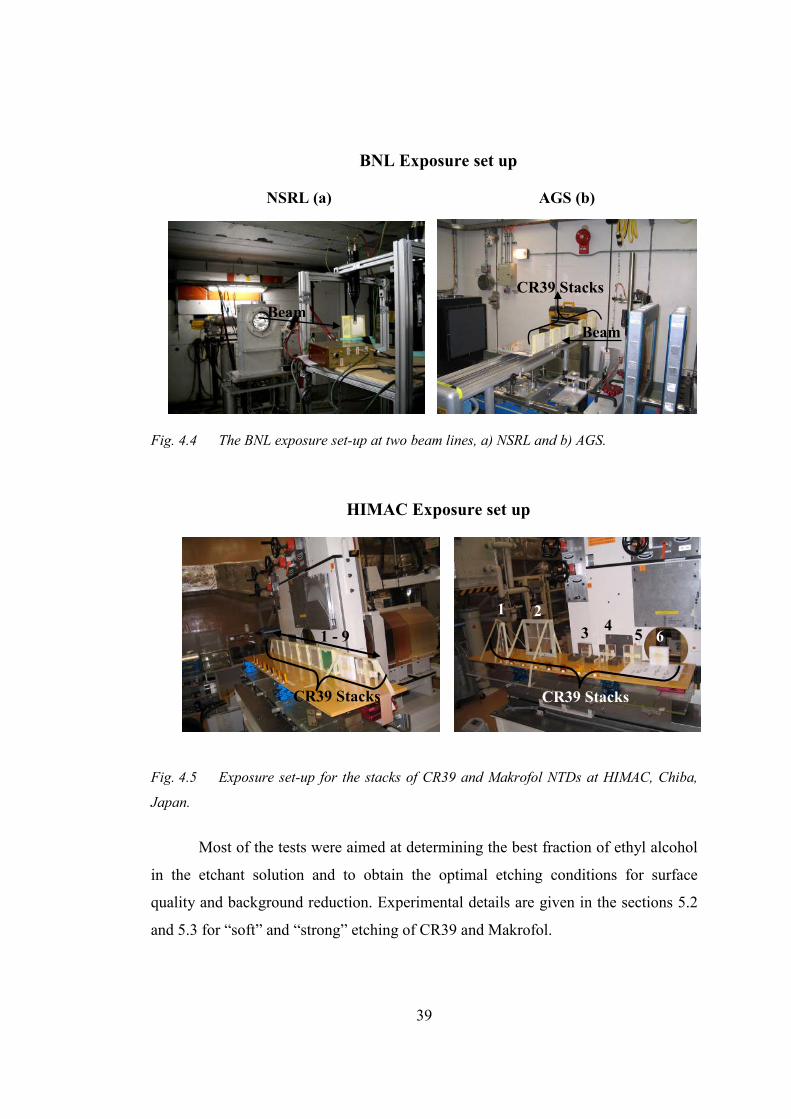
BNL Exposure set up
NSRL (a) AGS (b)
Fig. 4.4 The BNL exposure set-up at two beam lines, a) NSRL and b) AGS.
HIMAC Exposure set up
Fig. 4.5 Exposure set-up for the stacks of CR39 and Makrofol NTDs at HIMAC, Chiba,
Japan.
Most of the tests were aimed at determining the best fraction of ethyl alcohol
in the etchant solution and to obtain the optimal etching conditions for surface
quality and background reduction. Experimental details are given in the sections 5.2
and 5.3 for “soft” and “strong” etching of CR39 and Makrofol.
CR39 Stacks
1 2
3 4
5 6
CR39 Stacks
1 - 9
CR39 Stacks
Beam
Beam

40
Fig. 4.6 Tanks used for the etching of CR39 and Makrofol NTDs; (a) the V2 & V4 tanks
are used for the etching of SLIM NTDs, V3 is used for calibration purposes, and V1 is used
for the washing of the NTDs after etching. (b) The TKB tank is used for pre-soaking; TKB1
& TKB2 are used for etching few detectors for calibrations and tests; TKB3 is used for
cleaning the NTDs.
Fig. 4.7 Stainless steel supporting racks used for etching of CR39 and Makrofol NTDs.
(a) Rack used for strong and soft etching of the SLIM NTDs in the V2 and V4 tanks (see Fig.
4.5a); (b) rack used for etching in the V3 tank for calibrations; (c) rack used for etching of
NTDs in the TKB1 and TKB2 tanks.
(a)
(b)
(c)
V1 V2 V3 V4
(a)
TKB1 TKB2 TKB TKB3
(b)

41
Chemical etchings were performed in stainless steel tanks: two large tanks
(40 x 52 x 40 cm3, named V2 or V4), a medium tank (40 x 40 x 26 cm
3, named V3)
and two small tanks (22 x 34 x 16.5 cm3, TKB1 and TKB2) having different types of
improved stirring and heating systems, and of temperature control (see Fig. 4.6). The
large tank is equipped with a heating system composed of an oil circuit external to
the tank. The large and medium tanks also have a stirring-head with motorized
pumps and an internal thermo-resistance with digital controlled system. The
temperature controlled system guarantees the stability of the temperature throughout
the solution to within ± 0.01 oC. The small tank was equipped with only internal
thermo resistances and a motorized stirring head. The stability of the temperature
was within ± 0.1 oC. Detector foils were placed in the stainless steel detector holders
(see Fig. 4.7).
4.2 Chemical Etching of CR39 NTDs
4.2.1 “Soft” Chemical Etching
Previous standard etching conditions for CR39 were 6N NaOH water
solution. In order to improve the surface quality of the post-etched detectors, we
made a series of tests adding alcohol in the preparation of etching solution. In Table
4.1 the “soft” etching conditions used for CR39 sheets exposed to the 158 A GeV
Pb82+ and In
49+ ions are listed.
The CR39 etched in 10 % ethyl alcohol, 6N KOH solution at 70 oC, Fig. 4.8b,
was transparent and fake track density was much lower compared to the detector
etched without ethyl alcohol (Fig. 4.8a), but the threshold was higher (Z/β ≥ 30
instead of 5). For this etching condition, it was not possible to measure the tracks
automatically with the ELBEK system because of the lower contrast of the detector
surfaces. In order to improve surface contrast we etched the CR39 in 3 % ethyl
alcohol in 6N KOH at 60 oC. There was a significant decrease of fake tracks due to
surface defects and an increased contrast on the detector surface (see Fig. 4.8c); it

42
was thus possible to measure the tracks with the ELBEK system, but the detection
threshold is still too high (Z/β ≥ 21). In order to reduce the detection threshold the
CR39 NTDs were etched in 1% ethyl alcohol solution of 6N NaOH for an etching
time of 40 hr (see Fig. 4.8d). The etching time was increased from 30 h to 40 h in
order to enlarge the base cone areas of small nuclear fragments.
(a) 70 oC, 6N NaOH, 30 h
(b) 70 oC,6N KOH + 10 % ethyl alcohol, 3h
(c ) 60 oC, 6N KOH + 3% ethyl alcohol, 30 h
(d) 70 oC, 6N NaOH + 1 % ethyl alcohol, 40 h
Fig. 4.8 Tracks in CR39 of 158 A GeV Pb
82+ ions and their fragments (a, b, c) and (d)
tracks of 158 A GeV In49+
ions and their fragments etched under different etching conditions.
In order to study the bulk etching rate vs time with this new etching
conditions, we selected four sheets of CR39 ~1400 µm thick and etched them in 6N
KOH with 3 % ethyl alcohol by volume at 60 oC for 30 h in 5 steps of 6 h intervals.
For shorter etching times the thickness is affected by detector swelling. For etching
20x 20x
20x 20x

43
times larger than 12 h we did not observe any depth dependence of the bulk etch rate,
see Fig. 4.9. The identical procedure applied for etching detectors with 1% ethyl
alcohol; we observed the same swelling effect for shorter etching time.
Table 4.1. “Soft” etching conditions and bulk etch rates vB for CR39 obtained with the
standard method using 25 thickness measurements for each final data point. The errors are
statistical standard deviations of the mean.
S.N. Etching Conditions vB (µµµµm/h)
1 6N NaOH, 70 oC, 30 h 1.15 ± 0.03
2 6 N NaOH + 1 % alcohol, 70 oC, 40 h. 1.15 ± 0.03
3 6 N KOH + 3 % alcohol, 60 oC, 30 h. 1.43 ± 0.03
4 6 N KOH + 10 % alcohol, 70 oC, 30 h. 9.3 ± 0.2
Fig. 4.9 Thickness versus etching time of three different CR39 detectors etched in 6N
KOH + ethyl alcohol (3 % by volume) at 60 oC. The solid lines are linear fits to the data; the
dashed lines only connect the data points (notice the swelling effect for etching times smaller
than 12 h).
44
4.2.2 “Strong” Chemical Etching
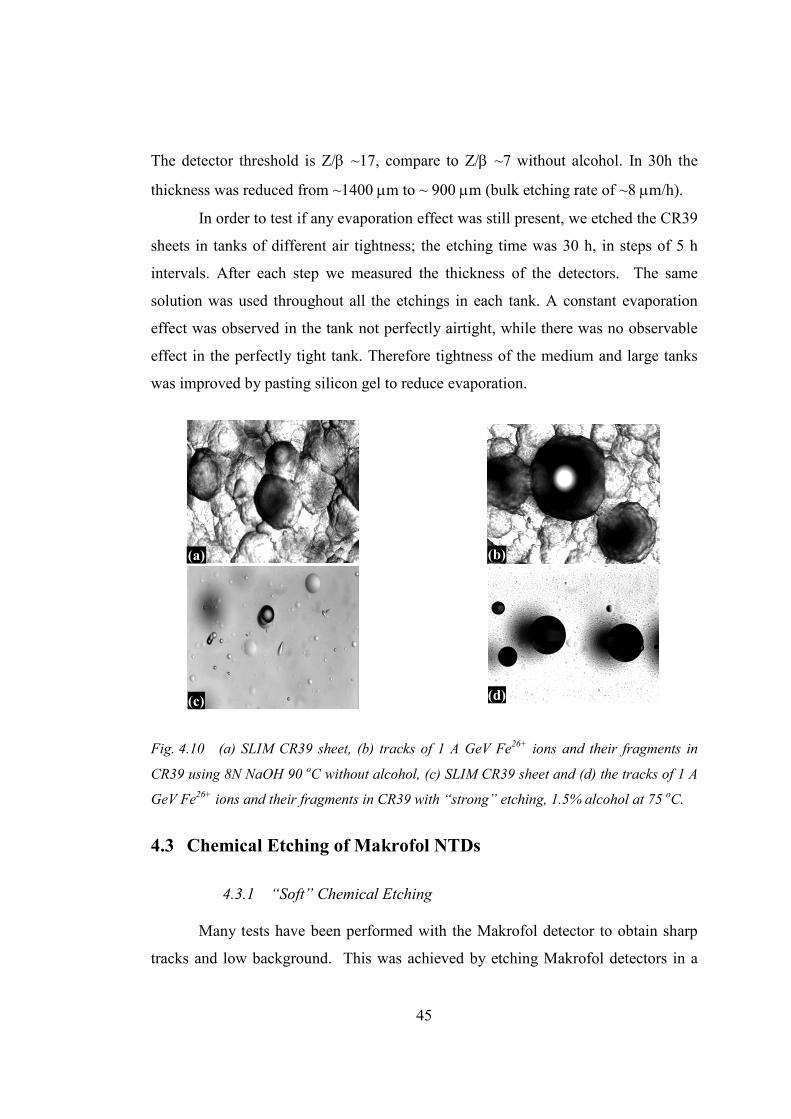
Preliminary etching of CR39 foils exposed at Chacaltaya to cosmic rays and
to 1 A GeV Fe26+ ions were made in 8NaOH at 90
oC. We found several background
tracks of 10-17 µm range due to carbon, oxygen and proton recoils produced in the
interactions of ambient neutrons; see Figure 4.10a, b: the surface quality of both
sheets was poor. In these conditions, it would be difficult to scan the detectors. In
order to improve the surface quality and to eliminate recoil tracks, extensive tests
were made by etching the SLIM CR39 sheets in 3%, 1.25% and 1.5% ethyl alcohol
in 8N and 7N KOH solution. The CR39 sheets were etched with 8N KOH + 1.5%
ethyl alcohol at 75 oC for 30 hr (see Figure 4.10c, d).
The “strong” etching conditions and the bulk etch velocities of the SLIM
CR39 are given in Table 4.2.
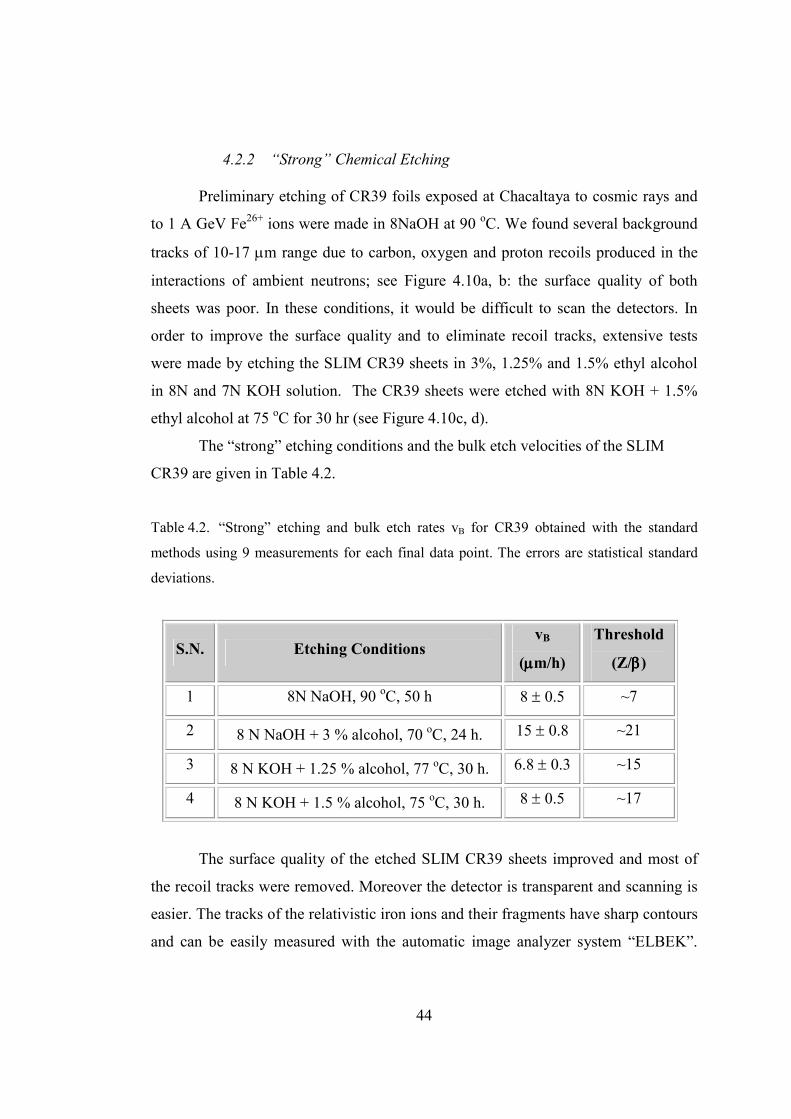
Table 4.2. “Strong” etching and bulk etch rates vB for CR39 obtained with the standard
methods using 9 measurements for each final data point. The errors are statistical standard
deviations.
S.N. Etching Conditions vB
(µµµµm/h)
Threshold
(Z/ββββ)
1 8N NaOH, 90 oC, 50 h 8 ± 0.5 ~7
2 8 N NaOH + 3 % alcohol, 70 oC, 24 h. 15 ± 0.8 ~21
3 8 N KOH + 1.25 % alcohol, 77 oC, 30 h. 6.8 ± 0.3 ~15
4 8 N KOH + 1.5 % alcohol, 75 oC, 30 h. 8 ± 0.5 ~17
The surface quality of the etched SLIM CR39 sheets improved and most of
the recoil tracks were removed. Moreover the detector is transparent and scanning is
easier. The tracks of the relativistic iron ions and their fragments have sharp contours
and can be easily measured with the automatic image analyzer system “ELBEK”.
45
The detector threshold is Z/β ~17, compare to Z/β ~7 without alcohol. In 30h the
thickness was reduced from ~1400 µm to ~ 900 µm (bulk etching rate of ~8 µm/h).
In order to test if any evaporation effect was still present, we etched the CR39
sheets in tanks of different air tightness; the etching time was 30 h, in steps of 5 h
intervals. After each step we measured the thickness of the detectors. The same
solution was used throughout all the etchings in each tank. A constant evaporation
effect was observed in the tank not perfectly airtight, while there was no observable
effect in the perfectly tight tank. Therefore tightness of the medium and large tanks
was improved by pasting silicon gel to reduce evaporation.
Fig. 4.10 (a) SLIM CR39 sheet, (b) tracks of 1 A GeV Fe26+
ions and their fragments in
CR39 using 8N NaOH 90 oC without alcohol, (c) SLIM CR39 sheet and (d) the tracks of 1 A
GeV Fe26+
ions and their fragments in CR39 with “strong” etching, 1.5% alcohol at 75 oC.
4.3 Chemical Etching of Makrofol NTDs
4.3.1 “Soft” Chemical Etching
Many tests have been performed with the Makrofol detector to obtain sharp
tracks and low background. This was achieved by etching Makrofol detectors in a
(a) (b)
(d) (c)

46
water solution of 6N KOH at 50 oC with 20% ethyl alcohol for an etching time of 8
h; uniform stirring and a tight etching bath was used to minimize evaporation of
alcohol during the etching cycle. We obtained tracks, which were suitable for the
ELBEK automatic measuring system.
The effect of pre-soaking for Makrofol in a perfectly closed small tank using
regular stirring was also studied. For this purpose, we used 9 unexposed detectors
11.5 cm x 11.5 cm in size, 500 µm thick; 4 of them were pre-soaked in de-ionized
water for 1 h, raising the temperature from room temperature up to 50 oC. All the
samples were etched in a 6N KOH solution with 20 % ethyl alcohol at 50 oC for 4 h.
The same steps were repeated five times using every time a fresh solution, in order to
avoid possible effects for evaporation of ethyl alcohol. The bulk etching rate vB was
determined using thickness measurements after each etching step. Within our
uncertainties, we observed no difference between the 4 pre-soaked and the 5 non-pre-
soaked sheets.
Fig. 4.11 Base areas of the “tracks” from 158 A GeV Pb ions in Makrofol at normal
incidence (a) 6N NaOH 50oC, 95 h, (b) 6N KOH + 30 % ethyl alcohol 45
oC, 10 h, (c) 6N
KOH + 20 % ethyl alcohol 50 oC, 8 h and (d) The tracks of Pb ions and their fragments in
Makrofol at 45o incident angle (etching conditions as in c).
For the study of depth dependence few unexposed detectors 500 µm thick
were etched in 6N KOH solution with 20 % ethyl alcohol at 50 oC for a total of 30 h
in five steps of 6 h each. In Fig. 4.12 the averaged detector thickness is plotted versus
etching time. A constant bulk-etching rate in all the steps within our experimental
20x 20x 20x (b) (a) (c) (d) 50x
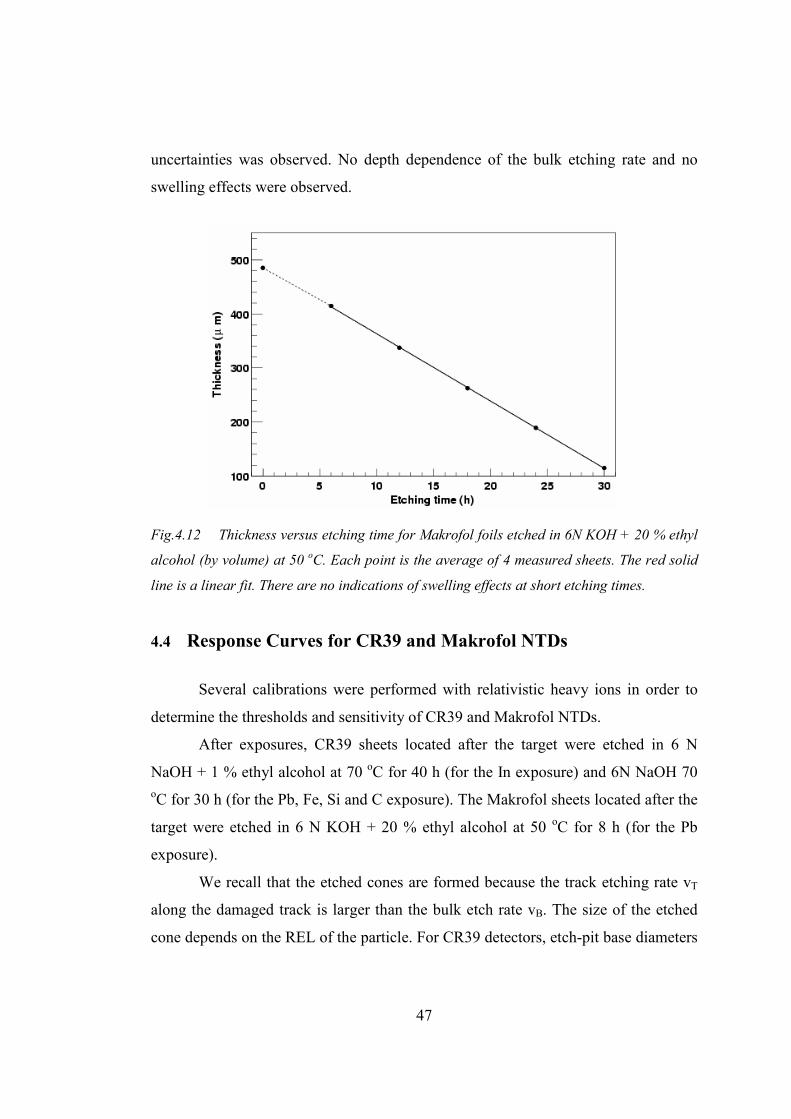
47
uncertainties was observed. No depth dependence of the bulk etching rate and no
swelling effects were observed.
Fig.4.12 Thickness versus etching time for Makrofol foils etched in 6N KOH + 20 % ethyl
alcohol (by volume) at 50 oC. Each point is the average of 4 measured sheets. The red solid
line is a linear fit. There are no indications of swelling effects at short etching times.
4.4 Response Curves for CR39 and Makrofol NTDs
Several calibrations were performed with relativistic heavy ions in order to
determine the thresholds and sensitivity of CR39 and Makrofol NTDs.
After exposures, CR39 sheets located after the target were etched in 6 N
NaOH + 1 % ethyl alcohol at 70 oC for 40 h (for the In exposure) and 6N NaOH 70
oC for 30 h (for the Pb, Fe, Si and C exposure). The Makrofol sheets located after the
target were etched in 6 N KOH + 20 % ethyl alcohol at 50 oC for 8 h (for the Pb
exposure).
We recall that the etched cones are formed because the track etching rate vT
along the damaged track is larger than the bulk etch rate vB. The size of the etched
cone depends on the REL of the particle. For CR39 detectors, etch-pit base diameters
48
and heights of In ions and their fragments were measured with a Leica optical
microscope. For Makrofol, Pb ions and their high Z fragments made through-holes in
the detector sheets; thus the cone length Le was measured only for high Z fragments
that have sharp etch-cone tips (no holes). Nuclear fragments with charges 78 < Z <
82 were identified by etching Makrofol sheets from the same stack in the same
conditions for only 5 hours.
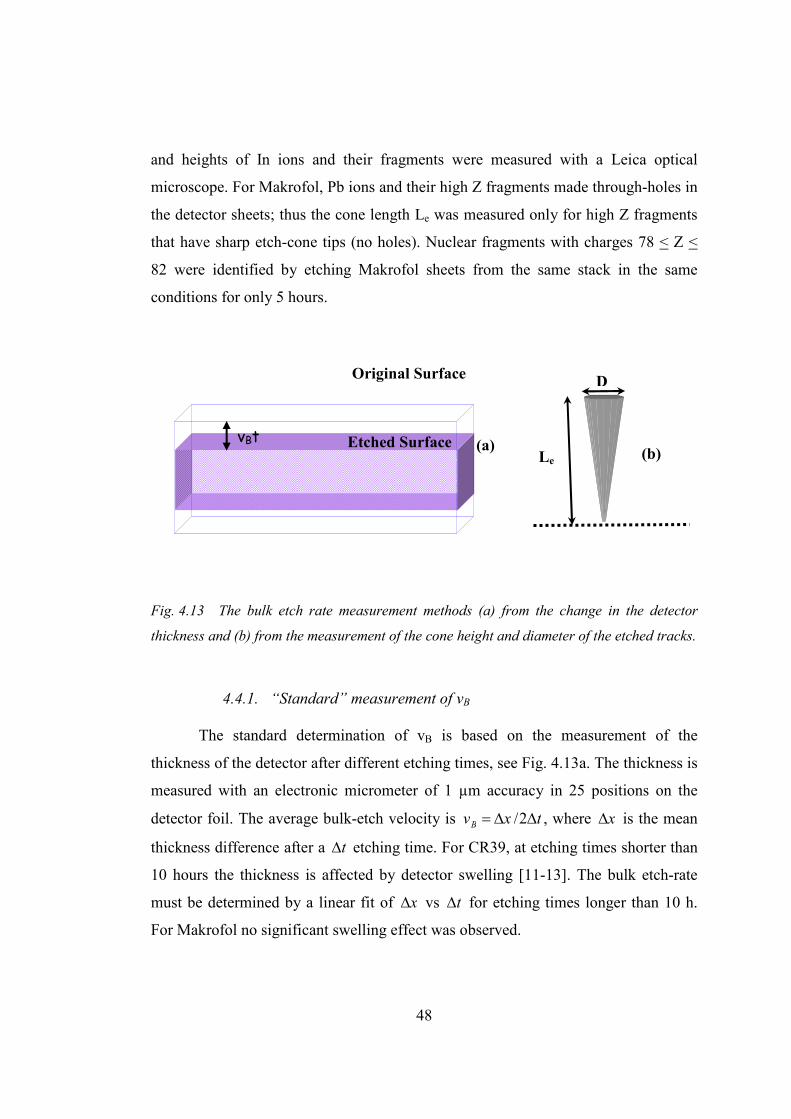
Fig. 4.13 The bulk etch rate measurement methods (a) from the change in the detector
thickness and (b) from the measurement of the cone height and diameter of the etched tracks.
4.4.1. “Standard” measurement of vB
The standard determination of vB is based on the measurement of the
thickness of the detector after different etching times, see Fig. 4.13a. The thickness is
measured with an electronic micrometer of 1 µm accuracy in 25 positions on the
detector foil. The average bulk-etch velocity is vB = ∆x /2∆t , where ∆x is the mean
thickness difference after a ∆t etching time. For CR39, at etching times shorter than
10 hours the thickness is affected by detector swelling [11-13]. The bulk etch-rate
must be determined by a linear fit of ∆x vs ∆t for etching times longer than 10 h.
For Makrofol no significant swelling effect was observed.
Original Surface
vBt Etched Surface (a) Le
D
(b)
D

49
4.4.2. The vB measurements from the cone height and base diameter
The track etch rate vT can be considered constant for relativistic heavy ions.
For normally incident particles, the measurable quantities are the cone base diameter
D, and the height Le, see Fig. 4.13b [88, 89]. Le is obtained by multiplying the
measured cone height using an optical microscope by the refractive index n of the
etched detector material. The refactive index ‘n’ is obtained from the ratio of the
actual thickness (which we measure with an electronic micrometer with a precision
of 1 µm) to the apparent thickness measured with an optical microscope (precision of
1 µm) [nCR39 = 1.55 ± 0.01; nMakrofol = 1.69 ± 0.01].
Fig. 4.14 Sketch of an “etched track” and its etched track parameters for a normally
incident ion.
The following relations hold:
Le = (vT − vB )t (4.1)
D = 2vB t(vT − vB )
(vT + vB ) (4.2)

50
From the above relations, the following quadratic equation in vB is obtained
Le
t
vB
2 −D2
2t 2
vB −
D2Le
4t 3
= 0 (4.3)
The real solution for vB is
++= 4
114 2
22
D
L
tL
Dv e
eB (4.4)
From eqs. 4.1 and 4.2, the reduced etch rate is
)(1
)(1
)2/(1
)2/(11
22
22
2
2
tvA
tvA
tvD
tvD
tv
L
v
vp
B
B
B
B
B
e
B
T
ππ
−+
=−+
=+=
= (4.5)
The bulk etch rate vB and the reduced etch-rate p may by determined by
measuring the track parameters Le (precision of ~1 µm) and D (precision of 0.5 µm).
Eqs. 4.4 & 4.5 were tested with relativistic Pb and In ions and their nuclear
fragments. We selected only tracks for which precise measurements of the cone
height and diameter could be performed (for example we cannot measure the track
cone heights for low Z fragments, for which the microscope image may be affected
by shadow effects). Using eq. (4.4) we computed the bulk-etch rate for CR39 and
Makrofol. Batches of measurements were made by different operators, and the
average vB’s and their statistical standard deviations were computed, see Table 4.3.
By this method we obtain vB values with accuracies of 0.01 ÷ 0.05 µm/h. The vB
values obtained for the same foils using detector thickness measurements are also
given in Table 4.3.
51
we can effectively make measurements with the available measuring
instruments using the new method only for intermediate z-values because at low and
high z we do not have enough precision for measuring Le and D, respectively.
The base area of each etch-pit cone, its eccentricity and central brightness
were measured with the ELBEK automatic image analyzer system [12], which also
provides the absolute coordinates of the etched tracks; this allows the tracking of the
beam ions and of their fragments through the CR39 detectors.
In the following sections new response curves for CR39 and Makrofol, based
on the new determination of the bulk etch-rate are discussed.
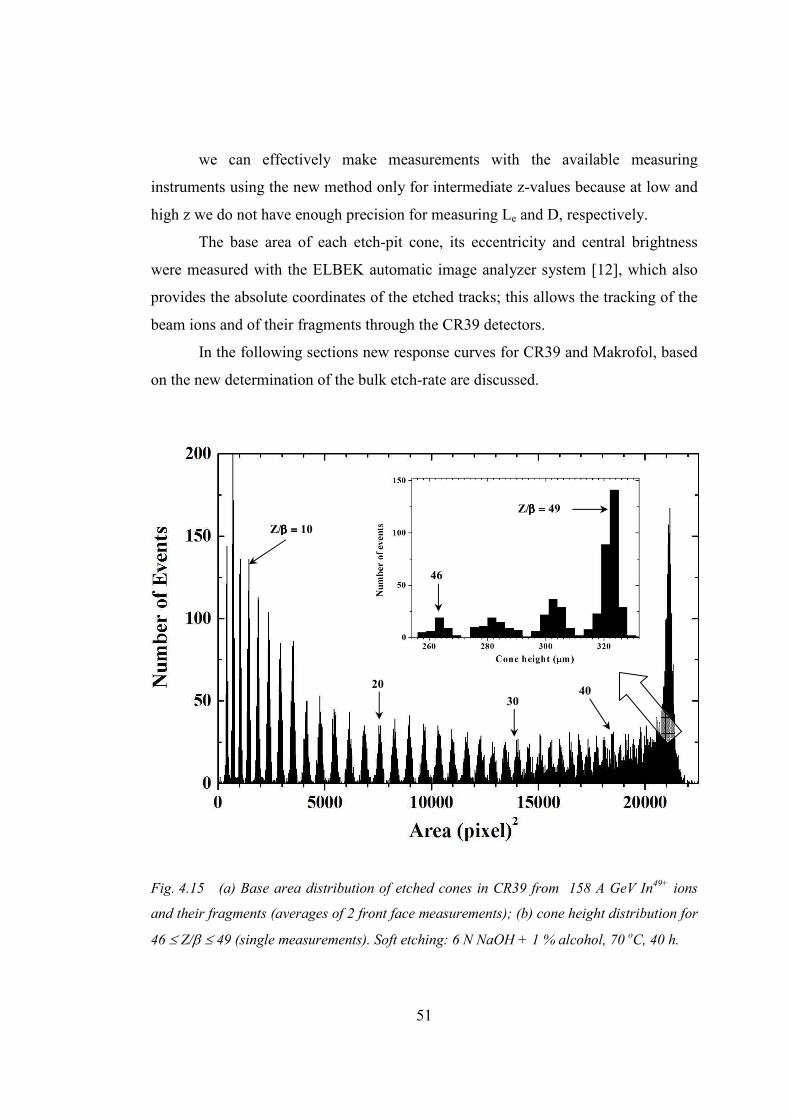
Fig. 4.15 (a) Base area distribution of etched cones in CR39 from 158 A GeV In49+
ions
and their fragments (averages of 2 front face measurements); (b) cone height distribution for
46 ≤ Z/β ≤ 49 (single measurements). Soft etching: 6 N NaOH + 1 % alcohol, 70 oC, 40 h.
46
Z/β =β =β =β = 49
Z/β =β =β =β = 10
20
30 40

52
4.5 Response Curves for CR39
Fig. 4.15 shows the etch-pit base area distribution for Indium ions and their
fragments in CR39; averages were computed from measurements made on the “front
sides” of two detector sheets. The peaks are well separated from Z/β ~7 to 45; the
charge resolution for the average of two measurements is σz ~0.13e at Z/β ∼15. The
charge resolution close to the Indium peak (Z ~49) can be improved by measuring
the heights of the etch pit cones [12]. The heights of 1000 etch-cones with diameter
larger than 48 µm (corresponding to nuclear fragments with Z > 45) were measured
with an accuracy of ± 1 µm with a Leica microscope coupled to a CCD camera and a
video monitor. The corresponding distribution is shown in the inset in Fig. 4.15; each
of the 4 peaks is well separated from the others, and a charge can be assigned to each
one. The charge resolution for a single measurement of different nuclear fragments is
given in Table 4.4; it is σz ~0.22e at Z/β ∼48. The charge resolutions σZ may be
computed from
)(/
(a) /
Z bZL
ZA
e
L
AZ
e
δδ
σσ
δδσ
σ
=
=
(4.6)
where Aσ and eLσ are standard deviations [8], A is the mean base area and Le the
mean height of the etched cones. See Table 4.4 for the numerical results.
For each detected nuclear fragment from Z = 7 to 48 and Indium ions (Z =
49) we computed the corresponding REL values and the reduced etch rate p = vT/vB
using eq. (4.5). The sensitivity p vs REL for CR39 is plotted in Fig. 4.16. The CR39
detection threshold is at REL ~50 MeV cm2 g-1, corresponding to a relativistic
nuclear fragment with Z ~ 7.
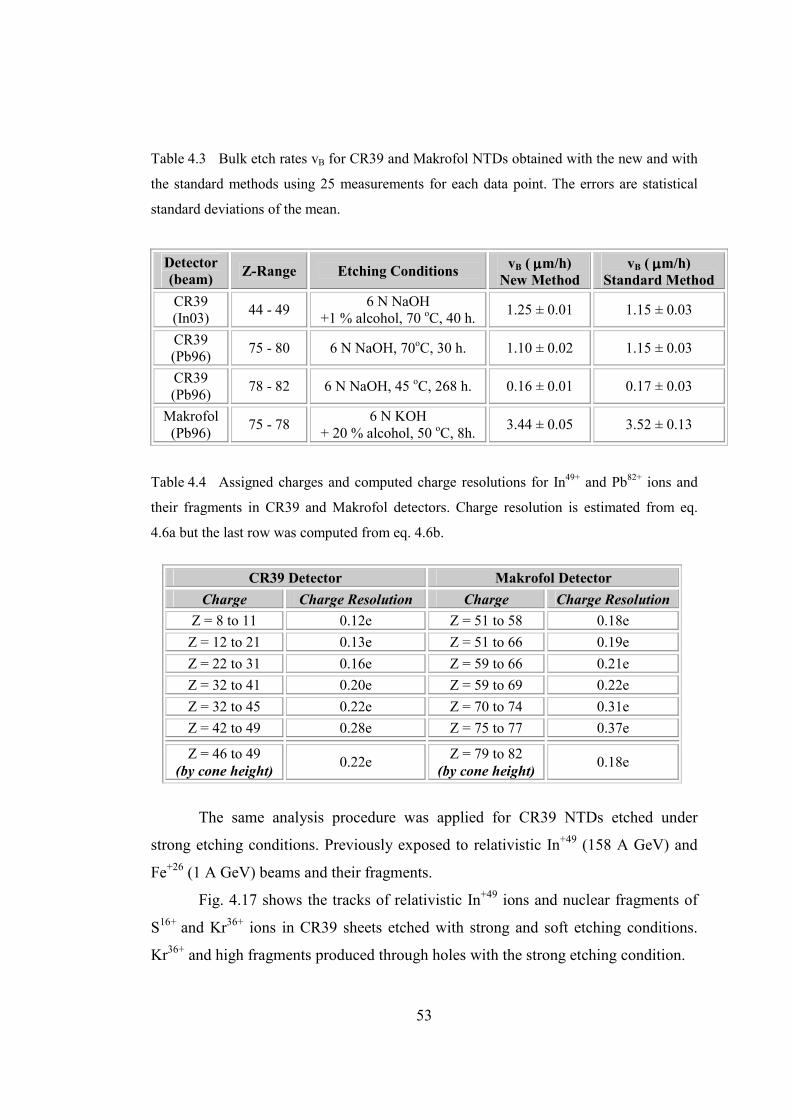
53
Table 4.3 Bulk etch rates vB for CR39 and Makrofol NTDs obtained with the new and with
the standard methods using 25 measurements for each data point. The errors are statistical
standard deviations of the mean.
Detector
(beam) Z-Range Etching Conditions
vB ( µ µ µ µm/h)
New Method
vB ( µ µ µ µm/h)
Standard Method
CR39
(In03) 44 - 49
6 N NaOH
+1 % alcohol, 70 oC, 40 h.
1.25 ± 0.01 1.15 ± 0.03
CR39
(Pb96) 75 - 80 6 N NaOH, 70
oC, 30 h. 1.10 ± 0.02 1.15 ± 0.03
CR39
(Pb96) 78 - 82 6 N NaOH, 45
oC, 268 h. 0.16 ± 0.01 0.17 ± 0.03
Makrofol
(Pb96) 75 - 78
6 N KOH
+ 20 % alcohol, 50 oC, 8h.
3.44 ± 0.05 3.52 ± 0.13
Table 4.4 Assigned charges and computed charge resolutions for In49+ and Pb
82+ ions and
their fragments in CR39 and Makrofol detectors. Charge resolution is estimated from eq.
4.6a but the last row was computed from eq. 4.6b.
CR39 Detector Makrofol Detector
Charge Charge Resolution Charge Charge Resolution
Z = 8 to 11 0.12e Z = 51 to 58 0.18e
Z = 12 to 21 0.13e Z = 51 to 66 0.19e
Z = 22 to 31 0.16e Z = 59 to 66 0.21e
Z = 32 to 41 0.20e Z = 59 to 69 0.22e
Z = 32 to 45 0.22e Z = 70 to 74 0.31e
Z = 42 to 49 0.28e Z = 75 to 77 0.37e
Z = 46 to 49
(by cone height) 0.22e
Z = 79 to 82
(by cone height) 0.18e
The same analysis procedure was applied for CR39 NTDs etched under
strong etching conditions. Previously exposed to relativistic In+49 (158 A GeV) and
Fe+26 (1 A GeV) beams and their fragments.
Fig. 4.17 shows the tracks of relativistic In+49 ions and nuclear fragments of
S16+
and Kr36+ ions in CR39 sheets etched with strong and soft etching conditions.
Kr36+ and high fragments produced through holes with the strong etching condition.

54
Fig 4.18a shows the mean area distribution of five CR39 independent
measurements (detector etched in 8N KOH + 1.25% alcohol at 77 oC). All peaks
with Z/β = 15 to 49 are well separated; the response p vs REL is shown in Fig. 4.19.
The detection threshold is at Z/β ~ 15, corresponding to REL ~200 MeV cm2 g-1.
Fig. 4.16 The etch rate ratio p plotted as a function of REL for CR39 detectors exposed to
relativistic Indium ions using vB evaluated with the new method. Typical statistical standard
deviations are shown at Z/β = 40, 45, 49; for Z/β ≤ 37 the errors are inside the black points.
For comparison in Fig. 4.18a shows the same mean area distribution of 158
In49+ and their fragments obtained by etching the NTDs in 8N NaOH at 90
oC. Notice
that the threshold is at Z ~7, (compared to Z ~15 in the bottom figure). The charge
peaks from Z = 8 to 20 are well seen and well separated; instead the peaks from Z

55
~20 to 35 are not separated well as is the case for the etching in alcohol (8N KOH +
1.25% ethyl alcohol, 77 oC, bottom figure).
Fig. 4.17 The surface tracks of Indium and their fragments in CR39. On top, the detector
was etched in “strong” etching condition for 24 h; the bottom, the same tracks etched in
“soft” condition.
In order to achieve low background, high contrast and an “acceptable”
threshold for the SLIM experiment, The CR39 sheets were etched in 8N KOH +
1.5% alcohol at 75 oC for 30 h. The strong calibration was obtained by etching two
CR39 sheets exposed to 3 A GeV Fe26+; the detector thickness was reduced from
1400 µm to ~900 µm at the rate of 8 µm/h. Fig. 4.20 shows p vs REL for CR39
etched strongly, the detector threshold is at 300 MeV cm2 g
-1 which corresponds to
Z/β ~ 17. This is the etching condition for the SLIM CR39 NTDs (see also Fig. 4.10
c,d).
D = 161 µµµµm S16+
D = 43 µµµµm
20X 20X
50X 50X
D = 371 µµµµm Kr36+
D = 81 µµµµm
D = 440 µµµµm In49+
D = 91 µµµµm
10X
50X

56
Fig. 4.18 “Strong” etching; mean area distribution (4 faces out of 5) of 158 A GeV In49+
ions and their fragments in CR39 after 5.50 h: etching in (a) 8N NaOH 90 oC and (b) 8N
KOH + 1.25 % Ethyl Alcohol at 77 oC, respectively.
Z = 8
Z = 20
Z = 49
Z = 30
(a)
Z = 15
Z = 20
Z = 49
Z = 30
(b)

57
Fig. 4.19 p vs REL for the CR39 detectors exposed to relativistic indium ions and their
fragments, etched in “strong” conditions.
Fig. 4.20 p vs REL for the CR39 detectors exposed to relativistic iron ions and their
fragments, etched in “strong” conditions.

58
4.6 Response Curve for Makrofol
Fig. 4.21 shows the etch-pit base area distribution for lead ions and their
fragments in Makrofol NTDs. The resolution of the base area measurement become
worse as the charge of the fragment increases, because for high charges the base
diameter of the etch pit cone changes slowly compared to the cone height increases
sharply. The effect is qualitatively described in Fig 4.22.
Fig. 4.21 Cone base area distribution (average of 2 measurements on two front faces) of
158 A GeV Pb ions and fragments in Makrofol after 8 h etching, in 6N KOH + Ethyl Alcohol
(80 : 20 % by volume) at 50 oC (Inset single measurements of cone heights).
Z/β = β = β = β = 51
78
Z/β =β =β =β = 82
83

59
The changes δD and δLe with respect to δp can be obtained by differentiating
eqs. 4.1 and 4.2 with respect to p [101]:
δDδp= 2vB t
p +1p −1
1
(p +1)2 (4.7)
δLe
δp= vB t (4.8)
At large p values, pD δδ / is smaller than pLe δδ / ; for high REL it is difficult
to obtain a charge resolution <1e from base diameter measurements. From Figs. 4.15
and 4.21 it is apparent that at high Z/β, the base area distribution does not give well
separated peaks; instead the peaks are well separated by cone height measurements.
Two Makrofol foils exposed at 90o and at 45
o with respect to the detector
surface, respectively were etched in 6N KOH + 20 % ethyl alcohol. The heights of
more than 4000 etch pit cones on each foil were measured with an accuracy of ±
1µm. The cone height distributions are shown in Fig. 4.23(a,b); each peak is well
separated from the others, and a charge can be assigned to each. Notice the Z=83
peak which is due to a charge pick-up reaction.
For each charge, the REL and p values have been calculated for the Makrofol
detector with the same procedure used for the calibrations of CR39 NTDs (see Fig.
4.24). The Makrofol detection threshold is at REL ~2700 MeV cm2 g-1,
corresponding to a nuclear fragment with Z/β ~50.
As evident in Figs. 4.16 and 4.24 the reduced etch-rate p is a non-linear
function of REL. For example for CR39 up to REL ~500 MeV cm2 g-1, p changes
slowly with REL, while a rapid increase is observed at larger values.

60
Fig. 4.22 The variation of cone height Le and of the base diameter D for relativistic lead
ions and their fragments measured in one sheet of CR39 [12].
Fig. 4.23 Cone height distributions in Makrofol NTDs for 158 A GeV Pb82+
beam exposure
for (a) normal incidence and (b) 45o incidence angle (single measurements).
Z = 20e
D = 40 µµµµm Le = 23 µµµµm
Z = 45e
D = 59 µµµµm Le =77 µµµµm
Z = 65e
D = 69 µµµµm Le = 169 µµµµm
Z = 76e
D = 74 µµµµm Le = 425 µµµµm
Z = 82e
D = 75 µ µ µ µm Le = 650 µµµµm
(a) Normal incidence
80
83 78
(b) 45o incidence Z = 82
75 83
80
78
Z = 82
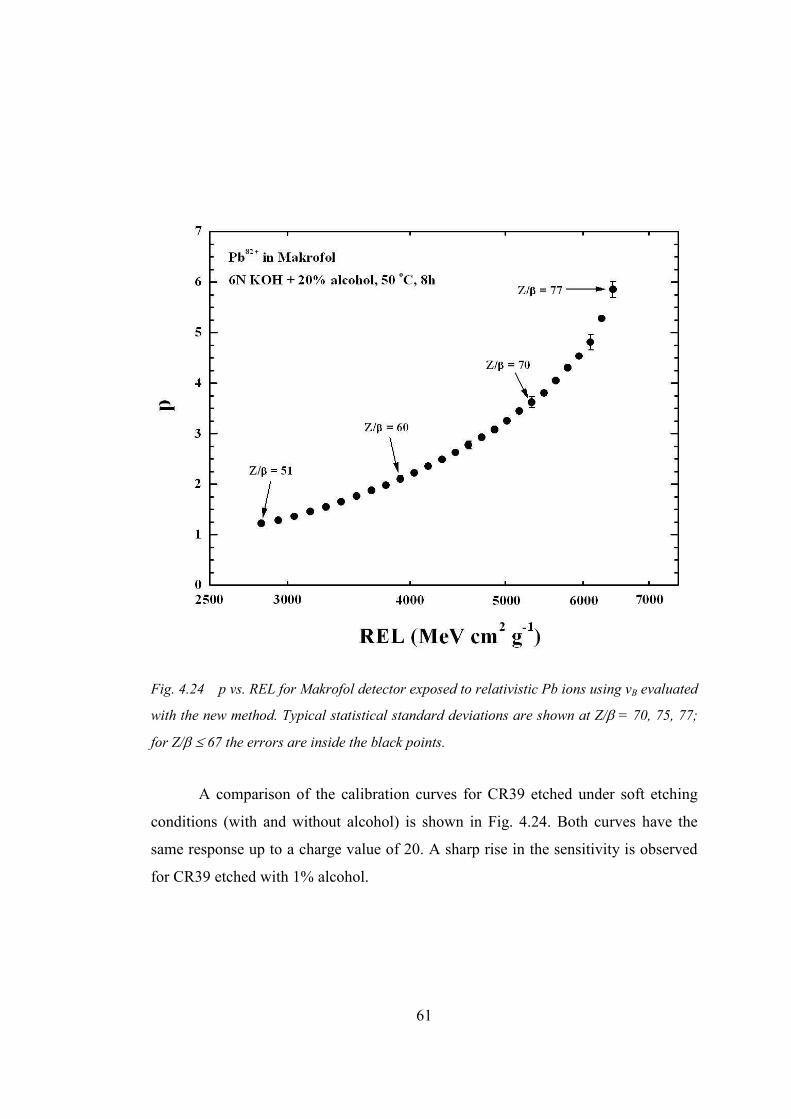
61
Fig. 4.24 p vs. REL for Makrofol detector exposed to relativistic Pb ions using vB evaluated
with the new method. Typical statistical standard deviations are shown at Z/β = 70, 75, 77;
for Z/β ≤ 67 the errors are inside the black points.
A comparison of the calibration curves for CR39 etched under soft etching
conditions (with and without alcohol) is shown in Fig. 4.24. Both curves have the
same response up to a charge value of 20. A sharp rise in the sensitivity is observed
for CR39 etched with 1% alcohol.

62
Fig. 4.25 Comparison for CR39 NTDs exposed to relativistic heavy ions and etched under
different “soft” condition. Notice the p values at Z = 10, 20, 40 and 49 for two etching
conditions for CR39. A sharp rise is evident for etching with alcohol after Z/β > 20.
4.7 Response Curves of CR39 to Relativistic Pb, Fe, Si and C ions
The same experimental procedure was used as mentioned above for the
analysis of 158 A GeV Pb82+ , 0.41, 1 & 5 A GeV Fe
26+, 1 A GeV Si
14+ and 0.29 A
GeV C6+ heavy ions. For the determination of the bulk etch rate by the cone height
and diameter method the CR39 sheets exposed to the relativistic Pb ions were used.
For the low charge beams we used the bulk etch velocity measured by the change in
thickness method (the cone height is not measurable due to the large cone opening
angle; in this case cone tip is difficult to identify with optical microscope.
Z = 10
20
40
49
10 20
40
49
67
60

63
The distribution of bulk etch velocity of 67 CR39 NTDs is drawn in Fig 4.26.
A Gaussian fit of the experimental data gives a mean value of vB ⋍ 1.11 ± 0.07. The
value is the same when measured using the new method (cone height and diameter
measurement, see Table 4.4).
Fig. 4.26 Distribution of the bulk etch-rate for 67 CR39 detectors measured with the
change in thickness method. The line is a Gaussian fit to the experimental data.
Histograms of the mean base areas for beams of 0.41 and 1 A GeV Fe and Si
ions and their fragments in CR39 detectors etched in the same conditions (6N NaOH
70 oC 30 h) are drawn in the same scale for comparison, see Fig. 4.27. There are
individual charge peaks with a minor shift in the mean area for the same nuclear
fragment.
6N NaOH 70 oC, 30h
1.11 ± 0.07 µµµµm/h
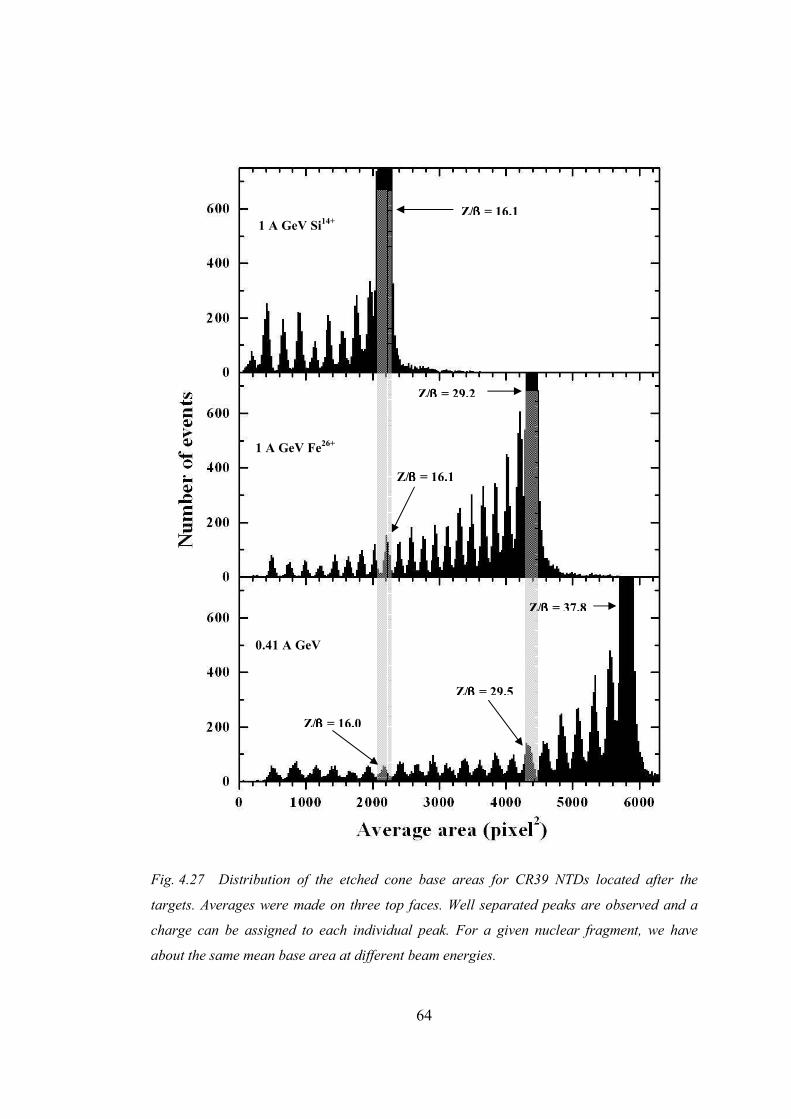
64
Fig. 4.27 Distribution of the etched cone base areas for CR39 NTDs located after the
targets. Averages were made on three top faces. Well separated peaks are observed and a
charge can be assigned to each individual peak. For a given nuclear fragment, we have
about the same mean base area at different beam energies.
1 A GeV Si14+
1 A GeV Fe26+
0.41 A GeV
Z/ββββ = 16.1
Z/ββββ = 29.2
Z/ββββ = 16.1
Z/ββββ = 16.0
Z/ββββ = 37.8
Z/ββββ = 29.5

65
Target
5 AGeV Fe+26 + CH2
Number of events
Z = 26
Z = 26
7 10 20
20
10
7
Figures 4.28 and 4.30 show the average base area distributions and scatter
plots of 5 A GeV Fe26+ and of 1 A GeV Si
14+ ions and their fragments tracked
through 2 foils upstream and downstream of the target. Well separated peaks are
observed and a charge can be assigned to each individual peak; some assigned
charges are shown on each graph.
Fig. 4.28 Overall view of the analysis of 5 A GeV Fe26+
+ CH2: the average area
distributions and the scatter plots of the CR39 sheets placed before and after the target are
presented. Individual charges are clearly resolved down to Z = 7.
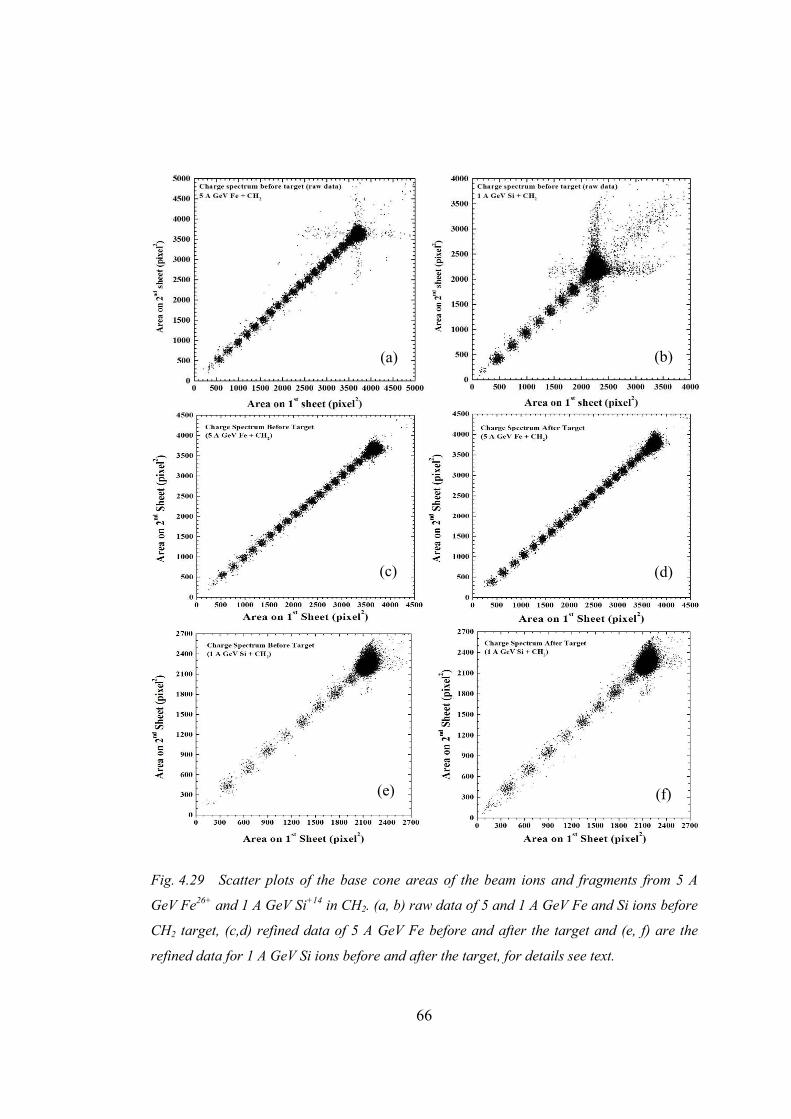
66
Fig. 4.29 Scatter plots of the base cone areas of the beam ions and fragments from 5 A
GeV Fe26+
and 1 A GeV Si+14
in CH2. (a, b) raw data of 5 and 1 A GeV Fe and Si ions before
CH2 target, (c,d) refined data of 5 A GeV Fe before and after the target and (e, f) are the
refined data for 1 A GeV Si ions before and after the target, for details see text.
(a) (b)
(c) (d)
(e) (f)
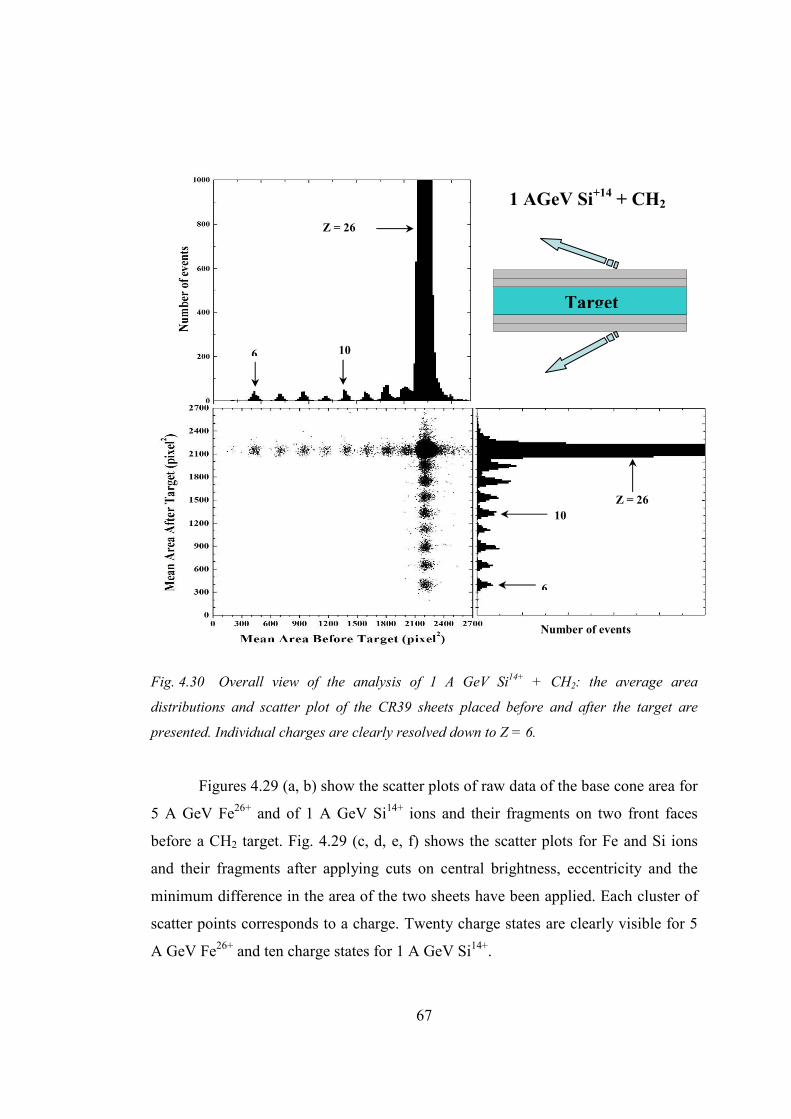
67
Fig. 4.30 Overall view of the analysis of 1 A GeV Si14+
+ CH2: the average area
distributions and scatter plot of the CR39 sheets placed before and after the target are
presented. Individual charges are clearly resolved down to Z = 6.
Figures 4.29 (a, b) show the scatter plots of raw data of the base cone area for
5 A GeV Fe26+ and of 1 A GeV Si
14+ ions and their fragments on two front faces
before a CH2 target. Fig. 4.29 (c, d, e, f) shows the scatter plots for Fe and Si ions
and their fragments after applying cuts on central brightness, eccentricity and the
minimum difference in the area of the two sheets have been applied. Each cluster of
scatter points corresponds to a charge. Twenty charge states are clearly visible for 5
A GeV Fe26+ and ten charge states for 1 A GeV Si
14+.
1 AGeV Si+14 + CH2
Z = 26
6 10
Number of events
Z = 26
6
10
Target
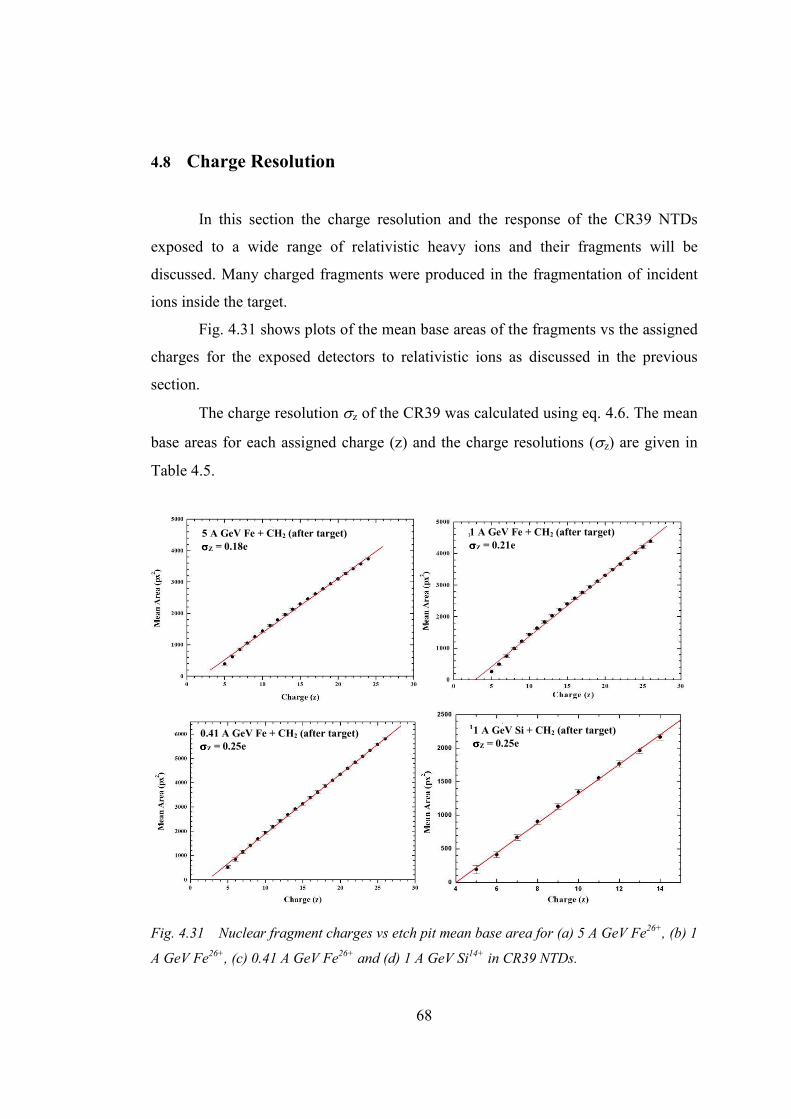
68
4.8 Charge Resolution
In this section the charge resolution and the response of the CR39 NTDs
exposed to a wide range of relativistic heavy ions and their fragments will be
discussed. Many charged fragments were produced in the fragmentation of incident
ions inside the target.
Fig. 4.31 shows plots of the mean base areas of the fragments vs the assigned
charges for the exposed detectors to relativistic ions as discussed in the previous
section.
The charge resolution σz of the CR39 was calculated using eq. 4.6. The mean
base areas for each assigned charge (z) and the charge resolutions (σz) are given in
Table 4.5.
Fig. 4.31 Nuclear fragment charges vs etch pit mean base area for (a) 5 A GeV Fe
26+, (b) 1
A GeV Fe26+
, (c) 0.41 A GeV Fe26+
and (d) 1 A GeV Si14+
in CR39 NTDs.
5 A GeV Fe + CH2 (after target)
σσσσZ = 0.18e 1 A GeV Fe + CH2 (after target)
σσσσZ = 0.21e
0.41 A GeV Fe + CH2 (after target)
σσσσZ = 0.25e
1 A GeV Si + CH2 (after target)
σσσσZ = 0.25e

69
Table 4.5 Mean base areas and charge resolutions σZ of nuclear fragment measured in
CR39 NTDs using high energy Fe26+, Si
14+ and C
6+ ion beams on a CH2 target.
5 Α5 Α5 Α5 ΑGeV Fe26+ 1 Α1 Α1 Α1 ΑGeV Fe26+ 0.41 Α0.41 Α0.41 Α0.41 ΑGeV Fe
26+ 1 Α1 Α1 Α1 ΑGeV Si14+ 0.29 Α0.29 Α0.29 Α0.29 ΑGeV C6+
Z Mean
Area
(pixel2)
σσσσZ Mean
Area
(pixel2)
σσσσZ Mean
Area
(pixel2)
σσσσZ Mean
Area
(pixel2)
σσσσZ Mean
Area
(pixel2)
σσσσZ
4 - - - - - - - - 495 0.13
5 - - 257 0.24 515 0.28 192 0.28 913 0.14
6 - - 490 0.19 838 0.31 412 0.20 1278 0.11
7 391 0.22 746 0.22 1145 0.28 667 0.19
8 612 0.20 988 0.21 1408 0.26 904 0.19
9 850 0.14 1216 0.25 1679 0.29 1131 0.21
10 1047 0.17 1428 0.21 1936 0.22 1344 0.18
11 1253 0.16 1633 0.21 2173 0.26 1554 0.20
12 1434 0.17 1829 0.20 2422 0.23 1765 0.21
13 1614 0.16 2029 0.20 2669 0.30 1966 0.21
14 1790 0.19 2214 0.19 2907 0.21 2165 0.20
15 1960 0.18 2397 0.21 3130 0.28
16 2128 0.18 2581 0.20 3378 0.22
17 2297 0.18 2764 0.20 3606 0.28
18 2458 0.18 2939 0.19 3855 0.24
19 2620 0.18 3121 0.23 4095 0.25
20 2782 0.17 3302 0.20 4336 0.23
21 2939 0.18 3482 0.22 4589 0.24
22 3095 0.17 3662 0.21 4840 0.22
23 3265 0.21 3841 0.20 5082 0.23
24 3418 0.19 4029 0.24 5326 0.24
25 3570 0.19 4209 0.16 5571 0.23
26 3733 0.21 4385 0.21 5804 0.18

70
Fig. 4.32 p vs REL for CR39 NTDs exposed to Pb, Fe, Si and C ions of different energies.
(a) by thickness method and (b) by new method for computing the bulk etch velocity vB.
(a)
(b)

71
Better charge resolution σZ ~0.13 to 0.18e can be achieved by measuring
three top faces of CR39 sheets exposed to 0.29 A GeV C and 5 A GeV Fe ions and
their fragments. A lower charge resolution (σZ = 0.21 ± 0.03) has been obtained for 1
A GeV Fe and Si ions and their fragments measured on three front faces of CR39
sheets. The charge resolutions can be improved by measuring more faces of CR39
sheets.
The etched rate ratio p was calculated by the old and by the new method
(track diameter and cone height measurements). Fig. 4.32a,b show p vs REL for C6+,
Si14+, Fe
26+ and Pb82+ ions and their fragments in CR39. It is observed that all the
experimental data points are not lying on one curve because of different bulk etch-
rate velocities.
Fig. 4.32b shows the p vs REL, with p calculated by taking the mean vB =
1.10 ± 0.02 by the new method (see Table 4.3). All the experimental data points are
on a single curve. The REL of charged particles can be used as a convenient criterion
to predict the formation of an etchable track in plastics.

72
5. The SLIM experiment
5.1 Introduction
The SLIM experiment, planned for the search for IMMs and SQM, is based
on 440 m2 of NTDs installed at the Chacaltaya high altitude cosmic ray laboratory
(Bolivia, 5230 m a.s.l.) since 2000, Fig. 5.1a, and 100 m2 more installed at Koksil,
Himalaya (Pakistan, 4275 m a.s.l.) since 2002, Fig. 5.1b. The detectors are organized
in wagons (modules) of 24 cm x 24 cm, each made of 3 layers of CR39 (1.4 mm
thick), 3 layers of polycarbonate (Makrofol, 0.5 mm thick) and of an aluminium
absorber (1 mm thick); each module is sealed in an aluminized plastic bag filled with
dry air at 1 atm pressure; the composition of a SLIM wagon is shown in Fig. 5.2b.
Since the atmospheric pressure at Chacaltaya is ~0.5 atm, a test was made in which
some aluminized plastic bags filled with 1 atm of dry air were sealed and placed in a
chamber at a pressure of about 0.3 atm for three weeks; no leakage was observed.
Fig. 5.1 The sites of the SLIM experiment: (a) Chacaltaya, Bolivia (5230 m a.s.l.)
and (b) Koksil, Himalaya, Pakistan (4275 m a.s.l.).
(b) (a)

73
The CR39 NTDs are used for the possible detection of Dirac charge (g = gD)
MMs with β around 10-4 and β > 10-3 (most of the whole β range, β > 10-4, for
magnetic charges g > 2gD, dyons and for SQM). The second and third layers of CR39
and all Makrofol NTDs are used for confirmation of possible candidates.
The radon concentration in the experimental sites was measured using E-
PERM (at the Chacaltaya site) and CR39 radon dosimeters (at the Koksil site). It was
found to be about 40 - 50 Bq/m3 at both places; such levels of radon concentrations
do not give any major problem in terms of background tracks in the detectors.
The cosmic ray neutron flux with energy 1 < En < 20 MeV was also measured
with BF3 gaseous detectors (Chacaltaya site) and with CR39 nuclear track detectors
(Koksil site). We obtained Φn = (1.7 ± 0.8) 10-2 cm-2 s-1, in agreement with other
reported neutron flux data at the Chacaltaya altitude. At Koksil a flux of (6.0 ± 1.0)
10-3 cm
-2h-1 was measured. The neutron flux could give some background problems.
Fig. 5.2 (a) The SLIM modules installed at Chacaltaya and (b) sketch of the
composition of one module. The whole module is enclosed in an aluminized plastic bag filled
with dry air at 1 atm pressure.
The CR39 and Makrofol detector calibrations are discussed in chapter 4. For
soft and strong etching conditions with alcohol the thresholds for CR39 are at REL
(a)
(b)
L0
L1
L2
L3
L4
L5
L6
L7
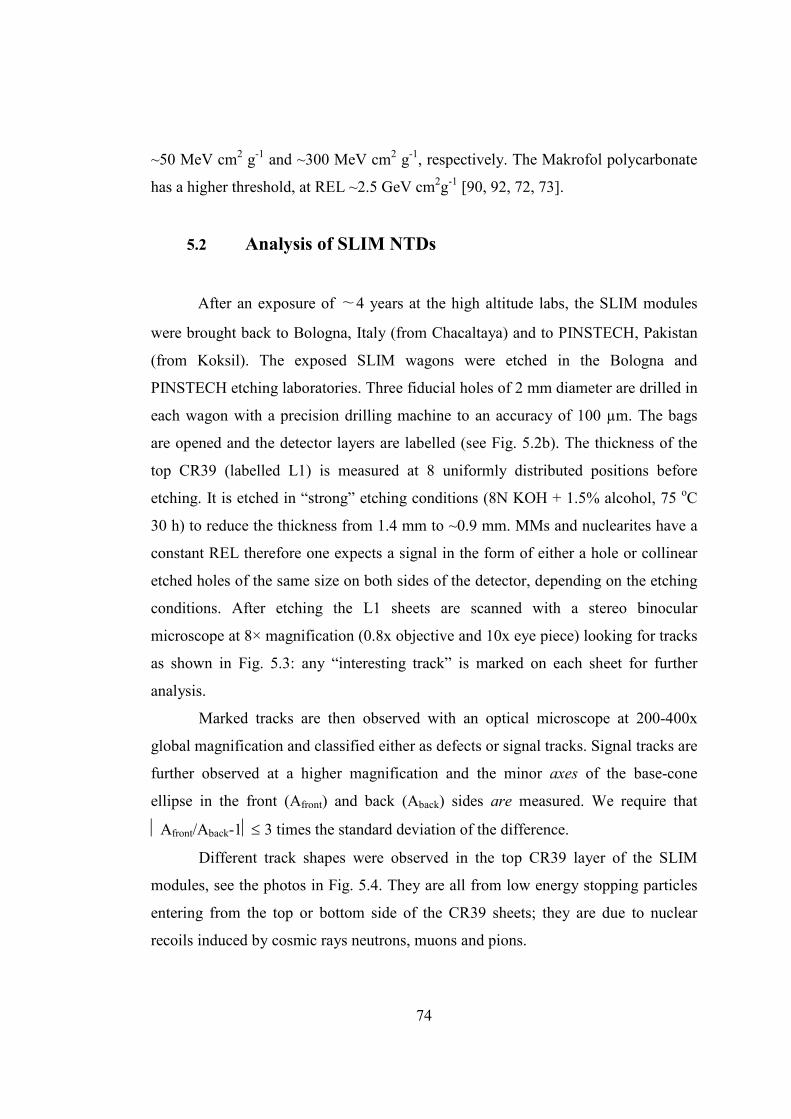
74
~50 MeV cm2 g-1 and ~300 MeV cm
2 g-1, respectively. The Makrofol polycarbonate
has a higher threshold, at REL ~2.5 GeV cm2g-1 [90, 92, 72, 73].
5.2 Analysis of SLIM NTDs
After an exposure of ∼4 years at the high altitude labs, the SLIM modules
were brought back to Bologna, Italy (from Chacaltaya) and to PINSTECH, Pakistan
(from Koksil). The exposed SLIM wagons were etched in the Bologna and
PINSTECH etching laboratories. Three fiducial holes of 2 mm diameter are drilled in
each wagon with a precision drilling machine to an accuracy of 100 µm. The bags
are opened and the detector layers are labelled (see Fig. 5.2b). The thickness of the
top CR39 (labelled L1) is measured at 8 uniformly distributed positions before
etching. It is etched in “strong” etching conditions (8N KOH + 1.5% alcohol, 75 oC
30 h) to reduce the thickness from 1.4 mm to ~0.9 mm. MMs and nuclearites have a
constant REL therefore one expects a signal in the form of either a hole or collinear
etched holes of the same size on both sides of the detector, depending on the etching
conditions. After etching the L1 sheets are scanned with a stereo binocular
microscope at 8× magnification (0.8x objective and 10x eye piece) looking for tracks
as shown in Fig. 5.3: any “interesting track” is marked on each sheet for further
analysis.
Marked tracks are then observed with an optical microscope at 200-400x
global magnification and classified either as defects or signal tracks. Signal tracks are
further observed at a higher magnification and the minor axes of the base-cone
ellipse in the front (Afront) and back (Aback) sides are measured. We require that
Afront/Aback-1≤ 3 times the standard deviation of the difference.
Different track shapes were observed in the top CR39 layer of the SLIM
modules, see the photos in Fig. 5.4. They are all from low energy stopping particles
entering from the top or bottom side of the CR39 sheets; they are due to nuclear
recoils induced by cosmic rays neutrons, muons and pions.
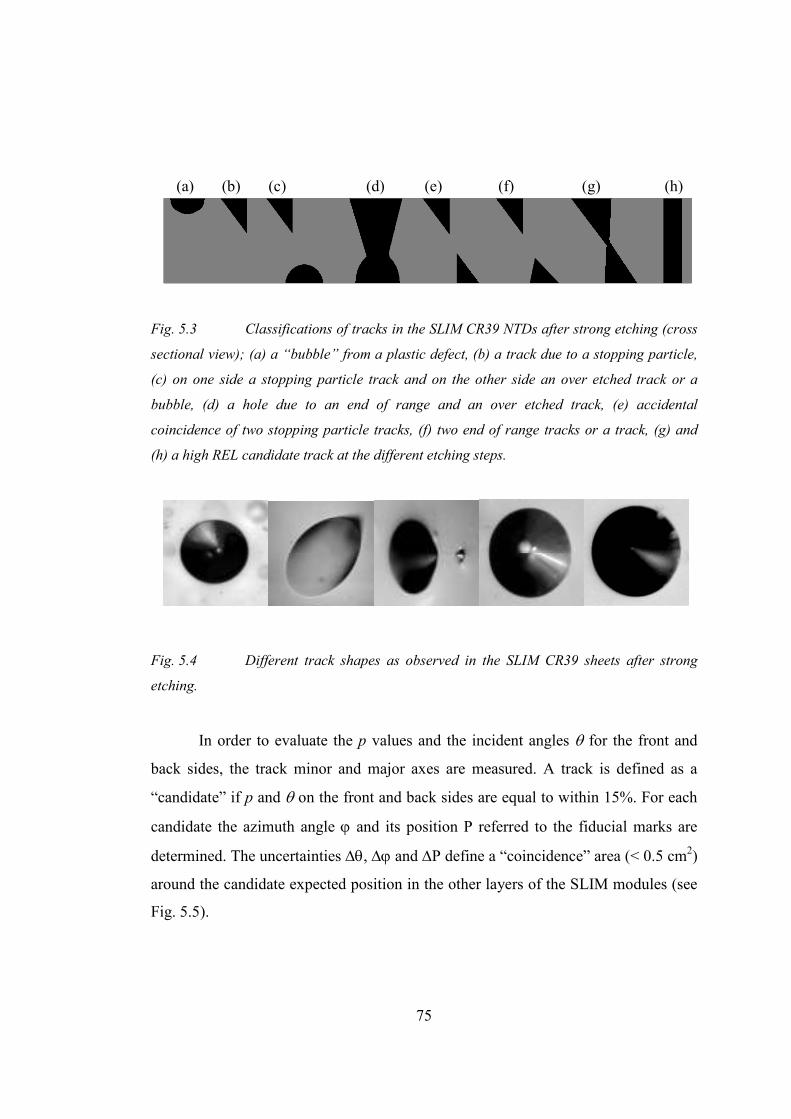
75
Fig. 5.3 Classifications of tracks in the SLIM CR39 NTDs after strong etching (cross
sectional view); (a) a “bubble” from a plastic defect, (b) a track due to a stopping particle,
(c) on one side a stopping particle track and on the other side an over etched track or a
bubble, (d) a hole due to an end of range and an over etched track, (e) accidental
coincidence of two stopping particle tracks, (f) two end of range tracks or a track, (g) and
(h) a high REL candidate track at the different etching steps.
Fig. 5.4 Different track shapes as observed in the SLIM CR39 sheets after strong
etching.
In order to evaluate the p values and the incident angles θ for the front and
back sides, the track minor and major axes are measured. A track is defined as a
“candidate” if p and θ on the front and back sides are equal to within 15%. For each
candidate the azimuth angle ϕ and its position P referred to the fiducial marks are
determined. The uncertainties ∆θ, ∆ϕ and ∆P define a “coincidence” area (< 0.5 cm2)
around the candidate expected position in the other layers of the SLIM modules (see
Fig. 5.5).
(a) (b) (c) (d) (e) (f) (g) (h)

76
Fig. 5.5 The procedure used for the ‘confidence’ area in which a possible candidate
track located on the top layer will be searched for in other layers of the same module.
The lowermost CR39 layer is then etched in “soft” conditions (6N NaOH +
1% ethyl alcohol, 70 oC 40h) and an accurate scanning with an optical microscope at
high magnification is done in a squared region around the candidate expected
position, which includes the “confidence” area. If a two-fold coincidence track was
detected all geometrical parameters are measured; the middle CR39 layer would also
be analyzed using the same procedure.
5.2.1 Non Confirmable Strange Events
In the past, a number of magnetic monopoles and other exotic candidate
events were quoted and few results were also published [93], but none of these
results were confirmed.
We observed a strange event in the first layer (L1) of the SLIM module 7408
after strong etching of the CR39 sheet.
r Dq + ecos Ö 2
r =
e
()
tanz-
zD q
( sin
z-D
Dqq2z)
-
()
tan
z+
zD q
( sin
z+
DDq
q2z)
+
Dj
z Dqqsin
2
z
qtan
j
DqDj
z
q j
L1
L5
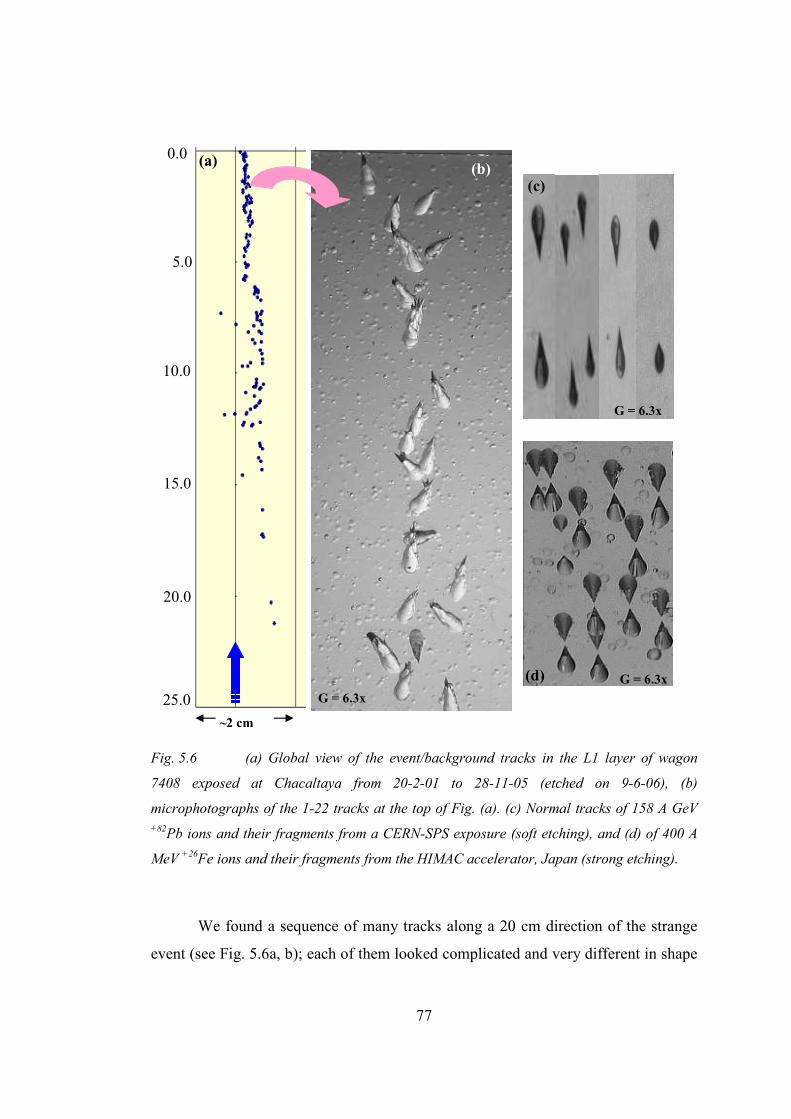
77
Fig. 5.6 (a) Global view of the event/background tracks in the L1 layer of wagon
7408 exposed at Chacaltaya from 20-2-01 to 28-11-05 (etched on 9-6-06), (b)
microphotographs of the 1-22 tracks at the top of Fig. (a). (c) Normal tracks of 158 A GeV
+82Pb ions and their fragments from a CERN-SPS exposure (soft etching), and (d) of 400 A
MeV +26
Fe ions and their fragments from the HIMAC accelerator, Japan (strong etching).
We found a sequence of many tracks along a 20 cm direction of the strange
event (see Fig. 5.6a, b); each of them looked complicated and very different in shape
(b) 0.0
10.0
15.0
20.0
25.0
5.0
(a)
~2 cm
G = 6.3x
(d) G = 6.3x
(c)
G = 6.3x
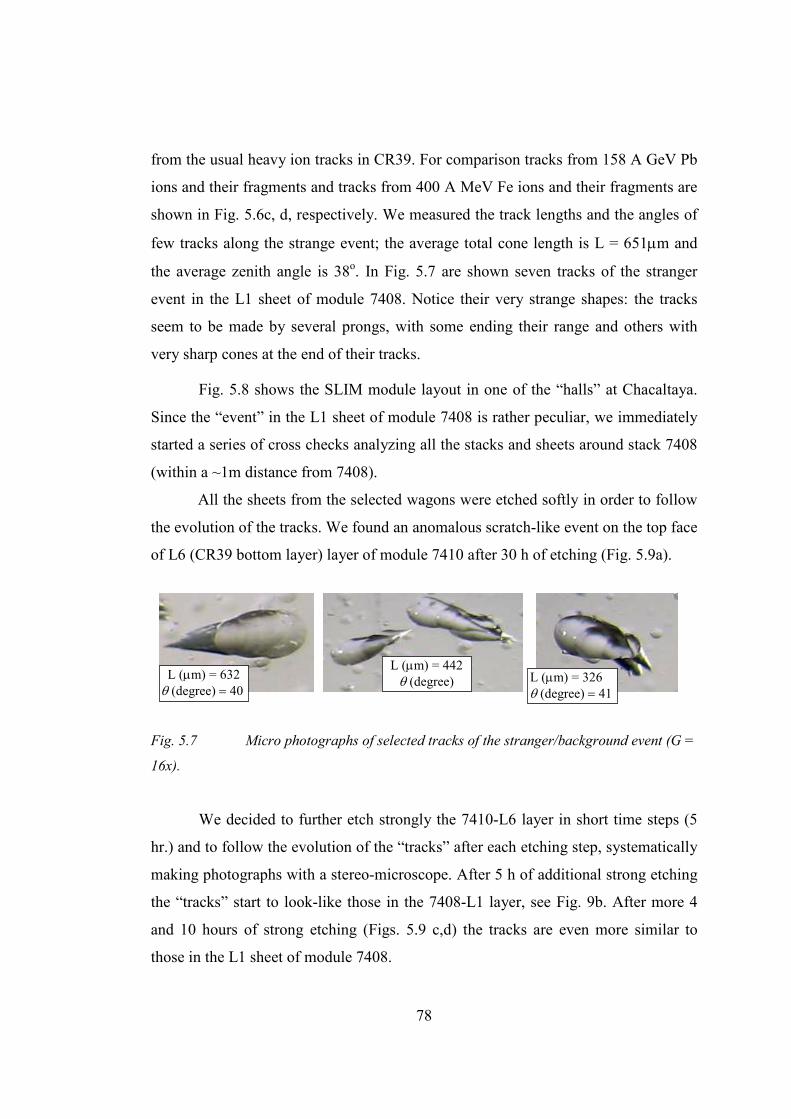
78
from the usual heavy ion tracks in CR39. For comparison tracks from 158 A GeV Pb
ions and their fragments and tracks from 400 A MeV Fe ions and their fragments are
shown in Fig. 5.6c, d, respectively. We measured the track lengths and the angles of
few tracks along the strange event; the average total cone length is L = 651µm and
the average zenith angle is 38o. In Fig. 5.7 are shown seven tracks of the stranger
event in the L1 sheet of module 7408. Notice their very strange shapes: the tracks
seem to be made by several prongs, with some ending their range and others with
very sharp cones at the end of their tracks.
Fig. 5.8 shows the SLIM module layout in one of the “halls” at Chacaltaya.
Since the “event” in the L1 sheet of module 7408 is rather peculiar, we immediately
started a series of cross checks analyzing all the stacks and sheets around stack 7408
(within a ~1m distance from 7408).
All the sheets from the selected wagons were etched softly in order to follow
the evolution of the tracks. We found an anomalous scratch-like event on the top face
of L6 (CR39 bottom layer) layer of module 7410 after 30 h of etching (Fig. 5.9a).
Fig. 5.7 Micro photographs of selected tracks of the stranger/background event (G =
16x).
We decided to further etch strongly the 7410-L6 layer in short time steps (5
hr.) and to follow the evolution of the “tracks” after each etching step, systematically
making photographs with a stereo-microscope. After 5 h of additional strong etching
the “tracks” start to look-like those in the 7408-L1 layer, see Fig. 9b. After more 4
and 10 hours of strong etching (Figs. 5.9 c,d) the tracks are even more similar to
those in the L1 sheet of module 7408.
L (µm) = 442 θ (degree) = 49
L (µm) = 326 θ (degree) = 41
L (µm) = 632 θ (degree) = 40
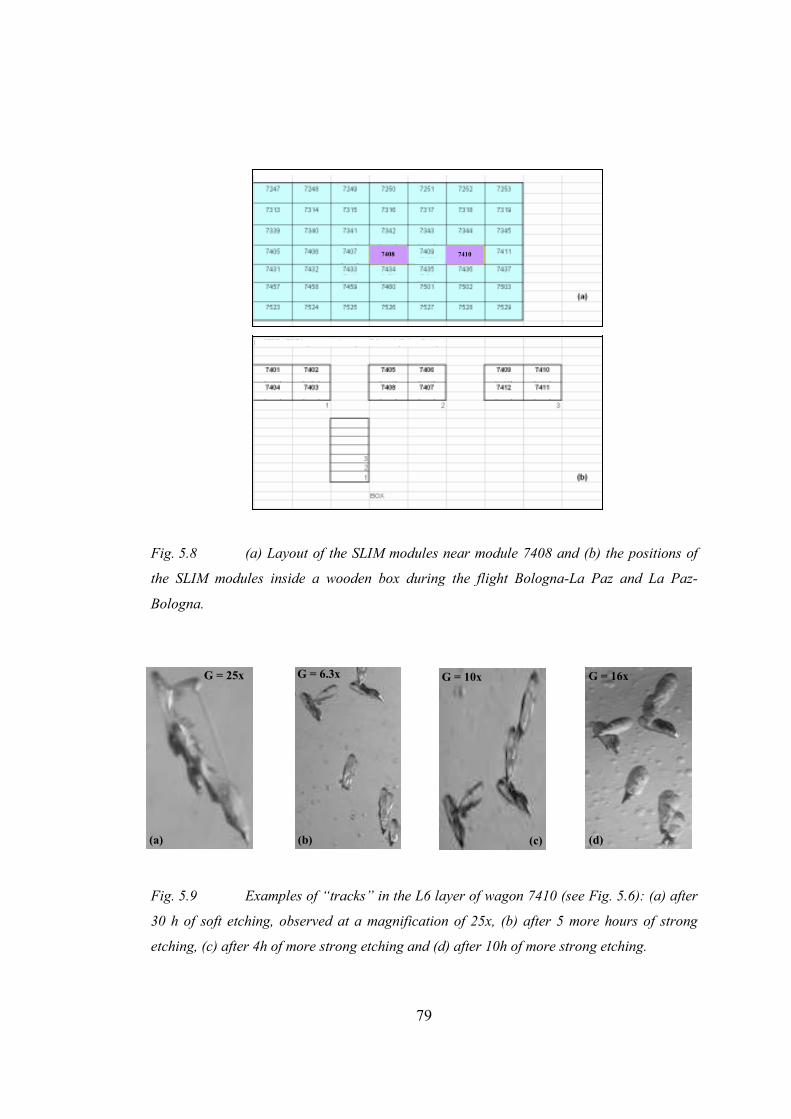
79
Fig. 5.8 (a) Layout of the SLIM modules near module 7408 and (b) the positions of
the SLIM modules inside a wooden box during the flight Bologna-La Paz and La Paz-
Bologna.
Fig. 5.9 Examples of “tracks” in the L6 layer of wagon 7410 (see Fig. 5.6): (a) after
30 h of soft etching, observed at a magnification of 25x, (b) after 5 more hours of strong
etching, (c) after 4h of more strong etching and (d) after 10h of more strong etching.
(a)
G = 6.3x G = 10x G = 16x G = 25x
(b) (c) (d)
7410
7408

80
The presence of this second event/background and its evolution with
increasing etching casts stronger doubts on the first event/background.
Moreover we inspected before and after etchings all the sheets in the modules
located close to 7408. We found at least one small translucid spot on one un-etched
foil, suggestive of a small piece of glass on the surface: this background disappeared
after the first soft etching; the same happened for a couple of other surface defects.
For three single surface impurities observed before etching in modules 7325 (L3),
7332 (L3) and 7339 (L3), we noticed that after soft and strong etching they yielded
tracks which resemble those in Fig. 5.6 and 5.9.
The presence of the second “event/background” in stack 7410 and the
observations made after different etching times and the three single background
tracks cast strong doubts on an event interpretation and supports a “background”
interpretation of the first “event”. The background may have originated in the
fabrication of the CR39: we made different hypotheses and we checked them with
the Intercast Co. The most plausible hypothesis seems to be the following: the
monomer solution is poured within two casting glass plates separated by a gasket. At
the end of the curing cycle, at the moment of detachment of the foil from the glass
moulds and the gasket, some small pieces of the not perfectly cured material around
the gasket could have been electrostatically deposited on the CR39 surface; then they
may have been pressed onto the surface of CR39 by the rolling machine which
presses a thin transparent protective film on both sides of CR39.
We have analyzed more than 400 m2 of CR39 using different etching
conditions and we have not seen before any of the above mentioned cases. We
conclude that we may have seen a very rare manufacturing defect involving 1 m2 of
CR39.

81
5.3 SLIM Acceptance and Limits for the Search of IMMs and
Nuclearites
5.3.1 Acceptance of the Detector
The acceptance of the SLIM detectors was calculated by assuming an
isotropic flux of magnetic monopoles. The geometrical acceptance of a NTD for an
isotropic flux of particles is given by
( )∫ −==Ωc
cSdS
θ
θπθθθ0
2cos12sincos (5.1)
where S is the detector area of the and θc is the limiting angle for monopoles. The
critical or limiting angle is (eq. 2.11)
pcc
1cossin =−= θθ (5.2)
By comparing eqs. 5.1 and 5.2, the detector acceptance for a downgoing isotropic
flux (Ω = π) is given by
−=Ω
2
11
pSS π (5.3)
From the detector calibrations, p vs REL, in soft etching conditions (see Fig.
4.24) and the REL vs β acceptance for MMs (see Fig. 3.7) we computed the
acceptance of the SLIM detector for downgoing IMMs with g = gD, 2gD, 3gD and for
dyons; the results are shown in Fig 5.10a,b (in soft and strong etching conditions).
Since no IMM candidate was found the flux upper limit at 90% confidence
level (C.L.) is
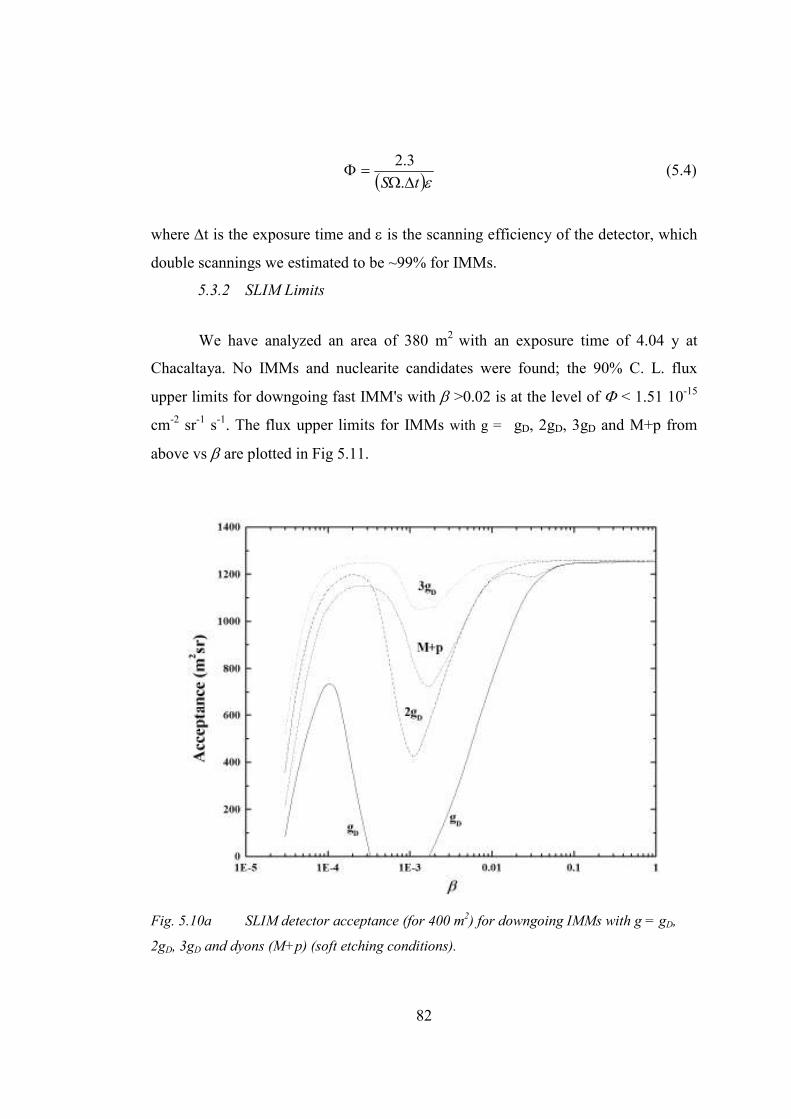
82
( )εtS ∆Ω=Φ
.
3.2 (5.4)
where ∆t is the exposure time and ε is the scanning efficiency of the detector, which
double scannings we estimated to be ~99% for IMMs.
5.3.2 SLIM Limits
We have analyzed an area of 380 m2 with an exposure time of 4.04 y at
Chacaltaya. No IMMs and nuclearite candidates were found; the 90% C. L. flux
upper limits for downgoing fast IMM's with β >0.02 is at the level of Φ < 1.51 10-15
cm-2 sr
-1 s-1. The flux upper limits for IMMs with g = gD, 2gD, 3gD and M+p from
above vs β are plotted in Fig 5.11.
Fig. 5.10a SLIM detector acceptance (for 400 m2) for downgoing IMMs with g = gD,
2gD, 3gD and dyons (M+p) (soft etching conditions).

83
Fig. 5.10b “Strong” etching SLIM detector acceptance (for 400 m2) for downgoing
IMMs with g = gD, 2gD, 3gD and dyons (M+p) (strong etching conditions).
Fig. 5.11 90% C.L. flux upper limits for downgoing intermediate mass magnetic
monopoles with g = gD, 2gD, 3gD and M + p (strong etching condition) (380 m2 analyzed).

84
6. Fragmentation Cross Sections
6.1 Introduction
The availability of relativistic heavy ion beams at the CERN SPS, BNL and HIMAC
facilities have made it possible to investigate the projectile fragmentation on different targets
and for different incoming energies. Experimental results on charge changing cross sections
give information on “peripheral reactions” at relativistic energies. The total reaction cross
sections can give important informations on many fields, including cosmic ray
propagation, appropriate radiation shielding in space or at accelerators,
radiobiological effectiveness, etc. The fragmentation cross sections are needed to
evaluate the changes in composition undergone by cosmic ray particles in the
collisions with the atomic nuclei of the interstellar medium. Plans for the construction
of Ultra Relativistic Heavy Ion colliders must take into account the expected large total
dissociation cross sections, since this process can be an important mechanism for beam
losses in such machines.
A number of authors [94-98] have successfully used NTDs for the systematic
measurement of nuclear fragmentation cross sections. For this purpose we have used CR-39
detectors which can detect a wide range of charges down to Z=5e in the relativistic energy
region [12, 88].
Based on the identification of the charges of the fragments we have
calculated the total charge changing cross sections of Lead, Iron and Silicon ions in
different target materials. Section 6.2 illustrates the experimental procedure; in the
next section, the results on calibrations and on total and partial cross sections are
discussed.
The fragmentation process takes place when a beam of heavy ions is incident
on a target. The emitted fragments are classified as projectile and target fragments.
The target fragments carry a relatively small momentum. The projectile fragments

85
travel with nearly the velocity of the beam, with small deflections, and have a lower
charge compared to that of the incident nuclei.
Fragmentation of relativistic ions occurs in targets through two mechanisms.
One is the electromagnetic dissociation (EMD) and the other is nuclear spallation
(NS). The first channel plays an important role in the case of heavy projectiles and
heavy targets: it occurs when a projectile nucleus passes close to a heavy target
nucleus. For relativistic ions one has a violent electromagnetic pulse incident on the
projectile [95]. For lighter targets, the role of EMD in fragmentation is much weaker.
6.2 Nucleus-Nucleus Total Charge Changing Cross sections
The expression for the total reaction cross sections, derived by Bradt and
Peters [99], gives relatively accurate values for the total charge changing cross
sections. In this model the incident and target nuclei are represented as two hard
spheres colliding with a small overlap; the total cross section is
( )2
31312),( ooTP bAArAA TP −+= πσ (6.1)
AP and AT are the projectile and target mass numbers, respectively; bo is the overlap
or transparency parameter (see Fig. 6.1); ro is the constant of proportionality for the
nuclear radius 31
ioi Arr = ; both bo and ro are energy-independent parameters.
Fig. 6.1 The geometric view of nucleus – nucleus interaction. The figure shows the
projectile and target nuclei of radii RP and RT, and the overlap parameter bo.
RP RT
bo
86
A modified form of the Bradt-Peters formula was suggested by Barshay et al.,
[99] to account for the observed nucleus-nucleus reaction cross sections
( )( )2313131312 −− +−+= TPTP AAbAAr ootot πσ (6.2)
Sihver et al. [99] used this formulation: however, instead of a constant value
of bo, they parameterized it as a first order polynomial in ( )3131 −− + TP AA , while
maintaining the assumption that it is energy-independent (for E ≥ 100 A MeV), they
find ( )3131876.0581.1 −− +−= TPo AAb
6.2.1 Exposure and Data Analysis
Six stacks composed of CR39 NTDs, of size 11.5 x 11.5 cm2, and different
targets were exposed at the CERN-SPS to 158 A GeV Pb82+
ions (see Fig. 6.2).
Twelve stacks composed of CR39 and with different targets were exposed to 10, 5, 3,
1 and 0.3 A GeV Fe26+
ions, 5, 3 and 1 A GeV Si14+
ions at BNL, 0.41, 0.14 A GeV
Fe26+
ions and 0.29 A GeV C12+
ions at HIMAC, Japan (see Fig. 6.3).
For the CERN exposures, three CR39 sheets, 1.4 mm thick, were placed in
the A and B sections of Fig. 6.2. Twelve CR39 sheets, 0.6 mm thick, were located
between “A” and the target ‘a’ section, and 24 CR39 sheets, 0.6 mm thick, were
placed after the target ‘b’. The 3 CR39 sheets in ‘A’ detected the total number of
incoming Pb ions. The 12 CR39 sheets in ‘a’ detected the incident beam ions and
fragments produced in the CR39. The target thickness was typically one half of the
ion mean free path. The 24 CR39 sheets in ‘b’ recorded the surviving beam ions and
their fragments. The exposures were done at normal incidence, with a density of
~2000 ions/cm2. Table 6.1 gives information on the target parameters of each stack.
For the Fe and Si exposures at BNL we placed three CR39 sheets, 0.65 mm
thick, before the target and nine sheets after the target; for the Carbon exposure at
HIMAC, one CR39 sheet was placed before and three sheets after the target.
The CR39 sheets exposed to the 158 A GeV lead beam were etched for 268 h
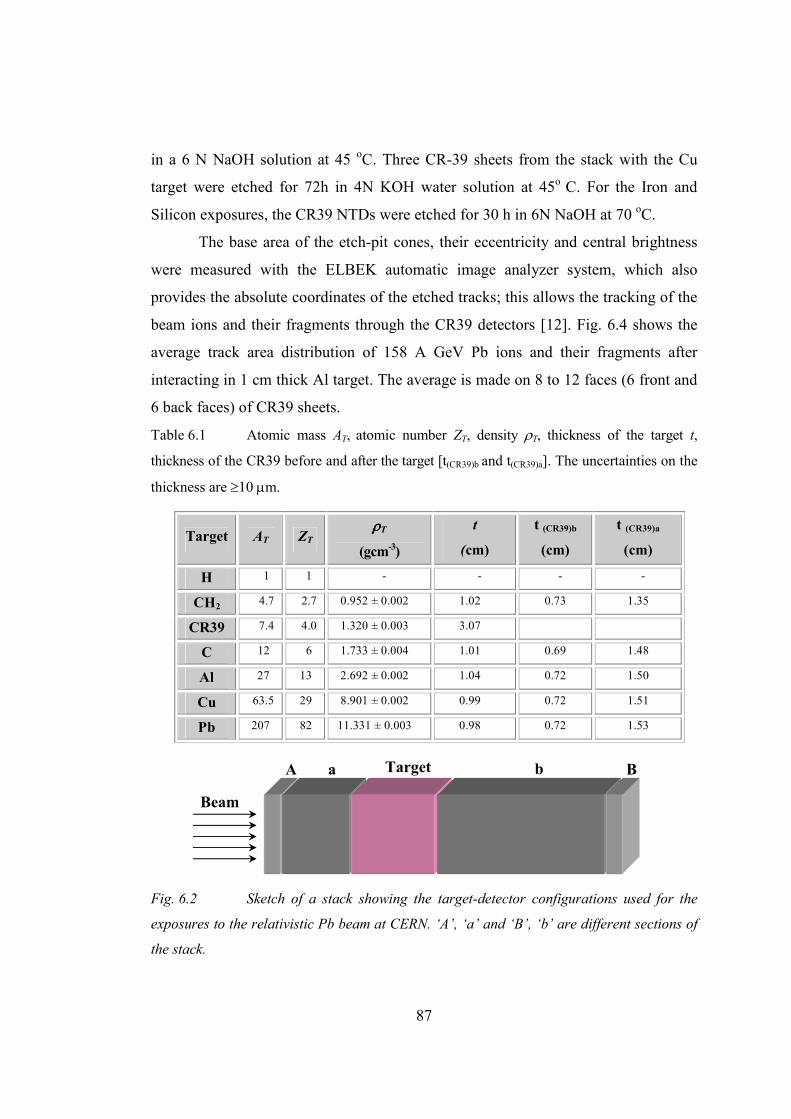
87
in a 6 N NaOH solution at 45 oC. Three CR-39 sheets from the stack with the Cu
target were etched for 72h in 4N KOH water solution at 45o C. For the Iron and
Silicon exposures, the CR39 NTDs were etched for 30 h in 6N NaOH at 70 oC.
The base area of the etch-pit cones, their eccentricity and central brightness
were measured with the ELBEK automatic image analyzer system, which also
provides the absolute coordinates of the etched tracks; this allows the tracking of the
beam ions and their fragments through the CR39 detectors [12]. Fig. 6.4 shows the
average track area distribution of 158 A GeV Pb ions and their fragments after
interacting in 1 cm thick Al target. The average is made on 8 to 12 faces (6 front and
6 back faces) of CR39 sheets.
Table 6.1 Atomic mass AT, atomic number ZT, density ρT, thickness of the target t,
thickness of the CR39 before and after the target [t(CR39)b and t(CR39)a]. The uncertainties on the
thickness are ≥10 µm.
Target AT ZT ρρρρT
(gcm-3)
t
(cm)
t (CR39)b
(cm)
t (CR39)a
(cm)
H 1 1 - - - -
CH2 4.7 2.7 0.952 ± 0.002 1.02 0.73 1.35
CR39 7.4 4.0 1.320 ± 0.003 3.07
C 12 6 1.733 ± 0.004 1.01 0.69 1.48
Al 27 13 2.692 ± 0.002 1.04 0.72 1.50
Cu 63.5 29 8.901 ± 0.002 0.99 0.72 1.51
Pb 207 82 11.331 ± 0.003 0.98 0.72 1.53
Fig. 6.2 Sketch of a stack showing the target-detector configurations used for the
exposures to the relativistic Pb beam at CERN. ‘A’, ‘a’ and ‘B’, ‘b’ are different sections of
the stack.
A a Target b B
Beam
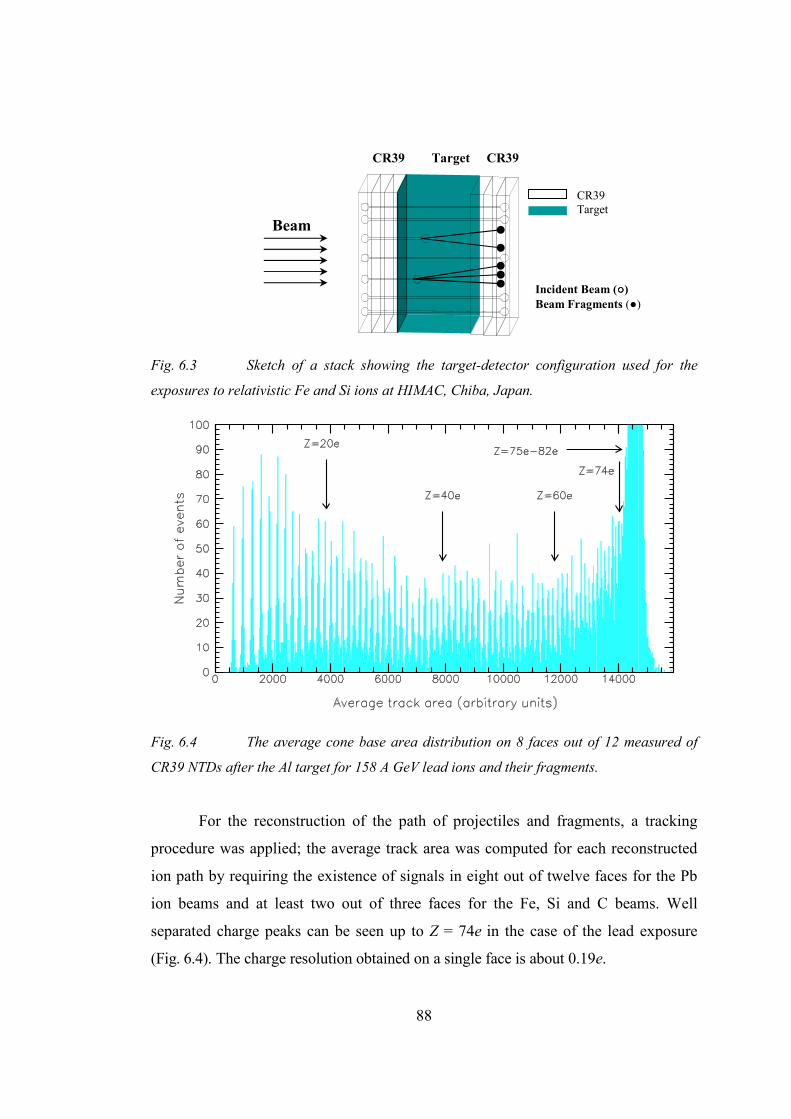
88
CR39 Target CR39
Fig. 6.3 Sketch of a stack showing the target-detector configuration used for the
exposures to relativistic Fe and Si ions at HIMAC, Chiba, Japan.
Fig. 6.4 The average cone base area distribution on 8 faces out of 12 measured of
CR39 NTDs after the Al target for 158 A GeV lead ions and their fragments.
For the reconstruction of the path of projectiles and fragments, a tracking
procedure was applied; the average track area was computed for each reconstructed
ion path by requiring the existence of signals in eight out of twelve faces for the Pb
ion beams and at least two out of three faces for the Fe, Si and C beams. Well
separated charge peaks can be seen up to Z = 74e in the case of the lead exposure
(Fig. 6.4). The charge resolution obtained on a single face is about 0.19e.
Incident Beam ()
Beam Fragments ()
CR39
Target
Beam
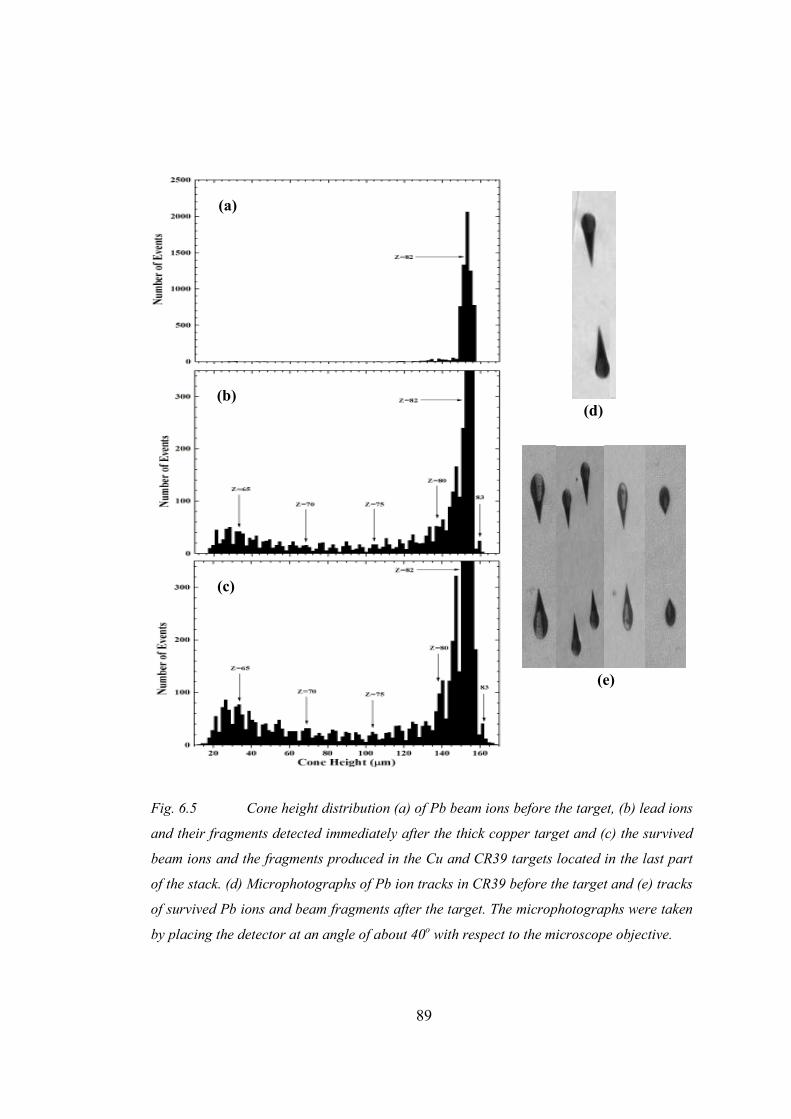
89
Fig. 6.5 Cone height distribution (a) of Pb beam ions before the target, (b) lead ions
and their fragments detected immediately after the thick copper target and (c) the survived
beam ions and the fragments produced in the Cu and CR39 targets located in the last part
of the stack. (d) Microphotographs of Pb ion tracks in CR39 before the target and (e) tracks
of survived Pb ions and beam fragments after the target. The microphotographs were taken
by placing the detector at an angle of about 40o with respect to the microscope objective.
(d)
(e)
(a)
(b)
(c)
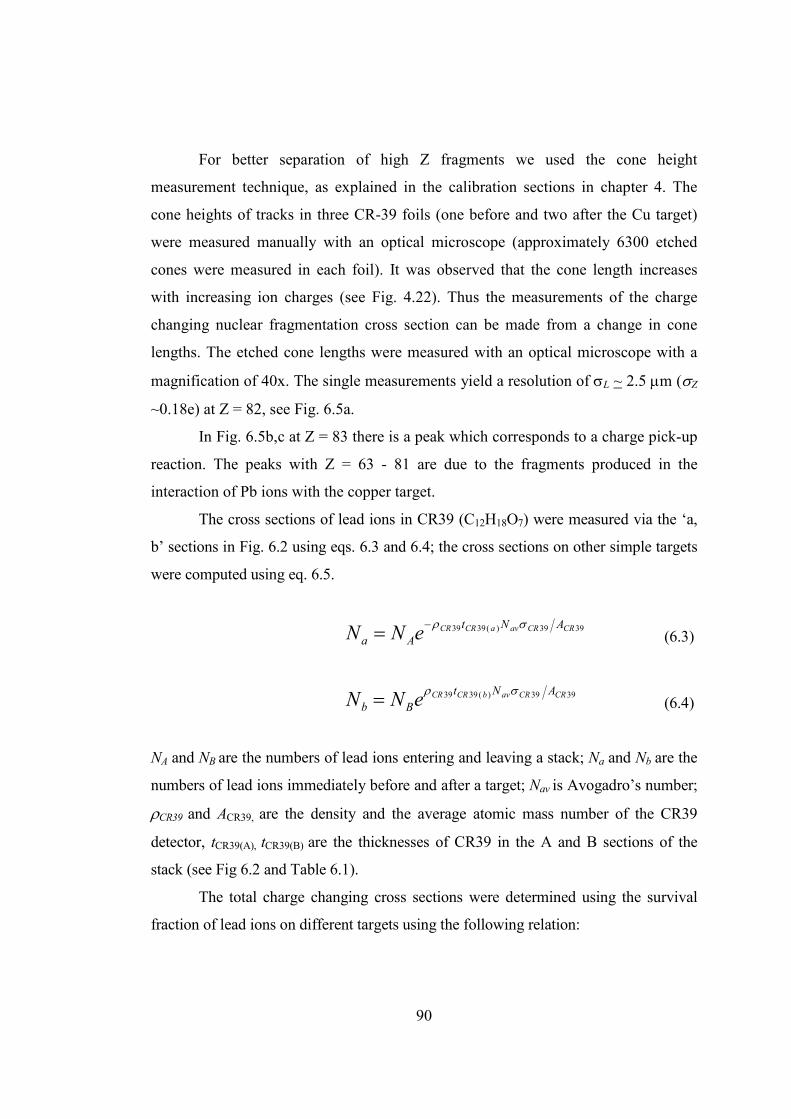
90
For better separation of high Z fragments we used the cone height
measurement technique, as explained in the calibration sections in chapter 4. The
cone heights of tracks in three CR-39 foils (one before and two after the Cu target)
were measured manually with an optical microscope (approximately 6300 etched
cones were measured in each foil). It was observed that the cone length increases
with increasing ion charges (see Fig. 4.22). Thus the measurements of the charge
changing nuclear fragmentation cross section can be made from a change in cone
lengths. The etched cone lengths were measured with an optical microscope with a
magnification of 40x. The single measurements yield a resolution of σL ~ 2.5 µm (σZ
~0.18e) at Z = 82, see Fig. 6.5a.
In Fig. 6.5b,c at Z = 83 there is a peak which corresponds to a charge pick-up
reaction. The peaks with Z = 63 - 81 are due to the fragments produced in the
interaction of Pb ions with the copper target.
The cross sections of lead ions in CR39 (C12H18O7) were measured via the ‘a,
b’ sections in Fig. 6.2 using eqs. 6.3 and 6.4; the cross sections on other simple targets
were computed using eq. 6.5.
3939)(3939 CRCRavaCRCR ANt
Aa eNNσρ−= (6.3)
3939)(3939 CRCRavbCRCR ANt
Bb eNNσρ= (6.4)
NA and NB are the numbers of lead ions entering and leaving a stack; Na and Nb are the
numbers of lead ions immediately before and after a target; Nav is Avogadro’s number;
ρCR39 and ACR39, are the density and the average atomic mass number of the CR39
detector, tCR39(A), tCR39(B) are the thicknesses of CR39 in the A and B sections of the
stack (see Fig 6.2 and Table 6.1).
The total charge changing cross sections were determined using the survival
fraction of lead ions on different targets using the following relation:
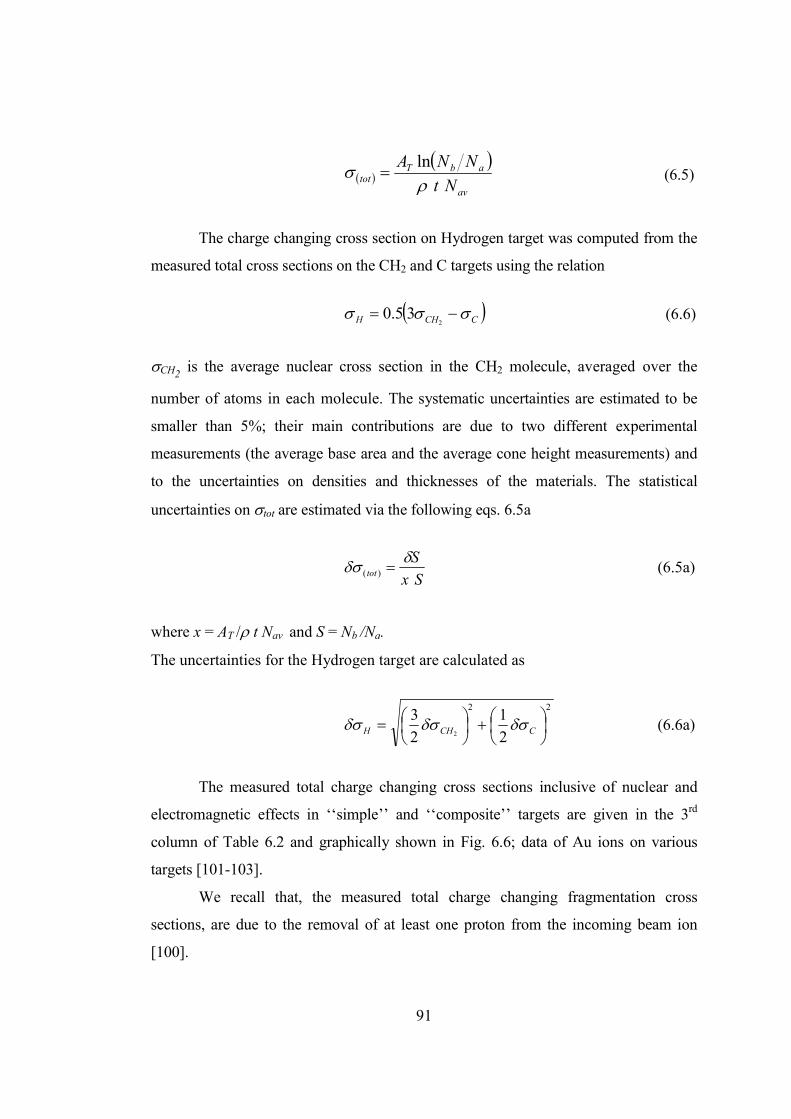
91
( )( )
av
abTtot
Nt
NNA
ρσ
ln= (6.5)
The charge changing cross section on Hydrogen target was computed from the
measured total cross sections on the CH2 and C targets using the relation
( )CCHH σσσ −=2
35.0 (6.6)
σCH2 is the average nuclear cross section in the CH2 molecule, averaged over the
number of atoms in each molecule. The systematic uncertainties are estimated to be
smaller than 5%; their main contributions are due to two different experimental
measurements (the average base area and the average cone height measurements) and
to the uncertainties on densities and thicknesses of the materials. The statistical
uncertainties on σtot are estimated via the following eqs. 6.5a
Sx
Stot
δδσ =)( (6.5a)
where x = AT /ρ t Nav and S = Nb /Na.
The uncertainties for the Hydrogen target are calculated as
22
2
1
2
32
+
= CCHH δσδσδσ (6.6a)
The measured total charge changing cross sections inclusive of nuclear and
electromagnetic effects in ‘‘simple’’ and ‘‘composite’’ targets are given in the 3rd
column of Table 6.2 and graphically shown in Fig. 6.6; data of Au ions on various
targets [101-103].
We recall that, the measured total charge changing fragmentation cross
sections, are due to the removal of at least one proton from the incoming beam ion
[100].
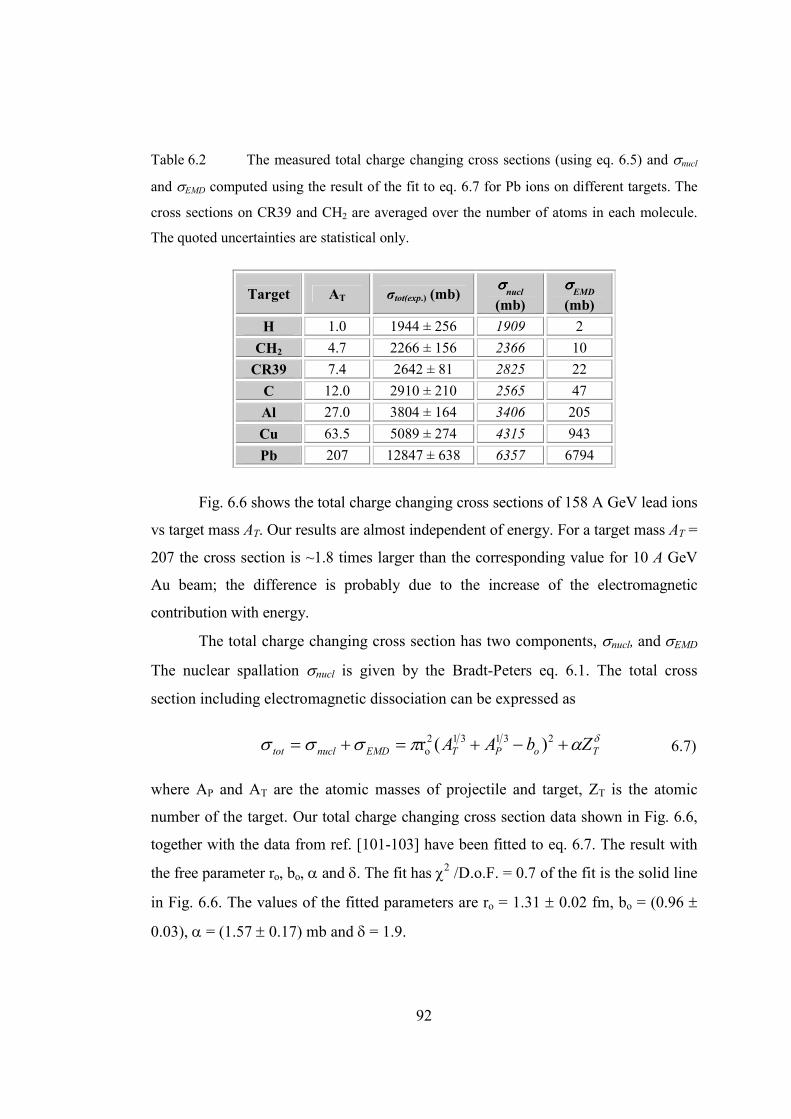
92
Table 6.2 The measured total charge changing cross sections (using eq. 6.5) and σnucl
and σEMD computed using the result of the fit to eq. 6.7 for Pb ions on different targets. The
cross sections on CR39 and CH2 are averaged over the number of atoms in each molecule.
The quoted uncertainties are statistical only.
Fig. 6.6 shows the total charge changing cross sections of 158 A GeV lead ions
vs target mass AT. Our results are almost independent of energy. For a target mass AT =
207 the cross section is ~1.8 times larger than the corresponding value for 10 A GeV
Au beam; the difference is probably due to the increase of the electromagnetic
contribution with energy.
The total charge changing cross section has two components, σnucl, and σEMD
The nuclear spallation σnucl is given by the Bradt-Peters eq. 6.1. The total cross
section including electromagnetic dissociation can be expressed as
δαπσσσ ToPTEMDnucltot ZbAA +−+=+= 231312
o )(r 6.7)
where AP and AT are the atomic masses of projectile and target, ZT is the atomic
number of the target. Our total charge changing cross section data shown in Fig. 6.6,
together with the data from ref. [101-103] have been fitted to eq. 6.7. The result with
the free parameter ro, bo, α and δ. The fit has χ2 /D.o.F. = 0.7 of the fit is the solid line
in Fig. 6.6. The values of the fitted parameters are ro = 1.31 ± 0.02 fm, bo = (0.96 ±
0.03), α = (1.57 ± 0.17) mb and δ = 1.9.
Target AT σtot(exp.) (mb) σσσσnucl
(mb)
σσσσEMD
(mb)
H 1.0 1944 ± 256 1909 2
CH2 4.7 2266 ± 156 2366 10
CR39 7.4 2642 ± 81 2825 22
C 12.0 2910 ± 210 2565 47
Al 27.0 3804 ± 164 3406 205
Cu 63.5 5089 ± 274 4315 943
Pb 207 12847 ± 638 6357 6794

93
Fig. 6.7 shows the average base area distribution in CR39 for Fe and Si ion
beams and their fragments after the CH2 target. The numbers of events in the incident
peak and in the peak after the target are used for the determination of the total charge
changing cross sections in CH2 using relation 6.5.
For the Fe and Si ions the fragmentation cross section is calculated via eq. 6.1
[104]; using the parameters ro = 1.35 ±0.02 fm and bo = 0.83 ± 0.12 obtained in ref.
[104], with fits for nuclei with Z ≤ 26.
Table 6.3a,b,c gives the results of a series of measurements using the setup
shown in Fig. 6.3.
Table 6.4 and 6.5 give the comparison of our measured cross sections with
the data of Webber et al [105] for Fe and Si beam ions at different energies. The
results are in good agreement within the quoted errors.
Fig. 6.6 Measured fragmentation charge-changing cross sections of 158 A GeV Pb
ions versus targets mass number; the solid line is the fit of the measured data to eq. 6.7. The
lower energy data from [101-103] are also shown.

94
Fig. 6.7 Average base area distributions of Fe26+
and Si14+
ions and fragments in
CR39. The average is made on two front sheets of CR39 before and after the CH2 target.
Table 6.3a The measured total charge changing cross sections (eq. 6.5) with statistical
standard deviations (eq. 6.5a) and the computed σnucl using eq. 6.1 for Fe26+
on different
targets.
Energy
(A GeV) Target AT
(Nb /Na) σtot(exp.) (mb)
10 CH2 4.7 1.166 1147 ± 97
10 CR39 7.4 1.029 1105 ± 366
5 CH2 4.7 1.137 1041 ± 130
5 CR39 7.4 1.028 1170 ± 478
3 CH2 4.7 1.180 904 ± 140
3 CR39 7.4 1.071 1166 ± 67
1 CH2 4.7 1.160 1105 ± 60
1 CR39 7.4 1.029 1113 ± 176
1 Al 27 1.120 1870 ± 131
0.41 CH2 4.7 1.162 948 ± 54
0.41 CR39 7.4 1.033 1285 ± 245
0.30 CH2 4.7 1.124 949 ± 61
0.30 CR39 7.4 1.033 1174 ± 192
Target σσσσnucl (mb)
CH2 1246
CR39 1396
Al 2053
Area (pixel)2 Area (pixel)2 Area (pixel)2
5 A GeV Fe26+ 1 A GeV Fe26+ 1 A GeV Si14+
5 A GeV Fe26+ 1 A GeV Fe26+ 1 A GeV Si14+
Target = CH2
Before target
After target After target
Target = CH2
Before target
After target
Target = CH2
Before target
Area (pixel)2 Area (pixel)2 Area (pixel)2

95
Table 6.3b The measured total charge changing cross sections and the computed σnucl using
eq. 6.1 for Si14+
ions on different targets.
Table 6.3c The measured total charge changing cross sections and the computed σnucl using
eq. 6.1 for 290 A MeV C6+
ions on different targets.
Table 6.4 Measured total charge changing cross sections for Fe26+
ions of different
energies on CH2 targets. For comparison the results of Webber et al. are also given.
W.R. Webber et al. [105]
Energy (A MeV) σtot(exp.) (mb)
400 2846
600 2958
810 2958
1180 2962
1600 3016
This work
Energy (A MeV) σtot(exp.) (mb)
300 2847
410 2843
1000 3316
5000 3122
10000 3439
Target σσσσnucl (mb)
H 588
CH2 861
CR39 986
C 1155
Al 1548
Energy
(A GeV) Target AT
(Nb /Na) σtot(exp.) (mb)
5 CH2 4.7 1.149 757 ± 168
5 CR39 7.4 1.018 807
3 CR39 7.4 1.025 754
3 Al 27 1.153 1533 ± 82
1 H 1.0 - 483 ± 76
1 CH2 4.7 1.089 694 ± 46
1 CR39 7.4 1.020 834
1 C 12 1.103 1117 ± 62
1 Al 27 1.088 1397 ± 138
Target AT (Nb /Na) σtot(exp.) (mb)
CH2 4.7 1.058 460 ± 53
CH2 4.7 1.065 513 ± 52
Al 27 1.072 1155 ± 108
Target σσσσnucl (mb)
CH2 562
Al 1136

96
Table 6.5 Measured total charge changing cross sections for Si14+
ions of different
energies on CH2, C and H targets. For comparison the results of Webber et al are also given.
Table 6.6 Measured total charge changing cross sections for C6+
ions of different
energies on CH2 and Al targets (measurements from ref. 105-107 and our results).
6.3 Partial Charge Changing Cross Sections
If the thickness of the target is small compared to the mean free path of the
fragments in that material, the fragmentation cross sections can be calculated using
the simple relation [18].
i
f
fiN
N
KtZZ
1),( ≈σ (6.8)
W.R. Webber et al. [105]
σtot(exp.)(mb) Energy
(A MeV) CH2 C H
570 1933 1176 379
830 1956 1183 387
1350 2027 1215 407
770 [107] 1980 1215 385
1296 [107] 2037 1229 403
1450 [108] 1961 1185 388
This work
σtot(exp.)(mb) Energy
(A MeV) CH2 C H
1000 2083 1127 478
5000 2272 - -
This work
σtot(exp.)(mb) Energy
(A MeV) CH2 Al
290 1194 1144
σtot(exp.)(mb) Energy
(A MeV) CH2 Al
267 [106] 1075 1215
498 [106] 1135 1103
296 [105] 974 -
326 [105] 988 -
310 [107] 1030 -

97
)Z,Z( fiσ is the partial fragmentation cross section of a relativistic ion iZ into the
fragment fZ , K is the number of target nuclei per cm3, t is the thickness of the
target, iN is the number of primary ions and fN is the number of fragments
produced with charge fZ . This expression may be valid also for a thick target,
(assuming that the number of fragments before the target is zero):
From the data shown in Fig. 6.4 we may obtain the partial fragmentation
cross section, using the number of events on each peak for Nf = 7 to 74 and the
number of survived lead ions Ni after the target for incident 158 A GeV lead ions.
For 75≤ Z ≤ 82 we measured the cone heights in one face of a CR39 sheet (see Fig.
6.5) before and after each target. Both Nf and Ni are corrected for the CR39 detector
thickness before the target using eq. 6.3 and 6.4.
For the Fe and Silicon beam ions exposures, we observed that fragments are
present even before the target (Fig. 6.7). In this case the partial charge change cross
sections have been calculated via the relation [106]
−=∆ p
in
f
in
p
s
f
outZ
Z
Z
Z
Z
Kt
1σ (6.9)
where f
inZ and f
outZ are the number of projectile fragments of each charge before and
after the target and p
inZ and p
sZ are the number of incident and survived projectile
ions, respectively.
The partial charge changing cross sections for 158 A GeV lead ions with
seven different targets are shown in Fig. 6.8. The fragmentation cross sections for
hydrogen material are calculated using eq. 6.6. The overall statistical and
systematical uncertainties are about 10 - 20% (the errors from multifragmentation
inside the thick target and the CR39 material, charge identification, tracking
procedure are not considered).
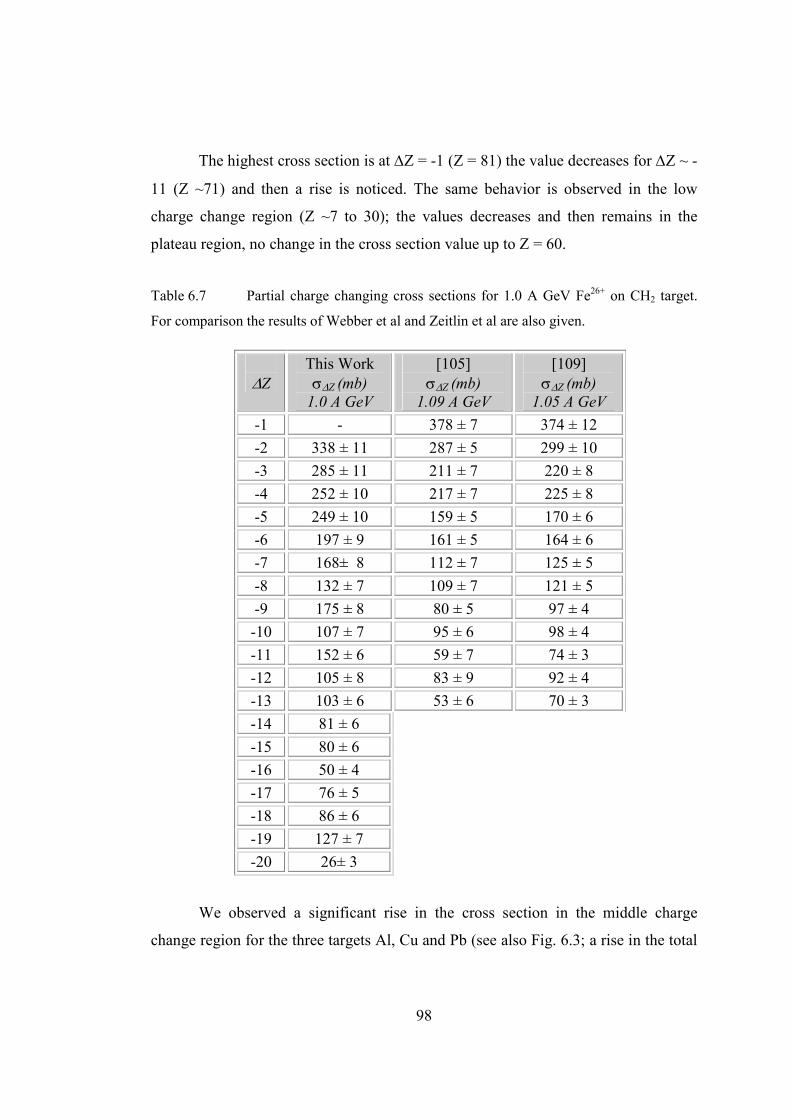
98
The highest cross section is at ∆Z = -1 (Z = 81) the value decreases for ∆Z ~ -
11 (Z ~71) and then a rise is noticed. The same behavior is observed in the low
charge change region (Z ~7 to 30); the values decreases and then remains in the
plateau region, no change in the cross section value up to Z = 60.
Table 6.7 Partial charge changing cross sections for 1.0 A GeV Fe26+
on CH2 target.
For comparison the results of Webber et al and Zeitlin et al are also given.
∆Z
This Work
σ∆Z (mb)
1.0 A GeV
[105]
σ∆Z (mb)
1.09 A GeV
[109]
σ∆Z (mb)
1.05 A GeV
-1 - 378 ± 7 374 ± 12
-2 338 ± 11 287 ± 5 299 ± 10
-3 285 ± 11 211 ± 7 220 ± 8
-4 252 ± 10 217 ± 7 225 ± 8
-5 249 ± 10 159 ± 5 170 ± 6
-6 197 ± 9 161 ± 5 164 ± 6
-7 168± 8 112 ± 7 125 ± 5
-8 132 ± 7 109 ± 7 121 ± 5
-9 175 ± 8 80 ± 5 97 ± 4
-10 107 ± 7 95 ± 6 98 ± 4
-11 152 ± 6 59 ± 7 74 ± 3
-12 105 ± 8 83 ± 9 92 ± 4
-13 103 ± 6 53 ± 6 70 ± 3
-14 81 ± 6
-15 80 ± 6
-16 50 ± 4
-17 76 ± 5
-18 86 ± 6
-19 127 ± 7
-20 26± 3
We observed a significant rise in the cross section in the middle charge
change region for the three targets Al, Cu and Pb (see also Fig. 6.3; a rise in the total
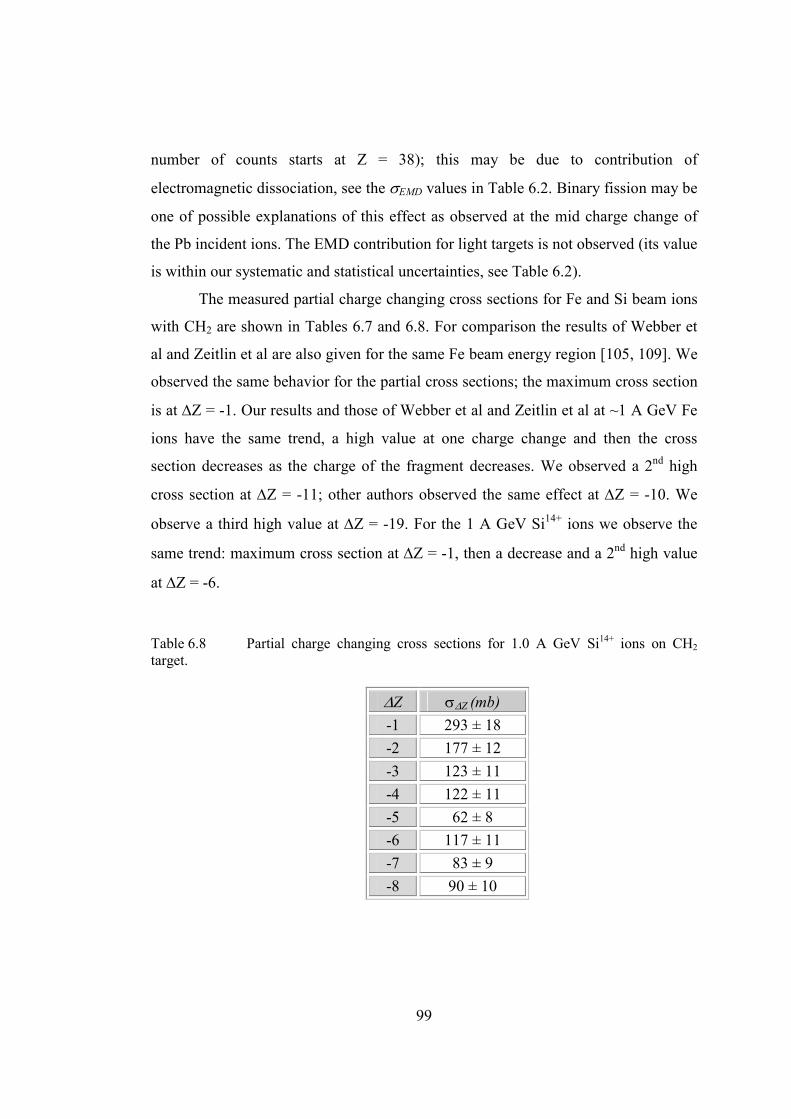
99
number of counts starts at Z = 38); this may be due to contribution of
electromagnetic dissociation, see the σEMD values in Table 6.2. Binary fission may be
one of possible explanations of this effect as observed at the mid charge change of
the Pb incident ions. The EMD contribution for light targets is not observed (its value
is within our systematic and statistical uncertainties, see Table 6.2).
The measured partial charge changing cross sections for Fe and Si beam ions
with CH2 are shown in Tables 6.7 and 6.8. For comparison the results of Webber et
al and Zeitlin et al are also given for the same Fe beam energy region [105, 109]. We
observed the same behavior for the partial cross sections; the maximum cross section
is at ∆Z = -1. Our results and those of Webber et al and Zeitlin et al at ~1 A GeV Fe
ions have the same trend, a high value at one charge change and then the cross
section decreases as the charge of the fragment decreases. We observed a 2nd
high
cross section at ∆Z = -11; other authors observed the same effect at ∆Z = -10. We
observe a third high value at ∆Z = -19. For the 1 A GeV Si14+
ions we observe the
same trend: maximum cross section at ∆Z = -1, then a decrease and a 2nd
high value
at ∆Z = -6.
Table 6.8 Partial charge changing cross sections for 1.0 A GeV Si14+
ions on CH2
target.
∆Z σ∆Z (mb)
-1 293 ± 18
-2 177 ± 12
-3 123 ± 11
-4 122 ± 11
-5 62 ± 8
-6 117 ± 11
-7 83 ± 9
-8 90 ± 10

100
Fig. 6.8 Partial charge changing cross sections for 158 A GeV lead ions on targets
from H to Pb; Charge states are between ∆Z = -1 to 75. For better visibility are multiplied
the charge change by a factor of 100: 100-10
2 for H; 10
2-10
4 CH2; 10
4-10
6 CR39; 10
6-10
8 C;
108-10
10 Al; 10
10-10
12 Cu; 10
12-10
14 Pb.

101
7. Conclusions
The surface quality of the CR39 and Makrofol Nuclear Track Detectors were
improved by new etching conditions as compared to previous standard etching
conditions; the new methods remove background and enhance the sharpness of the
tracks. A high sensitivity was achieved by the improved etching and measuring methods
for CR39 compared to previous standard one. The polycarbonate Makrofol NTD was
calibrated for the first time over a large energy loss range: a detection threshold of Z ~
50 was achieved for relativistic charged particles.
The addition of small fractions of ethyl alcohol in the etching solutions is very
useful in experiments having a significant background originated by local sources of
charged particles (e.g. the high altitude large area detectors like SLIM) and in the case of
cosmic ray long duration balloon and space experiments, where the presence of many
low energy particles may endanger the study of cosmic abundances of primary ions.
New calibrations for CR39 and Makrofol NTDs were performed with In49+
,
Pb82+
, Fe26+
and Si14+
relativistic ions making use of new etching methods. Calibration
curves of p vs REL were obtained for wide ranges of charge and energy.
A search for Intermediate Mass Magnetic Monopoles and Strange Quark Matter
was performed with 400 m2 of CR39 NTDs, with an average exposure time of 4 years,
(SLIM experiment). The exposed NTDs were analyzed using the new strong etching and
improved measuring methods. No survival candidate was found; the present 90% CL
upper flux limits for downgoing IMMs is 1.55 × 10⁻¹⁵
cm-2s-1sr
-1 (Fig. 5.11). Similar
upper limits are also valid for downgoing nuclearites and Q-balls of any speed. A
detailed discussion was made on a strange non reproducible candidate.
A study of the total and partial charge changing cross sections of relativistic lead,
iron, silicon and carbon ions on different targets was performed. It was observed that the
102
total charge changing cross sections increase with target mass and energy; the highest
values are observed for Cu and Pb targets and this is mainly due to electromagnetic
dissociation (see Fig. 6.6). It was also observed that the total charge changing cross section
is energy independent for light target materials as CH2 and CR39. A high partial charge
changing cross section for lead, iron and silicon ions was observed for ∆Z ~1; the value
decreases as the charge change ∆Z increases.
The measured cross section data indicate that passive NTDs, especially CR39, can
be used effectively for studies of the total and partial charge changing cross sections, also
in comparison with active detectors.

103
References
1. D. A. Young, Nature 182 (1958) 375.
2. E. C. H. Silk and R. S. Barnes, Phil. Mag. 4 (1959) 970.
3. R. L. Fleischer et al., Nuclear Tracks in Solids: Principles and Applications,
University of California Press, Berkeley (1975).
4. R. L. Fleischer et al., Ann. Rev. Nucl. Sci. 15 (1965a) 1.
5. P. B. Price et al., Proc. 11th Int. Conf. on Cosmic Rays, Budapest (1970) 417.
6. G. Siegman et al., Proc. 9th Int. Conf. Solid State Nuclear Track Detectors,
Suppl. 1 Nucl.Tracks (1976) 1059.
7. S. Cecchini., et al., Il Nuovo Cimento 109A (1996) 1119.
8. S. Manzoor et al., Nucl. Instrum. Meth. A453 (2000) 525.
9. B. G. Cartwright et al., Nucl. Instrum. Meth. 153 (1978) 457.
10. G. Tarle, Proc. 17th Int. Cosmic Rays Conf., Paris 8 (1981) 174.
11. P. B. Price and D. O'Sullivan, Proc. 11th Int. Conf. on Solid State Nuclear
Track Detectors, Bristol (1981) 929.
12. G. Giacomelli et al., Nucl. Instrum. Meth. A411 (1998) 41.
13. E. V. Benton and W. G. Nix, Nucl. Instrum. Meth. 67 (1969) 343.
14. D. Sampsonidis et al., Phys. Rev. C51D (1995) 3304.
15. C. Brechtmann and W. Heinrich, Z. Phys. A330 (1988) 407.
16. C. Lewenkopf et al., Phys. Rev. C44 (1991) 1065.
17. S. E. Hirzebruch et al., Nucl. Instrum. Meth. B74 (1993) 519.
18. H. Dekhissi et al., Nucl. Phys. A662 (2000).
19. R. Brandt, Nucl. Instrum. Meth. 173 (1980) 111.
20. B. Grabez et al., Nucl. Instrum. Meth. 211 (1983) 209.
21. H. Khan et al., Kerntechnik 49 (1987) 209.
22. H. A. Khan et al., Phys. Rev. C28 (1983) 1630.
23. H. A. Khan, N. A. Khan and R. J. Peterson, Phys. Rev. C35 (1987) 645.
24. I. E. Qureshi et al., Nucl. Phys. A477 (1988) 510.

104
25. H. Drechsel et al., Nucl. Instrum. Meth. 227 (1984) 342.
26. A. Noll et al., Nucl. Tracks Radiat. Meas. 15 (1988) 265.
27. W. Heinrich et al., Nucl. Tracks Radiat. Meas. 15 (1988) 393.
28. S. Cecchini et al., Astropart. Phys.1 (1993) 369.
29. S. Cecchini et al., Il Nuovo Cimento 24C (2001) 639.
30. T. Chiarusi et al., Rad. Meas. 36 (2003) 335.
31. B. A. Weaver et al., Nucl. Instrum. Meth. B145 (1998) 409.
32. B. A. Weaver and A. J. Westphal, Nucl. Instrum. Meth. B187 (2002) 285.
33. B. A. Weaver and A. J. Westphal, Nucl. Instrum. Meth. B207 (2003) 322.
34. M.R. Shavers et al., Advances in Space Research 34 (2004) 1333.
35. Y. Koike et al., Acta Astronautica 56 (2005) 367.
36. M. Casolino et al., Advances in Space Research 37 (2006) 1685.
37. T. Nakamura and L. Heilbronn, Nucl. Instrum. Meth. A562 (2006) 706.
38. M. Durante and A. Kronenberg, Advances in Space Research 35 (2006) 180.
39. A. Denker et al., Nucl. Instrum. Meth. B240 (2005) 61.
40. U. Amaldi and G. Kraft, Rep. Prog. Phys. 68 (2005) 1861.
41. G. Somogyi, Nucl. Track Detection 1 (1977) 3.
42. G. Somogyi G. and I. Hunyadi, Proc. 10th Int. Conf. Solid State Nuclear
Track Detectors, Suppl. 2 (1980) 443.
43. G. Somogyi, Proc. 11th Int. Conf. Solid State Nuclear Track Detectors (1981)
101.
44. S.A. Durrani and R.K. Bull, Solid State Nuclear Track Detection, Pergamon
Press, Oxford, (1987).
45. B. E. Fischer and R. Sphor, Rev. of Modern Phys. 55 (1983) 907
46. R.L Fleischer et al., Phys. Rev. 133 (1964) 1443.
47. R.L. Fischer et al., Phys. Rev.156 (1967) 353.
48. W. Enge et al., Nucl. Instrum. Meth. 127 (1975) 125.
49. H. A. Khan, Nucl. Instrum. Meth. 109 (1973) 515.
50. H. A. Khan and S. A. Durrani, Nucl. Instrum. Meth. 101 (1972) 583.
51. B. Dorschel et al., Radiat. Protection Dosimetry 82 (1999) 85.

105
52. P. A. M. Dirac, Proc. Roy. Soc. Lond. 281B (1931) 60.
53. G. ’t Hooft, Nucl. Phys. B29 (1974) 276.
M. Polyakov, JETP Lett. 20(1974|) 194.
N. S. Craigie et al., Theory and Detection of MMs in Gauge Theories, World
Scientific, Singapore (1986).
54. G. Giacomelli, Lectures at the Lake Louise Workshop (1994).
55. G. Giacomelli et al., hep-ex/011209; hep-ex/0302011; hep-ex/0211035; hep-
ex/0506014.
56. M. Bertani et al., Europhys. Lett. 12 (1990) 613.
57. G. Giacomelli, L.Patrizii, Lecture at the Summer School on Astroparticle
Physics and Cosmology ICTP, Trieste(2002), hep-ex/0302011.
58. G. Giacomelli, Riv. Nuovo Cimento, 7N12 (1984) 1.
59. J. Derkaoui et al., Astropart. Phys. 9 (1998) 173; Astrop. Phys. 9 (1999) 339.
60. M. Ambrosio et al., Eur. Phys. J. C25 (2002) 511; Phys. Lett. B406 (1997)
249; Phys. Rev. Lett. 72 (1994) 608.
61. (Ohya collab.) S. Orito et al., Phys. Rev. Lett. 66 (1991) 1951.
62. (Baksan collab.) E. N. Alexeyev et al., 21st ICRC, 10 (1990) 83; V. A.
Balkanov et al., Proc. Of ICRC 2001; Prog. Part. Nucl. Phys. 40 (1998) 391.
63. (Baikal collab. And AMANDA collab.) V. Aynutdinov et al., astro-
ph/0507713; Pro. Part. Nucl. Phys. 40 (1998) 391.
64. P. B Price, Phys. Rev. D38 (1988) 3813.
D. Ghosh and S. Chatterjee, Europhys. Lett. 12 (1990) 25.
65. T.W. Kephart and T.J. Weiler, Astropart. Phys. 4, 271 (1996).
66. T.J. Weiler and T.W. Kephart, Nucl. Phys. B (Proc. Suppl.) 51 B, 218 (1996)
67. S. Balestra et al., hep-ex/060236; hep/ex-0506075.
68. E. N. Parker, Astrophysics J. 122 (1955) 293; Astrophysics J. 160 (1970)
383.
69. F. C. Adams et al., Phys. Rev. Lett. 70 (1993) 2511.

106
70. S. P. Ahlen, Phys. Rev. Lett. 72 (1994) 608; M. Ambrosio et al., Astrop.
Phys. 6 (1997) 113; Nucl. Instrum. Meth. A486 (2002) 663; Astrop. Phys. 4
(1995) 33; Astrop. Phys. 18 (2002) 27.
71. G. F. Drell et al., Nucl. Phys. B209 (1982) 45.
72. S. Cecchini et al., Il Nuovo Cimento A109 ( 1996) 1119.
S. Cecchini et al., Radiation Measurements 40 (2005) 405.
73. S. Manzoor et al., Radiation Measurements 40 (2005) 433.
74. S. P. Ahlen, Phys. Rev. D 17 (1978) 229.
75. S. P. Ahlen et al., Phys. Rev. D 26 (1982) 2347.
76. A. De Rujula, Nucl. Phys. B435 (1995) 257.
77. D. Bakari et al., hep-ex/0003028.
78. I. De Mitri, Ricerca di monopoli magnetici supermassivi nella radiazione
cosmica, Ph.D. Thesis, University of L’Aquila ( 1996); P.F. Spada, Ricerca di
monopoli magnetici co1 rivelatore MACRO, Ph.D. Thesis, University of
Bologna (1996); R. Fantini, Ricerca di monopoli magnetici GUT con i tubi a
streamer di MACRO, Ph.D. Thesis, University of Bologna ( 1997); T.W.
Ruijgrok, J.A. Tjon, T. T. Wu, Phys. Lett. B 129 (1983) 209; S. Nakamura,
Ph.D. Thesis, Search for supermassive relics by large area plastic track
detectors, UT-ICEPP-88-04, University of Tokyo (1988).
79. E. Witten, Phys. Rev. D30 (1984) 272.
80. S. P. Ahlen, Phys. Rev. D 14 (1976) 2935.
81. S. Chin and R. Kerman, Phys. Rev. Lett. 43 (1979) 1292.
82. P. Haensel et al., Astro. Astrophys. 160 (1986) 121 ; P. Haensel et al.
Astrophys. J. 310 (1986) 261.
83. E. Farhi and R. L. Jaffe, MIT Preprint CPT 1160 (1984); E. Farhi and R. L.
Jaffe, Phys. Rev. D32 (1985) 2452.
84. A. DeRujùla and S. L. Glashow, Nature 312 (1984) 734.
85. T. Shibata, Prog.Theor.Phys. 57 (1977) 882.
86. D. Bakari et al., hep-ex/004019.
87. Ambrosio et al., MACRO Collaboration, Eur. Phys. J. C13 (2000) 453.
107
88. S. Balestra et al., Nucl. Instrum. Meth. B 254 (2007) 254, physics/0610227.
89. I. E. Qureshi et al., Radiat. Meas. 40 (2005) 437.
90. S. Balestra et al., Czech. J. Phys. 56 (2006) A221, hep-ex/0601019; S.
Balestra et al., hep-ex/0602036.
91. S. Manzoor et al., Radiat. Meas. 40 (2-6) (2005) 433, hep-ex/0502034.
92. S. Manzoor et al., 10th Topical Seminar on Innovative Particle and Radiation
Detectors, 1-5 October 2006, to be published in Nucl. Phys. A proc. Suppl.,
physics/0611084.
93. P. B. Price et al., Phys. Rev. Lett. 35 (1975) 487; Phys. Rev. D18 (1978)
1382;
B. Cabrera, Phys. Rev. Lett. 48 (1982) 1378.
V. V. Kopenkin et al., 28th ICRC, Tsukuba, Japan (2003) 1583.
94. C. Brechtmann and W. Heinrich, Phys. Rev. C39 (1989) 2222.
95. S. E. Hirzebruch et al., Phys. Rev. C46 (1992) 1487.
96. J. Westphal et al., Phys. Rev. C44 (1991) 1687.
97. S. E. Hirzebruch et al., Nucl. Instrum. Meth. B74 (1993) 519.
98. A. N. Golovchenko et al., Radiat. Meas. 34 (2001) 297.
99. L. Sihver et al., Phys. Rev. C 47 (1993) 1225.
100. G. D. Westfall et al., Phys. Rev. C19 (1979) 1309.
101. Y. He, P.B. Price, Z Phys. A 348 (1994) 105.
102. S. E. Hirzebruch et al., Phys. Rev. C51 (1995) 2085.
103. L. Y. Geer et al., Phys. Rev. C52 (1995) 334.
104. J. R. Cummings et al., Phys. Rev. 42 (1990) 2508.
105. W. R. Webber et al., Phys. Rev. C41 (1990) 520.
106. I. Schall et al., Nucl. Instrum. Meth. B117 (1996) 221.
107. W. R. Webber et al., ICRC proc. 3 (1985) 87.
108. A. N. Golovchenko et al., Phys. Rev. C66 (2002) 014609-1.
109. C. Zeitlin et al., Phys. Rev. C56 (1997) 388.
108
Figure Captions
Fig. 2.1 A latent track is formed in (a) inorganic solids by the ionization and
production of dense positive ions along the ion path and (b) the breakage of
polymeric chains by the passage of charged particle.
Fig. 2.2 (a) Sketch of a NTD track and (b) etched α tracks in a CR39 detector.
Fig. 2.3 Track geometry at different dip angle conditions: (a) formation of the post
etched cone for a particle with an incident angle θ > θc (vTt > vBt), (b)
limiting case when the incident angle θ = θc (vTt > vBt) and (c) no track is
detected if the incident angle θ < θc (vTt < vBt).
Fig. 2.4 Track geometry for a charged particle impinging at normal incidence in a
nuclear track detector.
Fig. 2.5 Geometry of a particle incident at an angle θ with respect to the detector
surface.
Fig. 3.1 The energy losses, in MeV/cm, of g = gD MMs in liquid hydrogen vs β.
Curve a) corresponds to elastic monopole–hydrogen atom scattering; curve
b) to interactions with level crossings; curve c) describes the ionization
energy loss.
Fig. 3.2 A massive GUT MM structure with different regions (for details see text).
Fig. 3.3 The experimental 90% C.L. upper flux limits for magnetic monopoles
obtained with MACRO electronic and passive detectors; also the results
obtained by other experiments, are shown.
Fig. 3.4 90% C.L. flux upper limits obtained with the MACRO CR39 nuclear track
detector for MMs with different magnetic charges, g =gD, 2gD, 3gD and for
M+p (dyon).
Fig. 3.5 The different regions of an Intermediate mass monopole.
Fig. 3.6 The downgoing MMs accessible mass regions in the plane (mass, β) for g =
gD at an altitude of 20 km, for an experiment at 5230 m (SLIM) and for an
underground experiment (MACRO).

109
Fig. 3.7 The Restricted energy loss of MMs vs β in CR39 NTDs. The solid and doted
lines show the different detector threshold.
Fig. 3.8 The quark bag radius (RN) and the core-electron system for nuclearites. For
nuclearite masses smaller than 109 GeV/c
2, the whole electron cloud is
outside the quark bag, the global size of the whole system is approximately
105 fm = 1 °A; for 10
9 < MN < 10
15 GeV/c
2 the electrons are partially inside
the core; for MN > 1015 GeV/c
2 all electrons are inside the core. The black
dots indicate the electrons, the quark bag border is indicated by the solid
lines; the border of the core+electronic cloud system for relatively small
masses is indicated by the dashed lines.
Fig. 3.9 The solid line shows the nuclearite RN radius for different nuclearite mass
MN. The dashed line shows the radius of the whole nuclearite system (core +
electron). Accessible mass region for the MACRO and SLIM experiments
are also indicated.
Fig. 3.10 Accessibility region in the (mass, β) plan for Nuclearites at different depths,
assuming the initial velocity of the outer atmosphere of β = 10-3 (Chatalcaya
altitude, 5230m (540 g/cm2); sea level (1033 g/cm
2) and MACRO depth
(3700 hg/cm2). The detection thresholds of CR39 and Makrofol NTDs are
shown with the dashed lines.
Fig. 4.1 Exposure set-up for the calibration of CR39 and Makrofol NTDs with
relativistic heavy ions.
Fig. 4.2 (a) Tracks of beam ions before the target and (b) beam and fragment tracks
after the target (from the 0.41 A GeV Fe26+ exposure). The tracks marked
with a red circle are from a Iron nuclei (a) and its fragment (b),
respectively.
Fig. 4.3 Photograph of the detector stacks exposed at the CERN 158 A GeV Pb82+
beam.
Fig. 4.4 The BNL exposure set-up at two beam lines, a) NSRL and b) AGS.
Fig. 4.5 Exposure set-up for the stacks of CR39 and Makrofol NTDs at HIMAC,
Chiba, Japan.
Fig. 4.6 Tanks used for the etching of CR39 and Makrofol NTDs; (a) the V2 & V4
tanks are used for the etching of SLIM NTDs, V3 is used for calibration
110
purposes, and V1 is used for the washing of the NTDs after etching. (b) The
TKB tank is used for pre-soaking; TKB1 & TKB2 are used for etching few
detectors for calibrations and tests; TKB3 is used for cleaning the NTDs.
Fig. 4.7 Stainless steel supporting racks used for etching of CR39 and Makrofol
NTDs. (a) Rack used for strong and soft etching of the SLIM NTDs in the V2
and V4 tanks (see Fig. 4.5a); (b) rack used for etching in the V3 tank for
calibrations; (c) rack used for etching of NTDs in the TKB1 and TKB2
tanks.
Fig. 4.8 Tracks in CR39 of 158 A GeV Pb82+ ions and their fragments (a, b, c) and
(d) tracks of 158 A GeV In49+ ions and their fragments etched under different
etching conditions.
Fig. 4.9 Thickness versus etching time of three different CR39 detectors etched in 6N
KOH + ethyl alcohol (3 % by volume) at 60 oC. The solid lines are linear
fits to the data; the dashed lines only connect the data points (notice the
swelling effect for etching times smaller than 12 h).
Fig. 4.10 (a) SLIM CR39 sheet, (b) tracks of 1 A GeV Fe26+ ions and their fragments
in CR39 using 8N NaOH 90 oC without alcohol, (c) SLIM CR39 sheet and
(d) the tracks of 1 A GeV Fe26+ ions and their fragments in CR39 with
“strong” etching, 1.5% alcohol at 75 oC.
Fig. 4.11 Base areas of the “tracks” from 158 A GeV Pb ions in Makrofol at normal
incidence (a) 6N NaOH 50oC, 95 h, (b) 6N KOH + 30 % ethyl alcohol 45
oC, 10 h, (c) 6N KOH + 20 % ethyl alcohol 50
oC, 8 h and (d) The tracks of
Pb ions and their fragments in Makrofol at 45o incident angle (etching
conditions as in c).
Fig.4.12 Thickness versus etching time for Makrofol foils etched in 6N KOH + 20 %
ethyl alcohol (by volume) at 50 oC. Each point is the average of 4 measured
sheets. The red solid line is a linear fit. There are no indications of swelling
effects at short etching times.
Fig. 4.13 The bulk etch rate measurement methods (a) from the change in the detector
thickness and (b) from the measurement of the cone height and diameter of
the etched tracks.

111
Fig. 4.14 Sketch of an “etched track” and its etched track parameters for a normally
incident ion in NTDs.
Fig. 4.15 (a) Base area distribution of etched cones in CR39 from 158 A GeV In49+
ions and their fragments (averages of 2 front face measurements); (b) cone
height distribution for 46 ≤ Z/β ≤ 49. Soft etching: 6 N NaOH + 1 % ethyl
alcohol, 70o C, 40 h.
Fig. 4.16 The etch rate ratio p plotted as a function of REL for CR39 detectors
exposed to relativistic Indium ions using vB evaluated with the new method.
Typical statistical standard deviations are shown at Z/β = 40, 45, 49; for
Z/β ≤ 37 the errors are inside the black points.
Fig. 4.17 The surface tracks of Indium and their fragments in CR39. On top, the
detector was etched in “strong” etching condition for 24 h; the bottom, the
same tracks etched in “soft” condition.
Fig. 4.18 “Strong” etching; mean area distribution (4 faces out of 5) of 158 A GeV
In49+ ions and their fragments in CR39 after 5.50 h: etching in (a) 8N NaOH
90 oC and (b) 8N KOH + 1.25 % Ethyl Alcohol at 77
oC, respectively.
Fig. 4.19 p vs REL for the CR39 detectors exposed to relativistic indium ions and their
fragments, etched in “strong” conditions.
Fig. 4.20 p vs REL for the CR39 detectors exposed to relativistic iron ions and their
fragments, etched in “strong” conditions.
Fig. 4.21 Cone base area distribution (average of 2 measurements on two front faces)
of 158 A GeV Pb ions and fragments in Makrofol after 8 h etching, in 6N
KOH + Ethyl Alcohol (80 : 20 % by volume) at 50 oC (Inset single
measurements of cone heights).
Fig. 4.22 The variation of cone height Le and of the base diameter D for relativistic
lead ions and their fragments measured in one sheet of CR39 [12].
Fig. 4.23 Cone height distributions in Makrofol NTDs for 158 A GeV Pb82+ beam
exposure for (a) normal incidence and (b) 45o incidence angle (single
measurements).
Fig. 4.24 p vs. REL for Makrofol detector exposed to relativistic Pb ions using vB
evaluated with the new method. Typical statistical standard deviations are

112
shown at Z/β = 70, 75, 77; for Z/β ≤ 67 the errors are inside the black
points.
Fig. 4.25 Comparison for CR39 NTDs exposed to relativistic heavy ions and etched
under different “soft” condition. Notice the p values at Z = 10, 20, 40 and
49 for two etching conditions for CR39. A sharp rise is evident for etching
with alcohol after Z/β > 20.
Fig. 4.26 Distribution of the bulk etch-rate for 67 CR39 detectors measured with the
change in thickness method. The line is a Gaussian fit to the experimental
data.
Fig. 4.27 Distribution of the etched cone base areas for CR39 NTDs located after the
targets. Averages were made on three top faces. Well separated peaks are
observed and a charge can be assigned to each individual peak. For a given
nuclear fragment, we have about the same mean base area at different beam
energies.
Fig. 4.28 Overall view of the analysis of 5 A GeV Fe26+ + CH2: the average area
distributions and the scatter plots of the CR39 sheets placed before and after
the target are presented. Individual charges are clearly resolved down to Z
= 7.
Fig. 4.29 Scatter plots of the base cone areas of the beam ions and fragments from 5 A
GeV Fe26+ and 1 A GeV Si
+14 in CH2. (a, b) raw data of 5 and 1 A GeV Fe
and Si ions before CH2 target, (c,d) refined data of 5 A GeV Fe before and
after the target and (e, f) are the refined data for 1 A GeV Si ions before and
after the target, for details see text.
Fig. 4.30 Overall view of the analysis of 1 A GeV Si14+ + CH2: the average area
distributions and scatter plot of the CR39 sheets placed before and after the
target are presented. Individual charges are clearly resolved down to Z = 6.
Fig. 4.31 Nuclear fragment charges vs etch pit mean base area for (a) 5 A GeV Fe26+,
(b) 1 A GeV Fe26+, (c) 0.41 A GeV Fe
26+ and (d) 1 A GeV Si
14+ in CR39
NTDs.
Fig. 4.32 p vs REL for CR39 NTDs exposed to Pb, Fe, Si and C ions of different
energies. (a) by thickness method and (b) by new method for computing the
bulk etch velocity vB.

113
Fig. 5.1 The sites of the SLIM experiment: (a) Chacaltaya, Bolivia (5230 m a.s.l.)
and (b) Koksil, Himalaya, Pakistan (4275 m a.s.l.).
Fig. 5.2 (a) The SLIM modules installed at Chacaltaya and (b) sketch of the
composition of one module. The whole module is enclosed in an aluminized
plastic bag filled with dry air at 1 atm pressure.
Fig. 5.3 Classifications of tracks in the SLIM CR39 NTDs after strong etching (cross
sectional view); (a) a “bubble” from a plastic defect, (b) a track due to a
stopping particle, (c) on one side a stopping particle track and on the other
side an over etched track or a bubble, (d) a hole due to an end of range and
an over etched track, (e) accidental coincidence of two stopping particle
tracks, (f) two end of range tracks or a track, (g) and (h) a high REL
candidate track at the different etching steps.
Fig. 5.4 Different track shapes as observed in the SLIM CR39 sheets after strong
etching.
Fig. 5.5 The procedure used for the ‘confidence’ area in which a possible candidate
track located on the top layer will be searched for in other layers of the
same module.
Fig. 5.6 (a) Global view of the event/background tracks in the L1 layer of wagon
7408 exposed at Chacaltaya from 20-2-01 to 28-11-05 (etched on 9-6-06) ,
(b) microphotographs of the 1-22 tracks at the top of Fig. (a). (c) Normal
tracks of 158 A GeV +82Pb ions and their fragments from a CERN-SPS
exposure (soft etching), and (d) of 400 A MeV +26Fe ions and their fragments
from the HIMAC accelerator, Japan (strong etching).
Fig. 5.7 Micro photographs of selected tracks of the stranger/background event (G =
16x).
Fig. 5.8 (a) Layout of the SLIM modules near module 7408 and (b) the positions of
the SLIM modules inside a wooden box during the flight Bologna-La Paz
and La Paz-Bologna.
Fig. 5.9 Examples of “tracks” in the L6 layer of wagon 7410 (see Fig. 5.6): (a) after
30 h of soft etching, observed at a magnification of 25x, (b) after 5 more
hours of strong etching, (c) after 4h of more strong etching and (d) after 10h
of more strong etching.

114
Fig. 5.10a SLIM detector acceptance (for 400 m2) for downgoing IMMs with g = gD,
2gD, 3gD and dyons (M+p) (soft etching conditions).
Fig. 5.10b “Strong” etching SLIM detector acceptance (for 400 m2) for downgoing
IMMs with g = gD, 2gD, 3gD and dyons (M+p) (strong etching conditions).
Fig. 5.11 90% C.L. flux upper limits for downgoing intermediate mass magnetic
monopoles with g = gD, 2gD, 3gD and M + p (strong etching condition) (380
m2 analyzed).
Fig. 6.1 The geometric view of nucleus – nucleus interaction. The figure shows the
projectile and target nuclei of radii RP and RT, and the overlap parameter
bo.
Fig. 6.2 Sketch of a stack showing the target-detector configurations used for the
exposures to the relativistic Pb beam at CERN. ‘A’, ‘a’ and ‘B’, ‘b’ are
different sections of the stack.
Fig. 6.3 Sketch of a stack showing the target-detector configuration used for the
exposures to relativistic Fe and Si ions at HIMAC, Chiba, Japan.
Fig. 6.4 The average cone base area distribution on 8 faces out of 12 measured of
CR39 NTDs after the Al target for 158 A GeV lead ions and their fragments.
Fig. 6.5 Cone height distribution (a) of Pb beam ions before the target, (b) lead ions
and their fragments detected immediately after the thick copper target and
(c) the survived beam ions and the fragments produced in the Cu and CR39
targets located in the last part of the stack. (d) Microphotographs of Pb ion
tracks in CR39 before the target and (e) tracks of survived Pb ions and
beam fragments after the target. The microphotographs were taken by
placing the detector at an angle of about 40o with respect to the microscope
objective.
Fig. 6.6 Measured fragmentation charge-changing cross sections of 158 A GeV Pb
ions versus targets mass number; the solid line is the fit of the measured
data to eq. 6.7. The lower energy data from [101-103] are also shown.
Fig. 6.7 Average base area distributions of Fe26+ and Si
14+ ions and fragments in
CR39. The average is made on two front sheets of CR39 before and after the
CH2 target.

115
Fig. 6.8 Partial charge changing cross sections for 158 A GeV lead ions on targets
from H to Pb; Charge states are between ∆Z = -1 to 75. For better visibility
are multiplied the charge change by a factor of 100: 100-10
2 for H; 10
2-10
4
CH2; 104-10
6 CR39; 10
6-10
8 C; 10
8-10
10 Al; 10
10-10
12 Cu; 10
12-10
14 Pb.

116
Table Captions
Table 2.1 Etching conditions for some commonly used nuclear track detector.
Table 4.1. “Soft” etching conditions and bulk etch rates vB for CR39 obtained with the
standard method using 25 thickness measurements for each final data point.
The errors are statistical standard deviations of the mean.
Table 4.2. “Strong” etching and bulk etch rates vB for CR39 obtained with the standard
methods using 9 measurements for each final data point. The errors are
statistical standard deviations.
Table 4.3 Bulk etch rates vB for CR39 and Makrofol NTDs obtained with the new and
with the standard methods using 25 measurements for each data point. The
errors are statistical standard deviations of the mean.
Table 4.4 Assigned charges and computed charge resolutions for In49+ and Pb
82+ ions
and their fragments in CR39 and Makrofol detectors. Charge resolution is
estimated from eq. 4.6a but the last row was computed from eq. 4.6b.
Table 4.5 Mean base areas and charge resolutions σZ of nuclear fragment measured in
CR39 NTDs using high energy Fe26+, Si
14+ and C
6+ ion beams on a CH2
target.
Table 6.1 Atomic mass AT, atomic number ZT, density ρT, thickness of the target t,
thickness of the CR39 before and after the target [t(CR39)b and t(CR39)a]. The
uncertainties on the thickness are ≥10 µm.
Table 6.2 The measured total charge changing cross sections (using eq. 6.5) and σnucl
and σEMD computed using the result of the fit to eq. 6.7 for Pb ions on
different targets. The cross sections on CR39 and CH2 are averaged over the
number of atoms in each molecule. The quoted uncertainties are statistical
only.
Table 6.3a The measured total charge changing cross sections (eq. 6.5) with statistical
standard deviations (eq. 6.5a) and the computed σnucl using eq. 6.1 for Fe26+
on different targets.
117
Table 6.3b The measured total charge changing cross sections and the computed σnucl
using eq. 6.1 for Si14+ ions on different targets.
Table 6.3c The measured total charge changing cross sections and the computed σnucl
using eq. 6.1 for 290 A MeV C6+ ions on different targets.
Table 6.4 Measured total charge changing cross sections for Fe26+ ions of different
energies on CH2 targets. For comparison the results of Webber et al. are also
given.
Table 6.5 Measured total charge changing cross sections for Si14+ ions of different
energies on CH2, C and H targets. For comparison the results of Webber et
al are also given.
Table 6.6 Measured total charge changing cross sections for C6+ ions of different
energies on CH2 and Al targets (measurements from ref. 105-107 and our
results).
Table 6.7 Partial charge changing cross sections for 1.0 A GeV Fe26+ on CH2 target.
For comparison the results of Webber et al and Zeitlin et al are also given.
Table 6.8 Partial charge changing cross sections for 1.0 A GeV Si14+ ions on CH2
target.

118
ACKNOWLEDGEMENTS
This is perhaps the easiest and hardest chapter that I have to write. It will be
simple to name all the people who helped me to get this work done, but it will be tough
to thank them enough. I will nonetheless try…
It is difficult to overstate my gratitude to my Ph.D. supervisors, Prof. Giorgio
Giacomelli, Dr. Imtinan E. Qureshi and Dr. Laura Patrizii. With their enthusiasm,
inspiration, and great efforts to explain things clearly and simply the completion of this
thesis would have not been possible. Throughout my thesis writing period, they provided
encouragement, sound advice, good teaching, good company, and lots of good ideas.
From the formative stages of this thesis, to the final draft, I owe an immense debt
of gratitude to my supervisor, Prof. Giorgio Giacomelli: his careful reading of my
original manuscript and his detailed, perceptive comments contributed in many ways to
the shape and clarity of the finished thesis.
I have also to thank Dr. Patrizii and Dr. Qureshi for guiding me through the writing
of the thesis, and for all the corrections and revisions made to the text. It became a
lighter and more concise thesis after their suggested improvements.
I must send thanks to all the SLIM team. Without their support and striving
development the project would have never reached the great result it did. A special
gratitude is due to Prof. Giacomelli for leading the group so far and being insatiable in
the quest for improvement and knowledge. Giacomelli was also a particular good leader
and motivator, enabling all the team to face the hard work with a smile on the lips. The
discussions, encouragement and critiques made by all collaborators were of essence to
the progress of this work.
And last but not the least Laura, not necessarily for coming along at the right time,
but for the very special person she is. And for the incredible amount of patience she
had with me in the last six months. It is time to start on that list of things to do.
I wish to thanks Dr. Vincent Togo and Dr. A. Kumar and Dr. M. Giorgini for many
technical discussions on how to improve the thesis and for helping me get through the
difficult times, and for all the emotional support, friendship, and kind-hearted they
provided. Togo, Lina and Chantal, whose extreme generosity will be remembered always,
I extend my deepest appreciation.
I am also grateful to the secretary Mrs. Anastasia Casoni for helping the
Departments matters to run smoothly and for assisting me in many different ways.
I would also like to thank the INFN sezione di Bologna, the Physics Department of
the University of Bologna and I am grateful to the Abdus Salam International Centre
for Theoretical Physics, ICTP, Trieste; special thanks to Prof. G. Furlan for his kind
support and help during the whole stay in Bologna. I also like to especially thank the
efficient staff at ICTP, Mrs. M. Durrani, Mrs. E. Dose and Mrs B. Valassi for their care,
attention and the rest for their continued moral support.
At the end, I would be offhand without mentioning my entire extended family;
mother, wife and two sweet daughters, Sidra and Areeba, as they patiently allowed me
to do this work.

119
Publications
1. V.Togo et al; The MACRO collaboration, “Calibration of CR39 and Makrofol
nuclear track detectors and search for exotic particles” Nucl. Phys. B 125 Proc.
Suppl. (2003) 217.
2. S. Cecchini et al; The SLIM collaboration: "Search for magnetic monopoles at
a high altitude laboratory", Proc. 28th Int.l Cosmic Ray Conf., Tsukuba, Japan,
July 31 – August 7, 2003, Universal Academy Press, Inc. (2003) 1657.
3. M. Ambrosio et al; The MACRO collaboration: “Moon and Sun shadowing
effect in the MACRO detector” Astropart. Phys. 20 (2003) 145.
4. M. Ambrosio et al; The MACRO collaboration: “Measurements of atmospheric
muon neutrino oscillations, global analysis of the data collected with MACRO
detector” Eur. Phys. J C36 (2004) 323.
5. G. Battistoni et al; “Search for a Lorentz invariance violation contribution in
atmospheric neutrino oscillations using MACRO data” Phys. Lett. B 615
(2005) 14.
6. Y. Becherini et al; “Time correlations of high energy muons in an underground
detector” Astropart. Phys. 23 (2005) 341.
7. S. Cecchini, et al; “Search for intermediate mass magnetic monopoles and
nuclearites with the SLIM experiment”, Radiation Measurements 40 (2005)
405.
8. S. Cecchini, et al; “Application of nuclear track detectors in astroparticle and
nuclear physics” 9th ICATPP Conf. on Astroparticle, Particle, Space Physics,
Detectors and Medical Physics Applications, Villa Erba, Como, Italy, 17-21
Oct 2005, Astroparticle, particle and space physics, detectors and medical
physics applications Url-str (9) (2005) 149.

120
9. S. Cecchini, et al; “Cosmic ray abundance measurements with the CAKE
balloon experiment” Proc. 29th Inter. Cosmic Ray Conf., Pune 3 (2005) 5,
astro-ph/0510717.
10. S. Manzoor et al; “Calibration of Makrofol-De nuclear track detector using
relativistic lead ions” Radiation Measurements 40 (2005) 433.
11. I.E. Qureshi et al; “Study of projectile fragmentation in the reaction (158 A
GeV) Pb + Pb using CR-39”, Radiation Measurements 40 (2005) 437.
12. T. Chiarusi; “The CAKE experiment Progress and new results” Radiation
Measurements 40 (2005) 424.
13. S. Balestra et al; “Rare particle searches with the high altitude SLIM
experiment”, EPS Int. Europhysics Conf. on H. E. P., Lisbon, Portugal, 21-27
Jul 2005. PoS HEP (2006) 018, hep-ex/0602036.
14. S. Balestra; “Search for massive rare particles with SLIM experiment” Proc.
29th Inter. Cosmic Ray Conf., Pune 9 (2005) 223.
15. S. Balestra et al., “Search for SQM in cosmic rays at high altitude laboratories”,
J. Phys. Conf. Ser. 39 (2006) 194.
16. L. Arrabito et al., “Hardware performance of a scanning system for high speed
analysis of nuclear emulsions”, Nucl. Instrum. Meth. A 568 (2006) 578,
physics/0604043.
17. S. Balestra et al., “Search for nuclearites with the SLIM detector”, Inter. Conf.
on Interconnection between H. E. P. and Astroparticle Physics: From Colliders
to Cosmic Rays, Prague, Czech Republic, 7-13 Sep 2005, Czech. J. Phys. 56
(2006) A221, hep-ex/0506075.
18. S. Balestra et al., “Bulk etch rate measurements and calibrations of plastic
nuclear track detectors” Nucl. Instrum. Meth. B 254 (2007) 254,
physics/0610227.
19. S. Manzoor et al., “Nuclear Track Detectors for Particle Searches”, 10th Topical
Seminar on Innovative Particle and Radiation Detectors, 1-5 October 2006, to
be published in Nucl. Phys. A proc. Suppl., physics/0611084.

121
20. S. Manzoor et al., “Nuclear Track Detectors for Environmental Studies and
Radiation Monitoring” 10th Topical Seminar on Innovative Particle and
Radiation Detectors, 1-5 October 2006, to be published in Nucl. Phys. A proc.
Suppl., physics/0611278.
21. V. Togo et al., “Fragmentation studies of high energy ions using CR39 nuclear
track detectors” 10th Int. Symp. on Radiat. Phys., Coimbra, Portugal, 17-22
Sept. 2006, to be published in Nucl. Instrum. Meth. A (2006), physics/0611105.
Reports, Internal Reports
1. OPERA Internal Note 77 (2006) “Measurement of the OPERA Lead α-
radioactivity in Bologna”.
2. SLIM Internal Report 2006/1 “The Stranger-Rompicapo
event/background”.