Robert Putnam - Social Capital Measurement and Consequences
12
Libreremo Questo libro è il frutto di un percorso di lotta per l’accesso alle conoscenze e alla formazione promosso dal CSOA Terra Terra, CSOA Officina 99, Get Up Kids!, Neapolis Hacklab. Questo libro è solo uno dei tanti messi a disposizione da LIBREREMO, un portale finalizzato alla condivisione e alla libera circolazione di materiali di studio universitario (e non solo!). Pensiamo che in un’università dai costi e dai ritmi sempre più escludenti, sempre più subordinata agli interessi delle aziende, LIBREREMO possa essere uno strumento nelle mani degli studenti per riappropriarsi, attraverso la collaborazione reciproca, del proprio diritto allo studio e per stimolare, attraverso la diffusione di materiale controinformativo, una critica della proprietà intellettuale al fine di smascherarne i reali interessi. I diritti di proprietà intellettuale (che siano brevetti o copyright) sono da sempre – e soprattutto oggi - grosse fonti di profitto per multinazionali e grandi gruppi economici, che pur di tutelare i loro guadagni sono disposti a privatizzare le idee, a impedire l’accesso alla ricerca e a qualsiasi contenuto, tagliando fuori dalla cultura e dallo sviluppo la stragrande maggioranza delle persone. Inoltre impedire l’accesso ai saperi, renderlo possibile solo ad una ristretta minoranza, reprimere i contenuti culturali dal carattere emancipatorio e proporre solo contenuti inoffensivi o di intrattenimento sono da sempre i mezzi del capitale per garantirsi un controllo massiccio sulle classi sociali subalterne. L’ignoranza, la mancanza di un pensiero critico rende succubi e sottomette alle logiche di profitto e di oppressione: per questo riappropriarsi della cultura – che sia un disco, un libro, un film o altro – è un atto cosciente caratterizzato da un preciso significato e peso politico. Condividere e cercare canali alternativi per la circolazione dei saperi significa combattere tale situazione, apportando benefici per tutti. Abbiamo scelto di mettere in condivisione proprio i libri di testo perché i primi ad essere colpiti dall’attuale repressione di qualsiasi tipo di copia privata messa in atto da SIAE, governi e multinazionali, sono la gran parte degli studenti che, considerati gli alti costi che hanno attualmente i libri, non possono affrontare spese eccessive, costretti già a fare i conti con affitti elevati, mancanza di strutture, carenza di servizi e borse di studio etc... Questo va evidentemente a ledere il nostro diritto allo studio: le università dovrebbero fornire libri di testo gratuiti o quanto meno strutture e biblioteche attrezzate, invece di creare di fatto uno sbarramento per chi non ha la possibilità di spendere migliaia di euro fra tasse e libri originali... Proprio per reagire a tale situazione, senza stare ad aspettare nulla dall’alto, invitiamo tutt* a far circolare il più possibile i libri, approfittando delle enormi possibilità che ci offrono al momento attuale internet e le nuove tecnologie, appropriandocene, liberandole e liberandoci dai limiti imposti dal controllo repressivo di tali mezzi da parte del capitale. Facciamo fronte comune davanti ad un problema che coinvolge tutt* noi! Riappropriamoci di ciò che è un nostro inviolabile diritto! csoa TerraaTerra Get Up Kids Neapolis Hacklab csoa Terra Terra csoa Officina 99 www.getupkids.org www.neapolishacklab.org www.csoaterraterra.org www.officina99.org www.libreremo.org
Transcript of Robert Putnam - Social Capital Measurement and Consequences

Libreremo
Questo libro è il frutto di un percorso di lotta per l’accesso alle conoscenze e alla formazione promosso dal CSOA Terra Terra, CSOA Officina 99, Get Up Kids!, Neapolis Hacklab. Questo libro è solo uno dei tanti messi a disposizione da LIBREREMO, un portale finalizzato alla condivisione e alla libera circolazione di materiali di studio universitario (e non solo!).
Pensiamo che in un’università dai costi e dai ritmi sempre più escludenti, sempre più subordinata agli interessi delle aziende, LIBREREMO possa essere uno strumento nelle mani degli studenti per riappropriarsi, attraverso la collaborazione reciproca, del proprio diritto allo studio e per stimolare, attraverso la diffusione di materiale controinformativo, una critica della proprietà intellettuale al fine di smascherarne i reali interessi.
I diritti di proprietà intellettuale (che siano brevetti o copyright) sono da sempre – e soprattutto oggi - grosse fonti di profitto per multinazionali e grandi gruppi economici, che pur di tutelare i loro guadagni sono disposti a privatizzare le idee, a impedire l’accesso alla ricerca e a qualsiasi contenuto, tagliando fuori dalla cultura e dallo sviluppo la stragrande maggioranza delle persone. Inoltre impedire l’accesso ai saperi, renderlo possibile solo ad una ristretta minoranza, reprimere i contenuti culturali dal carattere emancipatorio e proporre solo contenuti inoffensivi o di intrattenimento sono da sempre i mezzi del capitale per garantirsi un controllo massiccio sulle classi sociali subalterne.
L’ignoranza, la mancanza di un pensiero critico rende succubi e sottomette alle logiche di profitto e di oppressione: per questo riappropriarsi della cultura – che sia un disco, un libro, un film o altro – è un atto cosciente caratterizzato da un preciso significato e peso politico. Condividere e cercare canali alternativi per la circolazione dei saperi significa combattere tale situazione, apportando benefici per tutti.
Abbiamo scelto di mettere in condivisione proprio i libri di testo perché i primi ad essere colpiti dall’attuale repressione di qualsiasi tipo di copia privata messa in atto da SIAE, governi e multinazionali, sono la gran parte degli studenti che, considerati gli alti costi che hanno attualmente i libri, non possono affrontare spese eccessive, costretti già a fare i conti con affitti elevati, mancanza di strutture, carenza di servizi e borse di studio etc...
Questo va evidentemente a ledere il nostro diritto allo studio: le università dovrebbero fornire libri di testo gratuiti o quanto meno strutture e biblioteche attrezzate, invece di creare di fatto uno sbarramento per chi non ha la possibilità di spendere migliaia di euro fra tasse e libri originali... Proprio per reagire a tale situazione, senza stare ad aspettare nulla dall’alto, invitiamo tutt* a far circolare il più possibile i libri, approfittando delle enormi possibilità che ci offrono al momento attuale internet e le nuove tecnologie, appropriandocene, liberandole e liberandoci dai limiti imposti dal controllo repressivo di tali mezzi da parte del capitale.
Facciamo fronte comune davanti ad un problema che coinvolge tutt* noi! Riappropriamoci di ciò che è un nostro inviolabile diritto!
csoaTerraaTerra
Get Up Kids! Neapolis Hacklab csoa Terra Terra csoa Officina 99
www.getupkids.org www.neapolishacklab.org www.csoaterraterra.org www.officina99.org
www.libreremo.org
41isuma
A R T I C L E
RÉSUMÉ ❿ Plusieurs indicateurs portent à croire que le capital social est en nette régression
aux États-Unis depuis le milieu des années soixante. Après avoir connu une hausse pendant
près des deux tiers du XIXe siècle, le nombre d’adhérents à des associations et la
participation à des organismes civiques, le niveau de confiance et celui des dons de charité
ont enregistré un recul notable. Il existe aux États-Unis une corrélation très forte entre les
niveaux de capital social et la performance scolaire, la santé, la fraude fiscale et le bien-être
que les gens estiment avoir. Il faudrait évidemment analyser ce schéma beaucoup plus en
détails, mais il est suffisamment prononcé pour justifier de continuer à s’intéresser au
capital social et à ses conséquences potentiellement importantes pour plusieurs domaines
de politiques gouvernementales.
ABSTRACT ❿ A number of indicators suggest that there has been a sharp decline in social
capital in the United States since the mid-1960s. After rising for most of the first two thirds of
the 19TH century, formal membership and participation in civic organizations, levels of trust,
and charitable giving have all seen sharp declines. There is a strong relationship, across
American states, between measures of social capital and educational performance, health,
tax evasion and self-assessed welfare. Although this pattern still needs far more detailed
analysis, it is pronounced enough to justify further attention to social capital and its
potentially powerful implications for a range of public policy issues.
The central idea of social capital, in my view, is that networks and theassociated norms of reciprocity have value. They have value for the peo-ple who are in them, and they have, at least in some instances, demon-
strable externalities, so that there are both public and private faces of socialcapital. I focus largely on the external, or public, returns to social capital, butI think that is not at all inconsistent with the idea that there are also private re-turns. The same is no doubt true of human capital, i.e., there are simultane-ously public and private returns.
Like physical capital, social capital is far from homogenous. Some forms of so-cial capital are good for some things and not for others. Accepting that there isno single form of social capital, we need to think about its multiple dimensions.
Measurement and Consequences
B Y R O B E R T P U T N A M
SocialCapital
ILLU
STR
ATI
ON
S:
DA
NIE
L SY
LVES
TRE
42 Spring • Printemps 2001
social capital: measurement and consequences
American Medical Association (ama),or electronic engineers belonging tothe Institute of Electrical andElectronics Engineers (ieee).
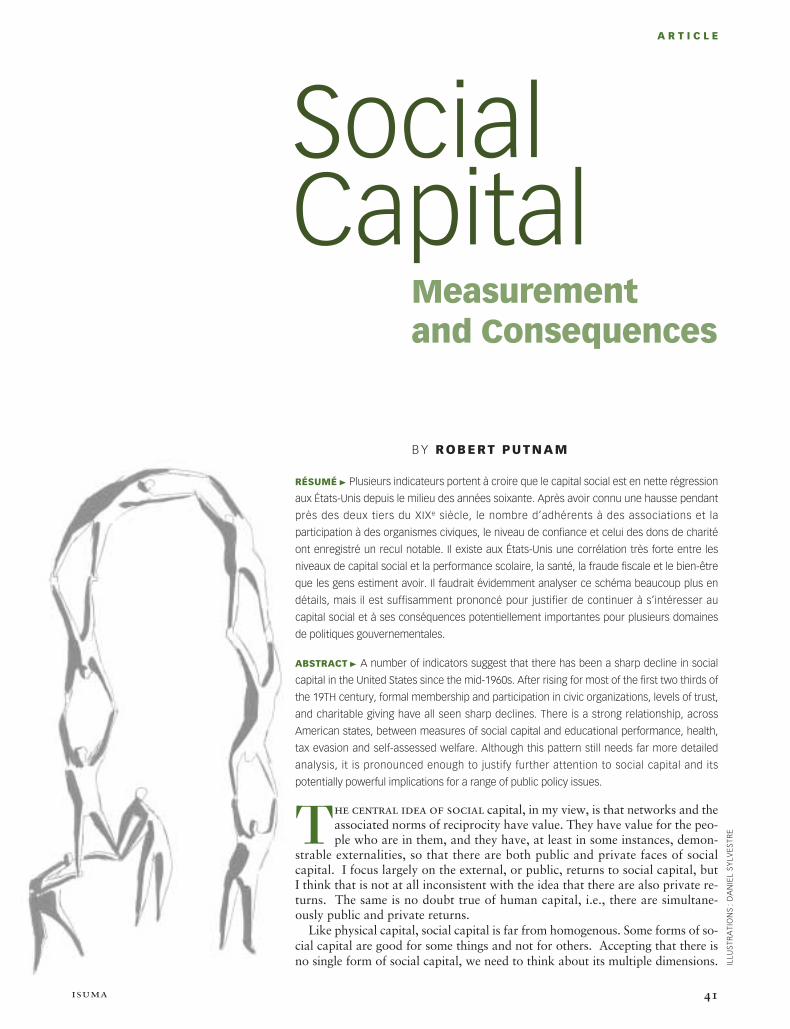
Graphs for the various organiza-tions tell a similar story. Membershipmarket shares rise for the first twothirds of the century, with the excep-tion of the Great Depression whenmany organizations lost half theirmembership between 1930 and 1935.Thereafter, there was a long period ofvery rapid growth, doubling marketshare, on average.
The period between 1940 and1965 was arguably the most rapid pe-riod of civic revival in American his-tory. Figure 1 does not prove that,but I believe it was the case.
And then suddenly, silently, inex-plicably, all of those organizationsbegan to experience levelling marketshares and then decline in marketshares, and gradually the decline inmarket shares became so great thatthey began to experience a decline inthe absolute number of members. By1997, the average organization wasback to Depression levels in terms ofmembership market shares. Not allorganizations’ membership fell at thesame time. The ama actually was thefirst to peak in terms of its marketshare. Appropriately, the last of the
One of the most important researchpriorities in this area is the develop-ment of theoretically coherent andempirically valid typologies or dimen-sions along which social capital shouldvary. Although, I give some examplesof how social capital varies, I do notthink we are anywhere near a kind ofcanonical account of the dimensionsof social capital.
Some forms of social capital, suchas a pta (Parent-Teacher Association)organization, a national organizationof any sort, or a labour union, for-mally organized with a chairperson, apresident and membership dues, arehighly formal. Other forms of socialcapital, such as a group of peoplegathering at a bar every Thursdayevening, are highly informal. And yet,both forms constitute networks inwhich there can easily develop reci-procity, and in which there can begains. Some forms of social capitalare densely interlaced, like a group ofsteelworkers who work together everyday at the factory, go bowling to-gether on Saturday, and to the samechurch every Sunday. At another ex-treme, you have very thin, almost in-visible forms of social capital, like thenodding acquaintance you have withthe person you occasionally see at thesupermarket, while waiting in line.
We must not be too dismissive ofsuch casual forms of social connec-tion. There has been good experi-mental evidence that if you nod topeople in the hall, they are more likelyto come to your aid if you shouldhave a seizure or a heart attack, thanif you don’t nod to them, even if youdon’t otherwise know them. Merelynodding to someone in the hall gen-erates visible, measurable forms ofreciprocity.
I now address issues of measure-ment, especially of long-run trends,over the course of the 20th century,in social capital in the United States.For many Americans that is an inter-esting question. In 1995, I wrote anarticle1 in which I conjectured that thelong-run trends, at least the recenttrends, in social capital in the UnitedStates were down. In that article Iprovided preliminary evidence thatshowed, at least by some measures,
that membership in organizationswas down. My recent book2 looks inmuch more detail at the question oftrends in social capital in the UnitedStates.
For my 1995 article, we con-structed market share measures formany major civic organizations inAmerican life, e.g., the percentage ofall Jewish women in America belong-ing to Hadassah; the percentage ofCatholic men belonging to theKnights of Columbus; the percentageof rural kids belonging to the 4-h; thepercentage of parents belonging to apta; or the percentage of all adultmen belonging to one of the “animalclubs,” that is, men’s organizations.(“Animal clubs” is a technical term: Ionly realized when I began doing thisresearch that all men’s clubs inAmerica are named for animals: theLions club, the Moose club, the Elksclub, the Eagles club, and so on.)
In all, over 30 large organizationswere examined. Virtually all of the in-dividual graphs look like Figure 1,which in fact shows the averagemembership rates for 32 nationalchapter-based voluntary associationsfor almost the entire 20th century.An almost identical graph applies toprofessional organizations, e.g., doc-tors who are members of the
1900 1910 1920 1930 1940 1950 1960 1970 1980 1990 2000
GreatDepression
WorldWar I
WorldWar II
F I G U R E 1
Average membership rate in 32 nationalchapter-based voluntary associations, 1900-1997
Meanmembership
rate fortwentiethcentury
43isuma
social capital: measurement and consequences
organizations we looked at to peakand begin to fall was the Optimists.The Optimists did not begin fallinguntil 1980, but then they really plum-meted and are now back down interms of their market share to belowwhat they were in the 1930s.
But there are two reasons to doubtthe adequacy of the membership dataas a sufficient measure of social con-nectedness. First of all, it is based onmembership in fixed organizations. Iwanted to know membership acrossthe whole of the century, so I neededsome measures that would last acrossthe whole century. But there mighthave been another shadow universeof organizations that was growingwhile these were declining, so perhapsthis graph represents just changes inthe pecking order of organizations,and not a universal pattern.
Second—and I want to underlinethis because there has been some mis-understanding of my own position onthis — I do not believe, nor have Iever believed, that associations weresome privileged form of social capi-tal, except in the sense that associa-tions tend to gather data onthemselves and, therefore, it is easierto gather data on associations.Beyond this greater ease of measure-ment, there is nothing canonically su-
perior about formal associations asforms of social networks.
Of course it could be true that as-sociations were becoming less com-mon in America but that we werehanging out in bars more, that wewere having more picnics, that wewere seeing folks at our home atnight more often, and those forms ofinformal social capital can be quiteimportant. But I could not figure outwhere the picnic register in Americansociety was located. Where would Igo to find out about trends in picnicsover time?
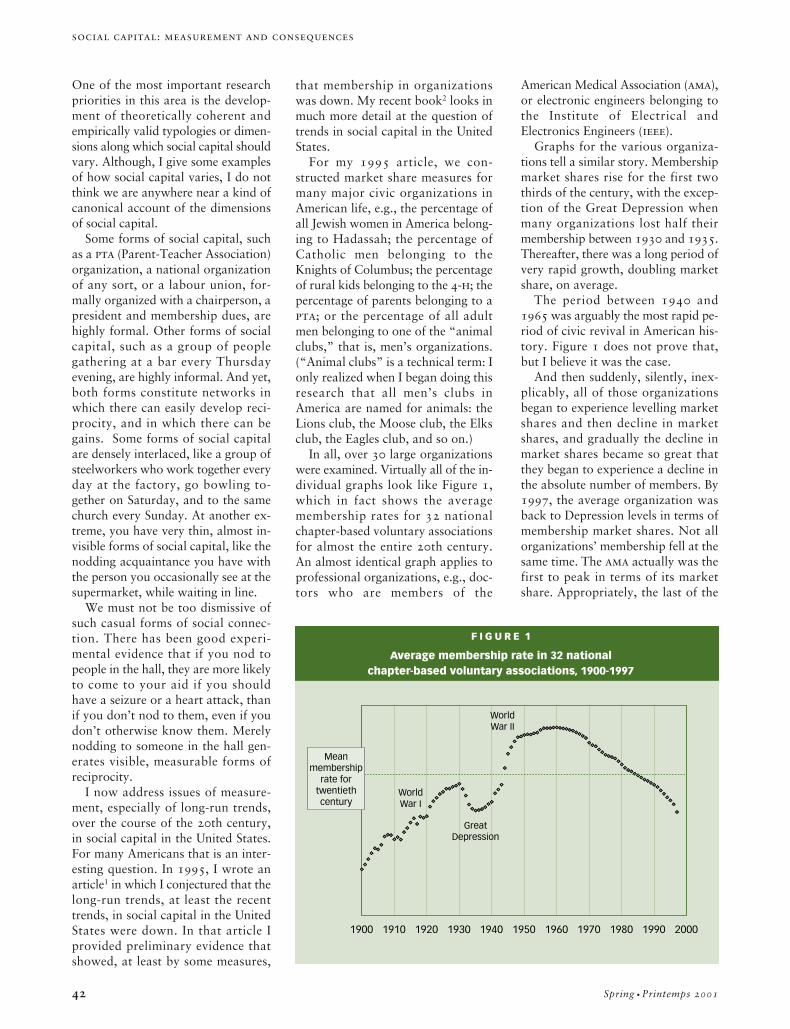
Both of these possible shortcomingsof the membership data were solvedwhen I discovered two massive newarchives of data in the United States.One of them, the Roper survey, hasasked national samples of Americans,every month over the last 25 yearsand continuing still, questions of thefollowing form: In the course of thelast year, did you do any of the fol-lowing things: sign a petition, write aletter to your congressman, attend alocal meeting, serve as an official of alocal club, serve on a committee ofany local organization, work for a po-litical party, and so on. By politicalscience standards, the Roper databaseis huge — more than 400,000 sur-veys—and it shows unequivocally a
0%
2%
4%
6%
8%
10%
12%
14%
16%
18%
1970 1975 1980 1985 1990 1995
Per
cen
t w
ho
hav
e se
rved
as
off
icer
or
on
com
mit
tee
(or
bo
th)
fo
r lo
cal c
lub
or
org
aniz
atio
n in
th
e p
ast
year
F I G U R E 2
Active organizational involvement, 1973-1994
We must
not be too
dismissive
of casual
forms
of social
connection.
44 Spring • Printemps 2001
social capital: measurement and consequences
decline in all these forms of civic par-ticipation. Figure 2, which happens tobe the graph of the Roper data for thepercentage of Americans who had, inthe course of the last year, served ei-ther as officer of a local organizationor as a committee member of a localorganization— any organization, notjust one of my 32 national organiza-tions— shows a quite dramatic drop,basically a cut in half, over theseyears. Every one of the 12 differentkinds of connectedness covered in thesurvey shows the same decline.
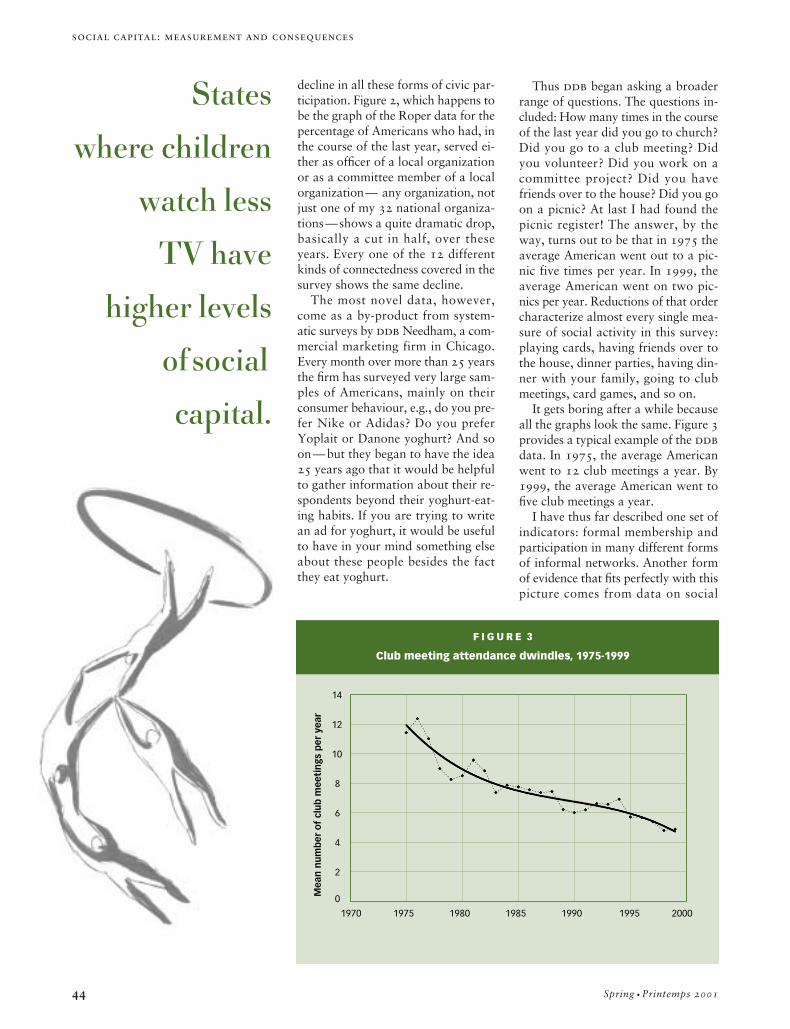
The most novel data, however,come as a by-product from system-atic surveys by ddb Needham, a com-mercial marketing firm in Chicago.Every month over more than 25 yearsthe firm has surveyed very large sam-ples of Americans, mainly on theirconsumer behaviour, e.g., do you pre-fer Nike or Adidas? Do you preferYoplait or Danone yoghurt? And soon—but they began to have the idea25 years ago that it would be helpfulto gather information about their re-spondents beyond their yoghurt-eat-ing habits. If you are trying to writean ad for yoghurt, it would be usefulto have in your mind something elseabout these people besides the factthey eat yoghurt.
Thus ddb began asking a broaderrange of questions. The questions in-cluded: How many times in the courseof the last year did you go to church?Did you go to a club meeting? Didyou volunteer? Did you work on acommittee project? Did you havefriends over to the house? Did you goon a picnic? At last I had found thepicnic register! The answer, by theway, turns out to be that in 1975 theaverage American went out to a pic-nic five times per year. In 1999, theaverage American went on two pic-nics per year. Reductions of that ordercharacterize almost every single mea-sure of social activity in this survey:playing cards, having friends over tothe house, dinner parties, having din-ner with your family, going to clubmeetings, card games, and so on.
It gets boring after a while becauseall the graphs look the same. Figure 3provides a typical example of the ddbdata. In 1975, the average Americanwent to 12 club meetings a year. By1999, the average American went tofive club meetings a year.
I have thus far described one set ofindicators: formal membership andparticipation in many different formsof informal networks. Another formof evidence that fits perfectly with thispicture comes from data on social
F I G U R E 3
Club meeting attendance dwindles, 1975-1999
0
2
4
6
8
10
12
14
1970 1975 1980 1985 1990 1995 2000
Mea
n n
um
ber
of
clu
b m
eeti
ngs
per
yea
r
States
where children
watch less
TV have
higher levels
of social
capital.
45isuma
social capital: measurement and consequences
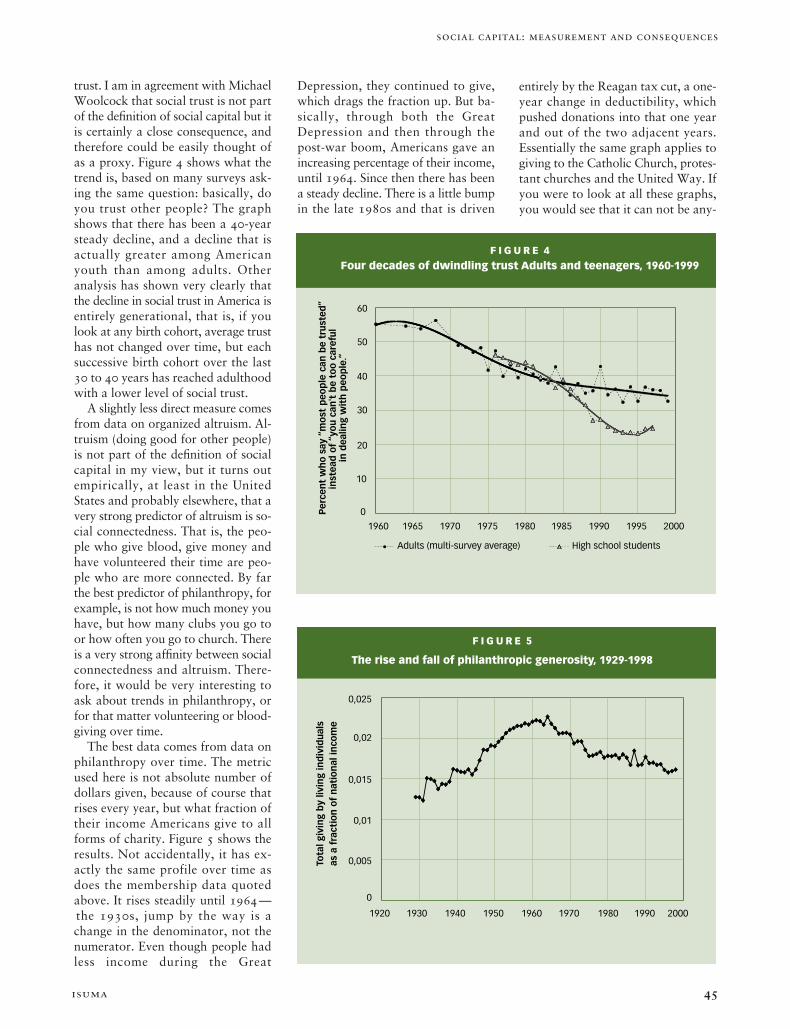
trust. I am in agreement with MichaelWoolcock that social trust is not partof the definition of social capital but itis certainly a close consequence, andtherefore could be easily thought ofas a proxy. Figure 4 shows what thetrend is, based on many surveys ask-ing the same question: basically, doyou trust other people? The graphshows that there has been a 40-yearsteady decline, and a decline that isactually greater among Americanyouth than among adults. Otheranalysis has shown very clearly thatthe decline in social trust in America isentirely generational, that is, if youlook at any birth cohort, average trusthas not changed over time, but eachsuccessive birth cohort over the last30 to 40 years has reached adulthoodwith a lower level of social trust.
A slightly less direct measure comesfrom data on organized altruism. Al-truism (doing good for other people)is not part of the definition of socialcapital in my view, but it turns outempirically, at least in the UnitedStates and probably elsewhere, that avery strong predictor of altruism is so-cial connectedness. That is, the peo-ple who give blood, give money andhave volunteered their time are peo-ple who are more connected. By farthe best predictor of philanthropy, forexample, is not how much money youhave, but how many clubs you go toor how often you go to church. Thereis a very strong affinity between socialconnectedness and altruism. There-fore, it would be very interesting toask about trends in philanthropy, orfor that matter volunteering or blood-giving over time.
The best data comes from data onphilanthropy over time. The metricused here is not absolute number ofdollars given, because of course thatrises every year, but what fraction oftheir income Americans give to allforms of charity. Figure 5 shows theresults. Not accidentally, it has ex-actly the same profile over time asdoes the membership data quotedabove. It rises steadily until 1964—the 1930s, jump by the way is achange in the denominator, not thenumerator. Even though people hadless income during the Great
Depression, they continued to give,which drags the fraction up. But ba-sically, through both the GreatDepression and then through thepost-war boom, Americans gave anincreasing percentage of their income,until 1964. Since then there has beena steady decline. There is a little bumpin the late 1980s and that is driven
entirely by the Reagan tax cut, a one-year change in deductibility, whichpushed donations into that one yearand out of the two adjacent years.Essentially the same graph applies togiving to the Catholic Church, protes-tant churches and the United Way. Ifyou were to look at all these graphs,you would see that it can not be any-
0
10
20
30
40
50
60
1960 1965 1970 1975 1980 1985 1990 1995 2000
Per
cen
t w
ho
say
“m
ost
peo
ple
can
be
tru
sted
”in
stea
d o
f “y
ou
can
't b
e to
o c
aref
ul
in d
ealin
g w
ith
peo
ple
.”
Adults (multi-survey average) High school students
F I G U R E 4
Four decades of dwindling trust Adults and teenagers, 1960-1999
0
0,005
0,01
0,015
0,02
0,025
1920 1930 1940 1950 1960 1970 1980 1990 2000
Tota
l giv
ing
by
livin
g in
div
idu
als
as a
fra
ctio
n o
f n
atio
nal
inco
me
F I G U R E 5
The rise and fall of philanthropic generosity, 1929-1998
46 Spring • Printemps 2001
social capital: measurement and consequences
Social Capital
Very high (4) (3) (6)
High (6) (5) (5)
Low (5) (4) (5)
Very low (6)
F I G U R E 6
Social capital in the American States
Ind
ex o
f Ed
uca
tio
nal
Per
form
ance
WY
WI
WV
WA
VA
VTUT
TX
TN
SD
SC
RI
PA
OR
OKOH
ND
NC
NY
NM
NJ
NH
NV
NEMT
MO
MS
MN
MI
MA
MD
ME
LA
KY
KS
IO
IN
ILID
GAFL
DE
CT
CO
CAAR
AZ
AL
Low High
Social Capital Index
F I G U R E 7 . 1
Schools work better in high social capital states
The period between
1940 and 1965
was arguably the
most rapid period of
civic revival in
American history.
Then suddenly,all of
those organizations
declined.
47isuma
social capital: measurement and consequences
Alabama . . . . . . . . . . . . . . . . . . ALAlaska . . . . . . . . . . . . . . . . . . . . AKArizona . . . . . . . . . . . . . . . . . . . AZArkansas. . . . . . . . . . . . . . . . . . ARCalifornia . . . . . . . . . . . . . . . . . CAColorado. . . . . . . . . . . . . . . . . . COConnecticut. . . . . . . . . . . . . . . . CTDelaware. . . . . . . . . . . . . . . . . . DEFlorida . . . . . . . . . . . . . . . . . . . . FLGeorgia . . . . . . . . . . . . . . . . . . . GAHawaii . . . . . . . . . . . . . . . . . . . . HIIdaho . . . . . . . . . . . . . . . . . . . . . IDIllinois . . . . . . . . . . . . . . . . . . . . . ILIndiana . . . . . . . . . . . . . . . . . . . . INIowa . . . . . . . . . . . . . . . . . . . . . . IAKansas. . . . . . . . . . . . . . . . . . . . KS Kentucky. . . . . . . . . . . . . . . . . . KYLouisiana . . . . . . . . . . . . . . . . . . LAMaine . . . . . . . . . . . . . . . . . . . . MEMaryland . . . . . . . . . . . . . . . . . MDMassachusetts . . . . . . . . . . . . MAMichigan . . . . . . . . . . . . . . . . . . MIMinnesota . . . . . . . . . . . . . . . . MNMississippi . . . . . . . . . . . . . . . . MSMissouri . . . . . . . . . . . . . . . . . . MOMontana. . . . . . . . . . . . . . . . . . MTNebraska . . . . . . . . . . . . . . . . . NENevada . . . . . . . . . . . . . . . . . . . NVNew Hampshire . . . . . . . . . . . . NHNew Jersey . . . . . . . . . . . . . . . . NJNew Mexico . . . . . . . . . . . . . . NMNew York . . . . . . . . . . . . . . . . . NYNorth Carolina . . . . . . . . . . . . . NCNorth Dakota . . . . . . . . . . . . . . NDOhio . . . . . . . . . . . . . . . . . . . . . OHOklahoma . . . . . . . . . . . . . . . . . OKOregon . . . . . . . . . . . . . . . . . . . ORPennsylvania . . . . . . . . . . . . . . PARhode Island . . . . . . . . . . . . . . . RISouth Carolina . . . . . . . . . . . . . SCSouth Dakota . . . . . . . . . . . . . . SDTennessee . . . . . . . . . . . . . . . . TNTexas . . . . . . . . . . . . . . . . . . . . TXUtah . . . . . . . . . . . . . . . . . . . . . UTVermont . . . . . . . . . . . . . . . . . . VTVirginia . . . . . . . . . . . . . . . . . . . VAWashington. . . . . . . . . . . . . . . WAWest Virginia . . . . . . . . . . . . . . WVWisconsin . . . . . . . . . . . . . . . . . WIWyoming . . . . . . . . . . . . . . . . . WY
American States
Low High
Social Capital Index
WY
WI
WV
WAVA
VTUT
TX
TN
SD
SC
RIPA OR
OK
OH
ND
NC
NY
NM
NJ
NH
NV
NE
MT
MO
MS
MN
MI
MA
MD
ME
LA
KY
KS
IA
IN
IL
ID
GAFL
DE
CT
CO
CA
AR AZ
AL
Ch
ild W
eld
are
Ind
ex (
1998
)
F I G U R E 7 . 2
Kids are better off in high social capital states
thing to do with any particular recip-ient organization because the samegeneral patterns applies across all.
It is reasonable to think that socialcapital and institutional enforcementmight be in some sense alternativeways of providing social order. Socialcapital does facilitate informal con-tract enforcement— the logic of thatderives from the basic theory of socialcapital, that is game theory: if I havedense ties and networks of reciproc-ity with other people then I do not ac-tually have to have a contract withmy neighbour; both he and I aregoing to rake the leaves. We just doit without a contract and I don’t suehim if he doesn’t rake his leaves.Thus, if social capital is declining inthe United States, it might have im-plications for other forms of contractenforcement. So I thought I wouldlook at the relative share of lawyer-ing in the American economy as awhole and how this fraction haschanged through time. In 1900, therewere 41 lawyers per every 10,000 em-ployees in the United States. In 1970,there were 39. This was a little knownPutnam’s constant: historically therewere about 40 lawyers, plus or minusone, for every 10,000 employees in
America. This number was rock-steadyover the first 70 years of this century.And then this number started to in-crease, just as trust and social capitalstarted to decline, so that by nowlawyers’ share in the workforce hasmore than doubled.
A corollary to Putnam’s law wasthat there should be one doctor forevery lawyer, or one lawyer for everydoctor, in America. But that too haschanged, because the post-1970 jumpin lawyering has not been matched byan increase in the number of doctorsin America. Thus the jump in lawyersper capita is not simply a reflection ofa general increase in professionals inAmerica; it is unique to lawyers. Infact, over most of the century, theratio of engineers to lawyers shiftedsharply in the direction of more engi-neers per lawyer, but since 1970 thattrend has reversed. You would thinkthat as a country becomes more tech-nologically intensive, more and moreof its workforce would be trained en-gineers, but since 1970 that trend hascompletely reversed.
Does declining social capital matter?What I claim to have shown so far isthat by a variety of different measures
48 Spring • Printemps 2001
citizens go to, the level of social trustits citizens have, the degree to whichthey spend time visiting one anotherat home, the frequency with whichthey vote, the frequency with whichthey do volunteering, and so on.
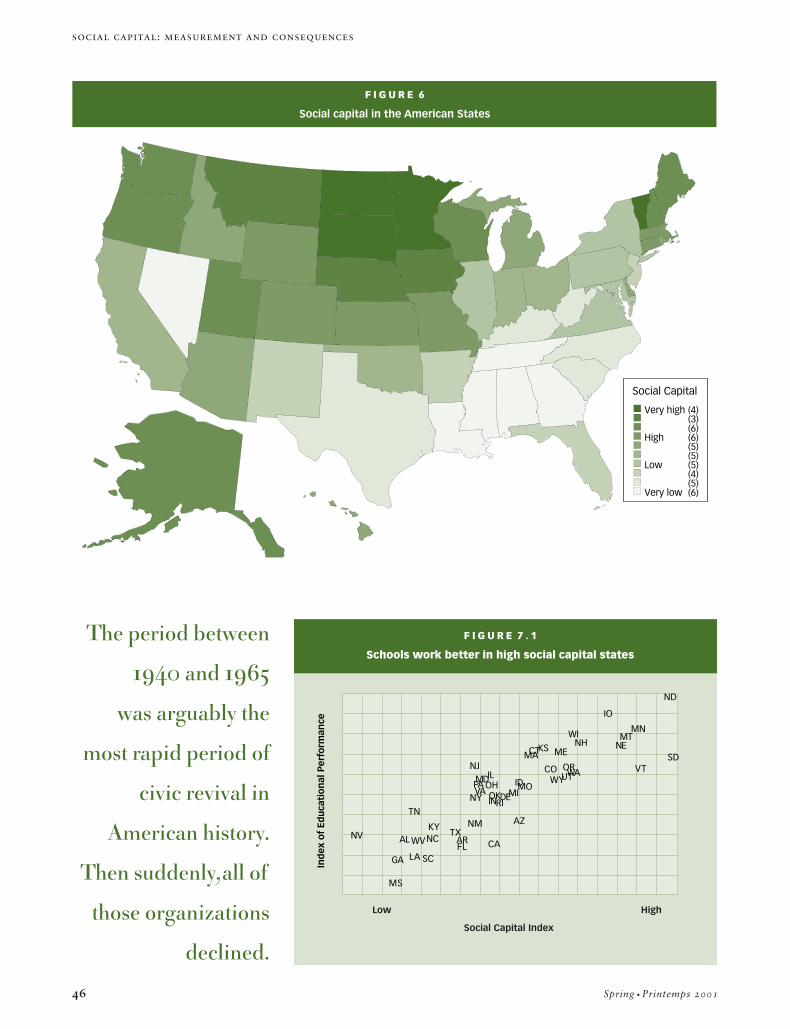
Figure 6 provides a social capitalmap of the United States. Canadiansmight find it interesting to note thatthe best single predictor of the level of
social capital: measurement and consequences
there has been a massive transforma-tion of social bonds in America overour lifetime. (My latest book dealswith the extent, causes and conse-quences of these changes in muchmore detail). In this section, I arguethat there are measurable conse-quences to social capital. In makingmy case, I take advantage of the factthat in the United States we have 50states, which hold some things con-stant but not others. Across all theAmerican states, I have developed 13different measures of social capital.Many of these I have already de-scribed: the percentage of people inthe state who had in the previous yearserved on a committee of some localorganization or as an officer of a localorganization, the number of clubmeetings attended, the number ofclub memberships, the turnout at thepresidential election, the number ofpublic meetings attended, and so on.
I have, for the sake of simplicity,combined all of those measures, viafactor analysis, into a single measure.You can think of that as the latentvariable that is measured by the over-lap among all these individual indica-tors. Operationally what I mean bysocial capital in what follows is the de-gree to which a given state is eitherhigh or low in the number of meetings
social capital in American states is dis-tance to the Canadian border. Beingcloser to the Canadian border meansmore social capital. Actually, if youlooked at that graph in more detailyou would see that it can be describedin terms of a barometric map withone high, centred over Minneapolis-St. Paul, and one low, centred overBaton Rouge, Louisiana. There areprobably deep historical roots for thatpattern. It is not an accident that thelow social capital is very clearly asso-ciated with the depth of slavery in the19th century, because slavery as a sys-tem and the post-slavery reconstruc-tion period were institutionallydesigned to destroy social capital. Thisis what slavery was about; it wasabout destroying social capital, be-cause social capital, among Blacks atleast, and later in post-slavery, socialconnection between Blacks and poorWhites, would have threatened thestructure of power. I am sure it is notan accident that there is a strong cor-relation between past slavery and cur-rent levels of social capital.
There are a few outliers to the gen-eral pattern. Nevada is lower thanwhere it should be; perhaps if youknow something about Nevada youhave guesses as to why this might betrue. Utah is higher than where it
Low High
Social Capital Index
TV W
atch
ing
by
4th
an
d8t
h G
rad
ers
1990
-199
4
WY
WI
WV
WA
VA
UT
TXTN
SC
RIPA
OR
OKOH
ND
NCNY
NM
NJ
NH
NE
MT
MO
MS
MN
MI
MA
MD
ME
LA
KY
IA
IN
IL
ID
GA FLDE
CT
CO
CA
AR
AZ
AL
F I G U R E 7 . 3
Kids watch less TV in high social capital states
Low High
Social Capital Index
WY
WI
WVWA
VA
VTUT
TX
TN
SD
SC
RI
PAOR
OK
OH
ND
NC
NY
NM
NJ
NH
NV
NEMT
MO
MS
MN
MI
MA
MD
ME
LA
KY
KS
IA
IN
IL
ID
GAFL
DE CT
CO
CA
ARAZ
AL
Mu
rder
Rat
e 19
80-1
995
F I G U R E 7 . 4
Violent crime is rarer in high social capital states
49isuma
social capital: measurement and consequences
should be, and this is quite explicablebecause of the Mormon Church.
The other variable that stronglypredicts social capital across theAmerican states is the pattern of im-migration. The best single migration-based positive determinant of socialcapital is the fraction of the popula-tion that is of Scandinavian descent.Another fact is that if you rankAmericans today by their level of so-cial capital or social trust or socialconnectedness, and you rank thecountries from which their ancestorscome, even as long ago as two orthree generations, those two rankingsare perfectly correlated, even thoughthe connection between those twostreams is on average two or threegenerations old. If you think of thecausal mechanism that must under-line that, the concordance is stunning.
The various panels of Figure 7 dis-play a number of pair-wise relationsbetween the index of social capitaland a number of important social andeconomic outcomes. These are allpartial relations based on multivari-ate regressions in which everythingpossible has been held constant be-cause states differ in so many ways.
The general pattern is that socialcapital drives out other possible com-peting variables in regression analy-
sis. There is no way to be entirely surein which direction causality runs. Icannot be sure there is no other causalvariable, but I have gone throughmany potential variables that couldmake this spurious. That is relevantbecause the horizontal axis inFigure 7.1 is the social capital index,and the vertical axis a composite mea-sure of educational performance (sat
scores, test scores, high school drop-out rate). This is an extremely robustfinding; it does not depend at all onwhich particular measure you use.The relationship shown is strongenough to pass what is known in po-litical science as the inter-oculartrauma test— it strikes one betweenthe eyes.
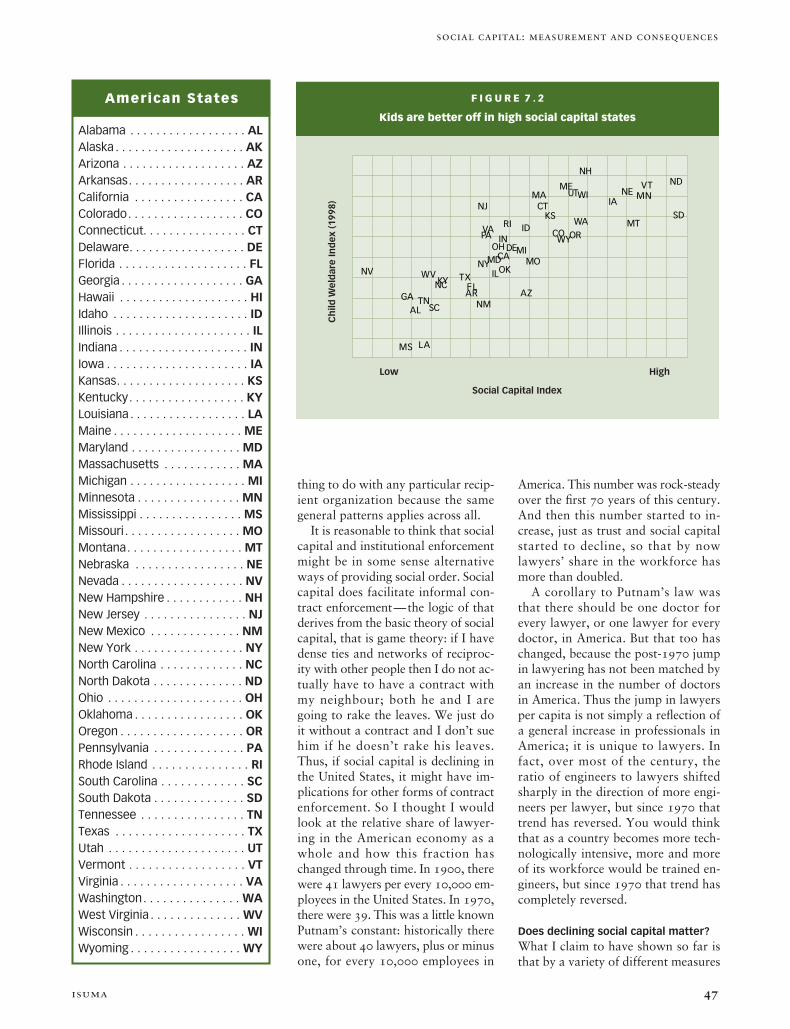
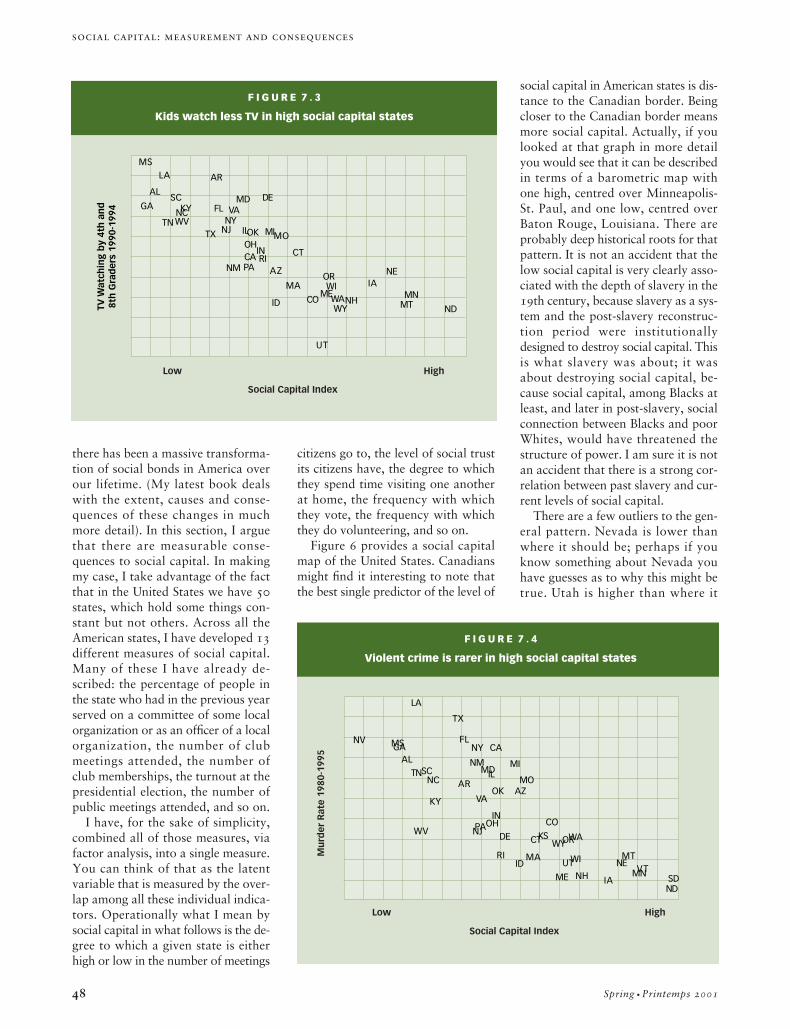
The relationship between educa-tional performance and social capitalis much stronger, two orders of mag-nitude stronger than, for example—again controlling for everythingelse — spending on schools orteacher/pupil ratios or any of the ob-vious things that are usually thoughtto increase educational performance.Figure 7.2 shows a composite mea-sure of child welfare (it includes teenpregnancy, infant mortality and a va-riety of other measures of how wellkids do) and again there is a verystrong relationship showing that, ingeneral, the welfare of children ishigher where social capital is higher.Figure 7.3 shows that states wherechildren watch less tv have higherlevels of social capital, a relationshipI study in much more detail in mybook.
Crime is strongly negatively pre-dicted by social capital; this is true atthe state level, but it is also true at the
Social Capital Index
WYWI
WV
WA
VAVTUT
TXTN
SD
SC
RIPA
OR
OK
OH
ND
NC
NY
NM
NJ
NH
NV
NE
MT
MO
MS
MN
MI
MAMD
ME
LA
KY
KS
IA
IN
IL
ID
GA
FL
DE
CTCO
CAAR AZ
AL
Low High
“I’d
do
bet
ter
than
ave
rage
in f
ist
figh
t”
Agree
Disagree
F I G U R E 7 . 5
States high in social capital are less pugnacious
Low High
Social Capital Index
WYWI
WV
WA
VA
VTUT
TX
TN
SD
SC
RI
PA
OR
OKOH
ND
NC NYNM
NJ
NH
NV
NE
MT
MO
MS
MN
MI
MAMD
ME
LA
KY
KS
IA
IN
IL
ID
GA
FL
DE
CT
COCA
AR
AZ
ALHea
lth
Sta
te In
dex
199
3-19
98
F I G U R E 7 . 6
Health is better in high social capital states
50 Spring • Printemps 2001
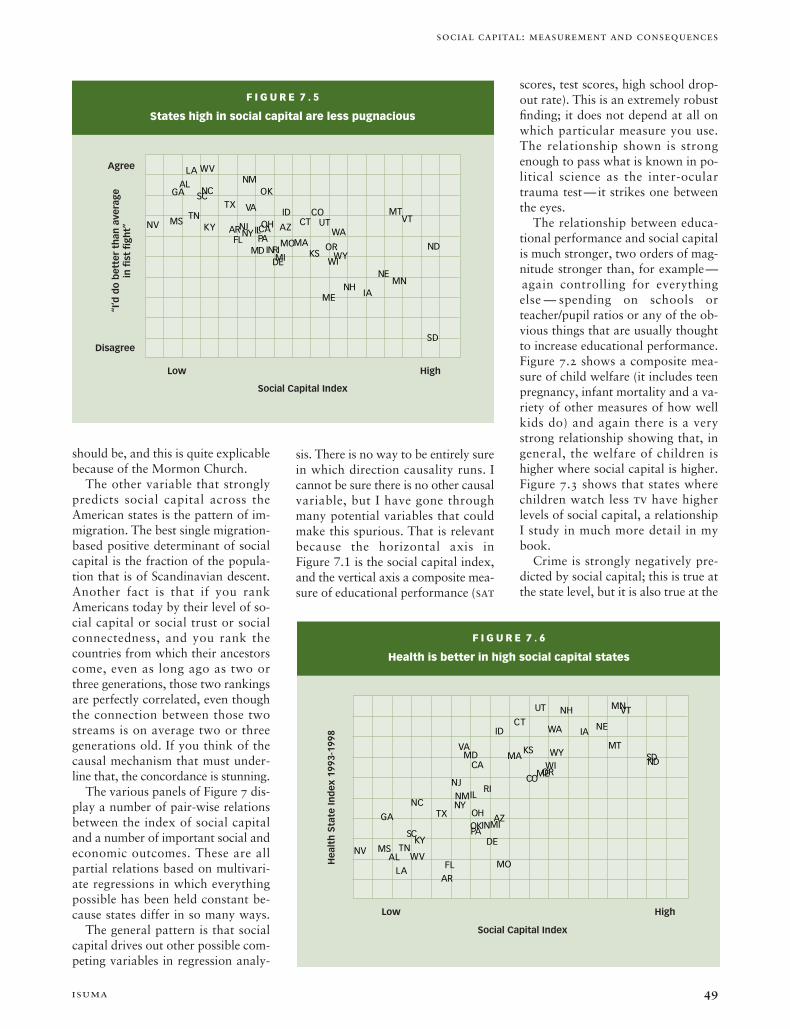
community and neighbourhood lev-els. Once again the strongest predic-tor of the murder rate is a low levelof social capital. It is stronger thanpoverty; it is stronger than other plau-sible measures. Figure 7.4 shows thatmurder rates are lower in stateswhere social capital is higher, andFigure 7.5 shows that people are gen-erally less pugnacious where socialcapital is high.
As Michael Woolcock and otherauthors have pointed out, there isvery strong evidence of powerfulhealth effects of social connectedness.The evidence is strong not only inAmerican states, but also in Finland,Japan and other countries. Control-ling for your blood chemistry, age,gender, whether or not you jog, andfor all other risk factors, your chanceof dying over the course of the nextyear are cut in half by joining onegroup, and cut to a quarter by join-ing two groups. This is not cheating;these are prospective studies. It is notthat people who are healthy becomejoiners; it is clear from the studiesthat the arrow runs in the other di-rection, from joining to health. Theseare big effects, as can been seen inFigure 7.6. Once again, these same re-sults are confirmed by a multitude ofindividual-level, over-time studies.
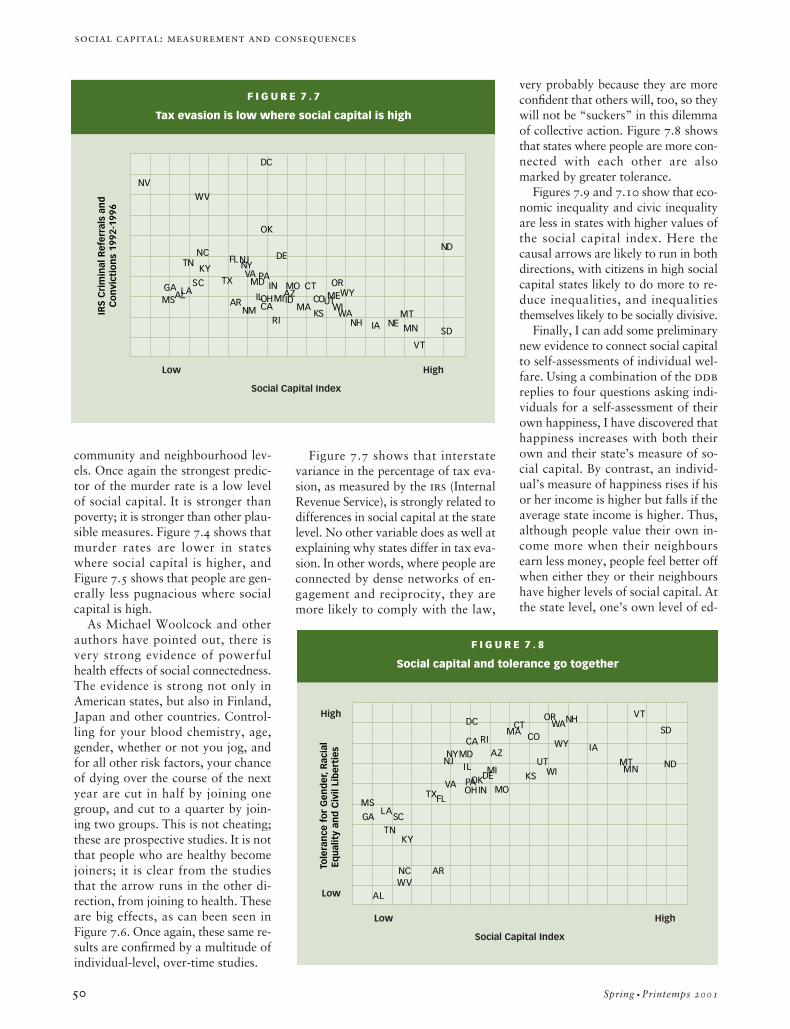
Figure 7.7 shows that interstatevariance in the percentage of tax eva-sion, as measured by the irs (InternalRevenue Service), is strongly related todifferences in social capital at the statelevel. No other variable does as well atexplaining why states differ in tax eva-sion. In other words, where people areconnected by dense networks of en-gagement and reciprocity, they aremore likely to comply with the law,
very probably because they are moreconfident that others will, too, so theywill not be “suckers” in this dilemmaof collective action. Figure 7.8 showsthat states where people are more con-nected with each other are alsomarked by greater tolerance.
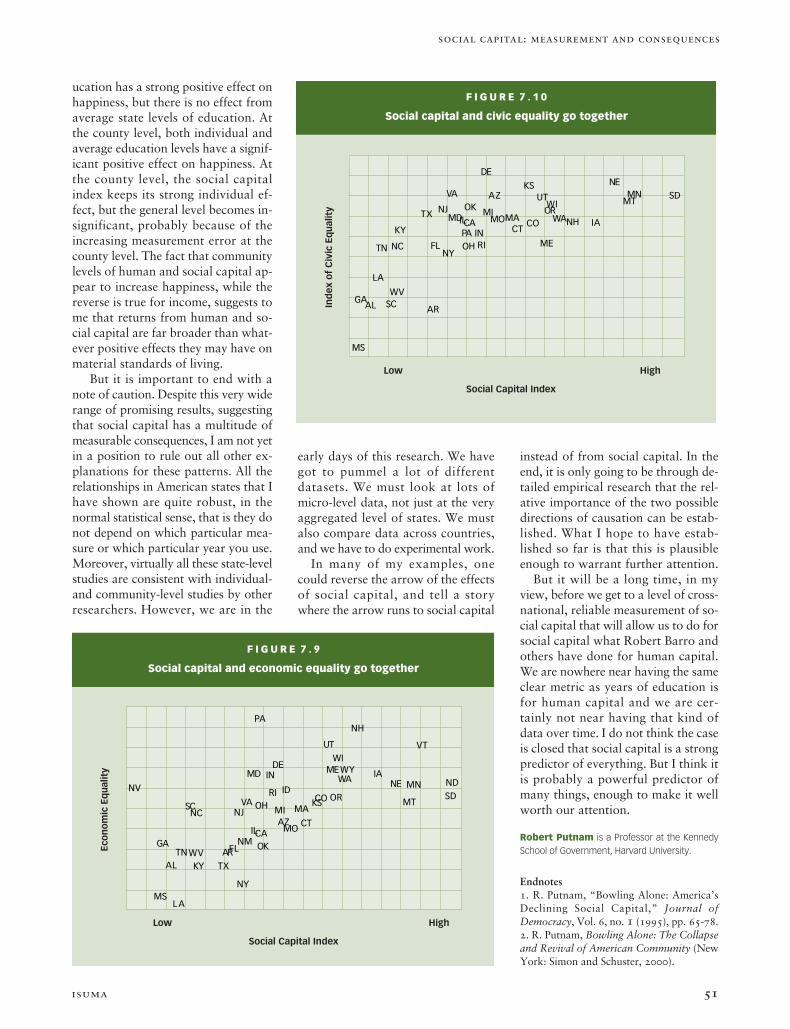
Figures 7.9 and 7.10 show that eco-nomic inequality and civic inequalityare less in states with higher values ofthe social capital index. Here thecausal arrows are likely to run in bothdirections, with citizens in high socialcapital states likely to do more to re-duce inequalities, and inequalitiesthemselves likely to be socially divisive.
Finally, I can add some preliminarynew evidence to connect social capitalto self-assessments of individual wel-fare. Using a combination of the ddbreplies to four questions asking indi-viduals for a self-assessment of theirown happiness, I have discovered thathappiness increases with both theirown and their state’s measure of so-cial capital. By contrast, an individ-ual’s measure of happiness rises if hisor her income is higher but falls if theaverage state income is higher. Thus,although people value their own in-come more when their neighboursearn less money, people feel better offwhen either they or their neighbourshave higher levels of social capital. Atthe state level, one’s own level of ed-
Low High
Social Capital Index
IRS
Cri
min
al R
efer
rals
an
dC
on
vict
ion
s 19
92-1
996
WY
WI
WV
WA
VA
VT
UT
TX
TN
SD
SC
RI
PAOR
OK
OH
NDNC
NY
NM
NJ
NH
NV
NEMT
MOMS
MN
MIMA
MDMELA
KY
KSIA
INIL ID
GA
FL DE
DC
CTCO
CAARAZAL
F I G U R E 7 . 7
Tax evasion is low where social capital is high
Low
Low
High
High
Social Capital Index
Tole
ran
ce f
or
Gen
der
, Rac
ial
Equ
alit
y an
d C
ivil
Lib
erti
es WY
WI
WV
WA
VA
VT
UT
TX
TN
SD
SC
RI
PA
OR
OKOH
ND
NC
NY NJ
NH
MT
MOMS
MNMI
MA
MD
LA
KY
KS
IA
IN
IL
GA
FL
DE
DC CTCOCA
AR
AZ
AL
F I G U R E 7 . 8
Social capital and tolerance go together
social capital: measurement and consequences
51isuma
ucation has a strong positive effect onhappiness, but there is no effect fromaverage state levels of education. Atthe county level, both individual andaverage education levels have a signif-icant positive effect on happiness. Atthe county level, the social capitalindex keeps its strong individual ef-fect, but the general level becomes in-significant, probably because of theincreasing measurement error at thecounty level. The fact that communitylevels of human and social capital ap-pear to increase happiness, while thereverse is true for income, suggests tome that returns from human and so-cial capital are far broader than what-ever positive effects they may have onmaterial standards of living.
But it is important to end with anote of caution. Despite this very widerange of promising results, suggestingthat social capital has a multitude ofmeasurable consequences, I am not yetin a position to rule out all other ex-planations for these patterns. All therelationships in American states that Ihave shown are quite robust, in thenormal statistical sense, that is they donot depend on which particular mea-sure or which particular year you use.Moreover, virtually all these state-levelstudies are consistent with individual-and community-level studies by otherresearchers. However, we are in the
Low High
Social Capital Index
WYWI
WV
WA
VA
VTUT
TXTN
SDSC
RI
PA
OR
OK
OH
ND
NC
NY
NM
NJ
NH
NV NE
MT
MO
MS
MN
MI MA
MD ME
LA
KY
KS
IAIN
IL
ID
GA FL
DE
CT
CO
CA
AR
AZ
AL
Eco
no
mic
Eq
ual
ity
F I G U R E 7 . 9
Social capital and economic equality go together
early days of this research. We havegot to pummel a lot of differentdatasets. We must look at lots ofmicro-level data, not just at the veryaggregated level of states. We mustalso compare data across countries,and we have to do experimental work.
In many of my examples, onecould reverse the arrow of the effectsof social capital, and tell a storywhere the arrow runs to social capital
Low High
Social Capital Index
WI
WV
WA
VA UT
TX
TN
SD
SC
RIPA
OROK
OHNCNY
NJNH
NE
MT
MO
MS
MN
MIMAMD
ME
LA
KY
KS
IAIN
IL
GA
FL
DE
CTCOCA
AR
AZ
ALInd
ex o
f C
ivic
Eq
ual
ity
F I G U R E 7 . 1 0
Social capital and civic equality go together
instead of from social capital. In theend, it is only going to be through de-tailed empirical research that the rel-ative importance of the two possibledirections of causation can be estab-lished. What I hope to have estab-lished so far is that this is plausibleenough to warrant further attention.
But it will be a long time, in myview, before we get to a level of cross-national, reliable measurement of so-cial capital that will allow us to do forsocial capital what Robert Barro andothers have done for human capital.We are nowhere near having the sameclear metric as years of education isfor human capital and we are cer-tainly not near having that kind ofdata over time. I do not think the caseis closed that social capital is a strongpredictor of everything. But I think itis probably a powerful predictor ofmany things, enough to make it wellworth our attention.
Robert Putnam is a Professor at the KennedySchool of Government, Harvard University.
Endnotes1. R. Putnam, “Bowling Alone: America’sDeclining Social Capital,” Journal ofDemocracy, Vol. 6, no. 1 (1995), pp. 65-78. 2. R. Putnam, Bowling Alone: The Collapseand Revival of American Community (NewYork: Simon and Schuster, 2000).
social capital: measurement and consequences