
Distribution of geneticDistribution of genetic diversity ...
51
Distribution of genetic Distribution of genetic diversity in forest tree species: role of species: role of demography and l i selection Giovanni G. Vendramin Delphine Grivet Mario Zabal Aguirre Santiago C González Martínez Giovanni G. Vendramin IGV‐CNR Delphine Grivet, Mario Zabal Aguirre, Santiago C. González‐Martínez Federico Sebastiani, Sara Torre Hadrien Lalague, Bruno Fady CNR-FAO “International year of forests: reasearch needs and perspective” – Rome, 17 October 2011
Transcript of Distribution of geneticDistribution of genetic diversity ...

Distribution of geneticDistribution of genetic diversity in forest tree
species: role ofspecies: role of demography and
l iselectionGiovanni G. Vendramin
Delphine Grivet Mario Zabal Aguirre Santiago C González Martínez
Giovanni G. Vendramin
IGV‐CNR
Delphine Grivet, Mario Zabal Aguirre, Santiago C. González‐MartínezFederico Sebastiani, Sara TorreHadrien Lalague, Bruno Fady
CNR-FAO “International year of forests: reasearch needs and perspective” – Rome, 17 October 2011
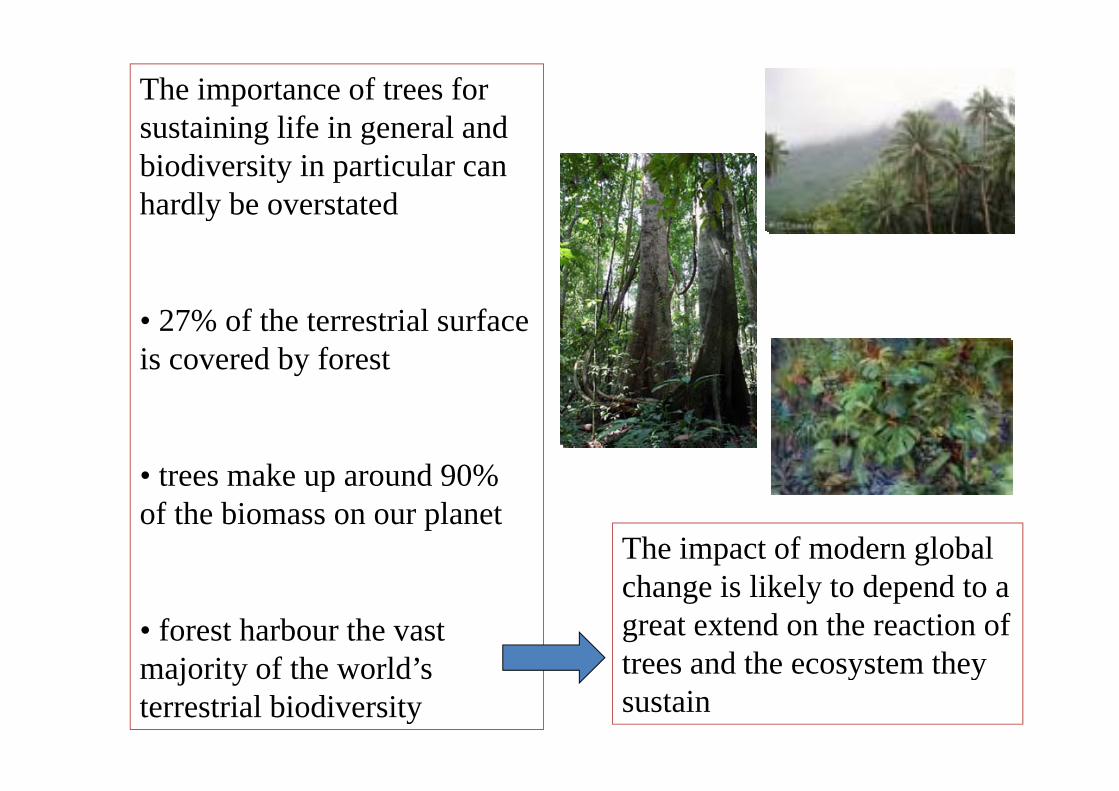
The importance of trees for sustaining life in general andsustaining life in general and biodiversity in particular can hardly be overstatedy
• 27% of the terrestrial surface is covered by forest
• trees make up around 90%trees make up around 90% of the biomass on our planet
The impact of modern global h i lik l d d
• forest harbour the vast majority of the world’s
change is likely to depend to a great extend on the reaction of trees and the ecosystem theymajority of the world’s
terrestrial biodiversitytrees and the ecosystem they sustain

Estimates of global tree species richness range from a low 60.000 to 100.000 taxa, th t i h 15 t 25%that is, as much as 15 to 25% of the 350-450.000 vascular plantsplants
Currently, around 10% of the world’s tree species are th t d t ti tithreatened to extinction, expecially in the tropics, and many more tree populations
This figures underpin the need to study treemany more tree populations
will likely succumbthe need to study tree biodiversity and evolution

Predictions for the Mediterranean region are dire
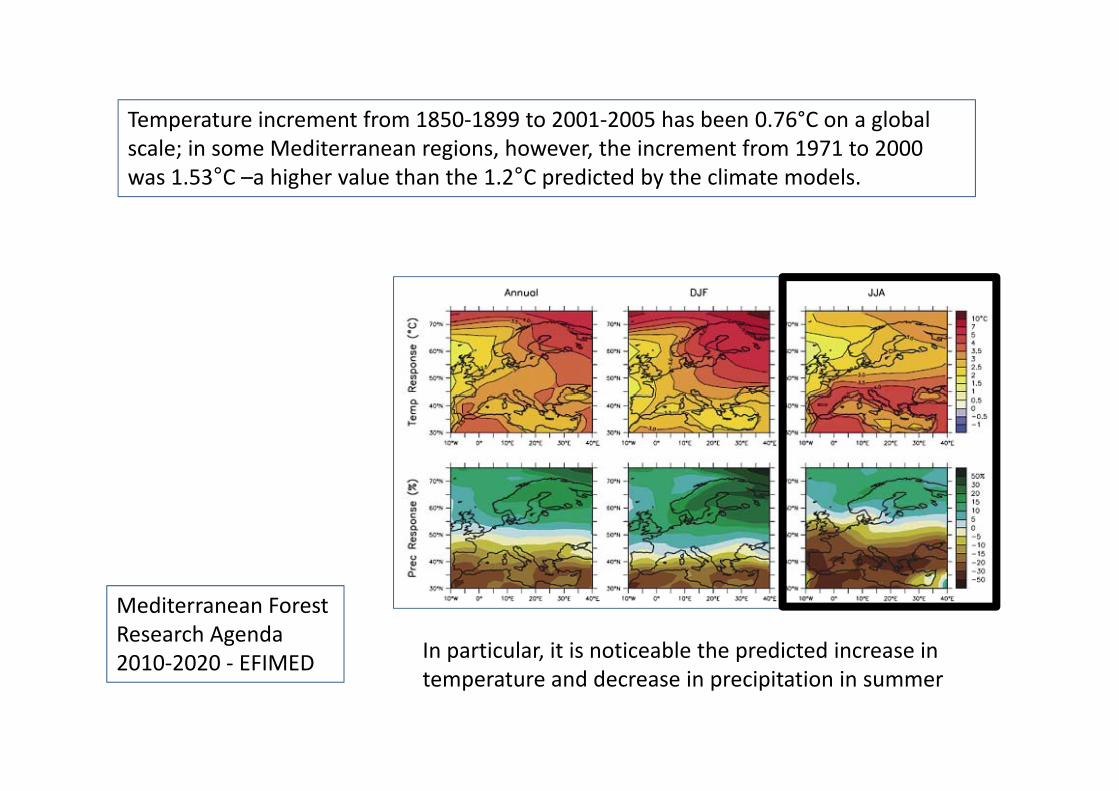
Temperature increment from 1850‐1899 to 2001‐2005 has been 0.76°C on a globalTemperature increment from 1850 1899 to 2001 2005 has been 0.76 C on a global scale; in some Mediterranean regions, however, the increment from 1971 to 2000 was 1.53°C –a higher value than the 1.2°C predicted by the climate models.
Mediterranean Forest Research Agenda 2010‐2020 ‐ EFIMED In particular, it is noticeable the predicted increase in 2010‐2020 ‐ EFIMED
temperature and decrease in precipitation in summer

Aridity has increased in the Mediterranean area during the last centuryy g y
Roquetas (Tarragona, Spain)1200
1100
1150
year
) Observed evolution:Aridity has increased. PET is higher
1050
1100
(mm/ Temperature
incrementGlobal scale: 0.76°C (1859‐99 to 2001‐05)
1000PET
( )Spain Mediterranean: 1.53°C (1971‐2000) (>1.2 °C predicted by models)
9501900 1920 1940 1960 1980 2000
models)
(Piñol et al. 1998)
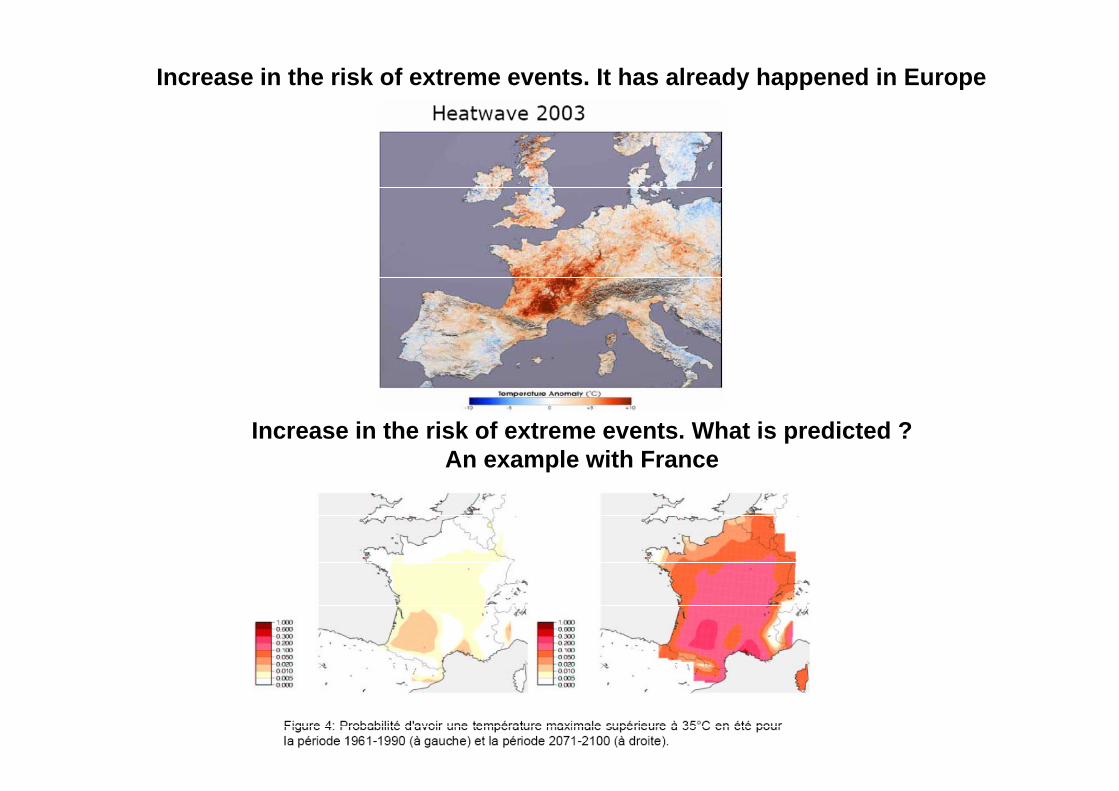
Increase in the risk of extreme events. It has already happened in Europe
Increase in the risk of extreme events. What is predicted ?An example with France

The limits of plasticity:predicted effect of climate change on tree distributionsp g
Predicted evolution of the geographic distribution of Fagus sylvaticag g p g yin France under climate warming (AURELHY climate model)
2050 210020502000 2100
Badeau et al. 2004. Carbofor projecthttp://www.nancy.inra.fr/extranet/com/carbofor/carbofor-D1.pdf

The Mediterranean forest: a threatened hotspot f di itof diversity
A biodiversity hotspot with over 11,000 endemic plants
• 52 putative refugia within the Mediterranean region (resulting from the analysis of the phylogeographical patterns of 82 plant species including 41 trees)the phylogeographical patterns of 82 plant species, including 41 trees) • 10 regional hotspots of plant biodiversity
(Médail & Diadema 2009 J. Biogeogr.)
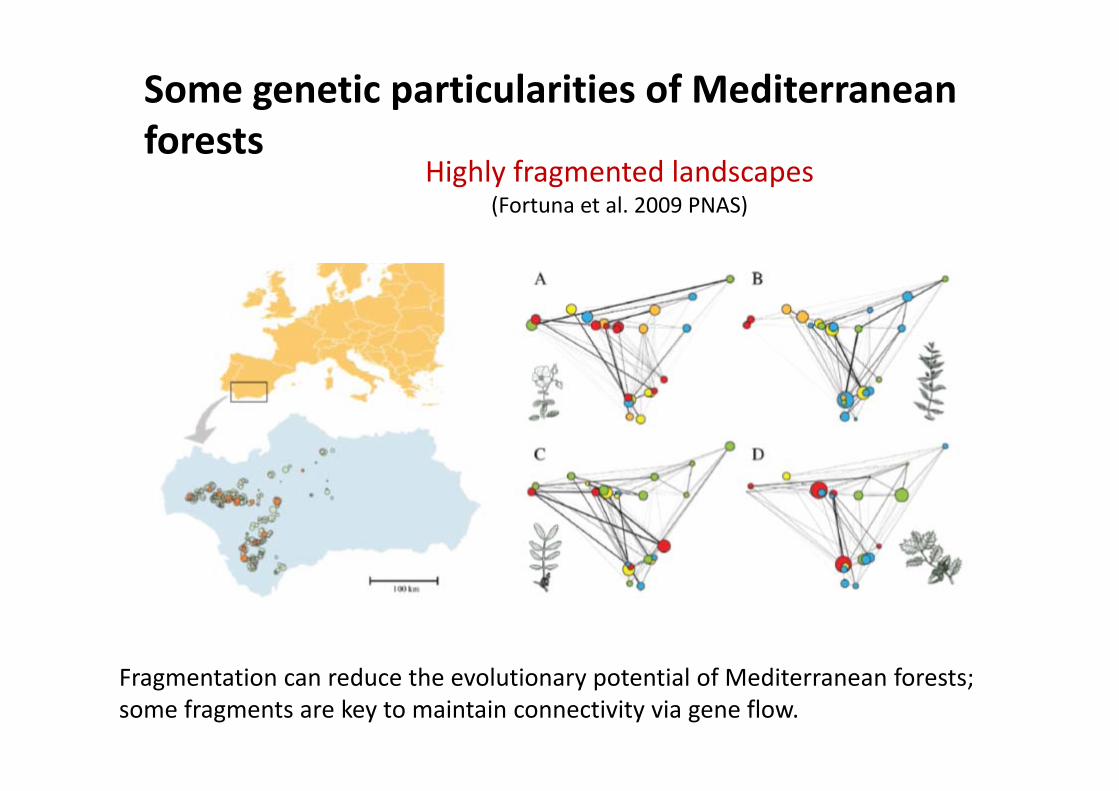
Some genetic particularities of Mediterranean fforests
Highly fragmented landscapes(Fortuna et al. 2009 PNAS) ( )
Fragmentation can reduce the evolutionary potential of Mediterranean forests; some fragments are key to maintain connectivity via gene flow.

Some genetic particularities of Mediterranean fforests
‘rear edge’ vs ‘leading edge’ populations(Hampe & Petit 2006 Ecology Letters)
Genetic variation at European southern limits (i.e. Mediterranean environments) may content relevant adaptations to warmer and drier conditions

Confronted with global change forest trees will have either to migrate or to adapt in situeither to migrate or to adapt in situ
Rates of spread of forest trees (<100 m/year) are far below what would be necessary (3,000 to 5,000 m/year) for species migration to track future climatic warming (Petit et al. 2008 i )Science).
Example: Spread rates in Mediterranean P. pinaster based on best‐fitting dispersalpinaster based on best fitting dispersal kernels from natural populations: just a few meters of forest advance per year!
Only in a scenario where trees have very high mean survival they would be able to track environmental optima (Nathan et al. 2011 Ecology Letters, f N th A i t )for North American trees)
Still, long‐distance dispersal may save the day!

Thus, forest trees will probably have to adapt in situ to survivesurvive
To adapt in situ, plant species rely mostly on standing genetic variation (and d ) h h l l fnot in de novo mutations), so that the level of genetic variation present in
natural populations is important.
Some advantages of trees are:Some advantages of trees are:
• They are undomesticated and still contain large amounts ofstill contain large amounts of genetic variation.
• Reaction norms from forest treesReaction norms from forest trees show high level of plasticity.
• Normally, tree populations have y, p pbig effective sizes (i.e. better response to selection).
(Wang et al. 2006 Global Change Biology, for Pinus contorta)

Complex system that results is significant population structure and opportunities for local adaptationand opportunities for local adaptation
Pinus pinasterCupressus sempervirens
Quercus suber
( l l l l )
Populus alba
(Bucci et al. 2007 Mol. Ecol.)
(Bagnoli et al. 2009 Mol. Ecol.)
(Magri et al. 2007 Mol. Ecol.)

Fagus sylvatica (Magri et al. 2006)

Fagus sylvaticaFagus sylvatica(Magri et al., 2006)

Taxus baccata
BAPS (Bayesian Analysis of PopulationAnalysis of Population Structure)
Geneland

Refugia are characterised by high di b t l l l f ithidivergence but low levels of within population diversity CYTOFORCYTOFOR
Petit et al., 2003

Intrapopulation diversity increases i di t l th f th thimmediately north of the southern refugia (admixture, hybridisation…) CYTOFORCYTOFOR
Petit et al., 2003

Pinus pineaThis tree has been used since ancient times
for timber, landscape architecture and for its large edible seeds Consequently it waslarge edible seeds. Consequently, it was extensively planted around the Mediterranean by Etruscans, Greeks, Romans and Arabs
Due to its intense cultivation since well before the pre-Roman age, its natural range is now difficult to circumscribe
Palaeobotanical records pre-dating its cultivation are very scarce, a possible indication that its large present-day distribution is of recent and artificial nature;distribution is of recent and artificial nature; however, macrofossils and charcoals indicate that P. pinea was present in Spain before the last glacial maximum and in Lebanon long before the coming of man
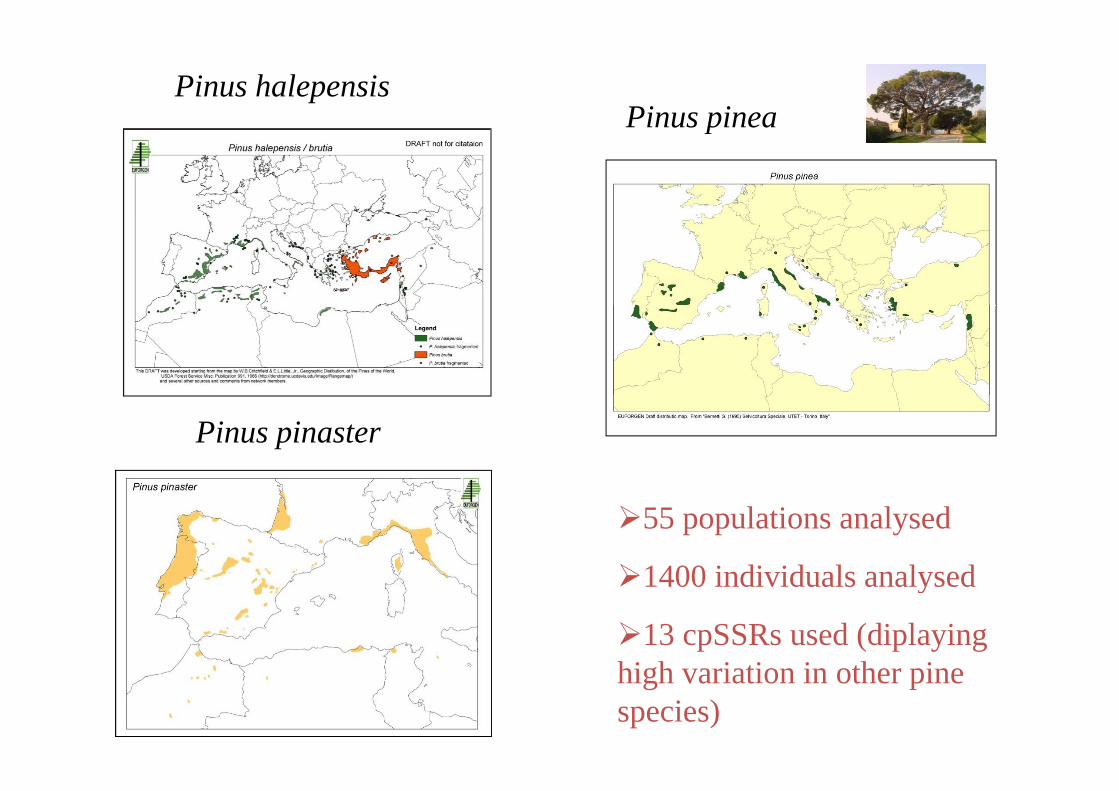
Pinus pineaPinus halepensis
Pinus pinea
Pinus pinaster
55 populations analysed
1400 individuals analysed1400 individuals analysed
13 cpSSRs used (diplaying hi h i ti i th ihigh variation in other pine species)

Chloroplast SSR variation in Pinus pineaVendramin et al. (2008), Evolution

Variation at chloroplast microsatellites in Pinus pineacompared to that in other conifers
Pinus pinea Other conifers1
Number of species 1 8Number of species 1 8Number of loci per species (>6 repeats) 13 4.9 Proportion of polymorphic loci2 23% 71% H (haplotypic diversity) 0.019 0.37 ÂÂ (mean number of alleles/locus) 1.23 4.62Â[100]
3 1.06 3.90 Â[100;10]
4 1.08 2.58 Mean number of repeats per locus 10 0 13 0Mean number of repeats per locus 10.0 13.0Maximum number of repeats 14.0 15.1 1 Data for eight species combined: Abies alba, Picea abies, Pinus brutia, P. cembra, P. halepensis, P. lambertiana, P. mugo and P. pinaster; see ref. 33.p g p2 Proportion of polymorphic loci computed without any threshold. 3 Mean number of alleles per locus in equal-sized samples of 100 individuals. 4 Mean number of alleles per locus in equal-sized samples of 100 individuals ft t d di ti t b f t l f 10after standardization to a mean number of repeats per locus of 10.
Vendramin et al. (2008), Evolution
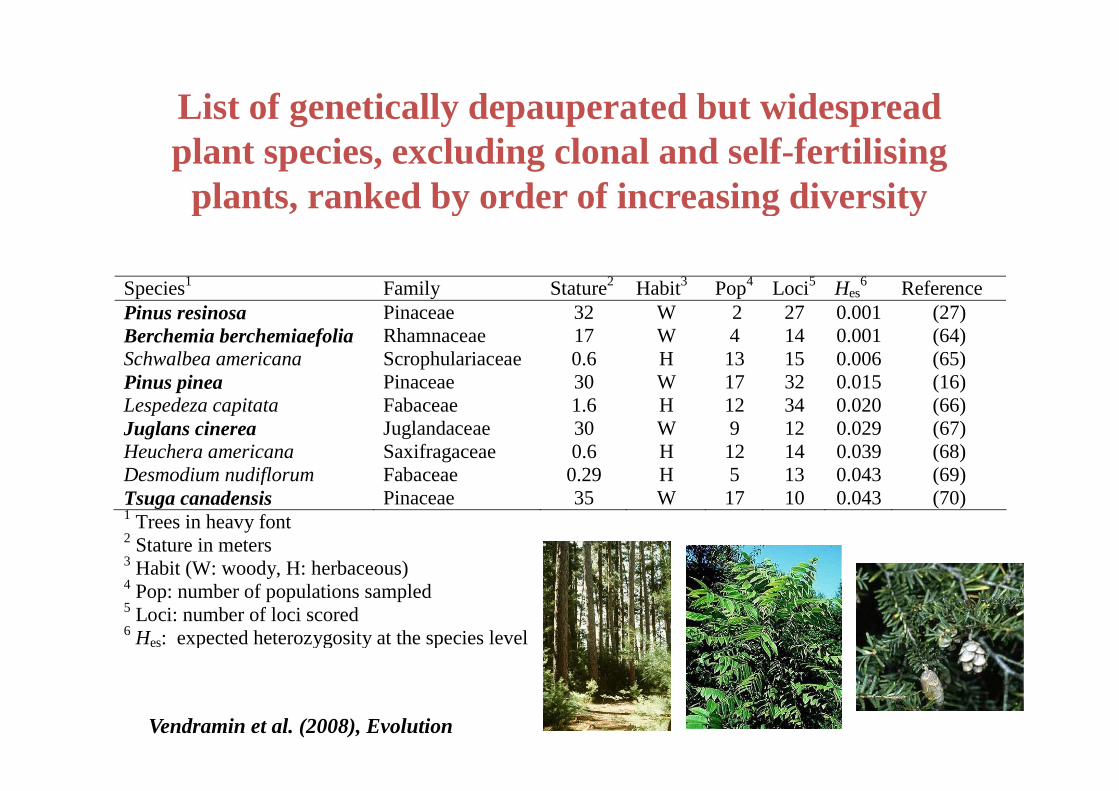
List of genetically depauperated but widespread g y p p pplant species, excluding clonal and self-fertilising
plants, ranked by order of increasing diversity
Species1 Family Stature2 Habit3 Pop4 Loci5 Hes
6 Reference i i Pi 32 W 2 27 0 001 (27)
p y g y
Pinus resinosa Pinaceae 32 W 2 27 0.001 (27)Berchemia berchemiaefolia Rhamnaceae 17 W 4 14 0.001 (64) Schwalbea americana Scrophulariaceae 0.6 H 13 15 0.006 (65) Pinus pinea Pinaceae 30 W 17 32 0.015 (16) Lespedeza capitata Fabaceae 1.6 H 12 34 0.020 (66)Juglans cinerea Juglandaceae 30 W 9 12 0.029 (67) Heuchera americana Saxifragaceae 0.6 H 12 14 0.039 (68) Desmodium nudiflorum Fabaceae 0.29 H 5 13 0.043 (69)f ( )Tsuga canadensis Pinaceae 35 W 17 10 0.043 (70) 1 Trees in heavy font 2 Stature in meters 3 Habit (W: woody, H: herbaceous)( y, )4 Pop: number of populations sampled 5 Loci: number of loci scored 6 Hes: expected heterozygosity at the species level
Vendramin et al. (2008), Evolution

This extreme situation is probably the result of a combination of factors that have acted in the same direction
fragmented rangefragmented range
mating system of the species
bilit t di dability to disperse seeds
human impact

Some genetic particularities of Mediterranean fforests Establishment of ‘neutral’ genetic clines
(i.e. due to historical factors)
Neutral clines (nuSSRs)One expanding
Historical factors are
gene pool
often confounded with adaptive clines tracking variation of
Admixture of two gene pools
environmental variables (e.g. variation of photoperiod withphotoperiod with latitude)
Taxus baccata L.

Traditional common garden experiments have provided valuable insights for Mediterranean treesprovided valuable insights for Mediterranean trees
• Large amount of genetic variation is contained within populations.• In addition, for most species there is also relevant geographical variation.• Good and relatively fast response to selection. • The local population is not always the one with the best performance.
Population phenotypic meansExample: P pinaster
350
400
450
500
550
350
400
450
500
550
TBSp27
F15T
FSp
Example: P. pinaster multisite combined provenance‐progeny tests
200
250
300
-27.2 -27.0 -26.8 -26.6 -26.4 -26.2 -26.0200
250
300
-27.2 -27.0 -26.8 -26.6 -26.4 -26.2 -26.0
δ13CWUE +-
M
Large variation between population performances and absence of simple relationship between WUE and biomassor height
WUE

Molecular approaches based on putatively f l k ( d d )functional markers (= candidate genes)
populations
P. pinaster
Mimizan
Coca
Arenas deSan Pedro
Imperia
Cabanellas
distribution
populations
distribution
P. halepensis
San Pedro
Pinia
Cabanellas
TarrasaOlba
Quatretonda
S’avallOriaCazorla
distribution
Tamrabta Aures Beni Melloul
Tabarka
EleaShaharia
OriaCompeta
Carratraca
ZaouiaIfrane
Sidi Meskour
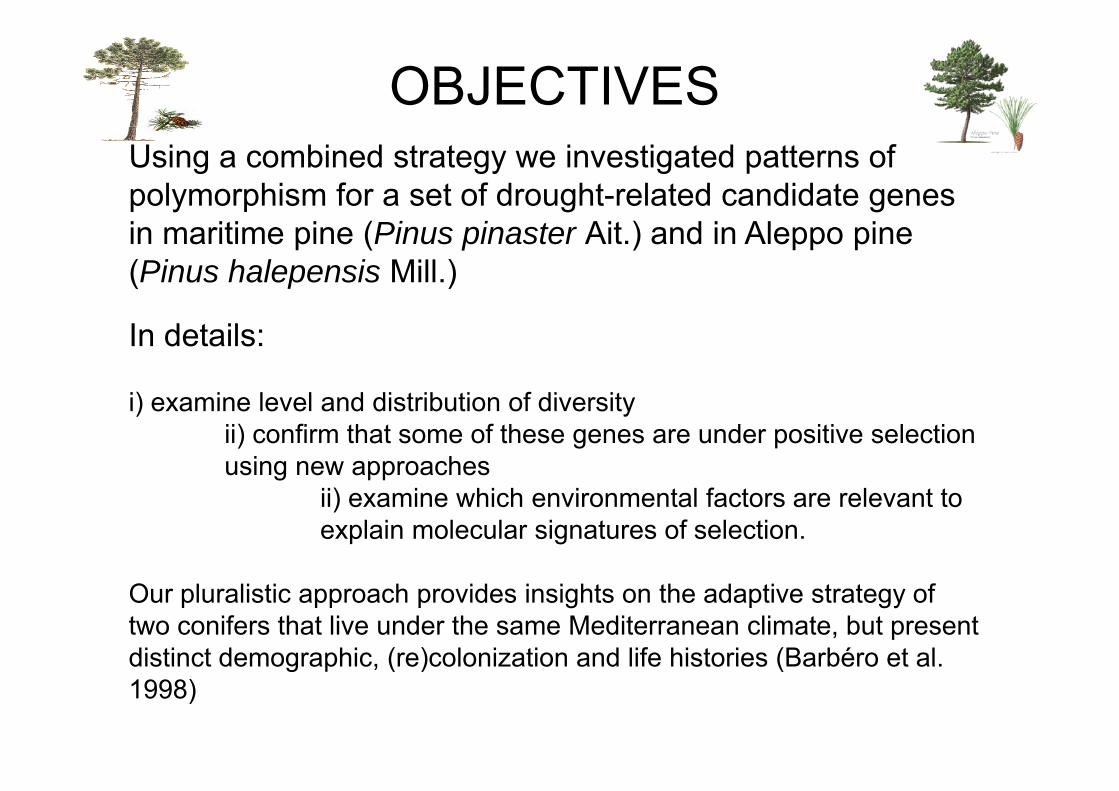
OBJECTIVESUsing a combined strategy we investigated patterns of polymorphism for a set of drought-related candidate genes in maritime pine (Pinus pinaster Ait.) and in Aleppo pine (Pinus halepensis Mill.)
In details:
i) i l l d di t ib ti f di iti) examine level and distribution of diversityii) confirm that some of these genes are under positive selection using new approaches
ii) examine which environmental factors are relevant to explain molecular signatures of selection.
Our pluralistic approach provides insights on the adaptive strategy of two conifers that live under the same Mediterranean climate, but present distinct demographic, (re)colonization and life histories (Barbéro et al.distinct demographic, (re)colonization and life histories (Barbéro et al. 1998)

Our model system: two widespread Mediterranean pines with contrasting demography: the Aleppo pine Pinuswith contrasting demography: the Aleppo pine, Pinus halepensis, and the maritime or cluster pine, P. pinaster
P. pinasterMimizan
CocaImperia
Arenas deSan Pedro
Pinia
Cabanellas
TarrasaOlba
Quatretonda
Tabarka
EleaShaharia
S’avallOria
CompetaCarratraca
Cazorla
Tamrabta
SidiMeskour
AuresBeni MelloulZaouiaIfrane
P. halepensis

Maritime pine is a paleo-endemic from the western
Aleppo pine is a relatively recent colonizer in this rangeendemic from the western
Mediterranean with marked population structure
recent colonizer in this range with less complex population structure
P. pinaster
P. halepensis
Italy
Algeria
Spain Greece
MoroccoIsrae
(Grivet et al 2009 New Phytol(Bucci et al. 2007 Mol. Ecol., based on cpSSRs)
(Grivet et al. 2009 New Phytol., based on cpSSR)
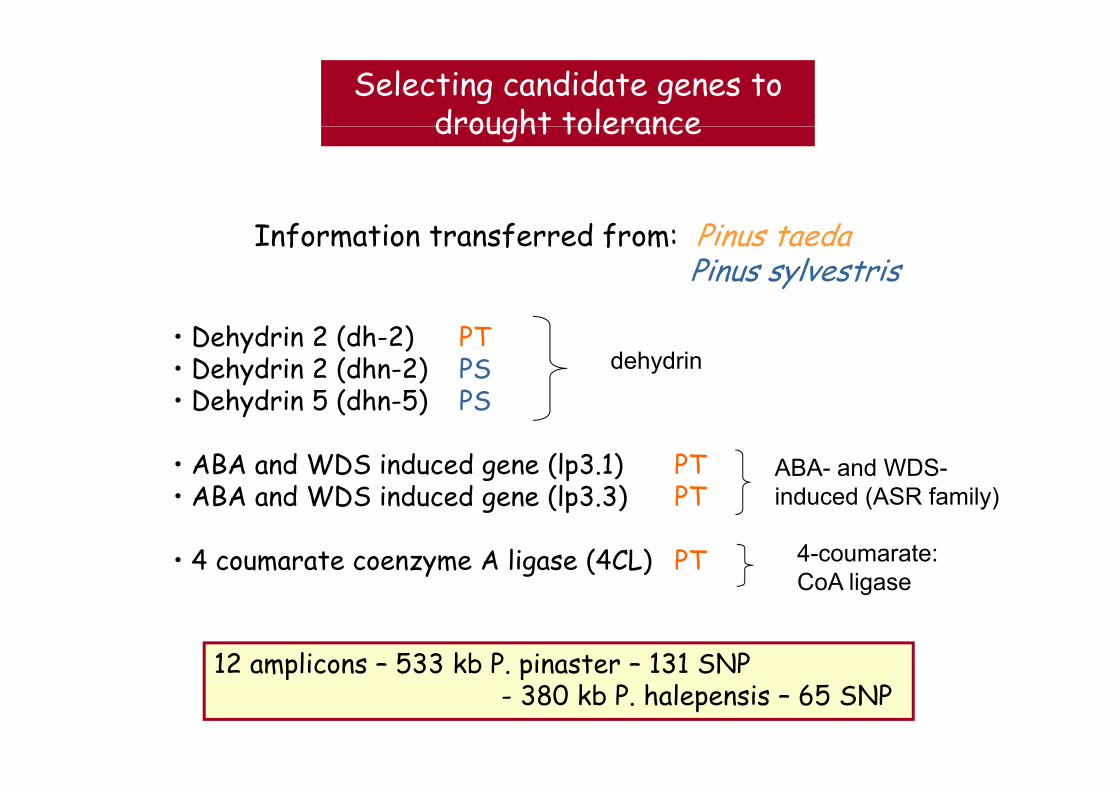
Selecting candidate genes to drought tolerancedrought tolerance
Information transferred from: Pinus taedaPinus sylvestris
• Dehydrin 2 (dh-2)• Dehydrin 2 (dhn-2)
D h d i 5 (dh 5)
PTPSPS
dehydrin
• Dehydrin 5 (dhn-5)
• ABA and WDS induced gene (lp3.1)B d D d d (l )
PS
PTP
ABA- and WDS-• ABA and WDS induced gene (lp3.3)
• 4 coumarate coenzyme A ligase (4CL)
PT
PT
induced (ASR family)
4-coumarate: C A li
y g
12 amplicons – 533 kb P pinaster – 131 SNP
CoA ligase
12 amplicons – 533 kb P. pinaster – 131 SNP- 380 kb P. halepensis – 65 SNP
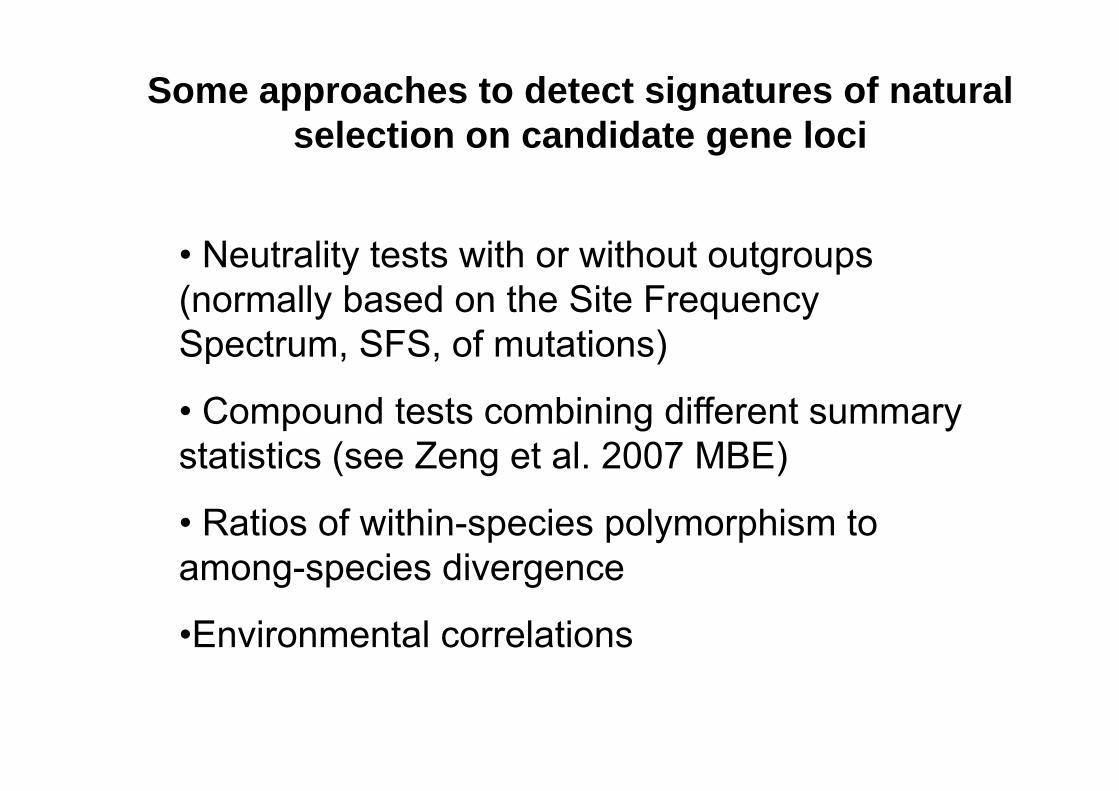
Some approaches to detect signatures of natural l ti did t l iselection on candidate gene loci
• Neutrality tests with or without outgroups (normally based on the Site Frequency(normally based on the Site Frequency Spectrum, SFS, of mutations)
• Compound tests combining different summary statistics (see Zeng et al. 2007 MBE)
• Ratios of within-species polymorphism to among-species divergenceamong species divergence
•Environmental correlations

Bottleneck followed by population growth (BM) model
Bottleneck followed by population growth (BM) model
Recent (t1=0.0005; ~15,000BP) and high-intensity (f=0.001) bottleneck
Recent (t1=0 0005; ~15 000BP) to old (t2=0 003;n = 1n = 1 Recent (t1=0.0005; ~15,000BP) to old (t2=0.003; ~90,000BP) and high-intensity (f=0.001) bottleneck
tpast = 1
npast = 1Past
i)tpast = 1
npast = 1Past
i)
Estimates:
•Tajima’s DF & W ’ H
nrec = 1
tpast = 0.0015npast
nrec
ii)
nrec = 1
tpast = 0.0015npast
nrec
ii)
• Fay & Wu’s Htpast
nrec = 1
npast
Present
iii)tpast
nrec = 1
npast
Present
iii)

Higher level of diversity in candidate genes for drought response were present in P. pinaster than in P. halepensis,response were present in P. pinaster than in P. halepensis, despite its narrower range in the Mediterranean

Pinus pinaster Pinus halepensis
4
2
3
4
gatin
g si
tes
0
1
Israel Italy Algeria Spain Morocco
Segr
eg
Ancient Recent
Populations by longitude
Ancient Recent
3
π x
10-3)
1
2
otid
e di
vers
ity ( π
0Israel Italy Algeria Spain Morocco
Populations by longitude
Nuc
leo
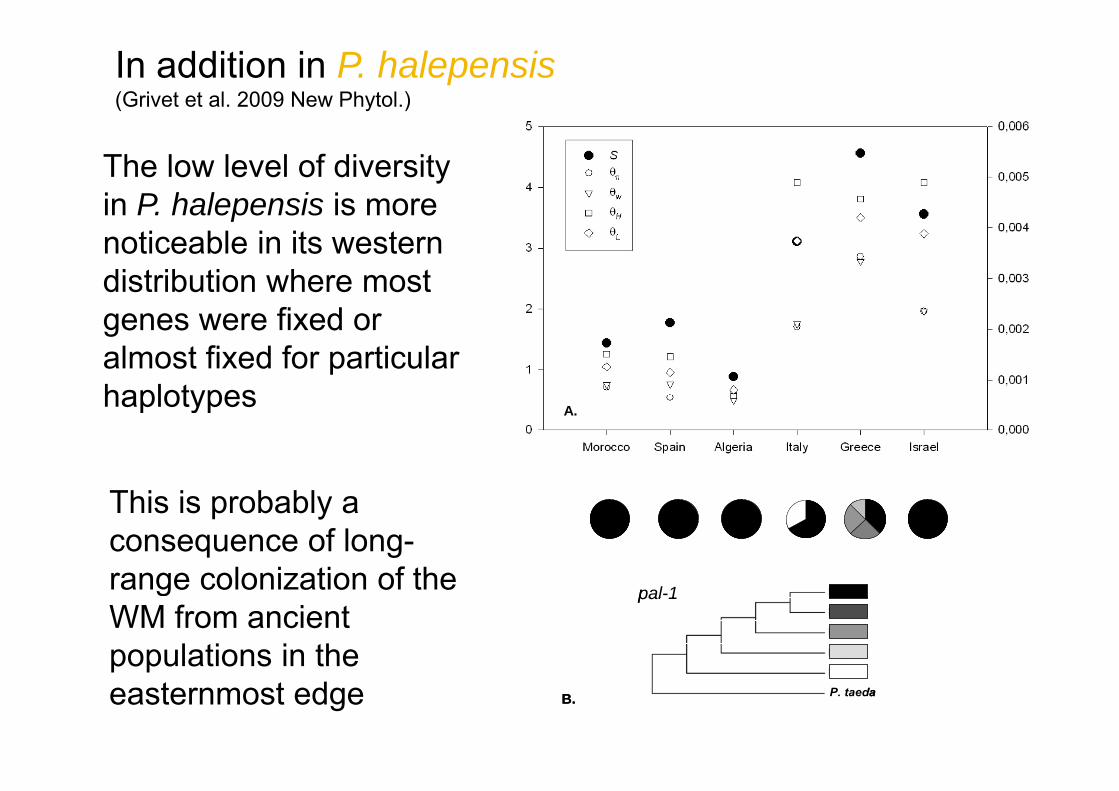
In addition in P. halepensis (Grivet et al. 2009 New Phytol.)
The low level of diversity in P. halepensis is more pnoticeable in its western distribution where most genes were fixed or almost fixed for particular haplotypes A.haplotypes
This is probably a consequence of long-range colonization of the pal-1pal-1range colonization of the WM from ancient populations in the
B. P. taedaB. P. taeda
populations in the easternmost edge

Demography and selection in Aleppo and maritime pines
Signatures of intense and very recent bottlenecks in Aleppo pine not so old as the one estimated for maritime pinepine, not so old as the one estimated for maritime pine
Maritime pine seems to pharbour large amount of diversity due to a more stable demography
In addition, because of its mesic distribution, higher environmental heterogeneity would have resulted inwould have resulted in contrasted selective pressure that may have increasedthat may have increased general levels of diversity
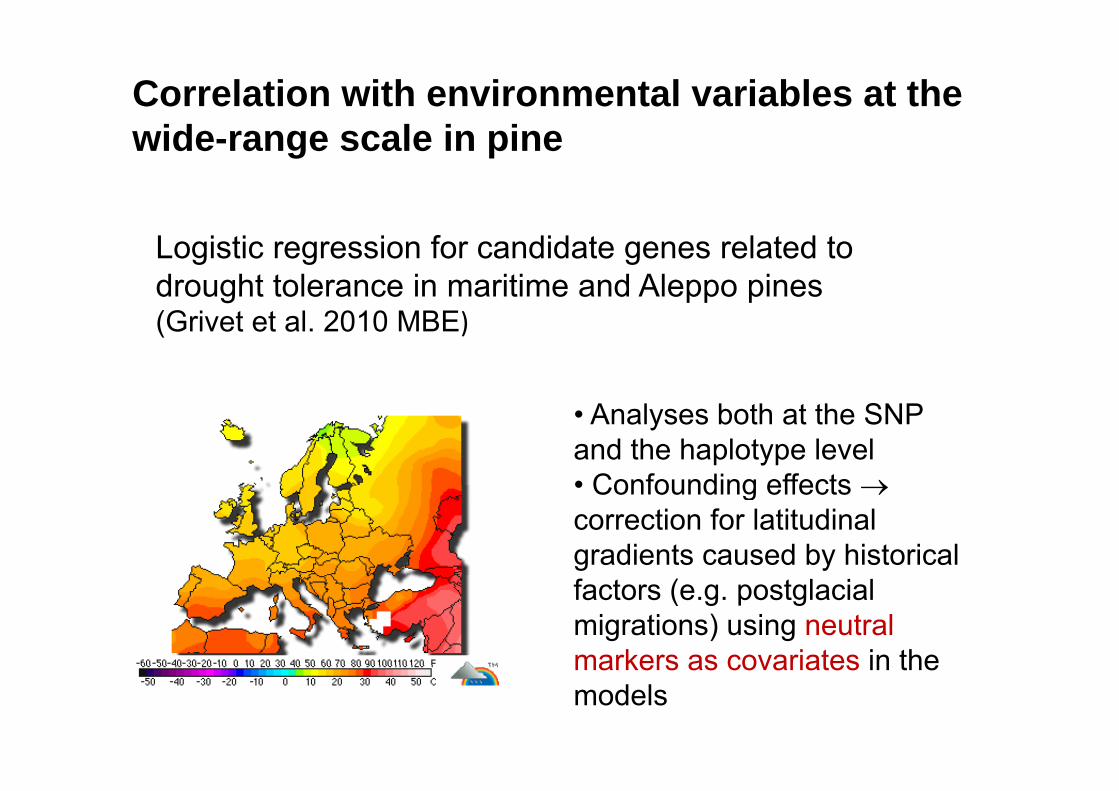
Correlation with environmental variables at the id l i iwide-range scale in pine
Logistic regression for candidate genes related to drought tolerance in maritime and Aleppo pines (Grivet et al. 2010 MBE)
• Analyses both at the SNP and the haplotype level• Confounding effects →• Confounding effects →correction for latitudinal gradients caused by historical factors (e.g. postglacial migrations) using neutral markers as covariates in themarkers as covariates in the models
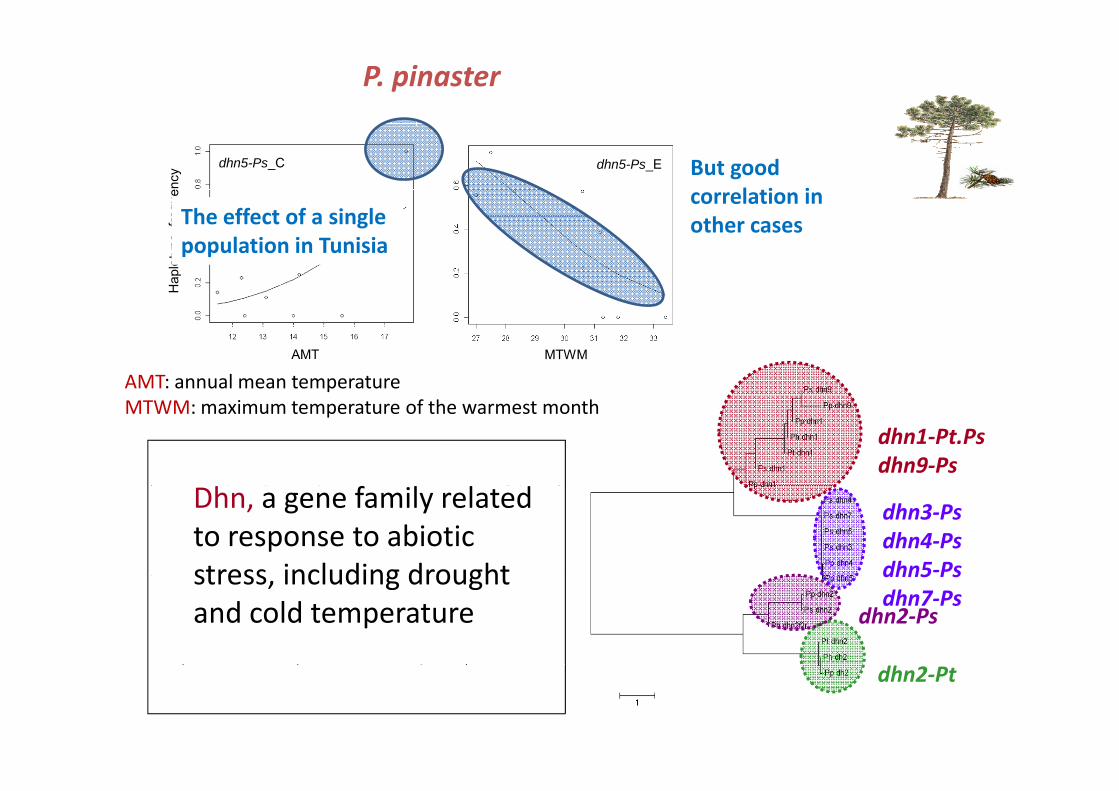
P. pinaster
dhn5-Ps_Ceq
uenc
y dhn5-Ps_E
The effect of a single
But goodcorrelation in
Hap
loty
pefreThe effect of a single
population in Tunisiaother cases
AMT MTWM
AMT: annual mean temperature
dhn1‐Pt.Ps dhn9‐Ps
MTWM: maximum temperature of the warmest month
dhn3‐Ps dhn4‐Psdhn5‐Ps
Dhn, a gene family related to response to abiotic stress including drought
dhn5-Ps C
dhn2‐Ps
dhn5 Psdhn7‐Ps
stress, including drought and cold temperature
_
dhn5-Ps_Eother haplotypes
And no geographical structure! dhn2‐Pt

P. halepensis 0 500 1000 1500 2000 2500
1
994
1410
1609
1697
1845
1934
2004
2385
2589
4cl-Pt_c_131nc
y
1 4 0 9 7 5 4 4 5 9
F4 R4 F3 R3 F2 R1A61 601 947 1454 1486 2003
F5 R3 F6 R6491 1956 2728
l k l
Alle
licfre
quen 4cl, a key gene in ligninformation (and other importantmetabolic processes)…
A
4cl-Pt_c_B
frequ
ency
Hap
loty
pe
TS
… found to be associated with wood properties in pine (González‐Martínez et al 2007 Genetics)
TS: temperature seasonality
(González Martínez et al. 2007 Genetics)

D Hnorm DHEW ML‐HKA Association P pinasternorm
lp31‐Pt_a
lp31‐Pt b
P. pinaster
lp31 Pt_b
lp33‐Pp
dhn2‐Pp_a Western Mediterraneanp_
dhn2‐Pp_b
dhn2‐Ps_a
North African
dhn2‐Ps_b
dhn5‐Ps
4cl‐Pt_a
4cl‐Pt_b
4cl Pt c4cl‐Pt_c
4cl‐Pt_d
5 amplicons potentially under selection
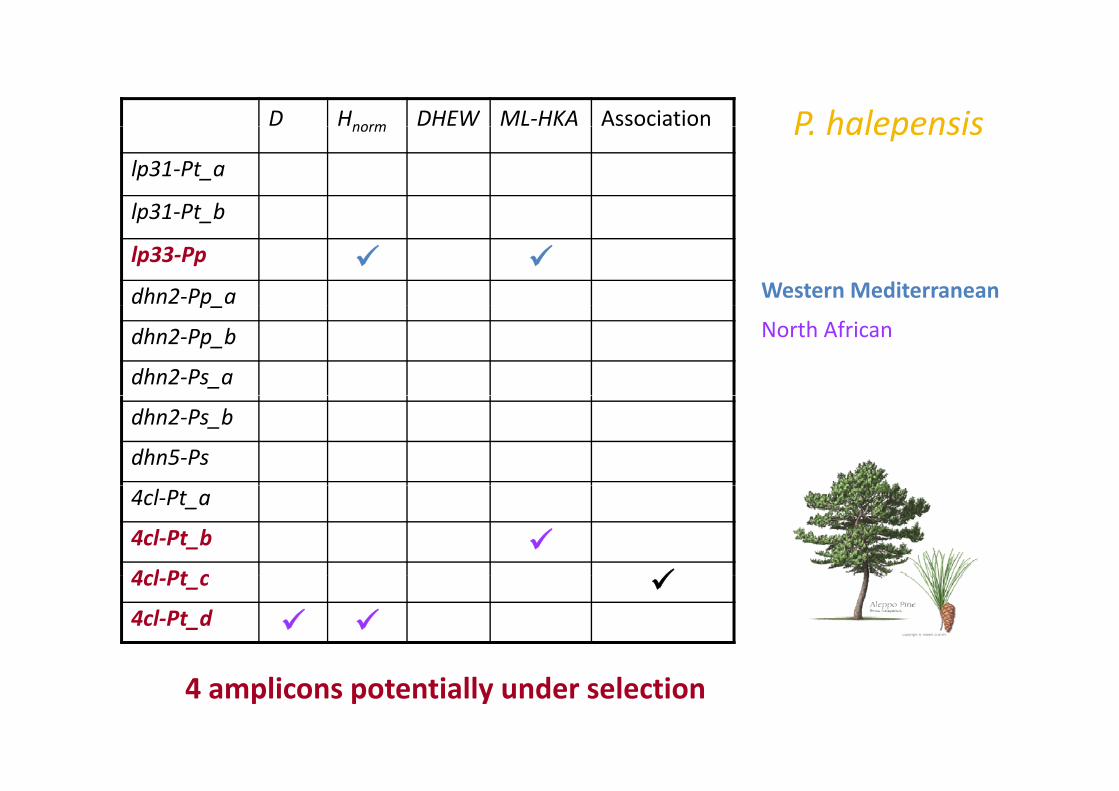
P halepensisD Hnorm DHEW ML‐HKA Association P. halepensisnorm
lp31‐Pt_a
lp31‐Pt blp31 Pt_b
lp33‐Pp
dhn2‐Pp a Western Mediterraneanp_
dhn2‐Pp_b
dhn2‐Ps_a
North African
dhn2‐Ps_b
dhn5‐Ps
4cl‐Pt_a
4cl‐Pt_b
4cl Pt c4cl‐Pt_c
4cl‐Pt_d
4 amplicons potentially under selection

Conclusions
• Multiple refugia located in southeastern Spain, northern Africa and the Atlantic coast of Portugal
• Restricted spatial range
• No loss of variation during recolonization
• Signatures of bottleneck
• Few refugia mainly located in Greece• Few refugia mainly located in Greece
• Wide spatial rangep g
• Loss of variation during recolonization
• Signatures of intense bottleneck

Conclusions
• Some of these events differ between th t i fl ti i di id lthe two species reflecting individual histories (recolonization, demography, adaptation)adaptation)
• Other events are shared whichOther events are shared, which translates partly as a common historyof these closely-related and partially y p ysympatric Mediterranean pines

Conclusions & perspectives
• Several approaches available → need basic knowledge on life-history traits, demography and population structure of the target speciesspecies.
• Environmental correlation approaches are promising to identify candidate genes and environmental variables relevant for local adaptation of tree populations.
• Combination with common garden experiments → association genetics. Development of a clonal population in maritime pine and
1536 SNP (EU N lT j t lt )a 1536-SNP array (EU NovelTree project, www.noveltree.eu).
• Use of HT-sequencing and new technologies (454, GAII, Illumina) q g g ( , , )to upscale research based on population genetics of candidate genes (see, for example, Turner et al. 2010 Nature Genetics). CRIEC (S González Martinez & G G Vendramin): 280 candidateCRIEC (S.González-Martinez & G.G. Vendramin): 280 candidate genes in 18 conifers.

Need to increase availability of genomic f d l iresources for non-model species
≠≠(Stapley et al. 2010 TREE)
High throughput (HT) Sequencing (454, GAIIx, Illumina) → An excellent opportunity for forest trees!
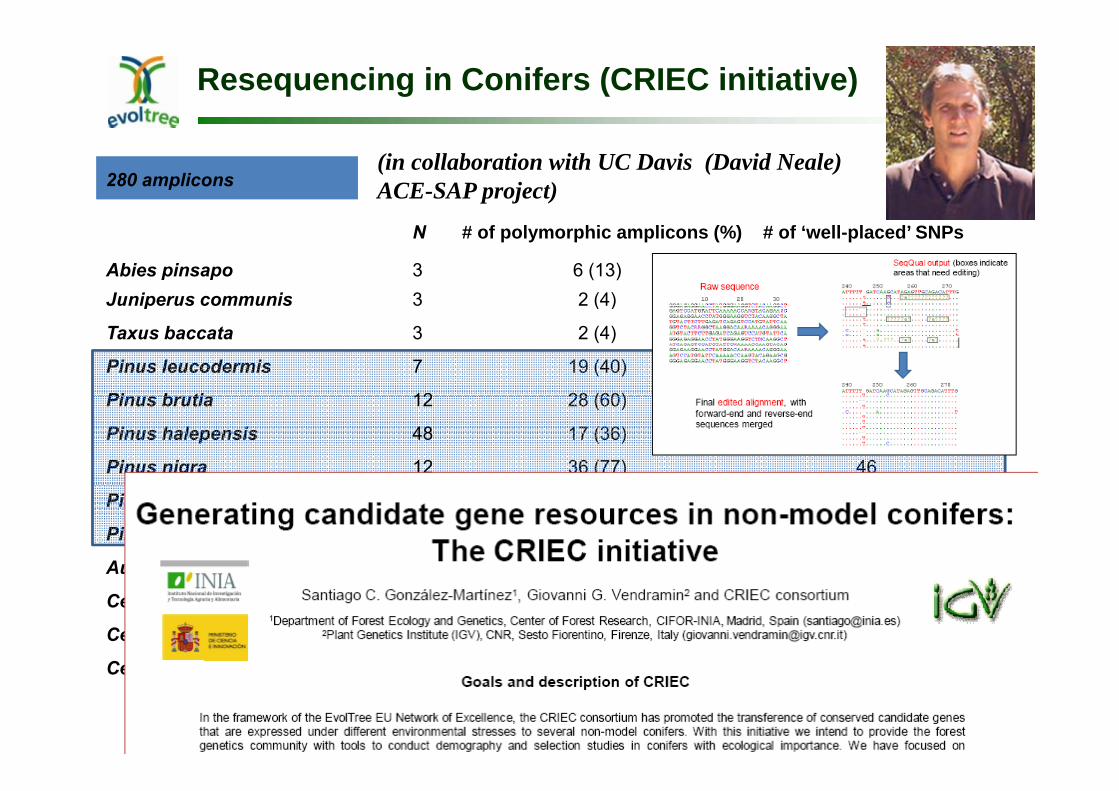
Resequencing in Conifers (CRIEC initiative)
280 amplicons(in collaboration with UC Davis (David Neale) ACE-SAP project)
Abies pinsapoJuniperus communis
6 (13)2 (4)
82
N # of polymorphic amplicons (%) # of ‘well-placed’ SNPs
33Ju pe us co u s
Taxus baccata
Pinus leucodermis
Pi b ti
( )
2 (4)
19 (40)
28 (60)
2
31
56
3
3
7
12Pinus brutia
Pinus halepensis
Pinus nigra
28 (60)
17 (36)
36 (77)
56
31
46
12
48
12
Pinus canariensis
Pinus pinea
Austrocedrus chilensis
35 (74)
9 (19)
4 (8)
80
12
4
12
12
3
Cedrus atlantica
Cedrus libani
Cedrus brevifolia
( )
2 (4)
13 (28)
20 (43)
2
16
29
4
4
4Cedrus brevifolia 20 (43) 294

Full genome andFull genome and transcriptome sequencing
Taxus baccata Pinus sylvestris
Pinus halepensis Pinus pinaster
FedericoBruno David
HadrienBruno David
Santiago
....and for your attention


![Identifying highly informative genetic markers for ... · crossbreeding schemes [6–9]. The introduction of im-proved Awassi (Afec-Awassi) to the local Awassi flocks managed by Bedouin](https://static.fdocumenti.com/doc/165x107/5f0b42907e708231d42fa298/identifying-highly-informative-genetic-markers-for-crossbreeding-schemes-6a9.jpg)


![SULYLQGHIHFWXDUHDGHVWXGLLFOLQLFHLIXUQL]DUHDGHPHGLFDPHQWHGHX]XPDQFDUHFRQLQ ... · 2020. 6. 17. · organisme modificate genetic sau care constau în organisme modificate genetic și](https://static.fdocumenti.com/doc/165x107/60cc89fdb1ddc156065c3442/sulylqghihfwxduhdghvwxgllfolqlfhlixuqlduhdghphglfdphqwhghxxpdqfduhfrqlq-2020.jpg)