
DIPARTIMENTO DI SCIENZE AZIENDALI -...
193
UNIVERSITÀ DEGLI STUDI DI BOLOGNA ALMA MATER STUDIORUM DIPARTIMENTO DI SCIENZE AZIENDALI ___________________________________________ DOTTORATO DI RICERCA IN DIREZIONE AZIENDALE - XIX CICLO TESI DI DOTTORATO PORTFOLIO STRATEGIES AND PERFORMANCE IN THE VENTURE CAPITAL INDUSTRY Candidato: Relatore: ALESSANDRO MALIPIERO Prof. FEDERICO MUNARI S.S.D. Coordinatore: SECS-P/08 ECONOMIA E GESTIONE DELLE IMPRESE Prof. MAURIZIO SOBRERO ING-IND/35 INGEGNERIA ECONOMICO-GESTIONALE ____________________________________________________________________ ANNO ACCADEMICO 2006-2007
Transcript of DIPARTIMENTO DI SCIENZE AZIENDALI -...
UNIVERSITÀ DEGLI STUDI DI BOLOGNAALMA MATER STUDIORUM
DIPARTIMENTO DI SCIENZE AZIENDALI ___________________________________________
DOTTORATO DI RICERCA IN DIREZIONE AZIENDALE - XIX CICLO
TESI DI DOTTORATO
PORTFOLIO STRATEGIES AND PERFORMANCE IN THE VENTURE CAPITAL INDUSTRY
Candidato: Relatore:ALESSANDRO MALIPIERO Prof. FEDERICO MUNARI
S.S.D. Coordinatore:SECS-P/08 ECONOMIA E GESTIONE DELLE IMPRESE Prof. MAURIZIO SOBREROING-IND/35 INGEGNERIA ECONOMICO-GESTIONALE
____________________________________________________________________
ANNO ACCADEMICO 2006-2007
INDEX
Introduction p. 1
1. Relevant literature on Venture Capital portfolio strategies and their performance. p. 51.1. The Definition of a venture capital investment p. 61.2. Portfolio strategy of Venture Capitalists: the p. 10 early studies on Diversification versus Specialization. 1.3. Conclusion and limits of early research. p. 18 1.4. Recent studies on the VCs portfolio strategies. p. 231.5. Conclusion and limits of recent studies p. 37
2. The performance of Venture Capital. p. 422.1. Factors affecting VC performance p. 452.2. Studies of returns. p. 512.3. Analysis of success rates. p. 562.4. Conclusions: what measure of performance should be used? p. 61
3. Research Framework and Hypothesis p. 653.1. The importance of portfolio strategies to Venture Capital. p. 703.2. The Financial Intermediation Perspective. p. 743.3. Conclusion on the financial intermediation perspective. p. 823.4. Resource-based theory. p. 863.5. Conclusion on the Resource-based theory. p. 903.6. Hypotheses. p. 95
4. Analytical Framework: setting and methods of analysis p. 1024.1. The raise and growth of Venture Capital in UK. p. 1034.2. Sample, Variable measurement and statistical approach. p. 109
4.2.1. The Sample. p. 1114.2.2. The operationalization of the dependent p.
114variable: VC performance.
4.2.3. The measurement of diversification strategy . p. 116 4.2.4. Operationalizing control variables. p. 1224.2.5. Statistical Approach. p. 123
5. The diversification of VCs’ portfolios and the impact on performance: p. 129analyses and results
5.1. The Dynamics of Venture Capital Funds in the UK p. 130
between 1981 and 2000.5.2. Interpretation of descriptive statistics and dynamics p.
1435.3. The impact of portfolio Diversification on fund Performance: p. 145
regressions and analyses.5.4. Robustness checks p. 153
5.4.1. Sample Selection bias p. 1535.4.2. The percentage of IPOs as an alternative p.
156measure of VCs performance.
Conclusions and limitation of the research p. 159- Contribution of the research p. 159- limitation of the thesis and direction for future research p. 164 on Venture Capital strategy
References p. 168
Appendix 1 p. 189
Introduction
Introduction
Venture Capital Funds invest in new (generally small) ventures with high risk
exposure and high growth potential, thus playing a fundamental role in fostering
national innovation and economic growth (Gompers and Lerner 2001, Kortum and
Lerner 2000, Callahan and Mueggue 2002). Academic studies on Venture Capital have
investigated over time a number of related topics. This research examines the many
strategies which Private Equity and Venture Capital Funds (hereinafter VCs) may use to
diversify their investment. I analyse the relationship between portfolio strategies and the
performance of a VC.
There is a large and growing literature analysing the return of venture capital
investments (Jones & Rhodes-Kropf 2003, Ljungqvist & Richardson 2003, Kaserer &
Diller 2004, Cumming & Walz 2004, Cochrane 2005, Kaplan & Schoar 2005). The
majority of these articles study the relative performance of VCs compared to public
markets. However, there is much less understanding about the impact of portfolio
strategies on the performance of VC. In this paper, I try to fill this gap by examining the
impact of diversification on the rate of positive return of VC funds.
Portfolio diversification is a particularly interesting issue in the Venture Capital
industry, where “generalist” funds (involved on many different markets) work alongside
funds concentrating their portfolios on specific industries, geographical areas and stage
of development (Cumming 2004, EVCA 2005, The Economist 2004). Among the many
possibilities of action, it has been seen that some large funds tend to circumscribe their
1
Introduction
activities by accurately choosing industries to include in their portfolios (EVCA, 2005;
The Economist, 2004), whereas other funds divide their organizational structure into
separate units devoted to specific business categories or industries within which to
develop and exploit specific expertise as a competitive advantage (Harper and
Schneider, 2004).
Although finance and strategic management researchers have increasingly
widened the scope of research on VCs, the latter’s portfolio strategies have been rarely
investigated (e.g. Norton and Tenenmbaum, 1993). Though, even if some previous
studies showed the existence of heterogeneity in the VC market relatively to managerial
approaches, preferences for particular stage of development of the supported deal,
business selection criteria (Robinson 1987, Norton e Tenenbaum 1993, Elango et al.
1995, Wright and Robbie 1998, Manigart et al. 2002), little attention has been paid on
how VCs cope with the composition of their portfolios. Surprisingly, little knowledge
exists as to how VCs develop their investments portfolio, even if the decisions
regarding investment scope are key issues for corporate strategy (Hofer and Schendel
1978). This research advances that VCs performance is influenced by the choices of
composition of their portfolio, along three possible dimensions: geographic dimension
(i.e. the geographic origin of the investee companies); the stage of development of
selected deals; the industry or technological field of the backed ventures.
This study suggests that VCs performances are contingent on their choices as to
the composition of their investment portfolios. Also, the decision determining the
composition of a fund and thus the level of diversification, plays a crucial role in its
2
Introduction
development, since it is a long-term strategic decision that is difficult to change. The
maximum amount a fund is allowed to invest in a single company as well as in certain
financing stages, industries, or countries is fixed in the partnership agreement with the
limited partners, i.e., the investors. A deviation from this agreement is only possible if
all limited partners approve. Hence, since the portfolio decision are difficult to change,
and have a deep impact on the VCs funds, we address the following question: does
portfolio-diversification lead to higher performance than portfolio-specialization?
This research aims at contributing to the literature dealing with the strategic
decisions and performances of VCs, calling into play the debate on whether a
diversification strategy is more or less effective than specialization. Exploring this
question may also contribute to the literature on corporate strategy in that it expand the
breath of corporations that are included in the analysis of how diversification and
specialization strategies affect performance. Understanding these issues contributes to
the debate on VC strategy and performance, by analyzing the different behaviours and
determinants of success of VCs, by comparing different stream of theory supporting two
competing strategies: portfolio diversification versus specialization.
The rest of this Thesis is organized as it follows:
Chapter I introduces the venture capital context and the relevant literature which
assessed the issue of portfolio strategy and venture capital performance.
Chapter II will directly address the question of factors affecting venture capital
performance, the difficulties in finding reliable proxies for evaluate funds’ return and
the solution offered from previous literature.
3
Introduction
Chapter III will present the analytical framework suggesting two competing
hypotheses relatively to the relationship between portfolio strategy and performance,
which are supported by two separate theoretical approaches: Financial Intermediation
Theory, support the idea that portfolio diversification is associated with better VCs
performance, while the Resource-based approach applied to the venture capital context
suggests that portfolio specialization should lead to higher performance.
Chapter IV firstly is dedicated to display the setting of the analyses, the UK
venture capital industry. The rest of the chapter discuss the methodological issues.
Sample selection, variables and statistical methods will be presented here.
Chapter V reports the analyses and results on the relationship between portfolio
diversification and performance. The first section of the chapter will show the dynamics
of sample funds and the emerging trends. Then the results and implication from
regressions will be presented. Also, robustness check will be reported to strengthen the
findings.
Chapter VI concludes the thesis and discuss possible avenues for future research.
4

Introduction
Aknwoledgements:
I am extremely grateful to everyone who was involved with the development of
this research. I wish to thank the Faculty of the Department of Management at the
University of Bologna, with those whom I share the years of my doctoral program.
Courses, seminaries and personal relationships helped me on developing ideas
contained within this dissertation.
But in particular I’m grateful to Professor Federico Munari, my advisor. He
helped me immensely by guiding me through all the steps of the project and sustained
me with insightful support in critical phases. His contribution to my education as a
research has been substantial.
Professor Maurizio Sobrero was my mentor. He first noticed my inclination and
passion toward Innovation Financing and Venture Capital, and fostered and encouraged
my development in different forms. The intellectual debt with him will remain
unbridgeable.
The questions of Professor Carlo Boschetti, the critiques of Professor Raffaele
Oriani, and the encouragements of Professor GianLuca Marzocchi improved
noteworthy this work, and my research skills as well.
Professor Robert C. Cressy honoured me with his time, his patience of my
mistakes, and his welcome and kindness at Cass Business School – City University of
London. I’m in debt with him for offering me the example of what to be a “researcher”
means.
5

Introduction
Thanks to all the PhD fellows of the Department of Management at the
University of
Bologna with whom I shared most of my time in the last three years. In
particular I want to mention Alessandra, Marcello and Marco. With them I learn to
laugh in difficult moments.
Special thanks to my family, for their patience and their encouragement. They
all supported me during these three years, even when they did not completely
understand where I was going.
Finally thanks to Cecilia. A light in the dark.
This dissertation is dedicated to her.
6
Chapter I
CHAPTER I
Relevant literature on Venture Capital portfolio
strategies and their performance.
In this section I will provide a synthetic review of the relevant literature dealing
with the portfolio strategies of VCs. First I will briefly describe what venture capital is
and how venture capitalists operate. Second I will discuss the literature which is most
related to the topic of this research, investigating on VCs’ portfolio strategies and
preference for particular type of investments. Then I will discuss later works that tried
to shed light on the relation between these decisions and VCs performance. For each of
these two groups of papers I will point out their findings and conclusions, as well as
their limitation and the paths of future research they have suggested. Finally I will
review the main literature on the performance of VCs. As it will be shown, this is a very
complicated issue, due to the general lack of available data on private transaction and to
the need to choose a robust proxy of the measure.
7
Chapter I
1.1. The Definition of a Venture Capital Investment.
A number of different definitions have been given for venture capital
investments, depending on the characteristics of the various parties involved. This
prolificacy of definition can be sometimes misleading: for instance in the United States
(US) “venture capital investment” refers only to investment in the shares of privately
held companies at an early stage of a company’s development, whereas in the United
Kingdom and continental Europe it refers to investment at all stages of a company’s
development. In this dissertation the UK and European connotation is used.
Venture capital investment consists in the purchase of shares of (young)
privately held companies by outsiders for the primary purpose of capital gain (Cressy
2005). Indeed venture capital is considered as a solution to financing high-risk, high
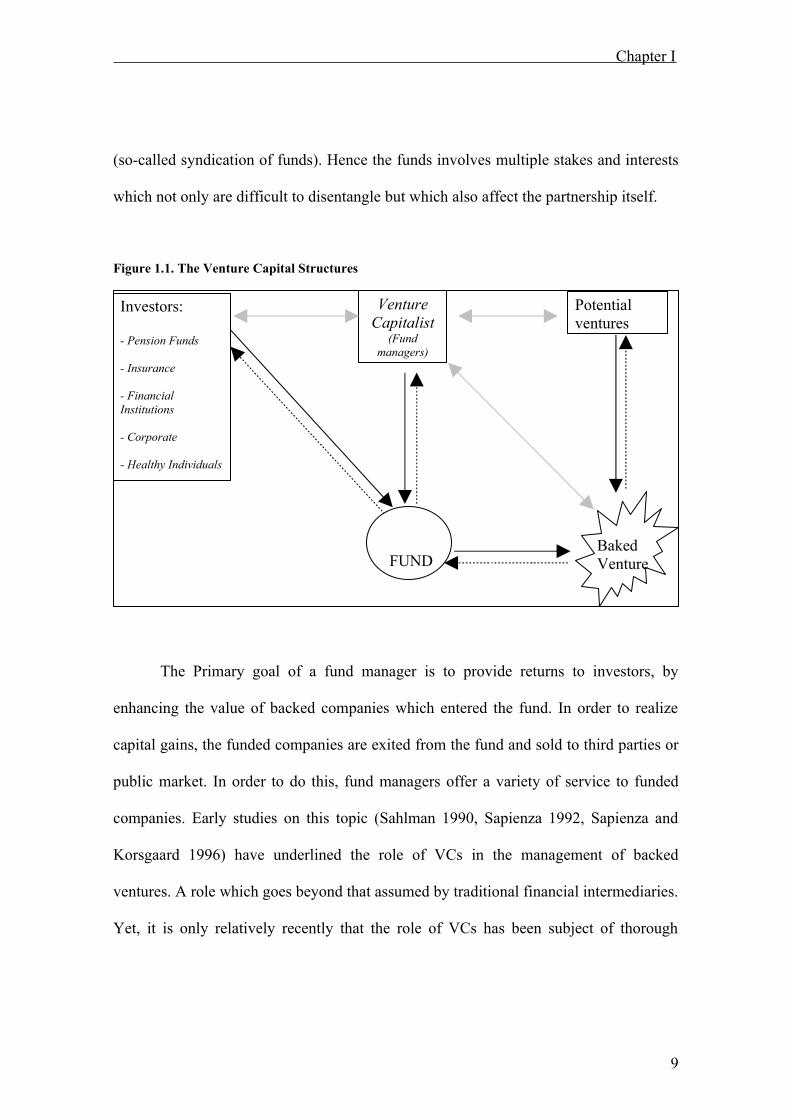
reward projects. Figure 1.1. represent the venture capital cycle.
A Venture Capital Fund (hereinafter VC) fund is a collector of financial
resources an a basket of funded companies (MacMillan et al. 1985). The creation of a
fund involves several entities (Murray and Marriott, 1998), being grounded on the
participation of two parties: on the one hand, the funded companies or entrepreneurs
and, on the other, a partnership between institutional entities (so-called: Limited
Partners) providing financial capital, and a venture capital managing firm (so-called:
General Partner) which professionally manages the fund (Bygrave et. al, 1989;
Chiampou and Kallett, 1989). It is very common that a fund is participated by a number
of limited partners and it is syndicated and run by a number of different general partners
8
Chapter I
(so-called syndication of funds). Hence the funds involves multiple stakes and interests
which not only are difficult to disentangle but which also affect the partnership itself.
Figure 1.1. The Venture Capital Structures
The Primary goal of a fund manager is to provide returns to investors, by
enhancing the value of backed companies which entered the fund. In order to realize
capital gains, the funded companies are exited from the fund and sold to third parties or
public market. In order to do this, fund managers offer a variety of service to funded
companies. Early studies on this topic (Sahlman 1990, Sapienza 1992, Sapienza and
Korsgaard 1996) have underlined the role of VCs in the management of backed
ventures. A role which goes beyond that assumed by traditional financial intermediaries.
Yet, it is only relatively recently that the role of VCs has been subject of thorough
Investors:
- Pension Funds
- Insurance
- Financial Institutions
- Corporate
- Healthy Individuals
Venture Capitalist
(Fund managers)
Potential ventures
FUNDBakedVenture
9
Chapter I
investigation, examining whether they act as mere intermediaries or as managing
companies capable of adding value to backed companies through their own expertise
and resources (Gompers and Lerner 2002, Hellmann and Puri 2002). It has been shown
that VCs provide assistance to new ventures by monitoring their financial and
operational performances (e.g. Gompers and Lerner 1999, Kaplan and Stromberg 2001);
moreover, they are highly involved in recruiting management teams (e.g. Elango et al.
1995, Hellmann and Puri 2002, Bottazzi et al. 2004), and in finding resources and
competences complementary to those of funded ventures (e.g. Brander et al. 2002), both
in terms of physical and relational capital and human resources (Sorenson and Stuart
2002); furthermore, they create incentive schemes connected with the economic
performances of funded companies’ managerial teams (e.g. Reid et al. 1997, Kaplan and
Stromberg 2003) and substantially contribute to the improvement of the latter’s
professional standards (e.g Kaplan and Stromberg 2003).
These are some of the strategies VCs display in order to make profit from the
companies they hold in their portfolios. Managing the portfolio of companies imply at
first the ability to create, select and develop a set of assets so that the VC partnership
can provide a remuneration to the investors for the risk they bear and the resources they
put at stake.
Hence portfolio management and VCs strategies relatively to portfolio decisions
is strongly related to their ability of adding value to their funded companies by having
access to complementary resources, sharing financial risks, getting access to a network
of managers, investors and investment opportunity (Brander et al., 2002).
10

Chapter I
In this sense, special attention has been given to the managerial competences
developed by VCs, assessing their role and level of participation in the management of
funded companies (Sapienza 1992, Hellman and Puri 2000, 2002). Such studies have
essentially subscribed two approaches: on the one hand, attention has been given to the
creation of adequate structures for the governance of relationships between venture
capitalists and backed companies; on the other, focus has been placed on a number of
processes for the management of different activities (Wright and Robbie 1998).
In the first case, the pioneering work of Sahlman (1990) has paved the way for a
theoretical approach essentially concerned with the screening and the evaluation of
business plans, and with the preparation of pay-off structures and contractual clauses
reducing VC firms’ risk exposure.
This dissertation, instead, is more in line with the abovementioned second
theoretical approach, which focuses on the strategic approaches displayed by VCs to
select and support funded companies (e.g. Bygrave and Timmons 1992, Fried and Hirsh
1994, Tybejee and Bruno 1994). This theoretical approach comprises different studies
which have examined the reasons behind the heterogeneity of VCs which affect their
managerial styles, their preferences for specific development stages of supported
ventures, and their strategic differences in selecting their operational scope in terms of
technological sectors and preferred countries in which to invest.
Although some studies have examined VCs’ strategic choices as to which
development stage is to be preferred when making investments (see e.g. Norton and
Tenenbaum 1989, Gupta and Sapienza 1992), little attention has so far been paid to how
11
Chapter I
VCs cope with different dimension along which they can choose between an investment
diversification or investment specialization strategy.
1.2. Portfolio strategy of Venture Capitalists: the early studies
on Diversification versus Specialization.
Dealing with the competition in the venture capital industry, the literature on
VCs has taken into account the variety of portfolio investments strategies (Elango et al.
1995, Wright and Robbie 1998). Given the heterogeneity of the field, some studies have
examined different kinds of VCs, identifying multiple managerial styles, investment
profiles, preferences for given fields and development stages of enterprises or ventures
requiring financing (Robinson 1987, Florida e Kennedy 1989, Elango et al. 1995,
Wright and Robbie 1998).
On the basis of such studies, some researchers have dealt more directly with
VCs’ choices in terms of diversification or specialization of their portfolio of
investments. Nonetheless, there still remains a relatively small number of studies
investigating the many differences between VCs portfolio strategies.
Moving from the recognition of a wide variety of strategies followed by VC
firms, some seminal papers started to analyse factors that might explain variations in
preferences in industry diversity, stage of development and geographic scope of
portfolio investments.
12

Chapter I
The finding of this early studies suggest that VCs focusing on early stage
investment tend to have a narrower industry and geographic scope of their portfolio than
VC firms involved in later stage investments, in order to accumulate specialized
knowledge and guarantee a greater involvement and assistance to the investee
companies (Gupta and Sapienza 1992).
Another important finding is that VCs managing larger funds tend to diversify
their portfolio much more than smaller firms. Furthermore the need to collect detailed
information in order to reduce uncertainty induces VCs to concentrate on industries they
are most familiar with. In particular, the high uncertainty characterizing early-stage
companies induces VCs to include a small number of companies in their portfolio and
to specialize in given industries (Norton and Tenenbaum 1993, Elango et al. 1995).
VC firms tend also to specialize in specific development stages, in which their
acquired expertise can produce greater value (Carter and Van Auken, 1994).
This initial stream of literature on VCs choices relatively to portfolio
composition faced for the first time the issue of heterogeneity between VCs. In
particular these scholars focused on the heterogeneity of VCs, by looking at their
strategic approach relatively to the management of their portfolio of assets, the
availability of resources and the their role in adding value to investment companies.
Gupta and Sapienza’s work (1992) examined the investment strategies of 169
US based VCs between 1980 and 1989 in order to identify factors that might explain
variations in preferences regarding the industry diversity and the geographical scope of
13
Chapter I
their investments. More interestingly this study is one the first attempt to explore the
portfolio strategies on a multiple level basis. Gupta and Sapienza investigate on how
the risk-lowering pressure induces VCs to implement different strategies to their
investment portfolio composition, relatively to their preferences regarding the stage of
development of selected deal, the industry spread of investee portfolio companies and
the geographic breadth of VCs operations.
Their basic assumption is underpinned on the hypothesis that variations in VCs
preference regarding portfolio composition of their investment along the industry and
country dimensions are a function of the preferred stage of development at which to
make the initial investment.
Their main findings suggest that VCs that specialize in early-stage development
investments are more keen to lower levels of industry diversification and tend to prefer
narrower geographic scope, relatively to those who invest in later-stage of development
ventures.
The importance of this findings is much more in what can be conclude on the
strategic behaviour of VCs. Indeed the fact that the effect of stage-of-development
decisions have on preferences regarding industry and geographical scope of VCs
portfolios is of particular interest as it sheds light on what value VCs might add to their
role as conduits of investors capital to investee companies. The authors assumes that,
because of the high risk-specific nature of the VC investing activity, the first decision in
order to control for the risk of their activity has to be taken along the stage of
development dimension. Then, given that VC who specialize in early-stage deals show
14
Chapter I
their keenness for narrower industry and geography scope, the authors also suggest that
their findings reinforce the notion that VCs are more than just providers of financial
capital. On the opposite, they add value to portfolio companies and thus increase VC
performance.
They also propose two possible explanations about the value-added hypothesis.
VCs may have superior selection capabilities. VCs who focus on early stage ventures
possess specialized knowledge, which enable them to make more effective decisions
regarding the selection of ventures to be funded. Hence the value added by VCs is much
more embedded in their “picking the winner” abilities (Baum and Silverman 2004) then
in their development skills. The other explanation also involves the ability of VCs to
improve risk-return characteristics of their backed companies.
Hence, VCs who focused on early-stage investment prefer narrower industry
and geographic scope, for they can thus provide industry-specific knowledge, external
contacts and strategic and management advices to the investee companies thereby
improving their risk-return characteristics.
Adopting Baum and Silverman words, some VCs might be able to show better
results by acting both as “scouts” of potential profitable companies, in recognition to
their ability to identify growing ventures which are more likely to show increasing
future value; and as “coaches”, in recognition to their ability to provide funded
companies bundle of assets and resources that encourage and trigger their growth.
15
Chapter I
Norton and Tenenbaum (1993) achieve similar conclusions. By using data
collected by means of postal questionnaires, the authors evaluated a number of
suggestions on the many strategies orienting VCs’ choices as to the composition of their
portfolios in order to assess how risk exposure is managed thereby.
They argue that essential to VCs’ performance is the control and management of
portfolio risk. VCs have hence developed multiple instrument for controlling risk, as for
instance by structuring the financing in different and subsequent stages and by relying
on very strict and detailed ex-ante covenants (see also Kaplan and Stromberg 2001).
The authors suggest that a powerful tool VCs have to control for risk exposure, include
portfolio diversification. Spreading the risk by investing in different markets and
countries VCs can minimize investment specific risks. On the other hands, they also
showed that many VCs seems to rely on specialization into particular investment types,
so that information sharing, gaining access to networks and deal flows, acquiring
reputation in the investing community can also be used to control for unsystematic risk.
Their analysis conducted on 98 enterprises suggests that the need to collect
information so as to reduce uncertainty induces VCs to concentrate on industries they
are most familiar with. In particular, the high uncertainty of the early growth stages of
deals induces VCs to include a small number of companies in their portfolio and to
specialize in given industries. Conversely, VCs engaged in later development stages
prefer to spread out their involvement across different industries.
The fact that investors in early-stage deals seems less diversified across industry
and country lead the authors to conclude that the assumption of complete diversification
16
Chapter I
is not appropriate in the context of VCs. In this circumstances of high uncertainty, VCs
are more likely to rely upon their expertise to specialize in certain technical and product
areas. Due to their information advantage in said technologies and markets, and the high
fixed costs of gaining expertise in other domains, it does not make economic sense for
them to seek portfolio diversification.
Other scholars were involved in researching on the heterogeneity of VCs.
Elango et al. (1995) study the source of heterogeneity among VCs.
Through a questionnaire-based data gathering method, they obtain data from
about 150 VCs in Nothern America, and point out that VC differ on several dimension,
which they group into four different areas: venture stage, staff assistance, size and
geographical heterogeneity.
The authors asked to a number of US based VCs information on these four
dimension until the year 1989. Relatively to this present dissertation more interesting
are above all the dimensions regarding the stage of ventures in which VCs invest, and
the geographical scope of operation.
Consistently with prior studies, Elango et al. found that earlier stage investors
are much more interested in focusing on smaller number of ventures within similar
product characterized by technological novelty and with high growth potential, while
later-stage investors look for companies that offer market-proven product, regardless to
the type of market relatedness between backed companies’ businesses.
17
Chapter I
At the same time, VC that are more concerned with later stage and buy out deals,
are also more likely to open subsidiaries in other parts of the US in order to search for
potential investment in other geographical areas rather than focusing on their domestic
territory, while for instance VC focusing in early-stage high-tech investment in the
Silicon Valley.
In other words, Elango et al. reach similar conclusion of previous work, where it
seems that VCs who specialize in early stage ventures tend to prefer less diversity in
terms of industry and geographical scope of their investment portfolio.
Also Carter and Van Auken (1994) are interested in investigating on the
importance of companies’ stage of development in investors choices.
In particular, while previous works have examined the relative significance of
various evaluation criteria for venture capital projects, there has been no attempt prior to
Carter and Van Auken study to investigate on the relationship between evaluation
criteria and the investment preference of the VC.
The authors argue that one of such preference involves the stage of development
of founded companies. They look at the stage of development of backed companies as
one key criteria VCs employ when selecting the deals they are willing to invest in. They
used a postal questionnaire approach and collected information on 69 US based VCs
during the years 1980-1989.
Their findings reports that VCs prefer to invest in business prior they reach a
mature phase, and that VCs investing in earlier stage of development declare to be more
18

Chapter I
involved as active manager in their companies, than those preferring later stage
investments.
As an explanation for this pattern of strategic choices, the authors employ the
same rationalization scheme of Gupta and Sapienza (1992) and Norton and Tenenbaum
(1993), supporting the view that specialization strategy is an important strategic means
that VC can display in order to control for unsystematic risk and uncertainty. In other
words, since the information on funded companies and market expectations are likely to
be a function of the company’s stage of development, it is reasonable to expect that
investors might specialize in specific stage of development where expertise in
evaluation may be more valuable.
Carter and Van Auken found evidence suggesting that the stage of development
of the companies in which the VC invests is of absolute relevance to investors.
Moreover investors who appear to prefer investments in their early stages are less
interested in the management of risk and of the endeavour than later stage investors, and
more willing to exercise control over the project by employing an active management
approach, for instance by spending more time in the selection process and by replacing
management as the need arise.
Finally and very important for the purpose of this dissertation, Carter and Van
Auken’s paper is one of the first attempt to look at the impact that strategic choices of
VCs have on their ability to perform. Their work suggest that preferences about the
stage of development of investee companies are also related to the investor’s strategy to
realize value from its investments.
19

Chapter I
Since the ultimate goal for the investor is to find a profitable exit from the
venture, VCs can be very concerned about the probability of success of this effort. This
probability is linked to the future prospect of liquidity of the investment.
In other words, the probability for a VC to experience a favourable exit has a
direct relationship with the probability to cash-out the investment. On the other hand,
since a positive exit can be made only via third sale of the backed company to another
investor and/or another organization, or by taking the founded company into the public
market via initial public offering (IPO), the probability to liquidate the investment is
also affected by the stage of development of the investment. Using responses from their
sample questionnaire, the authors thus shows that later stage investors pretend to be
much concerned about liquidity then their early stage investor peers. Also early stage
investors seem to favour the IPO as a means of exiting the project, than later stage VCs.
Two basic assumption are suggested here: the first one is that the probability of
positive exit through third sale are higher than the probability of positive exit from IPO
(Kaplan and Stromberg 2001). The second one is that the probability to obtain bigger
excess return from investee companies is higher if the companies are taken to the public
market than if the they are sold to another (private) counterpart (Gompers and Lerner
2001).
20
Chapter I
1.3. Conclusion and limits of early research.
These papers are the first attempt to tackle the issue regarding the way VCs cope
with their portfolio strategies, in order to deepen the understanding of the heterogeneous
strategic behaviour of VCs relatively to the managing of their companies in relation
with the decisions on the composition of their portfolio. These scholars have linked the
topic of investment strategy of VCs and the problem of portfolio management.
Interestingly, one can track several common themes which characterise the early
research. First of all, from all of these studies it emerges a tangible utility which
explain the need and the purpose of investigating this issue, that is: VCs have to employ
and display portfolio strategies in order to face and manage the risk-return issue of their
investments.
Moreover, it is generally reckoned that there are two possible theoretical
approaches among which a VC can choose in order to mange the risk-return issue: by
focusing the portfolio of investment along some strategic dimension, either spreading
the number of investments along these dimensions. In almost all of these studies the
strategic variables along which a VC can gauge their portfolio strategies and success are
the degree of specialization/diversification relatively to the stage of development of
their portfolio, the industry and geographic scope of their basket of investments.
Relatively to the specialization versus diversification approaches, the first one
apply to the benefit of specialization, that is the possibility of information sharing and
21

Chapter I
replication, the development of expertise and key resources and capabilities that can be
redeployed on a number of subsequent or contemporary investments.
The second approach rely on the benefits of portfolio diversification, which
apply on financial theory and address the issue of risk-return of a portfolio of
investment arguing that by diversifying the asset of a portfolio, the unsystematic risk
can be reduced with, benefiting the performance.
The pattern of portfolio decisions for VCs are modelled by these authors with a
common strategic starting point, or priority strategic dimension, which is the choices
regarding the preference for the stage of development of target companies, as if the core
feature which distinguishes the VC business from other type of economic activity is
concealed within the particular choice of the stage of development. It seems like this
early stream of research considers that the choice of regarding the stage of development
in which a VC operate is taken for granted by VCs. I suggest that this is because of the
undeniable difference which the stage of development of a venture entails. For instance,
an investment in the seed stage typically involve a start-up with no track of previous
activity, generally developing concept-products or offering or producing new products
and services in new markets, and unable to predict future steadily flows of sales neither
of profits (Tyebjee and Bruno 1984).
On the other hands, an investment in the buyout stage typically concerns a
developed company as deal target, with a track record of sales and a history of profits,
which needs to finance its growth and development plans. One can easily think about
differences in risk and needs that such different stages of development required from a
22
Chapter I
VC to be managed. The important point is the following: as it appears from these
mentioned seminal studies, because of the intrinsic difference in risk and abilities
needed to operate in diverse stage of development deals, once a VC decide how to
position itself along this dimension, the particular chosen stage demands subsequent
patterns of choices regarding the degree of specialization of diversification along the
industry and geographic dimensions.
Finally, these seminal contributions achieve common findings. It is commonly
acknowledged the view that early stage investors tend have more focused investment
portfolios along the industry and the geographical dimensions, than the later stage ones.
These seminal contributions opened an important and interesting avenue of
research regarding the understanding of VCs strategic behaviour and the different
approaches they display relatively to portfolio management.
One of the limits of these first studies is that their findings rely upon small
sample, drawn from only US, in the early years of Venture Capital. Gupta and Sapienza
perform their analyses on a sample of 169 US-based VCs, while Norton and
Tenenbaum’s sample counts for 98 respondent US-based VCs; Elango et al. perform
their study based on 149 responses; Carter and Van Auken rely on 69 VCs. This suggest
caution on generalization of their findings: for instance the papers look at the
phenomenon only in US. Yet it worth to say that during the ’80s, the Venture Capital
industry was much more active in US than in the rest of the world. But more recent
research show that the bulk of VC raise is to be set in the ‘90s, where not only the US
23
Chapter I
players have enormously grown in terms of numbers and volume of activities, but some
scholars talk about a real boost in the Venture Capital industry (Gomper and Lerner
2001, Bottazzi et al. 2004) thanks to the huge development of these industry in Europe
and in the Far-Eastern markets.
Hence, we might have a limited perception on what is the behaviour of VCs
from these later works, since many years have passed from this early contributions, the
Venture Capital market developing worldwide and shaping its features.
Moreover, given the severe limitations on the public availability of data on VCs,
these studies used survey-based data. In any survey there is a trade-off between the
eliciting of responses and collecting sufficient information (Carter and Van Auken
1994). These studies focused on the investment preferences rather than the actual
patterns of VCs (Gupta and Sapienza 1992). While we can expect a high correlation
between investment preferences and actual strategies there is an empirical need to
support this expectation. Some of the authors point out that from their responses it
emerged different preferences relatively to the industry and geographical scope of their
investment, from companies which showed similar preferences regarding stage of
development (Elango et al. 1995). Some VCs focus on specific industries, whereas
others do not, and this seem to be a significant factor although not tested (Bygrave and
Timmons 1992). This is a call for the need to investigate on the actual portfolio
strategies of VCs, not only on their past preferences, and to model the interaction of the
possible variable along which a VC can choose its diversification or specialization
approach relatively to its portfolio strategies.
24
Chapter I
Finally, Norton and Tenenbaum (1993) claim for the need of additional work to
be done in order to better understand the theory and process of VCs on risk control. For
instance, none of these works have taken into account the impact of different portfolio
strategies on VCs’ performance. This is an issue of primary importance, if the ratio
which is used to explain the need for VCs to manage their portfolio of investments is
the need to cope with the issue of risk-return. The focus of these studies had been
mainly on the antecedents of VCs’ investment preferences and it would be important to
take a look at the impact of this choices on the ability of VCs to perform (Gupta and
Sapienza 1992, Elango et al. 1995). The comparison of performance between VCs
specializing and/or diversifying along different dimension could also be very interesting
to shed light on the heterogeneous behaviour of VCs (Carter and Van Auken 1994).
1.4. Recent studies on the VCs portfolio strategies.
Venture capital has in recent years become a substantial and growing area of
academic research. This florescence has emerged from the pioneering works mentioned
above together with the build-up and final bursting of the stock market bubble of the
1990s, regarded by many as fuelled by venture capital (See Gompers and Lerner, 2001).
Recent research showed that while some VCs specialize only in certain
technologies and stage of development and geographical markets, keeping their
25
Chapter I
investment strategy very focused, others tend to display a diversification strategy along
the above mentioned dimensions (Cumming 2004).
Latest reports on VC industry point out that many players are defining their
operative area by accurately selecting industrial fields (EVCA 2005, The Economist
2004), while some others ramify their organizational structure in industry and/or
country-specific units in order to develop a context-specific knowledge as a competitive
advantage (Harper and Schneider 2004).
Most recent academic papers try to shed light on VCs heterogeneity, suggesting
that specialized organizations might be more successful then diversified VCs (Bottazzi
et al 2004), while other produce first evidence that a diversification approach can
improve fund performance (Knill 2005). Research community claims the need to
deepen the understanding of the linkages between VCs’ performance and their degree of
specialization.
These few studies emphasize also the importance of other factors which might
affect portfolio investment strategies, such as the country of origin, the source of funds
and the degree of experience of the VC. In a study of the Finnish venture capital
industry, De Clercq et al. (2001) point out that VCs develop their investment strategies
over time, through subsequent decisions regarding the type of companies they invest in.
More experienced VCs were slightly more specialized in terms of industry then less
experienced VCs (although the difference was not significant at conventional levels),
whereas the former were found to be more geographically diversified.
26
Chapter I
Bottazzi et al. (2004), analysing the European VC Industry found that
knowledge and human capital specialization at the level of the VC firm is a fundamental
driver to understand VCs’ strategies: specialized VCs are more active and more
involved with their portfolio companies. Gompers et al. (2004) studying the reactions of
US VCs to shifts in public market signals, found that the most successful were the VCs
exhibiting a higher level of industry-specific focus of their investments portfolio.
These works stress on the importance of knowledge and resources accrued by
VCs and on the constraints of diversified firms in redeploying their resources among
investments pertaining to different business areas. Thus a greater industry focus should
reduce the inefficiencies associated with spreading the VC’s resources across portfolio
companies (Fulghieri and Sevilir 2005).
The study of De Clercq et al. (2001) is the first attempt to identify realized
strategies of venture capital firms when undertaking portfolio investments. Their units
of analysis are not the declared preferences of Finnish VCs. More directly they focus on
portfolio of investments of these VC. They gathered data for the period 1994 through
1997 on 1160 investment from 28 Finnish VCs representing virtually the entire
population of the Finnish venture capital industry. The purpose of this study is to
examine the realized strategies of Finnish VCFs as determined by their portfolio
investments. The study builds on prior research on diversification, specialization, and
knowledge acquisition, as it pertains to venture capital investments.
27
Chapter I
They analysed the underlying patterns in the venture capitalist’s selection of
portfolio companies. More specifically, they focused on the characteristics of portfolio
companies, in terms of their industry, company stage of development and geographical
location, as strategic variables that guide the VCs’ decision process.
They built on Gupta and Sapienza, Nroton and Tenenbaum quoted research, in
that it should be expected that VCs’ strategic decisions are based on maximizing risk-
returns combination of their investment portfolios. Moreover, they argue that these
decisions may follow a specific pattern as VCs gain experience over time. VCs then use
their experience to control investment risk while maintaining high returns. They start
proposing that VC can control for risk by taking two possible approaches: (1) reducing
risk through specialization, with a VC developing knowledge by focusing on a specific
industry, company stage of development, and geographic location; or (2) spreading risk
through diversification across industries, company stages of development and
geographic locations. They modelled three independent indexes measuring the VC’s
relative degree of diversification along the dimension of industry scope, geographic
location and stage of development of their investments.
They looked at bivariate correlation coefficients of the three indexes above
mentioned and other control variables, including measures of the experience of the VC,
performing then a one-way ANOVA and t-test which informed about how the
investment patterns changed from year to year, and whether a general investment
pattern existed over the 4-year period.
28
Chapter I
They found that over time, VCs tend to specialize the industry scope of their
portfolio. Further, VCs consistently diversified geographically throughout the 4 year
period of the study, and they diversified their portfolio in terms of stage of development
by investing in increasingly later stage companies through the first years of the study,
before entering a period of equilibrium in which this degree of stage of development
diversification held relatively constant. Finally, the importance of accumulated
experience was illustrated by the finding that less experienced venture capital firms
showed a time lag in these investment patterns compared to more experienced firms.
An important contribution of their study concerns their approach to the analysis
of portfolio strategies of VCs. Their study focuses on how VCs develop their portfolios
through subsequent decisions regarding the types of companies they invest in. Instead of
looking at VCs’ preference regarding possible dimensions of diversification or
specialization, they modelled these dimensions employing independent diversification
indexes for the industry scope, the geographical breadth and the stage of development
spread of the companies VC hold in their portfolios.
Another important contribution of this study concerned the relationships
identified between different types of risk and specific portfolio investment patterns, and
suggesting that further understanding of the VCs’ decision making process may arise
when considering whether different factors become important during different stages of
evaluation. In particular, they propose that private investors are willing to accept higher-
than-market risk in order to receive higher-than-market returns. Therefore, a VC’s
performance is a function of how well it manages this risk. Specifically, its performance
29
Chapter I
reflects the quality of its investment decisions and the effectiveness of its management
advice and services subsequent to the investment decisions (Zacharakis and Meyer
1995).
Bottazzi et al. (2004) investigate on the role that VCs play in financial
intermediation. They found that specialization is key to VC activities in the sense that
choosing a specialization approach, VCs can be more active in the management of
funded companies.
This is one of the first comprehensive studies looking at the Venture Capital in
Europe, underpinning the analysis on a hand-collected dataset of European venture
capital investments. The data covers the period 1998-2001, and consists of a sample of
venture capital deals in all the members of the European Union (in the period under
study), plus Norway and Switzerland. Their primary data source is a comprehensive
survey of all the venture capital firms in these countries, plus various other sources of
commercial available data, resulting in a final sample of over 120 VCs, over 500
partners, and over 1,600 portfolio companies. A first important feature of this paper is
that is Europe-focused studies, and that the data collection is one of the first
significantly larger than other previous hand-collected datasets on venture capital.
Bottazzi et al. main conceptual frame is based on the belief that specialization
can help us better understand the nature of financial intermediation, since it is the key
variable that drives the degree of involvement of VCs in managing of backed
companies. Hence, they collocate their paper in the debate whether VCs can be
30

Chapter I
conceived as mere financial intermediaries, providing no more than financial capital and
few other pure financial services to the founded companies, or VCs can be considered
as corporate manager, actively managing the companies they fund, through the
provision of other type of capital (resources, human capital, knowledge and expertise,
networks and social capital).
They look at whether more focussed and specialized VCs become more involved
with the companies they finance. More specifically, they look at two dimensions of
specialization. First, they consider specialization at the level of the organization.
Second, they posit that financial intermediation is performed by people and look at
specialization at the level of human capital. Then they also look at the interaction of
these two levels of specialization, and ask whether the decision to be active resides at
the level of the organization or whether it is individuals within the financial
intermediaries who drive this choice.
Relatively to the organizational level, they found that an active investment style
is strongly related to a financial intermediary’s specialization. Independent VCs (those
VCs who are mainly dealing with VC kind of operations) are significantly more likely
to get involved with their companies, than subsidiaries VCs (those as for example
financial entities who occasionally are involved at some level in venture capital deals).
Further more, and consistently with prior research, VCs that specialize their
investment activities to doing only early stage deals and those which concentrate on
relatively few deals in absolute numbers, tend to be much more involved in the
31
Chapter I
management of funded companies than VCs who pursue later stage investments or that
are involved within a larger number of deals.
Beyond specialization at the organizational level, they also found that human
capital is associated with a more active investment style. In particular, VCs with prior
business experience are significantly more involved with the companies they finance.
Another important contribution of this paper comes from looking at the
interaction between these two dimensions of specialization, and finding that human
capital augments, rather than replacing, organizational characteristics. In other words it
seem more likely that variations in human capital across VCs has more explanatory
power than variation among partners within the same deal.
Fulghieri and Sevilir (2005) take a portfolio approach to analyse VCs investment
strategies, and investigates the optimal size and scope of a VC's portfolio. They studied
how the composition, in terms of size and focus, of the VC's portfolio affects the
incentives of the VC and of the entrepreneurs in his portfolio, as well as portfolio
performance.
They address the questions relatively to the determinants the size of a VC's
portfolio; they investigate on the costs and benefits of having a small versus a large
portfolio. They also examined the strategic aspects of managing a portfolio of start-ups
rather than a single start-up.
32
Chapter I
Their basic concern is to model how VCs take the decision of having a
diversified portfolio of companies or a focused one, assuming that size and focus of
portfolio of investment is an important variable affecting VCs’ performance.
Also Fulghieri and Sevilir’s starting hypothesis is that VCs add value to investee
companies by acquiring knowledge, human capital and skills that are very often specific
to their portfolio companies. These investments lead to specialization in the VC
industry, where different VCs invest in different sets of skills. For example, some VCs
specialize only in certain technologies and industries and keep their investment strategy
focused, whereas others diversify into different industries.
The authors build a model which explains the composition of VC’s portfolio,
relatively to its optimal size and focus of investments. They argue that the degree of
portfolio focus affect the trade-off between having a large or a small portfolio. A high
level of relatedness between portfolio companies allows the VC to reallocate resources
more efficiently from one start-up to another.
The VC benefits from a high level of focus in two different ways. First, when
one of the start-ups fails, the VC transfers his resources and human capital to the
successful start-up. The higher the level of focus, the higher the efficiency of the
reallocation of resources. This implies that a greater level of focus reduces the
inefficiency associated with spreading the VC's initial investment across several start-
ups, increasing the benefits of the resource allocation effect. This issue was already
suggested by Norton and Tenenbaum, who suggested that in this circumstances of high
uncertainty, the high fixed costs of gaining expertise in other domains, it does not make
33

Chapter I
economic sense for them to seek portfolio diversification. In other words, Fulghieri and
Sevilir built a mathematical model which hypothetically replicates this relationship
between scarceness of resources, uncertainty and the probability for VCs to focus their
portfolio. Fulghieri and Sevilir’s paper also suggests that larger and more focused
portfolios are optimal in the case of risky start-ups investing in related technologies with
high uncertainty and failure rates.
Another benefit of focusing the portfolio of investments is that it allows the VC
to perform better. The authors’ opinion is that this happens because, looking at the
relationships between VC and entrepreneurs as a bargain in which both of the two side
aim at having the highest number of options to perform a favourable exit in the future, a
high degree of focus increases the value of the VC's outside option while he bargains
with the entrepreneurs.
The authors conclude that a greater level of focus reduces the ex-post
inefficiency associated with spreading the VC's resources across several start-ups, and
increases the benefits of ex-post resource reallocation. This implies that focused
portfolios are more desirable (all else equal) in the case of risky start-ups that invest in
technologies with high uncertainty and failure rates.
Gompers et al. (2005) document that VCs with the most industry specific human
capital and experience react most to an increase in investment opportunities in the
sectors of their specialization. The evidence is explained by the view that it is more
difficult for diversified and less specialized VCs to re-deploy their human capital from
34
Chapter I
the sectors of their investment to the sector experiencing an increase in investment
opportunities. Their analysis covered all US venture capital investments during the
period 1975-1998, thanks to the availability of Venture Economics commercial datasets,
resulting in a final sample of 42559 observations.
They build on the idea that more experienced VCs achieve better performance
than less experienced peers (Sorensen 2004). They modelled VCs’ experience in three
different ways. They called “General Experience” of a VC its total number of
investments prior to the time of the investment in question. This measure represent the
VC’s experience accrued in the venture capital business.
The second type of VC’s experience relates to the "Industry Experience,”
constructed similarly to the “General Experience” measure, but including only
investments in the same industry as the investment in question. In other words they built
class or industry categories of investments and measure the industry specialization of a
VC in these classes. The third type of experience measure, “Specialization”, measure
the fraction of all previous investments that the VC made in a particular industry. In
other words they built the specialization measure as the ratio of “Industry” to “General”
experience.
Their findings suggest that the three kind of VC’s experience are important
channels through which the VC influences its reactions to shifts in public market
signals. Indeed VCs tend to increase their investments in years and industries in which
IPO activity increases. Also The results also indicate that industry experience have
higher level of investment then less industry experienced peers. Moreover General and
35
Chapter I
Industry experience is positively associated with greater investment sensitivity to IPO
activity.
Relatively to the industry-specialization kind of experience, Gompers et al.
showed evidence that more specialized VCs tend to increase their industry investments
more than less specialized firms when IPO activity increases, consistently with their
findings on industry experience.
Finally Gompers et al. looked at the performance of the companies in which the
VCs invest, measuring their performance by determining whether the investment
resulted in a profitable exit for the VC. This is most likely the case if the company went
public, registered for an IPO, or was made object of a third sale (i.e. the company was
acquired or merged). The authors argue that investments they categorized as successes
in that way, are likely to have generated higher returns that the investments that have
not yet exited or have been characterized as bankrupt or defunct. Preliminary results
seem to indicate that investments made by venture capital firms with more general and
industry experience are more successful. The patterns with specialization are non-linear,
but the least specialized organizations appear to be the poorest performers.
Then they repeated their analysis introducing new control variables such as the
stage of development of funded companies and the capital inflow in the market during
the year of the investment. This time, results showed that VCs do somewhat worse on
the investments they take when there is a lot of IPO activity. However, the more
experienced venture capitalists exhibit less degradation in their performance than do the
less experienced venture capitalists.
36
Chapter I
This is an important paper in the stream of research involved in the investigation
of the impacts of VCs’ specialization or diversification portfolio strategies on their
performance. Their general findings support the view that VCs are concerned with the
decisions relatively to specialize or diversify their investment portfolios. Moreover,
experience and especially industry-specific experience is shown to be a key driver in the
process of investment strategy. They also found hints that investments for specialized
VCs tend to be more successful in terms of probability of positive exits from the
founded ventures, although the authors themselves call for further need to deepen this
last issue, since the linkages between performance and specialization versus
diversification choices remain ambiguous
Finally, Knill (2005) investigated on the trade-off between two different types of
strategies a VC is looking to implement in order to achieve portfolio optimisation. She
distinguished between the “pure play” strategy, characterizing the willingness of a VC
to get actively involved in the management of backed companies, and the “generalist”
strategy carried on by the VC while pursuing a diversification approach in order to
minimize the overall risk of their portfolio.
Her strong basic assumption is that every VC plays at the same time two
different roles: the role as general manager of each of the companies the VC invests in,
and a role as fund manager concerned about the overall risk-return profile of the fund it
manages. Knill argue that these two different roles entails opposite investment
philosophy which have the potential to lead the VC to a dilemma. In other words, in
37
Chapter I
their role as company managers VCs should seek for specialization in the particular
business concerning the company they run or support. On the other hand in their role as
fund managers, they should look for the overall portfolio considerations and think about
the level of diversification potential investors practice, in order to take control and to
reduce portfolio risk.
This paper specifically built on Norton and Tenenbaum (1993) in that this paper
also examines how VCs reduce risk through stage diversification, information sharing,
networking and/or specialization. The underling assumption is that a VC determines
whether an investment is worthy based on the likelihood of its profitability and on
prospect of medium/long term portfolio risk.
This paper also differ from Norton and Tenenbaum approach in several aspects.
First of all, Knill examines more than 38000 observations relatively to US based VCs,
collected from a commercial dataset on the period 1998-2003, and thus providing a
larger sample than Norton and Tenenbaum’s one from which deriving conclusions.
Also Knill look more directly at the relation between VCs’ portfolio strategies
and their performance, although instead of a direct measure of fund profitability she
uses an indirect measure of growth relatively to the amount of asset under management
of the General Partner1. She also look at the performance of backed companies, because
she is also interested in knowing which of the said different approaches (the “generalist”
versus the “pure play” roles) is the best from the company point of view. She used the
1 Knill argue that, due to lack of available data it is virtually impossible to collect direct measure of performance. She then decided to rely on a proxy of performance measured, which is usually strongly positively correlated with more direct level of performance. I will discuss the problem good measure of performance in later sections of this dissertation.
38
Chapter I
probability of getting through an IPO or being sold via merger or acquisition as a proxy
to measure the performance of backed companies profitability.
Interestingly, as I will discuss in detail in next sections of this dissertation, these
types of performance measures are usually employed by researchers to measure the
performance at the fund level.
Similarly to De Clercq et al (2001), Knill built three dimension of portfolio
diversification relatively to the industry, geographical and stage of development
diversity of backed company, based on modified Herfindahal indexes2. She then studied
the effect of these indexes on the performance variables.
Looking at the impact of VCs’ levels of diversification along the industry, the
geographic and the stage of development dispersion of portfolio companies to their
performance, her findings showed that the impact of VC diversification are quite
different for the performance of VCs themselves and the performance of backed
companies. In other words her data shown that a diversified approach seems to be more
beneficial at the VC level then at the backed company level questioning the
misalignments of incentives in the VC-backed company relationship.
Interestingly the results showed that the geographic diversification seems to
have the a positive impact on measure of performance at the fund level, while industry
and stage of development diversification strategies seems to have only a smaller
marginal impact.
2 I will discuss the diversification measures more in depth in the section dedicated to the measurement of variables.
39
Chapter I
1.5. Conclusion and limits of recent studies
Based on the findings of earlier literature, these recent papers push forward the
understanding of VCs’ portfolio strategies and their relationship with performance.
These later studies appear some ten years after the earlier ones, benefiting for
quite a long time for the venture capital market to develop and expand from United
States to United Kingdom first, and then Continental Europe and Far East.
First of all, indeed, these later studies can count on more reliable samples from
which they can derive conclusion, thanks to the growing volume of venture capital
operation and the great importance of the venture capital in fostering economic growth
and innovation (see Hellman and Puri 2001), as it is witnessed by the proliferation of
commercial database set-up by organization conceived with the purpose of tracking
VCs operations over time.
Second, a number of new and unresolved issues are addressed relatively to the
relationships between VC basic concern about the risk-return profile of their portfolio
and the strategies they display in order to cope with it. These latest works start to be
interested not only in the preference of VCs for particular stage of development,
technological sectors or geographical markets, but in the actual strategies VC
implement along these dimensions. Also, multiple level of strategic assets should be
considered in relation to the various possibility for a VC to leverage on while setting up
their specialization or diversification approach: human capital, organizational level,
40
Chapter I
networks an alliances, industry-specific knowledge are some of the possibilities along
which a VC fund can diversify its portfolio of investments.
Furthermore, these works start to investigate on the impact that these strategies
have on performance. Since the VC partnership involves several entities each one
carrying its own stakes and interests, it is important when talking about performance to
specify who the performance are related to3.
Central to this group of research is also the idea that the accumulation of
different kind of experience is a key concept that deserve further theoretical
development and empirical investigation at different levels, in order to explain the roles
VCs plays in modern economy and in fostering the development of new companies. For
instance, as Fulghieri and Sevilir (2005) pointed out specialized VCs will manage
portfolios with a small number of companies, while less specialized VCs manage larger
portfolios. Also Bottazzi et al. (2004) suggested that specialized VCs, since they hold
portfolios with a small number of companies, are able to take a more active role in the
direct management of their portfolio companies, leveraging on the development of
greater human-capital-specific resources and with a more active investment style
relatively to their portfolio companies. From this point of view, VCs should seek for the
specialization of their portfolio, since specialization should specialized VCs refrain
from investing in start-ups that are not related to their core business (De Clercq et al.
2001). Conversely, as Gompers et al. (2005) pointed out, investment activity by VCs
with more general expertise is more sensitive to the overall business cycle conditions of
3 This is a very important issue since the VC partnership represent a different number of separate entities. I will dedicate a specific section to discuss this fundamental issue
41

Chapter I
the economy since it is more difficult for diversified VCs to re-deploy their human
capital and other resources from the areas of their investment to the area experiencing
an increase in investment opportunities.
On the other hands there is also contradictory evidence that diversification can
also benefit can also create value to investors and VCs, as far as a diversified portfolio
allows for the reduction of risk without reducing performance. So far there has been no
attempt to directly measure the impact of diversification strategy versus a specialization
approach on performance. This issue call into question also which level of performance
one is considering. As Knill (2005) pointed out, it could be a misalignment between the
incentives for the investors to diversify the fund portfolio and the incentive of the
backed company to be supported by a VC which has well developed skills in the same
particular field and markets of the backed company.
The existing literature reveals some limitations that deserve further
investigation. There is limited research on the determinants of VC success in relation
with portfolio strategy. This issue is deeply linked to the lack of understanding on the
precise mechanisms behind the relative performance of specialized or diversified VCs
As a final consideration, these latest studies appeared some ten years after the
earlier ones, which suggest that the portfolio strategies of VCs are far from being
completely understood and further research is to be exhaustive. Apart from such papers,
VCs portfolio strategies and the question whether implement a diversification versus
specialisation approach in order to achieve better performance, has so far been the
object of a few studies. Surprisingly, little knowledge still exists as to how VCs develop
42

Chapter I
their investments portfolio, even if the decisions regarding the scope of firms’ activities
are key issues for corporate strategy (Hofer and Schendel 1978). To my knowledge,
there are virtually no empirical studies on the impact of diversification (or
specialization) investment strategies on VC fund performance, the issue we will discuss
in the next section.
43
Chapter II
CHAPTER II
The performance of Venture Capital.
In what terms should venture capital performance and related success be
measured? The answer is that it depends on the observer. From a political macro
economic perspective, contributions such as employment growth, number of new
companies or technological breakthroughs, are of significant importance. Several
academic VC studies claim for example that entrepreneurial activity fosters innovation,
patenting and growth performances (e.g. Kortum and Lerner 1998, Engel 2002,
Hellman and Puri 2002, Romain and van Pottelsberghe de la Potterie, 2004). From an
entrepreneurial perspective VC firms’ performances might be measured in terms of their
ability to add value, in addition to capital infusions. Earlier research show e.g. that VC
firms play an important role in professionalizing the firms in which they invest;
connecting them with potential clients and suppliers; and attracting additional funding
(e.g. Sapienza, 1992; Rosenstein, Bruno, Bygrave and Tylor, 1993; Barney, Busenitz,
Fiet and Moesel, 1996).
A number of studies has examined the performance of venture capital, some of
them concentrating on the performances of funded enterprises (see e.g. Robinson, 1998;
Hege et al. 2003) whilst others focusing directly on VCs’ performances (see e.g. Brophy
and Gunter, 1988; Bygrave, 1989; Chiampou and Kallett, 1989; MacMillan et al., 1985;
44
Chapter II
Cochrare, 2001). From an investor perspective the most important measurement,
however, is financial returns from venture capital fund investments. A longer-term lack
of competitive returns will force investors to avoid VC investments, or only invest in
funds with proven track records. A vital VC market with satisfactory financial returns is
thus the guarantee for its future survival.
For the purposes of this research, I will focus on the impact that diversification
has on VCs’ performances, i.e. the performance at the fund level. What is more
important, therefore, is to define a performance index to be used in assessing VCs
performances.
Reliable performance indexes are hard to be found (MacMillan et al., 1989;
Cochrare, 2001; Hege et al., 2003) essentially because of the “private” nature of VC
firms, these not being subject to the transparency and divulgation standards which listed
companies have to comply with. It thus appears particularly difficult to collect data on
the economic and financial performances of VCs.
More importantly, the performance of venture capital should be understood in
the context of a set of investments forming a portfolio and to which the concepts of risk
and return can be applied. Firm-specific risk of a portfolio can in general be virtually
eliminated if the size of a portfolio is sufficiently large and diversified. The VC would
then choose a risk-return combination that best suited the investors whose money are
invested. The only risk such investors would be subject to would be the un-diversifiable
risk, associated with the market as a whole (Cochrane 2001). But as we have seen from
previous literature VCs do not necessarily build their portfolios in order to diversify all
45

Chapter II
the company-specific risk, being concentrated in particular markets, industries or stage
of development. VCs portfolio are substantially illiquid to boot making valuation,
particularly difficult and adding a dimension to risk4. Furthermore even if commercial
dataset tracking several measure of performance, are now available for research
purposes most of them provide this data only on aggregated form, that is relatively to
the return to particular segment of class of VCs as a whole. Thus researchers have so far
built a number of proxy to resolve this impasse.
Traditionally, attention has been paid to the return rates yielded by VC funds on
the invested capital (Brophy and Gunter, 1988; Bygrave, 1989; Chiampou and Kallett,
1989). Studies based on this approach, however, have faced both biases and lack of data
on the internal rates of return (IRR) of said funds. The lack of univocal and objective
data has been essentially resolved in two ways, i.e. by directly requiring VCs (through
postal questionnaires) to provide performance data (e.g. MacMillan et al., 1989;
Manigart et al., 2002) or by using secondary indexes (Gompers and Lerner, 1999; Hege
et al., 2003), e.g. by looking at VCs’ exit strategies: since the ultimate goal is to get out
of their investments and have a return on their invested capital, many studies have used
VCs’ exit strategies (e.g. IPOs or sale of the companies to other entities through merger
or acquisition) as a performance index.
The recent foundation of monitoring organizations and instruments (i.e. EVCA,
NVCA, TVE) which periodically gather and elaborate (through standard procedures)
information in the field on an international level, has widened the methods available to
4 Firm-specific risk (assumed to be eliminated by the investor in the CAPM model) will in practice play a role in pricing of such portfolios and so the CAPM cannot strictly be applied to price them. See Cochrane (2004).
46
Chapter II
evaluate VCs performances by using historical data on investments’ (incoming and
outgoing) cash-flows during the latter’s “life-time” (Murray and Marriot, 1998; Karaser
and Diller, 2004). Yet assessments through IRR indexes are not free from distortions
(Cochrane, 2001), this measures are bias for the remuneration of fund managers which
are generally based on an yearly fee for their management of funds, plus a percentage
fee for contributing to the latter’s increase in value (Murray and Marriot, 1998).
Agreements on fund managers’ remunerations may be differently renegotiated for each
fund they work on, and may be affected both by the timing of decisions relating to the
disinvestments of the fund and the return of capital, and by the terms of payment of
investors, through e.g. shares or liquid assets (Chiampou and Kallett, 1989). Such
circumstances affect the way the IRR indexes are calculated; not surprisingly,
international associations representing the VC field are involved in trying to unify and
standardize guidelines and criteria for the assessment of VCs returns (EVCA, 2005).
2.1. Factors affecting VC performance
There is a large and growing literature analysing the return of venture capital
investments, showing the impact of several factor on the profitability of venture catpial
investments (Jones & Rhodes-Kropf 2003, Ljungqvist & Richardson 2003, Kaserer &
Diller 2004, Cumming & Walz 2004, Cochrane 2005, Kaplan & Schoar 2005). In this
paragraph I present the most relevant factors affecting VC performance.
47
Chapter II
Empirical data show that high returns to VC are directly associated with the size
of the fund, and with the expertise of the fund managers. Laine and Torstila (2004)
found that large funds have significantly higher exit rates. Kaplan and Schoar (2005)
found that for US funds the relation between size of fund and performance is concave,
that is the larger the fund the better it perform, until the size reach a certain threshold
after which the size has a negative influence on VC performance. Cumming (2005)
explain this phenomenon as evidence of the trade-off between VC assistance to
entrepreneurial firms in the VC’s portfolio and the size of the portfolio. Consistent with
recent developments in the banking literature (Hughes et al. 2001), fund size in venture
capital is affected by risk taking, capital structure, and a number of other factors related
to agency costs, costs of investing and monitoring, and the potential for value
maximization, so that after a certain threshold increasing fund size is not cost efficient.
Furthermore, it has been shown that the size of the found not only have impacts
on performance in terms of scale effects, but also in terms of reputational capital. Those
fund manager that are able to attract greater amount of capital from investors are
considered to be the most skilled managers (Barktus and Hassan 2003), showing
formidable track of records of positive returns in the past; being better prepared to
evaluate the potential of profitable ventures (Baum and Silverman 2004) and thus
having better chances to gain positive returns. Accordingly, larger funds presumably
have greater expertise and reputation and thus have better performances (Laine and
Torstila 2004).
48
Chapter II
Another important positive effect on VC performance it has shown to be the
expertise of the VC. Kaplan and Schoar (2005) found that first-time funds (i.e. funds
that are raised for the first time) tend to raise bigger amounts of capital when the private
equity industry performs well, which they find interesting in the light of that first time
funds perform markedly worse than follow-on funds. Hocberg et al. (2005) also found
that funds raised subsequently to previous founds tend to perform significantly better
than sole or first-time found5.
The experience of the fund manager is also positively related to performance of
VC. Rosenstein et al. (1993), Sapienza et al. (1996) and Manigart et al. (2002) all found
that experienced VC managers are perceived to add more value than inexperienced VC
managers to their portfolio companies. Gompers et al. (2004) show that the VC
managers with the strongest hands-on industry experiences increase their number of
investments the most when industry investment activity accelerates. Gottschalg et al.
(2004) found that more experienced and skilled private equity managers have higher
survival rates and offer higher returns. Diller and Kaserer (2005) showed that VC
returns are positively associated with VC managers’ skills. It has often been noted,
however, that VC managers are intuitive decision makers, and that this intuition
develops after making numerous venture investment decisions (e.g. Zacharakis and
Shepherd 2001). This support the idea that, by the time VC managers accrue their
5 In the venture capital industry is common for a fund with good returns at the end of its life to replicate itself by raising a new fund with the same characteristics – and very often calling the new fund with the same name of previous one, followed by the subsequent number. Venture Expert defines sole funds as the funds that were raised for specific declared purposed and that will not have the possibility of a subsequent fund; follow-on funds are those raised for pursuing the same type of investment of previous one; First-time funds are those raised without a positive experience of funds behind them.
49

Chapter II
expertise in a larger number of investment, they became able to enhance fund returns
(Kaplan and Schoar 2005)
A further variable which affects VCs’ performances is the allocation and level of
capital inflows in the venture capital market. Gompers and Lerner (2000) show that
portfolio firm valuation in a financing round is higher the more money poured into the
venture capital market over the year before the deal closed. An overheated market was
according to the authors’ one of the reasons for the very low returns generated by VCs
during the period of 1985-19906. They argue that there is a limited number of
favourable investments in the private equity industry giving way to the so called
“money chasing deals” phenomenon, which has been supported by several researchers
(e.g. Ljungqvist and Richardson 2003, Hochberg et al. 2005, Diller and Kaserer 2005).
Diller and Kaserer (2005) find this especially true for early stage VCs, as they are more
affected by illiquidity and segmentation than buyout funds. Kaplan and Schoar (2005)
conclude that market entries are cyclical, whereby funds that are raised in boom times
are less likely to raise follow-on funds, implying that these funds are likely to perform
poorly. They show that an increase in the allocation of money towards a particular fund
has a significant negative impact on the performance of this fund. Hochberg et al.
(2005) also found that funds subsequently perform significantly worse the more money
flowed into the VC industry in the year they were raised. Another effect of a overheated
venture capital market is that VCs are unable to invest up to their capacity, according to
Mason and Harrison (2004). This arises for two main reasons; (1) there is a high level of
6 And then, most likely, also for the period after the Internet bubble, which has had a major negative impact on the returns of VCs.
50

Chapter II
venture capital aversion amongst entrepreneurs, attributed to their failure to understand
the role of VC firms as well as reluctance to surrender ownership and control, and, (2)
many of the businesses which do seek venture capital are not investment ready.
VCs frequently engage in collaborative relationships with other peers.
Syndication is common in the venture capital industry. Syndicates are typically formed
by a lead investor who contacts other potential VCs and records their commitments to
invest. Syndication has turned out to have a positive impact on performance, since it
serves multiple aims: (1) Risk diversification and Information sharing: through
syndication each VC can invest in more projects and thereby better diversify the
portfolio and reduce firm-specific risks (e.g. Gompers and Lerner 1999, De Clercq and
Dimov 2003, Hege et al. 2003). Furhtermore VCs tend to have investment expertise that
is both sector-specific and location-specific where syndication helps diffuse information
across sector boundaries and expands the spatial radius of exchange (e.g. Sorenson and
Stuart 2001). (2) Identify profitable investments and accruing deal flow: in evaluating
ventures’ potentials the involvement of another VC provides a second opinion (e.g.
Lerner 1994). By checking each other’s willingness to invest in potentially promising
deals, VCs can pool correlated signals and thereby may select better investments in
situations of often extreme uncertainty about the viability and return potential of
investment proposals (Sah and Stiglitz 1986). VCs invite others peers to co-invest in
their promising deals in the expectation that such invitations will be reciprocated in the
future (e.g. Lerner and Schoar, 2004). (3) Portfolio value add: Syndication networks
may also help VCs add value to their portfolio companies, where syndication networks
51
Chapter II
facilitate the sharing of information, contacts, and resources among VCs (e.g. Hellman
and Puri, 2002; Lindsey, 2003)7.
As a final remark, it has been shown for institutional and environmental factors8
only indirect effects on VCs performance. However it has been highlighted the
importance of such factors as the presence of developed stock markets, supporting
institutions and the existence of efficient legal and tax structure in order to create and
keep the venture capital industry alive. Megginson (2002) support the need to increase
the sources and occasion of collaboration between Universities and research institution
in order to create a supportive culture fostering the links between innovative ventures
and VCs. The most important factors for VC fund managers appear to be to reduce
geographical and industrial obstacles through syndication, avoid raising funds in boom
times. For policy makers the most significant measures are to nurture a deep and liquid
local stock market, establish efficient legal and tax structures, increase incentives for
investing by private investors, and reduce labour market rigidities. In particular the UK,
although still lagging behind the US NASDAQ stock exchange, seems through AIM to
be in the process of developing a competitive and efficient stock market for high
technology companies. The UK also appears to have a large informal Venture Capital
7 Other motives for syndication have been advanced. For instance, by syndicating deals with more experienced VCs helps in gaining reputation and certification, enabling further capital to be raised. (e.g. Hsu, 2004). Furthermore the some authors found support for the “Window dressing” hypothesis (Lakonichok et al. 1991) as a motive for syndication: VCs may syndicate investments even if the financial returns to such investments are relatively low in order to show potential investors an exit record (Lerner 1994, De Clercq and Dimov 2003).8 For influence of government programs see i.e. Megginson (2002); for regulatory changes see i.e. Cumming and Walz (2004); for tax and legal structures within different labour market see i.e. La Porta et al. (1998) and Jeng and Wells (2000); for the role of stock markets see i.e. Gompers and Lerner (2000) and Black and Gilson (1998).
52
Chapter II
market and is considered to have one of the most favourable legal and fiscal
environments in Europe (Black and Gilson 1998).
2.2. Studies of returns
Although the majority of reports from the VC industry seems to suggest that the
returns to venture capital exceed well-known benchmarks (like the NASDAQ and the
FTSE All Share indices), little was known about the returns to venture capital until the
first years of 21st Century. In the earlier studies returns were often not measured in cash
flow terms (as would be economically appropriate) and were not measured net of
management fees (thus creating an upward bias in the figures).
The academic literature seemed to assume that since venture capital is ‘special’
it should attract higher than average returns from the stock market. However, in the first
academic contribution to measuring the returns to venture capital Moskovitz and
Vissing-Jorgensen (2002) impugned this assumption. Using two large representative US
datasets for private equity covering the periods 1989 to 1998 (without unincorporated
businesses) and 1952 to 1999 (including proprietorships and partnerships), their
findings are remarkable. Firstly, they find that the scale of venture capital in the US is
huge and competes with public equity in importance. The total value of venture capital
in the period 1989-1998 was in fact about the same as that of public equity (equity of
quoted companies). Secondly, they found that investment in venture capital was
53
Chapter II
extremely concentrated with about 75% of all PE owned by households for which it
constitutes at least half of their net worth. Moreover, such households invest more than
70% of their holdings in a single private company in which they have ‘an active
management interest’, that is they are employed in it or run it. Finally, despite the
obvious risk of such a typical portfolios the returns offered by venture capital is on
average no higher than the market return, the return to a highly diversified index of
quoted (and mainly highly liquid) securities. The authors argued that economic logic,
based on the well-attested concept of risk aversion would dictate a risk premium to
venture capital investment (so-called the “Private Equity Premium Puzzle”).
Cochrane(2004) adopts a very different, econometrics-based, approach to
examining the returns to venture capital which focuses on solving the sample selection
problems that had determined previous efforts in the area. Despite this difference in
approach, his results are broadly in line with Moskovitz and Vissing-Jorgensen.
Cochrane argues that there are mainly three reasons why the risk and return of venture
capital should differ from that of traded stocks, holding their betas (measures of
systematic or market-wide risk) or other characteristics (e.g size and industry) constant.
These are (1) Liquidity: a higher return may be required by investors to compensate for
the lack of trade-ability of private equity (i.e. opposite to public equity); (2)
Diversification: private equity has typically been a high proportion of an investors net
wealth implying that they do not hold fully diversified portfolios and hence have high
firm-specific risk associated with them; (3) Costs of monitoring and governance: fund
managers often provide services of monitoring and control over investments made on
54

Chapter II
behalf of their clients (i.e. the investors) and this additional cost must be accounted for
in the returns these investments yield. Cochrane finds, however, that VC returns, even
when the lower risk of the VCs portfolio approach is ignored, are little different from
those of similar traded stocks and moreover are highly volatile. Returns are estimated to
be about 15% per annum with a volatility of about six times this figure. This finding is
confirmed in a recent study of VC returns to companies going to IPO in the UK (Cressy
and Lembergs, 2006).
Kaplan and Schoar (2005) investigate the performance of and capital inflows
to VC partnerships in the United States. Using cash flow data for the period 1988-1999
they address the following questions: (a) What are the returns to early and later stage
VC funding? (b) Do these returns exceed market benchmarks? (c) Are some VCs better
than others? (d) Do returns to PE persist over time? They found that the returns to early
stage funding were higher in the 90s boom but otherwise more variable and lower than
those to late stage funding. However, the average figures concealed a great deal of
heterogeneity amongst VCs with top quartile funds posting a premium of 10-20% over
bottom quartile funds. The level of returns is largely independent of the weighting
scheme employed. Weighting funds equally, Kaplan and Schoar found the returns are
slightly below the relevant benchmark (here the S&P500 index) and offer an IRR of
17% per annum. However, weighting funds relatively to the committed capital, they
found returns are slightly above the benchmark and offer an IRR of 18% per annum.
Dispersion of performance amongst VCs is however strong in both cases. One of their
most interesting findings relates to question concerning the heterogeneity of VCs and
55

Chapter II
whether and why there are VCs performing better than others. They found a
considerable persistence in fund returns through time, making past performance to a
significant degree a guide to future performance. This also support the evidence that
those who manage a fund that performs well are more likely to be able to raise future
funds as a result.
There are also issues of selection bias (non-randomly omitted observations)
with these studies (Hege et al. 2003). In finance, the typical measure of performance is
the return on a quoted security, consists of both a dividend yield (dividends expressed as
a proportion of the current value of the stock) and a capital gains, which are the most
relevant part of VCs returns on venture capital. However it is not possible to observe
the value of a venture capital investment much of the time (Cochrane 2004) but in three
occasions: if the backed company receives a further round of investment from a VC; if
its shares become part of an IPO; if the company is sold to another organization
through merger or acquisition. If on the other hand, the company does not receive more
money in the current period but remains on the VCs portfolios, or becomes bankrupt
and disappears, no such value is typically observed. This presents the econometrician
with a potential sample-selection problem since the sample of observed values is
generally unrepresentative of the population of values.
As Cochrane (2004) pointed out, potential biases do not stop at selection
however. For example, consider the relationship between one source of observation of
value, the IPO, and the true value of the firm in any period. It turns out that empirically
the chances of an IPO increase with a firm’s value (Cochrane, 2004). This means that if
56
Chapter II
we include in our estimate of returns only those investments with high (and hence
observable values) we end up with a potentially gross overestimate of the returns to
venture capital – gross because IPOs are a small proportion of the total number of VC
investments and make up a disproportionately large fraction of total value. If one were
to ignore the fact that the true distribution of VC returns is highly skewed
(approximately lognormal according to Cochrane, 2004) and were to take arithmetic
mean returns rather than geometric mean returns as our measure, this would again
overstate the returns to venture capital. Both these errors have unfortunately been
perpetrated in the academic and practitioner literature in this area9. Cochrane suggest to
deal with this problems by estimating a joint distribution of company returns and IPO
status (defined as reaching IPO or not).10 The estimated joint distribution will then give
him the returns to venture capital as a whole, including the return to those investments
that never reach IPO. Previous studies simply estimated the returns to IPO (and
sometimes trade sale) treating these as the returns to venture capital as a whole, thereby
providing a very rosy picture of industry profitability.
Other recent studies broadly confirm Cochrane’s findings even if they do not
control as accurately as he for selection biases. Thus Hege et al. (2003) found that in
their sample of European and American companies the average log(1+IRR) in 1997 is
18% per annum rising to 29% in 1999 and falling to -12% in the year 2000. Cressy and
Lembergs (2006) on a sample of UK based VCs from the Private Equity Intelligence
9 Early empirical studies of the returns to venture capital include Moskowitz and Vissing-Jorgenson(2000), Reyes(1997), Gompers and Lerner(1997), Smith and Smith(2004).10 More generally, sale status, since a company may be sold either through a trade sale or an IPO. However, we shall refer to IPO status rather than sale status here.
57
Chapter II
and Venture Economics databases find an average fund IRR of some 15%. The latter,
like Cochrane, find that the distribution of returns is Lognormal, but because their
sample is of IPO companies only (companies much less likely to fail), it has a much
smaller standard deviation.
2.3. Analysis of success rates
Another way to examine the performance of venture capital investments is to
look at the determinants of the chance that one of them will end in a sale (trade sale or
IPO) rather than bankruptcy etc. Several studies have used this empirical approach
which has the obvious advantage that it does not presuppose a market model to value
companies – the choice of which offers no consensus. As Jaaskelainen et al (2003)
suggested, although the performance of a venture capital fund can be defined
straightforwardly as the return on investments, the observation of the performance of
VCs is hard for an outsider due to secretive behaviour of the venture capitalists
concerning their profits. However, as the largest valuations and returns to venture
capitalists are most often realized in IPO and trade sales (Bygrave and Timmons 1992),
it is possible to use the number of IPOs and third sales (controlling for the number of
investments) as a proxy for the VCs performance.
For example, Hege et al (2003) examined the determinants of success in a large
sample of European venture capital investments. They combine a database
58
Chapter II
(VentureXpert) with a questionnaire approach to VCs and use both discrete measures of
success (high, medium and low represented by IPO, Trade Sale and Bankruptcy
respectively) and continuous measures (reported valuation data). Three main findings
emerge from their study. Firstly, VCs in the United States are more likely than those in
Europe to use control rights in their contracts and to enforce them when the need arises.
For example, United States VCs make greater use of convertible securities which in the
event of bankruptcy is associated with a shorter time to liquidation11. Control also
appears in the statistic that American VCs are three times as likely to replace an
underperforming manager as their European counterparts and this reduces the time to
liquidation in the event of bankruptcy12. Secondly, a higher proportion of total
investment in America is invested in first rounds; Europeans seem to have a preference
for later rounds (buyouts etc). However, Hege et al. results show that these investments
are also more likely to fail. Controlling for post-investment monitoring (another
significant function of the VC) along with other factors, the negative informational
deficiencies associated with first round investments may reduce their chances of success
below those of later stage investments. Another important control introduced by the
authors which should impact on VCs performance is the syndication of investments
(Brander et al 2003). Comparing US and European VCs, the American syndicates are
on average significantly larger than those in Europe. This is apparently not because
larger syndicates are associated with greater success, since the authors’ findings show
that greater syndicate size has no impact or even a negative impact on IPO success. This
11 In the United States according to Hege et al (2003), of VCs’ investments make use of convertible securities at the median 68%.12 An American VC is three times more likely to replace an owner-manager than a European VC.
59
Chapter II
results contradict the literature on VC syndication, which sees the rational of
syndication in the advantages of resources complementarities and risk diversification
which should be reflected in superior performance (Lockett and Wright 1999, Manigart
et al. 2002).
Remer (2005) has a possible explanation for the seemingly paradoxical outcome
on syndication. Examining the outcomes of specifically biotech investments in three
countries, the US, the UK and Germany in a sample of about 1700 biotech ventures
funded between 1970 and 2002 he finds, that controlling for industry, economy-wide
and financial factors the probability of syndication is negatively related to the
experience of the VC. However, he also finds this is in turn positively related to
performance, measured here by the probability of an IPO. The experience-IPO
relationship is also stronger the better matched is that experience to the project under
consideration13.
Some other studies employ more comprehensive count-data on performance,
considering the exit or success rates experienced by VCs. IPOs are often considered as
the preferred exit vehicle of the most venture capital firms since, although only a
fraction of venture capital investments reach the IPO, most of the total value to the
investors is created in these exits (Bygrave and Timmons 1992, Gompers and Lerner
1999). However it has been shown in the US market and in UK as well, that IPO is a
13 This suggests that a motivation for syndication is partly to gain experience: less experienced VCs therefore tend to syndicate, and such VCs are more likely to be associated with failure than success presumably because the Lead VC has compensatingly large experience on which the Follower VCs can draw. In the longer run, the followers will presumably reciprocate the ‘generosity’ shown them by the leader. (Lockett and Wright, 1999).
60
Chapter II
feasible alternative for only few small businesses14. VCs may rely on the IPO markets to
a widely different extent depending on their strategy. Advantages of a non-IPO exit
could be related to greater privacy or lesser external pressure on operating performance.
Often a trade sales provide more immediate liquidity than IPOs: a trade sale of a 100%
stake liberates capital immediately, while only a part of the company is sold in an IPO
(Schwienbacher 2002).
Hence the drawback with using only the number of IPOs from new company
investments is that performance measure would be biased upwards, since it counts only
for the value of very positive exits. One can circumvent this issue by calculating a total
number of positive exits, i.e. including also the trade sales (Laine and Torstila 2004).
Measures of exit rates are interesting not only as a proxy of investment success; they
also have value to practitioners as they evaluate whether their investment memoranda
are realistic. Studying a sample of 138 US-based VCs between the period 1990-2000
consisting in 4500 portfolio companies, Laine and Torstila (2004) suggest that the exit
rate may be affected by such factors as the size and the portfolio composition of the
fund, including industry preferences and the focus on early or later stage investments,
these latter measured with dummy variables. Their findings are consistently with
Kaplan and Schoar (2005): large VCs have significantly higher rates of exit success,
perhaps due to a better reputation as quality certifiers, consistently with the findings of
Sahlman (1990) relatively to those VCs which may have a larger investment universe
14 For instance Schwienbacher (2002) reports the following exit frequencies from a survey of 67 U.S. funds: IPO (+ sale of quoted equity) 29.9%, trade sale / acquisition 30.3%, management buyout 2.0%, secondary sale / refinancing 5.0%, and finally liquidation (write-off), 32.8%.
61
Chapter II
than smaller one. Sole funds, i.e. funds that receive no follow-up have significantly
lower exit rates. This is probably due to reverse survivorship bias: VCs who perform
badly never are not likely to have the chance to raise another fund. Finally, the stage
and industry focus of the fund seem to matter less than thought, although expansion
stage funds had larger exit rates in this sample.
There appears to be a need for further research into VCs performance as
measured by exit rates, where future uncertainty no longer clouds the results. the
question is: can we use exit rates as a reliable proxy for VC investment success? Some
steps in this direction have already been made. Hocberg et al. (2005) replicated Kaplan
and Schoar’s (2005) VC fund-level performance model, which relates performance to
log fund size and log fund sequence number (each included in levels and squares) and a
set of vintage year dummies, using exit rates instead of direct fund return as measures of
performance. Like Kaplan and Schoar, they found only weak evidence that more mature
funds perform better, and strong evidence that larger funds perform significantly better.
Furthermore the relation between fund performance and fund size is increasing and
concave, consistent with diminishing returns to scale. The authors finally repeated their
analysis for a subset of their sample VCs for which they were able to find individual
fund return, and show that IRR measures and measure based on the fraction of
companies that exit are very high correlated.
62
Chapter II
2.4. Conclusions: what measure of performance should be
used?
Given the generally accepted importance of the VC industry as such and the
large amount of literature about venture capital, it may seem surprising that there are
only a few papers analysing the returns of VC. However, an analysis of the profitability
of investments in private equity is no easy task since information within the private
equity industry is by definition "private", compared to e.g. public markets, and
transparency requirements are limited. The common use of fund valuation data provided
by two commercial vendors Venture Economics and Venture One, has been criticised
by e.g. Ljungqvist and Richardson (2003) for having three principal shortcomings: (i)
the data is available only in aggregate rather than in fund-by-fund format; (ii) returns
data is largely provided by VC firms on a voluntary basis and thus potentially subject to
selection biases; and, (iii) the data is based on unrealised as well as realised
investments, which introduces noise and potentially biases due to subjective accounting
treatment. Ljungqvist and Richardson (2003) show that the IRR of the average fund
does not turn positive until the eighth year of the fund’s life (the so called “J-curve
effect”), which means that it is only at the very end of a fund’s life that excess returns
are realised. In addition, external valuations of portfolio companies only exist in the
events of IPO’s, trade sales based on tradable securities or cash, additional financing
rounds including third parties or if the company files for bankruptcy. Therefore,
according to Ljungqvist and Richardson (ibid), the calculations of interim IRRs
63

Chapter II
computed before a fund reaches maturity are not very informative. Cumming and Walz
(2004) show that there are systematic biases in the reporting of interim IRRs which is
explained in terms of cross-country differences in accounting standards, legality and
proxies for information asymmetry between VC managers and their institutional
investors. In addition, Woodward and Hall (2004) argue that reported returns from VC
firms are too low in a rising market but too high in a falling market. Cumming and Walz
(2004) show that experienced VC firms tend to report significantly lower valuation than
their younger, especially early stage and high technology focused, counterparts. A final
example of challenges when evaluating and comparing IRRs, is the unclear and
inconsistent use of net and gross returns, i.e. whether the reported results include or
exclude fees to the VC firms.
Comparing results from different analyses on VC performance is thus
complicated. Having said that, now it still remain to decide which measure of
performance is the more appropriate for this study. A number of studies has examined
this specific issue, some of them focusing on the performances of VC-backed
companies whilst others focusing directly on VCs’ performances (see e.g. Brophy and
Gunter, 1988; Bygrave, 1989; Chiampou and Kallett, 1989; MacMillan et al., 1985;
Cochrare, 2001). In our case, we wish to concentrate on the impact that diversification
has on VCs’ performances, thus choosing a performance measure at the fund level.
We have seen that the secular returns to venture capital seem to be rather low
given the very high risks associated with it. We have also noted that returns to venture
capital overestimate the true returns since they are (a) individual rather than portfolio
64
Chapter II
returns and (b) they ignore the costs of VC salaries and carried interest (Cochrane,
2004). It is conceivable that the correct estimates of these returns will find them to be
below those of the relevant risk-adjusted benchmarks.
Ideally, one would measure fund performance directly, using the return a fund
achieved over its ten-year life. However, returns for individual funds are not
systematically available to researchers as VC funds generally disclose their performance
only to their investors and Venture Economics only makes fund returns publicly
available in aggregate form. Some researchers have recently had access to disaggregated
performance data from Venture Economics, but only in anonymous format (see Kaplan
and Schoar 2005, Jones and Rhodes-Kropf 2003). Absent a facility for identifying
individual funds and thus matching their returns to their portfolio strategy
characteristics and other cross-sectional variables, these anonymous data would not help
in examining the effect of VCs portfolio strategies on performance.
This latter concern raises the following question: can we then use exit rates as a
proxy for investment success? Exits will differ widely in their terms and the price
obtained. We should certainly be careful in making inferences based on, say, the IPO
exit rate only. Although IPOs have often been a high profit exit method, there may be
characteristics of the portfolio companies or market situations in which a particular fund
would find other exit methods more optimal.
The total rate of successful exits, however, while not a perfect proxy for
performance, presents fewer problems. We can in most cases safely assume that a
venture capitalist will prefer almost any kind of exit to liquidation. The exit rate can
65

Chapter II
mostly be more clearly observed from the outside than the actual cash flows of the fund.
In contrast, the calculation of performance through internal rates of return (IRR) is
tricky in terms of both data availability and measurement problems. As an example of
the latter, in IPO exits, venture capitalists typically keep a large stake for a certain
period after the IPO and exit piece by piece (see Cumming and Macintosh, 2003, for
partial exits). The difficult part for an outside observer would be to track all the actual
cash flows the venture capitalist receives from selling portions of its ownership after the
IPO.
66

Chapter III
CHAPTER III
Research Framework and Hypothesis
This research examines the many strategies which VCs may use to cope with
their investment portfolio. The focus is on the analysis of relationships between
portfolio strategies and the performance of a VC. There is a large and growing
literature analysing the return of VCs’ investments (Jones and Rhodes-Kropf 2003,
Ljungqvist and Richardson 2003, Kaserer and Diller 2004, Cumming and Walz 2004,
Cochrane 2005, Kaplan and Schoar 2005). The majority of these papers study the
relative performance of VCs compared to public markets. However, there is much less
understanding about the impact of portfolio strategies on the performance of VCs. In
particular this research’s aim is that of filling this gap by examining the impact of
portfolio diversification versus specialization strategies on the rate of positive return of
VC funds.
Portfolio diversification versus specialization is a particularly interesting issue in
venture capital, where “generalist” funds (involved on many different markets) work
alongside funds focusing their portfolios on specific stage of growth, industries and
geographical areas (EVCA, 2005).
Although finance and strategic management researchers have increasingly
widened the scope of research on VCs, the latter’s portfolio strategies have been rarely
67
Chapter III
investigated (e.g. Norton and Tenenmbaum 1993). In the light of increased importance
of the Private Equity and Venture Capital markets within Western economies,
researchers have been recently paying more attention to this issue (Hellmann and Puri
2002).
Since this study examines the relationship between specialization versus
diversification strategies and the performance of VCs, it applies to the management and
finance theory which empirically supported the linkages between the industrial
composition of a portfolio of investments and its performance. Though, even if some
previous studies showed the existence of heterogeneity in the VC market relatively to
managerial approaches, preferences for particular stage of development of the supported
deal, business selection criteria (Robinson 1987, Norton e Tenenbaum 1993, Elango et
al. 1995, Wright and Robbie 1998, Manigart et al. 2002), little attention has been paid
on how VCs cope with composition of their portfolios. On the contrary, recent research
showed that while some VCs specialize only in certain industries, stage of development
and countries, keeping their investment strategy very focused, others diversify into
different markets (Cumming 2004). Recent reports on the European VC industry point
out that many players are defining their operative area by accurately selecting their
investment scope along different dimensions – i.e. industry, geographic origin of
investee companies and stage of development of deals – (EVCA 2005, The Economist
2004), while some others ramify their organizational structure in specific fields in order
to develop a context-specific knowledge as a competitive advantage (Harper and
Schneider 2004).
68
Chapter III
Surprisingly, little knowledge exists as to how VCs develop their investments
portfolio, even if the decisions regarding investment scope are key issues for corporate
strategy (Hofer and Schendel 1978). By examining the activities of UK Private Equity
and Venture Capital funds issued from 1981 until 2000, this research advances that VCs
performance is influenced by the choices of composition of their portfolio, along three
possible dimensions: geographic dimension (i.e. the geographic origin of the investee
companies); the stage of development of selected deals; the industry or technological
field of the investee company.
It is important to examine factors influencing these decisions and the
consequences on VCs performance. Our study suggests that VCs’ performances are
contingent on their choices as to the composition of their investment portfolios. Also,
the decision determining the composition of a VC’s portfolio of investments and thus
the level of diversification, plays a crucial role in the creation of a fund. First these are
long term strategic decisions that are difficult to change. Second the maximum amount
a VC fund is allowed to invest in a single company as well as in certain financing
stages, industries, or countries is fixed in the partnership agreement with the limited
partners, i.e., the investors. A deviation from this agreement is only possible if all
limited partners approve.
Hence, since the portfolio decision are difficult to change and have a deep
impact on the development of the fund it-self, we address the following question: does
portfolio-diversification lead to higher performance than portfolio-specialization?
69

Chapter III
This research aims at contributing to the literature dealing with the strategic
decisions and performances of VCs. The suggested research question also calls into play
the debate on whether a diversification strategy is more or less effective than
specialization of portfolio investments. The literature on strategic management dealing
with diversification has recently convened that when a VC firm has a portfolio of
correlated companies, its performances are better - due to the strategic fit between the
logic dominating its core business, its distinctive competences and the enterprises
included in its portfolio – than those produced by a firm implementing a “pure”
diversification strategy centred around the portfolio effects connected with
diversification in different industries, markets and stage of development (Robins and
Wiersema 1995, 2003, Palich et al. 2000). VCs invest in highly risky ventures with the
hope of obtaining a profit in return. While, on the one hand, the traditional financial
approach suggests that diversification eliminates non-systematic risks (Scharpe 1964,
Brealey and Myers 1996), on the other, the competence-based approach seems to
support greater specialization of VCs portfolio as a means of reducing uncertainty
(Bygrave 1987, Lubatkin and Rogers 1989, Manigart et al. 2002).
Although the existence of a huge literature from both management and financial
fields, the answer to the question whether diversified or focused firms perform better
still remain ambiguous (Robins and Wiersema 2003). Exploring this question in the UK
market is important for several reasons. Venture Capital has become an important part
of the economic and financial system in Europe, having grown enormously in the last
decade (Bottazzi and Da Rin 2004). UK have been representing 50% of all Private
70
Chapter III
Equity and Venture Capital operations hold in Europe since the late Nineties and even
far more during the previous years, thus representing the ideal setting where conducting
analyses and examines the said phenomenon.
Exploring this question may contribute to the literature on corporate strategy in
that it expand the breath of corporations that are included in the analysis of how
diversification and specialization strategies affect performance. Understanding these
issues contributes to the debate on VC strategy and performance, by analysing the
different behaviours and determinants of success of VCs, by comparing different stream
of theory supporting two contrasting point of view: portfolio diversification versus
specialization.
After supporting the need and relevance of doing research on this topic, I will
discuss two different theoretical frameworks, one supporting portfolio diversification
while the other leading to strengthen portfolio specialization. The first approach apply
to the financial intermediation and portfolio theory, while the second one rely on the
assumption of the resource/knowledge based view. I will show that many studies who
refer, more or less explicitly, to one of these two theoretical arch-frames, tend to suggest
that portfolio diversification either specialization is the better strategy for a VC coping
with risk-return of its portfolio. This will help me introducing the thesis I will advance
in the hypothesis sub-section.
71
Chapter III
3.1. The importance of portfolio strategies to Venture Capital
VCs invest in new ventures with high risk exposure and high growth potential.
Academic studies on VC have over time investigated a number of related topics. In
particular, special attention has been given to the managerial competences of VC firms,
assessing their role and participation in the management of funded enterprises (Sapienza
1992, Hellman and Puri 2000, 2002). Such studies have essentially subscribed two
empirical approaches (Wright and Robbie 1998): on the one hand, attention has been
given to the creation of adequate structures for the governance of relationships between
venture capitalists and funded enterprises; on the other, focus has been placed on a
number of processes for the management of different activities. In the first case, more
attention have been given to the means and practical instruments available to VCs in
order to control for the business run by funded companies, through screening and
evaluating business plans, and with the preparation of pay-off structures and contractual
clauses. The final goal for VCs is obviously the control and reduction of risk exposure
when deciding to invest in a new portfolio company.
The abovementioned second empirical approach focuses on the managerial
processes used by VCs to support funded companies, and on the running of their own
activities (e.g. Bygrave and Timmons 1992, Fried and Hirsh 1994, Tybejee and Bruno
1994). Said approach comprises different studies which have examined the reasons
behind the heterogeneity of VCs which affect their managerial styles, their preferences
for specific development stages of ventures, and their strategic differences in selecting
72
Chapter III
the latter. Given the heterogeneity of venture capital, some studies have examined
different kinds of VCs, identifying multiple managerial styles, investment profiles,
preferences for given fields and development stages of enterprises or ventures requiring
financing (Robinson, 1987; Florida e Kennedy 1989, Elango et al. 1995, Wright and
Robbie 1998). On the basis of such studies, some researchers have dealt more directly
with VCs’ choices between diversifying and concentrating their investment portfolio.
Although many studies have examined VC firms’ strategic choices as to which
development stage is to be preferred when making investments (see e.g. Norton and
Tenenbaum, 1989, Gupta and Sapienza, 1992, Manigart et al. 2002), little attention has
so far been paid to such VCs’ diversified investments.
In the previous literature-review section I tried to show how the issue of
portfolio diversification or specialization is important, since it casts light on the way
VCs cope with the strategic decisions about the management of portfolio companies
having a direct impact on VCS performance. By using data collected by means of postal
questionnaires, Norton and Tenenbaum (1993) have evaluated a number of suggestions
on the many strategies orienting VCs’ choices as to the composition of their portfolios
in order to assess how risk exposure is managed thereby. Their analysis suggests that
the need to collect information so as to reduce uncertainty induces VCs to concentrate
on industries they are most familiar with. In particular, the high uncertainty of the early
growth stages of deals induces VCs to include a small number of companies in their
portfolio and to specialize in given industries. Conversely, VCs engaged in later
development stages prefer to spread out their involvement across different industries
73
Chapter III
and/or different countries. Gupta and Sapienza’s work (1992) have a similar idea and
find very similar evidences. In particular, their work suggests that VCs investing in
early stage companies are generally more involved in managing funded enterprises than
VCs investing in later stage enterprises. Some VCs even specialize in specific corporate
development stages, in which their acquired expertise produces greater value (Carter
and Van Auken 1994). Moreover, it appears that large VCs with large funds diversify
their portfolio much more than small firms (Gupta and Sapienza 1992). Recent works
try to shed light on VCs’ heterogeneity, suggesting that industry-specialized
organizations should be more successful then diversified VCs, and claiming the need to
deepen the understanding of the linkages between VCs’ performance and their degree of
diversification. Bottazzi et al. (2004), analysing the European VC Industry found that
knowledge and human capital specialization at the level of the firm is a fundamental
driver to understand VCs’ strategies: specialized VCs are more active and more
involved with their portfolio companies. Gompers et al. (2005) studying the reactions of
US VCs to shifts in public market signals, found that the most successful were the VCs
exhibiting a higher level of industry-specific focus of their investments portfolio. These
works stress on the importance of knowledge and resources accrued by VCs and on the
constraints of diversified firms in redeploying their resources among investments
pertaining to different business areas. Thus a greater industry focus should reduce the
inefficiencies associated with spreading the VC’s resources across portfolio companies
(Fulghieri and Sevilir 2005). On the other hand, Knill (2005) found that industry and
stage-of-development levels of diversification are positively related to VCs’ growth, in
74
Chapter III
the US market. The author found that, by playing a “pure diversification strategy”, VCs
can minimize portfolio risk, thus accruing the amount of capital under management.
Literature on VCs has so far taken into account the wide variety of investments
in venture capitalists’ portfolios (Elango et al. 1995, Wright and Robbie 1998).
Nonetheless, there still remains a relatively small number of studies investigating on the
impact these decisions have on VCs performance.
Many studies look at what VCs do and how they are different from more
traditional investors (Morris 2001). Previous literature approached the VCs portfolio
strategy issues as a means to manage risk/returns (Gupta and Sapienza 1992, Norton
and Tenenbaum 1993, De Clerq et al. 2001), emphasizing two opponent strategies:
diversification or specialization of their investments portfolio. Most of these studies,
explicitly or implicitly, refer to relevant theoretical concepts that have been used outside
the venture capital context. Those concepts provide some insights into answering my
guiding question. At the same time though there are few empirical studies that
simultaneously touch upon this question and use these theoretical concepts. In particular
one can retrieve two main stream of theoretical approach which apply to the debate on
diversification versus specialization of VCs portfolio. The first one pertain to the
financial intermediation theory and financial portfolio theory, which look at VCs as, on
the one hand, provider of financial capital to investee companies, on the other hand as
resource “allocators” for their investors (Chan 1983); the second one is deeply rooted in
the concepts of the resource/knowledge-based perspective, which emphasizes the
relevance of VC-specific capabilities and knowledge in certain business fields
75
Chapter III
(industries, countries and/or stage of development) relatively to their investment
approach.
Also this issue calls into question the role of VC as financial intermediaries or
active managers relatively to their portfolio companies. The academic debate on the
greater effectiveness of diversification versus specialization on VCs performance is
intertwined with the debate on the role of VC firms, i.e. whether they are mere financial
intermediaries or, rather, managing companies highly involved in the management of
backed firms. According to the former perspective, a well-diversified portfolio may thus
reduce the overall risk without reducing its results (Markovitz 1970). If, instead, VCs
are perceived as being actively involved in the management of backed companies,
providing both financial capital and human capital, relational resources, know-how and
professional skills, a portfolio focused on the business domains where VCs are most
likely to increase the value of their portfolio companies should lead to greater
performance.
3.2. The Financial Intermediation Perspective
Starting with Spence (1974), there is a sizeable theoretical literature regarding
VCs as intermediaries for equity investors seeking profitable business in which to
allocate their resources, and for potential growing companies who need capital to
implement their development projects. In this regard, VCs have been studied from and
76
Chapter III
agent/principal perspective (e.g. Jansen and Meckling 1976, Busenitz et al. 1997)
and/or applying the concept of the signalling theory15, which look at VCs investments
who correlate the development of VCs to their ability to stay in the market as repeat
players (Booth and Smith 1986) by signalling good investments and accrue their
reputation as providers of venture opportunities and/or capital ready to invest.
Following this perspective, VCs function as intermediaries between investors
and entrepreneurs, drawing funds from the former to invest in the latter. Why don’t
entrepreneurs simply do directly to the investors? Because VCs have an important role
in managing the investments that investors lack and their relationship to the
entrepreneur helps to resolve information asymmetries that would otherwise exist (Chan
1983). Building upon this literature some authors developed a theoretical model that
shows the general value of VCs as intermediaries - in a market with imperfect and
costly information – for resource allocation and welfare of investors. According to this
model, when all investors are uninformed, entrepreneurs are induced to undertake
inferior projects, offering low returns, and investors consequently will not enter the
market. However, the presence of some zero-cost, perfectly informed investors, as VCs
are assumed to be, induces entrepreneurs to select projects with higher investor
returns.16
15 In addition to these two theoretical theorys, a few studies also refer to other concepts, such as ‘Procedural Justice Theory’ (e.g Busenitz et al. 1997, 2004, Sapienza and Korsgaard 1996, Sapienza et al. 2000). However, I will not review those concepts in detail since they have not been widely used/mentioned and/or don’t seem to provide much additional insights with view to our guiding question.16 Here, Chan (1983) argues that VCs can be considered zero-cost agents, since the clients pay their costs. Furthermore, as information about firms is reusable for different clients, there are economies of scale in the intermediary’s operations, even if the intermediaries’ information cost is assumed to be the same for investors and intermediaries.
77

Chapter III
An important valuable role played by VCs as intermediaries, is particularly
evident for ventures going public. Megginson and Weiss (1991), for instance,
highlighted the role VCs have in certifying the quality of entrepreneurial ventures at
IPO to outside investors in the markets, since many VCs bring companies to market on
an ongoing basis, and therefore should have a very strong incentive to establish a
trustworthy reputation in order to retain access to the IPO market on favourable terms.
Furthermore, the value of VCs’ reputational capital is likely to exceed the maximum
possible benefit from certifying falsely – because successful fund managers who are
able to establish profitable ‘follow on’ funds, are also able to achieve an enhanced deal
flow from entrepreneurs, and are more likely to retain/attract high-quality staff.
Similarly, Sahlman (1990) pointed out that successful VCs bring instant credibility
associated with their capital; their contacts in the financial community can make it
easier to raise capital from other sources including IPO. Therefore, all else being equal,
investors may be willing to pay more for companies brought to market by VCs
perceived to be better able to oversee and guide new enterprises, resulting in a less
under-priced issue (Barry et al. 1990).
Moreover, VCs’ role as intermediaries might not only be relevant with view to
the financial markets. Instead, VCs act as good agents reducing uncertainty and
information asymmetry by facilitating ventures’ access to non-financial resources such
as personnel, suppliers and customers, network position (Manigart and Sapienza 1999,
Stuart et al. 1999). Because VCs are active in a range of activities and functions that
span industrial segments, they can act as information intermediaries, providing
78
Chapter III
privileged information access and reducing search costs for start-ups seeking
appropriate cooperation partners and for investors seeking good investment
opportunities. Indeed since investor may face with great uncertainty about the quality of
young companies, they rely on the prominence of the affiliates of those companies to
make judgements about their quality (Hsu 2004).
Whilst developed in the context of the mature firm, the logic of the agency
theory also appealed to researchers examining the VC-entrepreneur relationship - where
the VC is usually assigned the role of the principal, and the entrepreneur the role of the
agent.17 In fact, this theory arguably is the most commonly employed concept in
research on venture capital.18
Most agency models are based on a set of common assumptions (Eisenhardt
1989, Petersen 1989) relatively to the relationship between the VC (principal) and the
backed-company (agent): 1) VCs face situations of uncertainty with respect to the task
to be undertaken by the agent, 2) VCs have different risk preferences over the returns
they will receive from the contract, 3) principal and agents pursue different goals, or 4)
maximise different utility functions, 5) VCs are boundedly rational, and 6) VCs and
backed-companies have different information sets in that the principal cannot fully
observe the outcome and quality of the agent’s action.
17 In addition, there is also sometimes said to be another principal-agent relation, where the VCs serve as agents to their investors (e.g. Amit et al. 1990, Bergemann and Hege 1998, Brettel et al. 2001).18 Authors that have either explicitly or implicitly referred to this concept in the venture capital context are, for instance: Admati and Pfleiderer 1994, Amit et al. 1998, Arthurs and Busenitz 2003, Barney et al., 1989, Barney et al. 1994, Barry et al. 1990, Bruton et al. 2000, Busenitz et al. 2004, Fiet et al. 1997, Gompers, 1995, Gompers and Lerner 1999, Gorman and Sahlman 1989, Hellmann 1998, Kaplan and Strömberg 2001, 2002, 2003, Lerner 1994 1995, Ruhnka and Young, 1991, Sahlman, 1990, Sapienza et al. 1996, 2000, Sapienza and Gupta 1994.
79
Chapter III
Agency models show that that information asymmetry gives rise to two main
problems: adverse selection and moral hazard. Adverse selection might be due to
‘hidden information’. The principal might be able to observe the activities of the agent,
but the agent might have private information (e.g. about his own capabilities or certain
details of his project) that is not available to the principal. This, in turn, might lead to a
misinterpretation by the principal regarding the agent’s ability, and, as a result, to a
suboptimal contract, at least from the principal’s perspective. Moral hazard, by contrast,
might be due to ‘hidden action’. Specifically, it refers to unobservable behaviour by the
agent, such as low effort or shirking, which impacts negatively on the principal’s
welfare. Since the principal often cannot observe the agent’s activities, it is difficult for
him to differentiate a negative outcome of an activity due to factors under the control of
the agent (e.g. inadequate effort) or due to factors outside the agent’s control. Thus, the
agent can ‘explain’ unsatisfactory outcomes by exogenous factors and act – without
sanctions – against the interests of the investor. Clearly, both types of problems are
likely to lead to conflicts that have a negative impact on the performance of a fund.
Indeed, the suitability of the financial intermediation theory in the context of
venture capital seems obvious. Firstly, there is no doubt that uncertainty is a
characteristic of all VC investments. Secondly, both VCs and entrepreneurs can be
assumed to be rational individuals who might have different risk preferences and
different utility functions and try to satisfy different self-interests. (For instance, most
VCs will be primarily interested in the maximization of their internal rate of return of
their investments; but whilst most entrepreneurs will also be interested in the monetary
80

Chapter III
outcome of their projects, they might have additional intentions such as ‘on the job
consumption’, ‘independence’, and/or ‘developing a track record’). Thirdly, in VC-
backed ventures conflicts of interest are likely to emerge over specific issues such as
valuation, exit timing, and the allocation of resources and efforts (Sapienza et al. 2000).
Fourthly, information asymmetries are likely to exist between the VC and the
entrepreneur because of the difficulty and costs of day to day monitoring and the
technical nature of the activities conducted by the entrepreneur (Amit et al. 1998). The
entrepreneur is likely to know more about his project and its likely success, or failure;
and he is also likely to know more about his own ability and motives than the investor
(Bygrave 1988, Gompers and Lerner 1999)19. At the same time, as mentioned before,
principal-agent theory strives to identify not only causes of potential conflict between
principal (VC) and agent (entrepreneur) but also suitable means to prevent or deal with
their negative consequences. Kaplan and Stroemberg (2001) point out that theory has
identified three primary ways for the VCs to mitigate possible agency risks: pre-
investment screening, financial contracting, and post-investment monitoring and
advising.
19 The VC literature has discussed some of the reasons for possible manipulations of information by entrepreneurs. For instance, the entrepreneur might be afraid that negative information makes the VC decide against (further) investments in the venture. Similarly, the entrepreneur might be afraid that negative information makes the VC replace the management team completely or reduce its rights (Macmillan et al. 1988, Fried and Hisrich 1995). In both cases there is an incentive for the entrepreneur to keep back negative information and to present himself to the VC in the best possible way (Wright and Robbie 1998). This in turn, might lead to the problem of adverse selection of ‘low-quality’ projects, because it is hard for investors to distinguish between good-quality and poor-quality projects (Amit et al. 1999). Similarly, the problem of moral hazard (due to hidden action) might result in the entrepreneurial setting because the investor is not able to observe whether the entrepreneur is working hard and making sensible decisions, or whether he is planning to ‘take the money and run’ (Amit et al. 1990, Brettel et al. 2001).
81
Chapter III
Building upon the principal-agent theory, there is large academic literature on
financial contracting that looks at the possibilities of avoiding conflicts between
principals and agents in the first place, or at mitigating their negative consequences
should they occur. The focus of this literature is on contractual arrangements aimed at
aligning the principal’s and the agent’s interests, and to incentive the agent20, as well as
on the possibility to limit the VC risk exposure by accurately building a portfolio of
investment companies that shield the VC from company-specific risk. This strategy
explicitly apply to Markovitz portfolio theory (Markovitz 1970). Modern portfolio
theory states that rational investors will use diversification to optimize their portfolios.
Basic concepts of the theory are Markowitz diversification and capital asset
pricing model, which represents portfolios of assets a weighted combination of
investments and assets’ returns as random variables. The return of a portfolio is thus the
weighted combination of the assets' returns and portfolio risk is the standard deviation
of the portfolio returns. The model assumes that investors are risk averse. This means
that given two assets that offer the same expected return, investors will prefer the less
risky one. Thus, an investor will take on increased risk only if compensated by higher
expected returns. Conversely, an investor who wants higher returns must accept more
risk. The exact trade-off will differ by investor based on individual risk aversion
characteristics. The implication is that a rational investor will not invest in a portfolio if
a second portfolio exists with a more favourable risk-return profile - i.e. if for that level
of risk an alternative portfolio exists which has better expected returns. An investor can
20 This might involve, for instance, the appropriate allocation of cash-flow-rights (so-called cash-flow models), voting- and board-rights (so-called control-models), and/or liquidation-rights (so-called debt-models) (Hart 2001, Kaplan and Stroemberg 2001, 2003).
82
Chapter III
reduce portfolio risk simply by holding instruments which are not (perfectly) correlated.
In other words, investors can reduce their exposure to individual asset risk by holding a
diversified portfolio of assets. Diversification will allow for the same portfolio return
with reduced risk. For diversification to work the component assets must not be
(perfectly) correlated. Asset-specific risk - the risk associated with individual assets -
within a portfolio can be reduced through diversification. Systematic risk, or market
risk, refers to the risk common to all assets. Systematic risk cannot be diversified away
(within one market). Within the market portfolio, asset specific risk will be diversified
away to the extent possible.
Academic studies on diversification are not only finance-related, but come also
from other disciplinary areas. Industrial Organization economists have examined the
performances of diversified or specialized businesses since the 1960s (Arnould 1969,
Gort 1963, Markham 1973, Lang and Stulz 1994). Scholars focusing on the
development of management capabilities have looked at the potential applicability of
managerial expertise to a variety of different businesses (Andrews 1969, Drucker 1955,
Koontz 1961). Since the late Seventies it has sparked a lively (yet unsolved) debate on
the effectiveness of diversification in completely different ventures (Levy and Sarnat
1970, Higgins and Schalls 1975) as opposed to more focus on interconnected ventures
(Bettis 1981, Rumelt 1982, Markides and Williamson 1996, Goold and Luchs 1993).
In short, whilst acknowledging the positive impact of diversification on performances,
attention is shifted to its potential extension. In other words, to what extent can the
incorporation of different activities improve a firm’s performances?
83

Chapter III
Advocates of “pure” diversification insist on the financial advantages resulting
from the so-called “portfolio effects”, thanks to the reduction of risk exposure through
the combination of ventures whose financial flows are not correlated (Madj and Myers
1987, Berger and Ofek 1995).
As a matter of fact, the specific risk of an investment may be reduced by
increasing the industrial diversification of the portfolio (Kim et al., 1989). Finance
researchers have underlined further advantages, such as the link between risk reduction
and increased debt capacity whose interests, being fiscally deductible, entail notable
resource savings (Amit and Livnat 1988). According to such a theory, diversification
allows for resource and competence surpluses to be used in different territorial, market
o technological scope; diversification is thus much more than a mere opportunity to
reduce risk exposure by allocating completely fungible resources (Barney 1997).
3.3. Conclusion on the financial intermediation perspective
In sum, the literature that takes a financial intermediation perspective on the VCs
focuses on the VCs’ role in alleviating the problems resulting from information
asymmetries between the ventures and third party providers of financial (and non-
financial) resources. As such, this theory provides explanations not only for why VC
exist as an independent type of investor but also for how VC backing might be related
to venture performance.
84
Chapter III
Financial intermediation theory focuses both on the information asymmetries
between VCs, investors and entrepreneurial ventures, and on agency problems resulting
from likely information asymmetries (i.e. the VC's lack of knowledge compared to the
entrepreneur) and opportunistic behaviour by the entrepreneur, which have the potential
to result in severe problems for the venture and suggests means to alleviate these
problems, such as contractual arrangements and portfolio diversification.
However, in this context a major assumption is that VCs are able to overcome
information asymmetries and uncertainty – and, by this, ensure the quality of the
ventures they back and ‘certify’. But the intermediary/signalling literature hardly looks
in detail at how VCs actually deal with those issues.
There is a growing body of literature that suggests that the principal-agent theory
neglects important aspects of the VC-entrepreneur relationship. For instance, it is
argued that it is a one-dimensional view of the relation between the VC and the
entrepreneur. Sahlman (1990) for example, notes that, although VCs seem to retain
much of the power in the relationship with entrepreneurial ventures, there are in fact
checks and balances in the system: VCs who abuse their power will find it hard to
attract the best entrepreneurs, who have the option of approaching other VCs or sources
other than venture capital. Forbes and Milliken (1999), furthermore, point out that an
agency theory – although identifying problem areas and suggesting possible means to
deal with those problems - does not take into account how decision-making processes
themselves can affect the perception and resolution of problems.21
21 As a consequence, an increasing number of scholars recommend alternative/additional theoretical theories and models. For instance, a recent stream of literature suggests that there might be a ‘double-sided moral hazard’ problem (e.g. Casamatta 2000, Dessi 2000, Inderest and Mueller 2001, Repullo and
85
Chapter III
On the other hand, the agency theory and the related contracting theories fall
short of explaining two, arguably even more important, issues in the venture capital
context. Firstly, agency theory focuses mainly on the VCs’ role as financiers, and on
contractual arrangements to mitigate VCs’ downside potential when investing in
entrepreneurial ventures. But it has little to say about other key contributions of VCs to
their investee ventures: the provision of non-financial, value-added resources. Hellmann
and Puri (2002), for instance, argue that – although the traditional financial theory tends
to focus on the information-based roles of financial intermediaries, dealing with the
alleviation of moral hazard or adverse selection, and emphasizing the monitoring role of
VCs, who gather information about the firms they finance - the role of VCs extends
beyond that of traditional financial intermediaries like banks; they play a broader role in
the professionalization of the companies they finance.
Also, the portfolio diversification theory clashes with some particular features of
venture capital. Financial portfolio theory states that systematic risk is equated with the
risk (standard deviation) of the market portfolio. Since an asset will be purchased only if
it improves the risk-return characteristics of the market portfolio, the risk of a security
will be the risk it adds to the market portfolio. In this context, the volatility of the asset,
and its correlation with the market portfolio, is historically observed and is therefore a
Suarez 1998, Schmidt 1999). Some scholars also argue that a ‘prisoner's dilemma’ model is a more appropriate conceptual lens for understanding the VC–entrepreneur relationship than agency theory, which emphasizes their potentially competing interests and monitoring costs (e.g. Cable and Shane 1997). Others furthermore point out that while the agency theory might provide a good fundament for explaining structural and compositional elements of control, it has limited ability to explain how the parties behave in their ongoing and reciprocal relationship - where aspects of cooperation might be at least equally important than aspects of competitive. As a consequence, some scholars recommend concepts such as ‘Procedural Justice Theory’ to ground research on venture capital (e.g. Busenitz et al. 1997, 2004, Sapienza and Korsgaard 1996, Sapienza et al. 2000).
86

Chapter III
given. Unfortunately, the venture capital market is far from being an efficient market,
and the several approaches to asset pricing that attempt to price assets by modelling
assets' returns cannot be applied, for at least 3 reasons: (1) venture capital is private in
nature, characterised by information asymmetries and lack of information which make it
not possible to rely on market returns with the specific aim of pricing; (2) venture
capital is illiquid so that assets (i.e. the backed ventures) can be sold to only a limited
number of potential buyers, and often at a great discount to their purchase price. (3)
venture capital has very volatile floatations, and hence one can observe valuation and
returns only when and if an asset is sold, which is not as common as it comes for
securities. As a matter of facts, portfolio theory rely on the possibility for (maximum)
prices paid for any particular asset, and hence the return it will generate, to be
determined based on its relationship with the market portfolio. But for the said reasons
it is fairly impossible to determine the actual returns of a market-portfolio in the venture
capital market22.
These particular feature of venture capital market may limit the possible benefits
a VC may gain by implementing a strategy of pure diversification of its portfolio. In
particular the high-risk associated with the nature of the VC activity itself (i.e.
supporting potential future growing companies) may push the VC to rely to other
strategic approaches instead of a pure portfolio diversification, as I will illustrate in the
Hypotheses section.
22 Relatively to the discussion on the applicability of financial theory and portfolio diversification in the contest of Venture Capital I owe a special debt of gratitude to Professor Robert C. Cressy, whose speeches, lessons and private conversations on said topic gave me insight and inspiration.
87

Chapter III
The deficiencies of agency theory are addressed, to some extent, in the final
strand of theoretical oriented literature we shall discuss, namely the resource-based
theory, which follows in the next section.
3.4. Resource-based theory
The intermediation perspective treats VCs as a homogenous group, without
acknowledging likely differences between them (Hsu 2003). As such, it cannot explain
the apparent differences in the performance of VCs. When a group of competing firms
choose similar (contractual) approaches to agency problems, these approaches cannot be
sources of competitive advantage for any one firm (Barney and Hesterly 1996).
The resource-based theory views the firm as a unique bundle of heterogeneous
resources (Barney 1991, Penrose 1957, Wernerfelt 1984), and builds on two basic
assumptions about a firm’s resources: 1) that they can vary significantly across firms,
and 2) that such differences can be sustained due to resource immobility. Thus, no two
companies are alike; and a firm will have a competitive advantage if it possesses unique
bundles of resources that are valuable, scarce, hard to imitate, hard to replace, and that
enable the firm to perform better activities more efficiently or effectively than
competitors (e.g. Amit and Shoemaker 1993, Barney 1986, Conner 1991, Dierickx and
Cool 1989, Penrose 1968, Peteraf 1993, Spender 1993).23
23 As Teece (1997) notes, the resource-based theory has much in common with the work on organizational ecology and commitment, as it sees firms as heterogeneous because of their different resource
88
Chapter III
In this theory it is common to distinguish between two main groups of resources:
tangible resources (e.g. financial resources, physical assets, infrastructure) and
intangible resources (e.g. knowledge, reputation, human resources, culture ad
networks). It is also common to distinguish two main types of knowledge: explicit and
tacit (Nonaka and Takeuchi 1995, Polanyi 1962, Von Hippel 1986). Explicit knowledge
can be observed, communicated, transferred and imitated relatively cheaply and
quickly. Similar to ‘information’ explicit knowledge is often considered a public good
that is not relevant to individual wealth creation. Tacit knowledge, on the other hand, is
observable but is difficult to communicate and transfer, and can be imitated, if at all
only in a costly and prolonged process, and is thus considered by many as most
important resource of a firm (Barney 1991, Spender 1996).
In this context, the related concept of a firm’s (core) competencies or
capabilities must be mentioned. This concept assumes that resources are not normally
productive on their own (Hamel and Prahalad 1992). Instead, most tasks require that
several resources collaborate closely together to form competences that differentiate it
from its competitors. Thus, the interest is not in resources or capabilities per se but in
those capabilities that provide a competitive advantage relatively to other firms; and, as
Grant (1998) pointed out, it is the management’s core task to match a firm’s unique
resources or capabilities to the opportunities that arise in the external environment.
endowments and because those resources are ‘sticky’. This is distinctive from previous dominant approaches as advocated, for instance, by Michael Porter, who emphasized the importance of industry characteristics to explain performance differences of firms, arguing that any competitive edge achieved by firms in an industry will be short lived due to the high mobility of their rent-producing resources that can be bought and sold in factor markets.
89

Chapter III
However the resource-based theory has been mentioned explicitly only by a few
scholars respect to research on venture capital. Bygrave (1987) emphasized the
importance of VC’s knowledge as its distinctive capability, including innovations,
technology, and people in specific industry segments. Even more explicitly, Locket and
Wright (1999) argue that although the VC has been traditionally viewed as a financial
intermediary it may also be thought of as a “collection of productive resources”.
The applicability of the resource/knowledge-based perspective to the venture
capital context can be understood with view to the ventures particularly so when
referring to another resource-centred concept, the resource-dependence theory.
This concept emphasizes the constraints on the organization’s strategic choice
especially in situations of resource scarcity and environmental turbulence (Pfeffer and
Salancik 1978). According to this theory many firms do not control all the resources
they need. This might be, for instance, because environmental uncertainty makes it
impossible to own all relevant resources (Thompson 1967). Also, a firm’s strategy
might be particularly resource demanding such as is the case with fast growth, high-
innovation that aim for an IPO. For those companies acquisition of resources and
reduction of resource dependence becomes a vital activity.24
To explain this the resource-dependence theory suggests inter-organizational
association strategies are key. Among those strategies the adequate choice and
composition of the board of directors is said to be particularly efficient for small firms,
which cannot devote huge amounts of time and money to inter-organizational relations
24 In this context, a peculiarity of resource dependence theory, as opposed to neo-institutional theory, is its reliance on the effectiveness of managerial action and on inter-/organizational practices, which is seldom recognized as having an impact by neo-institutional scholars.
90
Chapter III
strategies (Aldrich 1979, Daily and Dalton 1992, 1993, Huse 1995, Pearce and Zahra
1992, Pfeffer and Salancik 1978).
The applicability of the resource-dependence theory in the venture capital
context is straightforward. Aldrich (2001), for instance, emphasizes the importance of
‘social capital’ that allows firms to obtain resources that are otherwise unobtainable to
them, such as knowledge, capital, clients, and access to suppliers, networks; and he
notes that VCs can be seen as one important part of the social capital for entrepreneurial
ventures. Fried et al. (1998) highlight that the board of directors of VC-backed ventures
- as suggested by the resource-dependence theory – plays an important role in the
acquisition of resources because. VC-backed firms are usually young and small, so that
board members, if sufficiently knowledgeable about the firm’s business, could make a
substantive contribution. Also the fact that both inside directors (founder-managers) and
outside directors (VCs) have significant ownership in the firm could provide an
incentive for the two parties to work closely together to ensure the success of their
venture.
Similarly, Jääskeläinen et al. (2003) note that there are two perspectives that
look at why VCs get involved in their portfolio ventures: monitoring needs and value-
added assistance/support. Monitoring needs result from agency risk, which gives rise to
the VCs’ governance with a need to monitor the activities of the ventures to ensure that
the conduct of the management is aligned with the interests of the VC. However, while
the governance of ventures concentrates on the value of reduced risks and prevention of
91
Chapter III
undesired outcomes, the assistance/support perspective considers the VCs’ involvement
as a valuable resource for the focal ventures.
In the same vein Busenitz et al. (2004) note that VC information may be more
valuable to start-up companies than to more later stage ones, because VCs bring
previous relevant expertise and experiences with them from earlier investments.
Theoretically, therefore, input from VCs – for instance on strategic issues - should lead
to decisions that are better than those that a start-ups could have generated otherwise.
Furthermore, VCs may even serve as intermediaries on behalf of essential factor
providers. Those VC-provided contacts have the potential to provide start-ups with a
more informed view of their business options. Thus, to the extent that VCs provide
information to start-ups on strategic issues, one might expect that it would be related
positively to improvements in venture performance (Busenitz et al., 2004).
3.5. Conclusion on Resource-based view
The resource/knowledge-based theory has been referred to by a number of
empirical studies, which indicate that VCs differ in their ability to identify and/or
develop successful companies.
Indeed, the applicability of this concept in the area of venture capital in general
and with a view to answering our own guiding research question is obvious. To begin
with it is plausible to argue that VCs – as all other companies - need certain resources to
92

Chapter III
develop (core) competences, which help them to differentiate themselves not only from
the more traditional investors but also from their peers. For this purpose, tangible -
financial - resources might be considered as one part of the bundle. After all, the VC’s
main activities are attracting financial resources from investors (or generating them
internally) and investing those funds into promising projects to generate profits. But
taken alone, financial resources are clearly insufficient for VC success since such
resources need to be managed effectively. They are often scarce (depending on the stage
of the cycle and the nature of the venture) but usually not ‘unique’.25 Instead, they are
transferable between firms at low costs, and as such ‘imitable’. As equity resources they
have (unlike debt) no time dimension and hence can be considered ‘durable’. Of course
they are always at risk when invested in a business with a view to earning profits. Thus,
financial resources are not sufficient to provide a competitive advantage to a VC.26
Relating this view to what it has been shown in the previous section, while
discussing venture capital literature on portfolio decisions, the resource-based theory
seems to support the empirical findings on the specialization of VCs’ portfolio in those
particular industries, stage of development and geographic markets, where VCs have
mostly accrued their capabilities and bundle of unique resources, leveraging on them in
order to built their own competitive advantage. Their particular knowledge and
25 In other words, these resources are not specialised to a particular company or VC.26 In this context, it should also be noted that if financial resources were the main determinant of investors’ success, there should be little reason for large investors to involve any third parties such as VCs, and to pay fees and to share potential profits whilst – in most cases – even bearing the full risk. Instead, large investors should safeguard against risk associated with investing in high-risk/-return ventures via contractual arrangements and/or diversification; and their success might be mainly due to economies of scale. But the fact that large investors are willing to do so, and the sheer fact that VCs exists as intermediaries in the financial markets suggests that, in many cases, there will be more to the investor’s success than just money.
93
Chapter III
capabilities allow VCs to differentiate themselves from more traditional investors but
also successful VCs from their less successful peers. This might happen, for instance,
because specialized knowledge and capabilities make them more capable of dealing
adequately with the risks, uncertainties, and information asymmetries associated with
investment opportunities.
Furthermore, the mentioned studies who stress on the active management role of
VCs, implementing those “hands-on” practices such as such as monitoring, corporate
governance, as well as a number of information-based advice and support services also
say that the these practices are time- and resource-consuming (Bottazzi et al. 2004),
hence limiting the number and range of portfolio companies on which these activities
are applicable. The assistance provided by venture capitalists to their portfolio
companies is largely based on the experience and information of the venture capitalists
(Barney et al. 1996, Bygrave and Timmons 1992).
Stretching over this idea under the resource/knowledge based lens, this might
entails that, in order to build a sustainable competitive advantage the VCs has to
develop unique capabilities that can be re-deployed to most of their portfolio
companies. Since time and resources are constrained, and uncertainty particularly high
in venture capital, VCs may specialize in particular areas of business (in terms of
preferred industries, countries and/or stage of development of selected deals). In other
words, VCs may decide to manage the uncertainties relatively to portfolio companies,
by accruing their capabilities in specific domains where selected companies pertain,
opting for a focused portfolio, as a means to control for risk-return. Specialized
94
Chapter III
resources are thus exploited to maximize the value of funded companies through the
creation of synergies between businesses (Brander et al. 2002).
Advocates of specialization in corporate strategy literature believe that multi-
business firms benefit from resource and competence sharing, only as far as such
benefits derive from the creation of synergies between correlated ventures (Grant 1988,
1991, Kanter 1989, Trautwein 1990, Goold and Luchs 1993), by means of which the
performance of a given portfolio is better than the sum of each single venture (Panzer
and Willig 1981, Prahalad e Hamel 1989, 1990). Attention is thus paid not only to the
portfolio of activities that can be managed contemporaneously, but also to the portfolio
of competences developed by the firm. The more each competence can be redeployed to
portfolio companies, the more it is convenient to keep said ventures in the VC’s
portfolio and to invest in the development and sharing of competences crucial thereto
(Campbell 1992, Stalk et al. 1992, Barney 1997).
In other words, the portfolio strategy is shaped by the way the VC
conceptualises its business and takes key decisions regarding the allocation of resources
and attention in similar technologies, product development stages, markets contests etc.
(Goold and Luchs 1993). Studies from corporate management largely agree that the
performances of a firm managing a portfolio of activities hinge on its capacity to “fit”
each single business with its dominant logic (Goold and Campbell 1991).
It should however be mentioned that from a resource-based perspective, the
characterization of a valuable resource tends to be ex post (Foss et al. 1993); and the
resource-based literature has far less to say about the emergence of these distinctive
95
Chapter III
capabilities (Levinthal and Myatt 1994). In other words, such resources tend to be taken
as given and their emergence is not explained. Furthermore, as Teece (1997) points out,
the resource-based theory recognizes but does not explain the nature of isolating
mechanisms that enable rents and competitive advantage to be sustained.27
In sum, from a resource (-dependence) perspective it seems reasonable to
assume that (at least some) VCs could have develop certain competences that
distinguish them not only from more traditional investors but also from each other by
allowing them identify and realistically assess the most promising investment
opportunities, to deal more appropriately with the risks and uncertainties associated
with investments in high risk-return ventures, and to provide missing/complementary
resources to them. This might not only become manifest in different investment
approaches by VC with different knowledge, but it might also translate into different
performances of VCs and/or their investments.
Thus, one might further argue that under the resource/knowledge-based view,
specialization is an alternative strategy, if not complementary, to the previously
discussed diversification approach to portfolio composition (i.e. the financial
intermediation/signalling and the principal-agent theories) in that having superior
resources or competencies should help a VC to better fulfil his role as a financial
intermediary and to deal with possible information asymmetries more appropriately.
27 Also more recent developments of the resource-based theory do only partially address this issue. For instance, the concept of dynamic capabilities extends the resource-based view by incorporating evolutionary theory; and it emphasizes the need of many organizations to adapt to rapidly changing environments. However, for this purpose, the concept focuses primarily on the exploitation and (re-) deployment of existing internal and external firm specific competences, but not on the development of (new) knowledge or competencies (Teece et al. 1997, Teece 1998).
96

Chapter III
3.6. Hypotheses
Previous literature approached the VCs portfolio strategy issues as a means to
manage risk/returns emphasizing two opponent strategies: diversification or
specialization of their investments portfolio. Now I will turn to examine which of the
two said approaches lead to better VCs performance. This question has never been
directly addressed before, and its implication are very important since they call into
question the very nature of the VCs. Indeed we have so far seen the said two strategic
approach received support from different stream of literature, one relying on the
concepts of financial intermediation and agency theory, the other looking at VCs under
the lens of a resource/knowledge based perspective.
The assessment of such assumptions shall significantly contribute to the debate
on the role of VC firms as mere financial intermediaries providing capital to funded
firms or as major players in the development of such companies, providing resources,
managerial competences, relational capital and actively guiding their growth. In doing
such an assessment I will look at three different strategic dimensions along which VCs
can decide whether to diversify or specialize their portfolio of companies. These key
variables are the geographic span of portfolio companies, their industry field and the
stage-of-development they are involved with when the VC decide to invest in. For each
dimension I will provide conflicting hypotheses regarding the theoretical advantages
97

Chapter III
associated with the implementation of a diversification strategy versus those of a
specialization strategy.
The strategy that VCs use to manage the investment risk/return relationship is
approached here as a multidimensional construct. Three key variables that have been
identified to affect this risk/return relationship are industry scope of portfolio company
investments, stage-of-growth scope of portfolio company investments, and geographic
scope of portfolio company investments. I thus assume that VCs are able to diversify or
specialize their portfolio mainly across these three dimensions or characteristics of
investee companies.
For each strategic dimension, a rationale will be given for using either a
specialization or a diversification strategy, depending on the type of risk that is most
pertinent to be controlled. Holding that the different types of risk are intertwined, it is
difficult to propose which polarizing force of risk will prevail. Therefore, I will then
advance two rivalling hypotheses.
Funds are able to decide on their degree of portfolio diversification by selecting
the geographic markets where they will go to invest. This strategy will determine the
location of their investments and thus the physical proximity of the investments within a
VC’s portfolio.
By broadening the spectrum of countries where they can fish for investee
companies, VCs can enlarge their basket of opportunities. A larger geographic horizon
will increase the chances and capabilities to identify higher-return investments.
98
Chapter III
Moreover, by spreading their portfolio in different geographic areas, they can minimize
country-specific risk and mitigate the impact on their portfolio performance of factors
negatively affecting the economic outcomes of a specific geographic region.
On the other hands, the possibility to invest in different countries involves time-
and resource-consuming activities of screening and analysing the different markets,
effectively supporting and running backed companies in heterogeneous domains each
with its different constraints and problems. It requires knowledge of different markets,
while by focusing on few similar regions, a fund can benefit from accruing the country-
specific knowledge from may point of view (legal issues, economic trends, screening
and selecting deals). A limited geographic scope of portfolio investments facilitates
control over the management of these companies. Indeed geographic proximity enable
VCs to maintain significant contact with the management of investee companies, and
provide homogeneity over several strategic aspects such as rule, regulations,
Institutional actors, other investors, geographic key factors. As a result, VCs who
specialize their portfolio of investment in few geographic regions can build on
experience to control for better evaluate environmental resources and constraints, for
both agency risk and business risk and, thus maximize their risk/reward returns.
The second dimension along which VCs can pursue different degree of
diversification is the range of industries in which to invest.
Applying to financial portfolio theory (Markovitz 1970, Sharpe 1964), VCs may prefer
to diversify across industries in order to reduce their risk exposure in a specific industry
99
Chapter III
or technology. A greater variety of industries in which to invest increases investment
opportunities.
The increased range of opportunities will provide the capability for the VCF to
more selectively identify higher-return investments. Agency and business risks could be
strongly reduced by decreasing industry-specific risk through the spreading of
investments across several industries.
On the other hand, investors who specialize in a tight number of technological
fields can control for business risk by providing more competent strategic and
operational support to deals they funded (Barney et al. 1989). Specialization may help
VCs to protect from information asymmetry (Eisenhardt 1989), by enhancing control
over the management of these companies by the VC. For example, it is more difficult
for portfolio companies to hide issues of management incompetence or other crucial
information regarding company performance due to the VC’s more in-depth
understanding of the industry.
Also VCs can develop a more specialized understanding of the complexities of
these industries, and control for business risk by accruing specific-knowledge which can
be horizontally applied across portfolio companies, as well as by enhancing skills to
better evaluate environmental resources and constraints affecting their portfolio of
investments.
A third dimension along which VCs can diversify or specialize their portfolio of
investments is the stage of development of selected deals. This strategy will determine
100

Chapter III
the degree of portfolio company diversity based on stage-of-growth within a VC’s total
portfolio of company investments.
It has been shown that different growth-stages of investee companies require a
number of different supporting skills and capabilities to be implemented by the investor
(Carter and Van Auken 1994; Chang 2004). Heterogeneity among portfolio company
growth stages will require the development of more general management skills at the
expense of particular stage-specific abilities (De Clercq et al. 2001). As a result, the
management team of VCs will be less able to take a more active role in decision making
processes at the portfolio company level (Bottazzi et al 2004). A diversified
development stage scope of portfolio company investments decreases VC control over
the management of these companies (Kaplan and Stromberg 2004). However, a greater
variety of growth stages in which to invest will offer increased investment opportunities
for the VF, offering more chances to selectively identify higher-return investments since
the fund will be less restricted by the stage-of-development variable. Furthermore
agency and business risk associated with specific stage of development will be
minimized through the spreading of investments across several growth stages.
On the opposite side, a focused stage-of-development portfolio strategy
facilitates control over the management of these companies by the VC (Zacharakis and
Shepherd 2001). By limiting the number of portfolio company stages of development
upon which to invest, fund managers can develop a more specialized knowledge of the
complexities inherent in these particular stages, and therefore, control for both agency
and business risk. The homogeneity among the investee companies, allow for an
101
Chapter III
effective sharing of specialized knowledge across portfolio companies, which enables
the VC to become more directly involved in the key decision making processes of their
portfolio companies as well as better evaluate environmental resources and constraints
associated with a specific stage-of-development.
So far I tried to set into opposition two theoretical frameworks which try to
explain the advantages in term of superior performance by following the portfolio
diversification strategy or the portfolio specialization approach.
According to the former perspective, since VCs mainly provide financial capital
to ventures with a high growth potential, a well-diversified portfolio may reduce the
overall risk without reducing its results. If, instead, VCs are perceived as being actively
involved in the management of backed firms, providing both financial and human
capital, relational resources, know-how and professional skills, the creation specialized
portfolio could greatly enhance portfolio performance by the research and exploitation
of synergies between similar businesses (Brander et al. 2002).
Following the works insisting on a “resource-based” rational, it is reasonable to
expect that:
H1,a: VC firms pursuing diversification as an investment strategy show higher
performance than VC firms following a specialization strategy.
102
Chapter III
Following a financial portfolio logic, it is thus reasonable to expect that:
H1,b: VC firms pursuing specialization as an investment strategy show higher
performance than VC firms following a diversification strategy.
Despite a recently growing academic interest on this topic, there is still no clear
understanding on the relationship between performance and the portfolio strategy of
VCs. If some latest work tend to suggest that specialization and diversification should
affect performance, there is a lot of room to deepen this avenue of research (De Clercq
et al 2001, Bottazzi et al. 2004, Gompers et al. 2005, Knill 2005).
103
Chapter IV
CHAPTER IV
Setting and methods of analysis
This Chapter is dedicated to the description of the setting and of the
methodological approach I used in order to analyse the impact of portfolio
diversification on the performance of VCs.
I decided to empirically address my research question in the United Kingdom
(UK) since it is the most developed venture capital market in Europe and second only
to United States worldwide, providing an ideal setting where to gather information and
perform analyses. Hence the first part of this section is dedicated to a brief introduction
to the UK venture capital industry with the aim of describing the analysis setting.
Then I will turn to the description of the variables derived from the literature
described in previous chapters, their operalization and the statistical approach to
perform the analysis.
104
Chapter IV
4.1. The raise and growth of Venture Capital in the UK.
Venture capital did not become established in the UK until the 1980s28. Indeed,
prior to 1979 there were just a handful of venture capital firms - of which the most
significant was ICFC, the predecessor of 3i plc (Clark 1987, Coopey and Clark 1995)29.
However, from the early 1980s an enormous expansion occurred in the number of
venture capital firms.
The private equity industry in the UK has grown rapidly from the mid 1980s
and is second only in importance globally to the USA. This rapid expansion in the UK
can be attributed to several factors, particularly the growth of the US venture capital
industry in the mid 1970s which provided a role model and information for the UK
counterpart (Bank of England 1982), the global economic boom during the 1980s and
the general encouragement through this period of new enterprises and small businesses
by the UK Conservative government.
Key influences were government policy and changes in financial markets. The
Conservative Government under Mrs. Thatcher stimulated a more entrepreneurial
economy, resulting in a higher quality and number of managers and businesses to be
28 The early stirrings of a UK venture capital industry began in the UK in the 1930s (Lorenz, 1989), but it was only in the early 1980s that it really began to develop and expand. At the foundation of the British Venture Capital Association in 1983, there were only 36 members. Six years later in 1989, the industry had grown to a peak of 124 venture capital firms (BVCA, 2000).29 Most notably, in 1945, the Bank of England, together with the major national clearing banks, established the Industrial and Commercial Finance Corporation (ICFC) (Coopey and Clarke, 1995). ICFC eventually evolved into 3i, which became the main equity provider in most of the regions of the UK, moving into venture capital from the late 1970s. In 1994, however, 3i went public and, driven by the need to make returns for its shareholders, it closed several of its UK regional offices and in 1998—99 it announced that it was adopting minimum deal sizes of 1 GBP million for technology deals and 3 GBP million for general investments. This regional rationalization and upward shift in deal size have reinforced the perception among many actors that there is an equity capital gap for small high-risk companies (Robbie and Murray 1992).
105
Chapter IV
backed. The Business Start-Up Scheme, later extended and renamed the Business
Expansion Scheme, which provided tax incentives for private investors who invested in
unquoted companies, led to the establishment of collective schemes to manage these
investments. This gave a significant boost to the development of a venture capital
experience. The introduction of the Unlisted Securities Market in 1981 made it easier
for smaller firms to achieve a flotation and in the process provided venture capitalists
with a potential exit route for their shareholdings. Another important influence was the
economic turbulence of the 1980s, which created opportunities for management buy-
outs (MBOs) and management buy-ins (MBIs), influenced in part by the US
experience, which showed how investing in high tech companies was very profitable
for the investor, which actively sought investment opportunities and played an
important role in expanding the market in which it operated (Coopey and Clark 1995,
BVCA 1998).
The total amount of funds invested grew rapidly from the early 1980s, peaking
at 1.4 GBP billion in 1989. This was followed by a period of decline and stagnation
between 1989 and 1993 when various financial institutional investors withdrew from
the industry. Between 1993 and 2000 there was a rapid growth in the amount invested:
the amount invested in 2000 was nearly 6.4 GBP billion, more than five times higher
than the annual amounts invested in the early 1990s (Figure 4.1.). However, despite the
increasing amounts invested by venture capital firms, the number of investments has
remained stable throughout the 1990s at just over 1000 (1182 in 2000), and is lower
than the 1988 total (Figure 4.2.), which reflects increasing deal sizes.
Robbie and Murray (1992) described the UK venture capital industry in the
1990s as having entered a stage of maturity, signified by declining profitability and
106
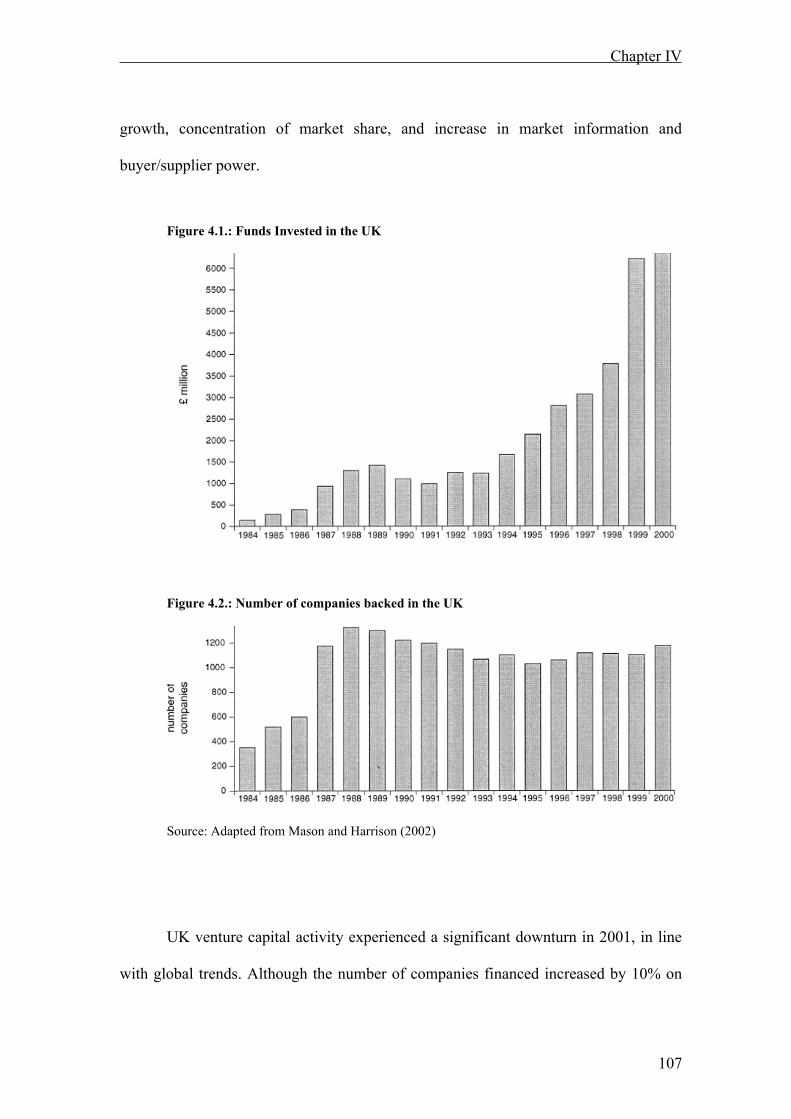
Chapter IV
growth, concentration of market share, and increase in market information and
buyer/supplier power.
Figure 4.1.: Funds Invested in the UK
Figure 4.2.: Number of companies backed in the UK
Source: Adapted from Mason and Harrison (2002)
UK venture capital activity experienced a significant downturn in 2001, in line
with global trends. Although the number of companies financed increased by 10% on
107
Chapter IV
the previous year, the amount invested declined to 4.8 GBP billion, significantly down
on the record levels in 1999 and 2000, but still higher than for 1998 and previous years
(BVCA 2002a).
These trends reflect the cyclical nature of venture capital investment that arises
from fluctuations in the willingness of investors to provide money to VCs that are
driven by their return expectations. Successful exits in the early 1990s, which provided
evidence of attractive returns, encouraged many investors to return and has attracted
new investors. There has been a particularly significant flow of money from large
North American investors seeking diversification from their domestic market (Financial
Times 1999). These investors accounted for 41% of the funds raised by UK VCs in the
period 1997-2000 (BVCA 2001a). This current downturn in venture capital investing in
2001 is the outcome of the over-funding in the late 1990s, the bursting of the
technology bubble and specifically the collapse of various venture capital-backed dot-
com businesses, the combined effect of which has been to drive down returns, and the
end of the bull market which has prevented investors from achieving profitable exits
from their investments.
This growth in venture capital investment activity during the 1990s has been
accompanied by a significant change in the nature of venture capital investing. Since
the late 1980s, the UK venture capital industry has become progressively more geared
to investing in MBOs and MBIs (Table 1). This reflects several factors (Wright et al.
1998), notably the preference of institutional investors to invest in MBO funds rather
than early stage funds, the superior returns achieved by MBO funds, and the shortage of
classic venture capital skills. MBOs and MBIs represented 56% of the amount invested
in 2000, compared with only 21% in 1984. However, this represents a decline
108

Chapter IV
compared with the late 1990s, when MBOs/MBIs were attracting over 70% of venture
capital investments.
Table 4.1. Venture capital investment in UK by stage and type of exitTable 1: Venture capital investments by stage and Type of Exit
1984 1985 1986 1987 1988 1989 1990 1991 1992 199 1994 1995 1996 1997 1998 1999 2000
A: amount invested (£m)
Early stage
38
50
86
120
130
213
128
58
82
69
76
87
131
159
288
347
703
Expansion
73
120
124
301
435
338
396
387
362
393
480
493
592
907
822
1156
2122 MBO/MBI
29
107
174
313
733
867
582
544
807
769
1112
1560
2083
2000
2665
4666
3546
Total amount invested
140
277
384
934
1 298
1420
1106
989
1251.
1231
1668
2140
2806
3066
3775
6169
6371 B: percentages
Early stage
27.1
18.1
22.4
12.8
10.0
15.1
11.6
5.9
6.6
5.6
4.6
4.0
4.7
5.2
7.6
5.6
11.0
Expansion
32.1
43.3
32.3
32.2
33.5
23.8 35.8
39.1
28.9
31.9
28.8
23.1
21.1
29.6
21.8
18.7
33.3 MBO/MBI
20.7
38.6
45.3
54.9
56.5
61.1
52.6 55.0
64.5
62.5
667
72.9
74.2
65.2
70.6
75.6
55.6
Source: BVCA (2000)
The increase in MBO/MBI investments has been at the expense of investments
in seed capital, start-up and early stage ventures: although the actual amount invested in
early stage ventures has increased substantially since the early 1990s and doubled
between 1999 and 2000, it accounts for a smaller proportion of investment activity than
in the 1980s. It is therefore the increasing significance of MBO/MBI investments that
has been responsible for the rising average size of investment.
Although the gap has narrowed considerably in recent years, the UK private
equity market is regarded as more mature compared to its continental European
counterparts (Tannon and Johnson, 2005). The UK accounts for some 40% of the whole
of the European market and as a percentage of GDP, the UK is the most significant
private equity investor in Europe at a level of 1.10%. Out of this, however, only 0.21%
goes into venture capital financing while the rest is invested in the buyout sector
109
Chapter IV
(EVCA, 2005b). The US is the predominant VC nation30; in 2003 74% of all venture
capital investments among the G7 nations was made in the US, and VC financing as a
percentage of GDP was at least twice as high in the US as in the UK (Bygrave and
Hunt, 2004). The invested amount per company is also higher in the US than in any
other country. In 2003, US VCs invested on average $8.1 million per company,
compared to $1.19 million per company in the UK.
During 2004 the total amount of raised funds in Europe reached €27.5 billion
where the UK contributed to 37% of these funds, i.e. €10.1 billion. Pension funds are
the largest contributors to UK funds, representing 23 to 26% of raised capital during
2002-2004. Second largest contributors are fund of funds with 15 to 20%, followed by
banks, contributing 15 to 16%. The UK private equity industry is highly international;
around 50% of the private equity investments done by UK investors during 2002
through 2004 were allocated to investments outside the UK (EVCA, 2003; EVCA,
2004b; EVCA, 2005b).
The UK venture capital and private equity investors tend to invest more in
established businesses rather than in new technology ventures, as evidenced by the
dominating buyout sector. Over 70% of all private equity goes into this segment
(Martin, Berndt, Klagge, Sunley and Herten, 2003; EVCA, 2005b). Furthermore, early
stage investments have decreased substantially in the UK, where VC allocations to seed
and start-up phases during the last few years account for only around 5% (EVCA,
2005b). And even though the volume of investments in high-technology companies in
the UK increased tenfold between the early 1990’s and 2001 (Martin et al. 2003), the
30 Institutional venture capital originated in the USA in the early post-war period, although rapid growth only occurred from the early 1980s following reductions in the rate of capital gains tax and new rules which explicitly allowed pension funds to invest in venture capital funds (Bygrave and Timmons 1992, Gompers 1994).
110
Chapter IV
technology VC investments as a percentage of GDP was only 0.08% in 2004 (BVCA,
2005b). In comparison, the US technology VC investments as a percentage of GDP in
2004 reached almost 0.15% (BVCA, 2005b). BVCA argues that the large gap in
technology VC investments between the UK and the US is due to both cultural and
structural differences. The US has been particularly successful in taking advantage of
the positive effects resulting from clustering and university spinouts, and has found it
easier to accept the risks involved in investing in technology companies. BVCA also
suggests that the absence of a functioning pan-European stock exchange for early stage
ventures hinders the development of early stage VC in Europe. About 22 to 38% of the
investments in the UK were syndicated, i.e. when a group of VCs jointly invest in a
portfolio company, during the 2002 to 2004 period. Out of these, the international
syndications represents around 6 to 10% (EVCA, 2003; EVCA, 2004b; EVCA, 2005b).
Regarding the realisation of private equity investments, industrial trade sales has
been the most common exit route for the UK VC firms during the last two to three
years period, representing 20 to 27% of all exits. Since 2003 secondary sales, when one
financial investor sells it stake in a company to another financial investor, have become
the second most common exit alternative, today representing almost 15% of all exits.
The percentage of IPOs has decreased from over 20% in 2002 down to 14% of
the exits in 2004. At the same time, the number of write-offs has also decreased; from
23% in 2001 to a level of 8% in 2004 (EVCA, 2003; EVCA, 2004b; EVCA, 2005b). In
the UK, limited partnerships is the most common legal form of structuring VC funds
(Mayer et al. 2003). According to EVCA (2004a) the UK has, at least currently, one of
the most favourable legal and fiscal environments in Europe for the development of the
111
Chapter IV
venture capital industry. One exception, however, is the unfortunate tax situation for
university spin-out companies (EVCA, 2005b).
Finally, by taking a cautious look at the financial returns for venture capital
investments in the UK, the BVCA reports that early stage and technology VC funds
performed considerably worse than all the FTSE indices (BVCA 2004, BVCA 2005a).
Early stage funds achieved just around -10.3% IRR in 2004 over five years, while the
figure for technology funds was -9.6% IRR over the same period. This gave that the
overall long-term net return to investors in early stage funds at the end of 2004 stood at
-2.9% and technology investment at 0.9%.
4.2. Sample, Variable measurement and statistical approach.
In this section I will give details on the data and methods I used to perform the
analysis. First I will describe the sample of this research providing details on how the
sample was built and on the dataset from which I derived sample data. Then I will
discuss how I operationalized the dependent variable – i.e. VCs performance, the main
explanatory variables (indexes of diversification on the industry, country and stage of
development dimensions); and the control variables, mainly discussed in Chapter II,
while presenting the studies looking at the impacts of several factors on VCs
performance. Last I will describe the statistical approach I used to assess the impact of
VCs diversification on their performance.
112
Chapter IV
4.2.1. The Sample
I decided to study the relationship between the scope of a VC’s portfolio and its
performance by focusing on VC funds established in the United Kingdom over the
period 1981-2000. I decided to refer to the UK VC industry since it is the largest and
most developed in Europe, accounting for nearly 40% of total annual venture capital
and private equity investment, and is second only to the USA in world importance
(BVCA, 2005). I used the database Venture Expert, provided by Thomson Financial,
as the primary source of data on VC funds and their investee companies.
Venture Expert provides information on funds, the firms managing these funds
and the portfolio companies in which the funds invest. It records the identities of the
participating venture capital firms and funds as well as the portfolio company receiving
the investment. It also tracks the date of the investment and usually records the amount
of the investment. The database also reports outcomes of the portfolio companies
receiving funding, including whether they went public, were acquired, went bankrupt,
were shut down, or are still active investments. Using this information it is possible to
construct measures of the performance of funds. Unfortunately Venture Expert does not
provide IRR-based information at the level of the single fund.
I first identified all VC funds that were created in the UK over the period 1981-
2000 according to Venture Economics. I dropped data on funds whose date of
inceptions is prior the year 1981. Indeed VentureXpert database start the coverage of
UK Private Equity and Venture Capital deals by the early Seventies, but information on
early deals is scattered and blanking possibly leading to data biases and distortions31.
31 The data coverage of the UK VC industry by Venture Expert starts from the early Seventies, but information on earlier deals is scattered and incomplete, leading to possible biases. Gompers and Lerner (1999) show that the Venture Expert coverage is very reliable and consistent starting from 1980 to present, covering up to 90% of Venture
113
Chapter IV
The initial sample consisted of all UK funds that were created starting from
1981 and including all the funds created in subsequent years until those created in year
2000, but gathering information on fund characteristics, backed companies and
performance until December the 31st of 2006. I followed previous studies (Kaplan and
Schoar 2005, Jones and Rhodes-Kropf 2003, Hochberg et al. 2005) and considered all
funds raised up including 2000, in order to have at least six-year of observations for the
youngest funds, using year 2006 as the latest year to measure fund performance. Indeed
funds are structured as closed-end, 10 years limited partnerships (Hocberg et al. 2005,
Kaplan and Schoar 2005). They are not usually traded, nor do they disclose fund
valuations (Ljungqvist et al. 2005). Generally, the first half of the fund lifecycle is
dedicated to the selection and financing of portfolio companies, whereas the second
half is generally devoted to the search of a positive exit (through IPOs or trade sales)
for the investee companies, in order to generate positive inflows. Due to this investment
cycle, relatively recent funds have not yet operated for long enough to measure their
lifetime performance. But since the fund has a predetermined limited life (10 years) I
can easily track the exit of the backed companies over the whole period until year 2006.
According to Venture Expert 689 funds were raised and 5329 companies were
backed over the period 1981-2000.
From this sample I eliminate “Undisclosed funds” which contain no information
at all. Also I dropped from my data set funds with incomplete data on the amount raised
or the composition of investee companies, and funds which were Evergreen funds or
Funds of Funds, following the approach of Kaplan and Schoar (2005) and Hocberg et al
Capital and Private Equity deals in more mature markets such as the U.S. or the UK. For this reason, we decided to start our data collection in 1981 since information on VC funds created in the UK before 1980 is present in Venture Expert on a very limited base.
114
Chapter IV
(2005). Indeed Evergreen funds and Funds of Funds follow investment patterns and
structures that are far from the Private Equity and Venture Capital Industry.
My final sample thus consists of 649 Funds that were raised between 1981 and
2000, and 4751 backed companies. For each fund, I constructed its portfolio of
investment, so that each counted variable is referred to the single found. This is a cross
sectional sample, constructed in order to allow for each variable one observation for the
whole period 1981-2000. For each fund portfolio I included all the companies it has
invested in. For each fund I continued to collect data on portfolio of investment and on
performance of portfolio deals until the 31st of December 2006.
For each fund, I collected the following information based on Venture Expert
data: VC fund name, vintage year, managing VC firm, total amount raised, number of
portfolio companies. For each investee companies, I collected the following
information: stage of development, country, main industry (according to the Venture
Expert Industry Classification), corresponding VC fund, year of the first stage of
investment and of the following stages, status. Based on these data I built the variable
of analysis, which I detail in the following paragraph.
4.2.2. The operationalization of the dependent variable: VC
performance
115
Chapter IV
In Chapter II it has been pointed out that the ideal performance measure for VCs
would be the financial returns from VC investments. However, analysing the
profitability of VCs’ investments is a hard task since information is by definition
"private", and transparency requirements are limited. The common use of fund
valuation data provided by two commercial vendors Venture Economics and Venture
One, has been criticised by some studies (e.g. Ljungqvist and Richardson 2003,
Cochrane 2005) for having three principal shortcomings: (i) the data is available only in
aggregate rather than in fund-by-fund format; (ii) financial returns are largely provided
by VC firms on a voluntary basis and thus potentially subject to selection biases; and,
(iii) the data is based on unrealised as well as realised investments, which introduces
noise and potentially biases due to subjective accounting treatment. A final example of
challenges when evaluating and comparing IRRs, is the unclear and inconsistent use of
net and gross returns, i.e. whether the reported results include or exclude fees to the VC
firms (Cumming and Walz 2004). Comparing results from different analyses on VC
performance is thus very complicated.
In Chapter II we have also seen that literature offered a reliable proxy for
measuring funds returns is represented by the successful companies exit rates, since the
capital gain VCs earn is made out of the subset of portfolio companies which
experience a positive exit through IPO or a third sale (Laine and Torstila 2004,
Hochberg et al. 2005)32. Following this approach I computed fund performance as the
share of companies in the portfolio having reached a successful exit (IPO or trade sale)
at the date of the 31st of December 2006. Indeed, by limiting the computation only of
companies brought to the public markets one can introduce possible up-ward biases,
32 Hochberg et al. (2005) also found a positive and strong correlation between exits rates and IRR measure of performance. All else equal, the more successful exits has a found, the larger will be its IRR.
116
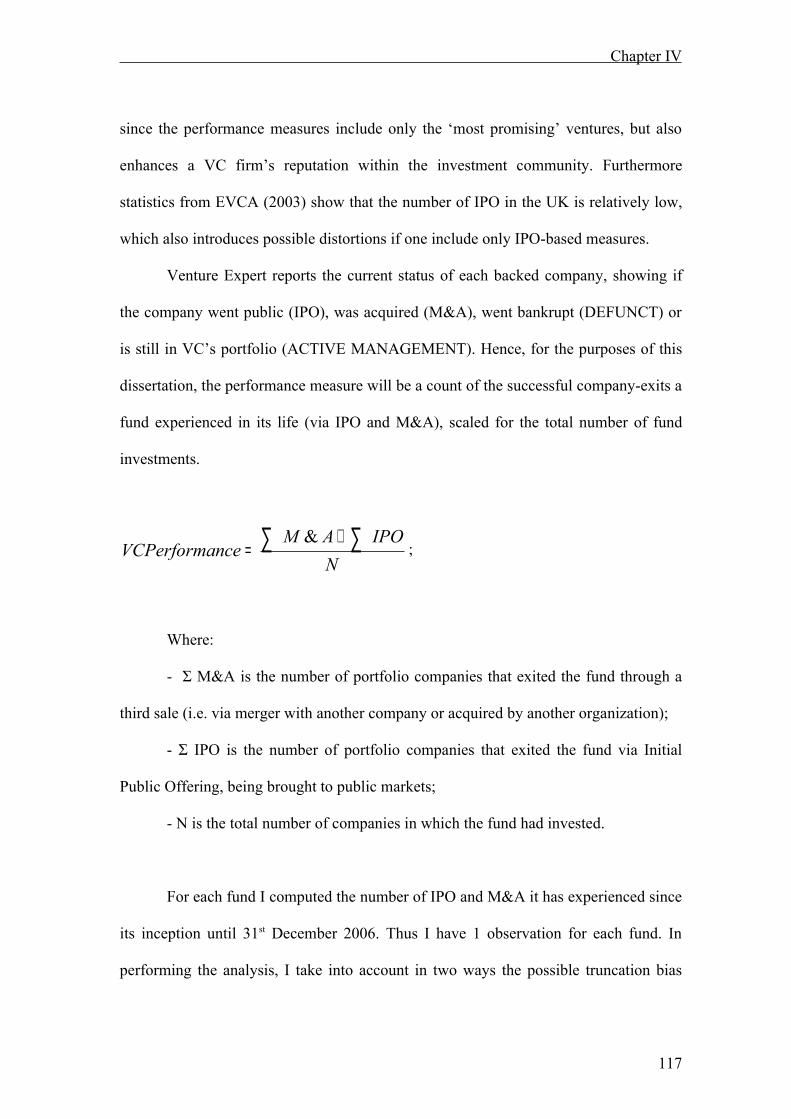
Chapter IV
since the performance measures include only the ‘most promising’ ventures, but also
enhances a VC firm’s reputation within the investment community. Furthermore
statistics from EVCA (2003) show that the number of IPO in the UK is relatively low,
which also introduces possible distortions if one include only IPO-based measures.
Venture Expert reports the current status of each backed company, showing if
the company went public (IPO), was acquired (M&A), went bankrupt (DEFUNCT) or
is still in VC’s portfolio (ACTIVE MANAGEMENT). Hence, for the purposes of this
dissertation, the performance measure will be a count of the successful company-exits a
fund experienced in its life (via IPO and M&A), scaled for the total number of fund
investments.
NIPOAM
nceVCPerforma ∑ ∑+=
&;
Where:
- Σ M&A is the number of portfolio companies that exited the fund through a
third sale (i.e. via merger with another company or acquired by another organization);
- Σ IPO is the number of portfolio companies that exited the fund via Initial
Public Offering, being brought to public markets;
- N is the total number of companies in which the fund had invested.
For each fund I computed the number of IPO and M&A it has experienced since
its inception until 31st December 2006. Thus I have 1 observation for each fund. In
performing the analysis, I take into account in two ways the possible truncation bias
117
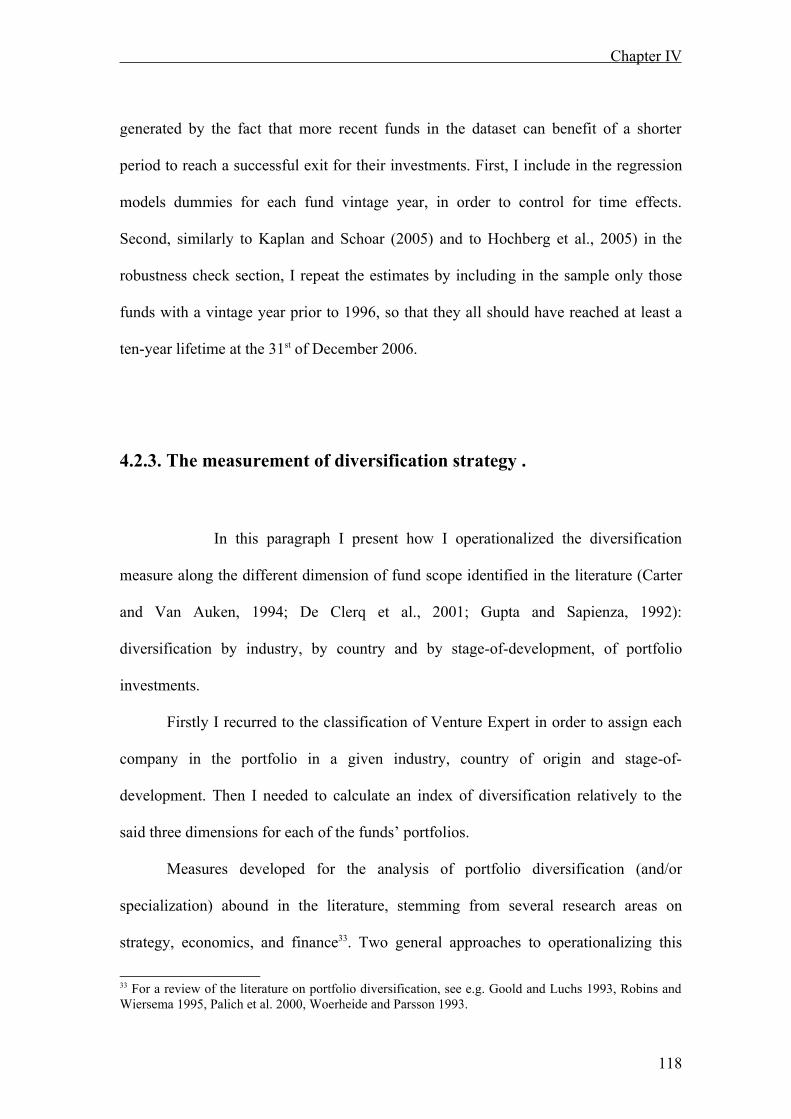
Chapter IV
generated by the fact that more recent funds in the dataset can benefit of a shorter
period to reach a successful exit for their investments. First, I include in the regression
models dummies for each fund vintage year, in order to control for time effects.
Second, similarly to Kaplan and Schoar (2005) and to Hochberg et al., 2005) in the
robustness check section, I repeat the estimates by including in the sample only those
funds with a vintage year prior to 1996, so that they all should have reached at least a
ten-year lifetime at the 31st of December 2006.
4.2.3. The measurement of diversification strategy .
In this paragraph I present how I operationalized the diversification
measure along the different dimension of fund scope identified in the literature (Carter
and Van Auken, 1994; De Clerq et al., 2001; Gupta and Sapienza, 1992):
diversification by industry, by country and by stage-of-development, of portfolio
investments.
Firstly I recurred to the classification of Venture Expert in order to assign each
company in the portfolio in a given industry, country of origin and stage-of-
development. Then I needed to calculate an index of diversification relatively to the
said three dimensions for each of the funds’ portfolios.
Measures developed for the analysis of portfolio diversification (and/or
specialization) abound in the literature, stemming from several research areas on
strategy, economics, and finance33. Two general approaches to operationalizing this
33 For a review of the literature on portfolio diversification, see e.g. Goold and Luchs 1993, Robins and Wiersema 1995, Palich et al. 2000, Woerheide and Parsson 1993.
118

Chapter IV
concept have been particularly used: categorical and continuous measures (Palich et al.
2000). While the former approach relies on a classification of a portfolio in terms of
one of several characteristic types of diversification, the latter positions the portfolio on
a scale that indicate its relative degree of diversification (and/or specialization)34.
Continuous measure have overwhelmed categorical ones, since they offer a number of
advantages for quantitative research (Robin and Wiersema 1995) by (1) providing
variables at a high level of measurement subjected to a wide range of technical
analyses; and (2) they employ data classified according to standard categories, allowing
for research to be replicable and cumulative.
the two continuous measures of diversification that are most commonly and
widely used are the Complement of Herfindahl index and the Entropy index35. A part
from the fact that these two indexes are calculated on the basis of SIC categories, they
differ in several aspects.
The Complement of Herfindal index is a variation of the Herfindahl-Hirschmann
Index (HHI), which have been developed by researchers in the industrial organization
context (e.g. Caves et al. 1980) and then adapted in strategy research (i.e. Montgomery
and Wernerfelt 1988) in order to calculate a measure of market concentration in a
particular sector for purposes of antitrust enforcement. Its complement then became
very popular in finance, as a reliable measure of portfolio diversification (Woerheide
and Persson 1993). In fact HHI is calculated by squaring the market shares of each firm
34 According to Robins and Wiersema 1995, the categorical measures are based on the typology of Wrigley (1970) and Rumelt (1974); while the continuous measures originated by the SIC (Standard Industrial Classification) system. 35 Critics of said indexes argue that SIC classifications can hardly account for the strategic interrelations between different industries (Robins and Wiersema, 1995), since their categories are based on physical aggregation criteria (materials, products/markets). According to Robins and Wiersema (1995), the index should be based on the sharing between industries of technological and managerial resources and competences (Barney, 1986; Teece, 1986; Winter, 1987), to be measured by an estimate of the flows of technological knowledge between industries (Farjoun, 1994).
119

Chapter IV
competing in a market and then summing the resulting number. The use of the
complement of this index by altering the HHI index value has the advantage that it can
range from 0 to 1. As such, 0 represents a portfolio with absolutely no diversification (a
one asset portfolio) and 1 would represent the ultimate in diversification36:
∑=
−=−=N
iiWHHIationDiversific
111
Where:
Wi = the proportion of portfolio market value invested in category i (in decimal form),
And N = the number of asset (investment) in the portfolio.
Statistically derived from the thermodynamics, the Entropy index is a direct
measure of diversification. This index has been used in corporate strategy in order to
study the relation between the external growth of large corporation and their pattern of
diversification from the core business (Jacquemin and Berry 1979) and to study the
relatedness of portfolio assets (Hart 1970). Using the same diction for the specification
of the HHI index, the Entropy measure is calculated as it follows:
36 The use of complement of HHI to distinguish diversification indexes from concentration indexes is common also in the industrial organization literature. See Robins and Wiersema (2003).
120

Chapter IV
)ln(1
i
N
ii WWationDiversific ∑
=
=
By using the natural logarithm, the Entropy measure is not constrained by 0 and 1.
A number of studies have been carried in order to analyse which of the two
indexes is the most reliable for measuring diversification. Studying the optimal
diversification strategy for portfolios of securities, Woerheide and Persson (1993)
compared five indexes aiming at finding which among them is the best in providing
meaningful information about the degree of diversification of a portfolio of stocks.
They found that the complement of the HHI was superior to the Entropy measure in
terms of closeness of fit in regression terms between portfolio risk and the index
number. In particular they found that the modified HHI is the best diversification index
amongst the five considered and recommended its use also for its simplicity of
calculation and interpretation.
Studying concentration and market power in several industries, Stigler (1968)
and Scherer and Ross (1990) found HHI to be an appropriate measure of industry
concentration, because by squaring the market shares it lessens the influence of errors
due to lack of data for small firms. In contrast, they also found that the Entropy index
can be misleading, in that it shows a more competitive structure than the true level.
Acar and Sankaran (1999) also prefer HHI for its simplicity and its widespread use –
although the entropy measure have been used in several other scientific domains (i.e.
Waterson 1984). In addition they argue that the two indexes are not perfectly
overlapping. In other words the two indexes are not perfectly comparable because (1)
121
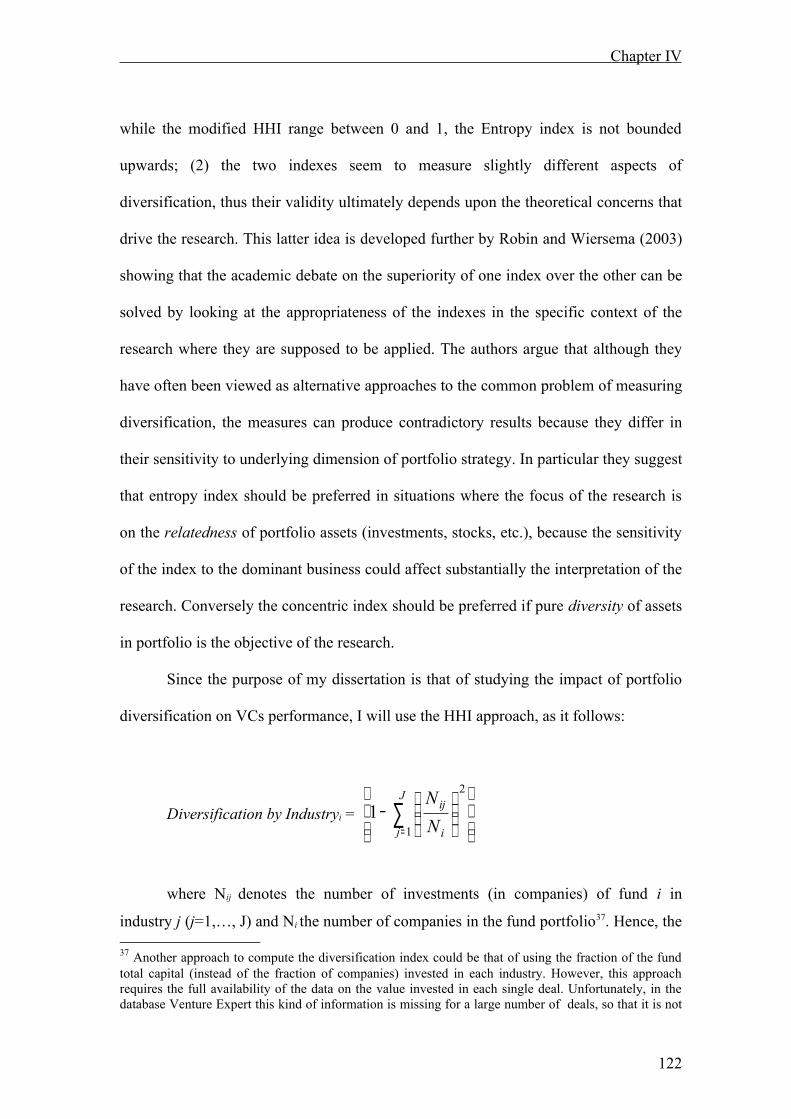
Chapter IV
while the modified HHI range between 0 and 1, the Entropy index is not bounded
upwards; (2) the two indexes seem to measure slightly different aspects of
diversification, thus their validity ultimately depends upon the theoretical concerns that
drive the research. This latter idea is developed further by Robin and Wiersema (2003)
showing that the academic debate on the superiority of one index over the other can be
solved by looking at the appropriateness of the indexes in the specific context of the
research where they are supposed to be applied. The authors argue that although they
have often been viewed as alternative approaches to the common problem of measuring
diversification, the measures can produce contradictory results because they differ in
their sensitivity to underlying dimension of portfolio strategy. In particular they suggest
that entropy index should be preferred in situations where the focus of the research is
on the relatedness of portfolio assets (investments, stocks, etc.), because the sensitivity
of the index to the dominant business could affect substantially the interpretation of the
research. Conversely the concentric index should be preferred if pure diversity of assets
in portfolio is the objective of the research.
Since the purpose of my dissertation is that of studying the impact of portfolio
diversification on VCs performance, I will use the HHI approach, as it follows:
Diversification by Industryi =
− ∑
=
2
11
J
j i
ij
NN
where Nij denotes the number of investments (in companies) of fund i in
industry j (j=1,…, J) and Ni the number of companies in the fund portfolio37. Hence, the
37 Another approach to compute the diversification index could be that of using the fraction of the fund total capital (instead of the fraction of companies) invested in each industry. However, this approach requires the full availability of the data on the value invested in each single deal. Unfortunately, in the database Venture Expert this kind of information is missing for a large number of deals, so that it is not
122
Chapter IV
index takes the value 0 for a VC fund which is not diversified at all (i.e., all portfolio
companies operate in a single industry) and increases for higher level of diversification,
its upper limit being 1.
In a similar way, I computed the diversification by country and by stage-of-
development indexes as it follows:
Diversification by Countryi =
− ∑
=
2
11
Y
y i
iy
NN
Diversification by Stagei =
− ∑
=
2
11
Z
z i
iz
NN
where Niy denotes the number of investments of fund i in country y (j=1,…, Y),
Niz the number of investments of fund i in stage-of-development z (z=1,…, Z) and Ni
the number of companies in the fund portfolio.
4.2.4. Operationalizing control variables
A number of variables, for which previous literature found an impact on VCs
performance, are used as controls.
The first control variable is Fund Size, measured as the log transformation of the
total amount of money invested in the VC fund, in order to control for scale and
reputation effects which might affect fund performance (e.g. Kaplan and Schoar 2005).
possible to use it for analysis.
123
Chapter IV
A dummy variable Follow-on, taking the value 1 for funds representing a
follow-on of previous funds, was included in order to control for the expertise accrued
by VCs (e.g. Hocberg et al 2005).
VC firm experience captures the experience cumulated over time by the fund
manager, measured by the cumulated number of companies supported by the lead fund
manager up to the fund’s vintage year (e.g. Zacharakis and Shepherd 2001).
VC inflows in fund’s vintage year captures the log transformation of the
aggregate amount of money raised by VC industry in the UK in the fund’s vintage year,
controlling for the presence of a “money chasing deals” phenomenon, which might lead
to the financing of low-quality companies in periods of excess availability of VC
funding (Lerner and Gompers 2000).
As illustrated in the previous part, syndication allows VCs to share risks and
have access to their partner’s information and skills in choosing and managing specific
investments. Hence, the resort to syndication is positively associated with VCs’
performances. This variable is operationalised for each VC as the shares of portfolio
investment co-invested with other VCs, expecting a positive relationship with
performance (Lerner 1994, Lockett and Wright 2001, Brander et al. 2002, Manigart et
al. 2002, Hege et al. 2003).
Lastly, in order to control for time effects and for the presence of a truncation
bias, as a consequence of the way I measured fund performance in terms of successful
exits, I included year dummies controlling for fund vintage year effects.
124
Chapter IV
4.2.5. Statistical Approach.
In this section I will introduce the statistical approach used to analyse the impact
of VCs diversification strategies on their performance.
In general terms, I modelled the said relationship as it follows:
VC Performance = A + B1(Div.byCountry) + B2(Div.byIndustry) + B3(Div.byStage) +
… + BkXk + e
With BkxXk representing a vector of control variables and “e” the error term.
Since the performance of a VC (the proportion of positive portfolio exits) is
fractional, taking any real value between 0 and 1, with values that tend to cluster on the
extremes; the explanatory independent variables (the three measures of portfolio
diversification) are also continuous, fractional and bounded between the values 0 and 1;
and our control variables are both continuous and dichotomous, the OLS cannot be
used. Instead I implement the method of Papke and Wooldridge (1996) for fractional
response variables. These authors developed a functional form for fractional dependent
variables, based on the Bernoulli quasi-maximum likelihood methods.
Papke and Wooldridge argue that multiple regression model is not applicable
when fractional dependent variables arise since it assumes a linear relationship between
the independent variables and the dependent variable. However, when the outcome
variable is dichotomous or fractional, this assumption is usually violated, because “the
predicted values from an OLS regression cannot guarantee to lie in the unit interval”
(Papke and Wooldridge 1996, pp. 620). One way to overcome this problem is to
125
Chapter IV
transform the data using the logarithmic transformation. This has the effect of making
the form of the relationship linear whilst leaving the relationship itself non-linear. The
logistic regression38 is based on this principle. It expresses the multiple linear regression
equation in logarithmic terms and thus overcomes the problem of violating the
assumption of linearity (Field 2000).
In the Logistic regression the dependent variable is the probability of having one
outcome or another based on a non-linear function of the best linear combination of the
independent variables (Tabachnick and Fidel 2001). In case of two outcomes categories
– i.e. if the dependent variable can assume only the value 0 or 1, the logistic regression
generates the logit or log of the odds:
E(ln[Y/(1-Y)|x]=Xβ.
That is, the linear regression equation is the natural log of the probability of
being in one group divided by the probability of being in the other group, conditioned
on a set of independent variables.
Nevertheless Papke and Wooldridge (1996) argue that, with fractional response
variables, this approach entails some potential problems. For instance, since the log-
odds ratio represent the probability for the dependent variable to take value 0 or 1, for a
given set of data where the observations take the value 0 or 1 (such as in the case of the
VC proportion of exited portfolio companies), some adjustment are needed39, for
example assuming a particular distribution for the response variable, given the
independent variables, and then by estimating the parameters of conditional distribution
38 Because the model produced by logistic regression is nonlinear, the equations used to describe the outcomes are slightly more complex than those for multiple regression.39 See for example Maddala (1983).
126

Chapter IV
by maximum-likelihood. However, even when a suitable conditional distribution can be
applied these adjustments can be difficult to implement or non-rosbust40, depending on
whether a non parametric or a parametric approach is adopted.
Papke and Wooldridge (1996) present an estimation method that circumvents
the said difficulties and it easy to implement for independent, though not identically
distributed, observations, even if the dependent variable takes the values 0 and 1. The
authors demonstrate that the Quasi-Maximum Likelihood Estimator (QLME) method
offer a viable alternative to linear models when the dependent variable is fractional,
being fully robust and efficient under GLM assumptions and with no need of any
adjustment.
Maximum likelihood estimation is an iterative procedure that starts with
arbitrary values of coefficients and determines the direction and size of change in the
coefficients that will maximise the likelihood of obtaining the observed frequencies.
Then the residuals are tested and another determination of directions and size of change
in coefficients is made, and so on, until the coefficients change very little, i.e. converge.
So, as with multiple regression, one tries to fit a model to the data that allows
estimating values of the dependent variable from known values of the independent
variables.
Hence, I applied the QLME to the following linear function, in order to evaluate
the impact of dependent variables of each j-VC on its performance (dependent
variable):
40 A possible distribution for fraction variables is the β-distribution, but Gourieroux et al. (1984) showed it is not robust, at least when a portion of the sample is at the extreme values of 0 and 1.
127
Chapter IV
VC Performancej = A + β1DivbyCountryj + β2DivbyIndustryj + β3DivbyStagej +
β4ln(fundsize)j + β5ln2 (fundsize)j + β6Dummy(follow-on)j +
β7ln(capitalinflows)j + β8firmexpj + β9Syndj + β10εj
STATA® provides routines for QLME method, derived from a particular
application of the GLM. It allows for heterosketasticity control, providing robust
standard error coefficients. Furthermore, dummies for each fund vintage-year were
included in the regression models, in order to control for time effects. Also, controls for
multicollinearity problems are performed for correlation amongst independent
variables. To address this problem, some preliminary analyses will be performed. First,
classic bivariate correlation will be calculated. Logistic regression, like all varieties of
multiple regression, is also sensitive to extremely high correlations. High correlation
coefficients between two variables can cause multicollinearity, reducing the predictive
power of analysis. Here, values higher than 0.5 are said to be critical. However, from
this it is not possible to uncover multicollinearity. Therefore statistics such as variance
inflation factors (VIFs), are calculated by simply running a linear regression analysis
using the same outcome and independent variables (Field, 2000; Menard, 1995;
Tabachnick & Fidel, 2001).
Based on this I find highly correlated coefficients between two of the main
explanatory variables, namely the index of Diversification by Industry and the index of
Diversification by Stage of Development. This leads me to run separate analyses, which
comprise the same baseline models (control variables) and use the same units of
analysis (VCs for which I have information on all examined variables) but include only
128
Chapter IV
one of the theoretical variables at a time. This both circumvents the problem of
multicollinearity and allows for the specification of a model which allows for the
examination of competing hypotheses. Hence I operationalized the two Diversification
dimensions of Industry and Country, by calculating Diversification measures based on
the complement of Herfindahl-Hirschmann Indexes (HHI). In order to take account of
the stage-of-development portfolio characteristics of funds, I followed previous studied
(i.e. Kaplan and Schoar 2005) and split the original sample in two sub-groups41: Early
Stage Funds (ES) are those funds which invest (at least) 60% of their capital in early-
stage deals (i.e. Seed, first-stage, second-stage, development, etc.), while Later Stage
Funds (LS) are those whose 60% of capital is invested in later stage deals (i.e.
Buyouts).
Analyses will be carried following this approach, which allows for
simultaneously analysing the impact of different levels of portfolio diversification on
VCs performance, including only those variables that are not highly correlated. Last, a
number of robustness checks are performed, especially in order to consider the possible
truncation bias generated by the fact that more recent funds in our dataset can benefit of
a shorter period to reach a successful exit for their investments, and in order to take
account of the possibility that portfolio strategies can have different impact on VC
performance, depending on the different type of exit.
41 This classification and definition is taken directly from Venture Expert.
129
Chapter V
CHAPTER V
The diversification of VCs’ portfolios and the
impact on performance: analyses and results
In this section we perform the analyses in order to test the two competing
hypotheses presented in paragraph 3.6.. In particular the focus is on the question
whether a diversification rather than a specialization strategy, relatively to the way VCs
decide which companies should be included in their portfolio, has a positive impact on
their performance. This issue is of particular relevance for VCs since portfolio
strategies are supposed to directly affect the risk/return profile of funds.
It has been shown that different bodies of literature tend to suggest competing
hypotheses about the most profitable portfolio strategy. A stream of literature following
the Financial intermediation perspective seems to support the idea that a diversified
portfolio should be beneficial to VCs performance, while applying a resource-based
view to the venture capital context, VCs with highly specialized skills should perform
better than less specialized peers.
In this section analyses on a sample of UK VCs are performed in order to shed
light on the diversification versus specialization strategies and the linkages with VCs
performance.
VC performance is measured as the percentage of successful exits a VC
experiences in its life. Portfolio diversification/specialization strategy is conceived as a
130

Chapter V
multilevel construct, which entails at least three possible dimensions, characterized by
the portfolio scope in terms of industries, countries and stage of development in which
the VC invests. I operationalized the first two dimensions (i.e. Industry and Country),
of Diversification by calculating modified Herfindahl-Hirschmann Indexes (HHI). In
order to consider the stage-of-development portfolio characteristics of funds, I followed
previous studied (i.e. Kaplan and Schoar 2005) by splitting the original sample in two
sub-groups: Early Stage Funds (ES), investing (at least) 60% of capital in early-stage
deals; and Later Stage Funds (LS), investing 60% of capital in later stage deals.
First, I will analyse descriptive statistics for the full sample and the splits. I will
also display the dynamics of VCs during the period of analyses. Then a quantitative
approach will be implemented to measure the relationship between VCs diversification
strategies and their performance. Finally a section of robustness checks will be
presented.
5.1. The Dynamics of Venture Capital Funds in the UK
between 1981 and 2000.
This paragraph will focus on the dynamics of VCs within the sample, looking
for trends and heterogeneous characteristics of sample VCs along a relevant period of
analysis.
Table 5.1. summarize the characteristics of the full sample. In order to give a
broad and detailed picture of the dynamics of the sample, I included a number of VCs
characteristics of interest more than only the variables that will be use in the
131
Chapter V
quantitative section of the analysis, such as the number of portfolio companies of each
funds and the statistics on the different type of exits.
Each fund has an average number of 9.3 companies in its portfolio, while the
median is 5. The average fund size is 68.7 millions of British Pounds, while the median
is around 11.04 million.
This suggest a relative small number of big funds with many companies in their
portfolios and a relatively bigger number of small/medium funds with fewer companies
in their portfolio.
On average, each found has performed 4.5 positive exits, with M&A that more
then double the number of IPOs. In terms of percentage, each fund has experienced
45% of success, meaning that the 45% of companies they have invested in has gone out
their portfolio, of which 33.2% through third-sale (merger and acquisition) and 11.9%
going public. This is consistent with the EVCA (2005) findings, which demonstrate a
preference for the third-sale type of exit for UK VCs.
The table allows to compare funds levels of Diversification by Industry and by
Country. The mean of Diversification by Industry for British funds is 49%, with
standard deviation levels of 0.29 and the median of 58%. The sample encompasses
small funds, which have invested in only one company, as well as large funds which
have invested in hundreds of companies.
Not surprisingly, the lower level for Industry Diversification is 0.00%,
representing the Industry Diversification of a fund that have invested in only 1
company, and hence having its portfolio focused on 1 Industry field. The maximum
level of the index is 0.89% representing funds that broadly spanned their invested
companies through almost all the Industry categories. Considering that the sample
132
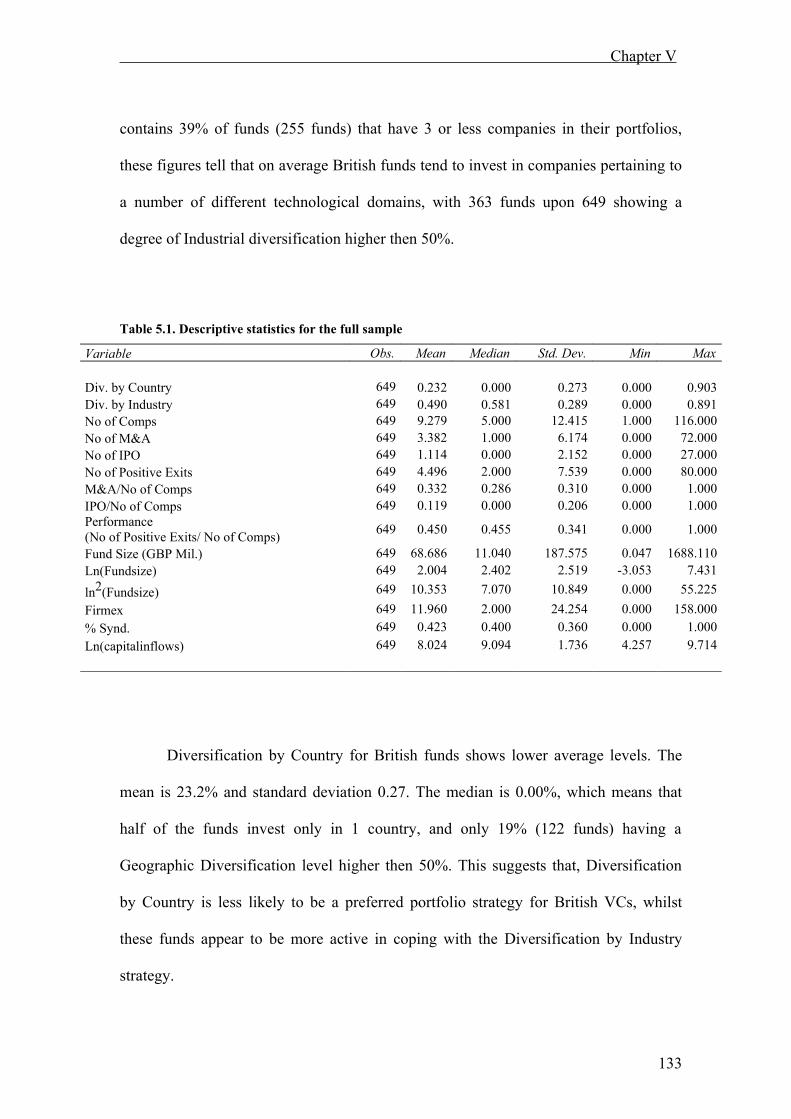
Chapter V
contains 39% of funds (255 funds) that have 3 or less companies in their portfolios,
these figures tell that on average British funds tend to invest in companies pertaining to
a number of different technological domains, with 363 funds upon 649 showing a
degree of Industrial diversification higher then 50%.
Table 5.1. Descriptive statistics for the full sample
Variable Obs. Mean Median Std. Dev. Min Max
Div. by Country 649 0.232 0.000 0.273 0.000 0.903Div. by Industry 649 0.490 0.581 0.289 0.000 0.891No of Comps 649 9.279 5.000 12.415 1.000 116.000No of M&A 649 3.382 1.000 6.174 0.000 72.000No of IPO 649 1.114 0.000 2.152 0.000 27.000No of Positive Exits 649 4.496 2.000 7.539 0.000 80.000M&A/No of Comps 649 0.332 0.286 0.310 0.000 1.000IPO/No of Comps 649 0.119 0.000 0.206 0.000 1.000Performance(No of Positive Exits/ No of Comps) 649 0.450 0.455 0.341 0.000 1.000
Fund Size (GBP Mil.) 649 68.686 11.040 187.575 0.047 1688.110Ln(Fundsize) 649 2.004 2.402 2.519 -3.053 7.431
ln2(Fundsize) 649 10.353 7.070 10.849 0.000 55.225Firmex 649 11.960 2.000 24.254 0.000 158.000% Synd. 649 0.423 0.400 0.360 0.000 1.000Ln(capitalinflows) 649 8.024 9.094 1.736 4.257 9.714
Diversification by Country for British funds shows lower average levels. The
mean is 23.2% and standard deviation 0.27. The median is 0.00%, which means that
half of the funds invest only in 1 country, and only 19% (122 funds) having a
Geographic Diversification level higher then 50%. This suggests that, Diversification
by Country is less likely to be a preferred portfolio strategy for British VCs, whilst
these funds appear to be more active in coping with the Diversification by Industry
strategy.
133
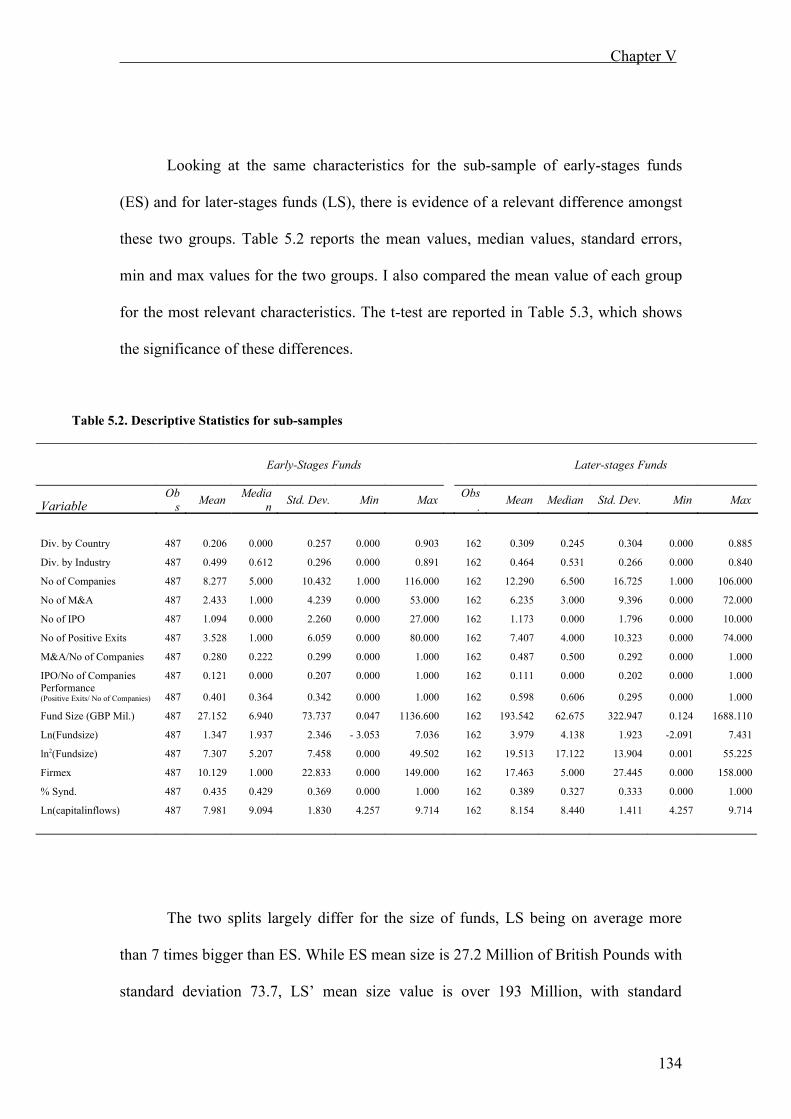
Chapter V
Looking at the same characteristics for the sub-sample of early-stages funds
(ES) and for later-stages funds (LS), there is evidence of a relevant difference amongst
these two groups. Table 5.2 reports the mean values, median values, standard errors,
min and max values for the two groups. I also compared the mean value of each group
for the most relevant characteristics. The t-test are reported in Table 5.3, which shows
the significance of these differences.
Table 5.2. Descriptive Statistics for sub-samples
Early-Stages Funds Later-stages Funds
VariableOb
s Mean Median Std. Dev. Min Max Obs
. Mean Median Std. Dev. Min Max
Div. by Country 487 0.206 0.000 0.257 0.000 0.903 162 0.309 0.245 0.304 0.000 0.885
Div. by Industry 487 0.499 0.612 0.296 0.000 0.891 162 0.464 0.531 0.266 0.000 0.840
No of Companies 487 8.277 5.000 10.432 1.000 116.000 162 12.290 6.500 16.725 1.000 106.000
No of M&A 487 2.433 1.000 4.239 0.000 53.000 162 6.235 3.000 9.396 0.000 72.000
No of IPO 487 1.094 0.000 2.260 0.000 27.000 162 1.173 0.000 1.796 0.000 10.000
No of Positive Exits 487 3.528 1.000 6.059 0.000 80.000 162 7.407 4.000 10.323 0.000 74.000
M&A/No of Companies 487 0.280 0.222 0.299 0.000 1.000 162 0.487 0.500 0.292 0.000 1.000
IPO/No of Companies 487 0.121 0.000 0.207 0.000 1.000 162 0.111 0.000 0.202 0.000 1.000Performance(Positive Exits/ No of Companies) 487 0.401 0.364 0.342 0.000 1.000 162 0.598 0.606 0.295 0.000 1.000
Fund Size (GBP Mil.) 487 27.152 6.940 73.737 0.047 1136.600 162 193.542 62.675 322.947 0.124 1688.110
Ln(Fundsize) 487 1.347 1.937 2.346 - 3.053 7.036 162 3.979 4.138 1.923 -2.091 7.431
ln2(Fundsize) 487 7.307 5.207 7.458 0.000 49.502 162 19.513 17.122 13.904 0.001 55.225
Firmex 487 10.129 1.000 22.833 0.000 149.000 162 17.463 5.000 27.445 0.000 158.000
% Synd. 487 0.435 0.429 0.369 0.000 1.000 162 0.389 0.327 0.333 0.000 1.000
Ln(capitalinflows) 487 7.981 9.094 1.830 4.257 9.714 162 8.154 8.440 1.411 4.257 9.714
The two splits largely differ for the size of funds, LS being on average more
than 7 times bigger than ES. While ES mean size is 27.2 Million of British Pounds with
standard deviation 73.7, LS’ mean size value is over 193 Million, with standard
134

Chapter V
deviation about 324, suggesting a great heterogeneity also within the groups. Those
differences are statistically significant at 1%. The difference between the two splits is
reflected in the number of companies held in portfolio, which for ES is 8.3 and for LS
is 12.3. On average, LS count for 4 more companies in their portfolio than ES. This
does not mean however that all the ES invest less in term of number of companies:
difference between median vales are in fact lower (ES = 10.4 and LS = 12.3) and while
the biggest LS invest in 106 companies, the biggest ES invest in 116 companies. Also
this difference is significant at 1% level.
Table 5.2. Early-stages funds compared with Later-stages funds. Mean values by group.
Early-stages Later-stages T-test p-value(two tails)
Div. by Country 0.21 0.31 -3.26 <0.01Div. by Industry 0.50 0.46 2.05 <0.05No of Companies 8.28 12.29 -2.87 <0.01No of M&A 2.43 6.23 -4.98 <0.001No of IPO 1.09 1.17 -0.44 n.s.No of Positive Exits 3.53 7.04 -4.53 <0.001M&A/No of Companies 0.28 0.48 -7.79 <0.001IPO/No of Companies 0.12 0.11 0.56 n.s.Performance(Positive Exits/ No of Companies) 0.40 0.60 -7.07 <0.001
Fund Size (GBP Mil.) 27.15 193.54 -6.50 <0.001Firmex 10.13 17.46 -3.07 <0.001% Synd. 0.43 0.39 1.46 n.s.
Looking at the difference relatively to Diversification indexes, LS have higher
levels of Diversification by Country with an average index of 31%, while ES reach
21%. This figure supports the finding of previous literature in that ES tend to prefer less
degree of diversification than LS. At least at the level of Country. Indeed, when turning
to the Diversification by Industry, mean values are very similar, with ES values (50%)
135

Chapter V
slightly higher than LS (46.4%). Hence ES and LS tend both to have on average a
medium level of diversification by Industry. This conflicts with previous findings that
ES might prefer lower level of industry scope for their portfolios than LS.
Relatively to company exits LS outperform ES with an average of 6.2
companies exited via third sale (M&A) versus 2.4 for ES. However when looking at the
number of IPOs for the two sub-sample, the figures are very similar, with 1.1
companies brought to public markets for ES and 1.2 for LS. These findings are
consistent with previous literature which shows that for LS third-sales may be a
preferred and/or easier type of exits than IPO, since LS’ portfolio include in general
more stable and easy to evaluate (or in other words, less risky) companies, thus being
more easy to find a third party who wishes to buy the company through MBO, MBI or
other type of buyout. Also this figure support the view that ES are more keen on IPO
than M&A as a way to exit portfolio companies. In fact IPO is the most promising way
for ES to “cash-out” their investment (i.e. to make money from the capital invested),
possibly benefiting for the huge increase of value that generally an offer to public
markets entails42.
Looking at the performance of two splits, measured as the proportion of
portfolio positive exits, including both those exited via IPO and via M&A, LS shows
statistically significant higher values, with an average of 60% of portfolio companies
exited, while ES have an average of 40% of portfolio companies positively exited.
Again, the difference reflects the number of M&A, which is higher for LS than for ES.
42 It has been calculated that in USA for each venture a VC is able to brought to public market, 10 are failures. In this case, for a VC is vital to perform a type of exit that pay not only the capital invested in the venture exited via IPO, but also for the capital invested in the failing ventures (Gompers and Lerner 2000).
136
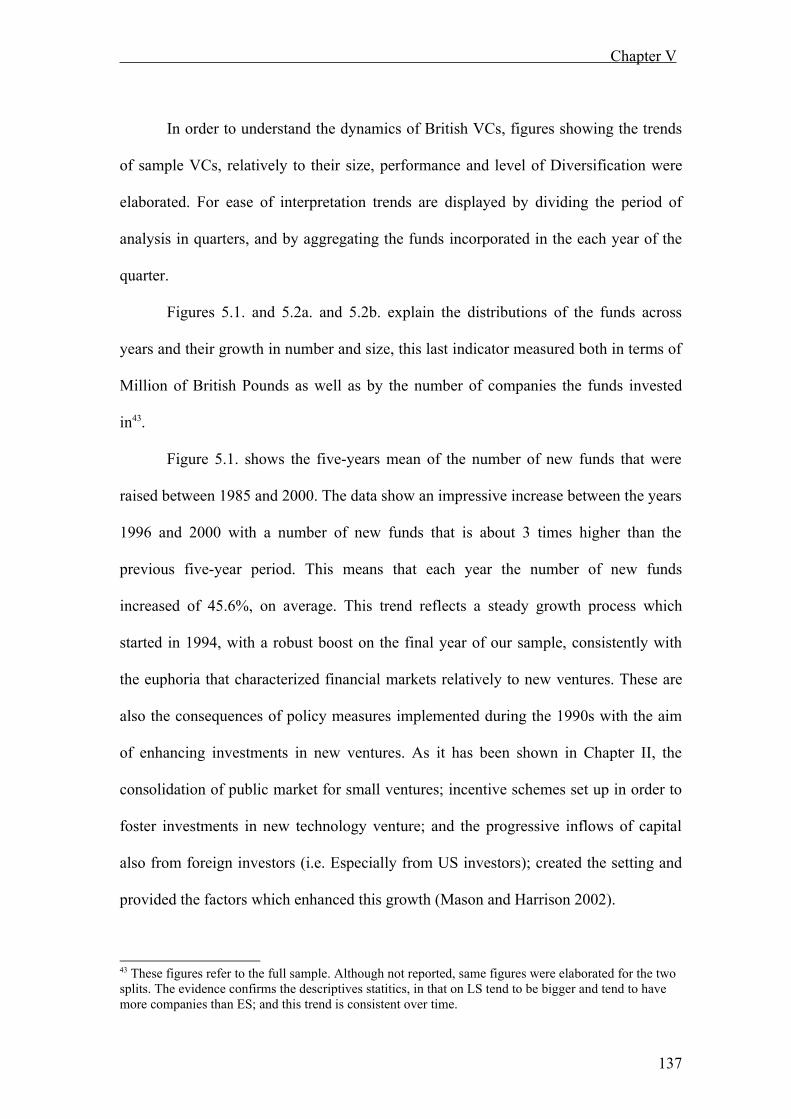
Chapter V
In order to understand the dynamics of British VCs, figures showing the trends
of sample VCs, relatively to their size, performance and level of Diversification were
elaborated. For ease of interpretation trends are displayed by dividing the period of
analysis in quarters, and by aggregating the funds incorporated in the each year of the
quarter.
Figures 5.1. and 5.2a. and 5.2b. explain the distributions of the funds across
years and their growth in number and size, this last indicator measured both in terms of
Million of British Pounds as well as by the number of companies the funds invested
in43.
Figure 5.1. shows the five-years mean of the number of new funds that were
raised between 1985 and 2000. The data show an impressive increase between the years
1996 and 2000 with a number of new funds that is about 3 times higher than the
previous five-year period. This means that each year the number of new funds
increased of 45.6%, on average. This trend reflects a steady growth process which
started in 1994, with a robust boost on the final year of our sample, consistently with
the euphoria that characterized financial markets relatively to new ventures. These are
also the consequences of policy measures implemented during the 1990s with the aim
of enhancing investments in new ventures. As it has been shown in Chapter II, the
consolidation of public market for small ventures; incentive schemes set up in order to
foster investments in new technology venture; and the progressive inflows of capital
also from foreign investors (i.e. Especially from US investors); created the setting and
provided the factors which enhanced this growth (Mason and Harrison 2002).
43 These figures refer to the full sample. Although not reported, same figures were elaborated for the two splits. The evidence confirms the descriptives statitics, in that on LS tend to be bigger and tend to have more companies than ES; and this trend is consistent over time.
137
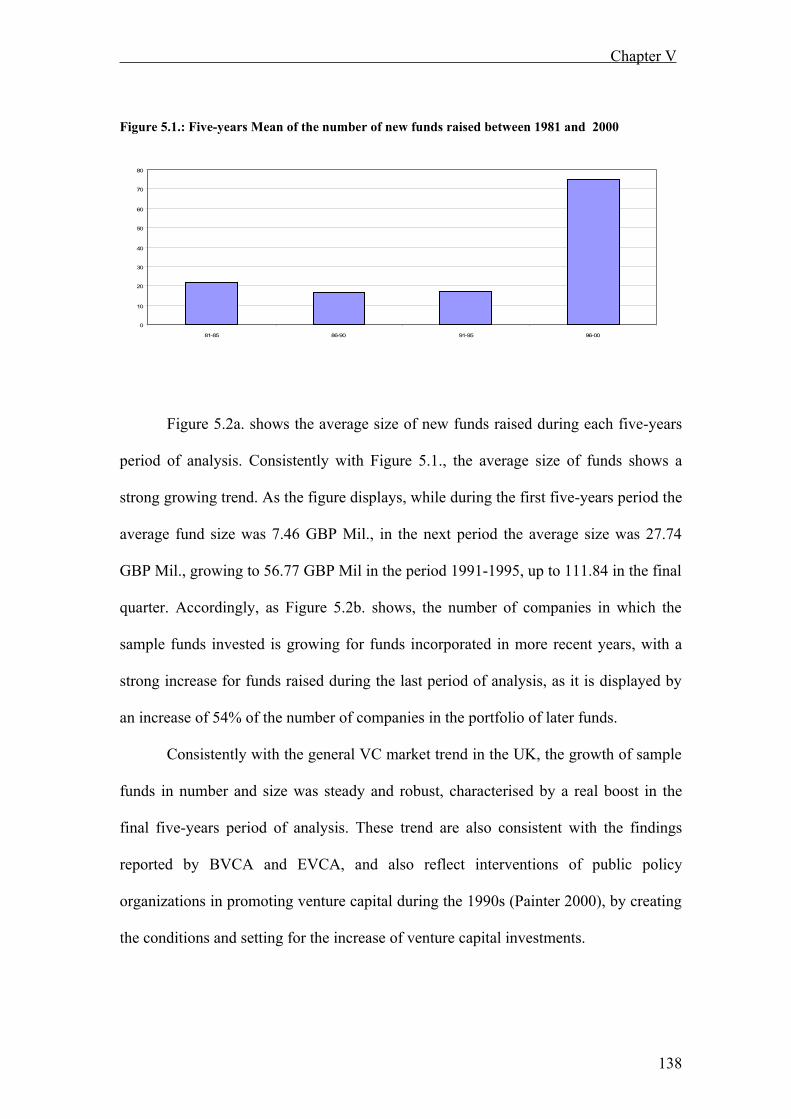
Chapter V
Figure 5.1.: Five-years Mean of the number of new funds raised between 1981 and 2000
0
10
20
30
40
50
60
70
80
81-85 86-90 91-95 96-00
Figure 5.2a. shows the average size of new funds raised during each five-years
period of analysis. Consistently with Figure 5.1., the average size of funds shows a
strong growing trend. As the figure displays, while during the first five-years period the
average fund size was 7.46 GBP Mil., in the next period the average size was 27.74
GBP Mil., growing to 56.77 GBP Mil in the period 1991-1995, up to 111.84 in the final
quarter. Accordingly, as Figure 5.2b. shows, the number of companies in which the
sample funds invested is growing for funds incorporated in more recent years, with a
strong increase for funds raised during the last period of analysis, as it is displayed by
an increase of 54% of the number of companies in the portfolio of later funds.
Consistently with the general VC market trend in the UK, the growth of sample
funds in number and size was steady and robust, characterised by a real boost in the
final five-years period of analysis. These trend are also consistent with the findings
reported by BVCA and EVCA, and also reflect interventions of public policy
organizations in promoting venture capital during the 1990s (Painter 2000), by creating
the conditions and setting for the increase of venture capital investments.
138
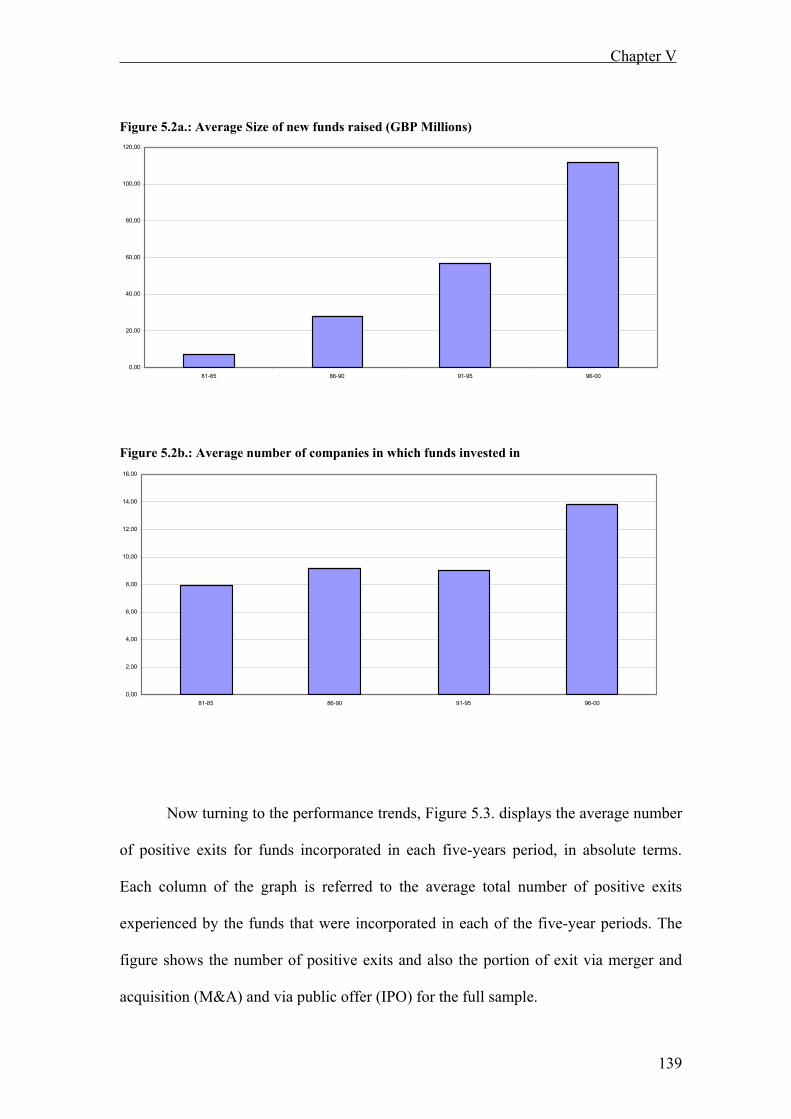
Chapter V
Figure 5.2a.: Average Size of new funds raised (GBP Millions)
0,00
20,00
40,00
60,00
80,00
100,00
120,00
81-85 86-90 91-95 96-00
Figure 5.2b.: Average number of companies in which funds invested in
0,00
2,00
4,00
6,00
8,00
10,00
12,00
14,00
16,00
81-85 86-90 91-95 96-00
Now turning to the performance trends, Figure 5.3. displays the average number
of positive exits for funds incorporated in each five-years period, in absolute terms.
Each column of the graph is referred to the average total number of positive exits
experienced by the funds that were incorporated in each of the five-year periods. The
figure shows the number of positive exits and also the portion of exit via merger and
acquisition (M&A) and via public offer (IPO) for the full sample.
139
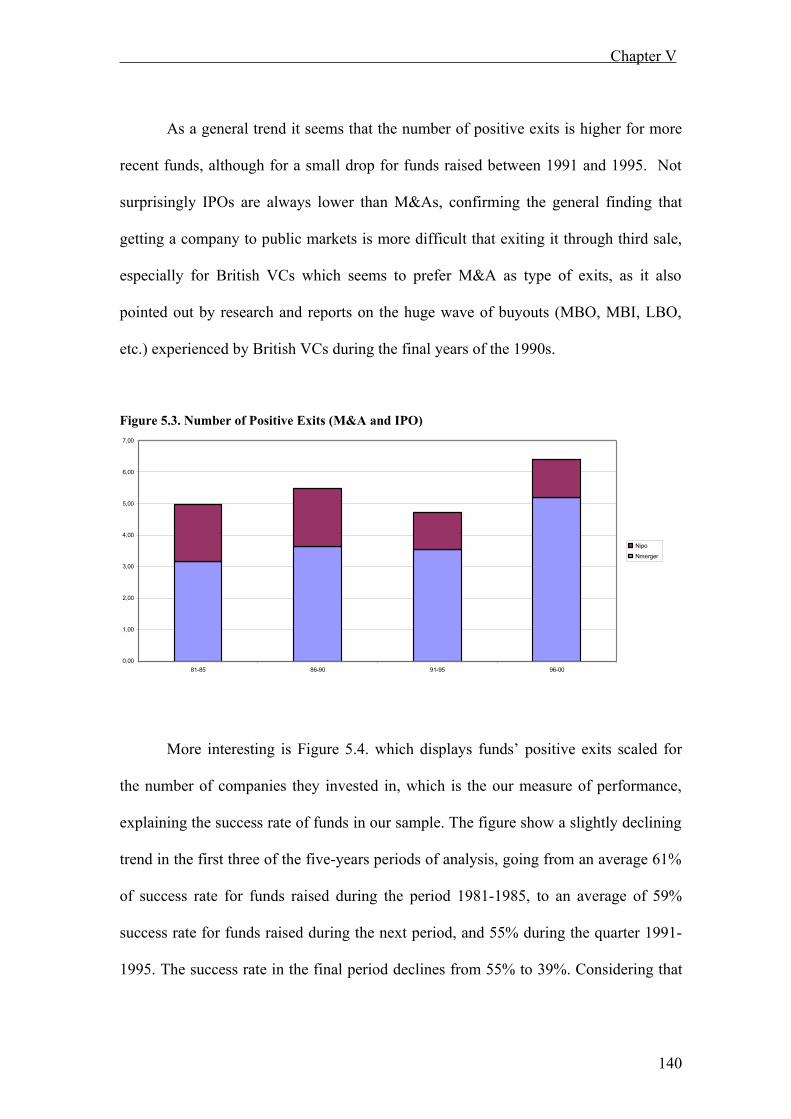
Chapter V
As a general trend it seems that the number of positive exits is higher for more
recent funds, although for a small drop for funds raised between 1991 and 1995. Not
surprisingly IPOs are always lower than M&As, confirming the general finding that
getting a company to public markets is more difficult that exiting it through third sale,
especially for British VCs which seems to prefer M&A as type of exits, as it also
pointed out by research and reports on the huge wave of buyouts (MBO, MBI, LBO,
etc.) experienced by British VCs during the final years of the 1990s.
Figure 5.3. Number of Positive Exits (M&A and IPO)
0,00
1,00
2,00
3,00
4,00
5,00
6,00
7,00
81-85 86-90 91-95 96-00
Nipo
Nmerger
More interesting is Figure 5.4. which displays funds’ positive exits scaled for
the number of companies they invested in, which is the our measure of performance,
explaining the success rate of funds in our sample. The figure show a slightly declining
trend in the first three of the five-years periods of analysis, going from an average 61%
of success rate for funds raised during the period 1981-1985, to an average of 59%
success rate for funds raised during the next period, and 55% during the quarter 1991-
1995. The success rate in the final period declines from 55% to 39%. Considering that
140
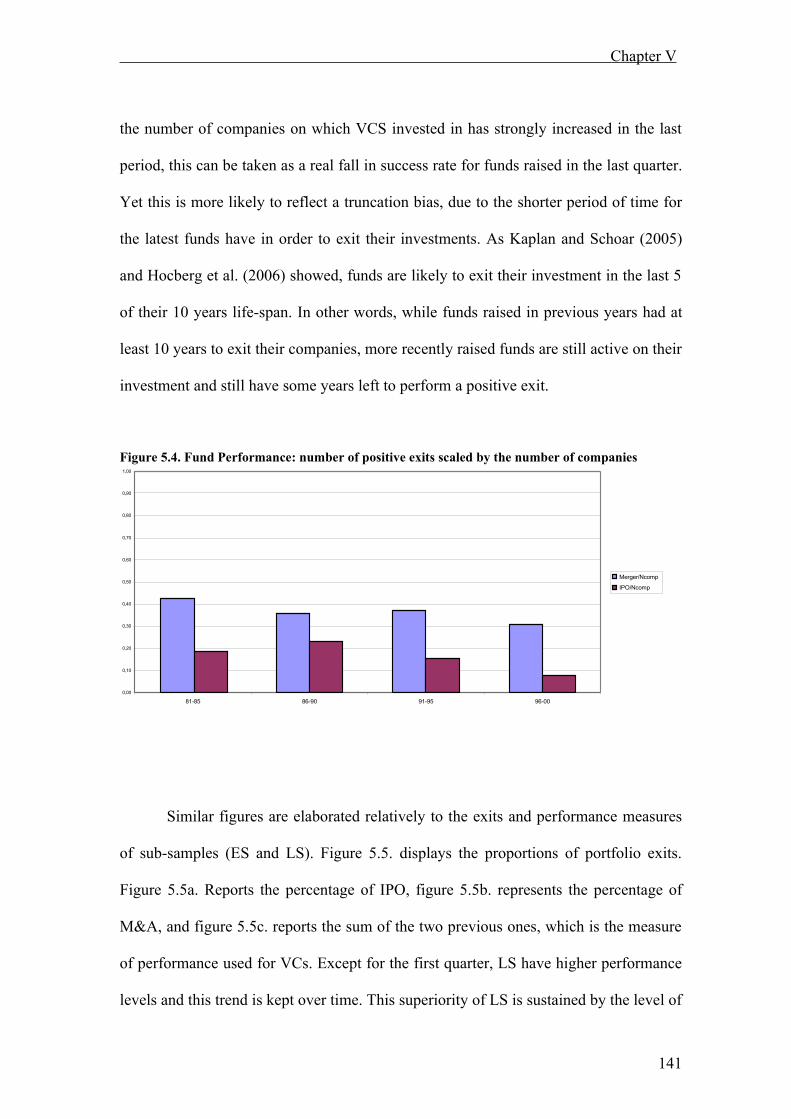
Chapter V
the number of companies on which VCS invested in has strongly increased in the last
period, this can be taken as a real fall in success rate for funds raised in the last quarter.
Yet this is more likely to reflect a truncation bias, due to the shorter period of time for
the latest funds have in order to exit their investments. As Kaplan and Schoar (2005)
and Hocberg et al. (2006) showed, funds are likely to exit their investment in the last 5
of their 10 years life-span. In other words, while funds raised in previous years had at
least 10 years to exit their companies, more recently raised funds are still active on their
investment and still have some years left to perform a positive exit.
Figure 5.4. Fund Performance: number of positive exits scaled by the number of companies
0,00
0,10
0,20
0,30
0,40
0,50
0,60
0,70
0,80
0,90
1,00
81-85 86-90 91-95 96-00
Merger/Ncomp
IPO/Ncomp
Similar figures are elaborated relatively to the exits and performance measures
of sub-samples (ES and LS). Figure 5.5. displays the proportions of portfolio exits.
Figure 5.5a. Reports the percentage of IPO, figure 5.5b. represents the percentage of
M&A, and figure 5.5c. reports the sum of the two previous ones, which is the measure
of performance used for VCs. Except for the first quarter, LS have higher performance
levels and this trend is kept over time. This superiority of LS is sustained by the level of
141
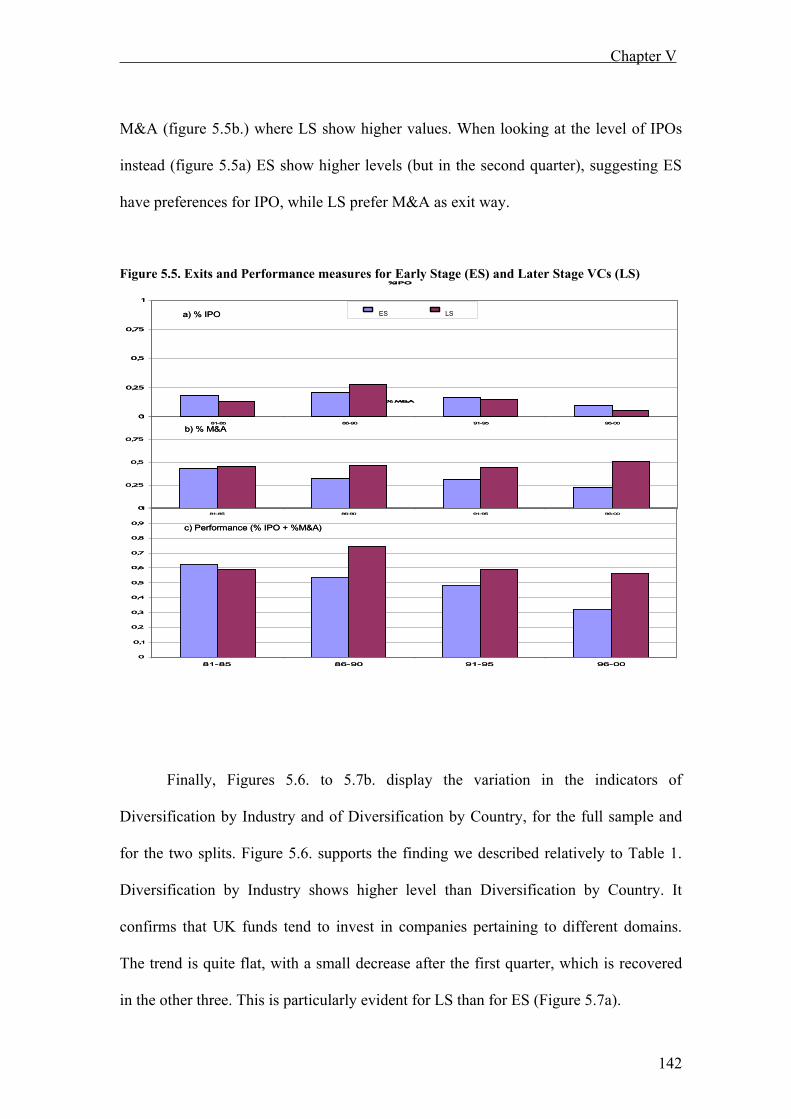
Chapter V
M&A (figure 5.5b.) where LS show higher values. When looking at the level of IPOs
instead (figure 5.5a) ES show higher levels (but in the second quarter), suggesting ES
have preferences for IPO, while LS prefer M&A as exit way.
Figure 5.5. Exits and Performance measures for Early Stage (ES) and Later Stage VCs (LS)
0
0,1
0,2
0,3
0,4
0,5
0,6
0,7
0,8
0,9
1
81-85 86-90 91-95 96-00
% M&A
0
0,25
0,5
0,75
1
81-85 86-90 91-95 96-00
%IPO
0
0,25
0,5
0,75
1
81-85 86-90 91-95 96-00
a) % IPO
b) % M&A
c) Performance (% IPO + %M&A)
0
0,1
0,2
0,3
0,4
0,5
0,6
0,7
0,8
0,9
1
81-85 86-90 91-95 96-00
% M&A
0
0,25
0,5
0,75
1
81-85 86-90 91-95 96-00
%IPO
0
0,25
0,5
0,75
1
81-85 86-90 91-95 96-00
a) % IPO
b) % M&A
c) Performance (% IPO + %M&A)
Finally, Figures 5.6. to 5.7b. display the variation in the indicators of
Diversification by Industry and of Diversification by Country, for the full sample and
for the two splits. Figure 5.6. supports the finding we described relatively to Table 1.
Diversification by Industry shows higher level than Diversification by Country. It
confirms that UK funds tend to invest in companies pertaining to different domains.
The trend is quite flat, with a small decrease after the first quarter, which is recovered
in the other three. This is particularly evident for LS than for ES (Figure 5.7a).
ES LS
142
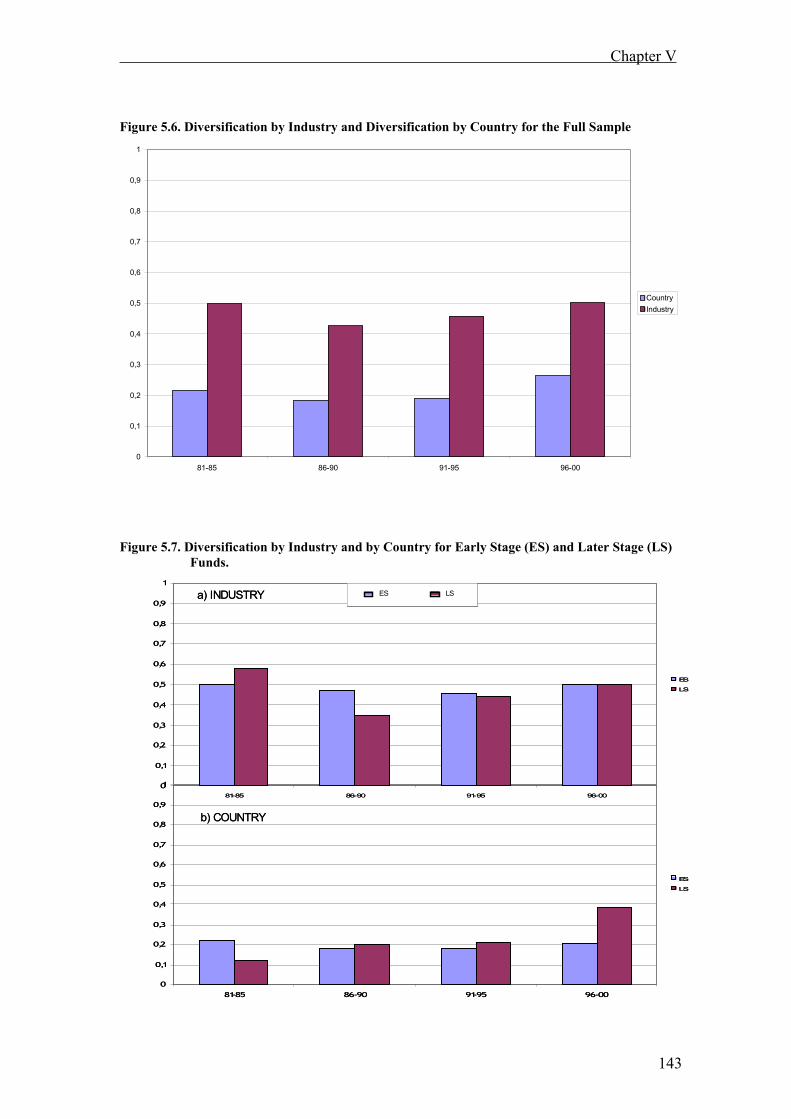
Chapter V
Figure 5.6. Diversification by Industry and Diversification by Country for the Full Sample
0
0,1
0,2
0,3
0,4
0,5
0,6
0,7
0,8
0,9
1
81-85 86-90 91-95 96-00
CountryIndustry
Figure 5.7. Diversification by Industry and by Country for Early Stage (ES) and Later Stage (LS) Funds.
0
0,1
0,2
0,3
0,4
0,5
0,6
0,7
0,8
0,9
1
81-85 86-90 91-95 96-00
ES
LS
0
0,1
0,2
0,3
0,4
0,5
0,6
0,7
0,8
0,9
1
81-85 86-90 91-95 96-00
ES
LS
ES LSa) INDUSTRY
b) COUNTRY
0
0,1
0,2
0,3
0,4
0,5
0,6
0,7
0,8
0,9
1
81-85 86-90 91-95 96-00
ES
LS
0
0,1
0,2
0,3
0,4
0,5
0,6
0,7
0,8
0,9
1
81-85 86-90 91-95 96-00
ES
LS
ES LSES LSa) INDUSTRY
b) COUNTRY
143
Chapter V
The general trend shown for the Diversification by Country is also flat (Figure
5.6.), with a remarkable increase for funds raised in the last quarters, supported by
higher levels of diversification reached by LS compared to LS (Figure 5.7a.). This is
consistent with the data showed by EVCA and BVCA reports and indicating a
progressive internationalisation of UK VCs (Chapter IV) in the late 1990s-early 2000s
showing the tendency to increase investments abroad.
5.2. Interpretations of descriptive statistics and dynamics.
The analyses evidenced that in VCs in the UK are heterogeneous in their
characteristics and apply to portfolio strategy in different ways. The distinction between
ES and LS proved to be significant since the two sub-sample statistically differ in many
important factors, including funds characteristics, level of performance, and
diversification strategies. Overall it seems that VCs tend to have higher level of
Diversification by Industry than Diversification by Country. This is consistent with the
studies which analyse the allocation of efforts and attention of VCs to backed ventures
and found that there is a trade off between the possibility to invest abroad and the
involvement of fund managers in the activities of funded companies (Gompers and
Lerner 2000, Manigart et al. 2002). In other words, the geographical distance imposes
some boundaries on the possibility to oversee and control funded companies, thus
suggesting that it might be easier and more convenient for VCs to follow a
diversification strategy by industry than a diversification strategy by country. The latter
may be more time- and resource-consuming since it requires the deployment of various
144
Chapter V
type of resources in different locations (Gompers 1995). This in particular is supported
by the fact that LS have higher levels of Diversification by Country than ES. The
former indeed have portfolio of companies which are by definition more easy to
evaluate (Kortum and Lerner 1998) because they represent more developed business,
operating in more mature stages where key success factors, such as product, markets
and clients (Hellmann and Puri 2002) are better defined. The latter have to deal instead
with early stage businesses, where even the product idea might be only roughly definite
(Amit et al. 1998), often entailing only the potential of a future profit at the date of
investment (Murray 1999, Kaplan and Stromberg 2001). These investments are those
requiring the greatest involvement and support of the VC in their management, thus
imposing constraints on the possibility to invest abroad or in a large number of different
countries.
Surprisingly this seems not to be true relatively to the dimension of
Diversification by Industry , where ES have the same average rate of diversification, if
not higher, than LS. This evidence clashes with previous literature (Gupta and Sapienza
1992, Norton and Tenenbaum 1993, Carter and Van Auken 1994, Elango et al. 1995)
which found for VCs involved in early stages a preference for less industry scope than
VCs involved in later stage deals. On the other hands this is consistent with those who
support the view of VCs as financial intermediaries, seeking to diversify their portfolio
by investing in unrelated businesses.
An alternative explanation of this could be linked to the existence (or absence)
of investment opportunities available to VCs in their geographical area. In particular,
the need to maintain a fluid and robust deal-flow (Tyebjee and Bruno 1984), i.e. the
need to constantly find profitable investment to be approached by VCs, clashes with the
145

Chapter V
possibility to find a suitable investment in the domain the VC is familiar with (Black
and Gilson 1998, Jeng and Wells 2000) Indeed European venture capital is considered
to be still a young market, at least compared to the more mature USA, lacking (among
other things) of the investment opportunities which arise oversees. This has been used
as an argument to justify the poor return European VCs gain compared to US-based
peers (Bottazzi et al. 2004). Assuming this is true also for UK venture capital, VCs
might have to chase profitable investment opportunities by looking at other domains
than those they are familiar with. This can be especially true for VCs which are
involved with new markets and/or businesses, and is typical for “State-of-the-art”
technologies, where the number of investment opportunity is lower than those in more
consolidate environment, explaining why also ES have to face higher levels of
Diversification by Industry.
5.3. The impact of portfolio Diversification on fund
Performance: regressions and analyses.
In this section I analyse whether portfolio Diversification leads to better
performance for VCs than portfolio specialization in a regression framework. In order
to do so, VCs performance are measured as the proportion of portfolio companies
exited via IPO and M&A. VCs diversification is operationalized at three different
levels: Diversification by Industry, by Country and the scope of stage of development
of investee ventures. I operationalized these measures using the complement to
Herfindahl-Hirschmann indexes, taking any value between 0 and 1, so that a fund with
146
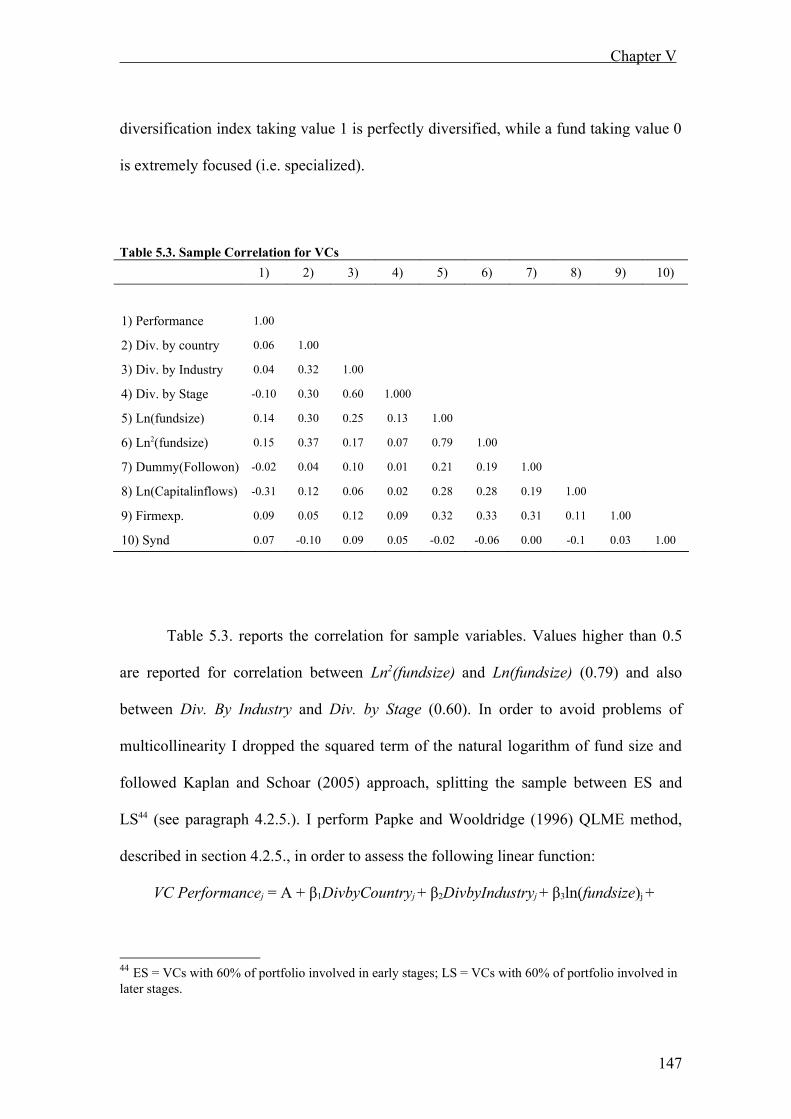
Chapter V
diversification index taking value 1 is perfectly diversified, while a fund taking value 0
is extremely focused (i.e. specialized).
Table 5.3. Sample Correlation for VCs1) 2) 3) 4) 5) 6) 7) 8) 9) 10)
1) Performance 1.00
2) Div. by country 0.06 1.00
3) Div. by Industry 0.04 0.32 1.00
4) Div. by Stage -0.10 0.30 0.60 1.000
5) Ln(fundsize) 0.14 0.30 0.25 0.13 1.00
6) Ln2(fundsize) 0.15 0.37 0.17 0.07 0.79 1.00
7) Dummy(Followon) -0.02 0.04 0.10 0.01 0.21 0.19 1.00
8) Ln(Capitalinflows) -0.31 0.12 0.06 0.02 0.28 0.28 0.19 1.00
9) Firmexp. 0.09 0.05 0.12 0.09 0.32 0.33 0.31 0.11 1.00
10) Synd 0.07 -0.10 0.09 0.05 -0.02 -0.06 0.00 -0.1 0.03 1.00
Table 5.3. reports the correlation for sample variables. Values higher than 0.5
are reported for correlation between Ln2(fundsize) and Ln(fundsize) (0.79) and also
between Div. By Industry and Div. by Stage (0.60). In order to avoid problems of
multicollinearity I dropped the squared term of the natural logarithm of fund size and
followed Kaplan and Schoar (2005) approach, splitting the sample between ES and
LS44 (see paragraph 4.2.5.). I perform Papke and Wooldridge (1996) QLME method,
described in section 4.2.5., in order to assess the following linear function:
VC Performancej = A + β1DivbyCountryj + β2DivbyIndustryj + β3ln(fundsize)j +
44 ES = VCs with 60% of portfolio involved in early stages; LS = VCs with 60% of portfolio involved in later stages.
147
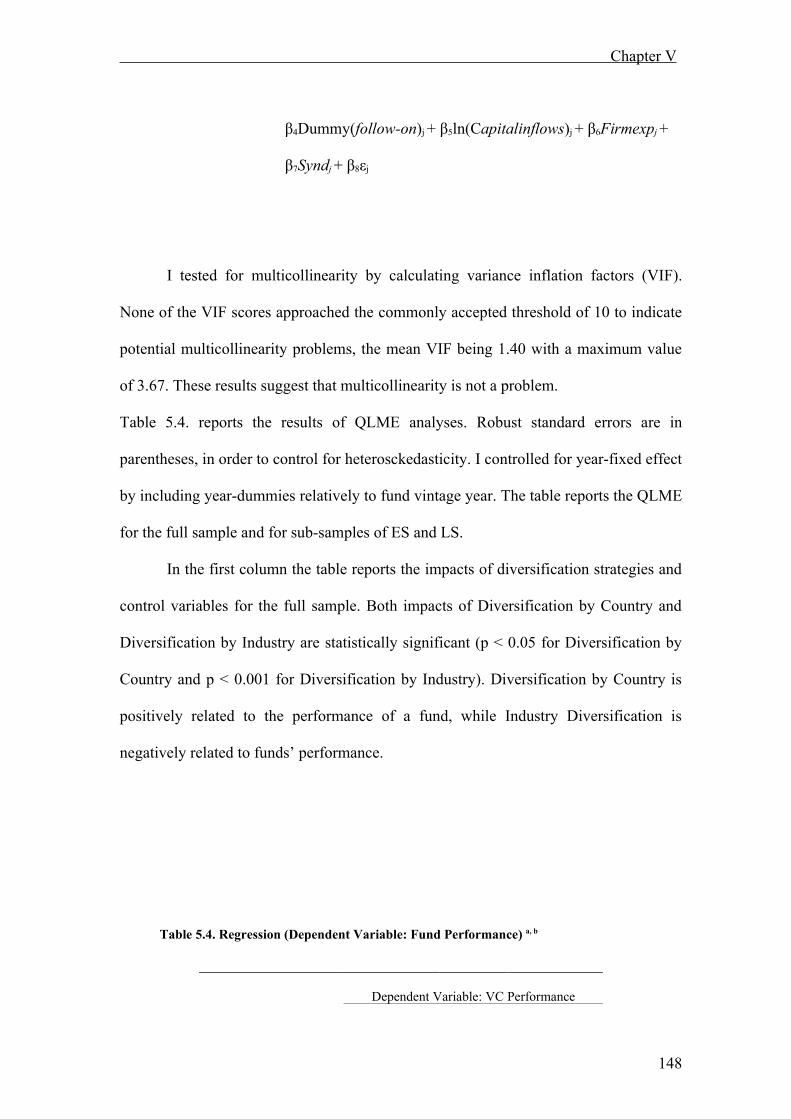
Chapter V
β4Dummy(follow-on)j + β5ln(Capitalinflows)j + β6Firmexpj +
β7Syndj + β8εj
I tested for multicollinearity by calculating variance inflation factors (VIF).
None of the VIF scores approached the commonly accepted threshold of 10 to indicate
potential multicollinearity problems, the mean VIF being 1.40 with a maximum value
of 3.67. These results suggest that multicollinearity is not a problem.
Table 5.4. reports the results of QLME analyses. Robust standard errors are in
parentheses, in order to control for heterosckedasticity. I controlled for year-fixed effect
by including year-dummies relatively to fund vintage year. The table reports the QLME
for the full sample and for sub-samples of ES and LS.
In the first column the table reports the impacts of diversification strategies and
control variables for the full sample. Both impacts of Diversification by Country and
Diversification by Industry are statistically significant (p < 0.05 for Diversification by
Country and p < 0.001 for Diversification by Industry). Diversification by Country is
positively related to the performance of a fund, while Industry Diversification is
negatively related to funds’ performance.
Table 5.4. Regression (Dependent Variable: Fund Performance) a, b
Dependent Variable: VC Performance
148

Chapter V
Variable (1) Full Sample (2) ES (3) LS
Intercept 3.248***(0.60)
2.184***(0.19)
1.793**(0.57)
Div by Country 0.424**(0.16)
0.290(0.19)
0.567**(0.31)
Div by Industry - 0.714**(0.20)
- 0.363(0.24)
- 1.582***(0.546)
Ln(Fundsize) 0.142***(0.03)
0.100***(0,03)
0.045***(0.057)
Dummy(Followon) - 0.111(0.12)
- 0.201(0.134)
- 0.254(0.27)
Ln(Capitalinflows) - 0.419***(0.06)
- 0.337***(0.039)
- 0.088(0.062)
Firmexp 0.004*(0.00)
0.005**(0.002)
0.004(0.358)
Synd 0.192(0.60)
0.322(0.21)
- 0.115(0.36)
Year Dummies YES YES YESLog pseudolikelihood -328.66 -246.75 -78.19McFadden's Adj R2 0.10 0.32 0.79N. obs. 649 487 162
a Robust Standard errors in parentheses. b *** = p < 0.001; ** = p < 0.05; * = p < 0.1
.
This suggest that for UK funds following a diversification strategy by investing
in companies differently located pays more, in terms of percentage of companies exited
through IPO or acquisition, then a country-focused approach.
On the other hand, Industry diversification is negatively related to fund
performance. In other words, the more the funds diversify by industry, the less they are
likely to perform positive exits.
149
Chapter V
In columns 2 and 3 results for ES and LS are considered. The direction of
relationships between portfolio diversification and performance are kept both for ES45
and LS, VCs performance being positively affected by country scope of portfolio and
negatively affected by industry scope of investments.
For the full sample Hypothesis 1,a is confirmed on the Country Dimension. This
results seem to support the Financial Intermediation perspective, in that VCs which
diversify across countries seeking portfolio risk reduction are more likely to show
higher performance. Conversely, on the geographic dimension, these results disconfirm
a resource-based view applied to the venture capital context. In other words VCs
pursuing diversification by country as an investment strategy show higher performance
than VCs following a geographic-focused approach to investments. By broadening their
geographic scope of investment portfolio VCs can enlarge their investment
opportunities. This will provide higher chances to identify higher-return investments.
Moreover, by spreading their portfolio in different geographic areas, they can minimize
country-specific risk and mitigate the impact on performance of factors negatively
affecting the economic outcomes for a specific geographic region.
However, this perspective changes when looking at diversification strategy at
the level of Industry. Here Hypothesis 1,b is confirmed. VCs pursuing specialization
investment strategy on the Industry dimension show higher performance than those
investing in several different technological fields or industries. On this dimension
Financial Intermediation and agency perspectives are no more supported. The results
suggest, instead, that moving along the Industry dimension, a more focused approach
pays more than diversification, thus confirming the resource/knowledge-based
perspective. Specialized VCs can control for business risk by providing more 45 Although ES coefficient are not statistically significant.
150

Chapter V
competent strategic and operational support to deals they funded (Barney et al. 1989),
by leveraging on knowledge and competences developed in a particular field and by
spreading and redeploying these assets over a number of technologically similar
ventures. Specialization may help VCs to protect themselves from information
asymmetry (Eisenhardt 1989), thanks to their in-depth understanding of the industry.
Also VCs’ specialized industry knowledge can help VCs in more accurately evaluating
and selecting ventures, thus having more potentially profitable companies in their
portfolios.
Overall it appears that VCs which diversify by Country tend to have higher
performance, while those who diversify by Industry tend to find more difficulties in
exiting portfolio companies.
When looking at columns 2 (ES) and 3 (LS) of the table direction of effects for
Diversification by Country and by Industry are steady with LS shower higher
magnitude than ES in both cases, and ES coefficients being not significant. In other
words, the positive impact of Diversification by Country is stronger for VCs involved
in later stage investments than for those dealing with earlier ones, the coefficient for the
latter being not statistically significant. On the Country dimension, this is consistent
with the studies which found that LS prefer higher level of geographic scope while ES
are keen to a narrower geographic scope (Gupta and Sapienza 1992, Norton and
Tenenbaum 1993).
Relatively to the Industry dimension, LS show higher impact of diversification
on performance. For this type of VCs industry diversification is more likely to lead to
lower performance, supporting the findings of scholars which state that, by limiting the
number of industries in which to invest, VCs can develop a more specialized
151
Chapter V
knowledge of the complexities inherent in these particular fields, the homogeneity
among the portfolio ventures allowing for an effective sharing and re-deploying of
specialized resources across them. This in turns enhance the possibility for the VC to
effectively support the funded companies and, as a consequence, it enhance the
probability to exit ventures via IPO and M&A.
Turning now to the other variables, the first one controls for the size of the fund
measured by the logarithmic transformation of fund size in Millions of British Pounds.
This measure is positively related to funds performance and significant at 1% level.
Furthermore this relationships is confirmed and significant both for ES and LS sub-
samples. Other authors (Hocberg et al. 2005, Kaplan and Schoar 2005, Lerner et al.
2005) found a concave relationship between funds performance and their size,
highlighted by the negative impact of the squared value of the logarithmic
transformation of size. I did not included the squared log term in the analysis, since it is
positively correlated with the log term. Yet in an unreported regression I controlled for
the squared effect finding no concave relationship between fund size and performance
in the sample.
Results also suggest that when more money was raised by venture funds in the
industry, performance of same-year funds declines. Controlling for the inflow of funds
in Million of British Pounds in the market, I found that the fund-raising (i.e. the Capital
Inflows in the venture capital industry) is negative and significantly related to funds
performance. This result is not surprising; it is likely that fund inflows proxy for
competition for deals. As competition increases the harder it is for new entrants to win
good deals. Hence this findings are consistent with Gompers and Lerner (2000), who
152

Chapter V
were the first to capture the “money chasing for deals” phenomenon. This evidence is
also supported by more recent papers (Hocberg et al. 2005, Kaplan and Schoar 2005)
which show that prices VCs pay when investing in portfolio companies increase as
more money flows into the venture capital industry, holding investment opportunities
constant. This pattern is an evidence that increases in capital inflow produce an increase
in the competition for a limited number of investment opportunities, negatively
affecting the quality of investments and, as a consequence, funds performance.
The variable Follow-on is a dummy which aims to capture the effect of
experienced funds on performance. Gompers (1996) shows, the possibility to raise
follow-on funds is affect the chances for VCs to attract capital from investors. Thus
raising follow-on funds is very important for VCs who want to show track records of
performance. Results show that follow-on funds do not seem to add to positive
performance, never being significant in all three studies (and showing negative
coefficients). Amit et al. (1998) report that, some VCs raise follow-on funds when at
the end of previous fund life, transferring old-fund companies in the new fund portfolio.
Hence, if a fund at the end of its life has a portfolio of active investments it is more
likely the VC raises a new fund in order to pursue the investments in the old portfolio,
trying to gain more time to perform positive exits with those investments still active. In
this case raising follow-on funds does not necessarily imply better performance,
reflecting instead the aim of the VC to simply pursue the investments.
As expected the experience of fund managers (i.e. the variable Firmexp) is
positively related to funds performance. This finding shows that managing experience
matter far more than the ability to raise up subsequent funds. Furthermore, this finding
is also significant for ES, supporting the view that managing experience can add more
153
Chapter V
value to early-stage ventures, because the greater uncertainty relatively to the definition
of products, markets and businesses, imply a greater involvement and support from the
VC (Murray 1999, Kaplan and Stromberg 2001).
Finally, I do not find statistical support for the positive relationship between the
syndication of investments and VCs performance, since the coefficients are not
significant in all the three studies, although reporting positive values for the full sample
and for the ES sub-sample.
5.4. Robustness Checks
Two potential biases can affect previous results. In this section I display the
robustness checks relatively to: sample selection and performance measurement.
5.4.1. Sample Selection bias
The sample include British VCs raised between 1981 and 2000. For each fund I
gathered information of investment activities and performance until the end of 2006.
Since funds have a predetermined life of 10 years, more recent funds have less years of
observation. For instance funds raised on 2000 have (only) 6 years of observation,
while funds raised in early 1990s have more than 10.
In paragraph 5.2. it has been displayed a decreasing trend relatively to
performance of funds raised in the last quarter period of analysis. Since funds tend to
exit their companies mostly in the second half of their life (Kaplan and Schoar 2005,
154
Chapter V
Hocberg et al. 2004) it might be that poorer performance trend for these younger
funds46 is not true, but instead is the effect of a truncation bias.
In order to control for this, I repeat the analyses considering only the VCs raised
until 1996, each fund having at least 10 years of observation to exit its companies.
Table 5.5. reports the results of the analyses for the sample of funds raised
between 1981 and 1996. The full sample counts about 52% of the old sample (335
observations were dropped) as expected, since in section 5.2. it has been shown that the
number of funds experienced a strong increasing trend over time, especially in the two
last quarter periods of analysis. However directions and significance of main effects
keep steady. Diversification by Industry is negatively related to VCs performance,
while Diversification by Country is positively related.
Also while looking at the two sub-samples, minor changes occur compared with
previous regressions. For LS the size of funds is no more significant. Trends shown in
previous paragraphs told that funds tend to increase their size during the last quarter
period (i.e. between 1995-2000). Hence a possible explanation may be linked to the fact
that the new LS sub-sample does not include bigger funds.
Moreover, the variable follow-on becomes significant (1% level) for the full
sample and for the ES split, having a negative relationship with VCs performance. This
contrasts with the findings of Gompers (1996). The explanation that follow-on funds
are raised with the purpose to continue pursuing investments which are still active at
the end of the fund life, is thus more reasonable.
Table 5.5. Regression for funds raised between 1981 and 1996 (Dependent Variable: Fund Performance) a, b
46 In previous paragraph it has been noted that I considered year-effects by including in the QMLE regression years dummies.
155
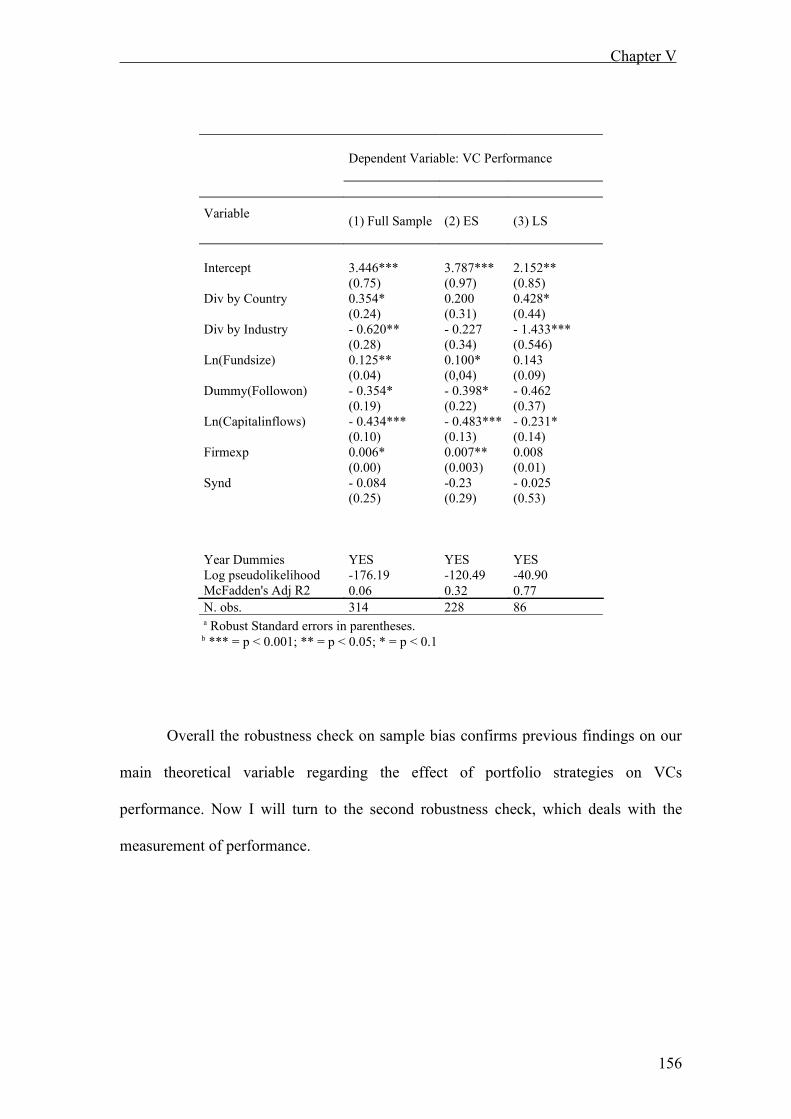
Chapter V
Dependent Variable: VC Performance
Variable (1) Full Sample (2) ES (3) LS
Intercept 3.446***(0.75)
3.787***(0.97)
2.152**(0.85)
Div by Country 0.354*(0.24)
0.200(0.31)
0.428*(0.44)
Div by Industry - 0.620**(0.28)
- 0.227(0.34)
- 1.433***(0.546)
Ln(Fundsize) 0.125**(0.04)
0.100*(0,04)
0.143(0.09)
Dummy(Followon) - 0.354*(0.19)
- 0.398*(0.22)
- 0.462(0.37)
Ln(Capitalinflows) - 0.434***(0.10)
- 0.483***(0.13)
- 0.231*(0.14)
Firmexp 0.006*(0.00)
0.007**(0.003)
0.008(0.01)
Synd - 0.084(0.25)
-0.23(0.29)
- 0.025(0.53)
Year Dummies YES YES YESLog pseudolikelihood -176.19 -120.49 -40.90McFadden's Adj R2 0.06 0.32 0.77N. obs. 314 228 86
a Robust Standard errors in parentheses. b *** = p < 0.001; ** = p < 0.05; * = p < 0.1
Overall the robustness check on sample bias confirms previous findings on our
main theoretical variable regarding the effect of portfolio strategies on VCs
performance. Now I will turn to the second robustness check, which deals with the
measurement of performance.
156
Chapter V
5.4.2. The percentage of IPOs as an alternative measure of VCs
performance.
I measured the dependent variable (VC performance) as the proportion of
companies exited via IPO and M&A. In paragraph 3.4. it has been shown why this
measure should be considered a reliable proxy for VCs return. Indeed by including only
the portion of M&As or only the portion of IPOs one is putting aside the other portion
of exits which generate returns (Hochberg et al. 2004). Furthermore, previous research
on UK and analysis on sample trend reveals that exit via third sale is a fundamental
driver for VC returns (Wright and Lockett 1999).
However some authors pointed out that IPO should be the most important exit
route, since it is by bringing ventures to public markets that VCs receive the highest
capital gains (Black and Gilson 1998). Hence IPO might be considered by VCs as the
strongest driver to invest (Jeng and Wells 2000), especially for early stage investors, for
which a successful IPO can cover the costs and risks of several failures (Gompers and
Lerner 1999).
As a robustness check I proxy VCs performance aa the proportion of IPOs, i.e.
the number of portfolio companies brought to public market scaled for the total number
of portfolio ventures, and repeat the regressions on the full sample and split samples.
Table 5.2. shows the results of this check. Looking at the first column for the
regression on the full sample, results of the analysis confirm the findings displayed in
Table 5.4. Higher levels of Diversification by Country seem to enhance the probability
for a VC to bring backed ventures to public markets. On the contrary, and still
157
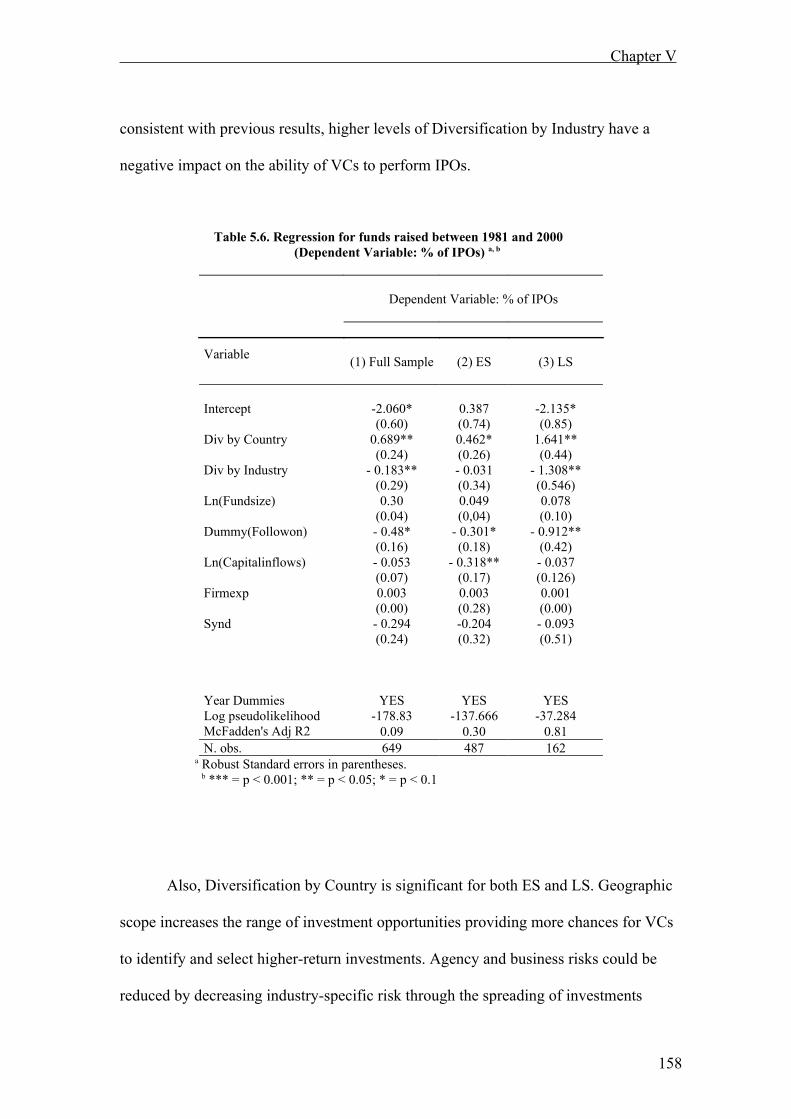
Chapter V
consistent with previous results, higher levels of Diversification by Industry have a
negative impact on the ability of VCs to perform IPOs.
Table 5.6. Regression for funds raised between 1981 and 2000 (Dependent Variable: % of IPOs) a, b
Dependent Variable: % of IPOs
Variable (1) Full Sample (2) ES (3) LS
Intercept -2.060*(0.60)
0.387(0.74)
-2.135*(0.85)
Div by Country 0.689**(0.24)
0.462*(0.26)
1.641**(0.44)
Div by Industry - 0.183**(0.29)
- 0.031(0.34)
- 1.308**(0.546)
Ln(Fundsize) 0.30(0.04)
0.049(0,04)
0.078(0.10)
Dummy(Followon) - 0.48*(0.16)
- 0.301*(0.18)
- 0.912**(0.42)
Ln(Capitalinflows) - 0.053(0.07)
- 0.318**(0.17)
- 0.037(0.126)
Firmexp 0.003(0.00)
0.003(0.28)
0.001(0.00)
Synd - 0.294(0.24)
-0.204(0.32)
- 0.093(0.51)
Year Dummies YES YES YESLog pseudolikelihood -178.83 -137.666 -37.284McFadden's Adj R2 0.09 0.30 0.81N. obs. 649 487 162
a Robust Standard errors in parentheses. b *** = p < 0.001; ** = p < 0.05; * = p < 0.1
Also, Diversification by Country is significant for both ES and LS. Geographic
scope increases the range of investment opportunities providing more chances for VCs
to identify and select higher-return investments. Agency and business risks could be
reduced by decreasing industry-specific risk through the spreading of investments
158
Chapter V
across different countries. Although data show this should be true for both the sub-
samples, the positive effect of geographic diversification is bigger for LS than ES, as
the magnitude of relative coefficients says. A possible explanation for this might lay on
the fact that, by dealing with more mature companies, LS may find easier to bring a
venture to public market. These ventures concern businesses better defined so that it
may be easier for VCs to evaluate the profit potential of companies and to select the
most promising ones. On the other hands, also for public markets it is easier to float
more established companies because it may offer more guaranties of returns to
shareholders. In other words, the higher stability and solidity of companies in later
stages might induce LS to look for the advantages of portfolio diversification on the
geographic dimension
159

Conclusions and limitation of the research
Conclusions and limitations of the research
Contribution of the research
This research analysed the impacts of VCs’ portfolio strategies on their
performance. In particular it addressed the question whether a diversified approach to
investment portfolio leads to better performance than a specialized strategy. Hence the
main contributions of this research are that it adds on the literature that studies the
strategic behaviour of VCs, analysing for the first time the VCs strategic decisions
relatively to portfolio composition, and their impacts on performances.
VCs invest in highly risky ventures with the hope of obtaining a profit in return.
While, on the one hand, the traditional financial approach suggests that diversification
eliminates non-systematic risks (Scharpe 1964, Brealey and Myers 1996), on the other,
the competence-based approach seems to support greater specialization of VCs
portfolio as a means of reducing uncertainty (Bygrave 1987, Lubatkin and Rogers
1989, Manigart et al. 2002). The very nature of VCs is the investment in highly risk and
(potentially) highly reward, privately held companies with the goal of providing
expected returns to investors, by supporting and developing backed ventures and then
by realizing capital gains through the exit of portfolio companies via third sale or public
offer. Hence analyses of portfolio strategies is a relevant question since it represents a
powerful means VCs have to manage their risk/return profile. It is important to
examine factors influencing these decisions and the consequences on VCs performance.
160
Conclusions and limitation of the research
This research suggests that VCs’ performances are contingent on their choices
as to the composition of their investment portfolios. Also, the decision determining the
composition of a VC’s portfolio of investments and thus the level of diversification,
plays a crucial role in the creation of a fund. First these are long term strategic decisions
that are difficult to change. Second the maximum amount a VC fund is allowed to
invest in a single company as well as in certain financing stages, industries, or countries
is fixed in the partnership agreement with the limited partners, i.e., the investors. A
deviation from this agreement is only possible if all limited partners approve.
Previous research on this topic showed that VCs can choose between two
alternative approaches to portfolio management: diversification or specialization of
investment portfolio. These approaches apply to different theoretical perspective: the
literature that takes a financial intermediation perspective on the VCs insists on the
financial advantages resulting from the reduction of risk exposure through the
combination of ventures whose financial flows are not correlated. The resource-based
perspective applied to venture capital, instead, advances the superiority of a
specialization strategy. The specialization of VCs’ portfolio in those particular
industries, stage of development and geographic markets, make them more capable of
dealing adequately with the risks, uncertainties, and information asymmetries
associated with investment opportunities.
Both these approaches some limitation in explaining the behaviour of venture
capital and they do not address the question of the relationship between portfolio
strategies and VCs performance. Hence this thesis is an attempt to go directly at the
core issue of this relationship, by modelling two conflicting hypotheses, one supporting
the view that diversification should lead to better performance than specialization (as
161
Conclusions and limitation of the research
predicted by Financial intermediation theory), the other one stating that specialization
should lead to better performance than diversification (as predicted by the Resource
based approach to venture capital investment). I modelled portfolio strategy considering
different dimensions along which a VC can diversify or specialize, namely the industry
and geographic scope of portfolio investments. In this sense indexes of diversification
have been calculated so that higher values in the indexes indicate diversification, while
lower values mean specialization. Then I analyse the impact of these factors on the
performance of VCs in the UK, taking in consideration also the particular involvement
of each VC in early stage deals or in later stage deals.
The analyses evidenced, first, that in VCs in the UK are heterogeneous in their
characteristics and apply to portfolio strategy in different ways. Overall VCs have
higher level of Diversification by Industry than Diversification by Country. This
research suggests that the geographical distance imposes some boundaries on the
possibility to oversee and control funded companies, implying that it might be easier or
more convenient for VCs to follow a diversification strategy by industry than a
diversification strategy by country. The latter may be more time- and resource-
consuming since it requires the deployment of various type of resources in different
locations (Gompers 1995). This in particular is supported by the fact that later-stages
VCs (LS) have higher levels of Diversification by Country than early-stages peers (ES).
The former indeed have portfolio of companies which are by definition more easy to
evaluate because they represent more developed business, while the latter have to deal
with businesses often entailing only the potential of a future profit at the date of
investment. Since these investments are those requiring the greatest involvement and
support of the VC in their management, thus imposing constraints on the possibility to
162
Conclusions and limitation of the research
invest abroad or in a large number of different countries. This is not true relatively to
Diversification by Industry, where ES have the same average rate of diversification, if
not higher, than LS. This lead to the conclusion which contradict previous literature
(Gupta and Sapienza 1992, Norton and Tenenbaum 1993, Carter and Van Auken 1994,
Elango et al. 1995) which found for ES a preference for less industry scope than LS. As
a possible explanation it is argued that the existence (or absence) of investment
opportunities available to VCs affects the composition of their portfolio of investments.
In particular, the need to constantly find profitable companies to invest in,
clashes with the actual existence (or absence) of suitable investment in the domain the
VC is familiar with. This calls into question the maturity of venture capital markets
(Black and Gilson 1998, Jeng and Wells 2000). Indeed European venture capital is
considered to be still a young market, at least compared to the more mature USA,
lacking (among other things) of the investment opportunities which arise overseas. This
has been used as an argument to justify the poor return European VCs gain compared to
US-based peers (Bottazzi et al. 2004). Assuming this is true also for UK venture
capital, VCs might have to chase profitable investment opportunities by looking at
other domains than those they are familiar with. This can be especially true for VCs
which are involved with new markets and/or businesses, and is typical for “State-of-
the-art” technologies, where the number of investment opportunity is lower than those
in more consolidate environment, explaining why also ES have to face higher levels of
Diversification by Industry.
On the relationship between diversification and performance, the analyses
results show that different level of diversification have divergent impacts on VCs
performance. In particular, while Diversification by Country have a positive impact on
163

Conclusions and limitation of the research
performance, Diversification by Industry negatively affects performance of VCs. Hence
on the geographic dimension, results confirm the prediction of the Financial
Intermediation perspective, while on the industry dimension, results confirm the
prediction of the Resource-based approach. As a possible explanation of this findings, it
is advanced that there is a higher degree of geography homogeneity than industry
homogeneity. In other words, the different country a VCs can chose to invest in are
more similar each other in terms of venture capital investments, than on the industry
domain. Indeed in Western economies processes of homologation are implemented in
latest years relatively to market infrastructures and economic regulation. For instance in
European countries small number of investment opportunities and poorer return during
the 1990s have been associating to the differences between regional venture capital
markets relatively to financial markets, business and sector regulation and policy
interventions (La Porta et al. 1997, Jeng and Wells 2000). Furthermore Bottazzi et al.
(2004) pointed out that a major issue explaining the gap between European VCs and
US-based VCs has been the fragmentation of regional venture capital markets and the
lack of critic mass in terms of investment opportunities to VC investment. Indeed
several official documents of the European Commission and other European
Organization policies urge for the integration of European Union’s financial markets
and the development of venture capital (European Commission 1998, EVCA 2000).
Sample data show increasing trend in level of diversification for younger funds. Hence,
is possible that in the context of integration of market infrastructures; converging
business, sector regulation and policy interventions (Levin 2004); and aligning financial
markets (Black and Gilson 1998), VCs may find easier to invest abroad and find
profitable opportunities which were not available in countries where they were used to
164
Conclusions and limitation of the research
invest in before. As a consequence, higher levels of Diversification by Country might
be beneficial in terms of VCs performance.
Limitations of the thesis and future directions of research on Venture
Capital strategy
In studying the patterns of VCs’ portfolio strategies and its impacts on
performance, this research shows several limitations.
A first limitation concerns the measure of performance implemented for
VCs. The calculation of performance through internal rates of return (IRR) is tricky in
terms of both data availability and measurement problems. First fund cash-flows are
difficult to observe, but when a company exits the VC portfolio. Furthermore, a big
fraction of deals is syndicated so that it is necessary to evaluate the syndication
agreements on the sharing of returns for venture exits. Moreover, in IPO exits, venture
capitalists typically keep a large stake for a certain period after the IPO and exit piece
by piece (Cumming and Macintosh 2003). The difficult part for an outside observer
would be to track all the actual cash flows the venture capitalist receives from selling
portions of its ownership after the IPO. I used the fraction of portfolio companies exited
via IPO and M&A as a proxy of fund returns. The question is: Can we then use exit
rates as a proxy for investment success? We should certainly be careful in making
inferences based on, say, the exit rate. Although IPOs and M&As are the highest profit
165
Conclusions and limitation of the research
exit routes, exits differ widely in their terms and the price obtained. For instance, a
success rate of 50% which gives a total capital gain of 20% on the total amount
invested by the fund, is performing worse than a success rate which earns a capital gain
of 50%. Future research should address the performance measurement issue, for
instance by weighting each exits with the amount of capital invested in, or using the
data of funds value when companies are exited. The problem of lack of available data it
is not only due to the private nature of venture capital investments, but also to the
difficulties in finding appropriate performance measures.
Another important limitation of this research concerns the modified
Herfindahl-Hirschmann measures originally used to measure the Diversification by
Stage of development (see paragraph 4.2.3.). In order to do so I assigned each portfolio
company to a stage class, according to the 2-digit classification of Venture Expert. This
classification counts four 1-digit classes relatively to the so-called early-stages (venture
capital in strict sense) and two 1-digit classes for the so-called later-stages (private
equity). Furthermore when looking at the two-digit subclasses, for early-stages each
sub-class is defined in terms of development of the venture (see in Appendix 1
definition for e.g. seed stage and expansion), that is in terms of development of the
business. On the contrary the sub-classed for later stage investments are assigned in
terms of difference in the type of financing and/or acquisition than on the base of the
venture development (see in Appendix 1 definition for e.g. MBO and MBI). As a
consequence I doubt the reliability of said classification relatively to the measure an
index of Diversification by Stage of development, since it is likely to induce distortion,
which may affect analyses, as in my case.
166
Conclusions and limitation of the research
More broadly, future research should deepen the understanding of these
diversification dimensions. Indeed results showed that funds specialize or diversify
along these dimensions (at least by Country and by Industry), but further investigation
is needed to understand the motives underlying a particular choice relatively to these
variables. For instance, which factors influence the decision of VCs to
diversify/specialize along the industry dimension and/or the geographic dimension? Is
the industry and/or geographic diversification/specialization strategy by the same
factors affecting performance? are these patterns steady over time? What types of VC
are more sensitive to the different dimension of diversification/specialization? Are there
other variables along which a VC can diversify/specialise? Since this research showed
that different dimension have divergent impact on performance, analysing these issues
seems relevant for the understanding of VCs strategic behaviour and performance.
Finally, this research pointed the existence of different patterns of
diversification. For instance it has been shown for Diversification by Country, which
has a positive impact on performance, while for Diversification by Industry values are
higher but the relationship with performance is negative. This results, seem to suggest
that the question whether diversification or specialization lead to better VCs
performance cannot be solved straightforward. Instead the question should be put in
terms of different levels or type of diversification for different variables. In other words
this research suggests that a certain degree of diversification may benefit funds
performance, but a stronger level of diversification might be detrimental. Put in other
terms there may exist threshold-levels of diversification positively related with VCs
performance. Over a certain amount of diversification, the relationship may become
negative. Yet the literature on strategic management dealing with diversification has
167

Conclusions and limitation of the research
recently convened that multi-business firms benefit from a correlated-diversification,
only as far as such benefits derive from the creation of synergies between correlated
ventures through the sharing of resource and competence (Grant 1988, 1991, Kanter
1989, Trautwein 1990, Goold and Luchs 1993), by means of which the performance of
a given portfolio is better than the sum of each single venture (Panzer and Willig 1981,
Prahalad e Hamel 1989, 1990). Attention is thus paid not only to the portfolio of
ventures that can be managed contemporaneously, but also to the portfolio of
competences developed by the VC.
Therefore future research on venture capital should address the issue of
correlated diversification. The more VCs skills and resources can be redeployed to
portfolio companies, the more it is convenient to keep said ventures in the VC’s
portfolio and to invest in the development and sharing of competences crucial thereto
(Campbell 1992, Stalk et al. 1992, Barney 1997). VCs might reach a maximum level of
efficient diversification, which is determined by the strategic correlation between its
ventures; beyond said level, further diversification implies reduced benefits and worse
performances (Palich et al. 2000).
In other words, diversification might entail benefits so long as the integration of
a new venture in the portfolio does not imply costs (due to increased difficulties related
to coordinating and controlling different ventures or inefficiencies due to conflicts and
agency problems, which counterbalance the positive effects of such an inclusion.
168
Reference
References:
Admati AR, Pfleider P. 1994. Robust financial contracting and the role of venture
capitalists. Journal of Finance, Vol. 49(2): 371 – 402.
Amit, R. and J. Livnat (1988). Diversification and risk–return trade-off’, Academy of
Management Journal, 31(1), pp. 157–166.
Amit, R., L. Glosten and E. Muller (1990). "Entrepreneurial ability, venture
investments, and risk sharing." Management Science, vol. 36(10), p. 1232-1245.
Anand B, Piskorski MJ. 2001. Money can’t buy my love: Financial resources and
network positions in the formation of venture capitalist syndicates. Working
paper, Harvard Business School.
Andrews K. (1969). Toward Professionalism in Business Management. Harvard
Business Review, 49-60.
Armour, J. and D. Cumming (2004). "The legal road to replicating Silicon Valley."
Working Paper No. 281. ESRC Centre for Business Research, University of
Cambridge.
Arnould R. J. (1969). Conglomerate growth and profitability, in L. Gorian (ed.),
Economics of Conglomerate Growth. Oregon State University, Corvallis, OR, pp.
72-80.
Artus, P., J. Teïletche, C. Kaserer and C. Diller (2004). "Performance measurement and
asset allocation for European private equity funds." EVCA Paper,
www.evca.com.
Avnimelech, G., M. Kenney and M. Teubal (2004). "Building venture capital
industries: Understanding the U.S. and Israeli experiences." Working Paper Series
169

Reference
No. 1059. UCAIS Berkeley Roundtable on the International Economy, UC
Berkeley.
Barktus J., Hassan M.K. (2003). Does Venture Capital Portfolio Size Matter? Working
Paper.
Barnes, E. and Y. McCarthy (2002). "Grandstanding in the UK venture capital
industry." Working Paper, EFMA 2002 London Meetings.
Barney, J., L. Busenitz, J. Fiet and D. Moesel (1996). "New venture teams' assessment
of learning assistance from venture capital firms." Journal of Business Venturing,
vol. 11(4), p. 257-272.
Baum J., Silverman B. (2004). Picking winners or building them? Alliance, intellectual,
and human capital as selection criteria in venture financing and performance of
biotechnology startups. Journal of Business Venturing, Vol. 19, pp. 411-436.
Berger PG., Ofek E. (1995). Causes and Effects of Corporate Refocusing Programs.
The Review of Financial Studies, Vol. 12, N° 2, pp. 311-345.
Bettis R.A. (1981). Performance Difference in related and unrelated diversified firms.
Strategic Management Journal, Vol. 2 (4), pp. 379-393.
Black, B. and R. Gilson (1998). "Venture capital and the structure of capital markets:
Banks versus stock markets." Journal of Financial Economics, vol. 47(3), p. 243-
277.
Black, B. and R. Gilson (1999). "Does venture capital require an active stock market?"
Journal of Applied Corporate Finance, vol. 11(4), p. 36-48.
Bottazzi L., Da Rin M., Hellmann T. (2004). Active Financial Intermediation: Evidence
of the Role of Organizational Specialization and Human Capital. RICAFE
Working Pape, No. 012.
170

Reference
Bottazzi, L. and M. Da Rin (2003). "Financing entrepreneurial firms in Europe: Facts,
issues, and research agenda." Working Paper No. 958. CESifo.
Brander J.A., Amit R., Antweiler W. (2002). Venture-Capital Syndication: improved
venture selection vs. The Value Added Hypothesis. Journal of Economics and
Management Strategy. Vol. 11, pp. 423-452.
Brav, A. and P. Gompers (1997). "Myth or Reality? The long-run underperformance of
initial public offerings: Evidence from venture and non-venture capital-backed
companies." Journal of Finance, vol. 52(5), p. 17911821.
Brealey, R.A. und Myers, S.C. (1996): Principles of Corporate Finance, 5. Aufl.,
McGraw-Hill, New York.
Brophy DJ, Guthner MW. 1988. Publicly Traded Venture Capital Funds: Implications
for Institutional “Fund of Funds” Investors. Journal of Business Venturing, Vol.
3: 187 – 206.
BVCA (2004). "BVCA private equity and venture capital performance measurement
survey 2003." PriceWaterHouseCoopers and BVCA, www.bvca.co.uk.
BVCA (2005a). "BVCA private equity and venture capital performance measurement
survey 2004." PriceWaterHouseCoopers and BVCA, www.bvca.co.uk.
BVCA (2005b). "BVCA report on investment activity." PriceWaterHouseCoopers and
BVCA, www.bvca.co.uk.
Bygrave WD, Fast N., Khoylian R., Vincent L., Yue W., (1989). Early rates of returns
of 131 venture capital funds started in 1978-1984. Journal of Business Venturing,
vol. 4, pp. 93-105.
Bygrave WD, Timmons JA. (1992). Venture Capital at the Crossroads. Harvard
Business School Press: Boston, MA.
171
Reference
Bygrave WD. (1987). Syndicated Investments by Venture Capital Firms: A Networking
Perspective. Journal of business Venturing, 2, 139-154.
Bygrave, W. and S. Hunt (2004). Global Entrepreneurship Monitor (GEM): 2004
Financing report. Frontiers of Entrepreneurship Research, 2002 XII, Babson
College.
Bygrave, W., M. Hay, E. Ng and P. Reynolds (2002). A study of informal investing in
29 nations composing the Global Entrepreneurship Monitor (GEM). Frontiers of
Entrepreneurship Research, 2002 XII, Babson College.
Callahan J., Muegge S. (2003). Venture Capital's Role in Innovation: Issues, Research,
and Stakeholder Interests, in L.V. Shavinina (editor), The International Handbook
on Innovation, Elsevier Press.
Carter R.B., Van Auken H.E. (1994)Venture Capital Firms’ preferences for projects in
particular stage of development. Journal of Small Business Management, 9 pp.
335-356.
Chen, P., G. Baierl and P. Kaplan (2002). "Venture capital and its role in strategic asset
allocation." Journal of Portfolio Management, vol. 28(2), p. 83-90.
Chiampou GF, Kallett JJ. 1989. Risk/Return Profile of Venture Capital. Journal of
Business Venturing, Vol. 4: 1 – 10.
Clercq, D., P. Goulet, M. Kumpulainen and M. Mäkelä (2001). "Portfolio investment
strategies in the Finnish venture capital industry; A longitudinal study." Venture
Capital: An International Journal of Entrepreneurial Finance, vol. 3(1), p.41-62.
Cochrane J. 2001). The Risk and Return of Venture Capital. Working paper, University
of Chicago.
172
Reference
Cochrane, J. (2005). "The risk and return of venture capital." Journal of Financial
Economics, vol. 75(1), p. 3-52.
Cumming D., Fleming G., Suchard J-A. (2005). Venture Capitalist Value-added
Activities, Fundraising and Drawdowns. Journal of Banking and Finance, Vol. 29,
pp. 295-331.
Cumming, D. (2002). "Contracts and exits in venture capital finance." Working Paper
DC Meetings, University of Alberta.
Cumming, D. and J. MacIntosh (2003). "A cross-country comparison of full and partial
venture capital exits." Journal of Banking and Finance, vol. 27(3), p. 511-548.
Cumming, D. and U. Walz (2004). "Private equity returns and disclosure around the
world." CFS Working Paper No 2004/05.
Das, S., M. Jagannathan and A. Sarin (2003). "Private equity returns: An empirical
examination of the exit of venture-backed companies." Journal of Investment
Management, vol. 1(1), p. 1-26.
Davila, A., G. Foster and M. Gupta (2000). "Venture-capital financing and the growth
of startup firms." Research paper No. 1667. Graduate School of Business,
Stanford University.
De Clercq, D. and D. Dimov (2003). A knowledge-based view of venture capital firms’
portfolio investment specialization and syndication. Frontiers of Entrepreneurship
Research, 2003 III, Babson College. - 60 De
Di Gregorio, D. and S. Shane (2003). "Why do some universities generate more start-
ups than others?" Research Policy, vol. 32(2), p. 209-227.
Drucker P. (1968). The practice of Management. Pan Books.
173
Reference
Elango B, Fried VH, Hisrich RD, Polonchek A. 1995. How Venture Capital Firms
Differ. Journal of Business Venturing, Vol. 10: 157 – 179.
Emery, K. (2003). "Private equity risk and reward: Assessing the stale pricing
problem." Journal of Private Equity, vol. 6(2), p. 43-50.
equity investments." Journal of Financial Economics, vol. 55(2), p. 281-325.
Espenlaub, S., I. Garrett and W.P. Mun (1999), Conflicts of interest and the
performance of venture-capital-backed IPOs: a preliminary look at the UK,
Venture Capital: An International Journal of Entrepreneurial Finance, vol. 1, n° 4,
pp. 325-349.
EVCA (2003). "EVCA Yearbook 2003 - Annual Survey 2002." www.evca.com.
EVCA (2004a). "Benchmarking European tax and legal environments."
www.evca.com.
EVCA (2004b). "EVCA Yearbook 2004 - Annual Survey 2003." www.evca.com.
EVCA (2004c). "Investment benchmarks 2004 European private equity." EVCA and
Thomson Venture Economics, www.evca.com
EVCA (2005a). "EVCA Yearbook 2005 - Annual Survey 2004." www.evca.com.
Experience and Specialization." vol. (Unpublished Working Paper).
Fender, I. (2003). "Institutional asset managers: Industry trends, incentives and
implications for market efficiency." BIS Quarterly Review.
Fleming, G. (2004). "Venture capital returns in Australia." Venture Capital: An
International Journal of Entrepreneurial Finance, vol. 6(1), p. 23-45.
Florida R, Kenney M. 1988. Venture Capital and High Technology Entrepreneurship.
Journal of Business Venturing, Vol. 3: 301 – 319.
174
Reference
Fried VH, Hisrich RD. 1994. Toward a model of Venture Capital Investment Decision
Making. Financial Management, Vol. 23(3): 28 – 37.
Gompers P. 1995. Optimal Investment, Monitoring, and the Staging of Venture Capital.
Journal of Finance, Vol. 50(5): 1461 – 1489.
Gompers, P. (1996). "Grandstanding in the venture capital industry." Journal of
Financial Economics, vol. 42(1),p. 133-156.
Gompers, P. and Lerner J. (1998). "What drives venture fundraising?" Brookings
Papers on Economic Activity Microeconomics, p. 149-192.
Gompers P., Lerner J. (1999); The Venture Capital Cycle, MIT Press, Cambridge, MA.
Gompers, P. and Lerner J. (2000). "Money chasing deals? The impact of fund inflows
on the valuation of private
Gompers P., Lerner J. (2001). The Venture Capital Revolution. Journal of Economic
Perspectives, Vol. 15 (2) pp. 145-168.
Gompers P., Lerner J. (2002). The Venture Capital Cycle. MIT Press, Cambridge.
Gompers P., Lerner J. (2004). The Money of Invention. How Venture Capital Creates
New Wealth. Harvard Business School Press, Boston, MA.
Gompers, P. and A. Metrick (2001). "Institutional investors and equity prices."
Quarterly Journal of Economics, vol. 166(1), p. 229-259.
Gompers, P., A. Kovner, J. Lerner and D. Scharfstein (2004). "Venture Capital
Investment Cycles: The Role of
Goold M., Luchs K. (1993). Why Diversify? Four Decades of Management Thinking.
Academy of Management Executive, Vol8, No 3, pp. 7-25.
Gorman, M. and W. Sahlman (1989). "What do venture capitalists do?" Journal of
Business Venturing, vol. 4(4), p. 231-248.
175
Reference
Gort M. (1962). Diversification and Integration in American Industry. Princeton
University Press, Princeton, NJ.
Gottschalg, O., L. Phalippou and M. Zollo (2004). "Performance of private equity
funds: Another puzzle?" Working Paper, INSEAD.
Grant R. M. (1987). Multinationality and performance among British manufacturing
companies. Journal of international Business Studies, Vol. 18, pp. 79-89.
Grant R. M. (1988). Contemporary Strategy Analysis. Backwell, Oxford
Gupta A., Sapienza H. (1992). Determinants of venture capital firms’ preferences
regarding the industry diversity and geographic scope of their investments.
Journal of business Venturing, Vol. 7, pp. 342-362.
Gupta, A. and H. Sapienza (1992). "Determinants of venture capital firms: Preferences
regarding the industry diversity and geographic scope of their investments."
Journal of Business Venturing, vol. 7(5), p. 347-362.
Hall, G. and C. Tu (2003). "Venture capitalists and the decision to invest overseas."
Venture Capital: An International Journal of Entrepreneurial Finance, vol. 5(2), p.
181-190.
Harper N, Schneider A (2004). Private Equity new Challenge. The Mckinsey Quarterly,
August, http://www.mckinseyquarterly.com/article.
Haspeslagh P. (1982). Portfolio planning : Uses and Abuses. Harvard Business Review,
58-73.
Hayes B., Abernathy B. (1980). Managing Our Way to business Decline. Harvard
Business Review, 76-77.
176

Reference
Hege U., Palomino F., Schwienbacher A. (2003). Determinants of Venture Capital
performance: Europe and United States. Unpublished WP, HEC School of
Mnagement. Tilburg University and University of Amsterdam.
Hege, U., F. Palomino and A. Schwienbacher (2003). "Determinants of venture capital
performance: Europe and the United States." Working Paper No. 001. RICAFE –
Risk Capital and the Financing of European Innovative Firms.
Hellman, T. (1998). "The allocation of control rights in venture capital contracts." Rand
Journal of Economics, vol. 29(1), p. 57-76.
Hellman T., Puri M., (2000). The interaction between product market and financing
strategy: The role of Venture Capital. Review of financial Studies, Vol, 13, pp.
959-984.
Hellman, T. and M. Puri (2002). "Venture capital and the professionalization of start-up
firms: Empirical evidence." Journal of Finance, vol. 57(1), p. 169-197.
Hellman, T., L. Lindsey and M. Puri (2004). "Building relationships early: Banks in
venture capital." NBER Working Paper No. W10535. National Bureau of
Economic Research.
Higgins R.C., Schall L.D. (1975). Corporate Bankruptcy and Conglomerate Merger.
Journal od Finance, Vol. 30, pp. 93-113.
Hochberg, Y., A. Ljungqvist and Y. Lu (2004). "Who you know matters: Venture
capital networks and investment performance." Working Paper, Johnson School
of Management, Cornell University.
Hsu, D. (2004). "What do entrepreneurs pay for venture capital affiliation?" Journal of
Finance, vol. 59(4), p. 1805-1844.
177
Reference
Huntsman, B. and J. Hoban (1980). "Investments in new enterprise: Some empirical
observations on risk return, and market structure." Financial Management, vol. 9.
p. 44-51.
Jääskeläinen, M., M. Maula and T. Seppä (2002). "The optimal portfolio of start-up
firms in venture capital finance: The moderating effect of syndication and an
empirical test." Frontiers of Entrepreneurship Research, 2002(XIII), Babson
College.
Jääskeläinen, M., M. Maula and T. Seppä (2003). "Allocation of attention and the
performance of venture capitalist." Working paper C24. Helsinki University of
Technology.
Jain B.A., Kini O. (2000). Does the presence of Venture Capitalist improve the survival
profile of IPO firms? Journal of Business Finance and Accounting, Vol. 27, pp
1139-1176.
Jain, B. and O. Kini (2000). "Does the presence of venture capitalists improve the
survival profile of IPO firms?" Journal of Business Finance and Accounting, vol.
27(9and10), p. 1139-1160.
Jeng, L. and P. Wells (2000). "The determinants of venture capital funding: Evidence
across countries." Journal of Corporate Finance, vol. 6. p. 241-289.
Jensen, M. (2002). "Securing venture capital: Today's realities." Financial Executive,
vol. 18(6), p. 43-46.
Jones, C. and M. Rhodes-Kropf (2003). "The price of diversifiable risk in venture
capital and private equity." Working Paper, Columbia University.
178
Reference
Kaplan S.N., Strömberg P. (2003). Financial contracting theory meets the real world: an
empirical analysis of venture capital contracts. Review of Economic Studies, Vol.
70, pp. 281-315.
Kaplan S.N., Strömberg P. (2003). Venture Capitalists as Principals: Contracting,
Screening, and Monitoring, American Economic Review, Papers and Proceedings
91(2): 426430.
Kaplan, P., F. Martel and P. Strömberg (2003). "How do legal differences and learning
affect financial contracts?" Working Paper, University of Chicago.
Kaplan, S. and A. Schoar (2003). "Private equity performance: Returns, persistence and
capital flows." NBER Working Paper No. W9807. National Bureau of Economic
Research.
Karaser C, Diller C. (2004). What drives Cash Flow Based European Private Equity
Returns? – Fund Inflows, Skilled GPs, and/or Risck? Working Paper.
Kirilenko AA. 2001. Valuation and Control in Venture Finance. Journal of Finance,
Vol. 56(2): 565 – 587.
Koontz H. (1961). The Management Theory Jungle. The Academy of Management
Journal, Vol. 4, No.3, pp. 175-189.
Kortum S, Lerner J. 2000. Assessing the Contribution of Venture Capital to Innovation.
RAND Journal of Economics 31(4): 674 – 692.
Kortum, S. and J. Lerner (1998). "Does venture capital spur innovation?" NBER
Working Paper No. W6846. National Bureau of Economic Research.
La Porta, R., F. Lopez-de-Silanes, A. Shleifer and R. Vishny (1998). "Law and
finance." Journal of Political Economy, vol. 106(6), p. 1113-1155.
179
Reference
Laine S., Torstila M. ( 2004). The Exit Rates of Liquidated Venture Capital Funds.
Journal of Entrepreneurial Finance and Business Venture, forthcoming.
Laine, M. and S. Torstila (2004). "The exit rates of liquidated venture capital funds."
Working Paper, Forthcoming in Journal of Entrepreneurial Finance and Business
Ventures.
Lakonishok, J., A. Schleifer, R. Thaler and R. Vishny (1991). "Window dressing by
pension fund managers." American Economic Review, vol. 81(1), p. 227-231.
Landier, A. (2001). "Start-up financing: Banks vs. venture capital." Mimeo, MIT.
Lang L.H.P., Stultz R.M. (1994). Tobin’s Q, Corporate Diversification and Firm
Performance. Journal of Political Economics, Vol. 102, pp. 1248-1280.
Leleux, B. and B. Surlemont (2003). "Public versus private venture capital: Seeding or
crowding out? A pan-European analysis." Journal of Business Venturing, vol.
18(1), p. 81-104.
Lerner J. (1994). The Syndication of Venture Capital Investments. Financial
Management, Vol. 23, pp. 16-27.
Lerner, J. (1994). "The syndication of venture capital investments." Financial
Management, vol. 23(3), p. 16-27.
Lerner, J. (1996). "The government as venture capitalist: The long-run impact of the
SBIR program." NBER Working Paper No. W5753. National Bureau of
Economic Research.
Lerner, J. and A. Schoar (2004). "The illiquidity puzzle: Theory and evidence from
private equity." Journal of Financial Economics, vol. 72(1), p. 3-40.
180

Reference
Lerner, J. and A. Schoar (2005). "Does legal enforcement affect financial transactions?
The contractual channel in private equity." Quarterly Journal of Economics, vol.
120(1), p. 223-246.
Lerner, J., A. Schoar and W. Wong (2005). "Smart institutions, foolish choices? The
limited partner performance puzzle." NBER Working Paper 11136. National
Bureau of Economic Research.
Levy H., Sarnat M. (1970). International diversification of investment portfolios.
American Economic Review, Vol. 70, pp. 668-675.
Lindsey, L. (2003). "Venture capital keiretsu effect: An empirical analysis of strategic
alliances among portfolio firms." SIERP Discussion Paper No. 02-17. Stanford
University.
Ljungqvist, A. and M. Richardson (2003a). "The cash flow, return and risk
characteristics of private equity." NBER Working Paper No. 9454. National
Bureau of Economic Research.
Ljungqvist, A. and M. Richardson (2003b). "The investment behavior of private equity
fund managers." Working Paper No. 005. RICAFE – Risk Capital and the
Financing of European Innovative Firms.
Lockett A, Wright M. 2001. The syndication of venture capital investments. Omega 29:
375 – 390.
Lockett, A. and M. Wright (1999). "The syndication of private equity: Evidence from
the UK." Venture Capital: An International Journal of Entrepreneurial Finance,
vol. 1(4), p. 303 - 324.
181
Reference
Lubatkin, M. H. and R. C. Rogers (1989). ‘Diversification, systematic risk, and
shareholder return: A capital market extension of Rumelt’s 1974 study’, Academy
of Management Journal, 32, pp. 454–465.
MacMillan I., Siegel R., SubbaNarasima P. (1985). Criteria used by Venture Capitalist
to evacuate new Venture proposal. Journal of Business Venturing, Vol. 4, pp. 27-
47.
MacMillan, I., L. Zemann and P. Narasimha (1985). "Criteria used by venture capitalist
to evaluate new venture proposals." Journal of Business Venturing, vol. 2(2), p.
123-137.
Madj, S. and S. C. Myers (1987). ‘Tax asymmetriesand corporate income tax reform’.
In M. Feldstein (ed.), Effects of Taxation on Capital Accumulation. University of
Chicago Press, Chicago, IL, pp. 343–376.
Manigart S., De Waele, Wright M., Robbie K., Desbrières P., Sapienza H, Beckman A.,
Determinants of required Return in Venture Capital Investments: A five-Country
Study. Journal of Business Venturing, Vol. 17, 291-312.
Manigart, S. (1994). "The founding rate of venture capital firms in three European
countries (1970-1990)." Journal of Business Venturing, vol. 9(6), p. 525-541.
Manigart, S. and C. Beuselinck (2001). "Supply of venture capital by European
Governments." Working Paper, Universiteit Gent.
Manigart, S., A. Lockett, M. Meuleman, M. Wright and H. Landström (2002b). "Why
do European venture capital companies syndicate?" Working Paper No. 2002/5.
Lund University, Institute of Economic Research.
Manigart, S., K. De Waele, M. Wright, K. Robbie, P. Desbrières, H. Sapienza and A.
Beekman (2000). "Venture capitalists, investment appraisal and accounting
182
Reference
information: a comparative study of the USA, UK, France, Belgium and
Holland." European Financial Management, vol. 6(2), p. 389-403.
Manigart, S., P. Desbrières, K. De Waele, M. Wright, K. Robbie, H. Sapienza and A.
Beekman (2002a). "Determinants of required return in venture capital
investments: A five country study." Journal of Business Venturing, vol. 17(4), p.
291-312.
Markham (1973). Conglomerate Enterprise and Economic Performance. Harvard
University Press. Cambridge, MA.
Markides C.C., Williamson P.J., (1996). Corporate Diversification and Organizational
Structure: a Resource-Based View. Academy of Management Journal, Vol. 39,
pp. 340-367.
Markovitz, H.M. (1952). Portfolio Selection. Journal of Finance, No.7, March.
Markovitz, H.M. (1970). Portfolio Selction: Efficient Diversification of Investment.
Yale University Press, New Haven.
Marti, J. and M. Balboa (2001). The determinants of private equity fundraising in
western Europe. Social Science Research Network Working Paper, presented at
the EFMA 2001 Lugano Meetings.
Martin, R., C. Berndt, B. Klagge, P. Sunley and S. Herten (2003). "Regional venture
capital policy: UK and Germany compared." Anglo-German Foundation for the
Study of Industrial Society.
Mason, C. and R. Harrison (2000). "Venture capital market complementarities: The
links between business angels and venture capital funds in the United Kingdom."
Venture Capital: An International Journal of Entrepreneurial Finance, vol. 2(3), p.
223-242.
183

Reference
Mason, C. and R. Harrison (2004a). "Does investing in technology-based firms involve
higher risk? An exploratory study of the performance of technology and non-
technology investments by business angels." Venture Capital: An International
Journal of Entrepreneurial Finance, vol. 6(4), p. 313-332.
Mason, C. and R. Harrison (2004b). "Improving Access to Early Stage Venture Capital
in Regional Economies: A New Approach to Investment Readiness." Local
Economy, vol. 19(2), p. 159 - 173.
Mayer, C., K. Schoors and Y. Yafeh (2003). "Sources of funds and investment
activities of venture capital funds: Evidence from Germany, Israel, Japan and the
UK." NBER Working Paper No. 9645. National Bureau of Economic Research.
McCahery, J. and E. Vermeulen (2004). "Limited partnership reform in the United
Kingdom: A competitive, venture capital oriented business form." European
Business Organization Law Reviews, vol. 5. p. 61-85.
Megginson, W. (2002). "Towards a global model of venture capital?" Journal of
Applied Corporate Finance, fourthcoming.
Megginson, W. and K. Weiss (1991). "Venture capitalist certification in initial public
offerings." Journal of Finance, vol. 46(3), p. 879-903.
Murray G.C., Marriott R. (1998). Why has the investment performance of technology-
specialist, European venture capital funds been so poor?. Research Policy, Vol. 9,
pp. 947-976.
Murray, G. (1999). "Early-stage venture capital funds, scale economies and public
support." Venture Capital: An International Journal of Entrepreneurial Finance,
vol. 1(4), p. 351-384.
184
Reference
Norton E., Tenenbaum B. (1993). Specialization versus Diversification as a Venture
Capital Investment Strategy. Journal of Business Venturing, Vol. 8, pp. 431-442.
Nowak, E., A. Knigge and D. Schmidt (2004). "On the performance of private equity
investments: Does market timing matter?" Working paper, EFMA 2004 Basel
Meetings Paper.
NVCA (2004). "Private equity performance 2004." www.nvca.com.
Palich, L E., B. Cardinal, C. Chet Miller. (2000). “Curvilinearity in the Diversification-
Performance Linkage: An Examination of over Three Decades of Research.”
Strategic Management Journal 21, 155– 174.
Peng L. (2001). Building a Venture Capital index. Yale IFC Working Paper, No. 00-51.
Penrose E.T. (1959). The Theory of the Growth of the Firm. Oxford University Press,
Oxford.
Peter T.J., Waterman R.H. (1982). In Search of Excellence. Harper Row Pub. New
York.
Porteba, J. (1989). "Venture capital and capital gains taxation". In Lawrence Summers
(ed.) Tax Policy and the Economy. Cambridge: MIT Press.
Powell, W., K. Koput, J. Bowie and L. Smith-Doerr (2002). "The spatial clustering of
science and capital: Accounting for biotech firm-venture capital relationships."
Regional Studies, vol. 36(3), p. 291-305.
Prahalad C., Hamel G. (1990). The Core Competencies of the Corporation. Havard
Business Review, Vol. 68, issue 3, p. 79-91.
Quigley, J. and S. Woodward (2003). "An index for venture capital." Working Paper
E03-333. Economics Department, University of California, Berkeley.
Rappaport A (1986). Creating Shareholder Value. Free Press, New York.
185
Reference
Reid G.C., Terry N.G., Smith J.A. (1997). Risk Management in Venture Capital
investor-investee relations. European Journal of Finance, Vol. 3, pp. 473-521.
Robins J.; Wiersema MF. (1995). A Resource-based Approach to the Multibusiness
Firm: Empirical Analysis of Portfolio Interrelationships and Corporate Financial
Performance. Long Range Planning, vol. 28, no. 4, pp. 124-124.
Robins J.; Wiersema MF. (2003). The measurement of corporate portfolio strategy:
analysis of the content validity of related diversification indexes. Strategic
Management Journal, Volume 24, Issue 1 , Pp. 39 – 59.
Robinson R.B. (1987). Emerging strategies in the venture capital industry. Journal of
Business Venturing, Vol. 2, pp. 53-77.
Romain, A. and B. van Pottelsberghe de la Potterie (2004a). "The determinants of
venture capital: A panel analysis of 16 OECD countries." Working Paper WP-
CEB 04/015. Université Libre de Bruxelles.
Romain, A. and B. van Pottelsberghe de la Potterie (2004b). "The economic impact of
venture capital." Discussion Paper series 1. No. 18/2004. Studies of Economic
Research Center.
Rosenstein J. 1988. The board and strategy: Venture capital and high technology.
Journal of Business Venturing, Vol. 3: 159 – 170.
Rosenstein, J., A. Bruno, W. Bygrave and N. Tylor (1993). "The CEO, venture
capitalists, and the board." Journal of Business Venturing, vol. 8(2), p. 99-113.
Rumelt R.P. (1982) Diversification Strategy and Profitability. Strategic Management
Journal, Vol. 3(4), pp. 359-369.
Sahlman W.A. 1990. The Structure and Governance of Venture-Capital Organizations.
Journal of Financial Economics, Vol. 27: 473 – 521.
186
Reference
Sahlman, W. (1990). "The structure and governance of venture capital organizations."
Journal of Financial Economics, vol. 27(2), p. 473-521.
Sapienza H, Korsgaard MA. 1996. Managing investor relations: The impact of
procedural justice in establishing and sustaining investor support. Academy of
Management Journal, Vol. 39: 544 – 574.
Sapienza HJ, Gupta AK. 1994. Impact of agency risks and task uncertainty on venture
capitalist – CEO interaction. Academy of Management Journal, Vol. 37(6): 1618
– 1632.
Sapienza HJ. 1992. When Do Venture Capitalists Add Value? Journal of Business
Venturing, Vol. 7(1): 9 – 27.
Sapienza, H. (1992). "When do venture capitalists add value?" Journal of Business
Venturing, vol. 7(1), p. 9-27.
Sapienza, H., S. Manigart and W. Vermeir (1996). "Venture capitalist governance and
value added in four countries." Journal of Business Venturing, vol. 11(6), p. 439-
469.
Schendel D. and Patton R. (1976). A Simultaneous Equation Model of Corporate
Strategy, Management Science, (24) 1978, 1611-1621.
Schmidt, D. (2004). "Private equity-, stock- and mixed asset-portfolios: A bootstrap
approach to determine performance characteristics, diversification benefits and
optimal allocations." Working Paper No. 2004/12. CFS.
Schneeweis, T. and J. Pescatore (1999). The handbook of alternative investment
strategies: An investor's guide. Institutional Investor.
187
Reference
Schwienbacher, A. (2002). "An empirical analysis of venture capital exits in Europe
and in the United States." Working Paper, University of Amsterdam - Finance
Group.
Seppä, T. and M. Jääskeläinen (2002). "How the rich become richer in venture capital:
Firm performance and position in syndication network." Frontiers of
Entrepreneurship Research, 2002(XIII), Babson College.
Sharpe W. (1964). Capital asset prices: A theory of market equilibrium under
conditions of risk, The Journal of Finance, Volume 19(3), 425-442.
Shepherd, D., Z. Andrew and R. Baron (2003). "VCs' decision processes: Evidence
suggesting more experience may not always be better." Journal of Business
Venturing, vol. 18(3), p. 381-401.
Sorenson O., Stuart T.E. (2001). Syndication Network and the spatial distribution of
venture capital investments. America Journal of Sociology, Vol. 106, pp. 1546-
1588.
Sorenson, O. and T. Stuart (2001). "Syndication networks and the spatial distribution of
venture capital investments." American Journal of Sociology, vol. 106(6), p.
1546-1588.
Tannon, J. and R. Johnson (2005). "Transatlantic private equity: Beyond a trillion
dollar force." Journal of Private Equity, vol. 8(3), p. 77-80.
The Economist, (2004). King of Capitalism. A survey of Private Equity. The
Economist, November 27th, 2004.
Tyebjee TT, Bruno AV. 1984. A Model of Venture Capital Investment Activity.
Management Science, Vol. 30(9): 1051 – 1065.
188
Reference
Woodward, S. and R. Hall (2004). "Benchmarking the returns to venture." NBER
Working Paper No. W10202. National Bureau of Economic Research.
Wright M, Robbie K. 1998. Venture Capital and Private Equity: A Review and
Synthesis. Journal of Business Finance & Accounting, Vol. 25: 521 – 570.
Wright, M. and K. Robbie (1998). "Venture capital and private equity: A review and
synthesis." Journal of Business Finance and Accounting, vol. 25(5-6), p. 521-569.
Yoshikawa T., PH Phan, J Linton, (2004). The relationship between governance
structure and risk management approaches in Japanese venture capital firms
Journal of Business Venturing, Vol. 19, pp. 831–849.
Zacharakis,A. and D. Shepherd (2001). "The nature of information and overconfidence
on venture capitalists' decision making." Journal of Business Venturing, vol.
16(4), p. 311-332.
189
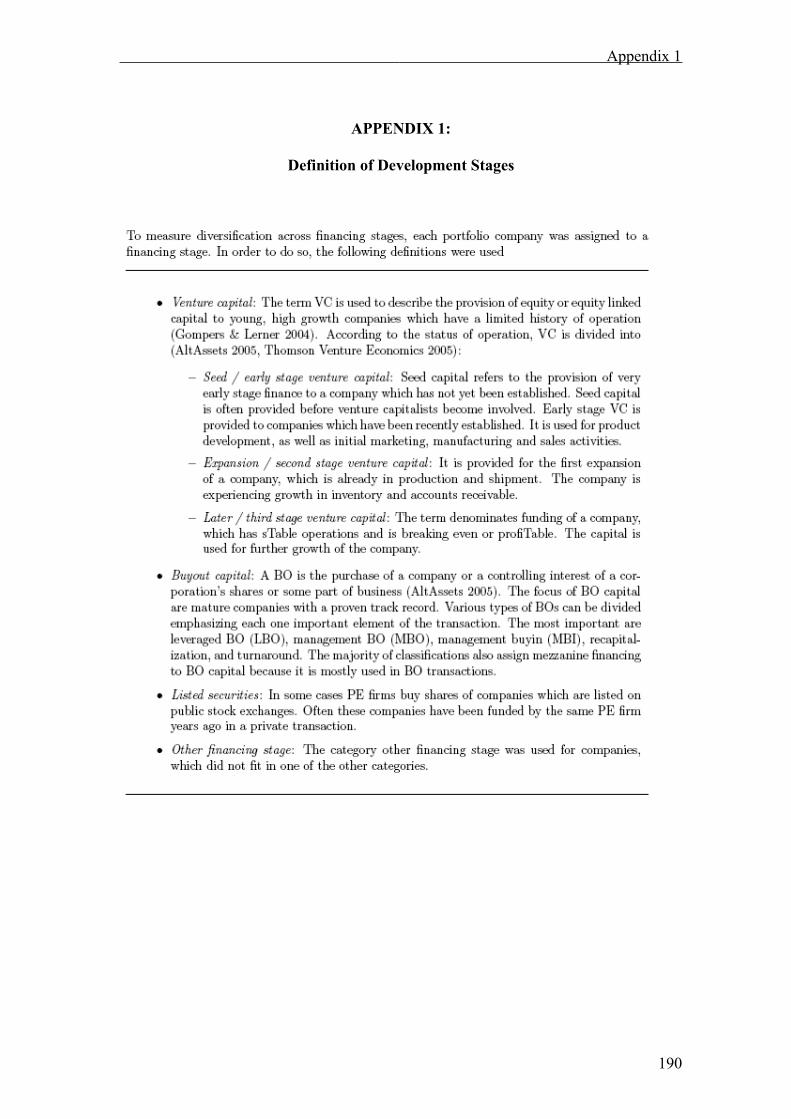
Appendix 1
APPENDIX 1:
Definition of Development Stages
190