David A. Seekell, Joel Carr, Jampel Dell'Angelo, Paolo D ... · 1 1 Resilience in the global food...
29
David A. Seekell, Joel Carr, Jampel Dell'Angelo, Paolo D'Odorico, Marianela Fader, Jessica A. Gephart, Matti Kummu, Nicholas Magliocca, Miina Porkka, Michael J. Puma, Zak Ratajczak, Maria Cristina Rulli, Samir Suweis and Alessandro Tavoni Resilience in the global food system Article (Published version) Refereed Original citation: Seekell, David A., Carr, Joel, Dell'Angelo, Jampel, D'Odorico, Paolo, Fader, Marianela, Gephart, Jessica A., Kummu, Matti, Magliocca, Nicholas, Porkka, Miina, Puma, Michael J., Ratajczak, Zak, Rulli, Maria Cristina, Suweis, Samir and Tavoni, Alessandro (2017)Resilience in the global food system. Environmental Research Letters . ISSN 1748-9326 DOI: 10.1088/1748-9326/aa5730 Reuse of this item is permitted through licensing under the Creative Commons: © 2017 The Authors © CC BY 3.0 This version available at: http://eprints.lse.ac.uk/68930/ Available in LSE Research Online: January 2017 LSE has developed LSE Research Online so that users may access research output of the School. Copyright © and Moral Rights for the papers on this site are retained by the individual authors and/or other copyright owners. You may freely distribute the URL (http://eprints.lse.ac.uk) of the LSE Research Online website.
Transcript of David A. Seekell, Joel Carr, Jampel Dell'Angelo, Paolo D ... · 1 1 Resilience in the global food...
David A. Seekell, Joel Carr, Jampel Dell'Angelo, Paolo D'Odorico, Marianela Fader, Jessica A. Gephart, Matti Kummu, Nicholas Magliocca, Miina Porkka, Michael J. Puma, Zak Ratajczak, Maria Cristina Rulli, Samir Suweis and Alessandro Tavoni
Resilience in the global food system Article (Published version) Refereed
Original citation: Seekell, David A., Carr, Joel, Dell'Angelo, Jampel, D'Odorico, Paolo, Fader, Marianela, Gephart, Jessica A., Kummu, Matti, Magliocca, Nicholas, Porkka, Miina, Puma, Michael J., Ratajczak, Zak, Rulli, Maria Cristina, Suweis, Samir and Tavoni, Alessandro (2017)Resilience in the global food system. Environmental Research Letters . ISSN 1748-9326 DOI: 10.1088/1748-9326/aa5730 Reuse of this item is permitted through licensing under the Creative Commons:
© 2017 The Authors © CC BY 3.0
This version available at: http://eprints.lse.ac.uk/68930/ Available in LSE Research Online: January 2017
LSE has developed LSE Research Online so that users may access research output of the School. Copyright © and Moral Rights for the papers on this site are retained by the individual authors and/or other copyright owners. You may freely distribute the URL (http://eprints.lse.ac.uk) of the LSE Research Online website.
Home Search Collections Journals About Contact us My IOPscience
Resilience in the global food system
This content has been downloaded from IOPscience. Please scroll down to see the full text.
Download details:
IP Address: 158.143.26.141
This content was downloaded on 13/01/2017 at 12:06
Manuscript version: Accepted Manuscript
Seekell et al
To cite this article before publication: Seekell et al, 2017, Environ. Res. Lett., at press:
http://dx.doi.org/10.1088/1748-9326/aa5730
This Accepted Manuscript is copyright Copyright 2017 IOP Publishing Ltd
As the Version of Record of this article is going to be / has been published on a gold open access basis
under a CC BY 3.0 licence, this Accepted Manuscript is available for reuse under a CC BY 3.0 licence
immediately.
Everyone is permitted to use all or part of the original content in this article, provided that they
adhere to all the terms of the licence https://creativecommons.org/licences/by/3.0
Although reasonable endeavours have been taken to obtain all necessary permissions from third parties to
include their copyrighted content within this article, their full citation and copyright line may not be
present in this Accepted Manuscript version. Before using any content from this article, please refer to
the Version of Record on IOPscience once published for full citation and copyright details, as
permissions will likely be required. All third party content is fully copyright protected, unless
specifically stated otherwise in the figure caption in the Version of Record.
When available, you can view the Version of Record for this article at:
http://iopscience.iop.org/article/10.1088/1748-9326/aa5730
1
Resilience in the global food system 1 2
Research Letter for consideration by Environmental Research Letters 3 4 5 6 David A. Seekell1,*, Joel Carr2, Jampel Dell’Angelo3, Paolo D’Odorico2, Marianela Fader4, 7 Jessica A. Gephart2, Matti Kummu5, Nicholas Magliocca3, Miina Porkka5, Michael J. Puma6, 8 Zak Ratajczak2, Maria Cristina Rulli7, Samir Suweis8, Alessandro Tavoni9 9 10 1) Department of Ecology and Environmental Science, Umeå University, Umeå, Sweden 11 2) Department of Environmental Sciences, University of Virginia, Charlottesville, Virginia 12 3) National Center for Socio-Environmental Synthesis, University of Maryland, Annapolis, 13 Maryland 14 4) International Centre for Water Resources and Global Change (UNESCO), hosted by the 15 Federal Institute of Hydrology, Koblenz, Germany 16 5) Water & Development Research Group, Aalto University, Aalto, Finland 17 6) Center for Climate Systems Research & Center for Climate and Life, Columbia University, 18 NASA Goddard Institute for Space Studies, New York, New York 19 7) Dipartimento di Ingegneria Civile e Ambientale, Politecnico di Milano, Milano, Italy 20 8) Department of Physics and Astronomy, University of Padova, Padova, Italy 21 9) Grantham Institute on Climate Change and the Environment, London School of 22 Economics, London, United Kingdom 23 * Corresponding author, email: [email protected] 24 25 26 27 28 29 30 31 32 33 34 35 36 37 38 39 40 41 42
Page 1 of 27 AUTHOR SUBMITTED MANUSCRIPT - ERL-102998.R2
123456789101112131415161718192021222324252627282930313233343536373839404142434445464748495051525354555657585960 A
ccep
ted
Man
uscr
ipt
2
Abstract 43 Ensuring food security requires food production and distribution systems function throughout 44 disruptions. Understanding the factors that contribute to the global food system’s ability to 45 respond and adapt to such disruptions (i.e. resilience) is critical for understanding the long-term 46 sustainability of human populations. Variable impacts of production shocks on food supply 47 between countries indicate a need for national-scale resilience indicators that can provide global 48 comparisons. However, methods for tracking changes in resilience have had limited application 49 to food systems. We developed an indicator-based analysis of food systems resilience for the 50 years 1992-2011. Our approach is based on three dimensions of resilience: socio-economic 51 access to food in terms of income of the poorest quintile relative to food prices, biophysical 52 capacity to intensify or extensify food production, and the magnitude and diversity of current 53 domestic food production. The socio-economic indicator has large variability, but with low 54 values concentrated in Africa and Asia. The biophysical capacity indicator is highest in Africa 55 and Eastern Europe, in part because of high potential for extensification of cropland and for yield 56 gap closure in cultivated areas. However, the biophysical capacity indicator has declined globally 57 in recent years. The production diversity indicator has increased slightly, with a relatively even 58 geographic distribution. Few countries had exclusively high or low values for all indicators. 59 Collectively, these results are the basis for global comparisons of resilience between nations, and 60 provide necessary context for developing generalizations about the resilience in the global food 61 system. 62 63 Keywords: food security; resilience; food systems; food production; sustainability 64
65
66
67
68
69
70
71
72
73
74
75
Page 2 of 27AUTHOR SUBMITTED MANUSCRIPT - ERL-102998.R2
123456789101112131415161718192021222324252627282930313233343536373839404142434445464748495051525354555657585960 A
ccep
ted
Man
uscr
ipt
3
1 Introduction 76
Achieving food security is central to the United Nations (UN) Sustainable Development 77
Goals. The UN Food and Agriculture Organization (FAO) defines food security as “a situation 78
that exists when all people, at all times, have physical, social and economic access to sufficient, 79
safe and nutritious food that meets their dietary needs and food preferences for an active and 80
healthy life” (FAO 2001). As a result, ensuring food security requires that food production and 81
distribution systems function despite potential disruptions. It also requires that all people have 82
economic access to a sufficient amount of food to satisfy their nutritional needs. Meeting this 83
goal in the face of a growing human population, shifting diets, limited natural resources, climate 84
change, and environmental variability is a major challenge of our time (Godfray et al 2010; 85
Foley et al 2011). 86
The ability of a food system to respond and adapt to disruptions, while maintaining its 87
function, describes the system’s resilience (Pingali et al 2005, Schipanski et al 2015). Like all 88
complex social-ecological systems, resilience within food systems cannot be evaluated at a 89
single scale (Folke et al 2010, Béné et al 2016). Consequently, local, global, and cross-scale 90
interactions must be included when evaluating resilience within the increasingly globalized food 91
system (Porkka et al 2013, D’Odorico et al 2014, Gephart and Pace 2015, MacDonald et al 92
2015). Further, food systems must be evaluated with respect to both the short-term responses and 93
the longer-term factors that contribute to resilience (Pingali et al 2005; Béné et al 2016). 94
At the local scale, research on food systems resilience has mostly focused on disaster 95
response case studies and detailed evaluations of infrastructure, governance, and social networks 96
(Béné et al 2016). These analyses help identify features of resilient systems including specific 97
mechanisms that allow them to respond and adapt to disruptions. For example, in 1992-1993 98
Page 3 of 27 AUTHOR SUBMITTED MANUSCRIPT - ERL-102998.R2
123456789101112131415161718192021222324252627282930313233343536373839404142434445464748495051525354555657585960 A
ccep
ted
Man
uscr
ipt
4
food production in southern Africa was adversely impacted by a drought related to El Niño, but 99
there was no regional food crisis. In 2002-2003 a similar drought caused a regional famine, and 100
this contrast has been interpreted as indicative of declining resilience related to conflicts and 101
adverse impacts of the HIV/AIDS pandemic on social and government institutions (Pingali et al 102
2005). 103
At the global level, resilience research has a different focus, evaluating economic patterns 104
and relationships rather than food security for individuals or households. Global-scale resilience 105
has been studied by tracking how shocks to food system propagate internationally (Marchand et 106
al 2016). For instance, extreme environmental conditions in 2007 and 2010 caused agricultural 107
failures in some countries. Export bans meant to protect populations in producing countries came 108
at the expense of nations reliant on trade to balance their food needs (Fader et al 2013, Baldos 109
and Hertel 2015). Food prices rose sharply, increasing the numbers of undernourished people 110
and creating social unrest including food riots (Fader et al 2013, Lagi et al 2011, Berazneva and 111
Lee 2013, Baldos and Hertel 2015). Studies combining population dynamics, food production, 112
and trade have found that the global food system has become increasingly fragile (Fraser et al 113
2005, D’Odorico et al 2010, Suweis et al 2015, Puma et al 2015, Marchand et al 2016). Global-114
scale factors like trade may enhance food security locally but reduce the resilience of the global 115
food system, while local scale factors that include more proximal drivers of food security - such 116
as grain reserves or the potential to increase local food production - act within the context of 117
global scale patterns and processes (Fraser et al 2005, D’Odorico et al 2010, Baum et al 2015, 118
Puma et al 2015, Fader et al 2016, Gephart et al 2016, Marchand et al 2016, Gephart et al 2017). 119
In order to track the evolution and current state of resilience within the global food 120
system, we collected national level indicators at multiple time points to evaluate the overall state 121
Page 4 of 27AUTHOR SUBMITTED MANUSCRIPT - ERL-102998.R2
123456789101112131415161718192021222324252627282930313233343536373839404142434445464748495051525354555657585960 A
ccep
ted
Man
uscr
ipt
5
and trajectory of three dimensions of country-level resilience. The indicators characterize: socio-122
economic access to food in terms of income of the poorest quintile relative to average food 123
prices, biophysical capacity to sustainably intensify or extensify food production, and magnitude 124
and diversity of domestic food production. Here, we describe the geographic and temporal 125
(1992-2011) patterns of these resilience indicators, and evaluate the indicators for potential 126
redundancies. Our analysis provides an opportunity for global-scale generalizations and 127
comparisons of resilience at the country level, and the context necessary for developing cross-128
scale analyses of food systems resilience. 129
130
2. Methods 131
2.1 Conceptual Basis 132
The resilience concept was popularized through studies of ecosystems with alternative 133
states. In this context, resilience describes an ecosystem’s ability to remain in a particular state 134
under perturbations (Holling 1973, Folke et al 2010). Since its introduction in ecology, resilience 135
theory has been applied to a wide range of complex systems and has adopted a more general 136
definition of “the capacity of a system to absorb disturbance and reorganize while undergoing 137
change so as to still retain essentially the same function, structure, identity, and feedbacks” 138
(Walker et al 2004). Operationally, the concept has been used in several ways, including as a 139
metaphor associated with sustainability, a feature of dynamic models, and a quantifiable field 140
measurement (Carpenter et al 2001). 141
The resilience concept can be applied across multiple scales (Béné et al 2016). For 142
example, factors influencing household-level resilience include the maintenance or sale of assets 143
like livestock and dietary variation of meals (Misselhorn 2005). At the national scale, food 144
security is influenced by factors like margins of self-sufficiency and financial ability to balance 145
Page 5 of 27 AUTHOR SUBMITTED MANUSCRIPT - ERL-102998.R2
123456789101112131415161718192021222324252627282930313233343536373839404142434445464748495051525354555657585960 A
ccep
ted
Man
uscr
ipt

6
food deficits with imports from other countries (e.g. Suweis et al 2015). Other attributes 146
including production diversity and the size of national grain reserves contribute to the ability to 147
avoid or cope with disruptions and are therefore used as general indicators of resilience (e.g. 148
Walker and Salt 2006). Finally, at the global level, factors including the structure of trade 149
networks influence the propagation of perturbations between countries and overall stability or 150
fragility of the globalized food system (e.g. D’Odorico et al 2010, Puma et al 2015, Gephart et al 151
2016, Marchand et al 2016). These factors can change at short or long time scales (Béné et al 152
2016). 153
Quantitative methods for tracking changes in resilience remain best developed in ecology 154
(e.g. van Nes and Scheffer 2007, Scheffer et al 2009, Carpenter et al 2011). Key ecosystem 155
variables are monitored and individually evaluated for reductions in the rate of return to 156
equilibrium after perturbations – known as critical slowing down – measured as changes in 157
autocorrelation and variance. These methods are effective at evaluating resilience in a diverse 158
array of ecosystems (Drake et al 2010, Carpenter et al 2011, Dakos et al 2012, Kéfi et al 2014). 159
These metrics have subsequently been extended to track changes in the resilience of socio-160
ecological networks (Suweis and D’Odorico 2014). The global food system can be 161
conceptualized as a complex network where countries are nodes with endogenously resilient 162
food production systems and consumption, where international trade connects nodes and acts as 163
another source of resilience. The network theory framework has allowed critical slowing down 164
and related approaches to evaluating changes in resilience to be applied to the global food system 165
(e.g. D’Odorico et al 2010, Suweis et al 2015). However, there are important limitations to 166
applying the resilience metrics developed by ecologists to food systems. Specifically, application 167
of critical slowing down based resilience metrics tested by ecologists assumes there is no 168
Page 6 of 27AUTHOR SUBMITTED MANUSCRIPT - ERL-102998.R2
123456789101112131415161718192021222324252627282930313233343536373839404142434445464748495051525354555657585960 A
ccep
ted
Man
uscr
ipt
7
difference in key functional structure between social institutions and ecosystem processes, an 169
assumption that is contested by some social scientists (Adger 2000, Barrett and Constas 2014, 170
Olsson et al 2015, Béné et al 2016). Additionally, critical slowing down based resilience metrics 171
only indicate that change may occur; they do not discriminate between impending shifts to 172
conditions of decreased human wellbeing versus transitions to improved human well being 173
(Bauch et al 2016). Hence, existing approaches cannot yet fully describe patterns and processes 174
relative to resilience in the global food system (Béné et al 2016). 175
A pragmatic way to complement critical slowing down based resilience metrics is to 176
develop an index-based analysis of the capacity of countries to handle shocks (e.g. Allison et al 177
2009, Fader et al 2016, Marchand et al 2016). Index based methods rely on surrogate measures 178
that reflect aspects of resilience that are difficult to measure or model (Adger 2000, Carpenter et 179
al 2005). Additionally, directional change in indicators can have explicit interpretations, whereas 180
critical slowing down based methods are more ambiguous about the nature of change (Bauch et 181
al 2016). Here, we focus on developing indicators for national-scale resilience. We have selected 182
the national scale for four reasons: 183
1) Domestic and foreign policies are set at the national level and thus provide the context in 184
which proximal causes and consequences of individual food security or lack thereof occur. 185
2) A recent review found that most analyses of resilience in food systems are at the household 186
or community scale and broader scale analyses are lacking (Béné et al 2016). 187
3) National scale indicators of food security are available with global coverage. Finer scale (e.g. 188
household) metrics are available, but typically not with global coverage (Naiken 2003). 189
Page 7 of 27 AUTHOR SUBMITTED MANUSCRIPT - ERL-102998.R2
123456789101112131415161718192021222324252627282930313233343536373839404142434445464748495051525354555657585960 A
ccep
ted
Man
uscr
ipt
8
4) Many indicators of food security at the national scale are available as time series, allowing us 190
to track inter-annual variability and longer-term changes in ways not possible at smaller 191
scales. 192
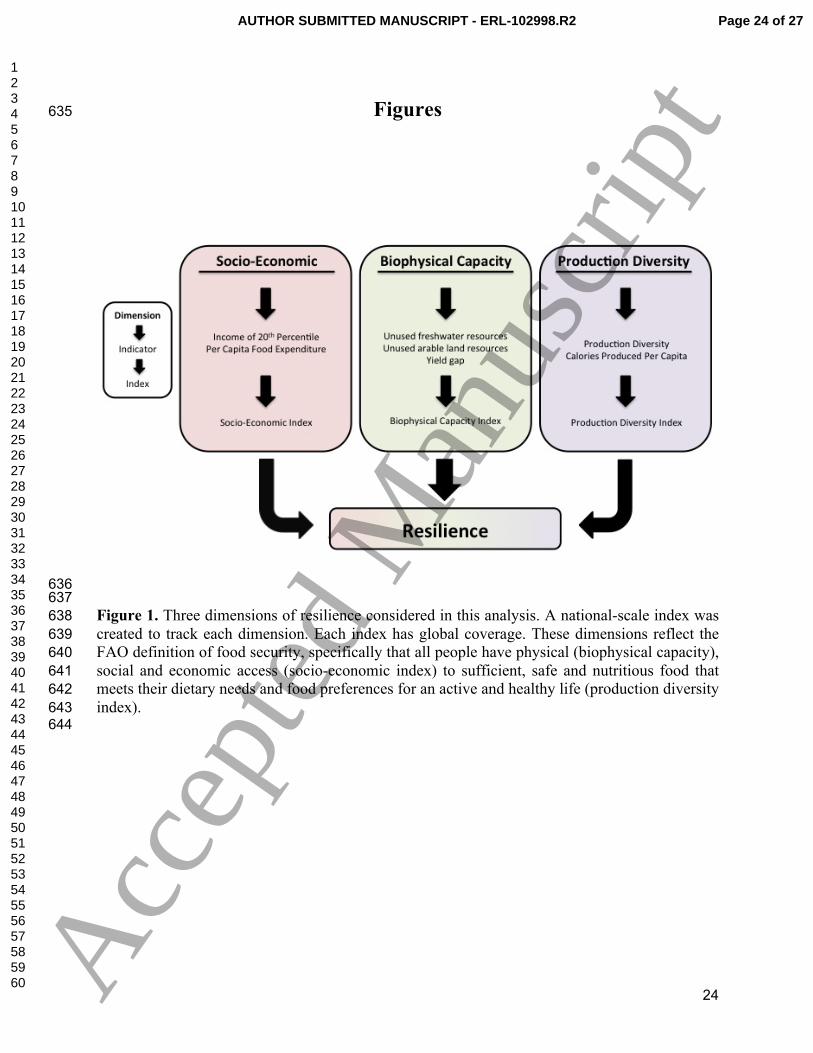
We consider three main dimensions of resilience within an index framework: the ability 193
to access food which is based on social and economic factors, biophysical capacity to increase 194
food production through sustainable intensification or extensification, and the magnitude and 195
diversity of domestic food production (Figure 1). For each dimension, we created an aggregate 196
index of resilience based on two to three key indicators. We described these indicators and 197
indices in detail below and have made the indicators available on Github (doi: 198
10.5281/zenodo.192394). 199
200
2.2 Access to Food 201
Access to food is chiefly a socio-economic issue related to prices and income (Barrett 202
2010). Typically, a country's poor are most likely to suffer from food insecurity (Bohle et al 203
1994, Timmer 2000). Being poor does not necessarily imply food insecurity, but it does limit 204
options during periods of price spikes, crop failures for subsistence farmers, or loss of assets 205
such as livestock (Timmer 2000). Therefore, we consider resilience to be higher in countries 206
where the poor have higher income relative to food prices, compared to countries where the poor 207
have low incomes relative to food prices (Timmer 2000). Other socio-economic factors including 208
levels of education, especially for women, and investments in infrastructure influence food 209
security and resilience at local scales, but we focus on income related factors here because these 210
are thought to be the primary influence on food security when evaluated at broad scales (Timmer 211
2000, Godfray et al 2010). 212
Page 8 of 27AUTHOR SUBMITTED MANUSCRIPT - ERL-102998.R2
123456789101112131415161718192021222324252627282930313233343536373839404142434445464748495051525354555657585960 A
ccep
ted
Man
uscr
ipt
9
We calculated an index of socio-economic access to food based on two indicators: the 213
average income of the lowest 20% of each country’s income distribution (per capita) and average 214
per capita food expenditure (cf. Timmer 2000). This metric reflects a measure of liquid assets 215
that can be readily exchanged for food. Estimates of the income of the lowest 20% of the 216
population are based on several sources. Most values were based on income data from the World 217
Bank, estimated using their PovcalNet tool 218
(http://iresearch.worldbank.org/PovcalNet/index.htm). In some cases, there were not enough 219
values in the World Bank dataset, so we used data from the United Nations University WIID 3.3 220
database (https://www.wider.unu.edu/download/WIID3.3). Average food expenditure per capita 221
was based on the FAO Domestic Food Price Level Index. This index represents the price of food 222
in each country relative to the United States in purchasing power parity terms. Data were not 223
available for all years, so we used logarithmic interpolation to complete time series. For 70 224
countries, this interpolation was based on five observations during the period 1992-2014. For 24 225
countries it was based on four observations, but with at least one observation before 1990. We 226
combined the income and food price metrics into a single index by taking the ratio of income to 227
food price. Lower values suggest increasing trade-offs with other critical expenditures (e.g., 228
housing) and reduced ability to make-up caloric deficits through food purchases. 229
230
2.3 Biophysical Capacity to Produce Food 231
We conceptualize the biophysical capacity to produce food as a function of area of 232
suitable, uncultivated land, untapped freshwater resources, and potential for closure in 233
agricultural yield gaps (percentage of actual production divided by potential production). 234
Increasing either of these factors will increase the biophysical capacity of countries to ramp-up 235
food production through extensification (putting unused land and water resources into 236
Page 9 of 27 AUTHOR SUBMITTED MANUSCRIPT - ERL-102998.R2
123456789101112131415161718192021222324252627282930313233343536373839404142434445464748495051525354555657585960 A
ccep
ted
Man
uscr
ipt
10
production) or intensification (decreasing yield gap through nutrient supply, irrigation, or 237
utilizing new technology) in the case of increased demand or decreased production capacity 238
(Fader et al 2016). Having little unused land or water resources, or no possibility to reduce yield 239
gap, indicates limited ability to increase food production domestically. In this sense biophysical 240
capacity contributes to resilience as a form of redundancy (e.g. Walker and Salt 2006). 241
Intensification or extensification of agricultural production mainly occurs over longer time spans 242
because of the time necessary to obtain capital, develop these new resources, and distribute 243
technologies to improve yield gaps (Godfray et al 2010). 244
Here, we use a biophysical capacity index developed and described by Fader et al (2016). 245
This index is based on three indicators: volume of renewable freshwater resources, availability of 246
farmable land for agricultural extensification, and ability to intensify agriculture as indicated by 247
yield gap (Fader et al 2016). Briefly, volume of freshwater resources was estimated based on 248
data from the FAO AQUASTAT database. Unused resources were calculated as the total 249
renewable freshwater resources minus water withdraws, environmental flow requirements, and 250
the amount of water that is unavailable due to seasonal variability, rainfall intensity, spatial 251
access, or lack of infrastructure. Unused arable land resources were estimated based on the 252
HYDE 3.2 land use database (http://themasites.pbl.nl/tridion/en/themasites/hyde/) and the FAO 253
Global Agro-Ecological Zones database. Unused arable land was calculated as total land area 254
minus land area already used for agriculture (excluding pastures), land not suitable for 255
agriculture, and land used for urban areas and other types of human settlement. Finally, yield gap 256
was estimated as the difference of actual yields for a given year and the maximum yields in 257
similar areas given ideal fertilization and irrigation minus actual production, multiplied by the 258
spare and used areas. These maximum values were estimated following the approaches of 259
Page 10 of 27AUTHOR SUBMITTED MANUSCRIPT - ERL-102998.R2
123456789101112131415161718192021222324252627282930313233343536373839404142434445464748495051525354555657585960 A
ccep
ted
Man
uscr
ipt
11
Mueller et al (2012). For each factor, we compiled values for the years 1992-2011. Fader et al 260
(2016) considered a variety of scenarios representing different levels of availability for unused 261
land and water resources. For the present analysis, we consider values from the middle scenario. 262
The values for each index were combined into an aggregate biophysical capacity measure by 263
assuming that land and water were non-substitutable, but that yield gap was substitutable with 264
these factors. In other words, increasing amount of available farmland does not increase 265
biophysical capacity to produce food if there is not also available water. However, extensifying 266
or potential for intensifying (yield gap closure) can both (or either) be used to increase 267
biophysical capacity. This index is scaled between 0 and 1, with values less than 0.5 indicating 268
limited water, land, or productivity redundancy and an inability to produce at least 3000 kcal d-1 269
per capita, a widely used value of dietary energy (Fader et al 2016). 270
271
2.4 Production Diversity 272
We consider production diversity to be related to the ability of countries to reliably meet 273
food demand through domestic production (Pingali et al 2005). This means maintaining a high 274
level of production despite (mostly) stochastic factors, such as weather variations including heat 275
waves and drought, biotic influences including invasive species and pests, plus the consequences 276
of local management decisions that include salinization and lost production due to over-grazing 277
(Walker and Salt 2006, D’Odorico et al 2010). Average production (kcal per capita) reflects the 278
ability of countries to meet caloric needs in a typical year, but not the resilience of countries to 279
short-term shocks that could decrease food availability over months or years. For example, a 280
country could have high production per capita, but if the majority of calories are from just a few 281
commodities, then this supply stream could be vulnerable to crop-specific pests or weather 282
outside the dominant crops’ optimum range. In general, more diverse biological systems are 283
Page 11 of 27 AUTHOR SUBMITTED MANUSCRIPT - ERL-102998.R2
123456789101112131415161718192021222324252627282930313233343536373839404142434445464748495051525354555657585960 A
ccep
ted
Man
uscr
ipt
12
thought to exhibit higher aggregate stability due to species asynchrony, portfolio effects, and a 284
number of other mechanisms (Chapin et al 2000, Schindler et al 2010, Tilman et al 2014). 285
Hence, we consider countries with high production for a greater variety of crops to be more 286
resilient than countries with low production or low diversity in production. 287
We calculated the “h-index” from bibliometric analyses as an index that balances 288
indicators of total production and breadth of production (Hirsch 2005). First, we calculated the 289
annual domestic production per capita of each commodity, Ci, in each country: 290
Ci = Ki / Pi 291
where Ki is the total kcal produced by a commodity in a given year and country, and Pi is the 292
population. Ki was determined using the FAO commodities production database (given in units 293
of weight) and using the FAO conversion factors to express Ki in kcal (D’Odorico et al 2014; 294
http://faostat.fao.org). We focus on calories instead of other nutritional characteristics (e.g. 295
protein or micronutrient content) because it is easily comparable across countries and is also the 296
basis for the biophysical capacity indicator (Fader et al. 2016). For the diversity analysis, we 297
only considered primary food products, which prevents double counting of caloric production 298
through the production of secondary products, like flours or processed animal products 299
(D’Odorico et al 2014). We then calculated each country’s h-index for the years 1992-2011. All 300
Ci were ordered from greatest to least and given a rank depending on their order in this sequence 301
(i.e. the highest Ci has a rank 1, the second highest has a rank 2, and so on). Then, we calculated 302
the h-index as the largest rank for which the rank is equal or less than the corresponding Ci. In 303
other words, an h-index of 20 would indicate that a country has 20 commodities that produce at 304
least 20 kcal per capita, but not 21 commodities producing at least 21 kcal per capita. A country 305
can only score a high h-index value if it has a production stream that has high production per 306
Page 12 of 27AUTHOR SUBMITTED MANUSCRIPT - ERL-102998.R2
123456789101112131415161718192021222324252627282930313233343536373839404142434445464748495051525354555657585960 A
ccep
ted
Man
uscr
ipt
13
capita and is also diverse. For example, a country that produced 1500 kcal per capita of corn, but 307
then only 10 kcal per capita of nine other commodities would have an h-index of 10. 308
309
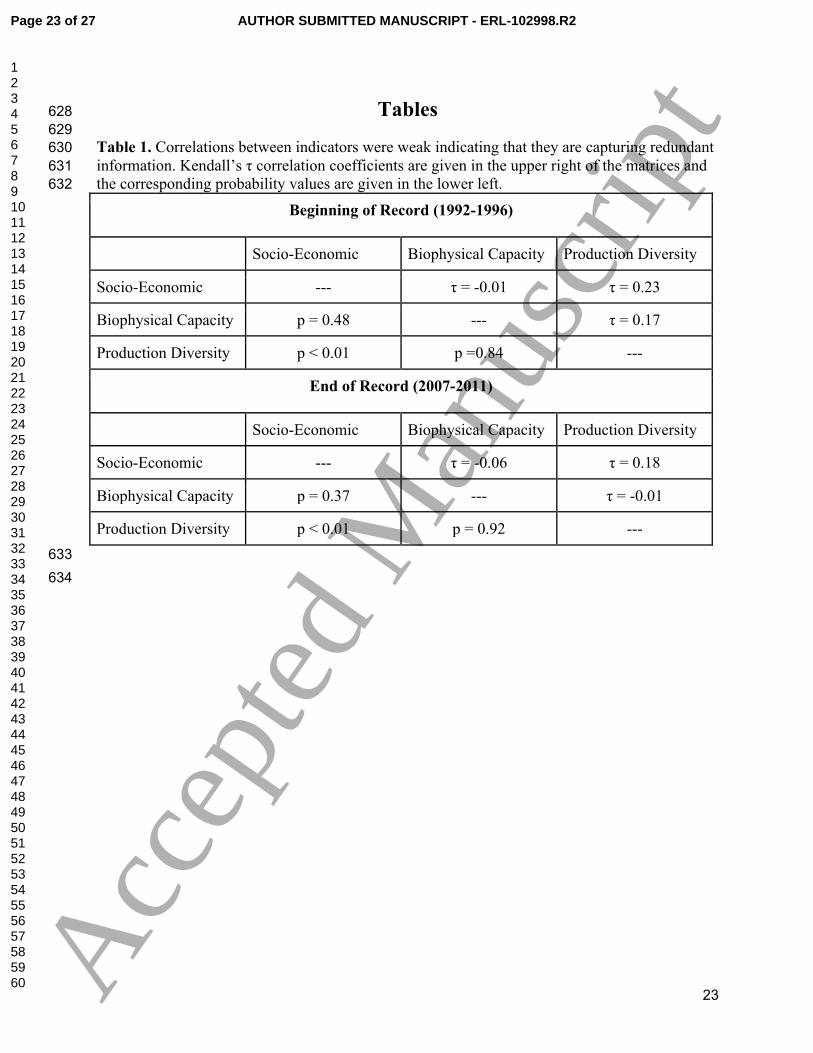
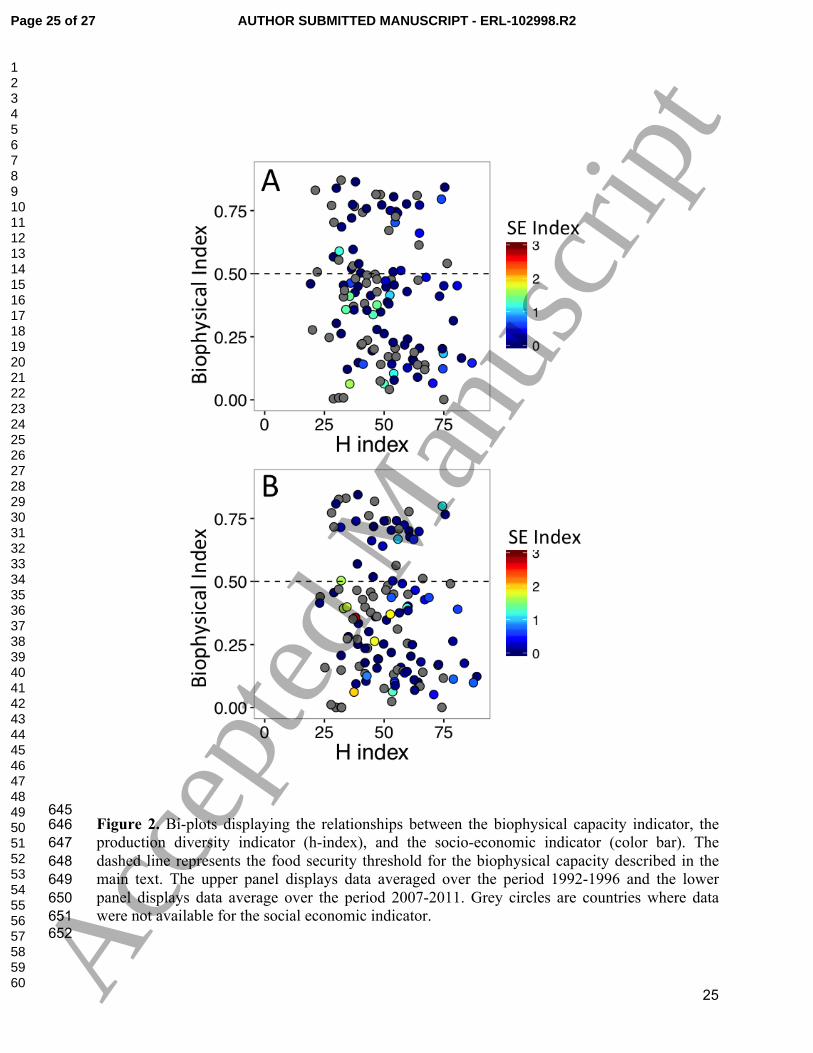
2.5 Evaluation of Redundancy Between Indicators 310
We evaluated the potential for redundancy between indicators using Kendall’s τ, a rank-311
based correlation coefficient (Kendall and Gibbons 1990). There was, at most, a minor 312
relationship between the indicators (Figure 2). Correlations between indicators were similar for 313
five-year averages at the beginning (1992-1996) and end (2007-2011) of the records (Table 1). In 314
both cases there was no significant relationship between the socioeconomic and biophysical 315
capacity indicators and no significant relationship between the biophysical capacity and 316
production diversity index. The correlation between the socio-economic indicator and production 317
diversity was statistically significant, but the effect size was weak at both the beginning and end 318
of the record. This analysis indicates that these three indicators have minimal redundancy in 319
capturing aspects of resilience. 320
321
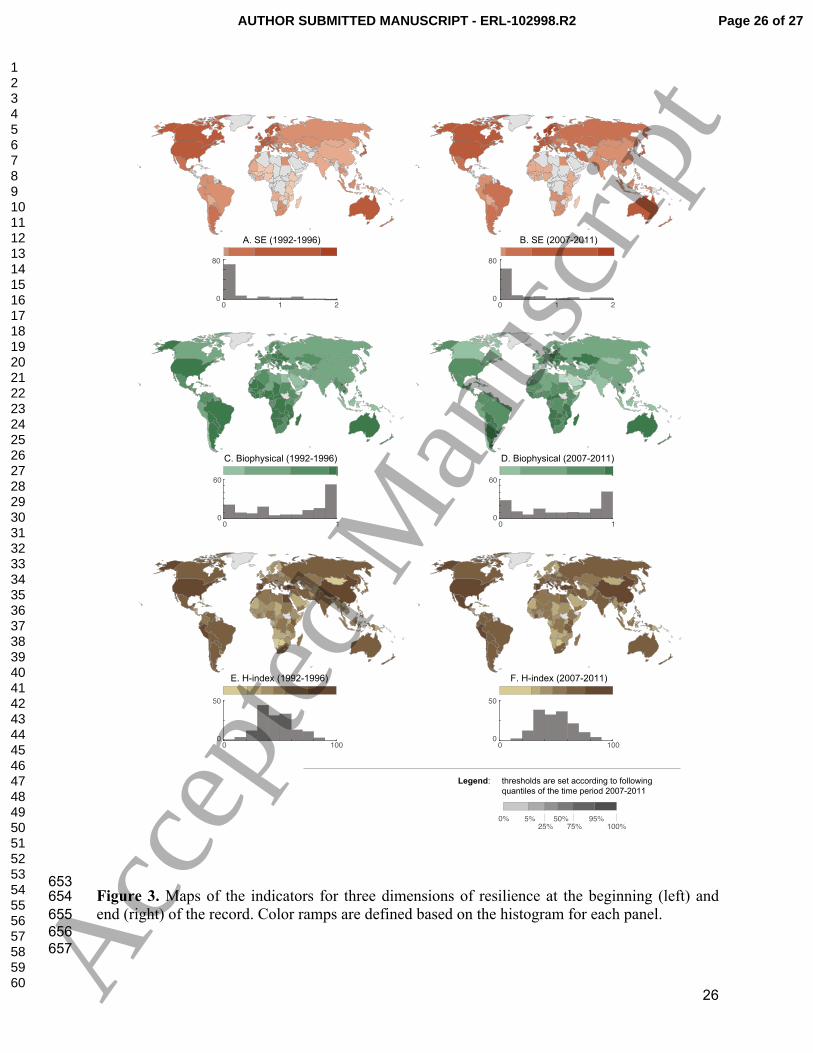
3 Empirical Results: Geographic and Temporal Patterns of Resilience Indicators 322
We evaluated patterns and changes in the resilience indicators based on 5-year averages 323
at the beginning (1992-1996) and end (2007-2011) of the record (Figure 3). The distribution of 324
the socio-economic indicator was strongly right skewed throughout the record (Figure 3). 325
Specifically, at the beginning of the record 90% of countries had socio-economic indicator 326
values < 1, indicating that their poor earn substantially less than average food expenditures are 327
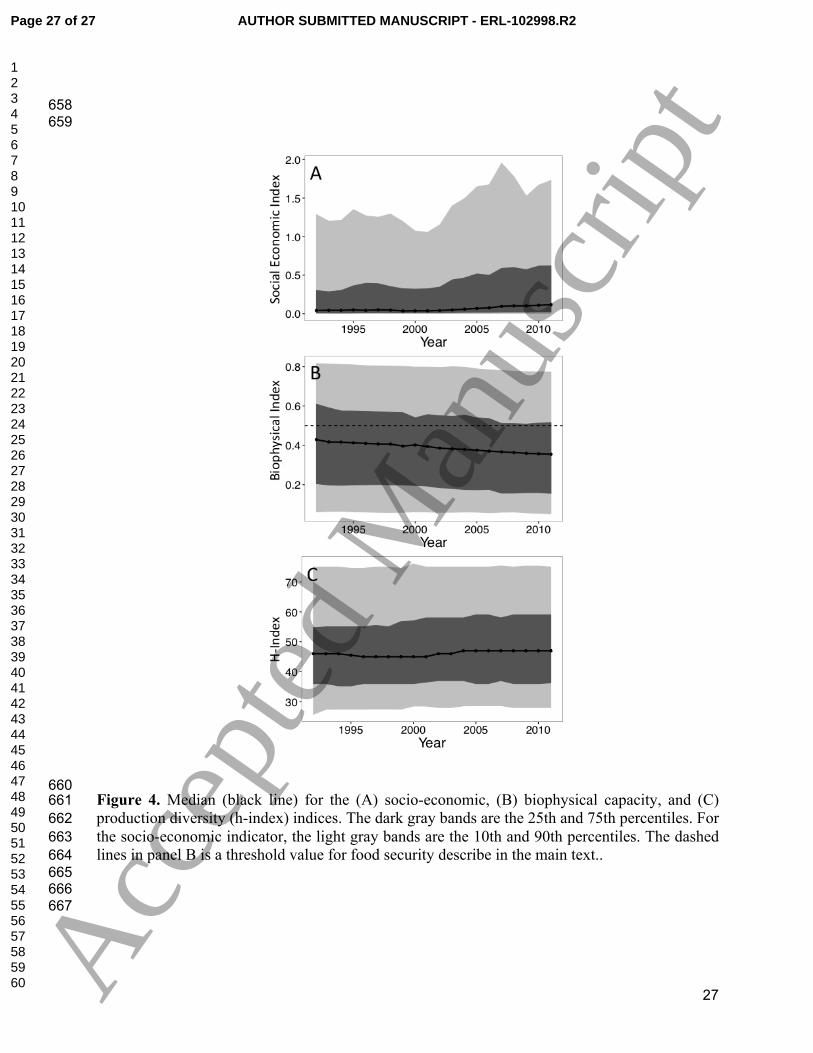
within the country. In fact the median socio-economic indicator values was just 0.04 (Figure 4). 328
At the end of the record, 86% of countries had socio-economic indicator values < 1 and the 329
median indicator value had increased to 0.08 (Figure 4). Across the record, high indicator values 330
Page 13 of 27 AUTHOR SUBMITTED MANUSCRIPT - ERL-102998.R2
123456789101112131415161718192021222324252627282930313233343536373839404142434445464748495051525354555657585960 A
ccep
ted
Man
uscr
ipt
14
were clustered in Western Europe and the lowest values were clustered in Africa and Asia. Many 331
of the countries with the largest increases between the beginning and end of the record were 332
European countries already with indicator values among the highest globally (e.g., Norway, 333
Switzerland, Finland, Sweden). 334
The distribution of the biophysical indicator was left-skewed or bimodal throughout the 335
record (Figure 3). At the beginning of the record, 41% of countries had biophysical capacity 336
indicators less than the threshold (0.5) indicating limited capacity. This increased to 47% by the 337
end of the record. The median indicator declined from 0.7 to 0.58 (Figure 4). The highest values 338
of biophysical capacity were in Africa, Eastern Europe, South America, and the United States. 339
Western and northern European countries have lower biophysical capacities because they lack 340
spare arable land through which agriculture can be extensified (Fader et al 2016). Despite this 341
patterning, the declines in biophysical capacity have been spread relatively evenly between 342
continents. 343
Production diversity had a unimodal distribution throughout the record (Figure 3). The 344
median diversity index for the beginning and end of the record, 46 and 47. Many of the biggest 345
gains in the diversity index occurred in Africa and the Middle East. China, the United States, and 346
several other countries with temperate or Mediterranean climates maintained high productivity 347
diversity throughout the time-series. In contrast, many countries in Africa, and areas with semi-348
arid and the tropical climates had lower production diversity. The positive, but weak relationship 349
between the socio-economic indicator and production diversity also suggests that wealthier 350
nations are more likely to have higher production diversity but with large variations in this 351
relationship. 352
Page 14 of 27AUTHOR SUBMITTED MANUSCRIPT - ERL-102998.R2
123456789101112131415161718192021222324252627282930313233343536373839404142434445464748495051525354555657585960 A
ccep
ted
Man
uscr
ipt
15
Collectively, geographic patterns and lack of strong correlation between indices 353
demonstrate that there are few countries with high values for all three dimensions of resilience 354
considered in this analysis. Hence, our analysis shows different countries, and in many cases 355
different regions, are resilient (or lack resilience) in different ways. 356
357
4 Discussion 358
The application of the resilience concept in the context of food security has become more 359
frequent both in the academic and policy arenas (Pingali et al 2005, Suweis et al 2015, Béné et al 360
2016). Our analysis adds to these developments by evaluating factors of resilience contributing 361
to country-scale food security of nations around the world, including country-specific diversity 362
and redundancy of agricultural production and the food purchasing power of the poor. These 363
indicators are available in time series based on standardized data, which allows for the evaluation 364
of inter-annual variability and longer-term changes. Hence, our results contribute to filling a gap 365
in the food security-resilience literature, which is dominated by local-scale studies based on 366
individual hunger events (Béné et al 2016). 367
Our approach focuses on dimensions of resilience and not on estimating or reducing 368
numbers of undernourished people. This difference in goals can cause interpretations that run 369
counter to common. One example is that in our biophysical capacity index we consider having 370
high yield gap as high resilience, whereas reduction of the yield gap is typically identified as a 371
goal to feed the growing human population (Godfray et al 2010). While we agree with this 372
interpretation of the yield gap issue, our approach notes there is a trade-off whereby yield gap 373
reductions limit the transformative capacity in the sense that transformation of agricultural 374
systems through intensification is no longer a viable option to increasing food production. 375
Similar reasoning applies to extensification in terms of the amount of viable farmland currently 376
Page 15 of 27 AUTHOR SUBMITTED MANUSCRIPT - ERL-102998.R2
123456789101112131415161718192021222324252627282930313233343536373839404142434445464748495051525354555657585960 A
ccep
ted
Man
uscr
ipt
16
in production where the production system become more rigid in the sense that it is operating on 377
nearly all potentially arable land, reducing buffer area (Fader et al 2016). 378
Our social-economic indicator is similar to the “share of food expenditure by the poor” 379
index of food security calculated by the FAO. However, the FAO indicator is only available for a 380
small number of countries and years, which limits the potential to track geographic and temporal 381
patterns. We were able to calculate our socio-economic indicator for 96 countries from 1992 to 382
2011 and these data are available on Github (doi: 10.5281/zenodo.192394). A limitation of our 383
socio-economic indicators is that it compares the average per capita income of the lowest 20% of 384
the population to the overall average food price index. It is probable that, for households, income 385
and food expenditures are correlated (e.g. Kirkpatrick and Tarasuk 2003). A more 386
comprehensive picture of food security among the poor would be gained by adding a measure of 387
average food expenditures of the poor as a percentage of total income, which would provide a 388
proxy for food access issues and tradeoffs with other essential expenditures (Misselhorn 2005). 389
Such disaggregated data is not widely available, hence this indicator reflects variation in the 390
ability to buffer price shocks by reducing non-food expenditures, but not the specific amount of 391
money spent or food actually acquired (Timmer 2000). Overall, the socio-economic indicator 392
relates to the absorptive coping capacity of the poor, especially in developing countries, and our 393
study has expanded the potential to evaluate this aspect of resilience geographically and over 394
time (Timmer 2000, Béné et al 2016). 395
The production diversity indicator in our analysis relates to the absorptive and adaptive 396
capacities of agricultural production, which are key dimensions of resilience, while the 397
biophysical capacity accounts for the ability of the system to transform agricultural systems 398
through intensification or extensification. How these characteristics play out in practice depends 399
Page 16 of 27AUTHOR SUBMITTED MANUSCRIPT - ERL-102998.R2
123456789101112131415161718192021222324252627282930313233343536373839404142434445464748495051525354555657585960 A
ccep
ted
Man
uscr
ipt
17
on local factors. For example, Japan has little ability to transform its food production system 400
because of lack of arable land for extensification. Many African countries, like Angola and 401
Ghana have a high biophysical capacity but the actual ability to transform agricultural systems 402
depends on the strength of local institutions, the ability to raise capital to convert land for 403
agriculture and implement technologies and strategies for sustainable intensification like 404
integrated crop water management, and the cultural acceptance of change (Béné et al 2016, 405
Jägermeyr et al 2016, MacDonald et al 2016). On the other hand, a country like Japan may have 406
strong institutions and large amounts of capital, but the biophysical limits of the country will 407
always constrain the transformability of agricultural production. Connecting our indicators with 408
the specific economics, governance, institutions, and cultures of every country is beyond the 409
scope of a single paper. However, these examples demonstrate both the utility of the global 410
context contributed by our analysis, as well as the need to integrate across scales and socio-411
environmental factors, to have a complete picture of resilience in the global food system. 412
Our analysis does not explicitly account for the influence of international trade. Twenty-413
four percent of food produced globally is traded between countries and the specific patterns of 414
trade connections between countries may amplify or muffle the transmission of production 415
shocks to consumers (D’Odorico et al 2014, d’Amour et al 2016, Marchand et al 2016). The 416
actual impact of trade-related shocks reflects a variety of factors, but a key one is the self-417
sustainability of crop production for a variety of crops that are consumed domestically (d’Amour 418
et al 2006). To a large extent, our production diversity index reflects the ability of a country to be 419
self-sufficient and to be self-sufficient for a variety of commodities, and hence integrates some 420
of the key factors influencing vulnerability to shocks propagated through trade. Other factors 421
include the numbers of people living in extreme poverty and this is, to some extent, integrated 422
Page 17 of 27 AUTHOR SUBMITTED MANUSCRIPT - ERL-102998.R2
123456789101112131415161718192021222324252627282930313233343536373839404142434445464748495051525354555657585960 A
ccep
ted
Man
uscr
ipt
18
within our socio-economic indicator (d’Amour et al 2006). Analyses of cereal trade networks 423
and fish trade networks have identified certain regions, especially Central and West Africa, as 424
susceptible to trade shocks (Gephart et al 2016, Marchand et al 2016). Our analysis finds that 425
many of these countries have low socio-economic indicators values (where available), low 426
production diversity, but high biophysical capacity. Hence our results reflect the influence of 427
trade on resilience and emphasize the complex nature of food systems’ resilience. 428
429
5 Conclusions 430
Achieving food security requires food production and distribution systems that are 431
resilient to disruption. This study provides national-scale indicators of food systems resilience 432
with global coverage from 1992 to 2011. Our overall finding is that very few countries have 433
exclusively high or low values for all dimensions, emphasizing the complexity and heterogeneity 434
of the global food system. These indicators create the opportunity for global comparisons of 435
resilience between nations, and provide context for developing generalizations about the 436
resilience in the global food system. 437
438
Acknowledgments 439
This paper is based on research supported by the National Socio-Environmental 440
Synthesis Center (SESYNC) with funding received from the National Science Foundation DBI-441
1052875. M Fader received additional support from the Labex OT-Med (n° ANR-11-LABX-442
0061) funded by the French Government «Investissements d’Avenir» program of the French 443
National Research Agency (ANR) through the A*MIDEX project (n° ANR-11-IDEX-0001-02), 444
and the European Union’s Seventh Framework Programme for research, technological 445
development and demonstration under the project LUC4C (grant agreement number 603542). M 446
Page 18 of 27AUTHOR SUBMITTED MANUSCRIPT - ERL-102998.R2
123456789101112131415161718192021222324252627282930313233343536373839404142434445464748495051525354555657585960 A
ccep
ted
Man
uscr
ipt
19
Kummu received support from the Academy of Finland SRC project Winland and Academy of 447
Finland project SCART. Z Ratajczak received additional support from the National Science 448
Foundation (DBI 1402033). MJ Puma gratefully acknowledges support from the Columbia 449
University Center for Climate and Life, where he is a Climate and Life Fellow, and from the 450
Interdisciplinary Global Change Research under NASA cooperative agreement NNX14AB99A 451
supported by the NASA Climate and Earth Observing Program. A Tavoni is supported by the 452
Centre for Climate Change Economics and Policy, funded by the ESRC, and the Grantham 453
Foundation for the Protection of the Environment. We thank Christina Prell and Roberto Patricio 454
Korzeniewicz for helpful conversations. 455
456
References 457 458 Adger W N 2000 Social and ecological resilience: Are they related? Prog. Hum. Geog. 24 347-459 364 460 461 Allison E H et al 2009 Vulnerability of national economies to the impacts of climate change on 462 fisheries Fish Fish. 10 173-196 463 464 Baldos U L C and Hertel T W 2015 The role of international trade in managing food security 465 risks from climate change Food Sec. 7 275-290 466 467 Barrett C B 2010 Measuring food insecurity Science 327 825-828 468 469 Barrett C B and Constas M A 2014 Toward a theory of resilience for international development 470 applications Proc. Natl. Acad. Sci. U.S.A. 111 14625-14630 471 472 Bauch C T et al 2016 Early warning signals of regime shifts in coupled human-environment 473 systems Proc. Natl. Acad. Sci. U.S.A. doi: 10.1073/pnas.1604978113 474 475 Baum S D et al 2015 Resilience to global food supply catastrophes Environ. Syst. Decis. 35 301-476 313 477 478 Béné C et al 2016 Is resilience a useful concept in the context of food security and nutrition 479 programmes? Some conceptual and practical considerations Food Sec. 8 123-138 480 481 Berazneva J and Lee D R 2013 Explaining the African food riots of 2007-2008: An empirical 482 analysis Food Policy 39 28-39 483
Page 19 of 27 AUTHOR SUBMITTED MANUSCRIPT - ERL-102998.R2
123456789101112131415161718192021222324252627282930313233343536373839404142434445464748495051525354555657585960 A
ccep
ted
Man
uscr
ipt
20
484 Bohle H G et al 1994 Climate change and social vulnerability: Toward a sociology and 485 geography of food insecurity Global Environ. Change 4 37-48 486 487 Carpenter S R et al 2001 From Metaphor to Measurement: Resilience of What to What? 488 Ecosystems 4 765–781 489 490 Carpenter S R et al 2005 Surrogates for resilience of social-ecological systems Ecosystems 8 491 941-944 492 493 Carpenter S R et al 2011 Early warnings of regime shifts: A whole-ecosystem experiment 494 Science 332 1079-1082 495 496 Chapin F S et al 2000 Consequences of changing biodiversity Nature 405 234-242 497 498 Dakos V et al 2012 Methods for detecting early warnings of critical transitions in time series 499 illustrated using simulated ecological data PLoS ONE 7 e41010 500 501 d’Amour C B, et al 2016 Teleconnected food supply shocks Environ. Res. Lett. 11 035007 502 503 D’Odorico P et al 2010 Does globalization of water reduce societal resilience to drought? 504 Geophys. Res. Lett. 37 L13403 505 506 D’Odorico P et al 2014 Feeding humanity through global food trade Earth’s Future 2 458-469 507 508 Drake J M and Griffen B D 2010 Early warning signals of extinction in deteriorating 509 environments Nature 467 456-459 510 511 Fader M et al 2013 Spatial coupling of agricultural production and consumption: Quantifying 512 dependences of countries on food imports due to domestic land and water constraints Environ. 513 Res. Lett. 8 014046 514 515 Fader M et al 2016 Past and present biophysical redundancy of countries as a buffer to changes 516 in food supply Environ. Res. Lett. 11 055008 517 518 FAO 2001 The State of Food Insecurity in the World (Rome: FAO) 519 520 Foley J A et al 2011 Solutions for a cultivated planet Nature 478 337-342 521 522 Folke C et al 2010 Resilience thinking: Integrating resilience, adaptability and transformability 523 Ecol. Soc. 15 art20 524 525 Fraser E D G et al 2005 A framework for assessing the vulnerability of food systems to future 526 shocks Futures 37 465-479 527 528 Gephart J A and Pace M L 2015 Structure and evolution of the global seafood trade network 529 Environ. Res. Lett. 10 125014 530 531
Page 20 of 27AUTHOR SUBMITTED MANUSCRIPT - ERL-102998.R2
123456789101112131415161718192021222324252627282930313233343536373839404142434445464748495051525354555657585960 A
ccep
ted
Man
uscr
ipt
21
Gephart J A et al 2016 Vulnerability to shocks in the global seafood trade network Environ. Res. 532 Lett. 11 035008 533 534 Gephart J A et al 2017 Shocks to fish production: Identification, trends, and consequences 535 Global Environ. Chang. 42 24-32 536 537 Gerland P A E et al 2014 World population stabilization unlikely this century Science 346 234-538 237 539 540 Godfray H C J et al Food security: The challenge of feeding 9 billion people Science 327 812-541 818 542 543 Hirsch J E 2005 An index to quantify an individual’s scientific research output Proc. Natl. Acad. 544 Sci. U. S. A. 102 16569-16572 545 546 Holling C S 1973 Resilience and stability of ecological systems Annu. Rev. Ecol. Syst. 4 1–23 547 548 Jägermeyr J et al 2014 Integrated crop water management might sustainably halve the global 549 food gap. Environ. Res. Lett. 11 025002 550 551 Jalava M et al 2014 Diet change-a solution to reduce water use? Environ. Res. Lett. 9 074016 552 553 Kéfi S et al 2014 Early warning signals of ecological transitions: Methods for spatial patterns 554 PLoS ONE 9 e92097 555 556 Kendall M G and Gibbons J D 1990 Rank correlation methods, 5th edition (New York: Oxford 557 University Press) 558 559 Kirkpatrick S and Tarasuk V 2003 The relationship between low income and household food 560 expenditure patterns in Canada Public Health Nutr. 6 589-596. 561 562 Lagi M et al 2011 The food crises and political instability in North Africa and the Middle East 563 arXiv 1108.2455v1 564 565 MacDonald G K et al 2015 Rethinking agricultural trade relationships in an era of globalization 566 BioScience 65 275-289 567 568 MacDonald G K et al 2016 Globalizing the potential for integrated crop water management. 569 Environ. Res. Lett. In Press. 570 571 Marchand P et al 2016 Reserves and trade jointly determine exposure to food supply shocks 572 Environ. Res. Lett. In Review 573 574 Misselhorn A A 2005 What drives food insecurity in southern Africa? A meta-analysis of 575 household economy studies Global Environ. Change 15 33-43 576 577 Mueller N D et al 2012 Closing yield gaps through nutrient and water management Nature 490 578 254-257 579
Page 21 of 27 AUTHOR SUBMITTED MANUSCRIPT - ERL-102998.R2
123456789101112131415161718192021222324252627282930313233343536373839404142434445464748495051525354555657585960 A
ccep
ted
Man
uscr
ipt
22
580 Naiken L 2003 FAO methodology for estimating the prevalence of undernourishment, In: 581 Measurement and assessment of food deprivation and undernutrition Food and Agricultural 582 Organization of the United Nations 583 http://www.fao.org/docrep/005/Y4249E/y4249e00.htm#Contents 584 585 Olsson L et al 2015 Why resilience is unappealing to social science: Theoretical and empirical 586 investigations of the scientific use of resilience Sci. Adv. 1 e1400217 587 588 Pingali P et al 2005 Food security in complex emergencies: Enhancing food system resilience 589 Disasters 29 S5-S24 590 591 Porkka M et al 2013 From food insufficiency towards trade dependency: A historical analysis of 592 global food availability PLoS ONE 8 e82714 593 594 Puma M J et al 2015 Assessing the evolving fragility of the global food system Environ. Res. 595 Lett. 10 024007 596 597 Ridolfi L et al 2015 Indicators of collapse in systems undergoing unsustainable growth Bull. 598 Math. Biol. 77 339-347 599 600 Scheffer M et al 2009 Early-warning signals for critical transitions Nature 461 53-59 601 602 Schipanski M E et al 2016 Realizing resilient food systems BioScience 66 600-610 603 604 Schindler D E et al 2010 Population diversity and the portfolio effect in an exploited species 605 Nature 465 609-612 606 607 Suweis S and D’Odorico P 2014 Early warning signs in social-ecological networks PLoS ONE 9 608 e101851 609 610 Suweis S et al 2015 Resilience and reactivity of global food security Proc. Natl. Acad. Sci. U. S. 611 A. 112 6902-6907 612 613 Tilman D, et al 2014 Biodiversity and ecosystem functioning Annu. Rev. Ecol. Evol. Syst. 45 614 471-493 615 616 Timmer C P 2000 The macro dimensions of food security: economic growth, equitable 617 distribution, and food price stability Food Policy 25 283-295. 618 619 Van Nes E H and Scheffer M 2007 Slow recovery from perturbations as a generic indicator of a 620 nearby catastrophic shift Am. Nat. 169 738-747 621 622 Walker B et al 2004 Resilience, adaptability and transformability in social-ecological systems 623 Ecol. Soc. 9 art5 624 625 Walker B and Salt D 2006 Resilience Thinking: Sustaining Ecosystems and People in a 626 Changing World (Washington DC: Island Press) 627
Page 22 of 27AUTHOR SUBMITTED MANUSCRIPT - ERL-102998.R2
123456789101112131415161718192021222324252627282930313233343536373839404142434445464748495051525354555657585960 A
ccep
ted
Man
uscr
ipt
23
Tables 628 629 Table 1. Correlations between indicators were weak indicating that they are capturing redundant 630 information. Kendall’s τ correlation coefficients are given in the upper right of the matrices and 631 the corresponding probability values are given in the lower left. 632
Beginning of Record (1992-1996)
Socio-Economic Biophysical Capacity Production Diversity
Socio-Economic --- τ = -0.01 τ = 0.23
Biophysical Capacity p = 0.48 --- τ = 0.17
Production Diversity p < 0.01 p =0.84 ---
End of Record (2007-2011)
Socio-Economic Biophysical Capacity Production Diversity
Socio-Economic --- τ = -0.06 τ = 0.18
Biophysical Capacity p = 0.37 --- τ = -0.01
Production Diversity p < 0.01 p = 0.92 --- 633 634
Page 23 of 27 AUTHOR SUBMITTED MANUSCRIPT - ERL-102998.R2
123456789101112131415161718192021222324252627282930313233343536373839404142434445464748495051525354555657585960 A
ccep
ted
Man
uscr
ipt
24
Figures 635
636 637
Figure 1. Three dimensions of resilience considered in this analysis. A national-scale index was 638 created to track each dimension. Each index has global coverage. These dimensions reflect the 639 FAO definition of food security, specifically that all people have physical (biophysical capacity), 640 social and economic access (socio-economic index) to sufficient, safe and nutritious food that 641 meets their dietary needs and food preferences for an active and healthy life (production diversity 642 index). 643
644
Page 24 of 27AUTHOR SUBMITTED MANUSCRIPT - ERL-102998.R2
123456789101112131415161718192021222324252627282930313233343536373839404142434445464748495051525354555657585960 A
ccep
ted
Man
uscr
ipt
25
645 Figure 2. Bi-plots displaying the relationships between the biophysical capacity indicator, the 646 production diversity indicator (h-index), and the socio-economic indicator (color bar). The 647 dashed line represents the food security threshold for the biophysical capacity described in the 648 main text. The upper panel displays data averaged over the period 1992-1996 and the lower 649 panel displays data average over the period 2007-2011. Grey circles are countries where data 650 were not available for the social economic indicator. 651
652
Page 25 of 27 AUTHOR SUBMITTED MANUSCRIPT - ERL-102998.R2
123456789101112131415161718192021222324252627282930313233343536373839404142434445464748495051525354555657585960 A
ccep
ted
Man
uscr
ipt
26
653 Figure 3. Maps of the indicators for three dimensions of resilience at the beginning (left) and 654 end (right) of the record. Color ramps are defined based on the histogram for each panel. 655 656
657
0 1 20
80
0 1 20
80
0 10
60
0 10
60
0 1000
50
0 100
0% 5%25% 75%
50% 95%100%
0
50
C. Biophysical (1992-1996) D. Biophysical (2007-2011)
A. SE (1992-1996) B. SE (2007-2011)
E. H-index (1992-1996) F. H-index (2007-2011)
Legend: thresholds are set according to following
quantiles of the time period 2007-2011
Page 26 of 27AUTHOR SUBMITTED MANUSCRIPT - ERL-102998.R2
123456789101112131415161718192021222324252627282930313233343536373839404142434445464748495051525354555657585960 A
ccep
ted
Man
uscr
ipt
27
658 659
660 Figure 4. Median (black line) for the (A) socio-economic, (B) biophysical capacity, and (C) 661 production diversity (h-index) indices. The dark gray bands are the 25th and 75th percentiles. For 662 the socio-economic indicator, the light gray bands are the 10th and 90th percentiles. The dashed 663 lines in panel B is a threshold value for food security describe in the main text.. 664
665 666 667
Page 27 of 27 AUTHOR SUBMITTED MANUSCRIPT - ERL-102998.R2
123456789101112131415161718192021222324252627282930313233343536373839404142434445464748495051525354555657585960 A
ccep
ted
Man
uscr
ipt