CARDIAC PACING LEAD AS HEMODYNAMIC SENSOR .. ~M- … · proveniente cuore sia i parametri...
106
UNIVERSITA' DEGLI STUDI DI TRIESTE DIPARTIMENTO DI INGEGNERIA INDUSTRIALE E DELL'INFORMAZIONE XXII Ciclo del Dottorato in Ingegneria dell'Informazione Tesi di Dottorato 1n BIOINGEGNERIA ELETTRONICA E DELL'lNFORMAZIONE CARDIAC PACING LEAD AS HEMODYNAMIC SENSOR Dottorando: Danko TOMASIC Responsabile dottorato di ricerca: VVESC. OVO .. . Relatore: Chiar.nlo Prof. Agostino P. ACCARDO U niversita di Trieste CorreIa tore: Dr.sc. Bozidar FEREK-PETRIC Universita di Anno Accademico
Transcript of CARDIAC PACING LEAD AS HEMODYNAMIC SENSOR .. ~M- … · proveniente cuore sia i parametri...

UNIVERSITA' DEGLI STUDI DI TRIESTE
DIPARTIMENTO DI INGEGNERIA INDUSTRIALE E DELL'INFORMAZIONE
XXII Ciclo del Dottorato in Ingegneria dell'Informazione
Tesi di Dottorato
1n
BIOINGEGNERIA ELETTRONICA E DELL'lNFORMAZIONE
CARDIAC PACING LEAD AS HEMODYNAMIC SENSOR
Dottorando:
Danko TOMASIC
Responsabile dottorato di ricerca:
Chiar.n~.PJ~o~:.to VVESC.OVO .. .~M- .@<~
Relatore:
Chiar.nlo Prof. Agostino P. ACCARDO
U niversita di Trieste
CorreIa tore:
Dr.sc. Bozidar FEREK-PETRIC
Universita di
Anno Accademico
2009~2010

Contents
Abstract 3
Riassunto 5
1 Introduction 71.1 Aim of the Thesis . . . . . . . . . . . . . . . . . . . . . . . . . 71.2 Organization of the Report . . . . . . . . . . . . . . . . . . . . 8
2 State of the Art 92.1 Implantable Cardiac Devices . . . . . . . . . . . . . . . . . . . 9
2.1.1 Electrophysiology of the Heart . . . . . . . . . . . . . . 102.1.2 Basics of Implantable Cardiac Devices . . . . . . . . . 12
2.2 Hemodynamic Sensor . . . . . . . . . . . . . . . . . . . . . . . 152.2.1 Types of Hemodynamic Sensors . . . . . . . . . . . . . 172.2.2 Applications . . . . . . . . . . . . . . . . . . . . . . . . 20
3 Triboelectric Sensor 233.1 Introduction . . . . . . . . . . . . . . . . . . . . . . . . . . . . 233.2 Sensor Design . . . . . . . . . . . . . . . . . . . . . . . . . . . 243.3 Measurement Setup . . . . . . . . . . . . . . . . . . . . . . . . 283.4 Acute Animal Experiments . . . . . . . . . . . . . . . . . . . . 31
3.4.1 Methods and Materials . . . . . . . . . . . . . . . . . . 313.4.2 Results . . . . . . . . . . . . . . . . . . . . . . . . . . . 33
3.5 Acute Human Experiments . . . . . . . . . . . . . . . . . . . . 383.5.1 Methods and Materials . . . . . . . . . . . . . . . . . . 383.5.2 Results . . . . . . . . . . . . . . . . . . . . . . . . . . . 39
3.6 Conclusions and Possible Extensions . . . . . . . . . . . . . . 44
4 High Frequency Parameters of Pacing Leads 474.1 Introduction . . . . . . . . . . . . . . . . . . . . . . . . . . . . 47
4.1.1 Transmission Line . . . . . . . . . . . . . . . . . . . . . 48
1

4.2 Previous Acute Experiments . . . . . . . . . . . . . . . . . . . 494.3 Latest Acute and Chronic Experiments . . . . . . . . . . . . . 50
4.3.1 Materials and Methods . . . . . . . . . . . . . . . . . . 504.3.2 Results . . . . . . . . . . . . . . . . . . . . . . . . . . . 52
4.4 Conclusions and Applications . . . . . . . . . . . . . . . . . . 58
5 High Frequency Sensor 615.1 Introduction . . . . . . . . . . . . . . . . . . . . . . . . . . . . 615.2 Measurement Setup . . . . . . . . . . . . . . . . . . . . . . . . 625.3 Acute Animal Experiments . . . . . . . . . . . . . . . . . . . . 64
5.3.1 Methods and Materials . . . . . . . . . . . . . . . . . . 645.3.2 Results . . . . . . . . . . . . . . . . . . . . . . . . . . . 65
5.4 Acute Human Experiments . . . . . . . . . . . . . . . . . . . . 715.4.1 Methods and Materials . . . . . . . . . . . . . . . . . . 715.4.2 Results . . . . . . . . . . . . . . . . . . . . . . . . . . . 71
5.5 Conclusions and Possible Extensions . . . . . . . . . . . . . . 74
6 Conclusion and Future Work 776.1 Summary and Contributions . . . . . . . . . . . . . . . . . . . 776.2 Future work . . . . . . . . . . . . . . . . . . . . . . . . . . . . 79
A Delibera di presentazione 81
Acknowledgments 89
List of Figures 93
List of Tables 97
References 99

Abstract
Therapy in modern cardiac electrotherapy is based alrnost exclusively on the information about cardiac electrical depolarization. This kind of detection lacks any data about the myocardial contraction. An optirnal rhythm control should integrate the assessment of the mechanical cardiac activity and related hemodynamic parameters to the already existing electrical signal analysis. A hemodynamic sensor integrated in pacing would be a valuable instrument for many applications. Only few hemodynamic sensors in cardiac electrotherapy are currently available on the market.
In order to fill the gap, I have explored the possibility of building a hemodynamic sensor for myocardial contraction detection that could be easily integrated in the cardiac and defibrillator leads. In this thesis I propose two sensors. One is based on tribolectricity and the other one requires the measurement of high frequency lead parameters.
The triboelectric sensor measures the charge due to the triboelectric effect between one of the lead conductors and the inserted stylet as a result of the lead bending. The measurement system consists in sterile charge mnplifiers for use in sterile operation field and a non-sterile enclosure containing isolation amplifiers and pavver supply. Atrial and right ventricular tensiometric were recorded during numerous ovine and human experiments and have sho\vn good results under different measurement conditions. The main downside is the necessity of the additional hardware in ternlS of chronic stylet insertion in the lead lumen.
The sensor based on the Iueasurement of high frequency (HF) pacing lead parameters has its origin in previous extensive in vitro experiments on the HF characteristics of the lead. These experiments have supported the idea of considering any bipolar lead to be a HF translnission line with its characteristic impedance and attenuation. An original revaluing lead HF parameters after being for more than a decade in the saline solution is presented. A parallel on dry new leads was also out.
The hemodynamic HF sensor is based on the variation of the pacing lead
3

HF impedance and reflection coefficient due to its movement during cardiac contractions. The quality of the signal \vas proven in a series of ovine and hUITwn and during dobutamine test in sheep.
Both sensors would be heITlOdynarnic sensors for various cations: capture managenlent, rate responsiveness, heart failure I1lOnitoring, CRT optimization, hemodynamic stability AF therapy titration and syncope prediction. These tvvo sensors are unique for their and universality for all existing endovenous bipolar cardiac leads.
Riassunto
Nei moderni sistemi eli stirnolazione cardiaca, la si basa esclusivamente sull'informazione proveniente dalla elepoladzzazione elettrica del rniocardio. Questo metoda tuttavia, non prende in consielerazione Ia componente meccanica della contrazione del muscolo cardiaco. Un sistema ottimale per il controllo dell'attivita cardiaca dovrebbe valutare sia il elettrico proveniente cuore sia i parametri emodinarniei correlati aHa contrazione del miocardio. Pertanto, un sensore emodinamico nei sistemi di stimolazione sarebbe uno strumento utile per vade applicazioni. Attualmente suI mercato sono disponibili pochi sensori emodinamici ,nt'Cln',...::.
nei sistemi eli elettroterapia cardiaca. Nel mio progetto di ricerca ho investigato la possibilita eli realizzare
un sensore emodinamico per la rivelazione delle contrazioni cardiache, che potesse essere facilmente integrato esistenti elettrocateteri per la stimolazione e elefibrillazione. Ho proposto due sensori. Il prinlO si basa sul
triboelettrieo, il misura Ie variazioni dei parmnetri degli elettroeateteri usati alta frequenza.
Il primo sensore rileva la cariea generata per effetto triboelettrieo tra uno dei eonduttori dell'elettrocatetere e il manelrino a forma di filo h-''--'~u",v.
eonle eonseguenza della dell' elettroeatetere durante Ie eontrazioni del ruiocardio. II sistema di rilevazione e eomposto da amplificatori sigillati e sterilizzati per l'utilizzo in campo operatorio sterile. Completa il sistema una scatola contenente l'alimentazione e amplificatori isolati, per I'uso al eli fuori del eampo sterile. Segnali elettrici sono stati registrati nell'atrio e ventricolo eli ovini e urnani, nel corso eli numerosi eseguiti in eondizioni diverse. I ottenuti confermano la fattibilita eli questa tipo eli sen80re, il eui maggiore svantaggio e rappreselltato dalla neeessita, di tenere un ::;upplementare mandrino isolato nelP elettrocatetere impiantato cronicamente.
II sensore basato sulla misurazione dei parametri in alta frequenza elell'elettroeatetere trova sue origini negli sperimenti sulle caratteristiehe in alta frequenza dei eateteri considerati come una linea di trasrnissione con un'irn
f-"'"",-<"'.L.LLiU> caratteristica e Pattenuazione tipica della linea. ::.Iella tesi viene descritto 10 studio comparativo di questi parametri sugli stessi cateteri prima e dopo 1a 101'0 irllrllersione nella soluzione fisiologica per pili di dieci anni. Inoltre, viene descritto 10 stesso sperimento fatto con 15 nuovi cateteri.
II secondo sensore proposto si basa sulla misura della variazione dell'impedenza e del coefficiente di dell'elettrocatetere, considerato come una linea di trasmissione che viene per effetto delle contrazioni miocardio. La buona del segnale ottenuto e stata verificata con vari esperimenti condotti su ovini e umani. II sensore e stato anche testato negli anirnali in ritmo artificialmente accelerato usando l'infusione di dobutamina.
Entrambi i sensori proposti potrebbero venire impiegati in molteplici applicazioni nel campo dell'elettrostirnolazione: adattamento autOInatico della corrente di stimolazione, stimolazione antibradicardica con frequenza adatta in cronotropicarnente poco efficienti: monitoraggio scompenso cardiaco, ottimizzazione della CRT, valutazione della stabilita emodinamica della tachicardia ventricolare, adattmnento della terapia per la fibrillazione atriale e predizione della sincope neurocardiogenica. I due sensori descritti sono unici in termini eli semplicita versatilita, venire 1Il
tutti elettrocateteri bipolari attualmente presenti suI mercato.

Chapter 1
Introduction
1.1 Aim of the Thesis
Pacemakers, implantable cardioverter debrillators (ICD), cardiac resynchro-nization therapy pacemakers (CRT-P) and cardiac resynchronization therapycardioverter debrillators (CRT-D) are currently delivering therapy basedalmost exclusively on myocardial electrical depolarization events. The nalscope of the pacing therapy is to provoke myocardial contraction and, even-tually, to improve the heart pump function. The information based only onelectrical events, does not give the complete insight in the electromechanicalactivation of the excitable myocardium. Instead of monitoring the electricalactivity, the real value stands in knowing the outcomes of the pacing stimu-lus, i.e. the contraction itself. A hemodynamic sensor able to determine theblood ow or mechanical contraction and integrated in cardiac electrotherapysystems would be a valuable feature for many applications.
Currently, there are very few commercially available hemodynamic sen-sors integrated in the pacing system and all of them have some considerablelimitations that do not allow them to be widely used. In order to ll theexisting gap, in this thesis I give few proposals of novel techniques and sen-sors that might be applied in more or less direct way to the existing pacingsystems. I oer a dierent approach for the solution of the sensor designproblems by applying the knowledge of other elds of electric engineering,such as triboelectricity and high-frequency transmission line theory, to theeld of cardiac pacing. The nal aim of my work is to extend the functional-ity of modern cardiac electrotherapy systems by integrating a hemodynamicsensor in the existing pacing leads and oer a unique solution for a morecomplete patient management. In this way, I want to give a small contribu-tion in the development of this exciting area of biomedical engineering that
7
CHAPTER 1. INTRODUCTION
evolved tremendously during the 60 years of its history.
1.2 Organization of the Report
This report is organized as follows:In Chapter 1 a short introduction to the problem is given. In Chapter 2 anintroduction to the eld of cardiac pacing will be carried out together withfamiliarizing with some basic notions about hemodynamic sensors integratedin pacing systems. In Chapter 3 the design of a new triboelectric sensorfor cardiac contractions integrated in the pacing lead will be described. Theovine and human experiments will be presented together with the analysisof results. In Chapter 4 the series of acute and chronic measurements ofhigh frequency parameters of the cardiac leads will be shown. In Chapter 5a novel sensor for cardiac contractions based on variation of high frequencyparameters of the cardiac lead will be proposed. A detailed report on acuteanimal and human experiments will be given. Finally, conclusions and pro-posals for the future work will be presented in Chapter 6.
8
Chapter 2
State of the Art
2.1 Implantable Cardiac Devices
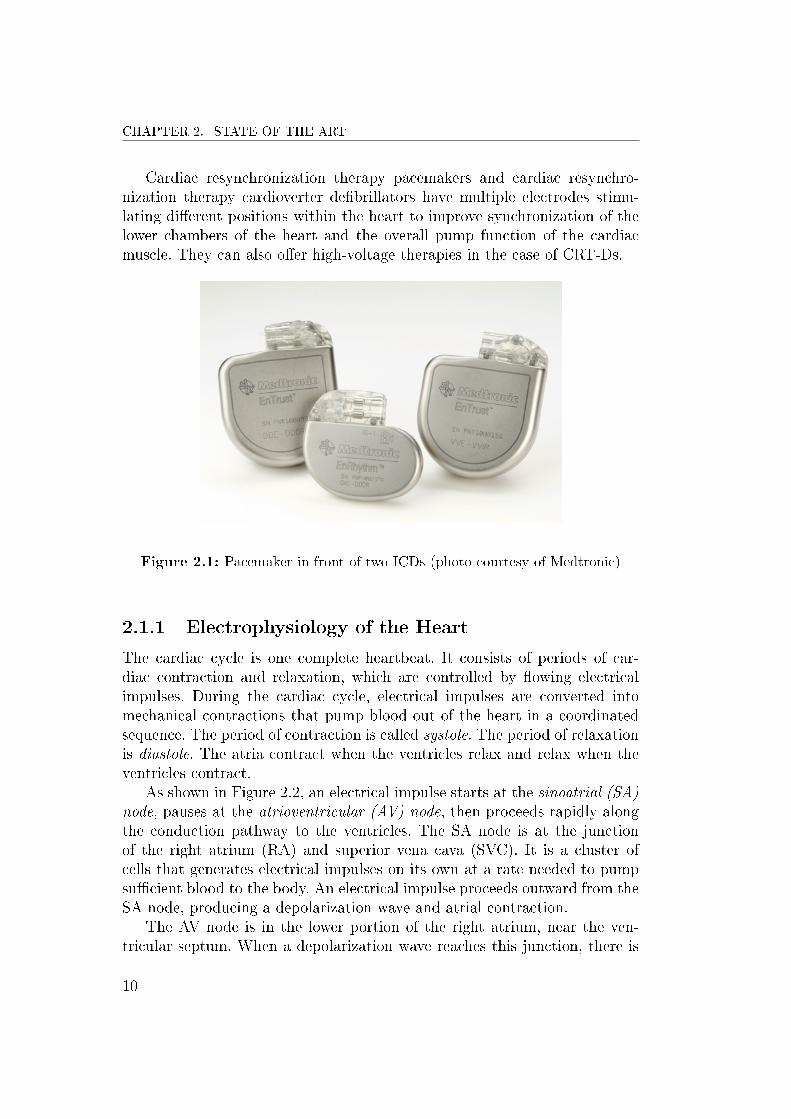
Advances in pacing and debrillator technology in recent years, supported byndings of a large number of well-designed, randomized clinical trials haveresulted in the increasing application of this technology for the treatmentof a variety of cardiac disorders. The result has been a huge increase in thenumbers of devices implanted for tachyarrhythmias and bradyarrhythmias,as well as heart failure therapy [1]. In fact, already in 2002 there were about3 million people worldwide with pacemakers [2] and currently around onemillion pacemakers are being implanted each year. As newer implantable de-vices have acquired increasing functionality, interpretation of their operationhas become increasingly progressive. Dierent types of implantable cardiacdevices currently exist in the market and the main distinction is in the typeof therapy they deliver.
A pacemaker is an implantable medical device which periodically deliversshort electrical impulses through the electrodes contacting the heart musclesin order to regulate the beating of the heart. The primary purpose of apacemaker is to maintain an adequate heart rate, either because the heart'snative pacemaker is not fast enough, or there is a block in the heart's electricalconduction system. These abnormal cardiac rhythms are generally known asbradycardias.
An implantable cardioverter debrillator combines a pacemaker and de-brillator in a single implantable device. The purpose of an ICD is to savelives by treating fast heart rhythms (tachycardias) and lethal ventricularbrillation. These types of arrhythmias are treated either by painless an-titachycardia pacing protocols or by uncomfortable high-voltage electricalshocks.
9
CHAPTER 2. STATE OF THE ART
Cardiac resynchronization therapy pacemakers and cardiac resynchro-nization therapy cardioverter debrillators have multiple electrodes stimu-lating dierent positions within the heart to improve synchronization of thelower chambers of the heart and the overall pump function of the cardiacmuscle. They can also oer high-voltage therapies in the case of CRT-Ds.
Figure 2.1: Pacemaker in front of two ICDs (photo courtesy of Medtronic)
2.1.1 Electrophysiology of the Heart
The cardiac cycle is one complete heartbeat. It consists of periods of car-diac contraction and relaxation, which are controlled by owing electricalimpulses. During the cardiac cycle, electrical impulses are converted intomechanical contractions that pump blood out of the heart in a coordinatedsequence. The period of contraction is called systole. The period of relaxationis diastole. The atria contract when the ventricles relax and relax when theventricles contract.
As shown in Figure 2.2, an electrical impulse starts at the sinoatrial (SA)node, pauses at the atrioventricular (AV) node, then proceeds rapidly alongthe conduction pathway to the ventricles. The SA node is at the junctionof the right atrium (RA) and superior vena cava (SVC). It is a cluster ofcells that generates electrical impulses on its own at a rate needed to pumpsucient blood to the body. An electrical impulse proceeds outward from theSA node, producing a depolarization wave and atrial contraction.
The AV node is in the lower portion of the right atrium, near the ven-tricular septum. When a depolarization wave reaches this junction, there is
10

2.1. IMPLANTABLE CARDIAC DEVICES
Figure 2.2: Electromechanical activation of the heart (photo courtesy ofMedtronic)
a slight pause. It gives sucient time for a complete ventricular relaxationand adequate ventricular lling by an atrial contraction. The delay mecha-nism ensures atrioventricular synchrony. The His bundle descends into theventricular septum, divides into branches, and terminates in Purkinje bers,which penetrate the ventricular myocardium. After leaving the atrioventric-ular node, electrical impulses travel rapidly along these bers, producingstrong ventricular contractions and the forceful expulsion of blood from theheart.
An electrocardiogram (ECG) is a record of the electrical activity in theheart. Electrical impulses are shown as a series of distinct waves in repeatingcycles. The P-wave represents atrial depolarization that is normally convertedto mechanical contraction of the atria. The QRS complex represents ventric-ular depolarization. The T-wave represents ventricular repolarization thatnormally corresponds to ventricular relaxation. Atrial repolarization wavesare small and occur during ventricular depolarization (QRS complex), sothey are usually not seen on an ECG.
The timing intervals such as PR, QRS and QT, shown in Figure 2.3,are important ECG parameters and the identication of electrocardiogramswith prolonged or shortened intervals is of extreme clinical importance. It canindicate a pathological state that is usually reected in suboptimal cardiacpump function.
11

CHAPTER 2. STATE OF THE ART
Figure 2.3: Cardiac cycle timing intervals
2.1.2 Basics of Implantable Cardiac Devices
The most generic cardiac implantable device system consists of a device canand one or more leads in contact with the myocardium. The electric circuitsdelivering and processing the electrical signals are placed in a titanium casetogether with a battery in order to protect them from direct contact withthe body tissue and uids. The can is usually implanted in the left or rightpectoral region. The stimulation pulse generated by the pulse generator istransferred to the heart by the pacemaker lead introduced into the rightchambers of the heart via the venous system. The pacing pulse enters theheart via the electrode located at the distal end of the lead. To close theelectric circuit, the stimulation pulse leaves the heart via a counter electrode,which transfers it back to the source in the pacemaker can. If a unipolarelectrode is used, the device can acts as a counter electrode and if a bipolarelectrode is used, the ring electrode is the counter electrode [3].
The pacemaker is not only able to stimulate the heart muscle. It alsodetects the electrical signals produced by the spontaneous cardiac depolar-ization (sensing). The contraction of depolarized cells in the myocardiumpresents as the heart beat. The complete process is called electromechanicalactivation of the heart. The sensing of the depolarization signal is achievedbetween the tip and ring electrode for bipolar electrodes or between the tip
12

2.1. IMPLANTABLE CARDIAC DEVICES
electrode and pacemaker can for unipolar electrodes. Only if the heart showsintrinsic activity and the sensing circuitry reveals it correctly, the pacingpulse is inhibited [3].
Figure 2.4: Triple chamber pacemaker - CRT-P (photo courtesy of Medtronic)
Single chamber systems make use of only one lead, either in the rightatrium (RA) or in the right ventricle (RV). Dual chamber systems withone lead in RA and another in RV, oer a more sophisticated therapy withatrioventricular synchrony. As shown in Figure 2.4, triple chamber systemspresent an additional lead stimulating the left ventricle (LV) for a syn-chronous activation of right and left side of the heart in order to optimizethe heart pump function [4].
The vast majority of modern leads are bipolar endovenous leads and theycan have passive or active (screw-in) xation. There are also dierent forms ofthe lead body and we can dierentiate between straight and J-shaped leads.The latter are normally used for placement in the right atrial appendage(RAA). The epicardial leads are used only in special cases during cardiacsurgery or in case of venous obstruction. The Figure 2.5 shows a dual chamberpacemaker with two endovenous bipolar leads with passive xation. The leadto the left is an atrial J-shaped lead and the other is a ventricular straightlead.
There are dierent pacing modes according to the type of the device andthe patient needs. The NBG code given in Table 2.1 describes the pacingmode - the manner in which the pacemaker paces and senses. The rst letterin the NBG code indicates which chambers are paced and the second let-ter identies the chambers sensed. The third letter identies the pacemaker
13

CHAPTER 2. STATE OF THE ART
Figure 2.5: Dual chamber pacemaker with a straight and a J-shaped lead. Thesilicone tines close to the cathodes are used for passive xation (photo courtesy ofMedtronic).
response to sensing. The fourth letter describes programmability and rateresponse functionality.
The most common single chamber pacing modes are AAI(R) andVVI(R). In AAI(R) mode, the pacemaker paces the atrium at the end ofthe lower rate interval (corresponds to lower frequency) in the absence of asensed atrial event. The pacemaker inhibits the scheduled pacing pulse whenan atrial event is sensed within the lower rate interval. The letter R standsfor the rate responsive mode, the ability to mimic the physiologic need offaster rhythms during activities. VVI(R) is the analogous pacing mode forthe ventricle.
Dual chamber modes are DDD(R), DDI(R) and VDD. In DDD mode,the lower rate interval has two portions - an AV interval, which starts withan atrial event, and a VA interval, which starts with a ventricular event.The AV interval is the longest period of time allowed before delivery of aventricular pace in the absence of a sensed ventricular event. It mimics the
14

2.2. HEMODYNAMIC SENSOR
Chamber paced Chamber sensed Response to sensing Programmability
O=None O=None O=None O=None
A=Atrium A=Atrium T=Triggered P=Simple
V=Ventricle V=Ventricle I=Inhibited M=Multiparameter
D=Dual D=Dual D=Dual R=Rate modulation
Table 2.1: NBG pacing mode codes
PR interval - the time between atrial and ventricular depolarization in ahealthy heart. An appropriately programmed AV interval provides sucienttime for a complete atrial contraction and adequate left ventricular lling,i.e. it provides AV synchrony. The VA interval is the longest period of timeallowed before the delivery of an atrial pace in the absence of sensed atrialactivity. An example of a DDD pacing with a lower rate of 60 beats perminute (bpm) is given in Figure 2.6.
Figure 2.6: DDD pacing with a lower rate of 60 bpm (photo courtesy of Medtronic)
In VDD mode, ventricular pacing is synchronized to the sensed atrialrate up to the programmed upper tracking rate. DDI(R) modes are non-tracking modes that provide AV sequential pacing at either the lower orsensor indicated rate. When the atrial rate is faster than the lower rate orsensor-indicated rate, the patient does not have AV synchrony. Therefore,only DDD and VDD modes are considered physiological tracking modes.
2.2 Hemodynamic Sensor
The word hemodynamic is derived from the Greek words for blood (haima)and power (dynamis). Hemodynamics is the study of the movement and
15

CHAPTER 2. STATE OF THE ART
forces of blood. Although cardiac output is probably the most importantparameter to characterize the hemodynamic status of a patient, other pa-rameters such as ejection fraction, fractional shortening, end-state volumes,and intracardiac pressures are also used routinely. Because hemodynamics isthe study of blood motion and the forces imposed on the blood, a hemody-namic sensor can be dened as any sensor that measures either the circulationof blood or the mechanical action of the heart [5].
Strictly dened, a hemodynamic sensor should directly measure mechani-cal activity of the heart or blood. By a broader denition, even an electrogramsignal could be classied as hemodynamic because the electrical depolariza-tion of the heart is typically related to the mechanical action. However, asin the case of electromechanical dissociation, electrical activity might notbe related to mechanical activity and an electrogram could fail to sense amechanical response of the heart. A true hemodynamic sensor, therefore,must directly measure a mechanical parameter and not merely be correlatedwith the mechanical response. The ability to measure mechanical action inthe heart or circulation is not the only requirement to implement a hemo-dynamic sensor in an implanted device: the sensor must also satisfy otherrigorous requirements such as robustness, stability, ease of use, longevity,and cost. This is not a simple task and many eorts have been put in thedevelopment of the sensors that require custom leads dierent from thosestandard and commercially available [5], [6].
Examples of the hemodynamic sensors in electrotherapy systems includepressure transducers or intracardiac accelerometers. In addition, as technol-ogy for standard bipolar leads has improved such that many leads last forthe lifetime of the patient, it is expected that these custom leads exhibitsimilar longevity and stability: the lead must oer robust measurements forlong periods of time and the sensor outputs need to be stable as they canoften only be calibrated during pulse generator implantation or replacementprocedures or during invasive tests. The sensor also needs to be stable un-der various patient conditions such as posture changes, exercise, etc. Lastly,the main stimulus to develop future sensors in bradycardia devices has beento improve patient therapy while simultaneously decreasing the burden ofphysicians to perform additional tests to obtain that therapy improvement.
These tasks are often at odds: adaptive-rate sensors are often patient de-pendent and require additional testing or time-consuming calibration algo-rithms to optimize patient therapy. Therefore, whereas hemodynamic sensorsoer great opportunities to improve therapy, these should not be burdensometo the clinician or the patient. Due to these rigorous requirements, there areonly a few clinically available pacemakers with hemodynamic sensors thathave demonstrated the promise of consistent and acceptable responses [5].
16

2.2. HEMODYNAMIC SENSOR
2.2.1 Types of Hemodynamic Sensors
Dierent types of hemodynamic sensors are already implemented in the im-plantable devices and some are still under investigation. Most of these sensorscannot be strictly dened as hemodynamic as they only measure parametersthat are in vague relation to the mechanical activity of the heart or blood.An example are rate response sensors based on patient activity. However, forsake of better understanding, an overview of this type of sensors will also begiven in the rst part of this Section.
An activity sensor (piezoelectric or accelerometer) detects body move-ment and is an indication for patient daily activity. This sensor is normallyused for rate response algorithms in patients with chronotropic incompetence.It can also indicate to some extent a progressive heart failure with drop ofpatient activity. However, this type of correlation depends on the level of ear-lier activity which is already quite low in the patients with a higher degree ofheart failure. In that case, an activity sensor can hardly be clinically relevantas the decompensation symptoms would present practically in the same time[6].
Heart rate variability (HRV) is a measure of autonomic tone; it re-ects the severity of heart failure and is a marker of prognosis. The de-vices measure both the short-term and long-term HRV of the intrinsic sinusrhythm. The 4-week average of the standard deviation of all median atrial-to-atrial (AA) intervals over 5 minutes has been shown to predict the riskof death or hospitalization. The advantages of HRV measurement are itssimplicity and minimal battery expenditure. However, it is not applicable inpatients with high burden of atrial tachyarrhythmias or high percentage ofatrial pacing and it is highly dependent on pharmacologic therapy.
The minute ventilation (MV) sensor looks for the number of breathsper minute and uses it for the rate adaptation algorithms. It is based onthe measurement of the impedance changes across the chest cavity with eachrespiration. A sub-threshold signal is sent across the chest between the ringelectrode and the pacemaker can and the change in impedance is measuredbetween the pacemaker and the tip electrode. The circuitry looks at boththe frequency and the amplitude of the MV signal (relative tidal volume)to determine the MV count. The strength of MV is a strong correlation toworkload, particularly in and above the sub-maximal levels of workload; theweakness of the MV sensor is a relatively slow response time - for shortbursts of activity, the MV sensor may be too late to respond. For that rea-son, it is often integrated with an activity sensor that has complementarycharacteristics.
Ventricular repolarization is highly dependent on sympathetic stimula-
17

CHAPTER 2. STATE OF THE ART
tion for both evoked or paced complexes. Therefore, the QT interval mightbe used as a physiologic sensor and is usually blended with an activity sensorfor rate response purposes. The longest QT interval has been found to bepositively correlated with the highest cardiac output and the programmedAV delay. Furthermore, QT interval-determined AV interval also minimizedmitral regurgitation [4] but such an application is not present in the com-mercially available cardiac devices.
With the onset of heart failure, pulmonary congestion and edema willset in and contribute to symptoms. Intrathoracic impedance measuresresistivity in the chest, and the impedance will decrease in the presenceof pulmonary uid [6]. Medtronic algorithm Optivol, based on intrathoracicimpedance measurements, has been shown to detect 76% of the eligible con-gestive admissions with a median of 17 days of early warning [7]. It enablesclinicians to initiate early medical therapy and potentially reduce or preventheart failure hospitalizations. Again the simplicity is a great advantage ofthis sensor but its usefulness is limited to the prediction of worsening heartfailure. Likewise the majority of above mentioned sensors, the eld of applica-tions of Optivol results to be pretty limited. Hence, it cannot be considered acomplete hemodynamic sensor, especially if applying the narrower denitionof a hemodynamic sensor being only a blood ow or a myocardial contractionsensor.
On the other hand, there are some dedicated implantable hemody-namic monitors (IHM) in the strict meaning of the word hemodynamic.All of them are designed for long-term monitoring of dierent hemodynamicparameters. The Chronicle IHM (Medtronic, USA) has the largest amountof clinical data thus far. It is designed to record ongoing RV pressures, pres-sure derivatives, heart rate, patient activity and temperature. It consists of aprogrammable memory device placed in the pectoral area and a transvenouselectrode carrying a pressure sensor in the RV outow tract as shown in Fig-ure 2.7. The diagnostic data stored in the device is transmitted via standardradio-frequency telemetry methods already in place for pacemakers, ICDsand CRTs. The clinical value of the data recorded by Chronicle is obvious,especially for heart failure patients [8]. However, it is dicult to justify aninvasive implant procedure of a diagnostic device taking into account possibleperioperative complications.
The majority of above mentioned sensors, IHMs excluded, follow thebroader denition of the hemodynamic sensor and are not directly propor-tional to the myocardial contractility. The hemodynamic sensors in the nar-rowest sense of the word that are directly correlated with the myocardiumcontractility or that measure it directly are already implemented in somecommercially available devices:
18

2.2. HEMODYNAMIC SENSOR
Figure 2.7: Chronicle implantable hemodynamic monitor with the lead carryingthe pressure transducer (photo courtesy of Medtronic)
• The Sorin group (Italy) proposed the Peak Endocardial Accelera-tion (PEA) consisting of a microaccelerometer sensor inside the rightventricular pacing lead [9]. The system requires a dedicated RV leadwith a special, non-standard connector. The possibility of extending thesystem to the right atrium in the case of a dual-chamber pacemaker,or even to left ventricular pacing lead in the case of CRT, is still underinvestigation [10], [11]. However, the limitation of using special leadsremains.
• Some Biotronik (Germany) pacemakers measure the variations of theunipolar RV impedance during the cardiac cycle since these changes arerelated to the modication of blood (low impedance) and tissue (highimpedance) contents around the tip of the pacing electrode. During my-ocardial contraction, the impedance progressively increases reaching itsmaximum in late systole. This impedance increase is thought to cor-relate with right ventricular contractility, and thus, with the inotropicstate of the heart [12], [13]. This system known as Closed-Loop Stim-ulation (CLS) is currently incorporated in an algorithm for a morephysiological rate modulation used in patients with sick sinus syndrome(SSS) [14]. It reacts to smaller physiological stresses than conventionalrate adaptive algorithms trying to achieve a heart rate comparable tothat of a normal heart [15], [16].
• Another way of cardiac impedance measurement proposed by Medico
19

CHAPTER 2. STATE OF THE ART
S.p.A. (Italy) is calledTrans-Valvular Impedance (TVI). TVI mea-surements are derived between right atrium and ventricle in standarddual-chamber implants (DDD or VDD) [17]. Dierently from PEA andCLS sensors which are designed to monitor processes and parameterscorrelated to ventricular contraction strength, transvalvular impedancemeasurements are more a reection of preload and stroke volume. Thesensor is used for permanent ventricular ejection check after ventric-ular pacing and sensing, and also for hemodynamic monitoring andphysiological rate modulation.
There were some other ideas that have never been brought to clinicalpractice. The best known example is the sensor for the measurement of heartmovements based on ber optics (FOS) proposed by Hoeland and Kloppe[18], [19]. This investigational device contains an optical ber, with a mirrorat its end, that is inserted into a catheter located in the heart while anopto-electrical control unit positioned outside the heart contains both thelight source and the signal receiver. The opto-electrical unit generates andcouples the light into the ber and transforms and analyzes the reectedsignal that depends on heart movements. Similar to PEA, FOS requires aspecial lead and some additional hardware. For that reason and despite itsgood performance, the usage of this type of sensor can hardly be extendedto existing pacing systems.
2.2.2 Applications
The aim of modern pacemaker technology is not only to prolong life but alsoto provide therapy that is oriented towards the patient's individual needs,thus improving their quality of life. In the light of that, pacemaker therapydelivered exclusively on myocardial electrical signal becomes more and moreinsucient. For an optimal and more physiologic control of the heart it wouldbe extremely important to integrate the electrical signal with an assessment ofthe mechanical cardiac activity and of the related hemodynamic parameters.A hemodynamic sensor integrated in pacing systems would be a valuableinstrument for many applications.
For example, detecting the eective mechanical contraction cycle by cy-cle is the ultimate way of determining a loss of capture during pacing. Theclassical problem of oversensing or undersensing of the electrical depolariza-tion signals would be also solved by integrating a hemodynamic sensor [20],[21]. Furthermore, it would be possible to obtain a long term hemodynamicmonitoring of the patient with an early recognition and treatment of decayin hemodynamic performance of the heart.
20
2.2. HEMODYNAMIC SENSOR
In order to achieve adequate cardiac output in patients with DDD pacingfor a high degree atrioventricular block and in patients with CRT pacing foradvanced congestive heart failure, it is essential to obtain good mechanicalsynchronization of the heart chambers [22], [23]. For this purpose, an opti-mal programming of the paced AV delay and interventricular (VV) delay isrequired. A direct assessment of changes in systolic function requires invasivemeasurements which are neither practical, nor ethically acceptable as a rou-tine procedure. For this reason, in clinical practice, the optimization of pacingtherapy is routinely done by echocardiography procedure [24], [25]. However,this type of procedure can be only performed with the patient supine; it isextremely time-consuming and operator-dependent. A hemodynamic sensorintegrated in the pacing system that automatically calculates and optimizesthe programmable synchronization parameters, might be an objective meanof assessing and adjusting therapy, also during activities or exercise [26], [27],[11].
Another application would be the early detection and therapy deliveryfor vasovagal syncope. In fact, a hemodynamic sensor could easily detectstronger myocardial contractions that precede the vagal reaction.
Hemodynamic stability of the patient varies in dierent types of arrhyth-mias. A hemodynamic sensor integrated in the detecting system of an ICDwould allow to deliver patient-tailored therapies [28]. For example, in hemo-dynamically stable patients it would allow to automatically prolong the detec-tion time and try more sequences of painless antitachycardia pacing therapy.On the other hand, in unstable patients it would warrant a more aggressiveprotocol and less time to the rst life-saving cardioversion or debrillation.
21


Chapter 3
Triboelectric Sensor
3.1 Introduction
The previous Chapter describes in detail the existing hemodynamic sensorsand their applications in the eld of cardiac pacing. The majority of thesesensors have some considerable limitations that impede them from beingwidely used. They are mostly used for a limited number of applications suchas rate responsiveness. The biggest gap is observable in the eld of contrac-tility sensors that are potentially applicable in numerous algorithms. In orderto ll this gap in the pacing therapy, Ferek-Petric [29] proposed a new ten-siometric sensor integrated in the existing cardiac pacing leads based uponthe triboelectric eect. Later on, I have designed and built the sensor and theentire measurement system in collaboration with Ferek-Petric. I have thor-oughly tested the measurement system during acute animal (Section 3.4) andhuman experiments (Section 3.5).
The triboelectric eect, more commonly known as electrostatic dis-charge, occurs when two materials slide against each other. The frictionalforce involved in this process causes electrons of one material to separateand reattach themselves to the second material, creating a charge imbal-ance between the two surfaces. The induced current in the wiring resultingfrom this charge imbalance is responsible for unwanted noise and interfer-ence in measuring-, controlling-, monitoring- or audio applications. Thesedisturbances called mechanically induced noises or cable microphony are su-perimposed to the signals that the cable is carrying. They become moresignicant in the case of low level signals. The magnitude of the triboelectriceect, seen in any given wiring, is dependent on the material composition,humidity, separation rate, frictional forces, and numerous other factors [29],[30], [31], [32], [33].
23

CHAPTER 3. TRIBOELECTRIC SENSOR
The triboelectric series is a list of materials, starting from materials thathave a greater tendency to attain a positive charge after separation, andending with those that have a greater tendency to attain a negative chargeafter separation as shown in Table 3.1. Thus, a material towards the negativeend of the triboelectric series, when put in contact with a material closerto the positive end of the series, will attain a more negative charge, andvice versa. More distant are two materials from each other on the series,greater is the transferred charge [30], [31], [32], [33]. A generalized equationfor the current induced between any two materials can be expressed with thefollowing equation [34]:
i =k ·M · vn
D+Q · C · M
D(3.1)
where k is a proportionality constant unique to material, M is mass owrate, D is average particle diameter, v is particulate velocity, n is the expo-nent unique to material, Q is the charge on contacting particles, and C is aproportionality constant.
As evident from this relationship, many of the proportionality con-stants have been obtained empirically. Furthermore, this relationship maybe straightforward in applying to simple theoretical situations such as a sin-gle particle running along a surface, but it may prove dicult to apply tomore complicated problems.
Applying the triboelectric eect in the eld of cardiac pacing may givean opportunity to detect cardiac pacing lead movements due to the cardiaccontractions. In fact, exed or otherwise deformed cardiac pacing leads seenas coaxial or parallel cables, may also generate electrical noise. I have con-structed a measurement system able to quantify this noise, i.e. the chargecreated between dierent pairs of conductors. The system has also been testedfor charge measurements between one of the pacing lead conductors and apacing lead stylet that is normally inserted in the internal lumen of the leadonly during a regular implant procedure in order to provide additional sti-ness and support for the lead placement. In this case, instead of a classicstylet made of wire, I used dierent kinds of isolated wires made of dierentmaterials in the eort to obtain better signal. I have thoroughly tested theinstrumentation in acute animal and human studies [35], [36].
3.2 Sensor Design
In order to measure the charge created between the lead stylet and one ofthe conductors, a charge amplier was designed. This was a modied circuit
24

3.2. SENSOR DESIGN
Most positiveAir
+++Human Hands, Skin
AsbestosRabbit Fur
GlassHuman Hair
+
MicaNylonWoolLead
Cat FurSilk
AluminumPaper
Cotton
Steel
-
WoodLucite
Sealing WaxAmber
Rubber BalloonHard Rubber
MylarNickelCopperSilverBrass
Synthetic RubberGold, Platinum
SulfurAcetate, Rayon
PolyesterCelluloid
PolystyreneOrlon, AcrylicCellophane Tape
- - -
Polyvinylidene chloride (Saran)PolyurethanePolyethylenePolypropylene
Polyvinylchloride (Vinyl)Kel-F (PCTFE)
SiliconTeon
Silicone Rubber
Most negative
Table 3.1: Triboelectric series
25

CHAPTER 3. TRIBOELECTRIC SENSOR
of a previously designed amplier [37] for the measurement of the electriccharge created within the electrodes of the special lead for tricuspid bloodow sensing. The new amplier had a charge gain of 4.5 · 109 in the bandbetween 1.6 Hz and 16 Hz. A guard drive amplier was also added for abetter signal-to-noise ratio.
The measurement amplier was divided in two parts: an isolation ampli-er stage comprising isolation power supply, and a dierential charge pream-plier that could be sterilized and applied within the surgical eld. A pairof electrometer ampliers has been used at the input of the charge amplier:Burr-Brown OPA 128 or lately Analog Devices AD 549 due to the unavail-ability of the former type. The input resistances were selected to the availablelow-noise 100 MΩ (RS Electronics, US) value that yields the low-pass lter-ing at 16 Hz (-3dB). The high-pass ltering is 1.6 Hz (-3dB) with the selectedfeedback components of 100 pF and 1 GΩ. Ampliers Burr Brown INA105were used for both the dierential output stage and the guard amplier.Zener diodes protect the input from electrosurgery and static potential. Theoutput signal from the dierential amplier is led via 2 m long patient cableto the input of the isolation ampliers Burr-Brown ISO 121. Decoupling ca-pacitor of 4.7 µF yields lower cut-o at the frequency of 0.17 Hz preventingthe baseline shift due to the stray charges which may accumulate on the feed-back capacitor. Quadruple isolating DC/DC converter Burr-Brown 724 wasused for the symmetric voltage isolated power supply. The complete circuitdiagram is shown in Figure 3.1.
The elements were soldered on the printed circuit boards (PCB) pro-duced manually and the pre-ampliers were mounted within the plastic caseas shown in Figure 3.2. The logic of the standard pacemaker system analyzer(PSA) connection was used whereby black alligator is for the lead connectorpin connection and red alligator for either the skin or the connector ring con-nection. White alligator was used for connection of the stylet. Fisher medicalgrade 4-wires cable with 9 mm circular connector attached (RS Electronics,USA) is used to conduct the positive and negative supply, output signal andground.
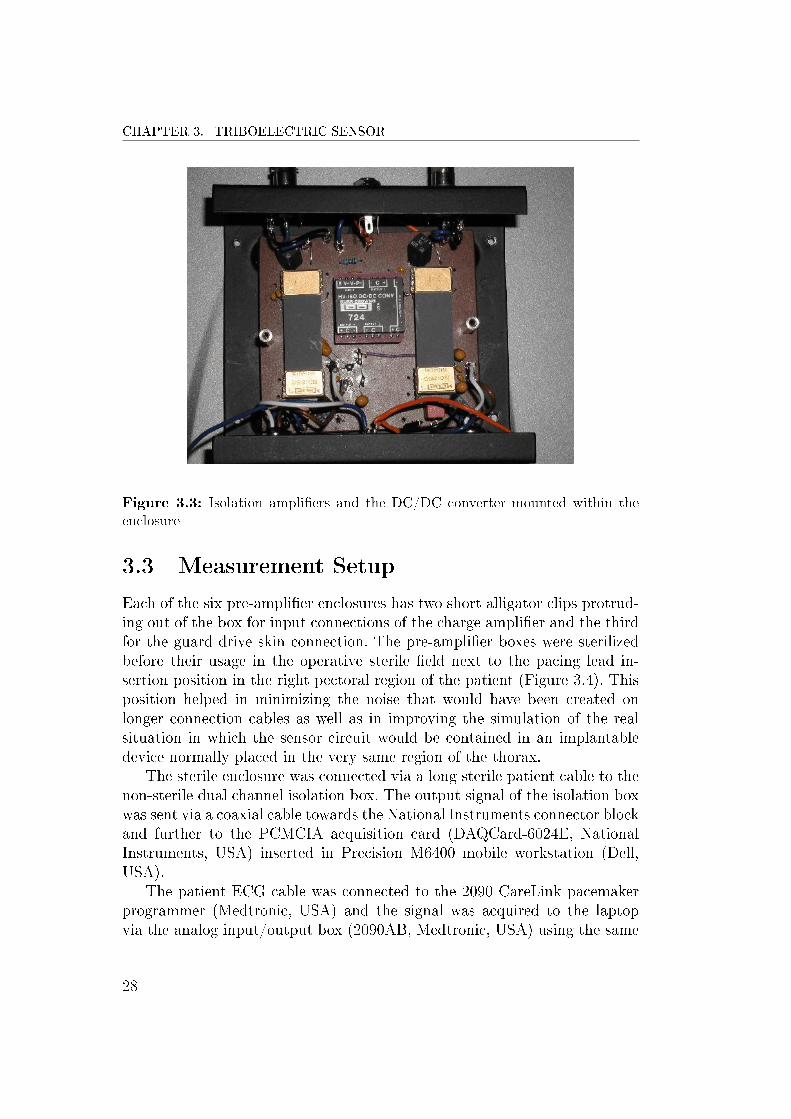
Isolation ampliers having the gain of 10 and an isolated DC/DC con-verter were soldered onto the PCB. They were mounted into the steel enclo-sure (Figure 3.3) having two input connectors for the patient cable bringingsignal from the charge ampliers and two BNC output connectors. The Ni-Cd9,6 Volts battery (not shown) was mounted on the top of the circuit. Circuitdiagram does not show the 100 nF ceramic capacitors and 5 µF tantalum ca-pacitors used for power supply decoupling lters keeping power supply noisefrom entering the circuit. Finally, six pre-ampliers and one dual channelisolation box were produced.
26

3.2. SENSOR DESIGN
Figure 3.1: Charge amplier and isolation amplier circuit design
Figure 3.2: Preamplier box
27
CHAPTER 3. TRIBOELECTRIC SENSOR
Figure 3.3: Isolation ampliers and the DC/DC converter mounted within theenclosure
3.3 Measurement Setup
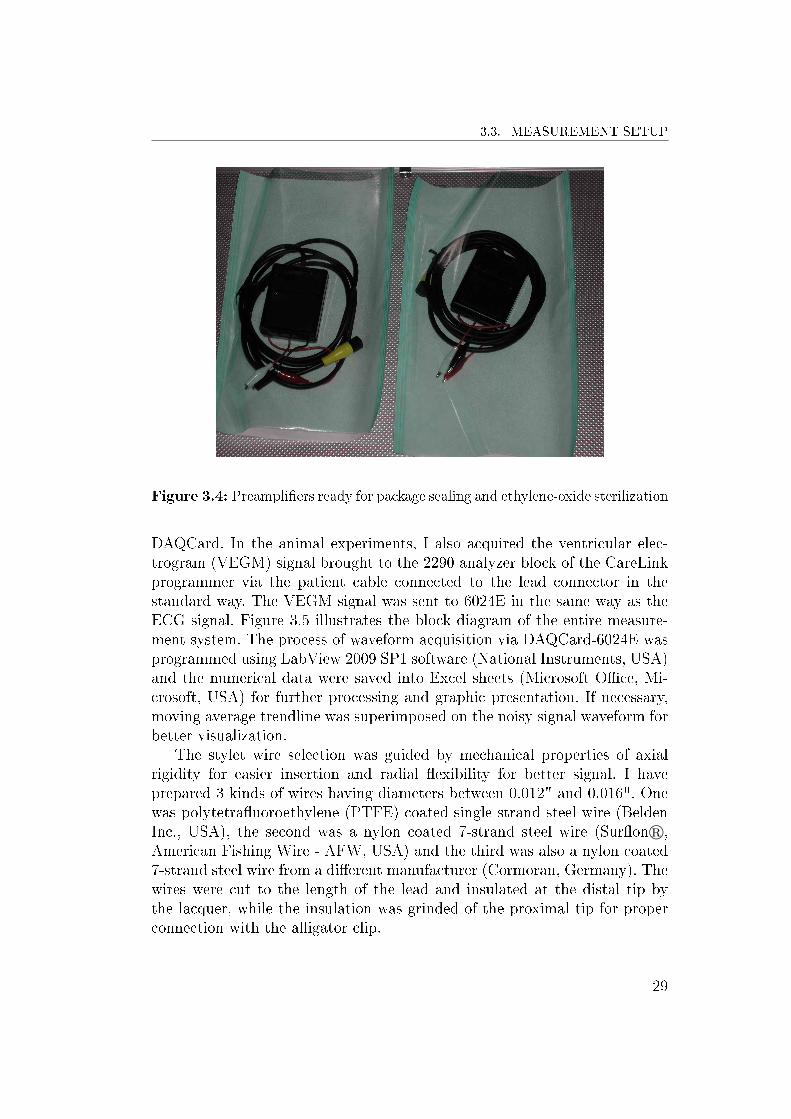
Each of the six pre-amplier enclosures has two short alligator clips protrud-ing out of the box for input connections of the charge amplier and the thirdfor the guard drive skin connection. The pre-amplier boxes were sterilizedbefore their usage in the operative sterile eld next to the pacing lead in-sertion position in the right pectoral region of the patient (Figure 3.4). Thisposition helped in minimizing the noise that would have been created onlonger connection cables as well as in improving the simulation of the realsituation in which the sensor circuit would be contained in an implantabledevice normally placed in the very same region of the thorax.
The sterile enclosure was connected via a long sterile patient cable to thenon-sterile dual channel isolation box. The output signal of the isolation boxwas sent via a coaxial cable towards the National Instruments connector blockand further to the PCMCIA acquisition card (DAQCard-6024E, NationalInstruments, USA) inserted in Precision M6400 mobile workstation (Dell,USA).
The patient ECG cable was connected to the 2090 CareLink pacemakerprogrammer (Medtronic, USA) and the signal was acquired to the laptopvia the analog input/output box (2090AB, Medtronic, USA) using the same
28
3.3. MEASUREMENT SETUP
Figure 3.4: Preampliers ready for package sealing and ethylene-oxide sterilization
DAQCard. In the animal experiments, I also acquired the ventricular elec-trogram (VEGM) signal brought to the 2290 analyzer block of the CareLinkprogrammer via the patient cable connected to the lead connector in thestandard way. The VEGM signal was sent to 6024E in the same way as theECG signal. Figure 3.5 illustrates the block diagram of the entire measure-ment system. The process of waveform acquisition via DAQCard-6024E wasprogrammed using LabView 2009 SP1 software (National Instruments, USA)and the numerical data were saved into Excel sheets (Microsoft Oce, Mi-crosoft, USA) for further processing and graphic presentation. If necessary,moving average trendline was superimposed on the noisy signal waveform forbetter visualization.
The stylet wire selection was guided by mechanical properties of axialrigidity for easier insertion and radial exibility for better signal. I haveprepared 3 kinds of wires having diameters between 0.012" and 0.016". Onewas polytetrauoroethylene (PTFE) coated single strand steel wire (BeldenInc., USA), the second was a nylon coated 7-strand steel wire (Suronr,American Fishing Wire - AFW, USA) and the third was also a nylon coated7-strand steel wire from a dierent manufacturer (Cormoran, Germany). Thewires were cut to the length of the lead and insulated at the distal tip bythe lacquer, while the insulation was grinded of the proximal tip for properconnection with the alligator clip.
29

CHAPTER 3. TRIBOELECTRIC SENSOR
Figure 3.5: Triboelectric sensor - measurement setup
30

3.4. ACUTE ANIMAL EXPERIMENTS
3.4 Acute Animal Experiments
3.4.1 Methods and Materials
The acute animal experiments have been performed at the Faculty of Vet-erinary Medicine in Zagreb, Croatia, in collaboration with a cardiologist asimplanting physician and two veterinarians. The measurement system wastested in eight sheep (42 ± 6 kg) at baseline and during acute hemodynamicinterventions: dobutamine infusion up to 15 µg/kg/min. The goal was toachieve a heart rate of minimum 160 beats/minute and not to exceed 220beats/minute.
After premedication with xylazine (0.1 mg/kg), ketamine (5 mg/kg) andbutorphanol (0.1 mg/kg) we proceeded to oral intubation. General anesthe-sia was inducted with sodium thiopenthal (5-10 mg/kg) and maintained withsevoourane using the S/5 Aespire anesthesia delivery system (GE Health-care, UK).
Three dierent types of custom-made leads have been implanted in thesheep. The rst one was a modied ICD lead, the second was a two-dottricuspid valve ow velocity measurement lead and the third type was a6-ring blood-ow sensor lead.
In ve sheep we have implanted the custom-made ICD lead shown inFigure 3.6. It is a modied Sprint Quattro Secure S 6935 active-xationsingle-coil ICD lead (Medtronic, USA). A standard 7x7 lead conductor (7bundles of 7 wires) made of MP35N nickel alloy was inserted into the other-wise empty lead body lumen used for the second high-voltage (HV) cable in adual-coil lead. The 7x7 conductor was inserted as far as possible towards thedistal portion of the right ventricular coil electrode. A standard DF-1 con-nector was attached on the proximal end of the cable obtaining a connectionfor the dead-end isolated conductor.
In two sheep we have implanted the custom-made 2-microdot electrodeslead designed for measurement of tricuspid blood ow. It is a straight siliconelead with 2 internal wires connected to the respective platinum dots havingdiameter 1 µm positioned on the surface of the epoxy bead. The epoxy beadis placed on the lead body in the position to be within the tricuspid valvewhen the tip is within the apex (Figure 3.7).
In one sheep we have implanted the custom-made six-ring lead originallydesigned for measurement of blood ow (Figure 3.8). Each electrode has itsown proximal connector which made possible the testing of dierent mea-surement vectors. There is a mutual distance of 10 mm between the ringelectrodes.
The lead insertion was done through the left jugular vein using a 9 or 10
31

CHAPTER 3. TRIBOELECTRIC SENSOR
Figure 3.6: Custom-made ICD lead used for animal experiments. White arrowpoints to the RV high-voltage coil. Looking from left to right, the connectors belongto the RV coil, the pace/sense conductor and the dead-end conductor normally usedfor SVC HV coil in dual-coil leads.
Figure 3.7: Custom-made 2-microdot electrodes lead for tricuspid ow measure-ment. (1) - connectors for wires leading to the platinum dots (3) positioned in thetricuspid valve; (2) - connector for the dead-end lead.
French (Fr) lead introducer (Medtronic Solo-Trak PLI) in ve animals withICD leads or by direct venous cut-down in the remaining three sheep. Theleads were positioned in the apex of the right ventricle using uoroscopy. Fivecustom-made ICD leads were screwed in the RV apex, while the custom-madesix-ring electrode lead had a passive xation system. Two-dot leads did nothave a dedicated xation system. The epoxy bead was oating rather freelyin the ventricle within the tricuspid valve as the tip of the lead has beenadvanced into the RV apex.
32

3.4. ACUTE ANIMAL EXPERIMENTS
Figure 3.8: Custom-made 6-ring lead used for animal experiments. The tip ispositioned in RV apex. The ring electrodes are equally spaced and positioned inRA and in the tricuspid valve.
3.4.2 Results
The rst ve acute ovine experiments have been performed using the custom-made ICD lead and I have measured the signal between dierent triboelectricpairs.
The best results were obtained between the pace/sense coil conductor andthe specially added 7x7 dead-end conductor. In this case, the materials in-cluded in the triboelectric series are MP35N nickel alloy for both conductors,PTFE as a redundant coating for the coil conductor and the inner siliconeinsulation forming the lead body [38]. Silicone and Teon are considered verynegative in the triboelectric series and, as such, are very distant from nickelthat is also positioned in the negative series but much closer to the materi-als with no charge. The distance in the triboelectric series ensures a biggercharge transfer between the materials and, consequently, better signal in thetriboelectric sensor (TBS). Figures 3.9 and 3.10 show the triboelectric sensorsignal (TS), ECG and intracardiac electrogram (EGM) obtained in the samesheep in sinus rhythm with 105 beats/minute (bpm) and during dobutamineinfusion with 195 bpm. The peak-to-peak amplitude of the triboelectric sig-nal was around 1.5 V for sinus rhythm and 2.5 V during the acceleratedrhythm which corresponds, respectively, to the charge of 333 picoCoulombs
33

CHAPTER 3. TRIBOELECTRIC SENSOR
peak-to-peak (pCpp) and 555 pCpp.
Figure 3.9: Triboelectric signal acquired during sinus rhythm (around 105 bpm)between the pace/sense conductor and the dead-end conductor.
Power spectral density (PSD) of TS between the pace/sense conductorand the dead-end lead was computed for 32 seconds long sequences in all 5sheep both in sinus rhythm and during the accelerated rhythm (Figure 3.11).The frequency was normalized (fnorm) to the fundamental ECG frequency,i.e. to the heart rate during each of the recorded sequences. Most of thepower is condensed around the fundamental ECG frequency and its multiples.After the third multiple, PSD amplitudes drop quickly towards extremely lowvalues.
The peak values of PSD at fnorm = 1 vary from 8.5 to 541 W/Hz be-tween sequences with no correlation to the contractility, i.e. the dobutamineinfusion. For a better visualization, PSD values in the graph are shown nor-malized to the peak value obtained at fnorm = 1.
TS frequency content is highly correlated to the ECG frequency spectrumand is representative of myocardial contractions. Taking into account thatthe highest expected heart rates are around 300 bpm which corresponds tothe ECG frequency of 5 Hz and knowing that PSD is very low after itsthird multiple, we can conclude that the low-pass cut-o of the measurementsystem at 16 Hz is adequate for this type of measurements.
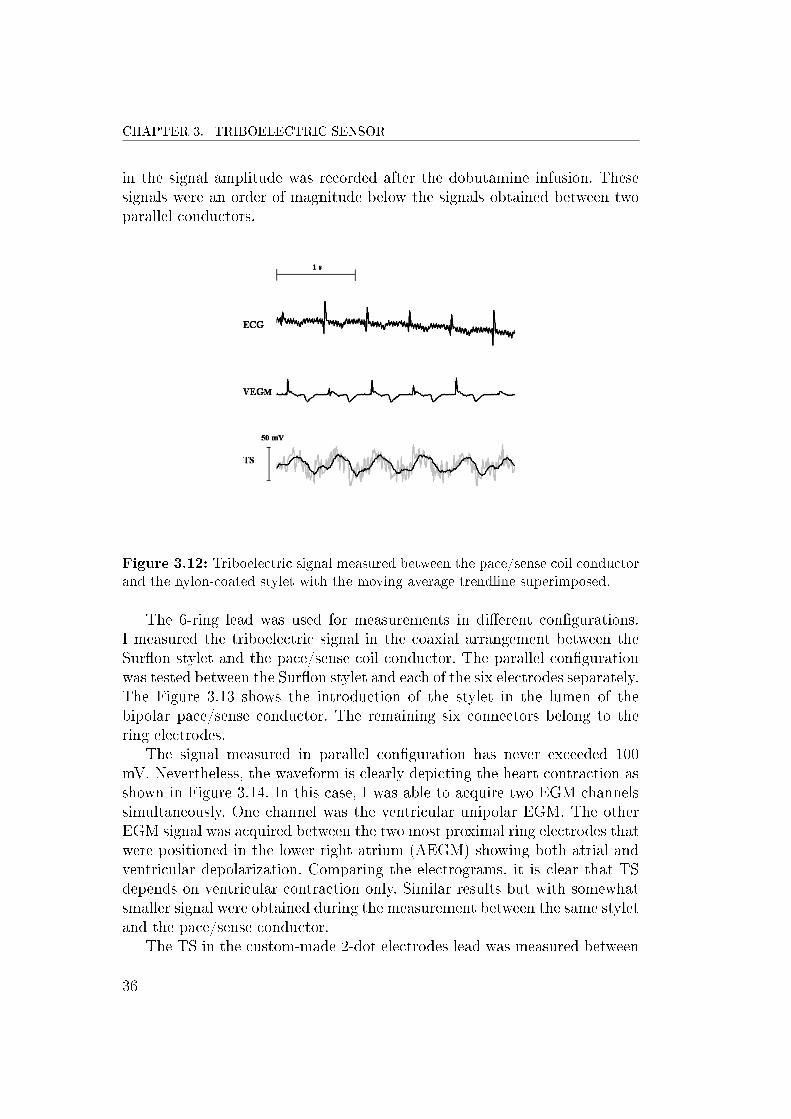
The signal amplitude was much smaller when measured between thepace/sense coil conductor and a custom-made stylet in coaxial arrangement.I have used two types of stylets: Suron by AFW and nylon-coated by Cor-moran. The waveforms obtained with Suron stylet were achieving maximumlevel of 50 mV peak-to-peak and in the case of nylon these values were some-what bigger up to 80 mV as shown in Figure 3.12. A very small increase
34

3.4. ACUTE ANIMAL EXPERIMENTS
Figure 3.10: Triboelectric signal acquired during dobutamine infusion (around195 bpm) between the pace/sense conductor and the dead-end conductor.
Figure 3.11: Power spectral density for sequences obtained between thepace/sense conductor and the dead-end conductor of the ICD lead.
35
CHAPTER 3. TRIBOELECTRIC SENSOR
in the signal amplitude was recorded after the dobutamine infusion. Thesesignals were an order of magnitude below the signals obtained between twoparallel conductors.
Figure 3.12: Triboelectric signal measured between the pace/sense coil conductorand the nylon-coated stylet with the moving average trendline superimposed.
The 6-ring lead was used for measurements in dierent congurations.I measured the triboelectric signal in the coaxial arrangement between theSuron stylet and the pace/sense coil conductor. The parallel congurationwas tested between the Suron stylet and each of the six electrodes separately.The Figure 3.13 shows the introduction of the stylet in the lumen of thebipolar pace/sense conductor. The remaining six connectors belong to thering electrodes.
The signal measured in parallel conguration has never exceeded 100mV. Nevertheless, the waveform is clearly depicting the heart contraction asshown in Figure 3.14. In this case, I was able to acquire two EGM channelssimultaneously. One channel was the ventricular unipolar EGM. The otherEGM signal was acquired between the two most proximal ring electrodes thatwere positioned in the lower right atrium (AEGM) showing both atrial andventricular depolarization. Comparing the electrograms, it is clear that TSdepends on ventricular contraction only. Similar results but with somewhatsmaller signal were obtained during the measurement between the same styletand the pace/sense conductor.
The TS in the custom-made 2-dot electrodes lead was measured between
36

3.4. ACUTE ANIMAL EXPERIMENTS
Figure 3.13: The implanter is introducing the stylet in the lumen of the pace/senseconductor of the 6-ring lead. The remaining six connectors belong to the ringelectrodes.
Figure 3.14: Triboelectric signal in the 6-ring lead measured between the Suronstylet and the conductor belonging to the middle 3rd ring electrode. The movingaverage trendline is superimposed.
37

CHAPTER 3. TRIBOELECTRIC SENSOR
one of the conductors connected to the dot on the epoxy bead and the dead-end conductor. The signal was clearly representing the ventricular contractionbut its amplitude was an order of magnitude lower compared to the signalmeasured in the 6-ring lead.
In spite of smaller amplitudes of TS measured using the stylet comparedto the case of TS acquired between the pace/sense conductor and the dead-end conductor in the ICD leads, the frequency content was pretty much thesame in all sequences. As expected, PSD peak values were much smaller inthe case of stylets and were all in the range between 1 and 80 mW/Hz.
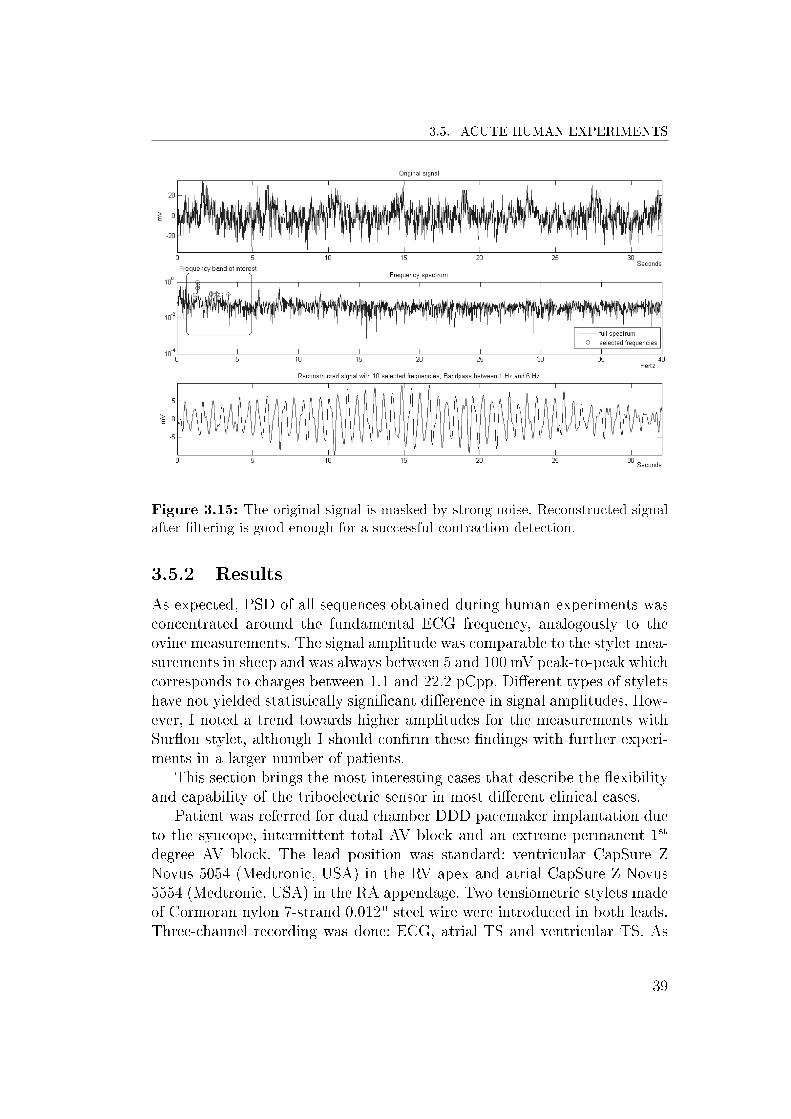
In most of the cases, there was no need to additionally lter the acquiredsignal as the waveforms were clear. However, in some cases the waveformswere not recognizable at all due to a very low signal-to-noise ratio. The worstcase is shown in Fig. 3.15. This waveform was acquired between the nylonstylet and the pace/sense conductor of the ICD lead with a very low peak-to-peak amplitude and the noise completely masking the signal. I calculatedthe FFT of the signal and used a selected subset of the frequencies between 1and 6 Hz for signal reconstruction that resulted in a waveform representativeof myocardial contractions. In this case, SNR was -7.5 dB as the signal powerwas very low. Nevertheless, by simple ltering which is ordinarily done forEGM signals in the implantable devices, I was able to obtain the signal thatwas good enough for the nal purpose of contraction detection. In morefavorable cases, it was even not necessary to lter the signal for successfulcontraction detection and SNR exceeded 30 dB.
3.5 Acute Human Experiments
3.5.1 Methods and Materials
The acute human experiments have been performed using the standard pac-ing leads during regular primary implantations or replacements of pacemak-ers and ICDs under local anesthesia. Therefore, I acquired the triboelectricsensor signal in both newly implanted leads and chronically positioned leads.All measurements prolonged the normal testing procedure for maximum 10minutes. The measurement system was tested in 18 patients at baseline andduring paced rhythms. I was able to observe the sensor response in dierentunderlying rhythms - atrial brillation (AF) with bradyarrhythmia, atrioven-tricular blocks of dierent grades, and sinus bradycardia. The measurementsetup was identical to the animal studies and is thoroughly described in Sec-tion 3.4.1.
38
3.5. ACUTE HUMAN EXPERIMENTS
Figure 3.15: The original signal is masked by strong noise. Reconstructed signalafter ltering is good enough for a successful contraction detection.
3.5.2 Results
As expected, PSD of all sequences obtained during human experiments wasconcentrated around the fundamental ECG frequency, analogously to theovine measurements. The signal amplitude was comparable to the stylet mea-surements in sheep and was always between 5 and 100 mV peak-to-peak whichcorresponds to charges between 1.1 and 22.2 pCpp. Dierent types of styletshave not yielded statistically signicant dierence in signal amplitudes. How-ever, I noted a trend towards higher amplitudes for the measurements withSuron stylet, although I should conrm these ndings with further experi-ments in a larger number of patients.
This section brings the most interesting cases that describe the exibilityand capability of the triboelectric sensor in most dierent clinical cases.
Patient was referred for dual chamber DDD pacemaker implantation dueto the syncope, intermittent total AV block and an extreme permanent 1st
degree AV block. The lead position was standard: ventricular CapSure ZNovus 5054 (Medtronic, USA) in the RV apex and atrial CapSure Z Novus5554 (Medtronic, USA) in the RA appendage. Two tensiometric stylets madeof Cormoran nylon 7-strand 0.012" steel wire were introduced in both leads.Three-channel recording was done: ECG, atrial TS and ventricular TS. As
39

CHAPTER 3. TRIBOELECTRIC SENSOR
the waveforms were relatively clear, the signals were not ltered and onlythe moving average trendline was added within the Excel chart for easierinterpretation. Figure 3.16 shows that the atrial waveform had much loweramplitude relatively to the ventricular. This is obviously due to the lowermagnitude of the lead bending, a result consistently conrmed throughoutthe experiment on other patients.
Figure 3.16: Triboelectric signal measured in atrial (ATS) and ventricular (VTS)channel using the nylon stylets.
A male underwent the implantation of the single lead VDD pacing systemdue to the intermittent total AV block and permanent 2nd degree AV block.The Medtronic lead CapSure VDD-2 5038, having 13.5 cm interelectrode dis-tance was implanted. Figure 3.17 discloses ECG and TS which exhibits threemajor waves. The rst one is due to the atrial contraction that follows the Pwave. The second wave corresponds to the ventricular contraction followingthe QRS wave. The third one has the largest amplitude and follows the Pwave that is not conducted to the ventricle. Comparing the signal to theuoroscopy movie, I concluded that the lead bending in the non-conductedatrial contraction has greater amplitude than during the conducted atrialcontraction followed by the ventricular contraction. This is due to a lessconstricted movement of the lead in case of absence of the ventricular con-traction. In that situation the lead exhibits a complete displacement withoutbeing pulled back by the ventricular contraction.
Implantation of a dual chamber pacemaker was done. Figure 3.18 showsthe oscilloscope measurements (Waverunner LT342, LeCroy, USA) for the
40

3.5. ACUTE HUMAN EXPERIMENTS
Figure 3.17: AV block Mobitz 2nd degree. Triboelectric signal in the VDD leadwith the nylon-stylet. Non-conducted P-waves produce larger triboelectric signalscompared to conducted atrial depolarization.
passive ventricular lead CapSure Z Novus 5054 (Medtronic, USA) positionedwithin the RV apex. The patient was in supraventricular tachycardia. Thenegative slope of the tensiometric signal was caused by the contraction andconsequent bending of the lead, while the positive slope of the tensiometricsignal was caused by the relaxation and consequent elongation of the lead.Similar to the previous case, a shorter coupling interval causes the decrease ofTS amplitude due to the lower magnitude of the lead bending and vice versafor longer coupling intervals. Electromechanical dissociation is demonstratedin Figure 3.19 wherein the fourth QRS complex is not followed by the cardiaccontraction. The seventh QRS complex has a very short coupling interval thatresults in signicant contraction impairment with small TS amplitude.
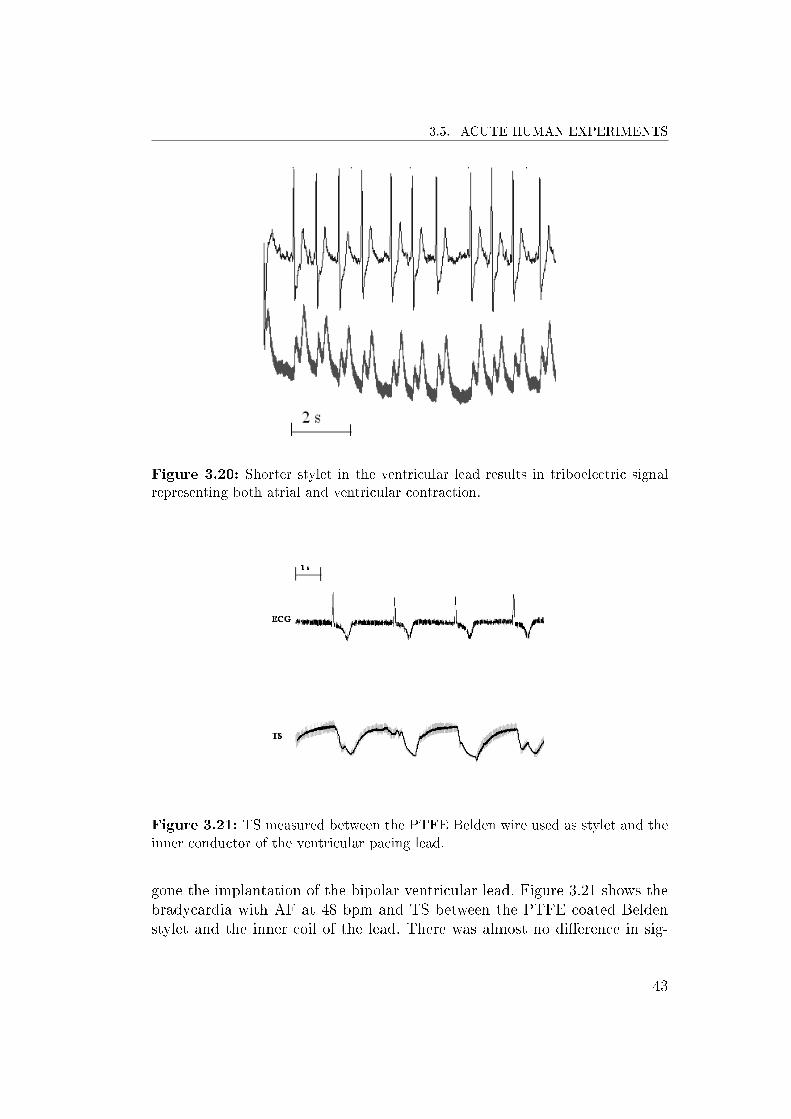
Another patient underwent an implantation of a ventricular lead. In thiscase, a Belden PTFE coated wire was inserted in the stylet channel butit was too short to be inserted distally until the lead tip implanted withinthe ventricular apex. As shown in Figure 3.20, TS exhibits two waves, onecaused by the atrial contraction and the other caused by the ventricularcontraction. This is obviously another characteristic of the sensor that couldmarkedly improve the proposed method of AV interval regulation utilizing thePeak Endocardial Acceleration (PEA) sensor [27]. However, the amplitudeof TS was much smaller compared to the case of the sensor in ventricularposition. As in the cases described above, it is most probably due to a smallermagnitude of the lead bending in the region where the stylet was positioned.
A patient had a bipolar temporary lead urgently implanted and connectedto an external pacemaker due to the syncope. Successively, she has under-
41

CHAPTER 3. TRIBOELECTRIC SENSOR
Figure 3.18: Shorter coupling interval causes the decrease of TS amplitude.
Figure 3.19: Electromechanical dissociation at the 4th QRS complex and thedecrease of TS amplitude in a shorter coupling interval after the 6th QRS complex.
42
3.5. ACUTE HUMAN EXPERIMENTS
Figure 3.20: Shorter stylet in the ventricular lead results in triboelectric signalrepresenting both atrial and ventricular contraction.
Figure 3.21: TS measured between the PTFE Belden wire used as stylet and theinner conductor of the ventricular pacing lead.
gone the implantation of the bipolar ventricular lead. Figure 3.21 shows thebradycardia with AF at 48 bpm and TS between the PTFE coated Beldenstylet and the inner coil of the lead. There was almost no dierence in sig-
43

CHAPTER 3. TRIBOELECTRIC SENSOR
Figure 3.22: TS signal during pacing has a much dierent morphology comparedto the sinus rhythm. Loss of capture was correctly identied after the 3rd QRScomplex.
nal when the amplier's input was connected to the outer conductor of thecoaxial bipolar lead. As expected, paced QRS complexes in Figure 3.22 havea signicantly dierent morphology on the ECG trace compared to sinusrhythm in previous traces. A dierent contraction pattern, following a post-pacing depolarization propagating from the RV apex, results in a completelydierent TS showing its sensitivity to dierent contraction course. Successivedecrease of the pacing current caused intermittent capture. Loss of captureoccurs after the fourth spike in Figure 3.22. There is no TS wave after theloss of capture event. In this case, the signal was recorded between the styletand the outer coil of the bipolar lead.
3.6 Conclusions and Possible Extensions
The above described experiments proved that the triboelectric sensor func-tions acutely in humans and in animals and that it functions in chronicallyimplanted leads in humans. In the ovine experiments, the stylets have beenleft in the implanted leads for chronic evaluation of the sensor. Next mea-surements in sheep are scheduled after four months and after one year, inorder to evaluate the long term stability of the sensor.
In most of the cases, the deection of the ventricular lead occurred in
44

3.6. CONCLUSIONS AND POSSIBLE EXTENSIONS
its distal portion at the curvature within the tricuspid valve. Cardiac con-tractions pulled the right ventricular segment of the lead in cranial directionthereby exing the tricuspid and low atrial segments of the lead. Dierentpositions of the lead tip implantation yielded dierent lead deection anddierent signal magnitude. Periodic variation of the tensiometric signal ex-actly corresponds to the periodic variation of the bending curve of the leadwithin the right ventricle.
In the future experiments, I will have to correlate the bending curve geom-etry change on the uoroscopy with the sensor's signal waveform as dierentanatomic positions of the lead tip yield dierent TS waveforms. The sensormay denitively be used in capture management and tachycardia detectionalgorithms. If it reveals the long-term stability, it will also be feasible for CRThemodynamic optimization and heart failure monitoring. Its clinical utilitymay be extended to rate responsive pacing and vasovagal syncope predictionalgorithms.
45

Chapter 4
High Frequency Parameters of
Pacing Leads
4.1 Introduction
The majority of the existing hemodynamic sensors requires a special lead orthe considerable amount of additional hardware. This impedes the sensors tobe widely used in existing pacing systems. In order to overcome the problemconcerning the building of specic leads, Ferek-Petric proposed a universalhemodynamic sensor based on high-frequency (HF) properties of the pacinglead seen as a transmission line [39].
The myocardial contraction causes the lead to bend. The exion of thelead immediately changes its geometry and impedance. An accurate mea-surement of the HF impedance or any other characteristic dependent on HFimpedance such as reection or transmission coecient, can precisely de-scribe the cardiac contraction. In vitro experiments conducted by our groupshowed that such measurements can be easily performed on any cardiac leadhaving at least two conductors that are parallel, helicoidal (co-radial) or coax-ial. The main concern is the chronic stability of the HF characteristics in thehostile environment constituted of human body and its liquids.
The rst step in the study consisted in the measurement of the propaga-tion speed of the signal in the range of 1-21 MHz within the cardiac lead.This rst phase also consisted in the measurement of HF characteristics suchas impedance and attenuation coecient of unused dry leads [37], [40]. Afterthe measurements, the leads have been immersed in saline solution for morethan 10 years simulating the human body environment.
I repeated the experiments subsequently to the lead extraction from thephysiologic solution. I wanted to determine the type and amount of chronic
47

CHAPTER 4. HIGH FREQUENCY PARAMETERS OF PACING LEADS
alterations in the lead structure observable in terms of variation of their HFcharacteristics. I have also measured the same physical quantities in a numberof dry new pacing leads in order to compare their HF characteristics to thosepertinent to the old leads [40]. These new leads will also be immersed insaline for some time. The alterations due to the penetration of the physiologicsolution will need to be revalued at the end of that period.
4.1.1 Transmission Line
An electrical lead can transmit electrical signals at high speed which canapproach large fractions of the speed of light. If the length of the lead athigh frequency signals becomes comparable to the wavelength, the lead can beconsidered electrically long. In such a case the lead can not be described withlumped parameters, but must be considered as a transmission line with itscharacteristic impedance. The wavelength λ (m) for a lead can be calculatedas:
λ =v
f(4.1)
where v (m/s) is the propagation speed of the wave in the transmission lineand f (Hz) is the frequency of the signal [37].
The transmission line impedance at a particular frequency is dened asthe ratio between voltage and current of both forward and reected wave atthe same frequency. The sending-end impedance is dened as
Z = Z0 ·ZR + Z0 · tanh(γ · d)
Z0 + ZR · tanh(γ · d)(4.2)
where Z0 is the characteristic impedance of the line of length d, ZR is thereceiving-end load impedance and the propagation constant γ is a measureof the change undergone by the amplitude of the wave as it propagates ina given direction. The constant γ depends on the ratio between transmittedand incident wave voltages and it can be dened for any point x along thetransmission line [41]:
VtransmittedVincident
= e−γ·x = e−(α+jβ)·x (4.3)
48
4.2. PREVIOUS ACUTE EXPERIMENTS
The real part α of the propagation constant corresponds to the attenuationcoecient expressed in Neper/meter (Np/m) that describes the rate of atten-uation of the propagation wave on a lossy transmission line. The imaginarypart of γ is the phase constant β that reects the wave nature of a high-frequency wave along the transmission line with its maxima and minima[42]. The impedance of a line long d meters in open and short termination isobtained from 4.2 considering ZR equal to innity for an open line or equalto zero for a short termination:
Zopen =Z0
tanh(γ · d)(4.4)
Zshort = Z0 · tanh(γ · d) (4.5)
The characteristic impedance Z0 can be easily obtained from previous equa-tions 4.4 and 4.5:
Z0 =√Zopen · Zshort (4.6)
Accordingly, propagation constant γ is obtained from
tanh(γ · d) =
√ZshortZopen
(4.7)
4.2 Previous Acute Experiments
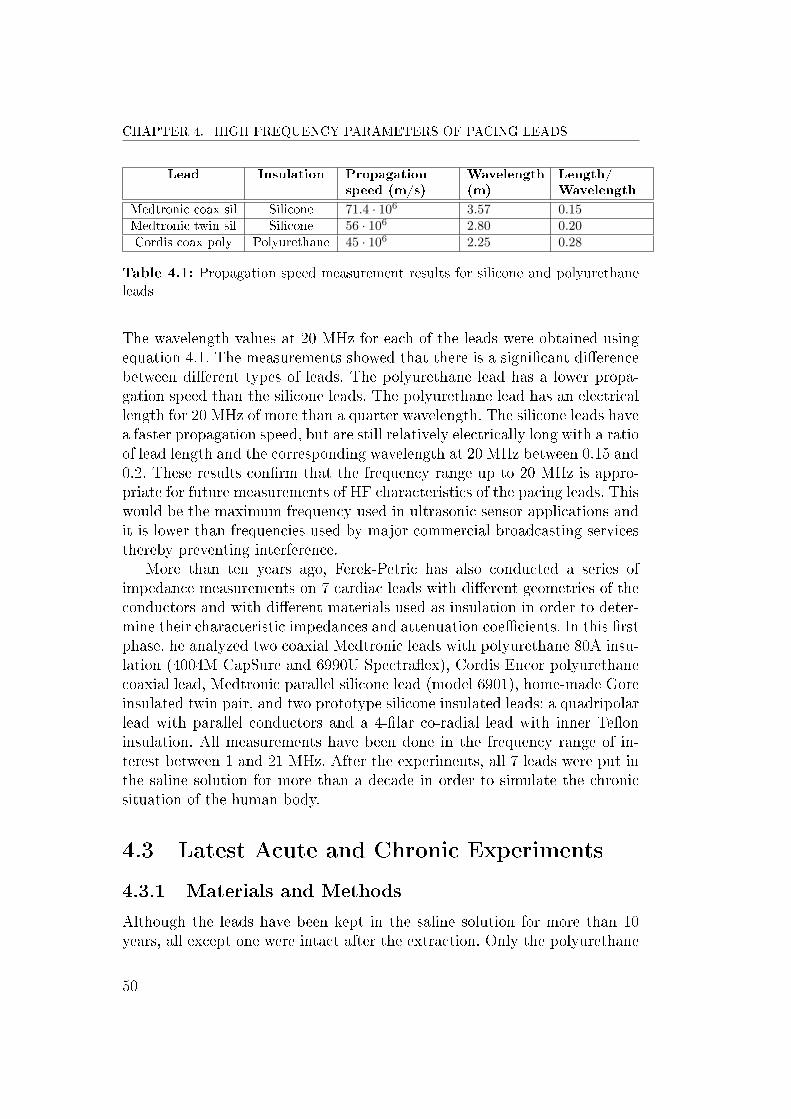
The rst experiments carried out by Ferek-Petric [37] consisted in measuringthe propagation time of the wave at the frequency of 20 MHz in 3 cardiacpacing leads with dierent geometries and insulation materials (Table 4.1):
• Medtronic coax sil is a coaxial bipolar conductor of a pacing lead withsilicone insulation produced by Medtronic, USA.
• Cordis coax poly is a coaxial bipolar lead conductor with polyurethaneinsulation by Cordis, USA.
• Medtronic twin silicone is a silicone lead with parallel conductors.
49
CHAPTER 4. HIGH FREQUENCY PARAMETERS OF PACING LEADS
Lead Insulation Propagationspeed (m/s)
Wavelength(m)
Length/Wavelength
Medtronic coax sil Silicone 71.4 · 106 3.57 0.15Medtronic twin sil Silicone 56 · 106 2.80 0.20Cordis coax poly Polyurethane 45 · 106 2.25 0.28
Table 4.1: Propagation speed measurement results for silicone and polyurethaneleads
The wavelength values at 20 MHz for each of the leads were obtained usingequation 4.1. The measurements showed that there is a signicant dierencebetween dierent types of leads. The polyurethane lead has a lower propa-gation speed than the silicone leads. The polyurethane lead has an electricallength for 20 MHz of more than a quarter wavelength. The silicone leads havea faster propagation speed, but are still relatively electrically long with a ratioof lead length and the corresponding wavelength at 20 MHz between 0.15 and0.2. These results conrm that the frequency range up to 20 MHz is appro-priate for future measurements of HF characteristics of the pacing leads. Thiswould be the maximum frequency used in ultrasonic sensor applications andit is lower than frequencies used by major commercial broadcasting servicesthereby preventing interference.
More than ten years ago, Ferek-Petric has also conducted a series ofimpedance measurements on 7 cardiac leads with dierent geometries of theconductors and with dierent materials used as insulation in order to deter-mine their characteristic impedances and attenuation coecients. In this rstphase, he analyzed two coaxial Medtronic leads with polyurethane 80A insu-lation (4004M CapSure and 6990U Spectraex), Cordis Encor polyurethanecoaxial lead, Medtronic parallel silicone lead (model 6901), home-made Goreinsulated twin pair, and two prototype silicone insulated leads: a quadripolarlead with parallel conductors and a 4-lar co-radial lead with inner Teoninsulation. All measurements have been done in the frequency range of in-terest between 1 and 21 MHz. After the experiments, all 7 leads were put inthe saline solution for more than a decade in order to simulate the chronicsituation of the human body.
4.3 Latest Acute and Chronic Experiments
4.3.1 Materials and Methods
Although the leads have been kept in the saline solution for more than 10years, all except one were intact after the extraction. Only the polyurethane
50

4.3. LATEST ACUTE AND CHRONIC EXPERIMENTS
Spectraex lead was visibly corroded. This was most probably due to thechemical process of metal ion oxidation (MIO) typical for polyurethane insu-lated leads. In fact, a metal ion that comes in contact with body uids andthe polyurethane, catalyzes an oxidative chemical degradation of the insula-tion material. This has caused a lot of unexpected lead failures in the rstyears after the introduction of polyurethane as an insulation material.
In order to revalue the characteristic impedances and the attenuation co-ecients in the same frequency range from 1 MHz to 21 MHz for these 7leads, I used a network analyzer (3577B, Hewlett-Packard, USA) in combi-nation with the 35676B Reection/Transmission Test Kit (Hewlett-Packard,USA). The measurement data were uploaded to a laptop through the GPIBinterface of the network analyzer and using the National Instruments GPIBExpress Card. The programming code for the upload of measured data waswritten in Matlab software (MathWorks, USA) and the data were saved intoExcel sheets for further analysis. All successive calculations were also donein Matlab.
For reection mode measurements, the proximal pacing lead connectorpins were connected by miniature alligator clips to a short 75-ohm RG-59coaxial cable and, through a 75-ohm N-type connector, to the test port ofthe 35676B reection kit. Before taking measurements, I performed one portfull calibration procedure of the connecting system at the frequency rangeof interest with open, short and 75 ohm reference load. In order to calcu-late the characteristic impedance Z0 of the pacing lead, open and short-endimpedances (Zopen and Zshort) were calculated from the respective reectioncoecient Γ measured directly with the 35676B kit:
Γopen/short =VreflectedVincident
=Zopen/short − Z0,line
Zopen/short + Z0,line
(4.8)
where Vreflected and Vincident are reected and incident voltage in respect tothe device under test (DUT) which in this case corresponds to the pacing lead[37], [42], [43]. Z0,line is the characteristic impedance of the test connectionsystem that was already calibrated to 75 ohm. The pacing lead characteristicimpedance Z0 was calculated using equation 4.6.
In order to obtain the values of the attenuation coecient for the leads,I had to perform the transmission mode measurements. This procedure re-quires two ports instead of only one in the previous case of reection measure-ment setup. The proximal lead connectors were connected in the same wayas for the reection coecient measurement. The distal electrodes were con-nected by alligator clips to a short 50-ohm RG-58 coaxial cable and, through
51

CHAPTER 4. HIGH FREQUENCY PARAMETERS OF PACING LEADS
Figure 4.1: Straight and J-shaped pacing lead - photo courtesy of Medtronic
a 50-ohm N-type connector, to the receiver port B of the network analyzer.The calibration of the system is much simpler in this case, as it can be doneby shorting the respective input and output alligator clips. I measured thelinear ratio gain or transmission coecient dened as
T =VtransmittedVincident
= e−γ·d = e−(α+jβ)·d (4.9)
where Vtransmitted and Vincident are transmitted and incident voltages in respectto the pacing lead of length d and γ is the propagation constant [37], [42], [43].The attenuation coecient α (Np/m) was easily calculated from equation 4.9:
α =1
d· ln 1
τ(4.10)
where τ is the module of the transmission coecient T.All above measurements have been carried out on 7 leads kept in saline
solution for more than a decade. The same measurements have also beendone for 13 new pacing leads and 2 high-voltage debrillator leads (mod-els 6944 and 6947) produced by Medtronic (USA) and shown in Table 4.2.These leads have never been soaked into the saline solution and I examinedthe inuence of lead shape (Fig. 4.1), conductor geometry (Fig. 4.2), andinsulation material on high-frequency parameters of these leads.
4.3.2 Results
Considering the old leads kept in saline, the Figures 4.3 and 4.4 show that thepenetration of the saline within the leads through the period of a decade did
52

4.3. LATEST ACUTE AND CHRONIC EXPERIMENTS
Figure 4.2: Dierent types of lead design: Coaxial, parallel and co-radial conduc-tors (from left to right) - photo courtesy of Medtronic
Lead Lead Name Shape Type Outer Insulation Inner Insulation
3830 SelectSecure Straight Coaxial Polyurethane(55D) Silicone(4719)/ETFE4092 CapSure SP Novus Straight Coaxial Polyurethane(55D) Silicone(4719)4194 Attain OTW Canted Coaxial Polyurethane(55D) Silicone4196 Attain Ability Canted Co-radial Polyurethane(55D) Silicone polyimide4396 Attain Ability Straight Straight Co-radial Polyurethane(55D) Silicone polyimide4574 CapSure Sense J-shaped Coaxial Polyurethane(55D) Silicone(4719)4592 CapSure SP Novus J-shaped Coaxial Polyurethane(55D) Silicone(4719)5038 CapSure VDD2 Straight Parallel Silicone(MDX) /5054 CapSure Z Novus Straight Coaxial Silicone(4719) Silicone(4719)5076 CapSureFix Novus Straight Coaxial Silicone(4719) Silicone(4719)5092 CapSure SP Novus Straight Coaxial Silicone(4719) Silicone(4719)5568 CapSureFix J-shaped Coaxial Silicone(MDX) Silicone(MDX)5592 CapSure SP Novus J-shaped Coaxial Silicone(4719) Silicone(4719)6944 Sprint Quattro Straight Parallel Polyurethane(55D,80A) Silicone(4755)6947 Sprint Quattro Secure Straight Parallel Polyurethane(55D,80A) Silicone(4755)
Table 4.2: New pacing and debrillation leads (ETFE - Ethylene tetrauoroethy-lene, Silicone MDX - Medical grade silicone, Silicone 4719 and 4755 - High perfor-mance silicone elastomer)
53

CHAPTER 4. HIGH FREQUENCY PARAMETERS OF PACING LEADS
not inuence much the HF characteristics of the leads, mainly the attenuationcoecient. This is a very important nding because of the primary intentionto use the HF lead measurements in chronically implanted leads. In fact, ifused as a lead bending sensor, penetration of the body uid will not aectits performance. If used in congestive heart failure monitoring, whereby long-term deterioration of cardiac muscle forces will be measured, the modulationof HF parameters by uid penetration may be taken into account. For thatpurpose, a chronic study has to be done for specic lead conductor in order todetermine timely change of the HF lead parameters. If used as a connectingcable of an ultrasonic sensor, there will be no signicant increase of thebattery drain in the implanted device due to the increased line losses.
Figure 4.3: Comparison of characteristic impedance values at 5, 10 and 20 MHzfor dry old leads (10 years ago) and after being kept in saline for a decade.
Fifteen new leads showed similar values of characteristic impedance andattenuation compared to the old leads. The curves of the characteristicimpedance Z0 in the frequency range from 1 to 21 MHz shown in Figure4.5 follow the typical theoretical rule of asymptotical approach towards axed value at higher frequencies. All asymptotic values are in the range from70 Ω for the coaxial 4574 lead to 240 Ω for the parallel line of the 6944debrillation lead formed by one of the low-voltage pacing conductors andthe longer high-voltage conductor positioned in the right ventricle. The mea-surements showed that, in general, the parallel leads have higher values of Z0
compared to the coaxial leads. These experimental data agree with theoret-ical results that in general conrm higher values of characteristic impedance
54

4.3. LATEST ACUTE AND CHRONIC EXPERIMENTS
Figure 4.4: Comparison of attenuation coecient values at 10 and 21 MHz fordry old leads (10 years ago) and after being kept in saline for a decade.
for twin lead conductors compared to coaxial cables for the same dielectricmaterial used. A good approximation for the characteristic impedance of acoaxial cable with an inner radius a and outer radius b is
Z0,coaxial =
√L
C≈ 1
2π· µε′· ln(
b
a) (4.11)
where L and C are, respectively, inductance and capacitance per unit length,µ is permeability and ε′ is the real part of complex permittivity of the dielec-tric between the conducting wires [37], [44]. A similar approximation can beused for a characteristic impedance in the case of parallel wires:
Z0,coaxial =
√L
C≈ 1
π· µε′· ln(
d
a) (4.12)
where a is the radius of the conducting wire and d is the distance betweenthe centers of two conductors [37], [44]. A larger value for Z0,parallel compared
55

CHAPTER 4. HIGH FREQUENCY PARAMETERS OF PACING LEADS
Figure 4.5: Comparison of characteristic impedance values between 1 and 21 MHzfor all new leads. Shadowed zone comprises the curves for all remaining pacingleads not shown separately. The measurements of dierent combinations of parallelconductors in debrillation leads are shown in an average value curve with standarddeviation superimposed.
to Z0,coaxial derives not only from the divisor 2 present in equation 4.11, butalso from the fact that normally the distance d has larger values comparedto the outer radius b of a coaxial cable.
Comparing coaxial pacing leads only, I observed larger values of Z0 for3830 lead in the whole frequency range. It is a very thin 4.1 French (1.4mm) lumenless lead with a dierent inner insulation from other leads. It ismade of high-performance 4719 silicone [45] and ethylene tetrauoroethylene(ETFE). ETFE is the material with a very low relative dielectric constant[44] making it a good insulation material with low capacitance per unit lengthof the cable and, as a consequence, with high characteristic impedance.
I noticed a dierent behavior for 4196 and 4396 Attain Ability left-ventricular pacing leads. There is a saddle-like curve starting around 13 MHz.This could be due to a dierent type of inner insulator (silicone polyimide)and a special co-radial design that allows to have a very thin bipolar lead (4French lead body).
The most instructive comparison concerns dierent types of coaxial Cap-Sure SP Novus leads (4092, 4592, 5092, and 5592) shown in Figure 4.6. Allthese leads have the same inner silicone 4719 insulation but dierent outerinsulation (silicone 4719 for 5092 and 5592; polyurethane 55D for 4092 and
56

4.3. LATEST ACUTE AND CHRONIC EXPERIMENTS
Figure 4.6: The curve of characteristic impedance for straight leads (4092 and5092) is almost identical in the whole frequency range. Very similar results areobtained for J-shaped leads (4592 and 5592). The shape of the cardiac lead playsa primary role in HF parameters.
4592). The curves clearly show that the characteristic impedance of straightleads 4092 and 5092 is almost identical for the whole frequency range. Thesame can be observed for J-shaped 4592 and 5592 leads. The measurementsreveal that in this case the only factor aecting the characteristic impedanceis the lead geometry. This nding is very valuable for my future experimentsas it helps to explain the correlation of the instantaneous impedance vari-ations to the lead bending during a heart muscle contraction. In fact, dur-ing the myocardial contractions the lead geometry is continuously changingwhich is directly related to the variation of the lead impedance and reectioncoecient making the lead itself a reliable heart contraction sensor.
As expected, the attenuation coecient α of all new leads increases withthe frequency as shown in Figure 4.7. It is kept under 0.9 Np/m for all coax-ial and parallel leads. Co-radial leads 4196 and 4396 have somewhat higherattenuation and a dierent curve shape. Similarly to the case of characteris-tic impedance, the attenuation coecient for the straight CapSure SP Novusleads (4092 and 5092) is practically the same for all frequencies and somewhathigher than α of the J-shaped CapSure SP Novus leads (Figure 4.8).
The acute measurements of the latest models of the leads revealed thatthere is no signicant dierence in attenuation coecient in comparison with
57

CHAPTER 4. HIGH FREQUENCY PARAMETERS OF PACING LEADS
Figure 4.7: Attenuation coecient values between 1 and 21 MHz for all newleads. Shadowed zone comprises the curves for all remaining pacing leads not shownseparately. The measurements of dierent combinations of parallel conductors indebrillation leads are shown in an average value curve with standard deviationsuperimposed. Co-radial leads 4196 and 4396 have a completely dierent curvecompared to parallel and coaxial leads.
the old lead models. This is expected because geometry and materials usedin lead design did not change dramatically during the decade. Coaxial leadconductor remained the standard of the bipolar lead design for many years.An exception are the newly designed co-radial lead conductors that exhibiteda greater increase of the attenuation coecient at higher frequencies.
4.4 Conclusions and Applications
The chronic results of my research on HF characteristics showed the long-term stability of impedances and attenuation coecients for most dierenttypes of the leads independently on materials used for insulation or geometrydesign of the cardiac lead.
The acute results for new leads showed that HF characteristics have mu-tually very similar values. Therefore, they would perform in a similar way ifused as hemodynamic sensors. Accordingly, a universal HF measurement cir-cuit within an implantable device could be designed in order to be used withevery cardiac lead. In order to increase the measurement accuracy, circuitcalibration procedure should be developed.
58

4.4. CONCLUSIONS AND APPLICATIONS
Figure 4.8: Attenuation coecient values between 1 and 21 MHz for CapsureSP Novus leads. The straight leads 4092 and 5092 are presenting almost identicalvalues of attenuation coecient in the whole frequency range. J-shaped leads havea very similar behavior, although not completely identical.
If the HF characteristics were studied for every cardiac lead used in clin-ical practice, the circuit calibration could be adapted to the specic lead'scharacteristic impedance by simple programming of the lead model whichis normally done today in the most of the devices but only for the purposeof clinical information. Further chronic analyzes would be useful in order toconrm the long-term stability of HF parameters as already announced bythe results obtained with 7 old leads kept in saline for a decade. For that pur-pose, I soaked fteen new leads in the physiologic solution and I will revaluetheir HF parameters after a longer period of steeping.
There could be three dierent goals in HF cardiac lead design: increasingthe sensitivity of the lead bending sensor, decreasing the sensor's cable lossesin the case of the intra-cardiac HF sensor application such as ultrasonic anddecreasing the sensitivity on MRI electromagnetic eld [46]. I may concludethat primarily the lead conductor design geometry and than the choice of theinsulation material may achieve any of the goals and the specic application.The HF impedance matching on the sending end but also at the receivingend of a lead conductor should be investigated in specic applications [47].
59


Chapter 5
High Frequency Sensor
5.1 Introduction
As described in the previous Chapter, it would be a major advantage foran implantable device to comprise a hemodynamic sensor being functionalwith every standard cardiac lead independently of the lead manufacturer.This would enable a simple upgrade of the therapy system at the devicereplacement procedure.
The main purpose of such hemodynamic sensor would be to monitor themechanical activity of the heart in order to enable highly accurate auto-matic functions such as threshold measurement and rate responsive pacing[48]. Especially in implantable cardioverters debrillators, the sensor couldyield dierentiation between hemodynamically stable and unstable tachycar-dia thereby tailoring the therapy accordingly [28].
The previous Chapter describes in detail the HF characteristics of dif-ferent kinds of bipolar leads. The geometry of the lead was found to be theessential parameter inuencing those characteristics. In vitro experiments,that I carried out later on, have conrmed that the HF impedance of anybipolar lead varies dynamically in correspondence to the exion of the leadand it is easily measurable. In the same way, it is possible to detect car-diac contractions and successive lead bending by measuring either the HFimpedance or any other HF parameter directly related to the impedance. Inorder to investigate a possibility of constructing a hemodynamic sensor basedupon HF parameters, I have conducted a series of animal and human experi-ments. Instead of measuring directly the impedance, I have mainly measuredthe reection coecient at dierent signal frequencies ranging from 1 to 200MHz. In fact, the Equation 4.8 shows that these two parameters are directlyrelated to each other and are interdependent. I chose the reection coe-
61

CHAPTER 5. HIGH FREQUENCY SENSOR
cient only for practical reasons and because of the available measurementinstrumentation.
5.2 Measurement Setup
The reection coecient measurement was carried out using the network an-alyzer (3577B, Hewlett-Packard - HP, USA) and the transmission/reectiontest kit (35676B, HP, USA). For that purpose, I built a dozen of 75-ohmcoaxial patient cables having alligator clips for lead connection on one sideand a standard F connector on the other side. These cables were sterilized forusage in the sterile eld. A short non-sterile coaxial cable was connecting thepatient cable to the 75-ohm N-connector at the test port of 35676B. The ac-quisition of the measured values to the mobile workstation (Precision M6400,Dell, USA) via the standard GPIB interface and the corresponding ExpressCard (National Instruments - NI, USA) was commanded by a Matlab script(MathWorks, USA).
Other signals during ovine experiments were acquired through the Na-tional Instruments connector block and further through the acquisition PCM-CIA card (DAQCard-6024E, National Instruments, USA) inserted in Pre-cision M6400 mobile workstation. Namely, the ECG, VEGM and AEGMsignals were acquired via the 2290 analyzer block of the 2090 CareLinkprogrammer (Medtronic, USA) and the analog input/output box (2090AB,Medtronic, USA). The process of waveform acquisition via DAQCard-6024Ewas programmed using LabView 2009 SP1 (National Instruments, USA) soft-ware and the numerical data were saved into Excel sheets (Microsoft Oce,Microsoft, USA) for further processing and graphic presentation. Completesystem is disclosed in Figure 5.1. Using the frame grabber hardware (CMP-USBVG4, König computer, Netherlands), I recorded the uoroscopy broughtto the grabber in form of composite signal directly from the screen output.
In human experiments, the setup was pretty much the same except that Iwas able to acquire the ECG signal from the signal input/output box of theRECOR monitoring system (Siemens-Elema, Sweden). The uoroscopy wasrecorded independently in DICOM format using the system already presentin the catheterization laboratory.
Before taking measurements, I performed one port full calibration proce-dure of the connecting system with open, short and 75 ohm reference load,as disclosed in Figure 5.2. I did the majority of the measurements utilizingthe signal frequency of 10 and 50 MHz. However, pilot measurements havebeen also done at 1, 20, 100 and 200 MHz.
62

5.2. MEASUREMENT SETUP
Figure 5.1: High frequency sensor - measurement setup
63

CHAPTER 5. HIGH FREQUENCY SENSOR
Figure 5.2: Sterile black coaxial RG59 cable is terminated by alligator clips. Greycable is connected to the pacemaker signal analyzer (PSA) for standard threshold-sensing testing. The surgeon xes the 75 ohm resistor to the alligator clips for thethird phase of the measurement system calibration.
5.3 Acute Animal Experiments
5.3.1 Methods and Materials
The acute animal experiments have been performed at the Faculty of Vet-erinary Medicine in Zagreb, Croatia. The measurement system was testedsimultaneously to the experiments done with the triboelectric sensor duringthe implants of the same leads in the same 8 sheep. The only dierence con-sisted in one more sheep used for HF experiments in which we implanted thecustom-made 2-dot electrodes lead. This type of the lead was already usedin two other sheep and is described in Section 3.3.
Similar to the triboelectric sensor, the HF sensor was tested at baselineand during acute hemodynamic interventions (dobutamine infusion) in orderto achieve a heart rate of minimum 160 beats/minute and not to exceed 220beats/minute. Other details concerning the implants are disclosed in detailin Section 3.3 describing the experiments with the triboelectric sensor.
Any combination of parallel or coaxial conductors can be seen as a trans-mission line. Accordingly, I used dierent pairs of conductors for the mea-surement of the reection coecient. In 5 custom-made ICD leads, I testedthe classic low-voltage bipolar conguration between the pace/sense conduc-
64

5.3. ACUTE ANIMAL EXPERIMENTS
tors. I was also able to measure the signal between dierent combinationsof low-voltage and both high-voltage conductors, including the high-voltageconductor with the dead-end isolated conductor. In the 6-ring electrode leadI could measure the reection coecient between the pace/sense conductorand one of the six conductors of the ring electrodes as well as between dif-ferent pairs of ring electrodes. The 2-dot lead has a dedicated conductor foreach of the dots and a dead-end conductor inserted within the whole lengthof the lead body. In this case, I also examined each couple of conductors.In addition, in the ICD leads and the 6-ring lead I measured the unipolarconguration between the pace/sense conductor and the skin. Valid measure-ments were also obtained when measuring the signal between the pace/senselead and the nylon-coated wire inserted in stylet channel forming anothertype of coaxial transmission line with nylon coating as insulation betweentwo conductors.
5.3.2 Results
I was able to record the HF reection signal variation, caused by the ven-tricular lead bending, in all nine sheep. The quality of the HF signal variesin dierent pairs of conductors and for dierent signal frequencies but in themajority of cases the reection coecient waveform obtained by the mea-surement system corresponds to the cyclic occurrence of QRS complexes andT waves on the ECG waveform. The Figure 5.3 shows the waveform obtainedfrom the transmission line formed by two parallel pace/sense conductors inone of the ICD leads at 10 MHz. The heart was beating in sinus rhythm at95 bpm. The following example was obtained in the same lead during thedobutamine test at 188 bpm (Figure 5.4). In both cases there is an obviouscorrelation between the ECG and EGM traces and the reection coecientwaveform that describes the lead bending and the myocardial contraction.
Further analysis of the reection coecient waveform in case of sinusrhythm is given in Figure 5.5. The positive slope starts at the end of the QRScomplex and corresponds to the myocardial contraction during the systolicphase of the cardiac cycle. A small inection occurs on the waveform shortlyafter the beginning of the contraction. It denes the end of the isovolumiccontraction and the beginning of blood ejection into the pulmonary artery. Infact, the ejection starts when the pulmonary valve opens after the pressurein the right ventricle rises above the pressure in the pulmonary artery. Anextremely fast blood movement drags one segment of the lead body towardsthe pulmonary valve at the base of the right ventricle which is very closeto the tricuspid valve where the lead enters the ventricle. At the end ofventricular systole, when the pressure in the right ventricle falls rapidly, the
65

CHAPTER 5. HIGH FREQUENCY SENSOR
Figure 5.3: Reection coecient signal (|Γ|) measured in the ICD lead betweenthe pace/sense conductors at 10 MHz during sinus rhythm (95 bpm). The middlewaveform is the ventricular unipolar EGM.
Figure 5.4: Reection coecient signal (|Γ|) measured in the ICD lead betweenthe pace/sense conductors at 10 MHz during dobutamine test (188 bpm). Themiddle waveform is the ventricular unipolar EGM.
pressure in the pulmonary artery closes the pulmonary valve. A small artifactin the HF signal waveform at the end of ventricular systole marks the closureof the pulmonary valve. This event contributes to the second heart sound incardiac auscultation.
The initial phase of the diastole, i.e. isovolumic relaxation, is representedby a slightly negative slope segment in the HF signal waveform. It is followedby a steep negative slope due the rapid blood inow after the opening ofthe tricuspid valve. The second almost horizontal segment represents the
66

5.3. ACUTE ANIMAL EXPERIMENTS
Figure 5.5: Reection coecient signal (|Γ|) measured in the ICD lead betweenthe pace/sense conductors at 10 MHz during sinus rhythm (95 bpm). The middlewaveform is the ventricular unipolar EGM. Dierent phases of the cardiac cycleare shown.
phase of diastasis. It is the middle stage of diastole where the initial passivelling of the right ventricle has slowed down. It is followed by the atrialcontraction and the second phase of ventricular lling known as A wave inechocardiography. In the HF signal waveform it is visible as the second steepnegative slope. A small inection of the waveform, positioned just before theend of the diastole, represents the closure of tricuspid valve and the end ofventricular lling.
An analogous graphic segmentation of the waveform obtained duringdobutamine test is given in Figure 5.6. In this case, the valve movementsare less visible. This may happen for two reasons. First, the cardiac con-tractions are much more vigorous during dobutamine test and these short
67

CHAPTER 5. HIGH FREQUENCY SENSOR
changes of the blood ow direction might not inuence that much the leadbending. Another reason might be the limited number of visualization pointsof the HF signal. In fact, I am able to fetch from the network analyzer onlyone screen per measurement and each screen gives maximum 401 points. Ob-viously, for faster cardiac rhythms I lose some information if I keep the samerecording interval which is 8 seconds in this case. Nevertheless, I was still ableto determine dierent phases of systole and diastole by using the steepnessof the slopes as guidance. I was not able to nd any correlation between the
Figure 5.6: Reection coecient signal (|Γ|) measured in the ICD lead betweenthe pace/sense conductors at 10 MHz during dobutamine test (188 bpm). Themiddle waveform is the ventricular unipolar EGM. Dierent phases of the cardiaccycle are shown.
68

5.3. ACUTE ANIMAL EXPERIMENTS
peak-to-peak amplitude of the reection coecient variation and the con-tractility. In most of the cases this amplitude was found to be even smallerduring the dobutamine test. The most probable reason is that stronger andfaster contractions do not allow the lead to complete its movement as it isthe case during sinus rhythm. Consequently, the HF impedance and the re-ection coecient do not change in the same amount as in the case of sinusrhythm.
Figure 5.7: Reection coecient signal (|Γ|) measured in the ICD lead betweenthe pace/sense conductors at 10 MHz during sinus rhythm (95 bpm). The arrowsare pointing to the start of the systole (waveform minima) and to its end points(waveform maxima) with respective values
Figure 5.8: Reection coecient signal (|Γ|) measured in the ICD lead betweenthe pace/sense conductors at 10 MHz during dobutamine test (188 bpm). Thearrows are pointing to the start of the systole (waveform minima) and to its endpoints (waveform maxima) with respective values
Later on, I analyzed the duration of the contraction relatively to the heartcycle interval in sinus rhythm and during the stress test. Figures 5.7 and 5.8show the same waveforms previously analyzed and segmented in dierentcardiac cycle phases. The arrows are indicating starting and ending points of
69

CHAPTER 5. HIGH FREQUENCY SENSOR
systole in both normal and accelerated rhythms with relative timing pointsand values of reection coecient module. The following calculations giveas a result the relative duration of the contraction period compared to thecomplete heart cycle duration in sinus rhythm Tcontraction,rel,SR:
Tcontraction,rel,SR =Tcontraction,SRTcycle,SR
=t2 − t1t3 − t1
=0.2
0.64= 0.3125 (5.1)
Exactly the same relative duration is obtained in the case of the dobutaminetest and it amounts to around one third of the heart cycle:
Tcontraction,rel,DOB =Tcontraction,DOBTcycle,DOB
=t2 − t1t3 − t1
=0.1
0.32= 0.3125 (5.2)
I also noticed a strong correlation between the slew rate of the HF signaland the myocardial contractility. I calculated the derivation of the positiveslope of the HF signal that represents the contraction phase. For the rstheart cycle during the sinus rhythm it amounts to
∆|Γ|∆Tcontraction,SR
=|Γ2| − |Γ1|t2 − t1
=0.407− 0.351
0.2= 0.28 (5.3)
In the second cycle, the derivation is
∆|Γ|∆Tcontraction,SR
=|Γ4| − |Γ3|t4 − t3
=0.405− 0.355
0.22= 0.23 (5.4)
The dierence between two values can be attributed to a relatively low timeresolution of the acquired signal as I was able to acquire only 401 points foreach measurement with the network analyzer. For a longer acquisition of 8seconds, the measurements are taken every 0.02 seconds. This is a source ofconsiderable errors around the signal peaks.
The same calculations were done for the waveform during the stress test.The slew rates are respectively 0.59 and 0.58 in the rst two heart cycles.The HF signal rises twice as rapidly during the dobutamine test. This givesan indication of a strong correlation between the sensor signal increase rateand the myocardial contractility.
70

5.4. ACUTE HUMAN EXPERIMENTS
This observation was conrmed with the further analysis of the rest ofacquired waveforms although a strictly mathematical approach was not un-dertaken. In fact, the acquisition system shortcoming in terms of low tem-poral resolution resulting in unreliable signal peek values have impeded thebuilding of a solid statistical model. This limitation does not diminish thevalue of the results of the experiments. Conversely, it gives a precise indica-tion for the future experiments and an announcement of an extremely simpleand steady method for myocardial contractility evaluation.
5.4 Acute Human Experiments
5.4.1 Methods and Materials
The acute human experiments have been performed using the standard pac-ing and debrillator leads during regular primary implantations or replace-ments of pacemakers and ICDs under local anesthesia.
The measurement system was tested in 28 patients with indications forpacemaker or ICD implantation in accordance with standard internationalguidance. Twelve patients have undergone ICD implantation (7 dual chamberand 5 single chamber). A pacemaker was implanted or replaced in the othersixteen patients with 11 dual chamber and 5 single chamber devices. Theventricular leads were positioned in the right ventricular apex and the atrialleads in the right atrial appendage. Both sites are standard pacemaker leadpositions.
5.4.2 Results
I was able to record the HF reection signal modulation caused by the leadbending in 24 patients. The wave obtained by HF measurements system oc-curred always after the QRS complex during expected ventricular contractionperiod whereby timely corresponding to the oxygen saturation (SO2) wave. Indual chamber system, the HF measurement was not possible in 4 patients dueto the rhythmic intra-atrial collision of two lead bodies that generated thehuge signal artifact. We were able to observe the sensor response in dierentunderlying rhythms - atrial brillation with bradyarrhythmia, atrioventricu-lar blocks of dierent grades, and sinus bradycardia.
The measurements prolonged the normal testing procedure for maximum10 minutes. Deection of the ventricular lead occurred in its distal portionat the curvature within the tricuspid valve. Cardiac contractions pulled theright ventricular segment of the lead in cranial direction thereby exing the
71

CHAPTER 5. HIGH FREQUENCY SENSOR
tricuspid and low atrial segments of the lead. Dierent positions of the leadtip implantation yielded dierent lead deection and dierent signal magni-tude. Periodic variation of the cardiac contraction signal corresponds to theperiodic variation of the bending curve of the lead within the right ventricle.
Figure 5.9 shows measured signals of the patient with arrhythmogenic RVdysplasia and sustained VT, recorded during implantation of a dual cham-ber ICD. Two Medtronic leads: ventricular 6944-65 and atrial 5554-53 wereimplanted in RV apex and RA appendage respectively. The measurements ofthe high frequency reection coecient magnitude (|Γ|) have been done by abipolar connection to the coaxial atrial lead at the frequency of 20 MHz. Sen-sor signal of atrial lead is on the top above unipolar atrial EGM and surfaceECG. A premature ventricular contraction (PVC) inuences the atrial leadbending and therefore the PVC signal is visible as a signal having decreasedamplitude in comparison with other normal sinus rhythm complexes.
Figure 5.9: Reection coecient signal (|Γ|) measured in the atrial bipolar lead at20 MHz. The middle waveform is atrial unipolar EGM. PVC inuences the atriallead bending.
Figure 5.10 shows measured signals of the patient with dilative cardiomy-opathy and non-sustained VT, recorded during the implantation of a dualchamber ICD with the same two leads as in the previous case. The mea-surements have been done at the frequency of 10 MHz between the proximalSVC (superior vena cava) high-voltage conductor and the RV ring connectorof the debrillation lead. This is an example of a parallel transmission line.Atrial pacing at the rate of 130 ppm provoked 2:1 AV block. Small atrial con-traction wave precedes the tall ventricular contraction wave and the other
72

5.4. ACUTE HUMAN EXPERIMENTS
non-conducted atrial contraction is superimposed on the ventricular wave.
Figure 5.10: Reection coecient signal (|Γ|) measured in the debrillation leadbetween SVC and RV ring connector pins at 10 MHz. Atrial pacing at 130 ppmprovoked 2:1 AV block.
Figure 5.11: Reection coecient signal (|Γ|) measured in the debrillation leadbetween HVB and RV ring connector pins at 10 MHz. The middle waveform isventricular unipolar EGM. HF sensor signal amplitude variation in related to R-Rinterval variation.
73
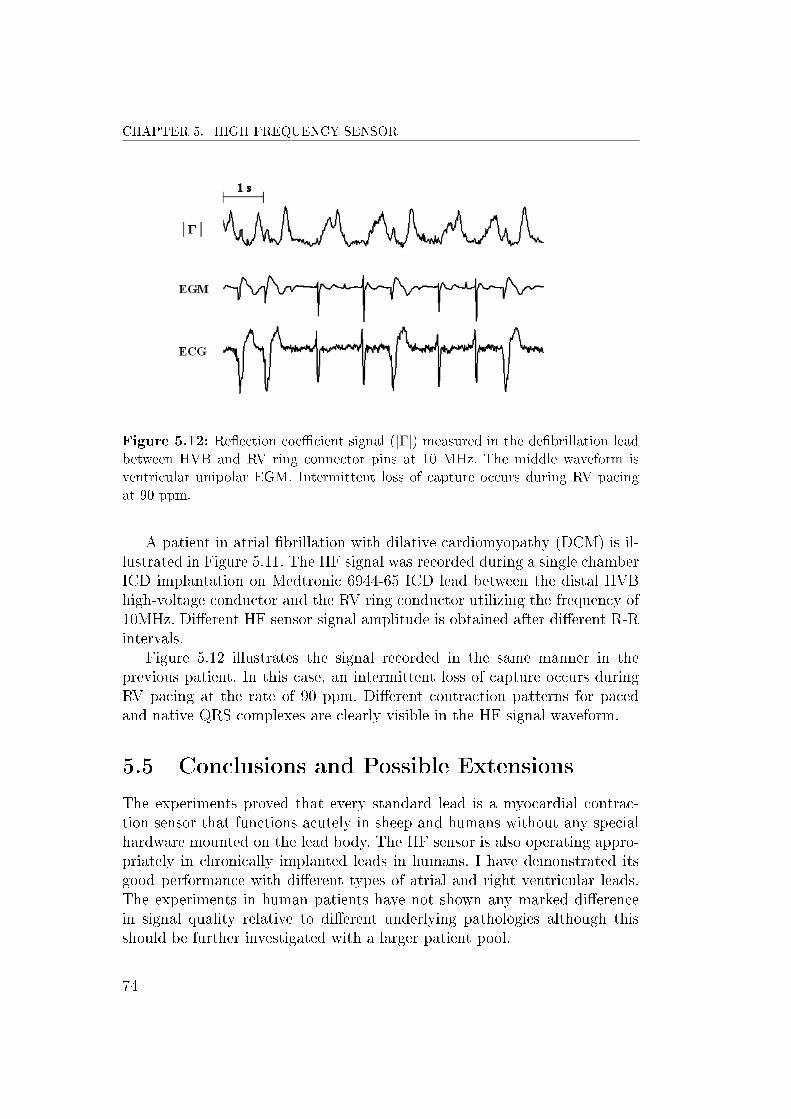
CHAPTER 5. HIGH FREQUENCY SENSOR
Figure 5.12: Reection coecient signal (|Γ|) measured in the debrillation leadbetween HVB and RV ring connector pins at 10 MHz. The middle waveform isventricular unipolar EGM. Intermittent loss of capture occurs during RV pacingat 90 ppm.
A patient in atrial brillation with dilative cardiomyopathy (DCM) is il-lustrated in Figure 5.11. The HF signal was recorded during a single chamberICD implantation on Medtronic 6944-65 ICD lead between the distal HVBhigh-voltage conductor and the RV ring conductor utilizing the frequency of10MHz. Dierent HF sensor signal amplitude is obtained after dierent R-Rintervals.
Figure 5.12 illustrates the signal recorded in the same manner in theprevious patient. In this case, an intermittent loss of capture occurs duringRV pacing at the rate of 90 ppm. Dierent contraction patterns for pacedand native QRS complexes are clearly visible in the HF signal waveform.
5.5 Conclusions and Possible Extensions
The experiments proved that every standard lead is a myocardial contrac-tion sensor that functions acutely in sheep and humans without any specialhardware mounted on the lead body. The HF sensor is also operating appro-priately in chronically implanted leads in humans. I have demonstrated itsgood performance with dierent types of atrial and right ventricular leads.The experiments in human patients have not shown any marked dierencein signal quality relative to dierent underlying pathologies although thisshould be further investigated with a larger patient pool.
74

5.5. CONCLUSIONS AND POSSIBLE EXTENSIONS
The main disadvantage of the method is of purely practical nature. Infact, the network analyzer allows the acquisition of one screen per measure-ment. One screen has 401 points and for a measurement of 8 seconds it gives atemporal resolution of 20 ms. This is not good enough for the representationof the signal with a high slew rate. In my case, some of the signal peaks werenot registered with adequate precision which makes impossible any furtherstatistical analysis of the signal. I am currently developing some additionalhardware to overcome this problem: a signal generator and an HF bridge op-erating at the frequency between 10 and 50 MHz. The imbalance of the bridgedue to the cardiac contractions will provide me with a continuous signal. Inorder to mathematically formalize the results, this signal will be correlatedto the uoroscopy movie and hemodynamic parameters such as rate of riseof LV pressure (dp/dt) and saturation of peripheral oxygen (SpO2). Furtherinvestigation will include chronic measurements in same nine sheep. Lateron, I will expand the measurements to other human patients for whom weare currently waiting an additional approval of the ethical committee as aninvasive procedure of catheterization is required for dp/dt curve acquisition.
I will also further investigate the delity of atrial and RV leads signal,especially in the case of intra-atrial collision of two lead bodies that gen-erated the signal artifact in previous experiments. Further improvement ofthe hardware and software should solve the problem. I need to determinethe feasibility of recording HF reection signal caused by LV lead bendingin the coronary sinus as this might give an indication of LV contraction. Itwould give very valuable information potentially exploitable for automaticCRT optimization - the major challenge of modern electrotherapy systemswhich is not yet solved. In addition, I will need to analyze the inuence ofthe signal frequency on the nal quality of the waveform. First observationshave shown satisfactory results at 10-50 MHz although in some cases I hadto use higher frequencies to obtain clear contraction waves.
There is a great potential to investigate the variety of possible clinicalutilities of this sensor already introduced in Section 2.2.2. I assume thatexisting studies for commercially available contractility sensors could be re-peated with our system. Furthermore, the major advantage of our system incomparison to the existing systems is that every standard bipolar cardiac leadmay be the cardiac contraction sensor without any special device mountedon its body. Additional HF hardware in cardiac devices would be neither de-sign challenge nor source of decreased battery longevity. It would not imposeadditional safety or reliability risk. Although the results obtained with HFsensor are extremely promising, additional clinical studies have to be done inthe future in order to investigate thoroughly the clinical applications beforebeing able to integrate the system in the implantable devices.
75


Chapter 6
Conclusion and Future Work
6.1 Summary and Contributions
In this thesis, I have explored the possibility of building a hemodynamic sen-sor for myocardial contraction detection that could be easily integrated in theexisting cardiac pacing and debrillator leads. Therapy delivery in moderncardiac electrotherapy systems is based almost exclusively on the informa-tion about cardiac electrical depolarization. This kind of detection lacks anyinformation about the mechanical component of myocardial contraction thatis considered even more useful for the nal scope of heart pump functionevaluation.
A short introduction to the problem and the organization of the reportare given in Chapter 1.
A vast research of literature has been carried out in Chapter 2. Cur-rently, there are only three cardiac pacing systems in the market that suc-cessfully gather information on cardiac contractions. However, one of themrequires a special lead with an accelerometer in the lead tip while the othertwo are based on impedance measurements and have very limited practicalapplication. The aim of my research was to ll this gap in the pacing therapyand propose a new solution that will be simple and universal for all kind ofleads. This sensor would preferably have a wider range of applications andwould markedly improve the patient management.
In Chapter 3, I have disclosed in detail the design and applications of ahemodynamic sensor based on triboelectricity that was the fruit of collabo-ration with my co-tutor Ferek-Petric. The system detects the built of chargewithin the cardiac pacing lead due to the lead bending and consequent fric-tion of conductive and insulation materials that build up the lead itself. Evenbetter signal quality was obtained when measuring the charge between one
77

CHAPTER 6. CONCLUSION AND FUTURE WORK
of the pacing conductors and a special insulated metallic wire used as styletin the central lumen of the lead. The system was thoroughly tested in a seriesif animal and human experiments.
In Chapter 4, I have presented an original study on electrical high-frequency parameters of cardiac leads. Ferek-Petric has previously conducteda series of measurements of characteristic impedance and attenuation coef-cient on six dry pacing leads. I have repeated the measurements after theten-year period of soaking the leads in physiologic solution for human bodyenvironment simulation. The results have shown a surprising stability of HFparameters independently of the extremely long time spent in NaCl solution.I have also analyzed the same parameters in 15 new pacing and ICD leadsand immersed them in saline for future experiments. Almost all new leadshave shown similar values of impedance and attenuation to those pertinentto old leads. The only exception were two modern co-radial LV leads with acompletely new design. The main nding of the experiment was the extremesensibility of HF parameters to the lead geometry variation.
That was an important and encouraging result for the upcoming develop-ment of the HF lead bending sensor presented in Chapter 5. In fact, we haveconsidered any bipolar cardiac lead to be a transmission line. Intraoperativemeasurements of HF reection coecient in sheep and humans have clearlydemonstrated the feasibility of such sensor. In fact, the lead ection due tothe cardiac contractions changes the HF impedance of the lead and servesas a consistent hemodynamic sensor. The main value of this novel techniquestands in its simplicity and possibility of its universal expanding to all ex-isting bipolar leads. This achievement is unique in the eld of hemodynamicsensors applied to the cardiac pacing.
The potential area of applications of two sensors presented in the the-sis is huge. Beat-to-beat monitoring of electromechanical coupling intervalscould be used in capture management algorithms. Tachycardia detection al-gorithms could be signicantly improved as hemodynamic unstable tachy-cardia impedes the heart muscle contractility [28]. It may be also used as arate responsive sensor because the exercise signicantly changes the contrac-tility [49], [50]. Considering that the heart failure inuences the parametersof RV and LV contractility [9], [21], [51], a continuous heart failure monitor-ing might be obtained with these sensors. AV interval closed loop regulationshould be investigated by RV contraction optimization [52], [53] as well as VVdelay regulation in CRT hemodynamic optimization [54]. Atrial brillationdetection, mode switching and post-AF therapy titration is also one of thepossible applications. In that regard, detection of hemodynamic assessmentof atrial brillation [55], [56], and post-AF therapy eects evaluation [57]should be investigated. As vigorous contractions precede the vagal reaction
78
6.2. FUTURE WORK
[58], [59], the vasovagal syncope episode could probably be predicted by oursensors.
The main contribution of this thesis can be found in its original interdis-ciplinary approach to the problem of hemodynamic sensor design. In thoseregards, the main signicance stands in simplicity and universality of the pro-posed sensors, especially in the case of sensor based on HF lead parameters.The quality of results is proven in numerous ovine and human experiments indierent conditions and the originality of the studies is proven by the entirepatent portfolio held by my co-tutor Ferek-Petric.
6.2 Future work
There is still a long way to the practical use of the proposed sensors. In thefuture experiments, I will correlate the sensor signal with uoroscopy movieand hemodynamic parameters such as dp/dt and SpO2. I will also proceedto the design of HF bridge that will provide continuous output signal insteadof the limited number of points acquired from the network analyzer in thecase of HF sensor. Further investigation will include chronic measurements insame nine sheep. Later on, I will expand the measurements to other humanpatients. The last step would be to integrate the measurement system intothe implantable device and have continuous monitoring and registration ofthe sensor signal that could prove its long-term stability and possibility ofintegrating the system in the commercially available devices.
79


Appendix A
Delibera di presentazione
81
UNIVERSITA. DEGLI STUDI DI TRIESTE pag. 1 di 4
VERB ALE NUMERO 48
DEL COLLEGIO DEI DOCENTI DEL DOTTORATO DI RICERCA IN INGEGNERIA DELL'INFORMAZIONE
XXIICICLO
II giomo 07 Dicembre 2010, aIle ore 11.30 pres so il Dipartimento di Ingegneria Industriale e dell'Informazione (DI3
) si eriunito, regolarmente convocato, il Collegio dei Docenti del Dottorato di Ricerca in Ingegneria dell'Informazione. Fra i componenti del collegio dei docenti sono presenti Ie persone di seguito indicate:
Presente Assente Assente giustificato non
giustificato IA ;<1;J AgO:::;tlIlO X i Babich Fulvio X
Albelio X I
! Carrato Sergio X I I X I
l Parisini Thomas MUlnolo Enzo
X i Ramponi Giovanni X I Russo Fabrizio X ! UkOVll.:h 'alter
I
X IT:" 1~'1 :"IL,d
e:::;l,.;ovo Roberto X I
Sono inoltre presenti il prof Lorenzo Castelli e la dr. Federica Vatta, tutrice del dottorando Meneghini.
Presiede il prof Vescovo. Verbalizza il prof Ramponi.
II presidente, constatato il nUlnero legale, apre 1a riunione alle ore 11.30 per trattare il seguente ordine del giomo:
1. Valutazione dell'attivita svolta dai dottorandi che hanno concluso i1 quarto anna in regime di proroga ed eventuale loro ammissione all'esame finale.
2. Redazione della tesi di dottorato in lingua inglese. 3. Scelta della cOlnmissione dell' esatne finale. 4. Varie ed eventuali.
IL PRESIDENTE IL SEGRETARIO

UNIVERSITA DEGLI STUDI DI TRIESTE 2 di 4
VERB ALE NUMERO 48
DEL COLLEGIO DEI DOCENTI DEL DOTTORATO DI RICERCA IN INGEGNERIA DELL'INFORMAZIONE
XXIICICLO
Prima di iniziare Ie valutazioni, il coordinatore ricorda che restano iscritti al dottorato soltanto Ie seguenti persone: MENEGHINI Fabio, MORO Alessandro, TOMASIC Danko, i quali terminano il quarto anna in di proroga, concessa nell'anno 2009.
1. Valutazione dell'attivita svolta dai dottorandi che hanno concluso il quarto anna in regime di proroga ed eventuale lora ammissione all'esame finale.
1. MENEGHINI Fabio (tutore dr. Federica VATTA) II dottorando presenta la propria attivita e risponde alle domande ed osservazioni da parte del Collegio.
2. MORO Alessandro (tutore prof, Enzo MUMOLO) II dottorando presenta la propria attivita e risponde alle domande ed osservazioni da parte del Collegio.
3. TOMASIC Danko (tutore prof. Agostino ACCARDO) II dottorando presenta la propria attivita e risponde alle domande ed osservazioni da parte del Collegio.
II Collegio apprezza la proficua attivita svolta dai.dottorandi MENEGHINI Fabio, MORO Alessandro e TOMASIC Danko, che nel corso dell'ultimo anno, in regime di proroga, hanno mostrato di aver completato iliavoro svolto nei primi tre anni, e ne delibera l'ammissione all'esame finale.
Delibera inoltre di sottoporre alIa commlSSlone dell' esame finale Ie presentazioni dei detti dottorandi cosi come preparate dai rispettivi tutori. Tali presentazioni sono allegate al presente verbale.
2. Redazione della tesi di dottorato in lingua inglese
I1 Collegio de1ibera di concedere la redazione della tesi in lingua inglese ai dottorandi che ne ravvisassero l' opportunita.

UNIVERSITA DEGLI STUDI DI TRIESTE pag. 3 di 4
VERB ALE NUMERO 48
DEL COLLEGIO DEI DOCENTI DOTTORATO DI RICERCA IN INGEGNERIA DELL'INFORMAZIONE
XXIICICLO
3. Scelta della commissione dell'esame finale
Dopo approfondita discussione, il Collegio delibera di proporre, all'unanimita, che la commissione per l' esame finale del Dottorato sia la medesima dell' esame finale della scuola di Dottorato in Ingegneria dell'Informazione (XXIII cicIo), istituita presso il Dipartimento di Ingegneria Industriale e dell'Informazione dell'Universita di Trieste e diretta dal prof. Walter Ukovich, presente ana nunlOne odiema. II collegio propone inoltre che tale commissione sia.folmata dalle seguenti persone:
1. Prof. Alberto BARTOLI, Universita di Trieste, Dipartimento di Ingegneria Industriale e dell'Informazione, Via A. Valerio 10, 34127 TRIESTE. (Tel. 040-5587822, E-mail: [email protected], Fax: 040-5583460).
2. Prof. Michele MIDRIO, Universita di Udine, Dipaliimento di Ingegneria Elettrica, Gestionale e Meccanica, Via delle Scienze, 208, 33100 UDINE. (Tel. 0432-558292, E-mail: [email protected], Fax: 0432-558251).
3. Prof. Alfredo RUGGERI, Universita degli studi di Padova, Dipartimento di Ingegneria dell'Informazione, Via Gradenigo 6/B, 35131 PADOVA (Tel. 049-8277624, Email:[email protected], Fax: 049-8277699).
4. Componente aggregato: Prof. Franco BLANCHINI, Universita di Udine, Dipartimento di Matematica e Informatica, Via delle Scienze, 208, 33100 lJDINE (Tel. 0432-558466, Email: [email protected], Fax: 0432-558499).
Vengono inoltre designati, all'unanimita, i seguenti merrlbri supplenti (commissione di riserva):
1. Prof. Enzo MUMOLO, Universita di Trieste, Dipartimento di Ingegneria Industriale e dell'Informazione, Via A. Valerio 10, 34127 TRIESTE (Tel. 040-5583861, E-mail: [email protected] , Fax: 040-5583460).
2. Prof. Giuseppe SCHETTINI, Universita di Roma Tre, Dipartimento di Elettronica Applicata, Via della Vasca Navale, 84, 00146 ROMA (Tel. 06-57337336, mail:[email protected], Fax: 06-57337026).
3. Prof. Gianna TOFFOLO, Universita di Padova, Dipartimento di Ingegneria dell'Informazione, Via Gradenigo 61B, 35131 P AD OVA (Tel. 049-8277804, mail:[email protected], Fax: 049-8277699).
4. Componente aggregato: Prof. Stefano MIANI, Universita di Udine, Dipartimento di Ingegneria Elettrica Gestionale e Meccanica, Via delle 208, 33100 UDINE (Tel. 0432-558262, E-mail: [email protected], Fax: 0432-558251).
IL PRESIDENTE SEGRETARIO

UNIVERSITA DEGLI STUDI DI TRIESTE pag. 4 di 4
VERB ALE NUMERO 48
DEL COLLEGIO DEI DOCENTI DEL DOTTORA TO DI RICERCA IN INGEGNERTA DELL'INFORMAZIONE
XXIICICLO
L'esame si terra locali del Dipartimento di Ingegneria Industriale e dell'Informazione (DI3)
dell'Universita di Trieste .. Il collegio del ega il proprio coordinatore, prof. Vescovo, e il Direttore della scuola di Dottorato sopra citata, prof. Ukovich, a definire un'unica data per l'esame finale dei candidati del dottorato e della Scuola. Data e ora saranno poi da essi comunicate in tempo utile alIa segreteria dottorati.
6.Varie ed eventuali
Constatata l'assenza di varie ed eventuali, il Presidente dichiara chiusa la seduta aIle ore 12:30.
ALLEGATI AI, A2, A3 al presente verbale:
Presentazioni, alIa commissione dell' esame finale, dei candidati MENEGHINI Fabio (Allegato AI), MORO Alessandro (Allegato A2), TOMASIC Danko (Allegato A3).
IL PRESIDENTE SEGRETARIO
Allegato A3 (verbale n. 48 della riunione delCollegio dei Docenti del 07-12-2010)
Dottorato di Ricerca in Ingegneria delI'Informazione
Presentazione del dottorando Danko Tomasic
alIa Commissione dell' Esame finale
Danko Tonlasi6 ha iniziato il dottorato nel gennaio 2007, indirizzo Bioingegneria, senza borsa. Ha svolto la sua attivita a Hvello intemazionale, sia presso la Facolta di Ingegneria dell'Universita di Zagabria, sia presso i laboratori di ricerca della Medtronic, l'Universita di Leuven e il St. George's Hospital di Londra su progetti finanziati dalla Fondazione Nazionale per Ia Scienza, Ricerca Universitaria e Sviluppo Tecnologico della Repubblica di Croazia e dalla ditta Medtronic. AlIa fine del 2009 ha chiesto l'am10 di proroga per poter condurre ulteriori misure e Ie relative analisi.
La principale attivita di ricerca svolta ha riguardato 10 studio dell'elettrostin10lazione cardiaca. In particolare nei primi due anni si e concentrato sulla modellizzazione del funzionamento elettromeccanico del muscolo cardiaeo al fine di individuare nuove e pili iill10vative terapie nell'ambito della resineronizzazione eardiaca (0 elettrostimolazione biventricolare) che si e dimostrata potenzialnlente utile nel miglioramento dei sintomi e della funzione della pompa cardiaca. Nel primo anne si e focalizzato sulla simulazione presentata da Kerckhoffs ed in collaborazione con Prof. Bart Bijnens (KU Leuven, Belgio) ha integrato e valutato nella prassi c1inica il modello inserendovi nuovi aspetti del movimento anomalo del setto cardiaco. AlIa fine del primo anno, la Medtronic ha interrotto la ricerca. II dottorando ha quindi nl0dificato, nel secondo anne di ricerca, il suo obiettivo adattando e applicando il modello unidimensionale autoadattativo delI'intero sistema cardiovascolare, basato su quanto descritto nel lavoro di Arts, al caso dell'ipertensione arteriosa polmonare osservabile nei pazienti con anelnia falciforme. Questa seconda ricerca e stata sviluppata insieme ad un gruppo di cardiologi e pneumologi del St. George's Hospital di Londra dove sono stati raccolti i dati da pazienti pediatrici di origine centro-africana dove la malattia e pili frequente. Prendendo in considerazione la geometria cardiaca e i paranletri dell' emodinamica specifici di ogni paziente, il dottorando ha ottenuto dei risultati quantitativi che rispecchiano bene il meccanismo dell' anemia falcifolme. Purtroppo gli errori relativi delle misure ecoeardiografiche di interesse sono risultati eccessivi, impedendo l'uso del modello nella prassi clinica. Negli ultimi due am1i il dottorando ha condotto una nuova ricerca basata su una serie di brevetti amerieani del dr. Bozidar Ferek-Petri6. Lo scopo del progetto estate quello di costruire un sensore delle contrazioni cardiache compatibile con tutti gli elettrocateteri in commercio indipendentemente dal tipo e dal produttore al fine di utilizzarlo per il rilevanlento anche precoce e la differenziazione di diversi tipi di aritmie e di ritmi cardiaci con una precisione maggiore rispetto i sistemi esistenti. II dottorando ha analizzato Ie caratteristiche in alta frequenza di una serie di elettroeateteri di diversa forma, costnlzione dei conduttori e con diversi tipi di isolamento ed ha ideato e realizzato tre nuovi tipi di sensori emodinamici per il rilevan1ento delle contrazioni cardiache. Tali sensori sono stati testati su un eerto numero di pazienti nei Dipartimenti di Cardiologia a Zagabria e Fiume. Inoltre alcuni elettrocateteri speciali sono stati impiantati anche su alcune pecore alla Facolta di Veterinaria di Zagabria in modo da poter effettuare sia misure acute che croniche al fine di avere informazioni sulla stabilita del sistema in vivo anche su tempi Inedio-lunghi. Trattandosi di procedure invasive, e state necessario ottenere gli opportuni pemlessi dalle Commissioni etiche dei Centri Clinici e dai Ministeri della Sanita edell'Agricoltura Croati, che hanno compoliato ritardi nella ricerca oltre quelli prodotti dal fatto che si e trattato di realizzare strumenti da utilizzare in sala operatoria che dovevano quindi rispettare anche precise regole sulla sterilizzazione.
~~-.~.~ \i . C· ~ "'l~t;~- 'e4-Cnry-

L'attivita scientifica del dottorando eattestata da 3 articoli inviati a riviste intemazionali, e da 4 articoli pres ent ati a congressi intemazionali e nazionali. Altri lavori da inviare a rivista intemazionale sono attualmente in preparazione. Una parte dei risultati so no stati presentati a convegni intemi alIa Medtronic in quanta coperti da segreto industriale. 11 dottorando ha paliecipato a numerosi corsi di formazione ed ha tenuto oltre 30 sessioni didattiche sull' elettrostimolazione per i cardiologi, cardiochirurghi e personale tecnico di ospedali in Serbia, Slovenia, Croazia, Bosnia ed Erzegovina, Kosovo e Albania.
II dottorando si e dedicato all' attivita di ricerca con impegno e autononlia, conseguendo risultati originali testimoniati dal personale contributo alle pubblicazioni elencate, sviluppando diretti rapporti di collaborazione con enti estemi raggiungendo un discreto livello di maturazione scientifica.


Acknowledgments
Over the past four years, I have received support and encouragement frommany people, professionally and personally.
I would like to express my gratitude to Prof. Agostino P. Accardo foraccepting me as his PhD student after the rst year. I want to thank himfor being patient with me even during the period in which the results ofthe research were still not that promising. I am grateful for his unreservedsupport and condence during the hard periods when most of the peoplewould simply say: No.
I am deeply grateful to dr.sc. Bozidar Ferek-Petric, the scientic super-visor of my thesis, for generous and openhearted sharing of his ideas withme. I am grateful for his continuous support and excellent guidance duringmy research. I am still hoping to reach at least a small fraction of his un-equalled exibility in thinking the world around him. And the ability to shareit genuinely with the world around me, as he always does.
I want to thank our co-researcher and the best lead implanter in sheepI've ever seen - dr. Sandro Brusich. I want to thank him for the passion heintroduced in our project and for his unsurpassed involvement in the teamwork. I want to thank him for reminding Bozo to do the things on time.Finally, I want to thank him for the friendship.
Special thanks go to NICE project committee, Medtronic Inc., Minneapo-lis (US) for recognizing the value of the project and for supporting it nan-cially. Mark Marshall, thank you very much for building the custom-madeICD leads we used during our experiments.
I am extremely grateful to my bosses Hrvoje Badovinac and Hrvoje Vale-cic for their support to my research activities and for the comprehension theyhad even though sometimes there were other things to do instead of solder-ing electronic devices. I want to mention the importance of Jörg Heikenfeld'spresence during the experiments and his full support in business, scienticand personal aspects.
Many many many many thanks to my colleagues Ela and Teo that werealways ready to accept plenty of everyday overwork due to my involvement

APPENDIX A. DELIBERA DI PRESENTAZIONE
in the research projects. They do deserve a lot of beers!Special thanks go to dr. Korenj and dr. Musulin from the Surgery Clinic
of Faculty of Veterinary Medicine in Zagreb for their excellent collaborationin animal experiments. I also want to thank everybody from the catheteriza-tion laboratory at the Department of Cardiology in Clinical Hospital CenterRijeka for their professional and friendly collaboration during human exper-iments.
I will always remember the exceptional involvement of Prof. Bart Bijnensfrom KU Leuven and Pompeu Fabra University as well as dr. Maja Cikes fromClinical Hospital Center Zagreb, especially in the rst stage of my research.I can only regret that I was not able to counterbalance their generous helpwith results.
Milana, Minka and Goran, thank you for collecting my letters, doing mybureaucracy work and oering me a bottle of exquisite wine and a warm bedwhenever I needed it in Trieste. Alexa and Moho, thank you with supportingmy bureaucratic ghts at the beginning! Goran, Ana V., Danijel, Dragan,Marko, Mia and many others, thank you for introducing me to the world ofscience during my diploma project at the EPFL in Lausanne. Moco, thankyou for the rst sentence in this Section. "Basel girls" and Jaro, thank youfor your hospitality in Switzerland and advices regarding the PhD each timewe were sitting, eating and drinking together. Zoka, thank you for the mutualsupport throughout the years and for reminding me that "crazy" scientistsstill exist! Marko N., thank you for being around all these years both inRijeka and Trieste. Lana, Rudi and Ivor, thank you for being patient lastfew moths. I will resume going out and travelling with you very soon. Silvio,thank you for being my personal reviser for Italian language!
I want to thank Marco Beltrame that was always generously dividing hisexperience with me during our studies and later on during the PhD. Marco,thank you for being such a quite but always strong and essential support andhelp!
I want to thank all my bestmen. Damir, thank you for being alwaysaround. No need to ask, no need to explain. Krema, thank you for supportingmy work but also for reminding me that the life consists of pleasure and notonly of work. And thank you for making the best documentary ever aboutovine experiments. Kruno, thank you for everything you taught me. And forthe proof-reading of this text.
I am extremely grateful to my parents-in-law and Igoric for helping allthe time without asking why and when. And for good sh and wine theywould prepare in every occasion.
Baka i deda - thank you for making a self-thinking man out of a wild boy.Ciga, Jelena, Milja i Ranko thank you for pretending pretty well that you
90

really believe to have an adult self-thinking man instead of a wild boy as anephew and cousin.
Nevena, mama Drina i tata Dinko thank you for being the greatest sup-port and for being the closest to me. Always. What else should I say?
Iva - thank you! Not only for the graphs you were putting together andadjusting for my thesis :) but also for being the second half all these years.I would add some more words but I know you don't like publicity. Mirta,you were a great support! Especially when waking us up in the middle of thenight.
Finally, I am extremely grateful to Prof. Paolo Inchingolo for acceptingme as his PhD student. I will always remember the passion you were puttingin everything you did. Now I can only regret you are not with us to see ourproject concluded. I am here mostly thanks to you.
91


List of Figures
2.1 Pacemaker in front of two ICDs (photo courtesy of Medtronic) 102.2 Electromechanical activation of the heart (photo courtesy of
Medtronic) . . . . . . . . . . . . . . . . . . . . . . . . . . . . . 112.3 Cardiac cycle timing intervals . . . . . . . . . . . . . . . . . . 122.4 Triple chamber pacemaker - CRT-P (photo courtesy of
Medtronic) . . . . . . . . . . . . . . . . . . . . . . . . . . . . . 132.5 Dual chamber pacemaker with a straight and a J-shaped lead.
The silicone tines close to the cathodes are used for passivexation (photo courtesy of Medtronic). . . . . . . . . . . . . . 14
2.6 DDD pacing with a lower rate of 60 bpm (photo courtesy ofMedtronic) . . . . . . . . . . . . . . . . . . . . . . . . . . . . . 15
2.7 Chronicle implantable hemodynamic monitor with the leadcarrying the pressure transducer (photo courtesy of Medtronic) 19
3.1 Charge amplier and isolation amplier circuit design . . . . . 273.2 Preamplier box . . . . . . . . . . . . . . . . . . . . . . . . . 273.3 Isolation ampliers and the DC/DC converter mounted within
the enclosure . . . . . . . . . . . . . . . . . . . . . . . . . . . 283.4 Preampliers ready for package sealing and ethylene-oxide
sterilization . . . . . . . . . . . . . . . . . . . . . . . . . . . . 293.5 Triboelectric sensor - measurement setup . . . . . . . . . . . . 303.6 Custom-made ICD lead used for animal experiments. White
arrow points to the RV high-voltage coil. Looking from leftto right, the connectors belong to the RV coil, the pace/senseconductor and the dead-end conductor normally used for SVCHV coil in dual-coil leads. . . . . . . . . . . . . . . . . . . . . 32
3.7 Custom-made 2-microdot electrodes lead for tricuspid owmeasurement. (1) - connectors for wires leading to the plat-inum dots (3) positioned in the tricuspid valve; (2) - connectorfor the dead-end lead. . . . . . . . . . . . . . . . . . . . . . . . 32
93

LIST OF FIGURES
3.8 Custom-made 6-ring lead used for animal experiments. Thetip is positioned in RV apex. The ring electrodes are equallyspaced and positioned in RA and in the tricuspid valve. . . . . 33
3.9 Triboelectric signal acquired during sinus rhythm (around 105bpm) between the pace/sense conductor and the dead-end con-ductor. . . . . . . . . . . . . . . . . . . . . . . . . . . . . . . . 34
3.10 Triboelectric signal acquired during dobutamine infusion(around 195 bpm) between the pace/sense conductor and thedead-end conductor. . . . . . . . . . . . . . . . . . . . . . . . 35
3.11 Power spectral density for sequences obtained between thepace/sense conductor and the dead-end conductor of the ICDlead. . . . . . . . . . . . . . . . . . . . . . . . . . . . . . . . . 35
3.12 Triboelectric signal measured between the pace/sense coil con-ductor and the nylon-coated stylet with the moving averagetrendline superimposed. . . . . . . . . . . . . . . . . . . . . . 36
3.13 The implanter is introducing the stylet in the lumen of thepace/sense conductor of the 6-ring lead. The remaining sixconnectors belong to the ring electrodes. . . . . . . . . . . . . 37
3.14 Triboelectric signal in the 6-ring lead measured between theSuron stylet and the conductor belonging to the middle 3rd
ring electrode. The moving average trendline is superimposed. 373.15 The original signal is masked by strong noise. Reconstructed
signal after ltering is good enough for a successful contractiondetection. . . . . . . . . . . . . . . . . . . . . . . . . . . . . . 39
3.16 Triboelectric signal measured in atrial (ATS) and ventricular(VTS) channel using the nylon stylets. . . . . . . . . . . . . . 40
3.17 AV block Mobitz 2nd degree. Triboelectric signal in the VDDlead with the nylon-stylet. Non-conducted P-waves producelarger triboelectric signals compared to conducted atrial de-polarization. . . . . . . . . . . . . . . . . . . . . . . . . . . . . 41
3.18 Shorter coupling interval causes the decrease of TS amplitude. 423.19 Electromechanical dissociation at the 4th QRS complex and
the decrease of TS amplitude in a shorter coupling intervalafter the 6th QRS complex. . . . . . . . . . . . . . . . . . . . . 42
3.20 Shorter stylet in the ventricular lead results in triboelectricsignal representing both atrial and ventricular contraction. . . 43
3.21 TS measured between the PTFE Belden wire used as styletand the inner conductor of the ventricular pacing lead. . . . . 43
3.22 TS signal during pacing has a much dierent morphology com-pared to the sinus rhythm. Loss of capture was correctly iden-tied after the 3rd QRS complex. . . . . . . . . . . . . . . . . 44
94

LIST OF FIGURES
4.1 Straight and J-shaped pacing lead - photo courtesy of Medtronic 524.2 Dierent types of lead design: Coaxial, parallel and co-radial
conductors (from left to right) - photo courtesy of Medtronic . 534.3 Comparison of characteristic impedance values at 5, 10 and 20
MHz for dry old leads (10 years ago) and after being kept insaline for a decade. . . . . . . . . . . . . . . . . . . . . . . . . 54
4.4 Comparison of attenuation coecient values at 10 and 21 MHzfor dry old leads (10 years ago) and after being kept in salinefor a decade. . . . . . . . . . . . . . . . . . . . . . . . . . . . . 55
4.5 Comparison of characteristic impedance values between 1 and21 MHz for all new leads. Shadowed zone comprises the curvesfor all remaining pacing leads not shown separately. The mea-surements of dierent combinations of parallel conductors indebrillation leads are shown in an average value curve withstandard deviation superimposed. . . . . . . . . . . . . . . . . 56
4.6 The curve of characteristic impedance for straight leads (4092and 5092) is almost identical in the whole frequency range.Very similar results are obtained for J-shaped leads (4592 and5592). The shape of the cardiac lead plays a primary role inHF parameters. . . . . . . . . . . . . . . . . . . . . . . . . . . 57
4.7 Attenuation coecient values between 1 and 21 MHz for allnew leads. Shadowed zone comprises the curves for all remain-ing pacing leads not shown separately. The measurements ofdierent combinations of parallel conductors in debrillationleads are shown in an average value curve with standard de-viation superimposed. Co-radial leads 4196 and 4396 have acompletely dierent curve compared to parallel and coaxialleads. . . . . . . . . . . . . . . . . . . . . . . . . . . . . . . . . 58
4.8 Attenuation coecient values between 1 and 21 MHz for Cap-sure SP Novus leads. The straight leads 4092 and 5092 arepresenting almost identical values of attenuation coecient inthe whole frequency range. J-shaped leads have a very similarbehavior, although not completely identical. . . . . . . . . . . 59
5.1 High frequency sensor - measurement setup . . . . . . . . . . . 635.2 Sterile black coaxial RG59 cable is terminated by alligator
clips. Grey cable is connected to the pacemaker signal ana-lyzer (PSA) for standard threshold-sensing testing. The sur-geon xes the 75 ohm resistor to the alligator clips for thethird phase of the measurement system calibration. . . . . . . 64
95

LIST OF FIGURES
5.3 Reection coecient signal (|Γ|) measured in the ICD leadbetween the pace/sense conductors at 10 MHz during sinusrhythm (95 bpm). The middle waveform is the ventricularunipolar EGM. . . . . . . . . . . . . . . . . . . . . . . . . . . 66
5.4 Reection coecient signal (|Γ|) measured in the ICD leadbetween the pace/sense conductors at 10 MHz during dobu-tamine test (188 bpm). The middle waveform is the ventricularunipolar EGM. . . . . . . . . . . . . . . . . . . . . . . . . . . 66
5.5 Reection coecient signal (|Γ|) measured in the ICD leadbetween the pace/sense conductors at 10 MHz during sinusrhythm (95 bpm). The middle waveform is the ventricularunipolar EGM. Dierent phases of the cardiac cycle are shown. 67
5.6 Reection coecient signal (|Γ|) measured in the ICD leadbetween the pace/sense conductors at 10 MHz during dobu-tamine test (188 bpm). The middle waveform is the ventricularunipolar EGM. Dierent phases of the cardiac cycle are shown. 68
5.7 Reection coecient signal (|Γ|) measured in the ICD leadbetween the pace/sense conductors at 10 MHz during sinusrhythm (95 bpm). The arrows are pointing to the start of thesystole (waveform minima) and to its end points (waveformmaxima) with respective values . . . . . . . . . . . . . . . . . 69
5.8 Reection coecient signal (|Γ|) measured in the ICD leadbetween the pace/sense conductors at 10 MHz during dobu-tamine test (188 bpm). The arrows are pointing to the startof the systole (waveform minima) and to its end points (wave-form maxima) with respective values . . . . . . . . . . . . . . 69
5.9 Reection coecient signal (|Γ|) measured in the atrial bipolarlead at 20 MHz. The middle waveform is atrial unipolar EGM.PVC inuences the atrial lead bending. . . . . . . . . . . . . . 72
5.10 Reection coecient signal (|Γ|) measured in the debrillationlead between SVC and RV ring connector pins at 10 MHz.Atrial pacing at 130 ppm provoked 2:1 AV block. . . . . . . . 73
5.11 Reection coecient signal (|Γ|) measured in the debrillationlead between HVB and RV ring connector pins at 10 MHz.The middle waveform is ventricular unipolar EGM. HF sensorsignal amplitude variation in related to R-R interval variation. 73
5.12 Reection coecient signal (|Γ|) measured in the debrillationlead between HVB and RV ring connector pins at 10 MHz. Themiddle waveform is ventricular unipolar EGM. Intermittentloss of capture occurs during RV pacing at 90 ppm. . . . . . . 74
96

List of Tables
2.1 NBG pacing mode codes . . . . . . . . . . . . . . . . . . . . . 15
3.1 Triboelectric series . . . . . . . . . . . . . . . . . . . . . . . . 25
4.1 Propagation speed measurement results for silicone andpolyurethane leads . . . . . . . . . . . . . . . . . . . . . . . . 50
4.2 New pacing and debrillation leads (ETFE - Ethylene tetrau-oroethylene, Silicone MDX - Medical grade silicone, Silicone4719 and 4755 - High performance silicone elastomer) . . . . . 53
97


References
[1] A. W. C. Chow and A. E. Buxton, eds., Implantable Cardiac Pacemakersand Debrillators: All You Wanted to Know. Blackwell Publishing Ltd,Oxford, UK, 2006.
[2] M. A. Wood and K. A. Ellenbogen, Cardiology patient pages. car-diac pacemakers from the patient's perspective., Circulation, vol. 105,pp. 21362138, May 2002.
[3] A. Norlin, Investigation of electrochemical properties and performance ofstimulation/sensing electrodes for pacemaker applications. PhD thesis,Department of Materials Science and Engineering, Royal Institute ofTechnology, Stockholm, Sweden, 2005.
[4] K. Ellenbogen, B. Wilko, G. N. Kay, and C. P. Lau, eds., Clinical Car-diac Pacing, Debrillation and Resynchronization Therapy. Saunders,Philadelphia, PA, USA, 3rd ed., 2007.
[5] D. R. Daum, B. R. Jones, and D. J. Lang, Hemodynamic sensors., AmJ Cardiol, vol. 86, pp. 95K100K, Nov 2000.
[6] C.-P. Lau and H.-F. Tse, Hemodynamic sensors in heart failure devices,in Devices for Cardiac Resynchronization (S. S. Barold and P. Ritter,eds.), pp. 253268, Springer US, 2008.
[7] C. M. Yu, Impedance measurements from implanted devices provideautomated prediction of chf hospitalization, European Heart Journal,Suppl. 1, vol. 25, p. 27, 2004.
[8] A. Nohria and A. Bhatt, Hemodynamic monitoring in heart failure,in Device Therapy in Heart Failure (W. H. Maisel, ed.), ch. 5, HumanaPress, New York, USA, 1st ed., 2009.
99

REFERENCES
[9] A. F. Rickards, T. Bombardini, G. Corbucci, and G. Plicchi, An im-plantable intracardiac accelerometer for monitoring myocardial contrac-tility. the multicenter pea study group., Pacing Clin Electrophysiol,vol. 19, pp. 20662071, Dec 1996.
[10] D. Gras, L. Kubler, P. Ritter, F. Anselme, P. P. Delnoy, P. Bordachar,F. Renesto, and P. Mabo, Recording of peak endocardial acceleration inthe atrium., Pacing Clin Electrophysiol, vol. 32 Suppl 1, pp. S240S246,Mar 2009.
[11] P. P. Delnoy, E. Marcelli, H. Oudeluttikhuis, D. Nicastia, F. Ren-esto, L. Cercenelli, and G. Plicchi, Validation of a peak endocar-dial acceleration-based algorithm to optimize cardiac resynchronization:early clinical results., Europace, vol. 10, pp. 801808, Jul 2008.
[12] S. Osswald, T. Cron, C. Graedel, P. Hilti, M. Lippert, J. Stroebel,M. Schaldach, P. Buser, and M. Psterer, Closed-loop stimulation us-ing intracardiac impedance as a sensor principle: correlation of rightventricular dp/dtmax and intracardiac impedance during dobutaminestress test., Pacing Clin Electrophysiol, vol. 23, pp. 15021508, Oct2000.
[13] M. Coenen, K. Malinowski, W. Spitzer, A. Schuchert, D. Schmitz,M. Anelli-Monti, S. K. G. Maier, W. Estlinbaum, A. Bauer, H. Muehling,F. Kalscheur, K. Puerner, J. Boergel, and S. Osswald, Closed loop stim-ulation and accelerometer-based rate adaptation: results of the providestudy., Europace, vol. 10, pp. 327333, Mar 2008.
[14] P. Zecchi, F. Bellocci, T. Sanna, G. D. Martino, M. Alviti, and R. Au-doglio, Closed loop stimulation vs. conventional dddr pacing: Benetsof hemodynamic pacing, Prog. Biomed. Res, vol. 5, pp. 292296, June2000.
[15] R. Quaglione, G. Calcagnini, F. Censi, M. Malavasi, M. Raveggi,G. Biancalana, P. Bartolini, and G. Critelli, Eect of pacemaker rate-adaptation on 24h beat-to-beat heart rate and blood pressure proles,Europace, vol. 7, no. 4, pp. 366373, 2005.
[16] S. Chandiramani, L. C. Cohorn, and S. Chandiramani, Heart ratechanges during acute mental stress with closed loop stimulation: reporton two single-blinded, pacemaker studies., Pacing Clin Electrophysiol,vol. 30, pp. 976984, Aug 2007.
100

REFERENCES
[17] G. Gasparini, A. Curnis, M. Gulizia, E. Occhetta, A. Corrado, L. Bon-tempi, G. Mascioli, G. M. Francese, M. Bortnik, A. Magnani, F. D.Gregorio, A. Barbetta, and A. Raviele, Rate-responsive pacing regu-lated by cardiac haemodynamics., Europace, vol. 7, pp. 234241, May2005.
[18] K. Hoeland, A. Kloppe, M. Hexamer, G. Nowack, and J. Werner, Newsensor based on bre optics for measurement of heart movement., MedBiol Eng Comput, vol. 40, pp. 571575, Sep 2002.
[19] A. Kloppe, K. Hoeland, S. Mueller, M. Hexamer, G. Nowack, A. Muegge,and J. Werner, Mechanical and optical characteristics of a new beroptical system used for cardiac contraction measurement., Med EngPhys, vol. 26, pp. 687694, Oct 2004.
[20] S. V. Beliaev, S. P. Berdnikov, S. P. Mikhailov, and D. Y. Tobolin, Heartrate variability over 24 hours closed loop stimulation and motion-sensorpacemakers compared with healthy control group, Prog. Biomed. Res,vol. 4, pp. 146148, April 1999.
[21] M. Bongiorni, E. Soldati, G. Arena, G. Giannola, C. Bartoli, A. Bar-betta, and F. D. Gregorio, Haemodynamic assessment by transvalvu-lar impedance recording, Emerging Pathologies in Cardiology, vol. 6,pp. 323330, 2005.
[22] J. Frielingsdorf, A. E. Gerber, P. Dur, A. Vuilliomenet, and O. Bertel,Importance of an individually programmed atrioventricular delay atrest and on work capacity in patients with dual chamber pacemakers.,Pacing Clin Electrophysiol, vol. 17, pp. 3745, Jan 1994.
[23] D. Mehta, S. Gilmour, D. E. Ward, and A. J. Camm, Optimal atrioven-tricular delay at rest and during exercise in patients with dual chamberpacemakers: a non-invasive assessment by continuous wave doppler., BrHeart J, vol. 61, pp. 161166, Feb 1989.
[24] N. Keller, M. Cikes, B. P. Nikolic, B. Buljevic, D. Puljevic, D. Tomasic,J. S. Hanzevacki, D. Milicic, and B. Bijnens, The acute impact of crt onleft ventricular function - the role of intraoperative echocardiography,in 19th Annual Meeting of the Mediterranean Association of Cardiologyand Cardiac Surgery - MACCS, Opatija, Croatia, 2007.
[25] M. Cikes, B. Bijnens, H. Gasparovic, F. Siric, M. Lovric-Bencic, V. Ve-lagic, D. Lovric, J. Samardzic, D. Tomasic, D. Milicic, and B. Biocina,
101
REFERENCES
Can intraoperative transoesophageal echocardiography guide lv leadplacement during surgical crt implantation?, in 8th Congress of theCroatian Cardiac Society, Opatija, Croatia, 2010.
[26] P. Ritter, L. Padeletti, L. Gillio-Meina, and G. Gaggini, Determina-tion of the optimal atrioventricular delay in ddd pacing. comparisonbetween echo and peak endocardial acceleration measurements., Eu-ropace, vol. 1, pp. 126130, Apr 1999.
[27] J.-M. Dupuis, A. Kobeissi, L. Vitali, G. Gaggini, M. Merheb, F. Rouleau,G. Leftheriotis, P. Ritter, and J. Victor, Programming optimal atrioven-tricular delay in dual chamber pacing using peak endocardial accelera-tion: comparison with a standard echocardiographic procedure., PacingClin Electrophysiol, vol. 26, pp. 210213, Jan 2003.
[28] B. Ferek-Petric, Methods for adjusting cardiac detection criteria andimplantable medical devices using same. U.S. Patent 6 873 870, March2005.
[29] B. Ferek-Petric, Cardiac therapy system including a triboelectric sen-sor. U.S. Patent 7 780 607, August 2010.
[30] R. C. Allen, Triboelectric generation: getting charged, EE Eval. Eng.,vol. 39, November 2000.
[31] E. P. Fowler, Microphony of coaxial cables, Proceedings of the Institu-tion of Electrical Engineers, vol. 123, pp. 10431046, October 1976.
[32] X.-D. Shi, Mechanism analysis and performance improvement of elec-trostatic noise in co-axial cable, in Proc. Conf Industry ApplicationsSociety Annual Meeting Record of the 1992 IEEE, pp. 16181621, 1992.
[33] B. Mund, Measuring of cable microphony attenuation, Wire Industry,vol. 63, pp. 376380, May 1996.
[34] Frequency response. National Instruments Application Guide, March2003.
[35] D. Tomasic, B. Ferek-Petric, S. Brusich, and A. P. Accardo, Acuteanimal and human study of tensiometric pacing lead sensor based ontriboelectricity. Under revision: IEEE Transactions On Biomedical En-gineering.
102

REFERENCES
[36] D. Tomasic, B. Ferek-Petric, and S. Brusich, Hemodynamic sensor instylet channel - acute human experiment, in XIV International Sym-posium on Progress in Clinical Pacing, Rome, Italy, 2010.
[37] B. Ferek-Petric, Cardiac Pacing Based on Intracardiac Flow Measure-ment. PhD thesis, University of Zagreb, Faculty of Electrical Engineeringand Computing, Zagreb, Croatia, 2005.
[38] Medtronic Inc., Minneapolis, MN USA, Sprint Quattro Secure S 6935Technical Manual, 2008.
[39] B. Ferek-Petric, Cardiac electrotherapy device for cardiac contractionmeasurement. U.S. Patent 5 693 074, December 1997.
[40] D. Tomasic, B. Ferek-Petric, S. Brusich, and A. P. Accardo, Acute andchronic high frequency properties of cardiac pacing and debrillationleads. Under revision: IEEE Transactions On Biomedical Engineering.
[41] W. C. Johnson, Transmission lines and networks. McGraw-Hill BookCompany, 1950.
[42] D. M. Pozar, Microwave Engineering. John Wiley & Sons, 1998.
[43] A. Technologies, Agilent network analyzer basics, USA, 2004.
[44] W. H. Hayt and J. A. Buck, Engineering Electromagnetics. McGrawHill, 6 ed., 2001.
[45] C. U. NuSil Tech., Carpinteria, Med-4719 silicone elastomer data sheet,2005.
[46] H. Tandri, M. M. Zviman, S. R. Wedan, T. Lloyd, R. D. Berger, andH. Halperin, Determinants of gradient eld-induced current in a pace-maker lead system in a magnetic resonance imaging environment.,Heart Rhythm, vol. 5, pp. 462468, Mar 2008.
[47] J. J. Karakash, Transmission Lines and Filter Networks. 1950.
[48] B. Ferek-Petric, Method and apparatus for administering cardiac elec-trotherapy dependent on mechanical and electrical cardiac activity. U.S.Patent 5 271 392, December 1993.
[49] J. Clementy, Dual chamber rate responsive pacing system driven by con-tractility: nal assessment after 1-year follow-up. the european pea clin-ical investigation group., Pacing Clin Electrophysiol, vol. 21, pp. 21922197, Nov 1998.
103

REFERENCES
[50] H. Langenfeld, A. Krein, M. Kirstein, and L. Binner, Peak endocar-dial acceleration-based clinical testing of the "best" dddr pacemaker.european pea clinical investigation group., Pacing Clin Electrophysiol,vol. 21, pp. 21872191, Nov 1998.
[51] T. Bombardini, E. Marcelli, E. Picano, B. Borghi, P. Fedriga, B. Gar-beroglio, G. Gaggini, and G. Plicchi, Operator independent left ventric-ular function monitoring during pharmacological stress echo with thenew peak transcutaneous acceleration signal., Heart, vol. 85, pp. 286289, Mar 2001.
[52] S. K. Leung, C. P. Lau, C. T. Lam, S. Ho, H. F. Tse, C. M. Yu, K. Lee,M. O. Tang, K. M. To, and F. Renesto, Automatic optimization ofresting and exercise atrioventricular interval using a peak endocardialacceleration sensor: validation with doppler echocardiography and di-rect cardiac output measurements., Pacing Clin Electrophysiol, vol. 23,pp. 17621766, Nov 2000.
[53] L. Padeletti, M. C. Porciani, P. Ritter, A. Michelucci, A. Colella, P. Pier-agnoli, A. Costoli, C. Ciapetti, A. Sabini, G. Demarchi, L. Gillio-Meina,G. Gaggini, and G. F. Gensini, Atrioventricular interval optimizationin the right atrial appendage and interatrial septum pacing: a compar-ison between echo and peak endocardial acceleration measurements.,Pacing Clin Electrophysiol, vol. 23, pp. 16181622, Nov 2000.
[54] P. Bordachar, S. Garrigue, S. Reuter, M. Hocini, A. Kobeissi, G. Gaggini,P. Jais, M. Haissaguerre, and J. Clementy, Hemodynamic assessmentof right, left, and biventricular pacing by peak endocardial accelerationand echocardiography in patients with end-stage heart failure., PacingClin Electrophysiol, vol. 23, pp. 17261730, Nov 2000.
[55] T. Bombardini, G. Gaggini, E. Marcelli, M. Parlapiano, and G. Plicchi,Peak endocardial acceleration reects heart contractility also in atrialbrillation., Pacing Clin Electrophysiol, vol. 23, pp. 13811385, Sep2000.
[56] C. I. O. Brookes, P. A. White, M. Staples, P. J. Oldershaw, A. N. Red-ington, P. D. Collins, and M. I. M. Noble, Myocardial contractility is notconstant during spontaneous atrial brillation in patients, Circulation,vol. 98, no. 17, pp. 17621768, 1998.
[57] R. J. Raymond, A. J. Lee, F. C. Messineo, W. J. Manning, and D. I.Silverman, Cardiac performance early after cardioversion from atrial
104
REFERENCES
brillation, American Heart Journal, vol. 136, pp. 435442, September1998.
[58] J. C. Deharo, J. P. Peyre, P. H. Ritter, T. Chalvidan, Y. Berland, andP. Djiane, A sensor-based evaluation of heart contractility in patientswith head-up tilt-induced syncope., Pacing Clin Electrophysiol, vol. 21,pp. 223226, Jan 1998.
[59] M. Brignole, C. Menozzi, G. Corbucci, B. Garberoglio, and G. Plicchi,Detecting incipient vasovagal syncope: intraventricular acceleration.,Pacing Clin Electrophysiol, vol. 20, pp. 801805, Mar 1997.
105