![1 £ 1 1 1 1 1 ï 1 1 1 £ 1 1 1 1 1 1 1 ... - EuroStudium · (xurvwxglxp z jhqqdlr jlxjqr 1 [ x 1) 0dlr]]l /d 5lyrox]lrqh 1 1. (xurvwxglxp z jhqqdlr jlxjqr 1 [ y 1) 0dlr]]l /d 5lyrox]lrqh](https://static.fdocumenti.com/doc/165x107/5fc60ea4d563330c12652014/1-1-1-1-1-1-1-1-1-1-1-1-1-1-1-1-xurvwxglxp-z-jhqqdlr-jlxjqr-1-.jpg)
Autophagy 11:2, 253--270; February 2015; © 2015 Taylor ... · Lucia Polletta,1 Enza Vernucci,1...
18
SIRT5 regulation of ammonia-induced autophagy and mitophagy Lucia Polletta, 1 Enza Vernucci, 1 Ilaria Carnevale, 1 Tania Arcangeli, 1 Dante Rotili, 2 Silvia Palmerio, 1 Clemens Steegborn, 3 Theresa Nowak, 4 Mike Schutkowski, 4 Laura Pellegrini, 5 Luigi Sansone, 1,6 Lidia Villanova, 1,7 Alessandra Runci, 1,6 Bruna Pucci, 6 Emanuela Morgante, 1 Massimo Fini, 6 Antonello Mai, 2,8 Matteo A Russo, 6 and Marco Tafani 1,6, * 1 Department of Experimental Medicine; University of Rome; Sapienza; Rome, Italy; 2 Department of Drug Chemistry and Technologies; University of Rome; Sapienza, Rome, Italy; 3 Department of Biochemistry; University of Bayreuth; Bayreuth, Germany; 4 Institut f€ ur Biochemie & Biotechnologie; Martin-Luther-Universit€ at Halle-Wittenberg; Halle, Germany; 5 John A. Burns School of Medicine; University of Hawaii Cancer Center; University of Hawaii; Honolulu, HI USA; 6 Department of Cellular and Molecular Pathology; IRCCS San Raffaele; Rome, Italy; 7 Division of Endocrinology; Gerontology; and Metabolism; Department of Medicine; Stanford University; Stanford, CA USA; 8 Pasteur Institute; Cenci Bolognetti Foundation; University of Rome; Sapienza, Rome, Italy Keywords: ammonia, autophagy, glutaminase, glutamine, mitophagy, molecular rehabilitation, mitochondrial dynamics sirtuin 5, succinylation Abbreviations: ACTB, actin, b; ATG, autophagy-related; BNIP3, BCL2/adenovirus E1B 19kDa interacting protein 3; BPTES, bis-2- (5-phenylacetamido-1, 3, 4-thiadiazol-2-yl)ethyl sulfide; COX4I1, cytochrome c oxidase subunit IV isoform 1; CPS1, carbamoyl- phosphate synthase 1, mitochondrial; GABARAP, GABA(A) receptor-associated protein; GABARAPL2, GABA(A) receptor- associated protein-like 2; GLS, glutaminase; GLUD1, glutamate dehydrogenase 1; GLUL, glutamate-ammonia ligase; hexachloro- phene, 2, 2 0 -methylenebis(3, 4, 6-trichlorophenol); MAP1LC3B, microtubule-associated protein 1 light chain 3 b; MFN2, mitofusin 2; OPA1, optic atrophy 1 (autosomal dominant); PARK2, parkin RBR E3 ubiquitin protein ligase; PEG, polyethylene glycol; PINK1, PTEN induced putative kinase 1; SIRT5, sirtuin 5; SQSTM1, sequestosome 1; TCA, tricarboxylic acid cycle; TEM, transmission electron microscopy. In liver the mitochondrial sirtuin, SIRT5, controls ammonia detoxification by regulating CPS1, the first enzyme of the urea cycle. However, while SIRT5 is ubiquitously expressed, urea cycle and CPS1 are only present in the liver and, to a minor extent, in the kidney. To address the possibility that SIRT5 is involved in ammonia production also in nonliver cells, clones of human breast cancer cell lines MDA-MB-231 and mouse myoblast C2C12, overexpressing or silenced for SIRT5 were produced. Our results show that ammonia production increased in SIRT5-silenced and decreased in SIRT5- overexpressing cells. We also obtained the same ammonia increase when using a new specific inhibitor of SIRT5 called MC3482. SIRT5 regulates ammonia production by controlling glutamine metabolism. In fact, in the mitochondria, glutamine is transformed in glutamate by the enzyme glutaminase, a reaction producing ammonia. We found that SIRT5 and glutaminase coimmunoprecipitated and that SIRT5 inhibition resulted in an increased succinylation of glutaminase. We next determined that autophagy and mitophagy were increased by ammonia by measuring autophagic proteolysis of long-lived proteins, increase of autophagy markers MAP1LC3B, GABARAP, and GABARAPL2, mitophagy markers BNIP3 and the PINK1-PARK2 system as well as mitochondrial morphology and dynamics. We observed that autophagy and mitophagy increased in SIRT5-silenced cells and in WT cells treated with MC3482 and decreased in SIRT5-overexpressing cells. Moreover, glutaminase inhibition or glutamine withdrawal completely prevented autophagy. In conclusion we propose that the role of SIRT5 in nonliver cells is to regulate ammonia production and ammonia-induced autophagy by regulating glutamine metabolism. Introduction Autophagy is a tightly regulated process used to remove cyto- solic components or damaged organelles starting with the forma- tion of double-membrane vesicles called autophagosomes. 1 Subsequently, autophagosomes fuse and deliver their cargo to lysosomes for degradation and recycling. 1 Initially thought of as a random process, autophagy is now regarded as an adaptive response specifically activated by stress or environmental changes. 2 From a molecular point of view, autophagy starts with the for- mation of a phagophore which requires the assembly of a protein complex composed of BECN1 (Beclin 1, autophagy-related), AMBRA1 (autophagy/Beclin 1 regulator 1), PIK3R4 (phosphoi- nositide-3-kinase, regulatory subunit 4) and PIK3C3 (phosphati- dylinositol 3-kinase, catalytic subunit type 3), the catalytic *Correspondence to: Marco Tafaniz; Email: [email protected] Submitted: 12/20/2014; Revised: 05/28/2014; Accepted: 09/12/2014 http://dx.doi.org/10.1080/15548627.2015.1009778 This is an Open Access article distributed under the terms of the Creative Commons Attribution-Non-Commercial License (http://creativecommons.org/licenses/ by-nc/3.0/), which permits unrestricted non-commercial use, distribution, and reproduction in any medium, provided the original work is properly cited. The moral rights of the named author(s) have been asserted. www.tandfonline.com 253 Autophagy Autophagy 11:2, 253--270; February 2015; © 2015 Taylor & Francis Group, LLC BASIC RESEARCH PAPER
Transcript of Autophagy 11:2, 253--270; February 2015; © 2015 Taylor ... · Lucia Polletta,1 Enza Vernucci,1...

SIRT5 regulation of ammonia-induced autophagyand mitophagy
Lucia Polletta,1 Enza Vernucci,1 Ilaria Carnevale,1 Tania Arcangeli,1 Dante Rotili,2 Silvia Palmerio,1 Clemens Steegborn,3
Theresa Nowak,4 Mike Schutkowski,4 Laura Pellegrini,5 Luigi Sansone,1,6 Lidia Villanova,1,7 Alessandra Runci,1,6 Bruna Pucci,6
Emanuela Morgante,1 Massimo Fini,6 Antonello Mai,2,8 Matteo A Russo,6 and Marco Tafani1,6,*
1Department of Experimental Medicine; University of Rome; Sapienza; Rome, Italy; 2Department of Drug Chemistry and Technologies; University of Rome; Sapienza, Rome, Italy;3Department of Biochemistry; University of Bayreuth; Bayreuth, Germany; 4Institut f€ur Biochemie & Biotechnologie; Martin-Luther-Universit€at Halle-Wittenberg; Halle, Germany;
5John A. Burns School of Medicine; University of Hawaii Cancer Center; University of Hawaii; Honolulu, HI USA; 6Department of Cellular and Molecular Pathology; IRCCS San
Raffaele; Rome, Italy; 7Division of Endocrinology; Gerontology; and Metabolism; Department of Medicine; Stanford University; Stanford, CA USA; 8Pasteur Institute; Cenci
Bolognetti Foundation; University of Rome; Sapienza, Rome, Italy
Keywords: ammonia, autophagy, glutaminase, glutamine, mitophagy, molecular rehabilitation, mitochondrial dynamicssirtuin 5, succinylation
Abbreviations: ACTB, actin, b; ATG, autophagy-related; BNIP3, BCL2/adenovirus E1B 19kDa interacting protein 3; BPTES, bis-2-(5-phenylacetamido-1, 3, 4-thiadiazol-2-yl)ethyl sulfide; COX4I1, cytochrome c oxidase subunit IV isoform 1; CPS1, carbamoyl-phosphate synthase 1, mitochondrial; GABARAP, GABA(A) receptor-associated protein; GABARAPL2, GABA(A) receptor-
associated protein-like 2; GLS, glutaminase; GLUD1, glutamate dehydrogenase 1; GLUL, glutamate-ammonia ligase; hexachloro-phene, 2, 20-methylenebis(3, 4, 6-trichlorophenol); MAP1LC3B, microtubule-associated protein 1 light chain 3 b; MFN2, mitofusin
2; OPA1, optic atrophy 1 (autosomal dominant); PARK2, parkin RBR E3 ubiquitin protein ligase; PEG, polyethylene glycol;PINK1, PTEN induced putative kinase 1; SIRT5, sirtuin 5; SQSTM1, sequestosome 1; TCA, tricarboxylic acid cycle;
TEM, transmission electron microscopy.
In liver the mitochondrial sirtuin, SIRT5, controls ammonia detoxification by regulating CPS1, the first enzyme of theurea cycle. However, while SIRT5 is ubiquitously expressed, urea cycle and CPS1 are only present in the liver and, to aminor extent, in the kidney. To address the possibility that SIRT5 is involved in ammonia production also in nonlivercells, clones of human breast cancer cell lines MDA-MB-231 and mouse myoblast C2C12, overexpressing or silenced forSIRT5 were produced. Our results show that ammonia production increased in SIRT5-silenced and decreased in SIRT5-overexpressing cells. We also obtained the same ammonia increase when using a new specific inhibitor of SIRT5 calledMC3482. SIRT5 regulates ammonia production by controlling glutamine metabolism. In fact, in the mitochondria,glutamine is transformed in glutamate by the enzyme glutaminase, a reaction producing ammonia. We found thatSIRT5 and glutaminase coimmunoprecipitated and that SIRT5 inhibition resulted in an increased succinylation ofglutaminase. We next determined that autophagy and mitophagy were increased by ammonia by measuringautophagic proteolysis of long-lived proteins, increase of autophagy markers MAP1LC3B, GABARAP, and GABARAPL2,mitophagy markers BNIP3 and the PINK1-PARK2 system as well as mitochondrial morphology and dynamics. Weobserved that autophagy and mitophagy increased in SIRT5-silenced cells and in WT cells treated with MC3482 anddecreased in SIRT5-overexpressing cells. Moreover, glutaminase inhibition or glutamine withdrawal completelyprevented autophagy. In conclusion we propose that the role of SIRT5 in nonliver cells is to regulate ammoniaproduction and ammonia-induced autophagy by regulating glutamine metabolism.
Introduction
Autophagy is a tightly regulated process used to remove cyto-solic components or damaged organelles starting with the forma-tion of double-membrane vesicles called autophagosomes.1
Subsequently, autophagosomes fuse and deliver their cargo tolysosomes for degradation and recycling.1 Initially thought of asa random process, autophagy is now regarded as an adaptive
response specifically activated by stress or environmentalchanges.2
From a molecular point of view, autophagy starts with the for-mation of a phagophore which requires the assembly of a proteincomplex composed of BECN1 (Beclin 1, autophagy-related),AMBRA1 (autophagy/Beclin 1 regulator 1), PIK3R4 (phosphoi-nositide-3-kinase, regulatory subunit 4) and PIK3C3 (phosphati-dylinositol 3-kinase, catalytic subunit type 3), the catalytic
*Correspondence to: Marco Tafaniz; Email: [email protected]: 12/20/2014; Revised: 05/28/2014; Accepted: 09/12/2014http://dx.doi.org/10.1080/15548627.2015.1009778
This is an Open Access article distributed under the terms of the Creative Commons Attribution-Non-Commercial License (http://creativecommons.org/licenses/by-nc/3.0/), which permits unrestricted non-commercial use, distribution, and reproduction in any medium, provided the original work is properly cited. Themoral rights of the named author(s) have been asserted.
www.tandfonline.com 253Autophagy
Autophagy 11:2, 253--270; February 2015; © 2015 Taylor & Francis Group, LLCBASIC RESEARCH PAPER

subunit of PtdIns3K.3,4 Subsequently, the phagophore mem-brane expands by the action of 2 ubiquitin-like conjugation pro-tein systems: MAP1LC3B (microtubule-associated protein 1light chain 3 b) and ATG12 (autophagy related 12)-ATG5 thatassemble with ATG16L1 (autophagy related 16-like 1 [S. cerevi-siae]) to promote cleavage and lipidation of MAP1LC3B by addi-tion of phosphatidyethanolammine (PE). In this wayMAP1LC3B‒PE, also indicated as LC3-II, associates with thegrowing double-membrane structure until it closes forming theautophagosome that, as said, then fuses with a lysosome.5 Aplethora of different stimuli can influence autophagy by regulat-ing the proteins involved in autophagosome formation. In fact,nutrient starvation or rapamycin treatment can activate autoph-agy by inhibiting MTOR (mechanistic target of rapamycin [ser-ine/threonine kinase]) thereby activating the ULK1 (unc-51 likeautophagy activating kinase 1) and ULK2 proteins that, in turn,recruit other ATG proteins such as MAP1LC3B and ATG16L1to the forming autophagosome.6
Sirtuins (SIRT) are a family of NAD-dependent proteindeacetylases and/or ADP ribosylases controlling metabolichomeostasis.7-9 Because of NAD dependency sirtuins are classi-fied as class III histone deacetylase.7-9 Sirtuins have differentintracellular localization being present in the nucleus (SIRT1 [sir-tuin1] and SIRT6), nucleolus (SIRT7), cytosol (SIRT1 andSIRT2) and mitochondria (SIRT3, SIRT4, and SIRT5).Through post-translational modification of a growing number ofnonhistonic proteins and enzymes, sirtuins have been shown toplay a major role in many cellular aspects such as survival, aging,stress response, and metabolism.7-9,11 Similarly to autophagy-related genes, expression and activity of sirtuins are induced bystress and nutrients availability.10 A connection between sirtuinsand autophagy has been suggested for SIRT1 and SIRT2.12,13
SIRT1 depletion in mammalian cells is accompanied by impairedor abolished autophagy.12 Moreover, SIRT1 coimmunoprecipi-tates with ATG5, ATG7, and LC3, and Sirt1-depleted mice havea phenotype very similar to that of atg5-KO mice.12,13 Consider-ing that SIRT1 is both cytosolic and nuclear, it has been sug-gested that SIRT1 could regulate autophagy by deacetylatingautophagy proteins or, alternatively, by regulating the binding oftranscription factors to promoter regions of autophagy genes.14
Overexpression or pharmacological activation of SIRT1 inducedautophagy both in vitro and in vivo.15-17 In particular, SIRT1-induced autophagy reduced prion- and ischemia-induced neuro-toxicity,16,18 increased remodeling in postinfarction heartimproving cardiac function15 and, reduced endothelial inflam-mation after TNF treatment.19 Finally, also the longevity effectsof caloric restriction and resveratrol treatment in C. elegans havebeen linked to the activation of autophagy by SIRT1.17
In the case of SIRT2, instead, it seems that during prolongedperiods of stress, this sirtuin dissociates from FOXO1 (forkheadbox O1) an effect that results in hyperacetylation of the latter.20
Hyperacetylated FOXO1 then binds to ATG7 promotingautophagy.20 In fact, SIRT2 inhibition or downregulation isaccompanied by increased autophagy in human neuroblastomacells in the presence of proteasome inhibition.21 By contrast,SIRT2 inhibition triggers necrosis and not autophagy in mouse
Schwann cells.22 Therefore, even if SIRT2 may represent a goodcandidate for treatment of neurodegenerative disorders, morework is needed to understand its mechanism of action.
No links between autophagy and other sirtuins have beenobserved. However, the mitochondrial sirtuin, SIRT5, has beenimplicated in the control of ammonia levels by deacetylating andactivating CPS1 (carbamoyl-phosphate synthase 1, mitochon-drial), the rate-limiting enzyme of the urea cycle.23,24 In fact,Sirt5-deficient mice have 30% lower CPS1 activity and showhyper ammonemia under fasting conditions.23,24 Additionally,recent studies have shown that SIRT5 is a NAD-dependent pro-tein lysine demalonylase, desuccinylase, and deglutarylase even ofthe described deacetylase target CPS1.25,26 In particular, it seemsthat SIRT5 has a strong demalonylation, desuccinylation, anddeglutarylation activity and a weak deacetylating activity.25,26
SIRT5 is a global regulator of lysine succinylation in mitochon-dria and, in fact, MEF from Sirt5-deficient mice show a signifi-cant increase in Lys succinylation.25,26 In the case of CPS1, itsactivity was reduced in Sirt5-deficient mice due to an increasedsuccinylation and not acetylation.25 Interestingly, SIRT5 lysinedesuccinylation seems to impact enzymes involved in diversemitochondrial metabolic pathways and to inhibit biochemicalactivity and mitochondrial respiration by suppressing the activityof the pyruvate dehydrogenase complex and succinate dehydroge-nase.27,28 From these initial studies it is clear that: i) SIRT5 pos-sesses different post-translational modification activities and ii)SIRT5 influences ammonia levels by regulating CPS1 activityand urea cycle.
Recently, ammonia has been shown to induce autophagy intumor cells via a paracrine and autocrine stimulation.29,30 More-over, ammonia-induced autophagy is independent from MTORand ULK1/2.31
From these considerations we reasoned that SIRT5 could belinked to ammonia-induced autophagy. So far SIRT5 has beenshown only to regulate the urea cycle that takes place exclusivelyin the liver and, to a minor extent, in the kidney. However,SIRT5 is ubiquitously expressed in various tissues.23 Therefore,SIRT5 may probably have other substrates besides CPS1.23 Inaddition, it is possible that the metabolic pathway(s) regulated bySIRT5 in other tissues, are still those involved in the regulationof ammonia. Glutamine has an important role in the anaplerosisof the Krebs cycle and glutaminolysis is an important source ofcellular ammonia.30-32 Mitochondrial GLS (glutaminase) is thefirst enzyme in glutaminolysis.33 To date, 3 mammalian GLSshave been identified: GLS2 (glutaminase 2 [liver, mitochon-drial]), GLSK (glutaminase kidney-isoform, mitochondrial) andGLSC/glutaminase C a splice variant of GLSK (both usuallyreferred to as GLS).34 Human GLS consists of 669 amino acidsand is structured in a short mitochondrial signaling peptide, anuclear receptor box, glutaminase domain (cGLS), 3 ankyrinrepeats, and APC/C-Cdh1 specific recognition motif (KENbox).35 Interestingly, the catalytic domain of GLS is exposed inthe mitochondrial matrix and GLS(K) is often overexpressed intumors.36,37
Our hypothesis is that SIRT5 could control ammonia levelsby regulating glutaminase and glutamine metabolism and, in
254 Volume 11 Issue 2Autophagy

turn, ammonia-induced autophagy. To this effect, we produceddifferent cell lines in which SIRT5 was overexpressed or silenced.Alternatively, we also used a new specific SIRT5 inhibitor toreduce SIRT5 activity. We also inhibited glutaminase activitywith BPTES and dimethyl-a-ketoglutarate (a cell permeableform of a-ketoglutarate). In these systems we measured ammonialevels, autophagy, and mitophagy markers. Our results show thatSIRT5 controls ammonia levels by interacting and desuccinylat-ing mitochondrial GLS. Decreased ammonia production bySIRT5 is accompanied by reduced autophagy and mitophagy.
Results
Ammonia levels are increased in SIRT5-silenced and reducedin SIRT5-overexpressing cells
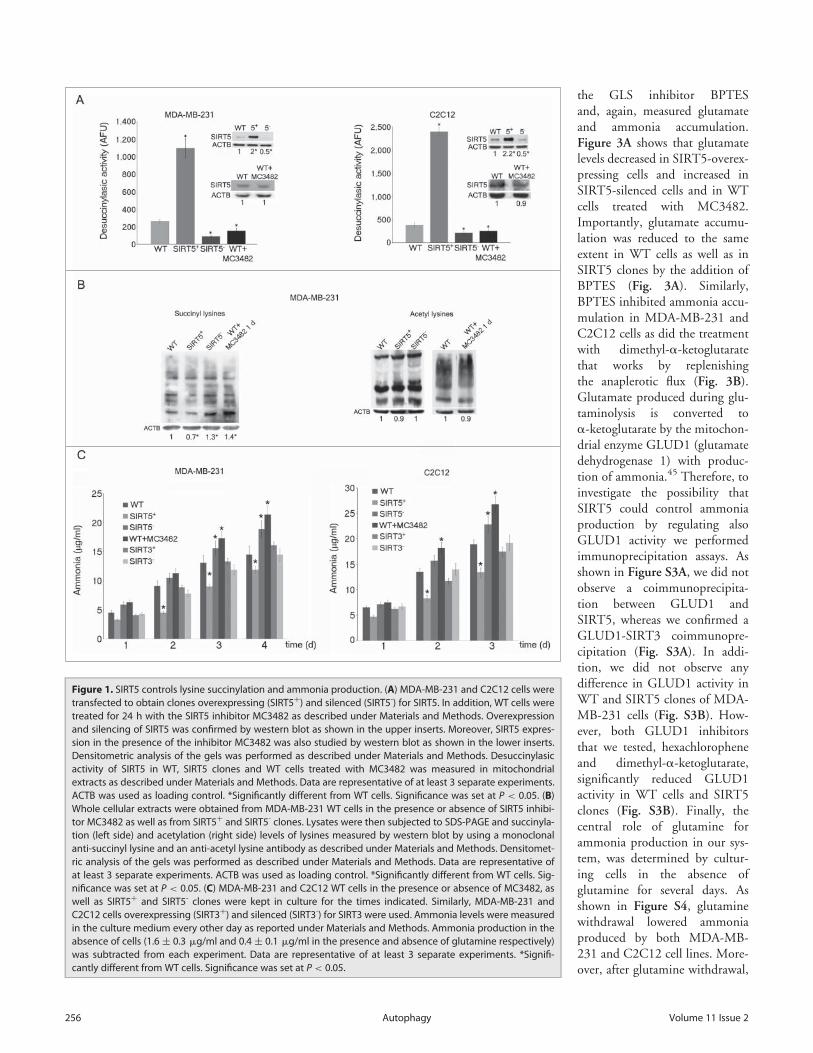
Urea cycle and ammonia levels are regulated by SIRT5through deacetylation and desuccinylation of CPS1.23-25 How-ever, urea cycle takes place in the liver whereas SIRT5 is ubiqui-tously expressed.23 What is the role of SIRT5 in other tissues? Isit always involved in the regulation of ammonia levels? To answerthese questions, we obtained SIRT5-overexpressing or silencedMDA-MB-231 and C2C12 cellular clones (upper inserts inFig. 1A). Desuccinylating activity was measured in WT, SIRT5-overexpressing or SIRT5-silenced clones. We observed that, com-pared to WT cells, SIRT5-overexpressing cells had an increaseddesuccinylating activity that was significantly reduced in SIRT5-silenced cells (Fig. 1A). In addition we also treated WT cells witha newly synthesized specific SIRT5 inhibitor called MC3482.This inhibitor was synthesized as described in the supplementarytext. The MC3482 effects on MDA-MB-231 and C2C12 cellsare shown in Figure 1A, 50 mM MC3482 inhibits SIRT5 desuc-cinylating activity without affecting SIRT5 intracellular expres-sion levels (lower inserts in Fig.1 A). The extent of inhibition ofSIRT5 by MC3482 was tested by treating MDA-MB-231 cellswith a different concentration of this compound and using acommercially available desuccinylating kit for SIRT5. Figure S1shows how SIRT5 inhibition increases when treating cells withincreasing concentration of MC3482. In particular a 42% inhibi-tion was achieved when using 50 mM MC3482. The specificityof MC3482 for SIRT5 was determined by assessing the activityof other sirtuins. Figure S2 shows that the activity of the nuclearsirtuin SIRT1 was not significantly inhibited by 50 mMMC3482. Similarly, only an 8% inhibition of the mitochondrialsirtuin SIRT3 was observed in the presence of 50 mM MC3482.Therefore, in order to avoid excessive SIRT3 inhibition byMC3482, we decided to use a 50-mM concentration throughoutthe experiments.
Protein desuccinylation was also measured with a monoclonalanti-succinyl lysine antibody on whole cellular extracts.Figure 1B shows that, compared to control WT cells, SIRT5-silenced cells and WT cells treated with the SIRT5 inhibitorMC3482 had an increase in succinylated proteins. By contrastSIRT5-overexpressing cells showed a lower succinylation(Fig. 1B). We also measured acetylation through an anti-acetyllysine antibody. In this case, we could not detect a significant
change in whole protein acetylation between WT, WT plusMC3482, and SIRT5-overexpressing or silenced cells (Fig. 1B).
To study SIRT5 involvement in the regulation of ammonialevels, we measured ammonia released in growth medium in ourWT and SIRT5 clones. We observed that SIRT5 overexpressionreduced ammonia accumulation in culture medium (Fig. 1C).By contrast, SIRT5 silencing significantly increased ammoniaaccumulation compared to WT cells (Fig. 1C). Again an ammo-nia increase was also observed when treating cells with the SIRT5inhibitor MC3482 (Fig. 1C). Importantly, when using SIRT3-overexpressing and silenced MDA-MB-231 or C2C12 cells wedid not observe any significant ammonia variation compared toWT cells (Fig. 1C).
SIRT5 regulates glutamine metabolismGlutamine is classified as a nonessential amino acid that, how-
ever, represents an important nitrogen source.38 In particular,glutamine acts as precursor of glutamate and ammonia and hastherefore an important role in the brain and other tissues.39,40
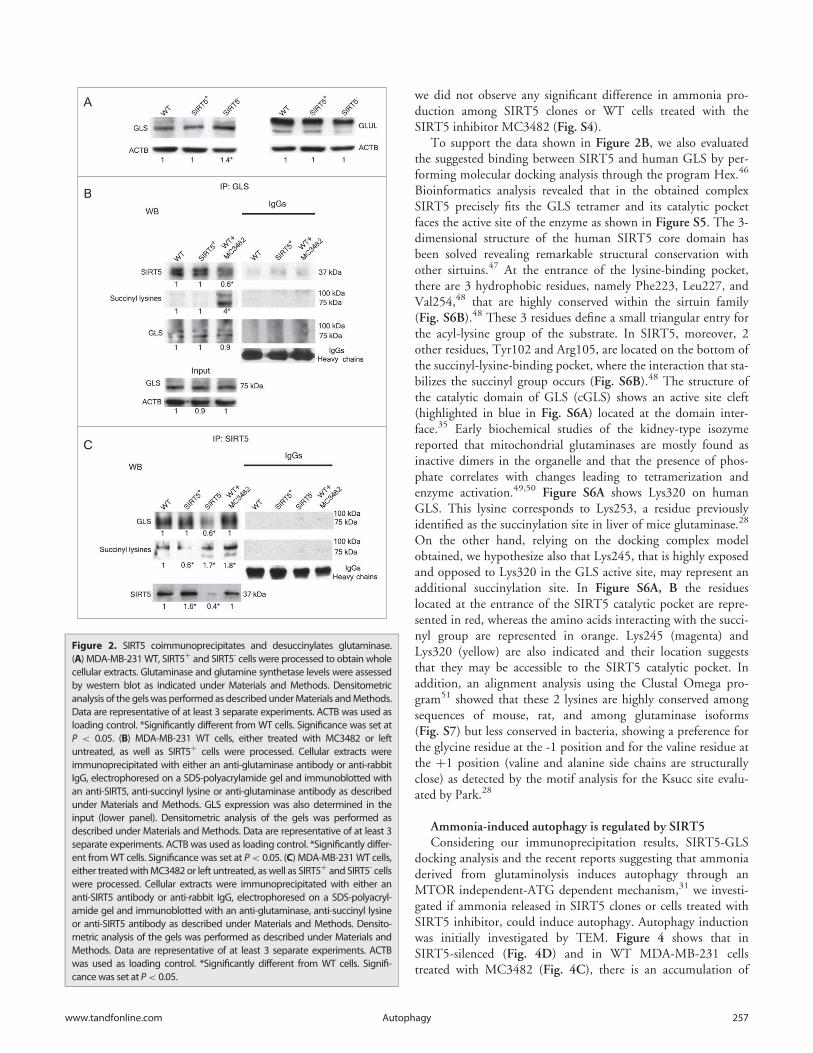
Glutamine metabolism is accelerated in tumor cells as well as inrapidly proliferating nontumor cells.41,42 This metabolismmainly occurs in the mitochondria where glutamine is convertedto glutamate and ammonia by the enzyme GLS.36,43 The oppo-site reaction that from glutamate and ammonia generates gluta-mine, is performed by the enzyme GLUL (glutamate-ammonialigase).44 In order to understand if SIRT5 can regulate these 2enzymes, expression levels of GLUL and GLS were measured inMDA-MB-231. Figure 2A shows that, in SIRT5-silenced cellsGLS levels were increased compared to WT and SIRT5-overex-pressing cells. We focused our attention on GLS because thisenzyme, contrary to GLUL, has a mitochondrial localizationand, in addition, its functionally relevant domain faces the mito-chondrial matrix where SIRT5 resides.36 Therefore, to investigatea possible endogenous interaction between SIRT5 and GLS, weperformed immunoprecipitation assays. Our results show thatSIRT5 coimmunoprecipitates with GLS (Fig. 2B). We used WTcells treated with SIRT5 inhibitor and not SIRT5-silenced cellsin our immunoprecipitation experiments because we encoun-tered some problems to interpret the results probably due to theincreased GLS expression present in the latter (see Fig. 2A). Infact, when we used the SIRT5 inhibitor, we observed a decreasedassociation between GLS and SIRT5 (Fig. 2B). Interestingly, inthese same samples treated with the SIRT5 inhibitor, we insteadobserved an increased succinylation of a protein(s) with a molec-ular weight similar to that of GLS as shown in figure 2B. To con-firm this result, we immunoprecipitated WT cells, either leftuntreated or treated with MC3482, as well as SIRT5 clones witha SIRT5 antibody and then immunoblotted for GLS. Figure 2Cshows, again, a coimmunoprecipitation between SIRT5 andGLS. Importantly, we observed a lower SIRT5-GLS interactionin SIRT5-silenced clones. By contrast, GLS succinylationdecreased in SIRT5-overexpressing cells and increased in SIRT5-silenced or WT cells treated with MC3482 (Fig. 2C).
To confirm that SIRT5 may control GLS activity through itsdesuccinylation, we measured glutamate accumulation in MDA-MB-231 and C2C12 WT cells and SIRT5 clones. We also used
www.tandfonline.com 255Autophagy
the GLS inhibitor BPTESand, again, measured glutamateand ammonia accumulation.Figure 3A shows that glutamatelevels decreased in SIRT5-overex-pressing cells and increased inSIRT5-silenced cells and in WTcells treated with MC3482.Importantly, glutamate accumu-lation was reduced to the sameextent in WT cells as well as inSIRT5 clones by the addition ofBPTES (Fig. 3A). Similarly,BPTES inhibited ammonia accu-mulation in MDA-MB-231 andC2C12 cells as did the treatmentwith dimethyl-a-ketoglutaratethat works by replenishingthe anaplerotic flux (Fig. 3B).Glutamate produced during glu-taminolysis is converted toa-ketoglutarate by the mitochon-drial enzyme GLUD1 (glutamatedehydrogenase 1) with produc-tion of ammonia.45 Therefore, toinvestigate the possibility thatSIRT5 could control ammoniaproduction by regulating alsoGLUD1 activity we performedimmunoprecipitation assays. Asshown in Figure S3A, we did notobserve a coimmunoprecipita-tion between GLUD1 andSIRT5, whereas we confirmed aGLUD1-SIRT3 coimmunopre-cipitation (Fig. S3A). In addi-tion, we did not observe anydifference in GLUD1 activity inWT and SIRT5 clones of MDA-MB-231 cells (Fig. S3B). How-ever, both GLUD1 inhibitorsthat we tested, hexachloropheneand dimethyl-a-ketoglutarate,significantly reduced GLUD1activity in WT cells and SIRT5clones (Fig. S3B). Finally, thecentral role of glutamine forammonia production in our sys-tem, was determined by cultur-ing cells in the absence ofglutamine for several days. Asshown in Figure S4, glutaminewithdrawal lowered ammoniaproduced by both MDA-MB-231 and C2C12 cell lines. More-over, after glutamine withdrawal,
Figure 1. SIRT5 controls lysine succinylation and ammonia production. (A) MDA-MB-231 and C2C12 cells weretransfected to obtain clones overexpressing (SIRT5C) and silenced (SIRT5-) for SIRT5. In addition, WT cells weretreated for 24 h with the SIRT5 inhibitor MC3482 as described under Materials and Methods. Overexpressionand silencing of SIRT5 was confirmed by western blot as shown in the upper inserts. Moreover, SIRT5 expres-sion in the presence of the inhibitor MC3482 was also studied by western blot as shown in the lower inserts.Densitometric analysis of the gels was performed as described under Materials and Methods. Desuccinylasicactivity of SIRT5 in WT, SIRT5 clones and WT cells treated with MC3482 was measured in mitochondrialextracts as described under Materials and Methods. Data are representative of at least 3 separate experiments.ACTB was used as loading control. *Significantly different from WT cells. Significance was set at P < 0.05. (B)Whole cellular extracts were obtained from MDA-MB-231 WT cells in the presence or absence of SIRT5 inhibi-tor MC3482 as well as from SIRT5C and SIRT5- clones. Lysates were then subjected to SDS-PAGE and succinyla-tion (left side) and acetylation (right side) levels of lysines measured by western blot by using a monoclonalanti-succinyl lysine and an anti-acetyl lysine antibody as described under Materials and Methods. Densitomet-ric analysis of the gels was performed as described under Materials and Methods. Data are representative ofat least 3 separate experiments. ACTB was used as loading control. *Significantly different from WT cells. Sig-nificance was set at P < 0.05. (C) MDA-MB-231 and C2C12 WT cells in the presence or absence of MC3482, aswell as SIRT5C and SIRT5- clones were kept in culture for the times indicated. Similarly, MDA-MB-231 andC2C12 cells overexpressing (SIRT3C) and silenced (SIRT3-) for SIRT3 were used. Ammonia levels were measuredin the culture medium every other day as reported under Materials and Methods. Ammonia production in theabsence of cells (1.6 § 0.3 mg/ml and 0.4 § 0.1 mg/ml in the presence and absence of glutamine respectively)was subtracted from each experiment. Data are representative of at least 3 separate experiments. *Signifi-cantly different from WT cells. Significance was set at P< 0.05.
256 Volume 11 Issue 2Autophagy
we did not observe any significant difference in ammonia pro-duction among SIRT5 clones or WT cells treated with theSIRT5 inhibitor MC3482 (Fig. S4).
To support the data shown in Figure 2B, we also evaluatedthe suggested binding between SIRT5 and human GLS by per-forming molecular docking analysis through the program Hex.46
Bioinformatics analysis revealed that in the obtained complexSIRT5 precisely fits the GLS tetramer and its catalytic pocketfaces the active site of the enzyme as shown in Figure S5. The 3-dimensional structure of the human SIRT5 core domain hasbeen solved revealing remarkable structural conservation withother sirtuins.47 At the entrance of the lysine-binding pocket,there are 3 hydrophobic residues, namely Phe223, Leu227, andVal254,48 that are highly conserved within the sirtuin family(Fig. S6B).48 These 3 residues define a small triangular entry forthe acyl-lysine group of the substrate. In SIRT5, moreover, 2other residues, Tyr102 and Arg105, are located on the bottom ofthe succinyl-lysine-binding pocket, where the interaction that sta-bilizes the succinyl group occurs (Fig. S6B).48 The structure ofthe catalytic domain of GLS (cGLS) shows an active site cleft(highlighted in blue in Fig. S6A) located at the domain inter-face.35 Early biochemical studies of the kidney-type isozymereported that mitochondrial glutaminases are mostly found asinactive dimers in the organelle and that the presence of phos-phate correlates with changes leading to tetramerization andenzyme activation.49,50 Figure S6A shows Lys320 on humanGLS. This lysine corresponds to Lys253, a residue previouslyidentified as the succinylation site in liver of mice glutaminase.28
On the other hand, relying on the docking complex modelobtained, we hypothesize also that Lys245, that is highly exposedand opposed to Lys320 in the GLS active site, may represent anadditional succinylation site. In Figure S6A, B the residueslocated at the entrance of the SIRT5 catalytic pocket are repre-sented in red, whereas the amino acids interacting with the succi-nyl group are represented in orange. Lys245 (magenta) andLys320 (yellow) are also indicated and their location suggeststhat they may be accessible to the SIRT5 catalytic pocket. Inaddition, an alignment analysis using the Clustal Omega pro-gram51 showed that these 2 lysines are highly conserved amongsequences of mouse, rat, and among glutaminase isoforms(Fig. S7) but less conserved in bacteria, showing a preference forthe glycine residue at the -1 position and for the valine residue atthe C1 position (valine and alanine side chains are structurallyclose) as detected by the motif analysis for the Ksucc site evalu-ated by Park.28
Ammonia-induced autophagy is regulated by SIRT5Considering our immunoprecipitation results, SIRT5-GLS
docking analysis and the recent reports suggesting that ammoniaderived from glutaminolysis induces autophagy through anMTOR independent-ATG dependent mechanism,31 we investi-gated if ammonia released in SIRT5 clones or cells treated withSIRT5 inhibitor, could induce autophagy. Autophagy inductionwas initially investigated by TEM. Figure 4 shows that inSIRT5-silenced (Fig. 4D) and in WT MDA-MB-231 cellstreated with MC3482 (Fig. 4C), there is an accumulation of
Figure 2. SIRT5 coimmunoprecipitates and desuccinylates glutaminase.(A) MDA-MB-231WT, SIRT5C and SIRT5- cells were processed to obtain wholecellular extracts. Glutaminase and glutamine synthetase levels were assessedby western blot as indicated under Materials and Methods. Densitometricanalysis of the gelswas performed as described underMaterials andMethods.Data are representative of at least 3 separate experiments. ACTB was used asloading control. *Significantly different from WT cells. Significance was set atP < 0.05. (B) MDA-MB-231 WT cells, either treated with MC3482 or leftuntreated, as well as SIRT5C cells were processed. Cellular extracts wereimmunoprecipitated with either an anti-glutaminase antibody or anti-rabbitIgG, electrophoresed on a SDS-polyacrylamide gel and immunoblotted withan anti-SIRT5, anti-succinyl lysine or anti-glutaminase antibody as describedunder Materials and Methods. GLS expression was also determined in theinput (lower panel). Densitometric analysis of the gels was performed asdescribed under Materials and Methods. Data are representative of at least 3separate experiments. ACTB was used as loading control. *Significantly differ-ent fromWT cells. Significance was set at P< 0.05. (C) MDA-MB-231WT cells,either treatedwithMC3482 or left untreated, as well as SIRT5C and SIRT5- cellswere processed. Cellular extracts were immunoprecipitated with either ananti-SIRT5 antibody or anti-rabbit IgG, electrophoresed on a SDS-polyacryl-amide gel and immunoblotted with an anti-glutaminase, anti-succinyl lysineor anti-SIRT5 antibody as described under Materials and Methods. Densito-metric analysis of the gels was performed as described under Materials andMethods. Data are representative of at least 3 separate experiments. ACTBwas used as loading control. *Significantly different from WT cells. Signifi-cancewas set at P< 0.05.
www.tandfonline.com 257Autophagy

autophagosomes and autolysosomes some of them in the processof fusion (Fig. 4C and D). Subsequently, we also determined lev-els of autophagic markers MAP1LC3B, GABARAP (GABA[A]receptor-associated protein) and GABARAPL2 (GABA[A] recep-tor-associated protein-like 2). MDA-MB-231 cells silenced forSIRT5 showed increased LC3-II levels compared to WT cells(Fig. 5A). Again, a similar LC3-II increase was present in WTcells treated with SIRT5 inhibitor (Fig. 5A). By contrast, SIRT5overexpression resulted in the absence of LC3-II (Fig. 5A).
LC3-II accumulation was also measuredby immunofluorescence. Figure S8Ashows that, compared to WT or SIRT5-overexpressing cells, LC3-II accumulatedin SIRT5-silenced cells and in WT cellstreated with MC3482. Such an accumu-lation was also clear after 4 d of cultureas reported in Figure S8B. In order toexclude that the lack of LC3-II signal inSIRT5-overexpressing cells was due toincreased autophagic flux, we treatedWT and SIRT5 clones with bafilomy-cinA1 for 2 and 17 h. As shown inFigure 5A, LC3-II levels in SIRT5-over-expressing cells treated with bafilomy-cinA1 were similar to LC3-II levels ofbafilomycinA1-treated WT cells, whereasSIRT5-silenced clones had an increasedaccumulation of LC3-II after 2 and17 h. This result suggests that LC3-IIabsence in SIRT5-overexpressing cells isdue to reduced autophagy induction andnot to an increased autophagic fluxas also shown in TEM pictures offigure 4B. Ammonia-induced autophagywas a characteristic of SIRT5 clonessince LC3-II levels were not increased inMDA-MB-231 cells overexpressing orsilenced for another mitochondrial sir-tuin, SIRT3 (Fig. 5A). We also mea-sured expression of LC3 paralogsGABARAP and GABARAPL2 that,sometimes, can be better indicators ofautophagy.52 In MDA-MB-231 cells,GABARAPL2 processing andGABARAP accumulation was observedonly in SIRT5-silenced clones and inWT cells treated with the SIRT5 inhibi-tor (Fig. 5A). We also determinedSQSTM1 (sequestosome 1) levels as amarker of lysosome degradation of theautophagosome cargo. Figure 5B, showsthat SQSTM1 degradation was impairedin SIRT5-overexpressing cells but not inSIRT5-silenced cells or in WT cellstreated with SIRT5 inhibitor and thatbafilomycinA1 treatment prevented
SQSTM1 degradation in SIRT5-silenced cells and in WT cellstreated with MC3482 (Fig. 5B). To demonstrate that ammoniacan increase accumulation of autophagic markers, we treatedMDA-MB-231 cells with exogenous ammonia at a concentrationsimilar to those reached in the cell medium after 4 d of culture.As shown in Figure 5C, ammonia at 2 mM concentrationinduced autophagy as demonstrated by accumulation of LC3-II,GABARAPL2, GABARAP, and SQSTM1 degradation. Simi-larly, Figure S8 shows LC3 puncta accumulation by
Figure 3. SIRT5 controls glutamate accumulation. (A) MDA-MB-231 and C2C12 WT cells, eithertreated with MC3482 or left untreated, as well as SIRT5C and SIRT5- cells were processed to obtainwhole cellular extracts. Glutamate concentration was measured using a glutamate assay kit accord-ing to manufacturer’s protocol. Alternatively, glutamate was also measured in MDA-MB-231cellstreated with the GLS inhibitor BPTES for 17 h. Data are representative of at least 3 separate experi-ments. *Significantly different from WT cells. Significance was set at P < 0.05. (B) MDA-MB-231 andC2C12 WT cells in the presence or absence of MC3482, as well as SIRT5C and SIRT5- clones were keptin culture for the times indicated. In addition cells were also treated with the GLS inhibitor BPTES orwith dimethyl-a-ketoglutarate to replenish anaplerotic flux. Ammonia levels were measured in theculture medium after 2 and 3 d as reported under Materials and Methods. Data are representative ofat least 3 separate experiments. *Significantly different from nontreated (NT) cells. Significance wasset at P < 0.05.
258 Volume 11 Issue 2Autophagy

immunofluorescence in NH4Cl-treated
cells. Ammonia production derivesfrom glutaminolysis since, as shown inFigure 5D, treatment of cells withGLS inhibitor BPTES or dimethyl-a-ketoglutarate, completely preventedLC3-II, GABARAPL2 accumulation aswell as SQSTM1 degradation. Impor-tantly, accumulation of LC3-II anddegradation of SQSTM1 were pre-vented by L-glutamine withdrawal(Fig. 5E). It must be noted that pro-longed glutamine withdrawal wasaccompanied by significant cell death(not shown).
Similar results were obtained inC2C12 cells where SIRT5 silencing aswell as SIRT5 pharmacological inhibi-tion and ammonia supplementation,increased LC3-II, GABARAPL2, andGABARAP levels (Fig. 5F).
Autophagic proteolysis was mea-sured by labeling long-lived proteinsby the Click-iT AHA method asdescribed in Materials and Methods.In fact, AHA is a surrogate for L-methionine with an azide group that isincorporated into proteins during pro-tein synthesis. In particular, cells canbe pulsed with AHA to label long-livedproteins followed by a short incubationin medium without AHA to chase outshort-lived proteins. At this point theClick reaction allows the binding of afluorescent alkyne group to the azide.In this way increased autophagy will result in a reduction of fluo-rescent long-lived proteins. By contrast, inhibition of autophagyor inhibition of lysosome proton pump activity, as in the case ofbafilomycinA1 treatment, will increase the signal from fluorescentlong-lived proteins. Our results are shown in Figure 6. Confocalanalysis of autophagic proteolysis showed a decrease in fluores-cence in WT MDA-MB-231 cells treated for 3 h with 2 mMNH4Cl or with 50 mM MC3482. By contrast no decrease wasobserved in cells treated with 10 mM NH4Cl. Importantly,10 mM NH4Cl also prevented starvation-induced autophagicproteolysis in WT cells (Fig. 6A). These results were quantifiedby reading the fluorescence intensity in a fluorimeter as reportedin Figure 6B. Fluorescence from long-lived proteins decreased byabout 15% in MDA-MB-231 WT cells treated with 2 mMNH4Cl or with MC3482 for 3 h. Interestingly, treatment ofMDA-MB-231 WT cells with 10 mM NH4Cl did not increaseautophagic proteolysis but prevented starvation-induced proteindegradation. Similar results were obtained in C2C12 cellsalthough we had to prolong treatments up to 6 h (Fig. 6B rightpanel).
Mitophagy regulation by SIRT5Our results indicates that SIRT5 controls glutamine metabo-
lism and the consequent ammonia-induced autophagy. We nextinvestigated if ammonia regulation by SIRT5 could also influ-ence the selective degradation of mitochondria through so-calledmitophagy. In fact, mitophagy is a tightly regulated process thatselectively sequesters and degrades superfluous, damaged, orpotentially dysfunctional mitochondria representing, as in thecase of autophagy, both a cell death and a survival process.5,52
Induction of mitophagy, in our system, was assessed by measur-ing different markers and precisely, BNIP3 (BCL2/adenovirusE1B 19kDa interacting protein 3) and the PINK1 (PTENinduced putative kinase 1) and PARK2 (parkin RBR E3 ubiqui-tin protein ligase) system. BNIP3 is a autophagy receptor on themitochondria that interacts with MAP1LC3B and GABARAPcommitting dysfunctional mitochondria to mitophagy.5,52,53
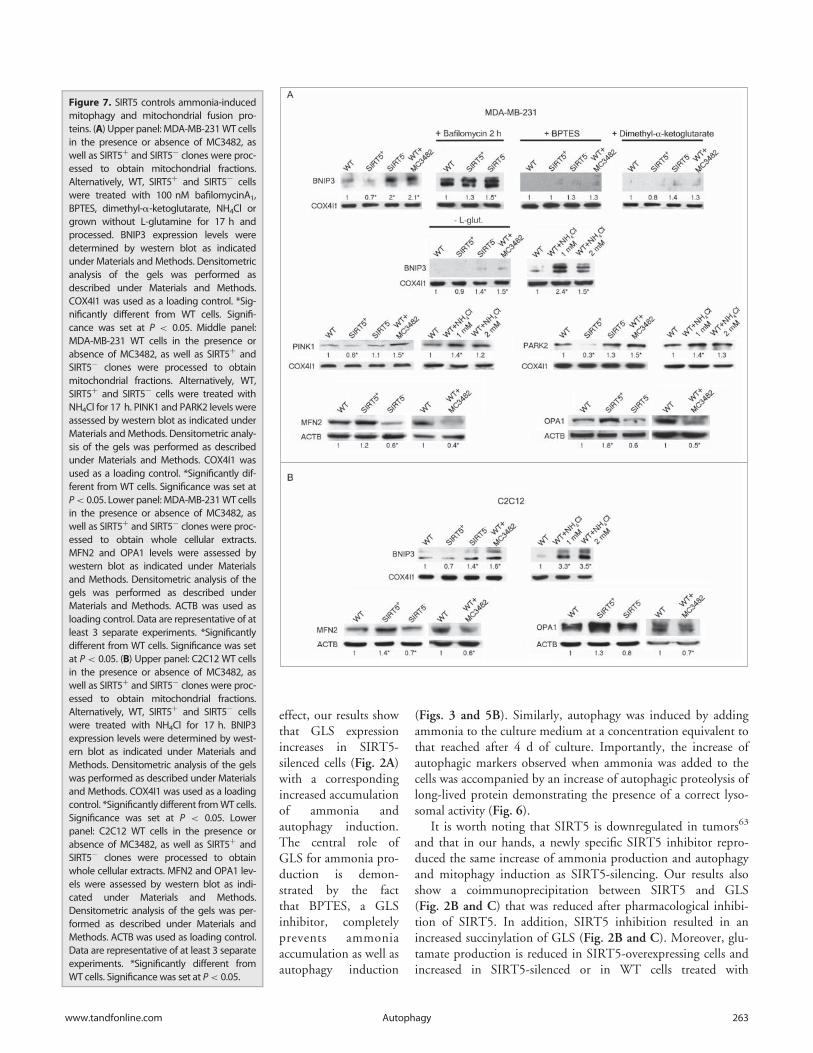
Our results show that in SIRT5-silenced MDA-MB-231 cells aswell as in WT cells treated with the SIRT5 inhibitor MC3482,there is an increase of BNIP3 in the mitochondria whereas adecrease was observed in SIRT5-overexpressing cells (Fig. 7A).
Figure 4. SIRT5 silencing or inhibition induces autophagy. MDA-MB-231 WT cells, either treated withMC3482 or left untreated, as well as SIRT5C and SIRT5- cells were cultured for 24 h. The cells were thenprocessed for electron microscopy as described under Materials and Methods. (A) WT control showinga few autophagosomes (magnification 21,000x). (B) SIRT5-overexpressing cells with very low or absentautophagy (Magnification 21,000x). (C) Autophagy in WT cells treated with MC3482. Black arrows pointto autolysosomes in the cytoplasm (magnification 21,000x). (D) Autophagy in SIRT5-silenced cells. Blackarrows point to autophagosomes and autolysosomes (magnification 15,500x). Inset Magnification28,500x.
www.tandfonline.com 259Autophagy

Figure 5. For figure legendx see page 261.
260 Volume 11 Issue 2Autophagy
Interestingly, when cells were treated with bafilomycinA1 weobserved a BNIP3 increase that was, however, more marked inSIRT5-silenced cells. The central role of GLS-dependent gluta-minolysis with ammonia accumulation for mitophagy was dem-onstrated by treating cells with BPTES, dimethyl-a-ketoglutarate, NH4Cl and glutamine withdrawal (Fig. 7A). Infact, BPTES, dimethyl-a-ketoglutarate and glutamine with-drawal completely inhibited BNIP3 accumulation whereas,ammonia supplementation increased BNIP3 levels in the cells.This result suggests that the mitochondrial degradation followingassociation between the autophagy receptor BNIP3 on the mito-chondria and the autophagy marker MAP1LC3B is reduced afterSIRT5 overexpression and increased after SIRT5 silencing orinhibition.
The PINK1-PARK2 pathway is another system to controlmitophagy.5,54-56 In particular, PINK1 accumulates in the mito-chondria thereby recruiting PARK2 through an unknown mech-anism. PARK2, in turn, ubiquitinases mitochondrial proteinsserving as a signal for mitophagy.57 Figure 7A shows that bothPINK1 and PARK2 accumulates in mitochondrial fractions ofSIRT5-silenced cells, in WT cells treated with MC3482 as wellas in WT cells treated with NH4Cl. By contrast, PINK1 andPARK2 levels decreased in SIRT5-overexpressing cells. MFN2(mitofusin 2) is one of the few substrates that is ubiquitinated byPARK2 on the mitochondria.57 MFN2 ubiquitination and deg-radation serves, then, as a signal for mitophagy.57 As shown inFigure 7A, MFN2 levels decreased in both SIRT5-silenced andWT cells treated with SIRT5 inhibitor. Interestingly, we alsoobserved that OPA1 (optic atrophy 1 [autosomal dominant]),another protein of the mitochondrial fusion machinery, wasincreased in SIRT5-overexpressing cells and decreased whenSIRT5 was silenced or inhibited (Fig. 7A).
Similar results were obtained in C2C12 cells. Figure 7B showsan increase in BNIP3 in SIRT5-silenced cells, in WT cells treated
with MC3482 or with NH4Cl. We also observed a decrease inMFN2 and OPA1 in SIRT5-silenced cells and in WT cells afterSIRT5 inhibition, whereas BNIP3 decreased and MFN2 levelsincreased in SIRT5-overexpressing cells.
SIRT5 influences mitochondrial dynamicsGlutamine homeostasis influences mitochondrial dynamics
suggesting that the energetic status of the cell and mitochondrialmorphology are somehow interlinked.57-59 Moreover, increasedMFN2 and OPA1 levels that we observed, could alter mitochon-drial dynamics favoring mitochondrial fusion. In addition, mito-chondrial membrane potential is influenced by the organelle’smorphology with higher potential in large fused mitochondria.59
We therefore measured mitochondrial morphology and potentialin SIRT5-overexpressing and silenced cells. Figure 8A shows thatSIRT5-overexpressing MDA-MB-231 and C2C12 cells had agreater number of mitochondria with a red JC-1 staining indicat-ing higher mitochondrial membrane potential. Almost no redmitochondria were present in SIRT5-silenced cells and in WTcells treated with MC3482 or with NH4Cl (Fig. 8A). Addition-ally, JC-1 mitochondrial staining showed that SIRT5-overex-pressing cells had large elongated mitochondria well distributedalong the cellular processes whereas, SIRT5-silenced cells as wellas WT cells treated with MC3482 or NH4Cl had small roundmitochondria clustered around the nucleus (Fig. 8A). ATP levelsand lactate production were measured in our cells. Figure 8Bshows that ATP levels were similar in WT cells and in SIRT5clones. Addition of 2-deoxy-D-glucose (2DG), an inhibitor ofglycolysis, reduced ATP levels in WT as well as in SIRT5 clones(Fig. 8B). However, reduction of ATP levels was more significantin SIRT5-silenced cells and in WT cells treated with MC3482(Fig. 8B). Importantly, lactate production was decreased inSIRT5-overexpressing cells and increased in SIRT5-silenced orin WT cells after SIRT5 inhibition (Fig. 8B).
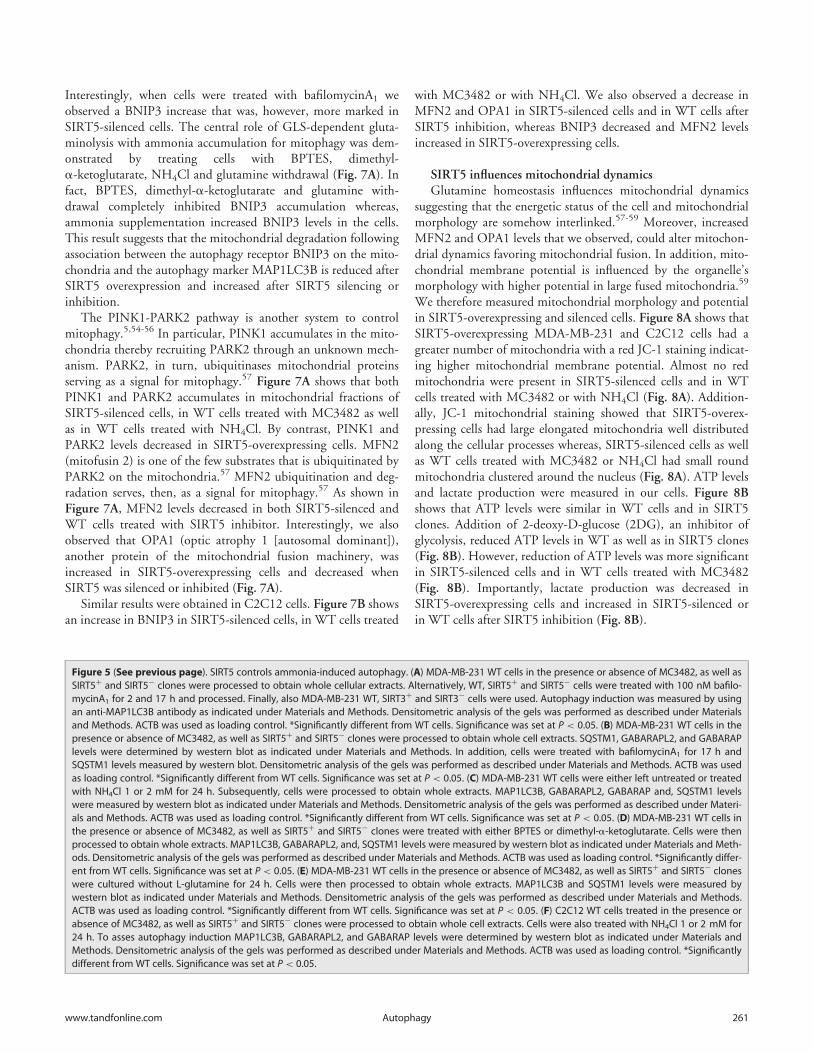
Figure 5 (See previous page). SIRT5 controls ammonia-induced autophagy. (A) MDA-MB-231 WT cells in the presence or absence of MC3482, as well asSIRT5C and SIRT5¡ clones were processed to obtain whole cellular extracts. Alternatively, WT, SIRT5C and SIRT5¡ cells were treated with 100 nM bafilo-mycinA1 for 2 and 17 h and processed. Finally, also MDA-MB-231 WT, SIRT3C and SIRT3¡ cells were used. Autophagy induction was measured by usingan anti-MAP1LC3B antibody as indicated under Materials and Methods. Densitometric analysis of the gels was performed as described under Materialsand Methods. ACTB was used as loading control. *Significantly different from WT cells. Significance was set at P < 0.05. (B) MDA-MB-231 WT cells in thepresence or absence of MC3482, as well as SIRT5C and SIRT5¡ clones were processed to obtain whole cell extracts. SQSTM1, GABARAPL2, and GABARAPlevels were determined by western blot as indicated under Materials and Methods. In addition, cells were treated with bafilomycinA1 for 17 h andSQSTM1 levels measured by western blot. Densitometric analysis of the gels was performed as described under Materials and Methods. ACTB was usedas loading control. *Significantly different from WT cells. Significance was set at P < 0.05. (C) MDA-MB-231 WT cells were either left untreated or treatedwith NH4Cl 1 or 2 mM for 24 h. Subsequently, cells were processed to obtain whole extracts. MAP1LC3B, GABARAPL2, GABARAP and, SQSTM1 levelswere measured by western blot as indicated under Materials and Methods. Densitometric analysis of the gels was performed as described under Materi-als and Methods. ACTB was used as loading control. *Significantly different from WT cells. Significance was set at P < 0.05. (D) MDA-MB-231 WT cells inthe presence or absence of MC3482, as well as SIRT5C and SIRT5¡ clones were treated with either BPTES or dimethyl-a-ketoglutarate. Cells were thenprocessed to obtain whole extracts. MAP1LC3B, GABARAPL2, and, SQSTM1 levels were measured by western blot as indicated under Materials and Meth-ods. Densitometric analysis of the gels was performed as described under Materials and Methods. ACTB was used as loading control. *Significantly differ-ent from WT cells. Significance was set at P < 0.05. (E) MDA-MB-231 WT cells in the presence or absence of MC3482, as well as SIRT5C and SIRT5¡ cloneswere cultured without L-glutamine for 24 h. Cells were then processed to obtain whole extracts. MAP1LC3B and SQSTM1 levels were measured bywestern blot as indicated under Materials and Methods. Densitometric analysis of the gels was performed as described under Materials and Methods.ACTB was used as loading control. *Significantly different from WT cells. Significance was set at P < 0.05. (F) C2C12 WT cells treated in the presence orabsence of MC3482, as well as SIRT5C and SIRT5¡ clones were processed to obtain whole cell extracts. Cells were also treated with NH4Cl 1 or 2 mM for24 h. To asses autophagy induction MAP1LC3B, GABARAPL2, and GABARAP levels were determined by western blot as indicated under Materials andMethods. Densitometric analysis of the gels was performed as described under Materials and Methods. ACTB was used as loading control. *Significantlydifferent from WT cells. Significance was set at P < 0.05.
www.tandfonline.com 261Autophagy

The presence of large fused mitochondria in SIRT5-overex-pressing cells and the increase in the fusion proteins MFN2 andOPA1 prompted us to investigate if this was due to a shift ofmitochondrial dynamics in favor of fusion. Fusion of the mito-chondria was studied by the PEG fusion assay as indicated in
Materials and Methods. Figure 9shows that, compared to WTC2C12 cells, SIRT5-silencedcells had a lower number of fusedyellow mitochondria whereasSIRT5-overexpressing cells had ahigher number of fused yellowmitochondria as well as mito-chondria with red or greenextremities and yellow center asindicated by the arrows.
Discussion
In the present study we dem-onstrate that SIRT5 regulatesammonia production by influ-encing glutamine metabolismthrough the binding and desucci-nylation of GLS. Ammoniaincreases autophagy in a para-crine and autocrine fashion.29,30
SIRT5 overexpression reducesammonia accumulation whereas,SIRT5-silencing or inhibitionincreases ammonia productionand ammonia-induced autoph-agy. Finally, SIRT5 also regulatesmitochondrial dynamics andmitophagy probably by control-ling glutamine metabolism andammonia accumulation.
Glutamine is the most abun-dant nonessential amino acid andserves as a storage form of gluta-mate and ammonia.60 Glutamineis important for anaplerosis ofthe Krebs cycle.60 Therefore, intumor cells, where glucose ismainly used through glycolysis,glutamine metabolism is acceler-ated and glutamine represents animportant source ofenergy.37,61,62 GLS is the mainenzyme for glutaminolysis andcatalyzes the transformation ofglutamine in glutamate andammonia. GLS resides in themitochondria and its functionallyrelevant domain faces the mito-
chondrial matrix.36 Interestingly, tumor cells show a higher GLSactivity and expression than normal cells.37 Therefore, in growingtumors, glutamine addiction and utilization releases ammoniathat is then used by surrounding tumor cells to increase autoph-agy and autophagic removal of toxic by-products.29 To this
Figure 6. Ammonia increases proteolysis of long-lived proteins. (A) MDA-MB-231 WT cells were labeled withAHA as described under Materials and Methods and then cultured in complete medium in the presence orabsence of 2 mM NH4Cl, 10 mM NH4Cl or 50 mM MC3482 for 3 h. Alternatively, cells were cultured in starva-tion medium in the presence or absence of 10 mM NH4Cl for 3 h. Cells were then fixed, permeabilized andstained for 2 h with alkine-Alexa Fluor 488 as described under Materials and Methods. Fluorescence fromlong-lived proteins was observed using a LSM 510 confocal microscopy (Zeiss). (B) MDA-MB-231 and C2C12WT cells were placed in a 96-well plate, labeled and treated as described in (A). However, C2C12 cells treat-ments were prolonged to 6 h. Fluorescence from labeled long-lived proteins was measured using Glomaxmulti detection system (Promega). The fluorescence intensity of the assay buffer was subtracted from eachexperimental sample. *Significantly different from control (ctrl) cells. #Significantly different from controlstarved (ctrl) cells. Significance was set at P< 0.05.
262 Volume 11 Issue 2Autophagy
effect, our results showthat GLS expressionincreases in SIRT5-silenced cells (Fig. 2A)with a correspondingincreased accumulationof ammonia andautophagy induction.The central role ofGLS for ammonia pro-duction is demon-strated by the factthat BPTES, a GLSinhibitor, completelyprevents ammoniaaccumulation as well asautophagy induction
(Figs. 3 and 5B). Similarly, autophagy was induced by addingammonia to the culture medium at a concentration equivalent tothat reached after 4 d of culture. Importantly, the increase ofautophagic markers observed when ammonia was added to thecells was accompanied by an increase of autophagic proteolysis oflong-lived protein demonstrating the presence of a correct lyso-somal activity (Fig. 6).
It is worth noting that SIRT5 is downregulated in tumors63
and that in our hands, a newly specific SIRT5 inhibitor repro-duced the same increase of ammonia production and autophagyand mitophagy induction as SIRT5-silencing. Our results alsoshow a coimmunoprecipitation between SIRT5 and GLS(Fig. 2B and C) that was reduced after pharmacological inhibi-tion of SIRT5. In addition, SIRT5 inhibition resulted in anincreased succinylation of GLS (Fig. 2B and C). Moreover, glu-tamate production is reduced in SIRT5-overexpressing cells andincreased in SIRT5-silenced or in WT cells treated with
Figure 7. SIRT5 controls ammonia-inducedmitophagy and mitochondrial fusion pro-teins. (A) Upper panel: MDA-MB-231WT cellsin the presence or absence of MC3482, aswell as SIRT5C and SIRT5¡ clones were proc-essed to obtain mitochondrial fractions.Alternatively, WT, SIRT5C and SIRT5¡ cellswere treated with 100 nM bafilomycinA1,BPTES, dimethyl-a-ketoglutarate, NH4Cl orgrown without L-glutamine for 17 h andprocessed. BNIP3 expression levels weredetermined by western blot as indicatedunder Materials and Methods. Densitometricanalysis of the gels was performed asdescribed under Materials and Methods.COX4I1 was used as a loading control. *Sig-nificantly different from WT cells. Signifi-cance was set at P < 0.05. Middle panel:MDA-MB-231 WT cells in the presence orabsence of MC3482, as well as SIRT5C andSIRT5¡ clones were processed to obtainmitochondrial fractions. Alternatively, WT,SIRT5C and SIRT5¡ cells were treated withNH4Cl for 17 h. PINK1 and PARK2 levels wereassessed by western blot as indicated underMaterials and Methods. Densitometric analy-sis of the gels was performed as describedunder Materials and Methods. COX4I1 wasused as a loading control. *Significantly dif-ferent from WT cells. Significance was set atP< 0.05. Lower panel: MDA-MB-231WT cellsin the presence or absence of MC3482, aswell as SIRT5C and SIRT5¡ clones were proc-essed to obtain whole cellular extracts.MFN2 and OPA1 levels were assessed bywestern blot as indicated under Materialsand Methods. Densitometric analysis of thegels was performed as described underMaterials and Methods. ACTB was used asloading control. Data are representative of atleast 3 separate experiments. *Significantlydifferent from WT cells. Significance was setat P< 0.05. (B) Upper panel: C2C12 WT cellsin the presence or absence of MC3482, aswell as SIRT5C and SIRT5¡ clones were proc-essed to obtain mitochondrial fractions.Alternatively, WT, SIRT5C and SIRT5¡ cellswere treated with NH4Cl for 17 h. BNIP3expression levels were determined by west-ern blot as indicated under Materials andMethods. Densitometric analysis of the gelswas performed as described under Materialsand Methods. COX4I1 was used as a loadingcontrol. *Significantly different fromWT cells.Significance was set at P < 0.05. Lowerpanel: C2C12 WT cells in the presence orabsence of MC3482, as well as SIRT5C andSIRT5¡ clones were processed to obtainwhole cellular extracts. MFN2 and OPA1 lev-els were assessed by western blot as indi-cated under Materials and Methods.Densitometric analysis of the gels was per-formed as described under Materials andMethods. ACTB was used as loading control.Data are representative of at least 3 separateexperiments. *Significantly different fromWT cells. Significance was set at P< 0.05.
www.tandfonline.com 263Autophagy

MC3482 demonstrating a regulation of GLS activity (Fig. 3A).To this regard, it is worth noting that recently, Park et al. haveshown that SIRT5 has structural preferences for its enzymaticactivity.28 In particular, motif analysis identified AK, GK, KFand KA motifs as significantly overrepresented for Lys succinyla-tion sites.28 A screening analysis identified, among a total ofabout 800 proteins, GLS as a putative succinylated substrate.28
In particular Lys 253 of mouse GLS2 was identified as a putativesuccinylation site.28 According to this, our docking protein-
protein analysis of human GLSand SIRT5 suggests that: i)SIRT5 fits in the cavity of a tetra-mer of GLS; ii) Lys 320, that cor-responds to the mouse 253, andalso Lys 245 are on opposite sidesof the GLS active site; iii) these 2lysines may be accessible to theSIRT5 catalytic pocket; iiii) these2 lysines and the amino acids atposition ¡1 and C1 are highlyconserved among different spe-cies (Fig. S5 to S7).
Our results also demonstratethat SIRT5 regulates mitophagyand mitochondrial dynamics. Infact, we showed that the mitoph-agy markers BNIP3 and PINK1-PARK2 system are reduced inSIRT5-overexpressing andincreased in SIRT5-silenced cellsor in WT cells treated with aSIRT5 inhibitor. Again thesebiological effects of SIRT5manipulation are due to the con-trol of glutamine metabolismand ammonia-induced autoph-agy by SIRT5. In fact, inhibitionof GLS with BPTES, inhibitionof anaplerosis with dimethyl-a-ketoglutarate and, L-glutaminewithdrawal reduced mitophagymarker BNIP3 (Fig. 7). By con-trast, ammonia supplementationincreased mitophagy by accumu-lating BNIP3, PINK1, andPARK2 (Fig. 7). Our results sug-gest that SIRT5 downregulationobserved in tumors can activatethe protective effects of ammo-nia-induced autophagy towardstressful conditions such as forexample hypoxia or chemother-apy. Activation of mitophagyobserved in SIRT5-silenced cellsis probably due to the loss ofmembrane potential and to the
reduced size of mitochondria observed in these cells and may,again, represent a protective mechanism for these cells by remov-ing damaged and dysfunctional mitochondria that could, forexample, produce high levels of toxic products. All these effectsare absent when SIRT5 is present or overexpressed. In this case,we observed mitochondria with elongated shape, widely distrib-uted in the cells and, with high membrane potential (Fig. 8A).Mitochondria from SIRT5-silenced cells or cells treated with aSIRT5 inhibitor, also show a decrease of ATP content when
Figure 8. Mitochondrial morphology, membrane potential, ATP and lactate levels in WT cells and in SIRT5clones. (A) MDA-MB-231 and C2C12 WT, SIRT5C and SIRT5- cells as well as WT cells treated with NH4Cl for24 h were incubated with JC-1 to assess mitochondrial membrane potential as described under Material andMethods. Pictures of mitochondria were taken at 60x with a LSM510 Zeiss Confocal Microscope. (B) Left side.MDA-MB-231 WT cells, either treated with MC3482 or left untreated, as well as SIRT5C and SIRT5- cells wereprocessed to obtain whole cellular extracts. ATP levels were measured using an ATP/ADP assay kit accordingto the manufacturer’s protocol. Alternatively, ATP levels were also measured in the presence of the glycolysisinhibitor 2DG for 17 h. Data are representative of at least 3 separate experiments. *Significantly different fromnon treated cells. #Significantly different from WT and SIRT5C cells treated with 2DG (P < 0.01). Significancewas set at P < 0.05. Right side. MDA-MB-231 cells in the presence or absence of MC3482, as well as SIRT5C
and SIRT5- clones were kept in culture for 3 d Lactate levels were measured in the culture medium as reportedunder Materials and Methods. Data are representative of at least 3 separate experiments. *Significantly differ-ent from WT cells. Significance was set at P < 0.05.
264 Volume 11 Issue 2Autophagy

treated with the glycolysis inhibitor 2DG and increased lactateproduction. However, the drop of extracellular pH was from 7.4to 6.7 in WT cells as well as in SIRT5 clones. One possible expla-nation is that glutamate produced by GLS is further oxidized toyield CO2 and HCO3¡. Bicarbonate accumulation can, in turn,buffer protons in culture medium. Therefore, the situation couldbe similar to that reported by Atkinson and Bourke64 to explainhow metabolic acidosis can be counteracted by increasing GLS
activity in the kidney, an event that generates bicarbonate that, inturn, prevents the drop of systemic pH64. In the case of SIRT5-silenced cells, increased GLS activity, herewith documented,would determine an increase glutamate accumulation and oxida-tion to generate bicarbonate that, in turn, can buffer excess ofprotons and reduce pH drop.
We also documented a decreased probability of mitophagyinduction as testified by lower expression of BNIP3 as well asPINK1 and PARK2 (Fig. 7A and B). The increased mitochon-drial size in SIRT5-overexpressing cells was also due to accumula-tion of fusion proteins MFN2 and OPA1, an event, that, at leastfor MFN2 was probably due to the reduction of PINK1-PARK2system that, when accumulating on the mitochondrial mem-brane, ubiquitinates MFN2 activating the mitophagic process.57
Therefore, we show that, by controlling glutamine metabolism,SIRT5 also controls 2 interlinked processes such as autophagyand mitophagy.
Recently a metabolic characterization of a Sirt5-deficientmouse model has been reported.65 Interestingly, sirt5 KO micehave elevated ammonia blood levels after 24 h fasting, but donot show any metabolic change compared to WT mice underbasal conditions.65 These results raise the question about theimportance of Sirt5 for metabolic homeostasis. However, as inthe case of sirt3 KO mice, it may be necessary to increase or pro-long the stress to observe a metabolic difference between sirt5KO and Sirt5 WT mice. Moreover, the observation of a prenatalloss of 40% of sirt5 KO offspring is particularly interesting for 2reasons: i) it may be related to an imbalance in glutamine metab-olism and autophagy that would result in embryonic malforma-tions and death;66 ii) it may be that the surviving offspring areborn because were able to bypass the metabolic imbalance, dueto Sirt5 absence, by increasing the activity or expression of othersirtuins or mitochondrial enzymes. In fact, as also suggested byYu et al., mitochondrial sirtuins may be involved in sensing andremoval of erroneous acyl modifications in proteins.65 Thesewould be the reasons why it may be necessary to prolong thestress on sirt5 KO mice in order o observe metabolic changes.Finally, it would be interesting to measure glutamine metabolismin sirt5 KO mice as well as behavioral abnormalities under pro-longed fasting that may be caused by increased damage to thebrain because of excessive ammonia.
Another interesting aspect is that our results are in agreementand complete those recently published by Csibi et al., in whichthe authors report that the CRTC1 (CREB-regulated transcrip-tion coactivator 1) pathway increases glutamine metabolism byremoving SIRT4 inhibition on GLUD1.67 In fact, GLUD1 isthe enzyme that, in glutaminolysis, follows the GLS catalysis ofthe reaction that transforms glutamate in a-ketoglutarate withammonia release.67 Studies show that SIRT4 is downregulated inhuman cancer and that SIRT4 overexpression reduces tumor for-mation, however, they do not report ammonia levels in theabsence or overexpression of SIRT4 and autophagy induction. 67
Based on their and our results, we can predict that both SIRT5and SIRT4 controls the 2 sequential steps of glutamine metabo-lism. SIRT5 would inhibit GLS activity and transformation ofglutamine to glutamate with ammonia production whereas,
Figure 9.Mitochondrial fusion in WT cells and in SIRT5 clones. Two sepa-rate populations of C2C12 WT, or SIRT5C or SIRT5- cells were incubatedwith either MitoTrackerGreen or MitoTrackerRed. Subsequently the 2populations were cocultured in the presence of PEG to stimulate cellularfusion as described under Materials and Methods. Cells with green-labeled mitochondria fused with cells with red-labeled mitochondriawere analyzed under confocal microscope (LSM510 Zeiss). The presenceof mitochondria fusion was assessed by the appearance of yellow mito-chondria. Pictures on the right side are enlargements of the images inthe white box on the left. White arrows in the lower right panel indicatethe presence of large fused or fusing mitochondria. Pictures of mito-chondria were taken at 60x with a LSM510 Zeiss Confocal Microscope.
www.tandfonline.com 265Autophagy

SIRT4 would inhibit GLUD1 activity and transformation of glu-tamate to a-ketoglutarate with, again, ammonia production.However, in our experiments we could not detect an interaction,through immunoprecipitation, between SIRT5 with GLUD1whereas we were able to observe a GLUD1-SIRT3 coimmuno-precipitation (Fig. S3). Therefore, both SIRT4 and SIRT5 wouldregulate glutamine homeostasis and ammonia levels. It is alsointeresting to notice that SIRT5 and SIRT4 inhibitory effects areachieved by 2 different post-translational modifications, that is:desuccinylation and ADP-ribosylation, respectively. Accordingto us this allows for a tighter control of an important metabolicpathway such as glutamine homeostasis. Finally, additionally theother mitochondrial sirtuin SIRT3 controls glutamine homeosta-sis by deacetylating and activating GLUD1 to regulate the TCAcycle.68 Therefore, glutamine homeostasis may represent the firstexample of a pathway regulated by all 3 mitochondrial sirtuinsand for this reason is an important metabolic target.
A schematic representation of our findings explaining the cen-tral role of SIRT5 in controlling ammonia-induced autophagyand mitophagy is drawn in Figure 10. SIRT5 by inhibiting theactivity of GLS reduces ammonia released in the presence of glu-tamine. Ammonia reduction is accompanied by a reduction ofammonia-induced autophagy and mitophagy as measured by themarkers listed in the figure.
Our new findings on the role of SIRT5 in glutamine metabo-lism are important because of potential implication in numeroushuman pathologies such as tumor development, neurodegenera-tive diseases, hepatic encephalopathy, etc. that are due to bloodammonia accumulation.69-71 In fact, one could foresee thatSIRT5 activation would result in a decrease of ammonia pro-duced in the presence of glutamine. In the case of tumor
development, ammonia-induced autophagy has been regarded asa protective mechanism for tumor cells. Therefore, SIRT5 activa-tion would reduce ammonia-induced autophagy reducing alsothe ability of tumor cells to survive to chemotherapy or otherstresses such as hypoxia or nutrient starvation. In the case ofpathologies related to ammonia accumulation, SIRT5 activationcould be beneficial for reducing damage to cells sensitive toammonia accumulation such as astrocytes.39,70
Materials and Methods
Cell cultureThe MDA-MB-231 human breast carcinoma cell line and the
C2C12 mouse myoblast cell line were purchased from LGCStandards (HTB-26 and CRL-1772, respectively). MDA-MB-231 were maintained in RPMI 1640 medium (Sigma-Aldrich,R0883), C2C12 were maintained in Dulbecco’s ModifiedEagle’s Medium (DMEM; Sigma-Aldrich, D65446). Bothmediums were supplemented with 1% penicillin/streptomycin,2 mM L-glutamine (Sigma-Aldrich, G7513) and 10% heat-inac-tivated fetal bovine serum (Sigma-Aldrich, F9665). Cells weremaintained at 37�C in a humidified atmosphere of 5% CO2 and95% air. Under these conditions, pH of DMEM was about 7.7.For glutamine withdrawal experiments, cells were grown, for thetime indicated, in complete medium without the addition ofL-glutamine.
Treatment protocols and antibodiesBafilomycin A1 (Sigma-Aldrich, B1793) was dissolved in
Me2SO and added to a final concentration of 100 nM for thetimes indicated. BPTES (Sigma-Aldrich, SML0601) was dis-solved in Me2SO and added to a final concentration of 10 mMfor the times indicated. Hexachlorophene (Sigma-Aldrich,H4625) was dissolved in Me2SO and added to a final concentra-tion of 5 mM for 24 h. Dimethyl-a-ketoglutarate was synthe-sized and provided by Prof. Mai and added to a 1 mM finalconcentration. Ammonium chloride (NH4Cl) (Sigma Aldrich,A0171) was dissolved in water and added to a final concentrationof 1, 2, or 10 mM for the indicated times. 2DG (Sigma Aldrich,D8375) was dissolved in water and added to a final concentrationof 10 mM.
Antibodies used: SIRT5 (Abcam, 13697), MAP1LC3B(Novus Biologicals, NB600-1384), GABARAP and GABAR-APL2 (MBL International Corporation, PM037 and PM038,respectively), SQSTM1 (Santa Cruz Biotechnology, sc-48402),BNIP3 (Santa Cruz Biotechnology, sc-56167), MFN2 (Abnova,H00009927-M07), OPA1 (Novus Biologicals, H00004976-D01P), PINK1 (Santa Cruz Biotechnology, sc-33796), PARK2(Santa Cruz Biotechnology, sc-32282), GLS (Novus Biologicals,H00002744-M01), GLUL (Novus Biologicals, H00002752-M02), GLUD1 (Santa Cruz Biotechnology, sc-160382), SIRT3(Cell Signaling Technology, 2627), succinyl lysine (PTM-Biol-abs, PTM 419), acetylated lysine (Cell Signaling Technology,9447), ACTB (Santa Cruz Biotechnology, sc-8432), COX4I1(Santa Cruz Biotechnology, sc-69359).
Figure 10. Schematic representation of SIRT5 control of glutaminemetabolism and ammonia-induced autophagy and mitophagy. SIRT5controls ammonia-induced autophagy and mitophagy by regulating glu-tamine metabolism.
266 Volume 11 Issue 2Autophagy

Biochemical assaysAccumulation of lactate in the culture medium was deter-
mined using lactate assay kit II (Sigma-Aldrich, MAK065)according to the manufacturer’s protocol. ATP levels in cellswere determined by using the ADP/ATP ratio assay kit (Sigma-Aldrich, MAK135) according to the manufacturer’s protocol.Glutamate levels in cell lines were determined by using the gluta-mate assay kit (Sigma-Aldrich, MAK004) according to the man-ufacturer’s protocol. GLUD1 activity was determined by usingthe glutamate dehydrogenase activity assay kit (Sigma-Aldrich,MAK099) according to the manufacturer’s protocol. All assayswere performed in triplicate and the results compared to the con-trol values.
SIRT5 inhibitorUnless otherwise stated, in all experiments, cells were treated
with 50 mM of SIRT5 inhibitor MC3482 for 24 h. The synthe-sis and characterization of MC3482 is reported in supplementarymaterials.
Generation of SIRT5-overexpressing and silenced stabletransfectants
MDA-MB-231 and C2C12 cells were stably transfected witha pcDNA3.1 expression vector encoding human and mouseSIRT5-Flag (Addgene, 13816) for overexpression and for humanSIRT5 and mouse Sirt5 shRNAs for silencing. Stable clones weregenerated by delivering plasmid DNA constructs into cells usingTurboFectin 8.0 (Origene Technologies, TF81001) according tothe manufacturer’s recommendations. Briefly, cells were seededon a 24-well plate. The following day the cells were transfected.TurboFectin reagents were first mixed with serum-free RPMI atroom temperature for 5 min. Subsequently, plasmid DNA wasadded to the TurboFectin-containing media and incubated atroom temperature for 30 min. After that, the mixtures wereadded to the cells. The selection of stable overexpressing andsilenced clones was started 24 h later with the addition of500 mg/ml of geneticin (Sigma-Aldrich, A1720).
SIRT5 desuccinylating activity assaySIRT5 desuccinylating activity was determined using a SIRT5
Fluorimetric Activity Assay/Drug Discovery Kit (Enzo Life Sci-ence, BML-AK513-0001) following the manufacturer’s protocol.In brief, the mitochondrial extract (5 mg) was incubated with theFluor de Lys substrate buffer at 37�C for 40 min. followed byincubation with Fluor de Lys Developer at 37�C for 15 min.After excitation at 360 nm, emitted light was detected at 460 nmusing Glomax multi detection system (Promega, 20137 Milan,Italy). The fluorescence intensity of the assay buffer was sub-tracted from each experimental sample.
SIRT1 and SIRT3 deacetylase activity assaySIRT1 and SIRT3 deacetylase activity was determined using a
SIRT1 or SIRT3 Fluorimetric Activity Assay/Drug DiscoveryKit (Enzo Life Science, BML-AK555-0001 and BML-AK557-0001, respectively) following the manufacturer’s protocol. Inbrief, the whole (for SIRT1) or mitochondrial (for SIRT3)
extract (5 mg) was incubated with the Fluor de Lys substratebuffer at 37�C for 1 h followed by incubation with Fluor de LysDeveloper at 37�C for 40 min. After excitation at 360 nm, emit-ted light was detected at 460 nm using a Glomax multi detectionsystem. The fluorescence intensity of the assay buffer was sub-tracted from each experimental sample.
Ammonia-level assayAmmonia levels in cell-conditioned medium was determined
by using the ammonia assay kit (Sigma-Aldrich, AA0100) follow-ing the manufacturer’s protocol. Briefly, cells were grown for sev-eral days and medium was collected every other day. 100 ml ofcell medium was mixed with 1 ml of ammonia assay reagent andincubated or 5 min at room temperature. Afterwards, 10 ml ofglutamate dehydrogenase solution was added. After 5 min absor-bance was read at 340 nm in a Glomax multi detection system.In all measurements ammonia production in the absence of cellswas subtracted from each experiments.
Autophagic proteolysis assessmentAutophagic proteolysis of long-lived proteins was determined
by using the Click-iT metabolic labeling for proteins (LifeTechnologies, C10428) according to the methodology of Zhanget al.72 Briefly, cells with 70% confluency were cultured in a96-well plate (for fluorimeter measurements) or in a glass cover-slip (for confocal microscopy). The day after cells were washed inphosphate buffered saline (PBS; Sigma-Aldrich, P4417) and thencultured in L-methionine-free medium for 2 h to deplete intra-cellular methionine reserves. Cells were then pulsed for 18 hwith 50 mM Click-iT AHA (L-azidohomoalanine; Life Technol-ogies, C10428) in methionine-free medium with 10% dialyzedfetal bovine serum to eliminate also this source of methionine.Afterward, cells were washed with PBSC3% BSA (Sigma-Aldrich, A2153) and cultured for 2 h in complete medium con-taining methionine to chase out short-lived proteins. Cells thenunderwent various treatments as indicated in the figures legends.Starvation was achieved by incubating cells in amino acid freemedium supplemented with 0.1% BSA and 2 mM L-methio-nine. Subsequently, cells were fixed in 4% paraformaldehyde for15 min and permeabilized in 0.5% Triton X-100 (Sigma-Aldrich, T9284) for 20 min at room temperature. Finally cellswere washed in PBS C 3% BSA. The detection click reaction wasobtained by incubating fixed cells for 2 h with alkine-Alexa Fluor488 (Life Technologies, C10428) in Click-iT cell reaction bufferkit. The reaction mixture was removed by washing samples withPBSC3% BSA. Fluorescence from labeled long-lived proteinswas measured using Glomax multidetection system. The fluores-cence intensity of the assay buffer was subtracted from eachexperimental sample. Alternatively, fluorescence from labeledcells on the coverslips was observed using a LSM 510 confocalmicroscopy (Zeiss, 20020 Milan, Italy).
Docking protein-proteinThe docking program Hex 6.137 has been used to evaluate
possible interactions between SIRT5 and GLS. The X-ray struc-tural coordinates of both SIRT5 and the catalytic domain of
www.tandfonline.com 267Autophagy

human kidney GLS have been obtained from the Protein DataBank database (www.pdb.org73) with the ID codes: 3RIY and3VOY, respectively.
A protein-protein docking analysis has been preformed withthe GLS structure assembled into a tetramer. After adding thehydrogen atoms, removing the ligands and the water molecules,the molecular docking has been carried out using shape C elec-trostatics correlation mode, grid size of 0.4 A
�to obtain 50000
solutions.46 The first high score 200 docking models were exam-ined to choose the best interaction complex, taking into accountthe surface complementarity and the total energy of the complex.Inspection of the complexes was performed using the Chimeraversion 1.8 molecular graphics program.74 The complex chosenfor the structural analysis shows a favorable value of protein-pro-tein interaction energy of -242.3 kJ/mol.
Protein extraction and western blot assayCells (1 £ 106) for whole cell lysate were pelleted at 700 £ g
(5 min at 4�C) and lysed in 50 ml of cell lysis buffer (20 mMTris, pH 7.4, 100 mM NaCl, 1% Triton X-100, 1 mM phenyl-methylsulfonyl fluoride [Sigma-Aldrich, P7626], 10 mg/ml leu-peptin [Sigma-Aldrich, L9783], 10 mg/ml aprotinin [Sigma-Aldrich, A3428]). After 30 min on ice, the lysates were clarifiedby centrifugation (10 min at 4�C) and the supernatant fractionwas collected. Protein concentration was determined by the Brad-ford assay (Bio-Rad, 500-0002). Equivalent amounts of proteinwere electrophoresed on SDS-polyacrylamide gels. KaleidoscopePrestained Standards (Bio-Rad, 161-0375) were used to deter-mine molecular weight. The gels were then electroblotted ontoPVDF (Bio-Rad, 162-0219) membranes. After blocking with5% milk, membranes where incubated with the primary anti-body overnight. Finally, the relevant protein was visualized bystaining with the appropriate secondary horseradish peroxidase-labeled antibody for 1 h followed by enhanced chemilumines-cence. Densitometric analysis of the bands, relative to ACTB ofCOX4I1, was performed using Image J software (National Insti-tutes of Health).
Mitochondria isolationCells (2 £ 106) were plated in 100 mm dishes. Following
treatment the cells were scraped off the plate using a rubberpoliceman and centrifuged at 700 £ g for 10 min at 4�C. Thecell pellets were resuspended in 1 ml of 20 mm HEPES-KOH,pH 7.5, 10 mm KCl, 1.5 mm MgCl2, 1 mm EDTA, 1 mmEGTA, 1 mm phenylmethylsulfonyl fluoride, 10 mg/ml leupep-tin, 10 mg/ml aprotinin, and 250 mm sucrose (Sigma-Aldrich,S9378). The cells were broken open with 6 passages through a26-gauge needle applied to a 1-ml syringe. The homogenate wascentrifuged at 1000 g for 5 min at 4�C. The supernatant fractionwas transferred to a high-speed centrifuge tube and centrifuged at10,000 g for 25 min at 4�C. The pellet (mitochondrial) fractionwas lysed in 50 mM Tris (tris[hydroxymethyl]aminomethane)–HCl, 150 mM NaCl, 1% Triton X-100, 0,1% Nonidet P-40(Sigma-Aldrich, 74388), 1 mM phenylmethylsulfonyl fluoride,10 mg/ml leupeptin, 10 mg/ml aprotinin. Protein concentrationof the fraction was determined by the Bradford assay (Bio-Rad).
The purity as well as equal loading of mitochondrial fraction wasdetermined by measuring levels of mitochondrial proteinCOX4I1.
Electron microscopyMDA-MB-231 cells were trypsinized and pelleted. The cells
were then suspended and fixed overnight at 4�C in 2% glutaral-dehyde with 1% tannic acid in 0.1 M sodium cacodylate, pH7.3. The cells were rinsed 3 times in the sodium cacodylate bufferand then incubated in 2% osmium tetroxide in the same bufferfor 2 h at room temperature. The cells were then rinsed 3 timesin distilled water and exposed to 1% uranyl acetate in water for15 min at room temperature. The cells were rinsed twice in dis-tilled water, spun down into 3% agarose at 45�C, and cooled toform blocks. The agarose blocks were dehydrated in graded stepsof acetone and embedded in Spurr’ low viscosity media. Follow-ing polymerization overnight at 65�C, 80-nm sections were cuton a Reighert-Jung Ultra cut E ultramicrotome (Leica Microsys-tems, 20132 Milan, Italy) and picked up on copper grids. Thegrids were post-stained in uranyl acetate and bismuth subnitrate.The sections were observed in a Philips CM-10 TEM (FEI Italia,20122 Milan, Italy) and micrographs recorded on Kodak 4489sheet film.
PEG fusion assayForty thousand cells labeled with Mitotracker Green (40 nM;
Life Technologies, M7514) were cultured overnight on 25-mmcoverslips with 40.000 cells labeled with Mitotracker Red(10 nM; Life Technologies, M22426). The next morning, cellswere fused for 60 s with 50% PEG 1500 (Roche,10783641001). The cells were washed and grown for 7 h ingrowth medium. Afterwards, coverslips were visualized in a LSM510 confocal microscopy (Zeiss).
Mitochondria staining and determination of the DCmt
Mitochondrial morphology and membrane potential (DCmt),were analyzed by using the DCmt sensitive dye 5,50,6,60-tetra-chloro-1,10,3,30-tetraethylbenzimidazolylcarbocyanine iodide(JC-1) (Life Technologies, T3168). Cells (1 £ 104) were cul-tured on 25-mm coverslips placed in a 6-well plate. The dayafter, cells were incubated in fresh media containing 10 mM JC-1 for 15 min at 37�C. After 2 washes in PBS to remove the excessof JC1, cell staining was determined by analysis on a LSM 510confocal microscopy (Zeiss).
Immunoprecipitation assayProteins were extracted as mentioned above. After determin-
ing protein concentration using the Bradford assay, 500 mg ofthe lysate was brought to a final volume of 1 ml with PBS.Lysates were precleared with 1 mg of appropriate control IgG(Santa Cruz Biotechnology, sc-2763) and 20 ml of protein A/GPLUS-agarose (Santa Cruz Biotechnology, sc-2003) and kept ona rotator for 1 h at 4�C. Lysates were centrifuged (500 £ g for5 min at 4�C) and 2 mg of GLS, SIRT5 or GLUD1 antibody orcorresponding IgG was added to the precleared lysates and kepton ice for approximately 3 to 5 h. Following incubation, 30 ml
268 Volume 11 Issue 2Autophagy

of protein A/G PLUS-agarose was added to each tube and kepton a rotator overnight at 4�C. Lysates were then centrifuged(500 £ g for 5 min at 4�C). The pellet fractions were washed4 times with PBS and then resuspended in 20 ml of loadingbuffer. Samples were electrophoresed on an 8% SDS-polyacryl-amide gel and immunoblotted with the appropriate antibody asindicated in the figures.
Statistical analysisThe results are expressed as meansC standard deviations (s.d.)
and 95% confidence intervals (95% CI). Before using parametrictests, the assumption of normality was verified using the Shapiro-Wilk W-test. The Student paired t test was used to determineany significant differences before and after treatment. Signifi-cance was set at 0.05 (P � 0.05). SPSS statistical software pack-age (SPSS Inc., Version 13.0.1 for Windows Chicago, IL, USA)was used for all statistical calculations.
Disclosure of Potential Conflicts of Interest
No potential conflicts of interest were disclosed.
Acknowledgments
Authors wish to thank M. Falconi for his help with the pro-tein-protein docking analysis and S. Ilari for her help with theglutamate measurements.
Funding
This work was partially supported by the Italian Space Agencygrant DC-DTE-2011-2013, by FIRB RBFR10ZJQT, SapienzaAteneo Project 2013, IIT-Sapienza Project, FP7 Project BLUE-PRINT/282510, by PRIN 2012 (prot. 2012 CTAYSY) and byPRIN 2010-2011 (prot. 2010 S7CET4_004). This work wasalso supported by BMBF grant ProNet-T3 to M. Schutkowski.
Supplemental Material
Supplemental data for this article can be accessed on the pub-lisher’s website.
References
1 Mizushima N, Levine B, Cuervo AM, Klionsky DJ.Autophagy fights disease through cellular self-digestion.Nature 2008; 451:1069-75; PMID:1830553810.1038/nature06639
2 Nakahira K, Cloonan SM, Mizumura K, Choi AM,Ryter SW. Autophagy: a crucial moderator of redox bal-ance, inflammation, and apoptosis in lung disease. Anti-oxid Redox Signal 2014; 20:474-94; PMID:23879400;http://dx.doi.org/10.1089/ars.2013.5373
3 Di Bartolomeo S, Corazzari M, Nazio F, Oliverio S, LisiG, Antonioli M, Pagliarini V, Matteoni S, Fuoco C,Giunta L, et al. The dynamic interaction of AMBRA1with the dynein motor complex regulates mammalianautophagy. J Cell Biol 2010; 191:155-68;PMID:20921139; http://dx.doi.org/10.1083/jcb.201002100
4 Itakura E, Kishi C, Inoue K, Mizushima N. Beclin 1forms two distinct phosphatidylinositol 3-kinase com-plexes with mammalian Atg14 and UVRAG. Mol BiolCell. 2008; 19:5360-72; PMID:18843052; http://dx.doi.org/10.1091/mbc.E08-01-0080
5 Kubli DA, Gustafsson A�B. Mitochondria and mitoph-
agy: the yin and yang of cell death control. Circ Res.2012; 111:1208-21; PMID:23065344; http://dx.doi.org/10.1161/CIRCRESAHA.112.265819
6 Chan EY, Longatti A, McKnight NC, Tooze SA.Kinase-inactivated ULK proteins inhibit autophagy viatheir conserved C-terminal domains using an Atg13-independent mechanism. Mol Cell Biol 2009; 29:157-71; PMID:18936157; http://dx.doi.org/10.1128/MCB.01082-08
7 Nakagawa T, Guarente L. Sirtuins at a glance. J Cell Sci2011; 124:833-8; PMID:21378304; http://dx.doi.org/10.1242/jcs.081067
8 Merksamer PI, Liu Y, He W, Hirschey MD, Chen D,Verdin E. The sirtuins, oxidative stress and aging: anemerging link. Aging (Albany NY). 2013; 5:144-50;PMID:23474711
9 Sauve AA, Youn DY. Sirtuins: NAD(C)-dependentdeacetylase mechanism and regulation. Curr OpinChem Biol 2012; 16:535-43; PMID:23102634; http://dx.doi.org/10.1016/j.cbpa.2012.10.003
10 Radak Z, Koltai E, Taylor AW, Higuchi M, Kumagai S,Ohno H, Goto S, Boldogh I. Redox-regulating sirtuinsin aging, caloric restriction, and exercise. Free Radic
Biol Med 2013; 58:87-97; PMID:23339850; http://dx.doi.org/10.1016/j.freeradbiomed.2013.01.004
11 Sack MN, Finkel T. Mitochondrial metabolism, sir-tuins, and aging. Cold Spring Harb Perspect Biol 2012;4 (12); PMID:23209156
12 Lee IH, Cao L, Mostoslavsky R, Lombard DB, Liu J,Bruns NE, Tsokos M, Alt FW, Finkel T. A role for theNAD-dependent deacetylase Sirt1 in the regulation ofautophagy. Proc Natl Acad Sci U S A 2008; 105:3374-9; PMID:18296641; http://dx.doi.org/10.1073/pnas.0712145105
13 Nezis IP, Stenmark H. p62 at the interface of autoph-agy, oxidative stress signaling, and cancer. AntioxidRedox Signal 2012; 17:786-93; PMID:22074114;http://dx.doi.org/10.1089/ars.2011.4394
14 Daitoku H, Sakamaki J, Fukamizu A. Regulation ofFoxO transcription factors by acetylation and protein-protein interactions. Biochim Biophys Acta 2011;1813:1954-60; PMID:21396404; http://dx.doi.org/10.1016/j.bbamcr.2011.03.001
15 Kanamori H, Takemura G, Goto K, Tsujimoto A,Ogino A, Takeyama T, Kawaguchi T, Watanabe T,Morishita K, Kawasaki M, et al. Resveratrol reversesremodeling in hearts with large, old myocardial infarc-tions through enhanced autophagy-activating AMPkinase pathway. Am J Pathol 2013; 182:701-13;PMID:23274061; http://dx.doi.org/10.1016/j.ajpath.2012.11.009
16 Wang P, Guan YF, Du H, Zhai QW, Su DF, Miao CY.Induction of autophagy contributes to the neuroprotec-tion of nicotinamide phosphoribosyltransferase in cere-bral ischemia. Autophagy 2012; 8:77-87;PMID:22113203; http://dx.doi.org/10.4161/auto.8.1.18274
17 Morselli E, Maiuri MC, Markaki M, Megalou E, Pas-paraki A, Palikaras K, Criollo A, Galluzzi L, Malik SA,Vitale I, et al. Caloric restriction and resveratrol pro-mote longevity through the Sirtuin-1-dependent induc-tion of autophagy. Cell Death Dis 2010; 1:e10PMID:21364612
18 Jeong JK, Moon MH, Lee YJ, Seol JW, Park SY.Autophagy induced by the class III histone deacetylaseSirt1 prevents prion peptide neurotoxicity. NeurobiolAging 2013; 34:146-56; PMID:22575359; http://dx.doi.org/10.1016/j.neurobiolaging.2012.04.002
19 Chen ML, Yi L, Jin X, Liang XY, Zhou Y, Zhang T, XieQ, Zhou X, Chang H, Fu YJ, et al. Resveratrol attenu-ates vascular endothelial inflammation by inducingautophagy through the cAMP signaling pathway.Autophagy 2013; 9:2033-45; PMID:24145604; http://dx.doi.org/10.4161/auto.26336
20 Zhao Y, Yang J, Liao W, Liu X, Zhang H, Wang S,Wang D, Feng J, Yu L, Zhu WG. Cytosolic FoxO1 isessential for the induction of autophagy and tumoursuppressor activity. Nat Cell Biol 2010; 12:665-75;PMID:20543840; http://dx.doi.org/10.1038/ncb2069
21 Gal J, Bang Y, Choi HJ. SIRT2 interferes with autoph-agy-mediated degradation of protein aggregates in neu-ronal cells under proteasome inhibition. NeurochemInt. 2012; 61:992-1000; PMID:22819792; http://dx.doi.org/10.1016/j.neuint.2012.07.010
22 Petrilli A, Bott M, Fern�andez-Valle C. Inhibition ofSIRT2 in merlin/NF2-mutant Schwann cells triggersnecrosis. Oncotarget 2013; 4:2354-65; PMID:24259290
23 Nakagawa T, Lomb DJ, Haigis MC, Guarente L.SIRT5 Deacetylates carbamoyl phosphate synthetase 1and regulates the urea cycle. Cell 2009; 137:560-70;PMID:19410549; http://dx.doi.org/10.1016/j.cell.2009.02.026
24 Nakagawa T, Guarente L. Urea cycle regulation bymitochondrial sirtuin, SIRT5. Aging (Albany NY)2009; 1:578-81; PMID:20157539
25 Du J, Zhou Y, Su X, Yu JJ, Khan S, Jiang H, Kim J,Woo J, Kim JH, Choi BH, et al. Sirt5 is a NAD-depen-dent protein lysine demalonylase and desuccinylase. Sci-ence 2011; 334:806-9; PMID:22076378; http://dx.doi.org/10.1126/science.1207861
26 Tan M, Peng C, Anderson KA, Chhoy P, Xie Z, Dai L,Park J, Chen Y, Huang H, Zhang Y, et al. Lysine gluta-rylation is a protein posttranslational modification regu-lated by SIRT5. Cell Metab 2014; 19:605-17;PMID:24703693; http://dx.doi.org/10.1016/j.cmet.2014.03.014
27 Rardin MJ, He W, Nishida Y, Newman JC, Carrico C,Danielson SR, Guo A, Gut P, Sahu AK, Li B, et al.SIRT5 regulates the mitochondrial lysine succinylomeand metabolic networks. Cell Metab 2013; 18:920-33;PMID:24315375; http://dx.doi.org/10.1016/j.cmet.2013.11.013
www.tandfonline.com 269Autophagy

28 Park J, Chen Y, Tishkoff DX, Peng C, Tan M, Dai L,Xie Z, Zhang Y, Zwaans BM, Skinner ME, et al.SIRT5-mediated lysine desuccinylation impacts diversemetabolic pathways. Mol Cell 2013; 50:919-30;PMID:23806337; http://dx.doi.org/10.1016/j.molcel.2013.06.001
29 Eng CH, Yu K, Lucas J, White E, Abraham RT.Ammonia derived from glutaminolysis is a diffusibleregulator of autophagy. Sci Signal 2010; 3:ra31;PMID:20424262
30 Eng CH, Abraham RT. Glutaminolysis yields a meta-bolic by-product that stimulates autophagy. Autophagy2010; 6:968-70; PMID:20724823; http://dx.doi.org/10.4161/auto.6.7.13082
31 Cheong H, Lindsten T, Wu J, Lu C, Thompson CB.Ammonia-induced autophagy is independent of ULK1/ULK2 kinases. Proc Natl Acad Sci U S A 2011;108:11121-6; PMID:21690395; http://dx.doi.org/10.1073/pnas.1107969108
32 Wise DR, Thompson CB. Glutamine addiction: a newtherapeutic target in cancer. Trends Biochem Sci 2010;35:427-33; PMID:20570523; http://dx.doi.org/10.1016/j.tibs.2010.05.003
33 DeBerardinis RJ, Cheng T. Q’s next: the diverse func-tions of glutamine in metabolism, cell biology and can-cer. Oncogene 2010; 29:313-24; PMID:19881548;http://dx.doi.org/10.1038/onc.2009.358
34 Cassago A, Ferreira AP, Ferreira IM, Fornezari C, GomesER, Greene KS, Pereira HM, Garratt RC, Dias SM,Ambrosio AL. Mitochondrial localization and structure-based phosphate activation mechanism of Glutaminase Cwith implications for cancer metabolism. Proc Natl AcadSci U S A 2012; 109:1092-7; PMID:22228304; http://dx.doi.org/10.1073/pnas.1112495109
35 Thangavelu K, Pan CQ, Karlberg T, Balaji G, Uttam-chandani M, Suresh V, Sch€uler H, Low BC, SivaramanJ. Structural basis for the allosteric inhibitory mecha-nism of human kidney-type glutaminase (KGA and itsregulation by Raf-Mek-Erk signaling in cancer cellmetabolism. Proc Natl Acad Sci U S A 2012;109:7705-10; PMID:22538822; http://dx.doi.org/10.1073/pnas.1116573109
36 Aledo JC, de Pedro E, G�omez-Fabre PM, N�u~nez deCastro I, M�arquez J. Submitochondrial localization andmembrane topography of Ehrlich ascitic tumour cellglutaminase. Biochim Biophys Acta. 1997; 1323:173-84; PMID:9042341; http://dx.doi.org/10.1016/S0005-2736(96)00189-7
37 Szeliga M, Obara-Michlewska M. Glutamine in neo-plastic cells: focus on the expression and roles of gluta-minases. Neurochem Int. 2009; 55:71-5;PMID:19428809; http://dx.doi.org/10.1016/j.neuint.2009.01.008
38 DeBerardinis RJ, Mancuso A, Daikhin E, Nissim I,Yudkoff M, Wehrli S, Thompson CB. Beyond aerobicglycolysis: transformed cells can engage in glutaminemetabolism that exceeds the requirement for proteinand nucleotide synthesis. Proc Natl Acad Sci U S A2007; 104:19345-50; PMID:18032601; http://dx.doi.org/10.1073/pnas.0709747104
39 Rama Rao KV, Norenberg MD. Glutamine in the Path-ogenesis of Hepatic Encephalopathy: The Trojan HorseHypothesis Revisited. Neurochem Res. 2014; 39:593-8
40 Wilkinson DJ, Smeeton NJ, Watt PW. Ammoniametabolism, the brain and fatigue; revisiting the link.Prog Neurobiol. 2010; 91:200-19; PMID:20138956;http://dx.doi.org/10.1016/j.pneurobio.2010.01.012
41 Romero-Garcia S, Lopez-Gonzalez JS, B�aez-Viveros JL,Aguilar-Cazares D, Prado-Garcia H. Tumor cell metab-olism: an integral view. Cancer Biol Ther. 2011;12:939-48; PMID:22057267; http://dx.doi.org/10.4161/cbt.12.11.18140
42 Soga T. Cancer metabolism: key players in metabolicreprogramming. Cancer Sci 2013; 104:275-81;PMID:23279446; http://dx.doi.org/10.1111/cas.12085
43 Katt WP, Cerione RA. Glutaminase regulation in can-cer cells: a druggable chain of events. Drug DiscovToday 2014; 19:450-7.
44 Cooper AJ. The role of glutamine synthetase and gluta-mate dehydrogenase in cerebral ammonia homeostasis.Neurochem Res 2012; 37:2439-55; PMID:22618691;http://dx.doi.org/10.1007/s11064-012-0803-4
45 DeBerardinis RJ, Lum JJ, Hatzivassiliou G, ThompsonCB. The biology of cancer: metabolic reprogrammingfuels cell growth and proliferation. Cell Metab 2008;7:11-20; PMID:18177721; http://dx.doi.org/10.1016/j.cmet.2007.10.002
46 Ghoorah AW, Devignes MD, Sma€ıl-Tabbone M,Ritchie DW. Protein docking using case-based reason-ing. Proteins 2013; 81:2150-8; http://dx.doi.org/10.1002/prot.24433
47 Verdin E, Hirschey MD, Finley LW, Haigis MC. Sir-tuin regulation of mitochondria: energy production,apoptosis, and signaling. Trends Biochem Sci 2010;35:669-75; PMID:20863707; http://dx.doi.org/10.1016/j.tibs.2010.07.003
48 Zhou Y, Zhang H, He B, Du J, Lin H, Cerione RA,Hao Q. The bicyclic intermediate structure providesinsights into the desuccinylation mechanism of humansirtuin 5 (SIRT5. J Biol Chem 2012; 287:28307-14;PMID:22767592; http://dx.doi.org/10.1074/jbc.M112.384511
49 Godfrey S, Kuhlenschmidt T, Curthoys P. Correlationbetween activation and dimer formation of rat renalphosphate-dependent glutaminase. J Biol Chem. 1977;252:1927-31; PMID:845154
50 Morehouse RF, Curthoys NP. Properties of rat renalphosphate-dependent glutaminase coupled to Sephar-ose. Evidence that dimerization is essential for activa-tion. Biochem J 1981; 193:709-16; PMID:7305957
51 Sievers F, Wilm A, Dineen D, Gibson TJ, Karplus K, LiW, Lopez R, McWilliam H, Remmert M, S€oding J,et al. Fast, scalable generation of high-quality proteinmultiple sequence alignments using Clustal Omega.Mol Syst Biol 2011; 7:539; PMID:21988835; http://dx.doi.org/10.1038/msb.2011.75
52 Klionsky DJ, Abdalla FC, Abeliovich H, Abraham RT,Acevedo-Arozena A, Adeli K, Agholme L, Agnello M,Agostinis P, Aguirre-Ghiso JA, et al., Guidelines for theuse and interpretation of assays for monitoring autoph-agy. Autophagy 2012; 8:445-544; PMID:22966490;http://dx.doi.org/10.4161/auto.19496
53 Hanna RA, Quinsay MN, Orogo AM, Giang K, RikkaS, Gustafsson A
�B. Microtubule-associated protein 1
light chain 3 (LC3 interacts with Bnip3 protein to selec-tively remove endoplasmic reticulum and mitochondriavia autophagy. J Biol Chem 2012; 287:19094-104;PMID:22505714; http://dx.doi.org/10.1074/jbc.M111.322933
54 Narendra D, Tanaka A, Suen DF, Youle RJ. Parkin isrecruited selectively to impaired mitochondria and pro-motes their autophagy. J Cell Biol 2008; 183:795-803;PMID:19029340; http://dx.doi.org/10.1083/jcb.200809125
55 Geisler S, Holmstr€om KM, Skujat D, Fiesel FC, Roth-fuss OC, Kahle PJ, Springer W. PINK1/Parkin-medi-ated mitophagy is dependent on VDAC1 and p62/SQSTM1. Nat Cell Biol. 2010; 12:119-31;PMID:20098416; http://dx.doi.org/10.1038/ncb2012
56 Poole AC, Thomas RE, Yu S, Vincow ES, Pallanck L.The mitochondrial fusion-promoting factor mitofusinis a substrate of the PINK1/parkin pathway. PLoS One2010; 5:e10054; PMID:20383334; http://dx.doi.org/10.1371/journal.pone.0010054
57 Gegg ME, Cooper JM, Chau KY, Rojo M, SchapiraAH, Taanman JW. Mitofusin 1 and mitofusin 2 areubiquitinated in a PINK1/parkin-dependent mannerupon induction of mitophagy. Hum Mol Genet 2010;19:4861-70; PMID:20871098; http://dx.doi.org/10.1093/hmg/ddq419
58 Mat�es JM, Segura JA, Campos-Sandoval JA, Lobo C,Alonso L, Alonso FJ, M�arquez J. Glutamine homeosta-sis and mitochondrial dynamics. Int J Biochem CellBiol 2009; 41:2051-61; PMID:19703661; http://dx.doi.org/10.1016/j.biocel.2009.03.003
59 Twig G, Shirihai OS. The interplay between mitochon-drial dynamics and mitophagy. Antioxid Redox Signal2011; 14:1939-51; PMID:21128700; http://dx.doi.org/10.1089/ars.2010.3779
60 Newsholme P, Procopio J, Lima MM, Pithon-Curi TC,Curi R. Glutamine and glutamate–their central role incell metabolism and function. Cell Biochem Funct2003; 21:1-9; PMID:12579515; http://dx.doi.org/10.1002/cbf.1003
61 Medina MA, S�anchez-Jim�enez F, M�arquez J, Rodr�ıguezQuesada A, N�u~nez de Castro I. Relevance of glutaminemetabolism to tumor cell growth. Mol Cell Biochem1992; 113:1-15; PMID:1640933; http://dx.doi.org/10.1007/BF00230880
62 Medina MA, N�u~nez de Castro I. Glutaminolysis andglycolysis interactions in proliferant cells. Int J Biochem1990; 22:681-3; PMID:2205518; http://dx.doi.org/10.1016/0020-711X(90)90001-J
63 Lai CC, Lin PM, Lin SF, Hsu CH, Lin HC, Hu ML,Hsu CM, Yang MY. Altered expression of SIRT genefamily in head and neck squamous cell carcinoma.Tumour Biol 2013; 34:1847-54; PMID:23475622;http://dx.doi.org/10.1007/s13277-013-0726-y
64 Atkinson DE, Bourke E. Metabolic aspects of the regu-lation of systemic pH. Am J Physiol. 1987; 252(6 Pt 2:F947-56; PMID:3296786
65 Yu J, Sadhukhan S, Noriega LG, Moullan N, He B,Weiss RS, Lin H, Schoonjans K, Auwerx J. Metaboliccharacterization of a Sirt5 deficient mouse model. SciRep. 2013; 3:2806; PMID:24076663
66 Wada Y, Sun-Wada GH, Kawamura N, Aoyama M.Role of autophagy in embryogenesis. Curr Opin GenetDev 2014; 27C:60-66; PMID:24861852; http://dx.doi.org/10.1016/j.gde.2014.03.010
67 Csibi A, Fendt SM, Li C, Poulogiannis G, Choo AY,Chapski DJ, Jeong SM, Dempsey JM, Parkhitko A,Morrison T, et al. The mTORC1 pathway stimulatesglutamine metabolism and cell proliferation by repres-sing SIRT4. Cell 2013; 153:840-54; PMID:23663782;http://dx.doi.org/10.1016/j.cell.2013.04.023
68 Lombard DB, Alt FW, Cheng HL, Bunkenborg J,Streeper RS, Mostoslavsky R, Kim J, Yancopoulos G,Valenzuela D, Murphy A, et al. Mammalian Sir2homolog SIRT3 regulates global mitochondrial lysineacetylation. Mol Cell Biol 2007; 27:8807-14;PMID:17923681; http://dx.doi.org/10.1128/MCB.01636-07
69 Chen JQ, Russo J. Dysregulation of glucose transport,glycolysis, TCA cycle and glutaminolysis by oncogenesand tumor suppressors in cancer cells. Biochim BiophysActa 2012; 1826:370-84; PMID:22750268
70 Albrecht J, Zieli�nska M, Norenberg MD. Glutamine asa mediator of ammonia neurotoxicity: A criticalappraisal. Biochem Pharmacol. 2010; 80:1303-8;PMID:20654582; http://dx.doi.org/10.1016/j.bcp.2010.07.024
71 H€aussinger D, G€org B. Interaction of oxidative stress,astrocyte swelling and cerebral ammonia toxicity. CurrOpin Clin Nutr Metab Care. 2010; 13:87-92; PMID:Can’t; http://dx.doi.org/10.1097/MCO.0b013e328333b829
72 Zhang J, Wang J, Ng S, Lin Q, Shen HM. Develop-ment of a novel method for quantification of autophagicprotein degradation by AHA labeling. Autophagy.2014; 10:901-12; PMID:24675368; http://dx.doi.org/10.4161/auto.28267
73 Berman HM, Westbrook J, Feng Z, Gilliland G, BhatTN, Weissig H, Shindyalov IN, Bourne PE. The pro-tein data bank. Nucleic Acids Res 2000; 28:235-42;PMID:10592235; http://dx.doi.org/10.1093/nar/28.1.235
74 Pettersen EF, Goddard TD, Huang CC, Couch GS,Greenblatt DM, Meng EC, Ferrin TE. UCSF Chi-mera–a visualization system for exploratory research andanalysis. J Comput Chem 2004; 25:1605-12;PMID:15264254; http://dx.doi.org/10.1002/jcc.20084
270 Volume 11 Issue 2Autophagy