Assemblea - Confitarma · 2007-2008, nel 2016 lo shippingrisente dell’impatto di eventi...
97
Transcript of Assemblea - Confitarma · 2007-2008, nel 2016 lo shippingrisente dell’impatto di eventi...


AssembleaRoma, 20 giugno 2017
Annual General MeetingRome 20th June 2017
aderente a

3
InItalia, oltre al protrarsi degli effetti della grave crisi economica e finanziaria iniziata nel2007-2008, nel 2016 lo shipping risente dell’impatto di eventi straordinari: atti terroristici
in varie parti d’Europa, guerra in Siria, crisi umanitaria nel Mediterraneo, tentato colpo di statoin Turchia, crisi delle banche, rallentamento in Cina e indebolimento delle economie di molti paesiin via di sviluppo.
Non meno importanti sono gli eventi politici: Brexit, esito delle elezioni presidenziali negliStati Uniti, prossime elezioni politiche in Francia e in Germania, crisi greca non ancora risolta,Unione europea che appare spesso disunita e indebolita, specie di fronte all’emergenza migratoria.
In proposito, gli armatori hanno dimostrato di saper onorare con grande disponibilità l’ob-bligo della legge del mare che impone di aiutare le persone in pericolo. Lo fanno in silenzio esenza clamori, nonostante i gravi rischi per la sicurezza e la salute dei marittimi derivanti dal fattoche le navi mercantili non sono costruite né attrezzate per operazioni SAR effettuate su largascala, né gli equipaggi sono per esse addestrati. Grazie al rafforzamento delle operazioni Triton eFrontex, fortemente richiesto da tutta l’industria armatoriale mondiale e soprattutto da Confi-tarma, il coinvolgimento di unità mercantili nelle operazioni SAR si è notevolmente ridotto, male unità mercantili continuano ad essere coinvolte nel salvataggio di migliaia di persone.
A livello mondiale, anche nel 2016 continua la generale tendenza al ribasso dei mercatimarittimi e la debole crescita della domanda si combina con l’eccesso di offerta di naviglio, facen-do registrare – specie per i carichi secchi – il perdurante andamento negativo dei noli. Il falli-mento della società coreana Hanjin è emblematico degli effetti della crisi.
Peraltro, sembra che il peggio sia passato e, anche se permangono preoccupazioni, in alcu-ni settori si cominciano a registrare miglioramenti. La ripresa dell’economia mondiale dovrebbefavorire la domanda di trasporto via mare. Parallelamente, gli analisti di shipping prevedono anco-ra un rallentamento nella consegna di nuove navi. Insomma, anche se la cautela è d’obbligo, vi èpiù di un segnale positivo.
In questo contesto, nonostante le flessioni registrate negli ultimi anni, la flotta mercan-tile italiana, con oltre 16,5 milioni di tonnellate, è sempre nelle prime posizioni: terza tra le flot-
Premessa
Emanuele Grimaldi, Presidente Confitarma
Confitarma 2017.qxp_Layout 1 07/06/17 17:15 Pagina 3

4
te dei maggiori Paesi riuniti nel G20, seconda nell’Unione europea e quarta al mondo tra quellein cui c’è corrispondenza tra bandiera della nave e nazionalità dell’armatore, corrispondenza cheeffettivamente alimenta il cluster marittimo del Paese.
Gli ultimi dati confermano che nel 2015 il contributo economico ed occupazionale gene-rato in Europa dall'industria delle crociere è stato di 41 miliardi di euro e di 360.000 addetti. Darilevare che l’Italia è tra i leader nel settore con 4,5 miliardi spesi e 103.000 addetti occupati.Senza trascurare l’eccellenza dei cantieri italiani, leader in Europa e nel mondo nella costruzionedi navi da crociera, con evidenti ritorni economici e occupazionali per il Paese. Due soli numeri:21 navi ordinate e quasi 12 miliardi di dollari investiti.
Inoltre, l’Italia è la prima al mondo nella graduatoria delle principali flotte di navi ferry ero-ro pax, con 250 unità per più di 5 milioni di tonnellate di stazza su un totale di circa 28 milio-ni di gt.
La competitività della flotta italiana è stata rafforzata e mantenuta, grazie a misure chehanno consentito ai nostri armatori di fronteggiare ad armi pari la concorrenza estera di marinesia comunitarie che extra-comunitarie.
Dal 1998 al 2015, la flotta mercantile italiana è passata da 8,7 milioni di tonnellate distazza a 16,5. L’occupazione marittima è passata da 30.000 a 63.000 unità. Una crescita costan-te, fin quando negli ultimi anni la crisi ha fatto sentire i suoi effetti anche nel nostro comparto:ciononostante, esso si mantiene su valori più che raddoppiati rispetto a vent’anni fa.
Ciò che ha consentito allo shipping nazionale di crescere tanto in relativamente pocotempo è stata l’istituzione del Registro internazionale, che nel 1998, rappresentò un punto disvolta qualificante della politica marittima italiana, che ci allineava a quanto previsto dalle linee-guida della Commissione europea: linee-guida tuttora efficaci e lungimiranti che consentono allaflotta europea di essere oggi il primo vettore marittimo al mondo.
Il contenuto della riforma della navigazione internazionale del 1998 può essere riassuntoin una sola parola: FLESSIBILITÀ.
Ridurla vuol dire perdere in competitività, e alla fine gli operatori, per sopravvivere nonpossono fare altro che ridurre l’attività o aumentare i costi. Sicché, cambiare un sistema norma-tivo coerente e fondato sulla certezza del diritto comunitario e nazionale, in vigore ormai da quasi20 anni e che ha consentito allo shipping italiano un successo senza precedenti (anche, e soprat-tutto, in campo occupazionale) è molto rischioso, perché non si creerebbero vantaggi per alcu-no, ma danni per tutti: armatori, marittimi e utenza, in pratica per l’intero sistema Paese.
Alla stessa preoccupazione di mantenere la competitività della flotta rispetto ai concor-renti risponde un’altra raccomandazione che formuliamo sempre: che a disporre nuove regola-mentazioni in campo operativo e ambientale sia l’International Maritime Organization. È solointroducendo nuove normative a quel livello che si ottiene una parità di condizioni in un settorecosì integrato e globalizzato come è quello del trasporto marittimo.
In questo contesto, essere stato eletto nel maggio 2017 vicepresidente dell’InternationalChamber of Shipping, è per me motivo di grande orgoglio, non solo dal punto di vista personalema anche e soprattutto perché questo è un esplicito riconoscimento da parte dello shipping mon-diale dell’operato di Confitarma e quindi del ruolo di primo piano dell’armamento italiano. In unmomento in cui lo shipping deve affrontare grandi sfide, soprattutto in campo ambientale è fon-damentale essere presenti in un consesso internazionale ove vengono elaborate le strategie marit-time, approfondendo tematiche operative, legali, lavoristiche, delle best practice e dello sviluppodel trasporto marittimo sostenibile. Inoltre, l’ICS, che rappresenta l’80% della flotta mondiale, èin contatto con la maggior parte delle istituzioni internazionali e intergovernative, nell’ambitodelle quali vengono adottate decisioni che incidono sull’industria marittima mondiale, a comin-ciare dall’IMO.
INDICE
Premessa di Emanuele Grimaldi, Presidente Confitarma
La navigazione mercantile italiana nel 2016Emendamenti di Manila 2010 alla Convenzione STCW: problemi e soluzioni per l’implementazione in ItaliaSafety e SecurityArmatori e finanzaTurismo che viene dal mareAccordi bilaterali di navigazione marittima internazionaleNavigazione di cabotaggio Bunkeraggio Sanità MarittimaAutorità di Regolazione dei Trasporti (ART)
Grafici e tabelle / Graphs and tablesFlotta mercantile italiana / Italian merchant fleetEvoluzione della flotta mercantile italiana / Italian merchant fleet evolutionEtà della flotta italiana e mondiale / Age of the Italian and world fleetRinnovamento della flotta italiana / Italian merchant fleet renewalPirateria / PiracyMigranti dal mare / Migrant at seaCommercio estero dell’Italia nel 2016 per modalità di trasporto / Italian foreign trade by mode of transport on 2016Movimento crocieristi nei porti italiani / Passengers movement in Italian portsServizi di trasporto ro-ro per la Sicilia / Ro-Ro services to SicilyServizi di trasporto ro-ro per la Sardegna / Ro-Ro services to SardiniaServizi di trasporto ro-ro internazionali / Ro-Ro international services
La navigazione internazionale e i traffici marittimiFlotta mondiale Mercati marittimi
Grafici e tabelle / Graphs and tablesPIL, commercio mondiale e commercio marittimo / GDP, world trade and maritime tradeTraffico marittimo mondiale / World seaborne tradeEvoluzione della flotta mondiale / World merchant fleet evolutionFlotta mondiale: tonnellaggio da carico controllato dai principali Paesi marittimi World fleet: cargo tonnage controlled by main maritime countries Flotta mondiale: navi iscritte nei principali registri / World fleet: ships on main registersRipartizione delle commesse ai cantieri / Break-down of shipyards ordersOrdini ai cantieri mondiali / World orderbookFlotta mondiale, principali tipi di navi da carico / World fleet by cargo carrying shiptypePrincipali flotte mondiali di navi cisterna / World leading tanker fleetsAndamento dei noli delle navi cisterna / Tanker ships charter market performanceAndamento dei noli delle navi chimichiere / Chemical ships charter market performanceTraffico marittimo di LNG e LPG / Maritime trade of LNG and LPGAndamento dei noli delle navi LPG / LPG ships charter market performanceAndamento dei noli delle navi LNG / LNG ships charter market performanceBaltic dry indexPrincipali flotte mondiali di navi portarinfuse / World leading bulk carrier fleets Principali flotte mondiali di navi portacontenitori / World leading container fleetsAndamento dei noli delle navi portacontenitori / Container ships charter market performanceTraffico mondiale di contenitori / World container trafficTraffico di contenitori per aree geografiche / Container trade by geographic areaPrincipali flotte mondiali di navi traghetto / World leading ro-ro fleetsEvoluzione della flotta crocieristica mondiale / World cruise fleet evolution
3
771012121313151516
5353545455555656565757
171718
58585859
606161626364646465656566676868686969
5
La navigazione europea e la politica marittima dell’UnioneIl valore economico dell’industria marittima europea
Grafici e tabelle / Graphs and tablesFlotta dell’Unione europea (inclusa Norvegia) / European Union fleet (incl. Norway)Impatto del valore aggiunto dell’industria europea della navigazione, 2015 / Total GVA impact of the Eu shipping industry, 2015 Impatto dell’occupazione dell’industria europea della navigazione, 2015 / Total employment impact of the Eu shipping industry, 2015Commercio dell’Unione europea per modo di trasporto / Eu trade by mode of transportImportazioni dell’Unione europea per modo di trasporto / Eu imports by mode of transportEsportazioni dell’Unione europea per modo di trasporto / Eu exports by mode of transport
Lo sviluppo dei traffici marittimi e il sistema portualeAndamento dei traffici portualiItalia: riforma della governance portualeQuadro normativo europeo per la fornitura di servizi portuali e norme comuni in materia di trasparenza finanziaria dei portiItalia: adeguamento tariffario del servizio di pilotaggioItalia: nuove normative sul dragaggioItalia: combustibili alternativi
Grafici e tabelle / Graphs and tablesMovimento container nei principali porti italiani / Containers movement in the major Italian portsMovimento container nei principali porti europei e nord-africani / Containers movement in the major European and North African ports
Il lavoro a bordo e la formazioneCCNL unico per il settore privato dell’industria armatorialeRiforma del collocamento della gente di mareFondo SolimareMaritime Labour Convention 2006Formazione
Grafici e tabelle / Graphs and tablesStima dei posti di lavoro a bordo delle navi italiane / Estimated jobs on board Italian ships ITS Giovanni Caboto. Allievi dal 2011 al 2016 / Cadets 2011 to 2016Fondazione Accademia Italiana della Marina Mercantile. Allievi Ufficiali ammessi dal 2005 al 2017 per regione di provenienza Italian Academy of Merchant Marine Cadet’s district of origin, 2005-2017Fondazione Accademia Nautica dell’Adriatico. Selezioni corsi per Tecnico Superiore / Selection for Superior Technician Cadets
La tutela dell’ambiente marino e la sicurezza della navigazione Acque di zavorraEmissioniCombustibiliFumi delle navi a CivitavecchiaGruppo Permanente Sicurezza della Navigazione del VI RepartoCertificati Radio
Grafici e tabelle / Graphs and tablesSversamenti di petrolio dal 1970 al 2016 / Number of oil spills from 1970 to 2016Requisiti BWMS (Ballast water management System): scenario della flotta mondiale BWMS Requirements: Global Fleet Scenario
L’organizzazione di ConfitarmaCariche confederali / OfficersCommissioni / CommissionsGiovani Armatori
English version
6
2525
707171727273
27272830333434
7475
353535353637
767677
77
40404142434344
7878
45474849
79
7
Emendamenti di Manila 2010 alla Convenzione STCW: problemi e soluzioni per l’implementazione in ItaliaDal 1° gennaio 2017, con l’entrata in vigore degli Emendamenti di Manila 2010 alla ConvenzioneStandards of Training, Certification and Watchkeeping for Seafarers (STCW), importanti novità inmateria di standard di addestramento, abilitazione e tenuta della guardia per i marittimi vengo-no introdotte a livello internazionale:– nuove figure professionali a bordo delle navi: “Marittimo Abilitato di Coperta” (Able SeafarerDeck), “Marittimo Abilitato di Macchina” (Able Seafarer Engine), “Ufficiale Elettrotecnico” (Electro-technical Officer) e “Comune Elettrotecnico” (Electro-technical Rating); – cambiamenti nelle Tavole delle competenze relative ai vari profili professionali come, ad esem-pio, l’utilizzo dell’Electronic Chart Display and Information System (ECDIS) per gli Ufficiali di coper-ta;– nuove competenze per gli Ufficiali di coperta e di macchina, in materia di Leadership andTeamwork;– formazione obbligatoria in materia di security;– maggiore importanza al mantenimento delle competenze da parte dei marittimi. In particolare,tutti i marittimi devono dimostrare, ogni cinque anni, di aver mantenuto un appropriato livellodi competenza per il rinnovo dei certificati di addestramento e di competenza, frequentando icorsi di refreshment per l’adeguamento dei certificati di competenza;– nuove competenze per la formazione specifica per navi petroliere, gasiere e chimichiere;– nuovi standard sulle competenze mediche.
Il grave ritardo con il quale è entrato in vigore il decreto legislativo n. 71 del 12 maggio2015, senza il quale non poteva essere avviato il processo di implementazione degli Emendamentidi Manila nel nostro Paese, determina nel 2016 una vera e propria corsa da parte delleAmministrazioni competenti ad emanare tutti i provvedimenti necessari per consentire ai nostri
La navigazione mercantile italiana nel 2016
8
marittimi di acquisire le competenze stabilite dalla nuova normativa internazionale anche al finedi evitare ripercussioni di carattere operativo per le imprese armatoriali.
In particolare, il ministero delle Infrastrutture e dei trasporti e, per la parte sanitaria, ilministero della Salute hanno dovuto disciplinare con specifici decreti i requisiti necessari peracquisire e rinnovare tutte le certificazioni previste dalla Convenzione STCW, mentre il ComandoGenerale ha provveduto all’emanazione dei decreti disciplinanti i vari corsi di formazione previstidalla nuova normativa internazionale. In merito a tale attività, nonostante i tempi particolar-mente ristretti per l’adozione dei vari provvedimenti, è stato costante il coinvolgimento diConfitarma da parte dell’Amministrazione, anche allo scopo di prevenire eventuali future proble-matiche che sarebbero potute derivare da una mancata partecipazione dell’armamento ai proces-si decisionali.
CORSI DI FORMAZIONE. Si stima che l’adeguamento dei certificati alla nuova normativa internazionaleabbia riguardato oltre 10.000 ufficiali e più di 20.000 sottufficiali e comuni.
Completata la fase normativa, nella seconda parte del 2016 inizia la corsa per l’effettua-zione da parte dei marittimi dei corsi di formazione e per il conseguente adeguamento dei certi-ficati presso le Capitanerie di Porto da concludersi prima del 1° gennaio 2017. Nonostante ilcostante lavoro delle Amministrazioni coinvolte e dei centri di formazione autorizzati, alla datadi scadenza molti marittimi erano ancora senza certificati adeguati.
Grazie al decisivo intervento del Comando Generale, il 5 dicembre l’IMO emana unaCircolare con cui si raccomanda ai Port State Control (PSC) di adottare, fino al 30 giugno 2017,un approccio pratico e pragmatico nell’applicazione dei nuovi Emendamenti di Manila 2010. Surichiesta di Confitarma, il Comando Generale delle Capitanerie di porto emana poi due circolariche forniscono le disposizioni attuative nel nostro Paese per le navi impegnate sia in traffici inter-nazionali che in quelli nazionali, dando un po’ di respiro a lavoratori marittimi e imprese arma-toriali per il completamento degli ultimi adempimenti.
TABELLE MINIME DI SICUREZZA. Negli ultimi mesi del 2016, il Comando Generale emana due circolari conle quali ha voluto dare la possibilità, alle aziende armatoriali che lo ritenessero opportuno, diaggiornare le Tabelle Minime di Sicurezza prima dell’entrata in vigore degli Emendamenti di Manilaalla Convenzione STCW.
Detto aggiornamento delle tabelle minime di sicurezza avrà comunque una validità limita-

9
ta nel tempo in quanto il Comando Generale, già nel mese di gennaio 2017, ha formalizzato l’in-tenzione di aggiornare le linee guida per l’emanazione delle Tabelle Minime di Sicurezza, chie-dendo a Confitarma di presentare le proprie proposte sulla materia.
Viene pertanto elaborato e presentato un documento illustrativo della posizione diConfitarma sulla materia ove in sintesi si propone di: evitare qualsiasi automatismo di inserimentonelle Tabelle Minime di Sicurezza delle nuove figure professionali introdotte dagli Emendamenti diManila; definire con chiarezza le suddette nuove figure professionali; introdurre elementi di sem-plificazione e flessibilità nelle procedure di determinazione delle tabelle; chiarire alcune questio-ni sulle quali sono state evidenziate applicazioni differenti fra le varie Capitanerie di Porto.
ALLIEVO UFFICIALE: PERCORSO FORMATIVO. Il percorso formativo per accedere alla figura dell’AllievoUfficiale e conseguire successivamente l’abilitazione di Ufficiale è un tema fondamentale sul qualei due decreti pubblicati a dicembre 2016 e gennaio 2017 non forniscono le necessarie certezze.Da un lato, il Decreto direttoriale 19 dicembre 2016 del ministero delle Infrastrutture e deiTrasporti, riguardante il percorso formativo per accedere alle figure professionali di AllievoUfficiale di coperta e Allievo Ufficiale di macchina (emanato con una certa fretta per scongiura-re un’ulteriore procedura di infrazione a seguito dei rilievi della Commissione Europea circa i corsidi allineamento) non stabilisce in maniera univoca quale debba essere il percorso per diventareAllievo Ufficiale, soprattutto in considerazione del fatto che le competenze previste devono esse-re soddisfatte non solo dai programmi dei cosiddetti corsi di allineamento (per gli studenti diplo-mati in un Istituto diverso dal “nautico”) ma anche dai programmi degli Istituti nautici. Inoltre,anche alla luce del decreto del 25 luglio 2016, il ministero delle Infrastrutture e dei Trasporti pre-vede di dover riconoscere i programmi degli Istituti nautici a prescindere dall’approvazione daparte del ministero dell’Istruzione, dell’Università e della Ricerca.
Ne potrebbe conseguire che, qualora l’Istituto nautico non venga riconosciuto dal mini-stero delle Infrastrutture e dei Trasporti, i suoi diplomati non possano iscriversi come AllievoUfficiale tra la gente di mare, ma debbano comunque svolgere un corso integrativo per colmare ilgap di competenze non acquisite.
Dall’altro lato, il ministero dell’Istruzione, dell’Università e della Ricerca (di concerto conil ministero del Lavoro e delle Politiche Sociali, il ministero dello Sviluppo Economico, il ministerodell’Economia e delle Finanze e il ministero delle Infrastrutture e dei Trasporti) emana il Decretodel 4 ottobre 2016 che unifica le prove di verifica finale per il conseguimento del diploma di tec-

10
nico superiore con gli esami di abilitazione allo svolgimento della professione di Ufficiale dicoperta e di macchina. Tale decreto rappresenta senz’altro un’evidente semplificazione ammini-strativa per tutti i marittimi che conseguono l’abilitazione di Ufficiale dopo aver svolto il percor-so formativo ITS. Inoltre evita che gli studenti ITS che hanno superato l’esame di abilitazioneprima della fine del corso e che trovano imbarco da Ufficiali, non avendo interesse a sostenerel’esame finale ITS siano considerati studenti “ritirati” dal corso, evenienza che – poiché i finan-ziamenti del MIUR agli ITS sono correlati alle percentuali di conclusione dei percorsi ITS – hapenalizzato gli ITS del mare che, per tale ragione, hanno ricevuto meno finanziamenti.
Tuttavia, l’esame unificato solleva ancor più dubbi in merito a quale sia il percorso for-mativo per diventare Ufficiale e in particolare come, in questo percorso, si innestano gli IstitutiTecnici Superiori. A seguito del confronto che Confitarma ha avuto negli ultimi mesi con MIT eMIUR volto a chiarire i diversi aspetti controversi della materia dovrebbe scaturire un provvedi-mento a firma dei suddetti ministeri che dovrebbe finalmente fornire un quadro di riferimentochiaro dei percorsi formativi.
Infine, il ministero delle Infrastrutture e dei Trasporti dovrebbe pubblicare a breve i qua-derni di addestramento, predisposti da Confitarma, per gli Allievi Ufficiali di coperta e macchinaed elettrotecnici, i comuni di coperta, di macchina ed elettrotecnici e i marittimi abilitati, inconformità agli Emendamenti di Manila 2010. Per le figure elettrotecniche dovrà essere inoltredefinito l’intero percorso formativo, soprattutto con riferimento alla parte scolastica.
Safety e securityMARITIME SAFETY: MIGRANT AT SEA. Alla fine del 2016, il Consiglio europeo proroga fino al 27 luglio 2017il mandato di EUNAVforMED Operazione SOPHIA, l’operazione navale dell’Ue intesa, tra l’altro, a con-trastare le attività del traffico e della tratta di esseri umani nel Mediterraneo centro-meridionale,rafforzandone il mandato con il compito di formare la guardia costiera e la marina libiche e di con-tribuire al largo delle coste libiche all’attuazione dell’embargo dell’ONU sulle armi in alto mare.
Nel corso dell’anno, molto intensi sono gli sforzi, pubblici e privati, per contrastare e miti-gare gli effetti delle attività connesse alla tratta di esseri umani nel Mediterraneo. Anche grazieal notevole dispiegamento di forze navali – marine militari e flotte legate alle ONG – nel corsodell’anno diminuiscono, ma non cessano, le chiamate al soccorso delle navi mercantili. Nel mag-gio si registra un picco, con 80 navi mercantili dirottate, di cui 31 coinvolte direttamente nel sal-vataggio di migranti, con un numero di persone salvate nello stesso mese pari al 22,59% del tota-le. Di fatto, dalle statistiche mensili della MRCC-Roma, nel primo trimestre 2016 le navi dirottatesono 25 e quelle coinvolte nel soccorso 2, mentre nel quarto trimestre dell’anno i totali passano
11
rispettivamente a 52 e 21. Più di una nave al giorno, quindi, viene dirottata e una ogni tre gior-ni è coinvolta in operazioni di soccorso di persone in mare.
Non sono ancora disponibili i dati relativi alla ripartizione tra le bandiere dei mercantilicoinvolti nel 2016, ma è molto probabile che la bandiera italiana resti ancora quella maggior-mente interessata per le due tipologie di operazioni, considerando la presenza della flotta di ban-diera nell’area interessata. Seguono Malta, Liberia, Panama e Singapore.
Al contempo, peraltro, si registrano attacchi armati a navi mercantili in transito nelleacque prospicienti la Libia, che restano quindi aree a rischio.
MARITIME SECURITY. Come noto, in Italia le attività di maritime security sono gestite dal CISM che nelcorso del 2016 riprende i suoi lavori, anche attraverso appositi sottocomitati tematici, concentran-dosi soprattutto sulla messa in sicurezza dei terminal e delle navi passeggeri nel periodo estivo.
PIRATERIA. Nonostante la generale riduzione degli atti di pirateria registratasi nel corso del 2016,l’International Maritime Bureau (IMB) continua a raccomandare ai comandanti di essere vigili nellearee a rischio e di continuare a seguire con molta attenzione le best management practice, soprat-tutto nelle acque della Somalia ove, al contrario, si registra una recrudescenza di attacchi allenavi mercantili.
In Italia, a seguito della fine del sistema duale (militari e privati) di difesa armata a bordodelle navi di bandiera, non essendo ancora operativi i corsi teorico-pratici previsti dal decretolegge n. 107 del 2011 convertito con la legge n. 30 del 2011, al fine di assicurare la sicurezzadegli equipaggi imbarcati, con la legge n. 19 del 2017 il legislatore accoglie la richiesta diConfitarma di prorogare per l’intero 2017 la possibilità di imbarcare guardie giurate ex-apparte-nenti alle Forze Armate (con comprovata esperienza maturata nelle missioni internazionali dipeace keeping). In tal modo, viene data continuità alle operazioni di difesa attiva a bordo deinostri mercantili impegnati nelle zone a rischio pirateria.
Resta al momento irrisolta la criticità rappresentata dagli attacchi in West Africa, ove,soprattutto per ciò che attiene alle acque territoriali nigeriane, resta impossibile impiegare leguardie giurate degli istituti di vigilanza riconosciuti dalla nostra Amministrazione.
CYBER SECURITY. Oltre alle tradizionali fonti di “insicurezza” marittima, è recente la nuova minacciaderivante da attacchi di natura informatica su cui IMO, Ue, Presidenza del Consiglio dei Ministrie Comando Generale delle Capitanerie di Porto sono intervenuti nel corso del 2016, fornendoanche le prime indicazioni operative.
12
In particolare, il Maritime Safety Committee dell’IMO, a maggio 2016, approva le prime spe-cifiche linee-guida volte a fronteggiare il sempre maggiore rischio di intrusioni informatiche neisistemi di gestione dei traffici marittimi, che dovranno essere attuate dai singoli Stati.
Armatori e finanzaNel 2016 prosegue con sistematicità il confronto di Confitarma con gli stakeholders finanziari, siacon riunioni dirette con i principali gruppi bancari nazionali ed internazionali operanti nel setto-re dello shipping, sia a livello istituzionale con l’Autorità di Vigilanza (Banca d’Italia), sia conl’Associazione Bancaria Italiana (ABI).
La strategia di lavoro si sviluppa su due binari:– massima trasparenza e comunicazione per far comprendere i cambiamenti di scenario che
caratterizzano il mercato dei trasporti marittimi, cambiamenti a volte repentini e spesso diversitra i settori di attività, con il risultato di andamenti ciclici non sempre coincidenti. Ciò soprat-tutto in relazione ai processi di ristrutturazione finanziaria in corso al fine di far comprendere agliinterlocutori bancari che, per l’industria dello shipping, la flessibilità finanziaria è una compo-nente imprescindibile e fondamentale;
– costante attenzione alla normativa europea in materia di vigilanza bancaria e in parti-colare al Capital Requirements Regulation (CRR), conosciuto come “Basilea IV”. Tale tema, grazieall’azione di Confitarma, è tra le questioni prioritarie dell’agenda dell’ECSA (associazione degliarmatori europei) e sta producendo, grazie anche al contributo dell’ABI, una proposta di emen-damento che sarà presentata in sede di riforma della normativa citata.
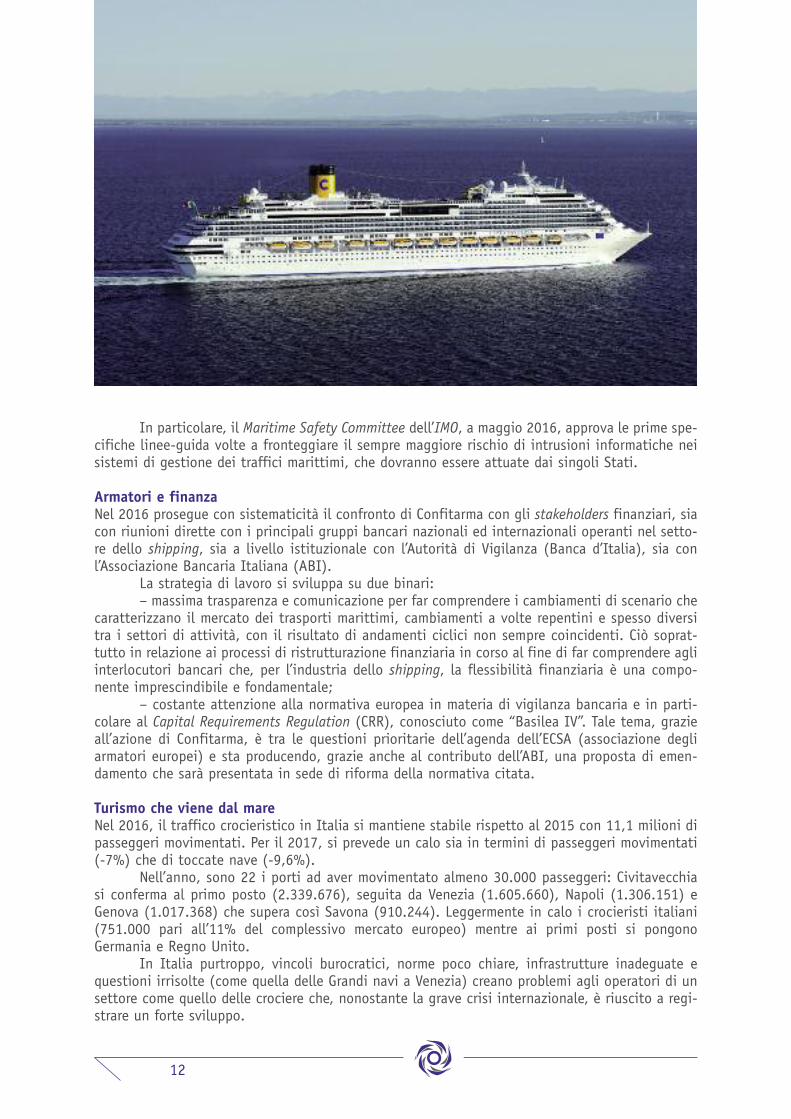
Turismo che viene dal mareNel 2016, il traffico crocieristico in Italia si mantiene stabile rispetto al 2015 con 11,1 milioni dipasseggeri movimentati. Per il 2017, si prevede un calo sia in termini di passeggeri movimentati(-7%) che di toccate nave (-9,6%).
Nell’anno, sono 22 i porti ad aver movimentato almeno 30.000 passeggeri: Civitavecchiasi conferma al primo posto (2.339.676), seguita da Venezia (1.605.660), Napoli (1.306.151) eGenova (1.017.368) che supera così Savona (910.244). Leggermente in calo i crocieristi italiani(751.000 pari all’11% del complessivo mercato europeo) mentre ai primi posti si pongonoGermania e Regno Unito.
In Italia purtroppo, vincoli burocratici, norme poco chiare, infrastrutture inadeguate equestioni irrisolte (come quella delle Grandi navi a Venezia) creano problemi agli operatori di unsettore come quello delle crociere che, nonostante la grave crisi internazionale, è riuscito a regi-strare un forte sviluppo.

13
Accordi bilaterali di navigazione marittima internazionaleTUNISIA: il negoziato per l’esame dell’accordo parafato a Tunisi nel 2006, mai ratificato per indi-sponibilità soprattutto dell’armamento italiano che non ritiene soddisfacente l’intesa raggiuntaall’epoca, non si è ancora riaperto, nonostante l’interesse manifestato da entrambe le parti ariprendere i lavori.
MAROCCO: nonostante Marocco e Italia concordino sull’esigenza di un nuovo accordo bilaterale, adoggi, non vi è ancora nessuna indicazione circa la data di inizio delle negoziazioni. L’Italia pro-porrà di inserire una previsione che permetta di interpretare in modo più favorevole una clauso-la contenuta nell’accordo bilaterale contro le doppie imposizioni, al fine di risolvere il problemadella tassazione in Marocco dei proventi trasferiti in Italia derivanti dall’utilizzo dei contenitori.
ALBANIA: il 2 marzo 2017 viene definita l’Intesa per la sottoscrizione ministeriale dell’Accordo diCooperazione tra il nostro Governo e quello della Repubblica d’Albania nel campo del trasportomarittimo.
AZERBAIJAN E ALGERIA: è all’esame del Senato il disegno di legge di ratifica ed esecuzione deiTrattati sottoscritti dall’Italia tra i quali figurano l’accordo con la Repubblica dell’Azerbaijan sultrasporto marittimo, fatto a Roma il 14 luglio 2014, e l’Accordo di cooperazione nel campo deitrasporti marittimi con la Repubblica algerina democratica e popolare, fatto ad Algeri il 14 novem-bre 2012. L’entrata in vigore di questi due accordi dovrebbe avvenire nel corso del 2017.
Navigazione di cabotaggio “MAREBONUS” E “FERROBONUS”. Alla fine del 2016, la Commissione europea approva gli schemi di rego-lamento relativi all’istituzione in Italia di incentivi per il trasferimento del trasporto merci dallastrada al mare e alla ferrovia (Marebonus e Ferrobonus) dichiarandoli compatibili con la normati-va sugli aiuti di stato.
In particolare, il Marebonus, previsto dalla legge di stabilità 2016, stanzia una spesa di138 milioni di euro complessivi (45,4 milioni nel 2016, 44,1 nel 2017 e 48,9 nel 2018) per l’at-tuazione di progetti condivisi tra armatori ed autotrasportatori che migliorino la catena intermo-dale e decongestionino la rete viaria. Tali progetti devono contemplare la creazione di nuovi ser-vizi marittimi, o il miglioramento di servizi esistenti, per il trasporto combinato delle merci, surotte in arrivo e in partenza da porti situati in Italia, che li collegano con porti italiani,dell’Unione europea o dello Spazio economico europeo.
Superati i rilievi posti da Bruxelles e dal nostro Consiglio di Stato, di recente vengono ema-

14
nati anche i regolamenti di secondo livello che identificano i criteri e le modalità per la presenta-zione dei progetti, al fine di avviare l’effettiva operatività del provvedimento di incentivazione.Poiché lo startup del provvedimento di incentivazione dovrebbe avvenire nel corso del 2017, restaal momento irrisolto il problema del recupero delle somme messe a bilancio per la prima annualità.
ACCERTAMENTO DEL REQUISITO DI “ARMATORE COMUNITARIO”. Purtroppo, anche nel 2016 si verificano nel set-tore del cabotaggio marittimo – soprattutto cisterniero – diversi casi di elusione del Regolamento(CEE) n. 3577/92 da parte di armatori che, pur nel formale rispetto della normativa comunitaria,attraverso la mera registrazione in paesi Ue, gestiscono le navi in territorio extracomunitario, elu-dendo così le norme emanate a tutela degli interessi genuinamente comunitari.
Al fine di accertare il rispetto del requisito di “armatore comunitario”, il ministero delleInfrastrutture e dei Trasporti, nel novembre predispone un nuovo “modello di autocertificazione”che l’armatore dovrà sottoscrivere impegnandosi ai sensi di legge circa la veridicità delle infor-mazioni fornite. In particolare, oltre alle generiche informazioni relative alla nave, al comandan-te e al registered owner, vengono richieste specifiche indicazioni concernenti l’organizzazione chegestisce l’International Safety Management e il responsabile della gestione commerciale e tecnicadella nave. Tale verifica, secondo le indicazioni della Commissione europea, mira ad accertare che,ai fini dell’espletamento dei traffici di cabotaggio, le principali decisioni che attengono alla navevengano adottate quotidianamente a partire dal territorio comunitario, non essendo sufficiente lasola nazionalità comunitaria del registered owner.
AUTOSTRADE DEL MARE. Nel 2017 il trend dell’offerta dei servizi di autostrade del mare in partenza daiporti nazionali è sostanzialmente stabile rispetto al 2016 e si conferma la tendenza ad adottarenuovi modelli operativi basati su collegamenti multiscalo anziché point-to-point, tenuto contodell’attuale concentrazione nel mercato e delle dimensioni delle flotte dei singoli operatori checonsentono un più efficiente utilizzo delle navi attraverso rotazioni più complesse.
I collegamenti verso la Sicilia mostrano valori positivi, sia in termini di partenze settima-nali che di metri lineari offerti, mentre quelli verso la Sardegna registrano una diminuzione. Si
15
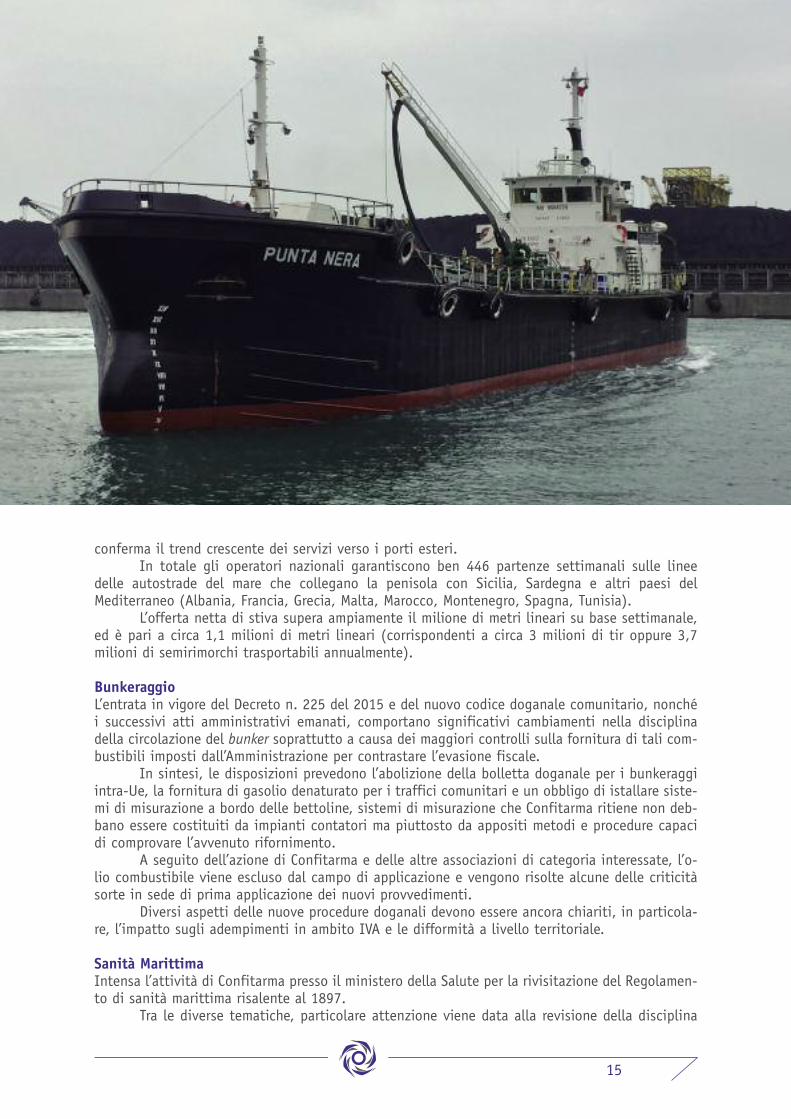
conferma il trend crescente dei servizi verso i porti esteri.In totale gli operatori nazionali garantiscono ben 446 partenze settimanali sulle linee
delle autostrade del mare che collegano la penisola con Sicilia, Sardegna e altri paesi delMediterraneo (Albania, Francia, Grecia, Malta, Marocco, Montenegro, Spagna, Tunisia).
L’offerta netta di stiva supera ampiamente il milione di metri lineari su base settimanale,ed è pari a circa 1,1 milioni di metri lineari (corrispondenti a circa 3 milioni di tir oppure 3,7milioni di semirimorchi trasportabili annualmente).
Bunkeraggio L’entrata in vigore del Decreto n. 225 del 2015 e del nuovo codice doganale comunitario, nonchéi successivi atti amministrativi emanati, comportano significativi cambiamenti nella disciplinadella circolazione del bunker soprattutto a causa dei maggiori controlli sulla fornitura di tali com-bustibili imposti dall’Amministrazione per contrastare l’evasione fiscale.
In sintesi, le disposizioni prevedono l’abolizione della bolletta doganale per i bunkeraggiintra-Ue, la fornitura di gasolio denaturato per i traffici comunitari e un obbligo di istallare siste-mi di misurazione a bordo delle bettoline, sistemi di misurazione che Confitarma ritiene non deb-bano essere costituiti da impianti contatori ma piuttosto da appositi metodi e procedure capacidi comprovare l’avvenuto rifornimento.
A seguito dell’azione di Confitarma e delle altre associazioni di categoria interessate, l’o-lio combustibile viene escluso dal campo di applicazione e vengono risolte alcune delle criticitàsorte in sede di prima applicazione dei nuovi provvedimenti.
Diversi aspetti delle nuove procedure doganali devono essere ancora chiariti, in particola-re, l’impatto sugli adempimenti in ambito IVA e le difformità a livello territoriale.
Sanità MarittimaIntensa l’attività di Confitarma presso il ministero della Salute per la rivisitazione del Regolamen-to di sanità marittima risalente al 1897.
Tra le diverse tematiche, particolare attenzione viene data alla revisione della disciplina

16
dei medici e degli infermieri imbarcati sulle navi passeggeri. Infatti, la vetustà della normativa,ancora ferma ai piroscafi e alle traversate oceaniche degli emigranti di inizio XX secolo, rappre-senta un elemento di criticità specie per le aziende che effettuano crociere o trasporto passeg-geri su mercati esteri, per le quali tra l’altro vi è l’assoluta necessità di imbarcare personale medi-co ed infermieristico in grado di interagire con pazienti non di lingua italiana e a conoscenza delsistema sanitario del loro Paese e della relativa farmacopea. A tal fine, nelle more dell’auspicatarevisione normativa, l’Amministrazione concede, fino alla fine del 2018, l’imbarco di un medi-co/infermiere traduttore che coadiuvi il medico di bordo.
Nel 2016, il ministero della Salute accoglie buona parte delle proposte presentate daConfitarma per la revisione e semplificazione delle linee-guida riguardanti le procedure di rim-borso delle spese mediche all’estero. Ulteriori tematiche in discussione riguardano la composizio-ne della farmacia di bordo, le modalità di sostituzione periodica delle bombole di ossigeno e lanormativa relativa all’assunzione/somministrazione di alcool a bordo.
Autorità di Regolazione dei Trasporti (ART)Anche nel 2016, l’ART richiede alle imprese del settore un contributo per il funzionamento dell’Au-torità stessa. Permangono molte perplessità riguardo alla corretta individuazione dei destinataridi tale richiesta, anche perché la legge prevede che il contributo sia dovuto dai gestori di servi-zi e infrastrutture regolati e in tale categoria non rientrano le imprese che operano in condizionidi libero mercato. Le perplessità sulla corretta applicazione della legge istitutive dell’ART sonoperaltro confermate da alcuni giudizi pendenti presso il Tar Piemonte e la Corte Costituzionale,frutto di ricorsi promossi da realtà appartenenti a molti settori del trasporto. Proprio di recentela suprema Corte si è espressa confermando la legittimità del contributo, peraltro sottolineandoche è competenza del giudice comune stabilire se le imprese svolgono servizi di trasporto effet-tivamente regolati e siano quindi tenute al pagamento.
Ciò nonostante l’ART prosegue il rafforzamento dei propri organici e nel corso dell’anno siregistrano anche i primi interventi nel settore marittimo-portuale dopo che i primi anni eranostati dedicati prevalentemente ad interventi in altri settori, ferroviario e aereo in primis. In par-ticolare, l’ART, dopo aver approvato a fine 2015 il proprio Regolamento per la tutela dei passeg-geri via mare e per vie navigabili interne, nel 2016 inizia a svolgere l’attività prevista in attua-zione del Regolamento (Ue) n. 1177/2010.
17
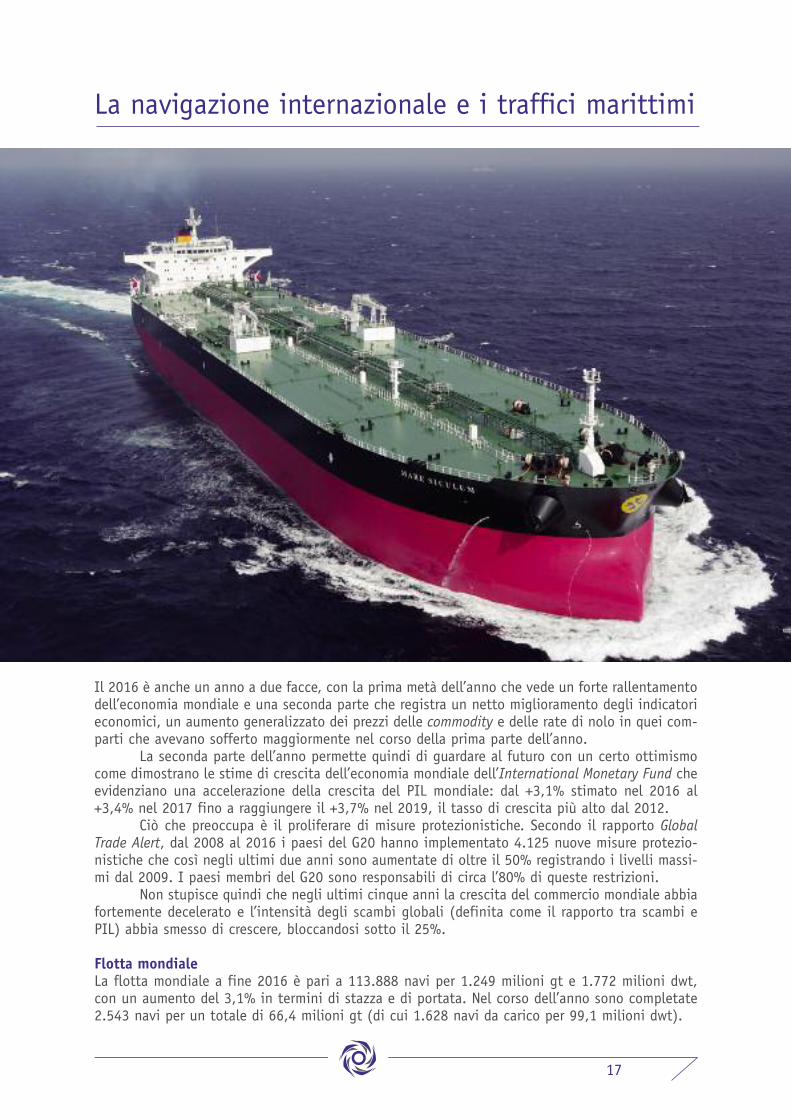
Il 2016 è anche un anno a due facce, con la prima metà dell’anno che vede un forte rallentamentodell’economia mondiale e una seconda parte che registra un netto miglioramento degli indicatorieconomici, un aumento generalizzato dei prezzi delle commodity e delle rate di nolo in quei com-parti che avevano sofferto maggiormente nel corso della prima parte dell’anno.
La seconda parte dell’anno permette quindi di guardare al futuro con un certo ottimismocome dimostrano le stime di crescita dell’economia mondiale dell’International Monetary Fund cheevidenziano una accelerazione della crescita del PIL mondiale: dal +3,1% stimato nel 2016 al+3,4% nel 2017 fino a raggiungere il +3,7% nel 2019, il tasso di crescita più alto dal 2012.
Ciò che preoccupa è il proliferare di misure protezionistiche. Secondo il rapporto GlobalTrade Alert, dal 2008 al 2016 i paesi del G20 hanno implementato 4.125 nuove misure protezio-nistiche che così negli ultimi due anni sono aumentate di oltre il 50% registrando i livelli massi-mi dal 2009. I paesi membri del G20 sono responsabili di circa l’80% di queste restrizioni.
Non stupisce quindi che negli ultimi cinque anni la crescita del commercio mondiale abbiafortemente decelerato e l’intensità degli scambi globali (definita come il rapporto tra scambi ePIL) abbia smesso di crescere, bloccandosi sotto il 25%.
Flotta mondialeLa flotta mondiale a fine 2016 è pari a 113.888 navi per 1.249 milioni gt e 1.772 milioni dwt,con un aumento del 3,1% in termini di stazza e di portata. Nel corso dell’anno sono completate2.543 navi per un totale di 66,4 milioni gt (di cui 1.628 navi da carico per 99,1 milioni dwt).
La navigazione internazionale e i traffici marittimi
18
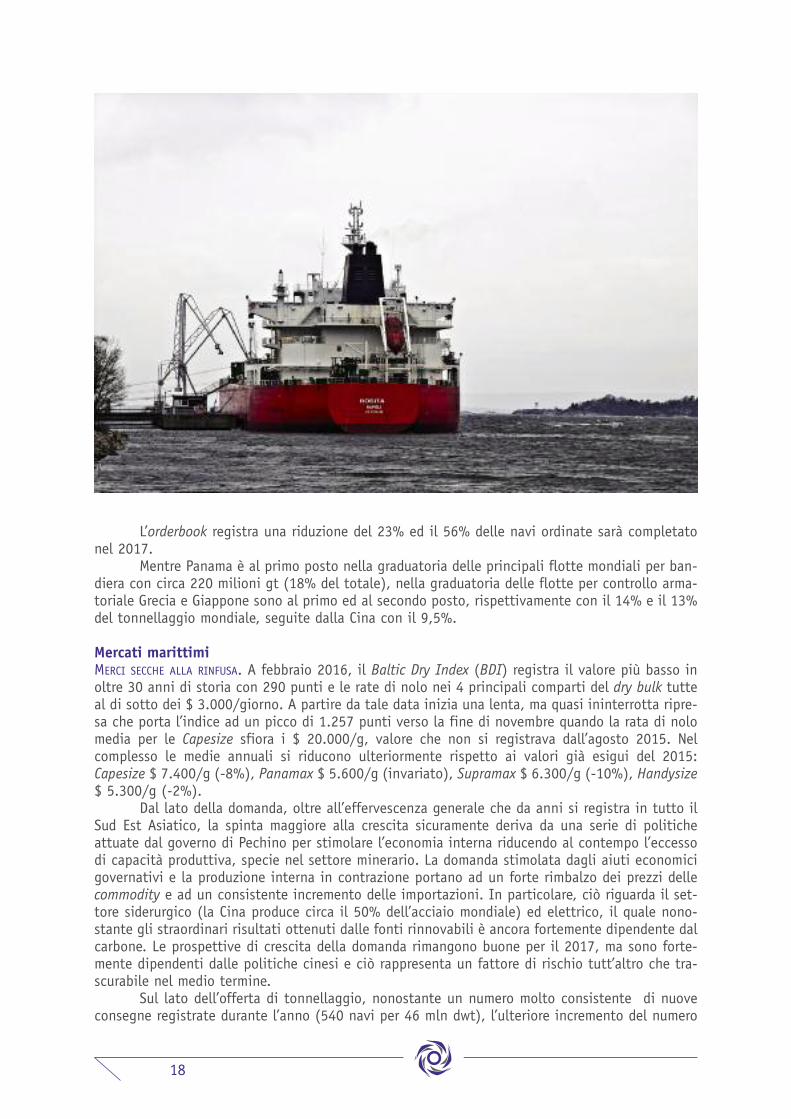
L’orderbook registra una riduzione del 23% ed il 56% delle navi ordinate sarà completatonel 2017.
Mentre Panama è al primo posto nella graduatoria delle principali flotte mondiali per ban-diera con circa 220 milioni gt (18% del totale), nella graduatoria delle flotte per controllo arma-toriale Grecia e Giappone sono al primo ed al secondo posto, rispettivamente con il 14% e il 13%del tonnellaggio mondiale, seguite dalla Cina con il 9,5%.
Mercati marittimiMERCI SECCHE ALLA RINFUSA. A febbraio 2016, il Baltic Dry Index (BDI) registra il valore più basso inoltre 30 anni di storia con 290 punti e le rate di nolo nei 4 principali comparti del dry bulk tutteal di sotto dei $ 3.000/giorno. A partire da tale data inizia una lenta, ma quasi ininterrotta ripre-sa che porta l’indice ad un picco di 1.257 punti verso la fine di novembre quando la rata di nolomedia per le Capesize sfiora i $ 20.000/g, valore che non si registrava dall’agosto 2015. Nelcomplesso le medie annuali si riducono ulteriormente rispetto ai valori già esigui del 2015:Capesize $ 7.400/g (-8%), Panamax $ 5.600/g (invariato), Supramax $ 6.300/g (-10%), Handysize$ 5.300/g (-2%).
Dal lato della domanda, oltre all’effervescenza generale che da anni si registra in tutto ilSud Est Asiatico, la spinta maggiore alla crescita sicuramente deriva da una serie di politicheattuate dal governo di Pechino per stimolare l’economia interna riducendo al contempo l’eccessodi capacità produttiva, specie nel settore minerario. La domanda stimolata dagli aiuti economicigovernativi e la produzione interna in contrazione portano ad un forte rimbalzo dei prezzi dellecommodity e ad un consistente incremento delle importazioni. In particolare, ciò riguarda il set-tore siderurgico (la Cina produce circa il 50% dell’acciaio mondiale) ed elettrico, il quale nono-stante gli straordinari risultati ottenuti dalle fonti rinnovabili è ancora fortemente dipendente dalcarbone. Le prospettive di crescita della domanda rimangono buone per il 2017, ma sono forte-mente dipendenti dalle politiche cinesi e ciò rappresenta un fattore di rischio tutt’altro che tra-scurabile nel medio termine.
Sul lato dell’offerta di tonnellaggio, nonostante un numero molto consistente di nuoveconsegne registrate durante l’anno (540 navi per 46 mln dwt), l’ulteriore incremento del numero

19
delle demolizioni (376 navi per 29 mln dwt) limita fortemente la crescita della flotta, che in tota-le aumenta solo del 2%, il valore più basso registrato da inizio secolo. È interessante notare chela flotta Panamax (Kamsarmax incluse) in termini di numero di navi risulta più piccola a fine annodi 13 unità rispetto all’inizio dell’anno. La flotta Supramax (incluse Handymax e Ultramax) al con-trario registra la crescita più sostenuta, con 123 unità in più nel corso dell’anno. L’orderbook amarzo 2017, rimane consistente, soprattutto per il 2017 (480 navi per 40 mln dwt), e il totaledegli ordinativi al momento risulta di 720 navi pari a 73 mln dwt. L’ andamento futuro delle demo-lizioni e dei nuovi ordini (a livelli minimi nel corso del 2016) sarà fondamentale per determinarel’assorbimento della overcapacity che si è accumulata nel corso degli anni, permettendo una ripre-sa durevole delle rate di nolo.
Nonostante il deciso miglioramento delle rate di nolo, è probabile che le demolizioni con-tinuino ad essere abbastanza sostenute, grazie alle normative anti-inquinamento che entrerannoin vigore a fine 2017 e nel 2020. Al contrario, vi è il rischio di una ripresa dei nuovi ordini aseguito della politica di prezzi bassi adottata dalla cantieristica mondiale per scongiurare la ces-sazione delle attività.
GREGGIO E PRODOTTI PETROLIFERI. Il grande numero di nuovi ordini piazzati nel 2014 e 2015 si è tra-dotto in un forte incremento della flotta delle navi petroliere nel 2016, il che tiene sotto una pres-sione pressoché costante le rate di nolo che registrano un trend negativo per buona parte del-l’anno; al quarto trimestre, grazie a fattori stagionali, le rate tornano a salire, senza comunqueraggiungere i picchi degli anni precedenti.
Il Baltic Dirty Tanker Index, nel 2016 registra una media di 730 punti, in contrazionedell’11%.
Peraltro, dagli andamenti dei vari tipi di navi cisterna emerge che la riduzione delle rate dinolo è ben più consistente: le VLCC sulla rotta di riferimento dal Golfo Persico al Giappone regi-strano una media giornaliera di $ 42.500/g in contrazione del 38%; le Suezmax $ 24.300/g (-46%)e le Aframax si attestano a $ 19.600/g (-47%). I valori medi in senso assoluto rimangono discre-ti, ma il risultato è decisamente preoccupante, tanto più che la domanda di trasporto si mantienesu tassi di crescita elevati, seppur in leggero calo rispetto al 2015, sostenuta da forti tassi di cre-

20
scita delle importazioni dei paesi in via di sviluppo ed emergenti, in particolare India e Cina.In Cina sono molteplici i fattori che spingono ad un forte incremento delle importazioni:
la grande crescita dei consumi, l’aumento delle esportazioni di prodotti petroliferi, la semi-libe-ralizzazione delle importazioni di crudo e soprattutto, approfittando dei bassi prezzi del crudo,l’accelerazione delle importazioni destinate alla creazione di enormi riserve strategiche.
Un aspetto che sicuramente incide sulla domanda di trasporto marittimo è la rimozionedelle sanzioni internazionali contro l’Iran il cui export di petrolio aumenta di circa 800.000 bari-li al giorno nei primi 6 mesi dell’anno. In senso assoluto la crescita dell’export iraniano sarebbeuna buona notizia per il comparto, ma nella situazione di oversupply in cui il mercato petroliferosi trova questi nuovi flussi consentono di rimpiazzare con rotte decisamente più brevi una buonaparte delle esportazioni che dall’Oceano Atlantico andavano in Estremo Oriente, offrendo unagrande domanda in termini di tonnellate-miglia.
È probabile che nel 2017 siano risolti almeno in parte i problemi legati al calo delle espor-tazioni nigeriane dovuti ai sabotaggi di milizie armate; alla crisi che affligge il Venezuela, agliscandali che si stanno susseguendo in Brasile, agli incendi in Canada. Il che, con la stabilizza-zione dell’export iraniano, dovrebbe offrire un buon incremento della domanda su queste rotte alungo raggio, rafforzando una già solida crescita della domanda mondiale.
In un contesto della domanda così dinamico è sconfortante registrare rate di nolo quasidimezzate. Nel corso del 2016 vengono consegnate 126 petroliere pari a oltre 24 mln dwt: 53Aframax (incluse le Large Range 2), 26 Suezmax e ben 47 VLCC.
A fronte di questo enorme numero di consegne il livello di demolizione è del tutto inade-guato con sole 9 navi demolite. L’effetto è una crescita della flotta del 6%, assolutamente non com-misurata all’aumento della domanda; la flotta VLCC addirittura registra un incremento di quasi il 7%.
Anche il settore delle unità porta-prodotti registra una tendenza simile a quella dellepetroliere con le rate di nolo sotto pressione per lunga parte dell’anno. Anche le cause sono simi-li con la flotta che è cresciuta troppo velocemente rispetto alla domanda.
La media del Baltic Clean Tanker Index per il 2016 è di 491 punti, in contrazione del 23%rispetto al 2015. La media dei ritorni per le Medium Range sulla triangolazione Atlantica(Continente – Costa Orientale degli Stati Uniti – Golfo – Continente) registra un calo del 50% e
21
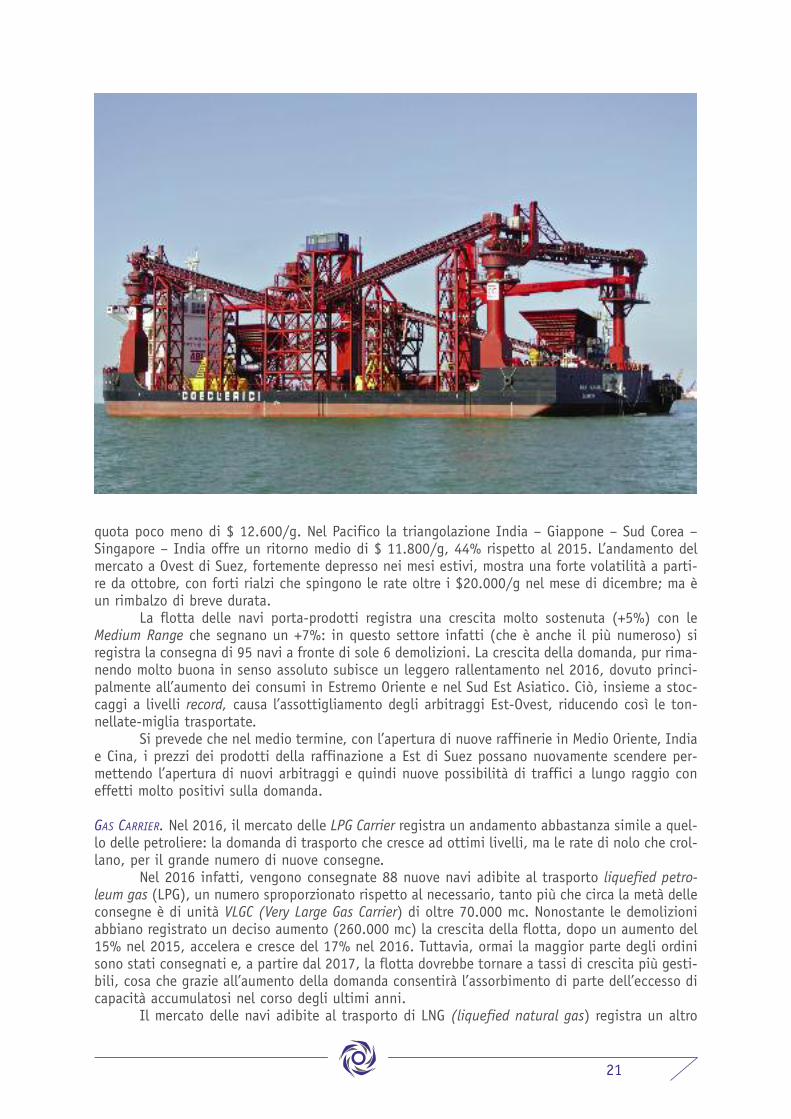
quota poco meno di $ 12.600/g. Nel Pacifico la triangolazione India – Giappone – Sud Corea –Singapore – India offre un ritorno medio di $ 11.800/g, 44% rispetto al 2015. L’andamento delmercato a Ovest di Suez, fortemente depresso nei mesi estivi, mostra una forte volatilità a parti-re da ottobre, con forti rialzi che spingono le rate oltre i $20.000/g nel mese di dicembre; ma èun rimbalzo di breve durata.
La flotta delle navi porta-prodotti registra una crescita molto sostenuta (+5%) con leMedium Range che segnano un +7%: in questo settore infatti (che è anche il più numeroso) siregistra la consegna di 95 navi a fronte di sole 6 demolizioni. La crescita della domanda, pur rima-nendo molto buona in senso assoluto subisce un leggero rallentamento nel 2016, dovuto princi-palmente all’aumento dei consumi in Estremo Oriente e nel Sud Est Asiatico. Ciò, insieme a stoc-caggi a livelli record, causa l’assottigliamento degli arbitraggi Est-Ovest, riducendo così le ton-nellate-miglia trasportate.
Si prevede che nel medio termine, con l’apertura di nuove raffinerie in Medio Oriente, Indiae Cina, i prezzi dei prodotti della raffinazione a Est di Suez possano nuovamente scendere per-mettendo l’apertura di nuovi arbitraggi e quindi nuove possibilità di traffici a lungo raggio coneffetti molto positivi sulla domanda.
GAS CARRIER. Nel 2016, il mercato delle LPG Carrier registra un andamento abbastanza simile a quel-lo delle petroliere: la domanda di trasporto che cresce ad ottimi livelli, ma le rate di nolo che crol-lano, per il grande numero di nuove consegne.
Nel 2016 infatti, vengono consegnate 88 nuove navi adibite al trasporto liquefied petro-leum gas (LPG), un numero sproporzionato rispetto al necessario, tanto più che circa la metà delleconsegne è di unità VLGC (Very Large Gas Carrier) di oltre 70.000 mc. Nonostante le demolizioniabbiano registrato un deciso aumento (260.000 mc) la crescita della flotta, dopo un aumento del15% nel 2015, accelera e cresce del 17% nel 2016. Tuttavia, ormai la maggior parte degli ordinisono stati consegnati e, a partire dal 2017, la flotta dovrebbe tornare a tassi di crescita più gesti-bili, cosa che grazie all’aumento della domanda consentirà l’assorbimento di parte dell’eccesso dicapacità accumulatosi nel corso degli ultimi anni.
Il mercato delle navi adibite al trasporto di LNG (liquefied natural gas) registra un altro

22
anno particolarmente difficile a causa del gran numero di navi consegnate (32 unità per 4,9 mlnmc) e di un mercato della demolizione praticamente immobile (1 sola unità demolita/131.000mc). La flotta nel 2016 cresce del 7% e la crescita è ancora superiore per le unità di dimensionipiù grandi, dove si concentra la grande parte della domanda di trasporto generata da viaggi alungo raggio.
La domanda, dopo un paio di anni deludenti, torna a crescere in maniera molto sostenu-ta, con nuovi progetti che vengono finalmente inaugurati facendo aumentare velocemente i volu-mi movimentati. Sul finire dell’anno le rate di nolo migliorano leggermente grazie a fattori sta-gionali e ad una disponibilità di tonnellaggio più limitata. Tuttavia, il numero di navi ancora inordine e da consegnare nei prossimi anni rimane molto consistente: anche le proiezioni di cre-scita della domanda sono però buone nel breve termine e ottime a partire dalla fine del decen-nio, quando un grande numero di nuovi impianti di produzione e ricezione del LNG sono previstientrare in funzione.
MERCI IN CONTAINER. Nel 2016, il mercato delle portacontenitori prosegue con la forte debolezza cheaveva già caratterizzato la seconda parte del 2015 e le rate di nolo si riducono ulteriormente.Fallisce la Hanjin Ship, ottava società di linea più grande del mondo.
Complessivamente l’indice registra la media annuale più bassa mai registrata dall’inizio deldecennio con soli 325 punti (-30% rispetto al 2015). Le rate di nolo sono particolarmente debo-li per le unità di medie dimensioni (4.250 teu e 3.500 teu), non sufficientemente grandi da potercompetere con le Post-Panamax sulle rotte intercontinentali e troppo grandi per i servizi di fee-deraggio. Le rate per queste unità crollano nel corso del 2016 e a fine anno una nave da 4.250teu viene noleggiata a meno di $ 4.500/giorno, -25% rispetto ai livelli di inizio anno. Le rate dinolo nei size più piccoli, 1.100 teu e 1.700 teu, pur registrando un trend negativo rimangono piùstabili diminuendo di circa $ 500/giorno rispetto ai valori di inizio anno. Il problema rimane l’ec-cesso di offerta presente sul mercato e lo shift sempre più marcato all’utilizzo di navi di grandis-sime dimensioni: il 90% del tonnellaggio consegnato è della categoria Post-Panamax.
23
Tali livelli di nolo portano a triplicare le demolizioni, con ben 640.000 teu di capacità ditrasporto demolita nel corso dell’anno.
Nonostante il grande numero di navi demolite e il forte rallentamento delle consegne (-43% rispetto al 2015), la flotta continua a crescere seppur di solo l’1%, il valore più basso mairegistrato nel settore. Anche gli ordini di nuove unità diminuiscono in maniera molto marcata consolo 64 unità ordinate rispetto alle 284 nel 2015. L’auspicio è che con pochi nuovi ordini e unnumero elevato di demolizioni, possa finalmente ridursi l’overcapacity che da un decennio afflig-ge il settore.
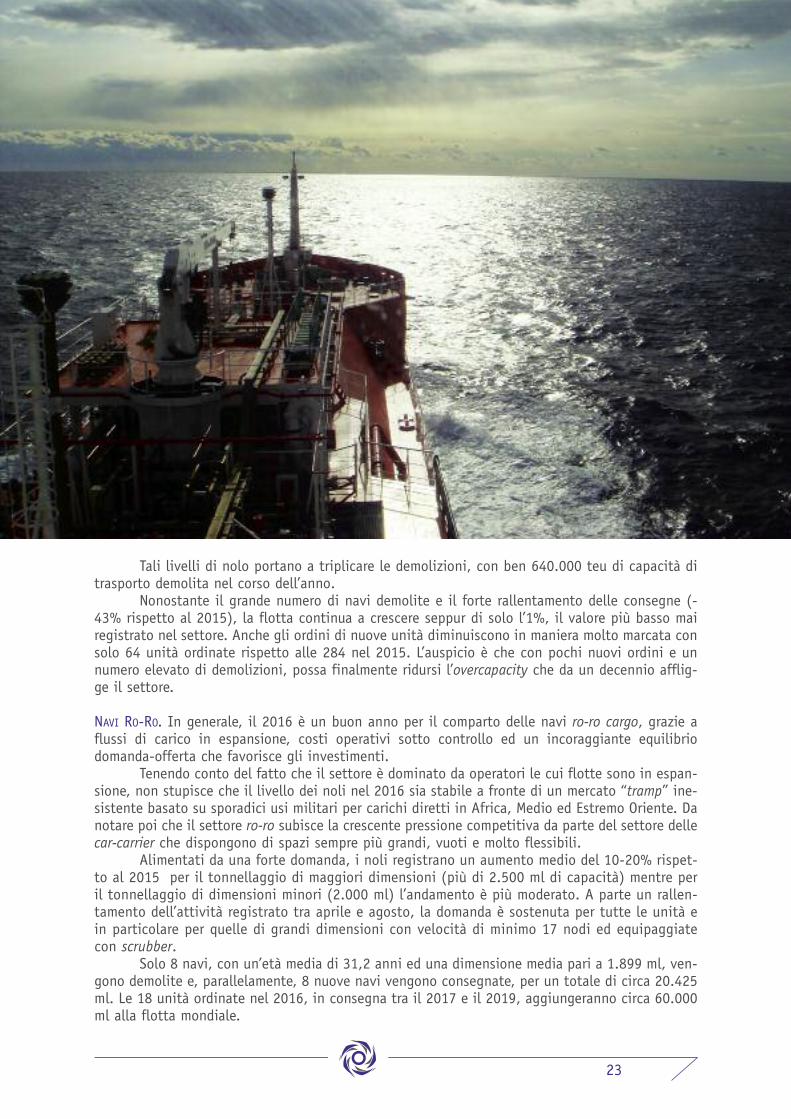
NAVI RO-RO. In generale, il 2016 è un buon anno per il comparto delle navi ro-ro cargo, grazie aflussi di carico in espansione, costi operativi sotto controllo ed un incoraggiante equilibriodomanda-offerta che favorisce gli investimenti.
Tenendo conto del fatto che il settore è dominato da operatori le cui flotte sono in espan-sione, non stupisce che il livello dei noli nel 2016 sia stabile a fronte di un mercato “tramp” ine-sistente basato su sporadici usi militari per carichi diretti in Africa, Medio ed Estremo Oriente. Danotare poi che il settore ro-ro subisce la crescente pressione competitiva da parte del settore dellecar-carrier che dispongono di spazi sempre più grandi, vuoti e molto flessibili.
Alimentati da una forte domanda, i noli registrano un aumento medio del 10-20% rispet-to al 2015 per il tonnellaggio di maggiori dimensioni (più di 2.500 ml di capacità) mentre peril tonnellaggio di dimensioni minori (2.000 ml) l’andamento è più moderato. A parte un rallen-tamento dell’attività registrato tra aprile e agosto, la domanda è sostenuta per tutte le unità ein particolare per quelle di grandi dimensioni con velocità di minimo 17 nodi ed equipaggiatecon scrubber.
Solo 8 navi, con un’età media di 31,2 anni ed una dimensione media pari a 1.899 ml, ven-gono demolite e, parallelamente, 8 nuove navi vengono consegnate, per un totale di circa 20.425ml. Le 18 unità ordinate nel 2016, in consegna tra il 2017 e il 2019, aggiungeranno circa 60.000ml alla flotta mondiale.
24
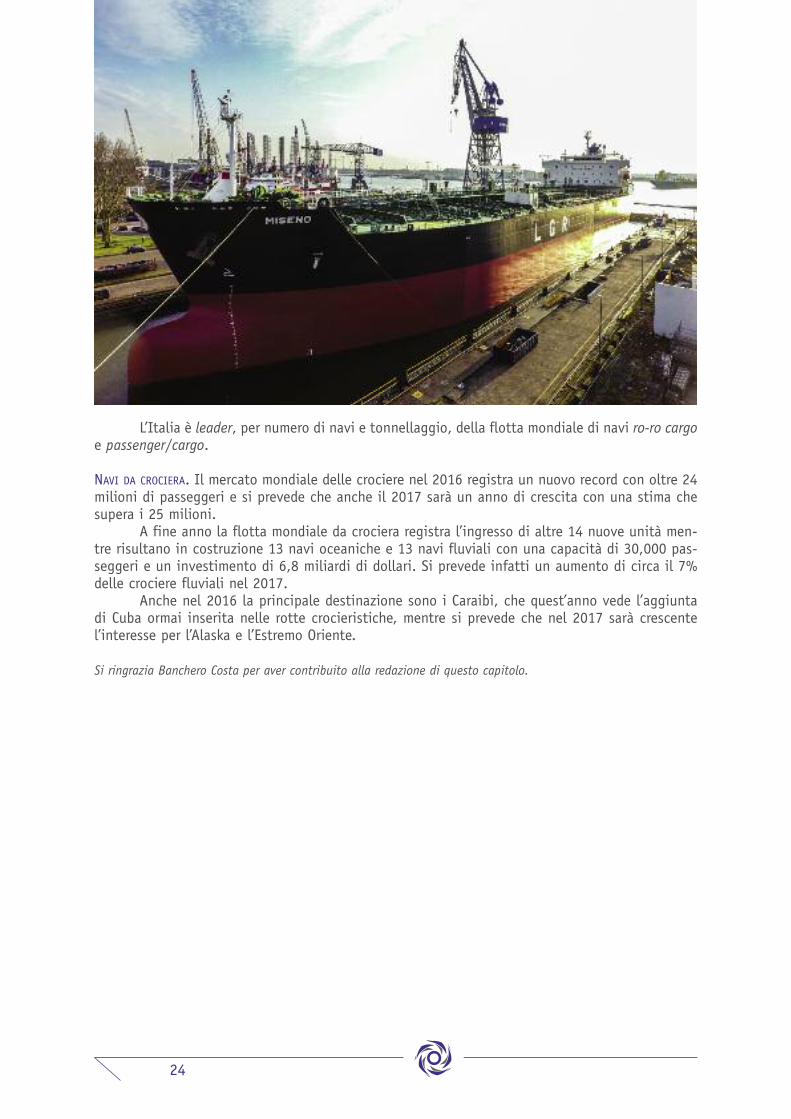
L’Italia è leader, per numero di navi e tonnellaggio, della flotta mondiale di navi ro-ro cargoe passenger/cargo.
NAVI DA CROCIERA. Il mercato mondiale delle crociere nel 2016 registra un nuovo record con oltre 24milioni di passeggeri e si prevede che anche il 2017 sarà un anno di crescita con una stima chesupera i 25 milioni.
A fine anno la flotta mondiale da crociera registra l’ingresso di altre 14 nuove unità men-tre risultano in costruzione 13 navi oceaniche e 13 navi fluviali con una capacità di 30,000 pas-seggeri e un investimento di 6,8 miliardi di dollari. Si prevede infatti un aumento di circa il 7%delle crociere fluviali nel 2017.
Anche nel 2016 la principale destinazione sono i Caraibi, che quest’anno vede l’aggiuntadi Cuba ormai inserita nelle rotte crocieristiche, mentre si prevede che nel 2017 sarà crescentel’interesse per l’Alaska e l’Estremo Oriente.
Si ringrazia Banchero Costa per aver contribuito alla redazione di questo capitolo.
25
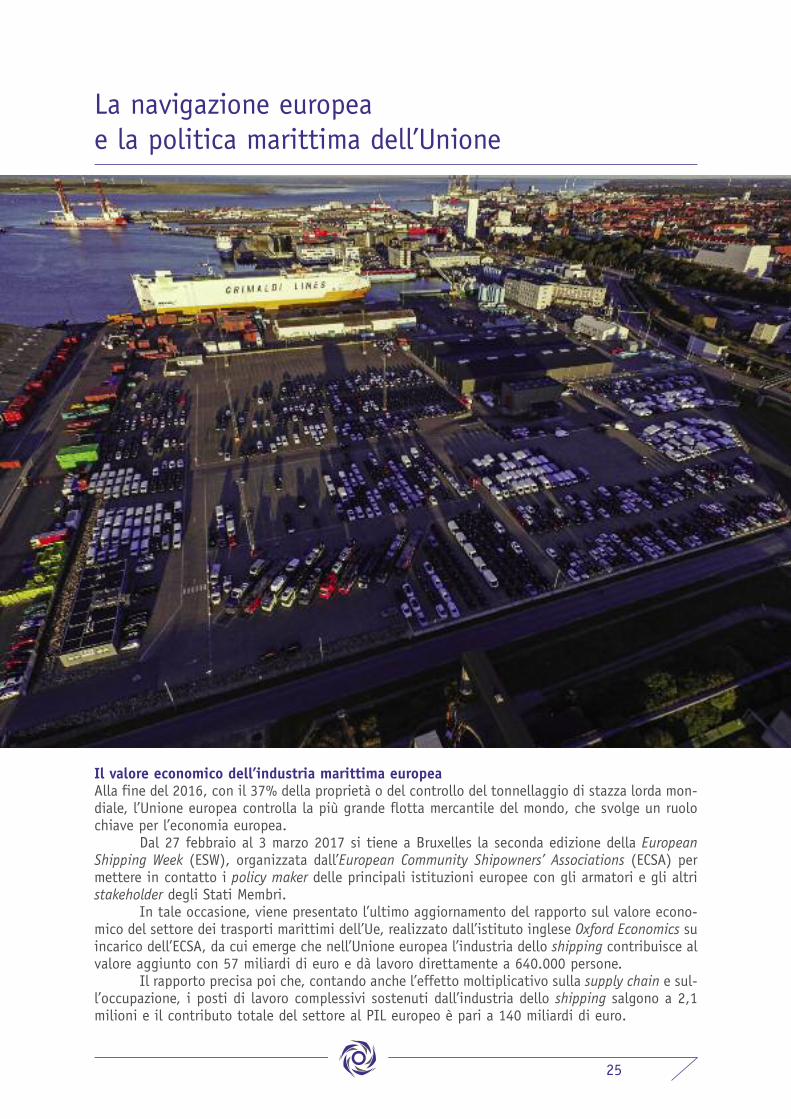
Il valore economico dell’industria marittima europeaAlla fine del 2016, con il 37% della proprietà o del controllo del tonnellaggio di stazza lorda mon-diale, l’Unione europea controlla la più grande flotta mercantile del mondo, che svolge un ruolochiave per l’economia europea.
Dal 27 febbraio al 3 marzo 2017 si tiene a Bruxelles la seconda edizione della EuropeanShipping Week (ESW), organizzata dall’European Community Shipowners’ Associations (ECSA) permettere in contatto i policy maker delle principali istituzioni europee con gli armatori e gli altristakeholder degli Stati Membri.
In tale occasione, viene presentato l’ultimo aggiornamento del rapporto sul valore econo-mico del settore dei trasporti marittimi dell’Ue, realizzato dall’istituto inglese Oxford Economics suincarico dell’ECSA, da cui emerge che nell’Unione europea l’industria dello shipping contribuisce alvalore aggiunto con 57 miliardi di euro e dà lavoro direttamente a 640.000 persone.
Il rapporto precisa poi che, contando anche l’effetto moltiplicativo sulla supply chain e sul-l’occupazione, i posti di lavoro complessivi sostenuti dall’industria dello shipping salgono a 2,1milioni e il contributo totale del settore al PIL europeo è pari a 140 miliardi di euro.
La navigazione europeae la politica marittima dell’Unione

26
Inoltre, il rapporto indica che, con 89.000 euro per ciascun lavoratore dello shipping nel2015, la produttività del settore dei trasporti marittimi dell’Ue rimane al di sopra della mediaeuropea, così come a quello di settori come il manifatturiero e la sanità.
Dei 640.000 posti di lavoro garantiti direttamente dall’industria dello shipping nel 2015,347mila sono relativi all’attività di trasporto marittimo di merci (incluse le attività di rimorchioe di dragaggio), 191mila all’attività di trasporto marittimo di passeggeri, 68mila nel settore deiservizi per l’industria offshore e 7.000 nel segmento delle attività di noleggio e leasing. Dei640.000 occupati direttamente dal comparto marittimo, 516.000 (l’81% del totale) sono lavora-tori imbarcati sulle navi, di cui 207.000 (il 40%) di paesi dell’Ue o dello Spazio EconomicoEuropeo e 309.000 (il 60%), di altre nazionalità, mentre 124.000 sono lavoratori impiegati a terra(il 19% del totale).
Nella stessa occasione, viene presentato lo studio “EU Shipping Competitiveness Study –International benchmark analysis” commissionato dall’ECSA alla Monitor Deloitte. Tale studio, pro-pedeutico alla revisione in corso della politica del trasporto marittimo dell’Unione europea 2009-2018, mette a confronto il quadro generale dell’Ue con le politiche attutate nei cinque principa-li centri marittimi internazionali (Singapore, Hong Kong, Dubai, Shanghai e Vancouver), sulla basedi otto criteri: tassazione e incentivi fiscali, disponibilità di servizi professionali, fattori norma-tivi, economici e politici, competenze, attrattività della bandiera, facilità di fare impresa, quadrogiuridico per le navi offshore (vessel exploitation) e disponibilità finanziaria.
Le conclusioni dello studio sono che, nel complesso, avendo attuato un regime competitivoper quanto riguarda le misure fiscali e sociali, la qualità dei registri di immatricolazione e un altolivello di qualificazione, l’Ue rappresenta un polo di attrazione per le attività di trasporto marittimo.
Peraltro, per sviluppare ulteriormente la crescita del settore, occorre che la politica marit-tima comunitaria sia maggiormente orientata a livello globale ad accrescere la competitivitàdell’Ue come centro per lo shipping internazionale. A tal riguardo, le linee-guida sugli aiuti diStato costituiscono una parte essenziale del quadro politico. Inoltre, lo studio riconosce chel’Unione svolge un ruolo positivo nel sostenere accordi di libero scambio bilaterali e multilatera-li, nonché nella promozione di singoli casi di accesso al mercato.
Per sottolineare questo messaggio, l’ECSA ha anche pubblicato una serie di raccomanda-zioni: “Shipping and Global Trade Towards an EU external shipping policy”.
27
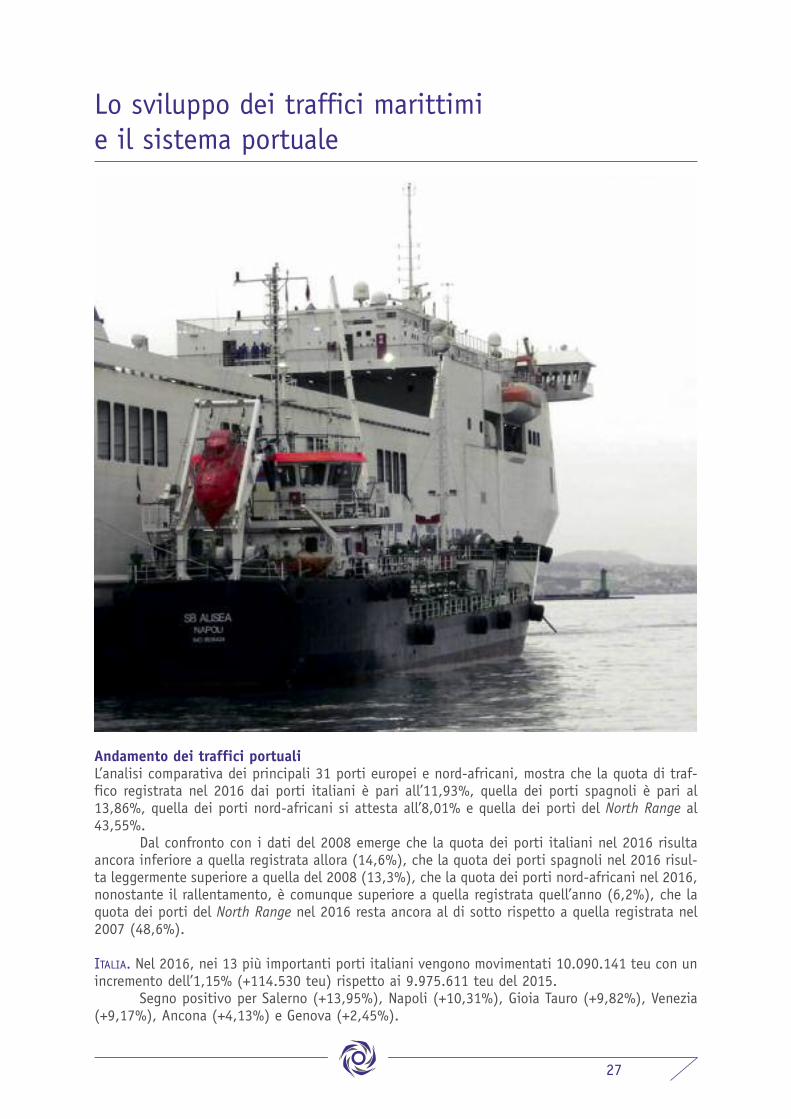
Andamento dei traffici portualiL’analisi comparativa dei principali 31 porti europei e nord-africani, mostra che la quota di traf-fico registrata nel 2016 dai porti italiani è pari all’11,93%, quella dei porti spagnoli è pari al13,86%, quella dei porti nord-africani si attesta all’8,01% e quella dei porti del North Range al43,55%.
Dal confronto con i dati del 2008 emerge che la quota dei porti italiani nel 2016 risultaancora inferiore a quella registrata allora (14,6%), che la quota dei porti spagnoli nel 2016 risul-ta leggermente superiore a quella del 2008 (13,3%), che la quota dei porti nord-africani nel 2016,nonostante il rallentamento, è comunque superiore a quella registrata quell’anno (6,2%), che laquota dei porti del North Range nel 2016 resta ancora al di sotto rispetto a quella registrata nel2007 (48,6%).
ITALIA. Nel 2016, nei 13 più importanti porti italiani vengono movimentati 10.090.141 teu con unincremento dell’1,15% (+114.530 teu) rispetto ai 9.975.611 teu del 2015.
Segno positivo per Salerno (+13,95%), Napoli (+10,31%), Gioia Tauro (+9,82%), Venezia(+9,17%), Ancona (+4,13%) e Genova (+2,45%).
Lo sviluppo dei traffici marittimi e il sistema portuale

28
Praticamente invariato l’azzeramento della movimentazione di container nel porto di Ta-ranto mentre si registra un calo significativo nei porti di Savona (-44,31%) e Livorno (-28,26%).
EUROPA. Rotterdam, Amburgo, Anversa e Bremerhaven registrano nel corso del 2016 una movi-mentazione totale di 36.819.000 teu con un aumento dell’1,71% rispetto ai 36.200.168 teu del2015. In particolare rispetto al 2015, nel 2016 registrano incrementi Rotterdam (+1,52%),Amburgo (+1,25%) e Anversa (+5,92%) mentre Bremerhaven registra un lieve calo (-1,08%). Lariduzione della quota di tali porti sul traffico complessivo è dovuta al fatto che l’incremento deltraffico container nei porti del North Range nel periodo 2007-2016 è stato pari all’8,99% a fron-te di un incremento complessivo del traffico nello stesso periodo pari al 19,43%.
Continua il trend positivo di Barcellona (+11,89%) e Marsiglia (+2,46%) che si attestanorispettivamente a 2.237.818 teu ed a 1.250.000 teu.
Degno di nota anche il costante e progressivo incremento del volume di traffico containernel porto di Sines PSA (Portogallo) che nel corso del 2016 registra 1.513.000 teu superandoampiamente i 150.000 teu del 2007; analoga considerazione vale per il porto maltese di Marsax-lokk che nel 2016 si attesta su 3.080.000 teu rispetto a 1.900.000 teu del 2007, con un lievedecremento dello 0,65% rispetto al 2015.
NORD AFRICA. Si registra un forte rallentamento sui dati di traffico relativi alla movimentazione con-tainer nei porti del Nord Africa pari a -13,37%.
In particolare, nel 2016 rispetto al 2015, nel porto marocchino di Tanger Med il traffico siriduce da 3.000.000 teu a 2.963.654 teu, con una flessione dell’1,21%, mentre nei porti di tran-shipment egiziani di Porto Said e Damietta si registra, rispettivamente, una riduzione del 26,83%per il primo (da 4.000.000 teu a 3.000.000 di teu), ed un incremento del 12,51% per il secondo(da 719.547 teu a 810.311 teu).
Italia: riforma della governance portualeIl 4 agosto 2016 viene pubblicato sulla Gazzetta Ufficiale il Dlgs. n. 169 del 2016 relativo allariorganizzazione, razionalizzazione e semplificazione della disciplina concernente le Autorità por-tuali istituite con la legge n. 84 del 1994. Il decreto riduce il numero delle Autorità portuali da24 a 15 assegnando loro la nuova definizione di Autorità di Sistema Portuale (AdSP).
Le Autorità di Sistema Portuale (AdSP) sono enti pubblici non economici di rilevanzanazionale a ordinamento speciale dotate di autonomia amministrativa, organizzativa, regolamen-tare, di bilancio e finanziaria, nonché di potere di ordinanza. Le AdSP sono sottoposte ai poteridi indirizzo e vigilanza del ministero delle Infrastrutture e dei Trasporti.
PRESIDENTE. La governance delle nuove AdSP si incentra sulla figura del Presidente al quale sonoriconosciuti tutti i poteri gestionali di ordinaria e straordinaria amministrazione. Il Presidente

29
dell’AdSP è nominato dal ministro delle Infrastrutture e dei Trasporti, d’intesa con il Presidente oi Presidenti delle Regioni interessate. In caso di mancata intesa, dopo aver svolto la procedura dicui all’art. 14 ter della legge n. 241 del 1990, la decisione viene adottata dal Consiglio dei Ministrila cui delibera ha natura di atto di alta amministrazione.
COMITATO DI GESTIONE. Il Comitato di Gestione, quale organo politico-strategico del nuovo ente, sosti-tuisce il precedente Comitato portuale ed ha una composizione molto più ridotta, essendo com-posto solo da rappresentanti della pubblica amministrazione, e cioè: il Presidente dell’AdSP; unrappresentante della Regione o delle Regioni il cui territorio è incluso nel sistema portuale anchesolo parzialmente; un rappresentante del Sindaco di ciascuna delle città metropolitane il cui ter-ritorio è incluso nel sistema portuale; un rappresentante del sindaco di ciascuno dei Comuni ex-sede di Autorità portuale; un rappresentante dell’Autorità marittima con diritto di voto solo sullematerie di competenza.
Il nuovo modello di governance delle AdSP rappresenta quindi una rottura con la prece-dente legge n. 84 del 1994 e si caratterizza per un’impostazione fortemente centralizzata di fun-zioni e competenze riservate ai soggetti pubblici, lasciando poco spazio al coinvolgimento dellerappresentanze economiche private.
ORGANISMO DI PARTENARIATO DELLA RISORSA MARE. L’Organismo di partenariato della risorsa mare è l’orga-no consultivo dell’AdSP, composto da due rappresentanti della Pubblica amministrazione (ilPresidente dell’AdSP, che lo presiede, e il Comandante del porto, ovvero dei porti già sede diAutorità portuali rientranti nella circoscrizione dell’AdSP) e dodici rappresentanti del mondoimprenditoriale e del mondo sindacale del settore portuale.
In particolare: un rappresentante per ciascuna delle categorie degli armatori, degli indu-striali, degli operatori di cui agli articoli 16 e 18 della legge n. 84/94, degli spedizionieri, deglioperatori logistici intermodali operanti in porto, degli agenti e raccomandatari marittimi, deglioperatori del turismo o del commercio operanti nel porto designati dalle associazioni nazionali dicategoria maggiormente rappresentative; un rappresentante degli operatori ferroviari operanti inporto; un rappresentante degli autotrasportatori operanti nell’ambito logistico-portuale, designa-to dal Comitato centrale dell’Albo degli autotrasportatori; tre rappresentanti dei lavoratori delleimprese che operano in porto, designati dalle Organizzazioni sindacali maggiormente rappresen-tative a livello nazionale stipulanti il contratto collettivo nazionale del settore portuale.
Tali membri durano in carica 4 anni, partecipano ai lavori dell’Organismo di partenariato atitolo gratuito e possono essere sostituiti da un membro supplente.
Tale Organismo svolge funzioni di confronto partenariale nonché funzioni consultive dipartenariato economico-sociale su tutte le materie che non siano di esclusiva competenza delPresidente.
Se il Comitato di gestione intende discostarsi dagli orientamenti emersi in seno
30
all’Organismo, deve farlo con una scelta adeguatamente e specificamente motivata, il che dovreb-be rendere il parere espresso parzialmente vincolante.
Le posizioni assunte dall’Organismo di partenariato sono adottate secondo la prassi delconsensus, in sostituzione di quello maggioritario. L’orientamento finale potrebbe quindi nonriflettere la volontà manifestata dalla maggioranza numerica dei membri. Sul piano pratico talespeciale procedura riduce la portata del parere in quanto lo stesso è soggetto ad inevitabili restri-zioni e compromessi ed il suo ambito di incidenza potrebbe risultare fortemente ridimensionato.
CONFERENZA NAZIONALE DI COORDINAMENTO DELLE AUTORITÀ DI SISTEMA PORTUALE. È prevista l’istituzione di unaConferenza nazionale di coordinamento delle Autorità di sistema portuale avente il compito dicoordinare ed armonizzare a livello nazionale le scelte strategiche che attengono ai grandi inve-stimenti infrastrutturali, alle scelte di pianificazione urbanistica in ambito portuale, alle strate-gie di attuazione delle politiche concessorie del demanio marittimo, nonché di marketing e pro-mozione del sistema portuale nazionale sui mercati internazionali.
Le competenze assegnate a questa Conferenza sono potenzialmente vastissime e certa-mente strategiche per la portualità nazionale. Sorprende quindi che la legge non abbia previstol’emanazione di un apposito regolamento per la disciplina del suo funzionamento come per il fun-zionamento dell’Organismo di partenariato.
La partecipazione dei rappresentanti delle organizzazioni nazionali di categoria ai lavoridella Conferenza nazionale è prevista solo in veste di invitati e solo in funzione della loro speci-fiche competenze in ordine alle materie di volta in volta inserite all’ordine del giorno.
Quadro normativo europeo per la fornitura di servizi portuali e norme comuni in materia ditrasparenza finanziaria dei portiIl 14 dicembre 2016 il Parlamento Europeo, in riunione plenaria, approva in prima lettura la rela-zione sul Regolamento dei porti che poi il Consiglio adotta il 23 gennaio 2017, trasformandolo inatto definitivo. Il 3 marzo 2017 viene pubblicato nella Gazzetta Ufficiale dell’Unione Europeacome Regolamento (Ue) 2017/352 del Parlamento Europeo e del Consiglio e istituisce un quadronormativo per la fornitura di servizi portuali e norme comuni in materia di trasparenza finanzia-ria dei porti.
Il Regolamento entra in vigore il 24 marzo 2017, ma la sua applicazione decorrerà dal 24marzo 2019. In pratica, l’entrata in vigore sancisce la conclusione del percorso legislativo ed ilconseguente inserimento del Regolamento nell’ordinamento giuridico dell’Unione Europea: gliStati membri devono ora adempiere agli obblighi preliminari indispensabili per la successiva pienaapplicazione del Regolamento, che decorrerà allo scadere del ventiquattresimo mese.
Il testo definitivo del Regolamento è frutto di innumerevoli compromessi, che hanno pro-
31
gressivamente ridimensionato la portata innovativa del provvedimento, inizialmente ispirato aiprincipi del libero mercato.
I servizi portuali ai quali si applica il Regolamento, fatte salve le esenzioni previste dal-l’art. 10, sono: rifornimento di carburante (bunkeraggio); movimentazione merci, ormeggio, ser-vizi passeggeri, raccolta dei rifiuti prodotti dalle navi e dei residui del carico; pilotaggio, servizidi rimorchio; servizio di dragaggio (per il quale è previsto l’obbligo di contabilità separata quan-do viene svolto dall’Ente di gestione del porto che beneficia di finanziamenti pubblici).
Parte integrante fondamentale del Regolamento sono le premesse che riportano tutte leconsiderazioni di principio poi trasfuse nella nuova normativa sui servizi portuali.
Inoltre, in base alla normativa europea, per obbligo di servizio pubblico si intende quel-lo imposto al fornitore di un servizio al fine di garantire una prestazione di interesse generale,obbligo che quello stesso operatore non assumerebbe alle stesse condizioni se dovesse tenerconto solo del proprio interesse commerciale.
LIMITAZIONE DEL NUMERO DEI PRESTATORI DEI SERVIZI PORTUALI. L’ente di gestione del porto, o l’autorità com-petente, può limitare il numero dei prestatori dei servizi portuali quando: vi è carenza o destina-zione ad altro scopo di aree o spazi portuali; l’assenza di tale limitazione ostacola l’esecuzionedegli obblighi di servizio pubblico (anche quando tale assenza determina per l’ente di gestione delporto, l’autorità competente o agli utenti del porto costi eccessivamente elevati in relazione all’e-secuzione di tali obblighi); l’assenza di detta limitazione collide con l’esigenza di garantire la sicu-rezza o la sostenibilità ambientale delle operazioni portuali; le caratteristiche dell’infrastrutturaportuale o la natura del traffico sono tali da non permettere che più prestatori operino nello stes-so porto; è accertato che un settore o un sotto settore portuale, insieme ai suoi servizi portuali,svolge un’attività che è direttamente esposta alla concorrenza su mercati liberamente accessibili.
MANTENIMENTO DEI DIRITTI DEI LAVORATORI – CLAUSOLA SOCIALE. Il Regolamento, nella sua lunga fase digestazione, ha risentito dell’influenza delle problematiche sociali e conseguentemente si èmostrato sempre più sensibile all’esigenza di tutela dei diritti dei lavoratori e della loro protezio-ne, oltre che della loro formazione professionale.
Per esempio l’art. 9 “Mantenimento dei diritti dei lavoratori”, prevede che al “personaleimpiegato dal prestatore di servizi portuali uscente sono concessi gli stessi diritti che tale persona-le avrebbe potuto rivendicare nel caso di un trasferimento di imprese a norma della direttiva2001/23/CE”. Tale norma rappresenta una vera e propria spada di Damocle per gli utenti del ser-vizio portuale in quanto il nuovo fornitore non potrà operare una vera ristrutturazione del servi-zio e sarà costretto a far gravare sui costi gestionali e sulle tariffe il costo del personale del pre-cedente concessionario.

32
ESENZIONI. L’art. 10 del Regolamento stabilisce che le disposizioni per la disciplina dell’accesso almercato dei servizi portuali non si applicano alla movimentazione di merci e passeggeri ed al pilo-taggio, anche se i singoli Stati membri possono eliminare tali esenzioni. Tutta l’incertezza politi-ca mostrata dalla Commissione emerge poi nell’incoraggiamento a tutti gli Stati membri a conce-dere “l’uso di certificati di esenzione dal pilotaggio, o meccanismi equivalenti (per esempio VHF),in modo da migliorare l’efficienza nei porti e, in particolare, stimolare il trasporto marittimo a cortoraggio” (Considerando 39).
Inoltre, il Regolamento non esclude il diritto degli Stati membri di regolamentare le tarif-fe dei servizi al fine di evitare una tariffazione eccessiva come potrebbe scaturire da situazionidel mercato che, anche se liberalizzato, non consentono di conseguire una concorrenza effettiva.(Considerando 40).
TRASPARENZA FINANZIARIA ED AUTONOMIA. “È opportuno che le relazioni finanziarie tra porti marittimibeneficiari di finanziamenti pubblici e prestatori di servizi portuali, da un lato, e le autorità pub-bliche, dall’altro, siano rese trasparenti al fine di assicurare condizioni eque di concorrenza ed evi-tare distorsioni del mercato” (Considerando 41).
Sempre al fine di evitare distorsioni di mercato, gli Enti di gestione dei porti, che benefi-ciano di finanziamenti pubblici e forniscono al contempo servizi portuali debbono mantenere unacontabilità separata tra attività finanziate con fondi pubblici e quelle svolte su base concorren-ziale (Considerando 43).
Inoltre, la Commissione deve individuare quali investimenti pubblici nelle infrastruttureportuali rientrino nell’ambito di applicazione del Regolamento n. 651/2014 (disciplina generalein materia di esenzioni alla normativa sugli aiuti di Stato per categoria), tenendo conto dellanatura non economica di alcune infrastrutture come quelle di accesso e di difesa dei porti, pur-ché aperte a tutti i potenziali utenti su base paritaria e non discriminatoria (Considerando 45).
Sulla base di tali principi il Regolamento stabilisce che le assegnazioni di fondi pubblici afavore degli Enti di gestione dei porti, anche per il tramite di imprese/istituzioni finanziarie pub-bliche, debbono essere rese trasparenti attraverso il sistema di contabilità separata, evidenzian-do lo scopo che si intende perseguire attraverso l’assegnazione di tali fondi.

33
DIRITTI D’USO DELL’INFRASTRUTTURA PORTUALE. Secondo il Regolamento, sono diritti d’uso dell’infrastrut-tura portuale quelli corrisposti a beneficio diretto o indiretto dell’Ente di gestione del porto odell’Autorità competente, per l’uso delle infrastrutture o dei servizi forniti dall’Autorità stessa,incluso l’accesso al porto per via navigabile. Inoltre, per contribuire a sostenere un sistema effi-ciente di tariffazione dell’uso dell’infrastruttura, il livello dei diritti d’uso sono stabiliti in basealla strategia commerciale ed ai piani di investimento del porto e rispettano le norme in materiadi concorrenza.
Comunque, in base alla strategia economica ed alla politica di pianificazione territorialedel porto, i diritti d’uso possono essere differenziati con riferimento a talune categorie di utentio al fine di promuovere un uso più efficiente dell’infrastruttura portuale ed il trasporto marittimoa corto raggio. I criteri per tale differenziazione – oltre ad essere trasparenti, obiettivi e nondiscriminatori – devono essere in linea con le norme sugli aiuti di Stato ed in materia di concor-renza. Peraltro, tale disposizione sembra contraddire quella che consente all’Ente di gestione delporto, o all’Autorità competente, di non rivelare differenziazioni delle tariffe d’uso risultanti dasingole negoziazioni (Considerando 48).
Italia: adeguamento tariffario del servizio di pilotaggioNegli ultimi mesi del 2016 si svolge, in sede ministeriale, l’istruttoria nazionale per l’adeguamen-to tariffario del servizio di pilotaggio nei porti nazionali. L’aumento medio nazionale delle tariffevalido per il biennio 2017-2018 risulta pari a +0,38% che, al netto del trattamento di fine servi-zio e della scontistica per le Autostrade del mare, si riduce a -1,47%. Tale risultato viene parti-colarmente apprezzato in quanto dimostra, a distanza di un biennio, la validità delle modificheapportate nel 2014 alla formula tariffaria del pilotaggio.
Nel corso del prossimo biennio verranno affrontati a livello ministeriale argomenti come l’am-pliamento del servizio di pilotaggio in VHF, i grandi tonnellaggi e la revisione della spesa ammessa.La soluzione di tali problematiche potrebbe migliorare ulteriormente l’efficienza e l’economicità delservizio, come è già successo con i risultati raggiunti grazie alle modifiche adottate nel 2014.
Nel 2016 viene emanata la legge n. 230 relativa alla limitazione della responsabilità deipiloti che comporta l’obbligo di stipulare un’apposita polizza assicurativa per poter esercitare la
34
professione. È importante rilevare che tale legge stabilisce che qualunque provvedimento disci-plinante l’obbligatorietà dei servizi tecnico-nautici debba essere attuato dopo aver acquisito ipareri delle organizzazioni di categoria nazionali interessate.
Italia: nuove normative sul dragaggioEntra in vigore tra febbraio e settembre 2016 la nuova normativa ambientale che regola le ope-razioni di dragaggio nei porti italiani, sia in merito alla semplificazione dei criteri di costruzio-ne delle casse di colmata e delle vasche di raccolta, sia in merito all’escavo nelle zone portualie marino-costiere che ricadono nei siti di interesse nazionale (SIN), oppure nelle aree che nesono fuori, nonché infine circa modalità e criteri di gestione del materiale dragato, inclusa l’im-mersione.
La nuova disciplina viene incontro alle preoccupazioni degli operatori marittimi che datempo lamentano una progressiva riduzione dei fondali marini, quanto mai dannosa difronte aduna evoluzione tecnologica che punta all’incremento delle dimensioni delle navi (cosiddetto“gigantismo navale”).
Italia: combustibili alternativiAl fine di ridurre la dipendenza dal petrolio attenuando l'impatto ambientale dei trasporti marit-timi, con il Decreto legislativo n. 257 del 2016 (entrato in vigore il 14 gennaio 2017), l’Italiada’ attuazione alla Direttiva europea 2014/94/Ue relativa alla realizzazione del quadro strategi-co nazionale volto allo sviluppo del mercato dei combustibili alternativi nel settore dei traspor-ti marittimi ed interni. Pertanto, per consentire la circolazione di navi alimentate con GNL, l’Italia si impegna a realiz-zare un numero adeguato di punti di rifornimento di tale combustibile, entro il 31 dicembre 2025all’interno della rete TEN-T ed entro il 31 dicembre 2030 nei porti interessati dalla navigazioneinterna. Viene previsto anche un piano di elettrificazione delle banchine nei porti marittimi rientrantinella rete TEN-T e nei porti della navigazione interna, da realizzare entro il 31 dicembre 2025.
35
CCNL unico per il settore privato dell’industria armatorialeIl 15 settembre 2016 Confitarma completa, insieme alle Organizzazioni sindacali confederali, non-ché ad Assorimorchiatori e Federimorchiatori per la Sezione applicata sulle unità adibite al rimor-chio portuale, la stesura definitiva del Contratto Collettivo Nazionale di Lavoro per il settore pri-vato dell’industria armatoriale, il quale scadrà il 31 dicembre 2017.
In conformità a quanto previsto dall’accordo quadro sottoscritto il 1° luglio 2015 conte-stualmente all’accordo di rinnovo contrattuale, viene così realizzato un contratto che comprendetutti i contratti collettivi nazionali precedentemente applicati nel settore marittimo, i quali vannoora a costituire le 15 Sezioni del CCNL Unico, recependo le modifiche e innovazioni introdotte dal-l’accordo del luglio 2015 e da quelli successivi, nonché completando il lavoro di semplificazionee riordino del CCNL.
In applicazione delle disposizioni della Maritime Labour Convention 2006, Confitarma haelaborato anche la versione in inglese di alcune Sezioni del CCNL.
Riforma del collocamento della gente di mareIl 17 novembre 2016, Confitarma, Fedarlinea, Filt-CGIL, Fit-CISL e Uiltrasporti sottoscrivono unAvviso Comune che propone di costituire un più efficiente e moderno sistema per il collocamen-to della gente di mare, sulla base dei seguenti principi: istituzione di un’Anagrafe Nazionale dellaGente di Mare informatizzata ed efficiente in previsione del superamento del “turno generale”;assunzione diretta del lavoratore marittimo; eliminazione del rilascio dei buoni di imbarco e delrelativo contributo economico; mantenimento di tutte le disposizioni e tutele previste dalRegolamento del Turno Particolare previsto dal CCNL 1° luglio 2015; procedura autorizzativa delleagenzie di manning per lo svolgimento delle proprie attività, ai sensi della Maritime LabourConvention 2006.
Al fine di avviare un tavolo tecnico di confronto in sede ministeriale e portare finalmen-te a compimento la riforma del collocamento, prevista dal DPR n. 231 del 2006, ma mai attuata,l’Avviso Comune viene trasmesso al ministero delle Infrastrutture e dei Trasporti.
Fondo SolimareIl 12 gennaio 2016 si insedia ufficialmente il Comitato Amministratore del Fondo di Solidarietà
Il lavoro a bordo e la formazione
36
Bilaterale del settore marittimo(Solimare), composto da due rappresen-tanti rispettivamente del ministero delLavoro e delle Politiche Sociali e di quel-lo dell’Economia e delle Finanze e dadieci esperti: cinque designati dalleSegreterie Nazionali delle OrganizzazioniSindacali confederali, cinque designatidalle Associazioni datoriali (tre daConfitarma, uno da Fedarlinea e uno daFederimorchiatori). Il Comitato eleggepresidente un rappresentante diConfitarma.
Nonostante i versamenti dei con-tributi da parte di imprese armatoriali eloro dipendenti, iniziati a giugno 2016con effetto retroattivo dal marzo 2014per disposizione del ministero del Lavoroe delle Politiche Sociali, nel corso del-l’anno il Fondo non riesce ad erogare pre-stazioni a causa di una disposizione inse-rita nel decreto interministeriale del2015 istitutivo del Fondo, che di fatto neinficia il carattere solidaristico. Il Fondo,infatti non può erogare alla singolaazienda prestazioni in misura superioreall’ammontare dei contributi da essa ver-sati nel trimestre precedente a quello incui viene presentata l’istanza.
A seguito delle ripetute richieste di Confitarma, il ministero del Lavoro e delle PoliticheSociali condivide la necessità di modificare la disposizione e chiede quindi alle parti sociali ade-renti al Fondo Solimare di sottoscrivere un accordo sindacale. Il 9 settembre 2016 Confitarma con-clude con Assorimorchiatori, Federimorchiatori, Fedarlinea, Filt-CGIL, Fit-CISL e Uiltrasporti, unaccordo sindacale che propone di sostituire il suddetto criterio con uno nuovo, molto più elasti-co, che preveda limiti alla prestazione ordinaria erogata dal Fondo determinati in proporzione aicontribuiti ordinari versati dal singolo datore di lavoro.
Acquisito il parere favorevole dell’INPS sulla sostenibilità della modifica proposta, si è orain attesa della firma dei due Ministri competenti e del successivo controllo di legittimità da partedella Corte dei Conti prima della definitiva pubblicazione in Gazzetta Ufficiale.
Maritime Labour Convention 2006Confitarma da tempo evidenzia l’esigenza di attuare gli Emendamenti 2014 in materia di “Financialsecurity” alla Maritime Labour Convention 2006, entrati in vigore il 18 gennaio 2017, riconoscen-do le coperture assicurative garantite dai P&I.
Il ministero delle Infrastrutture e dei Trasporti, d’intesa con il ministero dello SviluppoEconomico, avvia un approfondimento in merito alle procedure di riconoscimento degli Istitutiassicurativi che dovranno garantire dette coperture e, in attesa dei risultati, si avvale della pos-sibilità prevista dall’art. XV della Maritime Labour Convention comunicando all’International LabourOrganization (ILO) la decisione di differire al 18 gennaio 2018, l’entrata in vigore di tali norme.
Su richiesta di Confitarma, il Comando Generale del Corpo delle Capitanerie di Porto comu-nica ai Segretariati dei vari MoU e alle principali Coast Guard estere tale differimento, al fine dievitare ogni problema alle navi di bandiera italiana durante le ispezioni di Port State Control(PSC).

37
Formazione COMITATI TECNICO-SCIENTIFICI DEGLI ISTITUTI TECNICI TRASPORTI E LOGISTICA. Confitarma vuole promuovere unamigliore qualità della formazione, fornendo conoscenze e competenze funzionali agli effettivi fab-bisogni delle imprese armatoriali al fine di migliorare le possibilità di occupazione per i giovaniche vogliono intraprendere la carriera marittima.
A tal fine, Confitarma ha chiesto da tempo a tutti gli Istituti Tecnici Trasporti e Logisticacon opzione nautica presenti sul territorio nazionale di poter designare suoi qualificati rappre-sentanti nei Comitati Tecnico-Scientifici (CTS). Ad oggi, sono 14 gli Istituti nautici aderenti allarichiesta.
Sia pure con alterne fortune, dipendenti dal concreto coinvolgimento dei CTS nell’elabora-zione dei programmi formativi da parte degli Istituti, i rappresentanti di Confitarma si adoperanoper migliorare la qualità della didattica fornita dalla scuola e dagli enti formativi, promuovere l’al-ternanza scuola-lavoro e inserire strutturalmente negli istituti docenti provenienti dal mondo del-l’impresa, i quali portano nella scuola la loro esperienza “sul campo”, consentendo agli studentidi arricchire il proprio bagaglio formativo e di competenze.
Allo scopo di inserire nel percorso scolastico temi riguardanti la tutela dell’ambiente mari-no, Confitarma sta anche valutando la possibilità di collaborazione con Associazioni quale Marevivo.
CORSI DI FORMAZIONE PER UFFICIALI CHE SVOLGONO FUNZIONI DIRETTIVE. Alla fine del 2013, per chiudere unaprocedura di infrazione da parte della Commissione Europea, con un decreto del Comando Generaledel Corpo delle Capitanerie di Porto, venne introdotto nel nostro ordinamento l’obbligo per coman-danti, direttori di macchina e primi ufficiali di svolgere il relativo corso direttivo (300 ore per ilpersonale di coperta e 570 per quello di macchina).
Nella seconda parte del 2016 la delicata questione torna alla ribalta, dopo che il ministe-ro delle Infrastrutture e dei Trasporti chiarisce che l’effettuazione di tale corso è necessaria, aifini del rinnovo del certificato di competenza, anche per gli Ufficiali di livello direttivo già in pos-sesso dell’abilitazione, fino a quel momento esclusi da tale obbligo.
Sensibilizzato da Confitarma circa le difficoltà che avrebbe generato a livello operativo

38
l’applicazione immediata di tale obbligo, il Ministero stabilisce per i marittimi il cui certificato dicompetenza scada nel 2016 e 2017 una moratoria che permetta l’effettuazione di tali corsi finoal 31 dicembre 2018.
Inoltre, viene aperto un tavolo di confronto a livello ministeriale per approfondire la que-stione e alleggerire quanto più possibile l’impatto di tale obbligo. Ne deriva la disponibilità delministero delle Infrastrutture e dei Trasporti a rimodulare i programmi e le ore di formazioneattualmente previsti per i corsi, tenendo conto di professionalità e competenze dei comandanti,direttori di macchina e primi ufficiali già abilitati e ipotizzando anche la possibilità di svolgerequesti corsi attraverso modalità innovative (per esempio e-learning).
Il 1° febbraio 2017 Confitarma e Fedarlinea sottoscrivono, con Filt-CGIL, Fit-CISL eUiltrasporti (e successivamente anche con USCLAC-UNCDIM e UGL), una Proposta comune, artico-lata in tre punti, sostanzialmente accolta dall’Amministrazione marittima, la quale – modificandola propria posizione originaria – ha in sintesi previsto che:– gli Ufficiali che hanno conseguito il certificato di competenza (CoC) di livello direttivo primadel 1° febbraio 2002 sono esentati dall’obbligo di svolgere il corso direttivo e il relativo esame; – gli Ufficiali di livello direttivo che hanno già conseguito l’abilitazione ma che non sono esen-tati dall’obbligo di svolgere il corso direttivo sulla base del punto 1 sopra indicato, possono soste-nere direttamente l’esame per dimostrare l’effettivo possesso di tali competenze. Il superamentodell’esame esenterà tali ufficiali direttivi dall’obbligo di frequentare il corso; – coloro che sono già in possesso dell’abilitazione di Ufficiale di livello direttivo, ma che non sonoesentati in base ai due punti precedenti, possono effettuare i corsi direttivi attraverso il sistemae-learning, con una forte riduzione delle ore da svolgere in aula.
ISTITUTI TECNICI SUPERIORI (ITS). Anche nel 2016 si tengono i corsi degli Istituti tecnici superiori (ITS)per la formazione degli Allievi ufficiali e per la loro preparazione agli esami di abilitazione adiventare futuri Ufficiali della marina mercantile. I programmi didattici e formativi sono svilup-pati in stretta collaborazione con le principali compagnie di navigazione associate a Confitarma,mediante l’inserimento di docenti appartenenti ai loro servizi tecnici, l’alternanza scuola-lavoro eattraverso il sostegno finanziario del Fondo Nazionale Marittimi.
FONDAZIONE ACCADEMIA ITALIANA DELLA MARINA MERCANTILE DI GENOVA. Nel 2016, all’Accademia Italiana dellaMarina Mercantile di Genova, nella sezione di coperta, dalle selezioni dei 761 candidati, entranoin Accademia 92 nuovi allievi; nella sezione macchina, dei 259 partecipanti ne vengono selezio-nati 71. In totale si registra un incremento di 26 allievi rispetto al 2015, provenienti soprattut-to da Sicilia e Liguria. In totale, gli allievi ufficiali entrati in Accademia dal 2005 sono 1.381 (824di coperta e 557 di macchina).

39
Anche nel 2016 la Fondazione Accademia effettua un corso di allineamento per i diploma-ti che non provengono né da istituti nautici, né da istituti professionali ad indirizzo marittimo,selezionando così 20 allievi che si aggiungono ai 140 dei cinque anni precedenti. Inoltre, vieneeffettuato un corso per “Tecnico superiore della logistica” al quale partecipano 25 allievi.
Gran parte degli allievi dell’Accademia vengono imbarcati su navi di imprese armatorialiassociate a Confitarma.
ISTITUTO TECNICO SUPERIORE PER LA MOBILITÀ SOSTENIBILE FONDAZIONE “GIOVANNI CABOTO”. Costituito nel luglio2010 per la formazione del personale navigante di navi petroliere, gasiere, chimichiere, portarin-fuse e da carico generale sia di figure professionali che possano operare nel settore della logisti-ca, l’Istituto Tecnico Superiore per la mobilità sostenibile Fondazione “Giovanni Caboto” di Gaetacon il bando 2016 porta a sedici i corsi, che coinvolgono in totale 216 allievi ufficiali, di cui 114di coperta e 102 di macchina.
Nel 2016, si diplomano 22 allievi ufficiali di coperta e 19 allievi ufficiali di macchina.Alcuni di questi allievi, riuscendo a conseguire anticipatamente il titolo di Ufficiale di navigazio-ne, vengono imbarcati come terzi ufficiali, ma la maggior parte, a causa dell’introduzione dellanuova normativa e del notevole ritardo nella pubblicazione dei bandi, è in attesa di sostenere gliesami per il titolo professionale, avendo comunque ricevuto dalle compagnie di navigazione l’im-pegno all’assunzione.
FONDAZIONE ACCADEMIA NAUTICA DELL’ADRIATICO. Costituita nel settembre 2015, la Fondazione AccademiaNautica dell’Adriatico di Trieste opera come Istituto Tecnico Superiore, nell’ambito della mobilitàsostenibile. Dopo aver avviato nel 2015 il corso per la formazione di 10 allievi ufficiali di coper-ta e 10 allievi ufficiali di macchina destinati a navi da carico ed unità ro-ro, nel 2016 si ripete ilcorso per gli allievi ufficiali e si avvia quello per tecnico superiore per l’infomobilità e le infra-strutture logistiche, con 22 allievi. Sono circa 60 gli allievi che frequentano i tre corsi attivi pertecnico superiore. Nel 2018 si diplomeranno i primi 20 fra allievi ufficiali di coperta e macchina.

40
Confitarma dedica costante attenzione alle principali problematiche ambientali e della sicurezzadella navigazione, sia a livello internazionale, seguendo i lavori dell’IMO (International MaritimeOrganization), nell’ambito dei due comitati MSC (Maritime Safety Committee) e MEPC (MaritimeEnvironmental Protection Committee), sia a livello europeo con la partecipazione ai comitati/grup-pi di lavoro dell’ECSA (European Community Shipowners’ Association) e dell’ICS (InternationalChamber of Shipping), sia a livello nazionale, grazie in particolare alla sinergia con il VI Repartodel Comando Generale del Corpo delle Capitanerie di Porto e con altri enti quali l’UnionePetrolifera, esaminando problematiche comuni per delineare possibili scenari futuri.
Acque di zavorraAnche se il ministero dell’Ambiente e della tutela del territorio e del mare ha reso noto che le pro-cedure sono state avviate, l’Italia non ha ancora ratificato la Convenzione Ballast WaterManagement Convention (BWMC), che entrerà in vigore l’8 settembre 2017.
Tale scadenza di certo non sarà modificata dal prossimo MEPC (Maritime EnvironmentalProtection Committee) dell’IMO che si riunirà a luglio 2017, ma sono ancora molte le incertezzesulle decisioni che potranno essere adottate in merito alla data di installazione degli impianti ditrattamento dell’acqua di zavorra.
Per le nuove costruzioni (secondo gli emendamenti MEPC 69) l’installazione dovrà comun-que avvenire già alla consegna.
Per le navi esistenti, secondo gli emendamenti approvati al MEPC 69, l’installazionedovrebbe avvenire al primo rinnovo del certificato IOPP subito dopo l’entrata in vigore dellaBWMC. Ma, nel caso fossero approvati gli emendamenti sostenuti da Intertanko, a seconda dellascadenza del certificato IOPP (tra settembre 2017 e settembre 2019 oppure dopo settembre 2019,l’installazione avverrebbe alla seconda o alla prima scadenza dopo l’entrata in vigore della
La tutela dell’ambiente marino e la sicurezza della navigazione
41
Convenzione. In ogni caso, tali emendamenti potranno essere validi solo dopo l’entrata in vigoredella BWMC. Le unità esistenti, dopo l’8 settembre 2017, dovranno comunque provvedere al “bal-last water exchange” come previsto dalla Convenzione.
La comprensibile titubanza degli armatori riguardo all’affidabilità degli impianti approva-ti dall’IMO, crea una sorta di “congestione” per le tempistiche di reperimento e/o installazione deiprevisti impianti di trattamento. Dato che al momento la BWMC prevede l’installazione degliimpianti trattamento al primo rinnovo del certificato IOPP dopo l’8 settembre, l’industria armato-riale chiede al ministero dell’Ambiente di “disarmonizzare” tale certificato per effettuare la visitadi rinnovo ed avere la certezza di disporre del tempo necessario per ottemperare nel migliore deimodi alla norma. Il 6 aprile 2017, nel corso di un incontro con tutte le parti interessate,Confitarma, valutando positivamente i segnali di apertura al dialogo, consegna un documento chesintetizza la problematica e le relative esigenze degli armatori. Il 15 maggio 2017, i ministeridell’Ambiente e delle Infrastrutture e dei Trasporti diramano una comunicazione che autorizza gliOrganismi Riconosciuti a rilasciare il certificato IOPP, qualora sia richiesto, prima dell’8 settem-bre 2017, limitando però la sua validità ad una data non successiva al 28 settembre 2020 (datache coincide con l’obbligo di installare sistemi di trattamento conformi alle nuove linee guida G8emanate dall’IMO). Tale “disarmonizzazione” consente agli armatori italiani il tempo necessarioper poter rispondere adeguatamente alle nuove norme della BWMC.
Particolare poi lo scenario nord-americano, ove sono di recente approvazione da partedella Guardia Costiera solo alcuni impianti, in virtù di criteri diversi da quelli della BWMC.
EmissioniCon l’attuazione del Regolamento 2015/757 del Parlamento europeo e del Consiglio, concernenteil monitoraggio, la comunicazione e la verifica delle emissioni di anidride carbonica generate dal
42
trasporto marittimo, entrato in vigore il 1° luglio 2015, si completa la prima fase della strategiadella Commissione europea per la riduzione delle emissioni di greenhouse gas prodotti dalle navi.Pertanto, le società di navigazione, dovranno trasmettere ai verificatori i piani di monitoraggioentro il 31 agosto 2017 e dal 1° gennaio 2018 dovranno monitorare su base annua le emissionidi CO2 per ogni nave e tratta, applicando il metodo più appropriato per la determinazione delleemissioni di CO2.
Confitarma nel corso del 2016 collabora con il ministero dell’Ambiente e della tutela delterritorio e del mare fornendo il proprio contributo nel corso delle consultazioni dell’UnioneEuropea sull’implementazione del Regolamento.
Il 14 febbraio 2017, il Parlamento europeo approva la riduzione delle quote di emissionedi gas serra disponibili sul mercato dell’Ue (ETS), per riallineare la politica climatica comunitariaagli obiettivi dell’accordo di Parigi. La maggioranza dei deputati vota per includere il trasportomarittimo nello schema a partire dal 2023, se entro il 2021 non esisterà un sistema analogodell’IMO. In pratica, le emissioni di CO2 rilasciate nei porti dell’Unione e durante le tratte effet-tuate da e verso tali porti devono essere contabilizzate. I deputati europei propongono anche lacreazione di un “fondo per il clima del settore marittimo” per compensare le emissioni del tra-sporto marittimo, migliorare l’efficienza energetica, agevolare gli investimenti in tecnologie inno-vative e ridurre le emissioni di CO2.
ECSA e ICS manifestano contrarietà e delusione per questa decisione del Parlamento euro-peo, ritenendo che in tal modo si attui una irrealistica pressione sull’IMO con misure regionali gra-vemente dannose per un settore globale come lo shipping e pochi benefici per il clima. Inoltre,secondo gli armatori europei, tale decisione rende più difficile il raggiungimento di un accordoglobale efficace e tempestivo in seno all’IMO. Infatti, un regolamento speciale dell’Ue, in un set-tore integrato come quello del trasporto marittimo, mette a rischio i risultati dei negoziati in sedeIMO, dove sinora importanti Paesi terzi come gli USA, la Cina, il Brasile e l’India hanno prestatola loro collaborazione.
CombustibiliDurante la sessione di ottobre 2016, il MEPC 70 dell’IMO, pur prendendo atto dei dati differentiemersi da uno studio indipendente commissionato da BIMCO nonché delle riserve formulate damolti paesi membri, conferma l’entrata in vigore del limite 0,5% per il tenore di zolfo dei com-bustibili in ogni parte del mondo a partire dal 1° gennaio 2020, come previsto dall’Annesso VI(Rivisto) alla Convenzione MARPOL 73/78.
Fino al 1° gennaio 2020, sono quindi sostanzialmente tre i limiti per il massimo tenore dizolfo nei combustibili per uso marittimo: 3,5%, (“limite globale”) in tutti i mari del mondo; 1,5%per le navi da crociera e per le navi passeggeri in servizio di linea tra porti comunitari nelle acqueterritoriali e nelle ZPE; 0,1% nelle aree ECA (Emission Control Area) designate dall’IMO e nei porti

43
comunitari. Con le modifiche introdotte dalla Direttiva comunitaria 2012/33/Ue, che sostanzial-mente allinea i limiti della normativa europea con quelli imposti dall’Annesso VI alla ConvenzioneMARPOL 73/78, dal 1° gennaio 2020 i limiti si ridurranno a due: 0.50% globale e 0,1% nei portie nelle aree ECA.
Anche se per certi aspetti si avrà una semplificazione, sembra che il combustibile contenore 0,5%, le cui caratteristiche sono in via di definizione in sede ISO (non si parla più di resi-duo ma piuttosto di un distillato pesante, con esigenza di grandi impianti di de-sulfurizzazioneche hanno bisogno di molto idrogeno e richiedono l’eliminazione di metalli e asfalteni) avrà uncosto maggiore.
Da tempo si parla anche d’impianti di trattamento dei gas di scarico (scrubber) che con-sentano di ridurre le emissioni nel caso in cui sia utilizzato un combustibile con tenore di zolfoancora alto, ma solo recentemente le imprese armatoriali che strategicamente scelgono tale solu-zione, stanno studiando in modo approfondito le problematiche legate al loro impiego, non ulti-ma quella dei reflui e dei fanghi.
Fumi delle navi a Civitavecchia I fumi emessi da navi crociera e traghetti, visti nel contesto dell’inquinamento delle aree urbanecontigue a molti porti, sono spesso associati e confusi con le emissioni di ossidi di zolfo (SOx) eossidi di azoto (NOx). Di fatto, non esiste alcun legame tra tenore di zolfo del combustibile efumosità allo scarico. Inoltre, il passaggio in navigazione ad un combustibile con tenore di zolfopari allo 0,1% oltre a comportare una serie di difficoltà operative nonché rischi per la stessa sicu-rezza della navigazione, non incide in nessun modo sulla fumosità.
Ciò rende complessa la questione in quanto le emissioni SOx e NOx sono regolamentate daspecifiche norme internazionali (Annesso VI alla Convenzione MARPOL 73/78) e comunitarie,mentre non vi è una disciplina per i fumi delle navi che sono prodotti dal funzionamento deimotori diesel soprattutto nelle fasi di manovra.
A Venezia, nel marzo 2017 è stato rinnovato l’accordo volontario sottoscritto per la primavolta nel 2007, con cui le 41 compagnie di navi da crociera si impegnano ad usare carburanti abasso contenuto di zolfo per entrare nella Stazione Marittima. A Napoli, nel 2015, è stata emes-sa un’apposita ordinanza per imporre l’uso di tale combustibile nell’avvicinamento al porto, ordi-nanza che purtroppo si è rivelata non risolutiva. A Civitavecchia, ove esistono specifiche storichecriticità che da tempo si sta tendando di risolvere, nell’aprile 2017 Confitarma è coinvoltadall’Autorità Marittima al fine di valutare almeno la possibilità di un accordo volontario comequello adottato a Venezia.
Gruppo Permanente Sicurezza della Navigazione del VI Reparto Nel 2016, prosegue la collaborazione di Confitarma con il Comando Generale del Corpo delle

44
Capitanerie di Porto, in particolare con la sistematica e proficua partecipazione ai lavori delGruppo Permanente Sicurezza della Navigazione del VI Reparto, composto oltre che dagli ufficia-li dell’ufficio Sicurezza Navigazione, dai rappresentanti dei tre organismi riconosciuti (RINA, BV,e DNV-GL), di Confitarma e Fedarlinea. Il tavolo tecnico ha lo scopo di supportare l’Amministra-zione marittima nella redazione delle Circolari applicative/esplicative emesse e nell’elaborazionedi risposte a specifiche istanze presentate (deroghe, difficoltà a ottemperare a nuove norme, ecc.)e contribuire alla revisione della normativa esistente.
L’attività in seno a tale Gruppo di lavoro ha prodotto diverse circolari, quali ad esempioquelle sull’uso degli elettrogeneratori containerizzati e su quello dei sistemi di lavaggio dei gasdi scarico dei motori, nonché il regolamento nazionale dell’International Safety Management Code(ISM). Nel 2016, Confitarma avvia anche, in sinergia con il VI Reparto e il MIT, contatti con ilministero dello Sviluppo Economico, al fine di semplificare l’esecuzione delle visite radio all’este-ro: si tratta infatti di un annoso problema che comporta costi e impegni gestionali significativiper l’armamento.
Nel corso dell’anno, Confitarma collabora all’organizzazione di alcuni eventi dell’ATENA(Associazione Italiana di Tecnica Navale) per diffondere la cultura, aggiornare l’informazione tec-nica e dibattere problemi inerenti ogni forma di attività navale e marittima. Particolare successoriscuote il workshop sulla Convenzione Internazionale per il trattamento dell’acqua di zavorra(BWMC) dedicato alle problematiche inerenti l’installazione dei sistemi di trattamento e quelle sulloro utilizzo.
Certificati RadioPer quanto concerne gli accertamenti per il rilascio dei certificati radio, su impulso di Confitarmasi ottiene un importante risultato.
Infatti, a seguito dell’incontro del 10 febbraio 2017 promosso da Confitarma con i rappre-sentanti dei ministeri dello Sviluppo Economico (MISE) e delle Infrastrutture e dei Trasporti (MIT),nonché del VI Reparto del Comando Generale delle Capitanerie di Porto, si giunge alla conclusio-ne che, ferma restando la condivisa necessità di una completa revisione della normativa esisten-te, il MISE nel corso delle visite annuali, da effettuarsi nell’arco di circa tre mesi, valuterà la pos-sibilità di estendere a cinque anni la validità del certificato prevedendo, in casi particolari, la pos-sibile delega ai tre organismi riconosciuti (RINA, BV, e DNV-GL). Viene inoltre prevista la costi-tuzione di un tavolo tecnico per un esame approfondito della questione.
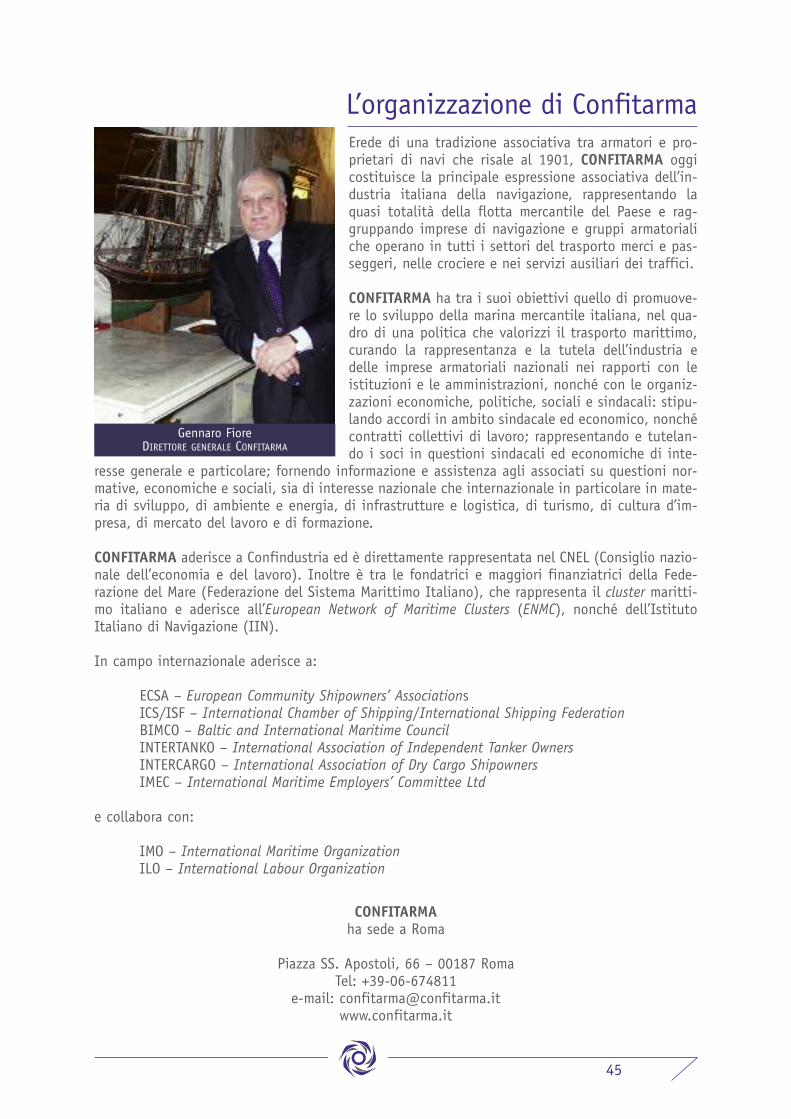
45
L’organizzazione di ConfitarmaErede di una tradizione associativa tra armatori e pro-prietari di navi che risale al 1901, CONFITARMA oggicostituisce la principale espressione associativa dell’in-dustria italiana della navigazione, rappresentando laquasi totalità della flotta mercantile del Paese e rag-gruppando imprese di navigazione e gruppi armatorialiche operano in tutti i settori del trasporto merci e pas-seggeri, nelle crociere e nei servizi ausiliari dei traffici.
CONFITARMA ha tra i suoi obiettivi quello di promuove-re lo sviluppo della marina mercantile italiana, nel qua-dro di una politica che valorizzi il trasporto marittimo,curando la rappresentanza e la tutela dell’industria edelle imprese armatoriali nazionali nei rapporti con leistituzioni e le amministrazioni, nonché con le organiz-zazioni economiche, politiche, sociali e sindacali: stipu-lando accordi in ambito sindacale ed economico, nonchécontratti collettivi di lavoro; rappresentando e tutelan-do i soci in questioni sindacali ed economiche di inte-
resse generale e particolare; fornendo informazione e assistenza agli associati su questioni nor-mative, economiche e sociali, sia di interesse nazionale che internazionale in particolare in mate-ria di sviluppo, di ambiente e energia, di infrastrutture e logistica, di turismo, di cultura d’im-presa, di mercato del lavoro e di formazione.
CONFITARMA aderisce a Confindustria ed è direttamente rappresentata nel CNEL (Consiglio nazio-nale dell’economia e del lavoro). Inoltre è tra le fondatrici e maggiori finanziatrici della Fede-razione del Mare (Federazione del Sistema Marittimo Italiano), che rappresenta il cluster maritti-mo italiano e aderisce all’European Network of Maritime Clusters (ENMC), nonché dell’IstitutoItaliano di Navigazione (IIN).
In campo internazionale aderisce a:
ECSA – European Community Shipowners’ AssociationsICS/ISF – International Chamber of Shipping/International Shipping FederationBIMCO – Baltic and International Maritime Council INTERTANKO – International Association of Independent Tanker OwnersINTERCARGO – International Association of Dry Cargo ShipownersIMEC – International Maritime Employers’ Committee Ltd
e collabora con:
IMO – International Maritime OrganizationILO – International Labour Organization
CONFITARMA ha sede a Roma
Piazza SS. Apostoli, 66 – 00187 RomaTel: +39-06-674811
e-mail: [email protected]
Gennaro Fiore DIRETTORE GENERALE CONFITARMA

46
,

47
PresidentePresident
Vice PresidenteVice President
Comitato EsecutivoExecutive Committee
TesoriereTreasurer
Collegio dei ProbiviriBoard of Arbitrators
Collegio dei RevisoriBoard of Auditors
Direttore generaleDirector General
Consulta del PresidentePresident’s Advisory Board
Francesco BerlingieriAlfonso Magliulo
Alfonso ScannapiecoOscar Raimondi, supplenteFrancesco Serao, supplente
Bernardo Cirillo, presidenteRoberto CocciaCarlo Lomartire
Pia Queirolo, supplente
Marco Novella
Gennaro Fiore
Nicola Coccia, past presidentAngelo D’Amato
Paolo d’Amico, past presidentGiovanni Delle PianeAndrea Garolla di BardBeniamino MalteseRoberto MartinoliLorenzo MatacenaMario MattioliStefano MessinaCarlo Pontecorvo
Giuseppe Mauro Rizzo
Mariella AmorettiClaudio BaccichettiRiccardo BaratozziFederica BarbaroStefano BeduschiLuca BertaniRaffaele BrulloPaolo CagnoniCarlo Cameli
Andrea ClavarinoPaolo Clerici, past president
Nello D’AlesioCesare d’Amico
Gianni Andrea de DomenicoAldo Grimaldi, past president
Alessandra GrimaldiDomenico IevoliEttore MoraceAngela MorfiniBruno MussoFranco Napp
Fabrizio VettosiLuca Vitiello
ConsiglioBoard
Alcide Ezio Rosina
Emanuele Grimaldi
Cariche confederali / Officers

48
FINANZA E DIRITTO D’IMPRESA FINANCE AND BUSINESS LAW
Nicola CocciaPresidente President
Beniamino Maltese, Fabrizio VettosiVicepresidenti Vice Presidents
Mariella Amoretti, Claudio Baccichetti, Federica Barbaro,Riccardo Biale, Manuela Blasi, Lorenzo Lanzi,
Carlo Lomartire, Giuseppe Maffia, Romano Mancini,Alessandro Matteini, Pierino Novelli, Diego Pacella,
Pietro Pasetti, Marco Tassara, Danilo Trabacca, Giulio VerriMarco Quadrani
Segretario Secretary
NAVIGAZIONE A CORTO RAGGIO SHORT SEA NAVIGATION
Roberto MartinoliPresidente President
Alessandra Grimaldi, Lorenzo MatacenaVicepresidenti Vice Presidents
Mariella Amoretti, Daniela Benvenuto, Bruno Castaldo,Gaetano D’Alesio, Antonio Di Falco, Raffaele Di Francia,
Riccardo Giannessi, Guido Grimaldi, Franco Napp, Valeria Novella
Luca SistoSegretario Secretary
NAVIGAZIONE OCEANICA DEEP SEA NAVIGATION
Angelo D’AmatoPresidente President
Cesare d’AmicoVicepresidente Vice President
Federica Barbaro, Stefano Beduschi, Luca Bertani, Marco Bisogno, Carlo Cameli, Bruno Castaldo,
Girolamo Carignani, Ernesto Gori, Gennaro Ievoli, Mario Maresca, Michele Morena, Valeria Novella,
Umberto Petinati, Adele Marina Rizzo, Cosimo Sforza
Luca SistoSegretario Secretary
GESTIONE TECNICA NAVITECHNICAL MANAGEMENT OF VESSELS
Giuseppe Mauro RizzoPresidente President
Umberto D’Amato, Massimo De Domenico Vicepresidenti Vice Presidents
Roberto Boero, Alberto Cafari Panico, Gabriele Calderan,Daniele Coppola, Giovanni Corsi, Andrea De Gregori,
Fernando Esposito, Marco Fasciolo, David Fiorentini, Luigi Genghi,Mario Maresca, Francesco Ottonello, Enzo Romano, Paolo
Satariano, Fabio Tagliavia, Cristiano Vattuone, Silvia ZacchelloFabio Faraone
Segretario Secretary
PORTI E INFRASTRUTTURE PORTS AND INFRASTRUCTURES
Emanuele Grimaldi (ad interim)Presidente PresidentGianpaolo Polichetti
Vicepresidente Vice PresidentGiovanni Balza, Davide Calderan, Antonino Cavallaro,Francesco D’Alesio, Gianni Andrea de Domenico,
Raffaele Di Francia, Calogero Famiani, Roberto Ferrarini,Attilio Ievoli, Diego Moscati, Marco Novella, Francesco Saverio Paturzo, Antonio Pedevilla, Alessandro Russo, Stefania Visco, Luca Vitiello
Giuseppe LombardiSegretario Secretary
RISORSE UMANE E RELAZIONI INDUSTRIALIHUMAN RESOURCES AND INDUSTRIAL RELATIONS
Stefano MessinaPresidente President
Maurizio Campagnoli, Costanza Dell’AbateVicepresidenti Vice Presidents
Carlo Bocchini, Massimo Comelato, Irma Ferrante,Alessandro Ferrari, Andrea Grisoni, Andrea Guietti,
Rodolfo Magosso, Francesca Manzi, Giuseppe Maresca,Roberto Marraccini, Carlo Miccio, Tiziano Minuti,
Franco Napp, Giuseppe Palomba, Valeria Poggi, Luigi Porzio
Leonardo PiliegoSegretario Secretary
Commissioni / Commissions
EDUCATION
Mario MattioliPresidente President
Irma FerranteVicepresidente Vice President
Vincenzo Berardi, Emanuele Bergamini, Alessio Brandi,Stefano Canestri, Renato Causa, Paola Maria Diquattro,Andrea Guietti, Carlo Lomartire, Tiziano Minuti, Valeria Poggi,Gianni Scarso, Serena Scordamaglia, Barbara Visentini
Leonardo PiliegoSegretario Secretary
AMBIENTEENVIRONMENT
Lorenzo MatacenaPresidente President
Commissione in via di definizione
Gruppo di lavoro OPERATIVITÀ NAVECesare d’Amico
Presidente President

49
Il Gruppo Giovani Armatori si è costituito nel 1995in attuazione dello Statuto confederale con i seguen-ti scopi:– promuovere la consapevolezza della funzione eticae sociale della libera iniziativa e delle responsabi-lità imprenditoriali che ne derivano;
– approfondire i temi di maggior respiro strategicoriguardanti l'industria armatoriale ed il sistemamarittimo nel suo complesso;
– contribuire ad un costante adeguamento di Con-fitarma alle nuove esigenze dell'industria armato-riale, correlate alle dinamiche del contesto econo-mico e sociale;
– favorire la formazione di nuove leve per la conduzione delle aziende armatoriali e delle correla-te attività associative.
Sono iscritti al gruppo oltre 60 membri, tra armatori, figli di armatori, dirigenti e colla-boratori direttamente impegnati nelle realtà imprenditoriali rappresentate da Confitarma e prove-nienti da circa 50 imprese associate.
I Giovani Armatori sono coinvolti in modo attivo nella vita della Confederazione: il presi-dente è membro di diritto del Consiglio e del Comitato esecutivo di Confitarma; i membri delConsiglio direttivo presenziano alle Commissioni consultive, dedicate all'approfondimento delleproblematiche del comparto armatoriale e del sistema marittimo.
I Giovani Armatori partecipano inoltre assiduamente ai gruppi di lavoro dell’ECSA.Nel mese di maggio i giovani armatori organizzano insieme alla multinazionale Ardent e a
Banchero Costa un seminario intitolato: “Maritime salvage – Operational and contractual aspects,media management”, evento aperto a tutti gli associati e articolato su diverse sessioni, affidatead esperti internazionali, aventi per oggetto temi specifici del salvataggio marittimo: gestionedelle operazioni di salvataggio (anche attraverso l’esame di alcuni case study), aspetti contrat-tuali, rapporti con i media nella gestione delle emergenze marit-time (anche attraverso lo svolgimento di alcune simulazioni).
A fine giugno, in occasione della Neaples Shipping Wee,il GGA organizza un convegno, in collaborazione con le altre rap-presentanze giovanili del cluster marittimo nel corso del quale,dopo le testimonianze di importanti esponenti del mondo arma-toriale italiano sui momenti iniziali della loro carriera e sull’im-portanza delle nuove generazioni all’interno di un’azienda, i gio-vani ribadiscono la loro volontà di crescere insieme e fare “rete”.
A dicembre, in occasione dell’Assemblea di fine anno iGiovani armatori, in collaborazione con il Gruppo Giovani diFederagenti e Youngship Italia, organizzano un seminario aven-te per tema l’attuale contesto macro-economico mondiale(Brexit, elezioni americane, Brics e nuove economie emergenti)e l’analisi dei mercati marittimi (noli, materie prime, cantieristi-ca) al partecipano come relatori Beniamino Quintieri, presiden-te SACE, Sissi Bellomo, giornalista de Il Sole 24 Ore ed EnricoPaglia, Bancosta Research.
I Giovani Armatori seguono altresì l’attività formativa,tramite testimonianze e docenze presso alcuni enti di formazio-ne, quali l’Istituto per ricerche ed attività educative (IPE),dando la possibilità ad alcuni studenti universitari delle facoltàdi ingegneria ed economia di maturare brevi esperienze pressole proprie aziende.
Giovani Armatori
Andrea Garolla di Bard PRESIDENTE GGA
CONSIGLIO DIRETTIVOGRUPPO GIOVANI ARMATORIManagement Council
of Young Shipowners Group
Andrea Garolla di BardPresidente President
Francesca Romana Barbaro e Giacomo Gavarone
Vice Presidenti Vice Presidents
Valeria NovellaPast President
Alberto BancheroSalvatore d’Amico
Giovanni Battista De Carlini Costanza Dell’AbateGiovanni Masucci Lorenzo Matacena Andrea Poliseno
Francesco BeltranoSegretario Secretary

Grafici e tabelleGraphs and tables

53
La navigazione mercantile italiana nel 2016The Italian merchant marine in 2016
Flotta mercantile italiana Italian merchant fleet
Evoluzione della flotta mercantile italiana Italian merchant fleet evolution
Fonte/Source: Confitarma
Fonte/Source: Confitarma
Navi di oltre 100 gt Ships of 100 gt and over N. 000 gt N. 000 gt N. gt
31.12.2016 31.12.2015 Var. 2016/2015
NAVI DA CARICO LIQUIDO LIQUID CARGO SHIPSPetroliere Oil tankersGasiere Gas tankersChimichiere (OIL-CHEM) Chemical tankersAltre cisterne Other tankersNAVI DA CARICO SECCO DRY CARGO SHIPS Carico generale General cargoPortacontenitori Container shipsPortarinfuse Bulk carriersTraghetti Ro-Ro cargoNAVI MISTE E DA PASSEGGERI MIXED AND PASSENGER SHIPSCrociera CruiseAliscafi, Catamarani e unità veloci High speed vesselsTraghetti FerriesAltre navi trasporto passeggeri Other passengers shipsPORTARINFUSE POLIVALENTI OBO CARRIERS
NAVI PER SERVIZI AUSILIARI AUXILIARY SERVICES SHIPSRimorchiatori e navi appoggio Tugboats and supply vesselsAltri tipi di navi OthersTOTALE TOTAL
2549323106321853015687243626752001351
5983642341.474
4.2582.3614111.45433
6.8261546283.0133.0304.7342.11723
2.5464833
698252446
16.549
2599426108311933416737043225711971391
5913562351.476
4.3482.3864301.50131
7.0432016543.2032.9854.4791.99222
2.4174833
690245445
16.592
-1,9%-1,1%-11,5%-1,9%3,2%-4,1%-11,8%-6,3%-6,8%2,9%0,9%4,0%5,6%1,5%-2,9%0,0%
1,2%2,2%-0,4%-0,1%
-2,1%-1,1%-4,4%-3,2%5,1%-3,1%-23,6%-3,9%-5,9%1,5%5,7%6,3%2,5%5,4%0,0%-1,2%
1,2%3,0%0,3%-0,3%
Alla fine del 2016, la flotta mercantile di proprietà ita-
liana rimane sostanzialmente stabile rispetto alla fine
del 2015, con 1.474 navi per un totale di 16.548.662
gt (tonnellate di stazza lorda), così ripartite:
– oltre le 1.000 gt: 691 navi, equivalenti a 16.286.235 gt
– da 100 a 999 gt: 783 navi, equivalenti a 262.427 gt
Il 92,5% del tonnellaggio di proprietà italiana, pari a
circa 15,3 milioni gt, sono iscritte nel Registro inter-
nazionale italiano, mentre il 6,6% (1 milione gt) sono
iscritte nel Registro ordinario e una piccola parte del
tonnellaggio di proprietà italiana batte temporanea-
mente bandiera estera (bareboat charter registration).
A ciò si aggiunge la crescente flotta di bandiera este-
ra controllata da interessi armatoriali italiani, frutto
per lo più di un processo di espansione che ha porta-
to all’acquisizione di importanti società di navigazio-
ne estere nel corso degli ultimi anni.199819992000 20012002 2003 20042005 2006200720082009 2010201120122013 2014 2015 20160
2.000
4.000
6.000
8.000
10.000
12.000
14.000
16.000
18.000
20.000
000 gt
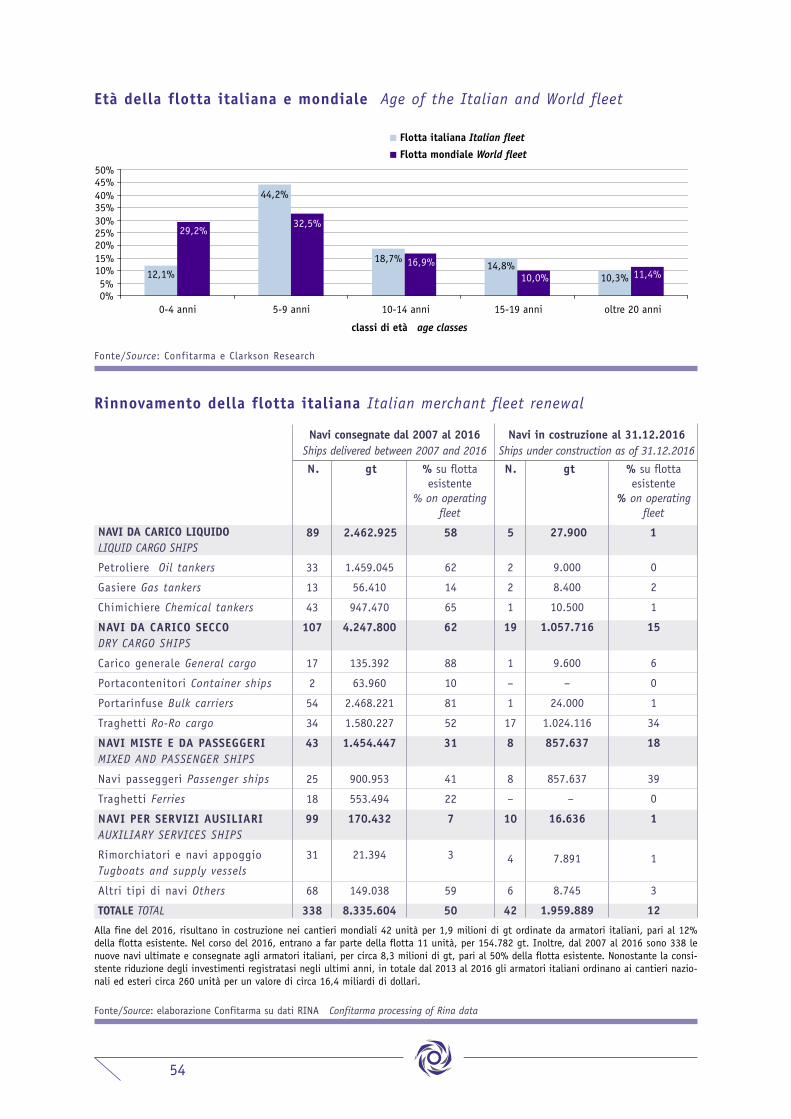
54
Età della flotta italiana e mondiale Age of the Italian and World fleet
12,1%
44,2%
18,7%14,8%
10,3%
29,2%32,5%
16,9%10,0% 11,4%
0%5%
10%15%20%25%30%35%40%45%50%
0-4 anni 5-9 anni 10-14 anni 15-19 anni oltre 20 anni
classi di età age classes
Flotta italiana Italian fleet
Flotta mondiale World fleet
Fonte/Source: Confitarma e Clarkson Research
Rinnovamento della flotta italiana Italian merchant fleet renewal
NAVI DA CARICO LIQUIDOLIQUID CARGO SHIPS
Petroliere Oil tankers
Gasiere Gas tankers
Chimichiere Chemical tankers
NAVI DA CARICO SECCODRY CARGO SHIPS
Carico generale General cargo
Portacontenitori Container ships
Portarinfuse Bulk carriers
Traghetti Ro-Ro cargo
NAVI MISTE E DA PASSEGGERIMIXED AND PASSENGER SHIPS
Navi passeggeri Passenger ships
Traghetti Ferries
NAVI PER SERVIZI AUSILIARIAUXILIARY SERVICES SHIPS
Rimorchiatori e navi appoggioTugboats and supply vessels
Altri tipi di navi Others
TOTALE TOTAL
N. gt % su flotta esistente
% on operatingfleet
N.
89 2.462.925 58 5
33
13
43
107
17
2
54
34
43
25
18
99
31
68
338
1.459.045
56.410
947.470
4.247.800
135.392
63.960
2.468.221
1.580.227
1.454.447
900.953
553.494
170.432
21.394
149.038
8.335.604
62
14
65
62
88
10
81
52
31
41
22
7
3
59
50
2
2
1
19
1
–
1
17
8
8
–
10
4
6
42
Navi consegnate dal 2007 al 2016Ships delivered between 2007 and 2016
Navi in costruzione al 31.12.2016 Ships under construction as of 31.12.2016
Fonte/Source: elaborazione Confitarma su dati RINA Confitarma processing of Rina data
gt
27.900 1
9.000
8.400
10.500
1.057.716
9.600
–
24.000
1.024.116
857.637
857.637
–
16.636
7.891
8.745
1.959.889
0
2
1
15
6
0
1
34
18
39
0
1
1
3
12
% su flotta esistente
% on operatingfleet
Alla fine del 2016, risultano in costruzione nei cantieri mondiali 42 unità per 1,9 milioni di gt ordinate da armatori italiani, pari al 12%della flotta esistente. Nel corso del 2016, entrano a far parte della flotta 11 unità, per 154.782 gt. Inoltre, dal 2007 al 2016 sono 338 lenuove navi ultimate e consegnate agli armatori italiani, per circa 8,3 milioni di gt, pari al 50% della flotta esistente. Nonostante la consi-stente riduzione degli investimenti registratasi negli ultimi anni, in totale dal 2013 al 2016 gli armatori italiani ordinano ai cantieri nazio-nali ed esteri circa 260 unità per un valore di circa 16,4 miliardi di dollari.

Attacchi nel mondoAttacks in the world
– Golfo di Aden, Mar Rosso, SomaliaGulf of Aden, Red Sea, Somalia
– Africa occidentaleWest Africa
Attacchi a navi italiane Attacks against Italian ships
55
2005
276
45
25
3
239
20
31
1
263
44
53
1
293
111
59
4
406
211
47
11
445
219
39
8
439
237
52
8
297
75
62
5
264
15
51
4
245
11
41
7
246
0
14
0
191
2
54
0
Pirateria Piracy 2006 2007 2008 2009 2010 2011 2012 2013 2014 2015 2016
Fonte/Source: IMB – International Maritime Bureau
Secondo il rapporto annuale dell’International Maritime Bureau (IMB), nel 2016 si registrano 191 attacchi di pirateria o rapine nei mari delmondo rispetto ai 246 del 2015 (150 navi abbordate, 12 incendiate, 7 sequestrate e 22 attacchi sventati). 151 marittimi vengono cattura-ti e 62 rapiti per richiedere il riscatto. Le acque intorno alla Malesia e all’Indonesia risultano particolarmente a rischio ed anche nel Golfodi Guinea, specie in Nigeria, si registra un notevole incremento degli attacchi (36 incidenti nel 2016 rispetto ai 15 del 2015) anche a 100miglia nautiche dalla costa. Nel Golfo di Aden risultano 2 attacchi nel corso dell’anno, l’ultimo dei quali in ottobre a 300 miglia dalla costa.Registrati 11 attacchi in Perù (nessuno nel 2015) mentre si dimezzano quelli in Vietnam e Bangladesh.
Totale navi mercantili dirottate da MRCC* Total merchant vessels diverted by MRCCdi cui/of which:mercantili di bandiera italian/Italian merchant vesselsTotale navi mercantili coinvolte in soccorso/Total Merchant vessels involved in rescue operations
Totale migranti salvati/Total people saved
Totale migranti salvati da unità mercantili/Total people saved by merchant vessels
di cui/of which: da navi mercantili di bandiera italiana/Italian merchant vessels
Unità soccorse Vessels saved
*Maritime Rescue Co-ordination Centre-Rome
381
90121
178.415
13.8888%
n. a.
119
1.755
365516
497.296
57.20911,5%
12.181
507
20162015Interventi SAR delle navi mercantili Sar operation by merchant vessels
492
105141
152.343
16.15811%
5.054
138
882
170254
166.538
41.05125%
8.347
250
2014
Fonte/Source: Comando Generale del Corpo delle Capitanerie di Porto – Guardia Costiera
Totale
Migranti dal mare Migrant at sea
Nonostante si registri una netta diminuzione degli interventi nelle operazioni di soccorso di migranti, il numero delle navi mercantili coin-volto rimane ancora alto. Nel maggio 2016 si registra un picco, con 80 navi mercantili dirottate di cui 31 coinvolte direttamente nel soc-corso di migranti per un numero pari al 22,59% del totale delle persone salvate nello stesso mese. Di fatto, dalle statistiche mensili dellaMRCC-Roma e tenendo conto delle variazioni legate alle condizioni metereologiche, nel primo trimestre 2016, le navi dirottate sono 25 equelle coinvolte nel soccorso 2, mentre nel quarto trimestre dell’anno i totali passano rispettivamente a 52 e 21. Più di una nave al giornoè stata dirottata e una ogni tre giorni è stata coinvolta in operazioni di soccorso di persone in mare.

56
16%3% 9%
19%
-6%
4%
-8%
7% 0%
-7%0
4.000
8.000
12.000
2008 2009 2010 2011 2012 2013 2014 2015 2016 2017 est
Movimento crocieristi nei porti italiani Passengers movement in Italian ports
Mare Sea
Treno Rail
Strada Road
Aereo Air
Altri Others
TOTALE TOTAL
import
%Mln. tonn. Mln. tonn. Mln. tonn.export
%total
%175,410
15,612
73,776
0,306
41,021
306,125
57,3
5,1
24,1
0,1
13,4
100
69,416
3,669
72,058
1,321
0,294
146,758
47,3
2,5
49,1
0,9
0,2
100
244,827
19,281
145,834
1,627
41,314
452,883
54,1
4,3
32,2
0,3
9,1
100
Commercio estero dell’Italia nel 2016 per modalità di trasporto Italian foreign trade by mode of transport on 2016
Fonte/Source: elaborazione Confitarma su dati ISTAT Confitarma processing of ISTAT data
Rispetto al 2015 si rileva un incremento del commercio estero italiano pari al 2,3%. Il 54% di merci importate ed esportate dall’Italia uti-lizza il trasporto via mare, a fronte del 32% che impiega la modalità stradale. Il 43% del commercio estero italiano interessa i paesidell’Unione europea. Di questo il 13% utilizza la via marittima (10% per le importazioni e 17% per le esportazioni).
Fonte/Source: elaborazione Confitarma su varie fonti Confitarma processing various sources
Treno Rail4,3% Mare
Sea54,1%
Altri Others 9,1%
Strada Road32,2%
AereoAir
0,4%
Servizi di trasporto ro-ro per la Sicilia Ro-Ro services to Sicily
CivitavecchiaCivitavecchiaGenovaGenova-LivornoGenova-SalernoLivornoNapoliNapoliPalermoRavenna-BrindisiSalernoSalernoSalernoTOTALE TOTAL
PalermoTermini ImeresePalermoCataniaPalermoPalermoCataniaPalermoCagliariCataniaCataniaMessinaPalermo
136,5353714131262
66,5
3.60010.80023.40020.52033.30022.68027.72050.4004.05019.98069.12023.2207.560
316.350118.200
OrigineOrigin
DestinazioneDestination
Round trip settimanali Weekly round trip
M. l. settimanaliWeekly linear meters
Fonte/Source: Confitarma. Dati ad aprile 2017
Dato al 1999

57
OrigineOrigin
DestinazioneDestination
CivitavecchiaCivitavecchiaCivitavecchiaGenovaGenovaLivornoLivornoLivorno-GenovaMarina di CarraraNapoliPalermoPiombinoSalernoSavonaTOTALE TOTAL
OlbiaCagliari (Arbatax)Porto TorresPorto TorresOlbiaOlbiaCagliariCagliariCagliariCagliariCagliariOlbiaCagliariPorto Torres
147673197132173383
Round trip settimanali Weekly round trip
M. l. settimanaliWeekly linear meters
Servizi di trasporto ro-ro per la Sardegna Ro-Ro services to Sardinia
50.40025.20032.40025.20010.80068.40022.6804.50014.5808.1004.05025.20020.52010.800322.830117.800
Fonte/Source: Confitarma. Dati ad aprile 2017
6 (1)4573
14 (4)11
6 (5)1,52,5121726132311,581,5
Servizi di trasporto ro-ro internazionali Ro-Ro international services
(Venezia)-AnconaAnconaAnconaBariBariBrindisiCivitavecchiaCivitavecchiaCivitavecchia-Porto TorresGenovaGenovaGenovaGenova-LivornoGenova-LivornoLivornoLivorno-SavonaLivorno-SavonaSalernoSalernoSalerno-PalermoSavonaSavonaSeteTOTALE TOTAL
Igoumenitsa-PatrassoSpalatoDurazzoDurazzoPatrassoIgoumenitsa-(Patrasso)Palermo-TunisiTunisiBarcellonaBarcellona-TangeriTunisiMaltaCatania-MaltaCatania-BarBastiaBarcellonaBarcellona-ValenciaCatania-MaltaCagliari-ValenciaTunisiBastiaBarcellona-TangeriNador (o Barcellona)-Tangeri
32.4005.04022.50025.20018.90085.6803.6003.78032.4005.4009.0006.84013.6806.84025.2007.56041.0406.84020.5207.56010.8003.9605.400
400.14030.000
DestinazioneDestination
Round trip settimanali Weekly round trip
M. l. settimanaliWeekly linear meters
Fonte/Source: Confitarma. Dati ad aprile 2017
OrigineOrigin
Dato al 1999
Dato al 1999

58
La navigazione internazionale e i traffici marittimiInternational navigation and maritime traffic
PIL, commercio mondiale e commercio marittimoGDP, world trade and maritime trade
Mln. dwt
Mln. gt
200
400
600
800
1.000
1.200
1.400
1.600
1.800
2007 2008 2009 2010 2011 2012 2013 2014 2015 2016
Evoluzione della flotta mondiale World merchant fleet evolution
Fonte/Source: elaborazione Confitarma su dati IHS Fairplay Confitarma processing of IHS Fairplay data
Traffico marittimo mondiale World seaborne trade
Fonte/Source: IMF, WTO, Clarkson Research
Var.
% rispe
tto all’a
nno prec
eden
teVar.%
com
pared with previous year
Fonte/Source: Clarkson Research
5,4 4,2
3,5 3,4 3,5 3,4 3,1
13,2
5,5
2,3 2,8 2,7 2,61,3
9,3
4,5 4,2 3,4 3,3
2,1 2,6
0
2
4
6
8
10
12
14
2010 2011 2012 2013 2014 2015 2016
PIL GDP Commercio World trade Commercio marittimo Maritime trade
%
Nel 2016, aumenta del 2,6%il commercio marittimomondiale con un totale divolumi trasportati pari a11.101 milioni di tonnellate.La domanda di servizi di tra-sporto marittimo, cioè lequantità di merci trasportateper le distanze percorse, nel2016 registra un aumentodel 3% per un totale di54.936 miliardi di tonnella-te-miglia.
Alla fine del 2016 la flottamondiale registra un ulterio-re aumento del 3,1%, conpiù di 1.248 milioni di ton-nellate di stazza lorda (gt) e1.772 milioni di tonnellatedi portata (dwt).
0
2.000
4.000
6.000
8.000
10.000
12.000
2001 2002 2003 2004 2005 2006 2007 2008 2009 2010 2011 2012 2013 2014 2015 2016
Milioni di tonnellate Million tonnes
0
10.000
20.000
30.000
40.000
50.000
60.000
Miliardi tonnellate miglia Billion tonnes-miles

59
Flotta mondiale: tonnellaggio da carico controllato dai principali Paesi marittimiWorld fleet: cargo tonnage controlled by main maritime countries 31 dicembre 2016 December 31st, 2016Navi di 1.000 gt e oltre Ships of 1.000 gt and above
123456789101112131415161718192021222324252627282930
Grecia/GreeceGiappone/JapanCina/ChinaGermania/GermanyUSARegno Unito/UKCorea del Sud/Korea Rep. ofSingaporeNorvegia/NorwayHong KongDanimarca/DenmarkTaiwanSvizzera/SwitzerlandITALIA/ItalyTurchia/TurkeyCanadaRussiaMonacoIndiaBelgio/BelgiumEmirati Arabi Uniti/UAEsMalesia/MalaysiaIndonesiaPaesi Bassi/NetherlandsFrancia/FranceIranArabia Saudita/Saudi ArabiaSvezia/SwedenBrasile/Brazil QatarAltri/Others
N.% GTN. GTPaesi/Countries
Fonte/Source: elaborazione Confitarma su dati IHS Fairplay Confitarma processing of IHS Fairplay data
TOTALE TOTAL
3.8124.0803.9842.8412.4821.5691.3991.4992.0681.0158868104247401.1824471.6282756312865945411.3501.09645520027130619194
5.364
8.860
51.380
GT DWT % DWT
Tonnellaggio di ignoto controllo armatorialeTonnage controlled by unknown shipowners
176.296.840157.888.979117.075.08374.176.97065.597.49259.948.46846.222.09537.772.88337.214.09434.666.84928.723.33028.662.67218.762.71017.165.16115.441.43314.889.44514.628.13613.339.22613.082.82312.354.85812.223.52811.223.03711.168.83010.879.19710.388.5349.287.4588.912.6386.707.1035.937.2905.718.10264.410.843
87.157.423
1.227.923.530
14,412,99,56,05,34,93,83,13,02,82,32,31,51,41,31,21,21,11,11,01,00,90,90,90,80,80,70,50,50,55,2
7,1
100
3.7503.9343.4542.7611.3171.2621.3011.1701.3159587677694076421.1583711.1212724161933632661.2438302041731372838462
3.957
7.393
42.333
175.739.490155.585.385113.619.86973.905.55857.944.75657.045.28045.923.22636.077.59131.213.14534.372.35627.792.45128.571.60218.020.95316.314.23115.239.00814.082.92412.644.39113.163.77312.286.59811.569.92011.608.6119.278.70610.785.3088.672.1979.281.8059.020.0678.659.9846.303.1593.500.2875.641.64259.511.350
82.691.437
1.176.067.060
301.928.699234.290.893179.296.25498.807.35171.854.50884.669.45872.344.09255.870.12638.313.64451.866.60534.567.19544.300.06920.786.18020.270.25823.974.88421.703.34019.533.90522.740.18521.303.88619.491.44114.375.73413.506.81815.351.39811.997.99510.145.72816.042.31115.536.1776.314.1326.385.4155.050.85485.887.253
123.752.158
1.762.258.946
17,113,310,25,64,14,84,13,22,22,92,02,51,21,21,41,21,11,31,21,10,80,80,90,70,60,90,90,40,40,34,9
7,0
100
Nella graduatoria delle flotte per controllo armatoriale, la Grecia, con 176 milioni di gt è in prima posizione, seguita da Giappone, Cina,Germania e Stati Uniti. L’Italia passa dal 13° al 14° posto ma mantiene la quinta posizione tra i paesi dell’Unione europea per controlloarmatoriale.
Totali/Totals Navi da carico/Cargo carrying ships

60
Flotta mondiale: navi iscritte nei principali registri World fleet: ships on main registers31 dicembre 2016 December 31st, 2016Navi di 100 gt e oltre Ships of 100 gt and above
Fonte/Source: elaborazione Confitarma su dati IHS Fairplay Confitarma processing of IHS Fairplay data
PanamaLiberiaIsole Marshall/Marshall IslandsHong KongSingaporeMaltaBahamasCina/ChinaGrecia/GreeceGiappone/JapanCipro/CyprusNorvegia/NorwayITALIA/ItalyDanimarca/DenmarkIsola di Man/Isle of ManIndonesiaRegno Unito/UKPortogallo/PortugalUSACorea del Sud/Korea Rep. ofBermudaIndiaGermania/GermanyRussiaAntigua e BarbudaMalesia/MalaysiaPaesi Bassi/NetherlandsFrancia/FranceTurchia/TurkeyBelgio/BelgiumAltri/Others
TOTALE TOTAL
123456789101112131415161718192021222324252627282930
N.% GTN. GTBandiera/Flag
8.1033.2253.1632.4853.3802.1801.3744.9461.3285.3501.0081.9831.5941.0443888.0221.4506546.3942.9301531.6386643.6739181.6221.3579131.497228
40.224
113.888
GT DWT % DWT
220.827.125138.735.562132.877.581107.076.11282.435.02367.315.29759.182.13945.416.72240.868.97124.579.00021.724.65217.387.17416.133.55515.912.72215.514.11214.948.69914.757.64212.163.92611.474.03411.083.04310.862.98710.635.7019.618.8638.887.0147.480.8037.406.6267.024.3936.334.2365.793.6994.993.80099.131.973
1.248.583.186
17,6911,1110,648,586,605,394,743,643,271,971,741,391,291,271,241,201,180,970,920,890,870,850,770,710,600,590,560,510,460,407,94
100
6.5793.0842.8712.4092.2712.0091.1362.6171.0273.2948029528064903333.3554344075101.2581436043201.51788651878721796875
15.121
57.800
215.822.462135.651.865127.604.304106.789.76280.033.40666.324.97253.443.17442.284.89940.784.55123.677.11420.990.32914.633.83415.453.37415.258.80814.878.65312.943.26413.660.85612.045.2878.324.87210.402.27910.420.2819.657.6489.341.3986.157.5617.429.8365.524.7696.174.3795.737.7885.615.8104.758.83380.955.869
1.182.782.237
332.045.478214.118.911208.095.346172.255.449120.787.37399.824.85567.733.11866.371.09571.721.95434.633.59933.304.34818.568.37815.237.74517.312.69524.547.57917.947.93014.225.39815.585.60310.052.81315.132.3488.784.63016.564.34310.122.5827.882.9289.633.1517.154.2696.488.2797.169.6398.099.0767.741.806
112.943.788
1.772.086.506
18,7412,0811,749,726,825,633,823,754,051,951,881,050,860,981,391,010,800,880,570,850,500,930,570,440,540,400,370,400,460,446,37
100
Con quasi 221 milioni di gt, Panama detiene sempre la prima posizione come paese di registrazione delle navi, seguita da Liberia, IsoleMarshall, Hong Kong, Singapore, Malta, Bahamas e Cina. Quest’ultima, con 45,4 milioni di gt, è la più grande flotta battente bandiera nazio-nale. L’Italia è 13a nella graduatoria mondiale delle principali flotte e, considerando il genuine link tra bandiera nazionale e nazionalità del-l’armatore, risulta 5a tra le flotte mondiali, 3a tra quelle dei paesi membri del G20 e 2a tra quelle dell’Unione europea.
Totali/Totals Navi da carico/Cargo carrying ships

61
Ripartizione delle commesse ai cantieri Break-down of shipyards ordersDicembre 2016 December 2016
Fonte/Source: IHS Fairplay
Ordini ai cantieri mondiali World orderbookDicembre 2016 December 2016
Fonte/Source: IHS Fairplay
0
10.000
20.000
30.000
40.000
50.000
60.000
000 GT
05001.0001.5002.0002.5003.0003.5004.000
Nazionalità armatore Paese di registrazione Paese di costruzione Nationality of owner Country of registration Country of build
N. naviN. vesselsGT CGT N. navi
Alla fine del 2016, secondo le statistiche IHS Fairplay, nel car-net degli ordini mondiali di nuove costruzioni risultano 4.851navi per 152 milioni di tonnellate di stazza lorda (e 84,8milioni di stazza lorda compensata), di cui 3.050 unità dacarico pari a 144,2 milioni di gt (74,3 milioni cgt e 199,1milioni dwt).Il 56% delle navi (pari a 85,5 milioni di gt) sarà completatoentro il 2017, il 30% (45,8 milioni di gt ) nel 2018 e il 14%(20,6 milioni di gt) nel 2019.Nonostante la contrazione degli ordini, i cantieri cinesi man-tengono la leadership nella costruzione di nuove navi con il38% dell’orderbook mondiale in termini di gt, mentre la Coreadel Sud e il Giappone detengono rispettivamente il 26% ed il24% degli ordini. I cantieri dell'Unione Europea detengono il5% dell'orderbook mondialeCon 30 navi per 2,086 milioni di gt, l’Italia è sesta nella gra-duatoria mondiale dei principali paesi costruttori seconda trai paesi dell’Unione europea dopo la Germania. Nella costruzione di navi da crociera, i cantieri italiani conordini per 20 unità e 2,03 mln di gt precedono quelli tedeschiche hanno ordini per 13 unità e 1,9 mln gt.La Cina è il principale costruttore di navi portarinfuse (317unità per 25,1 milioni dwt), da carico generale (94 unità per1,4mln dwt), portacontenitori (249 per 15,5 mln dwt), ro-rocargo (5 per 173mila gt) e passenger/ro-ro cargo ship (25 unitàper 395mila gt). La Corea del Sud è prima nella costruzione dicrude oil tanker (138 unità per 24,4 mln dwt), oil productstanker (22 unità per 1,5 mln dwt), gasiere LNG (74 unità per6 mln dwt) e LPG (51 unità per 1,8 mln dwt). Il Giappone hail primato nella costruzione di chemical tanker (45 unità per0,9 mln dwt) e chemical/oil product tankers (112 per 3,5 mnldi dwt). Delle 13 ro-ro cargo ship in costruzione nel mondo perun totale di 273mila gt, il Giappone ne costruirà 5 (52milagt), la Corea del Sud 2 (120mila gt) e l’Italia 2 (43mila gt),mentre per le passenger/ro-ro cargo ship, la Cina ne costruirà12 per 169mila gt ed il Giappone 14 per 103mila gt.
Vietnam 1%
BrasileBrazil1% Altri
Others2%
Corea del SudKorea Rep. of
26%
FilippinePhilippines
3%
GiapponeJapan24%
UeEu6%
Taiwan1%
CinaChina38%

62
Flotta mondiale, principali tipi di navi da carico World Fleet by cargo carrying shiptype
Flotta/Exhisting fleet
Order BookDismissioni e perdite/Ship disposals and lossessNavi ultimate/CompletionsNavi ordinate/Order reportedFlotta/Exhisting fleet
Order BookDismissioni e perdite/Ship disposals and lossessNavi ultimate/CompletionsNavi ordinate/Order reportedFlotta/Exhisting fleet
Order BookDismissioni e perdite/Ship disposals and lossessNavi ultimate/CompletionsNavi ordinate/Order reportedFlotta/Exhisting fleet
Order BookDismissioni e perdite/Ship disposals and lossessNavi ultimate/CompletionsNavi ordinate/Order reportedFlotta/Exhisting fleet
Order BookDismissioni e perdite/Ship disposals and lossessNavi ultimate/CompletionsNavi ordinate/Order reportedFlotta/Exhisting fleetOrder BookDismissioni e perdite/Ship disposals and lossessNavi ultimate/CompletionsNavi ordinate/Order reported
DWTN. GT
PetroliereOil tanker
ChimichiereChemical
GasiereGas carrier
PortarinfuseBulk carrier
PortacontainerContainer
Ro-ro cargo
Fonte/Source: elaborazione Confitarma su dati IHS Fairplay Confitarma processing of IHS Fairplay data
7.749
648821293105.102
531212092161.790
3652111498
9.782
1.3793776163395.169
494872122562.751146278981
243,3
44,91,56,323,162,1
10,71934,64,361,2
22,51,485,25,5
402,4
63,21526,313,4215,5
40,12,217,322,748,85,90,62,13
449,3
83,72,411,843,1100,0
17,40,37,67,054,5
18,60,15,04,6
735,6
114,927,647,423,9244,8
42,82,518,824,119,61,90,30,90,9
DWTN. GT
7.941
5213421588
5.301
4111321070
1.893
2451521021
9.970
72839054336
5.082
42818213075
2.770125365320
255,4
33,11,114,13,966
7,20,330,667,1
16,41,0114,30,8
413,5
37,715,725,35,1
216,4
33,87,39,32,648,84,91,41,70,5
471,6
61,41,926,37,2
106,4
11,60,56,91,059,9
13,00,36,80,7
755,3
69,229,346,410,1245,2
35,88,510,23,019,61,60,60,50,2
2015 2016
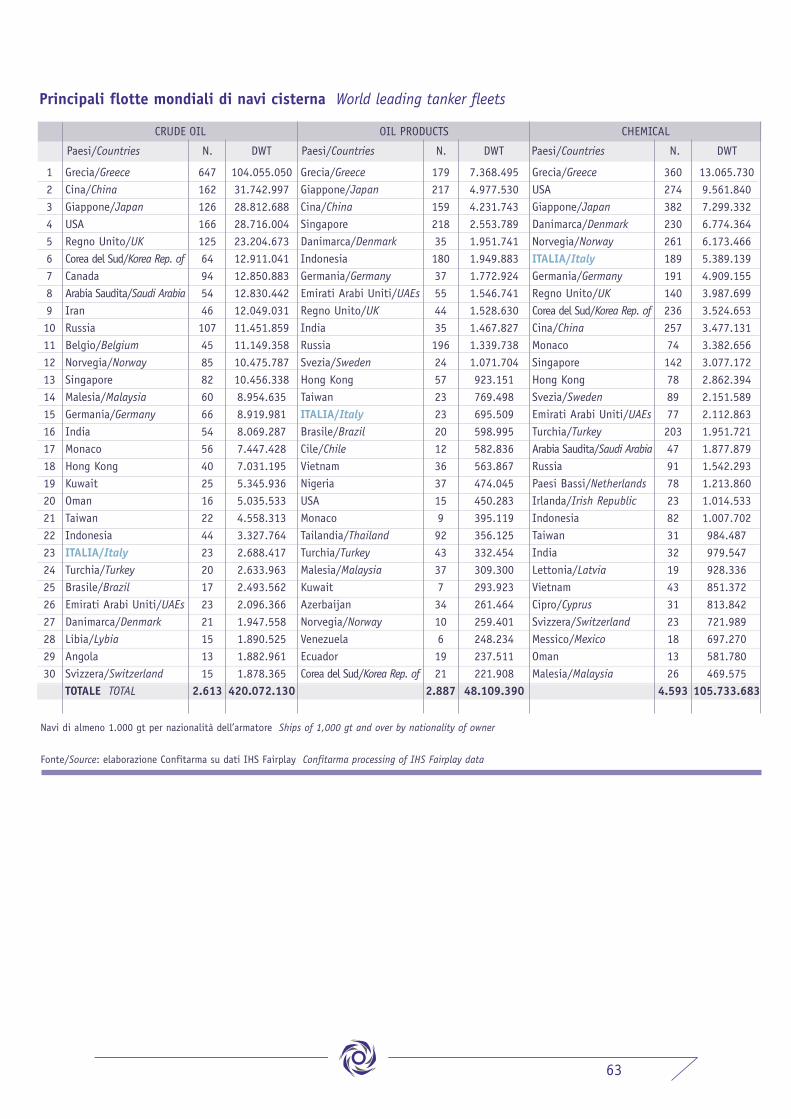
63
Principali flotte mondiali di navi cisterna World leading tanker fleets
123456789101112131415161718192021222324252627282930
Grecia/GreeceCina/ChinaGiappone/JapanUSARegno Unito/UKCorea del Sud/Korea Rep. ofCanadaArabia Saudita/Saudi ArabiaIranRussiaBelgio/BelgiumNorvegia/NorwaySingaporeMalesia/MalaysiaGermania/GermanyIndiaMonacoHong KongKuwaitOmanTaiwanIndonesiaITALIA/ItalyTurchia/TurkeyBrasile/BrazilEmirati Arabi Uniti/UAEsDanimarca/DenmarkLibia/LybiaAngolaSvizzera/SwitzerlandTOTALE TOTAL
104.055.05031.742.99728.812.68828.716.00423.204.67312.911.04112.850.88312.830.44212.049.03111.451.85911.149.35810.475.78710.456.3388.954.6358.919.9818.069.2877.447.4287.031.1955.345.9365.035.5334.558.3133.327.7642.688.4172.633.9632.493.5622.096.3661.947.5581.890.5251.882.9611.878.365
420.072.130
647162126166125649454461074585826066545640251622442320172321151315
2.613
DWTN.Paesi/Countries
Grecia/GreeceGiappone/JapanCina/ChinaSingaporeDanimarca/DenmarkIndonesiaGermania/GermanyEmirati Arabi Uniti/UAEsRegno Unito/UKIndiaRussiaSvezia/SwedenHong KongTaiwanITALIA/ItalyBrasile/BrazilCile/ChileVietnamNigeriaUSAMonacoTailandia/ThailandTurchia/TurkeyMalesia/MalaysiaKuwaitAzerbaijanNorvegia/NorwayVenezuelaEcuadorCorea del Sud/Korea Rep. of
Paesi/Countries
Navi di almeno 1.000 gt per nazionalità dell’armatore Ships of 1,000 gt and over by nationality of owner
Fonte/Source: elaborazione Confitarma su dati IHS Fairplay Confitarma processing of IHS Fairplay data
7.368.4954.977.5304.231.7432.553.7891.951.7411.949.8831.772.9241.546.7411.528.6301.467.8271.339.7381.071.704923.151769.498695.509598.995582.836563.867474.045450.283395.119356.125332.454309.300293.923261.464259.401248.234237.511221.908
48.109.390
179217159218351803755443519624572323201236371599243377341061921
2.887
DWTN.
Grecia/GreeceUSAGiappone/JapanDanimarca/DenmarkNorvegia/NorwayITALIA/ItalyGermania/GermanyRegno Unito/UKCorea del Sud/Korea Rep. ofCina/ChinaMonacoSingaporeHong KongSvezia/SwedenEmirati Arabi Uniti/UAEsTurchia/TurkeyArabia Saudita/Saudi ArabiaRussiaPaesi Bassi/NetherlandsIrlanda/Irish RepublicIndonesiaTaiwanIndiaLettonia/LatviaVietnamCipro/CyprusSvizzera/SwitzerlandMessico/MexicoOmanMalesia/Malaysia
Paesi/Countries
13.065.7309.561.8407.299.3326.774.3646.173.4665.389.1394.909.1553.987.6993.524.6533.477.1313.382.6563.077.1722.862.3942.151.5892.112.8631.951.7211.877.8791.542.2931.213.8601.014.5331.007.702984.487979.547928.336851.372813.842721.989697.270581.780469.575
105.733.683
360274382230261189191140236257741427889772034791782382313219433123181326
4.593
DWTN.
CRUDE OIL OIL PRODUCTS CHEMICAL
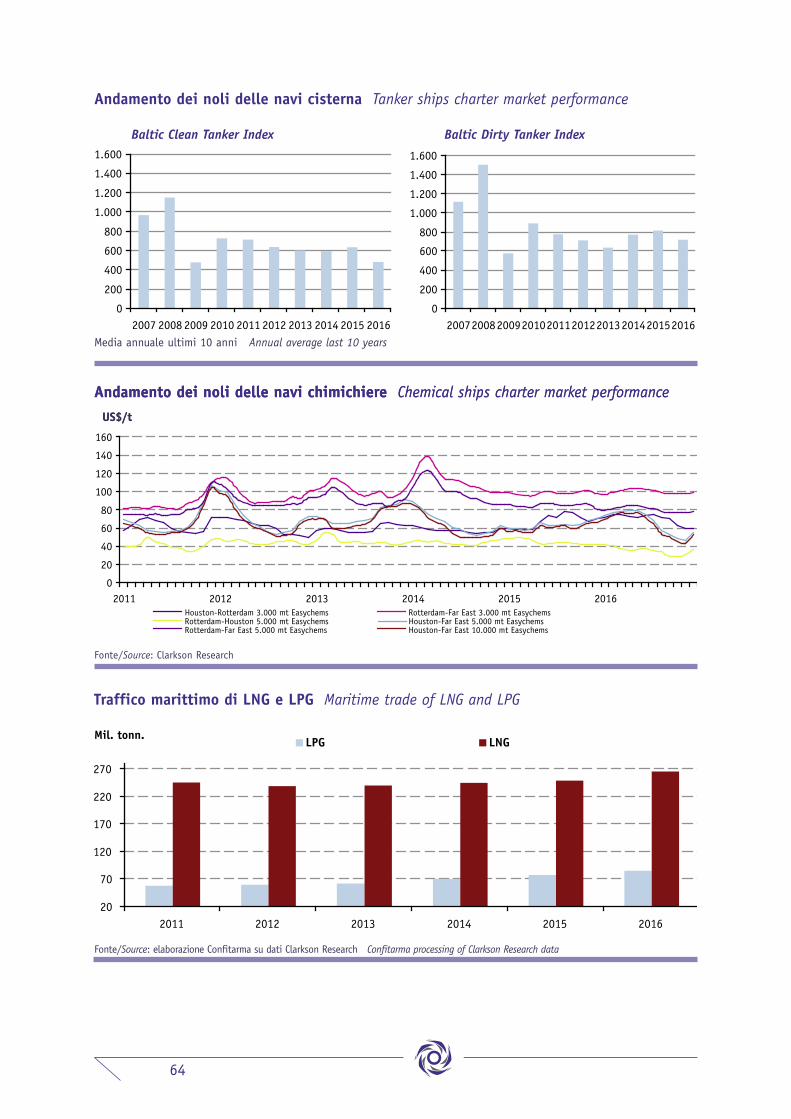
64
Andamento dei noli delle navi cisterna Tanker ships charter market performance
Media annuale ultimi 10 anni Annual average last 10 years
Andamento dei noli delle navi chimichiere Chemical ships charter market performance
Fonte/Source: Clarkson Research
US$/t
Baltic Clean Tanker Index Baltic Dirty Tanker Index
Andamento dei noli delle navi chimichiere Chemical ships charter market performanceUS$/t
Houston-Rotterdam 3.000 mt Easychems Rotterdam-Far East 3.000 mt EasychemsRotterdam-Houston 5.000 mt Easychems Houston-Far East 5.000 mt EasychemsRotterdam-Far East 5.000 mt Easychems Houston-Far East 10.000 mt Easychems
0
20
40
60
80
100
120
140
160
2011 2012 2013 2014 2015 2016
Traffico marittimo di LNG e LPG Maritime trade of LNG and LPG
Fonte/Source: elaborazione Confitarma su dati Clarkson Research Confitarma processing of Clarkson Research data
0
200
400
600
800
1.000
1.200
1.400
1.600
2007 2008 2009 2010 2011 2012 2013 2014 2015 20160
200
400
600
800
1.000
1.200
1.400
1.600
2007200820092010201120122013201420152016
20
70
120
170
220
270
2011 2012 2013 2014 2015 2016
LPG LNGMil. tonn.

65
Months Timecharter Rates, $000/Month
Andamento dei noli delle navi LPG LPG ships charter market performance
400
600
800
1.000
1.200
1.400
1.600
1.800
2.000
2.200
2012 2013 2014 2015 2016
35K CBM LPG 12 Month Timecharter Rate
Ethylene 8,250 CBM LPG 12 Month Timecharter Rate
Modern 59K CBM LPG 12 Month Timecharter Rate
Fonte/Source: Clarkson Research
Months Timecharter Rates, $000/Month
Andamento dei noli delle navi LNG LNG ships charter market performance
400
20.400
40.400
60.400
80.400
100.400
120.400
140.400
2012 2013 2014 2015 2016
LNG 160K CBM Spot Rate
LNG 145K CBM Spot Rate
Fonte/Source: Clarkson Research
Baltic dry index
0
1.000
2.000
3.000
4.000
5.000
6.000
7.000
2008 2009 2010 2011 2012 2013 2014 2015 2016
Media annuale ultimi 10 anni / Annual average last 10 years

66
Principali flotte mondiali di navi portarinfuse World leading bulk carrier fleets
123456789101112131415161718192021222324252627282930
Giappone/JapanGrecia/GreeceCina/ChinaCorea del Sud/Korea Rep. ofRegno Unito/UKHong KongTaiwanSingaporeUSAGermania/GermanyTurchia/TurkeyMonacoIndiaITALIA/ItalyNorvegia/NorwayBelgio/BelgiumCanadaIndonesiaSvizzera/SwitzerlandCipro/CyprusBrasile/BrazilDanimarca/DenmarkPaesi Bassi/NetherlandsTailandia/ThailandVietnamIranPolonia/PolandEmirati Arabi Uniti/UAEsCroazia/CroatiaOman
TOTALE TOTAL
148.816.381148.767.54099.084.39241.609.03734.609.33328.773.36325.149.55524.653.25822.944.83022.241.86713.264.82510.335.4199.040.0178.074.9206.352.6285.742.4493.691.3903.622.0893.358.7893.023.4163.001.9312.967.5122.922.8642.825.7432.282.4432.169.0701.962.1501.870.8861.634.5671.601.744
735.615.120
1.6431.7831.374334328439324256291307243109117109108538068804521725257110364937324
9.771
DWTN.Paesi/Countries
Navi di almeno 1.000 gt per nazionalità dell’armatore Ships of 1.000 gt and over by nationality of owner
Fonte/Source: elaborazione Confitarma su dati IHS Fairplay Confitarma processing of IHS Fairplay data

67
Principali flotte mondiali di navi portacontenitori World leading container fleets
Navi di almeno 1.000 gt per nazionalità dell’armatore Ships of 1,000 gt and over by nationality of owner
Fonte/Source: elaborazione Confitarma su dati IHS Fairplay Confitarma processing of IHS Fairplay data
123456789101112131415161718192021222324252627282930
Germania/GermanyCina/ChinaGrecia/GreeceDanimarca/DenmarkGiappone/JapanSvizzera/SwitzerlandTaiwanSingaporeHong KongFrancia/FranceRegno Unito/UKCorea del Sud/Korea Rep. ofEmirati Arabi Uniti/UAEsUSAIndonesiaTurchia/TurkeyCile/ChileCipro/CyprusIsraele/IsraelNorvegia/NorwayIranBelgio/BelgiumPaesi Bassi/NetherlandsTailandia/ThailandIsole Marshall/Marshall IslandsLussemburgo/LuxembourgMonacoVietnamSpagna/SpainRussiaTOTALE TOTAL
44.041.18225.409.97917.997.12417.652.91815.612.62111.871.29210.164.7319.854.1939.003.0696.966.8316.708.6186.526.6765.484.3843.277.5591.542.1751.507.1711.318.3471.281.7571.220.7341.133.112990.578801.079596.084524.572474.749414.976314.532288.383253.770228.792
215.450.469
51.371.86528.130.00520.426.62019.771.59316.904.05413.421.24011.115.53911.267.74810.044.2337.594.5587.810.3557.494.9345.767.9833.594.5931.996.7641.870.9371.459.9791.580.6061.437.6921.386.1571.198.157995.763736.105682.527614.280521.685393.854380.804272.330297.351
244.783.314
1.188458354262283181226255155821671838687178761963224226235041178737521
5.123
GT DWTN.Paesi/Countries
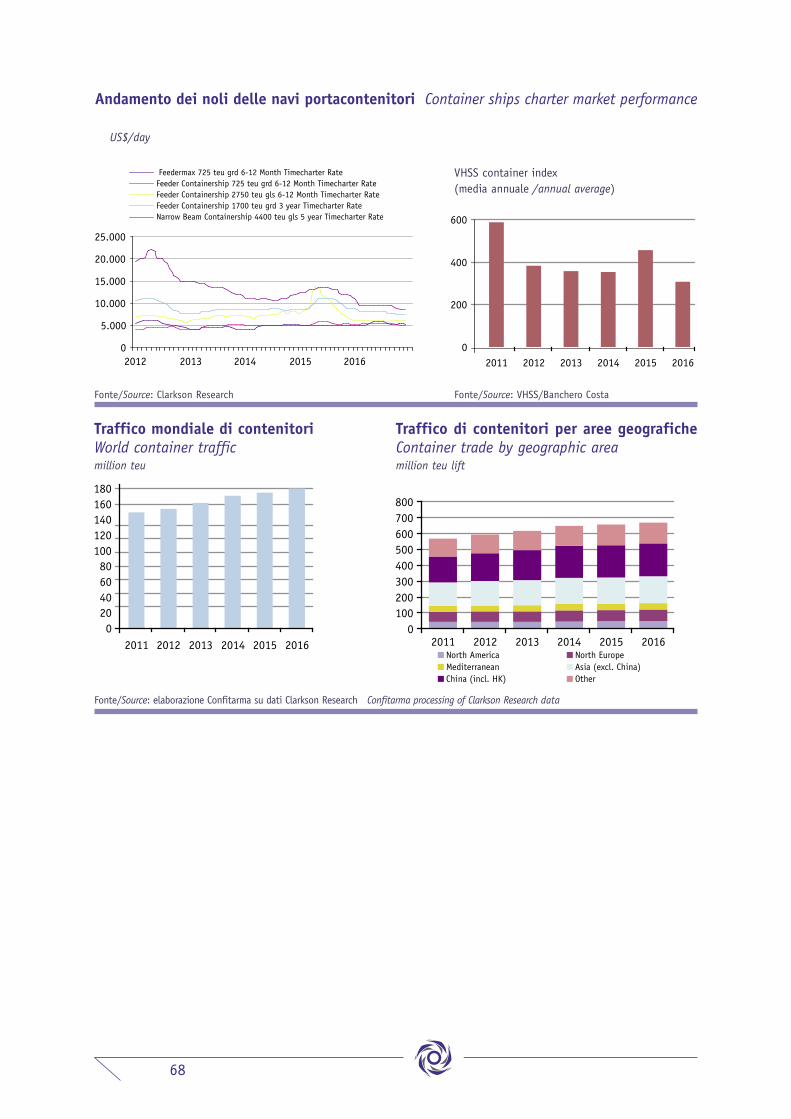
68
020406080
100120140160180
2011 2012 2013 2014 2015 2016 0
100200300400500600700800
2011 2012 2013 2014 2015 2016North America North EuropeMediterranean Asia (excl. China)China (incl. HK) Other
US$/day
Andamento dei noli delle navi portacontenitori Container ships charter market performance
0
5.000
10.000
15.000
20.000
25.000
2012 2013 2014 2015 2016
Feedermax 725 teu grd 6-12 Month Timecharter Rate Feeder Containership 725 teu grd 6-12 Month Timecharter Rate Feeder Containership 2750 teu gls 6-12 Month Timecharter Rate Feeder Containership 1700 teu grd 3 year Timecharter Rate Narrow Beam Containership 4400 teu gls 5 year Timecharter Rate
0
200
400
600
2011 2012 2013 2014 2015 2016
Fonte/Source: Clarkson Research Fonte/Source: VHSS/Banchero Costa
Traffico mondiale di contenitori World container traffic
Traffico di contenitori per aree geograficheContainer trade by geographic area
Fonte/Source: elaborazione Confitarma su dati Clarkson Research Confitarma processing of Clarkson Research data
million teu million teu lift
VHSS container index (media annuale /annual average)

69
Principali flotte mondiali di navi traghetto World leading ro-ro fleets
1234567891011121314151617181920
ITALIA/ItalyGiappone/JapanRegno Unito/UKCina/ChinaSvezia/SwedenFinlandia/FinlandMaltaPanamaGrecia/GreeceNorvegia/NorwayDanimarca/Denmark Francia/FranceTurchia/TurkeyIndonesiaUSACipro/Cyprus
CanadaPaesi Bassi/Netherlands
Spagna/SpainBahamasAltri/OthersTOTALE TOTAL
2.436.026926.371871.8151.287.390793.325562.397137.248498.646975.851676.383487.946698.653167.832562.676294.636568.442510.162294.243482.179470.3613.957.82417.190.045
62771810183337866415103535116111766
317820
2.715.500591.998608.28766.524364.835567.397931.232560.10137.104268.560423.537137.368617.341190.167376.30094.31186.352299.14948.54747.947
2.715.95411.748.511
261338127132757951142183306875811128711845111355030
1.2353.837
5.151.5261.518.3691.480.1021.353.9141.158.1601.129.7941.068.4801.058.7471.012.955944.943911.483836.021785.173752.843670.936662.753596.514593.392530.726518.3086.673.77828.938.556
Passenger ro-ro cargo
Ro-ro cargo Totale Total
GTN.GTN.N. GTPaesi/Countries
Fonte/Source: elaborazione Confitarma su dati Clarkson Research / Confitarma processing Clarkson Research data
19926110912257461456177302724876252107391001844249183.017
Evoluzione della flotta crocieristica mondiale World cruise fleet evolution
0
200
400
600
2000 2001 2002 2003 2004 2005 2006 2007 2008 2009 2010 2011 2012 2013 2014 2015 201605.00010.00015.00020.00025.000N. vessels 000 gt
Fonte/Source: elaborazione Confitarma su dati IHS Fairplay / Confitarma processing of IHS Fairplay data

70
La navigazione europea e la politica marittima dell’UnioneEuropean shipping and Union maritime policy
Flotta dell’Unione europea (inclusa Norvegia) European Union fleet (incl. Norway)31 dicembre 2016 December 31st, 2016
123456789101112131415161718192021222324252627
MaltaGrecia/GreeceCipro/CyprusITALIA/ItalyDanimarca/DenmarkRegno Unito/UKPortogallo/PortugalGermania/GermanyPaesi Bassi/NetherlandsFrancia/FranceBelgio/BelgiumSpagna/SpainSvezia/SwedenLussemburgo/LuxembourgFinlandia/FinlandCroazia/CroatiaEstoniaLituania/LithuaniaIrlanda/Irish RepublicLettonia/LatviaBulgariaPolonia/PolandRomaniaSloveniaAustriaRegistro di Gibilterra/Gibraltar Reg.Norvegia/NorwayTOTALE TOTAL% sul totale mondiale% on world total
Grecia/GreeceGermania/GermanyRegno Unito/UKDanimarca/DenmarkITALIA/ItalyBelgio/BelgiumPaesi Bassi/NetherlandsFrancia/FranceSvezia/SwedenCipro/CyprusSpagna/SpainFinlandia/FinlandCroazia/CroatiaPolonia/PolandIrlanda/Irish RepublicEstoniaMaltaBulgariaLussemburgo/LuxembourgLettonia/LatviaPortogallo/PortugalRomaniaSloveniaLituania/LithuaniaAustriaRegistro di Gibilterra/Gibraltar Reg.Norvegia/NorwayTOTALE TOTAL
67.315.29740.868.97121.724.65216.133.55515.912.72214.757.64212.163.9269.618.8637.024.3936.334.2364.993.8002.718.8932.269.9081.935.8361.734.6301.342.098388.852325.405254.749181.737131.83591.98672.9051.785
02.519.73617.387.174248.205.586
20
99.824.85571.721.95433.304.34815.237.74517.312.69514.225.39815.585.60310.122.5826.488.2797.169.6397.741.8061.888.0891.031.1671.564.6621.141.8782.139.68966.447160.610279.89065.546110.13837.96829.802
00
2.807.89518.568.378328.627.063
19
DWT Paesi/CountriesN. GTPaesi/Countries
Fonte/Source: elaborazione Confitarma su dati IHS-Fairplay Confitarma processing of IHS Fairplay data
2.1801.3281.0081.5941.0441.4506546641.3579132281.13438516428536910186248119761607250
2651.98317.872
16
176.296.84074.176.97059.948.46828.723.33017.165.16112.354.85810.879.19710.388.5346.707.1035.202.9013.016.6182.293.9751.647.1281.598.6841.150.187854.815803.804797.574763.297682.978570.636446.586217.409138.14942.348
037.214.094454.081.644
37
301.928.69998.807.35184.669.45834.567.19520.270.25819.491.44111.997.99510.145.7286.314.1327.355.2302.903.5482.041.8402.704.9352.247.2631.589.498349.2911.232.5191.203.837872.4891.049.426875.285591.595329.165118.30663.326
038.313.644652.033.454
37
DWTN. GT
3.8122.8411.56988674028610964553062663021168390939059516357484273980
2.06815.473
30
Bandiera/FlagNavi/Ships > 100 gt
Nazionalità/NationalityNavi/Ships > 1.000 gt

71
54
57
54
57
29 29
0
20
40
60
80
100
120
140
160
Direct Indirect Induced Total
640 640
980 980
477 477
0
500
1.000
1.500
2.000
2.500
Direct Indirect Induced Total
Impatto dell’occupazione dell’industria europea della navigazione, 2015Total employment impact of the Eu shipping industry, 2015
Impatto del valore aggiunto dell’industria europea della navigazione, 2015Total GVA impact of the Eu shipping industry, 2015
Fonte/Source: Oxford Economics
2,1 mln. jobs
€. 140 mld/bn

72
Commercio dell’Unione europea per modo di trasporto Eu trade by mode of transportGennaio-Dicembre 2016 January-December 2016
* I porti italiani sono al secondo posto in Europa per importazioni, dopo i Paesi Bassi.Fonte/Source: Eurostat 2016
Importazioni dell’Unione europea per modo di trasporto Eu imports by mode of transport
Austria
Belgio/Belgium
Bulgaria
Cipro/Cyprus
Croazia/Croatia
Danimarca/Denmark
Estonia
Finlandia/Finland
Francia/France
Germania/Germany
Grecia/Greece
Irlanda/Ireland
ITALIA/Italy*Lettonia/Latvia
Lituania/Lithuania
Lussemburgo/Luxembourg
Malta
Paesi Bassi/Netherlands
Polonia/Poland
Portogallo/Portugal
Regno Unito/UK
Romania
Slovenia
Spagna/Spain
Svezia/Sweden
Rep. Ceca/Czech Rep.
Rep. Slovacca/Slovakia
Ungheria/Hungary
TOTALE TOTAL
tonn.4.757.078
68.697.330
11.348.573
2.205.131
5.079.553
18.733.725
1.316.224
22.583.076
129.057.995
123.207.887
37.334.682
14.751.227
157.904.384
973.309
12.512.874
99.635
829.062
245.369.052
26.499.897
29.283.347
126.949.921
15.780.416
4.626.907
151.096.286
29.474.609
26.292
766.013
667.005
1.241.931.490
TrenoRail
MareSea
TotaleTotal
tonn.25.426.764
85.008.493
16.984.839
2.209.331
8.620.779
22.192.475
3.677.020
35.513.946
140.306.108
238.702.161
40.823.387
14.860.177
199.446.420
5.538.988
20.103.762
166.111
830.973
281.952.494
70.179.914
29.439.933
158.527.512
25.164.302
7.049.435
166.523.438
39.365.298
17.923.875
18.271.638
15.998.262
1.690.807.835
%19
81
67
100
59
84
36
64
92
52
91
99
79
18
62
60
100
87
38
99
80
63
66
91
75
0
4
4
73
tonn.1.493.414
51.136
397.500
0
64.431
8.189
972.596
7.744.410
74.772
1.496.186
37.793
43
670.233
2.849.797
5.560.312
5.826
0
3.218.239
20.155.210
44.779
21
3.904.035
546.811
11.183
2.690.944
8.650.494
8.409.053
3.212.828
72.270.235
%6
0
2
0
1
0
26
22
0
1
0
0
0
51
28
4
0
1
29
0
0
16
8
0
7
48
46
20
4
StradaRoad
tonn.2.521.953
3.502.821
2.320.487
66
2.963.582
755.576
1.030.795
3.110.065
6.183.560
11.436.398
1.020.883
52.022
3.441.804
710.484
1.363.833
40.487
0
6.272.831
5.093.465
77.034
493.465
2.880.164
1.488.627
837.809
6.390.746
2.225.431
689.698
1.849.806
68.753.892
%10
4
14
0
34
3
28
9
4
5
3
0
2
13
7
24
0
2
7
0
0
11
21
1
16
12
4
12
4
AereoAir
tonn.49.363
167.161
6.438
3.960
2.532
40.177
4.802
20.689
350.512
907.622
12.783
47.123
219.396
3.034
3.740
19.689
1.898
1.044.397
68.145
33.405
794.367
25.129
5.177
227.947
71.639
14.944
44.602
47.406
4.238.077
%0
0
0
0
0
0
0
0
0
0
0
0
0
0
0
12
0
0
0
0
1
0
0
0
0
0
0
0
0
IdrovieInland
Waterways
tonn.2.394.249
1.813.784
825.626
0
493.710
0
0
264.703
261.214
292.563
6.289
0
9
0
0
0
0
5.203.039
106
0
0
1.522.817
0
20
1
89
16.920
712.653
13.807.792
%9
2
5
0
6
0
0
1
0
0
0
0
0
0
0
0
0
2
0
0
0
6
0
0
0
0
0
4
1
AltriOthers
tonn.14.210.707
10.776.261
2.086.215
174
16.971
2.654.808
352.603
1.791.003
4.378.055
101.361.505
2.410.957
9.762
37.210.594
1.002.364
663.003
474
13
20.844.936
18.363.091
1.368
30.289.738
1.051.741
381.913
14.350.193
737.359
7.006.625
8.345.352
9.508.564
289.806.349
%56
13
12
0
0
12
10
5
3
42
6
0
19
18
3
0
0
7
26
0
19
4
5
9
2
39
46
59
17
Mare/SeaTreno/RailStrada/RoadAria/AirIdrovie/Inland waterwaysAltri/Others
TOTALE TOTAL
tonn.1.241.931.490
72.270.23568.753.8924.238.07713.807.792289.806.349
1.690.807.835
%73440117100
tonn.540.531.65717.516.44083.828.28015.433.3016.216.7345.080.751
668.607.163
%81313211100
tonn.1.782.463.147
89.786.675152.582.17219.671.37820.024.526294.887.100
2.359.414.998
%76461112100
TotaleTotal
EsportazioniExport
ImportazioniImport
Fonte/Source: Eurostat 2016
Secondo i dati Eurostat, nel2016 il commercio esterodell’Ue è pari a oltre 2,359miliardi di tonnellate, di cuiil 76% (1,782 Mld tonn) uti-lizza la via marittima.Ai primi posti nell’interscam-bio europeo via mare sono iPaesi Bassi (324,5 mil tonn),la Spagna (219,7 mil tonn) el’Italia (207,4 mil tonn).Inoltre, il 40% degli scambiintracomunitari avvengonovia mare.
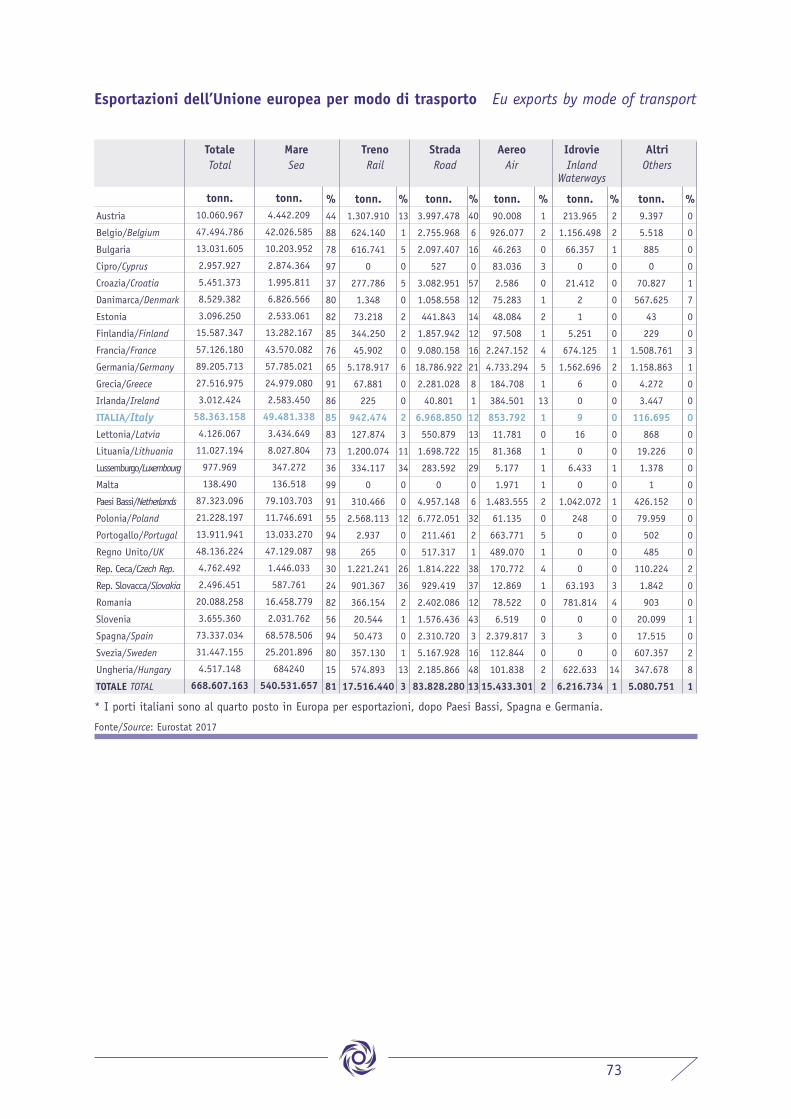
73
* I porti italiani sono al quarto posto in Europa per esportazioni, dopo Paesi Bassi, Spagna e Germania.
Fonte/Source: Eurostat 2017
Esportazioni dell’Unione europea per modo di trasporto Eu exports by mode of transport
Austria
Belgio/Belgium
Bulgaria
Cipro/Cyprus
Croazia/Croatia
Danimarca/Denmark
Estonia
Finlandia/Finland
Francia/France
Germania/Germany
Grecia/Greece
Irlanda/Ireland
ITALIA/ItalyLettonia/Latvia
Lituania/Lithuania
Lussemburgo/Luxembourg
Malta
Paesi Bassi/Netherlands
Polonia/Poland
Portogallo/Portugal
Regno Unito/UK
Rep. Ceca/Czech Rep.
Rep. Slovacca/Slovakia
Romania
Slovenia
Spagna/Spain
Svezia/Sweden
Ungheria/Hungary
TOTALE TOTAL
tonn.4.442.209
42.026.585
10.203.952
2.874.364
1.995.811
6.826.566
2.533.061
13.282.167
43.570.082
57.785.021
24.979.080
2.583.450
49.481.338
3.434.649
8.027.804
347.272
136.518
79.103.703
11.746.691
13.033.270
47.129.087
1.446.033
587.761
16.458.779
2.031.762
68.578.506
25.201.896
684240
540.531.657
TrenoRail
MareSea
TotaleTotal
tonn.10.060.967
47.494.786
13.031.605
2.957.927
5.451.373
8.529.382
3.096.250
15.587.347
57.126.180
89.205.713
27.516.975
3.012.424
58.363.158
4.126.067
11.027.194
977.969
138.490
87.323.096
21.228.197
13.911.941
48.136.224
4.762.492
2.496.451
20.088.258
3.655.360
73.337.034
31.447.155
4.517.148
668.607.163
%44
88
78
97
37
80
82
85
76
65
91
86
85
83
73
36
99
91
55
94
98
30
24
82
56
94
80
15
81
tonn.1.307.910
624.140
616.741
0
277.786
1.348
73.218
344.250
45.902
5.178.917
67.881
225
942.474
127.874
1.200.074
334.117
0
310.466
2.568.113
2.937
265
1.221.241
901.367
366.154
20.544
50.473
357.130
574.893
17.516.440
%13
1
5
0
5
0
2
2
0
6
0
0
2
3
11
34
0
0
12
0
0
26
36
2
1
0
1
13
3
StradaRoad
tonn.3.997.478
2.755.968
2.097.407
527
3.082.951
1.058.558
441.843
1.857.942
9.080.158
18.786.922
2.281.028
40.801
6.968.850
550.879
1.698.722
283.592
0
4.957.148
6.772.051
211.461
517.317
1.814.222
929.419
2.402.086
1.576.436
2.310.720
5.167.928
2.185.866
83.828.280
%40
6
16
0
57
12
14
12
16
21
8
1
12
13
15
29
0
6
32
2
1
38
37
12
43
3
16
48
13
AereoAir
tonn.90.008
926.077
46.263
83.036
2.586
75.283
48.084
97.508
2.247.152
4.733.294
184.708
384.501
853.792
11.781
81.368
5.177
1.971
1.483.555
61.135
663.771
489.070
170.772
12.869
78.522
6.519
2.379.817
112.844
101.838
15.433.301
%1
2
0
3
0
1
2
1
4
5
1
13
1
0
1
1
1
2
0
5
1
4
1
0
0
3
0
2
2
IdrovieInland
Waterways
tonn.213.965
1.156.498
66.357
0
21.412
2
1
5.251
674.125
1.562.696
6
0
9
16
0
6.433
0
1.042.072
248
0
0
0
63.193
781.814
0
3
0
622.633
6.216.734
%2
2
1
0
0
0
0
0
1
2
0
0
0
0
0
1
0
1
0
0
0
0
3
4
0
0
0
14
1
AltriOthers
tonn.9.397
5.518
885
0
70.827
567.625
43
229
1.508.761
1.158.863
4.272
3.447
116.695
868
19.226
1.378
1
426.152
79.959
502
485
110.224
1.842
903
20.099
17.515
607.357
347.678
5.080.751
%0
0
0
0
1
7
0
0
3
1
0
0
0
0
0
0
0
0
0
0
0
2
0
0
1
0
2
8
1
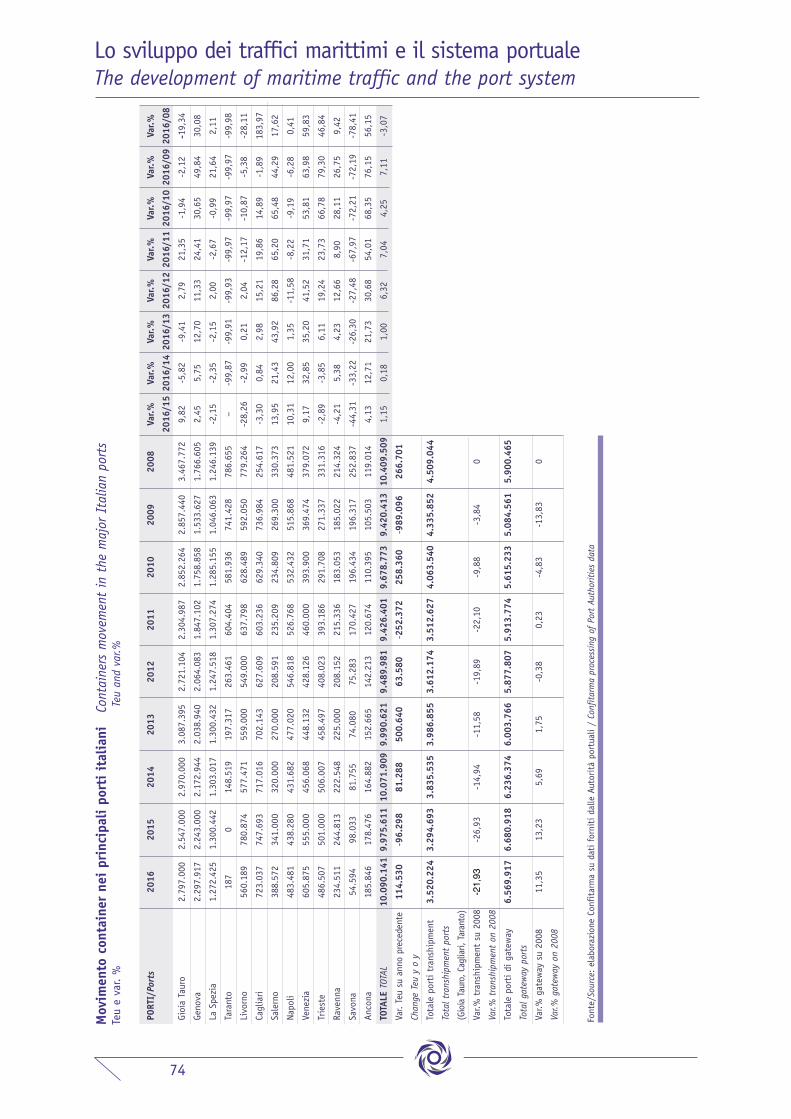
74
Lo sviluppo dei traffici marittimi e il sistema portualeThe development of maritime traffic and the port system
2015
2.54
7.00
0
2.24
3.00
0
1.30
0.44
2
0
780.87
4
747.69
3
341.00
0
438.28
0
555.00
0
501.00
0
244.81
3
98.033
178.47
6
9.975.611
-96.298
3.294.693
-26,93
6.680.918
13,23
2016
2.79
7.00
0
2.29
7.91
7
1.27
2.42
5
187
560.18
9
723.03
7
388.57
2
483.48
1
605.87
5
486.50
7
234.51
1
54.594
185.84
6
10.090.141
114.530
3.520.224
-21,93
6.569.917
11,35
2014
2.97
0.00
0
2.17
2.94
4
1.30
3.01
7
148.51
9
577.47
1
717.01
6
320.00
0
431.68
2
456.06
8
506.00
7
222.54
8
81.755
164.88
2
10.071.909
81.288
3.835.535
-14,94
6.236.374
5,69
2013
3.08
7.39
5
2.03
8.94
0
1.30
0.43
2
197.31
7
559.00
0
702.14
3
270.00
0
477.02
0
448.13
2
458.49
7
225.00
0
74.080
152.66
5
9.990.621
500.640
3.986.855
-11,58
6.003.766
1,75
2012
2.72
1.10
4
2.06
4.08
3
1.24
7.51
8
263.46
1
549.00
0
627.60
9
208.59
1
546.81
8
428.12
6
408.02
3
208.15
2
75.283
142.21
3
9.489.981
63.580
3.612.174
-19,89
5.877.807
-0,38
2011
2.30
4.98
7
1.84
7.10
2
1.30
7.27
4
604.40
4
637.79
8
603.23
6
235.20
9
526.76
8
460.00
0
393.18
6
215.33
6
170.42
7
120.67
4
9.426.401
-252.372
3.512.627
-22,10
5.913.774
0,23
2010
2.85
2.26
4
1.75
8.85
8
1.28
5.15
5
581.93
6
628.48
9
629.34
0
234.80
9
532.43
2
393.90
0
291.70
8
183.05
3
196.43
4
110.39
5
9.678.773
258.360
4.063.540
-9,88
5.615.233
-4,83
2009
2.85
7.44
0
1.53
3.62
7
1.04
6.06
3
741.42
8
592.05
0
736.98
4
269.30
0
515.86
8
369.47
4
271.33
7
185.02
2
196.31
7
105.50
3
9.420.413
-989.096
4.335.852
-3,84
5.084.561
-13,83
2008
3.46
7.77
2
1.76
6.60
5
1.24
6.13
9
786.65
5
779.26
4
254.61
7
330.37
3
481.52
1
379.07
2
331.31
6
214.32
4
252.83
7
119.01
4
10.409.509
266.701
4.509.044
0
5.900.465
0
Var.%
2016/15
9,82
2,45
-2,15
–
-28,26
-3,30
13,95
10,31
9,17
-2,89
-4,21
-44,31
4,13
1,15
Var.%
2016/14
-5,82
5,75
-2,35
-99,87
-2,99
0,84
21,43
12,00
32,85
-3,85
5,38
-33,22
12,71
0,18
Var.%
2016/13
-9,41
12,70
-2,15
-99,91
0,21
2,98
43,92
1,35
35,20
6,11
4,23
-26,30
21,73
1,00
Var.%
2016/12
2,79
11,33
2,00
-99,93
2,04
15,21
86,28
-11,58
41,52
19,24
12,66
-27,48
30,68
6,32
Var.%
2016/11
21,35
24,41
-2,67
-99,97
-12,17
19,86
65,20
-8,22
31,71
23,73
8,90
-67,97
54,01
7,04
Var.%
2016/10
-1,94
30,65
-0,99
-99,97
-10,87
14,89
65,48
-9,19
53,81
66,78
28,11
-72,21
68,35
4,25
Var.%
2016/09
-2,12
49,84
21,64
-99,97
-5,38
-1,89
44,29
-6,28
63,98
79,30
26,75
-72,19
76,15
7,11
Var.%
2016/08
-19,34
30,08
2,11
-99,98
-28,11
183,97
17,62
0,41
59,83
46,84
9,42
-78,41
56,15
-3,07
PORTI/
Port
s
Gioia Ta
uro
Geno
va
La Spe
zia
Tarant
o
Livo
rno
Cagliari
Salerno
Napo
li
Vene
zia
Trieste
Rave
nna
Savo
na
Anco
na
TOTALE
TOTAL
Var. Teu su
ann
o prec
eden
te
Change Teu y o y
Totale porti trans
hipm
ent
Total transhipm
ent ports
(Gioia Tau
ro, C
aglia
ri, Taran
to)
Var.%
trans
hipm
ent su
200
8
Var.%
transhipm
ent on 2008
Totale porti di ga
teway
Total g
atew
ay ports
Var.%
gatew
ay su 20
08
Var.%
gatew
ay on 2008
Movimento container nei principali porti italiani
Containers m
ovem
ent in the m
ajor Italian ports
Teu e va
r. %
Teu and var.%
Font
e/Source: elab
oraz
ione
Con
fitarm
a su
dati forniti da
lle A
utorità po
rtua
li / Confitarma processing of Port Authorities data

75
2014
12.297
.570
9.70
0.00
0
8.97
7.73
8
5.79
5.62
4
4.55
4.09
1
4.44
1.94
9
4.05
0.00
0
3.60
0.00
0
2.97
0.00
0
1.17
3.91
9
2.50
4.00
0
2.17
2.94
4
2.00
0.00
0
1.92
3.00
0
4.10
0.00
0
707.37
7
3.07
7.75
0
1.65
0.00
0
2.90
0.00
0
1.30
3.01
7
1.22
7.69
4
717.01
6
577.47
1
506.00
7
456.06
8
431.68
2
320.00
0
222.54
8
164.88
2
148.51
9
81.755
84.752.621
10.071
.909
36.770
.932
10.919
.040
7.88
5.12
7
11,88
43,39
12,88
9,30
2015
12.200
.000
8.80
0.00
0
9.65
3.51
1
5.54
6.65
7
4.49
4.16
5
4.61
5.19
6
3.98
4.00
0
3.33
0.00
0
2.54
7.00
0
1.22
0.00
0
2.56
0.00
0
2.24
3.00
0
1.55
9.00
0
2.00
0.00
0
4.10
0.00
0
719.54
7
3.00
0.00
0
2.10
8.00
0
3.10
0.00
0
1.30
0.44
2
1.33
2.20
0
747.69
3
780.87
4
501.00
0
555.00
0
438.28
0
341.00
0
244.81
3
178.47
6
-
98.033
84.297.887
9.97
5.61
1
36.200
.168
11.109
.361
7.81
9.54
7
11,83
42,94
13,18
9,28
2016
12.385
.000
8.91
0.00
0
10.037
.000
5.48
7.00
0
4.76
0.00
0
4.72
2.00
0
3.74
5.00
0
3.67
5.00
0
2.79
7.00
0
1.25
0.00
0
2.51
9.00
0
2.29
7.91
7
1.40
3.10
0
2.23
7.81
8
3.00
0.00
0
810.31
1
2.96
3.65
4
1.95
7.00
0
3.08
0.00
0
1.27
2.42
5
1.51
3.00
0
723.03
7
560.18
9
486.50
7
605.87
5
483.48
1
388.57
2
234.51
1
185.84
6
187
54.594
84.545.024
10.090
.141
36.819
.000
11.719
.818
6.77
3.96
5
11,93
43,55
13,86
8,01
2013
11.664
.000
9.30
0.00
0
8.57
8.00
0
5.83
1.00
0
4.34
3.00
0
4.32
8.00
0
3.50
0.00
0
3.16
3.00
0
3.08
7.39
5
1.09
9.24
7
2.50
4.00
0
2.03
8.94
0
2.00
0.00
0
1.72
0.00
0
4.10
0.00
0
688.07
0
2.50
0.00
0
1.65
0.00
0
2.55
0.00
0
1.30
0.43
2
900.00
0
702.14
3
559.00
0
458.49
7
448.13
2
477.02
0
270.00
0
225.00
0
152.66
5
197.31
7
74.080
80.408.938
9.99
0.62
1
35.373
.000
10.391
.000
7.28
8.07
0
12,42
43,99
12,92
8,60
2012
11.866
.000
8.63
5.00
0
8.63
5.00
0
6.11
5.00
0
4.07
1.00
0
4.47
0.00
0
3.32
7.00
0
2.70
9.00
0
2.72
1.10
4
1.06
1.00
0
2.30
6.00
0
2.06
4.08
3
1.95
3.00
0
1.75
7.00
0
3.63
0.00
0
755.65
1
1.80
0.00
0
1.65
1.00
0
2.40
0.00
0
1.24
7.51
8
570.00
0
627.60
9
549.00
0
408.02
3
428.12
6
546.81
8
208.59
1
208.15
2
142.21
3
263.46
1
75.283
77.201.632
9.48
9.98
1
35.251
.000
10.298
.000
6.18
5.65
1
12,29
45,66
13,34
7,30
2011
11.876
.920
9.01
4.16
5
8.66
4.24
3
5.91
5.48
7
3.60
2.63
1
4.32
7.37
1
3.74
0.00
0
490.89
4
2.30
4.98
7
949.71
7
2.21
5.00
0
1.84
7.10
2
2.20
6.68
1
2.03
4.11
9
4.27
0.00
0
711.00
0
2.09
3.40
8
1.61
3.00
0
2.36
0.00
0
1.30
7.27
4
410.00
0
603.23
6
637.79
8
393.18
6
460.00
0
526.76
8
235.20
9
215.33
6
120.67
4
604.40
4
170.42
7
75.921.037
9.42
6.40
1
35.470
.815
9.96
4.12
1
7.07
4.40
8
12,42
46,72
13,12
8,35
2010
11.148
.000
7.90
0.00
0
8.46
8.47
5
4.87
1.29
7
2.80
6.88
4
4.20
6.93
7
3.41
6.00
0
513.31
9
2.85
2.26
4
954.00
0
2.35
8.00
0
1.75
8.85
8
2.50
0.00
0
1.94
5.73
5
3.62
7.81
3
1.07
2.00
0
2.05
8.43
0
1.56
3.00
0
2.37
0.72
9
1.28
5.15
5
382.00
0
629.34
0
628.48
9
291.70
8
393.90
0
532.43
2
234.80
9
183.05
3
110.39
5
581.93
6
196.43
4
71.841.392
9.67
8.77
3
32.387
.772
8.95
9.55
6
6.75
8.24
3
13,47
45,08
12,47
7,97
2009
9.74
3.29
0
7.00
7.70
4
7.30
9.63
9
4.53
5.84
2
3.04
2.78
2
3.65
3.89
0
3.04
2.78
2
664.89
5
2.85
7.44
0
876.75
7
664.89
5
1.53
3.62
7
1.41
0.00
0
1.80
0.21
3
3.30
0.95
1
1.13
9.01
8
1.22
2.00
0
2.18
7.61
6
2.26
0.00
0
1.04
6.06
3
253.50
0
736.98
4
592.05
0
271.33
7
369.47
4
515.86
8
269.30
0
185.02
2
105.50
3
741.42
8
196.31
7
63.536.187
9.42
0.41
3
28.596
.475
8.49
6.88
5
5.66
1.96
9
14,83
45,01
13,37
6,68
2008
10.783
.825
9.73
7.00
0
8.66
2.89
1
5.50
0.70
9
3.32
7.61
6
3.60
2.11
2
3.32
4.31
0
433.58
2
3.46
7.77
2
851.42
5
430.00
0
1.76
6.60
5
1.70
0.00
0
2.56
9.54
9
3.18
6.58
9
1.12
4.96
9
920.70
8
2.20
9.71
3
2.33
4.00
0
1.24
6.13
9
233.00
0
254.61
7
779.26
4
331.31
6
379.07
2
481.52
1
330.37
3
214.32
4
119.01
4
786.65
5
252.83
7
71.341.507
10.409
.509
34.684
.425
9.49
9.27
7
5.23
2.26
6
14,59
48,62
13,32
6,17
Var.%
2016/15
1,52
1,25
3,97
-1,08
5,92
2,31
-6,00
10,36
9,82
2,46
-1,60
2,45
-10,00
11,89
-26,83
12,61
-1,21
-7,16
-0,65
-2,15
13,57
-3,30
-28,26
-2,89
9,17
10,31
13,95
-4,21
4,13
0,00
-44,31
0,29
1,15
1,71
5,49
-13,37
0,85
1,41
5,19
-13,62
Var.%
2016/14
0,71
-8,14
11,80
-5,33
4,52
6,30
-7,53
2,08
-5,82
6,48
0,60
5,75
-29,85
16,37
-26,83
14,55
-3,71
18,61
6,21
-2,35
23,24
0,84
-2,99
-3,85
32,85
12,00
21,43
5,38
12,71
-99,87
-33,22
-0,24
0,18
0,13
7,33
Var.%
2016/13
6,18
-4,19
17,01
-5,90
9,60
9,10
7,00
16,19
-9,41
13,71
0,60
12,70
-29,85
30,11
-26,83
17,77
18,55
18,61
20,78
-2,15
68,11
2,98
0,21
6,11
35,20
1,35
43,92
4,23
21,73
-99,91
-26,30
5,14
1,00
4,09
12,79
Var.%
2016/12
4,37
3,18
16,24
-10,27
16,92
5,64
12,56
35,66
2,79
17,81
9,24
11,33
-28,16
27,37
-17,36
7,23
64,65
18,53
28,33
2,00
165,44
15,21
2,04
19,24
41,52
-11,58
86,28
12,66
30,68
-99,93
-27,48
9,51
6,32
4,45
13,81
Var.%
2016/11
4,28
-1,16
15,84
-7,24
32,13
9,12
0,13
648,63
21,35
31,62
13,72
24,41
-36,42
10,01
-29,74
13,97
41,57
21,33
30,51
-2,67
269,02
19,86
-12,17
23,73
31,71
-8,22
65,20
8,90
54,01
-99,97
-67,97
11,36
7,04
3,80
17,62
Var.%
2016/10
11,10
12,78
18,52
12,64
69,58
12,24
9,63
615,93
-1,94
31,03
6,83
30,65
-43,88
15,01
-17,31
-24,41
43,98
25,21
29,92
-0,99
296,07
14,89
-10,87
66,78
53,81
-9,19
65,48
28,11
68,35
-99,97
-72,21
17,68
4,25
13,68
23,99
Var.%
2016/09
27,11
27,15
37,31
20,97
56,44
29,23
23,08
452,72
-2,12
42,57
278,86
49,84
-0,49
24,31
-9,12
-28,86
142,52
-10,54
36,28
21,64
496,84
-1,89
-5,38
79,30
63,98
-6,28
44,29
26,75
76,15
-99,97
-72,19
33,07
7,11
28,75
37,93
PORTI/
Port
s
Rotterda
m
Ambu
rgo
Anve
rsa
Brem
erha
ven
Alge
ciras
Valenc
ia
Felix
stow
e
Pireo
Gioia Ta
uro
Marsiglia
Le H
avre
Geno
va
Zeeb
rugg
e (estimated
)
Barcellona
Port Said
Damietta
Tang
er-M
ed
Sout
hampt
on
Marsa
xlok
k
La Spe
zia
Sine
s
Cagliari
Livo
rno
Trieste
Vene
zia
Napo
li
Salerno
Rave
nna
Anco
na
Tarant
o
Savo
na
TOTALE
TOTAL
Total Italian ports
Total N
orth Range ports
Total S
panish ports
Total N
orth African ports
% Italian ports
% North Range ports
% Spanish ports
% North African ports
Var.%
2016/08
14,85
-8,49
15,86
-0,25
43,05
31,09
12,65
747,59
-19,34
46,81
485,81
30,08
-17,46
-12,91
-5,86
-27,97
221,89
-11,44
31,96
2,11
549,36
183,97
-28,11
46,84
59,83
0,41
17,62
9,42
56,15
-99,98
-78,41
18,51
-3,07
6,15
23,38
Movimento container nei principali porti europei e nord-africani
Containers m
ovem
ent in the m
ajor European and No
rth African ports
Teu e va
r. %
Teu and var.%
Font
e/So
urce
: elab
oraz
ione
Con
fita
rma
su fon
ti v
arie
Confitarma processing
various sou
rces
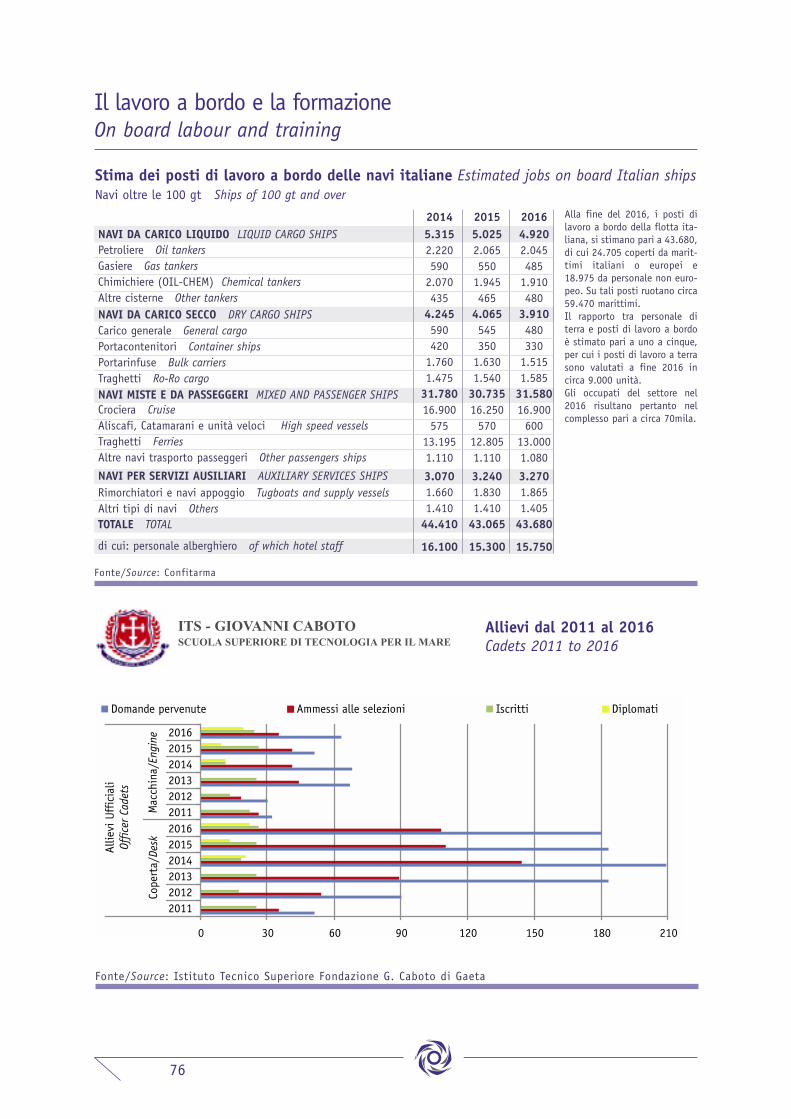
Fonte/Source: Istituto Tecnico Superiore Fondazione G. Caboto di Gaeta
0 30 60 90 120 150 180 210
201120122013201420152016201120122013201420152016
Domande pervenute Ammessi alle selezioni Iscritti Diplomati
Mac
chin
a/En
gine
Cope
rta/
Desk
Allie
vi U
ffic
iali
Off
icer
Cad
ets
Allievi dal 2011 al 2016Cadets 2011 to 2016
ITS - GIOVANNI CABOTOSCUOLA SUPERIORE DI TECNOLOGIA PER IL MARE
76
TOTALE TOTAL
Il lavoro a bordo e la formazioneOn board labour and training
Stima dei posti di lavoro a bordo delle navi italiane Estimated jobs on board Italian shipsNavi oltre le 100 gt Ships of 100 gt and over
NAVI MISTE E DA PASSEGGERI MIXED AND PASSENGER SHIPS
NAVI PER SERVIZI AUSILIARI AUXILIARY SERVICES SHIPSRimorchiatori e navi appoggio Tugboats and supply vesselsAltri tipi di navi Others
di cui: personale alberghiero of which hotel staff
Fonte/Source: Confitarma
NAVI DA CARICO LIQUIDO LIQUID CARGO SHIPSPetroliere Oil tankersGasiere Gas tankersChimichiere (OIL-CHEM) Chemical tankersAltre cisterne Other tankers
5.3152.2205902.0704354.2455904201.7601.47531.78016.900575
13.1951.110
3.0701.6601.41044.410
16.100
5.0252.0655501.9454654.0655453501.6301.54030.73516.250570
12.8051.110
3.2401.8301.41043.065
15.300
4.9202.0454851.9104803.9104803301.5151.58531.58016.900600
13.0001.080
3.2701.8651.40543.680
15.750
2014 2015 2016
NAVI DA CARICO SECCO DRY CARGO SHIPS Carico generale General cargoPortacontenitori Container shipsPortarinfuse Bulk carriersTraghetti Ro-Ro cargo
Crociera CruiseAliscafi, Catamarani e unità veloci High speed vesselsTraghetti FerriesAltre navi trasporto passeggeri Other passengers ships
Alla fine del 2016, i posti dilavoro a bordo della flotta ita-liana, si stimano pari a 43.680,di cui 24.705 coperti da marit-timi italiani o europei e18.975 da personale non euro-peo. Su tali posti ruotano circa59.470 marittimi. Il rapporto tra personale diterra e posti di lavoro a bordoè stimato pari a uno a cinque,per cui i posti di lavoro a terrasono valutati a fine 2016 incirca 9.000 unità.Gli occupati del settore nel2016 risultano pertanto nelcomplesso pari a circa 70mila.

77
Corso Ufficiali di coperta
Desk officers course
Corso Ufficiali di macchina
Engine officers course
N.20716677696145413926252313887711824
REGIONE DistrictLIGURIASICILIAPUGLIATOSCANASARDEGNAABRUZZOLAZIOCAMPANIAFRIULIMARCHECALABRIAPIEMONTEEMILIA ROMAGNAMOLISELOMBARDIAVENETOUMBRIAESTEROTOTALE TOTAL
N.18411343423426232320149974321
557
REGIONE DistrictSICILIALIGURIAPUGLIASARDEGNATOSCANACAMPANIACALABRIALAZIOABRUZZOMOLISEFRIULIMARCHEPIEMONTEVENETOLOMBARDIAEMILIA ROMAGNAUMBRIA
Fonte/Source: Fondazione Accademia Italiana Marina Mercantile
Fondazione Accademia Nautica dell’AdriaticoSelezioni corsi per Tecnico Superiore Selection for Senior Technician Cadets
Allievi ufficiali ammessi dal 2005 al 2017per regione di provenienzaItalian Academy of Merchant Marine: Cadet’sdistrict of origin, 2005-2017
ABRUZZO4,7%
CALABRIA3,3% CAMPANIA
4,7%EMILIA
ROMAGNA0,7%FRIULI2,5%
LAZIO4,6%
LIGURIA23,2%
LOMBARDIA0,7%MARCHE
2,5%MOLISE1,6%
PIEMONTE1,4%
PUGLIA8,7%
SARDEGNA7,5%
SICILIA25,4%
TOSCANA7,5%
UMBRIA0,1%
VENETO0,8%
Fonte/Source: Fondazione Accademia Nautica dell’Adriatico di Trieste
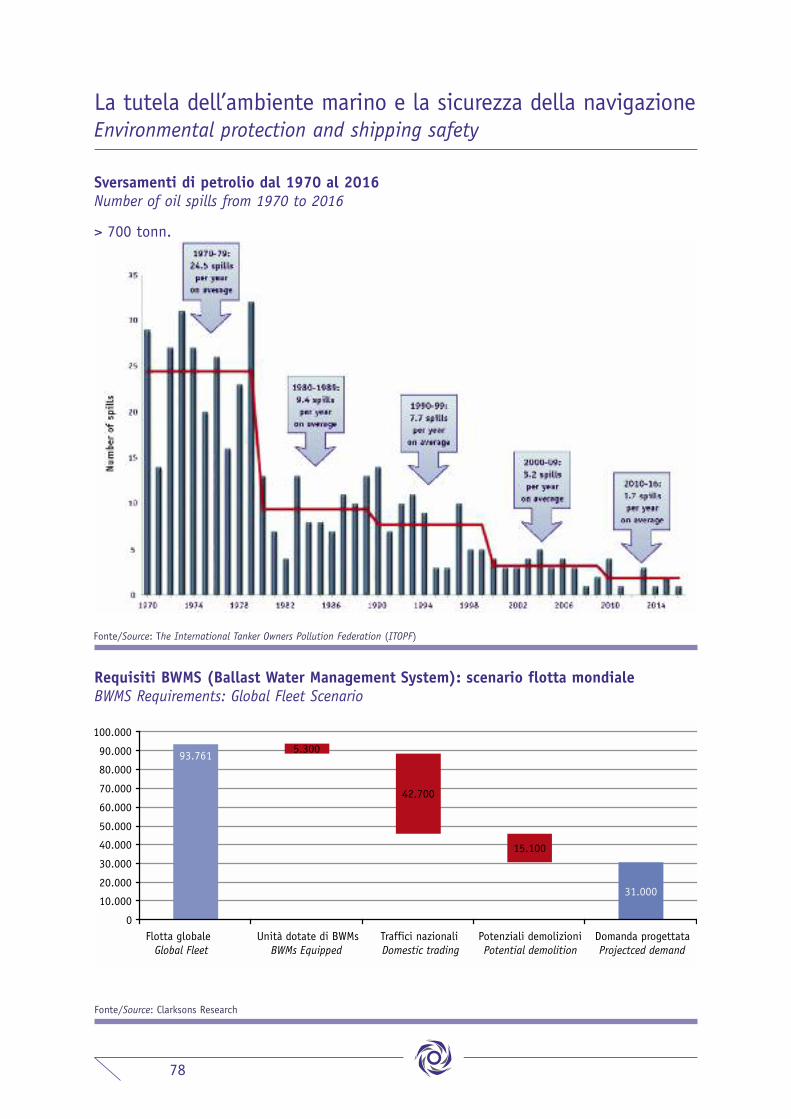
78
La tutela dell’ambiente marino e la sicurezza della navigazioneEnvironmental protection and shipping safety
Fonte/Source: The International Tanker Owners Pollution Federation (ITOPF)
Requisiti BWMS (Ballast Water Management System): scenario flotta mondialeBWMS Requirements: Global Fleet Scenario
93.7615.300
42.700
15.100
31.000
0
10.000
20.000
30.000
40.000
50.000
60.000
70.000
80.000
90.000
100.000
Flotta globaleGlobal Fleet
Unità dotate di BWMsBWMs Equipped
Traffici nazionaliDomestic trading
Potenziali demolizioniPotential demolition
Domanda progettataProjectced demand
Fonte/Source: Clarksons Research
Sversamenti di petrolio dal 1970 al 2016Number of oil spills from 1970 to 2016
> 700 tonn.
79
English version
The Council Report to the Annual General eetingCONTENTS
Forward by Emanuele Grimaldi, President of Confitarma
The Italian merchant marine in 20162010 Manila Amendments to the STCW Convention: problems and solutions for implementation in ItalySafety and securityShipowners and financeTourism from the seaBilateral International Maritime Shipping Agreements CabotageBunkeringMaritime healthTransport Regulatory Authority (TRA)
International shipping and maritime trafficThe World Fleet Maritime markets
European shipping and the maritime policy of the UnionThe economic value of the European shipping industry
The development of maritime traffic and the port system Port traffic trendsItaly: Reform of port governance European Regulatory Framework for the provision of port services and common rules on financial transparency of portsItaly: Tariff adjustment for pilotage servicesItaly: new legislation on dredgingAlternative fuels
Employment on board and trainingSingle National Collective Labour Agreement (CCNL Unico) for the Private Sector of the Shipping IndustryReforming the employment of seafarersThe Solimare FundMaritime Labour Convention 2006Education and Training
Protection of marine environment and safe navigation Ballast waterEmissionsFuel OilExhaust smoke from ships in CivitavecchiaPermanent Group for Shipping Safety of the VI UnitRadio Certificates
Confitarma – The OrganisationYoung Shipowners
80
81818283838383848485
858585
8888
88888990919292
929292929393
94949595969696
9797
English version
The Council Report to the Annual General Meeting

Forward by Emanuele Grimaldi, President of Confitarma
InItaly, in addition to the continued effects of the severe economic and financial crisis which began in2007-2008, shipping in 2016 was affected by the impact of extraordinary events such as acts of ter-rorism in various parts of Europe, the war in Syria, the humanitarian crisis in the Mediterranean, the
attempted coup in Turkey, the banking crisis, the slowdown in China and the weakening of the economies ofmany developing countries. No less important are political events such as Brexit, the outcome of the US presi-dential election, the upcoming political elections in France and Germany, the Greek crisis yet to be resolved andthe apparent division and weakening of the European Union, especially in the face of the migratory emergency. In this respect, shipowners have proven their readiness to honour the duty of the law of the sea to render assis-tance to people in danger. Despite the serious risks to the health and safety of seafarers stemming from the factthat merchant ships are not built or equipped nor have crews been trained for large-scale SAR operations, thisduty is undertaken quietly and without fuss. Thanks to the strengthening of the Triton and Frontex operations,at the behest of the entire global shipping industry and especially of Confitarma, the involvement of merchantships in SAR operations has been significantly reduced. Nevertheless, merchant ships continue to be involved inthe rescue of thousands of people. Amid the continuing fall in global shipping markets again in 2016, the weakgrowth in demand in the bulk and container sectors was combined with an oversupply of vessels, for whichfreight rates, especially for dry cargoes, continued to record a downward trend. The bankruptcy of the SouthKorean company Hanjin is emblematic of the effects of the crisis. However, it seems that the worst is over and,although concerns remain, some areas are beginning to improve. The recovery of the world economy shouldfavour demand for sea transport. At the same time, shipping analysts expect a slowdown in the delivery of newships. In short, though caution is a must, there are a number of positive signals. In this context, despite thedownturns recorded in recent years, the Italian merchant fleet, with over 16.5 million tonnes, continues to occu-py leading positions: third among the fleets of the major G20 countries, second in the European Union and thefourth in the world among those in which there is correspondence between the flag of the ship and the nation-ality of the shipowner, correspondence that actually feeds the maritime cluster of the country.The latest data confirms that in 2015 the cruise industry generated an economic and employment contributionin Europe of € 41 billion and 360,000 employees. It should be noted that Italy is among the leaders in the sec-tor with 4.5 billion spent and 103,000 employed. The excellence of Italian shipyards, leaders in Europe andaround the world in the construction of cruise ships, with obvious economic and employment returns for thecountry, should not be overlooked, as these figures show: 21 vessels ordered and nearly $ 12 billion invested. Furthermore, Italy ranks first in the world’s main fleets of ferry and ro-ro pax, with 250 vessels and over 5 mil-lion tonnes of the world's total of around 28 million GT. The competitiveness of the Italian fleet has beenstrengthened and maintained thanks to measures that have allowed Italy’s shipowners to deal equally with bothEU and non-EU maritime competition. Between 1998 and 2015, the Italian merchant fleet went from 7.8 to 16.5million tonnes. Maritime employment has gone from 30,000 to 63,000. Steady growth until the crisis of recentyears made its effects felt in our industry; nevertheless, values have more than doubled compared to twentyyears ago. National shipping has been allowed grow so much in such a relatively short space of time thanks tothe establishment of the International Registry, which, in 1998, represented a significant turning point forItalian maritime policy, aligning us with the guidelines of the Commission European. These effective and for-ward-looking guidelines have enabled the European fleet to be the current world leading maritime carrier.The content of the 1998 international shipping reform can be summarised in one word: FLEXIBILITY.Limiting flexibility means losing competitiveness and eventually businesses are forced to downsize or increasecosts in order to survive. So, changing a coherent regulatory system based on the certainty of EU and nationallaw, in force for almost the last 20 years and granting Italian shipping unprecedented success (especially inemployment terms), is very risky and would not create any advantage for anyone, simply damage to all: shipown-ers, seafarers and users, practically the entire national economy. In response to the concern about maintainingthe competitiveness of the fleet we always urge that the International Maritime Organization should be the bodythat determines new operational and environmental regulations. It is only by introducing new standards at thislevel that a level playing field can be created in an integrated and globalized sector such as maritime transport.In this context, being elected Vice President of the International Chamber of Shipping in May 2017 is not onlyan honour from a personal point of view, it is also acknowledgement of the importance of the Italian shippingindustry and the role played by Confitarma at international level. At a time when shipping faces major chal-lenges, especially where the environment is concerned, it is crucial to participate in the international forumwhere maritime strategies are devised and thus strengthen operational, legal, best practice and sustainable mar-itime transport development. Furthermore, the ICS, which accounts for 80% of the global fleet, is in contactwith most of the international and intergovernmental institutions, where decisions are made regarding the worldmaritime industry, starting with the IMO.
80

The Italian merchant marine in 2016
2010 Manila Amendments to the STCW Convention: problems and solutions for implementation in ItalyAs of January 1, 2017, when the Manila Amendments of 2010 to the Standards of Training, Certification andWatchkeeping for Seafarers (STCW) Convention entered into force, important changes regarding training stan-dards certification and watch-keeping for seafarers were introduced at international level:– New professional roles on board ships: Able Seafarer Deck, Able Seafarer Engine, Electro-technical Officer andElectro-technical Rating (Marittimo Abilitato di Coperta / Marittimo Abilitato di Macchina / UfficialeElettrotecnico / Comune Elettrotecnico);– Changes in the Competence standard tables relating to the various professional profiles; for example, the useof the Electronic Chart Display and Information System (ECDIS) for Deck Officers;– New competences for Deck and Engineering Officers with regard to Leadership and Teamwork;– Mandatory training regarding security;– Greater emphasis on the maintenance of competences of maritime personnel. All maritime workers must pro-vide evidence every five years that they have maintained an appropriate level of competence for the renewal oftheir training and competence certificates by attending refresher courses for endorsement of their standard ofcompetence certification;– New standards of competence in training specific to oil, gas and chemical tankers;– New standards regarding medical care.The coming into force of Legislative Decree No. 71 of 12 May 2015, required for implementing the ManilaAmendments in Italy, suffered severe delay and consequently put great pressure, in 2016, on the Administrationsresponsible for taking the necessary measures to enable our seafarers to acquire the standards of competenceestablished by the new international mandatory standard and also in order to avoid operational implications forshipping companies.In particular, the Ministry of Infrastructure and Transport and the Ministry of Health had to regulate with spe-cific decrees the requisites for acquiring and renewing all the certification provided for by the STCW Conventionand the Italian Coast Guard provided for the emanation of decrees governing the various training courses pro-vided for by the new international mandatory standards. In spite of the time constraints for the adoption of thevarious measures, Confitarma’s involvement with the Authorities has been on-going to prevent any future prob-lems arising from a lack of shipping industry participation in decision making processes.
TRAINING COURSES. It is estimated that the endorsement of certificates to comply with the new internationalmandatory standards concerns more than 10,000 officers and over 20,000 petty officers and ratings.Following the completion of the regulatory phase, the race for seafarers began in the second half of 2016 tocomplete training courses and gain endorsement of certificates at the Port Captaincies by 1 January 2017.Despite the constant work of the Administrations involved and the authorised training centres, many seafarersstill did not have endorsed certification by that date.Thanks to the decisive intervention of the Italian Coast Guard, the IMO issued a Circular on December 5 urgingPort State Controls (PSC) to adopt, by June 30, 2017, a practical and pragmatic approach to the implementa-tion of the new Manila 2010 Amendments. At the request of Confitarma, the Italian Corps of the Port Captaincies– Coast Guard then issued two Circulars providing the implementing measures in Italy for national and interna-tional shipping vessels and offering breathing space to seafarers and shipowners to meet any outstandingrequirements.
MINIMUM SECURITY TABLES. In late 2016, the Italian Coast Guard issued two circulars giving shipowners theopportunity to update their Minimum Security Tables before the Manila Amendments to the STCW Conventionentered into force.This updating of the Minimum Security Tables will however have limited validity over time as in January 2017the Italian Coast Guard formalised the intention to update the guidelines for the issuance of the minimum secu-rity tables and asked Confitarma to submit proposals on the matter.An illustrative document of Confitarma's proposals has been prepared and presented and which aims to: avoidany automatic insertion into the minimum security tables of the new professional figures introduced by theManila Amendments; clearly define these new professional figures; introduce elements of simplification and flex-ibility in the procedures for determining the tables; clarify a number of issues regarding application that differsfrom one Port Captaincy to another.
OFFICER CADET: TRAINING. The course for admission to Officer Cadet training and subsequently qualify asOfficer is a fundamental theme on which the two decrees published in December 2016 and January 2017 do notprovide the necessary certainty.On the one hand, the Ministry of Infrastructure and Transport Decree of 19 December 2016 concerning trainingcourses for admission as Deck Officer Cadet and Engineering Officer Cadet (issued in a hurry to ward off further
81

procedures for infringement following the European Commission's findings about alignment courses) does notunequivocally establish what training to become an Officer Cadet should entail, especially given that the com-petences required must be met not only by the so-called alignment courses (for students leaving non-nauticalinstitutes) but also by study programmes at nautical institutes. Furthermore, in the light of the Decree of July25, 2016, the Ministry of Infrastructure and Transport (MIT) plans to recognise the study programmes of nauti-cal institutes regardless of approval by the Ministry of Education, University and Research (MEUR).It might therefore be the case that students gaining a final diploma from a Nautical Institute not recognized bythe Ministry of Infrastructure and Transport, will not be able to enrol as Officer Cadets and will be obliged toundergo additional training to bridge the gap in their competences.On the other hand, the Ministry of Education, University and Research (in agreement with the Ministry of Labourand Social Policies, the Ministry of Economic Development, the Ministry of Economy and Finance and the Ministryof Infrastructure and Transport) issued the Decree of 4 October, 2016, which unifies the final exams for gainingthe higher technical diploma with the qualifying exams for the professions of Deck and Engineering Officer. Thisdecree certainly represents an obvious administrative simplification for all seafarers who qualify as Officers afterhaving completed the ITS training course. This also avoids classifying ITS students who have passed the quali-fying exam and who are already boarded as Officers without sitting the final ITS exam as “withdrawn fromcourse” and consequential detriment to nautical ITSs, which, like all ITSs, receive MEUR funding based on thepercentage students who complete courses.However, the unified exam raises further doubts about the route for Officer training and especially how, in thisroute, the Higher Technical Institutes are to be inserted. Following discussions over the past few monthsbetween Confitarma and MIT and MEUR to clarify the various controversial aspects of the matter, a measure isdue to be signed by the Ministries which would finally provide a clear framework for training routes.Lastly, the Ministry of Infrastructure and Transport should soon publish the training records, prepared byConfitarma, for Deck, Engineering and Electro-technical Officer Cadets, Deck, Engineering and Electro-technicalratings and Able Seafarers in accordance with the Manila Amendments of 2010. For the electro-technical ranks,the whole training route, especially with reference to the scholastic section, will also have to be defined.
Safety and securityMARITIME SAFETY: MIGRANTS AT SEA. At the end of 2016, the European Council extended until 27 July 2017 the
mandate for EUNAVforMED Operation SOPHIA, the EU’s naval operation to combat human smuggling and traf-ficking in the central-southern Mediterranean, strengthening this mandate with the task of training the LibyanCoast Guard and Navy and contributing to the implementation of the UN arms embargo on the high seas off thecoast of Libya.During the year, public and private efforts were very intense to counteract and mitigate the effects of activitiesrelated to human smuggling in the Mediterranean. Thanks to the considerable deployment of naval forces – navyand NGO-linked fleets – rescue calls to merchant ships diminished but did not cease during the year. In May,there was a peak of 80 diverted merchant ships, of which 31 were directly involved in the rescue of migrants,22.59% of the total number saved in the same month. In fact, the MRCC-Roma monthly statistics for the firstquarter of 2016 record 25 diverted ships and 2 involved in rescues; in the fourth quarter of the year the totalsrose to 52 and 21 respectively. More than one ship per day is diverted and one in every three days involved inrescue operations at sea.There is still no data for flag breakdown of the merchant vessels involved in 2016. It is, however, very likely thatthe Italian flag fleet remains the most frequent for both types of operation, considering the area concerned.Malta, Liberia, Panama and Singapore follow.At the same time, there are armed attacks on merchant ships in transit in the waters of Libya, which remainareas at risk.
MARITIME SECURITY. As is well known, maritime security activities in Italy are managed by CISM (Inter-min-isterial Committee for Maritime Safety), which in 2016 resumed its work, with dedicated thematic subcommit-tees, focusing mainly on the safety of passenger terminals and ships during the summer.
PIRACY. Despite the general reduction in piracy in 2016, the International Maritime Bureau (IMB) contin-ues to recommend Masters to be vigilant in areas at risk and to continue to follow best management practiceclosely, especially in the waters of Somalia where there is a recurrence of attacks on merchant ships.In Italy, following the end of the dual (military and private) armed defence system on board flag vessels and asthe theoretical-practical courses provided for by Decree Law No. 107 of 2011, converted by Law No. 30 of 201,are not yet operative, in order to ensure the safety of crews, the legislature, by Law No. 19 of 2017, approvedthe request of Confitarma to extend the possibility of embarking security guards, former members of the ArmedForces (with proven experience in international peace keeping missions) for the whole of 2017. This gives con-tinuity to active defence operations aboard our merchant ships in piracy risk areas.
82

The critical situation of the attacks in West Africa is still unresolved; here, especially in Nigerian territorialwaters, it is impossible to deploy the security guards of the supervisory bodies recognized by our Government.
CYBER SECURITY. In addition to the traditional sources of maritime “insecurity” comes the threat from com-puter-related attacks regarding which, in 2016, the IMO, EU, Presidency of the Council of Ministers and theItalian Coast Guard provided primary operational guidelines.In particular, in May 2016, the IMO Maritime Safety Committee approved interim guidelines, which should beimplemented by individual states, to address the increasing risk of cyber attacks on maritime traffic manage-ment systems.
Shipowners and financeIn 2016, Confitarma continued to engage in systematic encounters with financial stakeholders by means of directmeetings with the leading domestic and international banking groups operating in the shipping industry and,at the institutional level, with the Bank of Italy Supervisory Authority and with the Italian Banking Association(ABI). The work strategy developed along two tracks:1. Maximum transparency and communication to comprehend the changing scenarios of the maritime transportmarket; changes that are sometimes sudden and which often vary between sectors, resulting in cyclical trendsthat do not always coincide. This is especially the case where the on-going financial restructuring process isconcerned in order to make it clear to banking representatives that financial flexibility is an indispensable andfundamental component for the shipping industry. 2. Constant attention to European banking supervision legislation, and in particular the Capital RequirementsRegulation (CRR), known as “Basel IV”. This matter, thanks to the action of Confitarma, is among the priorityissues of the agenda of the ECSA – The European Community Shipowners’ Associations – and is producing, thanksto ABI’s contribution, an amendment to the proposal that will be presented at Reform of the aforementionedlegislation.
Tourism from the seaIn 2016, cruise traffic in Italy remained stable with respect to 2015 with 11.1 million cruise passengers. For2017, falls are expected for both passenger handling (-7%) and ship calls (-9.6%).During the year, 22 ports handled 30,000 passengers: Civitavecchia is confirmed to be in first place (2,339,676passengers) followed by Venice (1,605,660), Naples (1,306,151) and Genoa (1,017,368), which thus overtakeSavona (910,244). Cruise passengers from Italy were slightly fewer (751,000 or 11% of the European market)with Germany and the UK in the lead.In Italy, unfortunately, bureaucratic constraints, unclear standards, inadequate infrastructure and unresolvedissues (such as those of the Great ships in Venice) create problems for sectors like the cruise industry, which,despite the global economic crisis, managed to register strong growth.
Bilateral International Maritime Shipping AgreementsTUNISIA. Despite the interest shown by both parties to resume negotiations for examining the agreement
signed in Tunis in 2006 but never ratified due to the indisposition of the Italian shipping industry, which doesnot consider the agreement reached at the time satisfactory, talks have still not begun.
MOROCCO. Despite Morocco and Italy agreeing on the need for a new bilateral agreement, to date, there isstill no indication of when negotiations will start. Italy will propose to include a forecast to better interpret aclause contained in the bilateral agreement against double taxation in order to address the problem of taxationin Morocco of proceeds transferred to Italy arising from the use of containers.
ALBANIA. The Accord for ministerial signature of the maritime transport Cooperation Agreement betweenour government and that of the Republic of Albania was defined on 2 March 2017.
AZERBAIJAN AND ALGERIA. The Senate is examining the bill of ratification and execution of the Treaties signedby Italy, including the Rome agreement on maritime transport with the Republic of Azerbaijan of 14 July 2014and the Algiers Cooperation Agreement on maritime transport with the People’s Democratic Republic of Algeriaof 14 November 2012. The entry into force of these two agreements should take place in 2017.
Cabotage“MAREBONUS” AND “FERROBONUS”. At the end of 2016, the European Commission approved the draft provisions
for establishing incentives in Italy to encourage sea and rail freight (“Marebonus” and “Ferrobonus”) in prefer-ence to road transport, declaring these compatible with provisions regarding state aid. In particular, the Marebonus measure, provided for by the 2016 Stability Law, allocated a budget of 138 millioneuro (45.4 million in 2016, 44.1 in 2017 and 48.9 in 2018) for the implementation of joint shipowner-road
83

haulier projects that improve the intermodal network and decongest the roads. Such projects should provide forthe creation of new maritime services, or the improvement of existing services, for the combined transport ofgoods, on inbound and outbound routes from ports in Italy, linking them with other Italian, EU or EEA ports. Having exceeded the projections from Brussels and Italy’s Council of State, second-level regulations identifyingthe criteria and procedures for the presentation of the projects were recently issued in order to start the actu-al deployment of the incentive measure. As the start-up of the incentive provision is due to take place in 2017,the problem of recovering the amounts budgeted for the first year remains unresolved.
“EUROPEAN COMMUNITY SHIPOWNERS” REQUISITE. Unfortunately, even in 2016 there were several cases in the mar-itime cabotage sector – mainly tankers – of circumvention of Regulation (EEC) No 3577/92 by shipowners who,despite formal compliance with EU legislation, through mere registration in EU countries, operate ships in non-EU territory, thus evading the rules that have been put in place to protect genuine EU interests.In November, the Ministry of Infrastructure and Transport prepared a new “self-certification form” whichshipowners must sign, declaring the veracity of the information provided, in order to ensure compliance withthe requisite of “European Community Shipowner”. In addition to general information about the ship, masterand registered owner, specific indications are required regarding the organisation managing the InternationalSafety Management and also those responsible for the commercial and technical management of the ship.According to the indications of the European Commission, this check is intended to ensure that, for the com-pletion of cabotage operations, the main decisions affecting the ship are adopted on a daily basis from EU ter-ritory; EU nationality of the registered owner is insufficient.
MOTORWAYS OF THE SEA. In 2017, the trend in the supply of Motorways of the Sea freight services departingfrom national ports is essentially stable compared to 2016 and the trend towards adopting new operating mod-els based on multi-link connections rather than point-to-point, is now established, taking into account the cur-rent concentration on the market and the fleet size of individual operators, which allow more efficient use ofships by means of more complex rotations.Connections to Sicily show positive values both in terms of weekly departures and linear meters supplied, where-as those to Sardinia show a decrease. The growing trend of services to foreign ports is confirmed.In total, national operators guarantee 446 weekly departures on the motorways of the sea, linking the Italianpeninsula with Sicily, Sardinia and other Mediterranean countries (Albania, France, Greece, Malta, Morocco,Montenegro, Spain and Tunisia). The net hold supply exceeds a million linear meters on a weekly basis and is approximately 1.1 million linearmeters (corresponding to approximately 3 million tonnes or 3.7 million transportable semitrailers per year).
BunkeringThe entry into force of Decree No. 225 of 2015 and of the new EU Customs Code, as well as subsequent admin-istrative acts, have led to significant changes in the rules governing the movement of bunkers, mainly due tothe increased controls on the supply of such fuel oils imposed by the Administration to counter tax evasion.In summary, the provisions provide for the abolition of bills of entry for intra-EU bunkering and the obligationto install measuring systems on board cargo barges to prove fuelling and the supply of denatured diesel for EUtraffic. Following the action of Confitarma and other trade associations, fuel oil has been excluded from the scope ofapplication and some of the problems arising during the first application of the new measures have beenresolved. Several aspects of the new customs procedures need to be clarified, especially the impact on VAT complianceand territorial disparities.
Maritime healthConfitarma has been working hard with the Ministry of Health for the reappraisal of the Maritime HealthRegulations, which date back to 1897.Among the various issues, special attention is being given to the review of the regulations regarding doctorsand nurses embarked on passenger ships. Indeed, these old regulations, which remain in the era of thesteamships and ocean passages of early 20th century emigrants, are an element of concern, especially for com-panies operating cruises or transporting passengers on foreign markets, for which there is the absolute need toembark medical and nursing staff capable of interacting with patients who do not speak Italian. Members ofmedical staff also need to have knowledge of the patient’s normal health care system and relevant pharma-copoeia. To this end, pending revision of legislation, the ministry has granted, until the end of 2018, the board-ing of a doctor/nurse translator who should assist the ship’s doctor. In 2016, the Ministry of Health welcomed a large number of the proposals submitted by Confitarma for review-ing and simplifying the guidelines on the procedures for reimbursing medical expenses abroad. Further issues
84

under discussion concern the composition of the on-board pharmacy, the modalities of periodic replacement ofoxygen cylinders and the regulations on the serving/consumption of alcohol on board.
Transport Regulatory Authority (TRA)Again in 2016, TRA requested industry contribution to the working of the Authority. There are still many doubtsas to the proper identification of the recipients of this request, also because the law provides that the contri-bution is due from regulated service and infrastructure providers and this category does not include companiesoperating in a free market. Perplexities about the correct implementation of TRA’s institutive law were also con-firmed by a number of pending decisions from the Piedmont Regional Administrative Court and the ConstitutionalCourt, as a result of appeals promoted by members of many transport sectors. Just recently, the Supreme Courtexpressed its confirmation of the legitimacy of the contribution, pointing out, however, that it is up to theOrdinary Courts to establish whether companies carry out transport services that are actually regulated by theTRA and therefore whether they are required to pay.Nevertheless, after the early years devoted mainly to other sectors, principally rail and air transport, the TRAcontinues to strengthen its staff and, during the year, began working on the maritime-port sector. After endors-ing its Regulation for the Protection of Sea and Inland Waterways Passengers at the end of 2015, in 2016 theTRA will begin to carry out the activities envisaged in the implementation of Regulation (EU) No. 1177/2010.
International navigation and maritime traffic
2016 can be seen in two halves, with the first showing a heavy slowdown in the world economy and the se-cond, a sharp improvement in economic indicators and an overall increase in commodity prices and freight ratesin those areas that had suffered the most during the early part of the year. The latter part of the year thus enables us to look to the future with some optimism, as do the InternationalMonetary Fund world economy growth estimates; these show an acceleration in world GDP growth from 3.1% in2016 to +3.4 % in 2017 and touching +3.7% in 2019, the highest growth rate since 2012.A source of concern is the proliferation of protectionist measures. According to the Global Trade Alert report,between 2008 and 2016 G20 countries implemented 4,125 new protectionist measures, which in the last twoyears have increased by more than 50%, recording the highest levels since 2009. G20 members are responsiblefor about 80% of these restrictions.It is no surprise, therefore, that the growth of world trade has slowed down dramatically in the last five years, andthe intensity of global trade (defined as the trade-to-GDP ratio) has stopped rising and is blocked below 25%.
The world fleetAt the end of 2016 the world fleet amounted to 113,888 ships, with 1,249 million GT and 1,772 million DWT, a3.1% increase in terms of tonnage and capacity. During the year 2,543 ships were completed for a total of 66.4million GT (of which 1,628 cargo ships of 99.1 million DWT). The order book records a 23% reduction and 56% of the ordered vessels will be completed in 2017.While Panama ranks first in the world’s fleets by flag with around 220 million GT (18% of the total), in the ran-king of fleets by shipownership Greece and Japan are in the first and second place with, respectively, 14% and13% of the world total, followed by China with 9.5%.
Maritime marketsTHE DRY BULK SECTORS. In February 2016, the Baltic Dry Index (BDI) recorded the lowest in over 30 years
of history at 290 points and freight rates in the 4 major dry bulk sectors all below $ 3,000/day. As of that datea slow, but almost uninterrupted recovery began, bringing the index to a peak of 1,257 points towards the endof November when the average freight rate for Capesize exceeded $ 20,000/day, a value last seen in August2015. Overall, the annual averages reduced further, compared to the already low values of 2015: Capesize $7.400/g (-8%), Panamax $ 5.600/g (unchanged), Supramax $ 6.300/g (-10%), Handysize $ 5.300/g (-2%).On the demand side, as well as general effervescence that had been recorded for years in all of South East Asia,the biggest boost to growth certainly comes from a series of policies implemented by the Chinese governmentto stimulate the domestic economy while lowering excess production capacity, especially in mining. Demanddriven by government economic aid and shrinking domestic production led to a sharp rebound in commodityprices and a substantial increase in imports. In particular, this concerns the steel industry (China producesaround 50% of world steel) and electricity, which despite the extraordinary results obtained from renewableresources, is still heavily dependent on coal. Prospects for growth in demand remain good for 2017, but are
85

strongly dependent on Chinese policies and this is a risk factor that is far from negligible in the medium term.On the side of tonnage supply, despite a large number of new deliveries recorded during the year (540 vessels -46 million DWT), the further increase in the number of demolitions (376 ships - 29 million DWT) strongly limitsgrowth of the fleet, which in total only grew by 2%, the lowest value recorded since the beginning of the cen-tury. It is interesting to note that, in terms of number of ships, the Panamax fleet (Kamsarmax included) wassmaller at the end of the year by 13 units than at the beginning of the year. By contrast, the Supramax fleet(including Handymax and Ultramax) recorded the most sustained growth, with 123 units more during the year.The orderbook in March 2017 remains substantial, especially for 2017 (480 ships - 40 million DWT), and ordersat the moment total 720 ships of 73 million DWT. The future trend of demolition and new orders (at minimumlevels during 2016) will be crucial to determining the absorption of the overcapacity that has accumulated overthe years, allowing a durable recovery of freight rates.Despite the marked improvement in freight rates, it is likely that demolitions will continue at quite a fast rate,thanks to anti-pollution regulations that will come into force in late 2017 and in 2020. There is, however, a riskthat new orders will rally in the wake of low price policies adopted by shipbuilders worldwide to ward off sus-pension of business.
CRUDE OIL AND PETROLEUM PRODUCTS. The large number of new orders placed in 2014 and 2015 has resulted ina considerable increase in the oil tanker fleet in 2016 and consequently kept freight rates, which had a down-ward trend for most of the year, under constant pressure; in the fourth quarter, thanks to seasonal factors, ratesrose again, without ever reaching the peaks of previous years.In 2016, the Baltic Dirty Tanker Index recorded an average of 730 points, down 11%. However, the trends for the various types of tankers shows that the reduction in freight rates is far greater:VLCCs on the reference course from the Persian Gulf to Japan recorded a daily average of $ 42,500/day, down38%: Suezmax $ 24,300/day (-46%) and Aframax amounted to $ 19,600/day (-47%). Average values in absoluteterms continued to be moderately good, but the result is extremely worrying, especially as growth in demandfor transport stayed high, albeit with a slight decline compared to 2015, sustained by strong growth rates inimports to countries in developing and emerging markets, particularly India and China.In China, there are many factors that push for a notable increase in imports: high consumption growth, increasedexports of petroleum products, the semi-liberalisation of crude imports and above all, taking advantage of lowcrude prices, accelerated imports aimed at creating huge strategic reserves. One aspect that certainly affects demand for maritime transport is the removal of international sanctions againstIran whose oil exports increased by about 800,000 barrels a day in the first six months of the year. In theabsolute sense, the growth of Iranian exports would be good news for the industry, but in the oversupply situ-ation facing the oil market, these new flows make it possible to replace a large quantity of exports from theAtlantic Ocean to the Far East, offering a huge demand for ton-miles, with substantially shorter routes. During 2017, it is likely that the problems associated with the decline in Nigerian exports (due to sabotage byarmed militias), the crisis that afflicts Venezuela, the scandals in Brazil and the fires in Canada will be, at leastpartially, resolved and thus demand on these long-haul routes should rise. This, together with the stabilisationof Iranian exports, would further strengthen the already sturdy growth in global demand.In a context where demand is so dynamic, it is disheartening to record that freight rates almost halved. During2016, 126 oil tankers were delivered equal to 24 million DWT: 53 Aframax (including 2 Large Range), 26 Suezmaxand 47 VLCC.In the face of this huge number of deliveries, the level of demolition is totally inadequate as only 9 vessels werescrapped. The effect is a growth in the size of the fleet of 6%, which is totally unmatched by any increase indemand; the VLCC fleet even recorded an increase of nearly 7%.The trend for the product-carrying sector was also similar to that of oil tankers with freight rates under pressurefor most part of the year. The causes are similar and the fleet has grown much faster than demand. The average Baltic Clean Tanker Index for 2016 was 491 points, down 23% compared to 2015. The averagereturns for Medium Range on the Atlantic Triangulation (Continent - East Coast of the United States - Gulf -Continent) recorded a 50% drop and slightly less than $ 12,600/day. In the Pacific, the triangulation India -Japan - South Korea - Singapore - India offered an average return of $ 11,800/day, 44% compared to 2015. Themarket trend West of Suez, heavily depressed in the summer months, showed strong volatility as of October, withrates pushed to over $ 20,000 /day in December; nevertheless, the rebound was short-lived.The fleet of product-carrying ships grew at a strong rate (+5%) with Medium Range showing +7%; in this sec-tor (which is also the largest) 95 ships were delivered compared to just 6 demolitions. Growth in demand, whileremaining very good in absolute terms, slowed down slightly in 2016, mainly due to higher consumption in theFar East and Southeast Asia. This, together with stockpiling at record levels, caused a reduction in East-Westarbitrage, thus reducing the ton-miles transported. It is expected that in the medium term, with the opening of new refineries in the Middle East, India and China,
86
East of Suez prices for refined products may fall again, allowing the opening of new arbitrage and thus newopportunities for long-haul traffic with very positive effects on demand.
GAS CARRIERS. In 2016, the trend in the LPG Carrier market was similar to the oil tanker market: transportdemand grew to very good levels, but freight rates fell due to the large number of new deliveries. In 2016, 88 new ships were delivered for the transport of liquefied petroleum gas (LPG); of this number, whichis disproportionate to the need, more than half were VLGC (Very Large Gas Carrier) with capacity of over 70,000cubic metres. Despite the sharp increase in demolitions (260,000 cubic metres), the size of the fleet, after a15% increase in 2015, saw an acceleration and further growth of 17% in 2016. However, most of the orders havenow been delivered and, as of 2017, the fleet should return to more manageable growth rates and part of theexcess capacity accumulated over the last few years will be absorbed thanks to rising demand.The market for LNG (liquefied natural gas) ships had another difficult year due to the large number of deliver-ies (32 ships with capacity of 4.9 million cubic metres) and the demolition market virtually frozen (1 single shipscrapped/ 131,000 cubic metres). The fleet in 2016 grew by 7% and growth was even greater for larger ships,where much of the transport demand for long-haul journeys is concentrated. After a couple of disappointing years, demand shows renewed and sustained growth, with the final inaugurationof new projects rapidly increasing the volumes transported. At the end of the year, freight rates improved slight-ly thanks to seasonal factors and a more limited availability of tonnage. The number of ships ordered for deliv-ery over the next few years remains very high. Demand growth projections are nevertheless good in the shortterm and very good as of the end of the decade, when a large number of new LNG production and storage facil-ities are expected to come into operation.
THE CONTAINER SHIP SECTOR. In 2016, the container market continued to experience the notable weakness ofthe second part of 2015 and freight rates reduced even further. The sector saw the bankruptcy of HanjinShipping, the world's eighth largest line.Overall, the index recorded the lowest annual average since the beginning of the decade of just 325 points (-30%compared to 2015). Freight rates were particularly weak for medium sized units (4.250 TEU and 3.500 TEU), whichare not large enough to compete with Post-Panamax on intercontinental routes and too large for feeder services.Rates for these ships collapsed in 2016 and at the end of the year a 4.250 TEU vessel could be charged at lessthan $ 4.500/day, -25% compared to the start of the year. Although the rates for smaller freight vessels, 1,100TEU and 1,700 TEU, showed a downward trend, they remained more stable and reduced by about $ 500/day com-pared to the beginning of the year. The problem is the excess supply on the market and the increasingly markedshift towards the use of very large ships: 90% of the tonnage delivered is in the Post-Panamax category. These freight levels led to tripling demolition, with transport capacity of over 640,000 TEU scrapped during theyear. Despite the large number of scrapped ships and the slowdown in deliveries (-43% compared to 2015), the fleetcontinued to grow, albeit by only 1% – the lowest rate ever recorded for the industry. New orders also fell sharplywith only 64 ships ordered, compared with 284 in 2015. The hope is that with fewer new orders and a largenumber of demolitions, the overcapacity afflicting the industry for the last 10 years can finally be reduced.
RO-RO VESSELS. In general, 2016 was a good year for the ro-ro cargo vessel sector, thanks to load flows inexpansion, running costs under control and an encouraging balance between supply and demand, thus fosteringinvestment.Taking into account the fact that the sector is dominated by operators whose fleets are expanding, it is not sur-prising that the level of freight rates in 2016 was stable against a non-existent “tramp” market based on spo-radic military uses for cargoes to Africa, the Middle East and the Far East. It should be noted that the ro-ro sec-tor underwent growing competitive pressure from the car-carrier sector, which offers increasingly large andempty capacity and great flexibility. Due to heavy demand, the freight rates for larger tonnage (more than 2,500 ml capacity) recorded an averageincrease of 10-20% compared to 2015, whereas the trend was more moderate for smaller tonnage (2,000 ml).Apart from a slowdown in business recorded between April and August, demand was steady for all vessels, espe-cially large ships with a minimum speed of 17 knots and equipped with scrubber.Just 8 ships with an average age of 31.2 years and an average size of 1.899 ml were scrapped and, analogous-ly, 8 new ships are delivered, for a total of about 20.425 ml. The 18 vessels ordered in 2016, for delivery between2017 and 2019, will add about 60,000 ml to the world fleet.Italy has a leading position, in terms of number of ships and tonnage, in the world ro-ro fleet of cargo and pas-senger/cargo vessels.
CRUISE SHIPS. The world cruise market in 2016 established a new record with over 24 million passengers,and 2017 is expected to be another growth year, estimated at over 25 million passengers.At the end of the year the world cruise fleet recorded 14 new vessels; under construction, there are 13 ocean-going and 13 river vessels with a capacity of 30,000 passengers and an investment of $ 6.8 billion. River cruis-
87

ing is expected to increase by about 7% in 2017. Once again, in 2016 the main ports of call were in the Caribbean and now Cuba is an additional cruise destina-tion; interest in Alaska and the Far East is expected to grow in 2017.
(Our thanks to Banchero Costa for contributing to the drafting of this chapter)
European shipping and the maritime policy of the Union
The economic value of the European shipping industry By the end of 2016, with ownership of control of 37% of the world’s gross tonnage, the European Union con-trols the largest merchant fleet in the world and this plays a key role in the European economy.The second European Shipping Week (ESW), organized by the European Community Shipowners’ Associations(ECSA) and held in Brussels from 27 February to 3 March 2017, aims to bring together policy makers from themain EU institutions, shipowners and other stakeholders from Member States.On that occasion, the latest update of the report on the economic value of the EU maritime transport sector,presented by Oxford Economics and commissioned by the ECSA, shows that in the European Union the shippingindustry contributes added value of 57 billion euros and offers work directly to 640,000 people. The report also states that with the multiplicative effect on the supply chain and employment, overall employ-ment in the shipping industry rose to 2.1 million and the sector’s total contribution to European GDP was 140billion euros. Furthermore, the report indicates that, with € 89,000 for each shipping worker in 2015, productivity in the EUmaritime transport sector remains above the European average including sectors such as manufacturing andhealthcare. Of the 640,000 jobs guaranteed directly by the shipping industry in 2015, 347,000 were in maritime freight(including towing and dredging), 191,000 in passenger transport, 68,000 in the offshore services industry and7,000 in charters and leasing. Of the 640,000 employed directly by the maritime sector, 516,000 (81% of thetotal) are workers embarked on ships, of which 207,000 (40%) are from EU countries or the European EconomicArea and 309,000 (60%) are of other nationalities; 124,000 are employed on the ground (19% of the total). On the same occasion, the EU Shipping Competitiveness Study – International benchmark analysis, commis-sioned by the ECSA from Monitor Deloitte, was presented. This study, which is propaedeutic to the on-goingreview of EU Maritime Policy 2009-2018, compares the general EU framework with the policies that have beenput in place in the five major international maritime centres (Singapore, Hong Kong, Dubai, Shanghai andVancouver), on the basis of eight criteria: taxation and fiscal incentives, availability of professional services,regulatory, economic and political factors, skills, flag attractiveness, ease of doing business, legal framework foroffshore (vessel exploitation) and availability of finance.The conclusion of the study is that, overall, having implemented a competitive regime for tax and social meas-ures, the quality of registry levels and high skills levels make the EU an attractive centre for maritime transportactivities.Moreover, in order to develop the growth of the sector further, EU maritime policy needs to be more globally ori-ented to increase the competitiveness of the EU as a centre for international shipping. In this regard, the StateAid Guidelines form an essential part of the political framework. The study also recognizes that the Union playsa positive role in supporting bilateral and multilateral free trade agreements as well as in promoting individualcases for market access. To underline this message, the ECSA has also published a number of recommendations: Shipping and Global TradeTowards an EU external shipping policy.
The development of maritime traffic and the port system
Port traffic trends The comparative analysis of the main 31 European and North African ports shows that the share of traffic record-ed in 2016 in Italian ports amounted to 11.93%, that of Spanish ports amounted to 13.86%, that of northAfrican ports totalled 8.01% and that of the ports of the North Range amounted to 43.55%. A comparison with 2008 figures reveals that the share for Italian ports in 2016 was lower (14.6%) and that theshare for Spanish ports in 2016 was slightly higher than that of 2008 (13.3%), whereas the share for NorthAfrican ports in 2016, despite the slowdown, was still higher than that recorded (6.2%) and the share for North
88

Range ports in 2016 remained below the figure recorded in 2008 (48.6%).ITALY. In 2016 the 13 major Italian ports handled 10,090,141 TEU with an increase of 1.15% (+114,530
TEU) on the 9,975,611 TEU of 2015. Increases also for Salerno (+13,95%), Naples (+10,31%), Gioia Tauro(+9,82%), Venice (+9,17%), Ancona (+4,13%) and Genoa (+2,45%).Practically unchanged the zero setting for container handling in the port of Taranto and there was a significantdecline in the ports of Savona (-44.31%) and Livorno (-28.26%).
EUROPE. During 2016, Rotterdam, Hamburg, Antwerp and Bremerhaven recorded a handling of 36,819,000TEU, an increase of 1.71% compared to the 36,200,168 TEU of 2015. Compared with 2015, in 2016 increaseswere recorded for Rotterdam (+1.52%), Hamburg (+1.25%) and Antwerp (+5.92%), whereas Bremerhaven had aslight decline (-1.08%). The reduction in the share for these ports of total traffic is due to the fact that theincrease in container traffic in North Range ports in the period 2007-2016 was equal to 8.99% compared to anoverall increase in traffic during the same period of 19.43%.The positive trend for Barcelona (+11.89%) and Marseille (+2.46%) continues with 2,237,818 TEU and 1,250,000TEU respectively.Worthy of note is the steady and progressive increase in the volume of container traffic in the port of Sines PSA(Portugal), which recorded 1,513,000 TEU in 2016, greatly exceeding the 150,000 TEU of 2007; similarly, theMarsaxlokk Maltese port in 2016 stood at 3,080,000 TEU compared to 1,900,000 TEU in 2007, with a slightdecrease of 0,65% over 2015.
NORTH AFRICA. There was a significant slowdown in traffic for container handling in North Africa ports of-13.37%.Specifically, in 2016, compared with 2015, the Moroccan Tanger Med port reduced from 3,000,000 TEU to2,963,654 TEU, down 1.21%, and the Egyptian ports of Porto Said and Damietta recorded a reduction of 26.83%for the former (from 4,000,000 TEU to 3,000,000 TEU), and an increase of 12,51% for the latter (from 719,547TEU to 810,311 TEU).
Italy: reform of port governanceOn 4 August 2016 the Official Gazette published Legislative Decree No. 169 of 2016 on the reorganization,rationalization and simplification of the rules regarding the Port Authorities established by Law No. 84 of 1994.The Decree reduces the number of Port Authorities from 24 to 15 by assigning them the new definition of PortSystem Authority (ADSP).The Port System Authorities (ADSP) are specially regulated non-economic public bodies of national importancewith administrative, organizational, regulatory, fiscal and financial autonomy as well as deliberating power. TheADSPs are subject to the direction and supervision of the Ministry of Infrastructure and Transport.
PRESIDENT. The governance of the new ADSPs centres on the President, who is appointed with all ordinaryand extraordinary administrative powers. The President of the ADSP is nominated by the Minister ofInfrastructure and Transport in agreement with the president or presidents of the regions concerned. In the caseof no agreement after having carried out the procedure prescribed by law No. 14 ter of Law No. 241 of 1990,the decision is adopted by the Council of Ministers whose deliberation has the nature of an act of executiveadministration.
MANAGEMENT COMMITTEE. The Management Committee, as the political-strategic organ of the new body,replaces the former Port Committee, has fewer members and comprises only representatives from the publicadministration, that is to say: the President of the ADSP; a representative from the Region or Regions whoseterritory is included in the port system even if only partially; a representative of the Mayor of each of the met-ropolitan cities whose territory is included in the port system; a representative of the mayor of each of themunicipalities formerly port authority; a representative from the Maritime Authority with the right to vote onlyon matters of competence. The new model of governance of the ADSP is a radical departure from the previous one introduced by Law No.84 of 1994 and has a strongly centralised set of functions and competences sanctioned by public bodies, leav-ing little room for the involvement of representatives of private economic concerns.
MARINE RESOURCE PARTNERSHIP BODY. The Marine Resource Partnership Body is the advisory body to the ADSP,comprising two representatives of the Public Administration (the Chairman of the ADSP, who presides over it,and the Harbour Master for the port or former Port Authority ports falling within the constituency of the ADSP)and twelve port industry representatives from business and from the unions. In particular: one representative for each of the categories of shipowners, industrialists, operators referred to inArticles 16 and 18 of Law No. 84/94, freight forwarders, intermodal logistic operators operating in the port, mar-itime agents and consignees, tour operators or merchants operating in the port, as designated by the most rep-resentative national trade associations; a representative of the railway operators operating in port; a represen-tative of the haulage operators operating in the logistics-port area, designated by the Central Committee of the
89

Hauliers Registry; three representatives of personnel working in port companies, as designated by the most rep-resentative nationwide trade unions, stipulators of the collective national union agreement for the port sector.These members will stay in office for 4 years, participate in the work of the Partnership Body free of charge andmay be substituted by a deputy member.This Body carries out partnership-related functions as well as consultative partnership functions of an econom-ic-social nature on all matters that are not of the exclusive competence of the President.If the Management Committee intends to deviate from the guidelines of the Body, grounds for doing so must besuitably and specifically justified, which will make the opinion expressed partially binding. The positions taken by the Partnership Body shall be adopted according to the practice of consensus, in substi-tution of that of the majority. The final orientation may therefore not reflect the will expressed by the majori-ty of members. On a practical level, this special procedure reduces the scope of opinion as it is subject toinevitable restrictions and compromises and its scope of action may be greatly reduced.
NATIONAL COORDINATION COMMITTEE OF THE PORT SYSTEM AUTHORITIES. A National Coordination Committee of thePort System Authorities is also due to be established with the task of coordinating and harmonising at thenational level the strategic decisions concerning large infrastructure investments, urban planning choices in portareas, implementation strategies of the concession policies issued by the maritime state property departmentand marketing and promotion strategies regarding the national port system on international markets.The powers given to this Committee are potentially vast and certainly strategic for the Italian port system. Itis surprising, therefore, that the law does not envisage the adoption of a specific regulation for its functioningas it does for the functioning of the Partnership Body.The representatives of trade and industrial organisations take part in the work of the National Committee onlyas invited participants and only in as much as their specific competences are relevant to matters on the agen-da due to be discussed at any particular meeting.
European Regulatory Framework for the provision of port services and common rules on financial transparency of portsAt the plenary session on 14 December 2016, the European Parliament approved at first reading the report onthe rules for ports, which the Council adopted as legislative act on 23 January 2017. On 3 March 2017, this waspublished in the Official Gazette of the European Union as Regulation (EU) 2017/352 of the European Parliamentand Council and establishes a regulatory framework for the provision of port services and common rules on finan-cial transparency of ports.This Regulation enters into force on 24 March 2017 and shall apply from 24 March 2019. In practice, the entryinto force ratifies the conclusion of the legislative process and the consequent insertion of the Regulation intothe legal system of the European Union: Member States must now fulfil the prerequisites necessary for the fullapplication of the Regulation, to take place after twenty four months. The definitive text of the Rules is the result of innumerable compromises, which have progressively reduced theinnovative scope of the measure, initially inspired by free market principles. Port services to which the Regulations apply, without prejudice to Article 10 are: bunkering; cargo-handling;mooring; passenger services; collection of ship-generated waste and cargo residues; pilotage; towage and dredg-ing (for which separate accounting is required when carried out by the managing body of the port benefitingfrom public funding).An integral part of the Regulation is the premise containing all the principle considerations, which have beentransposed into the new rules covering port services.Moreover, according to European law, a public service obligation means that imposed on the provider of a serv-ice to guarantee fulfilment in the general interest, an obligation that the provider would not undertake underthe same conditions if he were only to take into account his own business interests.
LIMITATION OF THE NUMBER OF PORT SERVICE PROVIDERS. The managing body of the port, or the competent author-ity, may limit the number of providers of port services when: there is scarcity or reserved use of land or water-side space; the absence of such a limitation is obstructing the performance of public service obligations(including when such absence leads to excessively high costs related to the performance of such obligationsfor the managing body of the port, the competent authority, or the port users); the absence of such a limita-tion runs counter to the need to ensure safe, secure or environmentally sustainable port operations; the char-acteristics of the port infrastructure or the nature of the port traffic are such that the operations of multipleproviders of port services in the port would not be possible; it has been established that a port sector or sub-sector, together with its port services carries out an activity that is directly exposed to competition in mar-kets to which access is not restricted.
SAFEGUARDING OF EMPLOYEES’ RIGHTS – SOCIAL CLAUSE. The Regulation, in its long gestation phase, felt the impactof social problems and consequently became increasingly sensitive to the need to protect the rights and safety
90

of workers, as well as their professional training. For example, Article 9 “Safeguarding of employees’ rights” provides that “staff previously taken on by the outgo-ing provider of port services shall be granted the same rights as those to which they would have been entitled ifthere had been a transfer of undertaking within the meaning of Directive 2001/23/EC”. This rule is a real swordof Damocles for users of the port service since the new supplier cannot operate a real restructuring of the serv-ice and the burden of cost of the previous contract-holder’s staff will have to be born by overheads and feescharged.
EXEMPTIONS. Article 10 of the Rules stipulates that the rules governing access to the port market shall notapply to cargo handling, passenger services or pilotage, although individual Member States may eliminate suchexemptions. All the political uncertainty shown by the Commission emerges in the encouragement by all mem-ber states to grant “the use of Pilotage Exemption Certificates, or equivalent mechanisms (e. g. VHF), in orderto improve efficiency in ports, in particular to stimulate short sea shipping” (Premise Number 39).Furthermore, the Regulation does not exclude the right of Member States to regulate service tariffs in order toavoid over-charging, in cases where the situation of the market in port services, although liberalised, is suchthat effective competition cannot be achieved (Premise Number 40).
FINANCIAL TRANSPARENCY AND AUTONOMY. “Financial relations between maritime ports in receipt of public fundsand providers of port services, on the one hand, and public authorities, on the other hand, should be made trans-parent in order to ensure a level playing field and to avoid market distortions” (Premise Number 41). In order to avoid market distortions, the managing body of the port in receipt of public funds, when it is alsoacting as a service provider, must keep accounts for publicly funded activities separate from accounts for activ-ities carried out on a competitive basis. (Premise Number 43).Furthermore, the Commission must identify which public investments in port infrastructure fall within the scopeof Commission Regulation (EU) No. 651/2014 651/2014 (General Block Exemption Regulation), taking into con-sideration the non-economic nature of certain infrastructure, including access and defence infrastructure, pro-vided that they are accessible to all potential users on equal and non-discriminatory terms (Premise Number 45).Based on these principles, the Regulation stipulates that the allocation of public funds to Port managing bod-ies, also via enterprises/public financial institutions, should be made transparent through a separate account-ing system, highlighting the aim pursued through the allocation of such funds.
PORT INFRASTRUCTURE CHARGES. According to the Regulation port infrastructure charge means a charge levied,for the direct or indirect benefit of the managing body of the port or of the competent authority, for the use ofinfrastructure, facilities and services, including the waterway access to the port concerned. In order to con-tribute to an efficient infrastructure charging system, the structure and the level of port infrastructure chargesare to be determined according to the port’s own commercial strategy and investment plans, and shall complywith competition rules. Nevertheless, depending on the economic strategy of the port or port spatial planning policy, port infrastruc-ture charges can be varied for certain categories of users or for making more efficient use of port infrastructureand in order to promote short sea shipping. The criteria for such a variation – apart from being transparent,objective and non-discriminatory – must be consistent with competition law, including rules on State aid.Moreover, this provision seems to contradict the declaration that the managing body of the port, or the com-petent authority, shall not be required to disclose differentiations in the charges that are the result of individ-ual negotiations (Premise Number 48).
Italy: tariff adjustment for pilotage servicesTowards the end of 2016, a ministerial national inquiry was held into the tariff adjustment for pilotage servic-es in Italy’s ports. The national average increase of the tariffs valid for the two-year period 2017-2018 is +0.38%,which, net of end-of-service treatment and discount for the Motorways of the Sea, reduces it by -1.47%. Thisresult is particularly appreciated as it demonstrates, at a distance of two years, the validity of the modificationsmade in 2014 to the pilotage tariff formula.Over the next two years, matters to be discussed at ministerial level include extending the VHF pilotage serv-ice, large tonnage and review of allowed spending. Solving these issues could further improve the efficiency andcost-effectiveness of the service, as has already been the case with the results achieved through the changesintroduced in 2014.In 2016, Law No. 230 on the Limitation of maritime pilots’ liability was issued; this calls for compulsory insur-ance in order to be able to pursue the profession. It is important to note that this law provides that any meas-ure governing the compulsory nature of technical-nautical services must be implemented after having obtainedthe opinions of the national trade organisations involved.
91
Italy: new legislation on dredgingThe new environmental legislation that came into force between February and September 2016, regulates dredg-ing operations in Italian ports in terms of simplifying the criteria for the construction of filling boxes and col-lecting tanks, and also concerns dredging in port areas and marine-coastal areas that are within or outside sitesof national interest (SIN), and the methods and criteria for handling dredged material, including immersion.The new legislation responds to the concerns of maritime operators who have long complained about the pro-gressive reduction in the seabed and impediment to the technological evolution that aims at increasing the sizeof ships (so-called “ship gigantism”).
Alternative fuels In order to reduce dependence on oil and mitigate the environmental impact of maritime transport, byLegislative Decree No. 257 of 2016 (which entered into force on 14 January 2017), Italy implemented EuropeanDirective 2014/94/EU on the adoption of National policy frameworks for the development of the market asregards alternative fuels in the maritime and inland transport sectors. Therefore, in order to allow the movement of liquefied natural gas (LNG)-fuelled vessels, Italy undertook to pro-vide an adequate number of LNG refuelling points by 31 December 2025 within the TEN-T network and by 31December 2030 in Ports linked to inland shipping. A plan is also envisaged for the electrification of docks in seaports within the TEN-T network and inland ship-ping ports, to be completed by December 31, 2025.
Employment on board and training
Single National Collective Labour Agreement (CCNL Unico) for the Private Sector of the Shipping IndustryOn September 15, 2016, Confitarma completed, together with Confederal Trade Union Organisations, and, for thesection regarding employment in port towing, with Assorimorchiatori and Federimorchiatori, the definitive draft-ing of the National Collective Labour Agreement for the Private Sector of the Shipping Industry, which will expireon 31 December 2017.In accordance with the provisions of the framework agreement signed on 1 July 2015 at the same time as thecontract renewal agreement, a contract was concluded that includes all national collective agreements previouslyapplied in the maritime sector, which now form the 15 Sections of the “CCNL Unico”, absorbing the modifica-tions and innovations introduced by the July 2015 and subsequent agreements as well as completing the workof simplifying and rearranging the CCNL.In accordance with the provisions of the Maritime Labour Convention 2006, Confitarma has also compiled anEnglish language version of a number of the sections of the CCNL.
Reforming the employment of seafarersOn November 17, 2016, Confitarma, Fedarlinea, Filt-CGIL, Fit-CISL and Uiltrasporti signed a Joint Announcementproposing to establish a more efficient and modern system for the placement of seafarers on the basis of thefollowing principles: establishment of an efficient National Seafarers’ Registry database in anticipation of thephasing out of the “general shift”; direct employment of the maritime worker; the elimination of the issuing ofthe embarkation vouchers and related economic contribution; maintenance of all the provisions and safeguardsprovided for in the Special Shift Regulations provided by the CCNL of 1 July, 2015; authorization procedure formanning agencies for carrying out their activities, in accordance with the Maritime Labour Convention 2006.In order to initiate a technical committee at ministerial level and finally complete the employment reform envis-aged by Presidential Decree No. 231 of 2006, but never implemented, the Joint Announcement was sent to theMinistry of Infrastructure and Transport.
The Solimare Fund On January 12, 2016, the Board of Directors of the Bilateral Maritime Solidarity Fund (Solimare), which is com-posed of one representative of the Ministry of Labour and Social Policy, one from the Ministry for the Economyand Finance, and ten experts, five designated by the National Secretariats of confederal Trade Unions and fivedesignated by the Employers’ Associations (three from Confitarma, one from Fedarlinea and one from Fede-rimorchi). The Committee elected a representative of Confitarma as Chairman.Despite the contributions paid by shipping companies and their employees, which began in June 2016 with re-troactive effect since March 2014 by provision of the Ministry of Labour and Social Policy, during the year the Fundfailed to provide benefits because of a provision included in the 2015 inter-ministerial decree for the establish-
92
ment of the Fund, whose essence of solidarity is thus undermined. The Fund cannot pay out to any company morethan the amount of contributions paid in during the quarter preceding the one in which a claim is submitted.Following repeated requests by Confitarma, the Ministry of Labour and Social Policy shared the need to amendthe provision and therefore called on the social partners in the Solimare Fund to sign a union agreement. On 9September, 2016 Confitarma with Assorimorchiatori, Federimorchiatori, Fedarlinea, Filt-CGIL, Fit-CISL andUiltrasporti, concluded a union agreement that proposes the replacement of the above criterion with a new,much more flexible provision that limits the ordinary benefit provided by the Fund in proportion to the ordinarycontributions paid by the individual employer.Having obtained the favourable opinion of INPS on the sustainability of the proposed amendment, we are nowawaiting the signature of the two competent ministries and the subsequent verification of legitimacy by theCourt of Auditors before its final publication in the Official Gazette.
Maritime Labour Convention 2006 Confitarma has long underlined the need to implement the “2014 Financial Security Amendments” to theMaritime Labour Convention 2006, which entered into force on 18 January, 2017, recognizing the insurance cov-erage guaranteed by the P&Is.The Ministry of Infrastructure and Transport, in agreement with the Ministry of Economic Development, beganan in-depth study of the procedures for recognition of the insurance institutions that will have to guarantee thiscover and, awaiting the outcome of the study and availing of the opportunity provided by Article XV of theMaritime Labour Convention, notified the International Labour Organization (ILO) of the decision to postponethe entry into force of these regulations until 18 January 2018.At the request of Confitarma, the Italian Coast Guard notified the Secretariats of the various MoUs and the mainforeign Coast Guard Agencies of this deferment in order to avoid any problems for Italian flag state vessels dur-ing Port State Control (PSC) inspections.
Education and Training TECHNICAL-SCIENTIFIC COMMITTEES OF TRANSPORT AND LOGISTIC TECHNICAL INSTITUTES. Confitarma wants to promote bet-
ter quality training, providing knowledge and functional skills that reflect the actual needs of shipping compa-nies in order to improve employment opportunities for young people who want to embark on a maritime career.To this end, Confitarma has been asking the Technical Transport and Logistics Institutes throughout Italy tonominate representatives for the Technical-Scientific Committees (CTS). To date, 14 Nautical Institutes haveresponded to the request.Albeit with ups and downs, depending on the actual involvement of the CTSs in preparation of training pro-grammes by the Institutes, Confitarma’s representatives are working to improve the quality of the teaching pro-vided by schools and training agencies, by promoting school-work alternation and bringing teachers with a busi-ness world background into the classroom to share their field experience and enable pupils to enrich their train-ing and skills. In order to incorporate marine environment protection matters into the school curriculum, Confitarma is alsoconsidering the possibility of collaborating with Associations such as Marevivo.
TRAINING FOR OFFICERS WHO CARRY OUT MANAGEMENT FUNCTIONS. At the end of 2013, in order to close an infringe-ment procedure by the European Commission, a decree issued by the Italian Coast Guard was introduced intoItalian legislation obliging masters, engineers and first officers to participate in management training courses(300 hours for Deck staff and 570 hours for Engineering staff).In the latter part of 2016, the delicate issue came to the fore after the Ministry of Infrastructure and Transportclarified that the course is also necessary for the renewal of the competence certificate of officers already inpossession of this qualification and who had hitherto been excluded from this obligation.Warned by Confitarma about the difficulties that immediate application of this obligation would generate at anoperational level, the Ministry sanctioned a moratorium to allow seafarers whose competence certificates expirein 2016 and 2017 to complete courses by 31 December 2018.Moreover, a ministerial level discussion table was established to review the situation and alleviate the impactof this obligation as much as possible. As a result, the Ministry of Infrastructure and Transport is willing toremodel the current training programmes and required attendance, taking into account the certified competencesand skills of masters, engineers and first officers, and to investigate the feasibility of carrying out the coursesvia more innovative means (e. g. e-learning).On 1 February 2017, Confitarma and Fedarlinea with Filt-CGIL, Fit-CISL and Uiltrasporti (and subsequently alsowith USCLAC-UNCDIM and UGL), signed a three-point Joint Proposal that has in the main been accepted by theMaritime Administration, which – changing its original position – provides that:– Officers who obtained the Certificate of Competence (CoC) at a management level before 1 February 2002 are
93
exempted from the obligation to complete the course and the examination; – Management officers who are already licensed but are not exempt from the obligation to take the course onthe basis of point 1 above, can sit the examination directly to prove possession of such competences. Passingthe examination will exempt such officers from the obligation to attend the course; – those who are already in possession of management officer certification but who are not exempt on the basisof the previous two points, can take the courses using the e-learning, system, greatly reducing classroom time.
HIGHER TECHNICAL INSTITUTES (ITS). Courses continued in 2016 at the Higher Technical Institutes (ITS), aimedat training officer cadets and preparing them for the qualifying exam to become future officers in the merchantnavy. With the financial support of the National Maritime Fund, educational and training programmes have beendeveloped in close cooperation with leading shipping companies associated with Confitarma, incorporatingteaching staff belonging to company technical services and alternating classroom theory with work experience.
ITALIAN MERCHANT MARINE ACADEMY FOUNDATION, GENOA. In 2016, the Italian Merchant Marine AcademyFoundation, Genoa, saw 761 candidates for the Deck section, of which 92 were accepted and 259 candidates forthe Engineering section, of which 71 were accepted. Overall, there was an increase of 26 students compared to2015, mainly from Sicily and Liguria. In total, 1,381 officer cadets have entered the Academy since 2005 (824Deck and 557 Engineering).Once again in 2016, the Academy Foundation organized an “alignment” course module open to students withdiplomas who had not attended nautical institutes or maritime technical institutes and selected 20 students,whose number was added to the 140 other students over the previous five years. Additionally, 25 students areattending a course for “Superior Logistics Technician”.Most of the Academy students embark on ships belonging to companies affiliated with Confitarma.
HIGHER TECHNICAL INSTITUTE FOR SUSTAINABLE MOBILITY OF THE “GIOVANNI CABOTO” FOUNDATION. Established in July 2010for the training of both professional and logistical sector seafarers on oil, gas and chemical tankers, bulk carri-ers and general cargo ships, the Higher Technical Institute for Sustainable Mobility of the “Giovanni Caboto”Foundation in Gaeta in 2016 was able to offer 16 courses, involving a total of 216 Officer Cadets, of which 114are Deck Officer Cadets and 102 Engineering Officer Cadets.In 2016, 22 Deck Officer Cadets and 19 Engineering Officer Cadets obtained their final diploma from theInstitute. A number of these cadets, who were able to obtain the qualification of Navigation Officer early, havebeen embarked as Third Officers but most, due to the introduction of the new legislation and the considerabledelay in the publication of the announcements, are waiting to sit the exams for the professional qualification,having, nevertheless, received firm recruitment offers from the shipping companies.
ADRIATIC NAUTICAL ACADEMY FOUNDATION. Established in September 2015, the Adriatic Nautical AcademyFoundation in Trieste operates as a Higher Technical Institute for sustainable mobility. After launching the train-ing course for 10 Deck Officer Cadets and 10 Engineering Officer Cadets for cargo ships and ro-ro, vessels in2015, in 2016 the Officer Cadet course was run once again and a higher technical course for information mobi-lity and logistics infrastructure was inaugurated with 22 students. Approximately 60 students attend the threeactive courses for senior technicians. In 2018, the first 20 Deck and Engineering Officer Cadets will be awardedtheir final diplomas.
Protection of marine environment and safe navigation
Confitarma is dedicated to the main issues of the environment and shipping safety and, at international level,follows the work of the two IMO (International Maritime Organization) committees, Maritime Safety Committee(MSC) and Maritime Environmental Protection Committee (MEPC). At European level, Confitarma is involved incommittees and working parties at the European Community Shipowner’s Association (ECSA) and theInternational Chamber of Shipping (ICS) and, on a national level, works closely with the VI Unit of the ItalianCoast Guard and with the other organisations, such as the Italian Petroleum Union, to examine common issuesand outline potential future scenarios.
Ballast waterEven though the Ministry for the Environment and the Protection of the Land and Sea has announced that pro-cedures have begun, Italy has not yet ratified the Ballast Water Management Convention (BWMC), which willenter into force on 8 September 2017.This deadline certainly will not be changed when the IMO Maritime Environmental Protection Committee nextmeets in July 2017; however, there are still many uncertainties about the decisions that can be made regardingthe date of installation of ballast water treatment plants.
94

For new constructions (according to MEPC amendments 69), installation must be carried out before delivery. For existing ships, according to the MEPC 69 approved amendments, installation should take place at the firstrenewal of the International Oil Pollution Prevention (IOPP) Certificate shortly after the BWMC enters into force.But should the amendments proposed by Intertanko be approved, for IOPP certificates expiring between September2017 and September 2019, installation should take place at the second renewal and for IOPP certificates expiringafter September 2019, installation should take place at the first renewal, post entry into force of the Convention.In any case, these amendments will be valid only after the entry into force of the BWMC. After 8 September 2017,all existing vessels must nevertheless have “ballast water exchange” as provided by the Convention.Shipowners’ understandable concern about the reliability of the equipment approved by the IMO has led to a“backlog” in the search and/or installation of the treatment facilities required. As the BWMC currently requiresinstallation of water treatment plants at the first renewal of the IOPP certificate after 8 September, the ship-ping industry is asking the Ministry for the Environment to “break down” renewal inspections in order to havethe certainty of sufficient time to comply in the best way possible with the regulation. On 6 April 2017, duringa meeting with all interested parties, Confitarma delivered a document summarising the problem and the needsof the shipowners and received positive signals regarding readiness to dialogue. On 15 May 2017, the Ministriesfor the Environment and Infrastructure and Transport released notification authorizing Recognized Organisationsto issue IOPP certificates before 8 September 2017, if requested, on the condition that the expiry date shouldbe no later than 28 September 2020 (which coincides with the obligation to install treatment systems comply-ing with the new G8 guidelines issued by IMO).The scenario in North America causes particular concern; recently, the US Coast Guard, applying different crite-ria from those of the BWMC, has given approval to only certain types of system.
Emissions The implementation of Regulation 2015/757 of the European Parliament and of the Council on the monitoring,reporting and verification of carbon dioxide emissions from maritime transport, which entered into force on 1July 2015, completes the first phase of The European Commission’s strategy for reducing greenhouse gas emis-sions from ships. Therefore, shipping companies will have to submit to the verifiers a monitoring plan by 31August 2017 and, from 1 January 2018, will have to monitor CO2 emissions for each ship on a per-voyage andan annual basis by applying the appropriate method for determining CO2 emissions. During 2016, Confitarma worked with the Ministry for the Environment and the Protection of the Land and Seaand contributed during EU consultations on the implementation of the Regulations.On 14 February 2017, the European Parliament approved plans to boost greenhouse-gas emission curbs throughthe EU carbon market (EU ETS), so as to bring EU climate policy into line with the aims of the Paris agreement.The majority of MEPs voted to include maritime transport in the scheme from 2023, if by 2021 no comparablesystem operating under the IMO comes into existence. This means that CO2 emissions in EU ports and duringvoyages to and from them should be accounted for. MEPs propose setting up a “maritime climate fund” to com-pensate for maritime emissions, improve energy efficiency, facilitate investment in innovative technologies andreduce CO2 emissions. The ECSA and ICS, showing aversion and disappointment towards the European Parliament decision, believe thiswill put unrealistic pressure on the IMO with regional measures that will gravely hurt a global sector like ship-ping and do very little for climate. Moreover, according to European shipowners, this decision makes it more dif-ficult to reach an effective and timely global agreement within the IMO. In fact, a special EU regulation in anintegrated sector such as maritime transport puts the results of IMO negotiations with important third countriessuch as the USA, China, Brazil and India, which have all collaborated, at risk.
Fuel OilDuring the October 2016 session, IMO MEPC 70, while taking into account data from an independent study com-missioned by BIMCO and the reservations raised by many member countries, confirmed the entry into force ofthe 0.5% limit to sulphur content of fuel oil in all parts of the world as from 1 January 2020, as provided forin Annex VI (Revised) to the MARPOL 73/78 Convention.Up to 1 January, 2020, there are therefore basically three limits for maximum sulphur content in marine fuels:3.5%, (“global limit”) in all seas of the world; 1.5% for cruise liners and passenger vessels between Communityports in territorial waters and in ZPEs; 0.1% in Emission Control Area (ECA) designated by the IMO and inCommunity ports With the changes introduced by Community Directive 2012/33/EU, which essentially aligns thelimits of European legislation with those set out in Annex VI to MARPOL 73/78, from January 1, 2020 the lim-its will be reduced to two: 0.50% global and 0.1% in ports and in ECA areas. Although in some respects there will be a simplification, it seems that 0.5% fuel, whose characteristics are beingdefined by the ISO, will have a higher cost because we’re no longer talking about residual but rather a heavy
95

distillate requiring large desulphurisation plants that use a lot of hydrogen and necessitate the elimination ofmetals and asphaltenes. For some time, exhaust gas treatment plants, scrubbers, which reduce emissions if high sulphur fuel is used,were talked about. However, shipowners who strategically choose this solution are now beginning to look intothe issues related to their use, not least sludge.
Exhaust smoke from ships in Civitavecchia Exhaust gases emitted by cruise ships and ferries, seen in the context of the pollution of urban areas close tomany ports, are often associated and confused with sulphur oxide (SOx) and nitrogen oxide (NOx) emissions.There is, however, no link between fuel sulphur content and the smokiness of exhaust fumes. Furthermore, thechange to marine fuel with a sulphur content of 0.1%, apart from causing a number of operating difficulties andrisks to shipping safety, does not in any way affect smoke density. This complicates the issue as SOx and NOx emissions are regulated by specific Community and international stan-dards (Annex VI to MARPOL 73/78) whereas there is no regulation for the fumes of ships produced by dieselengines, especially during manoeuvring.The voluntary agreement signed for the first time in 2007 by which 41 cruise liners undertake to using low sul-phur fuels when entering Venice Maritime Station was renewed in Venice in March 2017. Despite a special ordi-nance issued in Naples in 2015 to impose the use of this type of fuel during harbour approach, the situation isunresolved. In April 2017, Confitarma worked with the Maritime Authority in order to assess the possibility of avoluntary agreement like the one adopted in Venice for the Port of Civitavecchia, where specific and enduringproblems have long sought a solution.
Permanent Group for Shipping Safety of the VI Unit In 2016, Confitarma continued to work with the Italian Coast Guard, participating in the systematic and prof-itable work of the Permanent Group for Shipping Safety of the VI Unit, comprising officers from the ShippingSafety Office along with representatives from RINA, BV, and DNV-GL, Confitarma and Fedarlinea. The technicalpanel aims to support the Maritime Administration in drafting application/explanatory circulars and in the prepa-ration of responses to specific requests submitted (exemptions, difficulties in meeting new regulations, etc.) aswell as contributing to the review of existing legislation. This Working Group has produced several circulars, such as those on the use of containerized generator sets andengine exhaust gas cleaning systems, as well as regulating the International Safety Management Code (ISM) inItaly. In 2016, Confitarma, in cooperation with the VI Unit and the MIT, initiated contacts with the Ministry forEconomic Development with the aim of simplifying the procedure for ship radio inspections overseas, which aretime-consuming, costly and require significant managerial outfitting commitment.During the year, Confitarma worked on a number of Italian Association of Naval Technology (ATENA) eventsaimed at spreading maritime culture, offering updates on technical themes and discussing problems concerningall aspects of naval and maritime business. Particularly successful was the workshop about the InternationalConvention for the Control and Management of Ships’ Ballast Water (BWMC), which focused on issues regardingthe installation of treatment systems and their use.
Radio CertificatesConfitarma’s impetus regarding inspections for the issuing of radio certificates has achieved a significant result.The meeting of 10 February 2017, promoted by Confitarma, with representatives of the Ministries of EconomicDevelopment (MISE) and Infrastructure and Transport (MIT) and the VI Unit of the Italian Coast Guard, whilstupholding the shared view that a complete revision of the existing legislation is necessary, concluded that,during annual inspections to be carried out over a three-month period, the MISE will evaluate the possibilityof extending certificate validity to five years and, in special cases, delegate to the three recognized organiza-tions (RINA, BV, and DNV-GL). A technical panel to carry out an in-depth survey into the matter is also due tobe set up.
96

Confitarma – The Organisation
Heir to traditional associations of shipowners and shipping entrepreneurs dating back to 1901, CONFITARMA,today, is the foremost Italian shipping industry association and represents almost the whole of the nation’s mer-chant fleet, shipping companies and groups operating in freight and passenger transport, cruises and auxiliarytraffic services. CONFITARMA objectives include the promotion of the development of the Italian merchant marine as part of apolicy that leverages maritime transport, managing the representation and protection of the Italian shippingindustry and shipping companies in relations with institutions and administrations, as well as with economic,political, social and trade union bodies. The functions of Confitarma include stipulating trade union and eco-nomic agreements, as well as collective labour contracts; representing and protecting its members in relation-ships with trade unions and in matters of general and special economic interest and providing information andassistance to members about regulatory, economic and social issues, both at the national and international level,especially in the fields of development, environment and energy, infrastructure and logistics, tourism, businessculture, the labour market and training. CONFITARMA is a member of Italian General Confederation of Industry CONFINDUSTRIA and is directly repre-sented in the CNEL (National Council for Economy and Labour). Furthermore, it is one of the founders and majorcontributors to the Federation of the Italian Maritime System (Federazione del Sistema Marittimo Italiano),which represents the Italian maritime cluster, and is also a member of the European Network of Maritime Clusters(ENMC), and the Italian Institute of Navigation (IIN). Internationally, CONFITARMA belongs to: ECSA – European Community Shipowners’ Associations; ICS/ISF – Inter-national Chamber of Shipping/International Shipping Federation; BIMCO – Baltic and International MaritimeCouncil; INTERTANKO – International Association of Independent Tanker Owners; INTERCARGO – InternationalAsso-ciation of Dry Cargo Shipowners; IMEC – International Maritime Employers’ Committee Ltd, and collaborateswith: IMO – International Maritime Organization and ILO – International Labour Organization.CONFITARMA is based in Rome.
Young ShipownersThe Young Shipowners Group was established in 1995 in compliance with the Confitarma’s Statute, with the fol-lowing purposes:– promoting awareness of the ethical and social role of free enterprise and the resulting entrepreneurial responsibilities;– exploring broader strategic topics related to the shipping industry and the maritime system as a whole; contributing to a constant adaptation of Confitarma to the new demands of the shipping industry, with regard –to the dynamics of the economic and social context; – encouraging the training of new management recruits to shipping companies and related membership activities.The group comprises over 60 members, including shipowners, sons of shipowners, managers and employeesdirectly engaged in the enterprises represented by Confitarma and coming from about 50 member companies.The Young Shipowners are actively involved in the life of the Confederation: the president is a statutory mem-ber of the Board and the Executive Committee of Confitarma; the members of the Board participate in theAdvisory Committees on issues related to the shipping industry and the maritime system.The Young Shipowners also participate assiduously in the working groups of the ECSA. In May, Young Shipowners, together with the multinational Ardent and Banchero Costa, organized a seminarentitled: “Maritime salvage – Operational and contractual aspects, media management”. The event, open to allmembers, spanned a number of sessions, which were entrusted to international experts and which dealt with thespecific subjects of management of rescue operations, contractual aspects and media relations in the manage-ment of maritime emergencies through theory, case studies, simulation and role play.At the end of June, during the Naples Shipping Week, the GGA with other young representatives of the maritimecluster organised a conference at which leading Italian shipowners described their early careers and stressed therole of the younger generation within companies, a generation which then reiterated a commitment to contin-ued growth and exchange. In December, at the year-end Meeting, Young Shipowners, in collaboration with the Young Agents of Federagentiand Youngship Italia, organised a seminar on the current macro-economic context (Brexit, American elections,Brics and new emerging economies) and an analysis of maritime markets (freight, commodities, shipbuilding)with guest speakers Beniamino Quintieri, SACE Chairman, Sissi Bellomo, journalist Il Sole 24 Ore, and EnricoPaglia, Bancosta Research.The Young Shipowners also hold lectures and participate in teaching activities in training institutes, such as theInstitute for Research and Educational Activities (IPE), as well as offering university students from Engineeringand Economics faculties brief periods of work experience in their shipping companies.
97
SedeHead Office
Piazza SS. Apostoli, 6600187 Roma
Tel. 0039 06 674811e-mail: [email protected]
www.confitarma.it
Progetto grafico e stampa
Teseo EditoreVia Amerigo Vespucci, 41
00153 RomaTel. 0039 06 5744679
Mobile 0039 335 5467264www.teseoeditore.it