Arianna Latini corso 11-10-18 - scoope.eu · with a production capacity of 500 ton/day. ... 2 di...
25
1 11/10/18 Company Logo Corso “Le coltri vegetali per l’efficienza energetica degli edifici: risutlati attività ENEA” ENEA Casaccia, 11 ottobre 2018 I risultati del progetto SCOoPE Arianna Latini
Transcript of Arianna Latini corso 11-10-18 - scoope.eu · with a production capacity of 500 ton/day. ... 2 di...

1 11/10/18
!!
Company Logo
Corso “Le coltri vegetali per l’efficienza energetica degli edifici: risutlati attività ENEA”
ENEA Casaccia, 11 ottobre 2018
I risultati del progetto SCOoPE
Arianna Latini

2 11/10/18
https://www.youtube.com/watch?v=R9BJnULnuCE&feature=youtu.be

3 11/10/18

4 11/10/18
ENEA roles in SCOoPE
• Expert on THERMAL PROCESSES (thermal KPIs, webinars on thermal energy and related topics, etc.)
• Expert on FRUIT & VEGETABLES processing sector
• Leader of WP4 – Collaborative Energy Management
ENERGY
FOOD PROCESSES
• Orange juice • Fruit juices • Fruit purées • Tomato concetrates

5 11/10/18
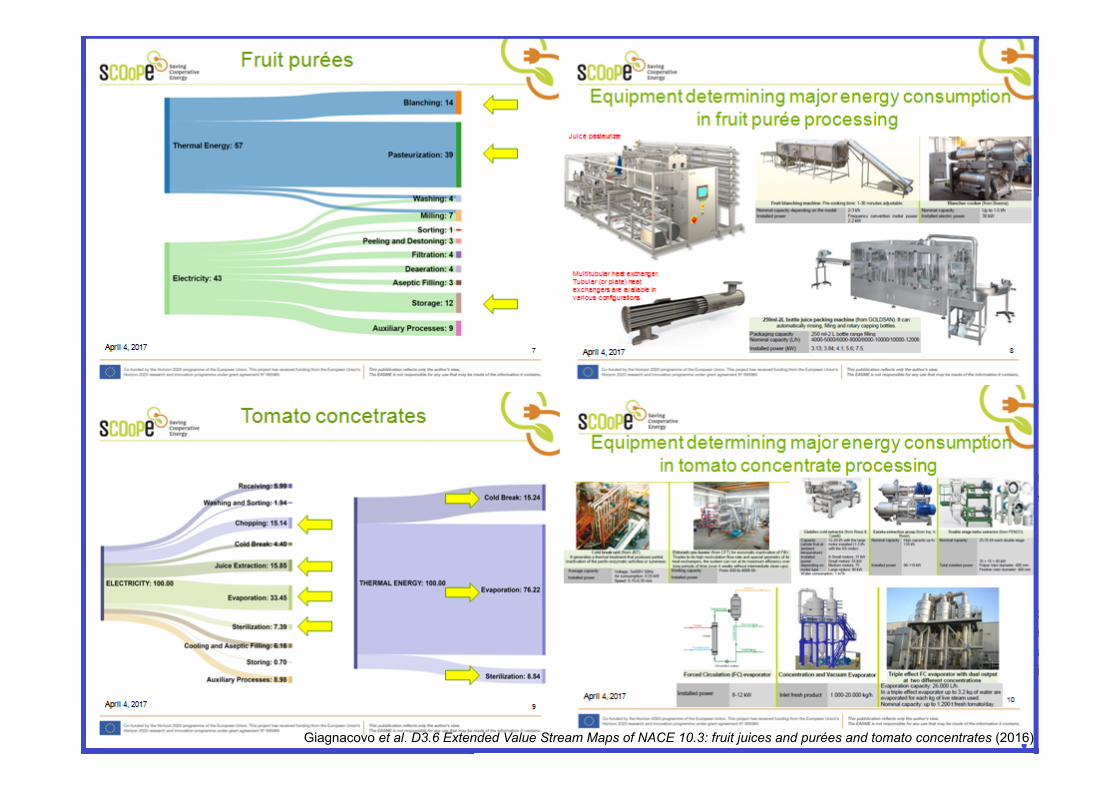
Giagnacovo et al. D3.6 Extended Value Stream Maps of NACE 10.3: fruit juices and purées and tomato concentrates (2016)
6 11/10/18 April 4, 2017
Giagnacovo et al. D3.6 Extended Value Stream Maps of NACE 10.3: fruit juices and purées and tomato concentrates (2016)

7 11/10/18
Current Value Stream Map for an exemplary plant processing triple concentrate tomato paste with a production capacity of 500 ton/day. In this situation, plant capacity is about 20 ton/hour; yearly operative working days are 150; operative working shifts are 3 per day, 8 hours each. About 300 L of drinking water (60 m3/h) are consumed for receiving and washing processes. Kaizen burst icons are used to highlight improvement needs at specific processes that are critical to achieving the future state map of the value stream.
Triplo concentrato di pomodoro
Latini et al. Open Access J Agric Res (2017)

8 11/10/18 April 4, 2017
Scheme of the thermal energy KPIs in the dairy sector, according to the four levels, which are – starting from the lower to the upper level – the following: industry level, product level, process level, and equipment level. In the scheme, only thermal processes of a production line are considered. For most of these KPIs, there is the “average KPI” version and the “best KPI” version.
Thermal KPIs in DIARY sector
Latini et al. D2.2 Thermal KPIs (2016)
9 11/10/18 April 4, 2017
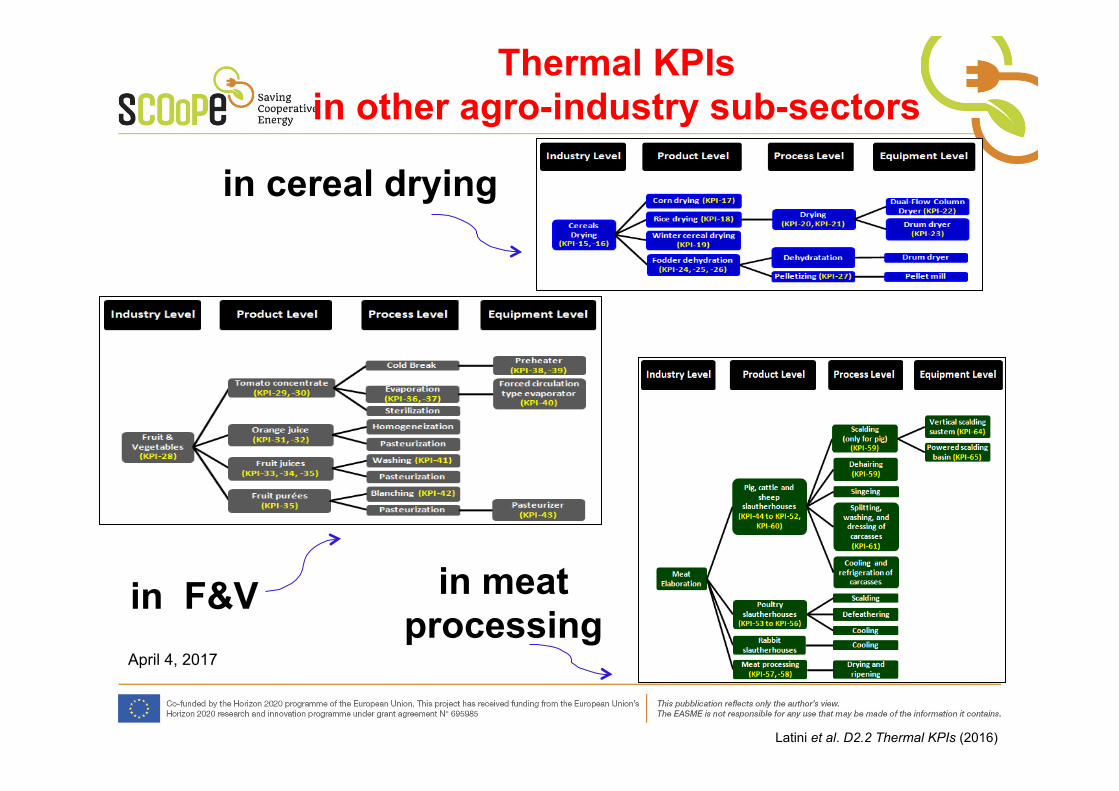
Thermal KPIs in other agro-industry sub-sectors
Latini et al. D2.2 Thermal KPIs (2016)
in meat processing
in F&V
in cereal drying

10 11/10/18
INDICATOR Thermal best KPI-‐3: Average thermal energy consump@on in kWh per L of raw milk transformed into pasteurized milk and/or semi-‐skimmed milk.
Sector (NACE code) 10.5 Subsector Dairy (milk) Level of indicator Product level (pasteurized milk and semi-‐skimmed milk)
Dairy industries require thermal energy for steam and hot water generaBon, and, generally, thermal energy consumpBon is higher than the electrical one. Milk producBon requires less energy per tonne than cheese producBon. White and flavoured milk manufacturing industries producing market milk use thermal energy mainly for homogenizaBon and pasteurizaBon, and also for cleaning and disinfecBon.
Thermal or electrical process Thermal processes Energy source Thermal energy from fossil fuels including coal, oil, natural gas and LPG.
Only a small number of plants supplement fuel with biogas. Descrip@on of the indicator This indicator refers to the average total thermal energy consumed by a milk
processing industry for fluid white milk producBon.
Upper level Industry level (dairy) Lower level Process level (white milk producBon processing) Associated variables Unit kWh/L
(kilowaM hour thermal energy consumed per litre of raw milk intake)
Name T bKPI L2 N3
Total thermal energy consumpBon is related to the raw milk intake, that is the milk entering the processing plant.
Source Elaborated from “Eco-‐efficiency for Dairy Processing Industry – Dairy Australia 2004”.
Best or average KPI Best KPI Value
0,110-‐0,170 kWh/L raw milk intake 110-‐170 kWh/m3 raw milk intake 0,4-‐0,6 GJ/m3 raw milk intake
INDICATOR Thermal average KPI-‐3: Average thermal energy consump@on in kWh per L of raw milk transformed into pasteurized milk and/or semi-‐skimmed milk.
Sector (NACE code) 10.5 Subsector Dairy (milk) Level of indicator Product level (pasteurized milk and semi-‐skimmed milk)
Dairy industries require thermal energy for steam and hot water generaBon, and, generally, thermal energy consumpBon is higher than the electrical one. Milk producBon requires less energy per tonne than cheese producBon. White and flavoured milk manufacturing industries producing market milk use thermal energy mainly for homogenizaBon and pasteurizaBon, and also for cleaning and disinfecBon.
Thermal or electrical process Thermal processes Energy source Thermal energy from fossil fuels including coal, oil, natural gas and LPG. Only a
small number of plants supplement fuel with biogas. Descrip@on of the indicator This indicator refers to the average total thermal energy consumed by a milk
processing industry for fluid white milk producBon.
Upper level Industry level (dairy) Lower level Process level (white milk producBon processing) Associated variables Unit kWh/L
(kilowaM hour thermal energy consumed per litre of raw milk intake)
Name T aKPI L2 N3
Average total thermal energy consumpBon is related to the raw milk intake, that is the milk entering the processing plant.
Source Elaborated from “Eco-‐efficiency for Dairy Processing Industry – Dairy Australia 2004”.
Best or average KPI Average KPI Value
0,195-‐0,250 kWh/L raw milk intake 195-‐250 kWh/m3 raw milk intake 0,7-‐0,9 GJ/m3 raw milk intake
Thermal KPI-3: Thermal energy consumption in kWh per L of raw milk transformed
into pasteurized milk and/or semi-skimmed milk.
Average KPI value Best KPI value

11 11/10/18
SCOoPE proposes a ground-breaking Collaborative Energy Management experiment.
What is Collaborative Energy Management (CEM)?
It’s a trial of joined-up cooperation between a number of cooperatives (cluster) developing an experimental platform for
Collaborative Energy data Management, resulting in an increase of Energy Efficiency and in a reduction of energy consumption and/or
energy costs.
Local energy operators (Key Actors) will play a crucial role in the set-up of this joint initiative. Together with energy providers, they
could maximizing utility savings with energy rebates and incentives.
COLLABORATIVE ENERGY MANAGEMENT (WP4 of SCOoPE Project)
12 11/10/18
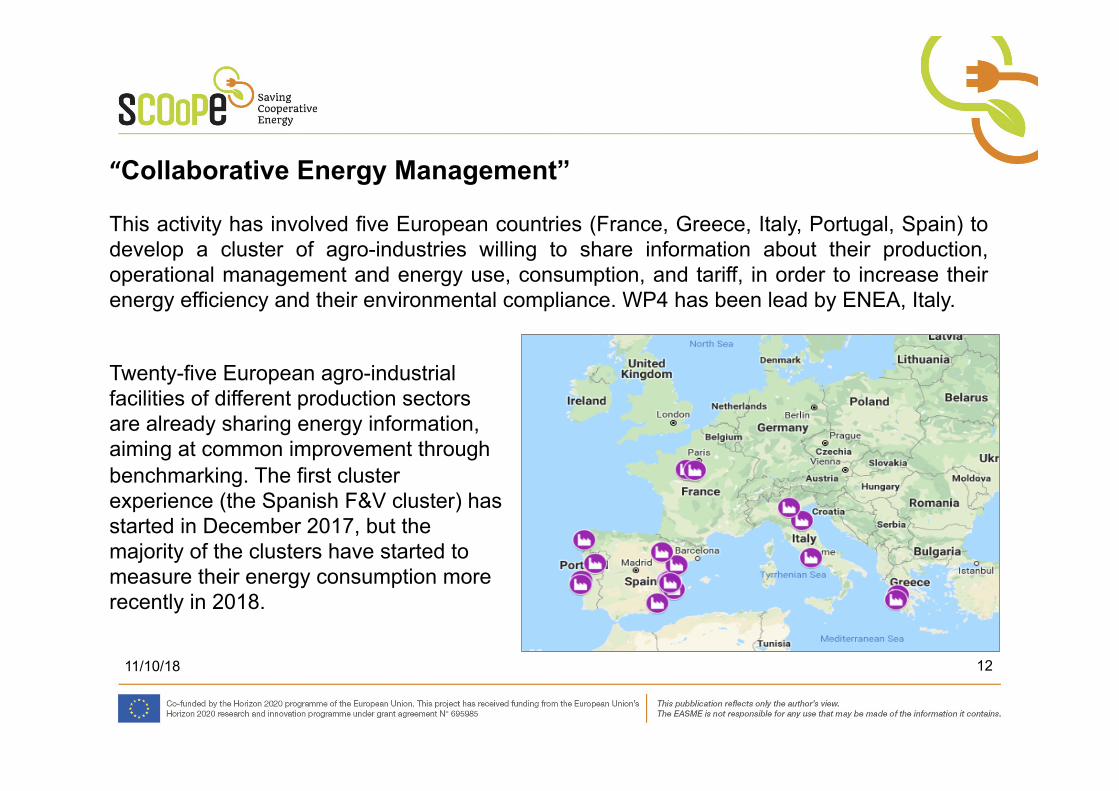
“Collaborative Energy Management” This activity has involved five European countries (France, Greece, Italy, Portugal, Spain) to develop a cluster of agro-industries willing to share information about their production, operational management and energy use, consumption, and tariff, in order to increase their energy efficiency and their environmental compliance. WP4 has been lead by ENEA, Italy. Twenty-five European agro-industrial facilities of different production sectors are already sharing energy information, aiming at common improvement through benchmarking. The first cluster experience (the Spanish F&V cluster) has started in December 2017, but the majority of the clusters have started to measure their energy consumption more recently in 2018.
13 11/10/18
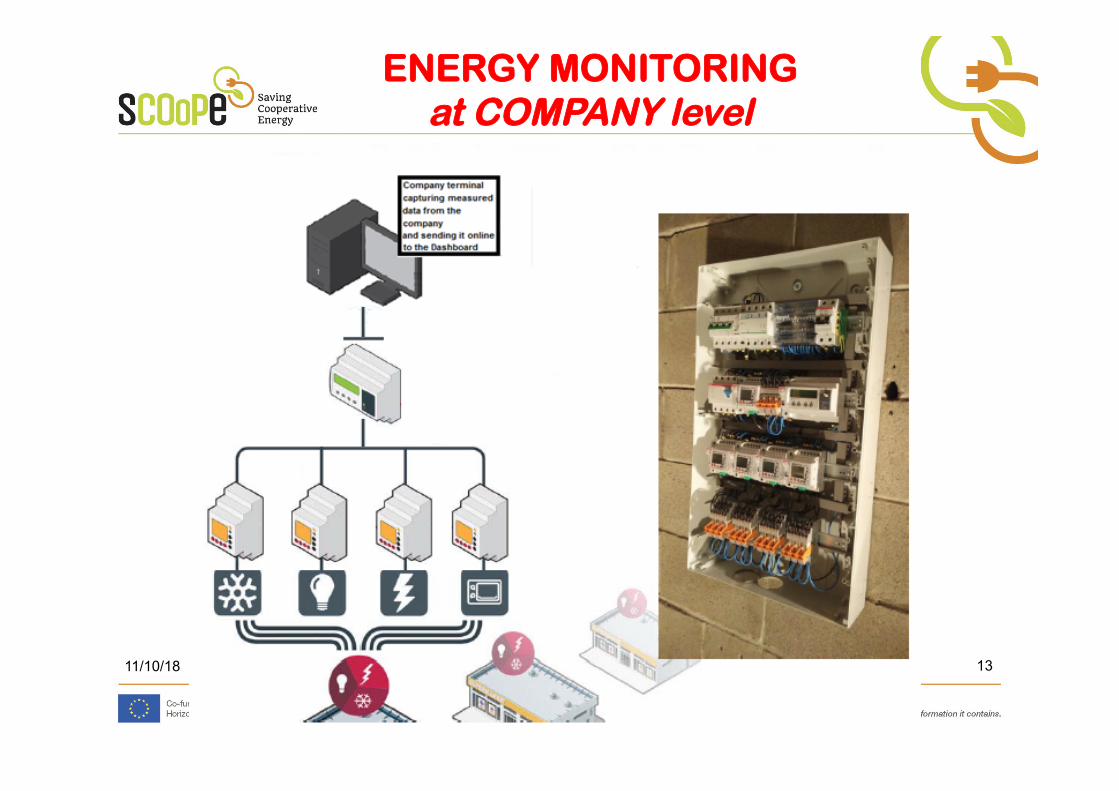
ENERGY MONITORING at COMPANY level

14 11/10/18
ENERGY MONITORING at CLUSTER level
15 11/10/18
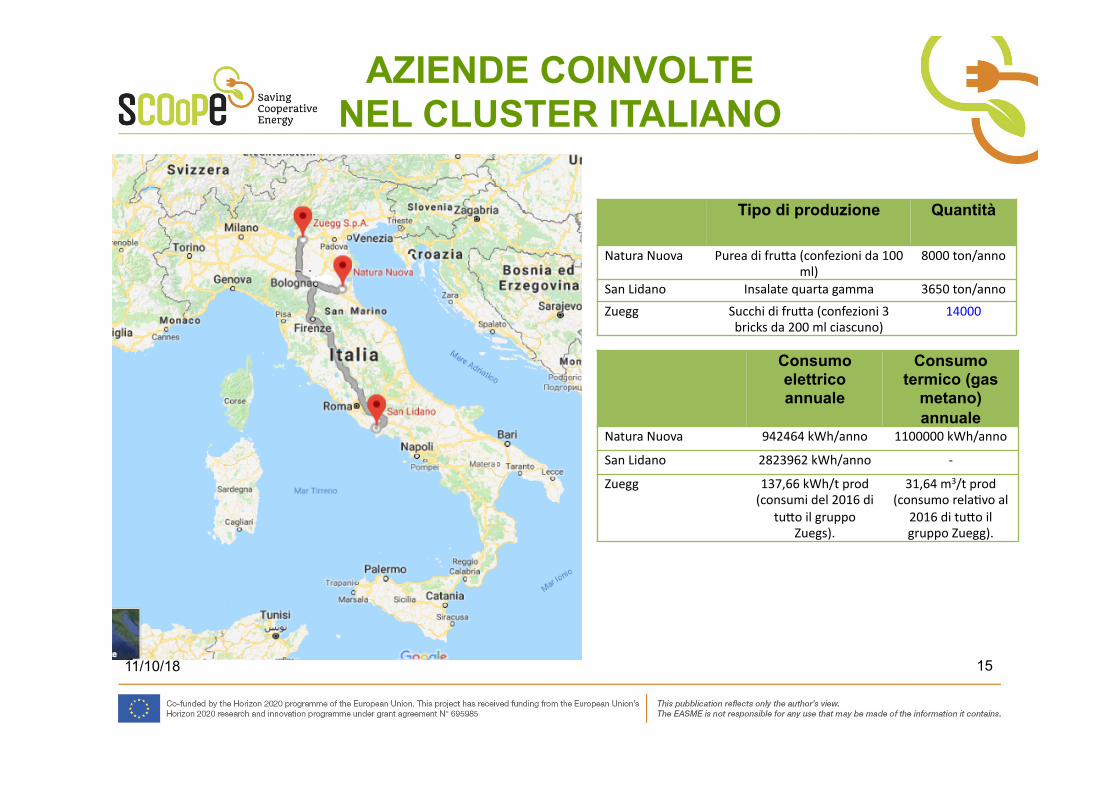
AZIENDE COINVOLTE NEL CLUSTER ITALIANO
Tipo di produzione Quantità
Natura Nuova Purea di fruMa (confezioni da 100 ml)
8000 ton/anno
San Lidano Insalate quarta gamma 3650 ton/anno Zuegg Succhi di fruMa (confezioni 3
bricks da 200 ml ciascuno) 14000
Consumo elettrico annuale
Consumo termico (gas
metano)annuale
Natura Nuova 942464 kWh/anno 1100000 kWh/anno
San Lidano 2823962 kWh/anno -‐
Zuegg 137,66 kWh/t prod (consumi del 2016 di
tuMo il gruppo Zuegs).
31,64 m3/t prod (consumo relaBvo al
2016 di tuMo il gruppo Zuegg).
16 11/10/18
!!
16
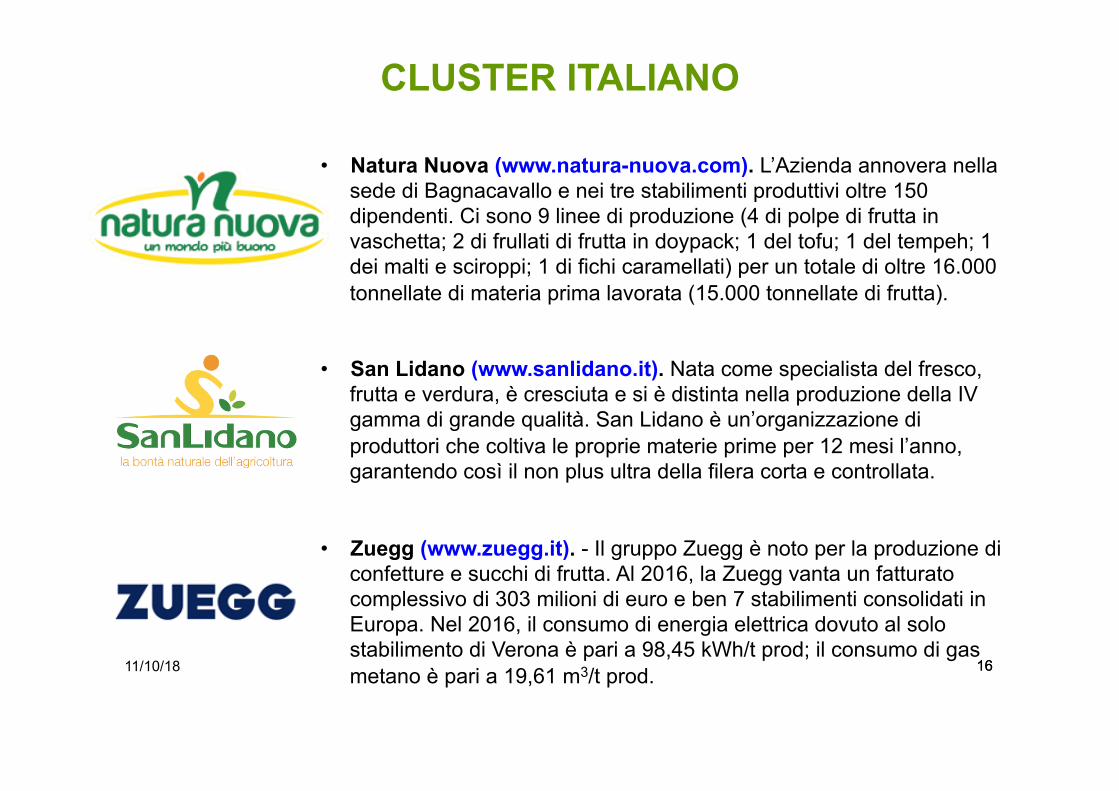
• Natura Nuova (www.natura-nuova.com). L’Azienda annovera nella sede di Bagnacavallo e nei tre stabilimenti produttivi oltre 150 dipendenti. Ci sono 9 linee di produzione (4 di polpe di frutta in vaschetta; 2 di frullati di frutta in doypack; 1 del tofu; 1 del tempeh; 1 dei malti e sciroppi; 1 di fichi caramellati) per un totale di oltre 16.000 tonnellate di materia prima lavorata (15.000 tonnellate di frutta).
• San Lidano (www.sanlidano.it). Nata come specialista del fresco, frutta e verdura, è cresciuta e si è distinta nella produzione della IV gamma di grande qualità. San Lidano è un’organizzazione di produttori che coltiva le proprie materie prime per 12 mesi l’anno, garantendo così il non plus ultra della filera corta e controllata.
• Zuegg (www.zuegg.it). - Il gruppo Zuegg è noto per la produzione di confetture e succhi di frutta. Al 2016, la Zuegg vanta un fatturato complessivo di 303 milioni di euro e ben 7 stabilimenti consolidati in Europa. Nel 2016, il consumo di energia elettrica dovuto al solo stabilimento di Verona è pari a 98,45 kWh/t prod; il consumo di gas metano è pari a 19,61 m3/t prod.
CLUSTER ITALIANO
17 11/10/18
!!
17
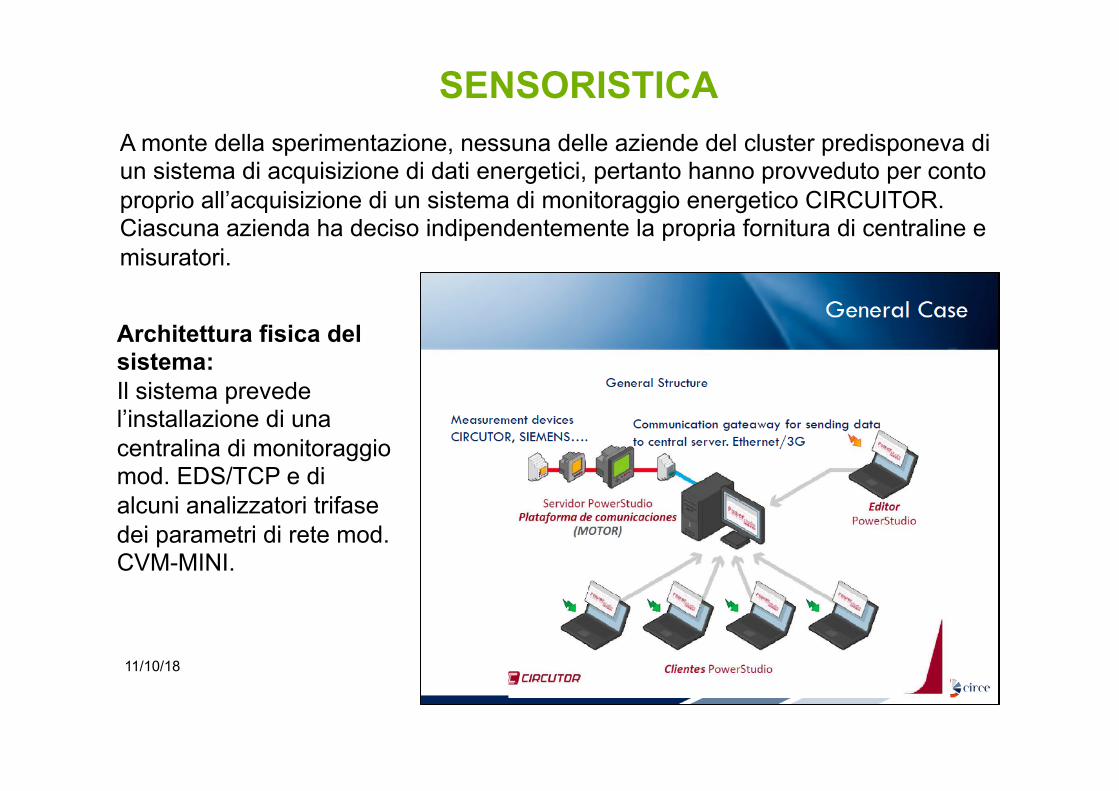
SENSORISTICA A monte della sperimentazione, nessuna delle aziende del cluster predisponeva di
un sistema di acquisizione di dati energetici, pertanto hanno provveduto per conto proprio all’acquisizione di un sistema di monitoraggio energetico CIRCUITOR. Ciascuna azienda ha deciso indipendentemente la propria fornitura di centraline e misuratori. Architettura fisica del sistema: Il sistema prevede l’installazione di una centralina di monitoraggio mod. EDS/TCP e di alcuni analizzatori trifase dei parametri di rete mod. CVM-MINI.

18 11/10/18
DASHBOARD
I punti di misura di ciascuna azienda si connettono tramite dei gateways via internet con un protocollo di tipo ModBUS alla Dashboard (software Power Studio SCADA Delux). I dati verranno misurati ogni 5 minuti. Il Sofware Power Studio SCADA viene configurato in maniera specifica per ciascuno dei clusters.
Ciascuna azienda potrà avere accesso alle seguenti informazioni per punto di rilievo: • informazioni sulla potenza di lavoro in funzione della potenza nominale; • storico delle informazioni sulla potenza utilizzata; • grafico del consumo di energia in funzione del tempo; • download in .xls dei dati; • altre variabili misurate dagli analizzatori, come l’energia reattiva, le intensità, ecc.
La dashboard mostra in tempo reale il consumo dovuto ai sottoprocessi in percentuale rispetto al consumo elettrico complessivo.
19 11/10/18
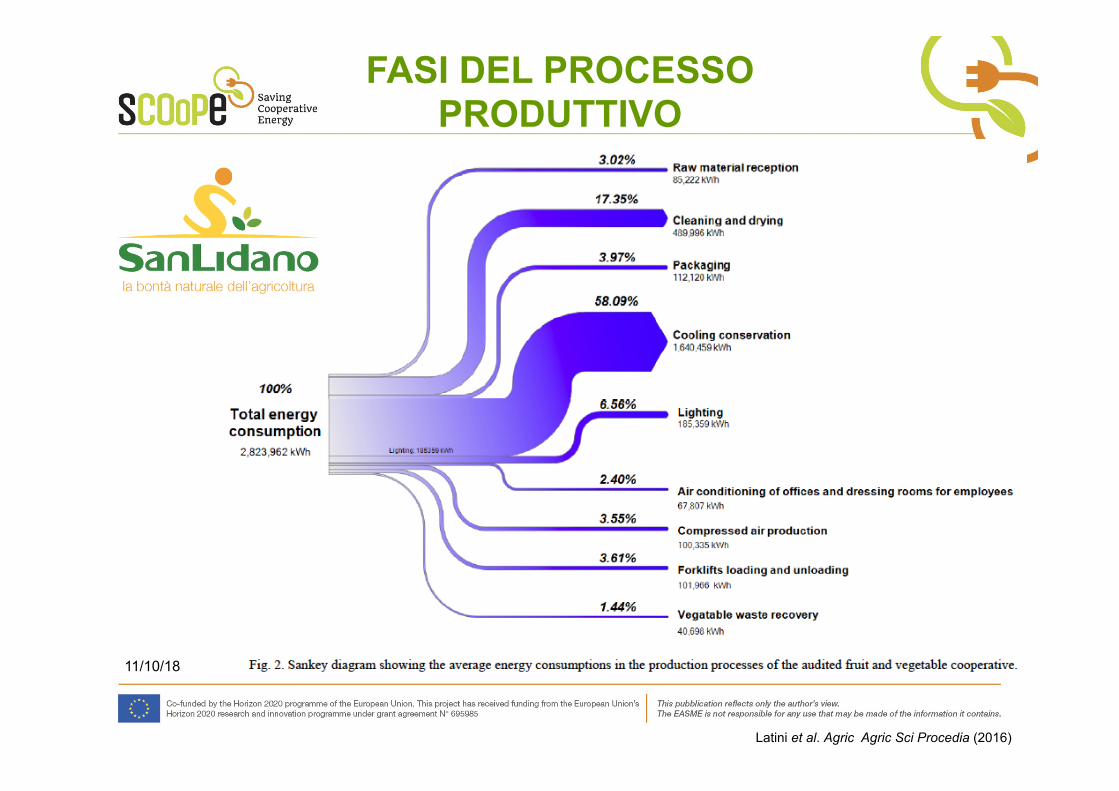
FASI DEL PROCESSO PRODUTTIVO
Latini et al. Agric Agric Sci Procedia (2016)
20 11/10/18
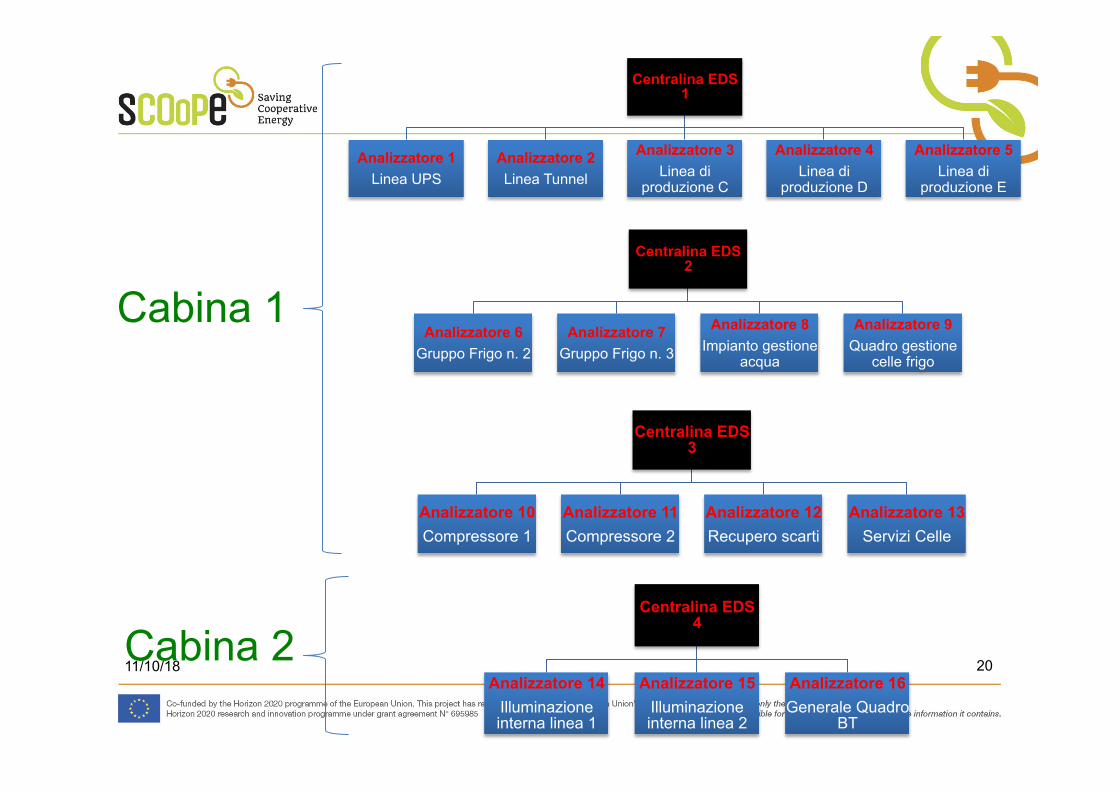
Centralina EDS 1
Analizzatore 1 Linea UPS
Analizzatore 2 Linea Tunnel
Analizzatore 3 Linea di
produzione C
Analizzatore 4 Linea di
produzione D
Analizzatore 5 Linea di
produzione E
Centralina EDS 2
Analizzatore 6 Gruppo Frigo n. 2
Analizzatore 7 Gruppo Frigo n. 3
Analizzatore 8 Impianto gestione
acqua
Analizzatore 9 Quadro gestione
celle frigo
Centralina EDS 3
Analizzatore 10 Compressore 1
Analizzatore 11 Compressore 2
Analizzatore 12 Recupero scarti
Analizzatore 13 Servizi Celle
Cabina 2 Centralina EDS
4
Analizzatore 14 Illuminazione interna linea 1
Analizzatore 15 Illuminazione interna linea 2
Analizzatore 16 Generale Quadro
BT
Cabina 1
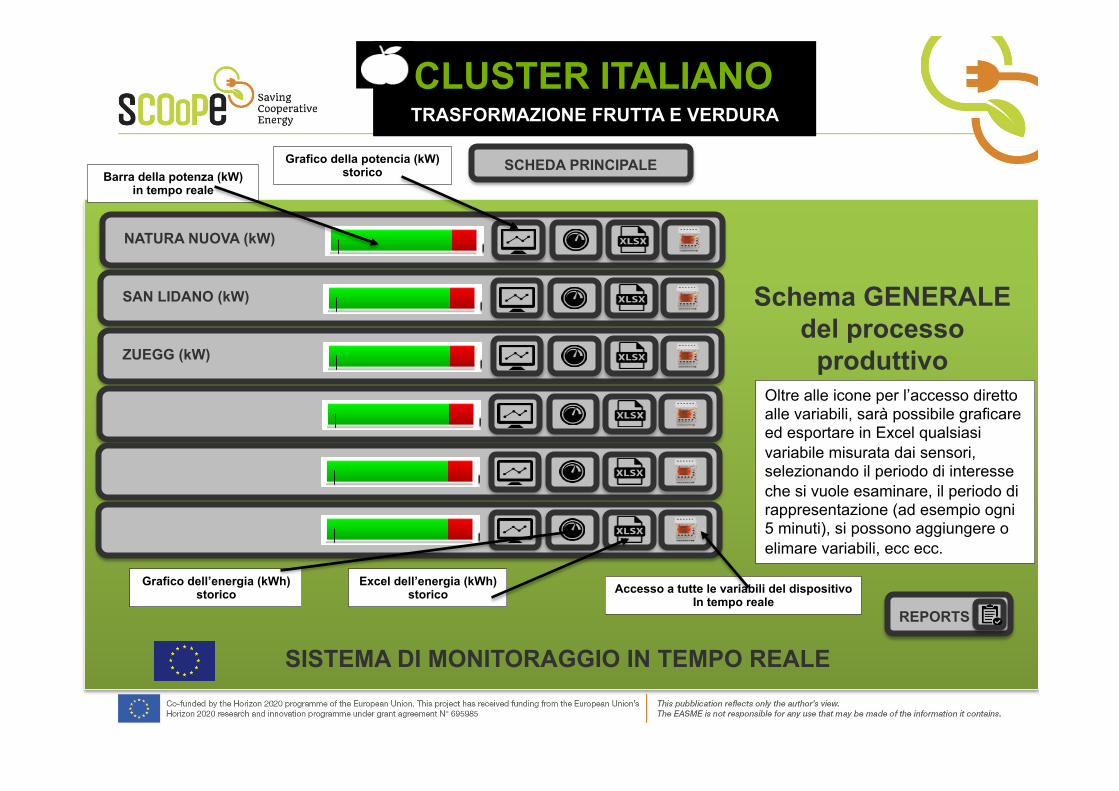
21 11/10/18 SISTEMA DI MONITORAGGIO IN TEMPO REALE
SCHEDA PRINCIPALE
TRASFORMAZIONE FRUTTA E VERDURA
Schema GENERALE del processo
produttivo
NATURA NUOVA (kW)
SAN LIDANO (kW)
ZUEGG (kW)
REPORTS
Barra della potenza (kW) in tempo reale
Grafico della potencia (kW) storico
Grafico dell’energia (kWh) storico
Excel dell’energia (kWh) storico Accesso a tutte le variabili del dispositivo
In tempo reale
Oltre alle icone per l’accesso diretto alle variabili, sarà possibile graficare ed esportare in Excel qualsiasi variabile misurata dai sensori, selezionando il periodo di interesse che si vuole esaminare, il periodo di rappresentazione (ad esempio ogni 5 minuti), si possono aggiungere o elimare variabili, ecc ecc.
CLUSTER ITALIANO

22 11/10/18
Screenshot of the Dashboard main page of real-time monitoring for a cooperative

23 11/10/18
Tipo di informazioni contenute in un report mensile
24 11/10/18
Sito web del progetto www.scoope.eu
Video di presentazione del progetto https://www.youtube.com/watch?v=R9BJnULnuCE&feature=youtu.be
Corso online (webinars) per Energy Managers https://scoope.eu/scoope-energy-manager-webinars/
Ulteriori informazioni
25 11/10/18
Grazie per l’attenzione!
Enrico Pietrantonio Chiara Chiostrini
Carlo Alberto Campiotti Germina Giagnacovo
Matteo Scoccianti Corinna Viola
Alberto Mastrilli
Gianni Lombardi
Collaboratori per il cluster italiano: