
Effect of Cassava (Manihot esculenta Crantz: Euphorbiaceae ...

Supporting Information
A Study of Competitive Multiple Hydrogen Bonding Effect and Its Associated Excited-State Proton Transfer TautomerismYi-Ting Chen, ¶,a Pei-Jhen Wu, ¶,a Chia-Yu Peng, ¶,b Jiun-Yi Shen,a Cheng-Cheng Tsai,b Wei-Ping Hu,b,* and Pi-Tai Choua,*†Department of Chemistry and Center for Emerging Material and Advanced Devices, National Taiwan University, Taipei 10617, Taiwan, R.O.C.
‡Department of Chemistry and Biochemistry, National Chung Cheng University, Chia-Yi 62102, Taiwan, R.O.C.
Corresponding AuthorEmail:[email protected] (P.-T. Chou)Email: [email protected] (W.-P. Hu)
Electronic Supplementary Material (ESI) for Physical Chemistry Chemical Physics.This journal is © the Owner Societies 2017

S2
Contentspage
Experimental section....................................................................................................................... S3
Figure S1. Side views of the packing of DHDA in the unit cell........................................................ S6
Figure S2. The 1H NMR spectroscopy of DHDA and 3 ..................................................................... S7
Figure S3. The 1H NMR spectroscopy of HN (up) and HMN (down) in CDCl3............................... S8Figure S4. The IR spectra of HN, HMN and DHDA in KBr ............................................................ S9Figure S5. Normalized steady-state absorption (black+symbol), excitation spectra (monitor at 470 nm (blue), 550 nm (green) and 700 nm (red in CH2Cl2)) and emission spectrum (black, λex=380 nm; cyan, λex=440) for DHDA in the described solvents at room temperature. ................................................... S9Figure S6. Normalized absorption and emission spectrum for 3 in the cyclohexane....................... S10Figure S7. Normalized absorption and emission spectrum for HMN in the cyclohexane................ S10
Figure S8. Time-resolved relaxation dynamics of DHDA in solid state monitored at 520 nm (blue open circles, ○), and 700 nm, (red open square,□). Solid lines depict the corresponding fitting curves (blue and red) and instrument response function (black).................................................................. S11
Figure S9. The complete ground (S0) and the first singlet excited state (S1) relative energies of DHDA................................................................................................................................................ S12
Figure S10. Predicted transition orbitals of DHDA-23_OO and DHDA-23_IO. HOMO (A) and LUMO (B) of DHDA-23_OO ; HOMO (C) and LUMO (D) of DHDA-23_OI.................................................................................................................................... S12
Eqs. S1.............................................................................................................................................. S13
Table S1. Crystal data and structure refinement for DHDA............................................................ S15
Table S2. Bond lengths for the DHDA crystal structure................................................................. S16
Table S3. Hydrogen bond distances and angles for DHDA crystal structure.................................. S16
Table S4. Calculated ground-state (S0) energetics in kcal/mol of DHDA system in cyclohexane solvent. The listed relative energies correspond to those in Figures 5 and S8, and the zero of energy is DHDA-23_OO. ................................................................................................................................ S17
Table S5. Calculated first excited state (S1) energetics in kcal/mol of DHDA system in cyclohexane solvent. The listed relative energies correspond to those in Figures 5 and S8, and the zero of energy is DHDA-23_OO*.................................................................................................................................. S17

S3
Experimental section
Experimental Section
Synthesis and characterization. All solvents were distilled from appropriate drying agents prior to use.
Commercially available reagents were used without further purification unless otherwise stated. All
reactions were monitored by TLC. Column chromatography was carried out using silica gel from
Merck (230-400 mesh). 1H and 13C NMR spectra were recorded on a Varian Unity 400 spectrometer at
400 MHz and 100 MHz, respectively. Chemical shifts (δ) are recorded in parts per million (ppm) and
coupling constants (J) are reported in Hertz (Hz). Mass spectra were obtained using a Gas
Chromatograph-Mass Spectrometer (Finnigan MAT TSQ-46C GC/MS/MS/ DS).
Synthesis of 1,8-bis(ethoxymethoxy)naphthalene (2). To a solution of naphthalene-1,8-diol (1) (1.60
g, 10 mmol, brand: COMBI-BLOCKS) in DMF (12 mL) at 0 °C was added NaH (30 mmol) and
stirred for 1 h. A solution of chloromethyl ethyl ether (2.3 mL, 25 mmol) in Et2O (10 mL) was added
to the mixture. After stirring overnight, the reaction mixture was added to water and extracted with
Et2O (20 mL × 3). The organic extracts were combined, dried over anhydrous MgSO4, filtered and
concentrated. The residue was purified using column chromatography on silica gel (DCM/hexane) to
yield 2 (2.34 g, 85%) as a white solid. 1H NMR (400 MHz, CDCl3): δ 7.47 (d, J = 8.4 Hz, 2 H), 7.32 (t,
J = 7.6 Hz, 2 H), 7.07 (d, J = 7.6 Hz, 2 H), 5.32 (s, 4 H), 3.83 (q, 4 H), 1.26 (t, 6 H) 13C NMR (100
MHz, CDCl3): δ 153.7, 137.4, 126.1, 122.5, 112.4, 95.0, 94.4, 64.4, 15.0.ESI-MS: m/z 276 (M+).
Synthesis of 1,8-bis(ethoxymethoxy)naphthalene-2,7-dicarbaldehyde (3). A solution of compound 2
(1.52 g, 5.5 mmol) and Et2O (10 mL) at 0 °C was added dropwise to a mixture of n-BuLi (2.5 M in
hexane, 5.72 mL, 14.2 mmol) and TMEDA (2.12mL, 14.2 mmol) in Et2O (100 mL) and stirred for 6 h
at this temperature. DMF (1.7 mL, 22 mmol) was added to the mixture for stirring overnight (0 °C to
r.t.). Water was added to the mixture and the pH7 adjusted using 1.0 N HCl(aq). After extraction with
Et2O, the organic layer was dried over MgSO4, filtered and evaporated. The residue was purified using
column chromatography on silica gel (hexane/EA) to yield the 3 (1.11 g, 61%) as an ochre solid. 1H
NMR (400 MHz, CDCl3): δ 10.58 (s, 2 H), 7.99 (d, J = 8.8 Hz, 2 H), 7.68 (d, J = 8.4 Hz, 2 H), 5.27 (s,
4 H), 3.77 (q, 4 H), 1.20 (t, 6H). 13C NMR (100 MHz, CDCl3): δ 190.2, 158.9, 143.5, 128.3, 126.0,
125.7, 121.3, 100.8, 66.7, 15.0. ESI-MS: m/z 332(M+).

S4
Synthesis of 1,8-dihydroxynaphthalene-2,7-dicarbaldehyde (DHDA). A solution of compound 3
(0.31 g, 1.0 mmol) in CH2Cl2 (25 mL) at 0 °C was added dropwise to a mixture of isopropanol (6.4 mL)
and HCl (4.8 mL). After stirring for 6 h, the solvent was removed under reduced pressure. The residue
was extracted with CH2Cl2 and wash with the water, dried over anhydrous MgSO4, filtered and
concentrated to yield the DHDA (0.15 g, 69%) as a yellow solid. 1H NMR (400 MHz, CDCl3): δ 12.64
(s, 2 H), 10.15 (s, 2 H), 7.73 (d, J = 8.4 Hz, 2 H), 7.29 (d, J = 8.8 Hz, 2 H).13C NMR (100 MHz,
CDCl3) δ 193.3, 164.1, 142.9, 130.3, 119.8, 116.4, 113.8. ESI-MS: m/z 216 (M+H)+.
Spectroscopic Measurements Steady-state absorption spectra were recorded using a Hitachi U-3310
Spectrophotometer, and emission spectra were obtained using an Edinburgh FS920 Fluorimeter.
Detailed time-resolved spectroscopic measurements have been reported previously.52 In brief,
nanosecond time-resolved experiments were performed by using an Edinburgh FLS920 time-
correlated single photon-counting (TCSPC) system with a pulsed hydrogen-filled lamp as the
excitation source. Data were fitted with the sum of exponential functions using a nonlinear least-
squares procedure in combination with a convolution method.
Sub-nanosecond to nanosecond time-resolved studies were performed using another TCSPC system
(OB-900 L lifetime spectrometer, Edinburgh) with an excitation light source from the second harmonic
generation (SHG, 400 nm) of pulse-selected femtosecond laser pulses at 800 nm (Tsunami, Spectra-
Physics) and a microchannel plate (MCP) detector. The fluorescence was collected at a right angle
with respect to the pump beam path and passed through a polarizer, which was located in front of the
detector. The polarization was set at a magic angle (54.7º) with respect to the pump polarization
direction to eliminate anisotropy. Similar data analysis and fitting procedures were applied. The
temporal resolution, after partial removal of the instrumental time broadening, was ~20 ps.
Ultrafast spectroscopic study of the titled compounds was performed by a femtosecond
photoluminescence up-conversion (uPL) system pumped at 400 nm. In this measurement, fluorescence
from a rotating sample cell was focused in a BBO crystal and its frequency was summed along with an
interrogation gate pulse at a designated delay time with respect to the pump pulse. A half-wave plate
was used to set the pump polarization at a magic angle (54.7º) with respect to the gate pulse to prevent
the fluorescence anisotropy contributed by solute reorientation. Fluorescence up-conversion data were
fitted to the sum of exponential functions convoluted with the instrument response function (IRF). The
IRF was determined from the Raman scattering signal and its profile was fitted to a Gaussian function

S5
with a full width at half maximum of ~220 fs.
Computational methodology The structures and energies of the 1,8-dihydroxynaphthalene-2,7-
dicarbaldehyde (DHDA) molecule and its tautomers in solvents were calculated by the hybrid density
functionals B3LYP with the 6-31+G(d,p) basis set for the ground-state (S0) potential energy surface
(PES). Their first excited state structures, energies, vertical S0 S1 excitation and the S1 S0
emissions were computed by the time-dependent (TD) approach with the same functional and basis set
as in the ground-state calculation. The above B3LYP/6-31+G(d,p) calculation on S0 were checked by
the single-point calculation at MP2/6-31+G(d,p) level on the B3LYP/6-31+G(d,p) geometries and by
the full calculation using the M06-2X functional with 6-31+G(d,p) basis set. The solvation effects was
considered by using the polarizable continuum model (PCM) in the solvent of cyclohexane. The higher
level EOM-CCSD/6-31+G(d,p) calculation was also performed to calculate the relative energies on the
S1 PES using the TD-B3LYP/6-31+G(d,p) geometries. All the calculations were performed using the
Gaussian 09 program except that the EOM-CCSD calculation was performed using the MOLPRO
program.

S6
Figure S1. Side views of the packing of DHDA in the unit cell.

S7
Figure S2. The 1H NMR spectroscopy of DHDA (up) and 3(down) in CDCl3.

S8
Figure S3. The 1H NMR spectroscopy of HN (up) and HMN (down) in CDCl3.
S9
4000 3500 3000 2500 2000 1500 1000 500
4000 3500 3000 2500 2000 1500 1000 500
4000 3500 3000 2500 2000 1500 1000 500
HN
HMN
Tran
smitt
ance
wavenumber (cm-1)
DHDA
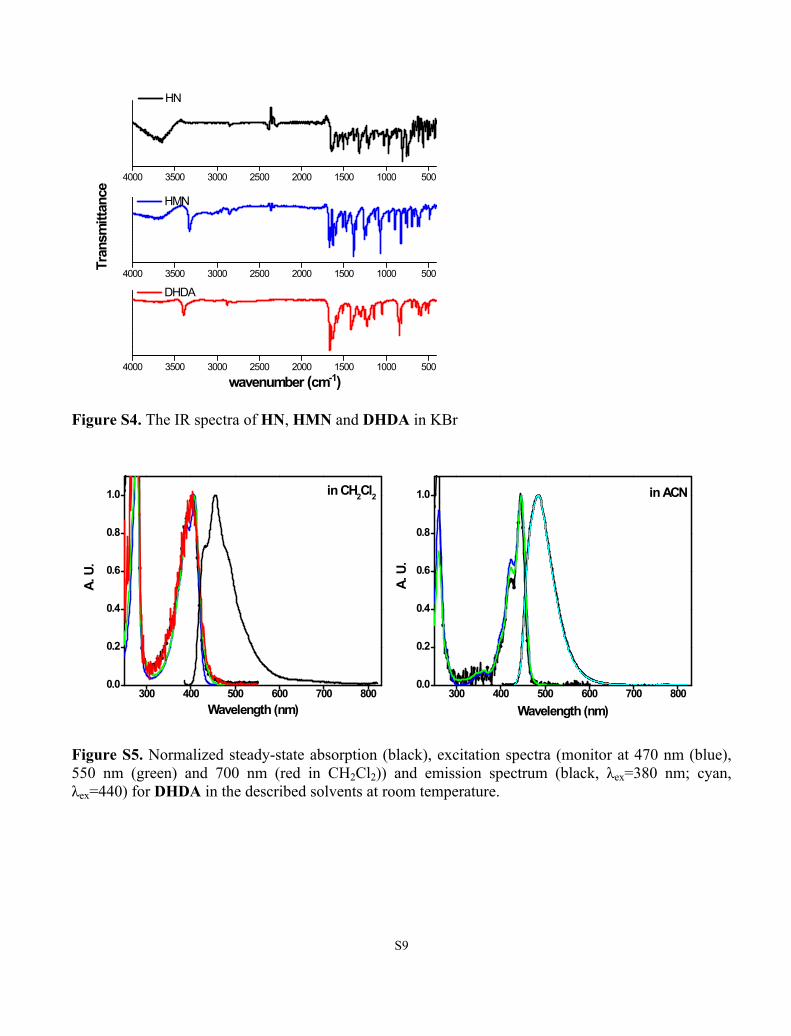
Figure S4. The IR spectra of HN, HMN and DHDA in KBr
300 400 500 600 700 8000.0
0.2
0.4
0.6
0.8
1.0
300 400 500 600 700 8000.0
0.2
0.4
0.6
0.8
1.0
A. U
.
Wavelength (nm)
in ACN
A. U
.
Wavelength (nm)
in CH2Cl2
Figure S5. Normalized steady-state absorption (black), excitation spectra (monitor at 470 nm (blue), 550 nm (green) and 700 nm (red in CH2Cl2)) and emission spectrum (black, λex=380 nm; cyan, λex=440) for DHDA in the described solvents at room temperature.

S10
300 400 500 600 7000.0
0.2
0.4
0.6
0.8
1.0
A. U
.
Wavelength (nm)
Figure S6. Normalized absorption and emission spectrum for 3 in the cyclohexane.
300 400 500 600 7000.0
0.2
0.4
0.6
0.8
1.0
A. U
.
Wavelength (nm)Figure S7. Normalized absorption and emission spectrum for HMN in the cyclohexane.

S11
0.5 1.0 1.5 2.0 2.5 3.0
200
400
600
800
1000
Coun
t.
Time (ns)Figure S8. Time-resolved relaxation dynamics of DHDA in solid state monitored at 520 nm (blue open circles, ○), and 700 nm, (red open square,□). Solid lines depict the corresponding fitting curves (blue and red) and instrument response function (black).

S12
Figure S9. The complete ground (S0) and the first singlet excited state (S1) relative energies of DHDA.
Figure S10. Predicted transition orbitals of DHDA-23_OO and DHDA-23_IO. HOMO (A) and
LUMO (B) of DHDA-23_OO; HOMO (C) and LUMO (D) of DHDA-23_OI.

S13
Eqs. S1
[[DHDA-12_II*]kpt2
k-pt2
hv kfTA* kf
TB*
[DHDA-23_OI]
[DHDA-23_OI*]kpt1
kdptx
Scheme S1. The proposed mechanism of excited-state double proton transferfor DHDA-23_OI. Note that the asterisk * denoted the electronically excited state.
[DHDA-13_II*]
In Scheme S1 we also draw a concerted PT pathway (kdpt) but specify that this process is unlikely to
take place according to the kinetic data. This viewpoint is also supported by theoretical arguments
based on the PES landscape, concluding that the concerted PT pathway is thermally unfavorable.
Based on the experimental data we conclude the rate of first proton transfer kpt1 (DHDA-23_OI*
→DHDA-13_II*) to be faster than the system response of (150 fs)-1. Therefore, in a time frame of
several ps of interest, it can be assumed that at t ~ 0 (< few hundred fs in reality) N* has been
depopulated to ~zero and DHDA-13_II* is instantaneously populated (DHDA-13_II* = [DHDA-
13_II*]0 at t = 0). Therefore, the time-dependent DHDA-13_II* and DHDA-12_II*, specified as
[DHDA-13_II*] and [DHDA-12_II*], respectively, can be expressed as
.............................(1)TA*pt2 pt2
DHDA-13_II* DHDA-13_II*d[ ] ( ) [ ] [ ] d
DHDA- 2 It
1 _ I*fk k k
.............................(2)TB*pt2 pt2
d[ ] ( )DHDA-12_II* DHDA-[ ] [ ]12_II* DHDA-13_II*dt fk k k
where are the sum of non-ESIPT decay rate for TA* and TB*, respectively. The *TB*A and fTf kk
differential Eqs. (1) and (2) can be solved by Laplace transformation to obtain Eqs. (3) and (4)

S14
.....................................................(3)1 202 1
2 1
[ ][ ] [( ) ( ) ]DHDA-13_II*DHDA-13_II* t tX e X e
.......................................................................(4)1 2pt2 0
2 1
DHDA-13_II*[ ]DHDA-12_[ ] [ ]II* t tk
e e
Where ......................................................(5)]4)()[(21
2ptpt22
2,1 kkYXYX m
............................................................................(6)*2pt
*TA2pt , TB
ff kkYkkX
The experimental results also draw the conclusion that the rate of forward DHDA-13_II* DHDA-12_II* (kpt2) and reverse DHDA-12_II* DHDA-13_II* (k-pt2) proton transfer is much larger than
. Under the condition of , it is thus reasonable for us to claim the *TB*A and fTf kk *TB*TA
pt2-pt2 , , ff kkkk
pseudo equilibrium between DHDA-13_II* and DHDA-12_II* prior to their corresponding emission. As a result, and Eqs. (5) can be written as follows.pt2pt2 and kYkX
.....................................(7)pt2pt22
2eq
eq*TB*TA
22
2*TB
2*TA
11
1 ,K1
K1
kk
kkkk
kkkk ff
ptpt
ptfptf
The pre-exponential factors in Eqs 3 for the [DHDA-13_II*] can be derived further as
.....................................................(8)pt20 11
2 1 pt2 pt2
DHDA-13_I[ I ]* ( )AkX
k k
...................................................(9)pt20 22
2 1 pt2 pt2
[DHDA-13_II*] ( )AkX
k k
The ratio between A1 and A2, i.e. A1/A2 is thus derived to be kpt2/k-pt2, which is equivalent to the equilibrium constant Keq (=kpt2/k-pt2) between DHDA-13_II* and DHDA-12_II* species. We then further convert the time-resolved concentration expression (Eqs 3, 4) to the time-resolved fluorescence intensity of DHDA-13_II* and DHDA-12_II*, denoted as [DHDA-13_II*]f and [DHDA-12_II**]f. This is done by multiplying the instrument factor (I0) and the fluorescence radiative decay rate constant and for DHDA-13_II* and DHDA-12_II**, respectively, giving Eqs. (10) and (11), *TA
rk *TBrk
which is essentially identical with equation (I) in the text.
............................(10)1 2
TA*0 0
f 2 12 1
[ *DHDA-13_IIDHDA- ][ *] [( ) ( ) ]13_II t trI k X e X e
.............................................................(11)1 2
TB*0 pt2 0
f2 1
DHDA-13_II*DHDA-
[ ][ *] [ ]12_II r t tI k k
e e
S15
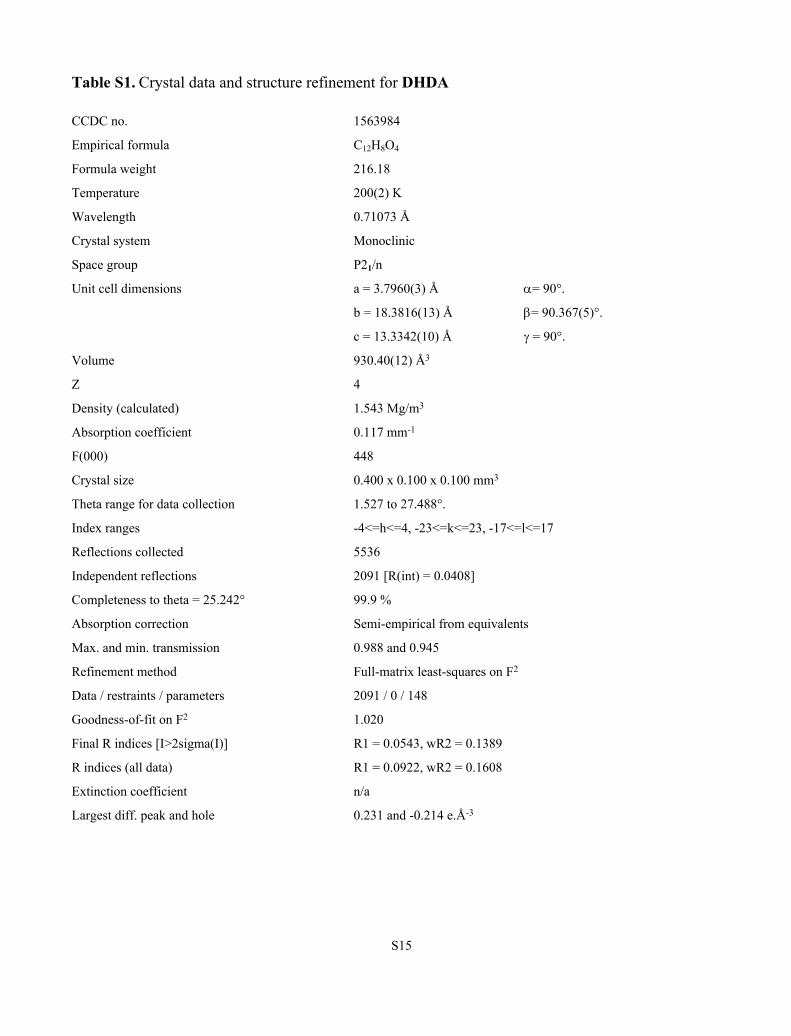
Table S1. Crystal data and structure refinement for DHDA
CCDC no. 1563984
Empirical formula C12H8O4
Formula weight 216.18
Temperature 200(2) K
Wavelength 0.71073 Å
Crystal system Monoclinic
Space group P21/n
Unit cell dimensions a = 3.7960(3) Å = 90°.
b = 18.3816(13) Å = 90.367(5)°.
c = 13.3342(10) Å = 90°.
Volume 930.40(12) Å3
Z 4
Density (calculated) 1.543 Mg/m3
Absorption coefficient 0.117 mm-1
F(000) 448
Crystal size 0.400 x 0.100 x 0.100 mm3
Theta range for data collection 1.527 to 27.488°.
Index ranges -4<=h<=4, -23<=k<=23, -17<=l<=17
Reflections collected 5536
Independent reflections 2091 [R(int) = 0.0408]
Completeness to theta = 25.242° 99.9 %
Absorption correction Semi-empirical from equivalents
Max. and min. transmission 0.988 and 0.945
Refinement method Full-matrix least-squares on F2
Data / restraints / parameters 2091 / 0 / 148
Goodness-of-fit on F2 1.020
Final R indices [I>2sigma(I)] R1 = 0.0543, wR2 = 0.1389
R indices (all data) R1 = 0.0922, wR2 = 0.1608
Extinction coefficient n/a
Largest diff. peak and hole 0.231 and -0.214 e.Å-3

S16
Table S2. Bond lengths for the DHDA crystal structure
Bond Lengths (Å)
O(1)-C(11) 1.232(3) C(4)-C(5) 1.411(3)
O(2)-C(7) 1.344(2) C(5)-C(10) 1.425(3)
O(3)-C(1) 1.352(2) C(5)-C(6) 1.427(3)
O(4)-C(12) 1.221(3) C(6)-C(7) 1.427(3)
C(1)-C(2) 1.397(3) C(7)-C(8) 1.394(3)
C(1)-C(6) 1.431(3) C(8)-C(9) 1.413(3)
C(2)-C(3) 1.412(3) C(8)-C(11) 1.450(3)
C(2)-C(12) 1.462(3) C(9)-C(10) 1.365(3)
C(3)-C(4) 1.364(3)
Table S3. Hydrogen bond distances and angles for DHDA crystal structure
D-H∙∙∙A d(D-H)/Å d(H∙∙∙A)/Å d(D∙∙∙A)/ Å <(DHA)/ °
O(2)-H(2)...O(1) 0.84 1.78 2.532(2) 148.5
O(3)-H(3)...O(2) 0.84 1.90 2.629(2) 145.0

S17
Table S4. Calculated ground-state (S0) energetics in kcal/mol of DHDA system in cyclohexane
solvent. The listed relative energies correspond to those in Figures 5 and S8, and the zero of energy is DHDA-23_OO.
B3LYP/6-31+G(d,p) MP2/6-31+G(d,p)// B3LYP/6-31+G(d,p) M06-2X/6-31+G(d,p)
DHDA-23_OO 0.0 0.0 0.0
DHDA-23_OI 0.9 -0.9 -0.01
DHDA-13_II 2.2 3.6 2.6
A-DHDA-23_OI 4.2 2.6 3.5
TS4 3.3 4.1 3.1
TS6 15.1 11.7 13.2
TS7 10.7 6.0 9.3
Table S5. Calculated first excited state (S1) energetics in kcal/mol of DHDA system in cyclohexane
solvent. The listed relative energies correspond to those in Figures 5 and S8, and the zero of energy is DHDA-23_OO*.
TD-B3LYP/6-31+G(d,p)EOM-CCSD/6-31+G(d,p)
// TD-B3LYP/6-31+G(d,p)
DHDA-14_II* -3.3 4.3
DHDA-13_IO* 2.1 3.1
DHDA-23_OO* 0.0 0.0
DHDA-13_II* -7.2 -4.9
DHDA-12_II* -8.2 -8.0
A-DHDA-23_OI* 0.4 -
TS1* 2.3 3.3
TS2* 13.9 15.2
TS5* -6.6 -3.5
TS6* 15.5 -
TS7* 5.5 -