UxrvnnsrrA Srunr Ptnovl - CORE · avviene in molti tipi cellulari diversi. Inoltre ho indagato il...
94
UxrvnnsrrA DEGLI Srunr lr P"tnovl Sede Amministrativa: Universitd degli Studi di Padova Dipartimento di Scienze Biomediche SCUOLA Dl DOTTORATO Dl RICERCA lN: BIOSCIENZE E BIOTECNOLOGIE INDIRIZZO: NEUROBIOLOGIA CICLO XXV NUTRIENT DEPBNDENT CONTROL OF MITOCHONDRIAL Ca2* SIGNALING Direttore della Scuola: Ch.mo Prof. Giuseppe Zanotti />- coordinatore d'indirizzo; ch.mo Prof. Danieta Pietrobon tOZ----- Supervisore: Ch.mo Prof. Rosario Rizzuto & I Dottorando: Maria Patron ffneru^8"f"^
Transcript of UxrvnnsrrA Srunr Ptnovl - CORE · avviene in molti tipi cellulari diversi. Inoltre ho indagato il...

UxrvnnsrrADEGLI Srunrlr P"tnovl
Sede Amministrativa: Universitd degli Studi di Padova
Dipartimento di Scienze Biomediche
SCUOLA Dl DOTTORATO Dl RICERCA lN: BIOSCIENZE E BIOTECNOLOGIE
INDIRIZZO: NEUROBIOLOGIA
CICLO XXV
NUTRIENT DEPBNDENT CONTROL OF MITOCHONDRIAL Ca2*
SIGNALING
Direttore della Scuola: Ch.mo Prof. Giuseppe Zanotti />-coordinatore d'indirizzo; ch.mo Prof. Danieta Pietrobon tOZ-----
Supervisore: Ch.mo Prof. Rosario Rizzuto &I
Dottorando: Maria Patron
ffneru^8"f"^


Table of contents
1. Abstract ...................................................................................................................... 1
2. Riassunto ................................................................................................................... 3
3. Introduction ............................................................................................................... 5
3.1 Metabolism and metabolites ................................................................................ 5
3.2 Autophagy .......................................................................................................... 11
3.3 Ca2+ signaling: the general framework .............................................................. 16
3.4 Fine regulation of mitochondrial proteins ......................................................... 23
4. Aim .......................................................................................................................... 27
5 Materials and Methods ............................................................................................. 29
5.1 Cell culture, transfection and proteomic analysis .............................................. 29
5.2 MICU1 expression constructs ............................................................................ 30
5.3 Aequorin as a Ca2+ indicator .............................................................................. 32
5.4 Imaging techniques ............................................................................................ 36
5.5 Measurement of Mitochondrial Membrane Potential ........................................ 39
5.6 SypHer ............................................................................................................... 39
5.7 Morphological analysis ...................................................................................... 40
5.8 Luciferin-Luciferase system .............................................................................. 41
5.9 ROS production measurement ........................................................................... 42
6. Results ..................................................................................................................... 43
6.1 Role of mitochondria as sensors of nutrient availability ................................... 43
6.2 Glucose deprivation decreases mitochondrial Ca2+ uptake ............................... 46
6.3 MICU1 controls mitochondrial Ca2+ uptake in response to glucose
availability ................................................................................................................ 60
7. Discussion ................................................................................................................ 69
8. References ............................................................................................................... 77


1
1. Abstract
Eukaryotic cells are able to continuously adapt to fluctuations in external conditions.
Furthermore, when metabolites availability varies, cells undergo rapid changes in order to adapt
their metabolism and protect themselves against potential damages. These rapid changes are
regulated through different nutrient dependent pathways. The most important proteins, known so
far, involved in these pathways are AMPK and Sirtuins. These proteins, that have a key role in
the cells response to caloric stress, are activated when the cells are under nutrient deprivation
(Dilova et al. 2007).
Ca2+ is a fundamental second messenger that enters the cytosol upon the opening of a
variety of plasma membrane and endoplasmic/sarcoplasmic reticulum (ER/SR) channels and
controls numerous cell functions also at the mitochondrial site (Rizzuto and Pozzan 2006).
Foskett’group recently identified a new role of constitutive Ca2+ transfer from ER to
mitochondria. They demonstrated that this represents a crucial intracellular signal for AMPK
activation and autophagy induction. On the other hand still unknown are the precise
physiological signals inside the cell that can translate fluctuation of metabolites concentration
into a specific regulation of mitochondrial Ca2+ content (Cardenas et al. 2010).
During my PhD, I measured mitochondrial Ca2+ uptake using targeted recombinant
aequorin (Pinton et al. 2007). I found that in HeLa cells, after 2 hours of glucose deprivation,
mitochondrial Ca2+ uptake is drastically reduced. This physiological response appears to be
transient and reversible. Indeed, after glucose deprivation, cells show a reduced mitochondrial
Ca2+ uptake up to 4 hours, but after this period it returns to the levels measured in normal feeding
conditions. I also investigated the possible involvement of a newly identified regulator of
mitochondria Ca2+ uptake, MICU1, and we found that after 2 hours of glucose deprivation this
regulator is quickly degraded. Based on its short half-life, we wondered whether during glucose
deprivation MICU1 could be ubiquitylated and rapidly degraded. I also found that the

2
proteasome inhibitor MG132 inhibits MICU1 degradation during glucose deprivation and it also
increases MICU1 half-life. High-resolution mass spectrometry data reveal five lysines in MICU1
protein sequence that are reported to be ubiquitylated. Thus, I decided to substitute each one of
these lysines with one arginine (K>R) in order to generate a MICU1 ubiquitylation incompetent
mutant (MICU1K102R, K103R, K104R, K296R, K359R). Importantly, I found that the overexpression of
MICU1K102R, K103R, K104R, K296R, K359R partially abolishes the effect of glucose deprivation on
mitochondrial Ca2+ uptake. Further experiments will allow us to understand how MICU1
influences the modulation of the activity of mitochondrial Ca2+ transport system. The analysis of
this mechanism will allow us to understand if mitochondria can be the link that directly connects
glucose availability with the modulation of physio-pathological processes such as autophagy and
apoptosis.

3
2. Riassunto
Le cellule eucariotiche hanno la necessità di adattarsi a cambiamenti nella disponibilità di
metaboliti. Quando i livelli di nutrienti cambiano, il metabolismo cellulare si adatta rapidamente
per proteggere la cellula stessa da eventuali danni. Questi rapidi cambiamenti sono regolati
attraverso proteine che sono sensibili alla disponibilità di metaboliti. Le più importanti proteine
coinvolte in questa risposta sono AMPK e le sirtuine (Dilova et al. 2007).
Il Ca2+ è un secondo messaggero fondamentale che controlla numerose funzioni cellulari e
il mitocondrio è uno degli organelli più importanti nel mantenimento dell’omeostasi del Ca2+
intracellulare (Rizzuto and Pozzan 2006). Recentemente, il gruppo di ricerca di Foskett ha
identificato un nuovo ruolo per il trasferimento di Ca2+ che normalmente avviene dal reticolo
endoplasmatico/sarcoplasmatico (ER/SR) ai mitocondri. Hanno quindi dimostrato che il Ca2+
trasferito è un segnale fondamentale per l'attivazione intracellulare di AMPK e per l’induzione di
una risposta adattativa alla mancanza di nutrimenti qual è l’autofagia. Rimane ancora
sconosciuto il segnale fisiologico all'interno della cellula che converte cambiamenti nella
disponibilità di nutrimenti con variazioni nell’ampiezza dei transienti Ca2+ mitocondriali.
Durante il mio dottorato di ricerca ho utilizzato l’equorina come sonda per misurare il Ca2+
all’interno dei vari comparti intracellulari (Pinton et al. 2007). Le nostre ricerche hanno
dimostrato che cellule HeLa, private per due ore di un metabolita fondamentale qual è il
glucosio, presentano transienti Ca2+ mitocondriali drasticamente ridotti. Misurare anche altri
parametri mitocondriali ci ha fatto capire che questa risposta è fisiologica e reversibile e che
avviene in molti tipi cellulari diversi.
Inoltre ho indagato il ruolo di MICU1, un regolatore dei livelli di Ca2+ mitocondriale
recentemente identificato, quale modulatore dei transienti Ca2+ mitocondriali durante l’assenza di
glucosio. I nostri esperimenti dimostrano chiaramente come, dopo 2 ore di deprivazione del
glucosio dal mezzo di coltura, questo fondamentale regolatore risulta essere rapidamente
4
degradato. Mi sono quindi chiesta, vista la sorprendentemente breve semi-vita di MICU1, se
durante la deprivazione di glucosio MICU1 potesse essere ubiquitinato e rapidamente degradato.
A supporto di questa ipotesi, ho dimostrato che il trattamento delle cellule con l’inibitore del
proteasoma MG132 inibisce la degradazione di MICU1 e ne aumenta la semi-vita. Inoltre, dati
pubblicati di spettrometria di massa hanno rivelato cinque lisine nella sequenza proteica di
MICU1 che sono predette essere ubiquitinate. Abbiamo quindi deciso di sostituire ognuna di
queste lisine con arginine (K>R) in modo da generare un mutante incompetente per
l’ubiquitinizzazione (MICU1K102R, K103R, K104R, K296R, K359R). La sovraespressione di questo mutante
in cellule HeLa abolisce parzialmente l’effetto della deprivazione del glucosio sull’entrata di
Ca2+ mitocondriale.
Esperimenti futuri ci permetteranno di capire come MICU1 influenzi la modulazione
dell’attività del trasporto di Ca2+ a livello mitocondriale. L’analisi di questo meccanismo ci
permetterà di comprendere se il mitocondrio rappresenti un anello di congiunzione tra la
disponibilità di glucosio e la modulazione di processi fisiopatologici quali l’autofagia e
l’apoptosi.
5
3. Introduction
3.1 Metabolism and metabolites
Metabolism is the set of life-sustaining chemical reactions, precisely catalyzed by
enzymes, present in all living organisms in order to provide energy for growth, reproduction and
adaptation to the environment. Metabolism is usually a balance between anabolic and catabolic
processes. Catabolism breaks down organic molecules in order to provide energy whereas
anabolism uses this energy to build cellular components such as proteins and nucleic acids.
The equilibrium between anabolism and catabolism is maintained by precise pathways in
order to maintain intracellular homeostasis. These reactions are organized and linked to each
others through specific metabolic pathways (Spirin et al. 2006), in which one metabolite is
transformed through a series of steps into another metabolite by a sequence of enzymes.
Metabolites are the intermediates and products of metabolism (Schmidt et al. 2003). They
are low molecular weight organic molecules. They have an important function: indeed, they are
fuel to provide energy to the organism. Discoveries in biochemistry during the late nineteenth
and twentieth centuries have provided a complex series of interactions between these metabolites
(Rennie 1999). It is thus very difficult to assess the contribution of single metabolites to
intracellular homeostasis. Object of intense investigations were the most known metabolites like
glucose, amino acids and growth factors.
Glucose is a simple monosaccharide that it is used as primary source of energy (Lienhard
et al. 1992), representing the main fuel for cellular energy production. The fate of this simple
monosaccharide is through three different ways. It can be stored; it can be converted through
glycolysis into pyruvate in order to provide ATP and metabolic intermediates (Boiteux and Hess
1981); it can be also oxidized through the pentose phosphate pathway to ribose 5-phosphate, a
key step for acid nucleic synthesis.
6
Amino acids are made from amine (-NH2) and carboxylic acid (-COOH) functional groups,
along with side-chains specific to each amino acid. About 500 amino acids are known.
Approximately half are essential in humans, as we cannot manufacture them ourselves. 22 are
the most important which are combined into peptide chains to build blocks of a vast array of
proteins (McNurlan 2012). When taken up into the human body from the diet, the 22 standard
amino acids are either used to synthesize proteins and other biomolecules or they are oxidized to
urea and carbon dioxide as a source of energy. Since amino acids are required for protein
biosynthesis, it is logical that amino acids should control components involved in the regulation
of protein synthesis (mRNA translation). Glucogenic amino acids can also be converted into
glucose, through gluconeogenesis. For their biological significance, amino acids are important in
nutrition and are commonly used as nutritional supplements.
Growth factors are proteins capable of stimulating cellular growth, proliferation and
cellular differentiation (Sporn and Roberts 1988, Frazier et al. 1996). They are very important in
the regulation of a variety of cellular processes. They carry out their function during
development including regulating tissue morphogenesis, angiogenesis, cell differentiation and
neurite outgrowth. They also play important roles in the maintenance of tissue homeostasis and
wound healing in the adult (Klenkler and Sheardown 2004). Their activities are mediated via
binding transmembrane receptors that often contain cytoplasmic tyrosine kinase domains. When
unregulated, many growth factors and their receptors have been implicated in tumor formation.
Metabolites as signaling molecules
The different types of metabolites have a central role in maintaining intracellular balance;
indeed, the amount of metabolites reflects the feeding status of the cell and determines which
metabolic reactions can occur (Ebenhoh and Heinrich 2001, Kapahi et al. 2010)).
During the last years, many researchers have found a new role for metabolites. They are
not only substrates for metabolic pathways, they also act as signaling molecules that regulate and
7
integrate the metabolic status of the cells with other fundamental cellular events such as cell
growth, replication and adaptive response to nutrient withdrawal. Cells thus use metabolites not
only as energy source but also like molecules that are able to connect the feeding status of the
cells with the ongoing cellular processes. This information is very important, and metabolites
can create a link between the changes in nutrient availability and the regulation of different
cellular processes.
Nutrient dependent pathways
Metabolites control a large variety of cellular pathways that are called “nutrient dependent
pathways”. These pathways trigger specific actions like cell growth, proliferation,
differentiation, apoptosis and autophagy that represent all metabolic adaptations. In these
pathways, sensor proteins play key roles.
Fundamental sensors of nutrient availability include mTOR, AMPK and Sirtuins. They can
detect changes in specific metabolites concentration.
The mammalian Target of Rapamycin (mTOR) is a large polypeptide with several distinct
functional domains: a kinase domain, several HEAT repeats, which are likely to be involved in
protein-protein interactions, and a domain for Rapamycin binding. mTOR binds several other
proteins and forms two major complexes: mTORC1 and mTORC2. The activity of mTORC1 is
tuned by amino acids and regulates the translational machinery of mammalian cells (Kapahi et
al. 2010). mTORC1 controls the phosphorylation of several components of the translational
machinery and also regulates ribosome biogenesis. mTORC2 is an important regulator of the
cytoskeleton (Oh and Jacinto 2011). These different complexes act as a critical nodal point in a
signaling network that regulates multiple cellular processes and several other inputs in response
to nutrient conditions (Proud 2007). The decreased mTOR activity under nutrient-poor
conditions results in the removal of nutrient transporter from the cell surface. This loss of
external nutrient supply is compensated by increased production of nutrients from intracellular

8
stores via autophagy. This type of response plays a key role in cell survival under stress
conditions (Chang et al. 2009).
Another fundamental sensor of nutrient availability is AMPK that controls a sophisticated
pathway acting to maintain and monitor the ratio of ATP/AMP/ADP (Hardie 2003). AMPK is a
heterotrimeric protein kinase. The reaction between ADP and ATP is catalyzed by a very active
adenylate kinase that converts 2ADP into ATP and AMP. As a consequence, the ratio of
AMP/ATP varies as the approximate square of the ADP/ATP ratios. This means that it is
sufficient a small decrease in cellular ATP level to result in a large increase in AMP, making it
an efficient signaling molecule of the energy status of the cell (Kahn et al. 2005). AMP is an
allosteric activator of AMPK by enhancing the phosphorylation of its T-loop by its upstream
protein kinase (Hardie 2003). Under glucose starvation, AMPK promotes autophagy by directly
activating Ulk1 through phosphorylation of its Ser317 and Ser777. This phosphorylation can be
prevented by nutrient availability through high mTOR activity.
Sirtuins are deacetylases involved in metabolic regulation and longevity (Blander and
Guarente 2004, Michishita et al. 2005, Haigis et al. 2006). The activity of Sirtuins is controlled
by a tight redox regulation by the [NADH/NAD+] ratio, which is a major sensor for metabolite
availability conserved from invertebrates to vertebrates. Sirtuins have different levels of NAD+-
dependent deacetylase activity (North and Verdin 2004). SIRT1, SIRT2 and SIRT3 have a
strong activity, whereas the others are weak in enzymatic activity but highly selective in their
targets. Reversible protein acetylation occurs at the ε-amino group of lysine residues and it is one
of the most common post-translational modifications that regulate DNA-protein interaction,
subcellular localization, protein stability and enzymatic activity during metabolic adaptations.
Mitochondrial proteins involved in the regulation of energy metabolism are subject to extensive
lysine acetylation. Indeed three sirtuins, SIRT3, SIRT4 and SIRT5 localize to mitochondria.
SIRT3 expression is activated during nutrient deprivation (Scher et al. 2007). The increased
9
expression of SIRT3 help the switch toward fasting metabolism, as tissues move away from
glucose instead of lipids and amino acids as source of energy (Nogueiras et al. 2012).
From metabolites to intracellular signaling: the glucose pathway
As mentioned above, glucose is one of the most important metabolites. It is also a crucial
primary messenger molecule (Sheen et al. 1999), signalling optimal growth conditions to the
cellular machinery. Its intracellular signalling involves specific glucose transporters, the
activation of protein kinase C (PKC) and the mitogen-activated kinases (MAPK), with the
consequent stimulation of gene expression of specific genes (i.e. TGFβ) (Haneda et al. 2003).
Blood glucose levels are maintained constant and independent from food intake, due to the
critical importance of this metabolite (Triplitt 2012).
Glucose deregulation is a pathological relevant event. Indeed, diabetes is one of the well-
known pathology caused by imbalance of glucose metabolism (Bouche et al. 2004). It affects
glucose availability by interfering with signals triggered by two hormones that maintain constant
blood glucose level, insulin and glucagon (Triplitt 2012). Understanding the cellular responses to
glucose withdrawal could lead to the discovery of new strategies to overcome the diabetes
damage. On the other hand, cancer cells base their metabolism on glycolysis in a phenomenon
termed “Warburg effect” (Vander Heiden et al. 2009). This metabolic adaptation allows cancer
cells to overcome the growth factor dependence that normally controls nutrients intake.
Independently from the growth factor stimulation, cancer cells uptake an excess of nutrients,
particularly glucose, that exceed the bioenergetics demands (DeBerardinis et al. 2008). This
ability enables cancer cells to proliferate and survive in hypoxic areas. The clarification of the
link between glucose availability and metabolic adaptation in cancer cells may ultimately lead to
more efficient treatments for human cancers.
For many years researchers have focused their studies on trying to uncover the effects of
glucose withdrawal on intracellular signalling. Many proteins that are involved in energy and

10
nutrient sensing, including AMPK and mTORC1, trigger metabolic adaptations like autophagy.
The determination of the proteins that control these metabolic adaptations will allow interfering
with this process and block the protection against glucose withdrawal-mediated cell death.
Thus, by choosing our model of nutrient deprivation, we decided to focus our studies on
the dissection of glucose signalling pathways. Indeed, we decided to completely remove all
metabolites and to add only glucose to control cells. In our experimental system, HeLa cells
were starved for 2 hours in KRB and control HeLa cells were incubated in KRB with 25mM
glucose.
Adaptive response to nutrient withdrawal
For any organism, the most important skill that allows surviving is the ability of sensing
the extracellular and the intracellular environment. The signals generated by these stimuli are
coded in order to respond appropriately in terms of intracellular modifications. There is a
plethora of different types of signaling, but we focused our attention on the metabolic ones that
give information about the feeding status of the cells. In this regard, metabolites play a central
role because they act as signaling molecules and they create a connection between nutrient
availability and key sensors of nutrient dependent pathways that are able to trigger cellular
adaptations to the availability of nutrients. Metabolic adaptations are intracellular events that
allow cells to maintain minimal cellular metabolism even in the absence of normal nutrients by
tuning ongoing chemical reactions.
One of the most important responses to the loss of external nutrient supply is the increased
production of nutrients from intracellular stores via autophagy.
11
3.2 Autophagy
Autophagy, or cellular self-degradation, is a pathway involved in protein and organelle
degradation. Christian de Duve firstly described this phenomenon in the late 60’s (Deter and De
Duve 1967), providing the clear biochemical proof of the involvement of lysosomes in this
process. However, a clear molecular description of this cellular event remained unresolved until
the isolation of the first autophagy-deficient yeast mutants (Tsukada and Ohsumi 1993) and the
consequent genetic dissection of the pool of regulatory genes (the so-called ATG genes), thus
ascribing autophagy among the tightly regulated and genetically programmed cellular processes.
There are three primary forms of autophagy: chaperone-mediated autophagy (CMA),
microautophagy and macroautophagy. CMA is a secondary response to starvation and, unlike the
other two processes, involves direct translocation of the targeted proteins across the lysosomal
membrane (Massey et al. 2006). Microautophagy is the least-characterized process but is used to
sequester cytoplasm by invagination and/or septation of the lysosomal/vacuolar membrane
(Wang and Klionsky 2003). By contrast, the most prevalent form, macroautophagy, involves the
formation of cytosolic double-membrane vesicles that sequester portions of the cytoplasm
(Klionsky and Ohsumi 1999). During macroautophagy, the sequestering vesicles, termed
autophagosomes, are not derived from the lysosome/vacuole membrane. Fusion of the completed
autophagosome with the lysosome or vacuole results in the delivery of an inner vesicle
(autophagic body) into the lumen of the degradative compartment. Subsequent breakdown of the
vesicle membrane allows the degradation of its cargo and eventually the recycling of the amino
acids and other nutrients. Although autophagy and autophagy-related processes are highly
dynamic, they can be divided into several discrete steps for the purpose of discussion: (1)
induction; (2) cargo selection and packaging; (3) nucleation of vesicle formation; (4) vesicle
expansion and completion; (5) retrieval; (6) targeting, docking and fusion of the completed
vesicle to the lysosome and (7) breakdown of the intraluminal vesicle and its cargo and recycling
of the macromolecular constituents.

12
One of the major regulatory component for sensing the extracellular milieu and
transducing it in an appropriate signal to sensors that allow the induction of autophagy is mTOR.
mTORC1 complex is a critical nutrient sensor and it causes the hyper-phosphorylation of the
Atg13 protein (Funakoshi et al. 1997). This modified form of Atg13 shows a lower affinity for
its interacting kinase Ulk/Atg1 and this impaired interaction might inhibit autophagy (Kamada et
al. 2000). mTORC1 sequesters Ulk/Atg1 in a complex with Atg13 and Fip200 in an inactive
state. Inhibition of mTOR through starvation or treatment with rapamycin results in a partial
dephosphorylation of Atg13 and allows the induction of autophagy (Noda and Ohsumi 1998).
DAP1 usually inhibits macroautophagy preventing abnormal activation of this pathway. DAP1 is
usually phosphorylated and inactivated by mTORC1 (Koren et al. 2010). Reduced mTOR
activity results also in reduced DAP1 phosphorylation (Singh and Cuervo 2011).
AMPK is another crucial regulatory component for autophagy induction (Kahn et al.
2005). As sensor of ATP/AMP/ADP ratio, this protein can translate the energetic state of the cell
into a metabolic adaptation like autophagy. AMPK interacts with Ulk/Atg1 in a nutrient-
dependent manner. AMPK phosphorylates Ulk/Atg1 and favors its release from mTORC1
(Singh and Cuervo 2011, Wong et al. 2013).
Once autophagy is initiated, a portion of cytoplasm is randomly sequestered into the
autophagosomes, even if some reports show specificity in the cargo selection (Onodera and
Ohsumi 2004). The subsequent vesicles nucleation process represents probably the least
understood step in autophagy, but likely it originates from a pre-autophagosomal structure (PAS)
already present in the cytoplasm. Vesicle expansion and completion require an ubiquitin-like
system mediating protein lipidation through the Atg8 protein (also known as LC3) (Ichimura et
al. 2000). Only two proteins are known to remain associated with the completed
autophagosomes, the specific receptor Atg19 and Atg8; other proteins that are involved in
vesicle formation presumably recycle from the PAS or the vesicles during formation, thus
enabling the retrieval of autophagy components. Of course, the timing of vesicle fusion with the

13
lysosome must be tightly regulated. Indeed, if the fusion process begins prior to completion of
the double-membrane vesicle, the cargo will remain in the cytosol. However the molecular
machinery mediating this complex process still remains in part obscure, even if several members
of the SNARE protein family have been demonstrated to be necessary (Darsow et al. 1997).
Lastly, the whole process must break down the single-membrane subvacuolar vesicles that result
from the fusion of the autophagosome with the lysosome, a step that mainly depends on the
acidic pH of the organelle (Nakamura et al. 1997).
Autophagy covers several physiological functions, ranging from a basal housekeeping role
to response to metabolic stress and regulation of cell death. Moreover, the relevance of this
cellular process at whole organism level is underlined by the observation that the genetic
ablation of many Atg genes leads to organism death due to impaired cell differentiation
(Sandoval et al. 2008), embryonic lethality or reduction of survival during peri-neonatal
starvation (Kuma et al. 2004). The repertoire of routine housekeeping functions performed by
autophagy includes the elimination of defective or damaged proteins and organelles, the
prevention of abnormal protein aggregate accumulation and the removal of intracellular
pathogens (Mizushima and Klionsky 2007). Such functions are critical for autophagy-mediated
protection against aging, cancer, neurodegenerative diseases, and infection. Although some of
these functions overlap with those of the ubiquitin-proteasome system (the other major cellular
proteolytic system) the autophagy pathway is uniquely capable of degrading entire organelles
such as mitochondria (in a process called mitophagy), peroxisomes and ER, as well as intact
intracellular microorganisms (Kim et al. 2007, Zhang et al. 2007). Furthermore, the relative role
of the autophagy-lysosome system in protein quality control may be greater than it was
previously thought. Moreover, autophagy is activated as an adaptive catabolic process in
response to different forms of metabolic stresses, including nutrient deprivation, growth factor
depletion and hypoxia. This bulk form of degradation generates free amino and fatty acids that
can be recycled in a cell-autonomous fashion or delivered systemically to distant sites within the

14
organism. Presumably, the amino acids generated are used for the de novo synthesis of proteins
that are essential for stress adaptation. It is presumed that the recycling function of autophagy is
conserved in mammals and other higher organisms, although direct data proving this concept are
lacking. The amino acids liberated from autophagic degradation can be further processed and,
together with the fatty acids, used by the tricarboxylic acid cycle (TCA) to maintain cellular ATP
production. The importance of autophagy in fueling the TCA cycle is supported by studies
showing that the phenotype of autophagy-deficient cells can be reversed by supplying them with
a TCA substrate such as pyruvate (or its membrane-permeable derivative methylpyruvate). For
example, methylpyruvate can maintain ATP production and survival in growth factor-deprived
autophagy-deficient cells that would otherwise quickly die (Lum et al. 2005). Moreover, it can
restore ATP production and the generation of engulfment signals in autophagy-deficient cells
during embryonic development (Qu et al. 2007).
Ca2+ dependent control of autophagy
The first report on Ca2+-dependent regulation of autophagy dates back to 1993 (Gordon et
al. 1993), and it suggested a complex role for Ca2+, since chelation of either intra- and
extracellular Ca2+ as well as elevating cytosolic [Ca2+] ([Ca2+]cyt) suppressed autophagy. Only
recently this topic returned to be of great interest but the published results are in conflict
regarding the role of intracellular Ca2+ in autophagy inductions.
Many reports describe Ca2+ as an inhibitor of autophagy. They are focused on the inositol
1,4,5-triphosphate (IP3) receptor (IP3R), a ubiquitously expressed intracellular Ca2+-releasing
channel, located mainly in the endoplasmic reticulum (ER). IP3Rs mediate Ca2+ release from the
ER into the cytoplasm in response to elevations in cytoplasmic [IP3] produced in cells after
stimulation for example by hormones, growth factors or antibodies (Berridge 2009). In 2005,
Sakar et al. reported the use of Li+ for autophagy stimulation (Sarkar et al. 2005). Li+ acts
through inhibition of inositol monophosphatase (IMPases), thereby reducing the IP3 levels. Also

15
chemical inhibition of IP3Rs with xestospongin (XeB) or suppression of its expression using
siRNA, also induced autophagy in HeLa cells (Criollo et al. 2007). The IP3R-mediated inhibition
of autophagy was also verified in IP3R triple knock out (TKO) chicken DT40 B lymphocytes,
which showed higher autophagy levels (Cardenas et al. 2010, Khan and Joseph 2010). Different
downstream mechanism and effectors have been proposed for the inhibitory role of IP3Rs and
Ca2+ in autophagy. In a recent study Cardenas and coworkers showed increased glucose and O2
consumption, pyruvate dehydrogenase and AMPK activation in TKO cells, suggesting a
mechanism whereby constitutive Ca2+ release through IP3Rs fuels into the mitochondria, thereby
increasing mitochondrial bio-energetics and ATP production (Cardenas et al. 2010). When these
essential Ca2+ signals are abolished there is an increased AMP/ATP ratio with a consequent
AMPK activation and a subsequent stimulation of autophagy. In this study, the authors can not
exclude a scaffold function for the IP3R.
On the other hand, treatments of cells with ER/SR Ca2+ ATPase (SERCA) inhibitors
resulted in increased autophagy. Of course, prolonged treatment with these agents leads to ER
Ca2+ depletion and subsequent ER stress, which itself might also be a trigger for autophagy
(Hoyer-Hansen and Jaattela 2007).
These models do not necessarily represent conflicting ideas, but may represent different
Ca2+-signaling modes that depend on the cellular state of the cells. While spontaneous Ca2+
signals may suppress basal autophagy in healthy cells through mitochondrial pathways, stress
conditions may promote Ca2+ signaling and thus elevate Ca2+ in the cytoplasm resulting in
autophagy stimulation through cytoplasmic effector molecules (Decuypere et al. 2011). This is
especially true for stressors that already induce a Ca2+ release into the cytoplasm, like the
SERCA inhibitor thapsigargin.
16
3.3 Ca2+ signaling: the general framework
Intracellular signaling requires messengers whose concentration rapidly and efficiently
varies with time. One of the most important messengers is Ca2+ and cells invest much of their
ATP energy to affect changes in [Ca2+]. This high consumption of ATP is balanced by the fact
that Ca2+ is one of the most important second messenger in the cell and ATP is the energy source
to allow modifications in Ca2+ concentration ([Ca2+]) in space and time (Clapham 2007). These
rapid modifications in intracellular [Ca2+] are required because Ca2+ can not be chemically
altered and for this reason changes in [Ca2+] require the binding to buffering proteins, the
compartmentalization into intracellular stores or the extrusion outside the cell (Berridge 2009).
Ca2+ binding triggers changes in protein shape and charge and consequently activates or
inhibits protein functions. The best known protein that buffers Ca2+ is calmodulin. This buffering
protein and others can control the amplitude and the timing of Ca2+ signaling (Hoeflich and Ikura
2002).
Ca2+ signaling in cells consists in dynamic variations of the cytosolic [Ca2+]. These
variations are provoked by fluxes of ions coming from two main sources: the extracellular
medium and the internal stores. The most important Ca2+ store in the cell is ER/SR, but recent
works demonstrated that also other organelles (such as Golgi apparatus, endosome and lysosome
(Pinton et al. 1998), (Calcraft et al. 2009)) are able to participate in Ca2+ signaling.
The signals that triggers Ca2+ changes generate Ca2+ waves within the cytoplasm where it
can stimulate numerous Ca2+ sensitive processes (Hajnoczky et al. 1995).
Most of the cells have a cytosolic [Ca2+] that fluctuates from 0.1 µM of resting condition to
2-3 µM after release from the stores. Cells use different types of mechanisms to access to the
different intracellular sources of Ca2+. These pathways are not exclusive and most cells express
combination of them. The best known pathway involves the release of IP3 after stimulation with
a hormone, and the consequent release of Ca2+ from the ER through the binding to the IP3R.

17
Once Ca2+ has carried out its signaling functions, it is rapidly extruded from the cytoplasm by
various pumps and exchangers and intracellular [Ca2+] returns to resting conditions.
The extrusion from the cells or the compartmentalization of Ca2+ is due to the action of
ATPase pumps that use ATP like energy sources to maintain intracellular low intracellular [Ca2+]
by extruding Ca2+ from the cells or into intracellular Ca2+ stores. In the plasma membrane there
are exchangers that exchange two Na+ with one Ca2+ and pumps (Ca2+-ATPase PMCA) that use
ATP like an energy source to extrude Ca2+ out of the cells. Other pumps return back Ca2+ into
intracellular stores, like the endoplasmic reticulum Ca2+-ATPase SERCA.
Given that the message decoded by Ca2+ is given to the cells like an oscillatory difference
of [Ca2+], it is simple to understand the high complexity of pumps and channels that, with their
activity, modulate the Ca2+ message. During the last years, many scientists focused their
attention on the identification of all the import/out-port mechanisms for Ca2+ signaling, but in
spite of this large effort, the whole scenario is not yet complete.
Mitochondria: the basics
ER and mitochondria are the main actors of Ca2+ signaling. Importantly, they are not
homogenously distributed within the cell. Indeed, they are spatially organized in order to
optimize intracellular Ca2+ signaling: some mitochondria are located in close proximity of ER-
Ca2+ source, and for this reason a major portion of the Ca2+ released into the cytoplasm is
absorbed by mitochondria. On the other hand, ER and mitochondria are strategically located near
the Ca2+ entry sites in the plasma membrane, where micro-domains of high [Ca2+] are generated
(Rizzuto et al. 1993).
The capability of mitochondria to buffer Ca2+ was first described by two key experiments
that took advantage of the possibility to target genetically encoded proteins into specific
intracellular organelles. By targeting Ca2+ sensitive photoprotein aequorin into mitochondria,
Rizzuto and coworkers demonstrated that a small increase of Ca2+ into the cytoplasm was

18
paralleled by a high increase of Ca2+ into mitochondrial matrix (Rizzuto et al. 1992).
Furthermore, labeling mitochondria with two different colored green fluorescent proteins
(GFPs), allowed demonstrating the existence of small regions (about 20% of mitochondria
surface) that are in close proximity to both ER and mitochondria (Rizzuto et al. 1998). The very
fine subcellular organization of these organelles into the cytoplasm is due to the fact that Ca2+
waves from ER regulates mitochondrial function, movement and viability and mitochondria
themselves are able to modulate the cellular response to different stimuli.
Further studies performed by my laboratory clarified the complexity of mitochondria
morphology that reflects the multiplicity of roles in the control of the intracellular response to
different stimuli. Mitochondria are composed by two membranes, the external one, that is named
outer mitochondrial membrane (OMM) that is a highly permeable membrane to ions and small
molecules, and the internal one, the inner mitochondrial membrane (IMM) that is ion
impermeable. More representative channels in the OMM are VDACs. They cluster at
ER/mitochondrial contact sites and they appear limiting for the Ca2+ uptake capacity of the
organelle (Rapizzi et al. 2002, Tan and Colombini 2007). On the other hand, IMM is an ion
impermeable membrane and it was shown that Ca2+ uptake machinery presents low affinity for
the ion. This low affinity would allow only small increase in mitochondrial [Ca2+], which could
not explain the observed rapid and huge increase of Ca2+ into mitochondrial matrix after cellular
stimulation. This apparent discrepancy was solved by the demonstration that, as mentioned
above, mitochondria are strategically located in close proximity of Ca2+ release source; this
generates micro-domains of high [Ca2+] near the mitochondrial Ca2+ uptake channels (Rizzuto et
al. 1998, Csordas et al. 1999). On the other hand, mitochondria extrude protons to create the
electrochemical gradient that allows ATP synthesis, thus generating a steep driving force for the
accumulation of the ion into the organelle.
The chemiosmotic theory of energy transfer was first demonstrated by Mitchell (Mitchell
1967) that showed that the electrochemical gradient across the IMM is utilized by the F1/F0
19
ATPase to convert the energy of NADH and FADH2, generated by the breaking down of energy
rich molecules, such as glucose, into ATP. This gradient is characterized, for the most part, by
electrical charge across the membrane (∆ψ) and, in minor part it is a H+ concentration difference
between the two compartments (∆pH). This difference of membrane potential generates a huge
driving force that allows the passage of cations through the low sensitive Ca2+ channels into the
matrix. This gradient is normally maintained in the range of -120/-200 mV.
Role of mitochondria
Mitochondria are very important components of intracellular Ca2+ signalling. Importantly
Ca2+ regulates key enzymes of the TCA cycle (McCormack et al. 1990), thus determining the
rate of ATP production and in addition it can regulate cellular metabolic adaptation to nutrient
levels and it could initiate the apoptosis process (Rasola and Bernardi 2011).
Different [Ca2+] in the mitochondrial matrix regulate aerobic metabolism, tuning
mitochondrial ATP production in the needs of a stimulated cell by the control of metabolic
enzymes. There are two Kreb cycle’s dehydrogenases (isocitrate deidrogenase and
αketoglutarato deidrogenase) that are Ca2+ sensitive since they directly bind Ca2+ and pyruvate
dehydrogenase that undergoes a dephosphorylation step that in a Ca2+ dependent manner
(Melendez-Hevia et al. 1996). Thus, the increase in Ca2+ level into the matrix modulates the
activity of Kreb cycle’s enzymes and therefore the passage of electrons through the respiratory
chain with the subsequent generation of the gradient across the IMM that is needed for ATP
production.
When Ca2+ has carried out its functions in the mitochondria, it is necessary to rapidly
extrude it in order to renew the resting balance into mitochondria. Ca2+ extrusion is finely
regulated by different exchangers. There are two major mechanisms for Ca2+ extrusion from
mitochondria; they match the exit of Ca2+ with the entrance of Na+ or H+. Recently, Sekler and

20
coworkers identified an essential component of Na+/Ca2+ exchanger, inhibited by CGP37157
(Palty et al. 2010).
If this mechanism for the regulation of mitochondria [Ca2+] fails and high levels of Ca2+ are
reached in the mitochondria, apoptosis is initiated. These observations started from the
observation that Bcl-2 has a role in the modulation of Ca2+ ions fluxes (Pinton and Rizzuto
2006).
This protein, like other anti-apoptotic proteins, reduces mitochondrial Ca2+ response to
extracellular stimuli by reducing the ER Ca2+ levels. On the other hand, pro-apoptotic proteins
exert their effect by increasing mitochondrial sensitivity. Massive Ca2+ entry into mitochondria
causes PTP opening that leads to modifications in mitochondrial morphology and the release of
pro-apoptotic factors, such as cytochrome c, that initiate the complex cascade of apoptosis.
As written above, Ca2+ was shown to play a more extended role in cellular bioenergetics,
by controlling autophagy, the adaptive response to nutrient deprivation. Constitutive Ca2+
transfer from ER to mitochondria is required for autophagy suppression (Cardenas et al. 2010)
and its absence induces prosurvival mTOR independent macroautophagy, mediated by the
activation of AMPK. It is not yet clear if this effect on autophagy is dependent from the release
from IP3R or on the amount of Ca2+ into mitochondria. Indeed, the overexpression and the
silencing of the recently identified mitochondrial calcium uniporter (MCU) exert an effect in the
AMPK activation and autophagy induction. Furthermore, it is not clear if the activation of
AMPK is simply through a metabolic effect on ATP/ADP/AMP ratio or directly on Ca2+ levels.
This could be a nice example of the activation of AMPK, sensor of nutrient availability, and the
consequent induction of a metabolic adaptation like autophagy. But still unknown are the
physiological signals that can translate fluctuations in metabolite concentration with a specific
regulation of mitochondrial Ca2+ content. I focused my PhD research on this aspect of control of
metabolism.
21
The study of the cellular processes mediated by mitochondrial calcium was severely
limited by the lack of the molecular identity of the channel responsible of Ca2+ entry into the
organelle. The electrophysiological properties of this channel, named mitochondrial calcium
uniporter (MCU) have been described in details about thirty years ago (Bernardi et al. 1984).
Indeed, it was shown its dependence on mitochondrial membrane potential, its sensitivity to
ruthenium red and its activity when extra-mitochondrial [Ca2+] are in the µM range. In this
seminal study, Clapham and coworkers in 2004 were the first to define that Ca2+ uptake was
carried out through a channel and not through a carrier. He showed that the current through this
channel is inwardly rectifying and gradually increases with the increase of free [Ca2+]. It defined
also that there is not a Ca2+ dependent inactivation because the amplitude of the current is not
altered with different [Ca2+]. Ca2+ is the primary charge carrier; indeed the channel binds Ca2+
with high affinity (Kd<2 nM) despite the low amount of cytoplasmic [Ca2+] and the abundant
cytoplasmic Mg2+ and K+ ions (Kirichok et al. 2004).
After this seminal work, many groups tried to describe this channel from the molecular
point of view. Graier and coworkers proposed in 2007 that uncoupling proteins 2 and 3 (UCP2
and UCP3) mediate mitochondrial calcium uptake (Trenker et al. 2007). This study was
controversial because the overexpression of these proteins increased the capacity of
mitochondrial Ca2+ uptake but they are non ubiquitously expressed in all tissues, as expected
from this channel, and UCP2 and UCP3 knockout mice still retain mitochondrial Ca2+ uptake.
Two years later, Clapham group’s identified by genome-wide RNAi screen in Drosophila,
Letm1 as a Ca2+/H+ antiporter (Jiang et al. 2009). This identification triggered a long discussion
because Letm1 knockdown cells demonstrate a Letm1 independent mitochondrial Ca2+ uptake
and also Letm1 containing liposomes rapidly accumulate Ca2+ in a ruthenium red dependent
mode. This antiporter is also sensitive to CGP37157, a non-selective inhibitor of Na+/Ca2+
(NCX) and H+/Ca2+ (HCX) exchangers. Moreover, these data are in contrast with previous
results on K+/H+ exchanger (Nowikovsky et al. 2004) (Dimmer et al. 2008).

22
Identification of the mitochondrial Ca2+ uniporter (MCU) and of its crucial regulator
Micu1
In the past years, the investigation of the molecular identity of the MCU benefited from the
genome-wide approach. In this respect, in a seminal piece of work, Mootha and co-workers
reported in 2008 the generation of a mitochondrial “genoteque” (MitoCarta) by performing mass
spectrometry analyses on both highly purified and crude mitochondrial preparations from 14
different mouse tissues to discover genuine mitochondrial proteins, validated by GFP tagging
(Pagliarini et al. 2008). By considering only the proteins localized into inner mitochondrial
membrane, expressed in the majority of mammalian tissue and with homologues in vertebrates
and kinetoplastids but not in the yeast, he identified a protein with unknown function, named
“mitochondrial calcium uptake 1” (MICU1). This is a mitochondrial EF hand protein required
for mitochondrial Ca2+ uptake (Perocchi et al. 2010). Its silencing abolishes mitochondrial Ca2+
uptake but it was clear that this protein was not the long searched MCU as it presents only one
transmembrane domain in the protein sequence. The two canonical EF hands are essential for its
activity in Ca2+ sensing and gating the activity of MCU. In our laboratory we demonstrated that
the overexpression of MICU1 increases mitochondrial Ca2+ uptake. Furthermore, we also found
that in the presence of µM [Ca2+], MICU1 is able to increase the open probability of the
uniporter and thus an increase in overall Ca2+ uptake into mitochondria.
Recently, Mallilankaraman K. and coworkers demonstrated that MICU1 is required to
preserve normal mitochondrial [Ca2+] under basal conditions. In its absence mitochondria
become constitutively loaded with Ca2+, triggering excessive reactive oxygen species generation
(Mallilankaraman et al. 2012).
The MitoCarta database and the identification of MICU1 laid the foundation stone for the
identification of the MCU. Indeed, our group and Mootha’s identified in 2011 a protein
CCDC109A, that fulfills all the requirements to be the mitochondrial calcium uniporter
(Baughman et al. 2011, De Stefani et al. 2011). This identification has been supported by two

23
different approaches based both on MitoCarta database. Mootha group compared MICU1
phylogenetic profile with unknown proteins profiles in order to find the channel. We used a
strategy based on the well-known properties of MCU. Among 529 candidates with ubiquitous
expression in mammalian tissues, we have selected proteins with a structure compatible with a
gated ion channel activity (i.e. two transmembrane domains), absent in Saccaromyces Cervisiae
and significantly conserved also in lower eukaryotes, such as kineetoplastids.
Mootha’s laboratory and ours demonstrated that MCU overexpression in HeLa cells
strongly increases mitochondrial Ca2+ uptake while its silencing by siRNA drastically reduces it.
The effects of overexpression are also correlated with MCU physiological role; indeed MCU-
expressing cells are more efficiently killed after apoptotic stimuli. Importantly, Mootha’s group
performs MCU silencing of MCU in vivo. They knockdown MCU in mice livers and they found
a complete loss of Ca2+ uptake in response to extramitochondrial pulses of Ca2+. Our laboratory
was able to show that MCU is necessary and sufficient to mediate Ca2+ uptake. Indeed, purified
MCU was able to form a RuR dependent channel in planar lipid bilayers.
Very recently, Mallilankaraman and coworkers identified also a new component of this
complex. Indeed, it showed that the mitochondrial Ca2+ uniporter regulator 1 (MCUR1) is an
IMM integral membrane protein that is required for MCU-dependent mitochondrial Ca2+ uptake.
Furthermore, they demonstrated that this protein is involved in the regulation of oxidative
phosphorylation and in the activation of AMPK dependent pro-survival autophagy
(Mallilankaraman et al. 2012).
3.4 Fine regulation of mitochondrial proteins
Mitochondrial proteins, once they have carried out their purpose or in response to damage,
have to be efficiently removed. Mitochondria have in place multiple quality control mechanisms.
24
Usually damaged mitochondria are removed by mitophagy, a process where damaged and
non functional mitochondria are removed via a selective process involving the autophagosome
(Pattingre et al. 2005, Narendra et al. 2008, Geisler et al. 2010, Suen et al. 2010). In this case, the
entire content of mitochondria including its proteins is subjected to lysosomal degradation.
Usually the quality control of mitochondrial proteins is ensured by ATP dependent
oligomeric proteases that survey protein quality control within the organelle and aid in the
removal of non assembled and misfolded proteins (Koppen and Langer 2007). These proteases
are found in the mitochondrial matrix (PIM1/Lon and ClpXP proteases), the inner membrane
facing the matrix (m-AAA protease) and the inner membrane facing the intermembrane space (i-
AAA protease) (Varabyova et al. 2013).
Protein degradation through the ubiquitin-proteasome system is the major pathway of non-
lysosomal proteolysis of intracellular proteins. It plays important roles in a variety of
fundamental cellular processes and the central element of this system is the covalent linkage of
ubiquitin to targeted proteins, which are then recognized by the proteasome (Livnat-Levanon and
Glickman 2011). Ubiquitynilation involves the covalent attachment of an ubiquitin molecule or a
chain of ubiquitin molecules to a lysine residues of a target protein. Like phosphorylation,
ubiquitinylation is a reversible process due to the activity of deubiquitinylation enzymes (Millard
and Wood 2006). The attached molecule or chain can affect the localization, activity, structure or
interaction partners of the target protein. One of the main functions of ubiquitinylation is to
target a protein for degradation by the 26S proteasome (Hershko and Ciechanover 1998). Until
recently it was not known whether mitochondrial inner membrane proteins were subjected to
ubiquinylation. However, recent reports suggest that ubiquitinylation may play an important role
in mitochondria protein quality control (Margineantu et al. 2007)((Radke et al. 2008). Indeed,
many proteins critical to mitochondrial function such as cytochrome oxidase subunits I, III and
IV accumulate upon proteasome inhibitor treatment (Margineantu et al. 2007) and moreover, the
cytosolic 26S proteasome has been implicated in the turnover of the uncoupling proteins 2 and 3

25
(UCP2 and UCP3) (Azzu et al. 2010, Azzu et al. 2010) and recently also the uncoupling protein
1 (UCP1) has been shown to be targeted to the proteasome (Clarke et al. 2012).

26
27
4. Aim
Mitochondria are unique organelles within the complex system of subcellular
compartments. They are involved in the regulation of a plethora of physiological and
pathological conditions. The numbers of cellular processes that are controlled by mitochondria
are object of deep investigation by several groups.
The variation of the metabolic availability induces intracellular adaptations in order to
maintain the energy status for the different cellular functions. The contribution of mitochondria
in the regulation of intracellular metabolism is well known. Due to the ATP production,
mitochondria provide energy for the cell and connect two important intracellular signals: ATP
and Ca2+. It is still unknown, which are the specific mitochondrial proteins that function as
sensors of nutrient availability and how they can translate the variation of nutrient concentrations
into modulation of Ca2+ uptake, which in turn induces intracellular adaptive processes like
autophagy.
The focus of my PhD research was to investigate the nutrient dependent control of
mitochondrial Ca2+ uptake. In particular, we took advantage from the long-standing experience
of our group in the analysis of cellular Ca2+ signals in order to precisely investigate
mitochondrial Ca2+ homeostasis during glucose deprivation. By using the most modern
technologies based on both fluorescent and bioluminescent Ca2+-probes, we also correlated the
effect of nutrient deprivation on Ca2+ signals to their consequences on induction of autophagy.
Moreover we also analyzed the possible involvement of MICU1 in this process.

28

29
5. Materials and Methods
5.1 Cell culture, transfection and proteomic analysis
All the experiments were performed in HeLa cells cultured in Dulbecco’s modified Eagle’s
medium (DMEM) (Lifetechnologies), supplemented with 10% Fetal bovine serum (FBS)
(Lifetechnologies). For minor experiment we used also MEF (mouse embryonic fibroblast),
Hek293A cultured in DMEM 10% FBS or C2C12 coltured in DMEM 10% FBS and differenciate
in DMEM 2% Horse serum (HS) (Lifetechnologies) for 5 days, MDA cultured in DMEM/F12
(1:1) (Lifetechologies, supplemented with 10% FBS.
Cells were transfected with a standard Ca2+-phosphate procedure. For Ca2+-phosphate
transfection procedure the following stock solution need to be prepeared and conserved at -20°C
until used.
- CaCl2 2.5 M.
- HEPES Buffered Solution (HBS): 280 mM NaCl, 50 mM Hepes, 1.5 mM Na2HPO4, pH 7.12.
All solutions were sterilized by filtration using 0.22 µm filters. Just before the transfection
procedure, cells are washed with fresh medium. For one 13 mm coverslip, 5 µl of 2.5 M CaCl2
were added to the DNA disolved in 45 µl of H2O. Routinely, 4 µg of DNA were used to transfect
1 coverslip. The solution was then mixed under vortex with 50 µl of HBS and incubated for 20
to 30 minutes at room temperature. For one 24 mm coverslip the amount of solution and DNA
were duplicated while for 10 cm dishes was used 50 µl of 2.5 M CaCl2, 20 µg of DNA in 450 µl
of H20 and 500 µl of HBS. The solution was then added directly to the cell monolayer. Sixteen
hours after addition or the DNA, cells were washed with PBS (two or three times until the excess
precipitate is completely removed). Experiments were carried out 24-36 hours after transfection.
MICU1 was silenced using specific siRNAs:
siMICU1 #1 TCTGAAGGGAAAGCTGACAAT
30
siMICU1 #2 GACTTCGCTTTACCCAAACAG
For glucose deprivation experiments culture medium were washed four times and then
cells were incubated for 2 hours in Krebs–Ringer modified buffer (KRB: 135 mM NaCl, 5 mM
KCl, 1 mM MgSO4, 0.4 mM K2HPO4, 20 mM HEPES, pH=7.4) with or without 25 mM glucose.
Most experiments were performed adding 1 mM CaCl2.
Cells were lisated in lysis buffer (150 mM NaCl, 50 mM Tris, 1 mM EGTA, 1% Triton
X-100) and after a brief sonication 20-40 µg of total proteins were separated by SDS-PAGE gel
electrophoresis in 4-12% SDS-bis,tris,acrylamide gels (Lifetechnologies), transferred to
Nitrocellulose membrane (Lifetechnologies), stained with Ponceau S solution and
immunoblotted against MICU1 (1:1000), Actin (1:7500), HA (1:1000; IF; 1:100), FLAG
(1:1000). These antibodies were purchased from Sigma-Aldrich. TOM20 (1:5000), (WB,
1:10000) were purchased from Santa Cruz Biotechnologies. P-AMPK (1:500), AMPK (1:1000),
Acetyl-lysine (1:1000) were purchased from Cell Signaling. VDAC2 (1:1000) was purchased
from Abcam. Secondary, HRP-conjugated antibodies (1:10000) were purchased from BioRad.
All chemicals were purchased from Sigma-Aldrich, unless specified.
5.2 MICU1 expression constructs
The pcDNA3.1MICU1-HA, pcDNA3.1MCU-HA and pcDNA3.1MCUD260N, E263Q-HA
expression constructs were provided by De Stefani et al. 2011 (De Stefani et al. 2011).
- The generation of the pcDNA3.1MICUK102R-HA was performed by mutagenesis PCR using
the wild type pcDNA3.1-MICU-HA as template and the mutagenesis primer:
GCCTTATCCTGAGGACAAGAGGAAGAAGCGCTCTGGATTCA
-The generation of the pcDNA3.1MICUK103R-HA was performed by mutagenesis PCR using the
wild type pcDNA3.1-MICU-HA as template and the mutagenesis primer:

31
CTTATCCTGAGGACAAGAAGAGGAAGCGCTCTGGATTCAGAG
- The generation of the pcDNA3.1MICUK104R-HA was performed by mutagenesis PCR using the
wild type pcDNA3.1-MICU-HA as template and the mutagenesis primer:
ATCCTGAGGACAAGAAGAAGAGGCGCTCTGGATTCAGAGAC
- The generation of the pcDNA3.1MICUK296R-HA was performed by mutagenesis PCR using the
wild type pcDNA3.1MICU-HA as template and the mutagenesis primer:
CTCAAAGGGAAACTGACCATCAGAAACTTCCTGGAATTTCAGCGC
- The generation of the pcDNA3.1MICUK359R-HA was performed by mutagenesis PCR using the
wild type pcDNA3.1-MICU-HA as template and the mutagenesis primer:
AGAAGCACTTCAAAGATGGGAGGGGCCTGACTTTCCAGGAG
- The generation of the pcDNA3.1MICUD233A, E244K-HA was performed by mutagenesis PCR
using the wild type pcDNA3.1MICU-HA as template and the mutagenesis primer:
TGAAATTGCTTTCAAGATGTTTGCCTTGAATGGAGACGGAGAGGTAGACATGGAGA
AGTTTGAGCAGGTTCAGAGC
- The generation of the pcDNA3.1MICUD233A, E244K, D423A, E434K-HA was performed by
mutagenesis PCR using the wild type pcDNA3.1MICUD233A, E244K-HA as template and the
mutagenesis primer:
GTGGTGTTCGCGCTCTTTGCCTGTGATGGCAATGGGGAGCTGAGCAACAAGAAGTT
CGTTTCCATCATGAAGC
The protocol for one step direct mutagenesis were described in Marianne Ratcliffe &
Sergei Sokol, (Ratcliffe et al. 2000), and adapted from Makarova et al.,(Makarova et al. 2000);
and Chen et al, (Chen et al. 2000).
For the cloning of MICU1K296R-HA in pEGFP-N1 the cDNA was subloned from
pcDNA3.1MICU1K296R-HA to pEGFP-N1.

32
5.3 Aequorin as a Ca2+ indicator
Aequorin is a 22 KDa photoprotein isolated from jellyfish Aequorea Victoria which emits
blue light in the presence of Ca2+. The aequorin originally purified from the jellyfish is a mixture
of different isoforms called “heterogeneous aequorin” (Shimomura 1995). In its active form the
photoprotein includes an apoprotein and a covalently bound prosthetic group, coelenterazine.
The apoprotein contains four helix-loop-helix “EF hand” domains, three of which are Ca2+-
binding domains (Inouye and Tsuji 1993). These domains confer to the protein a particular
globular structure forming the hydrophobic core cavity that accommodates the ligand
coelenterazine. The binding cavity for coelenterazine is situated in the centre of the protein; this
cavity is closed to a spherical probe, indicating that the outside molecules have no access to the
coelenterazine moiety. When Ca2+ ions bind to the three high affinity EF hand sites,
coelenterazine is oxidized to coelenteramide, with a concomitant release of CO2 and emission of
light (Head et al. 2000). Although this reaction is irreversible, an active aequorin can be obtained
in vitro by incubating the apoprotein with coelenterazine in the presence of oxygen and 2-
mercaptoethanol. Reconstitution of an active aequorin (expressed recombinantly) can be
obtained also in living cells by simple addition of coelenterazine into the medium.
Coelenterazine is highly hydrophobic and has been shown to permeate cell membranes of
various cell types. Different coelenterazine analogues have been synthetized and are now
commercially available from Molecular Probes.
The possibility of using aequorin as Ca2+ indicator is based on the existence of a well-
characterized relationship between the rate of photon emission and the [Ca2+].
The first method used to correlate the amount of photons emitted to the [Ca2+], was that
described by Allen and Blinks (Allen and Blinks 1978). In the following years, this system was
improved to achieve a simple algorithm for converting aequorin luminescence into [Ca2+] values.
This mathematical approach reposes on an accurately relationship between [Ca2+] and the
logarithm of L/Lmax, where L is the instant rate of light emission and Lmax is the maximal

33
values of light emission measured in saturated conditions. For the native jellyfish photoprotein,
in this logarithmic scale the response are linear in the physiological range of cytosolic [Ca2+], i.e.
between 107 and 105, thus allowing careful calibration of the luminescence signal into absolute
[Ca2+] values.
The rate of aequorin luminescence is independent of [Ca2+] at very high (>10-4 M) and
very low (<10-7 M) [Ca2+]. However, as described below in more details, it is possible to expand
the range of [Ca2+] that can be monitored with aequorin.
Ion concentration affects the luminescence of aequorin because ions are competitive
inhibitors of Ca2+. pH was also shown to affect aequorin and for this reason experiments with
aequorin need to be done in well-controlled conditions of pH and ionic concentration.
Recombinant aequorins
Aequorin began to be widely used when the cDNA encoding the photoprotein was cloned,
thus circumventing the need for purification of the native polypeptide and microinjection and
also open the possibility of molecular engineering the protein sequence; introducing specific
targeting sequences and thus directing the Ca2+ probe to a defined subcellular compartment.
Indeed, the analysis of a large number of amino acids sequences has highlighted short
presequences shared by proteins with the same subcellular location. Deletion analysis
experiments have shown that these amino acids presequences are sufficient and necessary for a
correct intracellular sorting of the protein (Hartl et al. 1989, Nothwehr and Gordon 1990, Garcia-
Bustos et al. 1991).
By introducing minimal sequences (as for mitochondrial targeting) or larger targeting
information (such as the entire hormone-binding domain of the glucocorticoid receptor, thus
retaining the property of shuttling from the cytosol to the nucleus in a hormone-dependent
manner), a large panel of aequorin chimeras with defined subcellular distribution was

34
constructed. The selective localization allowed monitoring for the first time Ca2+ dynamic in
specific subcellular compartment.
Below we briefly describe the constructs used in our experiments (Brini 2008):
- Cytoplasmic (cytAEQ): an unmodified aequorin cDNA encodes a protein that, in mammalian
cells is located in the cytoplasm and, given its small size, also diffuses into the nucleus.
- Mitochondria (mtAEQ): mtAEQ was generated to measure the [Ca2+] of the mitochondrial
matrix of various cell types. This construct includes the targeting presequence of subunit VIII of
human cytochrome c oxidase fused to the aequorin cDNA. To expand the range of Ca2+
sensitivity that can be monitored the photoprotein was also mutated (Asp119>Ala). This point
mutation affects specifically the second EF hand motive of wild type aequorin. The affinity for
Ca2+ of this mutated aequorin (mtAEQmut) is about 20 fold lower than that of the wild type
photoprotein.
Luminescence detection
The aequorin detection system is derived from that described by Cobbold and Lee
(Cobbold and Bourne 1984) and is based on the use of a low noise photomultiplier placed in
close proximity (2-3 mm) of aequorin expressing cells. The cell chamber, which is on the top of
a hollow cylinder, is adapted to fit 13-mm diameter coverslip. The volume of the perfusing
chamber is kept to a minimum (about 200 µl). The chamber is sealed on the top with a coverslip,
held in place with a thin layer of silicon. Cells are continuously perfused via peristaltic pump
with medium thermostated via a water bath at 37°C. The photomultiplier (Hamamatsu H7301) is
kept in a dark box. The output of the amplifier-discriminator is captured by C8855-01 photon-
counting board in an IBM compatible microcomputer and stored for further analysis.
35
Experimental procedures
Cytoplasmic [Ca2+] and mitochondrial [Ca2+] were measured in cells using appropriate
cytosolic (cytAEQ) and mitochondrial (mtAEQmut) chimeras (Pinton et al. 2007). Cells were
seeded 24 hours before transfection onto 13 mm glass coverslips and allowed to grow to 50%
confluence before transfection. Cells were transfected with CytAEQ or mtAEQmut probe (as
previously described (Pinton et al. 2007)) together with the indicated siRNA or plasmid.
pcDNA3.1 was used as control for transfection. The coverslip with the cells was incubated with
5 µM coelenterazine for 2 hours in KRB with or without 25 mM glucose, supplemented with
1mM CaCl2, and then transferred to the perfusion chamber. All aequorin measurements were
carried out in KRB. Agonists and other drugs were added to the same medium. The most
common stimuli used for maximal stimulation are: 100 µM histamine, 100 µM ATP, 0.5 mM
carbachol, 100 µM norepinephrine, 100 nM bradikynin. The experiments were terminated by
lysing the cells with 100 µM digitonin in a hypotonic Ca2+-rich solution (10 mM CaCl2 in H2O),
thus discharging the remaining aequorin pool. The light signal was collected and calibrated into
[Ca2+] values by an algorithm based on the Ca2+ response curve of aequorin at physiological
conditions of pH, [Mg2+] and ionic strength, as previously described (Pinton et al. 2007).
Representative traces are shown in the figures whereas column graphs are the results of the full
dataset.
Statistical data are presented as mean ± S.E.M. unless specified, significance was
calculated by Student’s t test, *p<0.05, **p<0.001.
In the experiments with permeabilized cells, a buffer mimicking the cytosolic ionic
composition, (intracellular buffer [IB]) was employed: 130 mM KCl, 10 mM NaCl, 2 mM
K2HPO4, 5 mM succinid acid, 5 mM malic acid, 1 mM MgCl2, 20mM HEPES, 1 mM pyruvate,
0.5 mM ATP and 0.1 mM ADP (pH 7 at 37°C). IB was supplemented with either 100 µM EGTA

36
(IB/EGTA) or a 2 mM EGTA and 2 mM HEEDTA-buffered [Ca] of 1 or 2 µM (IB/Ca2+),
calculated with Chelator software (Schoenmakers et al. 1992).
HeLa cells were permeabilized by a 1 min perfusion with 50 µM digitonin (added to
IB/EGTA) during luminescence measurements. Mitochondrial Ca2+ uptake speed was calculated
as the 1st derivative by using the SLOPE excel function and smoothed for 3 time points. The
higher value reached during Ca2+ addition represents the maximal Ca2+ uptake speed.
Also for capacitative Ca2+ influx experiment cells were reconstituted and starved for 2
hours before the experiment. This procedure allows evaluating Ca2+ influx through store operated
channels if we were measuring cytoplasmic Ca2+ level with CytAEQ or mitochondrial Ca2+
uptake independently to ER Ca2+ release if we were measuring mitochondrial [Ca2+] with
mtAEQmut. ER was emptied by treatment with cyclopiazonic acid (CPA), a highly selective
reversible inhibitor of Ca2+-ATPase in the intracellular Ca2+ storage sites. Cells were perfused
with KRB without Ca2+ and with 100 µM EGTA and then for 3 minutes with KRB without Ca2+
and with 100 µM EGTA and 20 µM CPA. During this period ER was emptied and a little and
slow increase in cytoplasmic Ca2+ was observed. This cytoplasmic [Ca2+] is directly correlated
with the amount of ER Ca2+ released.
After that, cells were perfused with KRB with 2 mM Ca2+ and 20 µM CPA. During this
perfusion the Ca2+ influx through the plasma membrane (CytAEQ) and into mitochondria
(mtAEQmut) could be evaluated.
5.4 Imaging techniques
All imaging experiments were carried out on three digital imaging systems. FRET
measurements were carried out on an inverted Zeiss Axiovert 100 TV equipped with a
63x/1.4N.A. objective. The probe was excited by a LED-based illumination device (OptoLED,
Cairn Research) with a 436/20 nm bandpass filter. Donor and acceptor wavelength were
37
separated by a beamsplitter device (Optosplit, Cairn Research) using a 480/40 nm filter for the
CFP, a D505 dichroic mirror and a 535/30 nm filter for the cpVenus. Images were collected with
a front-illuminated CCD camera (Photometrics CoolSnap ES2). TMRM and SypHer imaging
were performed on an inverted Zeiss Axiovert 200 equipped with a 40x 1.3N.A. objective.
SypHer was excited by a 75W Xenon lamp equipped with a prism-based monochromator (PTI)
at 430nm and 485 nm. Probe emission was collected through a 525/30 nm bandpass filter.
Images were collected with a back-illuminated EMCCD camera (Photometrics Cascade 512B) at
200-300 ms exposure time. TMRM was imaged on the same microscope but using a spinning
disk confocal head (BD CarvII). Probe was excited by a 300W Xenon arc lamp (Sutter Lambda
LS) with a 543/22 nm filter and collected through a 593/40 nm emission filter. ER/mitochondria
contact sites were imaged on a Leica TCS-SP5-II confocal system equipped with a PlanApo
100x/1.4 N.A. objective. For all images, pinhole was set to 1 airy unit, pixel size was about 100
nm and a Z-stack was acquired for the whole depth of the cell by sampling at 130 nm in the Z
plane. 488 nm Ar-laser line was used to excite GFP and its signal collected in the 492-537 nm
range, while RFP fluorescence was excited by the 543 nm HeNe laser and its emission was
collected in the 555-700 nm range. For each image, PMT gain was slightly adjusted in order to
maximize signal and avoid saturation.
Cameleon as Ca2+ probe
Cameleons are FRET-based ratiometric Ca2+ probe. The molecular structure is based on
two variant of GFP (having differing excitation and emission characteristics), calmodulin (CaM),
and the calmodulin-binding domain of myosin light chain kinase (M13). It was created by Roger
T. Tsien and coworkers (Palmer and Tsien 2006). The excitation energy of one fluorophore (the
donor) is transferred to another (the acceptor) by dipolar interactions, without fluorescence
emission (FRET). The donor emission and acceptor absorption spectra must overlap for FRET to
occur. Calmodulin is able of bind Ca2+ ions and the M13 chain can bind with calmodulin after it
38
has bound the Ca2+ ions. The bindind of Ca2+ by the calmodulin moiety of cameleon produces a
conformational change of the entire molecule and the consequent positions of the two
fluorescent proteins into close spatial proximity. In this conformation, dipolar energy transfer by
the excited donor protein stimulates the acceptor to produce secondary fluorescence. Intracellular
[Ca2+] can be determined by fluorescence ratio imaging. Also cameleon based probe can be
targeted into different intracellular compartment. The first cameleon developed had high pH-
sensitivity but during the years cameleon were engineered in order to overcome this problem.
There are several cameleon probes available that differ for the Ca2+-binding affinity and for the
GFP variants used.
In our experiments we used two mitochondrially-targeted cameleons with two different
affinities for Ca2+-binding. The GFP variants used are CFP (the donor) and cpVenus (the
acceptor).
HeLa cells were grown on 24 mm coverslips and transfected with 4mtD1cpv and
4mtD3cpv (Palmer et al. 2004, Palmer et al. 2006). 24-48 hours after transfection HeLa cells
were mounted into an open-topped chamber and maintained in KRB. Cells were stimulated by
applying 10 µM histamine as stimulus; thereafter, Ca2+ ionophore ionomycin (5 µM) with a
CaCl2 saturating concentration (5 mM) were applied to completely discharge the stores and to
verify the dynamic range of each probe. Image analysis was performed by the public domain
ImageJ program (developed at the U.S. National Institutes of Health by Wayne Rasband and
available on the Internet at http://rsb.info.nih.gov/ij/). Regions of interest (ROIs) were selected
covering essentially mitochondria (identified based on their morphology). Subsequently, a ratio
between cpVenus and CFP emission was calculated. Data are presented as normalized ratio for
4mtD1cpv or for the ratio difference between the starting point (Rmin) and the point reach after
agonist stimulation (R) for 4mtD3cpv.

39
5.5 Measurement of Mitochondrial Membrane Potential
The measurement of mitochondrial membrane potential is based on the distribution of
lipofilic cations. They are fluorescent and membrane permeable and their distribution into
intracellular compartment is due only to electrochemical gradients (Scaduto and Grotyohann
2000). The mitochondrion-selective tetramethylrhodamine dye (TMRM) was used to measure
mitochondrial membrane potential in HeLa cells. The accumulation of TMRM in mitochondria
at low concentrations was shown to be driven by their membrane potential (-150/-180mV). In
order to promote the correct distribution of the probe, cells are loaded with very low
concentration (10-40 nM). Changes in mitochondrial membrane potential will cause a
redistribution of the dye between mitochondria and cytoplasm. Data are expressed as percentage
difference between the TMRM fluorescence before and after FCCP (10µM) depolarization.
Confocal laser microscope (Zeiss Axiovert 200, objective PlanFluar 40X/1.3) was used in
TMRM experiment.
Cells were starved in KRB for 1 hour and 30’ and then were loaded with TMRM stock
solution for 30’ at 37°C. The probe was excited at 560 nm and the emission light was recorded in
the 590-650 nm ranges.
5.6 SypHer
The measurement of mitochondrial pH gradient is the sole driving force for the
electroneutral transport of many ions and metabolites in and out of the mitochondrial matrix. In
order to determine the mitochondrial matrix pH, a ratiometric circularly permuted YFP was
used. This probe allow us to real time measure the mitochondrial matrix pH in intact cells
(Poburko et al. 2011). HeLa cells were grown onto 24 wells until 50% and then transfected with
4 µg of mtSypher with a standard Ca2+-phosphate procedure. 24 hours after transfection SyPher
expressing cells were starved for 2 hours and then mounted into an open-topped chamber and

40
maintained in KRB with or without 25 mM glucose. After KRB whashout, pH was stepped
between 5.5 and 10 by turnover the bath solution. The solutions added were a Ca2+-free
intracellular buffer: 130 mM KCl, 10 mM NaCl, 2 mM K2HPO4, 1mM MgCl2 supplemented
with 20 mM MES (adjusted to pH 5.5 and 6.5 with KOH) or 20 mM HEPES (adjusted to pH 7.0
and 7.5 with KOH) or TRIS (adjusted to pH 8.0 and 9.0 with HCl) or Acid Boric (adjusted to pH
9.5 and 10 with KOH). For each experiment monensin (ionophore 5 µM) and nigericin (N+/H+
antiporter 1 µM) were also added to these Ca2+-free intracellular buffers in order to increase the
velocity to reach equilibrium between the external medium and the pH into the intermembrane
space.
Fluorescence ratio (F480/430) was calculated in MetaFluor 6.3 (Universal Imaging) and
analysed in Excel (Microsoft). For each cell, a 8-point calibration curve was fitted to a variable
slope sigmoid equation
5.7 Morphological analysis
ER-mitochondria colocalization
ER-mitochondria interactions are studied by confocal images of HeLa cells coexpressing a
mitochondria-targeted RFP (mit-RFP) and an ER-targeted GFP (ERD1cpv). Cells were excited
separately at 488 nm or at 543 nm, and the single images were recorded. Single channel images
were then merged. Statistical quantification of the overlapping signal area (OSA) was performed
from single confocal images by the public domain ImageJ program with Jacop plugin (Bolte and
Cordelieres 2006). Pearson’s correlation index, an overlap coefficient that is commonly used to
measure the amount of overlap between two image pairs, was obtained to determine the amount
of localization between ER and mitochondria (Manders et al. 1992).

41
Immunofluorescence
HeLa cells were grown on 24 mm coverslips and transfected with MICU-HA and/or mit-
RFP encoding plasmid. After 24 hours, cells were washed with PBS, fixed in 4% formaldehyde
for 10 minutes and quenched with 50 mM NH4Cl in PBS. Cells were permeabilized for 10
minutes with 0.1% Triton X-100 in PBS and blocked in PBS containing 2% BSA for 1 hour.
Cells were then incubated with primary antibodies (anti-HA) for 3 hours at room temperature
and washed 3 times with 0.1% Triton X-100 in PBS. The appropriate isotype matched
AlexaFluor conjugated secondary antibodies (Lifetechnologies) were used and coverslips were
mounted with ProLong Gold Antifade reagent (Lifetechnologies).
Confocal images were recorder and quantification of the number and the volume of the
mitochondria were performed from ImageJ program.
5.8 Luciferin-Luciferase system
There are different methods to measure intracellular ATP production and the major
difference is if they can discriminate ATP production from different subcellular site or not. We
used an approach based on specific targeting luciferase into different subcellular compartments.
Luciferase as an ATP probe: The direct measurement of mitochondrial and cytosolic ATP
levels is based on specifically targeted chimeras of the ATP-dependent photoprotein luciferase.
The cDNA of luciferase was cloned into different plasmid in order to have different intracellular
localization (Jouaville et al. 1999). Cells were seeded for transfection onto 13-mm coverslip and
grown to 50% confluence. Transfection with cytLUC cDNA was carried out according to a
standard Ca2+-phosphate procedure. The day after, cells were tripsinized and transferred onto
96wells (one 24well divided onto eight 96wells). 48 hours after transfection cell luminescence
was measured in a multimode plate reader (Perkin Elmer Envision). During the experiment cells
are maintained in KRB with or without 25 mM glucose, 1 mM CaCl2 and 20 µM lucifern. As
control were used the inhibitor of ATP synthase oligomycin (10 µM), and the glycoslisis blocker

42
2-deoxiglucose (10 mM).
5.9 ROS production measurement
ROS production was measured using a 2’,7’-dichlorfluorescein diacetate (DCFDA). This
dye is fluorogenic and after diffusion into the cell, DCFDA is deacetylated by cellular esterases
to a non-fluorescent compound, which is later oxidized by ROS into 2’,7’-dichlorofluorescin
(DCF). DCF is highly fluorescent compound, which can be detected by fluorescence
spectroscopy with maximum excitation and emission spectra of 495 nm and 529 nm
respectively. HeLa cells were growth in 96 wells until 80% confluence. Just before the
experiment the dye was reconstituted in DMSO (stock solution 5 mM) and then HeLa cells were
loaded with 5 µM DCFDA for 30 minutes at 37°C. HeLa cells were washed four times and then
treated with KRB with or without 25 mM glucose. H2O2 dilution scale was used as positive
control. Fluorescence emission was measured at Envision plate reader.

43
6. Results
6.1 Role of mitochondria as sensors of nutrient availability
Intracellular signals can be translated through mitochondria into specific actions in order to
maintain intracellular homeostasis. A good example of this important function mediated by
mitochondria is the identification of the role of constitutive Ca2+ transfer from ER to this
organelle. Indeed, constitutive Ca2+ release from ER was shown to suppress a prosurvival mTOR
independent macroautophagy; in its absence cells activates this adaptive response mediated by
the activation of AMPK (Cardenas et al. 2010). Until now it is still unknown if this effect on
macroautophagy is dependent on Ca2+ release from IP3R per se or if the amount of Ca2+ into
mitochondria is the real determinant of this function. In support of the latter mechanism, the
overexpression and the silencing of the recently discovered mitochondrial calcium uniporter
(MCU) (De Stefani et al. 2011) exerts an effect in the AMPK activation and autophagy
induction. Furthermore, it is not clear if the activation of AMPK is a metabolic consequence of
the effect on ATP/ADP/AMP ratio or if it is directly mediated by Ca2+ levels. What is clear is
that AMPK is a key protein sensor of nutrient availability and its activation involves also
mitochondrial Ca2+ signalling. It is unknown if metabolic availability can also be translated into
specific metabolic adaptations through mitochondria. During my PhD project we analyzed the
changes of mitochondrial [Ca2+] after nutrient deprivation.
Mammalian cells need different metabolites to support their growth. The most important
are amino acids, growth factors and glucose. Glucose and its metabolites are also important as
primary messenger molecules, signalling optimal growth conditions to the cellular machinery. Its
intracellular signalling involves specific glucose transporter, the activation of protein kinase C
(PKC) and the mitogen-activated kinases (MAPK) with the consequent stimulation of gene
expression (i.e. TGFβ) (Haneda et al. 2003).

44
We decided to focus our attention on the study of the contribution of glucose to cellular
signalling pathways. Indeed, we decided to completely remove all metabolites and to add to
control cells only glucose. The model of glucose deprivation is thus HeLa cells starved for 2
hours in KRB compared to HeLa cells in KRB with 25 mM glucose. Two hours of glucose
deprivation induce a constant decrease in total protein deacetylation as consequence of Sirtuins
activation and a strong phosphorylation of AMPK (Figure 1A). This result further underlines that
these proteins are key sensors of nutrient availability. We wondered whether there is a common
converging signalling pathway that links changes of nutrient availability with the activation of
these proteins. We therefore asked whether mitochondrial Ca2+ content plays a key role in this
process.
Our main working hypothesis is that there is a feedback loop: on one hand some protein
sensors of nutrient availability can sense mitochondrial Ca2+ content; on the other hand, they can
sense nutrient levels and in turn control the amplitude of mitochondrial Ca2+ response.
My research was focused on the regulation of Ca2+ content by post-translational
modifications occurring in mitochondria after nutrient deprivation and the intracellular processes
that are activated by this modification.
The amount of mitochondrial Ca2+ determines the activation of AMPK
We first verified if changes in the amplitude of the mitochondrial Ca2+ transient could tune
the activation of AMPK. 80% confluent HeLa cells were treated with and AMP mimetic
(AICAR 0.5 mM) that is an AMPK activator. In order to change the amplitude of the
mitochondrial Ca2+ transient, HeLa cells were treated with CGP37157 (20 µM). CGP37157 is a
selective inhibitor of the mitochondrial Na+/Ca2+ exchanger, the major mechanism of Ca2+
extrusion from mitochondria to cytoplasm. After sixteen hours of treatment, HeLa cells were
lysed and 20 µg were separated by SDS-PAGE. As expected, an AMP mimetic (AICAR)
treatment induces a strong phosphorylation and thus activation of AMPK. Interestingly, AMPK

45
activation by AICAR can be blocked by an increase of mitochondrial Ca2+ transient, by blocking
the mitochondrial Ca2+ extrusion (Figure 1B). Thus, it is clear that the amount of Ca2+ into
mitochondria determines the AMPK activation.
This effect on AMPK could be direct or a consequence of the known modulation of
mitochondrial ATP production.
SIRT1 and SIRT3 overexpression controls mitochondrial Ca2+ uptake
Sirtuin proteins are a family of NAD+-dependent protein deacetylases that are important
regulators of cellular metabolism (Blander and Guarente 2004). Indeed protein acetylation is a
post-translational modification that has a key role in the control of important metabolic
pathways. As discussed in the introduction, three sirtuins, SIRT3, SIRT4 and SIRT5 localize to
mitochondria and SIRT3 expression is activated during nutrient deprivation (Nogueiras et al.
2012). This increase in SIRT3 expression helps the switch to fasting metabolism, as tissues move
away from glucose instead of lipids and amino acids as a source of energy.
We started to study the role of Sirtuins as sensors of nutrient availability and we first asked
if they play a role in the control of mitochondrial Ca2+ uptake. To assess a direct role of Sirtuins
on mitochondrial Ca2+ uptake we co-expressed in HeLa cells different Sirtuin proteins and
mitochondrial targeted aequorin-based Ca2+ probe (mtAEQmut), and we evaluated organelle
Ca2+ responses to agonist stimulation. After reconstitution with the aequorin co-factor
coelenterazine for 2 hours, cells were challenged with histamine and luminescence was
measured and converted to [Ca2+]. We found that SIRT1 and SIRT3 have a role in the control of
the magnitude of Ca2+ transients inside mitochondria. Indeed the mitochondrial Ca2+ rise in
SIRT3 and SIRT1 overexpressing HeLa cells was reduced (Figure 1C).

46
Figure 1A, B, C. Effect of AMPK and Sirtuins activations. (A) Immunoblot analysis of phosphorylation of AMPK prepared from HeLa cells. HeLa cells were starved for 2 hours in KRB with or without 25mM glucose. (B) Immunoblot analysis of phosphorylation of AMPK prepared from HeLa cells treated for 16 hours with AICAR 0.5 mM and/or 20 µM CGP1375. (C) HeLa cells were transfected with mitochondrial targeted aequorin and [Ca2+] was measured as described in the Materials and Methods section. During Ca2+ experiment cells were maintained in KRB + 1 mM Ca2+ + 5 mM glucose. Control trace is shown in grey; traces from cells co-transfected with Sirtuins are shown in pink scale. Mean ± S.E.M. of values are shown.
6.2 Glucose deprivation decreases mitochondrial Ca2+ uptake
Glucose (C6H12O6) is a simple monosaccharide that it is used as the primary source of
energy, representing the main fuel for cellular energy production, as discussed in the
introduction section. The fate of this simple monosaccharide is through three different ways. It
can be stored; it can be converted through glycolysis into pyruvate in order to provide few ATP
molecules; finally, the product of glycolysis, pyruvate, can then enter mitochondria where it is
further processed by TCA cycle. Reducing equivalents derived by TCA cycle fuel the oxidative
phosphorylation and lead to efficient ATP production.
Glucose deprivation is a pathologically relevant event. Diabetes is one of the well-known
pathology of deregulation of glucose metabolism. It affects body’s ability to use glucose because

47
it interferes with two hormones that maintains constant blood glucose level. Understanding
cellular response to glucose withdrawal could bring out new strategies to overcome the diabetes
damage. On the other hand, cancer cells base their metabolism on glycolysis in a phenomenon
termed “Warburg effect”. This metabolic adaptation allows cancer cells to overcome the growth
factor dependence that normally controls the nutrients intake. Independently of the growth factor
stimulation, cancer cells uptake an excess of nutrients, particularly glucose, that exceeds the
bioenergetics demands. This ability enables cancer cells to proliferate and survive in hypoxic
areas. Better understanding the link between glucose availability and metabolic adaptation in
cancer cells, may ultimately lead to better treatments for human cancer.
For many years researchers have focused their studies on the understanding of the effects
of glucose withdrawal on intracellular signalling. There are proteins that are involved in energy
and nutrient sensing, including AMPK and mTORC1, that trigger metabolic adaptation like
autophagy.
In cancer cells modification in cellular microenvironment (i.e., nutrient availability) can
alter the cellular redox balance, provoking a positive feedback loop that amplifies ROS levels
above a toxicity threshold resulting in cell death (Graham et al. 2012). Furthermore,
understanding which proteins are involved in these systems offers a scaffold for synergistic
combination of therapeutics targeting signalling, metabolism and redox homeostasis.
Given the central role of mitochondria in the maintenance of intracellular homeostasis, we
focused our attention on the identification of the proteins that in different feeding conditions can
modulate mitochondrial Ca2+ levels and which intracellular response to different feeding
conditions are triggered by this modification. It is known that ROS production by mitochondria
triggers the response of glucose availability (Li et al. 2011), but we hypothesize the existence of
a more precise response that involves sensor proteins and triggers autophagy as survival
mechanism instead of cell death caused by apoptosis for excessive ROS production.

48
To assess a direct role of glucose deprivation on mitochondrial Ca2+ uptake, we expressed
in HeLa cells mitochondrial targeted aequorin-based Ca2+ probe (mtAEQmut), and evaluated
organelle Ca2+ responses to agonist stimulation. After reconstitution with the aequorin co-factor
coelenterazine and the simultaneous glucose deprivation for 2 hours, cells were challenged with
histamine and luminescence was measured and converted to [Ca2+]. We found that, after 2 hours
of glucose deprivation, mitochondrial Ca2+ uptake drastically decreases (60% reduction in
mitochondrial [Ca2+], Figure 2A). We performed the same experiment also in other cell type
such C2C12 myoblasts (data not shown), myotubes (Figure 2B) or MEFs (mouse embryonic
fibroblasts) (data not shown) with the same results. These data suggest that the inhibition of
mitochondrial Ca2+ transient is a common signalling event that correlates with glucose
deprivation.
Figure 2A, B. Effect of glucose withdrawal on mitochondrial Ca2+ uptake. (A) HeLa cells were transfected with mitochondrially targeted aequorin and [Ca2+] was measured as described in the Materials and Methods section. HeLa cells were starved for 2 hours. (B) C2C12 were grown until 80% and then infected with Ad-mtAEQmut and differentiated in DMEM 2% Horse serum for five days. Myotubes were starved for 2 hours in KRB with or without 25 mM glucose and then were challenged with 500 µM carbachol or 50 mM caffeine. Control trace is shown in grey; the trace from starved cells is shown in orange. Mean ± S.E.M. of values are shown.
49
We confirmed this data also with a FRET-based Ca2+ probe Cameleon (54% reduction in
mitochondrial [Ca2+] Figure 2C) (Palmer and Tsien 2006). We used two mitochondrially targeted
Cameleons (4mtD1cpv or 4mtD3cpv), that differ for their Ca2+ binding affinity (Palmer et al.
2004, Palmer et al. 2006). These probes belong to a new class of indicators for Ca2+ ion
concentration in living cells which operate through a conformational change that results in
fluorescence resonance energy transfer (FRET) in presence of Ca2+ ions.
We used 4mtD1cpv to measure the mitochondrial Ca2+ increase after cell stimulation with
an agonist. The starting level for sensor in each experiment was considered like Rmin: the
subsequent addition of 10 µM histamine caused an increase in the FRET ratio as Ca2+ released
form ER is uptaken by the mitochondria. Once the FRET ratio returned to baseline, cells were
washed and calibration of the sensor was performed. Cells were treated with 5 µM ionomycin in
5 mM CaCl2 to obtain the Rmax, the ratio at saturating Ca2+ levels. We tried two different
experimental approaches, first, we starved HeLa cells for 2 hours and then we performed the
Ca2+ measurement (Figure 2C); second, we starved HeLa cells and we acquired the Cameleon
probe emission under the microscope at the same time (data not shown). We used as positive
control a dominant negative form of mitochondrial Ca2+ uniporter (MCUD260N, E263Q) that causes
a reduction in mitochondrial Ca2+ uptake (De Stefani et al. 2011).
We used 4mtD3cpv to measure mitochondrial Ca2+ resting level. We starved HeLa cells
for 2 hours and then we acquired the baseline ratio of different cells for 30 sec (Figure 3A). We
used MICU1 silencing as positive control of basal mitochondrial [Ca2+] accumulation because it
has been demonstrated that HeLa cells mitochondria become constitutively loaded with Ca2+
after MICU1 silencing (Mallilankaraman et al. 2012).
These data confirm the aequorin-probe based experiment (Figure 2A). After 2 hours of
glucose deprivation, mitochondrial Ca2+ uptake drastically decreases with no difference in the
resting conditions.

50
These data also strongly indicate that this is a physiological response because it happens in
a short period of time and it is reversible. To further investigate this aspect, HeLa cells
transfected with mtAEQmut were starved for 2, 4, 6, 8 and 10 hours. During the last 2 hours of
starvation cells are also reconstitute with the aequorin co-factor coelenterazine.
Importantly, this response to glucose withdrawal is reversible: indeed, cells have a reduced
mitochondrial Ca2+ uptake up to 4 hours and then mitochondrial Ca2+ uptake level returns to
normal feeding condition (2 hours 32%, 4 hours 32%, 6 hours 14%, 8 hours 18% and 10 hours
2% reduction in mitochondrial [Ca2+], Figure 3C).
Figure 3A, B, C. Effect of glucose withdrawal on mitochondrial Ca2+ uptake. HeLa cells were transfected with 4mtD1cpv (A) and 4mtD3cpv (B). After 48 hours cells were starved for 2 hours in KRB with or without 25 mM glucose. Mitochondrial Ca2+ uptake was measured as described in the Materials and Methods section. (C) HeLa cells were transfected with mtAEQmut and 48 hours after transfection starved for 2, 4, 6, 8 and 10 hours in KRB with or without 25 mM glucose. During the last two hours cells were also reconstituted with coelenterazine. Mean ± S.E.M. of values are shown.

51
We next investigated the specificity of this effect. Indeed, the observed decrease in Ca2+
uptake levels could also be due to modification of mitochondrial physiological parameters. This
organelle is able to uptake Ca2+ because it is in close proximity to the ER Ca2+ source. IP3R
opening generates micro domains of high [Ca2+] in the contact sites near to the Ca2+ uptake
machinery. Reduced ER Ca2+ content or ER-mitochondria contact sites induce a decrease in
mitochondrial Ca2+ transient. This is not the only mechanism that allows mitochondria to uptake
Ca2+. Indeed, the driving force due to the difference in pH and ion concentration inside and
outside the mitochondrial inner membrane drives the entry of ions from the cytoplasm.
We thus investigated if one of these mechanisms is involved in the observed reduction of
mitochondrial Ca2+ uptake during glucose deprivations.
This reduction in mitochondrial Ca2+ uptake is not a secondary effect to modification in
ER Ca2+ content or positioning. HeLa cells transfected with aequorin (cytAEQ) (after 2 hours of
starvation and at the same time reconstituted with the prostetic group coelenterazine) were
challenged with an agonist (100 µM histamine) in order to evaluate cytoplasmic Ca2+ level. In
starved cells cytoplasmic Ca2+ level does not change (Figure 4A), ruling out the involvement of
the ER in this response to glucose deprivation. To further prove ER exclusion, cells were
transfected with cytAEQ in order to perform “capacitative Ca2+ influx experiment”. This
procedure allows evaluating in the same experiment, ER Ca2+ content and Ca2+ influx through
store operated channels. In this experiment, ER is emptied with a highly selective reversible
inhibitor of Ca2+-ATPase in the intracellular Ca2+ storage sites, Cyclopiazonic acid (CPA). 20
µM CPA (in KRB supplemented with 100 µM EGTA) is given by perfusion and aequorin light
emission is measured. During this period ER compartment is emptied and a consequent little and
slow increase in cytoplasmic Ca2+ is observed. This cytoplasmic [Ca2+] is directly correlated
with the amount of ER Ca2+ released (Figure 4B). Cells are then perfused with KRB with 2 mM
Ca2+ and 20 µM CPA. During this perfusion Ca2+ influx through the plasma membrane can be
evaluated (Figure 4Bbis). These data suggest that the reduction in mitochondrial Ca2+ uptake is

52
not due to a decrease in ER Ca2+ content or to a reduction in Ca2+ import from the external space
inside the cell.
It is well known that the ER membrane interacts closely with mitochondria. This highly
regulated interaction is endowed with key players of the Ca2+-handing machinery. Many
evidences indicate that the rapid Ca2+ uptake into mitochondria upon Ca2+ release relays on these
close interactions. Thus, we investigated the ER-mitochondria interactions in starved HeLa cells
coexpressing mitochondria-targeted RFP (mit-RFP) and an ER-targeted GFP (ERD1cpv). Cells
were excited separately at 488 nm or at 543 nm and single images were recorded. Statistical
quantification of the overlapping signal area (OSA) was performed from a Z-confocal stack
covering the whole cell volume by the ImageJ program. Pearson’s correlation index, a
coefficient that is commonly used to measure the amount of overlap between two image pairs,
was obtained to determine the ratio of localization between ER and mitochondria. Despite
confocal microscopy can not resolve such contact sites, it has been reported that this method for
quantifying areas of tethering is able to discriminate between known ER-mitochondria contact
sites alterations (Manders et al. 1992). Glucose deprivation had no effect on the distribution and
morphology of the mitochondrial/ER network. No significant differences were found when the
regions of tethering were assessed quantitatively. As shown in Figure 4C, the area of co-
localization is the same in control or starved cells. As negative control we used Mitofusin2
(MNF2) whose silencing was shown to increase the distance between two organelles. Pearson’
co-localization coefficient (Manders et al. 1992) was calculated from z-axis confocal stacks and
revealed no significant decrease in the ER-mitochondria juxtaposition (de Brito and Scorrano
2008). With this set of experiment we confirmed that the decreased in mitochondrial Ca2+
content is not due to decrease of contact sites between ER and mitochondria.

53
Figure 4A, B, C. Effect of glucose withdrawal on ER Ca2+ level and localization. (A, B, C) HeLa cells were transfected with cytAEQ and 48 hours after transfection starved for 2 hours in KRB with or without 25 mM glucose. Experiments for valuate cytoplasmic Ca2+ level and ER Ca2+ content were performed as described in Materials and Methods section. (A) Cytoplasmic Ca2+ levels. (B) ER Ca2+ content. (B bis) Ca2+ influx through the plasma membrane. (C) HeLa cells were transfected with mit-RFP and ER-D1cpv. Confocal images were acquired and Pearson’s coefficient calculated with ImageJ. MFN2 silencing cells were used as positive control. Mean ± S.E.M. of values are shown.
We then focused our attention to the proper functioning of the mitochondrial Ca2+ uptake
machinery. In order to measure the mitochondria Ca2+ influx independently to the ER Ca2+
source, we used two different strategies. First, after 2 hour of glucose deprivation in KRB
supplemented with 1 mM Ca2+ and reconstitution with coelenterazine, cells were perfused with
different solutions. ER was emptied with CPA (20 µM CPA in 100 µM EGTA) in perfusion for
240 seconds and then Ca2+ was given to cells (KRB with 1 mM Ca2+ and 20 µM CPA). During
the perfusion with Ca2+, we can evaluate the efficiency of mitochondria to uptake Ca2+
independently of the ER Ca2+ source. The second strategy involved cells starvation and
reconstitution in KRB with 500 µM EGTA in order to induce the emptying of ER Ca2+ by

54
passive leak. After that, cells were maintained in KRB with 10 µM EGTA and subsequent
addition of Ca2+. After the first addition, Ca2+ was around 8.33 µM. In both experiments
mitochondrial Ca2+ influx was slightly increased in starved cells compared to control but in a
non-significative way (Figure 5A and 5B).
In order to investigate only the mitochondrial Ca2+ machinery contribution, we measured
mitochondrial Ca2+ uptake in digitonin permeabilized cells. This experiment allows evaluating
the properties of the mitochondrial Ca2+ uptake machinery independently of the ER Ca2+ release
and the formation of microdomains of high [Ca2+] in close proximity to mitochondrial Ca2+
channel. Measurements in digitonin-permeabilized cells are performed perfusing cells in IB for
60 seconds. Cells are then perfused with the same buffer with 20 µM digitonin for 60 second and
washed with IB/EGTA buffer for other 60 second. The mitochondrial [Ca2+] rise is then
triggered by perfusing digitonin-permeabilized cells with a solution containing between 0.4 µM
to 2 µM. A slow increase of Ca2+ into mitochondria is observed. As shown in Figure 5C, the
reduction in mitochondrial Ca2+ uptake during starvation is not due to modification of the Ca2+
uptake machinery.
It is well known that the electrochemical potential (∆ψ) is formed in energized
mitochondria and it is composed by an ionic potential (∆µ) and a proton concentration gradient
(∆pH). We investigated the possible role of a modification in mitochondrial membrane potential
or in changes in mitochondrial matrix pH in this reduction of mitochondrial Ca2+ uptake. The
mitochondrion-selective tetramethylrhodamine dye (TMRM) was used to measure the
mitochondrial membrane potential in HeLa cells after 2 hours of glucose deprivation. The
accumulation of TMRM in mitochondria at low concentration has shown to be driven by their
membrane potential (-150/-180mV). In order avoid the self-quenching of the probe, cells are
loaded with very low TMRM concentration (20 nM). Changes in mitochondrial membrane
potential will result in differences in absolute fluorescence intensity. The specificity of the signal

55
is verified by collapsing the ∆ψm through the treatment with the protonophore FCCP (10µM).
Also after 2 hours of glucose deprivation, mitochondrial membrane potential is at the same level
of control cells (Figure 5D).
Figure 5A, B, C, D. Effect of glucose withdrawal on mitochondrial Ca2+ uptake machinery and mitochondrial membrane potential (A, B, C) HeLa cells were transfected with mitAEQmut and 48 hours after transfection starved for 2 hours in KRB with or without 25 mM glucose. Experiments for valuate mitochondrial influx and mitochondrial Ca2+ uptake in permeabilized cells were performed as described in Materials and Methods section. (A) Mitochondrial Ca2+ influx in HeLa cells by perfusing 1 mM Ca2+. (B) Mitochondrial Ca2+ influx in HeLa cells by adding 8.33 µM Ca2+. Mean ± S.E.M. of values are shown. (C) Mitochondrial Ca2+ uptake in permeabilized cells. (D) Measures of mitochondrial membrane potential were performed as described in Materials and Methods sections. Representative traces are shown.
Mitochondrial pH gradient (∆pHm) is the sole driving force for the electro neutral transport
of many ions and metabolites in and out of the mitochondrial matrix. We started to study the role
of ∆pHm using a mitochondrially targeted, pH-sensitive YFP (SypHer). This is a ratiometric
circularly permuted YFP. This probe allowed us to determine the real time measurement of pH

56
into the mitochondrial matrix in intact cells (Poburko et al. 2011). HeLa cells were grown onto
24 wells until 50% and then transfected with 4 µg of mtSypHer with a standard Ca2+-phosphate
procedure. 24 hours after transfection SypHer expressing cells were starved for 2 hours and then
mounted into an open-topped chamber and maintained in KRB with or without 25 mM glucose.
After KRB washout, pH was stopped between 5.5 and 10 by turnover of the bath solution. The
added solutions were a Ca2+-free intracellular buffer: 130 mM KCl, 10 mM NaCl, 2 mM
K2HPO4, 1mM MgCl2 supplemented with 20 mM MES or 20 mM HEPES or TRIS or Boric
Acid (adjusted to pH 9.5 and 10 with KOH). For each experiment monensin (ionophore 5 µM)
and nigericin (K+/H+ exchanger 1 µM) were also added to these Ca2+-free intracellular buffers in
order to increase the velocity to reach equilibrium between the external medium and the pH into
the intermembrane space. For pH imaging, mtSypHer was alternately excited for 200-300 ms at
430 and 480 nm through a dicroic filter and fluorescence ratio (F480/430). For each cell, an 8-
point calibration curve was fitted to a variable slope sigmoid equation. The resting matrix pH of
HeLa cells remains stable also in starved HeLa cells (Figure 6A).
We investigated also the regulation of mitochondria morphology during glucose
deprivation. Mitochondria typically form a reticular network radiating from the nucleus, creating
an interconnected system that supplies the cell with essential energy and metabolites. These
mitochondrial networks are regulated through the complex coordination of fission, fusion and
distribution events (Ferree and Shirihai 2012). We assessed whether mitochondrial morphology
is modified during glucose deprivation. It is known that autophagy induction by nutrient
deprivation causes mitochondria elongation because the high level of cAMP induces the
activation of protein kinase A (PKA) and the consequent reduction of the pro-fission dynamin
related protein 1 (DRP1) (Gomes et al. 2011). In order to evaluate whether the strong reduction
in mitochondrial Ca2+ uptake was due to the modification in mitochondrial morphology, HeLa
cells were transfected with mit-RFP, a probe that allows the visualisation of mitochondria.
Confocal images were recorder and quantification of the number and the volume of the

57
mitochondria were performed with ImageJ.
The observed reduction in mitochondrial Ca2+ uptake is not due to mitochondrial
morphological changes; indeed, mitochondria number and size were unchanged after glucose
withdrawal (Figure 6B). No evidence in the activation of proteins involved in the fission fusion
process like Mitofusin2 and Drp1 were noticed (data not shown). Indeed HeLa cells
overexpressed fission-fusion machinery proteins maintained this decrease in mitochondrial Ca2+
uptake during starvation.
Elongation is not the only morphological modification in mitochondria that is triggered
during nutrient deprivation. Indeed, during starvation mitochondria turnover can be accelerated
by an autophagic process, called mitophagy (Lee et al. 2012). Usually mitochondria are
depolarized and co-localize with autophagosomes and the total amount of mitochondria
drastically decreases. In the absence of extracellular nutrients cells degrade their intracellular
damaged organelles in order to provide energy to cells and to overcome the low level of nutrient
availability. We previously analyzed with TMRM the mitochondrial membrane potential (Figure
5D). We also investigated the amount of mitochondrial proteins. Starved HeLa cells maintained
unchanged the levels of mitochondrial proteins (Figura 6C). Low mitochondrial Ca2+ uptake
during starvation is maintained also in autophagy incompetent cells, demonstrating that the
reduction in mitochondrial Ca2+ uptake is upstream to the induction of autophagy. The
conversion from LC3I to LC3II and the phosphorylation of AMPK demonstrated that in glucose
deprived HeLa cells autophagy is induced (data not shown).
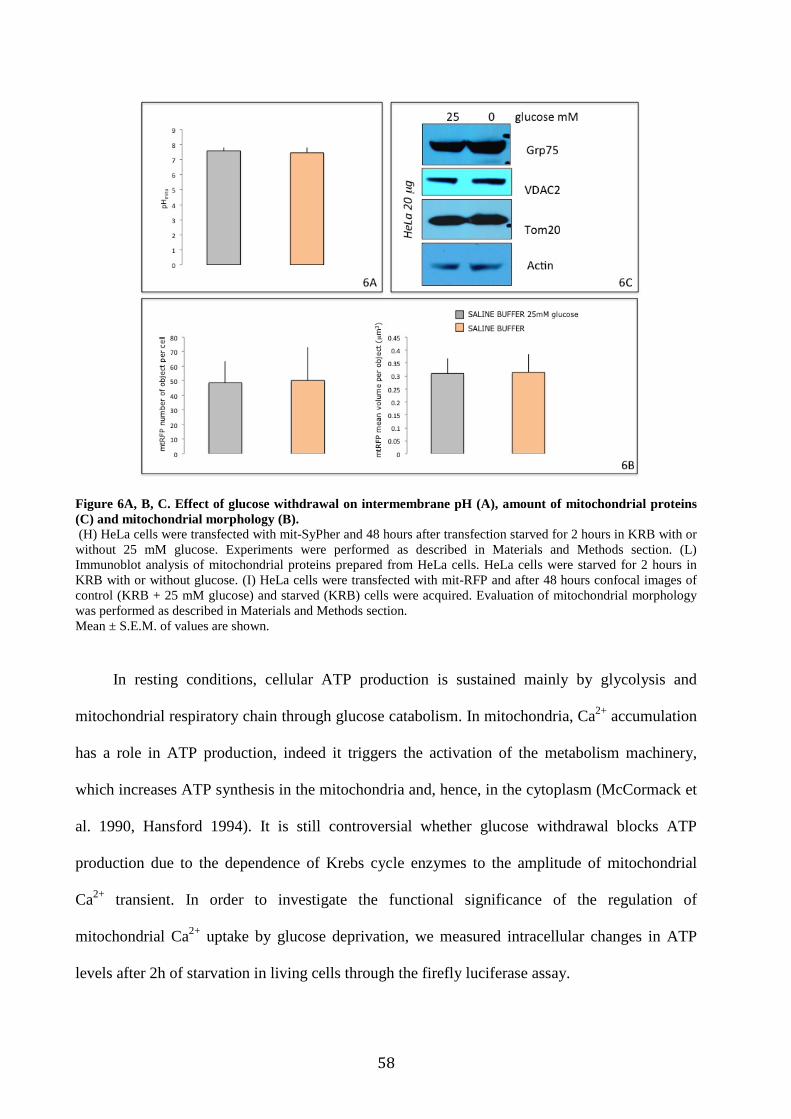
58
Figure 6A, B, C. Effect of glucose withdrawal on intermembrane pH (A), amount of mitochondrial proteins (C) and mitochondrial morphology (B). (H) HeLa cells were transfected with mit-SyPher and 48 hours after transfection starved for 2 hours in KRB with or without 25 mM glucose. Experiments were performed as described in Materials and Methods section. (L) Immunoblot analysis of mitochondrial proteins prepared from HeLa cells. HeLa cells were starved for 2 hours in KRB with or without glucose. (I) HeLa cells were transfected with mit-RFP and after 48 hours confocal images of control (KRB + 25 mM glucose) and starved (KRB) cells were acquired. Evaluation of mitochondrial morphology was performed as described in Materials and Methods section. Mean ± S.E.M. of values are shown.
In resting conditions, cellular ATP production is sustained mainly by glycolysis and
mitochondrial respiratory chain through glucose catabolism. In mitochondria, Ca2+ accumulation
has a role in ATP production, indeed it triggers the activation of the metabolism machinery,
which increases ATP synthesis in the mitochondria and, hence, in the cytoplasm (McCormack et
al. 1990, Hansford 1994). It is still controversial whether glucose withdrawal blocks ATP
production due to the dependence of Krebs cycle enzymes to the amplitude of mitochondrial
Ca2+ transient. In order to investigate the functional significance of the regulation of
mitochondrial Ca2+ uptake by glucose deprivation, we measured intracellular changes in ATP
levels after 2h of starvation in living cells through the firefly luciferase assay.
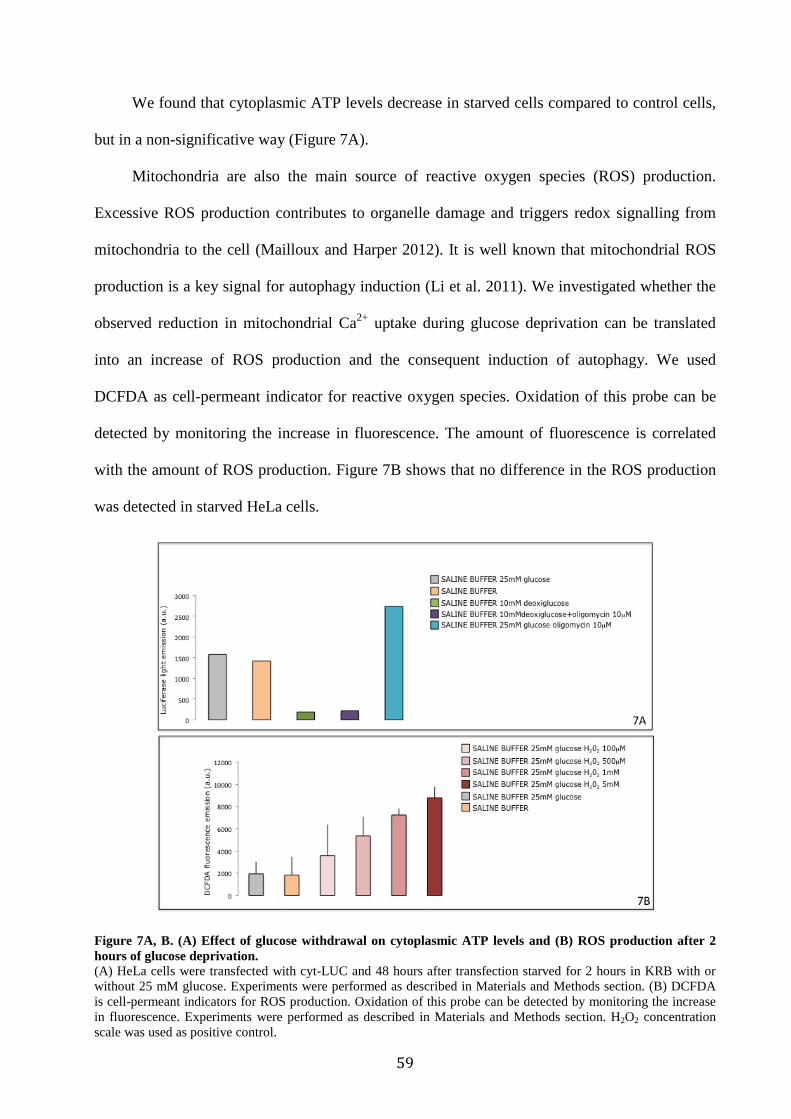
59
We found that cytoplasmic ATP levels decrease in starved cells compared to control cells,
but in a non-significative way (Figure 7A).
Mitochondria are also the main source of reactive oxygen species (ROS) production.
Excessive ROS production contributes to organelle damage and triggers redox signalling from
mitochondria to the cell (Mailloux and Harper 2012). It is well known that mitochondrial ROS
production is a key signal for autophagy induction (Li et al. 2011). We investigated whether the
observed reduction in mitochondrial Ca2+ uptake during glucose deprivation can be translated
into an increase of ROS production and the consequent induction of autophagy. We used
DCFDA as cell-permeant indicator for reactive oxygen species. Oxidation of this probe can be
detected by monitoring the increase in fluorescence. The amount of fluorescence is correlated
with the amount of ROS production. Figure 7B shows that no difference in the ROS production
was detected in starved HeLa cells.
Figure 7A, B. (A) Effect of glucose withdrawal on cytoplasmic ATP levels and (B) ROS production after 2 hours of glucose deprivation. (A) HeLa cells were transfected with cyt-LUC and 48 hours after transfection starved for 2 hours in KRB with or without 25 mM glucose. Experiments were performed as described in Materials and Methods section. (B) DCFDA is cell-permeant indicators for ROS production. Oxidation of this probe can be detected by monitoring the increase in fluorescence. Experiments were performed as described in Materials and Methods section. H2O2 concentration scale was used as positive control.

60
Mean ± S.E.M. of values are shown.
6.3 MICU1 controls mitochondrial Ca2+ uptake in response to glucose
availability
Given that none of the physiological parameters of mitochondria was affected by
starvation, we considered that during glucose deprivation a specific protein could control the
amplitude of mitochondrial [Ca2+]. We investigated the possible involvement of numerous
proteins in the contact sites between mitochondria and ER (MAM) and the possible role of
proteins involved in the Ca2+ uptake machinery. No one of the analyzed mitochondrial proteins
showed modifications during glucose deprivation with one exception (Figure 6C). Indeed, we
found that in our experimental condition MICU1 was rapidly degraded (Figure 8A). MICU1 is a
regulator of the mitochondrial Ca2+ uniporter (MCU). It has been shown that it localizes to
mitochondria and its loss was initially reported to abolish mitochondrial Ca2+ entry (Perocchi et
al. 2010). This protein has two canonical EF hands that are essential for its activity in Ca2+
sensing and gating the activity of MCU channel. However, we found that MICU1
overexpression increases mitochondrial Ca2+ uptake and it has a synergistic effect with the MCU
overexpression (unpublished data). Electrophysiological data revealed that in presence of µM
[Ca2+], MICU1 is able to increase the open probability of MCU with an increased Ca2+ uptake
into mitochondria (unpublished data). MICU1 is also required to preserve normal mitochondrial
[Ca2+] under basal conditions. In its absence mitochondria become constitutively loaded with
Ca2+, triggering excessive ROS generation (Mallilankaraman et al. 2012).
Proteins are continually synthetized and degraded in all cells in a process called protein
turnover. Every protein shows a characteristic turnover rate, due to its localization, post-
translational modifications and functions. The half-life can vary from few minutes to several
weeks but the half-life of a given protein in different organs and species is generally similar. The
half-life of a protein is used as a quantitative measurement of this “dynamic equilibrium”.
61
Usually it is measured by blocking the protein synthesis by a protein synthesis inhibitor
(cycloheximide) and by collecting cells at different time points in order to evaluate the relative
amount of the investigated protein into the collected samples.
Based on MICU1 short half-life of around 3 hours (Figure 8B), we wondered whether
during glucose deprivation it could be post-translationally modified and consequently rapidly
degraded.
There are many mechanisms to degrade mitochondrial proteins. Usually damaged
mitochondria are removed by mitophagy but this process, besides being slow, is not selective for
the removal of a single specific protein.
Protein degradation through the ubiquitin-proteasome system is the major pathway of non-
lysosomal proteolysis of intracellular proteins. It plays important roles in a variety of
fundamental cellular processes and the central element of this system is the covalent linkage of
ubiquitin to targeted proteins, which are then recognized by the proteasome. However, usually
the quality control of mitochondrial proteins is ensured by two ATP dependent proteases, AAA
proteases, which are an integral part of the inner mitochondrial membrane (Arnold and Langer
2002), although recent reports suggest that ubiquitinylation may play an important role in
mitochondria protein quality control (Margineantu et al. 2007, Radke et al. 2008). Still unknown
is the mechanism of the rapid degradation of MICU1.
During glucose deprivation we tried to block the MICU1 degradation by inhibiting the
ubiquitin proteasome system, the autophagy induction and the mAAA activity. As shown in the
Figure 8C only the treatment with MG132, a specific cell permeant proteasome inhibitor,
partially blocks the reduction of agonist-evoked mitochondrial [Ca2+] rises after glucose
deprivation.

62
Figure 8A, B, C. Effect of glucose withdrawal on MICU1. (A) Immunoblot analysis of MICU1. Proteins were prepared from HeLa cells treated with DMEM (DMEM supplemented with 10% FBS for 2 hours), 25 mM glucose (KRB + 25 mM glucose for 2 hours) or no glucose (KRB for 2 hours). (B) Immunoblot analysis using HA and FLAG antibodies. HeLa were transfected with MCU-FLAG or with MICU1-HA. Proteins were prepared from MCU and MICU1 overexpressing HeLa cells treated with 100 µg/ml cycloheximide in DMEM supplemented with 10% FBS and collected at different time points (0, 2, 4, 6, 12, 24, 32, 36 and 48 hours). (I) HeLa cells were transfected with mtAEQmut and after 48 hours treated for 2 hours with different inhibitors of protein degradation of ubiquitin-proteasome system (MG132, Z=Z Leu Leu Phe CHO and L=Lactacistil), inhibitors of autophagy (C=cloroquine) or an inhibitor of mAAA degradation system (P=1-10-phenanthroline monohydrate). HeLa cells were also treated as control (KRB + 25 mM glucose) and starved (KRB). Mean ± S.E.M. of values are shown.
MICU1 degradation during nutrient deprivation is abolished by MG132, suggesting that
MICU1 could be eliminated via ubiquitin proteasome system (Figure 9A). MICU1 half-life is
increased when cells are treated with the proteasome inhibitor, thus confirming that the stability
of this protein is dependent on the ubiquitin proteasome system (Figure 9B).
High-resolution mass spectrometry data reveal that five lysines in MICU1 are
ubiquitylated (Hornbeck et al. 2012) and thus we decided to substitute this lysine with arginine
in order to generate a MICU1 protein mutant that is not able to bind ubiquitin in this site. We
generated 5 different mutant forms of MICU1 for each lysine (MICU1K102R-HA, MICU1K103R-

63
HA, MICU1K104R-HA, MICU1K296R-HA, MICU1K359R-HA) and one mutant form of MICU1,
which all the lysine mutated (MICU1K102R, K103R, K104R, K296R, K359R-HA).
We compared the expression levels of MICU1-HA and MICU1K296R-HA expression
plasmids and we found that all of these ubiquitylation incompetent mutants reach a higher level
of protein expression (Figure 9C), thus suggesting that these mutants are more stable per se.
At first, we investigated the intracellular distribution of these MICU1 mutated forms by
performing immunofluorescence of HeLa cells overexpressing these constructs that show perfect
mitochondrial localization (data not shown). We also performed a sub fractionation experiment
in order to purify mitochondria from HEK293A transiently transfected with MICU1K102R, K103R,
K104R, K296R, K359R-HA (data not shown). In all these experiments, we found that the different
MICU1 mutants correctly localized into mitochondria.
We focused our attention in particular to MICU1K296R-HA for the higher score of mass
spectrometry results and MICU1K102R, K103R, K104R, K296R, K359R-HA. Probably also due to its low
transfection efficiency, MICU1 overexpression on HeLa cells challenged with maximal agonist
stimulation increase mitochondrial Ca2+ uptake by nearly 10%. On the contrast MICU1K296R-HA
overexpression increase agonist-evoked mitochondrial [Ca2+] rises by nearly 100% (Figure 9D).

64
Figure 9A, B, C, D. Effect on MICU1 during the inhibition of the proteasome system and analysis of MICU1 mutants. (A) Immunoblot analysis of MICU1. Proteins were prepared from HeLa cells incubated in KRB for 2 hours with or without 25 mM glucose and 100 µM MG132 (proteasome inhibitor). (B) Immunoblot analysis of HA tag (MICU1-HA). HeLa cells were transfected with MICU1-HA. After 24 hours proteins were prepared from MICU1-HA overexpressing cells were treated with 100 µg/ml cycloheximide and 100 µM MG132 in DMEM supplemented with 10% FBS and then they were collected at different time points (0, 2, 4, 6 and 8 hours). (C) Immunoblot analysis of MICU1. HeLa cells were transfected with MICU1-HA and MICU1K296R-HA and lysed after 48 hours. (D) mtAEQmut was coexpressed with MICU1-HA and MICU1K296R-HA in HeLa cells. Experiments were performed as described in Materials and Methods sections.
We assumed that in glucose deprivation MICU1 degradation causes a decrease in
mitochondrial Ca2+ uptake. To assess this hypothesis we overexpressed MICU1K296R-HA and
MICU1K102R, K103R, K104R, K296R, K359R-HA in our starvation experiments in order to block the
degradation of MICU1 and to prevent the uptake reduction. In order to overcome the aequorin
probe saturation problems, we challenged HeLa cells with two different concentrations of
agonist. We observed that the strong effect of starvation between control and starved cells is
partially abolished with the overexpression of this ubiquitylation incompetent mutant (Figure
10A).

65
In order to understand if MICU1 has a specific role in the control of mitochondrial Ca2+
uptake during glucose deprivation, we generated a new mutant form of this protein. MICU1 has
two canonical EF hands that are essential for its Ca2+ sensing activity (Perocchi et al. 2010). The
EF hand is a helix loop helix structural domain found in a large family of Ca2+ binding proteins.
It consists of two alpha helices positioned perpendicularly to one another and linked by a short
loop region (usually about 12 AA) that binds Ca2+ ions suggesting that this motif may undergo
conformational changes that enable Ca2+ regulated functions.
A dominant negative form of a protein is a mutated protein that can interact with the same
elements as the wild-type product, but blocks its function. We generated a dominant negative
form of this protein by the mutation of four residues in these EF hands (MICU1D231A, E242K, D421A,
E432K-HA) and we overexpressed this protein during glucose deprivation. We confirmed that this
mutated protein plays a dominant negative function: indeed, MICU1 capacity of increasing
mitochondrial Ca2+ uptake is blocked by the overexpression of these mutant proteins. The
overexpression of MICU1D231A, E242K, D421A, E432K-HA abolished the effect of glucose deprivation
on mitochondrial Ca2+ uptake (Figure 10B).

66
Figure 10A, B. Effect of MICU1K102R, K103R, K104R, K296R, K359R-HA and MICU1D231A, E242K, D421A, E432K-HA overexpression on glucose withdrawal (A, B) HeLa cells were transfected with mitAEQmut and 48 hours after transfection starved for 2 hours in KRB with or without 25 mM glucose. Experiments for valuate mitochondrial Ca2+ uptake were performed as described in Materials and Methods section. Mean ± S.E.M. of values are shown.
In order to mimic the effects of glucose deprivation on mitochondrial Ca2+ uptake
machinery we silenced MICU1. We silenced MICU1 with high efficiency but the effect on
mitochondrial [Ca2+] is controversial, since agonist evoked mitochondrial [Ca2+] rises is
increased of around 40%. Furthermore, after MICU1 silencing, glucose deprivation evokes a
decrease of mitochondrial Ca2+ uptake (Figure 11A). It is published that MICU1 silencing
increases the mitochondria Ca2+ basal levels (as confirmed by our data: figure 5A) but the
correlation between this and the increase also in agonist evoke mitochondrial [Ca2+] rise is still
unknown (Mallilankaraman et al. 2012).
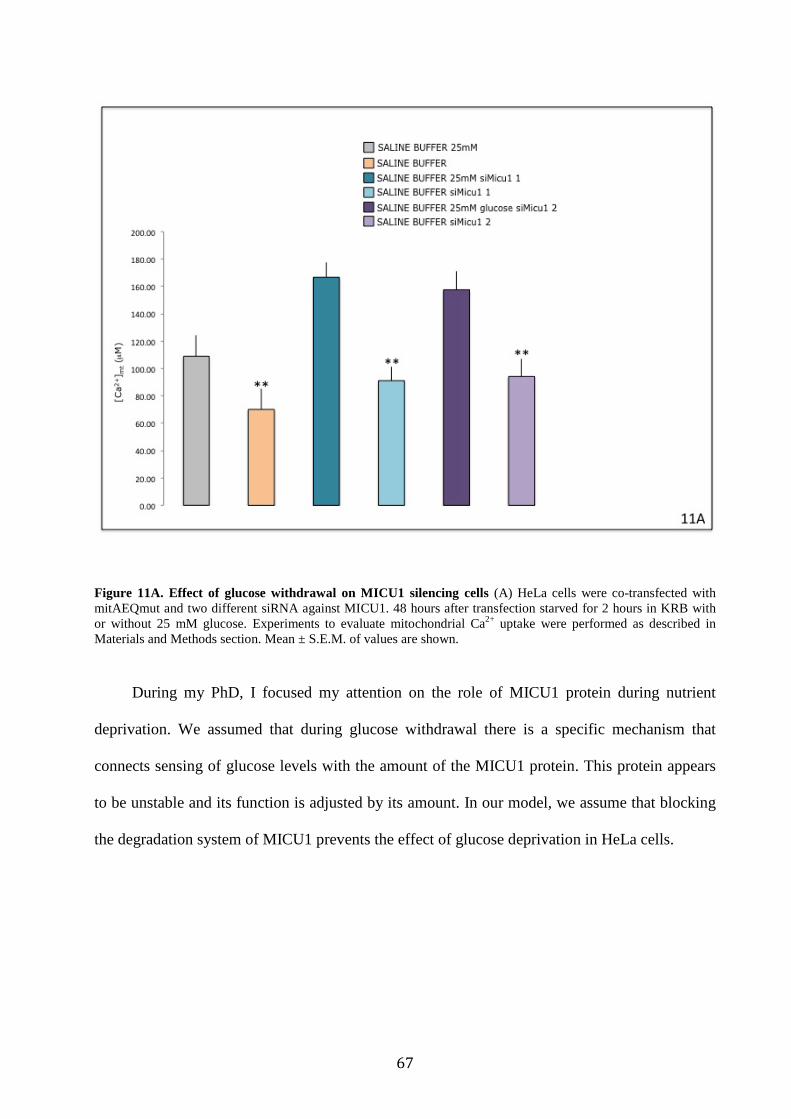
67
Figure 11A. Effect of glucose withdrawal on MICU1 silencing cells (A) HeLa cells were co-transfected with mitAEQmut and two different siRNA against MICU1. 48 hours after transfection starved for 2 hours in KRB with or without 25 mM glucose. Experiments to evaluate mitochondrial Ca2+ uptake were performed as described in Materials and Methods section. Mean ± S.E.M. of values are shown.
During my PhD, I focused my attention on the role of MICU1 protein during nutrient
deprivation. We assumed that during glucose withdrawal there is a specific mechanism that
connects sensing of glucose levels with the amount of the MICU1 protein. This protein appears
to be unstable and its function is adjusted by its amount. In our model, we assume that blocking
the degradation system of MICU1 prevents the effect of glucose deprivation in HeLa cells.

68

69
7. Discussion
The variation of the metabolic availability induces intracellular adaptations to provide
energy for cellular functions. These adaptations are traduced in intracellular changes in
metabolic reactions in order to overcome the decrease in feeding intake. Many data are available
on the contribution of mitochondria in the regulation of intracellular metabolism (McCormack et
al. 1990, Rasola and Bernardi 2011). Thanks to ATP production, mitochondria provide energy
for cells and connect two important intracellular signals: ATP and Ca2+. Still unknown are the
specific mitochondrial proteins that sense nutrient availability and how they can translate the
variation of nutrients concentration into modulation of Ca2+ uptake which in turn induces
intracellular adaptive processes like autophagy (Deter and De Duve 1967). When triggered,
autophagy provides nutrients from intracellular stores (Lum et al. 2005).
The contribution of Ca2+ in the activation or inhibition of autophagy is still matter of
debate (Decuypere et al. 2011), but, more importantly, what is still completely unknown is the
possibility of a direct link between nutrient availability and the modulation of Ca2+ signaling in
the regulation of the autophagy process.
The goal of my PhD research was to investigate whether the adaptive response to glucose
withdrawal was through the modulation of mitochondrial Ca2+ uptake. In particular, we focused
our attention in the possible involvement of mitochondrial proteins as connection point between
glucose levels and changes in mitochondrial Ca2+ content.
The first report on Ca2+-dependent regulation of autophagy dates back to 1993 (Gordon et
al. 1993), and it suggests a complex role for Ca2+, since chelation of either intra- and
extracellular Ca2+ as well as elevating cytosolic [Ca2+] suppresses autophagy. Only recently this
topic returned to be of great interest but the published results are again in conflict regarding the
role of intracellular Ca2+ in autophagy induction. Another critical point is that the lack of
information on the sensors of nutrient availability and their direct effects on Ca2+ signaling.

70
Many reports described Ca2+ as an inhibitor of autophagy (Sarkar et al. 2005, Criollo et al.
2007, Berridge 2009). These studies are focused on the inositol 1,4,5-triphosphate (IP3) receptor
(IP3R), an ubiquitously expressed intracellular Ca2+-release channel, located mainly in the
endoplasmic reticulum (ER). IP3Rs mediate Ca2+ release from the ER into the cytoplasm in
response to elevations in cytoplasmic [IP3] produced in cells after stimulation by hormones,
growth factors or antibodies (Berridge 2009). In 2005, Sarkar et al. reported the use of Li+ for
autophagy stimulation (Sarkar et al. 2005). Li+ acts through inhibition of inositol
monophosphatase (IMPases), thereby reducing the IP3 levels. Also chemical inhibition of IP3Rs
with xestospongin (XeB) or suppression of its expression using siRNA induce autophagy in
HeLa cells (Criollo et al. 2007). The IP3R-mediated inhibition of autophagy was also verified in
IP3R triple knock out (TKO) chicken DT40 B lymphocytes, which showed higher autophagy
levels (Cardenas et al. 2010, Khan and Joseph 2010). Different downstream mechanisms and
effectors have been proposed for the inhibitory role of IP3Rs and Ca2+ in autophagy. In a recent
study, Cardenas and coworkers showed decreased glucose and O2 consumption, and AMPK
activation in TKO cells, suggesting a mechanism whereby constitutive Ca2+ release through
IP3Rs fuels into the mitochondria, therefore augmenting mitochondrial bio-energetics and ATP
production (Cardenas et al. 2010). When these essential Ca2+ signals are abolished, an increased
of AMP/ATP ratio is observed with a consequent AMPK activation and subsequent stimulation
of autophagy. In this study, the authors can not exclude a scaffold function for the IP3R.
During my PhD I could benefit from the long-standing experience of our group in the
analysis of cellular Ca2+ signals in order to precisely investigate mitochondrial Ca2+ homeostasis
during glucose deprivation. By using the most modern technologies based on both fluorescent
and bioluminescent Ca2+-probes (Rizzuto et al. 1998, Pinton et al. 2007), we could also correlate
the effects of nutrient deprivation on Ca2+ signals to their consequences on the induction of
autophagy. Moreover, we also looked at the possible involvement in this process of an important

71
regulator of the mitochondrial Ca2+ uptake machinery, MICU1 (Perocchi et al. 2010,
Mallilankaraman et al. 2012).
We decided to completely remove all nutrients from the cell culture medium and to add to
control cells only 25 mM glucose. We noticed that 2 hours of glucose deprivation induce in
HeLa cells a constant decrease in total protein deacetylation as consequence of Sirtuins
activation and a phosphorylation of AMPK (Figure 1A). In order to analyze if this effect on
AMPK was through modulation of mitochondrial Ca2+ transients, we activated AMPK by an
AMP mimic and in parallel we changed the amplitude of mitochondrial Ca2+ transient. AMPK
activation can be blocked by an increase of mitochondrial Ca2+ transient, by blocking the
mitochondrial Ca2+ release. It is clear that the amount of Ca2+ into mitochondria determines the
activation of AMPK (Figure 1B). This effect on AMPK can be direct or a consequence of the
known modulation of mitochondrial ATP production (Hardie 2003). In the future, we will
investigate if the regulation of this protein is simply through the regulation of the mitochondrial
Ca2+ content or through the effect of Ca2+ on mitochondrial ATP production. We also found that
SIRT1 and SIRT3 have a role in the control of the magnitude of Ca2+ transient inside
mitochondria. Indeed, mitochondrial Ca2+ uptake in SIRT3 and SIRT1 overexpressing HeLa
cells was drastically reduced (Figure 1C). The role of SIRT1 in the control of mitochondrial Ca2+
uptake is still controversial because it is a nuclear and cytoplasmic protein (Nogueiras et al.
2012) (Tanno et al. 2007). We hypothesize that the control is through the induction of
mitochondrial biogenesis, as previously reported (Zhong and Mostoslavsky 2011). Future
experiments will be focused on the analysis of the acetylation state of some members of the Ca2+
uptake machinery (Newman et al. 2012).
We then assessed the direct role of glucose deprivation on mitochondrial Ca2+ uptake and
we found that after 2 hours of glucose deprivation mitochondrial Ca2+ uptake drastically
decreases (Figure 2). We confirmed this data also with a FRET-based Ca2+ probe Cameleon
(Palmer and Tsien 2006). Furthermore, we found no difference in resting conditions (Figure 3A

72
and 3B). This adaptive response to glucose deprivation is physiological because it happens in
short period of time and it is reversible; indeed if starved for a long period of time (10 hours)
cells have a reduced mitochondrial Ca2+ uptake for 4 hours and than mitochondrial Ca2+ uptake
levels return to the one of normal feeding conditions (Figure 3C).
We next investigated the specificity of this effect. Indeed, decrease in Ca2+ uptake levels
could be due to modifications in mitochondrial physiological parameters. This organelle is able
to uptake Ca2+ because it is in close proximity to ER Ca2+ source. IP3R opening generates micro
domains of high [Ca2+] in the contact sites near to the Ca2+ uptake machinery (Rizzuto et al.
1993). Reduced ER Ca2+ content or ER-mitochondria contact sites induce a decreased
mitochondrial Ca2+ transient. We investigated the role of ER Ca2+ content in our model of
glucose deprivation and we found that the reduction in mitochondrial Ca2+ uptake was not a
secondary effect due to modification in ER Ca2+ content (Figure 4). Glucose deprivation had also
no effect on the distribution and morphology of the mitochondrial/ER network. Indeed, no
significant differences were found when the regions of tethering were assessed quantitatively
(Figure 4C).
This is not the only mechanism that allows mitochondria to uptake Ca2+. It is well known
that the electrochemical potential (∆ψ) is formed in energized mitochondria and it is composed
of an ionic potential (∆µ) and a proton concentration gradient (∆pH) (Mitchell 1967). We
investigated the possible role of a modification in mitochondrial membrane potential or in
changes in mitochondrial matrix pH in this reduction of mitochondrial Ca2+ uptake. With the
TMRM dye we demonstrated also that there were no changes in mitochondrial membrane
potential. Also the mitochondrial pH gradient (∆pHm) was maintained (Figure 5D).
Moreover, we investigated the regulation of mitochondria morphology during glucose
deprivation. Mitochondria typically form a reticular network radiating from the nucleus, creating
an interconnected system that supplies the cell with essential energy and metabolites. This
mitochondrial network is regulated through the complex coordination of fission, fusion and

73
distribution events (Ferree and Shirihai 2012). We observed that the reduction in mitochondrial
Ca2+ uptake is not paralleled by mitochondrial morphological changes (Figure 6B).
Glucose deprivation triggers autophagy without the involvement of ROS production and
changes in ATP levels (Figure 7). Since none of the physiological parameters of mitochondria
was modified, we considered that during glucose deprivation a specific protein could control the
amplitude of mitochondrial [Ca2+]. We investigated the possible involvement of a large number
of proteins in the contact site between mitochondria and ER (MAM) and the possible role of
proteins involved in the Ca2+ uptake machinery. Our evidences suggest that, in our experimental
condition, only MICU1 is rapidly degraded (Figure 8A). MICU1 has a half-lives around three
hours (Figure 8B). This experiment suggests that this protein has a highly dynamic equilibrium
compared to the uniporter channel that appears to be highly stable. With this information, we can
assume that changes in mitochondrial calcium uptake are regulated by the degradation of the
regulator (MICU1) rather than of the channel (MCU).
We wondered whether during glucose deprivation MICU1 could be modified with a post-
translational modification and rapidly degraded. During glucose deprivation we tried to block the
MICU1 degradation by inhibiting the ubiquitin proteasome system, the autophagy induction and
the mAAA activity, and we found that only the treatment with a specific cell permeant
proteasome inhibitor, partially blocks the reduction of agonist-evoked mitochondrial [Ca2+] rises
after glucose deprivation (Figure 8C). The degradation of MICU1 during nutrient deprivation is
abolished by MG132, suggesting that MICU1 could be eliminated via ubiquitin proteasome
system (Figure 9A). Indeed, MICU1 half-life increased when cells were treated with the
proteasome inhibitor (Figure 9B).
Based on high-resolution mass spectrometry data we generated MICU1 mutants defective
for ubiquitination (Hornbeck et al. 2012). These mutant forms of MICU1 appear to be more
stable and the effect on Ca2+ is parallel with this stability (Figure 9C).
74
We assumed that in glucose deprivation MICU1 degradation causes a decrease in
mitochondrial Ca2+ uptake. To assess this hypothesis we overexpress MICU1K296R-HA and
MICU1K102R, K103R, K104R, K296R, K359R-HA in our starvation experiments in order to block the
degradation of MICU1 protein and to prevent the reduction of mitochondrial Ca2+ uptake. Our
hypothesis was confirmed by the fact that the effect of starvation is partially abolished by
overexpressing MICU1K296R-HA and MICU1K102R, K103R, K104R, K296R, K359R-HA (Figure 10A).
In order to understand the role of MICU1 in the control of mitochondrial Ca2+ uptake
during glucose deprivation, we also overexpressed a dominant negative form of MICU1
(MICU1D231A, E242K, D421A, E432K-HA) during glucose deprivation. The overexpression of this
mutant abolishes the effect of glucose deprivation on mitochondrial Ca2+ uptake, further
supporting the idea that MICU1 finely and dynamically regulates mitochondria Ca2+ uptake in
different conditions (Figure 10B). This result is difficult to interpret since, as already known
(Perocchi et al. 2010, Mallilankaraman et al. 2012), MICU1 plays a fundamental role in the Ca2+
uptake machinery. Therefore, our results using the dominant negative do not allow us to
distinguish between the generic role of MICU1 on the uptake machinery per se and the specific
role of this protein on the regulation of mitochondrial Ca2+ during glucose deprivation.
In order to mimic the effect of glucose deprivation on mitochondrial Ca2+ uptake
machinery, we silenced MICU1 and we analysed mitochondrial Ca2+ homeostasis. MICU1
overexpression increased mitochondrial Ca2+ uptake (unpublished data) and Perocchi and
coworkers (Perocchi et al. 2010) have also shown that absence of MICU1 abolishes
mitochondrial Ca2+ entry. In contrast with these data, we found that MICU1 silencing increases
mitochondrial Ca2+ transients of around 40% compared to control cells (Figure 11A). This result
is in agreement with a recent study that demonstrated that, in absence of MICU1, mitochondria
become constitutively loaded with Ca2+ (Mallilankaraman et al. 2012). These models suggest that
the right role of MICU1 on mitochondrial Ca2+ uptake machinery is still far to be uncovered.
Moreover, after MICU1 silencing, glucose deprivation still evokes a decrease of mitochondrial

75
Ca2+ uptake, strongly indicating that the picture of the adaptation to nutrient availability is more
complex and in the future we will elucidate the precise pathway that controls this phenomena.
My PhD research was focused on the physiological relevance of MICU1 during nutrient
deprivation. We demonstrated that during glucose withdrawal there is a specific mechanism that
connects sensing glucose levels with the amount of MICU1 protein. The turnover of this protein
appears to be highly dynamic and its function is adjusted by its amount.
Our data suggest that blocking the degradation of MICU1 prevents the effects of glucose
deprivation in HeLa cells. In conclusion, this work presents some novel and unexpected findings
on the cellular adaptations to glucose deprivation mediated by the control of mitochondrial Ca2+
homeostasis. To overcome the glucose dependence is a metabolic adaptation that enables cancer
cells to proliferate and survive in hypoxic areas (Vander Heiden et al. 2009). The clarification of
the link between the decrease in glucose availability and autophagy induction via modulation of
mitochondrial Ca2+ content may lead to understand if MICU1 plays a central role in this process.
This information may provide more efficient pharmacological intervention to treat human
disorders in which mitochondria have been proposed to play a central role in the pathogenesis,
for example, of metabolic disorders and cancer.

76

77
8. References
Allen, D. G. and J. R. Blinks (1978). "Calcium transients in aequorin-injected frog cardiac
muscle." Nature 273(5663): 509-513.
Arnold, I. and T. Langer (2002). "Membrane protein degradation by AAA proteases in
mitochondria." Biochim Biophys Acta 1592(1): 89-96.
Azzu, V., M. Jastroch, A. S. Divakaruni and M. D. Brand (2010). "The regulation and turnover
of mitochondrial uncoupling proteins." Biochim Biophys Acta 1797(6-7): 785-791.
Azzu, V., S. A. Mookerjee and M. D. Brand (2010). "Rapid turnover of mitochondrial
uncoupling protein 3." Biochem J 426(1): 13-17.
Baughman, J. M., F. Perocchi, H. S. Girgis, M. Plovanich, C. A. Belcher-Timme, Y. Sancak, X.
R. Bao, L. Strittmatter, O. Goldberger, R. L. Bogorad, V. Koteliansky and V. K. Mootha (2011).
"Integrative genomics identifies MCU as an essential component of the mitochondrial calcium
uniporter." Nature 476(7360): 341-345.
Bernardi, P., V. Paradisi, T. Pozzan and G. F. Azzone (1984). "Pathway for uncoupler-induced
calcium efflux in rat liver mitochondria: inhibition by ruthenium red." Biochemistry 23(8): 1645-
1651.
Berridge, M. J. (2009). "Inositol trisphosphate and calcium signalling mechanisms." Biochim
Biophys Acta 1793(6): 933-940.
Blander, G. and L. Guarente (2004). "The Sir2 family of protein deacetylases." Annu Rev
Biochem 73: 417-435.
Boiteux, A. and B. Hess (1981). "Design of glycolysis." Philos Trans R Soc Lond B Biol Sci
293(1063): 5-22.
Bolte, S. and F. P. Cordelieres (2006). "A guided tour into subcellular colocalization analysis in
light microscopy." J Microsc 224(Pt 3): 213-232.
78
Bouche, C., S. Serdy, C. R. Kahn and A. B. Goldfine (2004). "The cellular fate of glucose and its
relevance in type 2 diabetes." Endocr Rev 25(5): 807-830.
Brini, M. (2008). "Calcium-sensitive photoproteins." Methods 46(3): 160-166.
Calcraft, P. J., M. Ruas, Z. Pan, X. Cheng, A. Arredouani, X. Hao, J. Tang, K. Rietdorf, L.
Teboul, K. T. Chuang, P. Lin, R. Xiao, C. Wang, Y. Zhu, Y. Lin, C. N. Wyatt, J. Parrington, J.
Ma, A. M. Evans, A. Galione and M. X. Zhu (2009). "NAADP mobilizes calcium from acidic
organelles through two-pore channels." Nature 459(7246): 596-600.
Cardenas, C., R. A. Miller, I. Smith, T. Bui, J. Molgo, M. Muller, H. Vais, K. H. Cheung, J.
Yang, I. Parker, C. B. Thompson, M. J. Birnbaum, K. R. Hallows and J. K. Foskett (2010).
"Essential regulation of cell bioenergetics by constitutive InsP3 receptor Ca2+ transfer to
mitochondria." Cell 142(2): 270-283.
Chang, Y. Y., G. Juhasz, P. Goraksha-Hicks, A. M. Arsham, D. R. Mallin, L. K. Muller and T.
P. Neufeld (2009). "Nutrient-dependent regulation of autophagy through the target of rapamycin
pathway." Biochem Soc Trans 37(Pt 1): 232-236.
Chen, G. J., N. Qiu, C. Karrer, P. Caspers and M. G. Page (2000). "Restriction site-free insertion
of PCR products directionally into vectors." Biotechniques 28(3): 498-500, 504-495.
Clapham, D. E. (2007). "Calcium signaling." Cell 131(6): 1047-1058.
Clarke, K. J., A. E. Adams, L. H. Manzke, T. W. Pearson, C. H. Borchers and R. K. Porter
(2012). "A role for ubiquitinylation and the cytosolic proteasome in turnover of mitochondrial
uncoupling protein 1 (UCP1)." Biochim Biophys Acta 1817(10): 1759-1767.
Cobbold, P. H. and P. K. Bourne (1984). "Aequorin measurements of free calcium in single heart
cells." Nature 312(5993): 444-446.
Criollo, A., M. C. Maiuri, E. Tasdemir, I. Vitale, A. A. Fiebig, D. Andrews, J. Molgo, J. Diaz, S.
Lavandero, F. Harper, G. Pierron, D. di Stefano, R. Rizzuto, G. Szabadkai and G. Kroemer
(2007). "Regulation of autophagy by the inositol trisphosphate receptor." Cell Death Differ
14(5): 1029-1039.

79
Csordas, G., A. P. Thomas and G. Hajnoczky (1999). "Quasi-synaptic calcium signal
transmission between endoplasmic reticulum and mitochondria." EMBO J 18(1): 96-108.
Darsow, T., S. E. Rieder and S. D. Emr (1997). "A multispecificity syntaxin homologue, Vam3p,
essential for autophagic and biosynthetic protein transport to the vacuole." J Cell Biol 138(3):
517-529.
de Brito, O. M. and L. Scorrano (2008). "Mitofusin 2 tethers endoplasmic reticulum to
mitochondria." Nature 456(7222): 605-610.
De Stefani, D., A. Raffaello, E. Teardo, I. Szabo and R. Rizzuto (2011). "A forty-kilodalton
protein of the inner membrane is the mitochondrial calcium uniporter." Nature 476(7360): 336-
340.
DeBerardinis, R. J., J. J. Lum, G. Hatzivassiliou and C. B. Thompson (2008). "The biology of
cancer: metabolic reprogramming fuels cell growth and proliferation." Cell Metab 7(1): 11-20.
Decuypere, J. P., G. Bultynck and J. B. Parys (2011). "A dual role for Ca(2+) in autophagy
regulation." Cell Calcium 50(3): 242-250.
Decuypere, J. P., K. Welkenhuyzen, T. Luyten, R. Ponsaerts, M. Dewaele, J. Molgo, P.
Agostinis, L. Missiaen, H. De Smedt, J. B. Parys and G. Bultynck (2011). "Ins(1,4,5)P3
receptor-mediated Ca2+ signaling and autophagy induction are interrelated." Autophagy 7(12):
1472-1489.
Deter, R. L. and C. De Duve (1967). "Influence of glucagon, an inducer of cellular autophagy,
on some physical properties of rat liver lysosomes." J Cell Biol 33(2): 437-449.
Dilova, I., E. Easlon and S. J. Lin (2007). "Calorie restriction and the nutrient sensing signaling
pathways." Cell Mol Life Sci 64(6): 752-767.
Dimmer, K. S., F. Navoni, A. Casarin, E. Trevisson, S. Endele, A. Winterpacht, L. Salviati and
L. Scorrano (2008). "LETM1, deleted in Wolf-Hirschhorn syndrome is required for normal
mitochondrial morphology and cellular viability." Hum Mol Genet 17(2): 201-214.
80
Ebenhoh, O. and R. Heinrich (2001). "Evolutionary optimization of metabolic pathways.
Theoretical reconstruction of the stoichiometry of ATP and NADH producing systems." Bull
Math Biol 63(1): 21-55.
Ferree, A. and O. Shirihai (2012). "Mitochondrial dynamics: the intersection of form and
function." Adv Exp Med Biol 748: 13-40.
Frazier, K., S. Williams, D. Kothapalli, H. Klapper and G. R. Grotendorst (1996). "Stimulation
of fibroblast cell growth, matrix production, and granulation tissue formation by connective
tissue growth factor." J Invest Dermatol 107(3): 404-411.
Funakoshi, T., A. Matsuura, T. Noda and Y. Ohsumi (1997). "Analyses of APG13 gene involved
in autophagy in yeast, Saccharomyces cerevisiae." Gene 192(2): 207-213.
Garcia-Bustos, J., J. Heitman and M. N. Hall (1991). "Nuclear protein localization." Biochim
Biophys Acta 1071(1): 83-101.
Geisler, S., K. M. Holmstrom, D. Skujat, F. C. Fiesel, O. C. Rothfuss, P. J. Kahle and W.
Springer (2010). "PINK1/Parkin-mediated mitophagy is dependent on VDAC1 and
p62/SQSTM1." Nat Cell Biol 12(2): 119-131.
Gomes, L. C., G. Di Benedetto and L. Scorrano (2011). "During autophagy mitochondria
elongate, are spared from degradation and sustain cell viability." Nat Cell Biol 13(5): 589-598.
Gordon, P. B., I. Holen, M. Fosse, J. S. Rotnes and P. O. Seglen (1993). "Dependence of
hepatocytic autophagy on intracellularly sequestered calcium." J Biol Chem 268(35): 26107-
26112.
Graham, N. A., M. Tahmasian, B. Kohli, E. Komisopoulou, M. Zhu, I. Vivanco, M. A. Teitell,
H. Wu, A. Ribas, R. S. Lo, I. K. Mellinghoff, P. S. Mischel and T. G. Graeber (2012). "Glucose
deprivation activates a metabolic and signaling amplification loop leading to cell death." Mol
Syst Biol 8: 589.
Haigis, M. C., R. Mostoslavsky, K. M. Haigis, K. Fahie, D. C. Christodoulou, A. J. Murphy, D.
M. Valenzuela, G. D. Yancopoulos, M. Karow, G. Blander, C. Wolberger, T. A. Prolla, R.

81
Weindruch, F. W. Alt and L. Guarente (2006). "SIRT4 inhibits glutamate dehydrogenase and
opposes the effects of calorie restriction in pancreatic beta cells." Cell 126(5): 941-954.
Hajnoczky, G., L. D. Robb-Gaspers, M. B. Seitz and A. P. Thomas (1995). "Decoding of
cytosolic calcium oscillations in the mitochondria." Cell 82(3): 415-424.
Haneda, M., D. Koya, M. Isono and R. Kikkawa (2003). "Overview of glucose signaling in
mesangial cells in diabetic nephropathy." J Am Soc Nephrol 14(5): 1374-1382.
Hansford, R. G. (1994). "Physiological role of mitochondrial Ca2+ transport." J Bioenerg
Biomembr 26(5): 495-508.
Hardie, D. G. (2003). "Minireview: the AMP-activated protein kinase cascade: the key sensor of
cellular energy status." Endocrinology 144(12): 5179-5183.
Hartl, F. U., N. Pfanner, D. W. Nicholson and W. Neupert (1989). "Mitochondrial protein
import." Biochim Biophys Acta 988(1): 1-45.
Head, J. F., S. Inouye, K. Teranishi and O. Shimomura (2000). "The crystal structure of the
photoprotein aequorin at 2.3 A resolution." Nature 405(6784): 372-376.
Hershko, A. and A. Ciechanover (1998). "The ubiquitin system." Annu Rev Biochem 67: 425-
479.
Hoeflich, K. P. and M. Ikura (2002). "Calmodulin in action: diversity in target recognition and
activation mechanisms." Cell 108(6): 739-742.
Hornbeck, P. V., J. M. Kornhauser, S. Tkachev, B. Zhang, E. Skrzypek, B. Murray, V. Latham
and M. Sullivan (2012). "PhosphoSitePlus: a comprehensive resource for investigating the
structure and function of experimentally determined post-translational modifications in man and
mouse." Nucleic Acids Res 40(Database issue): D261-270.
Hoyer-Hansen, M. and M. Jaattela (2007). "Connecting endoplasmic reticulum stress to
autophagy by unfolded protein response and calcium." Cell Death Differ 14(9): 1576-1582.
82
Ichimura, Y., T. Kirisako, T. Takao, Y. Satomi, Y. Shimonishi, N. Ishihara, N. Mizushima, I.
Tanida, E. Kominami, M. Ohsumi, T. Noda and Y. Ohsumi (2000). "A ubiquitin-like system
mediates protein lipidation." Nature 408(6811): 488-492.
Inouye, S. and F. I. Tsuji (1993). "Cloning and sequence analysis of cDNA for the Ca(2+)-
activated photoprotein, clytin." FEBS Lett 315(3): 343-346.
Jiang, D., L. Zhao and D. E. Clapham (2009). "Genome-wide RNAi screen identifies Letm1 as a
mitochondrial Ca2+/H+ antiporter." Science 326(5949): 144-147.
Jouaville, L. S., P. Pinton, C. Bastianutto, G. A. Rutter and R. Rizzuto (1999). "Regulation of
mitochondrial ATP synthesis by calcium: evidence for a long-term metabolic priming." Proc
Natl Acad Sci U S A 96(24): 13807-13812.
Kahn, B. B., T. Alquier, D. Carling and D. G. Hardie (2005). "AMP-activated protein kinase:
ancient energy gauge provides clues to modern understanding of metabolism." Cell Metab 1(1):
15-25.
Kamada, Y., T. Funakoshi, T. Shintani, K. Nagano, M. Ohsumi and Y. Ohsumi (2000). "Tor-
mediated induction of autophagy via an Apg1 protein kinase complex." J Cell Biol 150(6): 1507-
1513.
Kapahi, P., D. Chen, A. N. Rogers, S. D. Katewa, P. W. Li, E. L. Thomas and L. Kockel (2010).
"With TOR, less is more: a key role for the conserved nutrient-sensing TOR pathway in aging."
Cell Metab 11(6): 453-465.
Khan, M. T. and S. K. Joseph (2010). "Role of inositol trisphosphate receptors in autophagy in
DT40 cells." J Biol Chem 285(22): 16912-16920.
Kim, I., S. Rodriguez-Enriquez and J. J. Lemasters (2007). "Selective degradation of
mitochondria by mitophagy." Arch Biochem Biophys 462(2): 245-253.
Kirichok, Y., G. Krapivinsky and D. E. Clapham (2004). "The mitochondrial calcium uniporter
is a highly selective ion channel." Nature 427(6972): 360-364.

83
Klenkler, B. and H. Sheardown (2004). "Growth factors in the anterior segment: role in tissue
maintenance, wound healing and ocular pathology." Exp Eye Res 79(5): 677-688.
Klionsky, D. J. and Y. Ohsumi (1999). "Vacuolar import of proteins and organelles from the
cytoplasm." Annu Rev Cell Dev Biol 15: 1-32.
Koppen, M. and T. Langer (2007). "Protein degradation within mitochondria: versatile activities
of AAA proteases and other peptidases." Crit Rev Biochem Mol Biol 42(3): 221-242.
Koren, I., E. Reem and A. Kimchi (2010). "DAP1, a novel substrate of mTOR, negatively
regulates autophagy." Curr Biol 20(12): 1093-1098.
Kuma, A., M. Hatano, M. Matsui, A. Yamamoto, H. Nakaya, T. Yoshimori, Y. Ohsumi, T.
Tokuhisa and N. Mizushima (2004). "The role of autophagy during the early neonatal starvation
period." Nature 432(7020): 1032-1036.
Lee, J., S. Giordano and J. Zhang (2012). "Autophagy, mitochondria and oxidative stress: cross-
talk and redox signalling." Biochem J 441(2): 523-540.
Li, Z. Y., Y. Yang, M. Ming and B. Liu (2011). "Mitochondrial ROS generation for regulation of
autophagic pathways in cancer." Biochem Biophys Res Commun 414(1): 5-8.
Lienhard, G. E., J. W. Slot, D. E. James and M. M. Mueckler (1992). "How cells absorb
glucose." Sci Am 266(1): 86-91.
Livnat-Levanon, N. and M. H. Glickman (2011). "Ubiquitin-proteasome system and
mitochondria - reciprocity." Biochim Biophys Acta 1809(2): 80-87.
Lum, J. J., R. J. DeBerardinis and C. B. Thompson (2005). "Autophagy in metazoans: cell
survival in the land of plenty." Nat Rev Mol Cell Biol 6(6): 439-448.
Mailloux, R. J. and M. E. Harper (2012). "Mitochondrial proticity and ROS signaling: lessons
from the uncoupling proteins." Trends Endocrinol Metab 23(9): 451-458.
Makarova, O., E. Kamberov and B. Margolis (2000). "Generation of deletion and point
mutations with one primer in a single cloning step." Biotechniques 29(5): 970-972.

84
Mallilankaraman, K., C. Cardenas, P. J. Doonan, H. C. Chandramoorthy, K. M. Irrinki, T.
Golenar, G. Csordas, P. Madireddi, J. Yang, M. Muller, R. Miller, J. E. Kolesar, J. Molgo, B.
Kaufman, G. Hajnoczky, J. K. Foskett and M. Madesh (2012). "MCUR1 is an essential
component of mitochondrial Ca2+ uptake that regulates cellular metabolism." Nat Cell Biol
14(12): 1336-1343.
Mallilankaraman, K., P. Doonan, C. Cardenas, H. C. Chandramoorthy, M. Muller, R. Miller, N.
E. Hoffman, R. K. Gandhirajan, J. Molgo, M. J. Birnbaum, B. S. Rothberg, D. O. Mak, J. K.
Foskett and M. Madesh (2012). "MICU1 is an essential gatekeeper for MCU-mediated
mitochondrial Ca(2+) uptake that regulates cell survival." Cell 151(3): 630-644.
Manders, E. M., J. Stap, G. J. Brakenhoff, R. van Driel and J. A. Aten (1992). "Dynamics of
three-dimensional replication patterns during the S-phase, analysed by double labelling of DNA
and confocal microscopy." J Cell Sci 103 ( Pt 3): 857-862.
Margineantu, D. H., C. B. Emerson, D. Diaz and D. M. Hockenbery (2007). "Hsp90 inhibition
decreases mitochondrial protein turnover." PLoS One 2(10): e1066.
Massey, A. C., C. Zhang and A. M. Cuervo (2006). "Chaperone-mediated autophagy in aging
and disease." Curr Top Dev Biol 73: 205-235.
McCormack, J. G., A. P. Halestrap and R. M. Denton (1990). "Role of calcium ions in regulation
of mammalian intramitochondrial metabolism." Physiol Rev 70(2): 391-425.
McNurlan, M. A. (2012). "New perspectives in the control of body protein metabolism." Br J
Nutr 108 Suppl 2: S94-104.
Melendez-Hevia, E., T. G. Waddell and M. Cascante (1996). "The puzzle of the Krebs citric acid
cycle: assembling the pieces of chemically feasible reactions, and opportunism in the design of
metabolic pathways during evolution." J Mol Evol 43(3): 293-303.
Michishita, E., J. Y. Park, J. M. Burneskis, J. C. Barrett and I. Horikawa (2005). "Evolutionarily
conserved and nonconserved cellular localizations and functions of human SIRT proteins." Mol
Biol Cell 16(10): 4623-4635.
85
Millard, S. M. and S. A. Wood (2006). "Riding the DUBway: regulation of protein trafficking by
deubiquitylating enzymes." J Cell Biol 173(4): 463-468.
Mitchell, P. (1967). "Proton current flow in mitochondrial systems." Nature 214(5095): 1327-
1328.
Mizushima, N. and D. J. Klionsky (2007). "Protein turnover via autophagy: implications for
metabolism." Annu Rev Nutr 27: 19-40.
Nakamura, N., A. Matsuura, Y. Wada and Y. Ohsumi (1997). "Acidification of vacuoles is
required for autophagic degradation in the yeast, Saccharomyces cerevisiae." J Biochem 121(2):
338-344.
Narendra, D., A. Tanaka, D. F. Suen and R. J. Youle (2008). "Parkin is recruited selectively to
impaired mitochondria and promotes their autophagy." J Cell Biol 183(5): 795-803.
Newman, J. C., W. He and E. Verdin (2012). "Mitochondrial protein acylation and intermediary
metabolism: regulation by sirtuins and implications for metabolic disease." J Biol Chem 287(51):
42436-42443.
Noda, T. and Y. Ohsumi (1998). "Tor, a phosphatidylinositol kinase homologue, controls
autophagy in yeast." J Biol Chem 273(7): 3963-3966.
Nogueiras, R., K. M. Habegger, N. Chaudhary, B. Finan, A. S. Banks, M. O. Dietrich, T. L.
Horvath, D. A. Sinclair, P. T. Pfluger and M. H. Tschop (2012). "Sirtuin 1 and sirtuin 3:
physiological modulators of metabolism." Physiol Rev 92(3): 1479-1514.
North, B. J. and E. Verdin (2004). "Sirtuins: Sir2-related NAD-dependent protein deacetylases."
Genome Biol 5(5): 224.
Nothwehr, S. F. and J. I. Gordon (1990). "Targeting of proteins into the eukaryotic secretory
pathway: signal peptide structure/function relationships." Bioessays 12(10): 479-484.
Nowikovsky, K., E. M. Froschauer, G. Zsurka, J. Samaj, S. Reipert, M. Kolisek, G.
Wiesenberger and R. J. Schweyen (2004). "The LETM1/YOL027 gene family encodes a factor

86
of the mitochondrial K+ homeostasis with a potential role in the Wolf-Hirschhorn syndrome." J
Biol Chem 279(29): 30307-30315.
Oh, W. J. and E. Jacinto (2011). "mTOR complex 2 signaling and functions." Cell Cycle 10(14):
2305-2316.
Onodera, J. and Y. Ohsumi (2004). "Ald6p is a preferred target for autophagy in yeast,
Saccharomyces cerevisiae." J Biol Chem 279(16): 16071-16076.
Pagliarini, D. J., S. E. Calvo, B. Chang, S. A. Sheth, S. B. Vafai, S. E. Ong, G. A. Walford, C.
Sugiana, A. Boneh, W. K. Chen, D. E. Hill, M. Vidal, J. G. Evans, D. R. Thorburn, S. A. Carr
and V. K. Mootha (2008). "A mitochondrial protein compendium elucidates complex I disease
biology." Cell 134(1): 112-123.
Palmer, A. E., M. Giacomello, T. Kortemme, S. A. Hires, V. Lev-Ram, D. Baker and R. Y.
Tsien (2006). "Ca2+ indicators based on computationally redesigned calmodulin-peptide pairs."
Chem Biol 13(5): 521-530.
Palmer, A. E., C. Jin, J. C. Reed and R. Y. Tsien (2004). "Bcl-2-mediated alterations in
endoplasmic reticulum Ca2+ analyzed with an improved genetically encoded fluorescent
sensor." Proc Natl Acad Sci U S A 101(50): 17404-17409.
Palmer, A. E. and R. Y. Tsien (2006). "Measuring calcium signaling using genetically targetable
fluorescent indicators." Nat Protoc 1(3): 1057-1065.
Palty, R., W. F. Silverman, M. Hershfinkel, T. Caporale, S. L. Sensi, J. Parnis, C. Nolte, D.
Fishman, V. Shoshan-Barmatz, S. Herrmann, D. Khananshvili and I. Sekler (2010). "NCLX is an
essential component of mitochondrial Na+/Ca2+ exchange." Proc Natl Acad Sci U S A 107(1):
436-441.
Pattingre, S., A. Tassa, X. Qu, R. Garuti, X. H. Liang, N. Mizushima, M. Packer, M. D.
Schneider and B. Levine (2005). "Bcl-2 antiapoptotic proteins inhibit Beclin 1-dependent
autophagy." Cell 122(6): 927-939.
87
Perocchi, F., V. M. Gohil, H. S. Girgis, X. R. Bao, J. E. McCombs, A. E. Palmer and V. K.
Mootha (2010). "MICU1 encodes a mitochondrial EF hand protein required for Ca(2+) uptake."
Nature 467(7313): 291-296.
Pinton, P., T. Pozzan and R. Rizzuto (1998). "The Golgi apparatus is an inositol 1,4,5-
trisphosphate-sensitive Ca2+ store, with functional properties distinct from those of the
endoplasmic reticulum." EMBO J 17(18): 5298-5308.
Pinton, P., A. Rimessi, A. Romagnoli, A. Prandini and R. Rizzuto (2007). "Biosensors for the
detection of calcium and pH." Methods Cell Biol 80: 297-325.
Pinton, P. and R. Rizzuto (2006). "Bcl-2 and Ca2+ homeostasis in the endoplasmic reticulum."
Cell Death Differ 13(8): 1409-1418.
Poburko, D., J. Santo-Domingo and N. Demaurex (2011). "Dynamic regulation of the
mitochondrial proton gradient during cytosolic calcium elevations." J Biol Chem 286(13):
11672-11684.
Proud, C. G. (2007). "Amino acids and mTOR signalling in anabolic function." Biochem Soc
Trans 35(Pt 5): 1187-1190.
Qu, X., Z. Zou, Q. Sun, K. Luby-Phelps, P. Cheng, R. N. Hogan, C. Gilpin and B. Levine
(2007). "Autophagy gene-dependent clearance of apoptotic cells during embryonic
development." Cell 128(5): 931-946.
Radke, S., H. Chander, P. Schafer, G. Meiss, R. Kruger, J. B. Schulz and D. Germain (2008).
"Mitochondrial protein quality control by the proteasome involves ubiquitination and the
protease Omi." J Biol Chem 283(19): 12681-12685.
Rapizzi, E., P. Pinton, G. Szabadkai, M. R. Wieckowski, G. Vandecasteele, G. Baird, R. A. Tuft,
K. E. Fogarty and R. Rizzuto (2002). "Recombinant expression of the voltage-dependent anion
channel enhances the transfer of Ca2+ microdomains to mitochondria." J Cell Biol 159(4): 613-
624.

88
Rasola, A. and P. Bernardi (2011). "Mitochondrial permeability transition in Ca(2+)-dependent
apoptosis and necrosis." Cell Calcium 50(3): 222-233.
Ratcliffe, M. J., K. Itoh and S. Y. Sokol (2000). "A positive role for the PP2A catalytic subunit
in Wnt signal transduction." J Biol Chem 275(46): 35680-35683.
Rennie, M. J. (1999). "An introduction to the use of tracers in nutrition and metabolism." Proc
Nutr Soc 58(4): 935-944.
Rizzuto, R., M. Brini, M. Murgia and T. Pozzan (1993). "Microdomains with high Ca2+ close to
IP3-sensitive channels that are sensed by neighboring mitochondria." Science 262(5134): 744-
747.
Rizzuto, R., W. Carrington and R. A. Tuft (1998). "Digital imaging microscopy of living cells."
Trends Cell Biol 8(7): 288-292.
Rizzuto, R., P. Pinton, W. Carrington, F. S. Fay, K. E. Fogarty, L. M. Lifshitz, R. A. Tuft and T.
Pozzan (1998). "Close contacts with the endoplasmic reticulum as determinants of mitochondrial
Ca2+ responses." Science 280(5370): 1763-1766.
Rizzuto, R. and T. Pozzan (2006). "Microdomains of intracellular Ca2+: molecular determinants
and functional consequences." Physiol Rev 86(1): 369-408.
Rizzuto, R., A. W. Simpson, M. Brini and T. Pozzan (1992). "Rapid changes of mitochondrial
Ca2+ revealed by specifically targeted recombinant aequorin." Nature 358(6384): 325-327.
Sandoval, H., P. Thiagarajan, S. K. Dasgupta, A. Schumacher, J. T. Prchal, M. Chen and J.
Wang (2008). "Essential role for Nix in autophagic maturation of erythroid cells." Nature
454(7201): 232-235.
Sarkar, S., R. A. Floto, Z. Berger, S. Imarisio, A. Cordenier, M. Pasco, L. J. Cook and D. C.
Rubinsztein (2005). "Lithium induces autophagy by inhibiting inositol monophosphatase." J Cell
Biol 170(7): 1101-1111.
89
Scaduto, R. C., Jr. and L. W. Grotyohann (2000). "2,3-butanedione monoxime unmasks Ca(2+)-
induced NADH formation and inhibits electron transport in rat hearts." Am J Physiol Heart Circ
Physiol 279(4): H1839-1848.
Scher, M. B., A. Vaquero and D. Reinberg (2007). "SirT3 is a nuclear NAD+-dependent histone
deacetylase that translocates to the mitochondria upon cellular stress." Genes Dev 21(8): 920-
928.
Schmidt, S., S. Sunyaev, P. Bork and T. Dandekar (2003). "Metabolites: a helping hand for
pathway evolution?" Trends Biochem Sci 28(6): 336-341.
Schoenmakers, T. J., G. J. Visser, G. Flik and A. P. Theuvenet (1992). "CHELATOR: an
improved method for computing metal ion concentrations in physiological solutions."
Biotechniques 12(6): 870-874, 876-879.
Sheen, J., L. Zhou and J. C. Jang (1999). "Sugars as signaling molecules." Curr Opin Plant Biol
2(5): 410-418.
Shimomura, O. (1995). "A short story of aequorin." Biol Bull 189(1): 1-5.
Singh, R. and A. M. Cuervo (2011). "Autophagy in the cellular energetic balance." Cell Metab
13(5): 495-504.
Spirin, V., M. S. Gelfand, A. A. Mironov and L. A. Mirny (2006). "A metabolic network in the
evolutionary context: multiscale structure and modularity." Proc Natl Acad Sci U S A 103(23):
8774-8779.
Sporn, M. B. and A. B. Roberts (1988). "Peptide growth factors are multifunctional." Nature
332(6161): 217-219.
Suen, D. F., D. P. Narendra, A. Tanaka, G. Manfredi and R. J. Youle (2010). "Parkin
overexpression selects against a deleterious mtDNA mutation in heteroplasmic cybrid cells."
Proc Natl Acad Sci U S A 107(26): 11835-11840.
Tan, W. and M. Colombini (2007). "VDAC closure increases calcium ion flux." Biochim
Biophys Acta 1768(10): 2510-2515.

90
Tanno, M., J. Sakamoto, T. Miura, K. Shimamoto and Y. Horio (2007). "Nucleocytoplasmic
shuttling of the NAD+-dependent histone deacetylase SIRT1." J Biol Chem 282(9): 6823-6832.
Trenker, M., R. Malli, I. Fertschai, S. Levak-Frank and W. F. Graier (2007). "Uncoupling
proteins 2 and 3 are fundamental for mitochondrial Ca2+ uniport." Nat Cell Biol 9(4): 445-452.
Triplitt, C. L. (2012). "Examining the mechanisms of glucose regulation." Am J Manag Care
18(1 Suppl): S4-10.
Tsukada, M. and Y. Ohsumi (1993). "Isolation and characterization of autophagy-defective
mutants of Saccharomyces cerevisiae." FEBS Lett 333(1-2): 169-174.
Vander Heiden, M. G., L. C. Cantley and C. B. Thompson (2009). "Understanding the Warburg
effect: the metabolic requirements of cell proliferation." Science 324(5930): 1029-1033.
Varabyova, A., D. Stojanovski and A. Chacinska (2013). "Mitochondrial protein homeostasis."
IUBMB Life.
Wang, C. W. and D. J. Klionsky (2003). "The molecular mechanism of autophagy." Mol Med
9(3-4): 65-76.
Wong, P. M., C. Puente, I. G. Ganley and X. Jiang (2013). "The ULK1 complex: Sensing
nutrient signals for autophagy activation." Autophagy 9(2).
Zhang, Y., H. Qi, R. Taylor, W. Xu, L. F. Liu and S. Jin (2007). "The role of autophagy in
mitochondria maintenance: characterization of mitochondrial functions in autophagy-deficient S.
cerevisiae strains." Autophagy 3(4): 337-346.
Zhong, L. and R. Mostoslavsky (2011). "Fine tuning our cellular factories: sirtuins in
mitochondrial biology." Cell Metab 13(6): 621-626.