Università degli Studi di Palermo - CORE · Università degli Studi di Palermo Dipartimento di...
149
Università degli Studi di Palermo Dipartimento di Scienze Agrarie e Forestali PhD Thesis Application of molecular markers to investigate genetic diversity in Sicilian livestock S.S.D. AGR/17 Candidato Tutor Dott. Salvatore Mastrangelo Prof. Baldassare Portolano Coordinatore Prof.ssa Adriana Bonanno
Transcript of Università degli Studi di Palermo - CORE · Università degli Studi di Palermo Dipartimento di...

Università degli Studi di Palermo
Dipartimento di Scienze Agrarie e Forestali
PhD Thesis
Application of molecular markers to
investigate genetic diversity in Sicilian
livestock
S.S.D. AGR/17
Candidato Tutor
Dott. Salvatore Mastrangelo Prof. Baldassare Portolano
Coordinatore
Prof.ssa Adriana Bonanno

Application of molecular markers to
investigate genetic diversity in Sicilian
livestock
Salvatore Mastrangelo


Contents
7 Abstract
11 Riassunto
15 1. General introduction
25 2. Study of polymorphisms in the promoter region of ovine β-
lactoglobulin gene and phylogenetic analysis among the Valle del
Belice breed and other sheep breeds considered as ancestors
47 3. Genetic diversity and population structure of Sicilian sheep
breeds using microsatellite markers
77 4. Genome wide structure in indigenous Sicilian cattle breeds
113 5. Genome wide linkage disequilibrium and genetic diversity in
three autochthonous Sicilian dairy sheep breeds
141 6. General Conclusion

7
Abstract
The genetic diversity of farm animal species and breeds is an important
resource in all livestock systems. To evaluate genetic diversity in
livestock populations several methods have been developed based on
pedigree information or on molecular data. The increasing availability of
molecular markers for most farm animal species and the development of
techniques to analyze molecular variation are widening the capacity to
characterize breeds genetic variation. Moreover, little is known about the
genetic diversity in Sicilian livestock breeds and populations. The aim of
this thesis was to explore the genetic diversity of the Sicilian
autochthonous breeds and populations using molecular markers.
In chapter 2, the promoter region of ovine -lactoglobulin (BLG) gene
was sequenced in order to identify polymorphisms, infer and analyze
haplotypes, and phylogenetic relationship among the Valle del Belice
sheep breed and other three breeds considered as ancestors. Sequencing
analysis and alignment of the obtained sequences showed the presence of
36 single nucleotide polymorphisms (SNPs) and one deletion. We found
four binding sites for milk protein binding factors (MPBFs) and five
binding sites for nuclear factor-I (NF-I). The number of identified
polymorphisms showed high variability within breeds. A total of 22
haplotypes found in best reconstruction were inferred considering all 37
polymorphic sites. Haplotypes were used for the reconstruction of a
phylogenetic tree using the Neighbor-Joining algorithm. Analysis of
genetic diversity indexes showed that the Sarda sheep breed presented the
lowest nucleotide diversity, whereas the Comisana sheep breed presented
the highest one. Comparing the nucleotide diversity among breeds, the
highest value was obtained between Valle del Belice and Pinzirita sheep

8
breeds, whereas the lowest one was between Valle del Belice and Sarda
sheep breeds. Considering that polymorphisms in the promoter region of
BLG gene could have a functional role associated with milk composition,
the lowest value of nucleotide diversity between Valle del Belice and
Sarda sheep breeds may be related to a higher similarity of milk
composition of these two breeds compared to the others.
In Chapter 3, microsatellite markers were used to explore the genetic
structure of the four Sicilian autochthonous and Sarda sheep breeds, and
to determine their genetic relationship. A total of 259 alleles were
observed with average polymorphic information content (PIC) equal to
0.76, showing that the used microsatellites panel was highly informative.
The low value of genetic differentiation among breeds (Fst=0.049) may
indicate that these breeds have a low differentiation level probably due to
common history and breeding practices. The low Fis and Fit values
indicated low level of inbreeding within and among breeds. The Unrooted
Neighbor-Joining dendrogram obtained from the Reynold’s genetic
distances, and factorial correspondence analysis revealed a separation
between Barbaresca and the other sheep breeds. The Bayesian assignment
test showed that Barbaresca and Sarda sheep breeds had more defined
genetic structure, whereas the lowest assignment value was found in the
Pinzirita sheep breed. Our results indicated high genetic variability, low
inbreeding and low genetic differentiation, except for Barbaresca sheep
breed, and were in accordance with geographical location, history, and
breeding practices. The low robustness of the assignment test makes it
unfeasible for traceability purposes, due to the high level of admixture, in
particular for Sicilian dairy sheep breeds.

9
In Chapter 4 were reported for the first time the estimates of population
structure, the levels of inbreeding (F) and coancestry (f), and the linkage
disequilibrium (LD) in two Sicilian autochthonous cattle breeds, the
Cinisara and the Modicana, using the Illumina Bovine SNP50K v2
BeadChip. Principal Components Analysis and Bayesian clustering
algorithm showed that animals from the two Sicilian breeds formed non-
overlapping clusters and are clearly separated populations, even from the
Holstein control population. The average molecular F and f coefficients
were moderately high, and the current estimates of Ne were low in both
breeds. These values indicated a low genetic variability. The average r2
was notably lower than the values observed in other cattle breeds. The
highest r2 values were found in chromosome 14, where causative
mutations affecting variation in milk production traits have been reported.
The low value of LD indicated that the present chip is not an optimum,
and that a denser SNP array is needed to capture more LD information.
The levels of inbreeding and Ne reported in this study point out the need
to establish a conservation program for these autochthonous cattle breeds.
In Chapter 5 genome wide levels of LD, the number of haplotype blocks
for each chromosome in each breed and the genetic diversity was assessed
in the Sicilian dairy sheep breeds, using the Illumina Ovine SNP50K v1
BeadChip. The LD declined as a function of distance and average r2 was
notably lower than the value observed in other sheep breeds. Few and
small haplotype blocks were observed in Comisana and Pinzirita sheep
breeds, which contained just two SNPs. The number of haplotype blocks
reported in our study for the Sicilian dairy sheep breeds were extremely
lower than those reported in other livestock species. PCA showed that
while Valle del Belice and Pinzirita sheep breeds formed a unique cluster,

10
the Comisana sheep breed showed the presence of substructure. PCA
using a subset of SNPs showed lack of ability to discriminate among the
breeds. The Pinzirita sheep breed displayed the highest genetic diversity,
whereas the lowest value was found in the Valle del Belice sheep breed.
The information generated from this study has important implications for
the design and applications of association studies as well as for the
development of selection breeding programs.
11
Riassunto
La diversità genetica delle specie e razze di interesse zootecnico,
rappresenta un’importante risorsa in tutti i sistemi di allevamento . Per lo
studio della diversità genetica, nel corso dei decenni sono stati sviluppati
diversi metodi che si basano su informazioni del pedigree o su dati
molecolari (microsatelliti e SNPs, Single Nucleotide Polymorphisms).
Con l’aumento della disponibilità di marcatori molecolari per la maggior
parte delle specie di interesse zootecnico, e con lo sviluppo di sofisticate
tecniche analitiche, sta crescendo la capacità di caratterizzare la variabilità
genetica delle razze. Inoltre, ad oggi, poche sono le informazioni sulla
diversità genetica delle razze e delle popolazioni autoctone siciliane.
L’obiettivo di questa tesi è stato quello di studiare la diversità e la
struttura genetica nelle razze e popolazioni zootecniche autoctone
siciliane mediante l’uso di marcatori molecolari.
Nel capitolo 2 è stata sequenziata la regione promoter del gene della -
lattoglobulina (BLG) ovina al fine di individuare i polimorfismi, calcolare
e analizzare gli aplotipi e studiare le relazione filogenetiche tra la razza
Valle del Belice e le altre razze considerate sue progenitrici.
L’allineamento e l’analisi delle sequenze ottenute hanno evidenziato la
presenza di 36 SNPs e una delezione, sottolineando un’elevata variabilità
all’interno delle razze. Sono stati individuati quattro siti di legame per
Milk Protein Binding Factors (MPBFs) e cinque siti di legame Nuclear
Factor-I (NF-I). Utilizzando i siti polimorfici identificati, sono stati
calcolati 22 aplotipi, usati per la ricostruzione di un albero filogenetico
tramite l’algoritmo Neighbor-Joining. L’analisi degli indici di diversità
genetica ha mostrato valori più bassi di diversità nucleotidica per la razza
Sarda, mentre la razza Comisana ha presentato i valori più alti.
12
Confrontando la diversità nucleotidica tra le razze, il valore più alto è
stato ottenuto tra le razze Valle del Belice e Pinzirita, mentre quello più
basso è stato ottenuto tra la razza Valle del Belice e la razza Sarda.
Considerando che i polimorfismi nella regione promoter del gene della
BLG potrebbero avere un ruolo funzionale associato alla composizione
del latte, il valore più basso della diversità nucleotidica tra le razze Valle
del Belice e Sarda, potrebbe essere correlato ad una maggiore somiglianza
nella produzione qualitativa del latte di queste due razze rispetto alle altre.
Nel capitolo 3, un pannello di 20 marcatori microsatelliti è stato utilizzato
per studiare e caratterizzare la struttura genetica delle quattro razze ovine
autoctone siciliane (Barbaresca, Comisana, Pinzirita e Valle del Belice) e
della razza Sarda, e per determinare le relazioni filogenetiche che
intercorrono tra esse. Il numero di alleli trovati (259) ed il contenuto di
informazione polimorfica (PIC) indicano che il pannello utilizzato è
altamente informativo (0,76). I valori di Fst, Fis e Fit hanno mostrato una
bassa differenziazione genetica e bassi livelli di consanguineità all’interno
delle razze e tra esse. Il dendrogramma Neighbor-Joining, ottenuto sulla
base delle distanze genetiche di Reynold, e l’analisi delle corrispondenti
fattoriali, hanno evidenziato una marcata separazione tra la razza
Barbaresca e le altre razze ovine. Il test di assegnazione bayesiano ha
mostrato una struttura genetica più omogenea per le razze Barbaresca e
Sarda, mentre il più basso valore di assegnazione è stato trovato nella
razza Pinzirita. I nostri risultati indicano la presenza di una elevata
variabilità, bassa consanguineità e bassa differenziazione genetica, fatta
eccezione per la razza Barbaresca, in accordo con la posizione geografica,
i possibili flussi genici e le pratiche di allevamento. La bassa robustezza
del test di assegnazione rende inutilizzabile l’uso dei marcatori
13
microsatelliti ai fini della tracciabilità delle produzioni lattiero casearie, a
causa dell’elevata promiscuità e del flusso genico, in particolare per le
razze ovine da latte autoctone siciliane. Nel capitolo 4 vengono riportate
per la prima volta, le stime riguardanti la struttura genetica, i livelli di
inbreeding (F) e coancestry (f) e il linkage disequilibrium(LD) nelle razze
bovine autoctone siciliane Cinisara e Modicana, utilizzando l’Illumina
Bovine SNP50K v2 BeadChip. L’Analisi delle Componenti Principali
(PCA) e l’algoritmo di assegnazione basato sulla statistica bayesiana,
hanno mostrato che gli animali delle due razze formano due clusters
distinti. I coefficienti F e f erano moderatamente elevati, mentre le attuali
stime sulla effettiva dimensione della popolazione (Ne) erano basse in
entrambe le razze, sottolineando una bassa variabilità genetica. Il valore
medio del LD calcolato con r2
è risultato notevolmente inferiore rispetto
ai valori medi riportati in letteratura per le altre razze bovine. I più alti
valori di r2 sono stati trovati nel cromosoma 14, all’interno del quale sono
state descritte diverse mutazioni che influenzano la produzione quanti-
qualitativa del latte. Il basso valore di LD suggerisce che il presente chip
non è ottimale, e che un pannello a più alta densità è necessario per
acquisire le informazioni riguardanti i livelli di LD, mentre i parametri
riguardanti la consanguineità e Ne, indicano la necessità di avviare
programmi di conservazione per il recupero di queste razze bovine
autoctone. Il capitolo 5 riporta i risultati relativi al calcolo del LD, alla
stima del numero di blocchi di aplotipi per cromosoma e alla diversità
genetica nelle razze ovine autoctone siciliane allevate per la produzione di
latte, utilizzando gli Ovine Beadchip SNP50K v1 BeadChip. I valori del
LD diminuivano in funzione della distanza e la media del coefficiente r2
era notevolmente inferiore al valore osservato nelle altre razze ovine.
14
Sono stati trovati un ridotto numero di blocchi di aplotipi e un ridotto
numero di SNPs per blocco, in particolare nelle razze Comisana e
Pinzirita. La PCA ha mostrato che, mentre la Valle del Belice e la
Pinzirita formano due gruppi omogenei e distinti per razza, la Comisana
evidenzia la presenza di sottostrutture. La PCA condotta con un subset di
SNPs ha mostrato una scarsa capacità di discriminare le razze tra loro. La
razza Pinzirita ha evidenziato i più alti livelli di diversità genetica, mentre
i valori più bassi sono stati riscontrati nella razza Valle del Belice. Le
informazioni generate da questo studio potrebbero essere utilizzate per gli
studi di associazione, nonché per lo sviluppo di programmi di selezione e
miglioramento genetico.

1
General Introduction

16
1.1 Introduction
Livestock breeds have been formed by centuries of human and natural
selection. Breeds have been selected to fit a wide range of environmental
conditions and human needs [1]. The definition of a breed, as applied by
the Food and Agriculture Organisation of the United Nations, is based on
the homogeneity of external characteristics, or on a generally accepted
identity of animals of a geographically or culturally separated group [2].
Studies of genetic diversity in domestic animals are based on evaluation
of the genetic variation within breeds and genetic relationships among
them, since the breed is the management unit for which factors such as
inbreeding are controlled [3].
Interest in the conservation of local livestock types has increased over the
last 25 years in response to the expansion of highly productive livestock
breeds at the expense of local populations [4]. In fact, the selection of a
few highly productive breeds has caused the decline of numerous other
breeds. The need of conservation comes from the potential rate of
decrease of genetic variation. The loss of genetic variation within and
between breeds is detrimental not only from the perspectives of culture
and conservation but also utility since lost genes may be of future
economic interest. Within breeds, high rates of loss of genetic variation
leads to reduced chances of breed survival due to decreased fitness
through inbreeding depression. These are all due to small effective
population sizes, or, equivalently, high rates of inbreeding [5]. In fact, the
loss of gene pool may lead to an increase of the frequency of unfavorable
genes resulting in a further increase of the risk of extinction. The genetic
diversity found in local breeds allows farmers to develop new
characteristics in response to changes in environment, diseases, or market
17
conditions [6]. Indigenous breeds often possess gene combinations and
special adaptations not found in other breeds. These adaptive traits
include tolerance to various diseases, fluctuations in feed quality, extreme
climatic conditions and the ability to survive and reproduce for long
periods of time. Moreover, genetic diversity is essential for the
sustainability of livestock species; in fact, genetic diversity within breeds
is needed for long-term genetic improvement of livestock breeds, for
selection of new traits or traits in a changing environment, and to preserve
low performance due to inbreeding.
The conservation of farm animal resources is important for coping with
future breeding needs and for facilitating the sustainable use of marginal
areas. Therefore, for all aspects mentioned above, it is important to
prevent further loss of breeds and of diversity within breeds.
1.2 Genetic diversity
Genetic diversity can be defined as the additive genetic variance within
and between breeds and populations [7]. To evaluate genetic diversity in
livestock populations, several methods have been developed [8]. These
methods are based on pedigree information or on molecular data when
pedigree information is not available. Moreover, genetic diversity can be
estimated by combining pedigree and molecular data [9]. In several
situations, use of SNP markers instead of pedigree information for genetic
diversity estimation can be helpful, for example, for situations with poor
or absent pedigree information. Moreover, SNP markers can be used for a
more precise estimation of genetic diversity than pedigree information,
even when pedigree data is available and accurate, in case the density of
the SNP data is high enough. The SNP data allows to estimate the
18
absolute genetic diversity, without relying on an arbitrary base population
[10]. Furthermore, missing pedigree data and pedigree errors can result in
a low estimated inbreeding in a population that is highly inbred, resulting
in a negative effect on conservation [11].
The increasing availability of molecular markers for most farm animal
species and the development of techniques to analyze molecular variation
are widening the capacity to characterize breeds genetic variation.
Molecular markers, revealing polymorphisms at DNA level, are now key
players in animal genetics. However, due to the existence of various
molecular biology techniques to produce them, and to the various
biological implications some can have, a large variety exists, from which
choices will have to be made according to purposes [12].
The development of tools for DNA analysis, that has taken place in the
last few decades, has increased enormously the capacity to characterize
variation within and between breeds. The restricted traditional
characterization by means of phenotypic attributes can now be
complemented by an increasing available number of molecular markers
and the development of sophisticated statistical techniques for their
analysis [13].
1.3 Genetic markers systems used in livestock populations
Commonly considered DNA markers are Microsatellites and Single
Nucleotide Polymorphisms (SNPs).
Microsatellites, also known as Simple Sequence Repeats (SSRs) or Short
Tandem Repeats (STRs), are repeated sequences of 2-6 base pairs of
DNA. They generally occur in non-coding regions of the genome.
Microsatellites have been the marker system of choice in population
19
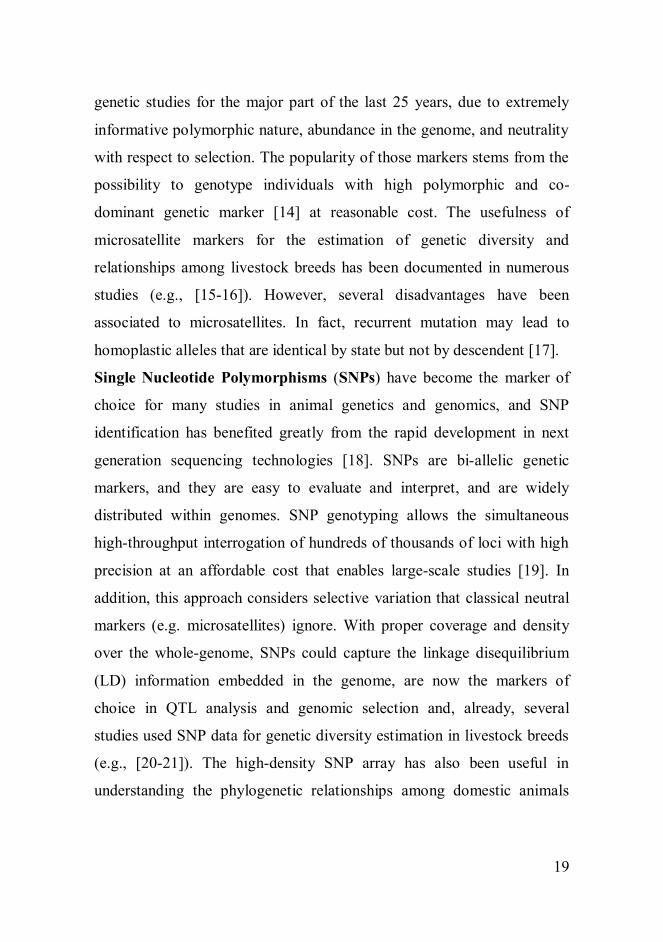
genetic studies for the major part of the last 25 years, due to extremely
informative polymorphic nature, abundance in the genome, and neutrality
with respect to selection. The popularity of those markers stems from the
possibility to genotype individuals with high polymorphic and co-
dominant genetic marker [14] at reasonable cost. The usefulness of
microsatellite markers for the estimation of genetic diversity and
relationships among livestock breeds has been documented in numerous
studies (e.g., [15-16]). However, several disadvantages have been
associated to microsatellites. In fact, recurrent mutation may lead to
homoplastic alleles that are identical by state but not by descendent [17].
Single Nucleotide Polymorphisms (SNPs) have become the marker of
choice for many studies in animal genetics and genomics, and SNP
identification has benefited greatly from the rapid development in next
generation sequencing technologies [18]. SNPs are bi-allelic genetic
markers, and they are easy to evaluate and interpret, and are widely
distributed within genomes. SNP genotyping allows the simultaneous
high-throughput interrogation of hundreds of thousands of loci with high
precision at an affordable cost that enables large-scale studies [19]. In
addition, this approach considers selective variation that classical neutral
markers (e.g. microsatellites) ignore. With proper coverage and density
over the whole-genome, SNPs could capture the linkage disequilibrium
(LD) information embedded in the genome, are now the markers of
choice in QTL analysis and genomic selection and, already, several
studies used SNP data for genetic diversity estimation in livestock breeds
(e.g., [20-21]). The high-density SNP array has also been useful in
understanding the phylogenetic relationships among domestic animals

20
[22], to predict the copy number variations [23], for paternity testing [24]
and tracing the geographic origins of animal products [25].
1.4 Aim of the thesis
Potentially, there is much unrecognized beneficial genetic variability in
local breeds and populations, which supposes important reservoirs of non-
exploited genetic resources. In Sicily, dairy production represents an
important resource for hilly and mountain areas economy, in which other
economic activities are limited, and the dairy products are the link among
product-territory, territory-breed and breed-product. Nowadays, several
local breeds and populations, belonging to livestock species (cattle, sheep
and goat), are reared in extensive traditional systems.
These breeds present differences in both morphology and production
traits, show excellent adaptability to the local environments and are not
subject to breeding programs. In fact, the development of breeding
programs for local breeds is too costly for breeding organizations, and the
absence of pedigree records is a threat for the existence of these breeds.
Their milk is used for the production of traditional raw milk cheeses,
sometimes protected designation of origin (PDO) cheeses. In some cases,
the quality of these products is linked to a specific breed. Assignment of
individuals to a specific breed, especially when the phenotypic
differentiation between breeds is difficult, is therefore of great importance
both for biodiversity purposes and dairy products traceability. The socio-
economic and ecological values, the historical, cultural and genetic
heritage of these breeds/populations are unquestionable. However, all
aspects mentioned above, which creates income for a small group of
farmers, justify the establishment of conservation programs.
21
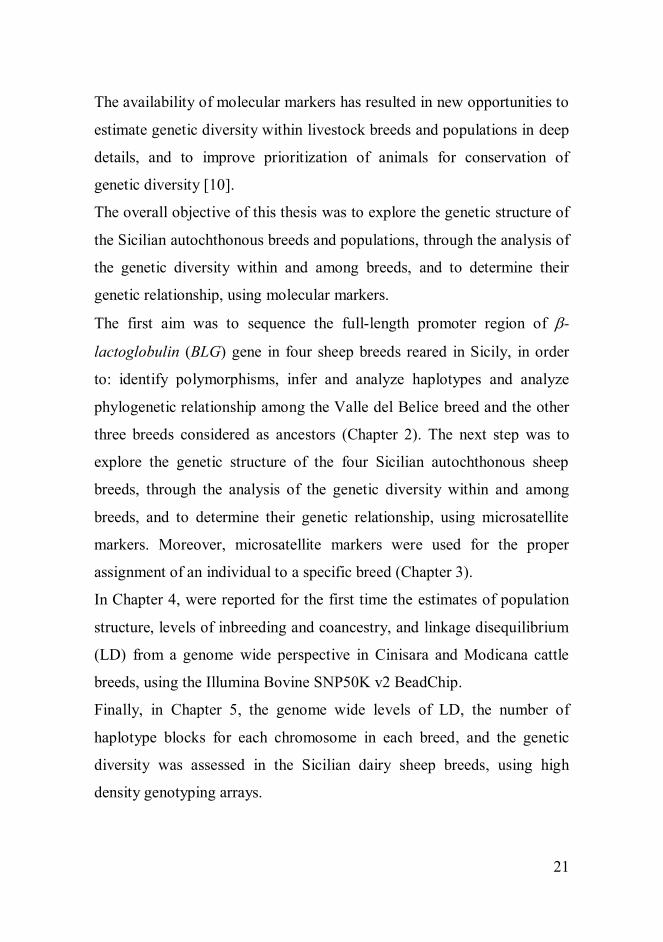
The availability of molecular markers has resulted in new opportunities to
estimate genetic diversity within livestock breeds and populations in deep
details, and to improve prioritization of animals for conservation of
genetic diversity [10].
The overall objective of this thesis was to explore the genetic structure of
the Sicilian autochthonous breeds and populations, through the analysis of
the genetic diversity within and among breeds, and to determine their
genetic relationship, using molecular markers.
The first aim was to sequence the full-length promoter region of -
lactoglobulin (BLG) gene in four sheep breeds reared in Sicily, in order
to: identify polymorphisms, infer and analyze haplotypes and analyze
phylogenetic relationship among the Valle del Belice breed and the other
three breeds considered as ancestors (Chapter 2). The next step was to
explore the genetic structure of the four Sicilian autochthonous sheep
breeds, through the analysis of the genetic diversity within and among
breeds, and to determine their genetic relationship, using microsatellite
markers. Moreover, microsatellite markers were used for the proper
assignment of an individual to a specific breed (Chapter 3).
In Chapter 4, were reported for the first time the estimates of population
structure, levels of inbreeding and coancestry, and linkage disequilibrium
(LD) from a genome wide perspective in Cinisara and Modicana cattle
breeds, using the Illumina Bovine SNP50K v2 BeadChip.
Finally, in Chapter 5, the genome wide levels of LD, the number of
haplotype blocks for each chromosome in each breed, and the genetic
diversity was assessed in the Sicilian dairy sheep breeds, using high
density genotyping arrays.

22
References
1. Maudet C, Luikart G, Taberlet P: Genetic diversity and assignment
among seven French cattle breeds based on microsatellite DNA
analysis. J Anim Sci 2002, 80:942-950.
2. FAO: The state of the world’s animal genetic resources for food and
agriculture, (2007). Edited by B. Rischkowsky & D. Pilling. Rome
(http://www.fao.org/docrep/010/a1250e/a1250e00.htm).
3. Tapio I, Tapio M, Grislis Z, Holm LE, Jeppsson S, Kantanen J,
Miceikiene I, Olsaker I, Viinalass H, Eythorsdottir E: Unfolding of
population structure in Baltic sheep breeds using microsatellite
analysis. Heredity 2005, 94:448-458.
4. Hall SJG: Livestock Biodiversity. Genetic Resources for the Farming
of the Future. Blackwell Science 2004, Oxford, UK.
5. Meuwissen TH: Reduction of selection differentials in finite
populations with a nested full-half sib family structure. Biometrics
1991, 47: 195-203.
6. Boettcher PJ, Tixier-Boichard M, Toro MA, Simianer H, Eding H,
Gandini G, Joost S, Garcia D, Colli L, Ajmone-Marsan P, GLOBALDIV
Consortium: Objectives, criteria and methods for using molecular
genetic data in priority setting for conservation of animal genetic
resources. Anim Genet 2010, 41:64-77.
7. Meuwissen THE: Towards consensus on how to measure neutral
genetic diversity? J Anim Breed Genet 2009, 126:333-334.
8. Woolliams JA, Toro M: What is genetic diversity? In: J.K.
Oldenbroek (ed.). Utilisation and conservation of farm animal genetic
resources. Wageningen Academic Publishers, Wageningen, The
Netherlands, 55-74.

23
9. Bömcke E: New method to combine molecular and pedigree
relationships. J Anim Sci 2011, 89:972-978.
10. Engelsma KA: Use of SNP markers to conserve genome-wide genetic
diversity in livestock. PhD thesis, Wageningen University 2012, The
Netherlands.
11. Mucha S, Winding JJ: Effects of incomplete pedigree on genetic
management of the Dutch Landrace goat. J Anim Breed Genet,
126:250-256.
12. Vignal A, Milan D, San Cristobal M, Eggen A: A review on SNP
and other types of molecular markers and their use in animal
genetics. Genet Sel Evol. 2002, 34:275-305.
13. Toro MA, Fernández J, Caballero A: Molecular characterization of
breeds and its use in conservation. Livest Sci 2009, 120:174–195.
14. Weber JL, Wong C: Mutation of human short tandem repeats. Hum
mol gen 1993, 2:1123-8.
15. Buchanan FC, Adams LJ, Littlejohn RP, Maddox JF, Crawford A M:
Determination of evolutionary relationships among sheep breeds
using microsatellites. Genomics 1994, 22:397–403.
16. Schmid M, Satbekova N, Gaillard C, Dolf G: Genetic diversity in
Swiss cattle breeds. J Anim Breed Genet 1999, 116:1–8.
17. Estoup A, Jarne P, Cornuet JM: Homoplasy and mutation model at
microsatellite loci and their consequences for population genetics
analysis. Mol Ecol 2002, 11:1591-1604.
18. Ramos AM, Megens HJ, Crooijmans RPMA, Schook LB, Groenen
MAM: Identification of high utility SNPs for population assignment
and traceability purposes in the pig using high-throughput
sequencing. Anim. Genet. 2011, 42:613-620.
24
19. Oldenbroek JK: Genebanks and the conservation of farm animal
genetic resources. Lelystad: DLO Institute for Animal Science and Health
Press; 1999.
20. Kijas JW, Townley D, Dalrymple BP, Heaton MP, Maddox JF, et al.:
A Genome Wide Survey of SNP Variation Reveals the Genetic
Structure of Sheep Breeds. PLoS ONE 2009, 4(3): e4668.
21. Flury C, Tapio M, Sonstegard C, Drogemuller C, Leeb T, Simianer H,
Hanotte O, Rieder S: Effective population size of an indigenous Swiss
cattle breed estimated from linkage disequilibrium. J Anim Breed
Genet 2010, 127:339-347.
22. Decker JE, Pires JC, Conant GC, McKay SD, Heaton et al.:
Resolving the evolution of extant and extinct ruminants with high-
throughput phylogenomics. Proc Natl Acad Sci USA 2009, 106:18644-
18649.
23. Liu J, Zhang L, Xu L, Ren H, Lu R, Zhang X, Zhang S, Zhou X, Wei
C, Zhao F, Du L: Analysis of copy number variations in the sheep
genome using 50K SNP BeadChip array. BMC Genomics 2013,
14:229.
24. Weller JI, Glick G, Zeron Y, Seroussi E, Ron M: Paternity
validation and estimation of genotyping error rate for the
BovineSNP50 BeadChip. Anim Genet 2010, 41:551-553.
25. Kijas JW, Townley D, Dalrymple BP, Heaton MP, Maddox JF, et al.:
A Genome Wide Survey of SNP Variation Reveals the Genetic
Structure of Sheep Breeds. PLoS ONE 2009, 4(3): e4668.
2
Study of polymorphisms in the promoter region of
ovine β-lactoglobulin gene and phylogenetic analysis
among the Valle del Belice breed and other sheep
breeds considered as ancestors
S. Mastrangelo, M.T. Sardina, V. Riggio, B. Portolano
Dipartimento di Scienze Agrarie e Forestali, Università degli Studi di
Palermo, Viale delle Scienze, 90128 Palermo, Italy
Molecular Biology Reports (2012) 39, 745-751
26
Abstract
The aim of this work was to sequence the promoter region of -
lactoglobulin (BLG) gene in four sheep breeds, in order to identify
polymorphisms, infer and analyze haplotypes, and phylogenetic
relationship among the Valle del Belice breed and the other three breeds
considered as ancestors. Sequencing analysis and alignment of the
obtained sequences showed the presence of 36 single nucleotide
polymorphisms (SNPs) and one deletion. A total of 22 haplotypes found
in “best” reconstruction were inferred considering the 37 polymorphic
sites identified. Haplotypes were used for the reconstruction of a
phylogenetic tree using the Neighbor-Joining algorithm. The number of
polymorphisms identified showed high variability within breeds. Analysis
of genetic diversity indexes showed that the Sarda breed presented the
lowest nucleotide diversity, whereas the Comisana breed presented the
highest one. Comparing the nucleotide diversity among breeds, the
highest value was obtained between Valle del Belice and Pinzirita breeds,
whereas the lowest one was between Valle del Belice and Sarda breeds.
Considering that polymorphisms in the promoter region of BLG gene
could have a functional role associated with milk composition, the lowest
value of nucleotide diversity between Valle del Belice and Sarda breeds
may be related to a higher similarity of milk composition of these two
breeds compared to the others. Further analyses will be conducted in
order to evaluate the possible correlation between the genetic diversity
indexes and the BLG content in milk of our breeds.
Keywords: β-lactoglobulin, polymorphisms, sheep breeds, phylogenetic
analysis

27
2.1 Introduction
β-lactoglobulin (BLG) is synthesized by secreting cells of mammary
gland and it is the major whey protein in the milk of ruminants. It is also
found in the milk of different mammalian species including cats [1], dogs
and dolphins [2] but it is lacking in humans [3, 4], rodents, and
lagomorphs [5]. It is a globular protein, belonging to the family of
lipocalins, small proteins with some peculiarities, such as the ability to
bind hydrophobic molecules [6]. Although no clear physiological
functions have been defined for BLG, a role in the transport of retinol and
fatty acids has been suggested [6, 7]. However, the general affinity of
BLG with these hydrophobic molecules did not allow ascribing a specific
role [7, 8].
The BLG encoding gene has been sequenced in sheep [9], cattle [10], and
goats [11], and mapped on chromosome 3 in sheep and chromosome 11 in
goats and cattle [12].
A large number of variants have been reported for bovine and ovine BLG
protein. Three co-dominant alleles (A, B, and C) have been reported in
sheep that differ by one or more amino acid changes. BLG variant A
differs from BLG variant B in the amino acid sequence at position 20
(TyrA→HisB) [13, 14], whereas it differs from BLG variant C at position
148 (ArgA → GlnC) [15]. Variants A and B are the most common and
have been reported in several breeds [13, 14], whereas variant C has been
reported only in milk from Merinoland, Hungarian Merino, Pleven [16],
and Carranzana and Lacha [17] breeds. Many studies on the effect of
ovine BLG polymorphisms on milk production traits have been carried
out, but results are still conflicting. Some authors reported the positive
effect of variant B on milk production and quality and whey protein

28
content [18-22], whereas others reported the positive effect of variant A
on fat and protein content and enzymatic properties [23-25]. However,
other studies reported no direct association between genotypes at this
locus and milk characteristics [26-29].
Several potential binding sites for specific mammary gland transcription
factors (TFs) were found by Watson et al. [30] within the ovine BLG
promoter region. Since they have been identified in the 5'-flanking region
of many expressed milk protein genes in different species [30-32], it has
been suggested that these factors are important regulators of milk protein
gene expression. Therefore, the presence of polymorphisms in the BLG
promoter region could influence the binding affinity of TFs and could
affect both the expression level and the content of BLG in milk [33].
In Sicily, dairy sheep production represents an important resource for the
economy of hill and mountain areas, in which other economic activities
are difficult to develop [34]. The main breeds reared are Valle del Belice,
Comisana, Pinzirita, and Sarda, which are genetically connected among
them. Based on historical, geographical, and morphological information,
it seems indeed that the Valle del Belice breed derives from the Pinzirita,
to which is similar for the horned trait in males, crossed with the
Comisana, to which is similar for the coat color (i.e. white with red head)
and for the high milk production. Subsequently, the cross between these
two breeds was likely crossed with the Sarda breed [35]. Nowadays, the
Valle del Belice breed is the most appreciated dairy sheep breed reared on
the island. The aim of this work was to sequence the full-length promoter
region of BLG gene in four sheep breeds reared in Sicily, in order to: i)
identify polymorphisms; ii) infer and analyze haplotypes; and iii) analyze

29
phylogenetic relationship among the Valle del Belice breed and the other
three breeds.
2.2 Materials and methods
Amplification of sheep BLG promoter region
A total of 50 randomly chosen unrelated (i.e. without common parents)
animals from several farms located in different areas of Sicily and
belonging to the four breeds (Valle del Belice n=20; Comisana n=10;
Pinzirita n=10; and Sarda n=10) were analyzed. Genomic DNA was
extracted from blood buffy coats of nucleated cells using a salting out
method [36]. Primers BLG-F1 and BLG-R1 (Table 2.1) were used to
amplify a fragment of 2255 bp, containing 2138 bp of the promoter region
and 117 bp of exon 1 of BLG gene, as reported by Sardina et al. [37] in
goat gene (GenBank Acc. No. Z33881). PCR reaction was performed in a
final volume of 25 μl using 2X PCR Master Mix (Fermentas), 10 μM of
each primer, and approximately 75 ng of genomic DNA. The thermal
cycling conditions were: 95°C for 5 min, 30 cycles of 95°C for 30 s, 59°C
for 1 min and 72°C for 1 min 30 s, and a final extension of 72°C for 5
min. The PCR products were checked by electrophoresis on 1% agarose
gel stained with ethidium bromide.
DNA sequencing reaction
PCR products were purified using 10 U of Exonuclease I and 1 U of
Shrimp Alkaline Phosphatase (Fermentas). The resulting PCR products
did not need additional purification before sequencing. Primers BLG-F1
and BLG-R1 and other eight internal primers (Table 2.1) were used for
30
sequencing reaction with BigDye Terminator v3.1 Cycle Sequencing Kit
in an ABI PRISM 3130 Genetic Analyzer (Applied Biosystems).
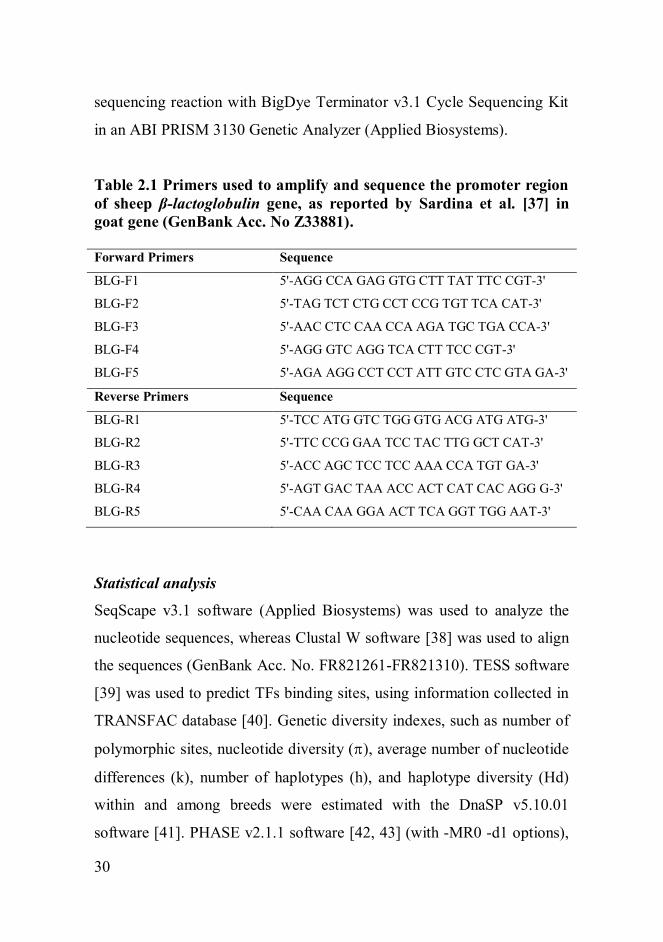
Table 2.1 Primers used to amplify and sequence the promoter region
of sheep β-lactoglobulin gene, as reported by Sardina et al. [37] in
goat gene (GenBank Acc. No Z33881).
Forward Primers Sequence
BLG-F1 5'-AGG CCA GAG GTG CTT TAT TTC CGT-3'
BLG-F2 5'-TAG TCT CTG CCT CCG TGT TCA CAT-3'
BLG-F3 5'-AAC CTC CAA CCA AGA TGC TGA CCA-3'
BLG-F4 5'-AGG GTC AGG TCA CTT TCC CGT-3'
BLG-F5 5'-AGA AGG CCT CCT ATT GTC CTC GTA GA-3'
Reverse Primers Sequence
BLG-R1 5'-TCC ATG GTC TGG GTG ACG ATG ATG-3'
BLG-R2 5'-TTC CCG GAA TCC TAC TTG GCT CAT-3'
BLG-R3 5'-ACC AGC TCC TCC AAA CCA TGT GA-3'
BLG-R4 5'-AGT GAC TAA ACC ACT CAT CAC AGG G-3'
BLG-R5 5'-CAA CAA GGA ACT TCA GGT TGG AAT-3'
Statistical analysis
SeqScape v3.1 software (Applied Biosystems) was used to analyze the
nucleotide sequences, whereas Clustal W software [38] was used to align
the sequences (GenBank Acc. No. FR821261-FR821310). TESS software
[39] was used to predict TFs binding sites, using information collected in
TRANSFAC database [40]. Genetic diversity indexes, such as number of
polymorphic sites, nucleotide diversity (), average number of nucleotide
differences (k), number of haplotypes (h), and haplotype diversity (Hd)
within and among breeds were estimated with the DnaSP v5.10.01
software [41]. PHASE v2.1.1 software [42, 43] (with -MR0 -d1 options),

31
included in DNAsp v5.10.01 software package [41], was used to infer
haplotypes within the whole sample analyzed. Finally, MEGA v4.0
software [44] was used for the reconstruction of a phylogenetic tree using
the Neighbor-Joining (NJ) algorithm with nucleotide substitution model
and 1,000 bootstrap replications.
2.3 Results and discussion
Identification of polymorphisms and genetic diversity indexes
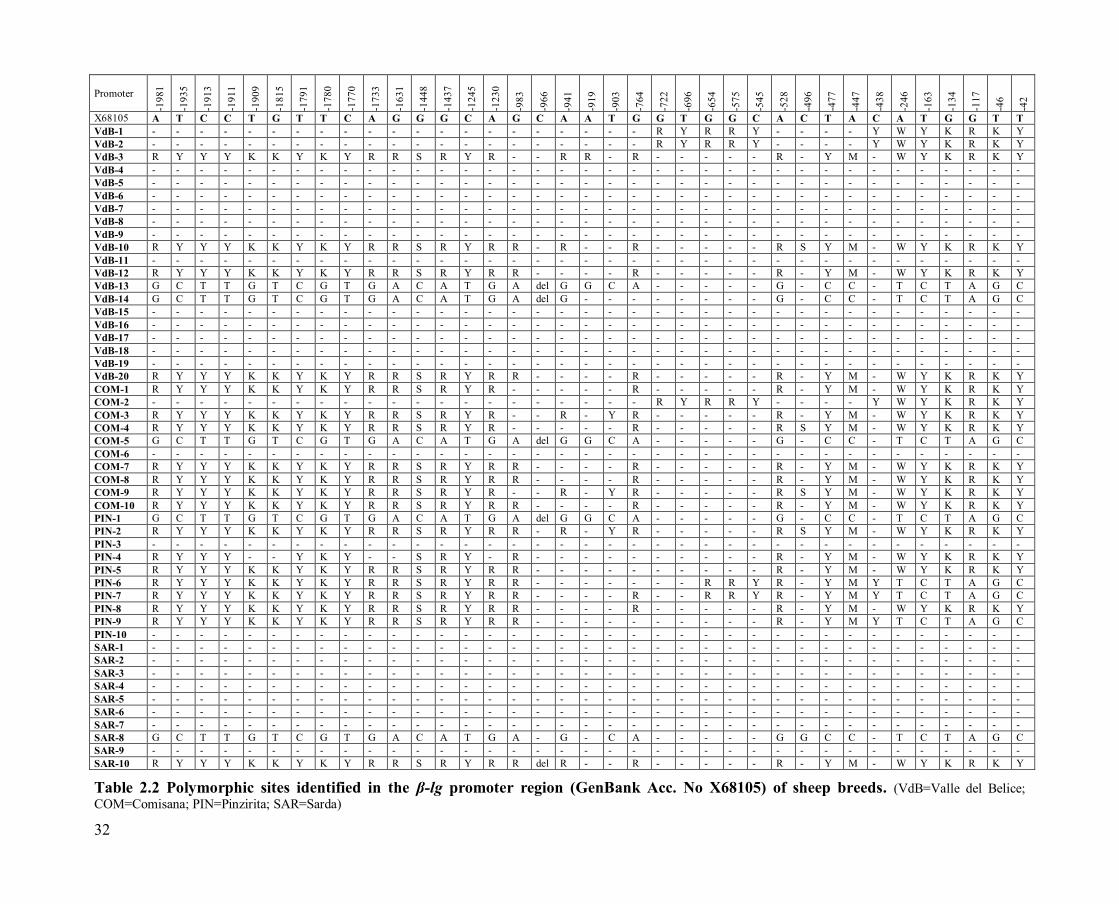
Sequencing analysis and alignment of the obtained sequences showed the
presence of 37 polymorphic sites in the BLG promoter region: 36 single
nucleotide polymorphisms (SNPs) and one deletion (Table 2.2), which
equates to about one polymorphism per approximately 60 bp. The number
of polymorphisms identified in our breeds showed high variability of the
BLG promoter region as reported by Sardina et al. [37] in goat and by
Ganai et al. [45] in cattle. Valle del Belice and Comisana breeds have all
point mutations (36 SNPs and the deletion) in common, whereas the
Pinzirita breed presented 34 SNPs and the deletion, and the Sarda breed
29 SNPs and the deletion. Using the TRANSFAC database [40], we
found four binding sites for milk protein binding factor (MPBF) and five
binding sites for nuclear factor-I (NF-I) within the promoter region of
sheep BLG gene, as reported by Watson et al. [30]. Since at least five NF-
I have been identified, these authors suggested that these factors could
play a regulatory role in BLG transcription. The polymorphic site -246
A/T, we found in our breeds, lies within a region of sheep BLG promoter,
in which a NF-I binding site is involved (-253/-240) (TESS -
TRANSFAC Site Record R03872), causing the loss of the latter.
32
Promoter
-19
81
-19
35
-19
13
-19
11
-19
09
-18
15
-17
91
-17
80
-17
70
-17
33
-16
31
-14
48
-14
37
-12
45
-12
30
-98
3
-96
6
-94
1
-91
9
-90
3
-76
4
-72
2
-69
6
-65
4
-57
5
-54
5
-52
8
-49
6
-47
7
-44
7
-43
8
-24
6
-16
3
-13
4
-11
7
-46
-42
X68105 A T C C T G T T C A G G G C A G C A A T G G T G G C A C T A C A T G G T T
VdB-1 - - - - - - - - - - - - - - - - - - - - - R Y R R Y - - - - Y W Y K R K Y
VdB-2 - - - - - - - - - - - - - - - - - - - - - R Y R R Y - - - - Y W Y K R K Y
VdB-3 R Y Y Y K K Y K Y R R S R Y R - - R R - R - - - - - R - Y M - W Y K R K Y
VdB-4 - - - - - - - - - - - - - - - - - - - - - - - - - - - - - - - - - - - - -
VdB-5 - - - - - - - - - - - - - - - - - - - - - - - - - - - - - - - - - - - - -
VdB-6 - - - - - - - - - - - - - - - - - - - - - - - - - - - - - - - - - - - - -
VdB-7 - - - - - - - - - - - - - - - - - - - - - - - - - - - - - - - - - - - - -
VdB-8 - - - - - - - - - - - - - - - - - - - - - - - - - - - - - - - - - - - - -
VdB-9 - - - - - - - - - - - - - - - - - - - - - - - - - - - - - - - - - - - - -
VdB-10 R Y Y Y K K Y K Y R R S R Y R R - R - - R - - - - - R S Y M - W Y K R K Y
VdB-11 - - - - - - - - - - - - - - - - - - - - - - - - - - - - - - - - - - - - -
VdB-12 R Y Y Y K K Y K Y R R S R Y R R - - - - R - - - - - R - Y M - W Y K R K Y
VdB-13 G C T T G T C G T G A C A T G A del G G C A - - - - - G - C C - T C T A G C
VdB-14 G C T T G T C G T G A C A T G A del G - - - - - - - - G - C C - T C T A G C
VdB-15 - - - - - - - - - - - - - - - - - - - - - - - - - - - - - - - - - - - - -
VdB-16 - - - - - - - - - - - - - - - - - - - - - - - - - - - - - - - - - - - - -
VdB-17 - - - - - - - - - - - - - - - - - - - - - - - - - - - - - - - - - - - - -
VdB-18 - - - - - - - - - - - - - - - - - - - - - - - - - - - - - - - - - - - - -
VdB-19 - - - - - - - - - - - - - - - - - - - - - - - - - - - - - - - - - - - - -
VdB-20 R Y Y Y K K Y K Y R R S R Y R R - - - - R - - - - - R - Y M - W Y K R K Y
COM-1 R Y Y Y K K Y K Y R R S R Y R - - - - - R - - - - - R - Y M - W Y K R K Y
COM-2 - - - - - - - - - - - - - - - - - - - - - R Y R R Y - - - - Y W Y K R K Y
COM-3 R Y Y Y K K Y K Y R R S R Y R - - R - Y R - - - - - R - Y M - W Y K R K Y
COM-4 R Y Y Y K K Y K Y R R S R Y R - - - - - R - - - - - R S Y M - W Y K R K Y
COM-5 G C T T G T C G T G A C A T G A del G G C A - - - - - G - C C - T C T A G C
COM-6 - - - - - - - - - - - - - - - - - - - - - - - - - - - - - - - - - - - - -
COM-7 R Y Y Y K K Y K Y R R S R Y R R - - - - R - - - - - R - Y M - W Y K R K Y
COM-8 R Y Y Y K K Y K Y R R S R Y R R - - - - R - - - - - R - Y M - W Y K R K Y
COM-9 R Y Y Y K K Y K Y R R S R Y R - - R - Y R - - - - - R S Y M - W Y K R K Y
COM-10 R Y Y Y K K Y K Y R R S R Y R R - - - - R - - - - - R - Y M - W Y K R K Y
PIN-1 G C T T G T C G T G A C A T G A del G G C A - - - - - G - C C - T C T A G C
PIN-2 R Y Y Y K K Y K Y R R S R Y R R - R - Y R - - - - - R S Y M - W Y K R K Y
PIN-3 - - - - - - - - - - - - - - - - - - - - - - - - - - - - - - - - - - - - -
PIN-4 R Y Y Y - - Y K Y - - S R Y - R - - - - - - - - - - R - Y M - W Y K R K Y
PIN-5 R Y Y Y K K Y K Y R R S R Y R R - - - - - - - - - - R - Y M - W Y K R K Y
PIN-6 R Y Y Y K K Y K Y R R S R Y R R - - - - - - - R R Y R - Y M Y T C T A G C
PIN-7 R Y Y Y K K Y K Y R R S R Y R R - - - - R - - R R Y R - Y M Y T C T A G C
PIN-8 R Y Y Y K K Y K Y R R S R Y R R - - - - R - - - - - R - Y M - W Y K R K Y
PIN-9 R Y Y Y K K Y K Y R R S R Y R R - - - - - - - - - - R - Y M Y T C T A G C
PIN-10 - - - - - - - - - - - - - - - - - - - - - - - - - - - - - - - - - - - - -
SAR-1 - - - - - - - - - - - - - - - - - - - - - - - - - - - - - - - - - - - - -
SAR-2 - - - - - - - - - - - - - - - - - - - - - - - - - - - - - - - - - - - - -
SAR-3 - - - - - - - - - - - - - - - - - - - - - - - - - - - - - - - - - - - - -
SAR-4 - - - - - - - - - - - - - - - - - - - - - - - - - - - - - - - - - - - - -
SAR-5 - - - - - - - - - - - - - - - - - - - - - - - - - - - - - - - - - - - - -
SAR-6 - - - - - - - - - - - - - - - - - - - - - - - - - - - - - - - - - - - - -
SAR-7 - - - - - - - - - - - - - - - - - - - - - - - - - - - - - - - - - - - - -
SAR-8 G C T T G T C G T G A C A T G A - G - C A - - - - - G G C C - T C T A G C
SAR-9 - - - - - - - - - - - - - - - - - - - - - - - - - - - - - - - - - - - - -
SAR-10 R Y Y Y K K Y K Y R R S R Y R R del R - - R - - - - - R - Y M - W Y K R K Y
Table 2.2 Polymorphic sites identified in the β-lg promoter region (GenBank Acc. No X68105) of sheep breeds. (VdB=Valle del Belice;
COM=Comisana; PIN=Pinzirita; SAR=Sarda)

33
Analysis of genetic diversity indexes (Table 2.3) showed that the Sarda
breed presented the lowest nucleotide diversity, which results in a reduced
number of haplotypes with a consequent low haplotype diversity. The low
nucleotide and haplotype diversity within the Sarda breed was due to the
presence of low proportion of animals showing polymorphisms (Table
2.2). Although Comisana and Valle del Belice breeds present the same
number of SNPs, the former was characterized by the highest variability,
presenting the highest nucleotide diversity, which results in the highest
number of haplotypes with a consequent high haplotype diversity (Table
2.3), whereas the Valle del Belice breed showed lower nucleotide
diversity, lower number of haplotypes, and consequently lower haplotype
diversity.
Table 2.3 Genetic diversity indexes in the four sheep breeds. Nucleotide diversity (π), number of haplotype (h), Haplotype diversity
(Hd) and standard deviation (s.d.).
Breed Polymorphic site π±s.d h Hd ±s.d
Valle del Belice 36 0.00459±0.00097 8 0.438±0.098
Comisana 36 0.00703±0.00055 10 0.837±0.076
Pinzirita 34 0.00695±0.00047 9 0.826±0.073
Sarda 29 0.00355±0.00151 3 0.279±0.123
These results may be explained considering the higher proportion of
polymorphic animals in the Comisana breed (90%) compared to the Valle
del Belice breed (40%) (Table 2.2). Moreover, the lower number of
haplotypes in the Valle del Belice breed compared to the Comisana breed
can be explained by the fact that some positions that are in homozygous

34
condition in the Valle del Belice breed are in heterozygous condition in
the Comisana breed. The Pinzirita breed, which presents a lower number
of SNPs compared to the Valle del Belice breed, presented higher
nucleotide diversity, higher number of haplotypes, and higher haplotype
diversity (Table 2.3), probably due to a higher proportion of polymorphic
individuals in the Pinzirita breed (80%) compared to the Valle del Belice
breed. Moreover, the heterozygous condition for some positions within
the Pinzirita breed, compared to the Valle del Belice breed, led to a higher
number of haplotypes.
It is interesting to highlight that among the four breeds, those
characterized by lower proportion of polymorphic individuals were Valle
del Belice and Sarda breeds. It is possible to hypothesize that this is
influenced by the selection pressure. However, in the Sicilian farming
system, natural mating is the common practice and the exchange of rams
among flocks is quite unusual. This leads to an increase of inbreeding
within the population and a consequent decrease of variability
(heterozygous condition).
Table 2.4 shows the nucleotide diversity and the average number of
nucleotide differences estimated between the Valle del Belice breed and
the other three breeds. The highest value of nucleotide diversity was
obtained between Valle del Belice and Pinzirita breeds, due to a higher
presence of mutated sites in homozygous condition in the Pinzirita breed
than in the Valle del Belice breed (Table 2.2). The lowest value of
nucleotide diversity between breeds was obtained between Valle del
Belice and Sarda breeds, due to a lower presence of mutated sites in
homozygous condition in the Sarda breed (Table 2.2). These results were
confirmed by the average number of nucleotide differences between

35
breeds (Table 2.4). Valle del Belice and Pinzirita breeds presented the
highest average number of nucleotide difference, whereas the lowest
value was found in Valle del Belice and Sarda breeds. A previous study
conducted on the genetic structure and relationship between the Valle del
Belice breed and the other sheep breeds considered as ancestors, using the
genetic polymorphisms of seven protein systems, has reported the lowest
genetic distance between Valle del Belice and Pinzirita breeds and the
highest one between Valle del Belice and Sarda breeds [46], which is not
in agreement with our results. Considering that polymorphisms in the
promoter region of BLG gene could have a functional role associated with
milk composition, the lowest value of nucleotide diversity between Valle
del Belice and Sarda breeds may be related to a higher similarity of milk
composition of these two breeds compared to the others.
Table 2.4 Nucleotide diversity (π) and average number of nucleotide
differences (k) between Valle del Belice breed and the other three
breeds.
Breed π k
Valle del Belice-Comisana 0.00564 12.104
Valle del Belice-Pinzirita 0.00566 12.138
Valle del Belice-Sarda 0.00421 9.027
Identification of haplotypes and phylogenetic analysis
On a total of 36 possible haplotypes, 22 haplotypes in “best”
reconstruction were inferred considering the 37 polymorphic sites
identified (Table 2.5). Of the 22 haplotypes, seven were specific for the
Pinzirita breed, four for the Comisana breed, three for the Sarda breed,

36
and two for the Valle del Belice breed (Table 2.5). Among the analyzed
breeds only Valle del Belice and Comisana breeds shared four haplotypes.
Haplotype H1 showed the highest frequency (0.617) and was found in all
breeds, followed by haplotype H22 with a frequency of 0.060. In
particular, haplotype H22 was the only one shared among Valle del
Belice, Pinzirita, and Comisana breeds and it was specific of animals
presenting the deletion at position -966.
Table 2.5 Haplotypes identified in the four sheep breeds, frequencies
(Freq.) and standard error (S.E.). Haplotypes Freq. S.E.
H1a,b,c,d ATCCTGTTCAGGGCAGCAATGGTGGCACTACATGGTT 0.617 0.008
H2c
ATCCTGTTCAGGGCAGCAATGGTGGCACTATTCTAGC 0.007 0.004
H3 a,b
ATCCTGTTCAGGGCAGCAATGACAATACTATTCTAGC 0.030 0.000
H4 c
ATCCTGTTCAGGGCAGCAATAGTAATACTATTCTAGC 0.020 0.000
H5 b
ATCCTGTTCAGGGCAGCGATGGTGGCACTACATGGTT 0.017 0.006
H6 d
ATCCTGTTCAGGGCAG5AATGGTGGCACTACATGGTT 0.010 0.000
H7 c
GCTTTGCGTAGCATAACAATAGTGGCGCCCCTCTAGC 0.010 0.000
H8 b
GCTTGTCGTGACATGGCAATAGTGGCGCCCCTCTAGC 0.012 0.003
H9 b GCTTGTCGTGACATGGCAATAGTGGCGGCCCTCTAGC 0.014 0.007
H10 a,b GCTTGTCGTGACATGGCAGTAGTGGCGCCCCTCTAGC 0.020 0.000
H11a
GCTTGTCGTGACATGGCGACAGTGGCGGCCCTCTAGC 0.009 0.003
H12 c
GCTTGTCGTGACATGACAATGGTGGCGCCCCTCTAGC 0.030 0.000
H13 c GCTTGTCGTGACATGACAATAGTGGCACTCCTTTAGC 0.007 0.004
H14 c GCTTGTCGTGACATGACAATAGTGGCGCTCCTCTAGC 0.009 0.002
H15 b
GCTTGTCGTGACATGACAATAGTGGCGCCACTCTAGC 0.010 0.000
H16 a,b
GCTTGTCGTGACATGACAATAGTGGCGCCCCTCTAGC 0.020 0.002
H17 a,b
GCTTGTCGTGACATGACGATAGTGGCGCCCCTCTAGC 0.019 0.002
H18 c
GCTTGTCGTGACATGACGATAGTGGCGGCCCTCTGGC 0.007 0.004
H19 d
GCTTGTCGTGACATGACGACAGTGGCGGCCCTCTAGC 0.020 0.000
H20 a
GCTTGTCGTGACATGA5GATGGTGGCACCCCTCTAGC 0.020 0.000
H21 d
GCTTGTCGTGACATGA5GATAGTGGCGCCCCTCTAGC 0.010 0.000
H22a,b,c GCTTGTCGTGACATGA5GGCAGTGGCGCCCCTCTAGC 0.060 0.000
Haplotypes identified in Valle del Belice (a), Comisana (b), Pinzirita (c) and Sarda (d)
sheep breeds
37
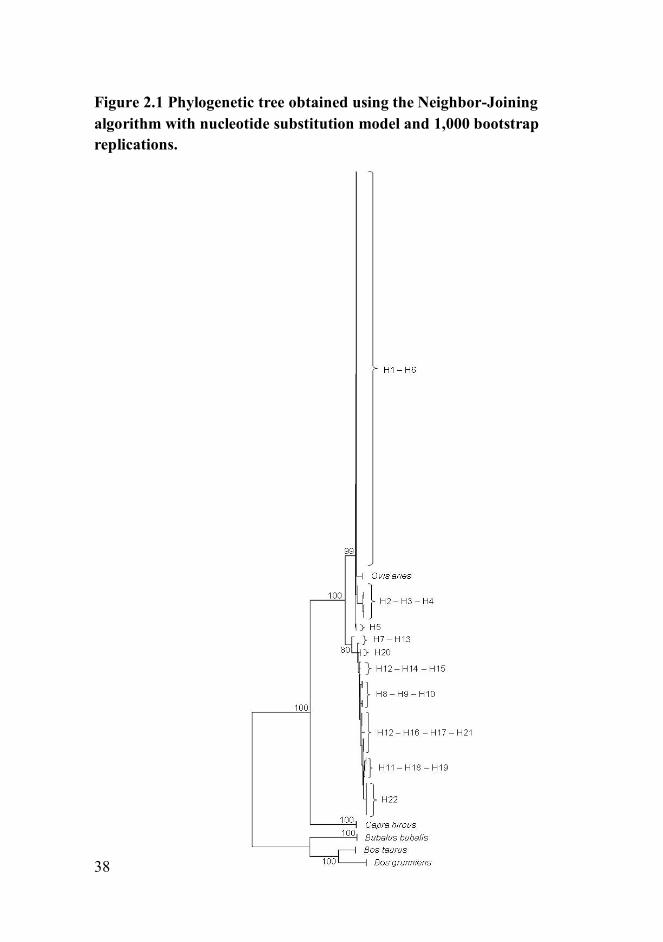
Haplotypes were used for the reconstruction of a phylogenetic tree, using
BLG promoter region of Capra hircus (GenBank Acc. No Z33881), Bos
taurus (GenBank Acc. No. Z48305), Bos grunniens (GenBank Acc. No.
AF194981), and Bubalus bubalis (GenBank Acc. No. AM238696) as
outliers. The NJ tree (Figure 2.1) showed the presence of some haplotypes
closely related to the consensus BLG promoter region of Ovis aries and in
particular haplotypes H1 and H6, identical to the former except for the
deletion at position -966. On the same branch are haplotypes H2, H3, H4,
and H5 that showed polymorphisms in the proximal promoter region and
in particular in the region between position -764 and position -42. The
other haplotypes (H7-H22) were placed in a different branch and among
them, haplotype H22 was the closest to the outlier sequences branch due
to presence of all polymorphic sites in mutated homozygous condition
compared to Ovis aries consensus.
38
Figure 2.1 Phylogenetic tree obtained using the Neighbor-Joining
algorithm with nucleotide substitution model and 1,000 bootstrap
replications.

39
2.4 Conclusion
Results showed high genetic variability in the BLG promoter region
within our breeds. The presence of the polymorphic site -246 A/T could
influence the binding affinity of NF-I in the region -253/-240 of the BLG
promoter. Analysis of genetic diversity of the promoter region of BLG
gene revealed the highest value of genetic diversity between Valle del
Belice and Pinzirita breeds and the lowest one between Valle del Belice
and Sarda breeds. The lowest value of genetic diversity between Valle del
Belice and Sarda breeds may be related to a higher similarity of milk
composition of these two breeds compared to the others. However, at
present literature does not present any evidence about that. Further
analyses will be conducted on a wider sample in order to estimate the
possible effect that the loss of TF could have on BLG gene expression
level and to evaluate the possible correlation between the genetic
diversity indexes and the BLG content in milk of our breeds.
40
References
1. Halliday JA, Bell K, Shaw DC: The complete amino acid sequence of
feline -lactoglobulin II and partial revision of the equine -
lactoglobulin II sequence. Biochim Biophys Acta Protein Struct Mol
Enzymol 1991, 1077:25-30.
2. Pervaiz S, Brew K: Purification and characterization of the major
whey proteins from the milks of the bottlenose dolphin (Tursiops
truncatus), the Florida manatee (Trichechus manatus latirostris), and
the beagle (Canis familiaris). Arch Biochem Biophys 1986, 246:846-854.
3. Brignon G, Chtourou A, Ribadeau-Dumas S: Does beta-lactoglobulin
occur in human milk? J Dairy Res 1985, 52:249-254.
4. Monti JC, Mermoud AF, Jollès P: Anti-bovine beta-lactoglobulin
antibodies react with a human lactoferrin fragment and bovine beta-
lactoglobulin present in human milk. Experientia 1989, 45:178-180.
5. Hambling SG, McAlpine A, Sawyer L: β-lactoglobulin. In: Fox PF
(ed) Advanced Dairy Chemistry -1. Proteins. Elsevier Applied Science.
1992, London, pp 141-190.
6. Flower DR: The lipocalin protein family: structure and function.
Biochem J 1996, 318:1-14.
7. Pérez MD, Calvo M: Interaction of β-lactoglobulin with retinol and
fatty acids and its role as a possible biological function for this
protein: a review. J Dairy Sci 1995, 78:978-988.
8. Puyol P, Pérez MD, Ena JM, Calvo M: Interaction of bovine β-
lactoglobulin and other bovine and human whey protein with retinol
and fatty acids. Agr Biol Chem 1991, 55:2515-2520.

41
9. Harris S, Ali S, Anderson S, Archibald AL, Clark AJ: Complete
nucleotide sequence of the genomic ovine beta-lactoglobulin gene.
Nucleic Acids Res 1988, 16:10379–10380.
10. Alexander LJ, Hayes G, Bawden W, Stewart AF, MacKinlay AG:
Complete nucleotide sequence of the bovine beta-lactoglobulin gene.
Anim Biotechnol 1993, 4:1–10.
11. Folch JM, Coll A, Sánchez A: Complete sequence of the caprine β-
lactoglobulin gene. J Dairy Sci 1994, 77:3493-3497.
12. Hayes HC, Petit EJ: Mapping of the β-lactoglobulin gene and of
immunoglobulin M heavy chain-like sequence to homologous cattle,
sheep and goat chromosomes. Mamm Genome 1993, 4:207–210.
13. Bell K, McKenzie HA: The whey proteins of ovine milk β-
lactoglobulin A and B. Biochim Biophys Acta 1967, 147:123–134.
14. King JWB: The distribution of sheep β-lactoglobulins. Anim Prod
1969, 11:53–57.
15. Erhard G, Godovac-Zimmermann J, Conti A: Isolation and complete
primary sequence of a new ovine wild-type beta-lactoglobulin C. Biol
Chem Hoppe-Seyler 1989, 370:757-762.
16. Erhardt G: Evidence of a third allele at the beta-lactoglobulin
(beta-Lg) locus of sheep milk and its occurrence in different breeds.
Anim Genet 1989, 20:197-204.
17. Calavia MC: Componentes y fenotipos de las caseınas y proteınas
del lactosuero de leche de oveja (razas Lacha y Carranzana)
comportamiento de las mismas durante la coagulation por quimosina
y estabilidad termica de la β-lactoglobulina. PhD Thesis 1997,
Universidad de Zaragoza, Spain.

42
18. Caroli A, Bolla P, Spanu A, Piredda G, Fraghì A: Effect of -
lactoglobulin genotype on milk yield in Sardinian sheep. In:
Proceedings 11th Congress ASPA 1995, Udine, Italia, pp 181-182.
19. Fraghì A, Carta A, Pilla F, Sanna SR, Piredda G: -lactoglobulin
polymorphism in Sarda dairy sheep. In: 47th
Annual Meeting of the
EAAP 1996, 42. Den Haag, The Netherlands.
20. Giaccone P, Di Stasio L, Macciotta NPP, Portolano B, Todaro M,
Cappio-Borlino: A Effect of β-lactoglobulin polymorphism on milk-
related traits of dairy ewes analysed by a repeated measures design. J
Dairy Res 2000, 67:443-448.
21. Dario C, Carnicella D, Bufano G: Effect of β-lactoglobulin
genotypes on ovine milk composition in Altamurana breed. Arch
Zootec 2005, 54:105-108.
22. Dario C, Carnicella D, Dario M, Bufano G: Genetic polymorphisms
of β-lactoglobulin gene and effect on milk composition in Leccese
sheep. Small Rumin Res 2008, 74:270-273.
23. Garzon AI, Martinez J: -Lactoglobulin in Manchega sheep breed:
relationship with milk technological indexes in handcraft
manufacture of Manchego cheese. Anim Genet 1992, 23:106.
24. Lopez-Galvez, G, Ramos M., Martin-Alvarez, PJ, Juarez M:
Influence of milk protein polymorphism on cheese producing ability
in the milk of Manchega ewes breed. In: Proceedings of the
International Dairy Federation Seminar “Cheese Yield and Factors
Affecting its Control” 1993. Cork, Ireland. pp 167-173 .
25. Gutiérrez-Gil B, Arranz JJ, Othmane MH, de la Fuente LF, San
Primitivo F: Influencia del genotipo de la β-lactoglobulina ovina sobre

43
caracteres cualitativos y rendimiento quesero individual en la raza
Churra. ITEA 2001, 22:15-17.
26. Recio I, Fernandez-Fournier A, Ramos M: Genetic polymorphism of
the whey proteins for two Spanish ovine breeds. Influence of genetic
polymorphism of -lg on renneting properties. In: Proceedings of the
International Dairy Federation Seminar 1995, March 28-29th
. Zürich,
Switzerland.
27. Recio I, Fernández-Fournier A, Martín-Álvarez PJ, Ramos M: β-
lactoglobulin polymorphism in ovine breeds: influence on
cheesemaking properties and milk composition. Lait 1997, 77:259-
265.
28. Pietrolà E, Carta A, Fraghì A, Piredda G, Pilla F: Effect of β-
lactoglobulin locus on milk yield in Sarda ewes. Zoot Nutr Anim 2000,
26:131-135.
29. Staiger EA, Thonney ML, Buchanan JW, Rogers ER, Oltenacu PA,
Mateescu RG: Effect of prolactin, β-lactoglobulin, and -casein
genotype on milk yield in East Friesian sheep. J Dairy Sci 2010,
93:1736-1742.
30. Watson CJ, Gordon KE, Robertson M, Clark AJ: Interaction of
DNA-binding proteins with a milk protein gene promoter in vitro:
identification of a mammary gland- gland-specific factor. Nucleic
Acids Res 1991, 19: 6603-6610.
31. Mink S, Härtig E, Jennewein P, Doppler W, Cato ACB: A mammary
cell-specific enhancer in mouse mammary tumour virus DNA is
composed of multiple regulatory elements including binding sites for
CTF/NFI and a novel transcription factor, mammary cell-activating
factor. Mol Cell Biol 1992, 12:4906-4918.

44
32. Burdon TG, Demmer J, Clark AJ, Watson CJ: The mammary factor
MPBF is a prolactin-induced transcriptional regulator which binds to
STAT factor recognition sites. FEBS Lett 1994, 350:177-182.
33. Braunschweig MH, Leeb T: Aberrant low expression level of
bovine -lactoglobulin is associated with a C to A transversion in the
BLG promoter region. J Dairy Sci 2006, 89:4414-4419.
34. Scintu M F, Piredda G: Typicity and biodiversity of goat and sheep
milk products. Small Rumin Res 2007, 68:221-231.
35. Portolano N: La pecora della Valle del Belice. In: Edagricole (ed)
Pecore e capre italiane 1987. Bologna, Italia, pp 117-124.
36. Miller SA, Dykes DD, Polesky HF: A simple salting out procedure
for extracting DNA from human nucleated cells. Nucleic Acids Res
1988, 16:1215.
37. Sardina MT, Rosa AJM, Braglia S, Scotti E, Portolano B:
Identification of SNPs in the promoter of -lactoglobulin gene in
three Sicilian goat breeds. In: Proceedings 18th Congress ASPA 2009,
Palermo, Italia. pp 147-149.
38. Thompson JD, Higgins DG, Gibson TJ: CLUSTAL W: improving
the sensitivity of progressive multiple sequence alignment through
sequence weighting, position-specific gap penalties and weight matrix
choice. Nucleic Acids Res 1994, 22:4673-4680.
39. Schug J, Overton GC (1997) TESS: Transcription Element Search
Software on the WWW. Technical Report CBIL-TR-1997-1001-v0.0.
In: Computational Biology and Informatics Laboratory, School of
Medicine, University of Pennsylvania, Philadelphia, PA.

45
40. Wingender E, Dietze P, Karas H, Knuppel R: TRANSFAC: a
database on transcription factors and their DNA binding sites.
Nucleic Acids Res 1996, 24:238-241.
41. Librado P, Rozas J: DnaSP v5: A software for comprehensive
analysis of DNA polymorphism data. Bioinformatics 2009, 25:1451-
1452.
42. Stephens M, Smith NJ, Donnely P: A new statistical method for
haplotype reconstruction from population data. Am J Hum Genet
2001, 68:978-989.
43. Stephens M, Scheet P: Accounting for decay of linkage
disequilibrium in haplotype inference and missing-data imputation.
Am J Hum Genet 2005, 76:449-462.
44. Tamura K, Dudley J, Nei M, Kumar S: MEGA4: Molecular
Evolutionary Genetics Analysis (MEGA) software version 4.0. Mol
Biol Evol 2007, 24:1596-1599.
45. Ganai NA, Bovenhuis H, van Arendonk JAM, Visker MHPW: Novel
polymorphisms in the bovine β-lactoglobulin gene and their effects on
β-lactoglobulin protein concentration in milk. Anim Genet 2008,
40:127-133.
46. Di Stasio L, Rasero R, Giaccone P, Fiandra P: Valle del Belice sheep:
genetic structure and relationship with other sheep populations
reared in Sicily. Agri Medit 1992, 122:66-69.


3
Genetic diversity and population structure of
Sicilian sheep breeds using microsatellite markers
M.Tolone*†
, S. Mastrangelo*†
, A.J.M. Rosa#, B. Portolano
*
*Dipartimento di Scienze Agrarie e Forestali, Università degli Studi di
Palermo, Viale delle Scienze, 90128 Palermo, Italy
#Brazilian Agricultural Research Corporation, Ministry of Agriculture,
Livestock and Food Supply, Planaltina- DF, Brazil, 73310-970.
Small Ruminant Research (2012) 102, 18-25
† Equal contributors
48
Abstract
Genetic diversity studies in domestic animals aim at evaluating genetic
variation within and across breeds mainly for conservation purposes. In
Sicily, dairy sheep production represents an important resource for hilly
and mountain areas economy. Their milk is used for the production of
traditional raw milk cheeses, sometimes Protected Designation of Origin
(PDO) cheeses. In some cases, the quality of these products is linked to a
specific breed, i.e. mono-breed labelled cheeses and it is therefore
important to be able to distinguish the milk of a breed from that of others,
in order to guarantee both the consumer and the breed itself. In order to
investigate the genetic structure and to perform an assignment test, a total
of 331 individuals (Barbaresca, BAR n=57, Comisana, COM n=65,
Pinzirita, PIN n=75, Sarda, SAR n=64, and Valle del Belice, VDB n=70)
were analysed using a panel of 20 microsatellite markers. A total of 259
alleles were observed with average polymorphic information content
equal to 0.76, showing that the microsatellites panel used was highly
informative. Estimates of observed heterozygosity ranged from 0.65 in
the BAR breed to 0.75 in the COM breed. The low value of genetic
differentiation among breeds (Fst = 0.049) may indicate that these breeds
are little differentiated probably due to common history and breeding
practices. The low Fis and Fit values indicated low level of inbreeding
within and among breeds. The Unrooted Neighbor-Joining dendrogram
obtained from the Reynold’s genetic distances, and factorial
correspondence analysis revealed a separation between BAR and the
other sheep breeds. Recent migration rates were estimated, showing that
four out of the five breeds have not received a significant proportion of
migrants. Only for the PIN breed a recent introgression rate from the

49
VDB breed (7.2%) was observed. The Bayesian assignment test showed
that BAR and SAR breeds had a more definite genetic structure
(proportion of assignment of 92% and 86.6%, respectively), whereas the
lowest assignment value was found in the PIN breed (67.1%). Our results
indicated high genetic variability, low inbreeding and low genetic
differentiation, except for BAR breed, and were in accordance with
geographical location, history, and breeding practices. The low robustness
of the assignment test makes it unfeasible for traceability purposes, due to
the high level of admixture, in particular for COM, PIN and VDB.
Keywords: Sicilian sheep breed, microsatellite markers, genetic
diversity, population structure
50
3.1 Introduction
In the past years, selection programs have mainly put high emphasis on
production traits, which led to an increased specialization for traits such
as milk yield and quality, meat, wool, etc. This happened sometimes even
by crossbreeding the local breeds with exotic ones, to generate
populations with the desired phenotypes. This hybridization process,
however, has resulted in an increased reliance on a small number of
breeds to meet the local’s food requirements, which could lead to the
disappearance of local breeds. Nevertheless, this aspect has received
greater interest in the last years, based on the awareness that indigenous
and locally developed sheep breeds are an important asset, because of the
unique combinations of adaptive traits developed to respond effectively to
the pressures of the local environment [1]. From these considerations and
given the importance of the local genetic resources, it is easily
understandable the considerable interest given nowadays to genetic
diversity studies in domestic animals in general and, recently, in small
ruminants [2]. Genetic diversity studies in domestic animals aim at
evaluating genetic variation within and across breeds, since the breed is
the management unit for which factors such as inbreeding are controlled
[3]. However, the definition of a breed, as applied by FAO, frequently
does not reflect the underlying genetic population structure. Therefore, a
molecular genetics study of the population diversity and structure may
improve the understanding of the actual genetic resources.
In Sicily, dairy sheep production represents an important resource for
hilly and mountain areas economy, in which other economic activities are
limited [4]. Their milk is mainly used for the production of traditional raw
milk cheeses, sometimes Protected Designation of Origin (PDO) cheeses

51
as laid down in the European Union legislation. In some cases, the quality
of these products is linked to a specific breed, i.e. mono-breed labelled
cheeses and it is therefore important to be able to distinguish the milk of a
breed from that of others, in order to guarantee both the consumer and the
breed itself. Assignment of individuals to a specific breed, especially
when the phenotypic differentiation between breeds is difficult, is
therefore of great importance both for biodiversity purposes and dairy
products traceability.
Nowadays only four native sheep breeds are reared in Sicily: Barbaresca
(BAR), Comisana (COM), Pinzirita (PIN), and Valle del Belice (VDB).
These breeds present differences in both morphology and production
traits and show excellent adaptability to the local environments. In
particular, BAR and PIN breeds, due to their good adaptive traits and
hardiness are raised on farms located in marginal areas, representing
therefore an important genetic resource for present and future needs. In
addition to these autochthonous breeds, the Sarda (SAR) breed, reared
mainly in Sardinia, was considered due to its likely contribution to the
origin of the VDB breed. Based on historical, geographical, and
morphological information, it is likely that the VDB breed derives from
the PIN breed, to which is similar for the horned trait in the males,
crossed with the COM breed, to which is similar for coat colour (i.e.
white with red head) and milk production. Subsequently, the cross
between these two breeds was likely crossed with the SAR breed [5]. In
addition, the BAR breed derives from crosses between Tunisian Barbary
breed from North Africa and the PIN breed, and posterior selection for
growth performance [6]. In recent years, several microsatellite studies on
sheep genetic diversity, population structure, genetic differentiation, and
52
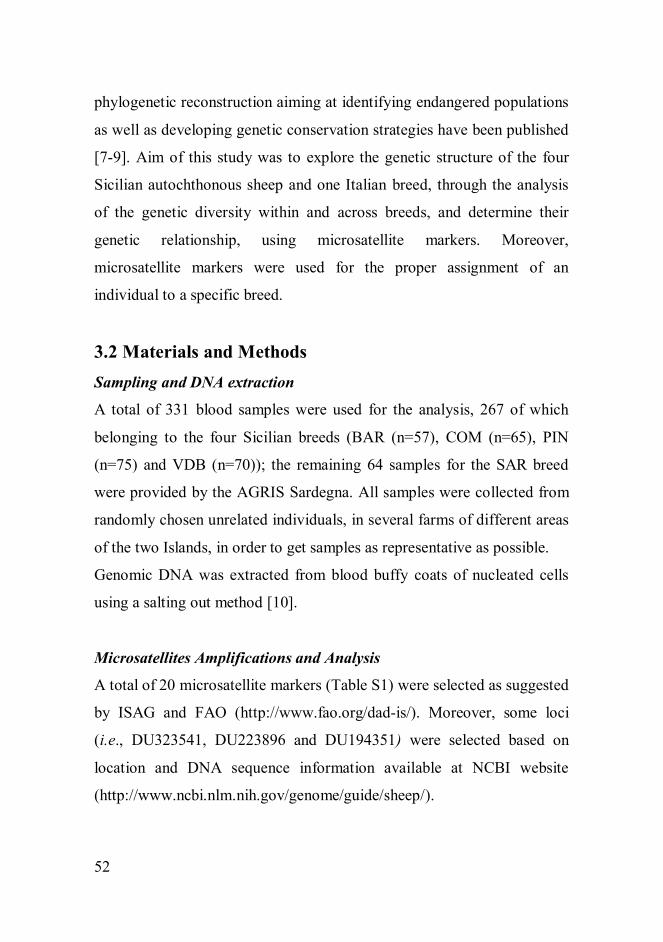
phylogenetic reconstruction aiming at identifying endangered populations
as well as developing genetic conservation strategies have been published
[7-9]. Aim of this study was to explore the genetic structure of the four
Sicilian autochthonous sheep and one Italian breed, through the analysis
of the genetic diversity within and across breeds, and determine their
genetic relationship, using microsatellite markers. Moreover,
microsatellite markers were used for the proper assignment of an
individual to a specific breed.
3.2 Materials and Methods
Sampling and DNA extraction
A total of 331 blood samples were used for the analysis, 267 of which
belonging to the four Sicilian breeds (BAR (n=57), COM (n=65), PIN
(n=75) and VDB (n=70)); the remaining 64 samples for the SAR breed
were provided by the AGRIS Sardegna. All samples were collected from
randomly chosen unrelated individuals, in several farms of different areas
of the two Islands, in order to get samples as representative as possible.
Genomic DNA was extracted from blood buffy coats of nucleated cells
using a salting out method [10].
Microsatellites Amplifications and Analysis
A total of 20 microsatellite markers (Table S1) were selected as suggested
by ISAG and FAO (http://www.fao.org/dad-is/). Moreover, some loci
(i.e., DU323541, DU223896 and DU194351) were selected based on
location and DNA sequence information available at NCBI website
(http://www.ncbi.nlm.nih.gov/genome/guide/sheep/).
53
Genotypes for all 20 microsatellite markers were determined by means of
four multiplex fluorescent PCR reactions and fragment lengths
determined in a single semi-automated multiplex electrophoresis run by
using an AB3130 Genetic Analyzer and GeneMapper version 4.0 with
recommended protocols (Applied Biosystems). Each reaction was
performed in a total volume of 20 μl containing 50 ng template DNA, 1X
Qiagen Multiplex PCR Master Mix, 1X PCR Master Mix, primer mix,
and nuclease-free water. For the four multiplex reactions, the PCR
program was: initial denaturation at 95°C for 15 min; 32 cycles of 95°C
for 45 s, 58°C for 1 min 50 s, and 72°C for 1 min 20 s; and final extension
at 60°C for 30 min. Amplification was carried out using the GeneAmp
PCR system 9700. A total of 3.7 μl of Multiplex PCR was mixed with 0.3
μl of LIZ 500 Size Standard and 6.0 μl of Hi-Di Formamide. The
multiplex PCR/LIZ/Formamide mixture was denatured for 5 min at 95°C
and then immediately snap cooled on ice for 3 min before performing a
capillary electrophoresis on an AB3130 Sequencer (Applied Biosystems).
Statistical analysis
Total number of observed alleles per locus (TNA), the mean number of
alleles observed in a population over all loci genotyped (MNA) and its
standard deviation, allelic richness, a measure of the number of alleles
independent of sample size, (AR), observed and expected heterozygosity
(Ho and Hs, respectively) per locus and overall loci in the whole sample
[11], and Wright’s fixation index (Fis, Fit and Fst) [12] were estimated
using FSTAT 2.9.3 software [13]. Moreover, FSTAT was used to
estimate observed and expected heterozygosity (Ho and He respectively)
within breed. Polymorphism information content (PIC) per locus was
54
estimated with Cervus 2.0 software [14] and the deviation from Hardy-
Weinberg equilibrium (heterozygote deficiency) with the GENEPOP
package version 4.0.11 [15] using a Markov Chain method
(dememorization 10,000, batches 100, and iterations per batch 5,000). In
addition, GENEPOP software was used to assess genotypic linkage
disequilibrium (LD) between each pair of loci in the whole sample. Nei’s
minimum distance [11] and Reynold’s distance [16], both recommended
for populations with short divergence time [17], were used to estimate
pair-wise genetic distances among breeds. The Reynold’s genetic distance
was used to reconstruct a neighbour-joining consensus tree using the
Phylip package version 3.69 [18], and the dendrogram was depicted using
the software TreeView version 1.6.6 [19]. Tree robustness was evaluated
by bootstrapping over loci (1000 replicates). Moreover, a factorial
correspondence analysis (FCA) was performed based on the individual
multilocus genotype using the GENETIX version 4.03 [20]. In order to
investigate the occurrence of recent migration among the breeds
considered, the program BayesAss+ [21] was used, with 3x10⁶ iterations,
a burn-in of 999,999, and thin 2,000. This program simultaneously
estimates the probability distribution of allelic frequencies for each locus,
migration rates among populations (m) and inbreeding coefficient for
each population (F).
STRUCTURE version 2.3.1 [22] was used to analyse the genetic structure
and identify the true number of populations (clusters) and assign the
individuals to each cluster. The program estimates the natural logarithm
of the probability that a given genotype (G) is part of a given population
(K). The model used was based on an assumption of admixture and
correlated allele frequencies as suggested by several authors [22-24]. The

55
Ln Pr(G|K) was calculated for K ranging from 1 to 9, without prior
information on the breed of origin, to estimate the most likely number of
clusters in the dataset, with 50 independent runs for each K. All runs
consisted of a burn-in period of 100,000 steps, followed by 100,000
Markov Chain Monte Carlo (MCMC) iterations.
3.3 Results
In total, 259 alleles were observed for the 20 loci surveyed. The TNA per
locus ranged from seven for OarFCB128 and APPO10 to 24 for OarCP49
with an average of 12.95±4.32 (Table 3.1). The PIC considering all loci
was equal to 0.76±0.10, showing that the microsatellites panel used was
highly informative. DU194351 was found to be the least informative
marker (0.50), whereas DU216028 the most informative one (0.89) (Table
3.1). The number of alleles per locus observed in each breed ranged from
3 to 18. The BAR breed showed the lowest number of observed alleles (3)
and the lowest overall mean number of alleles (6.15±1.74). The highest
number of observed alleles per locus was found in the PIN breed (18)
with a mean number of alleles equal to 11.05±3.43 (Table 3.1). Private
alleles, i.e. alleles unique for a single population, were evidenced in all
breeds with low frequency (<3%). However, two private alleles of the
microsatellite INRA132 (161 and 179 bp alleles) were found with higher
frequency (6.2% and 10.2%, respectively) in the SAR breed. Hardy-
Weinberg equilibrium was consistently rejected for DU223896 in all
breeds (Table S2) and this marker was not further considered. The
average observed (Ho) and expected (Hs) heterozygosities and the overall
genetic diversity (Ht) for the 19 microsatellites are given in Table S3.

56
Table 3.1 Total number of alleles per locus (TNA), number of
observed alleles per locus and per breed, and polymorphism
information content (PIC).
MARKER TNA BAR COM PIN SAR VDB PIC
OarFCB128 7 5 6 6 7 7 0.68
IDVGA45 13 3 8 11 10 12 0.79
BM827B 8 6 7 7 6 7 0.73
ILSTS011 8 5 6 7 6 8 0.72
DU323541 17 7 11 17 10 12 0.86
OarCP49 24 10 16 18 17 13 0.87
INRA063A 17 8 14 15 13 14 0.83
SPS115 8 5 6 8 7 6 0.74
LSCV36B 14 7 10 13 12 12 0.84
MAF209 12 6 10 12 8 10 0.76
BRN 10 5 7 8 7 8 0.58
McM527 10 6 8 9 6 10 0.80
ILSTS005 11 6 8 9 10 9 0.63
TCRBV6 15 5 12 11 11 11 0.75
DU223896 17 7 8 14 10 11 0.82
APPO10 7 3 6 7 7 7 0.70
INRA132 15 7 11 13 12 11 0.84
CSRD247 16 7 12 12 10 10 0.80
DU194351 17 5 10 12 9 9 0.50
DU216028 13 9 12 13 11 12 0.89
Overall mean 12.95 6.15 9.40 11.05 9.45 9.95 0.76
S.D. 4.32 1.74 2.87 3.43 2.82 2.26 0.10
BAR = Barbaresca; COM = Comisana; PIN = Pinzirita; SAR = Sarda; VDB = Valle del
Belice

57
Considering the whole sample, Ho ranged from 0.430 to 0.876, Hs from
0.504 to 0.866, and Ht from 0.517 to 0.899. DU194351 marker showed
the lowest Hs (0.504), whereas DU216028 the highest one (0.866). The Ho
was always higher than 0.50, except for the marker DU194351. However,
up to seven markers were found to be not in Hardy-Weinberg equilibrium
across breeds; in fact for these markers the observed heterozygosity was
lower than the expected one. Heterozygote deficiency (Fis) analysis
revealed that all five breeds exhibited deviations from HWE at some loci
(Table S3). Considering the whole sample, the number of markers
showing a significant deviation from Hardy-Weinberg equilibrium ranged
from 2 (BAR) to 7 (COM) (Table S2). Significant linkage disequilibrium
(P<0.001) was found between BM827B and DU323541, INRA063A and
LSCV36B, and OarFCB128 and DU216028.
The MNA and AR for each breed are showed in Table 3.2. MNA ranged
between 6.05±1.78 to 10.95±3.45 for BAR and PIN breeds, respectively,
whereas AR ranged between 5.66±1.57 to 9.44±2.84 for the same breed.
Table 3.2 Mean number of alleles (MNA), allelic richness (AR),
observed (Ho) and expected (He) heterozygosity and standard
deviation (s.d).
Breed MNA± s.d. AR± s.d. Ho ± s.d. He ± s.d.
BAR 6.05 ± 1.78 5.66 ± 1.57 0.65 ± 0.165 0.67 ± 0.094
COM 9.47 ± 2.93 8.73 ± 2.71 0.75 ± 0.131 0.77 ± 0.095
PIN 10.95 ± 3.45 9.44 ± 2.84 0.72 ± 0.141 0.78 ± 0.092
SAR 9.42 ± 2.89 8.39 ± 2.32 0.71 ± 0.108 0.75 ± 0.102
VDB 9.89 ± 2.31 8.64 ± 1.95 0.71 ± 0.123 0.77 ± 0.097
BAR = Barbaresca; COM = Comisana; PIN = Pinzirita; SAR = Sarda; VDB = Valle del
Belice

58
Table S3 also reports the population differentiation examined by fixation
indices for each locus and across all loci and the mean estimates of F-
statistic obtained were: Fit = 0.080, Fis = 0.032 and Fst = 0.049. An
overview of the genetic diversity parameters for each breed is given in
Table 3.2. Estimates of Ho ranged from 0.65 in BAR to 0.75 in COM,
whereas estimates of He from 0.67 in BAR to 0.78 in PIN. Table 3.3
shows the Nei and Reynolds genetic distance estimates. The lowest values
were observed between COM and PIN breeds for both Reynolds (0.025)
and Nei-minimum (0.020), whereas the highest ones between BAR and
SAR breeds (0.110 and 0.087 for Reynolds and Nei-minimum,
respectively). The BAR breed showed the highest genetic distance in
relation to the other four breeds.
Table 3.3 Reynolds (above the diagonal) and Nei-minimum (below
the diagonal) genetic distance per pair of breeds.
Breed BAR COM PIN SAR VDB
BAR - 0.077 0.075 0.110 0.095
COM 0.061 - 0.025 0.057 0.036
PIN 0.058 0.020 - 0.050 0.036
SAR 0.087 0.045 0.040 - 0.054
VDB 0.075 0.028 0.028 0.043 -
BAR = Barbaresca; COM = Comisana; PIN = Pinzirita; SAR = Sarda; VDB = Valle del
Belice
The Reynold’s genetic distances were also used to reconstruct the
Unrooted Neighbor-Joining dendrogram (Figure 3.1), showing two clear
clusters: VDB/SAR and PIN/COM, confirming that the BAR breed
appears again to be more distant from the other breeds.

59
Figure 3.1 Unrooted Neighbor-Joining dendrogram showing the
genetic relationships among sheep breeds using Reynolds genetic
distance. (BAR = Barbaresca; COM = Comisana; PIN = Pinzirita; SAR = Sarda; VDB
= Valle del Belice)
The factorial correspondence analysis was performed including all breeds
and loci using the corresponding allele frequencies (Figure 3.2). The first
three components explained the 86.46% of the total variation, 38.52% of
which explained by Axis 1 that clearly separates the BAR breed from the
other breeds; 28.49% explained by Axis 2 that separates the SAR breed;
and 19.45% explained by Axis 3 that separates the VDB breed.
Estimates of the recent migration rates (m) (up to the second generation of
migrants) and inbreeding coefficients per breed are presented in Table
3.4. Values on the diagonal are defined as the proportion of individuals in
each generation that are not migrants. All breeds but PIN have not
received a significant proportion of migrants. Nevertheless, recent
introgression was observed for the PIN breed from the VDB breed at a
rate of 7.2%. The posterior distribution of inbreeding coefficients ranged
from 0.03 (COM) to 0.08 (PIN).
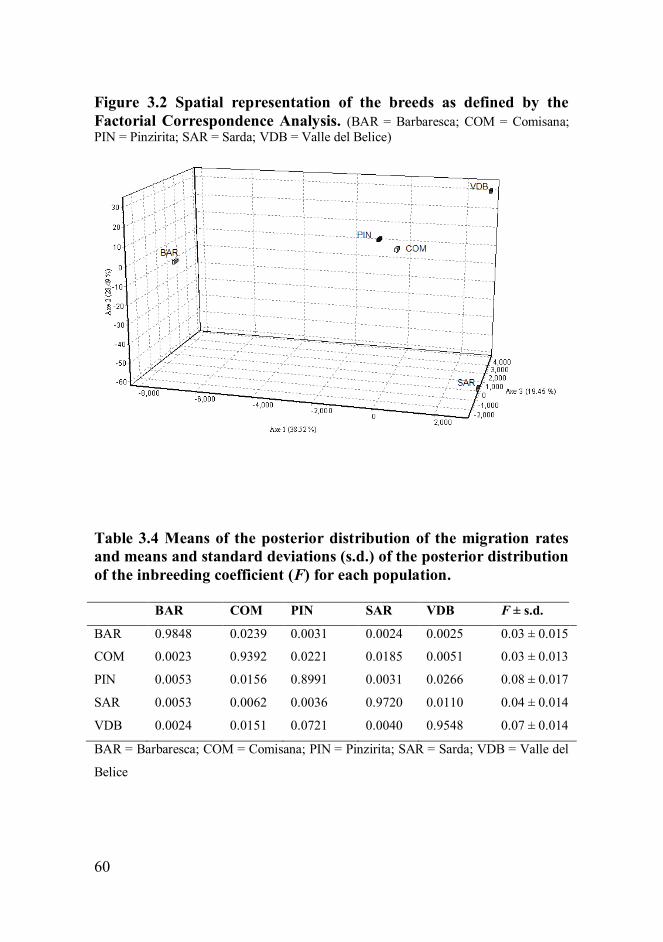
60
Figure 3.2 Spatial representation of the breeds as defined by the
Factorial Correspondence Analysis. (BAR = Barbaresca; COM = Comisana;
PIN = Pinzirita; SAR = Sarda; VDB = Valle del Belice)
Table 3.4 Means of the posterior distribution of the migration rates
and means and standard deviations (s.d.) of the posterior distribution
of the inbreeding coefficient (F) for each population. BAR COM PIN SAR VDB F ± s.d.
BAR 0.9848 0.0239 0.0031 0.0024 0.0025 0.03 ± 0.015
COM 0.0023 0.9392 0.0221 0.0185 0.0051 0.03 ± 0.013
PIN 0.0053 0.0156 0.8991 0.0031 0.0266 0.08 ± 0.017
SAR 0.0053 0.0062 0.0036 0.9720 0.0110 0.04 ± 0.014
VDB 0.0024 0.0151 0.0721 0.0040 0.9548 0.07 ± 0.014
BAR = Barbaresca; COM = Comisana; PIN = Pinzirita; SAR = Sarda; VDB = Valle del
Belice

61
Assignment test was performed using the program STRUCTURE with the
number of expected population (K) ranging from 1 to 9. The Ln Pr(G|K)
increased from K = 2 to K = 5, reached a “plateau” at K = 5, while did not
show a significant fluctuation from K = 5 to K = 8 and then decreased for
K = 9 (Figure S1). Therefore it was assumed that K = 5 is the most likely
number of clusters. For K = 2 the BAR separates from other breeds, while
for K = 3 it is the SAR that appears isolated and the Sicilian dairy breeds
remained in the same cluster; at K = 4 the VDB separates from the other
Sicilian dairy breeds (COM and PIN) and, finally, for K = 5 each breed
tends to have their own distinct cluster (Figure 3.3).
Figure 3.3 Estimated population structure of the 5 sheep breeds for K
ranging from 2 to 5. (BAR = Barbaresca; COM = Comisana; PIN = Pinzirita; SAR
= Sarda; VDB = Valle del Belice)

62
Table 3.5 shows the assignment proportion of each breed to the eight
most likely clusters inferred, choosing the iteration with the minimum
variance.
Table 3.5 Number of individuals (N) per breed and proportion of
membership of each breed in each of the 5 clusters inferred in the
most likely run of the program STRUCTURE.
Inferred clusters
Breed 1 2 3 4 5 N
BAR 0.031 0.016 0.014 0.020 0.919 57
COM 0.094 0.054 0.769 0.027 0.056 65
PIN 0.675 0.124 0.151 0.027 0.023 75
SAR 0.042 0.023 0.059 0.867 0.009 64
VDB 0.100 0.761 0.074 0.049 0.015 70
BAR = Barbaresca; COM = Comisana; PIN = Pinzirita; SAR = Sarda; VDB = Valle del
Belice
Clusters five and four included the BAR and the SAR individuals with
91.9% and 86.7%, respectively, showing a significant proportion of
assignment for these breeds; cluster three and two included the COM and
the VDB individuals with a proportion of assignment of 76.9% and
76.1%, respectively. The lowest value of assignment was showed in the
PIN breed with a proportion of assignment of 67.5% in the cluster one.
63
3.4 Discussion
In this study we investigated the genetic variability detected through
microsatellite markers in the four native sheep breeds reared in Sicily and
in the SAR breed. The majority of the markers were highly polymorphic
and generally in Hardy-Weinberg equilibrium except for the marker
DU223896 that showed the largest difference between observed and
expected heterozygosity. The significant deviation observed for the
marker DU223896 may be explained by unobserved null alleles leading
to high within-breed Fis values, ranging from 0.3139 to 0.6415. Genetic
linkage disequilibrium was found for some microsatellite markers and it
can be due to a variety of factors, including physical linkage, epistatic
selection, and genetic hitchhiking [25]. However, given that these
markers have been mapped to different chromosomes, physical linkage
was excluded.
Overall mean heterozygosity reflects a notably high variability,
characteristic of microsatellites derived from a greater mutation level than
other genetic markers, which makes them a valuable tool for genetic
diversity analyses [26]. The high mean heterozygosity values could be
attributed to low inbreeding levels found, low selection pressure, gene
flow among Sicilian sheep breeds, and the large number of alleles present
in all breeds. Another parameter indicative of the genetic variation is the
PIC estimate, which was higher than 0.50 and therefore highly
informative [27]. Estimates of observed heterozygosity over all loci
confirmed the remarkable level of genetic variability in these breeds.
Most of the breeds considered in this study have never been genetically
characterized before; therefore, it was not always possible to compare our
results with what is reported in literature. Previous studies presented

64
similar He estimates for the SAR breed [28-29], but lower Ho (0.60 and
0.66, respectively); whereas our He and Ho estimates for the COM breed
were higher than those reported by Lawson Handley et al. [29]. However,
it has to be considered that differences in the estimates can be also
attributed to the different number of markers and/or sampling scheme
used. The similarities among breeds for the average number of alleles
across loci and He, except for BAR, can be explained by the phylogenetic
relationships; in fact as reported above, COM, PIN, SAR, and VDB seem
to be genetically related among them. The lower number of alleles
observed in the BAR breed is probably due to a reduced effective
population size. This breed is, indeed, reared in a very restricted area of
Sicily and nowadays about 1,200 animals are enrolled in the herd book
[30]. The number of private alleles found in the SAR breed was probably
due to geographic isolation, i.e. determining a reduced or absent gene
flow with the Sicilian breeds.
The low Fis (within population inbreeding estimate) and Fit (total
inbreeding estimate) values indicate low inbreeding level within and
among breeds. The Fst (measurement of population differentiation) value
may indicate that these breeds are not differentiated enough and that they
may have a common history and breeding practices. To confirm this
hypothesis another analysis was performed, by removing the SAR breed
from the whole sample and Fst value decreased from 0.049 to 0.046,
underlying the low differentiation among these breeds. Thus, a large part
of the total genetic diversity can be explained by the variation within
breeds (0.951) and to a smaller extent by the variation among breeds
(0.049). Lack of differentiation between the Sicilian breeds could be due
to geographic proximity, similarities in environment and breeding

65
practices, but most likely due past gene flow among them. These
estimates of genetic differentiation are comparable to those reported by
other authors for indigenous Ethiopian (Fst = 0.046) [31], Portuguese (Fst
= 0.049) [32], and Alpine (Fst = 0.057) [7] sheep breeds and/or
populations, but lower than those reported by Baumung et al. [33] in
Austrian sheep breeds and Arora et al. [11] in Indian sheep breeds (0.080
and 0.111, respectively). Moreover, Lawson Handley et al. [29] in a study
on European sheep breeds, including the COM and the SAR, reported that
the Southern breeds are characterized by higher within-breed diversity,
lower genetic differentiation, and higher level of heterozygosity than
Northern breeds.
In PIN and VDB breeds the higher genetic diversity (He and average
number of alleles per locus), but at the same time the highest coefficient
of inbreeding suggested that whereas PIN and VDB have a wide genetic
base, individuals belonging to these two breeds were more inbred than
those in the other breeds. The rather high level of genetic variability in
PIN and VDB breeds is not surprising, as these are the most numerous
sheep breeds reared in Sicily. The highest level of inbreeding could be
affected by the farming system. In Sicily rams are reared together with
ewes, therefore mating with close relatives can be quite frequent.
Moreover, the reduced or absent exchange of rams between different
flocks of the same breed may have induced the development of a
substructure within the populations. The results of genetic distances are in
agreement with a previous study conducted on the genetic structure and
relationship between the VDB breed and the other sheep breeds
considered as ancestors, using the genetic polymorphisms of seven
protein systems [34]. The Unrooted Neighbor-Joining dendrogram
66
showed two clear clusters in accordance with the phylogenetic
relationships among breeds. Moreover, the FCA analysis showed a
relationship between COM and PIN breeds. The genetic closeness
between these two breeds might be explained considering that these
breeds are characterized by a common breeding system and geographical
husbandry area, which might have led to genetic exchange between them.
This seems to be partially confirmed by the structure analysis, showing
that COM and PIN breeds shared a cluster.
The FCA results corroborate the findings based on the Nei and Reynolds
genetic distances, which also indicated the isolation and a greater genetic
distance of the BAR breed. In fact, the least variable breeds are usually
the most distinct ones [35]. It is important to highlight that this breed was
mainly reared for meat production, unlike the other breeds reared
exclusively for milk production; therefore, there was less gene exchange
between the former and the other breeds.
We investigated population structure by varying K from one to nine.
Although the analysis showed the highest probability of forming eight
clusters, K = 5 was chosen as the best value to describe the genetic
structure of our breeds, since the increase of Ln Pr(G|K) from K = 5 to K
= 8 was low if compared with the increase from K = 1 to K = 5. However,
as suggested by Pritchard et al. [22], the inferred clusters are not
necessarily the corresponding real ancestral population and they can be
determined by sampling schemes. Assuming K = 3 the BAR and the SAR
formed two distinct groups suggesting that admixture was nearly zero for
these two breeds. The high average percentage of assignment of
individuals for BAR and SAR breeds pointed out the existence of clear
genetic differences compared to other breeds and this result is also

67
confirmed by the geographic distribution of these two breeds as well as
the different breeding system (i.e., meat production) for the former. The
COM, PIN and VDB breeds exhibited the presence of admixture, in fact
the COM and the PIN clustered together up to K = 4, confirming the
genetic closeness between these breeds. For K = 5, COM, PIN and VDB
breeds formed three distinct clusters but with proportion of membership
split in two or more clusters. This result could be probably due to the
phylogenetic relationships among these breeds and/or to the migration of
individuals among the several farms present in the area.
3.5 Conclusions
This study allowed exploring the genetic structure of the Sicilian
autochthonous sheep breeds. Our results indicated that significant
amounts of genetic variation are still maintained in these sheep breeds.
The results are in accordance with their geographical location, origin, and
breeding practices. The identification of genetic relationship and gene
flow among livestock breeds/populations is important for breeders and
conservationists. In order to maintain the existing genetic diversity,
breeding strategies (i.e. oriented seedstock exchange) aiming at
maintaining effective population size, minimizing inbreeding and genetic
drift should be implemented for the different breeds, especially for the
BAR that could be considered the most differentiated and endangered
breed. In the case of BAR, besides the strategies suggested before, a
conservation program is recommended and an in vitro (e.g. germplasm
bank) and in situ (e.g. conservation population) approaches should be
considered for future purposes. The robustness of assignment test depends
on the genetic differentiation but, unfortunately, it isn´t the case for COM,

68
PIN and VDB, and resulted in an unsatisfactory assignment performance
and thus it cannot be used for traceability purposes.
Acknowledgements
Dr. A.J.M. Rosa had an Experienced Researcher position within a Marie
Curie European Transfer of Knowledge-Development project with
contract number MTKD/I-CT-2004-14412.
69
References
1. Buduram P: Genetic characterization of Southern African sheep
breeds using DNA markers. Dissertation, University of the Free State
2004, Bloemfontein, South Africa.
2. Baumung R, Simianer H, Hoffmann I: Genetic diversity studies in
farm animals – a survey. J Anim Breed Genet 2004, 121:361-373.
3. Tapio I, Tapio M, Grislis Z, Holm LE, Jeppsson S, Kantanen J,
Miceikiene I, Olsaker I, Viinalass H, Eythorsdottir E: Unfolding of
population structure in Baltic sheep breeds using microsatellite
analysis. Heredity 2005, 94:448-456.
4. Scintu MF, Piredda G: Typicity and biodiversity of goat and sheep
milk products. Small Rumin Res 2007, 68:221-231.
5. Portolano N: La pecora della Valle Del Belice. In: Edagricole (ed),
Pecore e capre italiane 1987, Bologna, Italia, pp117-124.
6. Sarti DM, Lasagna F, Panella M, Pauselli F, Sarti FM: In: Edagricole
(ed), Pecore e capre italiane 2002, Bologna, Italia, p 7.
7. Dalvit C, Sacca E, Cassandro M, Gervaso M, Pastore E, Piasentier E:
Genetic diversity and variability in Alpine sheep breeds. Small Rumin
Res 2008, 80:45-51.
8. Ligda C, Altarayrah J, Georgoudis A: Genetic analysis of Greek
sheep breeds using microsatellite markers for setting conservation
priorities. Small Rumin Res 2009, 83:42-48.
9. Arora R, Bhatia S, Mishra BP, Joshi BK: Population structure in
Indian sheep ascertained using microsatellite information. Anim
Genet 2011, 42:242-250.
70
10. Miller SA, Dykes DD, Polesky HF: A simple salting out procedure
for extracting DNA from human nucleated cells. Nucleic Acids Res
1988, 16:1215.
11. Nei M: Molecular Evolutionary Genetics. Columbia University
Press 1987, New York, USA.
12. Weir BS, Cockerham CC: Estimating F-statistics for the analysis of
population structure. Evolution 1984, 38:1358-1370.
13. Goudet J: FSTAT (version 2.9.3): a computer programme to
calculate F-statistics. J Hered 1995, 8:485-486.
14. Marshall TC, Slate J, Kruuk LEB, Pemberton JM: Statistical
confidence for likelihood-based paternity influence in natural
populations. Mol Ecol 1998, 7:639-655.
15. Raymond M, Rousset F: GENEPOP (version 4.0.11): population
genetics software for exact tests and ecumenicism. J Hered 1995,
86:248-249.
16. Reynolds J, Weir BS, Cockerham C: Estimation of the coancestry
coefficient basis for a short term genetic distance. Genetics 1983,
105:767-779.
17. Eding JH, Laval G: Measuring genetic uniqueness in livestock. In:
Oldenbroek, J.K. (Ed.), Genebanks and the Conservation of Farm Animal
Genetic Resources 1999. Institute for Animal Science and Health,
Lelystad, pp. 33-58.
18. Felsentein J: Phylogeny Inference Package PHYLIP. Version 3.69.
Department of Genome Sciences and Department of Biology 2009,
University of Washington, Seattle, WA, USA.
19. Page RDM: TREEVIEW: An application to display phylogenetic
trees on personal computers. Comput Appl Biosci 1996, 12:357-358.

71
20. Belkhir K, Borsa P, Goudet J, Chikhi L, Bonhomme F: GENETIX
4.05, logiciel sous WindowsTM pour la génétique des populations.
Laboratoire Génome Populations 1996., Interactions CNRS UMR 5000,
Université de Montpellier II, Montpellier, France.
21. Wilson GA, Rannala B: Bayesian inference of recent migration
rates using multilocus genotypes. Genetics 2003, 163:1177-1191.
22. Pritchard JK, Stephens M, Donnelly P: Inference of population
structure using multilocus genotype data. Genetics 2000, 155:945-959.
23. Vicente AA, Carolino MI, Sousa MC, Ginja C, Silva FS, Martinez
AM, Vega-Pla JL, Carolino N, Gama LT: Genetic diversity in native
and commercial breeds of pigs in Portugal assessed by
microsatellites. J Anim Sci 2008, 86:2496-2507.
24. Zuccaro A, Bordonaro S, Criscione A, Guastella M, Perrotta G, Blasi
M, D’Urso G, Marletta D: Genetic diversity and admixture analysis of
Sanfratellano and three other Italian horse breeds assessed by
microsatellite markers. Animal 2008, 2:991-998.
25. Maudet C, Luikart G, Taberlet P: Genetic diversity and assignment
among seven French cattle breeds based on microsatellite DNA
analysis. J Anim Sci 2002, 80:942-950.
26. Arranz JJ, Bayon Y, Primitivo FS: Genetic variation at
microsatellite loci in Spanish sheep. Small Rumin Res 2001, 39:3-10.
27. Botstein D, White RL, Skolnick M, Davis RW: Construction of a
genetic linkage map in man using restriction fragment length
polymorphism. Am J Hum Genet 1980, 32:324-331.
28. Pariset L, Savarese MC, Cappuccio I, Valentini A: Use of
microsatellites for genetic variation and inbreeding analysis in Sarda
sheep flocks of central Italy. J Anim Breed Genet 2003, 120:425-432.
72
29. Lawson Handley LJ, Byrne K, Santucci F, Townsend S, Taylor M,
Bruford MW, Hewitt GM: Genetic structure of European sheep
breeds. Heredity 2007, 99:620-631.
30. ASSONAPA, 2010. http://www.assonapa.it/Consistenze/.
31. Gizaw S, Van Arendonk JAM, Komen H, Winding JJ, Hanotte O:
Population structure, genetic variation and morphological diversity
in indigenous sheep of Ethiopia. Anim Genet 2007, 38:621-628.
32. Santos-Silva F, Ivo RS, Sousa MCO, Carolino MI, Ginja C, Gama
LT: Assessing genetic diversity and differentiation in Portuguese
coarse-wool sheep breeds with microsatellite markers. Small Rumin
Res 2008 78:32-40.
33. Baumung R, Cubric-Curik V, Schwend K, Achmann R, Solkner J:
Genetic characterisation and breed assignment in Austrian sheep
breeds using microsatellite markers information. J Anim Breed Genet
2006, 123:265-271.
34. Di Stasio L, Rasero R, Giaccone P, Fiandra P: Valle del Belice sheep:
genetic structure and relationship with other sheep populations
reared in Sicily. Agr Medit 1992, 122:66-69.
35. Hedrick PW: Perspective: highly variable loci and their
interpretation in evolution and conservation. Evolution 1999, 53:313-
318.

73
Table S1 Microsatellite marker panel information.
Chr=chromosome; cM=centimorgan
MARKER Chr cM Size range locus
OarFCB128 2 96.1 98-132 UniSTS:250719
IDVGA45 18 44.2 162-188 UniSTS:251455
BM827B 3 161.6 205-217 UniSTS:250735
ILSTS011 9 40.1 264-290 UniSTS:250863
DU323541 8 - 365-421 GenBank:DU323541
OarCP49 17 29.9 80-108 UniSTS:251389
INRA063A 14 65.1 157-179 UniSTS:251139
SPS115 15 34.8 230-250 UniSTS:279634
LSCV36B 11 72.6 445-469 UniSTS:45189
MAF209 17 49.4 103-129 UniSTS:251175
BRN 7 47.2 138-148 UniSTS:251060
McM527 5 127.4 167-183 UniSTS:251416
ILSTS005 7 134.4 186-216 UniSTS:250860
TCRBV6 4 136.0 226-270 UniSTS:279515
DU223896 12 - 338-364 GenBank:DU223896
APPO10 1 149.6 107-125 UniSTS:279440
INRA132 20 9.5 145-179 UniSTS:251168
CSRD247 14 25.5 215-251 UniSTS:253556
DU194351 13 - 354-386 GenBank:DU194351
DU216028 23 - 472-510 GenBank:DU216028
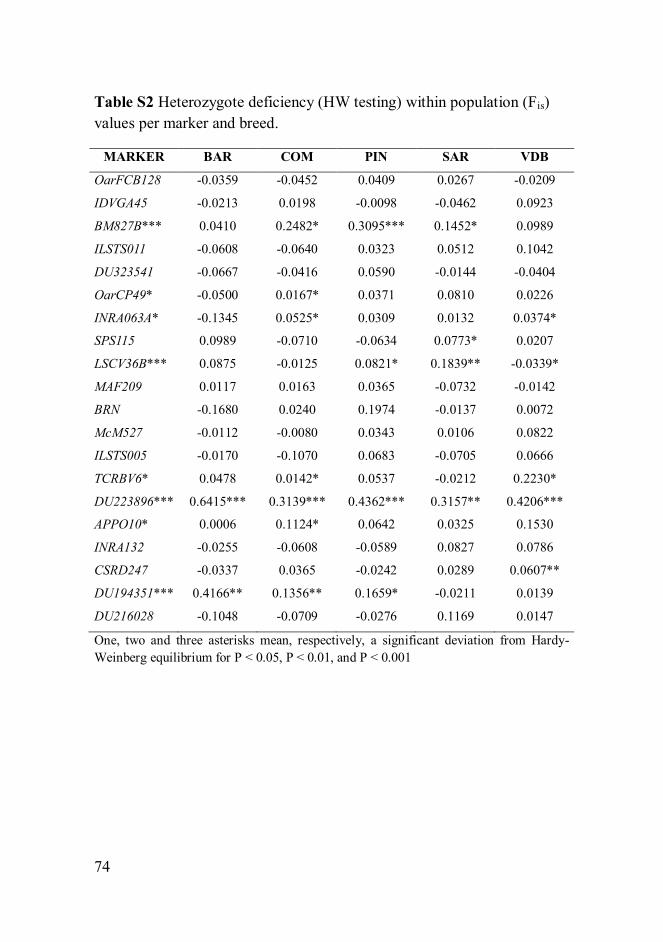
74
Table S2 Heterozygote deficiency (HW testing) within population (Fis)
values per marker and breed.
MARKER BAR COM PIN SAR VDB
OarFCB128 -0.0359 -0.0452 0.0409 0.0267 -0.0209
IDVGA45 -0.0213 0.0198 -0.0098 -0.0462 0.0923
BM827B*** 0.0410 0.2482* 0.3095*** 0.1452* 0.0989
ILSTS011 -0.0608 -0.0640 0.0323 0.0512 0.1042
DU323541 -0.0667 -0.0416 0.0590 -0.0144 -0.0404
OarCP49* -0.0500 0.0167* 0.0371 0.0810 0.0226
INRA063A* -0.1345 0.0525* 0.0309 0.0132 0.0374*
SPS115 0.0989 -0.0710 -0.0634 0.0773* 0.0207
LSCV36B*** 0.0875 -0.0125 0.0821* 0.1839** -0.0339*
MAF209 0.0117 0.0163 0.0365 -0.0732 -0.0142
BRN -0.1680 0.0240 0.1974 -0.0137 0.0072
McM527 -0.0112 -0.0080 0.0343 0.0106 0.0822
ILSTS005 -0.0170 -0.1070 0.0683 -0.0705 0.0666
TCRBV6* 0.0478 0.0142* 0.0537 -0.0212 0.2230*
DU223896*** 0.6415*** 0.3139*** 0.4362*** 0.3157** 0.4206***
APPO10* 0.0006 0.1124* 0.0642 0.0325 0.1530
INRA132 -0.0255 -0.0608 -0.0589 0.0827 0.0786
CSRD247 -0.0337 0.0365 -0.0242 0.0289 0.0607**
DU194351*** 0.4166** 0.1356** 0.1659* -0.0211 0.0139
DU216028 -0.1048 -0.0709 -0.0276 0.1169 0.0147
One, two and three asterisks mean, respectively, a significant deviation from Hardy-
Weinberg equilibrium for P < 0.05, P < 0.01, and P < 0.001
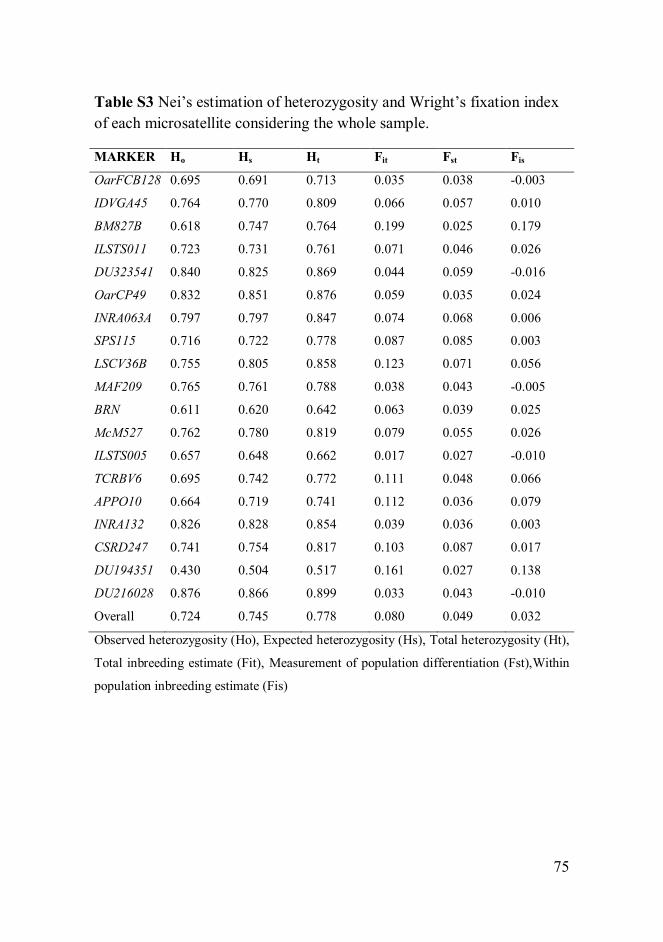
75
Table S3 Nei’s estimation of heterozygosity and Wright’s fixation index
of each microsatellite considering the whole sample.
MARKER Ho Hs
Ht
Fit
Fst
Fis
OarFCB128 0.695 0.691 0.713 0.035 0.038 -0.003
IDVGA45 0.764 0.770 0.809 0.066 0.057 0.010
BM827B 0.618 0.747 0.764 0.199 0.025 0.179
ILSTS011 0.723 0.731 0.761 0.071 0.046 0.026
DU323541 0.840 0.825 0.869 0.044 0.059 -0.016
OarCP49 0.832 0.851 0.876 0.059 0.035 0.024
INRA063A 0.797 0.797 0.847 0.074 0.068 0.006
SPS115 0.716 0.722 0.778 0.087 0.085 0.003
LSCV36B 0.755 0.805 0.858 0.123 0.071 0.056
MAF209 0.765 0.761 0.788 0.038 0.043 -0.005
BRN 0.611 0.620 0.642 0.063 0.039 0.025
McM527 0.762 0.780 0.819 0.079 0.055 0.026
ILSTS005 0.657 0.648 0.662 0.017 0.027 -0.010
TCRBV6 0.695 0.742 0.772 0.111 0.048 0.066
APPO10 0.664 0.719 0.741 0.112 0.036 0.079
INRA132 0.826 0.828 0.854 0.039 0.036 0.003
CSRD247 0.741 0.754 0.817 0.103 0.087 0.017
DU194351 0.430 0.504 0.517 0.161 0.027 0.138
DU216028 0.876 0.866 0.899 0.033 0.043 -0.010
Overall 0.724 0.745 0.778 0.080 0.049 0.032
Observed heterozygosity (Ho), Expected heterozygosity (Hs), Total heterozygosity (Ht),
Total inbreeding estimate (Fit), Measurement of population differentiation (Fst),Within
population inbreeding estimate (Fis)
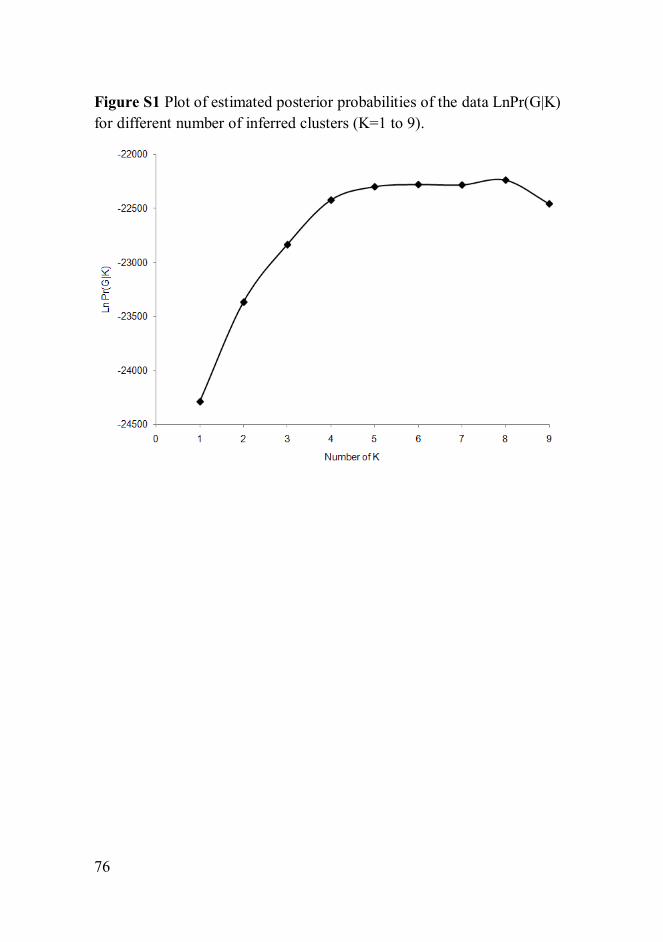
76
Figure S1 Plot of estimated posterior probabilities of the data LnPr(G|K)
for different number of inferred clusters (K=1 to 9).

4
Genome wide structure in indigenous Sicilian cattle
breeds
S. Mastrangelo*, M. Saura†, M. Tolone*, J. Salces†, R. Di Gerlando*, M.
T. Sardina*, M. Serrano†, B. Portolano*
*Dipartimento di Scienze Agrarie e Forestali, Università degli Studi di
Palermo, Viale delle Scienze, 90128 Palermo, Italy
†Departamento de Mejora Genética Animal, INIA, Carretera de la Coruña
Km 7.5, 28040 Madrid, Spain
In preparation (2014)
78
Abstract
Background:In recent years, there has been great interest in recovering
and preserving local breeds. Genomic technologies, such as high-
throughput genotyping based on SNP arrays, provide background
information concerning genome structure in domestic animals. The aim of
this work was to investigate the genetic structure, the genome-wide
estimates of inbreeding, coancestry and effective population size (Ne), and
the patterns of linkage disequilibrium (LD) in two Sicilian local cattle
breeds, Cinisara and Modicana, using the Illumina Bovine SNP50K
BeadChip.
Results: Principal Components Analysis and Bayesian clustering
algorithm showed that animals from the two Sicilian breeds formed non-
overlapping clusters and are clearly separated populations, even from the
Holstein control population. Between the Sicilian cattle breeds, the
Modicana was the most differentiated population, whereas the Cinisara
animals showed a lowest value of assignment, the presence of
substructure and genetic links occurred between both breeds. The average
molecular inbreeding and coancestry coefficients were moderately high,
and the current estimates of Ne were low in both breeds. These values
indicated a low genetic variability. Average r2 was notably lower than the
values observed in other cattle breeds. The highest r2 values were found
in chromosome 14, where causative mutations affecting variation in milk
production traits have been reported.
Conclusions:This study has reported for the first time in these local
populations, estimates of population structure, levels of coancestry and
inbreeding, and linkage disequilibrium from a genome-wide perspective.
The levels of inbreeding and Ne showed in this study point out the

79
necessity of establishing a conservation program in these autochthonous
breeds. The control of molecular inbreeding and coancestry would restrict
inbreeding depression, the probability of losing beneficial rare alleles, and
therefore the risk of extinction. The extreme low values of LD would
indicate that the present chip cannot pick up the real LD existing in these
two breeds, and that a high density SNP array would be better to capture
the LD information. The results generated from this study have important
implications for the design and applications of association studies as well
as for the development of conservation and/or selection breeding
programs.
Keywords: Genetic diversity, linkage disequilibrium, sicilian cattle
breeds, single nucleotide polymorphism
80
4.1 Introduction
The global decline in livestock genetic diversity is mainly the result of the
massive use of a small number of selected breeds. However, in recent
years, an increasing interest in recovering and preserving local breeds
and/or populations has taken place [1]. Potentially, there is much
unrecognized beneficial genetic variability in local breeds and
populations, which supposes important reservoirs of non-exploited
genetic resources. This genetic variability guarantees its selection
response to productive and adaptation traits improvement, to cope with
new environmental conditions, changes in market demands, husbandry
practices and disease challenges [2]. Maintaining the highest levels of
genetic diversity and limiting the increase in inbreeding is the premise of
most conservation programs [3]. Traditionally, inbreeding (F) and
coancestry (f) have been estimated on the basis of pedigree information
[4]. The effective population size (Ne), a general indicator of the risk of
genetic erosion, contains relevant information for the monitoring of the
genetic diversity and helps to explain how populations evolved [5].
Managing the rate of inbreeding and coancestry, or equivalently, the Ne,
provides a general framework to control the loss of variability avoiding or
alleviating the reductions in viability and fertility; i.e., inbreeding
depression [6]. F and f estimates depend on the completeness and
accuracy of the available pedigree records which is in most cases
inexistent or wrong in local breeds. Currently, with the availability of
high-density single nucleotide polymorphism (SNP) chips, these
coefficients can be estimated accurately in the absence of pedigree
information [7,8]. SNP genotyping allows the simultaneous high-
throughput interrogation of hundreds of thousands of loci with high

81
precision at an affordable cost that enables large-scale studies [9]. In
addition, this approach considers selective variation that classical neutral
markers (e.g. microsatellites) ignore. Moreover, with the application of
genome-wide SNP genotyping, the study in livestock population of the
extent of linkage disequilibrium (LD), the non-random association of
alleles at different loci, has gained more attention. The extent of LD is
often used to determine the optimal number of markers required for fine
mapping of quantitative trait loci (QTL) [10], genomic selection [11] and
increasing the understanding of genomic architecture and the evolutionary
history of the populations [12].
In Sicily, dairy production represents an important resource for hilly and
mountain areas economy, in which other economic activities are limited,
and the dairy products are the link among product-territory, territory-
breed and breed-product. An interesting situation is represented by two
local cattle breeds farmed in extensive traditional systems in this area.
The Cinisara breed is characterized by a uniform black coat and less
frequently by black spotted coat, and the Modicana breed is characterized
by a solid red coat. Both breeds are farmed in Sicily and their economic
importance lies on the traditional production systems of two typical ‘pasta
filata’ cheeses: ‘Caciocavallo Palermitano’ and Ragusano P.D.O.
(Protected Designation of Origin), respectively. These two breeds are well
adapted to the harshness of marginal mountain areas of Sicily, due to their
good grazing characteristics, and resistance to environmental conditions.
Therefore, the socio-economic and ecological values, the historical,
cultural and genetic heritage of these two breeds are unquestionable. The
Cinisara and Modicana breeds are not subject to breeding programs. In
fact, the development of breeding programs for local breeds is too costly
82
for breeding organizations, and the absence of pedigree records is a threat
for the existence of these breeds. However, all aspects mentioned above,
which creates income for a small group of farmers, justifies the
establishment of a conservation program [13]. In the last 50 years these
local breeds have undergone a progressive reduction in size, mainly due
to the mechanization of agriculture and to the introduction of more
specialized and productive cosmopolitan breeds. The risk of population
extinction states the necessity of exploring the genetic characteristics of
these two breeds, never studied before from a genetic perspective.
The aim of this study was to investigate these breeds from a genetic
perspective, including the analysis of: i) genetic structure, ii) genome-
wide estimates of F and f and Ne, and iii) the patterns of LD for the two
Sicilian local cattle breeds, Cinisara and Modicana.
4.2 Materials and Methods
DNA sampling and genotyping
A total of 144 animals from 14 farms were used for the analysis. Samples
consisted of 72 Cinisara (CIN) (68 cows and 4 bulls) and 72 Modicana
(MOD) (69 cows and 3 bulls) animals born between 1999 and 2010 and
chosen on the basis of their phenotypic profiles (morphological traits as
coat color) and information supplied by the farmers (year of birth). For
these cattle breeds pedigree data are not available. About 10 ml of blood
was collected from caudal vein using tubes with EDTA as anticoagulant.
Genomic DNA was extracted from buffy coats of nucleated cells using
the Salting Out method [14]. The concentration of extracted DNA was
assessed with the NanoDrop ND-1000 spectrophotometer (NanoDrop
Technologies, Wilmington, DE).
83
The CIN and MOD animals were genotyped for 54 609 SNPs, using the
Illumina Bovine SNP50K v2 BeadChip, and following the standard
operating procedures recommended by the manufacturer. Genotyping
data were initially tested for quality using the Illumina Genome Studio
Genotyping Module v1.0 software. Only the SNPs located on the
autosomes were considered in further analyses. SNPs unmapped were
discarded. The markers were filtered according to quality criteria that
included: (i) Call Frequency (proportion of samples with genotype at each
locus) (≥ 0.98), (ii) Gen Train Score (quality of the probe that determines
the shape and separation of clusters) (> 0.70), (iii) AB R Mean (genotype
signal intensity) (> 0.35), (iv) Minor Allele Frequency (MAF) (≥ 0.05),
and (v) Hardy-Weinberg equilibrium (HWE) (p-value 0.001). SNPs that
did not satisfy these quality criteria were excluded.
Genetic structure
STRUCTURE version 2.3.1 [15] was used to analyze the genetic
structure, to identify the true number of populations (clusters) and to
assign the individuals to each cluster. Genotypes from 96 animals of
Holstein Friesian (HOL) cattle breed, tested with the same quality criteria,
were included in this analysis and used to investigate the relationship
among breeds. Unlinked SNPs were selected using the --indep option of
the PLINK program [16] with the following parameters: 50 SNPs per
window, a shift of 5 SNPs between windows and a variation inflation
factor’s threshold of 2. From these markers, a random set of 10 000 SNPs
were used. Analysis was performed considering both the admixture model
and the correlated allele frequencies between populations [15]. The length
of the burn-in and MCMC (Monte Carlo Markov chain) were 50 000

84
steps and 100 000 iterations, respectively. The Ln Pr(G|K) was calculated
for each K ranging from 1 to 6 without prior information on the breed and
farm origins, to estimate the most likely number of clusters in the dataset,
running 10 independent replicates for each K.
The genetic relationship between individuals was also estimated by
Principal Components Analysis (PCA) of genetic distance. These values
were calculated using PLINK program [16] through the use of commands
--cluster and --distance matrix. PCA of the genetic distance (D) matrix
was performed using the multidimensional scaling (MDS) option within
PLINK. It should be noted that when MDS is applied to D, it is
numerically identical to PCA [16]. The graphical representation was
depicted using the statistical R software [17]. The same software was used
to visualize the IBS matrices using the Heatmap function.
Inbreeding and coancestry molecular coefficients, rates of inbreeding
and coancestry and effective population size
Following Malécot [18], molecular f coefficient between pairs of
individuals is defined as the probability that two alleles taken at random,
one from each individual, are identical in state. Similarly, molecular F
coefficient for each individual is defined as the probability that the two
alleles of a locus are identical in state. The molecular f coefficient
between individuals i and j was calculated as:
85
where L is the number of markers and Ilk(i)m(j) is the identity of the kth
allele
from individual i with the mth
allele from the animal j at locus l, that takes
a value of 1 if alleles are identical and 0 if they are not. The molecular F
coefficient for individual i was calculated as F = 2fii – 1 (i.e. fii is the
molecular self-coancestry). Thus, F was estimated as the proportion of
homozygous genotypes.
Rate of molecular inbreeding per year (ΔF) was computed by regressing
the natural logarithm of (1−F) on year of birth. Rate of molecular
coancestry per year (Δf) was estimated in the same way, i.e. by regressing
the natural logarithm of (1−f) for each pair of individuals on year of birth.
The Ne was estimated from the rates of inbreeding (NeF = 1/2LΔF) and
coancestry (Nef = 1/2LΔf) per generation, assuming a generation interval L
of six years.
Linkage Disequilibrium
A standard descriptive Linkage Disequilibrium parameter, the squared
correlation coefficient of allele frequencies at a pair of loci (r2),
was
obtained using PLINK [16]. For each SNP, pairwise LD between adjacent
SNPs was calculated on each chromosome. Also r2
was estimated for all
pairwise combinations of SNPs using Haploview v4.2 software [19]. For
each chromosome, pairwise r2
was calculated for SNPs between 5 kb and
50 Mb apart. To visualize the LD pattern per chromosome, r2 values were
stacked and plotted as a function of inter-marker distance categories.
4.3 Results and discussion
A descriptive summary of chromosomes and SNPs is shown in Table 4.1.
The number of SNPs per chromosome ranged from 2513 (chromosome
86
BTA1) to 711 (BTA27) in CIN and from 2366 (BTA1) to 690 (BTA28)
in MOD, and the average density of SNPs per Mb were 15 for CIN and
14 for MOD. The overall mean MAF was 0.248±0.016 for CIN and
0.240±0.013 for MOD being these values in agreement with those
reported by Matukumalli et al. [9] in a study on development and
characterization of a high density SNP genotyping assay for several cattle
breeds. A high proportion of monomorphic SNPs was expected in both
breeds given its reduced population size across years. In particular, the
MOD breed presented a higher number of fixed alleles (2412 SNPs)
respect to CIN breed (461 SNPs). Among the 54 609 SNPs included in
the chip only 52 886 mapping to bovine autosomes were considered for
further analysis. After screening, the final number of samples and SNPs
were 71 and 38 502 for CIN and 69 and 36 311 for MOD cattle breeds.

87
Table 4.1 Descriptive summary of chromosomes and SNPs. Total
number of single nucleotide polymorphisms (nº SNPs), number of SNPs
after filtered and average minimum allele frequency (MAF) in Cinisara
(CIN) and Modicana (MOD) cattle breeds and length of the covered
chromosome.
CIN MOD
Chr nº
SNPs
SNP after
filtered
Average
MAF
SNP after
filtered
Average
MAF
1 3430 2513 0.250 2366 0.238
2 2829 2044 0.276 1956 0.264
3 2549 1881 0.278 1781 0.261
4 2570 1851 0.252 1703 0.243
5 2271 1584 0.250 1427 0.241
6 2575 1932 0.248 1750 0.242
7 2352 1653 0.247 1613 0.235
8 2429 1796 0.247 1671 0.234
9 2095 1510 0.252 1384 0.246
10 2206 1623 0.243 1513 0.237
11 2295 1690 0.233 1607 0.223
12 1773 1238 0.237 1171 0.228
13 1850 1341 0.235 1270 0.230
14 1831 1385 0.228 1294 0.223
15 1762 1263 0.237 1191 0.224
16 1726 1215 0.234 1178 0.228
17 1600 1176 0.238 1115 0.230
18 1376 1015 0.237 947 0.233
19 1420 1055 0.225 1008 0.229
20 1568 1169 0.213 1123 0.211
21 1483 1053 0.247 1000 0.239
22 1324 954 0.264 906 0.252
23 1093 815 0.262 766 0.247
24 1312 967 0.271 920 0.258
25 1004 738 0.260 722 0.256
26 1116 808 0.258 781 0.251
27 981 711 0.271 693 0.254
28 980 712 0.276 690 0.260
29 1086 810 0.266 765 0.247
Total 52886 38502 0.249±0.013 36311 0.240±0.016

88
Genetic structure
Principal components analysis (PCA) was used to cluster animals and
explore the relationship among individuals and populations. As
mentioned before, a sample of Holstein was included in this analysis. The
PCA showed that animals from the three breeds formed non-overlapping
clusters and are clearly separated populations. This indicated a clear
genetic division existing among Holstein and Sicilian cattle breeds
(Figure 4.1).
Figure 4.1 Principal Components Analysis among Holstein (HOL),
Cinisara (CIN) and Modicana (MOD) cattle breeds
The function Heatmap of genetic similarity corroborated the findings
obtained with the PCA and showed that individuals from HOL and MOD
were closer to individuals from their same population respect to
individuals of the CIN breed, that showed the presence of substructure
[See Additional file 1: Figure S1].

89
Genotype data was also analyzed using a Bayesian clustering algorithm to
search for admixture between populations and to infer population
structure. Results from analysis of admixture considering a range of 1 to 6
potential clusters (K) pointed out that the highest average likelihood value
with the smallest variance among replicates were obtained for K = 4. Ln
Pr(G|K) increased from K = 1 to K = 4, reaching a plateau at K = 4, while
did not show a significant fluctuation from K = 4 to K = 5, and then
rapidly decreased for K = 6 [See Additional file 2: Figure S2].
For K = 2 the HOL is separated from Sicilian breeds and for K = 3 each
breed tends to have its own distinct cluster, suggesting that admixture was
nearly absent among HOL and Sicilian cattle breeds. A graphic
representation of the estimated membership coefficients to the four
clusters for each individual is shown in Figure 4.2.
The HOL is the most differentiated breed with 99.8% of the individuals
assigned to cluster 1, whereas the CIN animals showed a lowest value of
assignment with a proportion of 46.9% of the individuals assigned to
cluster 3 and 41.6% assigned to cluster 2. Cluster 4 included the MOD
individuals with 79.7%. Furthermore, 17.2% of the MOD individuals
were assigned to the cluster 3 and 10.8% of the CIN individuals to the
cluster 4 [See Additional file 3: Table S1]. Again, the results evidenced
that for the Sicilian cattle breeds, the MOD represented a well-supported
group, with some degree of introgression with CIN genes, while CIN was
split in two subgroups. Therefore, model based clustering suggested that
admixture has occurred and genetic links exist between CIN and MOD
breeds.

90
Figure 4.2 Estimated population structure of Holstein (HOL),
Cinisara (CIN) and Modicana (MOD) cattle breeds for K ranging
from 2 to 4
These results may be explained considering that CIN and MOD are two
ancient cattle breeds reared in the same area, with possible (natural or
artificial) gene flow between them, having a common history and
breeding practices. The CIN herd book was founded in 1996 and before
this date, the individuals of the CIN breed were registered in the MOD
herd book, which was founded in 1975. Furthermore, for CIN, the
clustering analysis suggested that this breed does not constitute a

91
homogenous population, but a mixture of two populations. However,
according to the herd book and morphological traits recorded, it does not
seem to be crossbred individuals among the samples used in this work;
hence, the genetic structure detected for CIN breed could be due to
possible introgression with genes from other breeds. In the past this breed
was probably crossed with Holstein individuals to improve milk
production [20]. Crossbreeding is a common practice among breeders and
it is used to modify the characteristics of breeds according to the needs
and also to expand the size of a population when it is becoming too small.
Depending on the situation, crossbreeding can be considered as a positive
or negative process for the management of populations [21]. This practice
can offset the loss of genetic diversity and to preserve from excessive
inbreeding, but it could be detrimental when small-endangered
populations are concerned [3]. Another explanation may be the
geographical isolation of some farms of CIN breed and the sampling of
CIN animals from independent farms. This would generate a population
subdivision as consequence of genetic drift (e.g. Wahlund effect). A PCA
conducted only for the CIN animals [See Additional file 4: Figure S3]
considering the herd of origin, showed that individuals which clustered
together belonged to farms located in the same area. In fact, as suggested
by Pritchard et al., [15], the inferred clusters are not necessarily the
corresponding real ancestral populations and they can be determined by
sampling schemes. Moreover, the presence of substructure could evoke
concerns about the generation of false positive results when using LD
mapping as the only means to locate genes underlying complex traits
[22]. Therefore, the genetic structure observed is in agreement with the
demographic history that occurred during the formation of the two breeds.
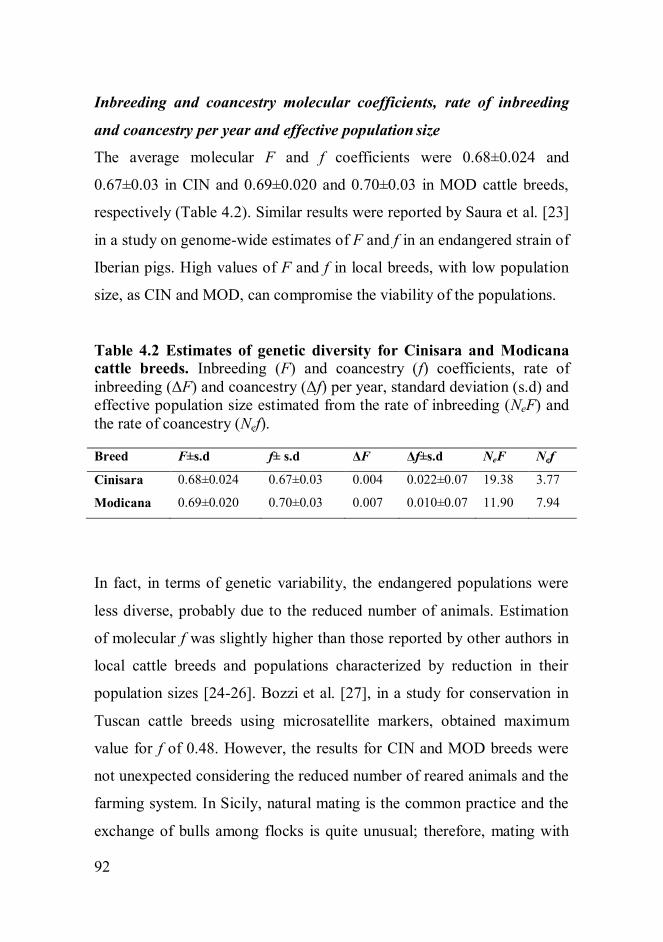
92
Inbreeding and coancestry molecular coefficients, rate of inbreeding
and coancestry per year and effective population size
The average molecular F and f coefficients were 0.68±0.024 and
0.67±0.03 in CIN and 0.69±0.020 and 0.70±0.03 in MOD cattle breeds,
respectively (Table 4.2). Similar results were reported by Saura et al. [23]
in a study on genome-wide estimates of F and f in an endangered strain of
Iberian pigs. High values of F and f in local breeds, with low population
size, as CIN and MOD, can compromise the viability of the populations.
Table 4.2 Estimates of genetic diversity for Cinisara and Modicana
cattle breeds. Inbreeding (F) and coancestry (f) coefficients, rate of
inbreeding (ΔF) and coancestry (Δf) per year, standard deviation (s.d) and
effective population size estimated from the rate of inbreeding (NeF) and
the rate of coancestry (Nef).
Breed F±s.d f± s.d ΔF Δf±s.d NeF Nef
Cinisara 0.68±0.024 0.67±0.03 0.004 0.022±0.07 19.38 3.77
Modicana 0.69±0.020 0.70±0.03 0.007 0.010±0.07 11.90 7.94
In fact, in terms of genetic variability, the endangered populations were
less diverse, probably due to the reduced number of animals. Estimation
of molecular f was slightly higher than those reported by other authors in
local cattle breeds and populations characterized by reduction in their
population sizes [24-26]. Bozzi et al. [27], in a study for conservation in
Tuscan cattle breeds using microsatellite markers, obtained maximum
value for f of 0.48. However, the results for CIN and MOD breeds were
not unexpected considering the reduced number of reared animals and the
farming system. In Sicily, natural mating is the common practice and the
exchange of bulls among flocks is quite unusual; therefore, mating with
93
close relatives can be quite frequent. Rates of molecular inbreeding (ΔF)
and coancestry (Δf) per year were 0.004 and 0.022 in CIN and 0.007 and
0.010 in MOD cattle breeds, respectively (Figures 4.3 and 4.4). Estimates
of Ne from ΔF and Δf are shown in Table 4.2. Ne values estimated from
the ΔF were about 19 animals in CIN and 12 animals in MOD, and those
calculated from the Δf, were about 4 and 8 animals in CIN and MOD
cattle breeds, respectively. The current estimates of Ne were low, probably
due to the intra-population genetic structuring. In animal breeding, the
recommendation is to maintain a Ne of at least 50 to 100 [28]. The control
of F and f would restrict inbreeding depression, the probability of losing
beneficial rare alleles, and therefore the risk of extinction [3]. Therefore,
monitoring Ne and possible control of resultant F may be crucial to
implementing genetic improvement programs.

94
Figure 4.3 Rate of inbreeding per year in Cinisara (a) and Modicana
(b) cattle breeds.
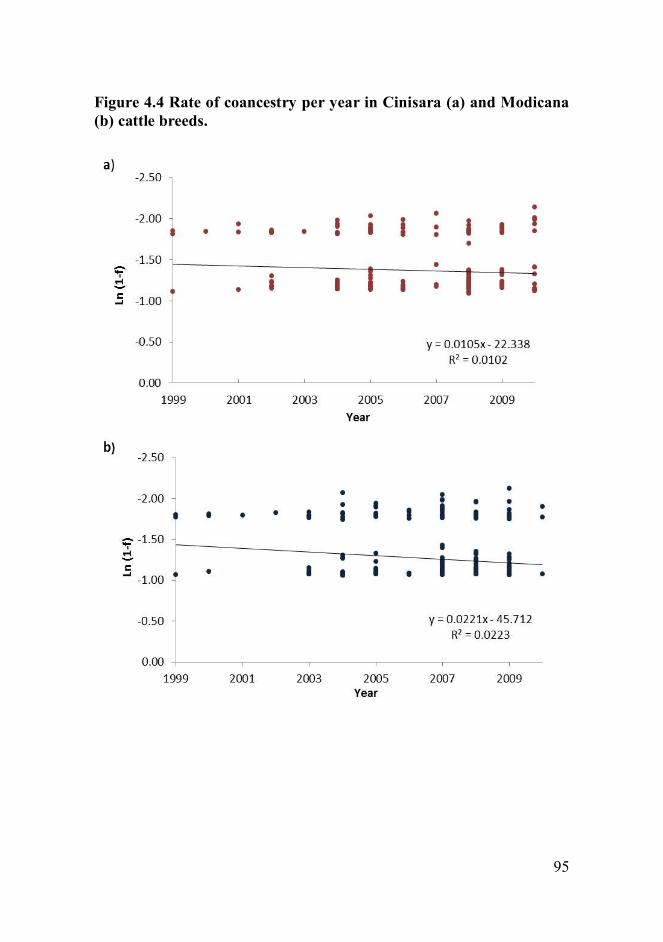
95
Figure 4.4 Rate of coancestry per year in Cinisara (a) and Modicana
(b) cattle breeds.

96
Linkage Disequilibrium (LD)
The extent of linkage disequilibrium was first evaluated for each adjacent
syntenic SNPs pair. The average distance between adjacent SNPs pairs
for the entire autosomal genome were about 57 and 60 kb for CIN and
MOD cattle breeds, respectively (Table 4.3). Average LD between
adjacent SNPs was 0.034±0.025 for CIN and 0.039±0.033 for MOD cattle
breeds, and some variations in the LD value across chromosomes in both
populations were observed. The r2
ranged from 0.018±0.026 for BTA5 to
0.106±0.199 for BTA14 in CIN, and from 0.019±0.027 for BTA2 to
0.126±0.221 for BTA14 in MOD (Table 4.3). Chromosomes 14, 15, 16
and 17 showed the highest average LD values in both breeds, whereas
small differences were observed among other chromosomes (Table 4.3).
Differences in LD among chromosomes have already been reported in
Holstein cattle, and these can be attributed to recombination rate,
heterozygosity, genetic drift and effect of selection [29]. Other authors
reported an average LD between adjacent SNP pairs over the 29 different
chromosomes relatively similar [22,30,31]. The comparison of LD levels
obtained in different studies is not straightforward, because of differences
in several factors as sample size, type of LD measures (D’ or r2), marker
types (microsatellite or SNP), marker density and distribution, and
population demography [29]. Moreover, so far, studies of the extent of
LD have been reported mostly for dairy and beef cattle breeds under
selection, and there is little knowledge about the degree of genome-wide
LD in local cattle breeds and populations.
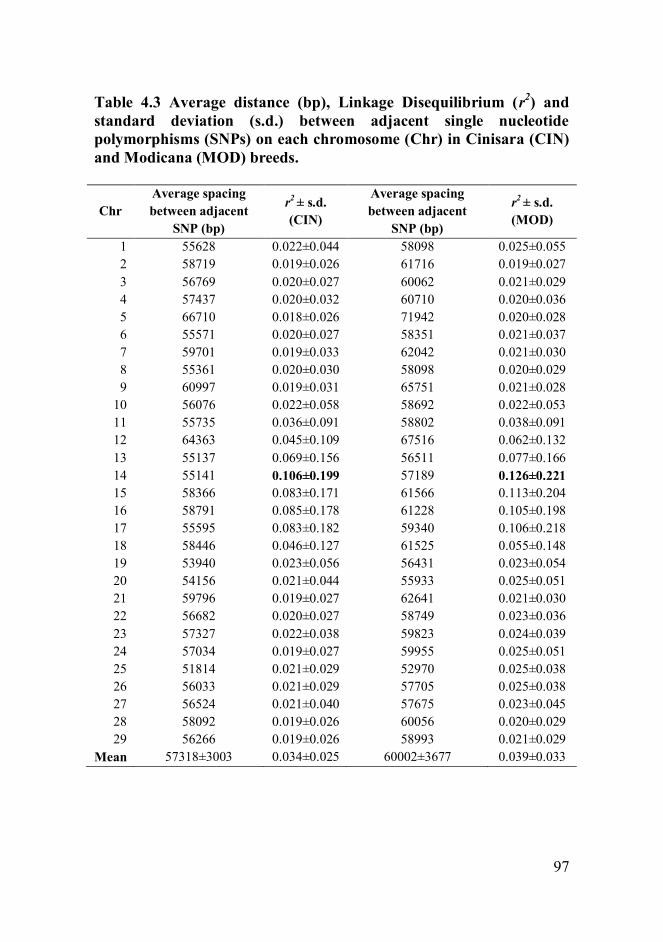
97
Table 4.3 Average distance (bp), Linkage Disequilibrium (r2) and
standard deviation (s.d.) between adjacent single nucleotide
polymorphisms (SNPs) on each chromosome (Chr) in Cinisara (CIN)
and Modicana (MOD) breeds.
Chr
Average spacing
between adjacent
SNP (bp)
r2
± s.d.
(CIN)
Average spacing
between adjacent
SNP (bp)
r2
± s.d.
(MOD)
1 55628 0.022±0.044 58098 0.025±0.055
2 58719 0.019±0.026 61716 0.019±0.027
3 56769 0.020±0.027 60062 0.021±0.029
4 57437 0.020±0.032 60710 0.020±0.036
5 66710 0.018±0.026 71942 0.020±0.028
6 55571 0.020±0.027 58351 0.021±0.037
7 59701 0.019±0.033 62042 0.021±0.030
8 55361 0.020±0.030 58098 0.020±0.029
9 60997 0.019±0.031 65751 0.021±0.028
10 56076 0.022±0.058 58692 0.022±0.053
11 55735 0.036±0.091 58802 0.038±0.091
12 64363 0.045±0.109 67516 0.062±0.132
13 55137 0.069±0.156 56511 0.077±0.166
14 55141 0.106±0.199 57189 0.126±0.221
15 58366 0.083±0.171 61566 0.113±0.204
16 58791 0.085±0.178 61228 0.105±0.198
17 55595 0.083±0.182 59340 0.106±0.218
18 58446 0.046±0.127 61525 0.055±0.148
19 53940 0.023±0.056 56431 0.023±0.054
20 54156 0.021±0.044 55933 0.025±0.051
21 59796 0.019±0.027 62641 0.021±0.030
22 56682 0.020±0.027 58749 0.023±0.036
23 57327 0.022±0.038 59823 0.024±0.039
24 57034 0.019±0.027 59955 0.025±0.051
25 51814 0.021±0.029 52970 0.025±0.038
26 56033 0.021±0.029 57705 0.025±0.038
27 56524 0.021±0.040 57675 0.023±0.045
28 58092 0.019±0.026 60056 0.020±0.029
29 56266 0.019±0.026 58993 0.021±0.029
Mean 57318±3003 0.034±0.025 60002±3677 0.039±0.033

98
Considering the levels of LD between adjacent markers, the average r2 in
these local Sicilian cattle breeds was surprisingly much lower than those
reported for indigenous Swiss Eriger (r2=0.24) [31], Blonde d’Aquitaine
(r2=0.20) [22] and Chinese and Nordic Holsteins (r
2=0.20 and 0.21) [32].
In fact, r2 values between adjacent SNPs for Sicilian cattle breeds are
similar to that reported for non-syntenic SNPs in Blonde d’Aquitaine
cattle breed [22]. Other factors, as MAF and sample size, may be
affecting the extent of LD within a genome. In both breeds, more than
67% of SNPs had a MAF larger than 0.2, suggesting that the effect of low
MAF on the overall LD estimated should be small. Moreover, Khatkar et
al. [33] pointed out that sample size near 70 individuals was sufficient for
unbiased and accurate estimates of LD (r2) across marker intervals
spanning < 1 kb to > 50 Mb.
Table S2 [See Additional file 5: Table S2] shows the average values of r2
estimated for all pairwise combinations of SNPs on each chromosome
and breed. The mean values of r2 pooled over all the autosomes were of
0.019±0.0008 for CIN and 0.021±0.0011 for MOD cattle breeds. García-
Gámez et al. [34], in a study on LD for Spanish Churra sheep, reported an
average r2 estimated for all pairwise combinations per chromosomes that
ranged from a 0.006 in OAR1 to 0.015 in OAR20. In some chromosomes,
the level of pairwise LD decreases quickly with physical distance
between SNPs; in particular, the highest values were observed for
chromosomes 13, 14 and 15 and for SNPs located in close proximity
(Figure 4.5). For SNPs up to 50 kb apart, the average r2 was 0.034 and
0.040 in CIN and MOD cattle breeds, respectively; for SNPs separated by
200-500 kb the average r2 was 0.020 and 0.024, and when SNPs are

99
separated by more than 500 kb, the average r2 was 0.019 and 0.022 (CIN
and MOD, respectively) (Table 4.4).
Table 4.4 Mean Linkage Disequilibrium (r2) among syntenic SNPs
over different map distances in Cinisara (CIN) and Modicana (MOD)
breeds.
Distance range (kb) r
2 (CIN) r
2 (MOD)
<50 0.034 0.040
50-100 0.027 0.033
100-200 0.022 0.027
200-500 0.020 0.024
>500 0.019 0.022
The surprising result was the low values of r2 observed for most
chromosomes, in which no change in r2
with the physical distance was
observed (Figure 4.5). The decay of LD in a genome determines the
power of QTL detection in association mapping studies and helps
determine the number of markers that are required for successful
association mapping and genomic selection. Meuwissen et al. [11], in a
simulation to predict genomic breeding values from dense markers across
the whole genome with accuracies up to 0.85, found a required r2 level of
0.2. Qanbari et al. [29] considered a threshold of 0.25 as a useful LD for
association studies. Therefore, these results support the use of more dense
SNP panels for a high power association mapping and genomic selection
efficiency in future breeding programs per CIN and MOD cattle breeds.

100
Figure 4.5 Distribution of r2 between syntenic SNP pairs on each
autosome as a function of physical distance in Modicana (a) and
Cinisara (b) cattle breeds.
The highest value of r2 estimated for each adjacent syntenic SNPs pair
and all pairwise combinations of SNPs was on chromosome 14 in both
breeds, which is in agreement with previous works in the species.
Different studies have identified causative mutations affecting variation in
milk production traits on bovine chromosome 14 [35]. Mai et al. [36]

101
detected 33 genome-wide QTL on BTA 14 for milk production traits;
Jiang et al. [37] showed 86 significant SNPs affecting milk production
traits, located within QTL regions on BTA14. Pryce et al. [38], in a
genome-wide association study for milk production traits on two dairy
cattle breeds, showed the largest effect on chromosome 14 where
important genes for milk production as DGAT1 and CYP11B1 are
mapped. The mutations in these genes have been found to have an effect
on milk production traits [36,39]. From this fact, it is possible to
hypothesize that the highest value of r2 found for BTA 14 in both breeds,
may be due to a selection made directly by the farmers to increase milk
production traits in an empirical way. In fact, as mentioned above, the
extent of LD can be affected by different factors, including the directional
selection.
The low levels of LD detected in CIN and MOD cattle breeds could be
explained by an effect of sampling method, given that individuals from
different farms have been included in each population, or ascertainment
bias, given that CIN and MOD cattle breeds did not participate in the
design of the chip. In addition, the possibility of crossbreeding with other
breeds in the past could have broken the patterns, showing lower levels of
LD than expected considering the values of inbreeding detected in these
populations.
4.4 Conclusion
This study has reported for the first time estimates of population structure,
levels of inbreeding and coancestry, and linkage disequilibrium from a
genome-wide perspective in Cinisara and Modicana cattle breeds. Our
results indicate that animals from the two breeds formed two different

102
clusters with some degree of gene exchange between them; the CIN breed
showing also certain introgression with Holstein genes. The high levels of
inbreeding and coancestry as well as the low Ne obtained in this study,
can compromise the viability of the populations and states the necessity of
implementing conservation programs to preserve these breeds. Avoiding
mating among relatives, i.e. minimize coancestry, is the strategy to
control the increase in inbreeding, and it is responsibility of all breeders to
participate in pedigree recording to perform the appropriate matings.
Regarding the results derived from LD analyses, a more in depth
investigation increasing sample size and performing technical replication
would be required if the aim is to perform QTL mapping studies, in order
to state the suitability of the Illumina Bovine SNP50K v2 BeadChip for
this task.
The information generated in this study has important implications from
an economic and scientific perspective, highlighting the necessity of
implementing a conservation program for these endangered
autochthonous breeds.

103
Competing interests
The authors declare that they have no competing interests.
Author’s contributions
SM, MS, BP and MSe conceived and designed the experiments. SM
drafted the manuscript. MS and MSe revised and helped to draft the
manuscript. SM, RDG and MTS carried out DNA extraction, purification
and analyses. SM, MT, MS and JS analyzed the data and performed the
statistical analysis. BP and MSe were the principal investigators that
organized the project. All authors contributed in refining the manuscript
and approved the final manuscript.
Acknowledgements
This research was financed by PON Ricerca e Competitività
PON01_02249, CUP: B11C11000430005 funded by MIUR

104
References
1. Sechi T, Usai MG, Miari S, Mura L, Casu S, Carta A: Identifying
native animals in crossbred populations: the case of the Sardinian
goat population. Anim Genet 2007, 38:614-620.
2. Boettcher PJ, Tixier-Boichard M, Toro MA, Simianer H, Eding H,
Gandini G, Joost S, Garcia D, Colli L, Ajmone-Marsan P, GLOBALDIV
Consortium: Objectives, criteria and methods for using molecular
genetic data in priority setting for conservation of animal genetic
resources. Anim Genet 2010, 41:64-77.
3. Frankham R, Ballou JD, Briscoe DA: Introduction to Conservation
Genetics. Cambridge: Cambridge University Press; 2002.
4. Wright S: Coefficients of inbreeding and relationship. Am Nat 1922,
56:330-338.
5. Tenesa A, Navarro P, Hayes BJ, Duffy DL, Clarke GM, Goddard ME,
Visscher PM: Recent human effective population size estimated from
linkage disequilibrium. Genome Res 2007, 17:520-526.
6. Villanueva B, Pong-Wong R, Woolliams JA, Avendaño S: Managing
genetic resources in selected and conserved populations. In Farm
Animal Genetic Resources Edited by Simm G, Villanueva B, Sinclair KD,
Townsend S. Nottingham: Nottingham University Press; 2004:113-132.
7. Allendorf FW, Hohenlohe PA, Luikart G: Genomics and the future of
conservation genetics. Nat Rev Genet 2010, 11:697-709.
8. Li MH, Strandén I, Tiirikka T, Sevón-Aimonen ML, Kantanen J: A
comparison of approaches to estimate the inbreeding coefficient and
pairwise relatedness using genomic and pedigree data in a sheep
population. PLoS ONE 2011, 6:e26256.

105
9. Matukumalli LK, Lawley CT, Schnabel RD, Taylor JF, Allan MF,
Heaton MP, O’Connell J, Moore SS, Smith TPL, Sonstegard TS, Van
Tassell CP: Development and Characterization of a High Density SNP
Genotyping Assay for Cattle. PLoS ONE 2009, 4: e5350.
10. Meuwissen THE, Goddard ME: Fine mapping of quantitative trait
loci using linkage disequilibrium with closely linked marker loci.
Genetics 2000, 155:421-430.
11. Meuwissen THE, Hayes BJ, Goddard ME: Prediction of total
genetic value using genome wide dense marker maps. Genetics 2001,
155:945-959.
12. Hayes BJ, Visscher PM, McPartlan HC, Goddard ME: Novel
multilocus measure of linkage disequilibrium to estimate past
effective population size. Genome Res 2003, 13:635-643.
13. Oldenbroek JK: Genebanks and the conservation of farm animal
genetic resources. Lelystad: DLO Institute for Animal Science and Health
Press; 1999.
14. Miller SA, Dykes DD, Polesky HF: A simple salting out procedure
for extracting DNA from human nucleated cells. Nucleic Acids Res
1988, 16:1215.
15. Pritchard JK, Stephens M, Donnelly P: Inference of population
structure using multilocus genotype data. Genetics 2000, 155:945-959.
16. Purcell S, Neale B, Todd-Brown K, Thomas L, Ferreira MA, Bender
D, Maller J, Sklar P, de Bakker PI, Daly MJ, Sham PC: PLINK: A tool
set for whole-genome association and population-based linkage
analyses. Am J Hum Genet 2007, 81:559-575.
106
17. R Development Core Team: R: A language and environment for
statistical computing. R Foundation for Statistical Computing. Vienna,
Austria. 2011. http://www.R-project.org
18. Malécot G: Les mathématiques de l´heredité. Paris: Masson and Cie
Press; 1948.
19. Barrett JC, Fry B, Maller J, Daly MJ: Haploview: analysis and
visualization of LD and haplotype maps. Bioinformatics 2005, 21:263-
265.
20. Di Stasio L: Indagine genetica sulle razze bovine Modicana e
Cinisara mediante l’analisi dei sistemi proteici del latte. Riv Zoot Vet
1983, 1:70-74.
21. Amador C, Jesús F, Meuwissen THE: Advantages of using
molecular coancestry in the removal of introgressed genetic material.
Genet Sel Evol 2013, 45:13.
22. Beghain J, Boitard S, Weiss B, Boussaha M, Gut I, Rocha D:
Genome wide linkage disequilibrium in the Blonde d’Aquitaine cattle
breed. J Anim Breed Genet 2012, 1-9.
23. Saura M, Fernández A, Varona L, Fernández AI, Toro MA,
Rodríguez MC, Barragán C, Villanueva B: Genome-wide estimates of
coancestry and inbreeding depression in an endangered strain of
Iberian pigs. In Book of Abstract of the 64nd
Annual Meeting of the
European Association for Animal Production (EAAP): 26-30August.
Nantes, France; 2013.
24. Jordana J, Ferrando A, Marmi J, Avellanet R, Aranguren-Méndez JA,
Goyache F: Molecular, genealogical and morphometric
characterisation of the Pallaresa, a Pyrenean relic cattle breed:
Insights for conservation. Livest Sci 2010, 132:65-72.
107
25. Ginja C, Penedo MCT, Sobral MF, Matos J, Borges C, Neves D,
Rangel-Figueiredo T, Cravador A: Molecular genetic analysis of a
cattle population to reconstitute the extinct Algarvia breed. Genet Sel
Evol 2010, 42:18.
26. Maretto F, Ramljak J, Sbarra F, Penasa M, Mantovani R, Ivankovic
A, Bittante G: Genetic relationships among Italian and Croatian
Podolian cattle breeds assessed by microsatellite markers. Livest Sci
2012, 150:256-264.
27. Bozzi R, Alvarez I, Crovetti A, Fernandez I, De Petris D, Goyache F:
Assessing priorities for conservation in Tuscan cattle breeds using
microsatellites. Animal 2012, 6:203-211.
28. Frankham R: Conservation Genetics. Annu Rev Genet 1995, 29:305-
327.
29. Qanbari S, Pimentel EC, Tetens J, Thaller G, Lichtner P, Sharifi AR,
Simianer H: The pattern of linkage disequilibrium in German
Holstein cattle. Anim Genet 2010, 41:346-356.
30. Bohmanova J, Sargolzaei M, Schenkel FS: Characteristics of
linkage disequilibrium in North American Holsteins. BMC Genomics
2010, 11:42.
31. Flury C, Tapio M, Sonstegard C, Drogemuller C, Leeb T, Simianer H,
Hanotte O, Rieder S: Effective population size of an indigenous Swiss
cattle breed estimated from linkage disequilibrium. J Anim Breed
Genet 2010, 127:339-347.
32. Zhou L, Ding X, Zhang Q, Wang Y, Lund MS, Su G: Consistency of
linkage disequilibrium between Chinese and Nordic Holsteins and
genomic prediction for Chinese Holsteins using a joint reference
population. Genet Sel Evol 2013, 45:7.
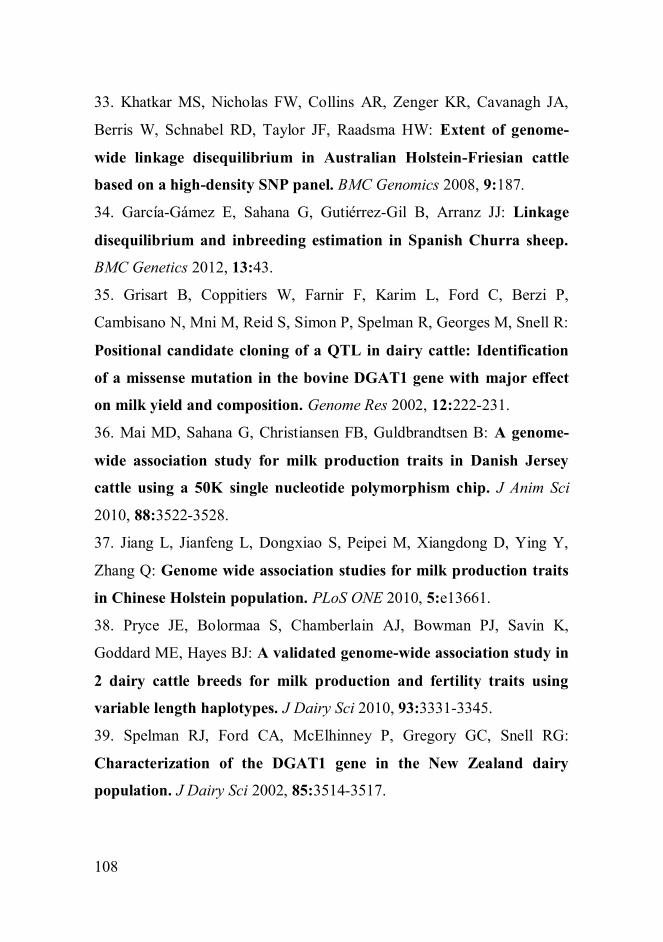
108
33. Khatkar MS, Nicholas FW, Collins AR, Zenger KR, Cavanagh JA,
Berris W, Schnabel RD, Taylor JF, Raadsma HW: Extent of genome-
wide linkage disequilibrium in Australian Holstein-Friesian cattle
based on a high-density SNP panel. BMC Genomics 2008, 9:187.
34. García-Gámez E, Sahana G, Gutiérrez-Gil B, Arranz JJ: Linkage
disequilibrium and inbreeding estimation in Spanish Churra sheep.
BMC Genetics 2012, 13:43.
35. Grisart B, Coppitiers W, Farnir F, Karim L, Ford C, Berzi P,
Cambisano N, Mni M, Reid S, Simon P, Spelman R, Georges M, Snell R:
Positional candidate cloning of a QTL in dairy cattle: Identification
of a missense mutation in the bovine DGAT1 gene with major effect
on milk yield and composition. Genome Res 2002, 12:222-231.
36. Mai MD, Sahana G, Christiansen FB, Guldbrandtsen B: A genome-
wide association study for milk production traits in Danish Jersey
cattle using a 50K single nucleotide polymorphism chip. J Anim Sci
2010, 88:3522-3528.
37. Jiang L, Jianfeng L, Dongxiao S, Peipei M, Xiangdong D, Ying Y,
Zhang Q: Genome wide association studies for milk production traits
in Chinese Holstein population. PLoS ONE 2010, 5:e13661.
38. Pryce JE, Bolormaa S, Chamberlain AJ, Bowman PJ, Savin K,
Goddard ME, Hayes BJ: A validated genome-wide association study in
2 dairy cattle breeds for milk production and fertility traits using
variable length haplotypes. J Dairy Sci 2010, 93:3331-3345.
39. Spelman RJ, Ford CA, McElhinney P, Gregory GC, Snell RG:
Characterization of the DGAT1 gene in the New Zealand dairy
population. J Dairy Sci 2002, 85:3514-3517.
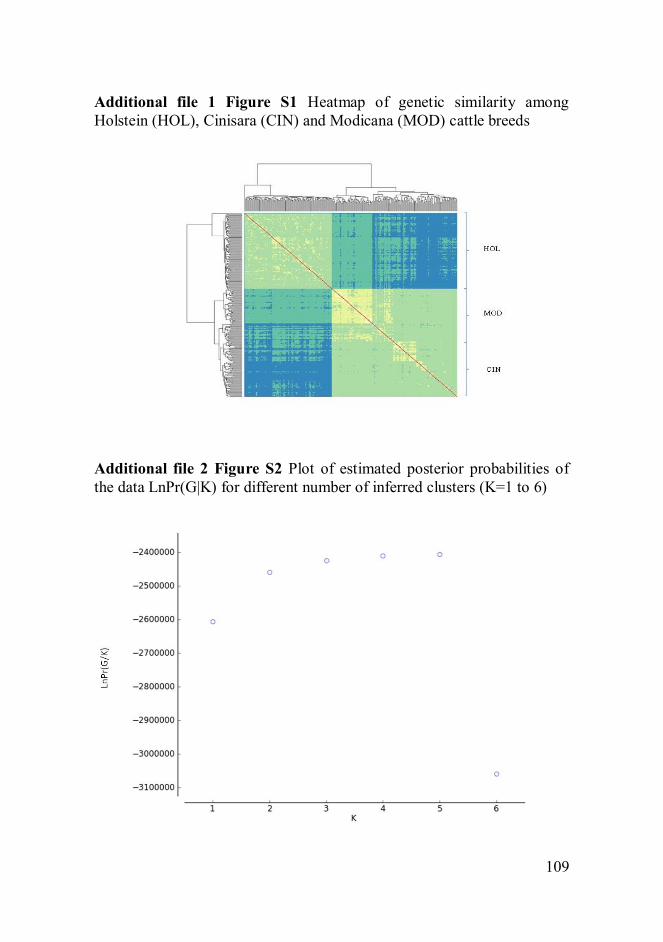
109
Additional file 1 Figure S1 Heatmap of genetic similarity among
Holstein (HOL), Cinisara (CIN) and Modicana (MOD) cattle breeds
Additional file 2 Figure S2 Plot of estimated posterior probabilities of
the data LnPr(G|K) for different number of inferred clusters (K=1 to 6)
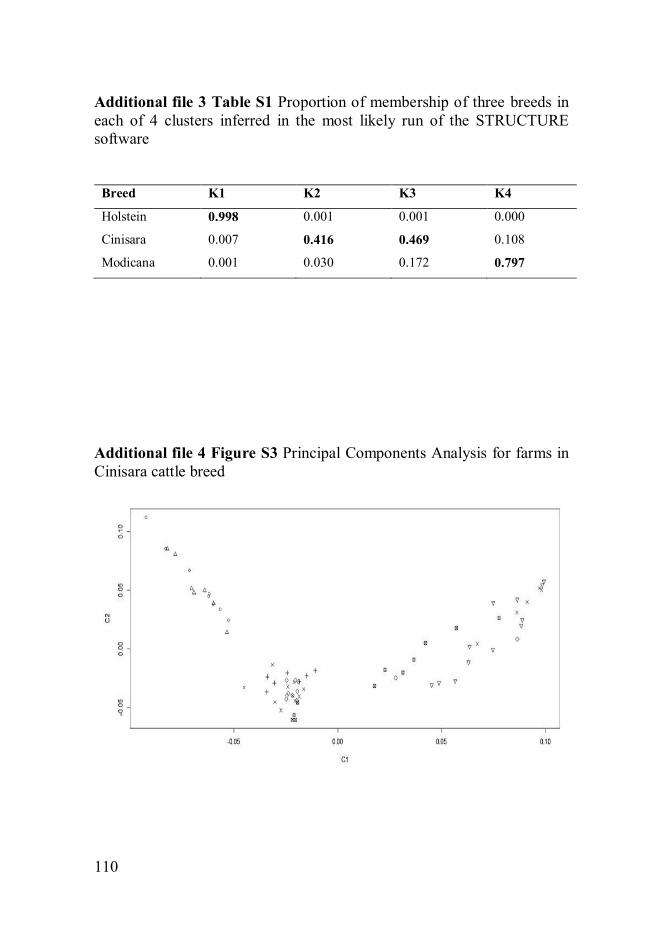
110
Additional file 3 Table S1 Proportion of membership of three breeds in
each of 4 clusters inferred in the most likely run of the STRUCTURE
software
Breed K1 K2 K3 K4
Holstein 0.998 0.001 0.001 0.000
Cinisara 0.007 0.416 0.469 0.108
Modicana 0.001 0.030 0.172 0.797
Additional file 4 Figure S3 Principal Components Analysis for farms in
Cinisara cattle breed

111
Additional file 5 Table S2 Average Linkage Disequilibrium (r2) for all
pairwise combinations of SNPs that were less than 50 Mb, on each
chromosome (Chr) in Cinisara (CIN) and Modicana (MOD) cattle breeds
Chr r2 ± SD (CIN) r
2 ± SD (MOD)
1 0.019±0.0005 0.021±0.0009
2 0.019±0.0004 0.021±0.0005
3 0.019±0.0005 0.020±0.0007
4 0.019±0.0005 0.021±0.0005
5 0.018±0.0005 0.021±0.0007
6 0.019±0.0005 0.021±0.0006
7 0.019±0.0007 0.021±0.0008
8 0.018±0.0005 0.021±0.0006
9 0.019±0.0006 0.021±0.0007
10 0.019±0.0009 0.021±0.0009
11 0.020±0.0025 0.022±0.0032
12 0.021±0.0042 0.026±0.0085
13 0.023±0.0084 0.028±0.0092
14 0.026±0.0129 0.035±0.0197
15 0.024±0.0102 0.032±0.0164
16 0.021±0.0107 0.025±0.0134
17 0.021±0.0097 0.024±0.0136
18 0.020±0.0039 0.022±0.0048
19 0.019±0.0008 0.020±0.0011
20 0.019±0.0009 0.021±0.0013
21 0.019±0.0006 0.020±0.0009
22 0.019±0.0008 0.021±0.0009
23 0.019±0.0009 0.021±0.0012
24 0.019±0.0008 0.021±0.0011
25 0.019±0.0008 0.021±0.0012
26 0.019±0.0008 0.022±0.0023
27 0.019±0.0010 0.021±0.0011
28 0.019±0.0008 0.020±0.0011
29 0.019±0.0008 0.021±0.0011


5
Genome wide linkage disequilibrium and genetic
diversity in three autochthonous Sicilian dairy
sheep breeds
S. Mastrangelo, R. Di Gerlando, L. Tortorici, M. Tolone, M. T. Sardina,
B. Portolano*
*Dipartimento di Scienze Agrarie e Forestali, Università degli Studi di
Palermo, Viale delle Scienze, 90128 Palermo, Italy
BMC Genetics (2013) Submitted
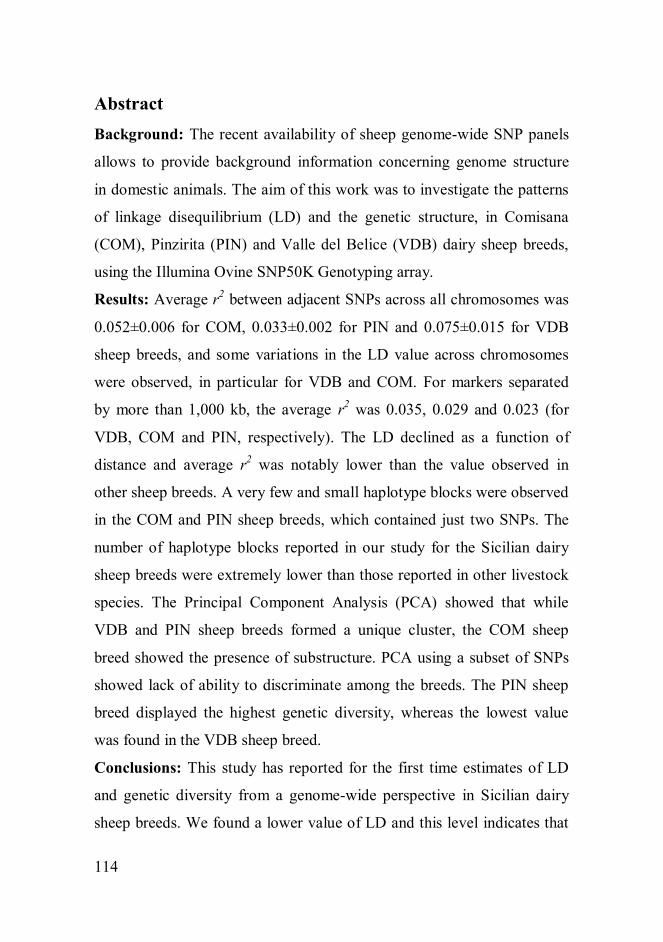
114
Abstract
Background: The recent availability of sheep genome-wide SNP panels
allows to provide background information concerning genome structure
in domestic animals. The aim of this work was to investigate the patterns
of linkage disequilibrium (LD) and the genetic structure, in Comisana
(COM), Pinzirita (PIN) and Valle del Belice (VDB) dairy sheep breeds,
using the Illumina Ovine SNP50K Genotyping array.
Results: Average r2 between adjacent SNPs across all chromosomes was
0.052±0.006 for COM, 0.033±0.002 for PIN and 0.075±0.015 for VDB
sheep breeds, and some variations in the LD value across chromosomes
were observed, in particular for VDB and COM. For markers separated
by more than 1,000 kb, the average r2 was 0.035, 0.029 and 0.023 (for
VDB, COM and PIN, respectively). The LD declined as a function of
distance and average r2 was notably lower than the value observed in
other sheep breeds. A very few and small haplotype blocks were observed
in the COM and PIN sheep breeds, which contained just two SNPs. The
number of haplotype blocks reported in our study for the Sicilian dairy
sheep breeds were extremely lower than those reported in other livestock
species. The Principal Component Analysis (PCA) showed that while
VDB and PIN sheep breeds formed a unique cluster, the COM sheep
breed showed the presence of substructure. PCA using a subset of SNPs
showed lack of ability to discriminate among the breeds. The PIN sheep
breed displayed the highest genetic diversity, whereas the lowest value
was found in the VDB sheep breed.
Conclusions: This study has reported for the first time estimates of LD
and genetic diversity from a genome-wide perspective in Sicilian dairy
sheep breeds. We found a lower value of LD and this level indicates that

115
the Illumina Ovine SNP50K genotyping array is not an optimum, and that
a denser SNP array is needed to capture more LD information. Our results
indicate that breeds formed non-overlapping clusters and are clearly
separated populations and that the COM sheep breed does not constitute a
homogenous population. The information generated from this study has
important implications for the design and applications of association
studies as well as for the development of selection breeding programs.
Keywords: OvineSNP50K BeadChip, Sicilian dairy sheep breeds,
Linkage Disequilibrium, genetic diversity

116
5.1 Background
The application of recently developed genomic technology, as high-
density single nucleotide polymorphism (SNP) arrays, has great potential
to increase our understanding on the genetic architecture of complex
traits, to improve selection efficiency in domestic animals through
genomic selection [1] and to conduct association studies [2]. However, to
optimally plan whole-genome association studies, it is crucial to know the
extent of linkage disequilibrium (LD), the non-random association of
alleles at different loci in the genome. In fact, the extent of LD is often
used to determine the optimal number of markers required for fine
mapping of quantitative trait loci (QTL) [3], for genomic selection [4],
and to understand the evolutionary history of the populations [5]. Species
with extensive LD will require fewer markers than those with low levels
of LD. Moreover, for high-resolution association mapping, it is necessary
to identify block-like structures of haplotypes and a minimal set of SNPs
that capture the most common haplotypes of each block [6]. Construction
of haplotype blocks and identification of tag SNPs have been found to be
quite informative in identification of specific markers for association
mapping in humans [7]. With this in mind, it is important to quantify the
extent of LD within different breeds as this is likely to have an impact on
the success of gene mapping experiments [8]. Moreover, knowledge
concerning the extent of genetic diversity, as the level of inbreeding and
population structure is critical for each of these applications [9]. In local
breeds, maintaining genetic variability is an important requirement for
animal breeding strategies; this guarantees selection response to
productive and adaptive traits improvement, to cope with new
environmental conditions, changes in market demands, husbandry

117
practices and disease challenges [10]. Currently, with the availability of
high-density SNP arrays, genetic diversity can be estimated accurately in
the absence of pedigree information [11]. In Sicily, dairy sheep
production represents an important resource for hilly and mountain areas
economy, in which other economic activities are limited [12]. Sheep milk
is mainly used for the production of traditional raw milk cheeses,
sometimes protected designation of origin (PDO) cheeses as laid down in
the European Union legislation. In some cases, the quality of these dairy
products is linked to a specific breed, i.e. mono-breed labeled cheeses and
therefore, it is important to be able to distinguish the milk of a breed from
that of others, in order to guarantee the consumers and to safeguard the
breed itself [13]. Nowadays, three native dairy sheep breeds are reared in
Sicily: Comisana (COM), Pinzirita (PIN), and Valle del Belice (VDB).
These breeds present differences both in morphology and production
traits, showing excellent adaptability to local environments. The aim of
this study was to estimate genome wide levels of LD and the genetic
diversity in three Sicilian dairy sheep breeds using high density
genotyping arrays.
5.2 Results and discussion
In the present study, we used the OvineSNP50K Genotyping BeadChip to
characterize LD and to analyze genetic diversity in the Sicilian dairy
sheep breeds.
Out of a total of 54,241 SNPs genotyped in this study, 378 were
unmapped and 1,450 were located on sex chromosomes. Thus, 52,413
SNPs mapped onto the 26 sheep autosomes were used in the following
described analyses. After screening, the final number of samples and
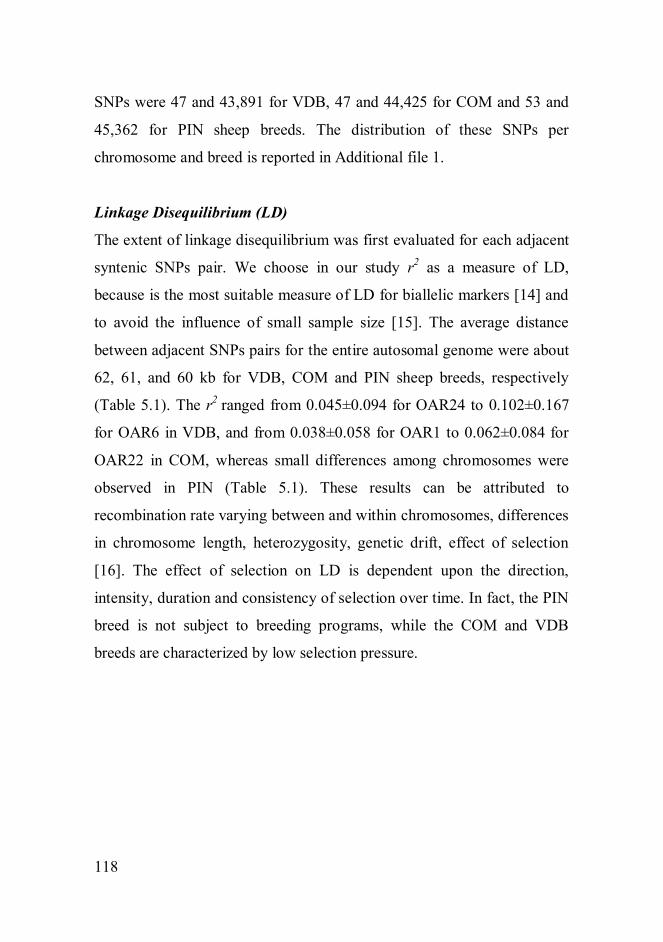
118
SNPs were 47 and 43,891 for VDB, 47 and 44,425 for COM and 53 and
45,362 for PIN sheep breeds. The distribution of these SNPs per
chromosome and breed is reported in Additional file 1.
Linkage Disequilibrium (LD)
The extent of linkage disequilibrium was first evaluated for each adjacent
syntenic SNPs pair. We choose in our study r2 as a measure of LD,
because is the most suitable measure of LD for biallelic markers [14] and
to avoid the influence of small sample size [15]. The average distance
between adjacent SNPs pairs for the entire autosomal genome were about
62, 61, and 60 kb for VDB, COM and PIN sheep breeds, respectively
(Table 5.1). The r2
ranged from 0.045±0.094 for OAR24 to 0.102±0.167
for OAR6 in VDB, and from 0.038±0.058 for OAR1 to 0.062±0.084 for
OAR22 in COM, whereas small differences among chromosomes were
observed in PIN (Table 5.1). These results can be attributed to
recombination rate varying between and within chromosomes, differences
in chromosome length, heterozygosity, genetic drift, effect of selection
[16]. The effect of selection on LD is dependent upon the direction,
intensity, duration and consistency of selection over time. In fact, the PIN
breed is not subject to breeding programs, while the COM and VDB
breeds are characterized by low selection pressure.
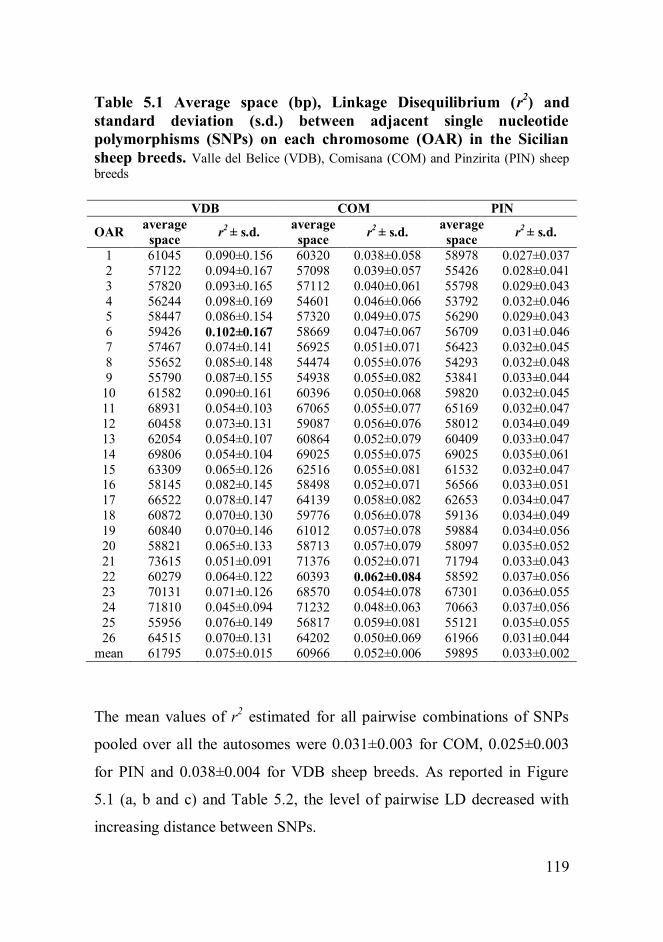
119
Table 5.1 Average space (bp), Linkage Disequilibrium (r2) and
standard deviation (s.d.) between adjacent single nucleotide
polymorphisms (SNPs) on each chromosome (OAR) in the Sicilian
sheep breeds. Valle del Belice (VDB), Comisana (COM) and Pinzirita (PIN) sheep
breeds VDB COM PIN
OAR average
space r
2 ± s.d.
average
space r
2 ± s.d.
average
space r
2 ± s.d.
1 61045 0.090±0.156 60320 0.038±0.058 58978 0.027±0.037
2 57122 0.094±0.167 57098 0.039±0.057 55426 0.028±0.041
3 57820 0.093±0.165 57112 0.040±0.061 55798 0.029±0.043
4 56244 0.098±0.169 54601 0.046±0.066 53792 0.032±0.046 5 58447 0.086±0.154 57320 0.049±0.075 56290 0.029±0.043
6 59426 0.102±0.167 58669 0.047±0.067 56709 0.031±0.046
7 57467 0.074±0.141 56925 0.051±0.071 56423 0.032±0.045
8 55652 0.085±0.148 54474 0.055±0.076 54293 0.032±0.048
9 55790 0.087±0.155 54938 0.055±0.082 53841 0.033±0.044
10 61582 0.090±0.161 60396 0.050±0.068 59820 0.032±0.045
11 68931 0.054±0.103 67065 0.055±0.077 65169 0.032±0.047
12 60458 0.073±0.131 59087 0.056±0.076 58012 0.034±0.049
13 62054 0.054±0.107 60864 0.052±0.079 60409 0.033±0.047
14 69806 0.054±0.104 69025 0.055±0.075 69025 0.035±0.061
15 63309 0.065±0.126 62516 0.055±0.081 61532 0.032±0.047 16 58145 0.082±0.145 58498 0.052±0.071 56566 0.033±0.051
17 66522 0.078±0.147 64139 0.058±0.082 62653 0.034±0.047
18 60872 0.070±0.130 59776 0.056±0.078 59136 0.034±0.049
19 60840 0.070±0.146 61012 0.057±0.078 59884 0.034±0.056
20 58821 0.065±0.133 58713 0.057±0.079 58097 0.035±0.052
21 73615 0.051±0.091 71376 0.052±0.071 71794 0.033±0.043
22 60279 0.064±0.122 60393 0.062±0.084 58592 0.037±0.056
23 70131 0.071±0.126 68570 0.054±0.078 67301 0.036±0.055
24 71810 0.045±0.094 71232 0.048±0.063 70663 0.037±0.056
25 55956 0.076±0.149 56817 0.059±0.081 55121 0.035±0.055
26 64515 0.070±0.131 64202 0.050±0.069 61966 0.031±0.044
mean 61795 0.075±0.015 60966 0.052±0.006 59895 0.033±0.002
The mean values of r2 estimated for all pairwise combinations of SNPs
pooled over all the autosomes were 0.031±0.003 for COM, 0.025±0.003
for PIN and 0.038±0.004 for VDB sheep breeds. As reported in Figure
5.1 (a, b and c) and Table 5.2, the level of pairwise LD decreased with
increasing distance between SNPs.
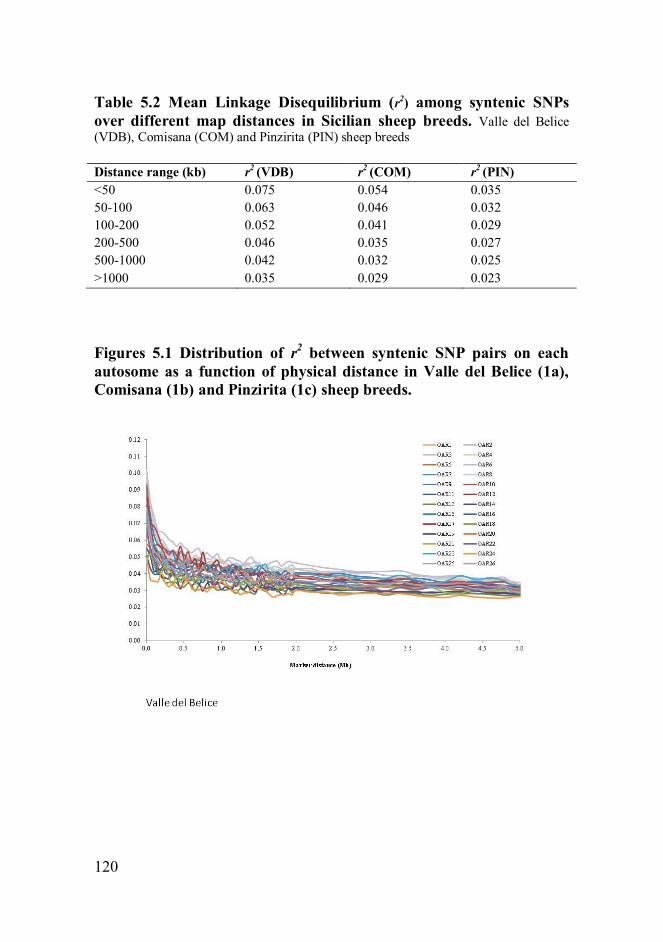
120
Table 5.2 Mean Linkage Disequilibrium (r2) among syntenic SNPs
over different map distances in Sicilian sheep breeds. Valle del Belice
(VDB), Comisana (COM) and Pinzirita (PIN) sheep breeds Distance range (kb) r
2 (VDB) r
2 (COM) r
2 (PIN)
<50 0.075 0.054 0.035
50-100 0.063 0.046 0.032
100-200 0.052 0.041 0.029
200-500 0.046 0.035 0.027
500-1000 0.042 0.032 0.025
>1000 0.035 0.029 0.023
Figures 5.1 Distribution of r2 between syntenic SNP pairs on each
autosome as a function of physical distance in Valle del Belice (1a),
Comisana (1b) and Pinzirita (1c) sheep breeds.

121
For SNPs up to 50 kb apart, the average r2 was 0.075, 0.054, and 0.035,
for SNPs separated by 200-500 kb the average r2 was 0.046, 0.035, and
0.027, and when SNPs were separated by more than 1,000 kb, the average
r2 was 0.035, 0.029 and 0.023 in VDB, COM and PIN sheep breeds,
122
respectively. The comparison of LD levels obtained in different studies is
not straightforward, because of differences in several factors as sample
size, type of LD measures (D or r2), marker types (microsatellite or
SNP), marker density and distribution, and population demography [16].
Moreover, so far, results of the extent of LD have been reported for sheep
breeds under selection, and there is little knowledge about the degree of
genome-wide LD in local sheep breeds. García-Gámez et al. [1] in a study
on LD in Spanish Churra sheep reported an average r2 estimated for all
pairwise combinations per chromosomes that ranged from 0.006 in OAR1
to 0.015 in OAR20. Usai et al. [17] in a study of LD in a sample of Sarda
rams showed higher value, with an average r2 value over 1,000 kb of
0.072. Previous studies in five populations of domestic sheep based on
microsatellite markers [8] and for wild sheep based on dense panel of
SNPs [18] showed LD extend over long distance. The level of r2 for
adjacent syntenic SNPs pair and all pairwise combinations of SNPs in the
Sicilian sheep breeds was notably lower than the values observed in other
livestock species as pig [19,20], cattle [16,21], and horse [22,23]. This
can be explained considering the intensive artificial selection to which
commercial animal breeding populations have been subjected for many
generations and the ensuing reduction in effective population size.
The number of haplotype blocks and the number of SNPs captured by the
blocks for each chromosome in each breed are shown in Table 5.3. Our
results for average LD within chromosome and breed are in agreement
with the block structure across the genome. In fact, VDB sheep breed had
the highest number of blocks, whereas the PIN sheep breed had the lowest
one. The major goal of using haplotype block is to capture most of
genetic variation with a small number of SNPs characterizing the block.

123
Table 5.3 Number of blocks and number of SNPs per block on each
chromosome (OAR) in the Sicilian sheep breeds. Valle del Belice (VDB),
Comisana (COM) and Pinzirita (PIN) sheep breeds
VDB COM PIN
OAR Number
of blocks
Number of
SNPs in
blocks
Number
of blocks
Number of
SNPs in
blocks
Number
of blocks
Number of
SNPs in
blocks
1 22 51 2 4 -- --
2 14 32 -- -- 1 2
3 16 38 -- -- 1 2
4 10 24 -- -- -- --
5 4 8 3 6 -- --
6 9 24 1 2 -- --
7 6 12 -- -- -- --
8 2 4 -- -- 1 2
9 11 24 2 4 -- --
10 7 23 -- -- -- --
11 1 2 -- -- -- --
12 8 16 -- -- -- -- 13 -- -- -- -- -- --
14 1 2 -- -- 1 3
15 2 4 2 4 1 2
16 4 11 -- -- -- --
17 6 19 1 2 -- --
18 -- -- -- -- -- --
19 2 6 1 2 -- --
20 1 2 -- -- -- --
21 -- -- 1 2 -- --
22 1 2 -- -- -- --
23 1 2 2 4 1 2 24 1 2 -- -- -- --
25 2 4 -- -- -- --
26 1 2 -- -- -- --
Tot 132 314 15 30 6 13
In addition, the use of low density panels for genomic selection is of
interest. A very few and small blocks were observed in the COM and PIN
sheep breeds, which contained just two SNPs. The number of haplotype
blocks reported in our study for the Sicilian dairy sheep breeds (132 for
VDB, 15 for COM and 6 for PIN breeds) (Table 5.3) were extremely
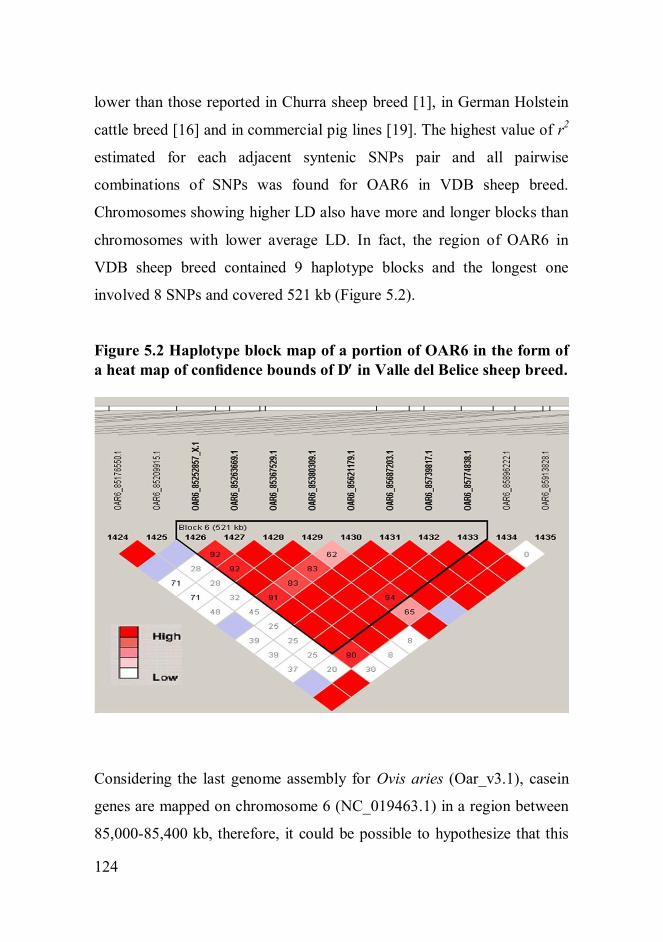
124
lower than those reported in Churra sheep breed [1], in German Holstein
cattle breed [16] and in commercial pig lines [19]. The highest value of r2
estimated for each adjacent syntenic SNPs pair and all pairwise
combinations of SNPs was found for OAR6 in VDB sheep breed.
Chromosomes showing higher LD also have more and longer blocks than
chromosomes with lower average LD. In fact, the region of OAR6 in
VDB sheep breed contained 9 haplotype blocks and the longest one
involved 8 SNPs and covered 521 kb (Figure 5.2).
Figure 5.2 Haplotype block map of a portion of OAR6 in the form of
a heat map of confidence bounds of D in Valle del Belice sheep breed.
Considering the last genome assembly for Ovis aries (Oar_v3.1), casein
genes are mapped on chromosome 6 (NC_019463.1) in a region between
85,000-85,400 kb, therefore, it could be possible to hypothesize that this

125
haplotype block is involved within this region. Moreover, the highest
value of r2 found for OAR6 in VDB sheep breed, may be due to selection
made directly by the farmers to increase milk production traits in an
empirical way. In fact, as mentioned above, the extent of LD can be
affected by different factors including the directional selection. The decay
of LD in a genome determines the power of QTL detection in association
mapping studies and helps to determine the number of markers required
for successful association mapping and genomic selection. Meuwissen et
al. [4], in a simulation to predict genomic breeding values from dense
markers across the whole genome with accuracies up to 0.85, found a
required r2 level of 0.2. Qanbari et al. [16] considered r
2 threshold of 0.25
as a useful LD value for association studies. Therefore, these results
support the need to use more dense SNP panels for high power
association mapping and genomic selection efficiency in future breeding
programs for Sicilian dairy sheep breeds.
Genetic diversity
Principal Component Analysis (PCA) was used to visualize the genetic
relationships among the Sicilian sheep breeds. Genotypes from additional
19 animals of another Italian sheep breed were included in the analysis
and considered as outliers (OUT). A total of 44,610 SNPs shared among
all breeds were analyzed. The PCA showed that the four sheep breeds
formed non-overlapping clusters and are clearly separated populations.
While for VDB, PIN and OUT sheep breeds, the two components (PCA1
and PCA2) clustered animals from the same breed together, the COM
sheep breed showed two groups (Figure 5.3). The function Heatmap of
genetic similarity corroborated the findings obtained with the PCA.
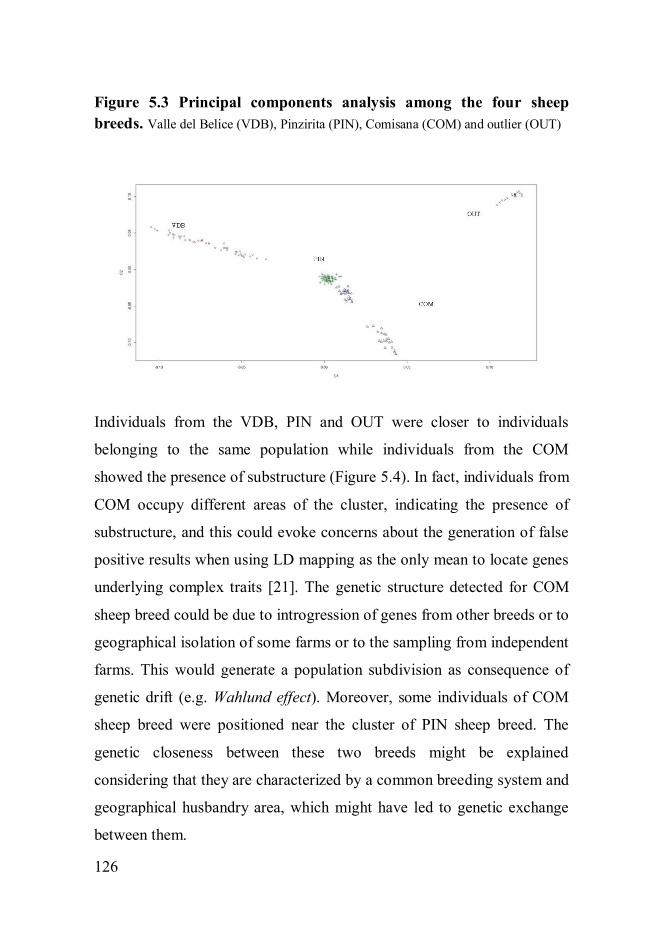
126
Figure 5.3 Principal components analysis among the four sheep
breeds. Valle del Belice (VDB), Pinzirita (PIN), Comisana (COM) and outlier (OUT)
Individuals from the VDB, PIN and OUT were closer to individuals
belonging to the same population while individuals from the COM
showed the presence of substructure (Figure 5.4). In fact, individuals from
COM occupy different areas of the cluster, indicating the presence of
substructure, and this could evoke concerns about the generation of false
positive results when using LD mapping as the only mean to locate genes
underlying complex traits [21]. The genetic structure detected for COM
sheep breed could be due to introgression of genes from other breeds or to
geographical isolation of some farms or to the sampling from independent
farms. This would generate a population subdivision as consequence of
genetic drift (e.g. Wahlund effect). Moreover, some individuals of COM
sheep breed were positioned near the cluster of PIN sheep breed. The
genetic closeness between these two breeds might be explained
considering that they are characterized by a common breeding system and
geographical husbandry area, which might have led to genetic exchange
between them.

127
Figure 5.4 Heatmap of genetic similarity among the four sheep
breeds. Valle del Belice (VDB), Pinzirita (PIN), Comisana (COM) and outlier (OUT)
The relative contribution of SNP to population assignment was estimated.
In fact, high throughput genotyping tools make it possible to extract
interesting genetic information from animal populations that could be
applied to identify useful markers for breed allocation, assignment
parentage [24] and for tracing the geographic origin of animal products
[9] as meat and mono-breed cheese. Among the 44,610 SNPs, a subset of
119 SNPs was used to evaluate their ability to cluster individuals
belonging to the Sicilian sheep breeds. These SNPs were selected
considering their informativeness in pair comparisons that means SNPs
with the larger allele frequency differences between the pairs of breeds
were chosen (fixed alleles in one breed and MAF > 0.25 in the other
breeds). PCA using this subset of SNPs showed lack of ability to
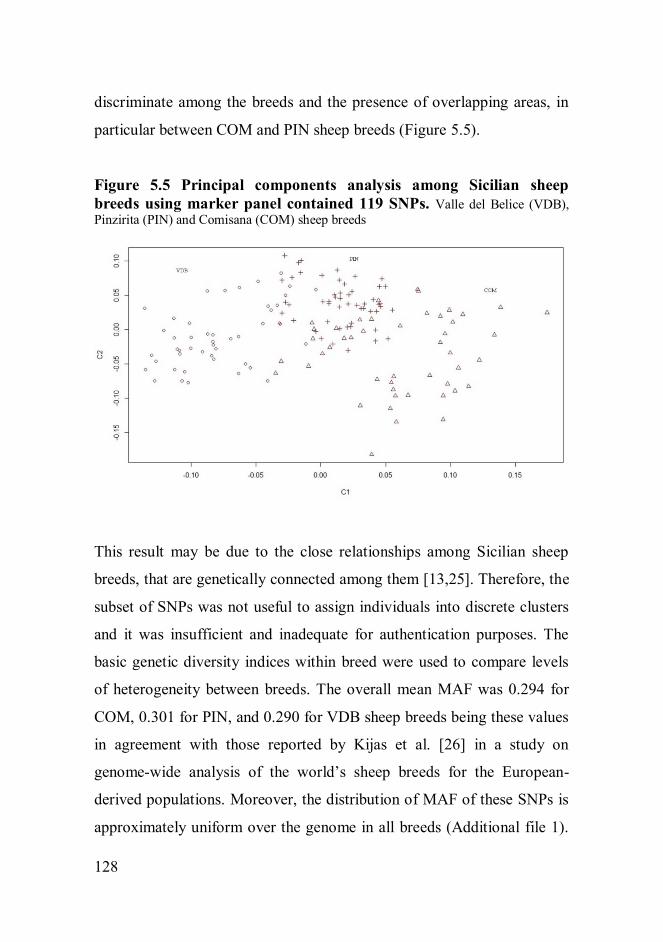
128
discriminate among the breeds and the presence of overlapping areas, in
particular between COM and PIN sheep breeds (Figure 5.5).
Figure 5.5 Principal components analysis among Sicilian sheep
breeds using marker panel contained 119 SNPs. Valle del Belice (VDB),
Pinzirita (PIN) and Comisana (COM) sheep breeds
This result may be due to the close relationships among Sicilian sheep
breeds, that are genetically connected among them [13,25]. Therefore, the
subset of SNPs was not useful to assign individuals into discrete clusters
and it was insufficient and inadequate for authentication purposes. The
basic genetic diversity indices within breed were used to compare levels
of heterogeneity between breeds. The overall mean MAF was 0.294 for
COM, 0.301 for PIN, and 0.290 for VDB sheep breeds being these values
in agreement with those reported by Kijas et al. [26] in a study on
genome-wide analysis of the world’s sheep breeds for the European-
derived populations. Moreover, the distribution of MAF of these SNPs is
approximately uniform over the genome in all breeds (Additional file 1).

129
The PIN sheep breed displayed the highest gene diversity (He
0.390±0.108), whereas the lowest value was found in the VDB sheep
breed (He 0.379±0.155) (Table 5.4).
Table 5.4 Estimates of genetic diversity indices for Sicilian sheep
breeds. Average minor allele frequency (MAF), observed heterozygosity (Ho),
expected heterozygosity (He), Inbreeding coefficient (F), and standard deviation (s.d.) Breeds MAF±s.d. Ho±s.d. He±s.d. F±s.d.
Valle del Belice 0.290±0.003 0.364±0.126 0.379±0.155 0.055±0.150
Comisana 0.294±0.004 0.382±0.129 0.382±0.114 0.016±0.031
Pinzirita 0.301±0.004 0.388±0.122 0.390±0.108 0.025±0.042
These estimates of gene diversity are comparable to those reported by
other authors for Southern and Mediterranean European sheep breeds
[26]. Similar results for genetic diversity (Ho, He, and MAF) were
reported for Sarda sheep breed [17]. We obtained some negative values
for inbreeding coefficient F, which corresponded to animals with lower
homozygosity than the average population. The highest F, calculated for
each individual based upon observed and expected heterozygosity, was
found in VDB sheep breed (0.055±0.150), whereas the lowest value in
COM sheep breed. The low level of inbreeding and high genetic diversity
in PIN sheep breed, but also in COM, reflect the short extent of LD.
5.3 Conclusions
This study reported for the first time the estimates of linkage
disequilibrium and genetic diversity from a genome-wide perspective in
Sicilian dairy sheep breeds. Knowledge concerning the behavior of LD is

130
important for performing genomic selection and genome wide association
analysis. We found lower values of LD in our breeds compared to others
and this indicates that the Illumina Ovine SNP50K genotyping array is
not an optimum, and that a denser SNP array is needed to capture more
LD information. Our results indicated that Sicilian sheep breeds formed
non-overlapping clusters and are clearly separated populations and that
the COM sheep breed does not constitute a homogenous population. The
information generated from this study has important implications for the
design and applications of association studies as well as for the
development of conservation and/or selection breeding programs.
5.5 Methods
DNA sampling and genotyping
A total of 149 unrelated animals collected from several farms in different
areas of Sicily were used for the analysis. The number of animal sampled
per flock ranged from 3 to 5. Samples consisted of 48 Comisana (COM),
53 Pinzirita (PIN) and 48 Valle del Belice (VDB) animals. For these
sheep breeds pedigree data are not available. About 10 ml of blood was
collected from jugular vein using tubes with EDTA as anticoagulant.
Genomic DNA was extracted from buffy coats of nucleated cells using
salting out method [27]. The concentration of extracted DNA was
assessed with the NanoDrop ND-1000 spectrophotometer (NanoDrop
Technologies, Wilmington, DE).
All animals were genotyped for 54,241 SNPs, using the Illumina
OvineSNP50K Genotyping BeadChip, and following the standard
operating procedures recommended by the manufacturer. Raw signal
intensities were converted into genotype calls using the Illumina
131
GenomeStudio Genotyping Module v1.0 software (Illumina Inc., San
Diego, CA) by applying a no-call threshold of 0.15. Genotyping data
were initially tested for quality using the same software. The markers
were filtered to exclude loci assigned to unmapped contigs. Only SNPs
located on autosomes were considered in further analyses. Moreover,
quality control included: Call Frequency (proportion of samples with
genotype at each locus) ≥ 0.95, Gen Train Score (quality of the probe that
determines the shape and separation of clusters) > 0.70, minor allele
frequency (MAF) ≥ 0.05, and Hardy-Weinberg Equilibrium (HWE) P-
value >0.001. SNPs that did not satisfy these quality criteria were
discarded.
Linkage Disequilibrium
A standard descriptive Linkage Disequilibrium parameter, the squared
correlation coefficient of allele frequencies at a pair of loci (r2),
was used
as measure. Pairwise LD between adjacent SNPs was calculated on each
chromosome using PLINK [28]. Moreover, r2
was estimated for all
pairwise combinations of SNPs using LD plot function in Haploview v4.2
software [7], exporting data to text files. For each chromosome, pairwise
r2
was calculated for SNPs between 0 and 50 Mb apart. To visualize the
LD pattern per chromosome, r2 values were stacked and plotted as a
function of inter-marker distance categories. Average r2 for SNP pairs in
each interval was estimated as the arithmetic mean of all r2. Haploview
v4.2 software [7] was also used to define the haplotype blocks present in
the genome. The method followed for blocks definition was previously
described by Gabriel et al. [29]. This algorithm considers that a pair of
132
SNPs is in strong LD when the upper 95% confidence bound of D’ is
between 0.70 and 0.98.
Genetic diversity
The genetic relationship between individuals was examined by Principal
Component Analysis (PCA) of genetic distance. First, the average
proportion of alleles shared between animals (As) was calculated as
IBS2+0.5*IBS1/N, where IBS1 and IBS2 are the number of loci that
share either one or two alleles identical by state (IBS), respectively, and N
is the number of loci tested. Genetic distance (D) was calculated as 1-As.
These values were calculated using PLINK [28] through the use of
commands -cluster and -distance matrix. PCA of the D matrix was
performed using the multidimensional scaling (MDS) algorithm of
pairwise genetic distance implemented in PLINK. It should be noted that
when MDS is applied to D matrix, it is numerically identical to PCA [28].
The graphical representation was depicted using the statistical R software
(R Development Core Team) with R-Color package. The same software
was used to visualize the IBS matrix using the Heatmap function. PLINK
[27] was also used to estimate the basic genetic diversity indices,
including observed and expected heterozygosity (Ho and He,
respectively), average MAF and the coefficient of inbreeding (F) for each
breed. Files used for basic diversity indices (Ho, He and F) were pruned
in PLINK considering 50 SNPs per windows, a shift of 10 SNPs between
windows and a variation inflation factor’s threshold of 1.5.
133
Competing interests
The authors have no competing to declare.
Authors’ contributions
SM, MTS and BP conceived and designed the experiments. SM drafted
the manuscript. RDG and LT carried out DNA extraction, purification
and analyses. SM, MTS and MT analyzed the data and performed the
statistical analysis. All authors contributed to editing of the article and
approved the final manuscript.
Acknowledgements
This research was financed by PON Ricerca e Competitività
PON01_02249, CUP: B11C11000430005 funded by MIUR.

134
References
1. García-Gámez E, Sahana G, Gutiérrez-Gil B, Arranz JJ: Linkage
disequilibrium and inbreeding estimation in Spanish Churra sheep.
BMC Genet 2012, 13:43.
2. Karlsson EK, Baranowska I, Wade CM et al: Efficient mapping of
mendelian traits in dogs through genome-wide association. Nat Genet
2007, 39:1321-1328.
3. Meuwissen THE, Goddard ME: Fine mapping of quantitative trait
loci using linkage disequilibrium with closely linked marker loci.
Genetics 2000, 155:421-430.
4. Meuwissen THE, Hayes BJ, Goddard ME: Prediction of total genetic
value using genome wide dense marker maps. Genetics 2001, 155:945-
959.
5. Hayes BJ, Visscher PM, McPartlan HC, Goddard ME: Novel
multilocus measure of linkage disequilibrium to estimate past
effective population size. Genome Res 2003, 13:635-643.
6. Johnson GC, Esposito L, Barratt BJ, Smith AN, Heward J, Di Genova
G, Ueda H, Cordell
HJ, Eaves
IA, Dudbridge
F, Twells
RCJ, Payne
F,
Hughes W, Nutland
S, Stevens
H, Carr
P, Tuomilehto-Wolf
E, Tuomilehto
J, Gough SCL, Clayton
DG, John A. Todd
JA: Haplotype tagging for the
identification of common disease genes. Nat Genet 2001, 29:233-237.
7. Barrett JC, Fry B, Maller J, Daly MJ: Haploview: analysis and
visualization of LD and haplotype maps. Bioinformatics 2005, 21:263-
265.
8. Meadows JRS, Chan EKF, Kijas JW: Linkage disequilibrium
compared between five populations of domestic sheep. BMC Genet
2008, 9:61.

135
9. Kijas JW, Townley D, Dalrymple BP, Heaton MP, Maddox JF, et al.:
A Genome Wide Survey of SNP Variation Reveals the Genetic
Structure of Sheep Breeds. PLoS ONE 2009, 4(3): e4668.
10. Boettcher PJ, Tixier-Boichard M, Toro MA, Simianer H, Eding H,
Gandini G, Joost S, Garcia D, Colli L, Ajmone-Marsan P, GLOBALDIV
Consortium: Objectives, criteria and methods for using molecular
genetic data in priority setting for conservation of animal genetic
resources. Anim Genet 2010, 41:64-77.
11. Li MH, Strandén I, Tiirikka T, Sevón-Aimonen ML, Kantanen J: A
comparison of approaches to estimate the inbreeding coefficient and
pairwise relatedness using genomic and pedigree data in a sheep
population. PLoS ONE 2011, 6:e26256.
12. Scintu MF, Piredda G: Typicity and biodiversity of goat and sheep
milk products. Small Rumin Res 2007, 68:221-231.
13. Tolone M, Mastrangelo S, Rosa AJM, Portolano B: Genetic diversity
and population structure of Sicilian sheep breeds using microsatellite
markers. Small Rumin Res 2012, 102:18-25.
14. Zhao H, Nettleton D, Dekkers JCM: Evaluation of linkage
disequilibrium measures between multi-allelic markers as predictors
of linkage disequilibrium between single nucleotide polymorphisms.
Genet Res 2007, 89:1-6.
15. Khatkar MS, Nicholas FW, Collins AR, Zenger KR, Cavanagh JA,
Berris W, Schnabel RD, Taylor JF, Raadsma HW: Extent of genome-
wide linkage disequilibrium in Australian Holstein-Friesian cattle
based on a high-density SNP panel. BMC Genomics 2008, 9:187.
136
16. Qanbari S, Pimentel EC, Tetens J, Thaller G, Lichtner P, Sharifi AR,
Simianer H: The pattern of linkage disequilibrium in German
Holstein cattle. Anim Genet 2010, 41:346-356.
17. Usai MG, Sechi T, Salaris S, Cubeddu T, Roggio T, Casu S, Carta A:
Analysis of a representative sample of Sarda breed artificial
insemination rams with the OvineSNP50 BeadChip. In Proceedings of
37th International Committee for Animal Recording (ICAR) Biennial
Session: 31st May-4
th June 2010; Riga, Latvia. Edited by Skujina E.,
Galvanoska E., Leray O., Mosconi C.; 2010:7-10.
18. Miller JM, Poissant J, Kijas JW, Coltman DW, international sheep
genomics consortium: A genome-wide set of SNP detects population
substructure and long range linkage disequilibrium in wild sheep.
Mol Ecol Resour 2010, 11:314-322.
19. Veroneze R, Lopes PS, Guimaraes SEF, Silva FF, Lopes MS,
Harlizius B, Knol EF: Linkage disequilibrium and haplotype block
structure in six commercial pig lines. J Anim Sci 2013, 91(8):3493-
3501.
20. Uimari P, Tapio M: Extent of linkage disequilibrium and effective
population size in Finnish Landrace and Finnish Yorkshire pig
breeds. J Anim Sci 2011, 89(3):609-614.
21. Beghain J, Boitard S, Weiss B, Boussaha M, Gut I, Rocha D:
Genome wide linkage disequilibrium in the Blonde d’Aquitaine cattle
breed. J Anim Breed Genet 2013, 130(4):294-302.
22. Corbin LJ, Blott SC, Swinburne JE, Vaudin M, Bishop SC,
Woolliams JA: Linkage disequilibrium and historical effective
population size in the Thoroughbred horse. Anim Genet 2010, 41(2):8-
15.

137
23. McCue ME, Bannasch DL, Petersen JL, Gurr J, Bailey E, et al: A
High Density SNP Array for the Domestic Horse and Extant
Perissodactyla: Utility for Association Mapping, Genetic Diversity,
and Phylogeny Studies. PLoS Genet 2012, 8(1): e1002451.
24. Fisher PJ, Malthus B, Walker MC, Corbett G, Spelman RJ: The
number of single nucleotide polymorphisms and on-farm data
required for whole-herd parentage testing in dairy cattle herds. J
Dairy Sci 2009, 92:369-374.
25. Mastrangelo S, Sardina MT, Riggio V, Portolano B: Study of
polymorphisms in the promoter region of ovine b-lactoglobulin gene
and phylogenetic analysis among the Valle del Belice breed and other
sheep breeds considered as ancestors. Mol Biol Rep 2012, 39:745-751
26. Kijas JW, Lenstra JA, Hayes B, Boitard S, Porto Neto LR, et al:
Genome-Wide Analysis of the world’s sheep breeds reveals high
levels of historic mixture and strong recent selection. Plos Biology
2012, 10(2):e1001258.
26. Miller SA, Dykes DD, Polesky HF: A simple salting out procedure
for extracting DNA from human nucleated cells. Nucleic Acids Res
1988, 16:1215.
27. Purcell S, Neale B, Todd-Brown K, Thomas L, Ferreira MA, Bender
D, Maller J, Sklar P, de Bakker PI, Daly MJ, Sham PC: PLINK: A tool
set for whole-genome association and population-based linkage
analyses. Am J Hum Genet 2007, 81:559-575.
28. Gabriel SB, Schaffner SF, Nguyen H, Moore JM, Roy J, Blumenstiel
B, Higgins J, De Felice M, Lochner A, Faggart M, Liu-Cordero SN,
Rotimi C, Adeyemo A, Cooper R, Ward R, Lander ES, Daly MJ,

138
Altshuler D: The structure of haplotype blocks in the human genome.
Science 2002, 296(5576):2225-2229.

139
Addiotional file 1 Table S1 Average MAF (Minor Allele Frequency)
per chromosome (OAR) and number of SNPs (N°) that passed quality
control in the Sicilian sheep breeds. Valle del Belice (VDB), Comisana (COM)
and Pinzirita (PIN) sheep breeds
VDB COM PIN
OAR MAF N° MAF N° MAF N°
1 0.292 4908 0.295 4967 0.299 5080
2 0.289 4607 0.291 4609 0.297 4748
3 0.286 4196 0.290 4248 0.295 4348
4 0.289 2261 0.291 2239 0.304 2364
5 0.291 1985 0.293 2024 0.297 2061
6 0.287 2117 0.291 2200 0.298 2276
7 0.298 1892 0.288 1910 0.299 1927
8 0.293 1798 0.297 1796 0.304 1802
9 0.284 1806 0.296 1834 0.307 1873
10 0.289 1529 0.291 1559 0.300 1574
11 0.286 991 0.288 998 0.301 1027
12 0.294 1424 0.284 1457 0.302 1484
13 0.291 1433 0.292 1461 0.303 1472
14 0.292 985 0.295 997 0.303 997
15 0.288 1420 0.296 1438 0.306 1461
16 0.288 1326 0.302 1318 0.303 1363
17 0.293 1179 0.297 1224 0.304 1253
18 0.290 1177 0.296 1203 0.301 1216
19 0.291 1066 0.295 1063 0.295 1083
20 0.295 937 0.295 944 0.302 954
21 0.296 750 0.291 772 0.309 769
22 0.289 912 0.294 912 0.299 940
23 0.283 945 0.298 967 0.294 986
24 0.292 617 0.292 662 0.311 627
25 0.288 859 0.297 846 0.300 872
26 0.290 771 0.302 777 0.301 805
0.290 43891 0.294 44425 0.301 45362

6
General Conclusions

142
New technologies in molecular genetics and innovative approaches in
data analysis have increased the number of available neutral markers,
providing tools to assess and to estimate population genetic diversity and
structure in order to improve the prioritization of animals for conservation
purposes. The genetic diversity is directly and positively related with
population size, and the effect of genetic drift is strong in isolated and
small populations, as in certain local Sicilian breeds. This thesis reported
the use of molecular markers, such as microsatellites and SNPs, for
genetic characterization studies of local Sicilian sheep and cattle breeds.
In fact, genetic data represent an objective tool to reliably assess genetic
diversity and population structure, migration and admixture. Several
methods as Bayesian analysis, genetic diversity indexes, Factorial
Correspondence Analysis, Neighbor-Joining dendrogram, and Principal
Component Analysis were used to assess genetic relationship and
population structure in local sheep (Barbaresca, Comisana, Pinzirita, and
Valle del Belice) and cattle (Cinisara and Modicana) breeds.
In Chapter 3, the genetic diversity indexes estimated with SNPs of BLG
promoter region, revealed high genetic variability within Sicilian sheep
breeds. Our results revealed the highest value of genetic diversity between
Valle del Belice and Pinzirita sheep breeds and the lowest one between
Valle del Belice and Sarda sheep breeds. Considering that polymorphisms
in the promoter region of BLG gene could have a functional role
associated with milk composition, the lowest value of nucleotide diversity
between Valle del Belice and Sarda sheep breeds may be related to a
higher similarity of milk composition of these two breeds compared to the
others. However, at present literature does not present any evidence about
that.

143
It is assumed that the availability of a higher number of genetic markers
implies higher precision in genetic diversity analysis. We observed
similar results between the genetic structure computed with 20
microsatellites (Chapter 3) and with ~44,000 SNPs (Chapter 5) in the
Sicilian sheep breeds, in particular for genetic distance among breeds and
for genetic diversity within breed. The results showed a close relationship
between Comisana and Pinzirita sheep breeds and highest genetic
diversity in Pinzirita sheep breed. The assignment test indicated that the
molecular markers can be reliably use to assign animals to their
population/breeds of origin. Moreover, this study at individual level is
interesting since it makes possible to detect potential sampling errors and
admixed individual. The relative contribution of SNP to population
assignment, estimated using a subset of 119 SNPs, instead, showed lack
of ability to discriminate among the breeds and the presence of
overlapping areas, due to the close relationships among Sicilian sheep
breeds, that are genetically connected among them (Chapter 5).
Linkage disequilibrium (LD) was evaluated for each adjacent syntenic
SNPs pair and for all pairwise combinations of SNPs on each
chromosome in Sicilian cattle and sheep breeds (Chapters 4 and 5). Our
results showed a lower values of LD in Sicilian cattle and sheep breeds,
compared to others breeds. Moreover, for the Sicilian sheep breeds, few
and small haplotype blocks were observed. These results can be explained
considering: i) the low artificial selection to which local breeds have been
subjected, because the selection pressure affect the genomic variability of
regions under selection; ii) ascertainment bias, given that, except for
Comisana sheep breed, the Sicilian cattle and sheep breeds did not
participate in the design of the chip. This indicates that the Illumina
144
genotyping arrays are not an optimum and that a denser SNP array is
needed to capture more LD information.
For the Cinisara and Modicana cattle breeds, this thesis has reported for
the first time, estimates of population structure, levels of coancestry and
inbreeding from a genome wide perspective. Principal Components
Analysis and Bayesian clustering algorithm showed that animals from the
two breeds formed non-overlapping clusters and are clearly separated
populations; in particular, the Modicana was the most differentiated
population, whereas the Cinisara animals showed a lowest value of
assignment, the presence of substructure and genetic links occurred
between them. The levels of inbreeding and Ne point out the necessity of
establishing a conservation program for these autochthonous breeds. The
control of molecular inbreeding and coancestry would restrict inbreeding
depression, the probability of losing beneficial rare alleles, and therefore
the risk of extinction.
The information generated from this thesis has important implications for
the design and applications of association studies as well as for the
development of conservation and/or selection breeding programs for the
Sicilian cattle and sheep breeds.

145
Ringraziamenti
Comincio col ringraziare il Prof. Portolano, che ha supervisionato il mio
lavoro di tesi con grande professionalità, collaborazione e disponibilità,
per tutti i consigli che mi ha dato e soprattutto per la fiducia mostratami.
Un grazie particolare va anche alla Dott.ssa Sardina, o meglio, a Ciupy,
con la quale ho mosso i primi passi in laboratorio, insegnandomi le
tecniche che si sono rese necessarie per lo sviluppo della mia attività di
ricerca, supportandomi e “sopportandomi” con pazienza e dedizione;
ringrazio il Dott. Marco Tolone, per la preziosa collaborazione, il
supporto datomi nella realizzazione delle attività e per il tempo passato
insieme. Ad entrambi mi legano tantissimi e bellissimi ricordi.
Un grazie a tutti i colleghi del Dipartimento SAF.
Grazie a tutto lo staff dell’INIA di Madrid, per l’ospitalità dimostratami e
per la grande disponibilità.
Il ringraziamento più grande va ai miei genitori, per avermi sempre
sostenuto, per tutti i loro sacrifici e per quello che mi hanno insegnato, e a
Cinzia, per tutto quello che ha fatto e continua a fare per me.


147
List of publications
Peer reviewed pubblications
S. Mastrangelo, M.T. Sardina, V. Riggio, B. Portolano (2012).
Study of polymorphisms in the promoter region of ovine b-
lactoglobulin gene and phylogenetic analysis among the Valle del
Belice breed and other sheep breeds considered as ancestors.
Molecular Biology Reports 39: 745-751.
M. Tolone, S. Mastrangelo, A.J.M. Rosa, B. Portolano (2012).
Genetic diversity and population structure of Sicilian sheep breeds
using microsatellite markers. Small Ruminant Research 102: 18–
25.
S. Mastrangelo, M.T. Sardina, M. Tolone, B. Portolano (2013).
Genetic polymorphism at the CSN1S1 gene in Girgentana dairy
goat breed. Animal Production Science 53: 403:406.
M. Tolone, S. Mastrangelo, M.T. Sardina, B. Portolano (2013).
Effect of hairless gene polymorphism on the breeding values of
milk production traits in Valle del Belice dairy sheep. Livestock
Science 154: 60-63.
A.J.M. Rosa, M.T. Sardina, S. Mastrangelo, M. Tolone, B.
Portolano (2013). Parentage verification of Valle del Belice dairy
sheep using multiplex microsatellite panel. Small Ruminant
Research 113: 62– 65.
S. Mastrangelo, M. Tolone, M.T. Sardina, R. Di Gerlando, B.
Portolano (2013). Genetic characterization of the Mascaruna goat,
a Sicilian autochthonous population, using molecular markers.
African Journal of Biotechnology 12: 3758-3767.
M. Palmeri, S. Mastrangelo, M.T. Sardina, B. Portolano (2013).
Genetic variability at s2-casein (CSN1S2) gene in Girgentana
dairy goat breed. Italian Journal of Animal Science. In press.
Papers under review or in preparation
S. Mastrangelo, M. Saura, M. Tolone, J. Salces, R. Di Gerlando,
M.T. Sardina, M. Serrano, B. Portolano (2014). Genome wide
structure in indigenous Sicilian cattle breeds. In preparation
S. Mastrangelo, R. Di Gerlando, L. Tortorici, M. Tolone, M.T.
Sardina M, B. Portolano (2013). Genome wide linkage
148
disequilibrium and genetic diversity in three Sicilian dairy sheep
breeds. BMC Genetics.
R. Di Gerlando, L. Tortorici, M.T. Sardina, S. Mastrangelo, G.
Monteleone, B. Portolano (2013). Molecular characterization of κ-
casein (CSN3) gene in Girgentana dairy goat breed and
identification of two new alleles. Animal Production Science.
M. Montalbano, L.Tortorici, S. Mastrangelo, M.T. Sardina, B.
Portolano (2013). Development and validation of RP-HPLC
method for the quantitative estimation of alpha s1-genetic variants
in goat milk. Food Chemistry.
M. Montalbano, R. Segreto, R. Di Gerlando, S. Mastrangelo,
M.T. Sardina (2014). Quantitative determination of casein genetic
variants in milk of Girgentana dairy goat breed. International
Dairy Journal.
Conference proceedings
S. Mastrangelo, M. Tolone, M.T. Sardina, M. Serrano, B.
Portolano (2013). Linkage disequilibrium and genetic diversity in
two sicilian cattle breeds assessed by bovine Snp Chip. In: Book of
Abstracts LXVII Convegno Nazionale S.I.S.Vet, Società Italiana
delle Scienze Veterinarie, Brescia, 17-19 settembre. Abstract. p.
240, ISBN: 978-88-909092-0-7.
R. Segreto, F. Gulli, M. Montalbano, S. Mastrangelo, B.
Portolano (2013). Association between the polymorphism at
casein loci and milk fatty acid composition in Girgentana goats.
In: Book of Abstracts LXVII Convegno Nazionale S.I.S.Vet,
Società Italiana delle Scienze Veterinarie, , Brescia, 17-19
settembre. Abstract. p. 243, ISBN: 978-88-909092-0-7.
G. Monteleone, S. Mastrangelo, M.T. Sardina, G. Gallo (2013).
Proteomics for milk proteins characterization in Girgentana goat
breed. In: Proceedings 20th
congress ASPA, Bologna 10-12
giugno, Italy, vol. 12: S1.
M. Montalbano, R. Segreto, F. Gulli, S. Mastrangelo, M. Tolone,
B. Portolano (2013). Quantification of genetic variants of caseins
in milk of Girgentana goat breed. In: Proceedings 20th
congress
ASPA, Bologna 10-12 giugno, Italy, vol. 12: S1.
M. Montalbano, L. Tortorici, S. Mastrangelo, B. Portolano
(2012). Preliminary study on quantification of αs1-casein variants
in Girgentana goat breed by direct chromatographic analysis of

149
milk. In: Book of Abstracts, XXIII Congresso della Divisione di
Chimica Analitica della Società Chimica Italiana, Isola d’Elba 16-
20 settembre, Italy, p 83. ISBN: 978‐88‐907670‐8‐1.
S. Mastrangelo, M. Tolone, M.T. Sardina, B. Portolano (2012).
Caratterizzazione genetica mediante microsatelliti di una
popolazione caprina siciliana. XX Congresso Nazionale
S.I.P.A.O.C., Siracusa 26 - 29 Settembre 2012.
S. Mastrangelo, M. T. Sardina, V. Riggio (2011). Genetic
diversity and phylogenetic relationships among four breeds reared
in Sicily using β-lactoglobulin promoter region polymorphisms.
In: Proceedings 19th
congress ASPA, Cremona 7-10 giugno, Italy,
vol. 10: S1.
M. Tolone, S. Mastrangelo, B. Portolano (2011). Genetic
structure and assignment test in five sheep breeds reared in Sicily
using microsatellites. In: Proceedings 19th
congress ASPA,
Cremona 7-10 giugno, Italy, vol. 10: S1.