UNIVERSITÀ DEGLI STUDI DI PADOVA - CORE · UNIVERSITÀ DEGLI STUDI DI PADOVA ... dai...
113
UNIVERSITÀ DEGLI STUDI DI PADOVA Sede Amministrativa: Università degli Studi di Padova Dipartimento di Biologia SCUOLA DI DOTTORATO DI RICERCA IN: BIOLOGIA E MEDICINA DELLA RIGENERAZIONE INDIRIZZO: BIOLOGIA DELL’INTEGRAZIONE INTERCELLULARE CICLO XXV Effects of egg enrichment with glucocorticoid hormone, antagonist and receptor messenger in the modulation of gene expression in zebrafish (Danio rerio) embryos with transgenerational follow up till adulthood Direttore della Scuola: Prof.ssa Maria Teresa Conconi Coordinatore d’indirizzo: Dott.ssa Luisa Dalla Valle Supervisore: Prof. Lorenzo Colombo Correlatore: Dott.ssa Luisa Dalla Valle Dottorando: Md. Golam Rabbane Febbraio 2013
Transcript of UNIVERSITÀ DEGLI STUDI DI PADOVA - CORE · UNIVERSITÀ DEGLI STUDI DI PADOVA ... dai...

UNIVERSITÀ DEGLI STUDI DI PADOVA
Sede Amministrativa: Università degli Studi di Padova
Dipartimento di Biologia
SCUOLA DI DOTTORATO DI RICERCA IN: BIOLOGIA E MEDICINA
DELLA RIGENERAZIONE
INDIRIZZO: BIOLOGIA DELL’INTEGRAZIONE INTERCELLULARE
CICLO XXV
Effects of egg enrichment with glucocorticoid hormone, antagonist and receptor
messenger in the modulation of gene expression in zebrafish (Danio rerio) embryos
with transgenerational follow up till adulthood
Direttore della Scuola: Prof.ssa Maria Teresa Conconi
Coordinatore d’indirizzo: Dott.ssa Luisa Dalla Valle
Supervisore: Prof. Lorenzo Colombo
Correlatore: Dott.ssa Luisa Dalla Valle
Dottorando: Md. Golam Rabbane
Febbraio 2013


i
CONTENTS
SUMMARY....................................................................................................................
RIASSUNTO..................................................................................................................
INTRODUCTION.........................................................................................................
1. Zebrafish as a model organism ............................................................................
2. Zebrafish embryogenesis and organogenesis.......................................................
3. Antisense techniques in developmental biology..................................................
4. Morpholino-based screening in zebrafish............................................................
5. Hypothalamus-pituitary-interrenal (HPI) axis and stress response in fish...........
6. Cortisol actions ....................................................................................................
7. Zebrafish as a model for stress research ..............................................................
8. Glucocorticoids and the glucocorticoid receptor in zebrafish research................
9. Impact of stress on fish reproduction...................................................................
10. Impact of perinatal stress on the cortisol..............................................................
11. Maternal hormones in fish oocytes......................................................................
12. Objectives of the study.........................................................................................
MATERIALS AND METHODS...................................................................................
13. Zebrafish Maintenance........................................................................................
13.1. Sources.....................................................................................................
13.2. Housing and care......................................................................................
13.3. Lighting....................................................................................................
13.4. Temperature.............................................................................................
13.5. Water quality...........................................................................................
13.6. Catching and handling.............................................................................
13.7. Feeding....................................................................................................
14. Breeding of F0 brood stock for embryo studies...................................................
15. Reagents for egg treatment..................................................................................
16. Eggs treatment with cortisol................................................................................
17. Treatment termination.........................................................................................
18. Embryo development of the F1 progeny.............................................................
19. Breeding of F0 fish for sampling of F1 juveniles and adults..............................
20. Juvenile and adult development of the F1 progeny..............................................
21. Testing of puberty onset......................................................................................
1
3
5
5
7
11
13
14
16
17
18
20
23
24
26
27
27
27
27
27
27
28
28
28
28
29
29
30
30
30
30
31
ii
22. Cortisol extractions and radioimmunoassay (RIA)..............................................
23. Production of second (F2), third (F3) and fourth (F4) generations .....................
24. Length and weight measurement.........................................................................
25. RNA Isolation.......................................................................................................
25.1. Procedure.................................................................................................
26. Agarose gel electrophoresis.................................................................................
27. Quantification of total RNA................................................................................
28. Purification of extracted RNA with LiCl precipitation for microarray
hybridization .............................................................................................................
29. Reverse transcription of RNA..............................................................................
30. Amplification of DNA by Polymerase Chain Reaction (PCR)...........................
31. Touchdown PCR..................................................................................................
32. Purification of PCR product by ExoSAP-IT®.....................................................
33. DNA sequencing..................................................................................................
34. Cloning..........................................................................................................
34.1. Ligation...................................................................................................
34.2. Bacterial transformation...........................................................................
34.3. Identification of positive colonies by PCR .............................................
34.4. Purification of plasmidic DNA (Miniprep)..............................................
35. Quantitative Real-Time Polymerase Chain Reaction (qPCR)............................
35.1. Absolute quantification...........................................................................
35.2. Relative quantification.............................................................................
36. Two-color Microarray Hybridization ................................................................
36.1. RNA quality control for microarray hybridization..................................
36.2. Sample preparation, hybridization and microarray wash........................
36.3. Scanning, feature extraction and data analysis........................................
37. Morpholino microinjection of fertilized eggs......................................................
38. Preparation of the needles....................................................................................
39. Preparation of z-gr RNA.....................................................................................
40. Statistical analysis................................................................................................
41. Abbreviations ......................................................................................................
RESULTS.......................................................................................................................
42. Cortisol immunoassay..........................................................................................
31
31
32
32
32
33
33
34
34
35
36
37
38
38
38
40
40
41
42
42
43
46
47
47
48
49
49
50
53
54
57
57

iii
43. Microarray analysis of the effect of cortisol hormone on gene expression..........
43.1. RNA quality control..................................................................................
43.2. cRNA quantification and incorporation of cyanine.................................
43.3. Scanning and microarray data analysis.....................................................
43.4. Interpretation of microarray results.........................................................
44. Analysis of gene expression by qPCR................................................................
44.1. Relative qPCR..........................................................................................
44.2. Analysis of mRNA expression by absolute qPCR...................................
45. Morphological effects..........................................................................................
46. Length measurement............................................................................................
47. Weight measurement...........................................................................................
48. Analysis of puberty onset.....................................................................................
DISCUSSION.................................................................................................................
REFERENCES..............................................................................................................
57
58
58
59
61
69
69
73
76
78
80
84
86
95

iv

1
SUMMARY
This study is relevant to the recent field of investigation on the genetic programming of embryo
development by maternal glucocorticoid and its receptor messenger with lasting influences on
subsequent life stages. This research has been undertaken with an articulate experimental design
supported by an ample repertoire of biomolecular techniques, ranging from whole-genome
microarray to relative and absolute qPCRs of glucocorticoid-dependent up- and down-regulated
genes. I have found that cortisol enrichment of newly fertilized eggs by immersion in a solution
of the steroid (13 M) for 2 h brings about significant up-regulation of 100 genes with no down-
regulation at 5 h post-fertilization (hpf), when only maternal cortisol is available to the embryo.
At 12 hpf, 143 genes were up-regulated and 6 down-regulated with only 30 genes in common
with those at 5 hpf, indicating that substantial changes in responsiveness to maternal cortisol may
occur at early developmental phases. At 24 hpf, responsiveness to cortisol was enlarged to
hundreds of genes. Subsequently, I analyzed by relative qPCR seven target genes during
development, observing a significant decrement of expression from 10 to 24 hpf of both vasp
and plp1a genes, when ef1α was used as a calibration reference. Moreover, four genes that were
up-regulated at 5 hpf (mat1a, notch2, parn and stmn2a), were no longer so at 20 hpf.
The work has been extended to the analysis of cortisol-induced changes in the expression of two
target genes, igf-2a and casp8. It was demonstrated that the expression of igf-2a was
significantly enhanced by egg microinjection with the zebrafish glucocorticoid receptor mRNA
(z-gr mRNA), and more so by z-gr mRNA plus cortisol at 5 hpf and, to a lesser extent, at 10 hpf.
This is of interest since igf-2a is considered as a major growth factor during embryogenesis. A
stimulatory response was obtained also with casp8 at 5 hpf with both treatments, with a non-
significant decrement at 10 hpf. Using absolute qPCR, I confirmed an expression enhancement
of casp8 transcription by z-gr mRNA w/wo cortisol at 5 hpf, which was depressed by both the
glucocorticoid antagonist RU486 and the z-gr mRNA translation knockdown by morpholino.
Surprisingly, at 10 hpf, the latter negative modulations were reversed. The complexity of
glucocorticoid action on embryonic gene expression was highlighted also by absolute qPCR of
another gene, mcm6, whose transcripts were significantly increased by both cortisol and RU486
when administered alone, but decreased when in combination with z-gr mRNA at both 5 and 10
hpf.
Further, I examined in details the effects of the above treatments on larval survival after hatching
(3 days pf) and undertook a study on the influence of cortisol enrichment of fertilized eggs on
fish growth till 180 days of age by comparing a lineage in which the treatment was repeated
along four generations (F1-F4) with another lineage acting as an untreated control. Since both

2
lineages were homozygous for different colour patterns, they could be co-cultured, thus
eliminating any differential environmental influence. This experiment was intended to determine
whether exposure of early embryos to cortisol exerts a permanent imprinting on subsequent body
growth and to elucidate the transgenerational pattern of this epigenetic modulation. Through
statistical analysis, I established greater growth in cortisol-treated F1 and F2 from 120 to 180 dpf
in terms of length and body weight. But, in F3 and F4, the difference in length disappeared,
while that in body weight was somehow reversed. This seems to suggest that the priming effect
was compensated rather than intensified along generations, as if a sort of adaptation has occurred.

3
RIASSUNTO
Questo studio è rilevante dal momento che recenti ricerche si sono concentrate sul ruolo svolto
dai glucocorticoidi di origine materna e dai messaggeri codificanti per il loro recettore nella
programmazione genetica dello sviluppo embrionale, con particolare attenzione alle fasi di vita
successive. Tale ricerca è stata effettuata seguendo un articolato disegno sperimentale supportato
dall’utilizzo di molteplici tecniche biomolecolari, quali, ad esempio, il microarray e la real time
PCR sia relativa che assoluta. E’stato dimostrato che l’arricchimento delle uova di zebrafish
appena fecondate con cortisolo, mediante immersione per 2 ore in una soluzione 13 M dello
steroide, provoca una significativa up-regolazione di 100 geni a 5 ore dopo la fecondazione
(hpf), quando nell’embrione è presente solo il cortisolo di origine materna. Nessun gene è
risultato invece down-regolato allo stesso stadio di sviluppo. A 12 hpf, 143 geni sono risultati
up-regolati e 6 down-regolati, con solo 30 geni in comune con l’esperimento delle 5 hpf: questo
indica che probabilmente nelle fasi precoci di sviluppo embrionale avvengono dei cambiamenti
sostanziali nella risposta al cortisolo materno. A 24 hpf la risposta al cortisolo interessa centinaia
di geni. Successivamente ho analizzato mediante real time PCR relativa sette geni bersaglio dei
glucocorticoidi durante lo sviluppo, osservando una significativa diminuzione dell’espressione
dalle 10 alle 24 hpf dei geni vasp e plp1a, con ef1α come “gene housekeeping”. Inoltre ho
dimostrato che quattro geni, precedentemente risultati up-regolati a 5 hpf (mat1a, notch2, parn e
stmn2a), non risultano più sovraespressi a 20 hpf.
Successivamente ho esteso l’analisi anche ai cambiamenti indotti dal cortisolo sull’espressione
dei geni target igf-2a e casp8. In particolare ho potuto dimostrare che l’espressione di igf-2a
aumenta significativamente in seguito alla microiniezione delle uova con il messaggero
codificante per il recettore dei glucocorticoidi di zebrafish (z-gr mRNA), e più ancora se alla
microiniezione viene abbinato il trattamento con cortisolo. Questo è stato dimostrato a 5 hpf e, in
misura minore, anche a 10 hpf. Questo dato è interessante dal momento che igf-2a viene
considerato il principale fattore di crescita durante l’embriogenesi. Un aumento di espressione è
stato ottenuto anche per il gene casp8 con entrambi i trattamenti a 5 hpf, mentre a 10 hpf c’è una
diminuzione di espressione non significativa. Mediante real time PCR assoluta ho confermato
l’aumento di trascrizione del gene casp8 a 5 hpf successivamente alla microiniezione con z-gr
mRNA, indipendentemente dall’aggiunta di cortisolo; una diminuzione di espressione è stata
invece ottenuta sia con l’utilizzo dell’antagonista dei glucocorticoidi RU486, sia dopo
silenziamento del recettore tramite microiniezione con morfolino. Sorprendentemente, a 10 hpf,
le modulazioni che erano risultate precedentemente negative hanno avuto un’inversione di
tendenza.

4
La complessità dell’azione dei glucocorticoidi sull’espressione genica durante lo sviluppo
embrionale è stata messa in evidenza anche dall’esperimento di real time PCR assoluta per il
gene mcm6, i cui trascritti sono risultati notevolmente aumentati sia dopo trattamento con
cortisolo che con RU486, quando questi reagenti sono stati utilizzati da soli; una diminuzione dei
trascritti è stata invece osservata per entrambi i reagenti, sia a 5 hpf che a 10 hpf, quando sono
stati impiegati contemporaneamente alla microiniezione con z-gr mRNA.
Ho poi esaminato in dettaglio gli effetti di tutti i trattamenti descritti precedentemente sulla
sopravvivenza delle larve dopo la schiusa (3 giorni pf) ed ho condotto uno studio sull’influenza
dell’arricchimento con cortisolo sulla crescita dello zebrafish, effettuando misurazioni ad
intervalli di tempo definiti, fino ai 180 giorni pf. L’analisi è stata fatta comparando una linea in
cui il trattamento con cortisolo è stato ripetuto per quattro generazioni successive (F1- F4) con
un’altra utilizzata come controllo non trattato. Poichè entrambe le linee erano omozigoti per
differenti pattern di colorazione si è potuto anche allevarle assieme, eliminando ogni possibile
influenza ambientale. Lo scopo dell’esperimento era determinare se l’esposizione dell’embrione
al cortisolo, a stadi di sviluppo precoci, esercitasse un’influenza permanente sulla crescita ed
inoltre spiegare il pattern transgenerazionale di tale modulazione epigenetica. Attraverso analisi
statistica ho dimostrato che c’è una maggiore crescita nei trattati con cortisolo delle generazioni
F1 e F2 dai 120 ai 180 giorni pf in termini di lunghezza e peso corporeo. Nelle generazioni F3 e
F4 scompaiono le differenze di lunghezza rispetto ai controlli, mentre il peso corporeo risulta
addirittura diminuito. Questi risultati sembrano suggerire che l’effetto iniziale del trattamento
viene compensato, e non intensificato, nel corso delle generazioni, come se avvenisse una sorta
di adattamento.

Introduction
5
INTRODUCTION
1. Zebrafish as a model animal
Zebrafish, Danio rerio are cyprinids native to South Asia, broadly distributed across parts of
India, Bangladesh, Nepal, Pakistan and Myanmar and were first described by Hamilton (1822) in
his survey of fishes of the Ganges River (Rahman, 1989; Barman, 1991; Talwar and Jhingran,
1991; Menon, 1999; Bhat, 2003). Due to monsoon weather, with dry and rainy seasons this area
has profound effects on habitat parameters, including water chemistry and resource abundance. It
belongs to the Phylum Chordata, Class Actinopterygii, Order Cypriformes, Family Cyprinidae,
Genus Danio (Fig. 1). As early as the 1930s, the zebrafish was being used as a classical
developmental and embryological model. Subsequently, it has been widely used as a vertebrate
research organism primarily for developmental genetics, and increasingly for toxicological and
environmental monitoring, cancer, aging, neurophysiology, and biomedicine (Kishi, 2004; Trede
et al., 2004; Parng, 2005; Wright et al., 2006; Beckman, 2007; Scholz and Mayer, 2008;
Sumanas and Lin, 2004).
Figure 1. Striped zebra (left) and spotted leopard (right) zebrafish, Danio rerio
On the basis of culture, reproduction and organogenesis, zebrafish are easy to keep and breed
under laboratory conditions all the year round. The small size, high fecundity, transparent
embryos and rapid development have made zebrafish highly favourable research models
(Westerfield, 2007; Matthews et al., 2002). Adult fish spawn hundreds of eggs once every 5 days
(Dahm and Geisler, 2006). Generation time is short, typically 3-4 months, making it suitable for
transgenerational experiments. Moreover, fertilization is external, thus live embryos are
accessible to manipulation and can be monitored through all developmental stages under a
dissecting microscope. Development is rapid, with all major organs developing within 36 h at
28.5°C (Kimmel et al., 1995).

Introduction
6
Year
1980 1990 2000 2006-07 2007-08
1800
1600
1400
1200
1000
800
600
400
200
0
Pu
bM
ed L
isti
ng
Importantly, the transparency of the embryo coupled with the detailed understanding of its
developmental stages allows elegant embryonic manipulations to distinguish between effects due
to the genetic asset vs influences of the surrounding environment (Spitsbergen and Kent, 2003).
The use of microinjection into the cytoplasm of one-cell-stage embryos to study gene function in
the zebrafish has become widespread in recent years. This includes ectopic expression of genes
by introducing DNA or RNA into embryos or injection of blocking molecules, such as RNAs
encoding truncated proteins or antibodies, to perturb the function of endogenouse gene products
(Holder and Qiling, 1999).
The zebrafish genome is sequenced and readily accessible on internet Ensembl (http://www.
ensembl.org/ index.html), while molecular products such as high density microarray chips are
available. A complete assembled sequence has already been published (http://www.ncbi.
nlm.nih.gov/genome/guide/zebrafish/). A number of forward and reverse genetic methodologies
are well established in zebrafish, including transgenesis, gene silencing (morpholino) and
chemical-induced mutagenesis (ethylnitrosourea; ENU). Due to above advantages, zebrafish
becomes one of the most important model animals today (Fig. 2).
Figure 2. Zebrafish research reported in Pubmed references from the year 1980 to 2008. The term
‘zebrafish’ and the year like “ 2007” were used for searching in Pubmed (Chakraborty et al., 2009)
Spotted leopard (Fig. 1), a well-known zebrafish mutant that has spotted skin pattern instead of
stripes, is also a model for the study of pigment patterning (Watanabe et al., 2006). Zebrafish
connexion41.8 gene, Cx41.8 (Fig. 3) is responsible for pigment pattern on the body surface of
leopard.

Introduction
7
Figure 3. Zebrafish connexion41.8 as a leopard gene. (A) Map of the leopard region. The yellow
arrowhead indicates the microsatellite marker z9704. The red bar indicates the bacterial artificial
chromosome (BAC) clone zK53o8, which includes the critical region for leopard. The black bars show
the BAC clones located around this region. Green arrowheads indicate single nucleotide polymorphism
marker sites. Each site was named as shown above the arrowhead. The numbers below the green
arrowheads refer to the number of recombination events (Watanabe et al., 2006; supplementary
information online). This region includes two genes, bcl9 and Cx41.8. Cx41.8 is indicated by a red
arrowhead. (B) Schematic of zebrafish connexin41.8 showing predicted structural motifs and mutations
detected in leopard alleles, leot1, leo
tw28 and leo
tq270 (Figure and legend taken from Watanabe et al., 2006).
2. Zebrafish embryogenesis and organogenesis
Zebrafish develops very rapidly (embryogenesis takes only about 24 h and organogenesis is
largely complete after day 5 of development), enabling the observation of defined aspects of
development as well as the completion of experiments generally within a few hours to days
(Dahm, 2002). Moreover, the transparency of the zebrafish’s chorion and the translucency of
embryos and early larval stages allow the easy visualization of internal processes, such as the
formation and function of internal organs inside the living animal.
According to Kimmel et al. (1995), zebrafish has seven broad periods of embryogenesis, namely
the zygote, cleavage, blastula, gastrula, segmentation, pharyngula, and hatching periods.
These divisions highlight the changing spectrum of major developmental processes that occur
during the first 3 days after fertilization. This work is focusing mainly on stages from blastula to
gastrula, when most patterning and cell fate determination processes take place. Figures 4 and 5
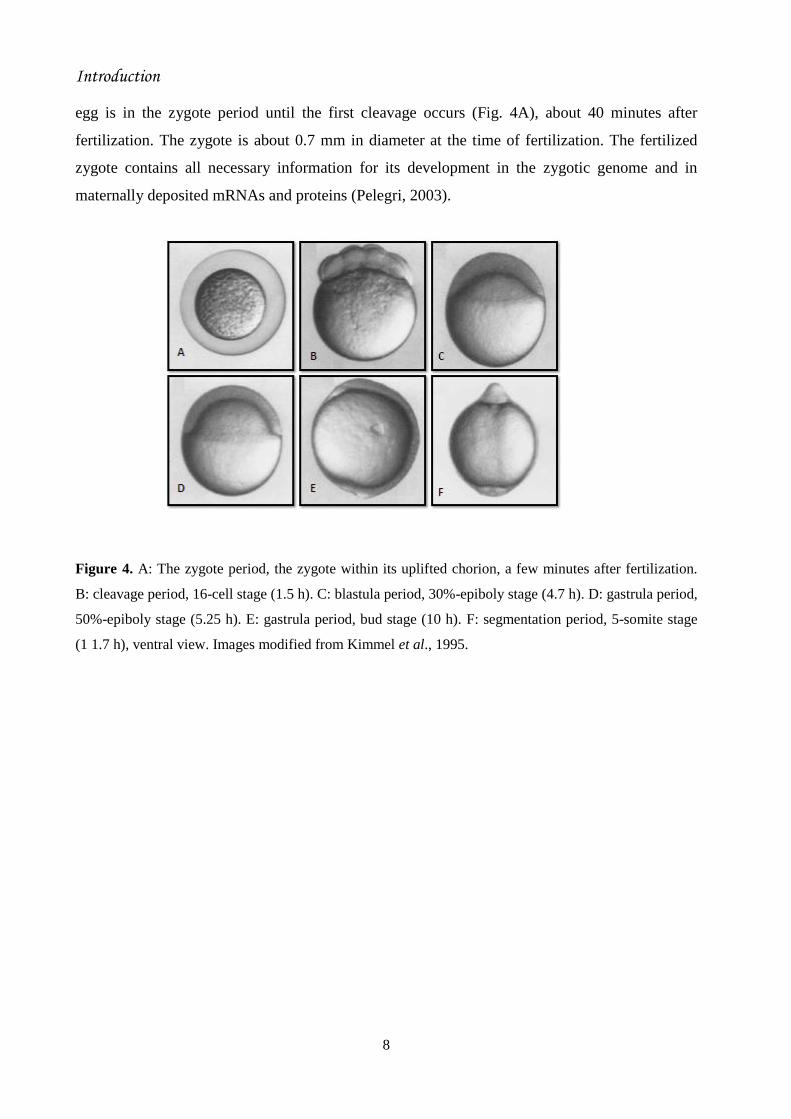
show some stages of early embryonic development. Zygote period (0-¾ h): the newly fertilized
Introduction
8
egg is in the zygote period until the first cleavage occurs (Fig. 4A), about 40 minutes after
fertilization. The zygote is about 0.7 mm in diameter at the time of fertilization. The fertilized
zygote contains all necessary information for its development in the zygotic genome and in
maternally deposited mRNAs and proteins (Pelegri, 2003).
Figure 4. A: The zygote period, the zygote within its uplifted chorion, a few minutes after fertilization.
B: cleavage period, 16-cell stage (1.5 h). C: blastula period, 30%-epiboly stage (4.7 h). D: gastrula period,
50%-epiboly stage (5.25 h). E: gastrula period, bud stage (10 h). F: segmentation period, 5-somite stage
(1 1.7 h), ventral view. Images modified from Kimmel et al., 1995.

Introduction
9
Figure 5. Developmental stages of zebrafish, A: segmentation period, 26-somatic stage (22 h). B:
pharyngula period, prim-6 (25 h). C: hatching period, long pec (48 h). D: hatching period, protruding
mouth (72 h). Images modified from Kimmel et al., 1995.
Cleavage stages (¾-2¼ h): the zygote starts to divide in a discoidal-meroblastic manner, leaving
newly formed blastomeres interconnected by cytoplasmic bridges. Blastomeres are cleaved
synchronously and radial-symmetrically. With the fourth cleavage (16-cell-stage), the central
cells become completely divided from the others (Fig. 4B). In contrast, marginal blastomeres
remain cytoplasmically connected to the yolk cell. Already during the early cleavage stages, the
embryo undergoes its first subdivision into two cell lineages: (a) germ-line cells, which inherit
unique maternal transcripts demarcating them as primordial germ cells (PGCs), and (b) somatic
cells forming the large bulk of the embryo.
Blastula period (2¼-5¼ h): at this stage, important processes occur. The embryo enters
midblastula transition (MBT), the yolk syncytial layer (YSL) forms, and epiboly begins. During
the early blastula period, the cleavages are metasynchronous because mitoses do not all occur at
quite the same time. The MBT starts during the tenth cell cycle (512- cell stage). As interphases
lengthen, cells become motile, and RNA synthesis increases over background levels. The
marginal tier of blastomeres in the early blastula lies against the yolk cell and remains
cytoplasmically connected to it throughout cleavage. Beginning during cycle 10 (Kimmel and

Introduction
10
Law, 1985), the marginal cells undergo a collapse, releasing their cytoplasm and nuclei together
into the immediately adjoining cytoplasm of the yolk cell. Thus YSL arises and after forming
YSL, the enveloping layer (EVL) cells that were in the second blastodisc tier now lie at the
marginal position.
Epiboly starts in the late blastula (Solnica-Krezel and Driever, 1994). It consists in the thinning
and spreading of both the YSL and the blastodisc over the yolk cell, as one might model by
pulling a knitted cap over the head. When primary stages of this morphogenetic movement
occurs, the blastodisc thins considerably, changing from a high-piled cell mound to a cup-shaped
cell multilayer of nearly uniform thickness (Fig. 4C).
Epiboly also continues during the gastrula period (5¼-10 h). The morphogenetic cell
movements of involution, convergence, and extension occur, producing the primary germ layers
and the embryonic axis. At 50%-epiboly, a thickened marginal region, termed the germ ring,
appears nearly simultaneously all around the blastoderm rim. Convergence movements then,
nearly as rapidly, produce a local accumulation of cells at one position along the germ ring, the
so-called embryonic shield. During these time, epiboly arrests for sometimes, but after forming
shield, epiboly continues; blastoderm margin continues to grow around the yolk cell to cover it
completely (Fig. 4E).
When epiboly is completed at the end of gastrulation, the yolk is completely covered by the
blastoderm, and the concerted cell movements have established the dorsal-ventral and anterior-
posterior body axes. After gastrulation, the embryo is further patterned and elongated in the
course of the segmentation period along its axes. In particular, the tail bud extends away from
the yolk cell to produce the embryonic tail region. The gut tube forms in close opposition to the
yolk surface and the notochord primordium separates from the adjacent somitic mesoderm,
which is progressively subdivided into the segmentally arranged somites.
During the segmentation period (10-24 h), morphogenetic change occurs in a amazing way, the
somites develop, the rudiments of the primary organs become visible, the tail bud becomes more
prominent and the embryo elongates (Figs. 4F and 5A). At the completion of the first day of
development, the embryo has between 8,000 and 10,000 cells. With notable major exceptions,
such as the neural crest-derived structures of the jaw and endodermally derived structures of the
gut tube, the development of the major systems of the embryo is laid out. The embryos are
touch-sensitive and their hearts will start beating.
During the first few hours of the pharyngula period (24-48 h), the embryo continues the rapid
lengthening that started at 15 h, but then the rate of lengthening abruptly decreases (Fig. 5B).

Introduction
11
The time of the change, at 31-32 h, correlates approximately with the end of the rapid
morphogenetic straightening of the tail.
The embryo continues to grow at about the same rate as earlier during the hatching period (48-
72 h). Now the morphogenesis of many of the organ is relatively finish and slows down
considerably, with some remarkable exceptions including the gut and its associated organs (Figs.
5C and D). At 5 days post fertilization (dpf), larvae develop a swim-bladder and begin to swim
and feed. Sexual maturity is reached within 3-4 months, and adults can live for 2.5 – 4 years.
3. Antisense techniques in developmental biology
Antisense technique was first developed over 25 years ago (Izant and Weintraub, 1984; Izant and
Weintraub, 1985) to block translation, processing or stability of its endogenous mRNA
complement . Exogenous RNA microinjection into oocytes of the frog Xenopus laevis showed
successful inhibition of translation (Harland and Weintraub, 1985; Melton, 1985), as well as in
inhibiting the translation of endogenous mRNA (Izant and Weintraub, 1985). However, in the
zebrafish, antisense RNA has been shown to have extensive sequence-independent effects that
hamper the use of this system in the research of specific gene functions during developmental
stages (Oates et al., 2000). Usually, a gene-knockdown agent should be characterized by high
sequence specificity and lack of off-target effects due to interactions with structures other than
gene transcripts. Three major gene knockdown types are compared with respect to off-target
effects and sequence specificities: 1) phosphorothioate-linked DNA (S-DNA); 2) short
interfering RNA (siRNA); and, 3) Morpholino (Table 1).

Introduction
12
Table 1. Structure types of gene knockdown agents (Summerton, 2007).
Phosphorothioates (Table 1) are nearly iso-structural with DNA, differing only in the
replacement of an oxygen atom by a sulphur atom in the phosphate linkages of the backbone
(Steck et al., 1984). The principal advantage is that S-DNAs are degraded less quickly by
nucleases (half-lives extended to multiple hours in biological systems as compared to few
minutes for bare DNA oligos). On the other hand, the sulfur on the backbone phosphates
significantly decreases the S-DNA’s affinity for its RNA target sequence (Summerton, 2004;
Summerton and Weller, 1997).
Short interfering RNA (Table 1) is a small RNA duplex about 20 to 25 base-pairs, which is
processed within cells, where one of the RNA strands is disposed off while the other RNA strand
is combined with cellular proteins to form the RNA-induced silencing complex (RISC) structure
(Dorsett and Tuschl, 2004; Scherer and Rossi, 2004). Primarily, the location of RISC structure is
in the cytosol, then efficiently it blocks partially-complementary mRNA sequences and cuts
highly-complementary mRNA sequences. An alternative approach to RNA interference is the
antisense Morpholino (MO) technology that has proven to be a powerful tool to knockdown
specific targets in zebrafish. RNAi and MO are emerging as the most effective tools in bringing
about functional silencing of genes. Both of these molecules are complementary oligonucleotides

Introduction
13
that interfere with mRNA translation. This reduces protein levels and functionally silences the
gene.
MOs are synthetic derivative of DNA and made of about 25 subunits chains which are alike to
DNA and RNA oligonucleotides, but MOs have a morpholine ring rather than a ribose ring
(Table 1). This structure still proves MOs to allow Watson-Crick base pairing, but it offers
important benefits over conventional oligonucleotides (Corey and Abrams, 2001; Heasman,
2002). MOs do not act through an RNaseH mechanism and can be designed to inhibit translation
(Summerton, 1999) (Fig. 6).
Figure 6. Translation-blocking MOs. It is targeted to sequence 5′ of the translation start site and block
progression of the initiation complex (Eisen and Smith, 2008).
4. Morpholino-based screening in zebrafish
MO-based screening can produce knockdown phenotypes in wild-type embryos, significantly
reducing infrastructural needs as compared to a classical mutagenesis screening due to the
requirement of housing and breeding of many normal fish to produce the subset of mutant
animals for analysis.
MO oligonucleotides have recently emerged as a successful and important tool for gene-specific
antisence knockdown during zebrafish development owing to its rapid embryogenesis,
transparency and the ease of delivery of MOs. The use of MOs in zebrafish has shown these
compounds to be sequence specific and extremely potent as knockdown agents in all cells during
the first 50 hours post-fertilization (hpf) (Nasevicius and Ekker, 2000).

Introduction
14
5. Hypothalamus-pituitary-interrenal (HPI) axis and stress response in fish
Hormones are chemicals released by one or more cells that affect cells in other parts of the
organisms. Only a small amount of hormone is required to alter cell metabolism. It is essentially
a chemical messenger that transports a signal from one cell to another. Hormones bind to their
cognate receptor proteins, resulting in the activation of a signal transduction mechanism that
ultimately leads to cell type-specific responses.
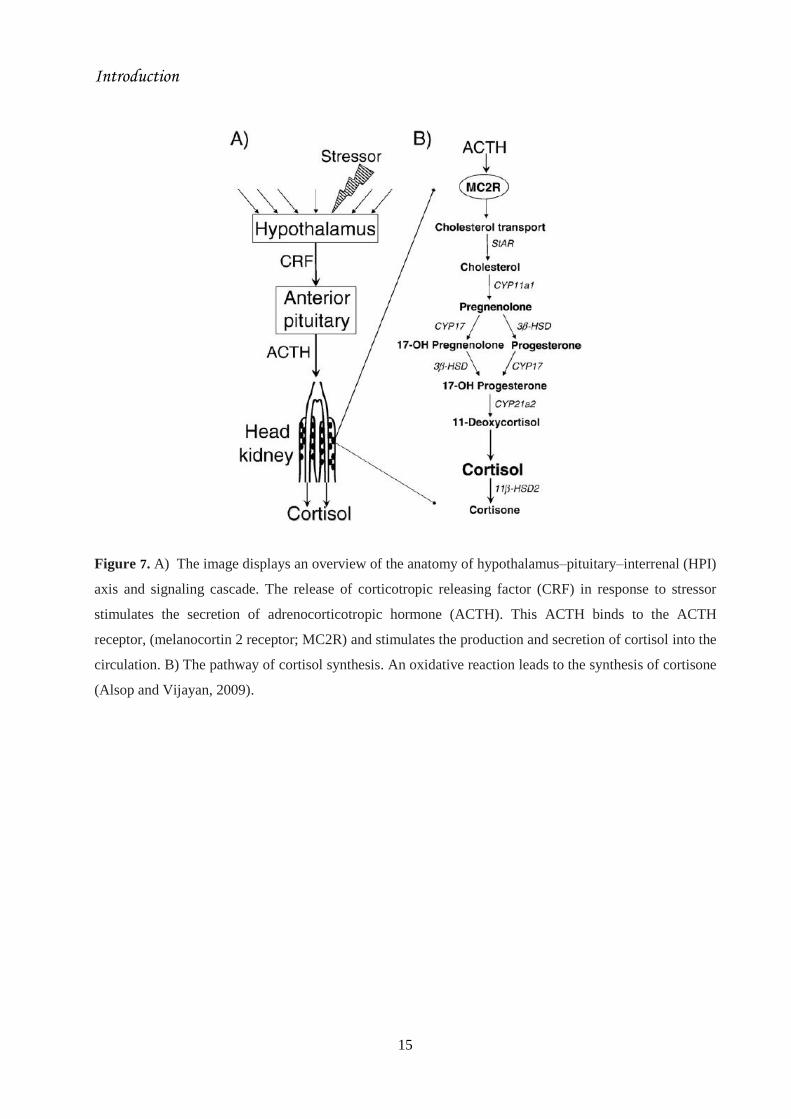
The stimulation of the hypothalamus-pituitary-interrenal (HPI) axis in response to stressor
exposure has been extensively reviewed in teleosts (Barton and Iwama, 1991; Wendelaar Bonga,
1997; Barton et al., 2002; Iwama et al., 2006). As in other vertebrates, corticotropin-releasing
factor (CRF) is the initial hormone in a signaling cascade that functions to regulate circulating
glucocorticoids during stress. In fish, CRF produced in the preoptic area of the brain, stimulates
the release of corticotropin (adrenocorticotropic hormone; ACTH) from the pituitary
corticotrophs (Wendelaar Bonga, 1997; Fig. 7A). CRF and its related peptides, urocortin
(tetrapods) and urotensin I (fish), signal via specific G-protein coupled receptors (CRF-R1 and
CRF-R2) and are further regulated by a shared binding protein (CRF-BP). Together, these
components are referred to as the CRF system and, in addition to their key role in the regulation
of the ACTH response, they display a variety of functions ranging from food intake inhibition
(Bermier, 2006) to behavioral modulation (Koob and Heinrichs, 1999; Lowry and Moore, 2006).
In turn, ACTH binds to melanocortin type 2 receptors (MC2R, also called the ACTH receptor)
on head kidney interrenal cells to stimulate the production and release of glucocorticoids (Aluru
and Vijayan, 2008; Fig. 7B). This pathway, known as the hypothalamus-pituitary-interrenal
(HPI) axis (Figs. 7A and B) is homologous to the HP-adrenal (HPA) axis of tetrapods (Flik et
al., 2006).
In teleosts, as in humans, cortisol is the major glucocorticoid secreted by the interrenal cells
(analogous to the adrenal cortex in tetrapods), whereas corticosterone, the only glucocorticoid in
rodents, plays a minor role. These hormones are synthesized from either circulating cholesterol
in association with low-density lipoproteins or from cholesterol synthesized de novo from acetate
in these cells (Fig. 8) (Boron and Boulpaep, 2006).
Introduction
15
Figure 7. A) The image displays an overview of the anatomy of hypothalamus–pituitary–interrenal (HPI)
axis and signaling cascade. The release of corticotropic releasing factor (CRF) in response to stressor
stimulates the secretion of adrenocorticotropic hormone (ACTH). This ACTH binds to the ACTH
receptor, (melanocortin 2 receptor; MC2R) and stimulates the production and secretion of cortisol into the
circulation. B) The pathway of cortisol synthesis. An oxidative reaction leads to the synthesis of cortisone
(Alsop and Vijayan, 2009).

Introduction
16
Figure 8. Cholesterol uptake and steroid hormone synthesis. Cholesterol is the initiator of steroid
hormone synthesis. About 80% is from LDL particles via receptor-mediated endocytosis. The cell
synthesizes the remaining cholesterol de novo from acetyl coenzyme A (Acetyl CoA). LDL, low-density
lipoprotein; VLDL, very-low-density lipoprotein (Boron and Boulpaep, 2006).
6. Cortisol actions
In fish, as in other vertebrates, the cellular responses associated with cortisol signalling are
thought to be mediated by a glucocorticoid receptor (GR). Figure 9 displays the cortisol-GR-
mediated molecular changes in the gluconeogenic and protein catabolic pathways in trout
hepatocytes (Aluru and Vijayan, 2007). Cortisol is also known to play an important role in
modulating a vast array of physiological processes, including organ development, protein and fat
metabolism, carbohydrate homeostasis, immune response, neural activity, memory and
behaviour and bone formation in both unstressed and stressed animals (Mommsen et al., 1999;
Barnes, 2006; De Kloet et al., 2005 ; Wang, 2005; Migliaccio et al., 2007). Since cortisol exerts
different effects on the various organs of the body, it is likely that the functional targets of GR
are different in each tissue and these tissue specific mechanisms needs to be elucidated in order
to understand the functional genomics of the stress response (Phuc Le et al., 2005; Vegiopoulos
and Herzig, 2007).
Mammalian studies using microarrays and bioinformatics tools have identified GR is responsible
for gene regulatory networks in the liver of mice treated with dexamethasone. Some genes are
directly linked to GR signaling, while other genes are regulated indirectly by interaction of GR
with other transcription factors, including estrogen receptor (ER) and CCAAT/enhancer binding

Introduction
17
protein beta (C/EBPb) (Aluru and Vijayan, 2007). Due to their various actions, glucocorticoids is
now become an attractive for therapy. As a class of compounds including synthetic analogues,
they are among the most prescribed drugs in the world. Clinically, because of their
immunosuppressive and anti-inflammatory activity, glucocorticoids are widely prescribed in the
treatment of chronic autoimmune/inflammatory and allergic diseases, such as asthma,
inflammatory bowel disease, rheumatoid arthritis, and skin disorders (Schaff et al., 2009).
Figure 9. A role for cortisol signaling in stress transcriptomics. Glucocorticoid receptor exists as a
complex with accessory proteins (AP), including heat shock protein 90, which gives stability and ligand
binding conformation to the receptor. Cortisol (F) binds to GR and the GR-ligand heterocomplex
translocates to the nucleus where it forms a homodimer and binds to the glucocorticoid-response element
(GRE) on the promoter of glucocorticoid-responsive genes, modulating either transactivation or
transrepression of genes encoding proteins involved in metabolism, reproduction and immune function.
Also, ligand-bound GR may modulate transactivation and/or repression by other transcription factors,
including ER. Moreover, another mechanism of action of cortisol may involve signaling by binding to
membrane proteins and the associated non-genomic and genomic signalling. However, all these
additional mechanisms of action are poorly understood in fish (Figure and legend taken from Aluru and
Vijayan, 2009).
7. Zebrafish as a model for stress research
Now zebrafish has become a useful model in the study of the corticosteroid stress axis on the
basis of both developmental and genetic traits. The Tuebingen 2000 large-scale ethylnitrosourea
(ENU) screen has produced zebrafish mutants have been described that lack pituitary
corticotropic cells and hence do not capable to synthesize ACTH (Herzog et al., 2004). So there

Introduction
18
is opportunity to study the effects of ACTH in the stress response and in the ability of a fish to
cope with a stressor.
While the teleost-related genome duplication event that occurred in the taxon 350 million years
ago is very interesting from the fish evolutionary and comparative points of view, duplicate
genes can create problems in some technical points of view. For example, morpholino injections
in gene silencing studies, have to contend with knocking down two genes and also face the
complication of functional partition between duplicate genes. But corticoid research in zebrafish
can avoid this problem; zebrafish is the only fish currently known to possess a single gene for all
three of the HPI components: CRF, (Chandrasekar et al., 2007), ACTH (POMC genes are
duplicated, but only one can synthesize ACTH; De Souza et al., 2005) and GR (Alsop and
Vijayan, 2008, Schaaf et al., 2008). This is also interesting in comparative study with species,
such as the common carp (Cyprinus carpio), that possesses two genes for CRF (Huising et al.,
2004), POMC (Arends et al., 1998) and GR (Stolte et al., 2008).
Hence, the ease of genetic manipulation, optically clear embryos and larvae for microscopic
imaging study especially in combination with fluorescent labelling of specific cells and proteins,
along with the single gene systems for several key components of the HPI axis, makes zebrafish
a powerful animal model for studies pertaining to the development of the stress axis and
corticosteroid function in vertebrates.
8. Glucocorticoids and the glucocorticoid receptor in zebrafish research
At the cellular level, the actions of glucocorticoids are mediated by intracellular GR, which
functions as a hormone-activated transcription factor that regulates the expression of
glucocorticoid-responsive genes. This receptor is a member of the family of steroid receptors,
which in turn belongs to the superfamily of nuclear receptors (Zhang et al., 2004). Like all
nuclear receptors, the GR acts as a ligand-activated transcription factor, and it is well conserved
among vertebrate animal species (Bridgham et al., 2006). It consists of a large N-terminal
domain, involved in transcriptional activation, a small DNA binding domain which contains two
zinc-fingers and a C-terminal ligand-binding domain (Giguere et al., 1986). In the absence of
hormone, the GR resides in the cytoplasm, where it forms a complex with heat shock proteins
and immunophilins (Pratt and Toft, 2003).
Most teleostean fish species contain two glucocorticoid receptor genes, called GR1 and GR2
(Stolte et al., 2006). These isoforms have been recognised for rainbow trout (Bury et al., 2003),
burton's mouthbrooder (Greenwood et al., 2003), green spotted puffer, fugu (Stolte et al., 2006),

Introduction
19
common carp (Stolte et al., 2008), and sea bass (Terova et al., 2005; Vizzini et al., 2007). But in
some fish species, like the Japanese flounder and brown trout (Stolte et al., 2006) contains one
GR gene has been found thus far, still it is unclear if they contain a second GR gene, since most
of these fish species are poorly studied.
The structure of fish GR1 and GR2 genes is highly similar to the organization of the human GR
gene (Stolte et al., 2006). At the protein level, fish GRs display a high level of similarity to the
human GR as well. In the ligand-binding domain, between 85% and 95% of the amino acids of
fish GRs are similar to those in the human GR and in the DNA binding domain this number
exceeds 98% for most fish GRs studied (Fig. 10).
Figure 10. The human and zebrafish GR α-isoforms. GR possesses the four functional domains common
to nuclear hormone receptors: a large N-terminal domain, involved in transcriptional activation, a DNA
binding domain (DBD) which contains two zinc-fingers and a ligand-binding domain (LBD). Percentages
indicate the fraction of amino acids similar between human and zebrafish per domain. The overall level of
similarity is 59.3% (Schaaf et al., 2009).
As said, the zebrafish genome only contains one GR gene (Stolte et al., 2006; Schaaf et al.,
2008; Alsop and Vijayan, 2008). The analysis of the syntenic regions of the fish GR genes shows
that the genomic region surrounding the zebrafish GR gene is well conserved and is highly
similar to the region surrounding the GR2 gene of fugu, green spotted puffer, medaka and
stickleback in a phylogenetic tree (Fig. 11).

Introduction
20
Figure 11. Phylogenetic tree of the teleost fish (GR1 and GR2) and tetrapod GRs. The zebrafish GR
clusters within the GR2 clade of teleostean GRs (Schaaf et al., 2009).
Thus, zebrafish could be a important research tool for GR research by using techniques for
transient or stable genetic manipulation in combination with imaging-based phenotypic readouts
to advance our knowledge on the molecular mechanisms underlying the effects of GR activation
in vivo. Its potential could be exploited in studies towards the discovery of novel drugs and drug
targets (Zon and Peterson, 2005; Mathew et al., 2007). Because of its small size and suitability
for imaging studies, the zebrafish could be an ideal tool for the screening of novel glucocorticoid
drugs. In addition, using forward genetic screens for glucocorticoid responsiveness as a readout,
novel drug targets may be discovered that may increase the effectiveness of glucocorticoid
treatment.
9. Impact of stress on fish reproduction
Jalabert (2008) observed that the many aspects of fish physiology are potentially vulnerable to
the effects of stressors as fish mature and reproduce, mainly due to the redirection of energy
resources associated with the stress response (Schreck and Li, 1991). One important aspect is
that a fish has to decide whether or not to reproduce under stressful conditions. When a fish
reproduces, it should maintain fecundity with good quality eggs. Fish adopt different tactics to
cope with stress during their reproductive life histories. The comparative results about the effects
Introduction
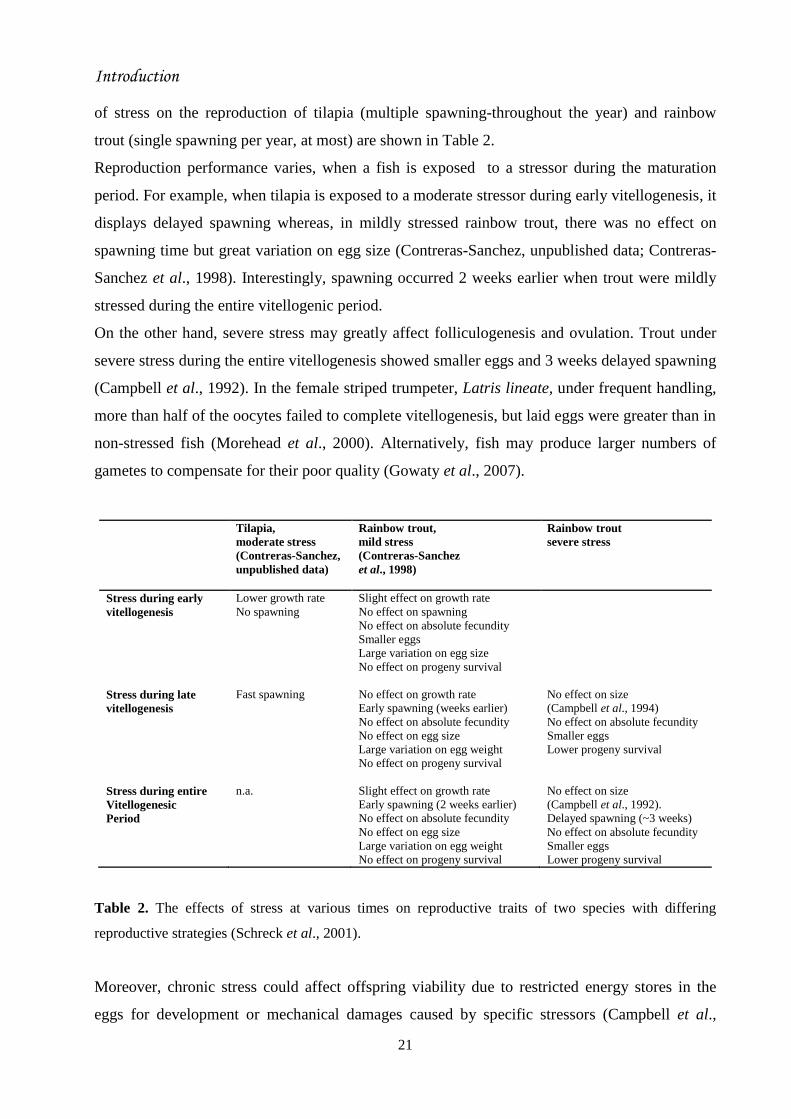
21
of stress on the reproduction of tilapia (multiple spawning-throughout the year) and rainbow
trout (single spawning per year, at most) are shown in Table 2.
Reproduction performance varies, when a fish is exposed to a stressor during the maturation
period. For example, when tilapia is exposed to a moderate stressor during early vitellogenesis, it
displays delayed spawning whereas, in mildly stressed rainbow trout, there was no effect on
spawning time but great variation on egg size (Contreras-Sanchez, unpublished data; Contreras-
Sanchez et al., 1998). Interestingly, spawning occurred 2 weeks earlier when trout were mildly
stressed during the entire vitellogenic period.
On the other hand, severe stress may greatly affect folliculogenesis and ovulation. Trout under
severe stress during the entire vitellogenesis showed smaller eggs and 3 weeks delayed spawning
(Campbell et al., 1992). In the female striped trumpeter, Latris lineate, under frequent handling,
more than half of the oocytes failed to complete vitellogenesis, but laid eggs were greater than in
non-stressed fish (Morehead et al., 2000). Alternatively, fish may produce larger numbers of
gametes to compensate for their poor quality (Gowaty et al., 2007).
Tilapia,
moderate stress
(Contreras-Sanchez,
unpublished data)
Rainbow trout,
mild stress
(Contreras-Sanchez
et al., 1998)
Rainbow trout
severe stress
Stress during early
vitellogenesis
Lower growth rate
No spawning
Slight effect on growth rate
No effect on spawning
No effect on absolute fecundity
Smaller eggs
Large variation on egg size
No effect on progeny survival
Stress during late
vitellogenesis
Fast spawning No effect on growth rate
Early spawning (weeks earlier)
No effect on absolute fecundity
No effect on egg size
Large variation on egg weight
No effect on progeny survival
No effect on size
(Campbell et al., 1994)
No effect on absolute fecundity
Smaller eggs
Lower progeny survival
Stress during entire
Vitellogenesic
Period
n.a. Slight effect on growth rate
Early spawning (2 weeks earlier)
No effect on absolute fecundity
No effect on egg size
Large variation on egg weight
No effect on progeny survival
No effect on size
(Campbell et al., 1992).
Delayed spawning (~3 weeks)
No effect on absolute fecundity
Smaller eggs
Lower progeny survival
Table 2. The effects of stress at various times on reproductive traits of two species with differing
reproductive strategies (Schreck et al., 2001).
Moreover, chronic stress could affect offspring viability due to restricted energy stores in the
eggs for development or mechanical damages caused by specific stressors (Campbell et al.,
Introduction
22
1992, 1994). Hatchlings from smaller eggs produced by mildly stressed trout were smaller, but
exhibited no abnormal mortality (Contreras-Sanchez et al., 1998). Interestingly, McCormick
(1998) found that female ambon damselfish stressed by the presence of a predator produced
eggs with higher amounts of cortisol. So, the quality of progeny in fish is affected by the
stressful situations and behavioural interactions (Schreck et al., 2001).
Social factors can affect fish reproduction through interactions with the endocrine stress
response. When Siamese fighting fish, Betta splendens, and African cichlid, Haplochromis
burtoni, were stressed by threatening social encounters, their testicular steroidogenic capacity
was inhibited (Leitz , 1987). It was reported that the size of GnRH neurons in the hypothalamo-
preoptic area and testis size were inversely related to social condition ( Fox et al., 1997).
Brown trout, Salmo trutta, stressed by crowding had elevated plasma ACTH and cortisol and
decreased circulating testosterone and 11-keto-testosterone. This finding suggested that stress
can adversely affect reproduction in fishes (Pickering et al., 1987). Subsequent studies confirmed
that stress does indeed have a negative impact on reproductive fitness, as outlined above
(Campbell et al., 1992, 1994; Contreras-Sanchez et al., 1998; Schreck et al., 2001). Castranova
et al. (2005) demonstrated that striped bass, Morone saxatilis, despite genetically determined low
cortisol responses to stressors, still manifested lower androgen levels and lower spermiation
response to gonadotropin treatment when subjected to stressors. Stressful handling of mature
jundia, Rhamdia quelen, resulted in lowered 17β-estradiol; fewer oocytes could be stripped from
the stressed fish and their quality appeared reduced (Soso et al., 2008).

Introduction
23
Figure 12. The main phases of the reproductive clock and the key reproductive events that happen during
each phase (shown to the left of each respective clock). The organism-level response to stressors causing
emergency responses and coping responses as part of allostatic load are shown to the right of the clocks.
Responses in bold lettering are based on solid information; responses not in bold lettering are based on
strong inference. A down arrow indicates a decrease. A minus sign (-) indicates inhibition (Figure and
legend adapted from Schreck, 2010).
10. Impact of perinatal stress on the cortisol
The influence of perinatal stress on the cortisol response of young and adult subjects has been
extensively explored in mammals. It has been observed that depending on the development stage
at which the young are exposed to stress, the opposite regulation of the HPA axis activity
operates in the adults. Indeed, when an expectant rats under prenatal stress, a prolonged post-
stress corticosterone secretion is induced in the progeny once they are adults (Vallée et al.,
1997), whereas early postnatal handling of the offspring induces a decrease in adult

Introduction
24
corticosterone secretion in response to stress (Vallée et al., 1997). In the case of prenatal stress,
the observed effect is suggested to be triggered, at least in part, by direct embryo exposure to
corticosteroids. Corticosterone in the stressed mother causes a down-regulation of fetal
glucocorticoid and mineralocorticoid receptors and impairs the feedback regulation of the HPA
axis in infancy and adulthood (Weinstock, 2005).
11. Maternal hormones in fish oocytes
The yolk of mature teleost oocytes contains large amount of liposoluble hormones such as
steroid, thyroid and retinoid hormones, as found in other oviparous vertebrates. These maternal
hormones plays important role in regulating developmental processes of post-fertilization (Lam,
1985; Brown et al., 1989; Brown and Bern, 1989; Feist et al., 1990; Schreck et al., 1991; Ayson
and Lam, 1993; Yeoh et al., 1996a,b; McCormick, 1999; Irie and Seki, 2002), are taken up from
the maternal circulation or the follicular envelope. Studies on several fish species have shown
that maternal steroid hormones may be involved in the early development of the offspring. For
example, sex steroid hormones were found in the eggs of coho salmon (Oncorhynchus kisutch)
(Feist et al., 1990) and testosterone in medaka (Oryzias latipes) (Iwamatsu et al., 2006). So, the
maternal transfer of sex steroids, to the yolk constitutes a potentially significant source of
maternal impact over embryogenesis and adult phenotype in oviparous fish.
The physiological response of a female fish to stress could have considerable consequence in
terms of gamete quality and progeny fitness. Egg Cortisol contents were reported in
Mozambique tilapia (Oreochromis mossambicus) (Shiraishi et al., 1999), chum salmon,
Oncorhynchus keta. (De Jesus and Hirano, 1992) and other teleosts (Hwang et al., 1992).
Specifically, the maternal transfer of cortisol could be modified by physiological processes
induced by stress, suggesting that concentrations in eggs could be affected (Campbell et al.,
1992, 1994; Yeoh, 1993). Cortisol concentrations in coho salmon, O. kisutch, eggs were
significantly higher when the fish were stressed for 2 weeks prior to spawning (Stratholt et al.,
1997). McCormick (1998) also published that cortisol administered to ambon damselfish,
Pomacentrus ambionensis, resulted in elevated ovarian cortisol concentrations, similar to those
of fish experiencing stress in the natural environment. Cortisol implantation into adult tilapia, O.
mossambicus, resulted in reduced oocytes size and lower circulating testosterone and 17β-
estradiol concentrations (Foo and Lam, 1993). On the other hand, no elevation in cortisol
concentrations was shown in eggs of rainbow trout that were stressed up to 3 months prior to
spawning. In fact, elevated levels of maternal cortisol at ovulation were not reflected in the

Introduction
25
concentrations in ovarian fluid or eggs (Contreras-Sanchez, 1995). Furthermore, embryo of early
development has the biochemical machinery to metabolize steroid hormones, including cortisol
(Yeoh et al., 1996a,b), which suggests that regulation of maternally contributed factors occurs
post-fertilization in the embryo.
But in mammals, it is not clear whether exposure of fish to cortisol variations during the early
stages of development can influence the stress sensitivity later in life. Basal endogenous cortisol
changes during development have been studied in several species: Paralichthys olivaceus (De
Jesus et al., 1991), Oncorhynchus keta (De Jesus and Hirano, 1992), Oncorhynchus mykiss
(Pottinger and Mosuwe, 1994; Barry et al., 1995a,b), Dicentrarchus labrax ( Sampath- Kumar et
al., 1995), Cyprinus carpio (Flick et al., 2002), and Gadus morhua (King and Berlinsky, 2006).
During embryonic development, egg cortisol decreased, and endogenous cortisol production
began around hatching, as shown from the increase in whole-body cortisol concentration. The
development of a mature hypothalamic– pituitary–interregnal (HPI) axis able to generate cortisol
in response to an external stressor occurred in the first weeks after hatching (Auperin and Geslin,
2008); cortisol production as an instant response to stress was observed 2 weeks after hatching in
turbot and rainbow trout (Stephens et al., 1997; Barry et al., 1995a,b; Pottinger and Mosuwe,
1994), whereas it was observed only one week after hatching in yellowperch (Jentoft et al.,
2002).
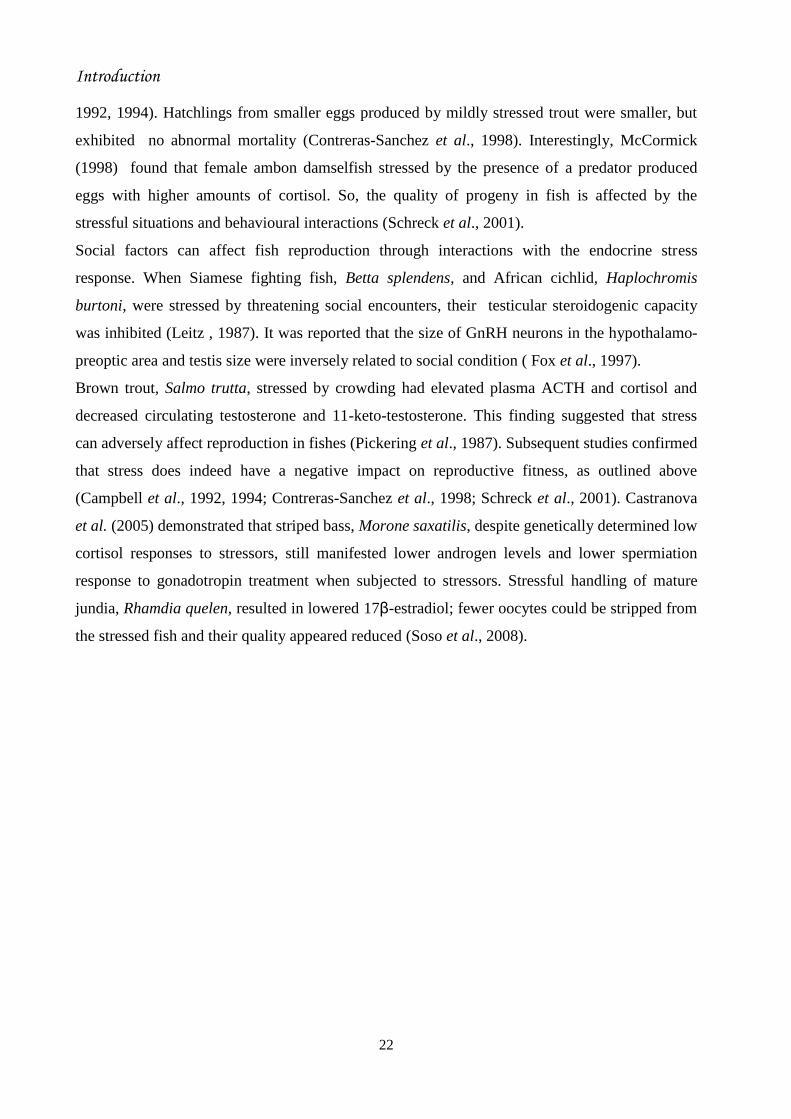
Alsop and Vijayan (2008) demonstrated that cortisol does not increase after a stressor exposure
at 25, 49 or 73 hpf (Fig. 13). A cortisol stress response was first detected at 97 hpf, 2 days after
hatching (Fig. 13). The absence of a stressor-mediated response may not be due to the lack of
MC2R, as this receptor transcripts were up-regulated between 25 and 49 hpf (To et al., 2007;
Alsop and Vijayan, 2008). Similarly, although basal cortisol levels were increasing in rainbow
trout larvae at hatch (4 weeks post fertilization), a cortisol stress response was not seen until 2
weeks post-hatch (Barry et al., 1995a).
Introduction
26
Figure 13. Basal cortisol levels from 1.5 to 146 hpf (closed circles; left axis) and changes in whole body
cortisol 5 min after exposure to a stressor (control-open bars, stressed hatched bars; right axis) in
zebrafish at 25, 49, 73, and 97 hpf. An asterisk (*) denotes a significant change in cortisol from control
animals (t-test) (Alsop and Vijayan, 2008).
12. Objectives of the study
The objectives of this study were: A) to verify whether the cortisol treatment of zebrafish eggs
affects the growth rate of the progenies as compared to controls in F1-F4 treated generations
(ontogenetic programming). It was to be established whether: 1) this is due to a short-term effect
of maternal cortisol, directly producing an initial growth retard that is not compensated later on
in lifetime (short-term epigenetic effect); or 2) this is due to a long-term priming of growth rate
by maternal cortisol that persists later on in lifetime (long-term epigenetic effect); B) to verify
whether the ontogenetic programming is inheritable, being transmitted also to the untreated F4
generation. It was to be established whether the programmed genes are developmental and/or
growth genes that are inhibited, or genes encoding hormones of the corticoid stress axis
(hypothalamo-hypophyso-interrenal axis) that are amplified, or both gene clusters.

Materials and Methods
27
MATERIALS AND METHODS
13. Zebrafish maintenance
13.1. Sources
About 100 couples of adult homozygous striped (called zebra, Z) and spotted (called leopard, L)
zebrafish (Fig.1) were obtained from Prof. Francesco Argenton’s laboratory (Department of
Biology, University of Padova, Italy). These fish were bred to produce my parent collection
(parent generations, F0).
13.2. Housing and care
As zebrafish can be easily reared and bred under laboratory conditions, a facility was arranged
for their proper housing, care and breeding. Transparent polycarbonate plastic tanks of different
capacities were used to hold zebrafish. One litre-capacity tanks were used to hold juvenile fish
and 5-L tanks for adult fish. The stocking density was about 80 juveniles/tank and about 60
adults/tank. There was a continuous water circulation system in each tank to provide clean and
highly oxygenated freshwater. Daily inspection of fish was performed. Tanks were cleaned
regularly by siphoning and replaced with new tanks. Diseased and dead fish were promptly
removed.
13.3. Lighting
Light triggers zebrafish spawning and breeding, so appropriate lighting is an important factor for
successful spawning. Darkness is crucial for animals to rest and to minimize their stress
Vargesson, 2007). However, constant darkness delays normal embryo development and hatching
may still not being observed at 7 dpf (Bilotta, 2000). By considering all aspects, a 14 h-light and
10 h-dark photoperiod was adopted to raise zebrafish.
13.4. Temperature
Temperature is a vital factor for development of fish. The zebrafish is recognised as a
eurythermal species, which means it can tolerate a wide thermal range, surviving in nature at
temperatures as low as 6°C in winter and to over 38°C in summer (Spence et al., 2008). Under
laboratory conditions, its maximum thermal tolerance was reported to span from 6.2°C to 41.7°C
(Cortemeglia and Beitinger, 2005). But 28.5°C is widely cited as the optimum temperature for

Materials and Methods
28
zebrafish culture and breeding. So this temperature was maintained for growing and breeding the
experimental fish.
13.5. Water quality
Water quality is the most important factor for the health and wellbeing of fish. Poor water quality
can lead to stress and disease, and may affect breeding (Kreiberg, 2000; Bilotta et al., 1999).
Level of contaminants was minimized by maintaining proper water exchange, removal of excess
food, and keeping tanks and the water filtration system clean. The pH level was maintained at 7 -
7.4 as measured with a pH meter for proper growth and reproductive performance. Other water
quality parameters, such as dissolved oxygen, excreted ammonia, nitrates, nitrites etc were
regularly monitored.
13.6. Catching and handling
The majority of zebrafish in research facilities are the descendents of many generations of
captive bred animals. Although their 'nervousness' or predator avoidance behaviour, as a prey
species, appear to be reduced, still handling represents a potentially dangerous stressor. Even
following a brief stressful event, the physiological response may significantly affect blood
chemistry for as much as 24 h (Kreiberg, 2000). Hence, catching and handling were minimised
to avoid unnecessary stress to fish.
13.7. Feeding
All larvae were fed with the commercial diet Novotom, Premium Baby (JBL, Neuhofen,
Germany) four times a day. Francis (2008) suggests that a quality diet specifically developed for
zebrafish should be used. Some commercial feeds claim to offer a nutritionally complete food.
However, it was preferred to integrate the dry feed with live prey. So, adult fish were daily fed
twice with dry food flakes (AZ300, Tetra) and once with brine shrimp nauplii and metanauplii
hatched from commercially purchased brine shrimp cysts incubated into saline water for 48 h.
14. Breeding of F0 brood stock for embryo studies
The first mating of F0 brood stock was performed in 1-L transparent plastic breeding boxes
containing a single male and a single female of the same strain kept separated during night-time,
and allowed to mate in the morning, after light switch on, by removing the separation screen.
Materials and Methods
29
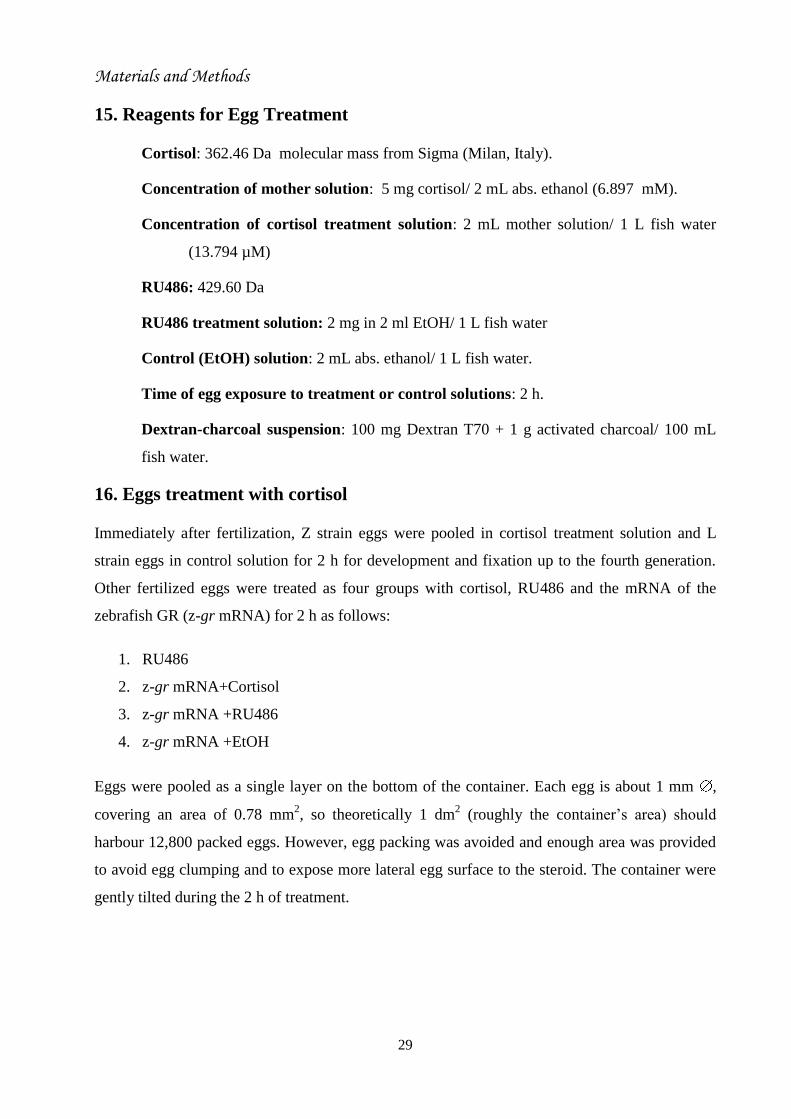
15. Reagents for Egg Treatment
Cortisol: 362.46 Da molecular mass from Sigma (Milan, Italy).
Concentration of mother solution: 5 mg cortisol/ 2 mL abs. ethanol (6.897 mM).
Concentration of cortisol treatment solution: 2 mL mother solution/ 1 L fish water
(13.794 µM)
RU486: 429.60 Da
RU486 treatment solution: 2 mg in 2 ml EtOH/ 1 L fish water
Control (EtOH) solution: 2 mL abs. ethanol/ 1 L fish water.
Time of egg exposure to treatment or control solutions: 2 h.
Dextran-charcoal suspension: 100 mg Dextran T70 + 1 g activated charcoal/ 100 mL
fish water.
16. Eggs treatment with cortisol
Immediately after fertilization, Z strain eggs were pooled in cortisol treatment solution and L
strain eggs in control solution for 2 h for development and fixation up to the fourth generation.
Other fertilized eggs were treated as four groups with cortisol, RU486 and the mRNA of the
zebrafish GR (z-gr mRNA) for 2 h as follows:
1. RU486
2. z-gr mRNA+Cortisol
3. z-gr mRNA +RU486
4. z-gr mRNA +EtOH
Eggs were pooled as a single layer on the bottom of the container. Each egg is about 1 mm ,
covering an area of 0.78 mm2, so theoretically 1 dm
2 (roughly the container’s area) should
harbour 12,800 packed eggs. However, egg packing was avoided and enough area was provided
to avoid egg clumping and to expose more lateral egg surface to the steroid. The container were
gently tilted during the 2 h of treatment.
Materials and Methods
30
17. Treatment termination
After 2 h of treatment, the cortisol treatment solution was poured out and Z eggs were gently
washed 5-fold in fish water to eliminate any trace of cortisol and ethanol. They were then exactly
counted and 300 intact eggs were fixed in liquid nitrogen for cortisol immunoassay. To check for
any persistent cortisol contamination on the egg surfaces, a 300-egg sample was immersed in 10
mL of dextran-charcoal suspension for 5 min, washed 5-fold until clean and fixed in liquid
nitrogen for cortisol immunoassay. The control solution containing L eggs was terminated as
above.
18. Embryo development of the F1 progeny
The remainder of pooled embryos of the Z and L strains were kept separately in Petri dishes (100
embryos/dish) till 2 dpf. While developing, normal embryos of both strains were fixed in liquid
nitrogen for RNA analysis at the following developmental stages:
50 +50+50 embryos at 5 hpf
50 +50+50 embryos at 10 hpf
50 +50+50 embryos at 12 hpf
50 +50+50 embryos at 24 hpf
19. Breeding of F0 fish for sampling of F1 juveniles and adults
Breeding of F0 adult fish of both strains, cortisol treatment of collected Z eggs and its
termination were performed as indicated above. The same was done with the control of L eggs.
20. Juvenile and adult development of the F1 progeny
To equalize the culture environment, the cortisol-treated eggs and larvae of the Z strain and
control eggs and larvae of the L strain were kept together in Petri dishes as 50 Z+ 50 L in
number till 6 dpf, in 1 L-boxes till 20 dpf and in 5 L-tanks till adulthood. Eggs of each strain
obtained from matings carried out within 3 days were considered as belonging to the same stock.
Materials and Methods
31
21. Testing of puberty onset
The first oviposition, marking the onset of puberty, begins after 80 dpf and is generally not
fertile. From 80 dpf onwards, pairs of male and female of each strains were tested for first
mating and the day of first oviposition and the number of laid eggs were checked.
22. Cortisol extractions and radioimmunoassay (RIA)
In order to evaluate the tissue cortisol levels as a stress-response indicator, embryos (n = 50) and
fish (n = 3) were captured and immediately frozen in liquid nitrogen and stored at −80°C until
the cortisol extraction. Whole-body cortisol was measured by a specific microtitre
radioimmunoassay (RIA), as described by Simontacchi et al. (2009). Each sample was weighed,
thawed out and pulverized in liquid nitrogen, and the resulting powders were suspended in 1 ml
phosphate buffer (PBS, pH 7.2). Then the suspension was extracted with 8 ml of diethyl ether
and the supernatant was evaporated to make dry. The dry pellet extracts were then dissolved in
0.5 ml of PBS and varying aliquots were used for radioimmunoassays (RIAs). Finally RIAs were
performed in the Department of Experimental Veterinary Sciences, Faculty of Veterinary
Medicine, University of Padova, Italy.
The anti-cortisol serum showed the following cross-reactions: cortisol 100%, prednisolone
44.3%, 11-deoxycortisol 13.9%, cortisone 4.95%, corticosterone 3.5%, prednisone 2.7%, 17-
hydroxyprogesterone 1.0%, 11-deoxycorticosterone 0.3%, dexamethasone 0.1%, progesterone
< 0.01%, 17-hydroxypregnenolone < 0.01%, pregnenolone < 0.01%.
To validate steroid determination in whole-body larvae, competitive dose-response binding
curves were created by serial extract dilutions of larvae (parallelism test) and the intra-and
interassay tests were performed.
23. Production of second (F2), third (F3) and fourth (F4) generations
At least 50 males and 50 females of Z and L fish of F1, F2 and F3 generations were used to
produce the F2, F3 and F4 generations, respectively. Egg cortisol treatment and development
were carried out as described in section 16-20.

Materials and Methods
32
24. Length and weight measurement
While producing F1, F2, F3 and F4, length and weight of fish at 60, 90, 120, 150 and 180 dpf
were measured. Before measurement 60 to 70% fish of each tank were randomly collected using
scoop net and anesthetized with 0.004% tricaine (ethyl 3-aminobenzoate methanesulfonate salt).
After measurement, fish were restocked in the same tank for further development.
25. RNA isolation
To evaluate gene expression, total RNA was extracted from pools of 50 embryos of Z and L
strains at the desired developmental stages using TRIZOL reagent, according to the
manufacturer’s instructions (Invitrogen, Milan, Italy). The experimental phase of extraction and
manipulation was carried out under a chemical hood using sterile glassware or sterilized at
200°C in oven for the entire night.
Reagents:
TRIzol
Chloroform
Isopropanol
70% Ethanol
25.1. Procedure
For each sample, three replicates were taken. Embryos in individual tubes were kept in liquid
nitrogen until processing. Briefly, 1 ml of Trizol reagent was added to each tube and the sample
was crushed with sterilized glass beads (Sigma) in a Mini-BeadbeaterTM
stirrer for 10 s. The
homogenized sample was incubated for 5 min at room temperature to permit the complete
dissociation of nucleoprotein complexes. Chloroform (0.2 ml) was then added and the tubes were
vigorously shaken for 15 s and left on ice for 1 min. The samples were centrifuged at 12,000 g
for 15 min at 4°C. Following centrifugation, the mixture separates into a lower red, phenol-
chloroform phase, and an upper colourless aqueous phase. RNA remains exclusively in the
aqueous phase. The volume of the aqueous phase is about 60% of the volume of Trizol reagent
used for homogenization. The aqueous solution was transferred to a new 1.5-ml tube and 0.55 ml
Materials and Methods
33
of isopropyl alcohol was added to each tube for RNA precipitation. Tubes were shaken by
inverting and incubated at -20°C for at least 3 h.
After incubation, the samples were centrifuged at 12,000 g for 20 min at 4°C. The RNA
precipitate forms a gel-like pellet on the side and bottom of the tubes. The supernatant was
discarded and RNA was washed twice with 70% ethanol and centrifuged at 7,500 g for 15 min at
4°C. At the end of the procedure, the RNA pellet was dried under a chemical hood for 5-10 min
and re-dissolved in 12-20 µl of RNase-free water. The RNA samples were stored at -80°C until
future use.
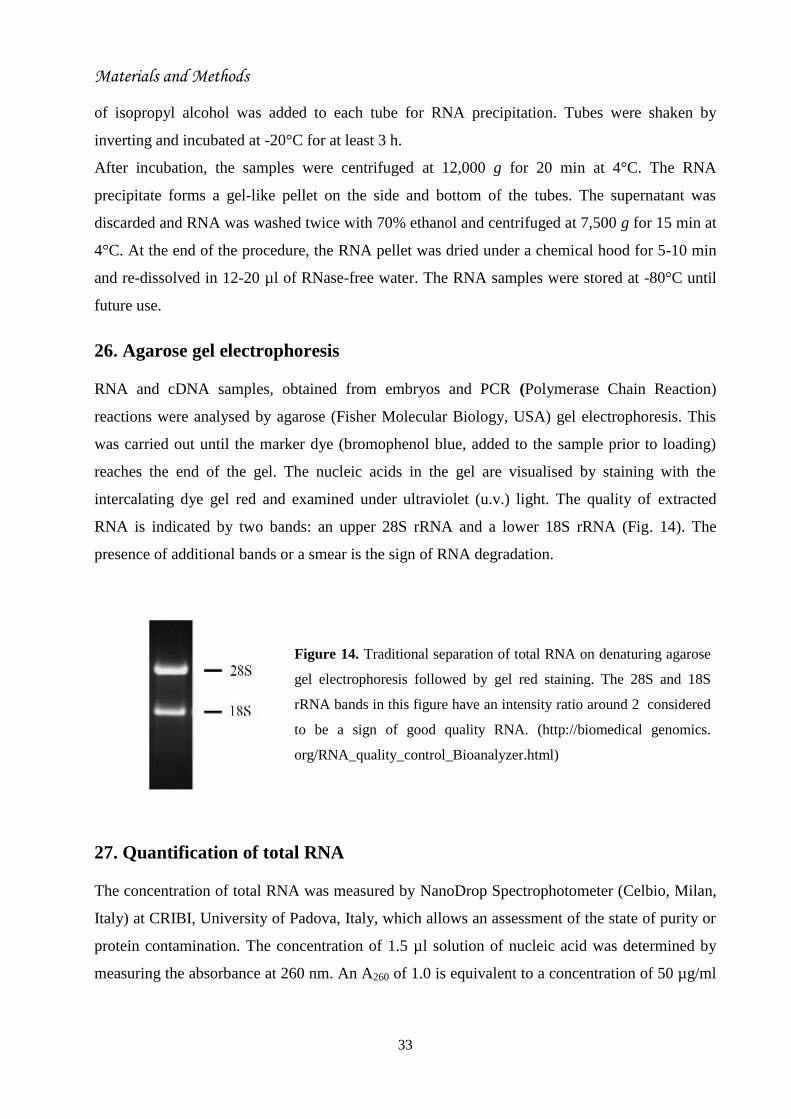
26. Agarose gel electrophoresis
RNA and cDNA samples, obtained from embryos and PCR (Polymerase Chain Reaction)
reactions were analysed by agarose (Fisher Molecular Biology, USA) gel electrophoresis. This
was carried out until the marker dye (bromophenol blue, added to the sample prior to loading)
reaches the end of the gel. The nucleic acids in the gel are visualised by staining with the
intercalating dye gel red and examined under ultraviolet (u.v.) light. The quality of extracted
RNA is indicated by two bands: an upper 28S rRNA and a lower 18S rRNA (Fig. 14). The
presence of additional bands or a smear is the sign of RNA degradation.
27. Quantification of total RNA
The concentration of total RNA was measured by NanoDrop Spectrophotometer (Celbio, Milan,
Italy) at CRIBI, University of Padova, Italy, which allows an assessment of the state of purity or
protein contamination. The concentration of 1.5 µl solution of nucleic acid was determined by
measuring the absorbance at 260 nm. An A260 of 1.0 is equivalent to a concentration of 50 µg/ml
Figure 14. Traditional separation of total RNA on denaturing agarose
gel electrophoresis followed by gel red staining. The 28S and 18S
rRNA bands in this figure have an intensity ratio around 2 considered
to be a sign of good quality RNA. (http://biomedical genomics.
org/RNA_quality_control_Bioanalyzer.html)

Materials and Methods
34
for double-stranded DNA, or 40 µg/ml for single-stranded DNA or RNA. The A260/A280 ratio
should be 1.8 for pure DNA and 2.0 for pure RNA preparations (Nicholl, 1996).
28. Purification of extracted RNA with LiCl precipitation for microarray
hybridization
Highly pure RNA is the key requirement for microarray hybridization, in which A260/A230 must be
higher than 2.2 and A260/A280 should be higher than 2. Extracted RNA contains different types of
contaminants like polysaccharides, carbohydrates, peptides and solvents (phenol, aromatic
compounds). These contaminants were removed by LiCl precipitation. RNA samples were
heated at 40°C for 6 min and centrifuged at 12000 xg for 15 min at 4°C. The pellet contains
contaminants, so the supernatant was transferred to a new clean tube. Then, 9.48 µl of 4 M LiCl
was added to each tube, which was left overnight at 4°C for precipitation. The sample was then
centrifuged at 12000 xg for 20 minutes at 4°C. Following centrifugation, the supernatant was
discarded and 200 µl of 75% EtOH were added to the pellet for washing. The mixture was again
centrifuged at 12000 xg for 20 minutes at 4°C and the supernatant discarded. The RNA pellet
was dried under a chemical hood for 10 minutes and re-dissolved in RNase-free water. Finally,
the RNA was re-quantified by NanoDrop Spectrophotometer.
29. Reverse transcription of RNA
After qualification and quantification of extracted RNA, reverse transcription was performed
using Moloney Murine Leukemia Virus Reverse Transcriptase (M-MLV RT) protocol
(Invitrogen), according to the manufacturer’s instructions. M-MLV RT uses single-stranded
RNA or DNA in the presence of a primer to synthesize a complementary DNA strand.
The M-MLV reverse transcriptase PCR is a two-step process. Briefly, 2µg of the purified total
RNA was mixed with Mix I reaction (Table 3), denatured by incubation at 70oC for 5 min and
then placed on ice for 5 min. Then, 15 µl of Mix II (table 4) were added to each sample. The
samples were incubated in a PCR machine at 25°C for 10 min, 50°C for 50 min and 70°C for 15
min. Then, the cDNA reactions were either stored at -20oC or used for PCR immediately.

Materials and Methods
35
Mix I reaction
Mix II reaction
30. Amplification of DNA by Polymerase Chain Reaction (PCR)
PCR is an enzymatic reaction, used to produce many copies of a specific DNA fragment. PCR
involves thermal denaturation of DNA strands, annealing of primers to the complementary
sequence of DNA and synthesis of a new DNA strand complementary to the DNA template. The
BioTherm™ Taq DNA Polymerase exhibits deoxynucleotidyl transferase activity, which
frequently results in the addition of extra adenines at the 3'-end of PCR products.
Compoments Amount
Random hexamer 2 µl
H2O mQ up to 10 µl
Total 10 µl
Compoments Amount ( µl)
cDNA synthesis Buffer (5X) 5
dNTP Mix (10 mM) 1.25
M-MLV reverse transcriptase enzyme 0.3
H2O mQ up to 15 µl
Total 15 µl
Table 3. Reverse transcriptase PCR MixI.
Table 4. Reverse transcriptase PCR MixII.

Materials and Methods
36
31. Touchdown PCR
Touchdown PCR is a method of polymerase chain reaction by which primers will avoid
amplifying nonspecific sequences. The annealing temperature during a polymerase chain
reaction determines the specificity of primer annealing. The melting point of the primer sets the
upper limit on annealing temperature. The annealing temperature of the initial cycle is 5-10°C
above the melting temperature of the primers and the temperature is gradually reduced by 1°C
for each following cycle down to the lowest melting temperature value of the primer. The
amplification condition of touchdown PCR is as follows:
Touchdown PCR condition
Steps Time Temperature Cycles
Initialization 2 min 95°C 1
Denaturation 30 sec 95°C
40 Annealing 30 sec 62°-50°C
Extension 1min per kb 72°C
Final extension 10 min 72°C 1
Termination 2 min 20°C 1
The number of cycles depends on the temperature range chosen for the reaction, according to the
melting temperature of the primers used. The duration of the extension depends
on the expected length of the amplification.
Table 5. PCR thermal cycler condition.

Materials and Methods
37
Reaction mix
32. Purification of PCR product by ExoSAP-IT®
The ExonucleaseI/Shrimp Alcaline Phosphatase (ExoSAP-IT®) method treats PCR products,
ranging in size from less than 100 bp to over 20 kbp, to remove unused primers and nucleotides
with absolutely no sample loss. The post-PCR reaction product was mixed with 2 μl of Exosap-
IT in a final volume of 7 μl. Then, the reaction was carried out as follows:
Time Temperature Function
15 min 37oC Degradation of primers and nucleotides
15 min 80oC Inactivation of ExoSAP-IT
10 min 4oC Hold final
Finally, 2 μl (3.2 pmol) of specific primer was added to the purified PCR DNA product sample
for sequencing.
Compoments Amount ( µl)
Buffer 10X 2.5
MgCl2 (50 mM) 1
dNTPs Mix (10 mM) 0.5
Taq Biotherm (5 U/μl) 0.2
Oligo forward (10 μM) 0.5
Oligo reverse (10 μM) 0.5
cDNA 1
H2O mQ up to 25
Total 25 µl
Table 6: PCR reaction mix.
Table 7. PCR conditions.

Materials and Methods
38
33. DNA sequencing
DNA sequencing was performed by BMR Genomics (Padova, Italy). For this purpose, a mix
containing the specific primer (3.2 pmol) and the required amount of purified DNA was
prepared. The mix was dried at 65°C and then delivered to BMR for sequencing.
34. Cloning
34.1. Ligation
Ligation of DNA fragment was performed into pGEM®-T Easy vector (Fig. 15) (Promega,
Milan, Italy), according to the manufacturer´s instructions. The pGEM®-T Easy vector is a
linearized vector with a single 3´-terminal thymidine at both ends. The T-overhangs at the
insertion site greatly improve the efficiency of ligation of PCR products by preventing
recircularization of the vector and providing a compatible overhang for PCR products generated
by certain thermostable polymerases. The promoter and multiple cloning sequence of pGEM®
-T
Easy vector is shown in figure 15.
(http://wwwpromega.com/paguide/images/1473VA05_6A.jpg)
Figure 15. Map of pGEM® Easy plasmid vector.

Materials and Methods
39
Figure 16. The promoter and multiple cloning sequence of the pGEM®-T Easy Vector.The top strand
corresponds to the RNA synthesized by T7 RNA polymerase. The bottom strand corresponds to the RNA
synthesized by SP6 RNA polymerase.
The appropriate amount of DNA fragments for using in the ligation reaction was calculated by
the following equation:
Usually, the ligation reaction was performed as follows:
The reaction was incubated at 4°C overnight and then used to transform chemically competent
bacteria.
Compoments Amount ( µl)
pGEM®-T Easy vector (50 ng) 1
2X rapid ligation buffer, T4 DNA ligase 5
PCR product X
T4 DNA ligase (3 U/ μl) 1
H2O mQ up to 10
Total 10 µl
Table 8. Ligation reaction mix.

Materials and Methods
40
34.2. Bacterial transformation
Plasmid (with DNA) is inserted into competent bacteria by a process called transformation. To
obtain transgenic bacteria, DNA plasmids from the ligation step were transferred into competent
E. coli cells (JM109 from Promega) by heat shock-induced transformation. Briefly, about 200 μl
of competent bacteria were mixed with 5 μl of ligation reaction and the tubes incubated on ice
for 30 min. The suspension was then heated at 42°C for 40 sec and incubated on ice for 1 min.
Then 1 ml of LB Broth was added and the suspension was shaken at 200 rev/min speed for 1
hour at 37°C. In the meantime, the ampicillin LB-Agar plates were prepared with 80 μl of X-Gal
(20 mg/ml) and 100 μl of the inductor IPTG (0.1 M). The suspension of bacteria was then
centrifuged at 12000 xg for 1 min. The upper solution was discarded and the lower
transformation culture was plated onto LB-plates. The plates were incubated at 37°C overnight.
According to the Technical manual of Promega, bacteria carrying a plasmid without the insert
possess a functional β-galactosidase gene and produce blue colonies due to the X-Gal reaction.
In contrast, bacteria containing a plasmid with the insert of interest have a disrupted β-
galactosidase gene and produce white colonies.
34.3. Identification of positive colonies by PCR
Following bacterial transformation, single white colonies were picked from incubated plates with
pipette tips. The single colony present on the tip was streaked onto a fresh replicate LB-plate and
also added to the PCR Mix I (Table 9). The PCR tubes were incubated at 98°C for 10 min to
destroy the bacterial cells. Then the PCR Mix II (Table 10), containing the Taq polymerase, was
added.
PCR Reaction MixI
Table 9. Reaction MixI.
Compoments Quantity ( µl)
10X buffer reaction 2
MgCl2 (50 μM) 1
dNTPs (10mM) 0.6
Primer forward (10μM) 0.6
Primer reverse (10μM) 0.6
H2O mQ Up to 20
Total 20 µl
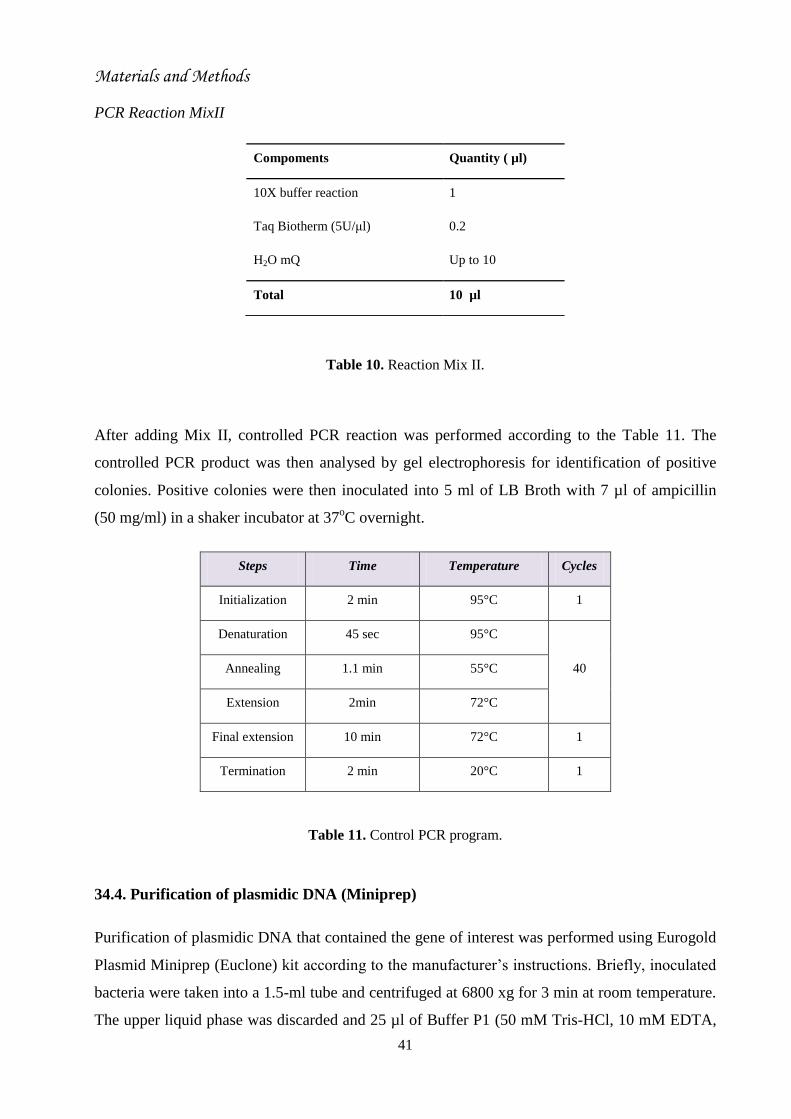
Materials and Methods
41
PCR Reaction MixII
Table 10. Reaction Mix II.
After adding Mix II, controlled PCR reaction was performed according to the Table 11. The
controlled PCR product was then analysed by gel electrophoresis for identification of positive
colonies. Positive colonies were then inoculated into 5 ml of LB Broth with 7 µl of ampicillin
(50 mg/ml) in a shaker incubator at 37oC overnight.
Steps Time Temperature Cycles
Initialization 2 min 95°C 1
Denaturation 45 sec 95°C
40 Annealing 1.1 min 55°C
Extension 2min 72°C
Final extension 10 min 72°C 1
Termination 2 min 20°C 1
Table 11. Control PCR program.
34.4. Purification of plasmidic DNA (Miniprep)
Purification of plasmidic DNA that contained the gene of interest was performed using Eurogold
Plasmid Miniprep (Euclone) kit according to the manufacturer’s instructions. Briefly, inoculated
bacteria were taken into a 1.5-ml tube and centrifuged at 6800 xg for 3 min at room temperature.
The upper liquid phase was discarded and 25 µl of Buffer P1 (50 mM Tris-HCl, 10 mM EDTA,
Compoments Quantity ( µl)
10X buffer reaction 1
Taq Biotherm (5U/μl) 0.2
H2O mQ Up to 10
Total 10 µl

Materials and Methods
42
pH 8.0, 25°C, 50 ug/ml RNase A) and 250 µl of Buffer P2 (0.2 M NaOH, 1% SDS) were added
to the tube, which was kept at room temperature for 5 min. Then, 350 µl of Buffer N3 (4 M
guanidine hydrochloride, 0.5M Potassium acetate, pH 4.2) was added to the tube and centrifuged
at 17,900 xg for 10 min at room temperature. After centrifugation, one high pure filter was
inserted into one collection tube. The entire supernatant was transferred onto the filter and
centrifuged for 1 min at full speed. After centrifugation, the filter tube was removed from the
collection tube, the follow-through liquid was discarded and the filter tube reinserted in the same
collection tube. Then, 500 µl of Buffer PB (5 M guanidine hydrochloride, 20 mM Tris-HCl, pH
6.6, 25°C and isopropanol to 38%) was added, centrifuged for 1 min and the flow-through was
discarded. Again, 750 µl of Buffer PE (mM NaCl, 2 mM Tris-HCl, pH 7.5, 25°C, and ethanol to
70%) was added and the flow-through was discarded after 1 min centrifugation. Finally,
plasmidic DNA was eluted with 25 µl of H2O and screened with NanoDrop quantification and
sequencing (see section 27 and 33 ).
35. Quantitative Real-Time Polymerase Chain Reaction (qPCR)
35.1. Absolute quantification
In absolute quantification assays, the concentration of a target molecule is expressed as an
absolute value. This is based on a standard curve, which is prepared from samples of known
template concentrations. To create the standard curves for absolute qPCR, sequenced PCR
products were cloned into the pGEM-T Easy vector (see section 34). The copy numbers of the
plasmid DNA templates were calculated according to the plasmid molecular weight and then
converted into copy numbers on the basis of Avogadro’s number. Serial dilutions of 108–10
2
plasmids/μl were used to generate the calibration curves.
Absolute qPCR was performed using the 7500 Real-Time PCR System (Applied Biosystems,
Foster City, CA) and GoTaq®
qPCR Master Mix kit (Promega) (Table 12) according to the
manufacturer’s protocol. All samples were analyzed in triplicate in 20 μl volume.

Materials and Methods
43
Table 12. Absolute qPCR reaction mix.
* 1 µl of plasmid for standard curves and 2 µl of cDNA per each sample
Threshold values for threshold cycle (Ct) determination were generated automatically by the
7500 Real-Time PCR System software. Specificity of the reaction was checked by analysis of
the amplification curve of the final amplified product. The results were reported as expression,
after normalization, of the transcript amount with respect to the reference gene (ef1a). The
reaction conditions were performed as shown in the Table 13.
Steps Time Temperature Cycles
Taq activation 2 min 95°C 1
Denaturation 15 s 95°C
45
Annealing 1 min 56°C
Table 13. Absolute qPCR thermal cycler protocol.
35.2. Relative quantification
In relative quantification method, the target concentration is expressed as a ratio of target-to-
reference gene in the same sample, rather than as an absolute value. The reference gene is an
unregulated nucleic acid that is found at constant copy number in all samples. Relative qPCR
mix and thermal cycler protocol for relative qPCR are shown in the following tables:
Compoments Quantity ( µl)
GoTaq®
qPCR Master Mix, 2X 10
Primer forward (10μM) 0.4
Primer reverse (10μM) 0.4
CXR dye 0.2
cDNA X*
H2O mQ Up to 20 µl
Total 20 µl

Materials and Methods
44
qPCR Reaction Mix
Table 14. Realtive qPCR reaction mix.
Relative qPCR condition
Steps Time Temperature Cycles
Taq activation 10 min 95°C 1
Denaturation 30 s 95°C
45
Annealing 1 min 57°C
Table 15. Relative qPCR thermal cycler condition.
Each cDNA sample was amplified using specific forward and reverse primers that were derived
from mRNA sequences contained in the NCBI database (www.ncbi.nlm.nih.gov). The primers
were designed to cross exon/exon boundaries of coding regions in order to prevent co-
amplification of genomic DNA, which may compromise assay specificity and dynamic range.
ef1a was used as housekeeping gene to verify the quality of cDNA synthesis. The list of primers
used in relative qPCR is as described in Table 16.
Components Quantity ( µl)
qPCR Master Mix 10
Primer forward (10μM) 0.4
Primer reverse (10μM) 0.4
ROX dye 0.2
cDNA 1
H2O mQ Up to 20 µl
Total 20 µl

Materials and Methods
45
Primer Orientation Sequence (5′ to 3′) Accession number
ef1a-F Sense GACAAGAGAACCATCGAG
NM_131263
ef1a-R Antisense CCTCAAACTCACCGACAC
rplp0-F Sense CTGAACATCTCGCCCTTCTC
NM_131580
rplp0-R Antisense TAGCCGATCTGCAGACACAC
vasp-F1 Sense GTAAGATGCAGACTGACCAGC
NM_001017790
vasp-R2 Antisense CTCTCTTGCTGCTCCAGCC
plp1a-F1 Sense CAGTTCGGCAATCACTCG
NM_175576
plp1a-R1 Antisense GTACTGTCTGGCATCAATGC
stmn2a-F1 Sense CAGCATCACCTCTCCTCC
NM_001005923
stmn2a-R1 Antisense GCTTTGAGCAGCACATCC
parn-F1 Sense CAAGCGCAGCATCAGTC
NM_201088
parn-R1 Antisense TCCGCCTCCTCTGCCAC
notch2-F1 Sense GACGAATGCATCTCCAGTGC
NM_001115094
notch2-R1 Antisense GCAGCAGCCACAGCAACC
tsc22d3-F Sense AGCTCGCACTCTACCAGC
NM_200569
tsc22d3-R Antisense GTGCTCCTTCAAGATCTCC
Mat1a-F1 Sense GGGTAGCGAAGTCTCTGG
NM_199871
Mat1a-R1 Antisense TAGCAGGCGGTGTTCTGG
igf-2a-F Sense TCAAACAGCCGCCGTCCTCC
NM_131433
igf-2a-R1 Antisense GAAAAAGTGCCTCTACTGACC
mcm6-F2 Sense ACCGCGTCTACAGTCTCG
NM_001082849
mcm6-R1 Antisense AGCAGCCTGAAAGCCTCC
Table 16. List of primers

Materials and Methods
46
36. Two-color Microarray hybridization
A DNA microarray is a stamp-sized piece of glass or plastic on which single-stranded fragments
of DNA (also called probes) representing the genes of an organism have been attached in a
microscopic array. As many as 30,000 spots can fit on one slide and each fragment can bind to
complementary DNA or RNA strand. Two-color Microarray-based gene expression analysis
(Agilent Technologies, Santa Clara, CA) was performed to analyze the gene expression of
embryos treated with cortisol (sections 16-17) at 5, 12 and 24 hpf, as shown in Figure 17. The
analysis was performed at CRIBI, using Agilent Whole Zebrafish Genome Oligo Microarrays
4x44K slide.
Figure 17. Scheme of amplified cRNA procedure (Protocol of Agilent Technologies, USA).
Oligo Microarrays
BA
A+B

Materials and Methods
47
36.1. RNA quality control for microarray hybridization
The assessment of RNA integrity is a critical first step in obtaining meaningful gene expression
data. Using intact RNA is a key element for successful microarray analyses. The Agilent 2100
bioanalyzer and RNA LabChip were used to perform RNA quality assessment and
quantification. The bioanalyzer software automatically generates the ratio of the 18S to 28S
ribosomal subunits. This ratio plays an important role in determining the level of sample
degradation in gel electrophoresis. The Agilent technology has also introduced a new tool for
RNA quality assessment: the RNA Integrity Number (RIN). The RIN software algorithm allows
the classification of eukaryotic total RNA, based on a numbering system from 1 to 10, with 1
being the most degraded profile and 10 being the most intact one (Fig. 18). Only the samples
having RIN value greater than 7 were used to perform microarray hybridization.
Figure 18. The RIN number was tested on samples of varying levels of intactness. The RIN software
algorithm was able to accurately classify the samples.
36.2. Sample preparation, hybridization and microarray wash
Agilent's Two-Color Microarray-based Gene Expression Analysis used cyanine 3- and cyanine
5-labeled targets to measure gene expression in control and experimental samples. Figure 19 is a
standard workflow for sample preparation and array hybridization design.
Briefly, after the preparation of Spike A and Spike B Mix, the synthesis of double-stranded
cDNA was performed. This is followed by the synthesis of cRNA labelled with cyanine 3 (Cy3)
and cyanine 5(Cy5) for control and cortisol treated samples, respectively. The cRNA was

Materials and Methods
48
purified and quantified with NanoDrop Spectrophotometer. Absorbance ratios 260/280 nm and
260/230 nm were measured to check a good quality (≥ 2) of samples. In addition, cyanine 3 or
cyanine 5 dye concentration (pmol/μl) was also measured. The samples were then hybridized
with 2x GEx Hybridization Buffer in 4x44K array at 65°C for 17 h. Then the microarray slide
was washed two times with GE wash buffer 1 and GE wash buffer 2, respectively.
Figure 19. The workflow for sample preparation and array processing.
36.3. Scanning, feature extraction and data analysis
Fluorescence signals of the hybridized Agilent Oligo Microarrays were detected using Agilent’s
DNA microarray scanner. The Agilent Feature Extraction Software (FES) was used to read out
and process the microarray image files. The software determines feature intensities and ratios
(including background subtraction and normalization), rejects outliers and calculates statistical
confidences (P values). For determination of differential gene expression, FES-derived output
data files were further analyzed using the Rosetta Resolverâ gene expression data analysis
system (Rosetta Biosoftware, Agilent). Subsequently, the genes were classified into functional
Materials and Methods
49
groups using gene ontology and analyzed individually at the site "Entrez Gene"
(http://www.ncbi.nlm.nih.gov/gene).
37. Morpholino microinjection of fertilized eggs
Microinjections of single-cell fertilized eggs were performed with antisense oligonucleotides,
called MO, and GR-mRNA. MO oligonucleotides were designed and synthesized by Gene
Tools, Philomath, OR, USA (www.gene-tools.com). The sequences of MOs were as follows:
grMO-ATG-1: 5’- CATTCTCCAGTCCTCCTTGATCCAT- 3’
grMO-ATG-1 was designed around the start codon (ATG) of zebrafish glucocorticoid receptor
coding sequence (Accession number EF567112). Morpholino oligos were delivered from a pre-
quantified, sterile, salt-free, lyophilized solid in a glass vial. The stock solutions (8 mg/ml) was
prepared with nuclease-free water, as advised by Genetool’s protocols, and kept at RT. MO
working solutions were prepared diluting the stock solutions in Danieau 1X and adding Phenol
Red (Sigma) to make the solutions visible during microinjection. Different MO concentrations
were tested in a range between 0.5 and 2 μg/ml.
38. Preparation of the needles
The needles for microinjection were prepared from 1.2 mm thin-walled glass capillaries (World
Precision Instruments Inc., WPI, Germany) by a puller micropipette (Flaming/Brown p-97
Micropipette Puller, Setter Instruments, Crisel Instruments, Rome, Italy). The parameter of the
micropipette puller was set as heat 95, velocity 60, time 50 and pull 60.
The freshly laid eggs were collected and placed in a Petri dish containing fish water. They were
then aligned against a clean glass slide on the lid of a Petri dish to facilitate microinjection. The
microinjection was carried out using an air pump controlled pedal (Pneumatic Picopump PV82,
Word Precision Instruments Inc.). A micromanipulator (Leitz) and a stereomicroscope with 3.2
X magnification was used to monitor the procedure. The samples (MO and mRNA) were loaded
with 0.5-20-μl GELoader tips (Eppendorf, Milan, Italy) into the injection needles. Then, the tip
of injection needles was broken with dissection forceps. The samples (MO and mRNA) were
injected into the yolk sac of 1 or 2-cell stage embryos. After injection, embryos were incubated
in fish water and kept at 28.5ºC in an incubator. MO- and/or mRNA-injected embryos were
raised to the desired stages for observations or fixed for RNA analysis.

Materials and Methods
50
39. Preparation of z-gr RNA
The full-length z-gr cDNA was amplified using primers containing overhangs with restriction
sites for further specific subcloning into the vector pCS2+ (Fig. 20).
- z-gr-F: CGGGATCCCGGCAAAATGGATCAAGGAGGA (restriction site of BamHI is
shown as bold italic letters)
- z-gr-R: GCTCTAGAGCCTGCTGTTGGGAGGAGATTC (restriction site of XbaI is shown
as bold italic letters)
Full-length z-gr cDNA was cloned into pGEM-T Easy and subcloned into pCS2+ expression
vector using BamHI and XbaI (Table 15) restriction enzymes. After complete sequencing to
check for nucleotide changes that could alter the amino acidic sequence or interrupt the
translation-reading frame, one positive clone was linearized with XbaI.
Restriction enzyme Recognition sequence
XbaI T▼CTAGA
BamHI G▼GATCC
Table 17. Recognition sequences for specific restriction enzyme.

Materials and Methods
51
Figure 20. Map of pCS2+ vector (www.biovisualtech.com/bvplasmid/pCS2+.htm).
Efficiency of linearization was checked on agarose gel electrophoresis and the linear DNA was
purified using phenol/chloroform extraction. Briefly, 50 μl of sterile water, 50 μl of chloroform
and 50 μl of phenol are added to 50 μl of digestion product; the reaction mix is vortexed
vigorously to mix the phases and centrifuged at 12,000 g for 1 min. After centrifugation, the
supernatant (aqueous phase) was transferred to a new tube and mixed with 50 μl of chloroform
and 50 μl of phenol. The mix was vortexed and centrifuged at 12,000 g for 1 min. Again, the
supernatant was transferred into a new tube, mixed with 100 μl chloroform and centrifuged at
12,000 g for 1 min. After transferring the supernatant into a new tube, 10 μl of 4 M NaCl and
250 μl of 100% ethanol are added and gently mixed. The sample was chilled at -80°C for at least
1 h. The sample is then centrifuged at 12,000 g at 4°C for 20 min. The pellet obtained was
washed with 70% ethanol, dried and resuspended in 10-15 μl of mQ H2O.

Materials and Methods
52
Full length z-gr mRNA was in vitro transcribed and 5’-capped with the SP6 polimerase using the
kit mMessage mMachine according to manufacturer’s protocol (Ambion, Milan, Italy). The
reaction (Table 18) was incubated at 37°C for 2 h. The template DNA was digested at the end of
the reaction with DNAse I, RNAse-free. The RNA was then precipitated in LiCl and
subsequently dissolved in mQ H2O. The RNA concentration was determined using a NanoDrop
Spectrophotometer (Thermo Scientific, Euroclone, Milan, Italy). The in vitro transcribed mRNA
was stored at -80°C.
Components Quantity( µl)
Linear template DNA (1 μg) 5.2
mQ H2O 1.5
2X NTP/CAP 10
10X Reaction Buffer 2
Enzyme Mix 2
Total 20 µl
Table 18. Reaction Mix.
This z-gr mRNA was diluted with 200 ng/µl concentration and microinjected into fertilized one-
cell stage embryos according to the following treatments:
Group 1. z-gr mRNA+ Cortisol
Group 2. z-gr mRNA+EtOH
Group 3. z-gr mRNA+RU486
Treatment termination: 2 h
After 2 h treatment, the embryos were fixed at 5 and 10 hpf for RNA analysis.

Materials and Methods
53
40. Statistical analysis
All values are presented as mean±standard error of the mean (sem) and mean±standard deviation
(SD). Cortisol immunoassay data were analysed by using one-way analysis of variance
(ANOVA) followed by LSD pair-wise multiple comparison test. Where F values indicated
statistical significance (P < 0.05),
SAM 3.0 (Significance Analysis of Microarrays) statistical program was used to analyse
expression of up- and down-regulated genes using 1% False Discovery Rate (FDR), which
points out statistically significant up- and down-regulated genes from the set of a microarray
experiment.
Relative qPCR results were analysed using REST 2009 (Relative Expression Software Tool)
program to estimate up and down regulation for gene expression of some cortisol responsive
genes. One-way ANOVA, followed by Tukey HSD multiple comparison test was performed to
analyse absolute qPCR results to point out significantly up- and down-regulated genes.
Effects of different treatments on the percentage of mortality and abnormal phenotypes of
embryos data were analysed using one-way ANOVA, followed by LSD multiple comparison
test. Length and weight of fish at different time points and generations were analysed using
paired sample Student's t-tests. For all statistical tests, a probability level of P < 0.05 was
considered to be significant.

Materials and Methods
54
41. ABBREVIATIONS
ACTH adrenocorticotropic hormone
ANOVA analysis of variance
AP accessory proteins
BAC bacterial artificial chromosome
bp base pairs
cDNA
complementary DNA
CRF corticotropin-releasing factor
Ct threshold cycle
Cy3
cyanine-3 (green)
Cy5 cyanine-5 (red)
Da dalton
DBD DNA-binding domain
DNA deoxyribonucleic acid
dpf days post fertilization
ENU Ethylnitrosourea
ER estrogen receptor
EVL enveloping layer
ExoSAP exonucleasei/shrimp alcaline phosphatase
F cortisol
F0 parent stock
F1 first generation
F2 second generation
F3 third generation
F4 fourth generation
FDR
false discovery rates
FES feature extraction software
Fig. figure
FU fluorescence
g
gram

Materials and Methods
55
g gravity force
GO gene ontology
GR
glucocorticoid receptor
GRE glucocorticoid-response element
h
hour
hpf
hour post-fertilization
HPI
hypothalamus-pituitary-interrenal
HSD Honestly Significant Difference
l
liter
kbp kilo base pairs
kDa kiloDalton
L leopard
LBD
ligand-binding domain
LDL
low-density lipoprotein
LSD
least significant difference
MBT midblastula transition
MC2R melanocortin 2 receptor
min minute
mL milliliter
mM millimolar
M-MLV RT moloney murine leukemia virus reverse
transcriptase
mmol millimole
MO morpholino oligonucleotides
mRNA messenger ribonucleic acid
nt nucleotide size
PBS phosphate buffer
PGCs
primordial germ cells
pH
potential of hydrogen
Pmol
picomole
qPCR
quantitative real-time polymerase chain
reaction

Materials and Methods
56
REST
relative expression software tool
RIA radioimmunoassay
RIN RNA integrity number
RISC RNA-induced silencing complex
RNA ribonucleic acid
rRNA
ribosomal RNA
RT room temperature
RU486
mifepristone
s second
SD standard deviation
S-DNA phosphorothioate-linked DNA
SEM standard error of mean
siRNA
short interfering RNA
StAR steroidogenic acute regulatory protein
U unit
VLDL very-low-density lipoprotein
WT wild type
X-Gal 5-bromo-4-chloro-3-indolyl-beta-D-
galactopyranoside
YSL yolk syncytial layer
Z zebra
μg microgram
μl microliter
μm micrometer
μM micromolar

Results
57
RESULTS
42. Cortisol immunoassay
The cortisol immunoassay showed an acceptable parallelism test for both embryos of zebrafish.
For embryos just after treatment, the parallelism test showed: y=16.59x-0.23; r2= 0.996, and
reproducibility CV % intra-assay = 5.29. Cortisol concentrations of cortisol-treated embryos and
control for F1, F2, F3 and F4 generations are shown in Table 19.
F1 F2 F3 F4
Cortisol- treated
embryos (pg/egg) 4.3±1.1
a 2.9±0.49
a 4.0±2.5
a 3.6±0.80
a
Control embryos
(pg/egg) 0.2±0.01
b 0.27±0.05
b 0.53±0.3
a 0.5±0.2
b
Table 19. The cortisol concentration of cortisol-treated embryos and control embryos for F1, F2, F3 and
F4 generations. Cortisol concentrations (mean±SD) with different letters in each column indicate
statistically differences from one another (p < 0.05, paired sample t-test).
The cortisol-treated embryos displayed significantly higher (p < 0.05) cortisol concentration than
control in F1, F2 and F4 generations. But there was no statistical significant difference in F3
between cortisol-treated and control embryos.
43. Microarray analysis of the effect of cortisol hormone on gene expression
Microarray analysis of cortisol-treated embryos and control was performed to investigate
glucocorticoid-dependent gene expression in zebrafish. Samples were collected at 5, 12 and 24
hpf, corresponding to the 40%-epiboly Blastula, 6-somite Segmentation and prim-5 Pharyngula
stages, respectively. Prior to analysis, fertilized eggs F1 were immersed in treatment and control
solutions for 2 h. Thereafter, eggs were poured out from treatment and control solutions and
washed gently 5-fold in fish water to eliminate any trace of cortisol and ethanol. Then, embryos
were sampled at 5, 12 and 24 hpf for microarray analysis.
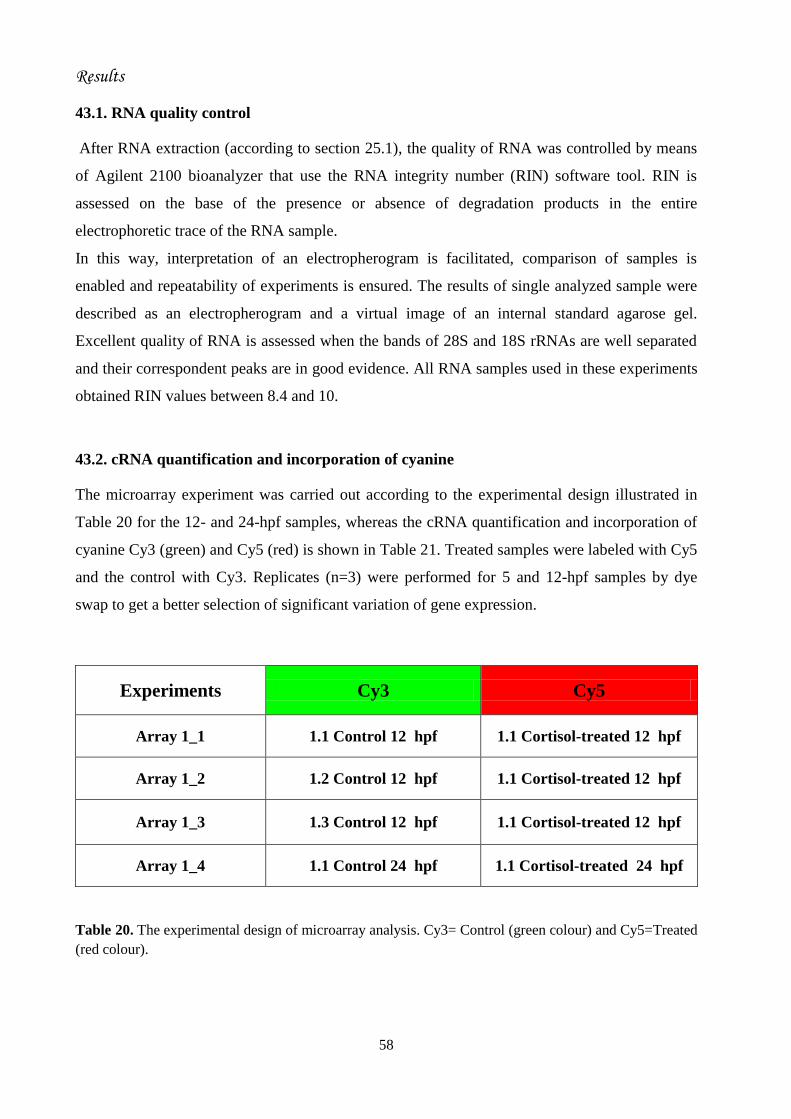
Results
58
43.1. RNA quality control
After RNA extraction (according to section 25.1), the quality of RNA was controlled by means
of Agilent 2100 bioanalyzer that use the RNA integrity number (RIN) software tool. RIN is
assessed on the base of the presence or absence of degradation products in the entire
electrophoretic trace of the RNA sample.
In this way, interpretation of an electropherogram is facilitated, comparison of samples is
enabled and repeatability of experiments is ensured. The results of single analyzed sample were
described as an electropherogram and a virtual image of an internal standard agarose gel.
Excellent quality of RNA is assessed when the bands of 28S and 18S rRNAs are well separated
and their correspondent peaks are in good evidence. All RNA samples used in these experiments
obtained RIN values between 8.4 and 10.
43.2. cRNA quantification and incorporation of cyanine
The microarray experiment was carried out according to the experimental design illustrated in
Table 20 for the 12- and 24-hpf samples, whereas the cRNA quantification and incorporation of
cyanine Cy3 (green) and Cy5 (red) is shown in Table 21. Treated samples were labeled with Cy5
and the control with Cy3. Replicates (n=3) were performed for 5 and 12-hpf samples by dye
swap to get a better selection of significant variation of gene expression.
Experiments Cy3 Cy5
Array 1_1 1.1 Control 12 hpf 1.1 Cortisol-treated 12 hpf
Array 1_2 1.2 Control 12 hpf 1.1 Cortisol-treated 12 hpf
Array 1_3 1.3 Control 12 hpf 1.1 Cortisol-treated 12 hpf
Array 1_4 1.1 Control 24 hpf 1.1 Cortisol-treated 24 hpf
Table 20. The experimental design of microarray analysis. Cy3= Control (green colour) and Cy5=Treated
(red colour).

Results
59
Table 21. Quantification of cRNA and incorporation rates of cyanine Cy3 (green) and Cy5 (red) for
control and treatment samples, respectively.
43.3. Scanning and microarray data analysis
High throughput gene expression data from microarray experiments were collected by scanning
the signal intensities of the corresponding spots on the array by dedicated fluorescence Agilent’s
DNA microarray scanner. An example of the spatial distribution of significantly up- and down-
regulated features is shown in Figure 21, where red spot indicates that the fluorescence intensity
of the Cy5 signal is higher than that of Cy3, which means that the corresponding gene is over-
expressed. Green spots indicate that the fluorescence intensity is higher in the control sample
than treatment sample, which means that the corresponding gene is down-regulated.
Samples Labeling Concentration
cRNA (ng/µl) Volume (µl)
Dye
(picomol/µl)
Incorporation
rate (pmol/µg)
1.1 Control
12 hpf Cy3 411 30 7.3 17.8
1.2 Control
12 hpf Cy3 362 30 3.2 8.8
1.3 Control
12 hpf Cy3 293 30 4.7 16.4
1.1 Control
24 hpf Cy3 296 30 3.1 12.5
1.1 Cortisol-
treated 12
hpf
Cy5 248 30 5.1 12.5
1.1 Cortisol-
treated 12
hpf
Cy5 407 30 4.7 13.4
1.1 Cortisol-
treated 12
hpf
Cy5 350 30 2.5 8.3
1.1 Cortisol-
treated 24
hpf
Cy5 371 30 4.5 12

Results
60
Figure 21. An example of the spatial distribution of significantly up- and down-regulated features.
Image processing was performed using Agilent's Feature Extraction Software (FES) and the
normalization of data was performed automatically. This software offers, among other features,
the possibility to visualize the results of the data analysis in a log ratio versus log processed
signal scatter plot. An example of log ratio versus log processed signal scatter plot is shown in
Figure 22.

Results
61
Figure 22. Scatter plot of log ratio versus log processed signal intensities (an example of one array
experiment). Red spot: significantly up-regulated genes (P < 0.05). Green spot: significantly down-
regulated genes (P < 0.05). Yellow spot: Not differentially expressed genes. Blue spot: Genes used to
normalize.
43.4. Interpretation of microarray results
The differentially expressed up- and down-regulated genes were analysed using SAM
(Significance Analysis of Microarrays) statistical program using one percent FDR, which points
out statistically significant up- and down-regulated genes from the set of a microarray
experiment. The results showed that 100 genes were significantly up-regulated at 5 hpf, whereas
none was down-regulated. At 12 hpf, 149 genes were dys-regulated, with 143 up-regulated and 6
down-regulated. There were 33 common dys-regulated genes from 5 and 12 hpf (Table 22). A
description of up- and down-regulated genes at 5 and 12 hpf with their functional groups are
shown in Tables 23 and 24, respectively.
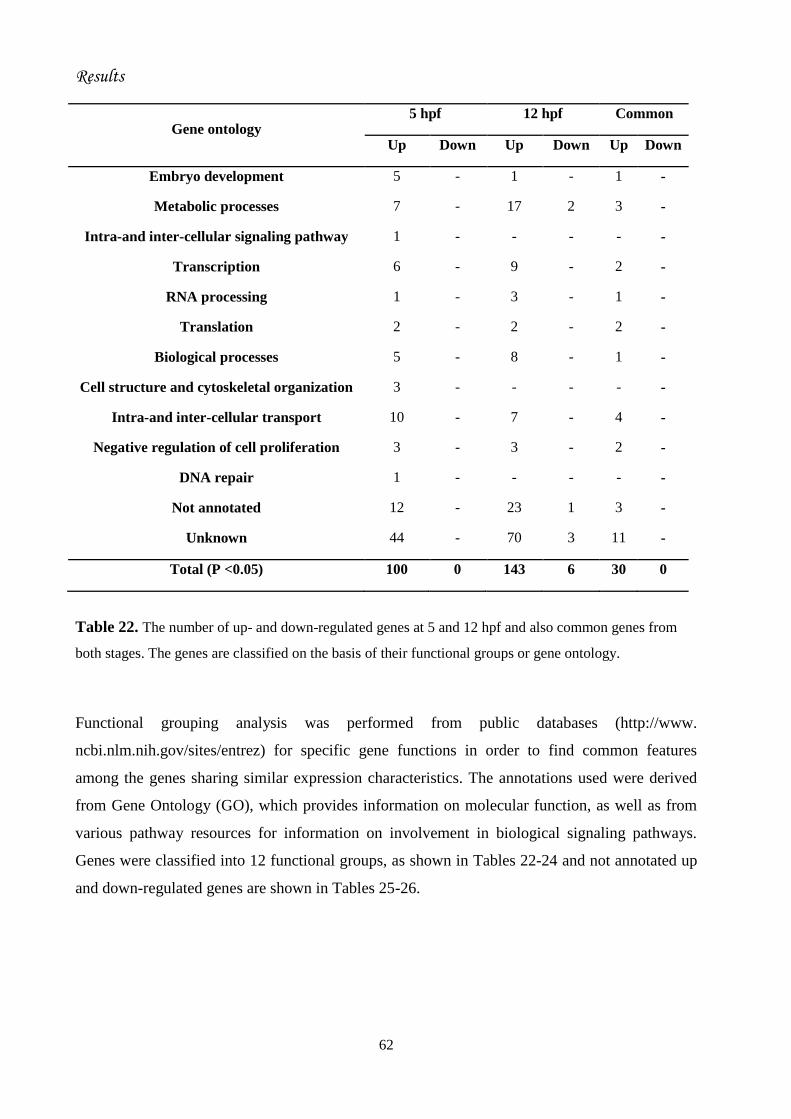
Results
62
Gene ontology 5 hpf 12 hpf Common
Up Down Up Down Up Down
Embryo development 5 - 1 - 1 -
Metabolic processes 7 - 17 2 3 -
Intra-and inter-cellular signaling pathway 1 - - - - -
Transcription 6 - 9 - 2 -
RNA processing 1 - 3 - 1 -
Translation 2 - 2 - 2 -
Biological processes 5 - 8 - 1 -
Cell structure and cytoskeletal organization 3 - - - - -
Intra-and inter-cellular transport 10 - 7 - 4 -
Negative regulation of cell proliferation 3 - 3 - 2 -
DNA repair 1 - - - - -
Not annotated 12 - 23 1 3 -
Unknown 44 - 70 3 11 -
Total (P <0.05) 100 0 143 6 30 0
Table 22. The number of up- and down-regulated genes at 5 and 12 hpf and also common genes from
both stages. The genes are classified on the basis of their functional groups or gene ontology.
Functional grouping analysis was performed from public databases (http://www.
ncbi.nlm.nih.gov/sites/entrez) for specific gene functions in order to find common features
among the genes sharing similar expression characteristics. The annotations used were derived
from Gene Ontology (GO), which provides information on molecular function, as well as from
various pathway resources for information on involvement in biological signaling pathways.
Genes were classified into 12 functional groups, as shown in Tables 22-24 and not annotated up
and down-regulated genes are shown in Tables 25-26.

Results
63
Function
Genes
Description
5 hpf
Up Down
Translation
mrpl20
mitochondrial ribosomal protein L20
↑
-
sepsecs Sep (O-phosphoserine) tRNA:Sec
(selenocysteine) tRNA synthase
↑ -
Biological process ccnd3 cyclin D3 ↑ -
ndufa1 NADH dehydrogenase (ubiquinone) 1 alpha
subcomplex, 1
↑ -
pawrl PRKC, apoptosis, WT1, regulator like ↑ -
marveld2b MARVEL domain containing 2b ↑ -
acot9.2 acyl-CoA thioesterase 9.2
↑ -
Embryo
develpment
dscam Down syndrome cell adhesion molecule ↑ -
jag2 jagged 2 ↑ -
stmn2a stathmin-like 2a ↑ -
ptrfb polymerase I and transcript release factor b ↑ -
notch2 notch homolog 2
↑ -
Intra-and inter-
cellular transport
vtg1 vitellogenin 1 ↑ -
slc16a12b solute carrier family 16 (monocarboxylic acid
transporters), member 12b
↑ -
vtg6 vitellogenin 6 ↑ -
syt5a synaptotagmin Va ↑ -
sfxn5b sideroflexin 5b ↑ -
slc4a1 solute carrier family 4, anion exchanger,
member 1a
↑ -
snx16 sorting nexin 16 ↑ -
mfsd7 major facilitator superfamily domain
containing 7
↑ -
dscr3 down syndrom critical region gene 3 ↑ -
slc30a4 solute carrier family 30 (zinc transporter),
member 4
↑ -
DNA repair ino80db INO80 complex subunit Db ↑ -
Negative regulation
of cell proliferation
adra2db
adrenergic, alpha-2D-, receptor b
↑
-
hhip hedgehog interacting protein ↑ -

Results
64
apaf1 apoptotic protease activating factor 1
↑ -
RNA processing parn poly(A)-specific ribonuclease (deadenylation
nuclease)
↑ -
Intra and inter
cellular signalling
pathway
exorh extra-ocular rhodopsin ↑ -
Transcription hoxd9a homeo box D9a ↑ -
nkx2.2a NK2 transcription factor related 2a ↑ -
pde8a phosphodiesterase 8A ↑ -
znf367 zinc finger protein 367 ↑ -
il7r interleukin 7 receptor ↑ -
nfe2l3 nuclear factor (erythroid-derived 2)-like 3
↑ -
Cell structure and
cytoskeleton
organization
tmsb thymosin, beta ↑ -
actc1b actin, alpha, cardiac muscle 1b ↑ -
epb4.1l4 erythrocyte protein band 4.1-like 4
↑ -
Metabolic processes rnd2 Rho family GTPase 2 ↑ -
mat1a methionine adenosyltransferase I, alpha ↑ -
fgl2 fibrinogen-like 2 ↑ -
hnrnpab heterogeneous nuclear ribonucleoprotein A/B ↑ -
ripply3 ripply3 ↑ -
oxsr1b oxidative-stress responsive 1b ↑ -
tbk1 TANK-binding kinase 1
↑ -
Table 23. Up- (↑) and down-regulated genes at 5 hpf with their specific functions and descriptions.

Results
65
Functions
Genes
Descriptions
12 hpf
Up Down
Translation
mrpl20
mitochondrial ribosomal protein L20
↑
-
sepsecs Sep (O-phosphoserine) tRNA:Sec
(selenocysteine) tRNA synthase
↑ -
Biological
process
vasp
vasodilator-stimulated phosphoprotein
↑
-
sec14l1 SEC14-like 1 (S. cerevisiae) ↑ -
plp1a proteolipid protein 1a ↑ -
atpif1 ATPase inhibitory factor 1 ↑ -
tbl3 transducin (beta)-like 3 ↑ -
commd1 copper metabolism (Murr1) domain
containing 1
↑ -
mybpc2b myosin binding protein C, fast type b ↑ -
acot9.2 acyl-CoA thioesterase 9.2 ↑ -
Embryo
develpment
dscam
down syndrome cell adhesion molecule
↑
-
Intra-and
inter-cellular
transport
rbp4
retinol binding protein 4, plasma
↑
-
slc30a4 solute carrier family 30 (zinc transporter),
member 4
↑ -
kpna3 karyopherin (importin) alpha 3 ↑ -
atp2b2 ATPase, Ca++ transporting, plasma
membrane 2
↑ -
dscr3 down syndrome critical region gene 3 ↑ -
mfsd7 major facilitator superfamily domain
containing 7
↑ -
Snx16 sorting nexin 16 ↑ -
Negative
regulation of
cell
proliferation
lppr5b
lipid phosphate phosphatase-related
protein type 5b
↑
-
hhip hedgehog interacting protein ↑ -
apaf1 apoptotic protease activating factor 1 ↑ -
RNA
processing
myoc
myocilin
↑
-
dgcr8 DiGeorge syndrome critical region gene 8 ↑ -
parn poly(A)-specific ribonuclease
(deadenylation nuclease)
↑ -

Results
66
Transcription foxf1 forkhead box F1 ↑ -
mef2ca myocyte enhancer factor 2ca ↑ -
ldb1a LIM-domain binding factor 1a ↑ -
znf367 zinc finger protein 367 ↑ -
nfe2l3 nuclear factor (erythroid-derived 2)-like 3 ↑ -
ets2 v-ets erythroblastosis virus E26 oncogene
homolog 2 (avian)
↑ -
hmga1b high mobility group AT-hook 1b ↑ -
il7r interleukin 7 receptor ↑ -
pde8a phosphodiesterase 8A ↑ -
Metabolic
processes
bckdha
branched chain keto acid dehydrogenase
E1, alpha polypeptide
-
↓
tcp1 t-complex polypeptide 1 - ↓
march8 membrane-associated ring finger
(C3HC4) 8
↑ -
lrrc4c leucine rich repeat containing 4C ↑ -
ate1 arginyltransferase 1 ↑ -
aplp amyloid beta (A4) precursor-like protein ↑ -
sh2b1 SH2B adaptor protein 1 ↑ -
arl3 ADP-ribosylation factor-like 3 ↑ -
ripply3 ripply3 ↑ -
slit3 slit (Drosophila) homolog 3 ↑ -
ankfy1 ankyrin repeat and FYVE domain
containing 1
↑ -
crfb8 cytokine receptor family member b8 ↑ -
rgs5b regulator of G-protein signaling 5b ↑ -
oxsr1b oxidative-stress responsive 1b ↑ -
adck1 aarF domain containing kinase 1 ↑ -
spag1b sperm associated antigen 1b ↑ -
tbk1 TANK-binding kinase 1 ↑ -
zdhhc5a zinc finger, DHHC-type containing 5a ↑ -
trim35-24 tripartite motif containing 35-24 ↑ -
Table 24. Up (↑) and down-regulated (↓) genes at 12 hpf with their specific function and descriptions.

Results
67
Name of genes 5 hpf
Up Down
zgc:174689 ↑ -
zgc:171686 ↑ -
zgc:103519 ↑ -
zgc:153629 ↑ -
zgc:85858 ↑ -
zgc:65857 ↑ -
zgc:154176 ↑ -
zgc:64002 ↑ -
zgc:158254 ↑ -
si:dkey-21k24.2 ↑ -
zgc:153031 ↑ -
zgc:113983 ↑ -
Table 25. Not annotated up (↑) and down-regulated (↓) genes at 5 hpf.
Name of genes
12 hpf
Up Down
zgc:114123 ↑ -
zgc:66337 ↑ -
si:dkey-165a24.4 ↑ -
zgc:114175 ↑ -
si:dkey-11e23.5 ↑ -
im:6903943 ↑ -
si:dke-21k24.2 ↑ -
zgc:77816 ↑ -
zgc:112992 - ↓
zgc:171485 ↑ -
zgc:153845 ↑ -
si:dkey-71l1.1 ↑ -
zgc:153893 ↑ -
si:dkeyp-22b2.2 ↑ -
zgc:64022 ↑ -
zgc:73144 ↑ -
zgc:122979 ↑ -

Results
68
zgc:73359 ↑ -
zgc:153031 ↑ -
si:dkey-21k24.2 ↑ -
zgc:165519 ↑ -
zgc:110655 ↑ -
zgc:136758 ↑ -
zgc:113983 ↑ -
Table 26. Not annotated up (↑) and down-regulated (↓) genes at 12 hpf.
There was no replica for 24-hpf embryos sampled for microarray hybridization, so it was not
possible to perform statistical analysis with the SAM program. The up- and down-regulated
genes due to cortisol treatment were filtered on the basis of their fold changes. In total, 719 genes
were up-regulated having fold change greater than 2 and 955 genes were down-regulated having
fold change less than -2. The percentage of up and down-regulated genes at 24 hpf is shown in
Figure 23, using a pie chart.
Figure 23. The pie chart displays percentages of up- and down-regulated genes at 24 hpf due to cortisol
treatment. Genes in red are up-regulated and genes in green are down-regulated.

Results
69
44. Analysis of gene expression by qPCR
qPCR was performed to analyse differential expression of genes. For this purpose, some cortisol-
responsive genes that were identified by microarray technology were selected for performing
relative and absolute qPCR.
44.1. Relative qPCR
Relative qPCR was performed to determine the change in the expression of a nucleic acid
sequence (target) in a test sample relative to the same sequence in a calibrator sample. The
calibrator sample can be an untreated control or a sample at time zero in a time-course study
(Livak and Schmittgen, 2001). A total of seven cortisol-responsive genes were selected to
perform Relative qPCR to check the effects of cortisol in treated fish compared to control: vasp,
plp1a, stmn2a, parn, notch2, tsc22d3 and mat1a. Three replicate samples from cortisol-treated
and control embryos were collected at 10, 12, 20 and 24 hpf.
The vasp and plp1a genes did not show significant (p > 0.05) high or low expression at 12 and
24 hpf of F1 when rplp0 was used as reference gene (Fig. 24).
Figure 24. Expression of vasp and plp1a gene at 12 and 24 hpf of F1 compared to control (set at 1) when
rplp0 gene was used as reference gene. Values are represent as mean±SEM (n= 9).
At 10 hpf of F2 generation, vasp and plp1a did not show significant up regulation, when ef1α
was used as reference gene (Fig. 25A). Interestingly, vasp gene at 24 hpf of F1 and 12 hpf of F2
was significantly down regulated (p < 0.001) when ef1α was used as reference gene, as shown in

Results
70
Figures 25C and 25B. But plp1a gene was significantly (p < 0.05) down regulated only at 12
hpf of F2 generation (Fig. 25B).
Figure 25. Whisker-box plot represents expression of vasp and plp1a gene compared to control (set at 1)
when ef1α gene was used as reference gene. Expression ratio values are shown on the top of top whisker.
A: 10 hpf F2. B: 12 hpf F2 and C: 24 hpf F1. Symbol (*) indicates that the difference in the expression
levels is statistically significant (p < 0.05)= *; (p < 0.01)= **; (p < 0.001) = ***.
This analysis discloses that statistical significance and temporal trends of the measurements are
dependent upon the choice of the reference gene. With rplp0, statistical significance was never
achieved, whereas with ef1α, it was attained with both vasp and plp1a at 12 hpf and with vasp
alone at 24 hpf. Moreover, the plots with ef1α suggest a decrement of expression from 10 hpf to

Results
71
24 hpf for both vasp and plp1a, which is still compatible with the up-regulation of both genes
observed with microarray analysis at 12 hpf.
Figure 26 shows the expression of fkbp5, tsc22d3, mat1a, notch2, parn and stmn2a genes at 20
hpf of F1 compared to control (set at 1) when ef1α gene was used as reference gene. In this case
there were no significant up- or down-regulation of the investigated genes due to cortisol
treatment.
Figure 26. Expression of fkbp5, tsc22d3, mat1a, notch2, parn and stmn2a genes at 20 hpf of F1
compared to control (set at 1) when ef1α gene was used as reference gene. Expression ratio values are
shown on the top whisker-box plots.
Relative qPCR technique was also performed to analyse igf-2a and casp8 gene expression of
embryos treated with z-gr mRNA+EtOH and z-gr mRNA+Cortisol at 5 and 10 hpf of F1
compared with a wild-type control (WT), whose expression level was set at 1. With z-gr
mRNA+EtOH, the igf-2a gene was significantly (p < 0.05) up-regulated at 5 and 10 hpf,
whereas the casp8 gene was significantly (p < 0.001) up-regulated at 5 hpf only (Fig. 27).

Results
72
Figure 27. Expression ratio of igf-2a and casp8 gene in z-gr mRNA+EtOH treated embryos at 5 and
10 hpf of F1 compared to WT (set at 1) when ef1α gene was used as reference gene. Each bar represents
the mean±SEM (n = 9). Symbol (*) indicates that the difference in the expression levels is statistically
significant (p < 0.05)= *; (p < 0.01)= **; (p < 0.001) = ***.
With z-gr mRNA+Cortisol, the igf-2a gene was significantly (p < 0.01 and p < 0.05) up-
regulated at 5 and 10 hpf, respectively, whereas the casp8 gene was significantly (p < 0.01) up-
regulated at 5 hpf only (Fig. 28).
Figure 28. Expression ratio of igf-2a and casp8 gene in z-gr mRNA+Cortisol treated embryos at 5
and 10 hpf of F1 compared to WT (set at 1) when ef1α gene was used as reference gene. Each bar
represents the mean±SEM (n = 9). Symbol (*) indicates that the difference in the expression levels is
statistically significant (p < 0.05)= *; (p < 0.01)= **; (p < 0.001) = ***.

Results
73
44.2. Analysis of mRNA expression by absolute qPCR
The absolute qPCR was performed to investigate the levels of mRNA expression of two genes of
interest: casp8 and mcm6. Fertilized eggs were subjected to seven treatments by immersion in
solutions containing: WT, Cortisol, RU486, z-gr mRNA+Cortisol, z-gr mRNA+RU486, z-gr
mRNA and grMO-ATG-1. Treated embryos were sampled at 5 and 10 hpf. The results of
absolute qPCR were reported as mRNA copies, after normalization of the transcript amount with
respect to the reference gene (ef1a).
Figure 29 shows the normalized gene expression of casp8 transcripts at 5 hpf, as determined by
absolute qPCR. Levels were significantly higher (p < 0.001) in z-gr mRNA+Cortisol than in the
other six treatments (WT, Cortisol, RU486, z-gr mRNA+RU486, z-gr mRNA and grMO-ATG-
1). The transcripts of the grMO-ATG-1 group were significantly lower (p < 0.01) than the z-gr
mRNA+RU486 treatment group.
Figure 29. Normalized gene expression of casp8 transcripts of different treatment groups at 5 hpf.
Values represent the means±SEM (n = 9) of expressions, as determined by absolute qPCR. Different
letters indicate significant differences among treatment groups (p < 0.05, one-way ANOVA, followed by
Tukey HSD multiple comparison test).
0
10
20
30
40
50
Norm
aliz
ed m
RN
A c
opie
s
Treatment groups
ab
a
ab
b
c
ab
ab

Results
74
Surprisingly, normalized casp8 transcript levels at 10 hpf were significantly higher (p < 0.05) in
grMO-ATG-1 than in WT, Cortisol, RU486, z-gr mRNA+Cortisol and z-gr mRNA treatment
groups, whereas there was no difference between grMO-ATG-1 and z-gr mRNA+RU486 (Fig.
30). There were no significant differences (p > 0.05) among Cortisol, RU486 and z-gr mRNA.
The transcripts of RU486 group were significantly lower (p < 0.01) than z-gr mRNA+Cortisol,
z-gr mRNA+RU486 and grMO-ATG-1 groups.
Figure 30. Normalized gene expression of casp8 transcripts of different treatment groups at 10 hpf.
Values represent the means±SEM (n = 9) of expressions, as determined by absolute qPCR. Different
letters indicate significant differences among treatment groups (p < 0.05, one-way ANOVA, followed by
Tukey HSD multiple comparison test).
The normalized gene expression of mcm6 transcripts at 5 hpf with respect to the different
treatments, as determined by absolute qPCR, is shown in Figure 31. Levels in Cortisol and
RU486 were significantly higher (p < 0.01) than in z-gr mRNA+Cortisol, z-gr mRNA+RU486,
z-gr mRNA and grMO-ATG-1 treatment groups, whereas z-gr mRNA+Cortisol, z-gr mRNA
and grMO-ATG-1 groups did not show any significant difference (p > 0.05). There were also no
significant transcript differences between WT and z-gr mRNA+RU486 groups.
0
4
8
12
16
20
24
Norm
aliz
ed m
RN
A c
op
ies
Treatment groups
f
abc
df
cd
ab a
ab

Results
75
Figure 32 shows the normalized gene expression of mcm6 transcripts at 10 hpf as determined by
absolute qPCR. Levels at 10 hpf were significantly higher (p < 0.01) in WT and RU486 than in
the other five treatment groups. There were also no significant transcript differences (p > 0.05)
among z-gr mRNA+Cortisol, z-gr mRNA+RU486 and z-gr mRNA treatment groups.
Figure 31. Normalized mRNA copies of mcm6 transcripts of different treatment groups at 5 hpf. Values
represent the means±SEM (n = 9) of expressions, as determined by absolute qPCR. Different letters
indicate significant differences among treatment groups (p < 0.05, one-way ANOVA, followed by Tukey
HSD multiple comparison test).
0
50
100
150
200
250
300
Norm
aliz
ed m
RN
A c
opie
s
Treatment groups
c
a a
bc
ab
d
d

Results
76
Figure 32. Normalized mRNA copies of mcm6 transcripts of different treatment groups at 10 hpf.
Values represent the means±SEM (n = 9) of expressions, as determined by absolute qPCR. Different
letters indicate significant differences among treatment groups (p < 0.05, one-way ANOVA, followed by
Tukey HSD multiple comparison test).
45. Morphological effects
The effects of different treatments of fertilized eggs (WT, Cortisol, RU486, z-gr mRNA
+Cortisol, z-gr mRNA+RU486, z-gr mRNA and grMO-ATG-1) on zebrafish larvae were
assessed by the observation of morphological effects. The mortality and abnormal phenotypes of
treated larvae were assessed at 3 dpf. Significantly higher mortality was observed in grMO-
ATG-1 -injected larvae than in the other treatment groups (Table 27). There were no significant
difference among WT, Cortisol, RU486 and treated larvae. Significantly higher percentage of
abnormal phenotypes was observed in grMO-ATG-1 and z-gr mRNA+Cortisol treated larvae.
Some abnormal phenotypes found among z-gr mRNA+Cortisol, z-gr mRNA+RU486 z-gr
mRNA and grMO-ATG-1 treated larvae at 3 dpf are shown in Figure 33. Larvae were affected
by growth delay, reduced or oedematous yolk extension, curved body shape, persistent
voluminous yolk sac, uninflated swim bladder and rudimentary caudal fin with aberrant circular
swimming after mechanical stimulus (Fig. 33) .
0
50
100
150
200
250
300
350
400
Norm
aliz
ed m
RN
A c
opie
s
Treatment groups
a
e
cde
cd cde
ab
bc

Results
77
Treatment groups Total no. of larvae Mortality (%)
(Mean±SD)
Abnormality (%)
(Mean±SD)
WT 439 7±2ab
2±1a
Cortisol 273 5±1a
3±1a
RU486 265 8±5ab
5±2a
z-gr mRNA+ Cortisol 247 20±6bc
25±8c
z-gr mRNA+ RU486 185 13±4c
12±4b
z-gr mRNA 251 12±3abc
9±5ab
grMO-ATG-1 352 34±9d
45±13d
Table 27. Effects of different treatments on the percentage of mortality and abnormal phenotypes among
3 dpf larvae. Data were pooled from at least 3 experiments. Values represent the means±SD. Different
letters indicate significant differences among treatment groups in each column (p < 0.05, one-way
ANOVA, followed by LSD multiple comparison test).
Figure 33. Abnormal phenotypes of larvae at 3 dpf after treatment with z-gr mRNA+Cortisol, z-gr
mRNA+RU486, RU486, z-gr mRNA and grMO-ATG-1 as compared to WT. Larvae are presented as
lateral view.

Results
78
46. Length measurement
To verify the morphogenetic effect of steroid hormone, the measurement of length for cortisol-
treated fish and control fish was performed for F1, F2, F3 and F4 generation at 60, 90, 120, 150
and 180 dpf. The lengths of cortisol-treated fish of F1 generation at 150 and 180 dpf were
significantly greater (p < 0.05) than in control fish, whereas there were no significant difference
of length at 60, 90 and 120 dpf (Fig. 34).
Figure 34. The length of the first generation (F1) fish at different time points. Values are mean ± SEM
(n = 100). Symbols with different letters (a, b) are significantly different ( p < 0.05, paired sample t-test)
from cortisol-treated fish to control.
The length of second generation (F2) at 60, 90, 120, 150 and 180 dpf of cortisol-treated fish and
control fish is shown in Figure 35. In the second generation, at 120, 150 and 180 dpf the length
of cortisol-treated fish were significantly higher (p < 0.05) than control fish. In contrast, there
was no significant difference of length at 60 and 90 dpf between treatment and control fish. In
third generation (F3), only the length of control fish was higher (p < 0.05) than cortisol-treated
fish at 60 dpf, which was at variance with the results of F1 and F2 generations, but there was no
significant difference (p > 0.05) of length at 90, 120, 150 and 180 dpf (Fig. 36). In the fourth
generation (F4), the lengths of cortisol-treated fish and control fish were more or less similar, as
there was no difference at each time point except at 90 dpf, when the length of cortisol-treated
fish was significantly higher than control (Fig. 37).
1.2
1.4
1.6
1.8
2
2.2
2.4
2.6
60 90 120 150 180
Len
gth
(cm
)
Days post fertilization
Cortisol Treated Fish Control Fish
a
a b
b

Results
79
Figure 35. Length of the second generation (F2) fish at different time stages . Values are mean±SEM
(n= 100). Symbols with different letters (a, b) are significantly different (p < 0.05, paired sample t-test)
from cortisol-treated fish to control.
Figure 36. The length of the third generation (F3) fish at 60, 90, 120, 150 and 180 dpf. Values are
mean±SEM (n = 80). Symbols with different letters (a, b) are significantly different (p < 0.05, paired
sample t-test) from cortisol-treated fish to control.
1.5
1.7
1.9
2.1
2.3
2.5
60 90 120 150 180
Len
gth
(cm
)
Days post fertilization
Cortisol Treated Fish Control Fish
a
a a
b
b b
1.4
1.6
1.8
2
2.2
2.4
2.6
60 90 120 150 180
Len
gth
(cm
)
Days post fertilization
Cortisol Treated Fish Control Fish
a b

Results
80
Figure 37. The length cortisol treated and control fish of the fourth generation (F4) at different time
points. Values are mean±SEM (n= 45). Symbols with different letters (a, b) are significantly different ( p
< 0.05, paired sample t-test) from cortisol-treated fish to control.
47. Weight measurement
The weight of cortisol-treated and control fish were measured up to the F4 generation at different
time points (60, 90, 120, 150 and 180 dpf) as for the length. Figure 38 shows that the weight of
cortisol-treated and control fish of F1 were significantly higher (p < 0.05) than control at 150
and 180 dpf, whereas there were no significant weight difference at 60, 90 and 120 dpf. In F2,
the weight of control fish were significantly lower (p < 0.05) at 120, 150 and 180 dpf than
cortisol-treated fish, while, at 60 and 90 dpf, there was no statistical weight difference (Fig. 39).
1.5
2
2.5
3
60 90 120 150 180
Len
gth
(cm
)
Days post fertilization
Cortisol Treated Fish Control Fish
a b

Results
81
Figure 38. The weight of cortisol-treated and control fish of F1 generation. Each bar represents the
mean±SEM (n = 100). Different letters (a, b) denote statistical difference between treatment and control
fish at each time point ( p < 0.05, paired sample t-test).
Figure 39. The weight of cortisol-treated and control fish of F2 generation at different days post
fertilization. Each bar represents the mean±SEM (n = 100). Bars with different letters (a, b) denote
statistical difference between treatment and control fish at each time point (p < 0.05, paired sample t-
test).
Surprisingly, F3 and F4 obtained higher weight in control fish than cortisol-treated fish except
the weights at 60 and 90 dpf of F4 generation. But in the third generation, only the weight of
control fish at 120 dpf was significantly higher (p < 0.05) than in cortisol-treated fish (Fig. 40).
0
0.05
0.1
0.15
0.2
0.25
0.3
60 90 120 150 180
Wei
gh
t (g
)
Days post fertilization
Cortisol Treated Fish Control Fish
a
b a
b
0.05
0.1
0.15
0.2
0.25
60 90 120 150 180
Wei
gh
t (g
)
Days post fertilization
Cortisol Treated Fish Control Fish
a b
b
b
a
a

Results
82
There was no significant weight difference (p > 0.05) at the other time points of F3 generation.
In fourth generation, the weights of cortisol-treated fish were significantly lower (p < 0.05) at
120 and 150 dpf, whereas the weight of control fish was significantly lower at 60 dpf (Fig. 41).
Figure 40. The weight of cortisol-treated and control fish of F3 generation. Each bar represents the
mean±SEM (n = 100). Different letters (a, b) denote statistical difference between treatment and control
fish at each time point ( p < 0.05, paired sample t-test).
Figure 41. The weight of cortisol-treated and control fish of F4 generation at different days post
fertilization. Each bar represents the mean±SEM (n = 100). Bars with different letters (a, b) denote
statistical difference between treatment and control fish at each time point ( p < 0.05, paired sample t-
test).
0.08
0.13
0.18
0.23
0.28
0.33
60 90 120 150 180
Wei
gh
t (g
)
DPF
Cortisol Treated Fish Control Fish
a
b
0.08
0.13
0.18
0.23
0.28
60 90 120 150 180
Wei
gh
t (g
)
DPF
Cortisol Treated Fish Control Fish
a
b
a a
b
b
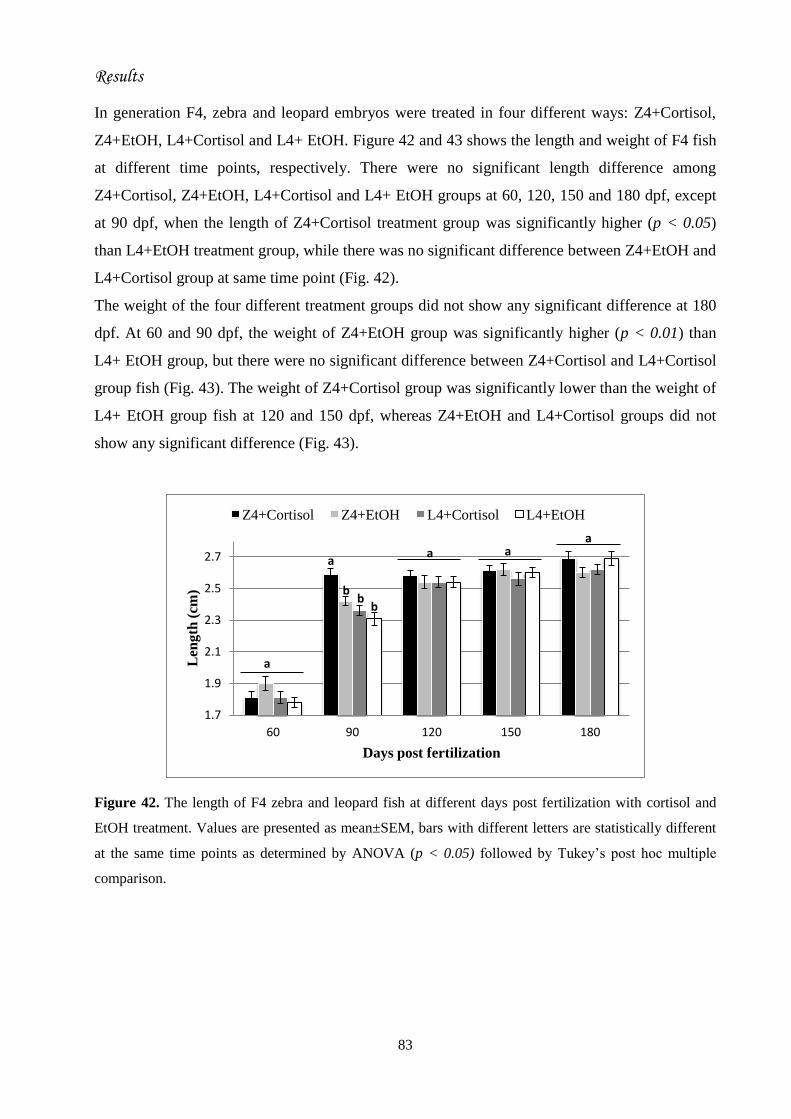
Results
83
In generation F4, zebra and leopard embryos were treated in four different ways: Z4+Cortisol,
Z4+EtOH, L4+Cortisol and L4+ EtOH. Figure 42 and 43 shows the length and weight of F4 fish
at different time points, respectively. There were no significant length difference among
Z4+Cortisol, Z4+EtOH, L4+Cortisol and L4+ EtOH groups at 60, 120, 150 and 180 dpf, except
at 90 dpf, when the length of Z4+Cortisol treatment group was significantly higher (p < 0.05)
than L4+EtOH treatment group, while there was no significant difference between Z4+EtOH and
L4+Cortisol group at same time point (Fig. 42).
The weight of the four different treatment groups did not show any significant difference at 180
dpf. At 60 and 90 dpf, the weight of Z4+EtOH group was significantly higher (p < 0.01) than
L4+ EtOH group, but there were no significant difference between Z4+Cortisol and L4+Cortisol
group fish (Fig. 43). The weight of Z4+Cortisol group was significantly lower than the weight of
L4+ EtOH group fish at 120 and 150 dpf, whereas Z4+EtOH and L4+Cortisol groups did not
show any significant difference (Fig. 43).
Figure 42. The length of F4 zebra and leopard fish at different days post fertilization with cortisol and
EtOH treatment. Values are presented as mean±SEM, bars with different letters are statistically different
at the same time points as determined by ANOVA (p < 0.05) followed by Tukey’s post hoc multiple
comparison.
1.7
1.9
2.1
2.3
2.5
2.7
60 90 120 150 180
Len
gth
(cm
)
Days post fertilization
Z4+Cortisol Z4+EtOH L4+Cortisol L4+EtOH
a
b b
b
a a a
a

Results
84
Figure 43. The weight of F4 zebra and leopard fish at different days post fertilization with cortisol and
EtOH treatment. Values are presented as mean±SEM, bars with different letters are statistically different
at the same time points as determined by ANOVA (p < 0.05) followed by Tukey’s post hoc multiple
comparison.
48. Analysis of puberty onset
The day of first oviposition and the number of laid eggs were checked to observe the effect of
cortisol on puberty onset in zebrafish. The first oviposition of cortisol-treated fish started from
92, 91, 116 and 83 dpf for F1, F2, F3 and F4 generations, respectively (Table 28). For control
fish, the first oviposition started from 90, 96, 115 and 83 dpf for F1, F2, F3 and F4 generations,
respectively (Table 28). Surprisingly, third and fourth generation exhibited very later and earlier
ovipositions, respectively.
F1(dpf) F2(dpf) F3(dpf) F4(dpf)
Cortisol treated fish 92 91 116 83
Control fish 90 96 115 83
Table 28. The first oviposition (dpf) of cortisol-treated and control fish for F1, F2, F3 and F4 generations.
The number eggs laid at first oviposition of cortisol-treated and control fish for F1, F2, F3 and
F4 generations is shown in Figure 44. The number of eggs of cortisol-treated fish declined
0.07
0.12
0.17
0.22
0.27
0.32
60 90 120 150 180
Wei
gh
t (g
)
Days post fertilization
Z4+Cortisol Z4+EtOH L4+Cortisol L4+EtOH
c
a ab
abc
ab ab
a
a ab ab
ab b a
b b
a ab

Results
85
steadily from F1 to F3 generation, with a higher declination observed at F4 generation. The
number of eggs of cortisol treated fish at F4 generation was significantly lower (p < 0.05) than
control. On the other hand, the number of eggs of cortisol-treated and control fish did not show
any significant difference (p > 0.05) in F1, F2 and F3 generations .
Figure 44. The number of eggs laid at first oviposition for cortisol-treated and control fish of F1, F2, F3
and F4 generations. Each values represent mean±SEM, (*) symbol denotes statistical difference between
no. of eggs of cortisol-treated and control fish with (p < 0.05).
40
60
80
100
120
140
F1 F2 F3 F4
No
. of
egg
s
Generations
No. of eggs (Cortisol treated fish)
No. of eggs (Control fish)
*

Discussion
86
DISCUSSION
This thesis work provides experimental evidence that the enrichment of cleaving eggs with
exogenous cortisol can alter the contents of a wide range of transcripts during the early stages of
embryo development in zebrafish. Immunoassay showed that immersion of eggs for 2 h in a
cortisol solution is a valid procedure to increase the deposition of the steroid in the embryo, thus
mimicking an enhanced corticoid transfer into the blastomeres from an ooplasmic store derived
from the maternal circulation in a stressogenic environment. This similarity rests on the cortisol
availability to the embryo, while the involved processes are different.
Enrichment is initially facilitated by the inward flux of external medium needed for the
expansion of egg volume just after fertilization (Auperin and Geslin, 2008). Yet, a relatively
high concentration of external free cortisol is required to compensate for its low cellular
permeability due to intermediate polarity that is complicated by chorion hardening before
cleavage. The ooplasmic supply is instead the result of prolonged contact of more permeable
oocytes in the ovary with low levels of circulating unbound steroid that is then retained in the
yolk mass. During treatment, embryos are exposed to two steroid sources, internal and external,
with superimposed transport kinetics. Afterwards, the situation becomes more similar to that of
the control with progressive utilization of internalized cortisol. Throughout embryogenesis, there
is no contribution by newly synthesized cortisol, because this capacity is acquired only after
hatch (Alsop and Vijayan, 2008).
A comparable bathing approach was adopted in rainbow trout (Auperin and Geslin, 2008; Li et
al., 2010), where it was found to follow first-order kinetics (Belvedere et al., 1999), as an
alternative to stressing the mother during oogenesis (Eriksen et al., 2006) or direct cold stressing
of embryos (Auperin and Geslin, 2008). These alternatives are impractical in zebrafish due to its
asynchronous oogenesis with multiple spawning and thermal sensitivity, but cortisol
microinjection into one-cell embryos was successfully applied to amplify its developmental
effects in this species (Nesan and Vijayan, 2012). However, in the present work, the permeation
technique was preferred in order to treat large numbers of eggs, since the time-window available
for microinjection before the onset of first cleavage is short (about 40 min).
Of particular interest is the finding by microarray analysis that cortisol enrichment caused a
significant up-regulation of the contents of one hundred transcripts, with no down-regulation,
already in embryos at 5 hpf. Bioactivity of cortisol, either maternal or exogenous, is expected in
zebrafish embryos because the mRNA encoding its main cognate receptor, GR, is the most
abundant among maternal transcripts encoding nuclear and membrane steroid receptors in

Discussion
87
ovulated oocytes (Pikulkaew et al., 2010). Its translation into protein to act as GR-cortisol
complex on gene targets is to be assumed in the embryo, because the activation of the GR
signaling pathway is essential for mesoderm formation in zebrafish (Nesan et al., 2012). Yet,
invoking the genomic mechanism of action of cortisol to explain the observed transcript up-
regulation is problematic. First of all, at 5 hpf, corresponding to the end of the blastula stage, the
embryo still contains hundreds of the maternal transcripts synthesized during the diplotene stage
of meiosis I from the lampbrush chromosomes of the primary oocyte (Pelegri, 2003). These
include the “medium degrading group” of maternal mRNAs which start to be eliminated after the
mid-blastula transition (MBT) at 3 hpf and are mostly removed during early gastrulation
(Mathavan et al., 2005; Ferg et al., 2007). Secondly, up to MBT, there is barely any opportunity
for zygotic transcription, because blastomeres divide synchronously every 14-15 min without
interphase (Kane and Kimmel,1993). Thereafter, with the lengthening of the cell cycle, a G
phase is progressively introduced and expanded allowing activation of zygotic transcription,
which still remains at low levels during the blastula stage (Tadros and Lipshitz, 2009), though
some zygotic transcription is required for gastrulation just after MBT (Zamir et al., 1997).
These facts suggest that the up-regulated transcripts at 5 hpf are likely of maternal origin and that
their increased contents reflect a slowing down of their programmed degradation. The lack of
down-regulation may be explained by assuming that the degradation process is already so fast
that a further acceleration is unfeasible. How cortisol may delay the pace of maternal mRNA
degradation is difficult to be clarified, because many agents are involved. The destruction
depends initially upon maternally transcribed/translated products, but is later on reinforced by
zygotic proteins and microRNAs (Tadros and Lipshitz, 2009).
This kind of cortisol interference does not apply to the dys-regulated (that is up- or down-
regulated) transcripts after gastrulation, because at 12 hpf, with the onset of the segmentation
period and somitogenesis, the transition from maternal to zygotic mRNAs is mostly completed.
At this stage, cortisol appears to influence the rates of zygotic transcription with a prevalent up-
regulation and a minor down-regulation. The important point is that, although 77% of the altered
transcripts at 12 hpf are different from those at 5 hpf, there are 30 transcripts in common, which
would imply that cortisol can concordantly affect corresponding maternal and zygotic transcripts
by presumably unrelated mechanisms. Although zygotic transcripts can affect maternal ones, the
other way around remains to be explored. In particular, it is unclear whether zygotic transcription
is directly altered by cortisol mechanism of action or indirectly by links with cortisol dys-
regulated maternal transcripts or both. Preliminary microarray evidence indicates that, at 24 hpf,
the number of affected zygotic transcripts has grown more than ten-fold, with a prevalence of

Discussion
88
down-regulated transcripts, suggesting both an amplification and a mode transition in the cortisol
control of transcription.
Indeed, the role of the GR-cortisol complex in modulating transcript abundance in the embryo is
more complex than what inferred from these results. In particular, a comparable microarray
analysis carried out by Pikulkaew et al. (2011) on embryos microinjected with morpholinos to
block translation of maternal and zygotic gr transcripts (grMO-ATG, as in the present study),
thus impairing cortisol action, showed not just a reversed, but an entirely different pattern of
transcript dys-regulation, with 114 up- and 37 down-regulated mRNAs at 5 hpf, 68 up- and 52
down-regulated mRNAs at 10 hpf, and 43 up- and 6 down-regulated mRNAs in common.
Besides greater proportions of down-regulated and in common transcripts, the most represented
functional groups were those of embryo development, metabolic processes, signaling and
negative regulation of cell proliferation while, in this thesis, metabolic processes, biological
processes and intra-and inter-cellular transport were more represented. It seems that excess
cortisol affects mainly dynamic processes, whereas the lack of GR is associated with regulatory
drawbacks.
A crucial aspect, is that significantly higher incidence of abnormal phenotypes and mortality
were observed in grMO-ATG-1 larvae at 3 dpf, thus confirming a previous report by Pikulkaew
et al. (2011), in which these defects were rescued with trout gr2 mRNA. Since treatment with
morpholino to selectively block the splicing process of zygotic gr mRNA yielded normal larvae,
their work underlined the relevance of maternal gr mRNA in the control of embryogenesis. Here,
the gain of function experiment on morphogenesis disclosed that also the microinjection with z-
gr mRNA slightly compromised larval development and survival, which were significantly
further worsened by the combination of z-gr mRNA plus exogenous cortisol. This suggests that
not only maternal gr mRNA is essential to the embryo, but also that the amount stored in the
oocyte must be precisely adjusted in the presence of maternal cortisol.
The gain of function with excess corticoid was not harmful for normal development, as
documented along four generations. Such result is at variance with what described by Nesan and
Vijayan (2012), who found that elevation of cortisol level by microinjection caused heart
deformities in 50% of larvae, such as pericardial edema and malformed chambers, defects
described also in morphant embryos and larvae after GR knockdown (Pikulkaew et al., 2011).
The former Authors concluded that normal catabolism of maternally deposited cortisol in the
embryo with progressive decrease to a minimum around hatch at 48 hpf is necessary to relieve a
corticoid repression of genes involved in cardiac organogenesis. This claim is intriguing because,
in embryos microinjected with 32 pg, they measured only a small increment of cortisol contents

Discussion
89
which remained constant till hatch (3.5 – 3.8 pg/embryo from 12 to 36 hpf), whereas in the
control there was a modest decline (from 2.7 to 2.0-2.2 pg during the same period). The reason
why a decline was not observed after such limited enrichment (30% more) remains unclear, but
the point is that, in the present study, bathing of eggs in cortisol solution increased around 10-
fold the cortisol concentration in 2-hpf-embryos without greater abnormalities or mortalities in
3-dpf larvae as compared to control. In fact, the range of cortisol content increased from 0.2-0.9
pg/egg in the control to 1,7-10.9 pg/egg after enrichment along the four generations.
Microarray analysis established that presumably maternal transcripts up-regulated by cortisol at
5 hpf were not up-regulated as zygotic transcripts at 12 hpf. This result was validated by relative
qPCR technique showing that the mRNAs of four genes displaying this transient pattern, namely
mat1a, notch2, parn and stmn2a, were still unchanged at 20 hpf, meaning that they were not
cortisol targets in the embryo. The fact that the messengers of two well-known cortisol targets,
namely the genes fkbp5 and tsc22d3, were also unaffected is not surprising, because they were
also found to be unaltered at 10 hpf in morphant embryos deprived of GR (Pikulkaew et al.,
2011). Apparently, the responsiveness of these targets to cortisol emerges at later developmental
stages.
The relative qPCR was also applied to the vasp transcript, which appeared up-regulated at 12 hpf
according to microarray analysis. The gene encodes the vasodilator-stimulated phosphoprotein, a
member of the Ena-VASP protein family, which plays a widespread role in cell adhesion and
motility (Zimmer et al., 1997). A non-significant up-regulation was found at 10 hpf, a slight
down-regulation at 12 hpf which was followed by a significant marked down-regulation at 24
hpf (when down-regulation prevails over up-regulation, as noted above). Hence, there was a shift
from up- to down-regulation during the segmentation period, when a variety of morphogenetic
movements occurs. The same trend was observed for the plp1a transcript, also up regulated at 10
hpf and down-regulated at 24 hpf, but data were less statistically reliable. This gene encodes the
proteolipid protein 1a involved in the process of myelination as an integral membrane protein of
axon-enveloping glial cells (Brösamle and Halpern, 2002), whose mRNA is first detectable
during the segmentation period.
Two more genes, igf-2a and casp8, were analysed by relative qPCR, despite the fact that their
transcripts were not among those up-regulated by cortisol in the microassays at 5 and 12 hpf.
They were included because reported to be strongly up-regulated in grMO-ATG-injected early
embryos compared to WT (Pikulkaew et al., 2011). Hence, their expression was assessed after
treatment with z-gr mRNA alone or in combination with cortisol relatively to untreated control.
The igf-2a encodes the insulin-like growth factor-2a, which is the most potent among four IGF

Discussion
90
peptides (1a and b, 2a and b) in zebrafish. It is a critical regulator of GH-independent somatic
growth during embryogenesis by stimulating cell proliferation. Notably, excess of IGF-2a
signalling caused defects in the midline formation and expansion of the notochord, leading to
fully or partially duplicated notochords (Zou et al., 2009). Despite the ineffectiveness of cortisol
alone, the gain of function with z-gr mRNA elicited a significant up-regulation at both 5 and 10
hpf, which was reinforced after addition of cortisol. As said above, this outcome might share
responsibility for compromising larval development and survival. But, in this case, the observed
up-regulation seems to be imputed to zygotic transcription, because an extremely low level of
maternal igf-2a transcript was detected at 4 hpf (Pikulkaew et al., 2011). This means that not
only maternal gr transcript deposition must be carefully adjusted, as inferred above, but also that
an anticipation and enhancement of igf-2a zygotic transcription may be harmful. In fact, it is
really remarkable that both GR knockdown by morpholino as well as GR gain of function can
bring about developmental defects in zebrafish, once again emphasizing the fine tuning of all
molecular actors involved.
The same kind of reasoning applies to the casp8 gene, whose caspase 8 protein exerts pro-
apoptotic activity by proteolytically activating downstream caspases. Its transcripts are
maternally expressed and zygotic ones continue to be present throughout embryogenesis and into
larval stages (Sakata et al., 2007; Pikulkaew et al., 2011). Casp8 over-expression is detrimental
to the embryo, because it boosts the normal restrained rate of apoptosis. Up-regulation was
significantly measured by relative qPCR with z-gr mRNA/w/wo cortisol at 5 hpf and non-
significantly at 10 hpf.
Given the ample range of variation, casp8 expression was further investigated by absolute qPCR
analysis at 5 and 10 hpf after treatments with cortisol, the corticoid antagonist RU486, z-gr
mRNA, administered alone or in combination, and grMO-ATG-1. When alone, there was no
difference with respect to untreated embryos, whereas z-gr mRNA plus cortisol caused a
significant up-regulation at both times, with possible deleterious effects, as argued above. It is
instructive the fact that no up-regulation of casp8 occurred in both grMO-ATG-1 injected
embryos and z-gr mRNA-treated ones at 5 hpf, indicating that gearing up or down the content of
translatable maternal gr mRNA per se does not affect maternal casp8 transcript degradation,
which is normally almost complete by 8 hpf, as shown by Pikulkaew et al. (2011). Conversely,
at 10 hpf, in grMO-ATG-1 injected embryos, there was a significant up-regulation of zygotic
casp8 transcripts, even greater than that due to z-gr mRNA plus cortisol at the same time, though
lower than when combined at 5 hpf in terms of normalized mRNA copies. This confirms an
equivalent casp8 up-regulation in grMO-ATG-1 injected embryos at 8 and 10 hpf, with no effect

Discussion
91
at 4 hpf, as reported by Pikulkaew et al. (2011). This signifies that GR keeps in check apoptosis
during embryogenesis by restricting zygotic caspase 8 expression, a control that is lost not only
with GR knockdown, but also with an excess of the GR-cortisol complex. Apparently, there is
limited tolerance about abnormal variations of controlling molecules, resulting in an
autodestructive course when exceeded.
A comment is required for the response to z-gr mRNA+RU486, which was ineffective on
maternal casp8 transcripts at 5 hpf, while inducing a strong up-regulation of zygotic ones at 10
hpf, thus mimicking z-gr mRNA+cortisol action. Actually, the “antagonistic” properties of
RU486 on zebrafish GR are still to be clarified but, in mammalian models, its interactions with
the corticoid and progestogen receptors are known to occur at multiple levels with complex
integration (Leonhardt and Edwards, 2011). This may explain why, at 5 hpf, it failed to elicit a
GR-induced delay of maternal casp8 transcript degradation (no agonistic action) while, at 10 hpf,
it seems to prompt GR activation of zygotic casp8 transcription (agonistic action).
The experimental design with absolute qPCR was adopted also for a second gene, mcm6. This
encodes the protein component 6 of the hexameric mini-chromosome maintenance complex
which is essential for the initiation of eukaryotic genome replication, owing to its DNA helicase
activity as an unwinding enzyme in the formation of replication forks (You and Masai, 2008). In
WT embryos, transcripts of this gene are present at low level at 4 hpf to increase dramatically
thereafter (Pikulkaew et al., 2011). Since there is a tumultuous thrust of DNA replication before
MBT, it is conceivable that maternal MCM6 protein rather than its translatable transcript be
implicated in speeding up the process. Anyhow, this gene was selected because, in grMO-ATG-
1 injected embryos, its transcripts exhibited an opposite pattern with respect to those of casp8,
with down-regulation from 4 to 12 hpf, hinting at a stimulatory role of GR on its transcription in
the developing embryo (Pikulkaew et al., 2011). As a matter of fact, casp8 and mcm6 genes can
be regarded as operating antagonistically during embryogenesis, fulfilling pro-apoptotic and pro-
replicative roles, respectively.
The present results confirmed the down-regulation of mcm6 mRNA after grMO-ATG-1
treatment. Moreover, at 5 hpf, there was a significant up-regulation at high levels of normalized
mRNA copies after either cortisol or RU486 enrichment, though no difference was evident at 10
hpf with respect to control. But the unexpected outcome was a significant down-regulation after
gain of function with z-gr mRNA alone or associated with cortisol. With z-gr mRNA+RU486,
the combination was ineffective at 5 hpf, while inducing down-regulation at 10 hpf. This pattern
reminds of that of casp8 transcripts, with obviously inverted signs, at 10 hpf. Once again,
gearing down or up the embryo z-gr mRNA content abolishes its stimulatory role on mcm6

Discussion
92
expression, which remains operative in the presence of excess corticoid alone. This implies that
probing gr gene function by either translation knockdown or transcript enhancement by gain of
function may lead to equivocal results in the absence of parallel treatments with its cognate
ligand.
The above discussion indicates that, differently from alterations of the maternal gr transcript
which can precipitate adverse consequences on embryo development and larval survival, the
enrichment of maternal cortisol in the egg was associated with modifications in the rates of
maternal mRNA degradation as well as changes in zygotic transcriptome that did not hamper
viability and might actually be beneficial. As summarized in the Introduction, it has been
demonstrated that the impact of environmental or social stressors on female fish may derange
oogenesis provoking increased follicular atresia and smaller egg size at ovulation with
unfavourable progeny survival (cf. Table 2). However, it is reasonable to assume that reduced
ooplasmic energy stores and possibly deficient or altered transcript deposition be responsible for
crippling progeny rather than the greater amount of cortisol taken up by the oocytes from the
maternal circulation.
Evidence was, instead, provided that cortisol enrichment of rainbow trout eggs just after
fertilization induced a dose-dependent reduction of sensitivity to stressors in 5-month-old
fingerlings, as measured by lower plasma cortisol levels 1 h after stress (Auperin and Geslin,
2008). This long-lasting effect points at an imprinting action of the developmental programming
by maternal cortisol on the offspring epigenome, resulting in modified threshold levels of
response in the HPI axis. Sparing energy for growth through hyporesponsiveness to stressors
would be a positive trait for aquaculture. Accordingly, Li et al. (2010) found that a 40% increase
in oocyte cortisol content in rainbow trout caused a significant increase in the growth rates of
embryos and adults. This result was explained by enhanced expression of the igf-1 and igf-2
genes during embryogenesis with subsequent maintenance of superior growth capacity.
Therefore, after demonstrating the effectiveness of cortisol in modifying embryo transcript
contents, it was deemed of interest to check whether a similar auxogenic or growth-promoting
imprinting existed also in the zebrafish. Taking advantage of its relatively short generation cycle
and standardized conditions of culture in terms of water temperature, photoperiod and feeding
regime, the experiment covered four successive generations to ascertain possible cumulative
effects. The use of two strains differing merely by colour pattern allowed the co-culture of the
treated lineage of fish with the untreated control, in order to eliminate interference by
surrounding environment, stocking density and food availability.

Discussion
93
Despite all these precautions and reliance on large numbers of fish, the experiment met only with
partial success, owing mainly to lack of constant growth rates among generations in both
lineages. The finding of significant greater body lengths and weights in the treated lineage of the
first two generations was encouraging, because statistical divergence occurred at 4-5 months of
age till adulthood at 6 months, revealing an imprinting effect by cortisol. But, in F3, the
difference was no longer present, despite a greater growth of the treated lineage as compared to
those observed in F1 and F2. Even more ambiguous was the situation in the F4, where the
seemingly superior growth of the control lineage is doubtful, because bigger fish were measured
in both lineages at 3 months with respect to 4 and 5 months of age. Probably, there was some
sort of inadvertent sampling bias due to non-uniform growth in the F4 stocks. Even the challenge
of both the treated and untreated lineages with cortisol in F4 was inconclusive, because fish
failed to grow significantly after 120 days. On the other hand, although cortisol did not affect the
time of puberty in the four treated generations, it did lower fertility by reducing the number of
eggs laid at first oviposition, which was statistically significant in F4. Less energy diverted for
reproduction might be available for enhanced growth. So, the present experiment supports,
though not in a definitive way, a priming auxogenic action of maternal cortisol in zebrafish
progeny.
From this thesis work, a model can be proposed as a working hypothesis for future research.
First of all, maternal cortisol action in the zebrafish would mainly favour cell proliferation and
development in the embryo, while taking on a catabolic, energy-mobilizing hormonal function
only in post-natal life, likely by controlling different sets of genes. This functional shift is
motivated by the fact that the embryo is focused on completing its auto-organizational program
with finite energy available in a predetermined time, without the faculty to waste energy for
reactivity to stressors, an ability which is acquired only after 97 hpf (Alsop and Vijayan, 2008).
Presumably, a smooth course during embryogenesis might have a positive imprinting effect on
growth till adulthood. This might occur in the embryo through higher saturation of GR derived
from maternal and zygotic gr transcripts. Since some reports claim adverse effects by egg
loading with exogenous cortisol on cardiac organogenesis (Nesan and Vijayan, 2012) and
craniofacial morphogenesis (Hillegass et al., 2008), there might be just a tolerable range of
receptor saturation or activation by too much cortisol of additional, high-threshold response
mechanisms with detrimental interference. While the high concentration of maternal gr
transcripts, with replacement by zygotic ones from 8 hpf onwards (Pikulkaew et al., 2010),
points to a fundamental role of the GR-cortisol complex during embryogenesis, it is evident that
the level of the maternal gr transcript content must be finely tuned in the oocyte, because not

Discussion
94
only GR knockdown, but also GR enhancement by gain of function can endanger progeny
development, as shown in this study. Conversely, the recovery of normal development after
rescuing with a precisely calibrated amount of translatable trout gr transcript concomitantly with
z-GR translation knockdown (Pikulkaew et al., 2011), emphasizes once more the sophistication
in the adjustment of maternal gr gene expression in the oocyte.
In conclusion, the maternal gr transcript dosage should be regarded as the major integral sensor
of the stressor load on the mother life during oogenesis, as proposed by Pikulkaew et al. (2011),
while the cortisol deposit would act as an ancillary sensor. Apart from abortive gr transcript
levels, a reduced (or anyway altered), but still viable, maternal gr transcript content may result in
stunted progeny with over-reactivity to stressors. This imprinting, which would be advantageous
in an environment experienced by the mother as full of threats, might prevail over the imprinting
due to cortisol that, by ensuring better energy utilization for body growth at the expense of stress
reactivity and reproduction, would be advantageous if the cortisol hypersecretion in the mother
reflects a stress response to scarce food availability. From this perspective, there is ample scope
for investigation not only to disentangle the underlying molecular mechanisms in the maternal
programming of offspring epigenetic adaptation to the environment, but also to determine
whether recurrent imprinting signalling along generations might lead to hereditary fixation of
favourable epigenetic changes.

References
95
REFERENCES
Alsop, D., Vijayan, M.M. 2008. Development of the corticosteroid stress axis and receptor
expression in zebrafish. Am. J. Physiol. Regul. Integr. Comp. Physiol., 294, R711–R719.
Alsop, D., Vijayan, M.M. 2009. Molecular programming of the corticosteroid stress axis during
zebrafish development. Comp. Biochem. Physiol. Part A, 153, 49-54.
Alsop, D., Vijayan, M.M. 2009. The zebrafish stress axis: molecular fallout from the teleost-
specific genome duplication event. Gen. Comp. Endocrinol., 161, 62–66.
Aluru, N., Vijayan, M.M. 2007. Hepatic transcriptome response to glucocorticoid receptor
activation in rainbow trout. Physiol. Genomics, 31, 483–491.
Aluru, N., Vijayan, M.M. 2008. Molecular characterization, tissue-specific expression and
regulation of melanocortin 2 receptor in rainbow trout. Endocrinology, 149, 4577–4588.
Arends, R.J., Vermeer, H., Martens, G.J., Leunissen, J.A., Wendelaar Bonga, S.E., Flik, G. 1998.
Cloning and expression of two proopiomelanocortin mRNAs in the common carp
(Cyprinus carpio L.). Mol. Cell. Endocrinol., 143, 23–31.
Auperin, B., Geslin, M. 2008. Plasma cortisol response to stress in juvenile rainbow trout is
influenced by their life history during early development and by egg cortisol content.
Gen. Comp. Endocrinol., 158, 234–239.
Ayson, F.G., Lam, T.J. 1993. Thyroxin injection of female rabbitfish (Siganus guttatus)
broodstock: changes in thyroid hormone levels in plasma, eggs, and yolk-sac larvae, and
its effect on larval growth and survival. Aquaculture, 109, 83–93.
Barman, R.P. 1991. A taxonomic revision of the Indo-Burmese species of Danio rerio. Rec.
Zool. Surv. India. Misc. Publ., Occas. Pap., 137, 1–91.
Barnes, P.J. 2006. How corticosteroids control inflammation: Quintiles Prize Lecture 2005. Br. J.
Pharmacol., 148, 245–254.
Barry, T.P., Malison, J.A., Held, J.A., Parrish, J.J. 1995a. Ontogeny of the cortisol stress
response in larval rainbow trout. Gen. Comp. Endocrinol., 97, 57–65.
Barry, T.P., Ochiai, M., Malison, J.A. 1995b. In vitro effects of ACTH on interregnal
corticosteroidogenesis during early larval development in rainbow trout. Gen. Comp.
Endocrinol., 99, 382–387.
Barton, B.A., Iwama, G.K. 1991. Physiological changes in fish from stress in aquaculture with
emphasis on the response and effect of corticosteroids. Ann. Rev. Fish Dis., 1, 3–26.

References
96
Barton, B.A., Morgan, J.D., Vijayan, M.M. 2002. Physiological and condition-related indicators
of environmental stress in fish, In: Adams, S.M. (Ed.), Biological Indicators of Stress in
Fish, 2nd ed. American Fisheries Society, Bethesda, Maryland, pp. 111–148.
Beckman, M. 2007. Zebrafish take the stage in cancer research. Journal of the National Cancer
Institute, 99, 500-501.
Belvedere, P., Vianello, S., Dalla Valle L., Ramina, A., Manzalini, A., Salvato, B., Colombo, L.
1999. Long-term effects on body growth induced by oocyte exposure to exogenous
cortisol and estradiol-17β in rainbow trout. In: Roubous W, Wendelaar Bonga SE,
Vaudry H, De Loot A, editors. Recent developments in comparative endocrinology and
neurobiology. Maastricht: Shaker Publishing. pp. 258–260.
Bernier, N.J. 2006. The corticotropin-releasing factor system as a mediator of the appetite-
suppressing effects of stress in fish. Gen. Comp. Endocrinol., 146, 45–55.
Bhat, A. 2003. Diversity and composition of freshwater fishes in streams of Central Western
Ghats, India. Environ. Biol. Fishes, 68, 25–38.
Bilotta, J. 2000. Effects of abnormal lighting on the development of zebrafish visual behaviour.
Behav. Brain Res., 116, 81–87.
Boron, W. F., Boulpaep, E. L. 2006. Medical Physiology. Elsevier Publication, pp. 1017-1022.
Bridgham, J.T., Carroll, S.M., Thornton, J.W. 2006. Evolution of hormone-receptor complexity
by molecular exploitation. Science, 312, 97–101.
Brösamle, C., Halpern, M. 2002. Characterization of myelination in the developing zebrafish.
Glia, 39, 47-57.
Brown, C.L., Bern, H.A. 1989. Hormones in early development, with special reference to teleost
fish. In: Scanes, C.G., Scheibman, M.P. (Eds), Academic Press, San Diego, pp. 189–306.
Brown, C.L., Doroshov, S.I., Cochran, M.D., Bern, H.A. 1989. Enhanced survival in striped bass
fingerlings after maternal triiodothyronine treatment. Fish. Physiol. Biochem., 7, 295–
299.
Bury, N.R., Sturm, A., Le Rouzic, P., Lethimonier, C., Ducouret, B., Guiguen, Y., Robinson-
Rechavi, M., Laudet, V., Rafestin-Oblin, M.E., Prunet, P. 2003. Evidence for two distinct
functional glucocorticoid receptors in teleost fish. J. Mol. Endocrinol., 31, 141–156.
Campbell, P.M., Pottinger, T.G., Sumpter, J.P. 1992. Stress reduces the quality of gametes
produced by rainbow trout. Biol. Reprod. 47, 1140–1150.

References
97
Campbell, P.M., Pottinger, T.G., Sumpter, J.P. 1994. Preliminary evidence that chronic
confinement stress reduces the quality of gametes produced by brown and rainbow trout.
Aquaculture, 120, 151–169.
Castranova, D.A., King, V.W., Woods III, L.C. 2005. The effects of stress on androgen
production, spermiation response and sperm quality in high and low cortisol responsive
domesticated male striped bass. Aquaculture, 246, 413–422.
Chakraborty, C., Hsu, C. H., Wen, Z.H., Lin C.S., Agoramoorthy, G. 2009. Zebrafish: A
complete animal model for in vivo drug discovery and development. Current Drug
Metab., 10, 116-124.
Chandrasekar, G., Lauter, G., Hauptmann, G. 2007. Distribution of corticotropin-releasing
hormone in the developing zebrafish brain. J. Comp. Neurol., 505, 337–351.
Contreras-Sanchez, W.M., 1995. Effects of stress on the reproductive performance and
physiology of rainbow trout (Oncorhynchus mykiss). MS thesis, Oregon State University,
pp. 60.
Contreras-Sanchez, W.M., Schreck, C.B., Fitzpatrick, M.S., Pereira, C.B. 1998. Effects of stress
on the reproductive performance of rainbow trout (Oncorhynchus mykiss). Biol. Reprod.,
58, 439–447.
Corey, D.R., Abrams, J. M. 2001. Morpholino antisense oligonucleotides: tools for investigating
vertebrate development. Genome Biol., 2 (5), 1015.1- 1015.3.
Cortemeglia, C., Beitinger, T.L. 2005. Temperature tolerances of wild-type and red transgenic
zebra danios. Trans. Amer. Fish. Soc., 134, 1431-1437.
Dahm, R. 2002. Atlas of embryonic stages of development in the zebrafish. In: Zebrafish: A
Practical Approach, Nüsslein-Volhard C. Dahm R. (eds), Oxford: Oxford University
Press, pp. 219–236.
Dahm, R., Geisler, R. 2006. Learning from small fry: the zebrafish as a genetic model organism
for aquaculture fish species. Mar. Biotechnol., 8, 329-345.
De Souza, F.S.J., Bumaschny, V.F., Low, M.J., Rubinstein, M. 2005. Subfunctionalization of
expression and peptide domains following the ancient duplication of the
proopiomelanocortin gene in teleost fishes. Mol. Biol. Evol., 22, 2417–2427.
De Kloet, E.R., Joels, M., Holsboer, F. 2005. Stress and the brain: from adaptation to disease.
Nat. Rev. Neurosci., 6, 463–475.

References
98
De Jesus, E.G., Hirano, T. 1992. Changes in wholes body concentrations of cortisol, thyroid
hormones, and sex steroids during early development of the chum salmon, Oncorhynchus
keta. Gen. Comp. Endocrinol., 85, 55–61.
De Jesus, E.G., Hirano, T., Inui, Y. 1991. Changes in cortisol and thyroid hormone
concentrations during early development and metamorphosis in Japanese Flounder,
Paralichthys olivaceus. Gen. Comp. Endocrinol., 82, 369–376.
Dorsett, Y., Tuschl, T. 2004. siRNAs: applications in functional genomics and potential as
therapeutics. Nat. Rev. Drug Discov., 3(4), 318-329.
Eisen, J.S., Smith, J.C. 2008. Controlling morpholino experiments: don’t stop making antisense.
Development, 135, 1735-1743.
Eriksen, M., Bakken, M., Espmark, Å., Braastad, B., Salte, R., 2006. Prespawning stress in
farmed Atlantic salmon Salmo salar: maternal cortisol exposure and hyperthermia during
embryonic development affect offspring survival, growth and incidence of
malformations. J. Fish Biol. 69, 114–129.
Feist, G., Schreck, C.B., Fitzpatrick, M.S., Redding, J.M. 1990. Sex steroid profiles of coho
salmon (Oncorhynchus kisutch) during early development and sexual differentiation.
Gen. Comp. Endocrinol., 80, 299-313.
Ferg, M., Sanges, R., Gehrig, J., Kiss, J., Bauer, M., Lovas, A., Szabo, M., Yang, L., Straehle,
U., Pankratz, M. J., Olasz, F., Stupka, E., Müller, F. 2007. The TATA-binding protein
regulates maternal mRNA degradation and differential zygotic transcription in zebrafish.
The EMBO Journal, 26, 3945–3956.
Flik, G., Klaren, P.H.M., Van den Burg, E.H., Metz, J.R., Huising, M.O. 2006. CRF and stress in
fish. Gen. Comp. Endocrinol., 146, 36–44.
Flick, G., Stouthart, X.J.H.X., Spanings, F.A.T., Lock, R.A.C., Fenwick, J.C., Wendelaar Bonga,
S.E. 2002. Stress response to waterborne Cu during early life stages of carp, Cyprinus
carpio. Aquat. Toxicol., 56, 167–176.
Foo, J.T.W., Lam, T.J. 1993. Retardation of ovarian growth and depression of serum steroid
levels in the tilapia, Oreochromis mossambicus, by cortisol implantation. Aquaculture,
115, 133–143.
Fox, H.E., White, S.A., Kao, M.H.F., Fernald, R.D. 1997. Stress and dominance in a social fish.
J. Neurosci., 17, 6463–6469.
Francis, M. 2008. Aquatics labs: five questions you don’t want to have to ask. CALAS/ACSAL
membership magazine, 42 (3), 25-27.

References
99
Giguere, V., Hollenberg, S.M., Rosenfeld, M.G., Evans, R.M. 1986. Functional domains of the
human glucocorticoid receptor. Cell, 46, 645–652.
Greenwood, A.K., Butler, P.C., White, R.B., DeMarco, U., Pearce, D., Fernald, R.D. 2003.
Multiple corticosteroid receptors in a teleost fish: distinct sequences, expression patterns,
and transcriptional activities. Endocrinology, 144, 4226–4236.
Gowaty, P.A., Anderson, W.W., Bluhm, C.K., Drickamer, L.C., Kim, Y.K., Moore, A.J. 2007.
The hypothesis of reproductive compensation and its assumptions about mate preferences
and offspring viability. Proc. Natl. Acad. Sci., 104, 15023– 15027.
Harland, R., Weintraub, H. 1985. Translation of mRNA injected into Xenopus oocytes is
specifically inhibited by antisense RNA. J. Cell Biol., 101, 1094-1099.
Heasman, J. 2002. Morpholino oligos: making sense of antisense? Dev. Biol., 243, 209-214.
Herzog,W., Sonntag, C.,Walderich, B., Odenthal, J., Maischein, H.M., Hammerschmidt, M.
2004. Genetic analysis of adenohypophysis formation in zebrafish. Mol. Endocrinol., 18,
1185–1195.
Holder, N. Xu, Q. 1999. Microinjection of DNA, RNA, and protein into the fertilized zebrafish
egg for analysis of gene function. Meth. Mol. Biol., 97, 487–490.
Huising, M.O., Metz, J.R., van Schooten, C., Taverne-Thiele, A.J., Hermsen, T., Verburg-van
Kemenade, B.M., Flik, G. 2004. Structural characterisation of a cyprinid (Cyprinus
carpio L.) CRH, CRH-BP and CRH-R1, and the role of these proteins in the acute stress
response. J. Mol. Endocrinol., 32, 627–648.
Hwang, P.P., Wu, S.M., Lin, J.H., Wu, L.S. 1992. Cortisol content of eggs and larvae of teleosts.
Gen. Comp. Endocrinol., 86, 189–196.
Irie, T., Seki, T. 2002. Retinoid composition and retinal localization in the eggs of teleost fishes.
Comp. Biochem. Physiol. B Biochem. Mol. Biol., 131, 209-219.
Iwama, G.K., Afonso, L.O.B., Vijayan, M.M. 2006. Stress in fish, In: Evans, D.H., Claiborne,
J.B. (Eds.), The Physiology of Fishes, Third ed. CRC Press, Boca Raton, Florida, pp.
319–34.
Iwamatsu, T., Kobayashi, H., Sagegami, R., Shuo, T. 2006. Testosterone content of developing
eggs and sex reversal in the medaka (Oryzias latipes). Gen. Comp. Endocrinol., 145, 67-
74.
Izant, J.G., Weintraub, H. 1984. Inhibition of thymidine kinase gene expression by anti-sense
RNA: a molecular approach to genetic analysis. Cell, 36, 1007-1015.

References
100
Izant, J.G. Weintraub, H. 1985. Constitutive and conditional suppression of exogenous and
endogenous genes by anti-sense RNA. Science, 229, 345-352.
Jalabert, B. 2008. An overview of 30 years of international research in some selected fields of
the reproductive physiology of fish. Cybium, 32, 7–13.
Jentoft, S., Held, J.A., Malison, J.A., Barry, T.P. 2002. Ontogeny of the cortisol stress response
in yellow perch (Perca flavescens). Fish Physiol. Biochem., 26, 371–378.
Kane, D.A., Kimmel, C.B. 1993. The zebrafish midblastula transition. Development, 119, 447–
456.
King, W., Berlinsky, D. 2006. Whole-body corticosteroid and plasma cortisol concentrations in
larval and juvenile atlantic cod Gadus morhua L. following acute stress. Aquac. Res., 37,
1282–1289.
Kimmel, C.B., Ballard, W.W., Kimmel, S.R., Ullmann, B., Schilling, T.F. 1995. Stages of
embryonic development of the zebrafish. Dev. Dyn., 203, 255-310.
Kimmel, C.B., Law, R.D. 1985. Cell lineage of zebrafish blastomeres. II. Formation of the yolk
syncytial layer. Dev. Biol., 108, 86-93.
Kishi, S. 2004. Functional senescence and gradual aging in zebrafish. Ann. N. Y. Acad. Sci.,
1019, 521-526.
Koob, G.F., Heinrichs, S.C. 1999. A role for corticotropin releasing factor and urocortin in
behavioral responses to stressors. Brain Res., 848, 141–152.
Kreiberg, H. 2000. Stress and anaesthesia. In: G. K. Ostrander (ed.) The Laboratory Fish.
Academic Press: New York, pp. 503-511.
Lam, T.J. 1985. Role of thyroid hormone on larval development in fish. In: Lofts, B., Holms,
W.N. (Eds.), Current Trends in Comparative Endocrinology. Hong Kong Univ. Press,
Hong Kong, pp. 481–485.
Leitz, T. 1987. Social control of testicular steroidogenic capacities in the Siamese fighting fish
Betta splendens Regan. J. Exp. Zool., 244, 473–478.
Leonhardt, S.A., Edwards, D.P. 2002. Mechanism of action of progesterone antagonists. Exp.
Biol. Med., 227, 969-980.
Li, M., Bureau, D., King, W.A., Leatherland, J.F. 2010. The actions of in ovo cortisol on egg
fertility, embryo development and the expression of growth-related genes in rainbow
trout embryos, and the growth performance of juveniles. Mol. Reprod. Dev., 77, 922-931.

References
101
Livak, K.J., and Schmittgen, T.D. 2001. Analysis of relative gene expression data using real-time
quantitative PCR and the 2-ΔΔC
T method. Methods, 25, 402–408.
Lowry, C.A., Moore, F.L. 2006. Regulation of behavioral responses by corticotropin-releasing
factor. Gen. Comp. Endocrinol., 146, 19–27.
Mathavan, S., Lee, S.G.P., Mak, A., Miller, L.D., Murthy, K.R.K., Govindarajan, K.R., Tong,
Y., Wu, Y.L., Lam, S.H., Yang, H., Ruan, Y., Korzh, V., Gong, Z., Liu, E.T., Lufkin, T.
2005. Transcriptome analysis of zebrafish embryogenesis using microarrays. Plos Genet.,
1, 260–276.
Matthews, M., Trevarrow, B., Matthews, J. 2002. A virtual tour of the guide for zebrafish users.
Lab Animal, 31, 34-40.
Mathew, L.K., Sengupta, S., Kawakami, A., Andreasen, E.A., Lohr, C.V., Loynes, C.A.,
Renshaw, S.A., Peterson, R.T., Tanguay, R.L. 2007. Unraveling tissue regeneration
pathways using chemical genetics. J. Biol. Chem., 282, 35202–35210.
McCormick, M.I. 1998. Behaviorally induced maternal stress in a fish influences progeny
quality by a hormonal mechanism. Ecology, 79, 1873–1883.
McCormick, M.I. 1999. Experimental test of the effect of maternal hormones on larval quality of
a coral reef fish. Oecologia, 118, 412-422.
Melton, D.A. 1985. Injected anti-sense RNAs specifically block messenger RNA translation in
vivo. Proc. Natl. Acad. Sci. USA, 82, 144-148.
Menon, A.G.K. 1999. Check list-fresh water fishes of India. Rec. Zool. Surv. India. Misc. Publ.,
Occas. Pap., 175 (366), 234–259.
Migliaccio, S., Brama, M., Fornari, R., Greco, E.A., Spera, G., Malavolta, N. 2007.
Glucocorticoid-induced osteoporosis: an osteoblastic disease. Aging Clin. Exp. Res., 19,
5–10.
Mommsen, T.P., Vijayan, M.M., Moon, T.W. 1999. Cortisol in teleosts: dynamics, mechanisms
of action, and metabolic regulation. Rev. Fish Biol. Fish., 9, 211–268.
Morehead, D.T., Ritar, A.J., Pankhurst, N.W. 2000. Effect of consecutive 9- or 12-month
photothermal cycles and handling on sex steroid levels, oocyte development, and
reproductive performance in female striped trumpeter Latris lineata (Latrididae).
Aquaculture, 189, 293–305.
Nasevicius, A., Ekker, S.C. 2000. Effective targeted gene ‘knockdown’ in zebrafish. Nat. Genet.,
26, 216-220.
References
102
Nesan, D., Kamkar, M., Burrows, J., Scott, I.C., Marsden, M., Vijayan, M.M. 2012.
Glucocorticoid receptor signaling is essential for mesoderm formation and muscle
development in zebrafish. Endocrinology, 153, 1288–1300.
Nesan, D., Vijayan, M. M. 2012. Embryo exposure to elevated cortisol level leads to cardiac
performance dysfunction in zebrafish. Mol. Cell. Endocrinol., 363, 85–91.
Nicholl, D.S.T. 1996. An introduction to genetic engineering. Cambridge University Press. pp.
23.
Oates, A.C., Bruce, A.E., Ho, R.K. 2000. Too much interference: injection of double-stranded
RNA has nonspecific effects in the zebrafish embryo. Dev. Biol., 224, 20-28.
Okuzawa, K. 2002. Puberty in teleosts. Fish Physiol. Biochem., 26, 31–41.
Parng, C. 2005. In vivo zebrafish assays for toxicity testing. Current Opinions in Drug Discovery
and Development, 8, 100-106.
Pelegri, F. 2003. Maternal Factors in Zebrafish Development. Dev. Dyn., 228, 535-554.
Phuc Le, P., Friedman, J.R., Schug, J., Brestelli, J.E., Parker, J.B., Bochkis, I.M., Kaestner, K.H.
2005. Glucocorticoid receptor-dependent gene regulatory networks. PLoS Genet., 1, e16.
Pickering, A.D., Pottinger, T.G., Carragher, J., Sumpter, J.P. 1987. The effects of acute and
chronic stress on the levels of reproductive hormones in the plasma of mature brown
trout, Salmo trutta L. Gen. Comp. Endocrinol., 68, 249–259.
Pikulkaew, S., Benato, F., Celeghin, A., Zucal, C., Skobo, T., Colombo, L., Valle, L.D. 2011.
The knockdown of maternal glucocorticoid receptor mRNA alters embryo development
in zebrafish. Dev. Dyn. 240, 874–889.
Pikulkaew, S., De Nadai, A., Belvedere, P., Colombo, L., Dalla Valle, L. 2010. Expression
analysis of steroid hormone receptor mRNAs during zebrafish embryogenesis. Gen.
Comp. Endocrinol., 165, 215–220.
Pottinger, T.G., Mosuwe, E. 1994. The corticosteroidogenic response of brown and rainbow
trout alevins and fry to environmental stress during a “critical period”. Gen. Comp.
Endocrinol., 95, 350–362.
Pottinger, T.G., Moran, T.A. 1993. Differences in plasma cortisol and cortisone dynamics during
stress in two strains of rainbow trout (Oncorhynchus mykiss). J. Fish Biol., 43, 121–130.
Pottinger, T.G., Pickering, A.D., Hurley, M.A. 1992. Consistency of the stress response of
individuals of two strains of rainbow trout, Oncorhynchus mykiss. Aquaculture, 103,
275–289.

References
103
Pratt,W.B., Toft, D.O. 2003. Regulation of signaling protein function and trafficking by the
hsp90/hsp70-based chaperonemachinery. Exp. Biol.Med., 228, 111–133.
Rahman, A.K.A. 1989. Freshwater fishes of Bangladesh. Zoological Society of Bangladesh,
Department of Zoology, University of Dhaka, pp. 364.
Sakata, S., Yan, Y., Satou, Y., Momoi, A., Ngo-Hazelett, P., Nozaki, M., Furutani-Seiki, M.,
Postlethwait, J.H., Yonehara, S., Sakamaki, K. 2007. Conserved function of caspase-8 in
apoptosis during bony fish evolution. Gene, 396, 134-48.
Sampath-Kumar, R., Byers, R.E., Munro, A.D., Lam, T.J. 1995. Profile of cortisol during
ontogeny of the asian sea bass, Lates calcarifer. Aquaculture, 132, 349– 359.
Schaaf, M.J., Chatzopoulou A., Spaink H.P. 2009. The zebrafish as a model system for
glucocorticoid receptor research. Comp. Biochem. Physiol., 253, 75-82.
Schaaf, M.J., Champagne, D., van Laanen, I.H., van Wijk, D.C., Meijer, A.H., Meijer, O.C.,
Spaink, H.P., Richardson, M.K. 2008. Discovery of a functional glucocorticoid receptor
beta-isoform in zebrafish. Endocrinology, 149, 1591–1599.
Scherer, L., Rossi, J.J. 2004. RNAi applications in mammalian cells. Biotechniques, 36 (4), 557-
561.
Scholz, S., Mayer, I. 2008. Molecular biomarkers of endocrine disruption in small model fish.
Mol. Cell. Endocrinol., 293, 57–70.
Schreck, C.B. 2010. Stress and fish reproduction: The roles of allostasis and hormesis. Gen.
Comp. Endocrinol., 165, 549–556.
Schreck, C.B., Li, H.W. 1991. Performance capacity of fish: stress and water quality. In: Brune,
D.E., Tomasso, J.R. (Eds.), Aquaculture and Water Quality, vol. 3. World Aquaculture
Society, Baton Rouge, Advances in World Aquaculture, pp. 21–29.
Schreck, C.B., Maule, A.G. 2001. Are the endocrine and immune systems really the same thing?
In: Goos, H.J.T., Rostogi, R.K., Vaudry, H., Pierantoni, R. (Eds.), Monduzzi Editore. CD
ROM Book, Naples, pp. 351–357.
Schreck, C.B., Fitzpatrick, M.S., Feist, G.W., Yeoh, C.G. 1991. Steroids: developmental
continuum between mother and offspring. In: Scott, A.P., Sumpter, J.P., Kime, D.E.,
Rolfe, M.S. (Eds.), Proceedings of the 4th
International Symposium on the Reproductive
Physiology of Fish, FishSymp 91, Sheffield, pp. 256–258.
Schreck, C.B. 1981. Stress and compensation in teleostean fishes: response to social and physical
factors. In: Pickering, A.D. (Ed.), Stress and Fish. Academic Press, London, pp. 295–321.

References
104
Schreck, C.B., Contreras-Sanchez, W., Fitzpatrick, M.S. 2001. Effects of stress on fish
reproduction, gamete quality, and progeny. Aquaculture, 197, 3-24.
Shiraishi, K., Matsuda, M., Mori, T., Hirano, T. 1999. Changes in expression of prolactin and
cortisol-receptor genes during early-life stages of euryhaline tilapia (Oreochromis
mossambicus) in fresh water and seawater. Zool. Sci., 16, 139-146.
Simontacchi, C., Negrato, E., Pazzaglia, M., Bertotto, D., Poltronieri, C. and Radaelli, G. 2009.
Whole-body concentrations of cortisol and sex steroids in white sturgeon (Acipenser
transmontanus, Richardson 1836) during early development and stress response.
Aquacult. Int., 17, 7–14.
Solnica-Krezel, L., and Driever, W. 1994. Microtubule arrays of the zebrafish yolk cell:
organization and function during epiboly. Development, 120, 2443-2455.
Soso, A.B., Barcellos, L.J.G., Ranzani-Paiva, M.J. 2008. The effects of stressful broodstock
handling on hormonal profiles and reproductive performance of Rhamdia quelen (Quoy
& Gaimard) females. J. World Aquacult. Soc., 39, 835–841.
Spence, R., Gerlach, G., Lawrence, C., Smith, C. 2008. The behaviour and ecology of the
zebrafish, Danio rerio. Biol. Rev., 83 (1), 13-34.
Spitsbergen, J.M., Kent, M.L. 2003. The state of the art of the zebrafish model for toxicology
and toxicologic pathology research-advantages and current limitations. Toxicol. Pathol.,
31 (Suppl.), 62-87.
Steck, W.J., Zon, G., Egan, W., Stec, B. 1984. Automated solid-phase synthesis, separation, and
stereochemistry of phosphorothioate analogs of oligodeoxyribonucleotides. J. Am. Chem.
Soc., 106, 6077.
Stephens, Z.M., Alkindi, Y.A., Waring, C.P., Brown, J.A. 1997. Corticosteroid and thyroid
responses of larval and juvenile turbot exposed to the water-soluble fraction of crude oil.
J. Fish Biol., 50, 953–964.
Stolte, E., De Mazon, A., Leon, K., Jesiak, M., Bury, N., Sturm, A., Savelkoul, H., van
Kemenade, L., Flik, G. 2008. Corticosteroid receptors involved in stress regulation in
common carp, Cyprinus carpio. J. Endocrinol., 198, 403–417.
Stolte, E.H., van Kemenade, B.M., Savelkoul, H.F., Flik, G. 2006. Evolution of glucocorticoid
receptors with different glucocorticoid sensitivity. J. Endocrinol., 190, 17–28.
Stratholt, M.L., Donaldson, E.M., Liley, N.R. 1997. Stress induced elevation of plasma cortisol
in adult female coho salmon (Oncorhynchus kisutch), is reflected in egg cortisol content,
but does not appear to affect early development. Aquaculture, 158, 141–153.
References
105
Sumanas, S., Lin, S. 2004. Zebrafish as a model system for drug target screening and validation.
Drug Discov., Today, 3, 89-96.
Summerton, J. 2007. Morpholino, siRNA, and S-DNA Compared: Impact of Structure and
Mechanism of Action on Off-Target Effects and Sequence Specificity. Curr. Topics Med.
Chem., 7, 651-660.
Summerton, J. 2004. Morpholinos and PNAs compared. Lett. Pep. Sci., 10, 215- 236.
Summerton, J. Weller, D. 1997. Morpholino Antisense Oligomers: Design, Preparation and
Properties. Antisense Nucleic Acid Drug Dev., 7, 187- 195.
Summerton, J. 1999. Morpholino antisense oligomers: the case for an RNase H-independent
structural type. Biochim. Biophys. Acta, 1489, 141-158.
Tadros, W., Lipshitz, H.D. 2009. The maternal-to-zygotic transition: a play in two acts.
Development, 136, 3033-3042.
Talwar, P.K., Jhingran, A.G. 1991. Inland Fishes of India and Adjacent Countries. A.A.
Balkema, Rotterdam, pp. 1158.
Terova, G., Gornati, R., Rimoldi, S., Bernardini, G., Saroglia, M. 2005. Quantification of a
glucocorticoid receptor in sea bass (Dicentrarchus labrax, L.) reared at high stocking
density. Gene, 357, 144–151.
To, T.T., Hahner, S., Nica, G., Rohr, K.B., Hammerschmidt, M., Winkler, C., Allolio, B. 2007.
Pituitary–interrenal interaction in zebrafish interrenal organ development. Mol.
Endocrinol., 21, 472–485.
Trede, N.S., Langenau, D.M., Traver, D., Look, A.T., Zon, L.I. 2004. The use of zebrafish to
understand immunity. Immunity, 20, 367-79.
Vallée, M., Mayo, W., Dellu, F., Le Moal, M., Simon, H., Maccari, S. 1997. Prenatal stress
induces high anxiety and postnatal handling induces low anxiety in adult offspring:
correlation with stress induced-corticosterone secretion. J. Neurosci., 17, 2626–2636.
Vargesson, N.A. 2007. ‘Zebrafish’ in Manual of Animal Technology (ed. S. Barnett). Blackwell
Publishing Ltd: Oxford, UK.
Vegiopoulos, A., Herzig, S. 2007. Glucocorticoids, metabolism and metabolic diseases. Mol.
Cell. Endocrinol., 275, 43–61.
Vizzini, A., Vazzana, M., Cammarata, M., Parrinello, N. 2007. Peritoneal cavity phagocytes
from the teleost sea bass express a glucocorticoid receptor (cloned and sequenced)

References
106
involved in genomic modulation of the in vitro chemiluminescence response to zymosan.
Gen. Comp. Endocrinol., 150, 114–123.
Wang, M. 2005. The role of glucocorticoid action in the pathophysiology of the metabolic
syndrome. Nutr. Metab., (Lond.) 2, 3.
Watanabe, M., Iwashita, M., Ishii, M., Kurachi, Y., Kawakami, A., Kondo, S., Okada, N. 2006.
Spot pattern of leopard Danio is caused by mutation in the zebrafish connexin41.8 gene.
EMBO Reports, 7(9), 893-897.
Weinstock, M. 2005. The potential influence of maternal stress hormones on development and
mental health of the offspring. Brain Behav. Immun., 19, 296–308.
Weltzien, F.A., Andersson, E., Andersen, O., Shalchian-Tabrizi, K., Norberg, B. 2004. The
brain–pituitary–gonad axis in male teleosts, with emphasis on the flatfish
(Pleuronectiformes). Comp. Biochem. Physiol., 137A, 447–477.
Wendelaar Bonga, S.E. 1997. The stress response in fish. Physiol. Rev., 77, 591–625.
Westerfield, M. 2007. The Zebrafish Book: A guide for the laboratory use of zebrafish (Danio
rerio), 5th Edition. University of Oregon Press, Eugene, OR, USA.
Wright, D., Nakamichi, R., Krause, J., Butlin, R.K. 2006. QTL analysis of behavioral and
morphological differentiation between wild and laboratory zebrafish (Danio rerio).
Behavior Genetics, 36, 271-284.
You, Z., Masai, H. 2008. Cdt1 forms a complex with the minichromosome maintenance protein
(MCM) and activates its helicase activity. J. Biol. Chem., 283, 24469–24477.
Yeoh, C.G. 1993. The effects of hormones on development of embryonic and post embryonic
salmonids, and hormone metabolism during these stages. MS Thesis, Oregon State
University, pp. 120.
Yeoh, C.G., Schreck, C.B., Feist, G.W., Fitzpatrick, M.S. 1996a. Endogenous steroid
metabolism is indicated by fluctuations of endogenous steroid and steroid glucorinide
levels in early development of the steelhead trout (Oncorhynchus mykiss). Gen. Comp.
Endocrinol., 103, 107–114.
Yeoh, C.G., Schreck, C.B., Fitzpatrick, M.S., Feist, G.W. 1996b. In vivo steroid metabolism in
embryonic and newly hatched steelhead trout (Oncorhynchus mykiss). Gen. Comp.
Endocrinol., 102, 197–209.
Zamir, E., Kam, Z., Yarden, A. 1997. Transcription-dependent induction of G1 phase during the
zebra fish midblastula transition. Mol. Cell. Biol., 17, 529-536.

References
107
Zhang, Z., Burch, P.E., Cooney, A.J., Lanz, R.B., Pereira, F.A., Wu, J., Gibbs, R.A.,Weinstock,
G., Wheeler, D.A. 2004. Genomic analysis of the nuclear receptor family: new insights
into structure, regulation, and evolution from the rat genome. Genome Res., 14, 580–590.
Zimmer, M., Fink, T., Fischer, L., Hauser, W., Scherer, K., Lichter, P., Walter, U. 1997. Cloning
of the VASP (vasodilator-stimulated phosphoprotein) genes in human and mouse:
structure, sequence, and chromosomal localization. Genomics, 36, 227–233.
Zon, L.I., Peterson, R.T. 2005. In vivo drug discovery in the zebrafish. Nat. Rev. Drug Discov.,
4, 35–44.
Zou, S., Kamei, H., Modi, Z., Duan, C. 2009. Zebrafish IGF genes: gene duplication,
conservation and divergence, and novel roles in midline and notochord development.
PLoS ONE, 4(9), e7026.


![Ultima lezione 2016 medicina [modalità compatibilità] · specialmente: lspecialmente: linsulina’insulina il glucagone le catecolammine i glucocorticoidi e gli ormoni, il glucagone,](https://static.fdocumenti.com/doc/165x107/5c69b57309d3f27a7e8b89bd/ultima-lezione-2016-medicina-modalita-compatibilita-specialmente-lspecialmente.jpg)