UNIVERSITA’ DEGLI STUDI DI PADOVA - … Abstract Questo elaborato mira ad analizzare il legame che...
38
UNIVERSITA’ DEGLI STUDI DI PADOVA DIPARTIMENTO DI SCIENZE ECONOMICHE ED AZIENDALI “M.FANNO” CORSO DI LAUREA Economia e Management PROVA FINALE The nexus between bank and sovereign risk during the sovereign debt crisis RELATORE: CH.MO PROF. Bruno Maria Parigi LAUREANDO/A: Enrico Bernardi MATRICOLA N. 1065153 ANNO ACCADEMICO 2015 – 2016
Transcript of UNIVERSITA’ DEGLI STUDI DI PADOVA - … Abstract Questo elaborato mira ad analizzare il legame che...

UNIVERSITA’ DEGLI STUDI DI PADOVA
DIPARTIMENTO DI SCIENZE ECONOMICHE ED AZIENDALI “M.FANNO”
CORSO DI LAUREA
Economia e Management
PROVA FINALE
The nexus between bank and sovereign risk during the sovereign
debt crisis
RELATORE: CH.MO PROF. Bruno Maria Parigi
LAUREANDO/A: Enrico Bernardi
MATRICOLA N. 1065153
ANNO ACCADEMICO 2015 – 2016
2
Abstract Questo elaborato mira ad analizzare il legame che unisce il rischio nel settore finanziario al
rischio del debito sovrano attraverso la presentazione di alcuni studi. Alla fine del 2007,
infatti, la crisi finanziaria sviluppatasi negli Stati Uniti ha contribuito ad aumentare in maniera
significativa il rischio di credito nel sistema bancario dell’intera Europa. Questo, unito ad altri
fattori fra i quali scompensi a livello macroeconomico negli stati membri dell’unione e alcune
lacune nel sistema di governance dell’UE, ha portato allo scoppio della crisi del debito
sovrano. In questo contesto, si è materializzato il legame fra il settore bancario e quello
pubblico dopo che molti fra gli stati membri dell’Unione hanno impiegato ingenti risorse nel
tentativo di salvare i propri istituti di credito che versavano in forti condizioni di dissesto
finanziario. La caratteristica più importante di questo tipo di connessione è quella di essere un
legame bidirezionale nel senso che scompensi nel settore finanziario hanno ripercussioni in
quello pubblico e vice versa. Al fine di descrivere il rapporto che lega settore bancario e
debito sovrano l’elaborato è così organizzato: il capitolo due offre una breve descrizione di
alcune delle cause della crisi del debito sovrano che rappresenta il contesto all’interno del
quale si è assistito al trasferimento del rischio, il capitolo tre mira invece a definire a livello
teorico i modi in cui il rischio di credito influenza il settore pubblico e vice versa, infine, il
capitolo quattro presenta i risultati di studi che definiscono i fattori che hanno portato alla
costituzione del legame nonché le caratteristiche dello stesso.
3
Table of contents 1. Introduction
2. The sovereign debt crisis: a brief overview of its causes
2.1 The role of EU’s shortcomings
2.2 The role of fiscal policies
2.3 The role of the global financial crisis
2.4 The role of saving imbalances
2.5 The role of the loss in competitiveness
3. The theoretical framework behind the nexus between the banking and the sovereign
sector
3.1 The “diabolic loop”: theoretical explanation of the threat and possible solution
3.2 The channels through which risk shifts
3.3 A fundamental element of the “diabolic loop”: the home bias
4. Measuring and explaining the nexus
4.1 Two ways to measure sovereign risk: sovereign CDS and sovereign spreads
4.2 Qualitative analysis of the nexus
4.3 The establishment of the nexus: the triggering phase
4.4 The main features of the nexus
4.5 Some factors that affect the nexus
5. Conclusions
6. Bibliography

4
1. Introduction Starting from the end of 2007 Europe had to cope with the effects of the financial
crisis that originated in the US and spread all over the world. This crisis hit the European
Union and contributed to worsen the already difficult situation of many countries of the
Eurozone. Indeed, within few years, imbalances at the country level in Europe translated into
the sovereign debt crisis. This period of distress brought to light weaknesses in the fiscal
position and in the financial sector of many European countries and most importantly it
created negative synergies between the sovereign and the banking sectors. Particularly,
Europe faced the risk of the nexus between sovereign and bank risk i.e. vulnerabilities that
arose in the financial sector translated into an increase in sovereign distress at the government
level and vice versa. Given the threatening consequences of this nexus some economists
studied this phenomenon conducting empirical researches and designing theoretical models in
order to identify the determinants of the link between sovereign and bank risk. This thesis
aims at presenting the results of some studies that tried to shed light on the two-way feedback
loop that occurred in Europe during the sovereign debt crisis. Particularly, this piece of work
would like to collect the results of some authors that designed theoretical models that are
useful to understand the nexus between sovereign and bank risk. On top of this, the main
findings of some empirical analyses are also included. Specifically, the empirical pieces of
evidence presented here would like to clarify which are the main elements that lead to the
establishment of the nexus between sovereign and financial risk. Furthermore, the empirical
studies reported aims at defining some of the characteristics of the nexus using two alternative
measures of sovereign risk namely sovereign CDS and sovereign spreads.
Therefore, chapter 2 offers a brief overview of the causes of the sovereign debt crisis.
Chapter 3 presents the theoretical framework useful to model the loop between sovereign and
bank risk and some evidence in favor of the home bias. Chapters 4 provides empirical
evidence that describes both the elements that lead to the establishment of the two-way
feedback loop between sovereign and bank risk and the features of the tie between the two
risks.

5
2. The sovereign debt crisis: a brief overview of its causes The very beginning of the sovereign debt crisis started in early 2010 when Greece
revealed that the government budget data for 2009 was much larger than the estimates
previously declared to the public. These pieces of news decreased investors’ confidence
towards the sustainability of public finances of Greece and after little time of other periphery
countries like Portugal, Spain, Italy and Ireland. This risk-reassessment led to an increase in
sovereign spreads in Greece, Portugal, Ireland and Spain in the period that goes from the
second half of 2010 to the first half of 2011. As a result, almost all countries at the European
periphery had to implement fiscal austerity measures forced by markets’ pressure.
The causes that led to this scenario are multiple and sometimes difficult to disentangle,
therefore, this chapter aims at briefly presenting only some the most important elements that
contributed to the rise of the crisis.
2.1 The role of EU’s shortcomings One of the main elements that contributed to the sovereign debt crisis in Europe is a
set of flaws in the design of the Monetary Union. The first one pointed out by Lane (2012) is
the lack of a banking and fiscal union that makes banking regulations and the fiscal policy a
national responsibility. This allows countries to have a certain level of freedom to cope with
problems related to public expenditure or the banking sector. In particular, countries still have
to bear the risks of a banking crisis such as the direct costs of a recapitalization of financial
institutions.
The second shortcoming stressed by Lane (2012) is related to the fact that all countries
after the inception of the Euro could borrow at a relatively low interest rate (which coincided
with the rate at which Germany could borrow). This poses an over-borrowing problem that
was supposed to be handled by the Maastricht treaty’s limits on the size of annual budget
deficit at 3% of GDP and on the stock of public debt of 60% of GDP. However, these rules
were not sufficient to prevent countries at the periphery, for example Greece, from
accumulating huge stocks of debt.
On top of these elements, the European commission (www.ec.europa.eu) addressed
other vulnerabilities at the EU level that favored the rise of the sovereign debt crisis. One of
these is represented by the fact that European authorities responsible for monitoring the
economic conditions of public finances were too focused on the annual budget deficit of each
country and neglected the other fundamental determinant of a country’s fiscal position namely
the level of government debt. Therefore even those countries that kept their annual current
deficit low had to cope with serious problems during the global financial crisis because of
6
high levels of public debt.
Another weakness that led to the sovereign debt crisis is the lack of effective
surveillance of the monitoring authorities that didn’t attach the right weight to the loss of
competitiveness experienced by the European countries nor to their macroeconomic
imbalances. Indeed, surveillance authorities didn’t pay much attention to the credit growth
that happened in some countries at the periphery nor to the high private levels of
indebtedness. On top of this, also weaknesses in the financial sector and inflated housing
markets were among the problems that didn’t receive the attention they deserved.
The last element that paved the way to the sovereign debt crisis is the lack of an
effective mechanism that could provide European countries with the financial means they
needed to cope with the bad health of their public finances. As a matter of fact, financial
support should have been targeted not only to tackle country specific issues but also to
prevent contagion in the Eurozone.
2.2 The role of fiscal policies As Lane (2012) argued, one of the factors that favored the spread of the sovereign debt
crisis is related to the fact that some European countries during the pre-crisis period between
2003 and 2007 didn’t tighten their fiscal policy in a moment where they needed to be
tightened. In Ireland and Spain, for instance, credit and housing booms generated extra tax
revenues that should have been used to improve the fiscal position in these countries, instead,
loose fiscal policies had been undertaken.
Surveillance bodies’ behavior gave a strong contribution to these loose fiscal policies
in the period from 2002 to 2007. Indeed, neither domestic authorities nor international
organizations such as the IMF, OECD, and the European Commission attached the right
weight to macroeconomic, financial, and fiscal risks associated with the expansion in external
imbalances, credit growth, sectorial debt levels, and housing prices in the countries at the
European periphery. The result was a general underestimation of the risk of the conditions of
many European countries.
The potentially negative consequences of loose fiscal policies became tangible when
the global financial crisis hit Europe in 2008. As Lane (2012) pointed out the increase in
financial risk made investors reassess the sustainability of the rapid credit growth and large
external deficits especially in the countries at the European periphery. This reassessment led
to private sector capital outflows, tighter credit conditions, a stop in the construction activity
and considerable losses in the banking sector that faced both the issue of increasing losses and
liquidity problems.
7
2.3 The role of the global financial crisis
The sovereign debt crisis is also the result of the events that happened in the American
banking sector when the financial crisis broke out in 2007. As pointed out by the European
commission (www.ec.europa.eu), when the US economy slowed down many households
failed to repay their mortgage loans leading to the US banking sector to suffer huge losses.
This financial distress spread across the entire globe and affected also European banks that
had invested heavily in the American mortgage market. In order to rescue their weak financial
sector that was close to failure, many countries namely Germany, France, the UK, Ireland,
Denmark, the Netherlands and Belgium bailed out their banking sector. Bailout costs proved
to be very high and contributed to deteriorate public finances of these countries.
The effects of this financial turmoil had been heterogeneous across the Eurozone.
Indeed, Milesi-Ferretti and Tille (2011) highlight that financial distress in Europe made
investors repatriate funds to home markets and reassess their international exposure level.
This implies that those countries that relied heavily on external funds were hit more severely
by this process of risk-reassessment with the respect to those who didn’t. A perfect example
of this fact is the case of Ireland in which the Irish government in September 2008 had to bail
out its banking sector that strongly relied on international short-term funds.
On top of this, the global financial crisis brought to a reassessment of asset prices and
growth prospects especially for those countries that were characterized by macroeconomic
imbalances in the pre-crisis period. For instance, the decline in the Irish and Spanish
construction sectors that had experienced a rapid growth in the period before the crisis
represented a huge shock for the economies of the two countries.
However, only starting from 2009 the financial crisis had a harsh impact on the
sovereign sector since, as shown by Mody and Sandri (2012), only from this moment on
investors realized that an increase in banks’ losses could worsen a country’s fiscal situation.
2.4 The role of saving imbalances According to Higgins and Klitgaard (2011) one of the elements that favored the rise of
the sovereign debt crisis is the set of saving imbalances in which countries at the European
periphery incurred in the period before the crisis.
As reported by these two authors in the period that goes from 1999 to 2007 saving
deficits (defined as domestic savings minus domestic investment spending) of Greece, Spain
and Portugal ranged from 10% to 15% of their respective GDP. In a similar manner Ireland
faced a smaller but still significant deficit of 5% of its GDP. On the other hand, Germany,
which was not characterized by saving imbalances, experienced an increase in its savings

8
mostly driven by the increase in the private sector savings. The saving deficit path influenced
the path of consumption. Indeed, Ireland, Spain and Greece experienced an increase in
consumption in the time window that ranges from 1999 to 2007, conversely, Germany’s
consumption level remained constant. Finally, over the same period, the developments on the
saving rate side influenced also the level of household liabilities that increased remarkably in
the periphery countries while it decreased in Germany.
These saving imbalances arose also as a consequence of the creation of the common
currency. Indeed, after the inception of the Euro, periphery countries could borrow at
relatively low interest rates; this fostered capital inflows towards those countries bringing to
an increase in current account deficits.
Current account deficits are not an issue per se, however, they become a problem
when the saving-investment mix doesn’t favor growth and stability. This is precisely what
happened in countries at the European periphery in the period before the crisis. Indeed, if we
take a look at the investment side we notice that in Greece the level of investments decreased
while in Portugal it remained flat. On the other hand, in Ireland and Spain investment
spending increased but mainly because of an increase in the construction sector, this made
huge housing bubbles form in both these two countries. Clearly in all four countries these
investment strategies couldn’t sustain growth in the long run and couldn’t help but worse the
stability of the countries.
Overall, the increase in foreign borrowing was the consequence of low savings in
Greece and Portugal while In Ireland and Spain the capital inflows resulting from borrowing
fuelled the rise of housing bubbles. However, all four countries ended up with the high
foreign indebtedness that was doomed to become an unsustainable burden given that capital
inflows were not used by any of the periphery countries to improve their productivity capacity
that is one of the elements that allows a country to cope with its foreign debt.
2.5 The role of the loss in competitiveness Another important element that contributed to the rise of the sovereign debt crisis is
the loss of competitiveness experienced by countries at the European periphery. Country
competitiveness can be measured in different ways.
One possible measure proposed by Higgins and Klitgaard (2011) is the relative unit
labor cost of manufacturing. Intuitively, the higher the level of wages the smaller the
competitiveness of a country, unless high wages are offset by productivity gains. Data in
picture 2.1 suggest that Portugal, Spain and Greece all experienced an increase in the unit of
labor costs and therefore experienced a considerable loss in competitiveness. Ireland is a

9
strange case since its level of competitiveness can be compared to some extent to the one of
Germany.
Picture 2.1 Relative unit labor costs in manufacturing Source: Higgins and Klitgaard (2011) The picture plots the path of the relative unit labor costs in manufacturing for Greece, Portugal, Germany, Ireland and Spain. The higher the increase in this variable the stronger the loss of competitiveness experienced by the country. Spain, Portugal and Greece all experienced high appreciation in the level of this variable and therefore suffered from a loss in competitiveness. On the other hand, in Germany the level of this variable was pretty low suggesting that this country didn’t experience a loss in competitiveness.
The second measure that may help in assessing the loss in competitiveness consists in
comparing the growth in the exports of a country with the growth in the imports of the trading
partners of the same country. As pointed out by Higgins and Klitgaard (2011) if a country’s
export growth cannot keep pace with its partners’ import growth it means that country is
becoming less competitive because it is losing market share. OECD calculations plotted in
picture 2.2 show that periphery countries namely Portugal, Greece and Spain experienced a
considerable loss in competitiveness as their market share decreased in the period that goes
from 1999 to 2007.
Picture 2.2 Export market share Source: Higgins and Klitgaard (2011) The picture plots the export market share for Greece, Portugal, Germany, Ireland and Spain. A decrease in the market share of a county can be interpreted as a decrease in the competitiveness of that country. As highlighted by the picture Greece, Spain and Portugal were among the countries that, in the period before the rise of the sovereign debt crisis, experienced the most severe decrease in competitiveness given the decreasing path of their market share.
10
3. The theoretical framework behind the nexus between the
banking and the sovereign sector One of the key features of the European sovereign debt crisis of 2011 is the dramatic
strengthening of the nexus between the sovereign and the bank risk. Given the importance of
this characteristic it is worth to define a theoretical framework that will help rationalizing how
this link became so strong.
3.1 The “diabolic loop”: theoretical explanation of the threat and possible
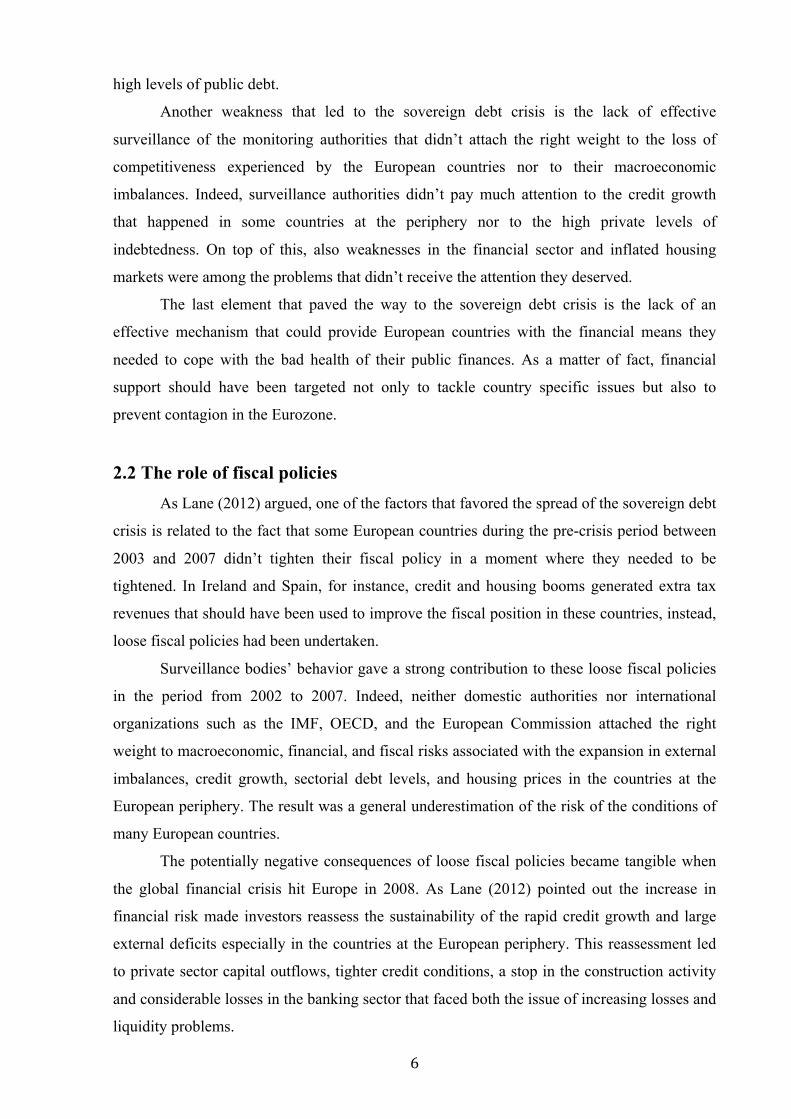
solution A remarkable piece of literature dealing with the tie that links the sovereign and the
banking sectors is the model of the “diabolic loop”, developed by Brunnermeier et al. (2016),
that aims at describing how sovereign and bank risk interact. Specifically, when government’s
creditworthiness deteriorates sovereign debt risk increases leading to a reduction in the value
of the assets held by domestic financial institutions and causing the level of distress to rise
also at the bank level. As a consequence the probability of a bailout by the government rises
bringing sovereign creditworthiness even lower with the respect to its initial level. In addition
to this channel, there is also another way through which sovereign and bank risks are linked.
Indeed, when the financial sector is distressed the credit supply to the economy shrinks
producing a recessionary impact that slows growth down and reduces tax revenue triggering
the so called “real economy loop” (Picture 3.1). Up to this point, sovereign creditworthiness
has worsened for two reasons: the increase in the bailout costs and the deterioration in the
country’s fiscal condition.
Picture 3.1 The “diabolic loop” Source: Brunnermeier et al. (2016) The picture shows two ways in which bank and sovereign risk interact. The rise in sovereign risk affects the value of sovereign bonds banks hold in their balance sheets. This increases the financial risk and the probability of a bailout making distress at the government level rise. Moreover when financial risk increases the credit supply decreases reducing both the growth in the real economy and the tax revenue collected by the government and, ultimately, increasing sovereign risk.

11
These vicious circles arise only if three conditions are met. The first one is the home
bias i.e. banks hold a sufficiently large amount of sovereign bonds. Indeed, this portfolio
choice makes the value of equity and solvency of the financial sector depend on the quality of
the sovereign domestic debt. The second condition is government’s lack of incentive to
commit not to rescue the financial sector whenever distressed. Indeed, when bank risk
increases it is optimal for the public sector to bail the financial sector out since the rescue
operation is supposed to prevent government’s fiscal condition from worsening. Third, free
capital mobility, which ensures that international investors’ perceptions of future government
solvency – whether warranted by fiscal fundamentals or not – are incorporated in the market
value of domestic government debt (Brunnermeier et al. 2016, p 2).
Breaking the diabolic loop is feasible. As suggested by Brunnermeier et al. (2016) one
possible solution is to reduce the sensitivity of banks’ sovereign debt portfolio to domestic
sovereign risk. One way of doing it is to make financial institutions hold only particular senior
tranches, namely European Safe Bonds (ESBies), obtained securitizing a well-diversified
portfolio of euro-area sovereign bonds. It’s important to point out that both the diversification
and the seniority are necessary characteristics of ESBies. In fact, if banks held only a well-
diversified portfolio of European bonds (i.e. their sovereign portfolio was not tranched) they
would still end up suffering losses due to the deterioration of creditworthiness of some
European countries. If we also consider that usually sovereign creditworthiness is correlated
among countries it must be that diversification alone is not enough to break the nexus
between sovereign and bank risk. Tranching alone is not enough to isolate banks form
sovereign risk either. On one hand, making financial institutions hold only senior tranches of
securitized sovereign debt allows to reduce the scope for the diabolic loop to arise since the
risk shifts from the banking sector to the holders of the junior tranches. On the other hand, the
securitization process is not able to manufacture a sufficiently large amount of safe securities
especially in those countries that have weak fiscal conditions. Therefore pooling and
tranching bonds issued by different countries will make the risk shift from financial
institutions to holders of the junior tranche effectively and, via reduction of the probability of
a government intervention, defuse the diabolic loop.

12
3.2 The channels through which risk shifts The model described in the previous section is useful to rationalize the nexus between
government and bank risk, yet it doesn’t offer a complete picture of all the possible ways in
which the two types of risks interact. Indeed, the BIS (2011) identifies four different channels,
through which sovereign distress affects the financial sector.
The first one, already pointed out by Brunnermeier et al. (2016), is the asset holding
channel. Given that banks hold sovereign bonds, whenever sovereign default risk increases
their value decreases and so does the value of the assets in financial institutions’ balance
sheets. This causes the banking sector to suffer losses.
The second transmission channel is the collateral channel. According to this channel if
sovereign risk raises the value of the assets, namely sovereign bonds, banks can offer as
collateral in repo transactions in the interbank market decreases. This depreciation, impairing
financial institutions’ ability to obtain liquidity, contributes to raise risk also at the bank level.
The third channel that links sovereign and bank risk is the guarantee channel. When
sovereign distress increases the value of the guarantees (both implicit and explicit) the
government can offer decreases. This reduces the benefits that financial institutions can get
from such guarantees and also the effectiveness of government treatment to fix distressed
situations at bank level.
The last risk transmission channel is the rating channel. According to this channel the
sovereign rating is an important determinant of the bank risk for two main reasons. First, a
downgrade in sovereign rating may have a direct negative impact on banks’ debt and equity
funding. This effect works via the three channels described above. Second, given the tie that
links the banking and the sovereign sector, rating agencies deliberately decide to assign to
financial institutions a rating that cannot be higher than the rating attached to the sovereign
debt. Hence, sovereign downgrades usually lead to downgrades also of the domestic banks.
This increases financial distress for three reasons. First, banks face higher costs on their bond
and equity funding. Second, the access to the liquidity market may be reduced and third the
downgrade of domestic banks may tighten portfolio constrains forcing institutional investors
to sell their holdings of bank bonds if their ratings fall below a certain threshold. All these
elements contribute to increase distress at the bank level.
These results, combined with those of the “diabolic loop” model, provide a good
theoretical framework which is ultimately characterized by two main attributes: the fact that
the link between sovereign and bank risk is bidirectional i.e. government risk affects bank risk
and vice versa and the fact that there are multiple ways through which distress shifts from one
sector to the other.

13
3.3 A fundamental element of the “diabolic loop”: the home bias In the model of the “diabolic loop” developed by Brunnermeier et al. (2016) the most
important necessary condition for the vicious circle to arise is the home bias. This feature
became particularly important during the sovereign debt crisis since the amount of sovereign
bonds held by banks in several European countries increased dramatically. In order to
estimate the relevance of sovereign exposure during the crisis it is worth to present some
stylized facts identified by Altavilla, Pagano and Simonelli (2015). These authors exploited a
data set made up of monthly observations on the main balance sheet items of some European
countries in the period that goes from June 2009 to February 2015. In particular, data are
available for the following countries: Cyprus, Greece, Ireland, Italy, Portugal, Slovenia,
Spain, Austria, Belgium, Estonia, Finland, France, Germany, Luxembourg, Malta, the
Netherlands, and Slovakia. For the purpose of the analysis countries are divided into
vulnerable, i.e. highly exposed to sovereign stress, and non-vulnerable countries (a country is
considered vulnerable if its 10-year sovereign spread exceeds 6%). The first seven countries
of the list belong to the former group while the rest belongs to the latter.
Table 3.1 Domestic exposure, bank lending, interest rates and bank characteristics Source: Altavilla, Pagano and Simonelli (2015) The table presents the mean, median and standard deviation of banks’ monthly sovereign exposures, loans to firms, CDS premia and interest rates (Panel A), and characteristics (Panel B) for vulnerable and non-vulnerable countries. Domestic Sovereign Exposures are domestic sovereign debt as a fraction of the corresponding bank’s main assets. Bank Lending is the bank loans to non-financial corporations as a fraction of the corresponding banks’ main assets. Bank Lending Growth and Sovereign Holdings Growth are the quarterly growth rates (in percent) of bank loans to non-financial companies and of their sovereign holdings. Interest Rate is the interest rate charged on loans to non-financial corporations. Leverage Ratio is the ratio of banks’ total assets to their equity capital. T1/RWA is the ratio of Tier-1 common equity to risk-weighted assets. Public is the fraction of banks’ shares owned by local or national government or publicly controlled institutions (Fondazioni in Italy, Fundaciones and Cajas in Spain, and Sparkasse and Landesbank in Germany). Bailout equals 1 starting in the quarter in which a bank was bailed out (unless acquired in the two subsequent quarters), and 0 before that date.
14
Table 3.1 reports some descriptive statistics related to sovereign exposure for the two
groups of counties. From the table, three main differences between vulnerable and non-
vulnerable countries emerge. First of all, on average, vulnerable countries are more exposed
to domestic sovereign debt with respect to non-vulnerable ones. Second, the rate at which the
amount of domestic sovereign bonds held by banks in vulnerable countries grows is almost
double compared to the rate at which sovereign exposure grows in non-vulnerable countries.
Last, the average amount of loans to firms and the relative average interest rate are higher in
vulnerable countries with the respect to non-vulnerable ones.
Despite these differences, the two categories have some characteristics in common
such as the high dispersion in sovereign exposure as well as in the growth of sovereign
holdings and in corporate lending. Also, vulnerable and non-vulnerable countries share some
other features like the size of total assets held in their balance sheets, high leverage ratios and
strong reliance on deposit funding.
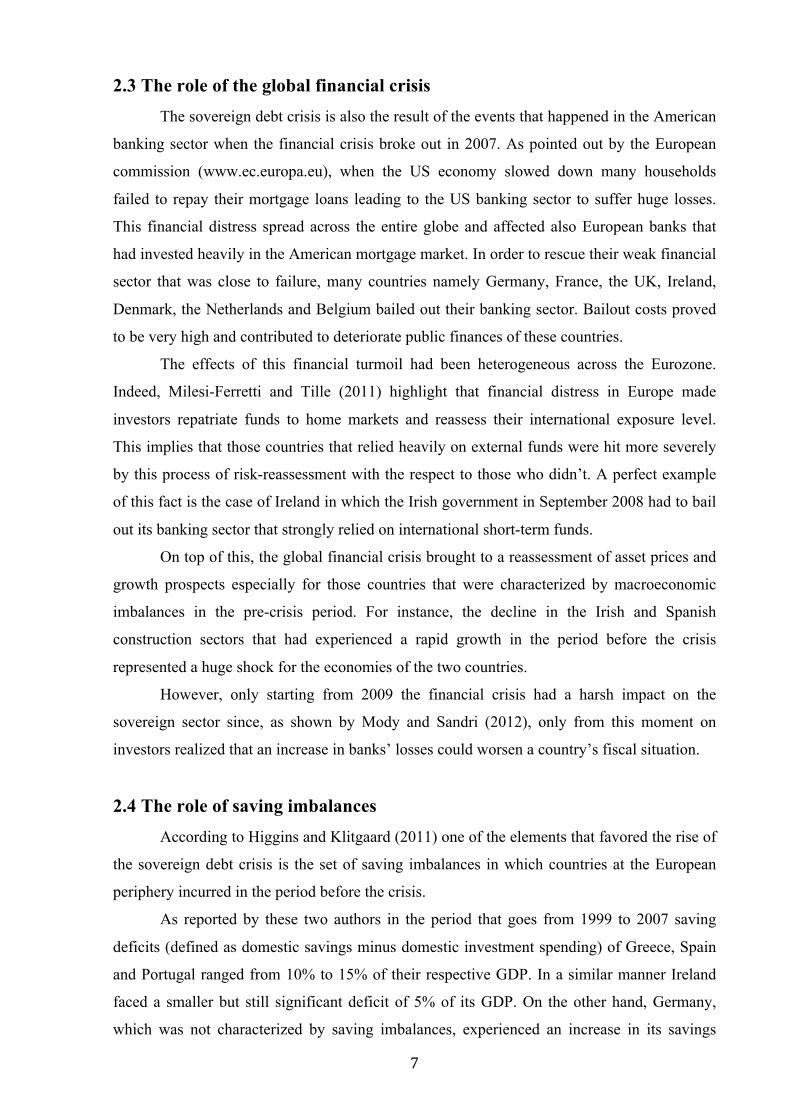
Taking a step further in the analysis we can examine the evolution over time of the two
main stylized facts that stuck out in table 3.1, namely rapid growth of sovereign exposure and
reduction in corporate lending. The first of the two is highlighted in picture 3.2. In fact, this
piece of graphical evidence points out not only the fact that sovereign exposure is
significantly larger in vulnerable countries with the respect to non-vulnerable ones but shows
also that sovereign bonds are purchased almost only by head banks.
Picture 3.2 Median domestic sovereign exposure of head banks, domestic and foreign subsidiaries Source: Altavilla, Pagano and Simonelli (2015) Domestic sovereign exposure (monthly values) is the ratio of domestic sovereign debt holdings to main assets. The figure shows that sovereign exposure is higher in vulnerable countries with the respect to non-vulnerable ones. On top of this the picture shows that head banks hold sovereign securities while subsidiaries don’t.

15
Pictures 3.3 and 3.4 provide even more strong pieces of evidence in favor of the
stylized facts above since they plot the patterns of sovereign exposure and of loan-asset ratio
for the median bank in vulnerable and non-vulnerable countries respectively. The two graphs
differ in two main aspects. First, as already pointed out above, the increase in the sovereign
domestic exposure is higher in vulnerable countries than in non-vulnerable ones. Second,
loans to non-financial institutions are negatively correlated with sovereign domestic exposure
for vulnerable countries while for non-vulnerable ones the correlation between the two
variables is positive (with the exception of the first two years of the sample).
Picture 3.3 Domestic sovereign exposure and loan-asset ratio of the median bank in vulnerable countries Source: Altavilla, Pagano and Simonelli (2015) Domestic sovereign exposure (monthly values) is the ratio of domestic sovereign holdings to main assets; the loan-asset ratio is lending to non-financial corporations divided by main assets. The picture highlights the negative correlation between sovereign exposure and the loan-asset ratio for vulnerable countries. Indeed, in the period taken into account the former increases while latter decreases.
Picture 3.4 Domestic sovereign exposure and loan-asset ratio of the median bank in non-vulnerable countries Source: Altavilla, Pagano and Simonelli (2015) Domestic sovereign exposure (monthly values) is the ratio of domestic sovereign holdings to main assets; the loan-asset ratio is lending to non-financial corporations divided by main assets. The picture highlights the positive correlation between sovereign exposure and the loan-asset ratio. Indeed, in the period taken into account both variables increase (with the exception for the first two years of the sample).
16
It is worth to stress that this last empirical evidence is meant to be a simple stylized fact,
indeed, no causality relation can be established on the basis of the simple negative correlation
between the two variables examined.
Given these findings, trying to explain how and why banks’ portfolio choices towards
sovereign bonds change over time is of crucial importance. When economic conditions are
normal, it is not surprising that the banking sector holds sovereign bonds. On one hand, as
pointed out by Acharya and Steffen (2015), holding treasury bonds helps financial institutions
manage risk since zero risk-weight is attached to investments in sovereign debt. On the other
hand, as suggested by Bolton and Jeanne (2011), government bonds are important for
liquidity-management purposes since they let banks obtain liquidity in two ways. First,
holding sovereign bonds allows financial institutions to get access to public liquidity since
central banks, in normal economic conditions accepts as collateral only high-rated securities
like treasury bonds. Second, sovereign securities serve as a guarantee for banks also to make
repo transactions take place in the interbank market.
Yet, during the European debt crisis the economic scenario has changed significantly
and the reasons listed above are not able to explain, by themselves, the dramatic increase in
sovereign exposure for vulnerable countries. In an attempt to address this issue literature has
developed two different hypotheses: the “moral suasion” and the “carry trade” hypotheses.
The term “moral suasion” refers to an appeal to “morality” or “patriotic duty” to
induce behavior by the persuaded entity that is not necessary profit‐maximizing for it
(Ongena, Popov, Horen, 2016, p. 2). Horvitz and Ward (1987) argued that this appeal may
also be affected by the persuaded entity’s fear of being the target of repressive measures that –
in the case of banking - goes from stricter supervision to limited access to central bank
funding to the revoking of the bank’s license. However, it can also imply a natural agreement
between two parties that share the same interest. For example, banks may choose to respond
to pressure from their government if they are locked in a long‐term relationship with the
government where it is implicitly understood that current favors are always reciprocated in the
future (Ongena, Popov, Horen, 2016, p. 2).
The “carry trade” hypothesis, instead, states that undercapitalized banks have an
incentive to buy sovereign bond of peripheral countries in order to gain profits from the
spread between the long-term peripheral countries yields and their short term founding cost.
Of course this investment strategy involves a considerable amount of risk since when the
spreads of the two legs of the trade diverge sovereign bonds depreciate and this translates into
banking suffering losses. In other words, banks, particularly the undercapitalized ones, have

17
the incentive to purchase high-yield government bonds that serve as a tool to get involved in
risky but potentially profitable investment strategies.
These two theoretical hypotheses are supported by some empirical studies conducted
by Altavilla, Pagano and Simonelli (2015). Particularly, the authors focused on three features
of financial institutions that are capable of explaining both the difference in sovereign
exposure between vulnerable and non-vulnerable countries and variations in sovereign
exposure in banks’ portfolio, especially within the group of vulnerable countries. The three
bank characteristics are: the public ownership, the government-bailout history and regulatory
capital ratios. The first variable is consistent with the moral suasion hypothesis since the
higher the fraction of shares of a bank held by the government the more a financial institution
will be prone to purchasing sovereign bonds even when sovereign risk is relatively high. In a
similar manner a bank, which has been rescued by the government, is going to be more
willing to buy sovereign securities since its ability to survive depends on public capital
infusions. For this reason also government’s bailout-history can help in supporting the “moral
suasion” hypothesis. Finally, the third variable is able to back the “carry trade” hypothesis up
since the lower the capitalization of a bank the higher the incentive to buy high-yield
government bonds and engage in highly risky investment strategies.
Now, let us examine some evidence to test whether the three variables just mentioned
can actually explain the increase in domestic sovereign exposure in some European countries.
Picture 3.5 Domestic sovereign exposure and bank ownership, in vulnerable and non-vulnerable countries. Source: Altavilla, Pagano and Simonelli (2015) The lines labeled “public” and “private” respectively plot the average exposure (monthly values) of banks above and below the average fraction of public ownership in the relevant countries in 2008. For vulnerable countries at the end of 2011 sovereign exposure increased significantly more for those banks whose public ownership is above the average. A qualitative similar result can be recognized for non-vulnerable countries.

18
Picture 3.5 describes the relationship between public ownership and sovereign
exposure in vulnerable and non-vulnerable countries. In each panel, the continuous line,
labeled “public”, plots the average sovereign exposure for banks whose fraction of public
ownership is above the average while the dashed line, labeled “private”, refers to the average
sovereign exposure of banks whose public stake of share is below the average. For vulnerable
countries the two series are very close with each other till the end of 2011. From that moment
on the two lines start to diverge pointing out that sovereign exposure becomes significantly
higher for banks with more public ownership with the respect to those with a lower public
ownership. In the series in the right hand side panel a qualitatively similar result can be
recognized, however, in this second case the increase in the average sovereign exposure for
“public” banks is much smaller.
Picture 3.6, instead, analyzes the interaction between the bailout history and sovereign
exposure. The line plotted in each of the two panels is the difference between the average
sovereign domestic exposure of banks that benefitted from a bailout and those that didn’t,
measured in the same month and over a 2-year window of time before and after the bailout.
For vulnerable countries the left hand side panel of the picture shows that in the aftermath of
the bailout the difference in sovereign exposure between rescued banks and control banks, i.e.
financial institutions that didn’t benefit from a bailout, has considerably widened. The same
pattern cannot be identified in non-vulnerable countries.
Picture 3.6: Difference between the average domestic sovereign exposure of bailed-out and control banks, in vulnerable and non-vulnerable countries. Source: Altavilla, Pagano and Simonelli (2015) Control banks are those that are not bailed out. The difference refers to values observed in the same month and for the same group of countries. Month 0 is the bailout date. For vulnerable countries the difference in sovereign exposure between rescued and control banks increased after the bailout. The same pattern cannot be identified in non-vulnerable countries.

19
Picture 3.7 Domestic sovereign exposure and bank regulatory capital in vulnerable and non-vulnerable countries. Source: Altavilla, Pagano and Simonelli (2015) The lines labeled “highT1/RWA” and “lowT1/RWA” refer respectively to the average exposure (monthly values) of banks with above- and below-median ratios of Tier 1 capital to risk-weighted assets. The picture shows that, for vulnerable countries, low-capitalized banks increased sovereign exposure more than better-capitalized financial institutions.
Finally, picture 3.7 investigates whether regulatory capital ratio affects banks’
sovereign exposure. In this context the measure of banks capital adequacy is the Tier-1 capital
ratio scaled by risky weighted assets. The two panels in the picture plot the average sovereign
exposure for vulnerable and non-vulnerable countries. Within each group banks are divided
into two groups: the “high T1/RW A” whose Tier-1 capital ratio is above the median and the
“low T1/RW A” whose Tier-1 capital ratio is below the median. The figure clearly highlights
that, among vulnerable countries, financial institutions with a low level of capital increase the
amount of sovereign bonds significantly more than well-capitalized banks.
According to these empirical findings, in vulnerable countries, banks with low
regulatory capital and high public ownership buy more sovereign bonds when sovereign risk
increases. The same is true for financial institutions that have been recently rescued by their
governments. These analysis, although qualitative, ensure that the banks’ characteristics listed
above are able to explain the increase in financial institutions’ sovereign exposure.
All these results are also supported by quantitative analyses. Particularly, the authors ran two
main sets of OLS regressions to find evidence in favor of the “moral suasion” and the “carry
trade” hypothesis respectively.
The first set of regressions, reveals that, when the value of the sovereign debt
deteriorates, the higher the share of public ownership of financial institutions the higher the
quarterly growth rate of domestic sovereign holding for banks headquartered in vulnerable
countries. Furthermore, the regressions show that, other things being equal, banks that have

20
been saved are supposed to purchase more sovereign bonds with the respect to non-bailed-out
financial institutions. Similar results cannot be identified for non-vulnerable countries.
On the other hand, according to the second set of regressions, when sovereign debt
becomes cheaper the lower the level of regulatory capital of a bank the higher the growth rate
of domestic sovereign exposure for banks in vulnerable countries.
Overall the analyses support both the moral suasion and the carry trade hypotheses
that can, therefore, be considered two of the main drivers of the increase in banks’ sovereign
exposure during the sovereign debt crisis.
21
4. Measuring and explaining the nexus This chapter aims at presenting the results of two empirical studies that tried to shed
light on the nexus between sovereign and bank risk. Particularly, the following paragraphs are
meant to show which are the factors that led to the establishment of the nexus, which are the
characteristics of the tie and which are some of the factors that affect the risk transfer.
4.1 Two ways to measure sovereign risk: sovereign CDS and sovereign
spreads In order to analyze the nexus between the sovereign and the banking sectors
empirically it is necessary to identify some measures of the riskiness in the two sectors. Here
we take into account two different studies, the first one developed by Acharya, Drechsler and
Schnabl (2014) and the second one carried out by Mody and Sandri (2012), that used two
different measures of sovereign risk namely sovereign CDS and sovereign spreads.
Sovereign CDS can be considered a kind of insurance investors buy in order to protect
themselves from the risk of insolvency of a country, for this reason changes in their spreads
can be used to measure sovereign risk.
In a similar manner also sovereign spreads carry information about the riskiness of the
public sector of a country. The advantage of using this last element on top of sovereign CDS
to measure risk at the government level is that the latter measure is made up of different
components and each of them reflects a particular aspect of sovereign risk.
Furthermore, the evolution of sovereign bond yields came to be under the spotlight
during the recent financial and economic crisis. Indeed, sovereign yields, which - despite
pretty different fiscal positions - were very similar across countries in Europe in the period
that goes from the inception of the euro to mid-2007, started to increase and differentiate
consistently after the financial crisis hit Europe. Given this remarkable change in sovereign
bond yields’ patterns, using sovereign spreads as an alternative measure of public sector
riskiness may be useful to detect some characteristics of the nexus that might not emerge from
an analysis that takes into account only sovereign CDS as a measure of sovereign risk.
In order to fully understand why it might be useful to use sovereign spreads as an
alternative way to measure sovereign risk it is important to present a brief overview of the
major determinants of sovereign risk premia. Indeed, sovereign spreads are made up of
different components that are usually difficult to disentangle since they are closely
interconnected and correlated with each other. However, as pointed out by the ECB on its
22
monthly bulletin (issue 5) of 2014 in theory it is possible to identify two main elements that
determine sovereign spreads namely liquidity premium and credit premium.
Liquidity premium is the compensation investors require in order to bear the risk of
selling the asset at a lower price because of the inability to find a counterpart willing to buy it.
The main elements that affect this type of risk are the size of the bond market, the transaction
costs investor need to bear (bid-ask spreads) and the trading volumes.
On the other hand, credit premium is the compensation required by investors to bear
the risk of default of the issuer of the security. This type of compensation depends on the
specific country’s fiscal position. Therefore, all the variables that affect directly or indirectly
government’s finance conditions are responsible for changes in this component of sovereign
spreads. These variables are the existing stock of public debt, the primary deficit-to-GDP
ratio, the debt maturity and the owner profile. Macroeconomic variables affecting the ability
of a country to repay its debt influence credit premium as well. The most important variables
belonging to this category are GDP current and potential growth, current account balance and
country competitiveness.
Given the effects of the recent financial and sovereign crisis and the deterioration of
sovereign fiscal position, the credit premium became of crucial importance in affecting
sovereign spreads. As a matter of fact, after the economic crisis broke out the credit risk
premium has been the most important component of sovereign spreads. Moreover, since this
component captures the largest part of the elements related to the sovereign financial
conditions of a country it is strongly connected with the default risk of that country.
Therefore, sovereign spreads can be a good alternative way to measure sovereign distress.
4.2 Qualitative analysis of the nexus In order to provide a general picture of the nexus between the sovereign and the
banking sectors and in order to show that it might be useful to use two different measures of
sovereign risk to analyze this tie the following two pieces of evidence are provided.
The first one provided by Acharya, Drechsler and Schnabl (2014) is the path of
sovereign and bank CDS for Ireland in the period from the beginning of 2007 to mid-2010.
Before the financial crisis of 2007-2008 no evidence of sovereign default risk could be found
in the Euro area. As a matter of fact, only since the end of 2007 sovereign distress started to
appear and to increase significantly in the majority of the European countries. Picture 4.1
provides an evidence of this since it shows that the spread of the Irish sovereign CDS kept on
being pretty low till mid-2008. In this period no evidence of an increase in sovereign risk can
be found. Over the same period of time spreads on bank CDS increased remarkably showing
23
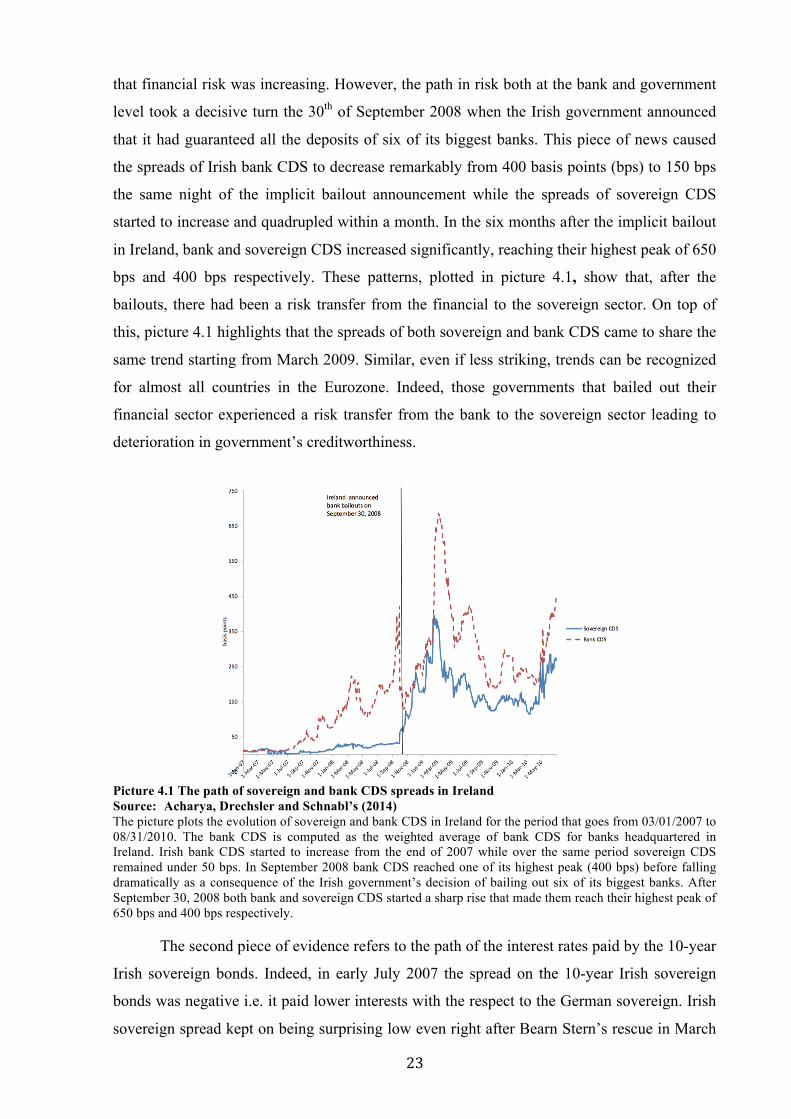
that financial risk was increasing. However, the path in risk both at the bank and government
level took a decisive turn the 30th of September 2008 when the Irish government announced
that it had guaranteed all the deposits of six of its biggest banks. This piece of news caused
the spreads of Irish bank CDS to decrease remarkably from 400 basis points (bps) to 150 bps
the same night of the implicit bailout announcement while the spreads of sovereign CDS
started to increase and quadrupled within a month. In the six months after the implicit bailout
in Ireland, bank and sovereign CDS increased significantly, reaching their highest peak of 650
bps and 400 bps respectively. These patterns, plotted in picture 4.1, show that, after the
bailouts, there had been a risk transfer from the financial to the sovereign sector. On top of
this, picture 4.1 highlights that the spreads of both sovereign and bank CDS came to share the
same trend starting from March 2009. Similar, even if less striking, trends can be recognized
for almost all countries in the Eurozone. Indeed, those governments that bailed out their
financial sector experienced a risk transfer from the bank to the sovereign sector leading to
deterioration in government’s creditworthiness.
Picture 4.1 The path of sovereign and bank CDS spreads in Ireland Source: Acharya, Drechsler and Schnabl’s (2014) The picture plots the evolution of sovereign and bank CDS in Ireland for the period that goes from 03/01/2007 to 08/31/2010. The bank CDS is computed as the weighted average of bank CDS for banks headquartered in Ireland. Irish bank CDS started to increase from the end of 2007 while over the same period sovereign CDS remained under 50 bps. In September 2008 bank CDS reached one of its highest peak (400 bps) before falling dramatically as a consequence of the Irish government’s decision of bailing out six of its biggest banks. After September 30, 2008 both bank and sovereign CDS started a sharp rise that made them reach their highest peak of 650 bps and 400 bps respectively.
The second piece of evidence refers to the path of the interest rates paid by the 10-year
Irish sovereign bonds. Indeed, in early July 2007 the spread on the 10-year Irish sovereign
bonds was negative i.e. it paid lower interests with the respect to the German sovereign. Irish
sovereign spread kept on being surprising low even right after Bearn Stern’s rescue in March
24
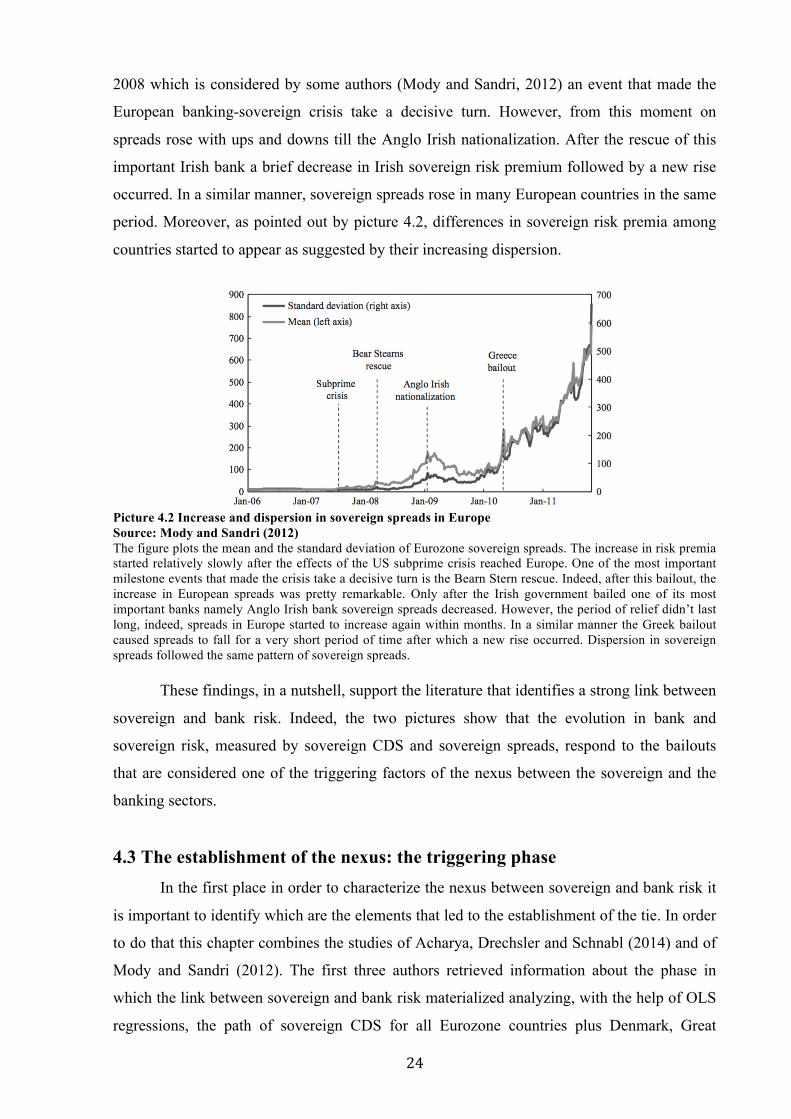
2008 which is considered by some authors (Mody and Sandri, 2012) an event that made the
European banking-sovereign crisis take a decisive turn. However, from this moment on
spreads rose with ups and downs till the Anglo Irish nationalization. After the rescue of this
important Irish bank a brief decrease in Irish sovereign risk premium followed by a new rise
occurred. In a similar manner, sovereign spreads rose in many European countries in the same
period. Moreover, as pointed out by picture 4.2, differences in sovereign risk premia among
countries started to appear as suggested by their increasing dispersion.
Picture 4.2 Increase and dispersion in sovereign spreads in Europe Source: Mody and Sandri (2012) The figure plots the mean and the standard deviation of Eurozone sovereign spreads. The increase in risk premia started relatively slowly after the effects of the US subprime crisis reached Europe. One of the most important milestone events that made the crisis take a decisive turn is the Bearn Stern rescue. Indeed, after this bailout, the increase in European spreads was pretty remarkable. Only after the Irish government bailed one of its most important banks namely Anglo Irish bank sovereign spreads decreased. However, the period of relief didn’t last long, indeed, spreads in Europe started to increase again within months. In a similar manner the Greek bailout caused spreads to fall for a very short period of time after which a new rise occurred. Dispersion in sovereign spreads followed the same pattern of sovereign spreads.
These findings, in a nutshell, support the literature that identifies a strong link between
sovereign and bank risk. Indeed, the two pictures show that the evolution in bank and
sovereign risk, measured by sovereign CDS and sovereign spreads, respond to the bailouts
that are considered one of the triggering factors of the nexus between the sovereign and the
banking sectors.
4.3 The establishment of the nexus: the triggering phase In the first place in order to characterize the nexus between sovereign and bank risk it
is important to identify which are the elements that led to the establishment of the tie. In order
to do that this chapter combines the studies of Acharya, Drechsler and Schnabl (2014) and of
Mody and Sandri (2012). The first three authors retrieved information about the phase in
which the link between sovereign and bank risk materialized analyzing, with the help of OLS
regressions, the path of sovereign CDS for all Eurozone countries plus Denmark, Great
25
Britain, Norway, Sweden, and Switzerland in the period in which many bailouts took place in
Europe (this period goes from September 26, 2008 to October 21, 2008). On the other hand,
Mody and Sandri (2012) tried to shed light on the nexus analyzing, with the help of panel
regression analyses, the path of sovereign spreads for some countries in the Euro area namely
Austria, Belgium, Netherlands, Finland, France, Greece, Ireland, Italy, Portugal and Spain in
the period that ranges from January 2006 to November 2011.
According to the results of the two studies the first factor that triggered the rise in
sovereign risk and contributed to the establishment of the nexus is distress at the bank level.
Indeed, as discovered by Acharya, Drechsler and Schnabl (2014), after many European
countries got involved in rescue operations of their financial sector in the period that goes
from September 26, 2008 to October 21, 2008, the correlation between changes in sovereign
CDS and bank CDS was positive. Therefore, the rise in sovereign risk can be explained by the
rise in distress at the bank level. Mody and Sandri’s (2012) studies support this idea since
they also find that the increase in sovereign spreads in an early phase of the financial crisis
can be attributed to financial distress. These two authors, however, took a step further with the
respect to Acharya, Drechsler and Schnabl (2014), indeed, they showed that in the period that
goes from mid July 2007 to Bearn Stern rescue what mattered for the rise in sovereign risk
was global financial distress while for the period that goes from the rescue of the American
financial institution to the nationalization of one of the most important banks in Ireland in
2009 namely Anglo Irish bank the main driver of sovereign risk was the health of the
domestic banking sector.
The second element that is responsible for the increase in sovereign risk is the level of
debt-to-GDP prior to the broke out of the financial crisis. In particular, the results of Acharya,
Drechsler and Schnabl’s (2014) empirical analyses show that, after the rescue operations took
place in Europe, the higher the stock of debt of a country the stronger the increase in the
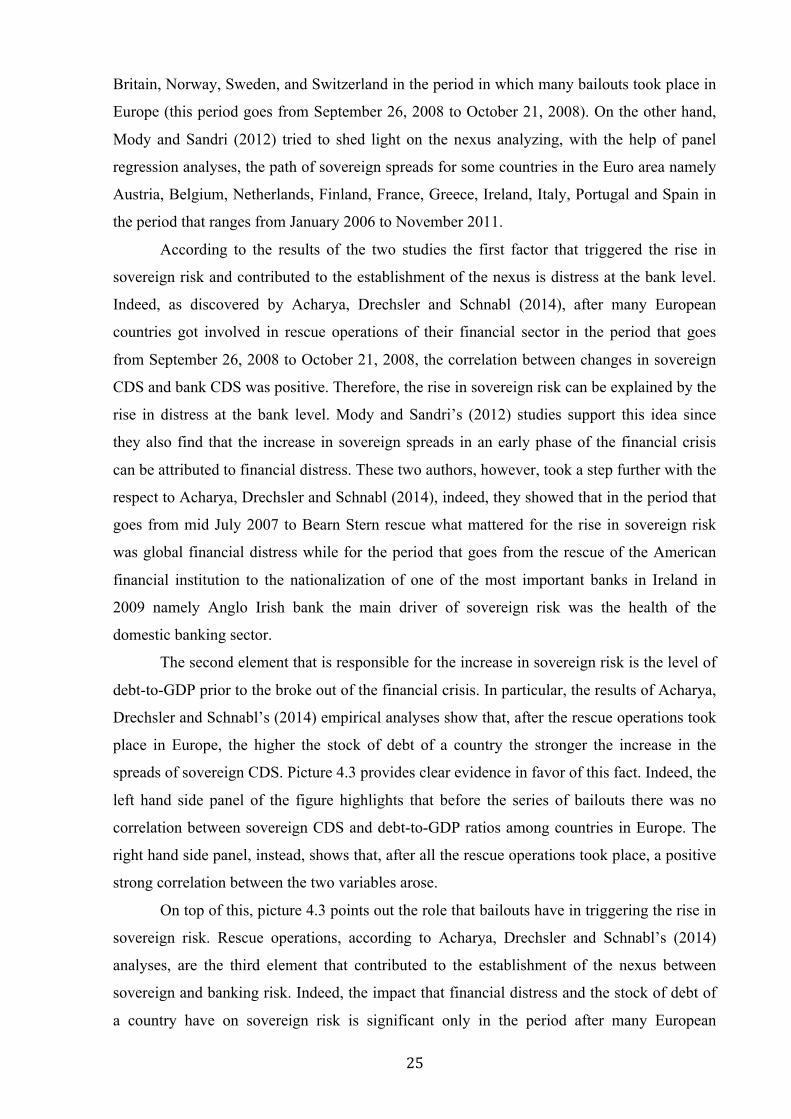
spreads of sovereign CDS. Picture 4.3 provides clear evidence in favor of this fact. Indeed, the
left hand side panel of the figure highlights that before the series of bailouts there was no
correlation between sovereign CDS and debt-to-GDP ratios among countries in Europe. The
right hand side panel, instead, shows that, after all the rescue operations took place, a positive
strong correlation between the two variables arose.
On top of this, picture 4.3 points out the role that bailouts have in triggering the rise in
sovereign risk. Rescue operations, according to Acharya, Drechsler and Schnabl’s (2014)
analyses, are the third element that contributed to the establishment of the nexus between
sovereign and banking risk. Indeed, the impact that financial distress and the stock of debt of
a country have on sovereign risk is significant only in the period after many European
26
countries provided financial support to their financial institutions. Mody and Sandri (2012)
analyses also provide evidence of the relevance of the rescue operations for the establishment
of the nexus. Indeed, they recognized that one significant change in the interaction between
sovereign spreads and financial risk happened only after the Anglo Irish nationalization. The
fact that the correlation between sovereign and bank risk changes after rescue operations can
be explained by looking at the reason why these operations are undertaken. Indeed, bailouts
are the tool that may allow governments to transfer distress from the financial to the sovereign
sector. Therefore, it makes perfect sense that the financial conditions of the public sector and
the level of public debt in particular, come to matter for the establishment of the nexus only
after the government opens up to bank risk.
Picture 4.3 Correlation between sovereign CDS and public debt-to-GDP ratios before and after bailouts Source: Acharya, Drechsler and Schnabl (2014) The picture plots the correlation between sovereign CDS spreads (in basis points) and the level of public debt (expressed as a percentage of GDP) for western countries in Europe. The left hand side panel shows that before bailouts no correlation between the two variables of interest can be found. On the other hand, as pointed out by the right hand side panel, a positive relationship between sovereign CDS and Debt-to-GDP ratios arises after the rescue operations took place. The picture provides a piece of evidence in favor of the hypothesis according to which bailouts are responsible for the rise in sovereign risk during the recent crisis. Also, the figure supports the idea that debt-to-GDP ratios are an important factor to take into account while trying to investigate the elements that make risk shift from the financial to the sovereign sector.
One last final result obtained by Acharya, Drechsler and Schnabl (2014) concerns the
fact that the risk shift from the banking to the sovereign sector, in the triggering phase,
occurred throughout two specific channels namely the increase in the debt-to-GDP ratio after
the bailouts and the costs of recapitalization of financial institutions governments had to bear
to rescue their financial sector. Concerning the first variable, the empirical analyses carried
out by the authors show that the correlation between bank CDS and the change in the level of
countries’ public debt in the period between June 2008 and June 2010 is positive after the
rescue operation took place. In a similar manner, also bailouts costs, that proved to be very
27
high, and the level of financial risk happened to be positively correlated only in the period
after the series of bailouts.
4.4 The main features of the nexus
Once the nexus has been established it is important to highlight which are its main
characteristics. In order to address this point some evidence of Acharya, Drechsler and
Schnabl’s (2014) studies are reported. Particularly, the authors pointed out how the tie
between the banking to the sovereign sectors developed over time simply comparing changes
in bank and sovereign CDS for several countries in the Euro area during three different
periods namely pre-bailout period, bailout period and post-bailout period.
The first one goes from January 1, 2007 to September 25, 2008. The peculiar element
of this period is that it captures the gradual but constant increase in financial risk as well as
the sharp rise in distress at the bank level that occurred after Lehman Brothers’ bankruptcy.
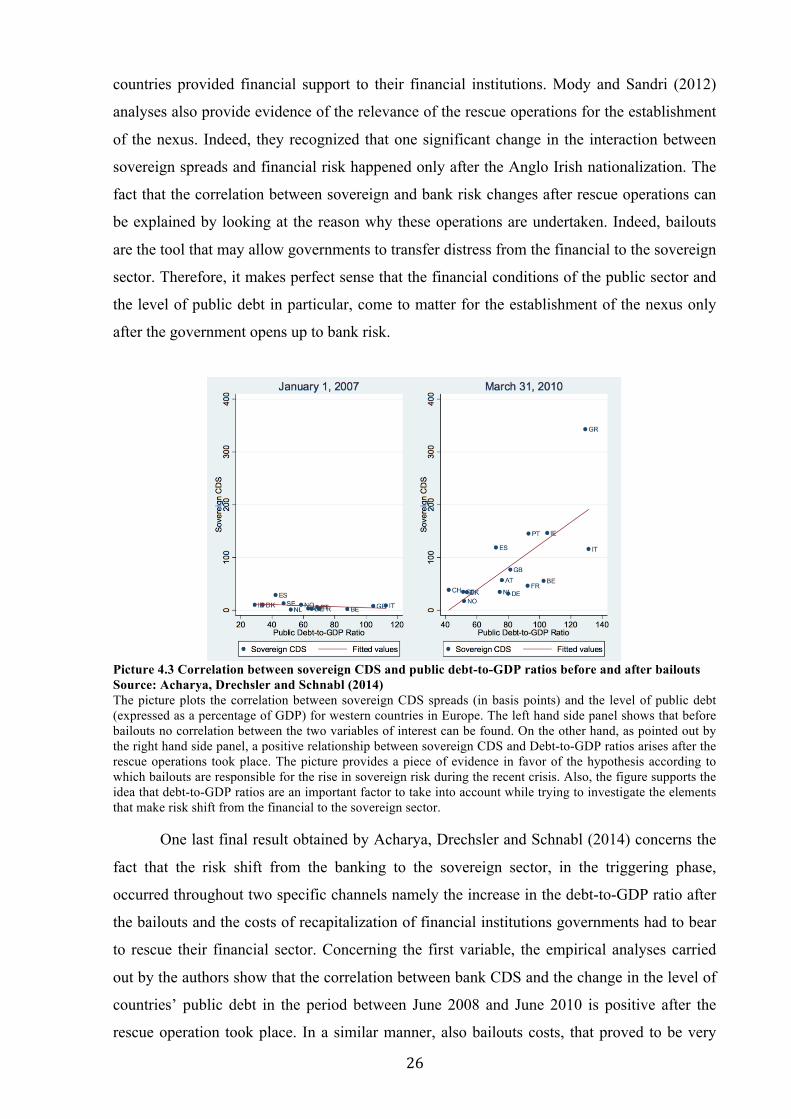
Picture 4.4 shows changes in sovereign and bank CDS for Eurozone countries plus Denmark,
Great Britain, Norway, Sweden and Switzerland in the pre-bailout period.
Picture 4.4 Change in bank and sovereign CDS in the pre-bailout period Source: Acharya, Drechsler and Schnabl (2014) The picture plots the change in average bank CDS and sovereign CDS for Eurozone countries plus Denmark, Great Britain, Norway, Sweden, and Switzerland in the period from 1/1/2007 to 9/25/2008. The bank CDS for each country is computed as the weighted average of bank CDS for banks headquartered in that country. The picture highlights that in the period before the rescue operations took place the change in sovereign CDS was close to zero while the change in bank CDS was considerably high. Ireland is definitely the most striking case since the average bank CDS increased by 471 basis points while almost no change in sovereign CDS can be found. Similar qualitative results can be found also for all other countries. Overall this figure suggests that before the Irish bailout sovereign risk was under control while financial distress was increasing.
A country’s bank CDS is defined as the weighted average of all banks’ CDS within the
country, with weights determined by banks’ assets as of January 2007. As highlighted by the
28
picture, in the pre-bailout period the increase in bank CDS for each country was pretty
remarkable while there was almost no significant change in sovereign CDS. Ireland is
definitely the most striking case since the average bank CDS increased by 471 basis points
while only a relatively small change in sovereign CDS can be found. Similar qualitative
results can be recognized also for all other countries. Overall these findings suggest that
before the Irish bailout sovereign risk was under control.
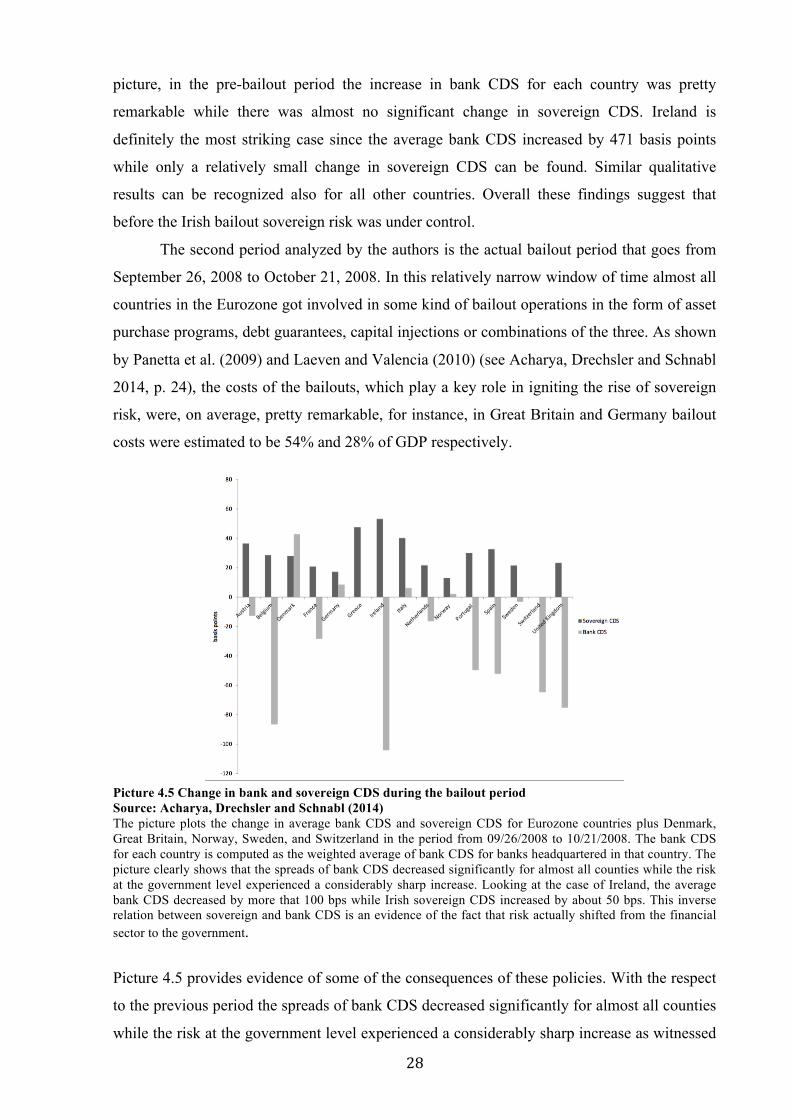
The second period analyzed by the authors is the actual bailout period that goes from
September 26, 2008 to October 21, 2008. In this relatively narrow window of time almost all
countries in the Eurozone got involved in some kind of bailout operations in the form of asset
purchase programs, debt guarantees, capital injections or combinations of the three. As shown
by Panetta et al. (2009) and Laeven and Valencia (2010) (see Acharya, Drechsler and Schnabl
2014, p. 24), the costs of the bailouts, which play a key role in igniting the rise of sovereign
risk, were, on average, pretty remarkable, for instance, in Great Britain and Germany bailout
costs were estimated to be 54% and 28% of GDP respectively.
Picture 4.5 Change in bank and sovereign CDS during the bailout period Source: Acharya, Drechsler and Schnabl (2014) The picture plots the change in average bank CDS and sovereign CDS for Eurozone countries plus Denmark, Great Britain, Norway, Sweden, and Switzerland in the period from 09/26/2008 to 10/21/2008. The bank CDS for each country is computed as the weighted average of bank CDS for banks headquartered in that country. The picture clearly shows that the spreads of bank CDS decreased significantly for almost all counties while the risk at the government level experienced a considerably sharp increase. Looking at the case of Ireland, the average bank CDS decreased by more that 100 bps while Irish sovereign CDS increased by about 50 bps. This inverse relation between sovereign and bank CDS is an evidence of the fact that risk actually shifted from the financial sector to the government.
Picture 4.5 provides evidence of some of the consequences of these policies. With the respect
to the previous period the spreads of bank CDS decreased significantly for almost all counties
while the risk at the government level experienced a considerably sharp increase as witnessed

29
by the positive change in sovereign CDS. Taking a look at the most striking case, which is,
again, represented by Ireland, the average bank CDS decreased by more than 100 bps while
Irish sovereign CDS increased by about 50 bps. This inverse relation between sovereign and
bank CDS is an evidence of the fact that during this period risk actually shifted from the
financial to the public sector.
In the last period, namely the post-bailout period, that goes from October 22, 2008 to
June 30, 2010 the patterns in the changes of sovereign and bank CDS is very different from
the previous phase, indeed, as shown in picture 4.6, both spreads increased significantly in all
countries of the Euro area.
Picture 4.6 Change in bank and sovereign CDS in the post-bailout period Source: Acharya, Drechsler and Schnabl (2014) The picture plots the change in average bank CDS and sovereign CDS for Eurozone countries plus Denmark, Great Britain, Norway, Sweden, and Switzerland in the period from 10/22/2008 to 06/30/2010. The bank CDS for each country is computed as the weighted average of bank CDS for banks headquartered in that country. The picture clearly shows that in post-bailout period a positive correlation between sovereign and bank CDS arose, indeed, a remarkable positive change in both bank and sovereign CDS occurred. This picture highlights that rescue operations didn’t make risk vanish, instead, they made the nexus between sovereign and bank sector materialize.
Taken together these pictures provide evidence in favor of one important characteristic
of the nexus namely the fact that it unfolded into different phases. Particularly, the evolution
over time of the correlation between sovereign and bank CDS shows that before bailouts
sovereign risk was to some extent unaffected by the rise in financial distress. The interaction
between the two types of risk appeared after the rescue operations took place. In particular, it
is important to point out that bailouts actually allowed the government sector to absorb part of
the distress of the financial sector in the first place. The period of relief generated by the risk
transfer, however, didn’t last long since the correlation between sovereign and bank risk
30
became positive. This can be considered the final and most dangerous stage of the nexus
where weaknesses in one sector make distress in the other sector increase and vice versa.
These results are supported also by the analyses of Mody and Sandri (2012), indeed,
also these two authors found out that the nexus developed over time. Particularly, they
identified that the nexus evolved throughout four different phases. The first one is the phase
prior to the financial crisis. In this period the correlation between sovereign spreads and
financial risk was not relevant. The second phase goes from the outbreak of the financial
crisis in late 2007 to the rescue of Bearn Stern. In this phase sovereign spreads responded
mainly to changes in global financial risk. On the other hand, in the third period that goes
from the Bearn Stern rescue to the Anglo Irish nationalization sovereign risk is mainly
affected by the risk in the domestic financial sector. Finally, after the Anglo Irish
nationalization an increase in the risk in the domestic financial sector makes sovereign
spreads (and therefore sovereign risk) increase and vice versa.
One possible interpretation of the reason why the nexus developed throughout these
four phases can be found into investors’ learning process about the way the crisis unfolded.
Particularly, right after financial distress hit Europe investors were still learning about the
magnitude of the effects of the crisis. This brought only to a moderate re-pricing of sovereign
debt and eventually to a slow rise in sovereign spreads driven by the increase in worldwide
financial risk. On the other hand, after Bearn Stern rescue investors’ way of assessing risk
changed. Particularly, economic agents slowly realized that the financial distress that resulted
from the American financial crisis had caused financial weaknesses in the domestic banking
sector to arise. In the end these vulnerabilities couldn’t help but affect more severely the
riskiness of the sovereign sector. Finally, after the Anglo Irish nationalization the learning
process came to an end. In this phase there was no doubt about the effect of an increase in
financial distress on sovereign risk and it became clear that weaknesses in the financial sector
were doomed to affect the sovereign sector and vice versa.
The second characteristic of the nexus is that it is a two way feedback i.e. an increase
in bank risk triggers an increase in sovereign risk and vice versa. This characteristic of the
nexus is pointed out by the studies carried out by Acharya, Drechsler and Schnabl (2014) as
well as by the studies developed by Mody and Sandri (2012). This feature of the nexus is
crucial because it means that negative synergies between the two sectors can arise and
reinforce.
The third feature of the nexus refers to the fact that the impact of an increase in
financial risk on sovereign risk was not homogeneous among countries in the Eurozone.
Particularly, Mody and Sandri (2012) identified two variables that are useful to differentiate
31
the rise in sovereign risk and the strength of the nexus namely loss in competitiveness
experienced during the crisis and the role of public debt. Concerning the first variable,
authors’ analyses showed that the higher the loss in competitiveness experienced by a country
the stronger the impact of an increase in financial risk on sovereign spreads. However, the
role of the loss in competitiveness in differentiating the increase in sovereign risk due to an
increase in bank risk appeared to be significant only after the Bearn Stern rescue i.e. after the
nexus between the sovereign and the banking sector appeared. Concerning the second
variable, the authors investigated whether the level of public debt influences the rise in
sovereign spreads for countries that have experienced similar losses in competitiveness after
the crisis broke out.
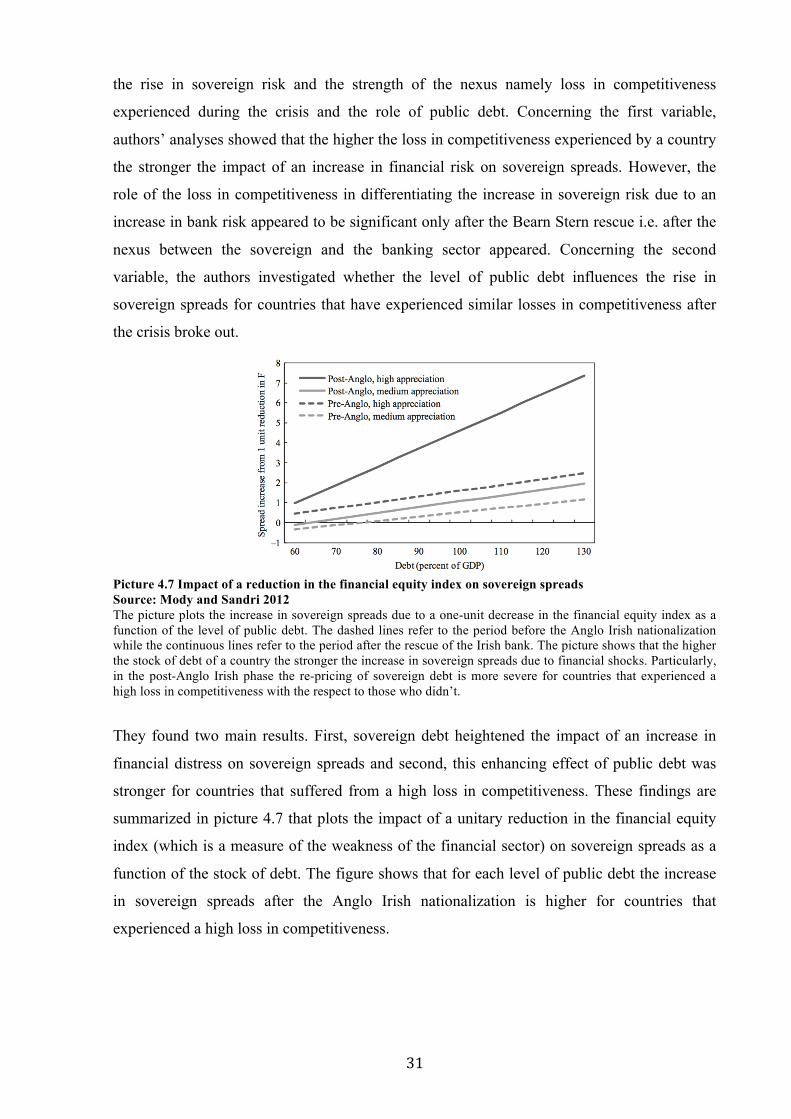
Picture 4.7 Impact of a reduction in the financial equity index on sovereign spreads Source: Mody and Sandri 2012 The picture plots the increase in sovereign spreads due to a one-unit decrease in the financial equity index as a function of the level of public debt. The dashed lines refer to the period before the Anglo Irish nationalization while the continuous lines refer to the period after the rescue of the Irish bank. The picture shows that the higher the stock of debt of a country the stronger the increase in sovereign spreads due to financial shocks. Particularly, in the post-Anglo Irish phase the re-pricing of sovereign debt is more severe for countries that experienced a high loss in competitiveness with the respect to those who didn’t.
They found two main results. First, sovereign debt heightened the impact of an increase in
financial distress on sovereign spreads and second, this enhancing effect of public debt was
stronger for countries that suffered from a high loss in competitiveness. These findings are
summarized in picture 4.7 that plots the impact of a unitary reduction in the financial equity
index (which is a measure of the weakness of the financial sector) on sovereign spreads as a
function of the stock of debt. The figure shows that for each level of public debt the increase
in sovereign spreads after the Anglo Irish nationalization is higher for countries that
experienced a high loss in competitiveness.

32
4.5 Some factors that affect the nexus Finally, to complete the picture of the nexus it can be useful to point out some other factors
identified by Acharya, Drechsler and Schnabl (2014) that influence the nexus between
sovereign and bank risk.
The first element is the role played by the government guarantees. Indeed, the authors
found out a negative correlation between the rating of a country and its rating uplift and
between the rating uplift and sovereign CDS. These results show that an increase in sovereign
risk (which is reflected in a lower credit rating or in higher values of the sovereign CDS)
affect financial risk throughout a decrease in the value of the guarantees the government can
offer.
The second factor that influences the nexus is the size of the financial sector. Indeed,
the authors showed that the larger the size of the banking sector the smaller the impact of
sovereign risk on financial distress. The explanation of this result is straightforward; if the
financial sector is much larger than the sovereign then the latter may not be able to rescue the
former in case it is close to the failure. In other words the fact that the financial sector is too-
big-to-be-saved may impair government ability to provide it with the financial means it needs
in case of high distress. This can’t help but affect the nexus between the two sectors.
The third element that affects the tie between the sovereign and the banking sectors is
related to the fact that a country belongs to the Eurozone or not. Authors found out that the
nexus between the two sectors is tighter for counties that belong to the Euro area, in
particular, the analysis shows that belonging to the Eurozone enhances the risk transmission.
On the basis of this result it is possible to argue that the two-way feedback loop is a
phenomenon influenced by the fact that all the countries belong to the currency union.
The fourth variable that influences the risk transmission is sovereign credit rating.
Authors’ analyses prove that the downgrading of a country enhances the impact of an increase
in sovereign risk on financial risk, however, this happens only after the bailout operations
took place. In a nutshell, the fact that the rating of a country contributes to tighten the nexus
may be considered a piece of evidence in favor of the rating channel as a way through which
sovereign risk flows back into the financial sector.
Finally, the last element that may affect the nexus is the health of the fiscal conditions
of a country. Indeed, both the studies carried out by Acharya, Drechsler and Schnabl (2014)
and Mody and Sandri (2012) showed that a bailout can have dangerous consequences if
countries’ fundamentals are not sound. Indeed, the pieces of evidence in favor of the rise of
vicious loops between sovereign and bank risk allow to stress the effects that bailouts can
have on the tie that links the two sectors. Indeed, in general the ex-ante effect of a bailout is

33
not unequivocally determined a priori. For instance, Diamond and Dybvig (1983) showed
that the effect can be nil, if the bailout prevents bank runs and a risk transfer doesn’t occur.
On the other hand, Leonello (2013) pointed out that the result can be positive, in particular, a
rescue operation can reduce both bank and sovereign risk, if the value in macroeconomic
variables like the level of government debt is sound enough to make the rescue operation
credible. Finally, Acharya, Drechsler and Schnabl’s (2014) and Mody and Sandri’s (2012)
results prove that bailouts can have negative consequences if the risk transfer undermines the
solvency of the sovereign sector.
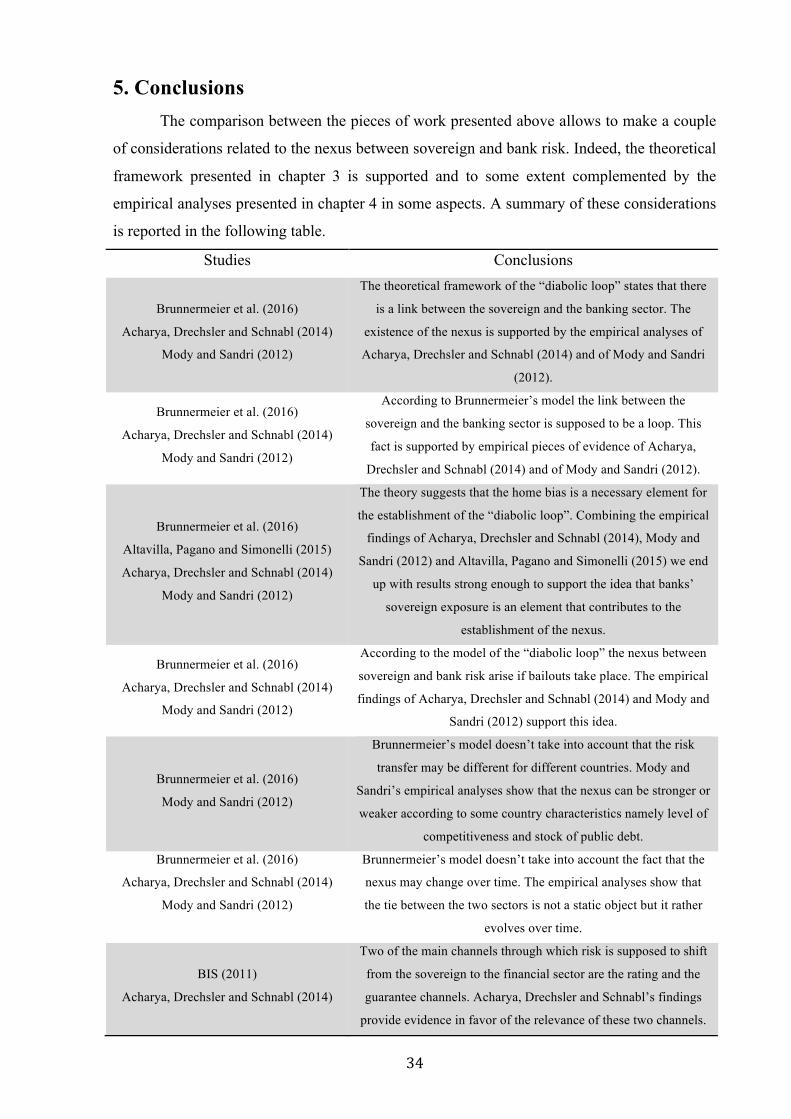
34
5. Conclusions The comparison between the pieces of work presented above allows to make a couple
of considerations related to the nexus between sovereign and bank risk. Indeed, the theoretical
framework presented in chapter 3 is supported and to some extent complemented by the
empirical analyses presented in chapter 4 in some aspects. A summary of these considerations
is reported in the following table.
Studies Conclusions
Brunnermeier et al. (2016)
Acharya, Drechsler and Schnabl (2014)
Mody and Sandri (2012)
The theoretical framework of the “diabolic loop” states that there
is a link between the sovereign and the banking sector. The
existence of the nexus is supported by the empirical analyses of
Acharya, Drechsler and Schnabl (2014) and of Mody and Sandri
(2012).
Brunnermeier et al. (2016)
Acharya, Drechsler and Schnabl (2014)
Mody and Sandri (2012)
According to Brunnermeier’s model the link between the
sovereign and the banking sector is supposed to be a loop. This
fact is supported by empirical pieces of evidence of Acharya,
Drechsler and Schnabl (2014) and of Mody and Sandri (2012).
Brunnermeier et al. (2016)
Altavilla, Pagano and Simonelli (2015)
Acharya, Drechsler and Schnabl (2014)
Mody and Sandri (2012)
The theory suggests that the home bias is a necessary element for
the establishment of the “diabolic loop”. Combining the empirical
findings of Acharya, Drechsler and Schnabl (2014), Mody and
Sandri (2012) and Altavilla, Pagano and Simonelli (2015) we end
up with results strong enough to support the idea that banks’
sovereign exposure is an element that contributes to the
establishment of the nexus.
Brunnermeier et al. (2016)
Acharya, Drechsler and Schnabl (2014)
Mody and Sandri (2012)
According to the model of the “diabolic loop” the nexus between
sovereign and bank risk arise if bailouts take place. The empirical
findings of Acharya, Drechsler and Schnabl (2014) and Mody and
Sandri (2012) support this idea.
Brunnermeier et al. (2016)
Mody and Sandri (2012)
Brunnermeier’s model doesn’t take into account that the risk
transfer may be different for different countries. Mody and
Sandri’s empirical analyses show that the nexus can be stronger or
weaker according to some country characteristics namely level of
competitiveness and stock of public debt.
Brunnermeier et al. (2016)
Acharya, Drechsler and Schnabl (2014)
Mody and Sandri (2012)
Brunnermeier’s model doesn’t take into account the fact that the
nexus may change over time. The empirical analyses show that
the tie between the two sectors is not a static object but it rather
evolves over time.
BIS (2011)
Acharya, Drechsler and Schnabl (2014)
Two of the main channels through which risk is supposed to shift
from the sovereign to the financial sector are the rating and the
guarantee channels. Acharya, Drechsler and Schnabl’s findings
provide evidence in favor of the relevance of these two channels.
35
First of all, the empirical analyses confirm the existence of a nexus between sovereign
and bank risk. Both Acharya, Drechsler and Schnabl’s (2014) and Mody and Sandri’s (2012)
studies provide clear evidence of the fact that there is a strong correlation between the risk at
the banking level and at the government level.
The second important aspect to highlight is the fact that the empirical analyses
reported support the theory according to which the tie that links sovereign and bank risk is a
two-way feedback loop. Indeed, both Acharya, Drechsler and Schnabl (2014) and Mody and
Sandri (2012) provide evidence of the fact that risk moves from the banking to the sovereign
sector and vice versa.
Third, Altavilla, Pagano and Simonelli (2015) showed that there is evidence in favor
of one of the necessary elements, identified by Brunnermeier et al. (2016), for the “diabolic
loop” to arise namely home bias. In particular, the period in which the average banks’
sovereign exposure increased coincides to some extent with the period in which Acharya,
Drechsler and Schnabl (2014) and Mody and Sandri (2012) documented the risk transmission
from one sector to the other. This is strongly supportive of the fact that the home bias is
actually one of the elements that contributes to the rise of the nexus between sovereign and
bank risk.
Fourth, one of the features of the model of the “diabolic loop” developed by
Brunnermeier et al. (2016) is the fact that the nexus between the sovereign and the banking
sector is supposed to arise only if bailouts took place. The empirical analyses of Acharya,
Drechsler and Schnabl (2014) and of Mody and Sandri (2012) both support this element of
the theoretical model since they found significant changes in the pattern of the correlation of
sovereign and bank risk only after rescue operations took place.
Fifth, the empirical analyses of Mody and Sandri (2012) complement the theoretical
framework since they discovered one element that it is not taken into consideration by the
model of Brunnermeier et al. (2016) namely the differences in the rise in sovereign risk due to
an increase in financial distress between countries.
Sixth, the empirical analyses of both Acharya, Drechsler and Schnabl (2014) and
Mody and Sandri (2012) showed that the nexus between the sovereign and the banking sector
is a “dynamic entity” i.e. it is not static but it rather evolves over time. In this sense these
pieces of evidence complement Brunnermeier et al.’s (2016) model that doesn’t take into
account the role that time may have in the transfer of risk from one sector to the other.
Seventh, Acharya, Drechsler and Schnabl (2014) identified that country rating affects
the riskiness of the financial sector. On top of this, they also found that sovereign risk affects
bank risk throughout a reduction in the value of the guarantees the government can offer.

36
These empirical findings support the theory that recognized in the guarantee and in the rating
channels two ways through which risk shifts from the sovereign to the banking sector.
Overall the analyses report how dangerous and disruptive the consequences of the
nexus between sovereign and bank risk can be. Hence, these results suggest that self-
reinforcing imbalances like the ones described above mustn’t be underestimated but rather,
they should be prevented form happening.

37
6. Bibliography
- ACHARYA, V., DRECHSLER, I., SCHNABL, F., 2014. A Pyrrhic Victory? Bank Bailouts and Sovereign Credit Risk. The Journal of Finance 69 (6), 2689–2739.
- ACHARYA, V., STEFFEN, S., 2015. The “greatest” carry trade ever? Understanding eurozone bank risks. Journal of Financial Economics 115 (2), 215–236. - ALTAVILLA, C., PAGANO, M., SIMONELLI, S., 2015. Bank Exposures and Sovereign Stress Transmission [online]. Italy: Centre for Studies in Economics and Finance (CSEF) Working Papers 410. Available at < www.ideas.repec.org > [access date: 01/06/2016]. - BANK FOR INTERNATIONAL SETTLEMENTS, 2011. The impact of sovereign credit risk on bank funding conditions [online]. Available at < https://ideas.repec.org > [access date 01/05/20126].
- BOLTON, P., JEANNE, O., 2011. Sovereign default risk and bank fragility in financially integrated economies. Available at < www.springer.com > [access date 01/06/20126].
- BRUNNERMEIER, M. K., GARICANO, L., LANE, P. R., PAGANO M., REIS, R., SANTOS T., THESMAR D., STIJN VAN NIEUWERBURGH, S. V., VAYANOS, D., 2016. The Sovereign-Bank Diabolic Loop and ESBies. American Economic Review, 106 (5), 508-512. - DIAMOND, D. W., & DYBVIG, P. H., 1983. Bank runs, deposit insurance, and liquidity. Journal of Political Economy 91 (3), pp. 401-419. In: FRATZSCHER, M., RIETH, M., 2015. Monetary Policy, Bank Bailouts and the Sovereign-bank Risk Nexus in the Euro Area [online]. Berlin: The German Institute for Economic Research (DIW Berlin). Available at < https://www.diw.de/en > [access date: 01/06/2016].
- ECB, 2014. Monthly Bulletin [online]. Available at < www.ecb.europa.eu > [access date: 03/05/2016].
- HIGGINS, M., KLITGAARD, T., 2011. Saving Imbalances and the Euro Area Sovereign Debt Crisis [online]. Available at < www.newyorkfed.org > [access date 10/06/2016].
- HORVITZ, P., WARD R., 1987. Monetary Policy and the Financial System. Prentice Hall: Englewoods Cliffs, NJ. In: ONGENA, S., POPOV, ALEXANDER A. VAN HOREN, N., 2016. The Invisible Hand of the Government: “Moral Suasion” During the European Sovereign Debt Crisis. De Nederlandsche Bank Working Paper No. 505. Available at < http://ssrn.com/abstract=2745767> [access date 10/06/2016].
- LAEVEN, L., VALENCIA, F., 2010. Resolution of Banking Crises: The Good, the Bad, and the Ugly [online]. Available at <http://ssrn.com/abstract=1632145> [access date: 01/05/2016]. In: ACHARYA, V., DRECHSLER, I., SCHNABL, F., 2014. A Pyrrhic Victory? Bank Bailouts and Sovereign Credit Risk. The Journal of Finance 69 (6), 2689–2739.
- LANE, P. R., 2012. The European sovereign debt crisis. Journal of Economic perpspectives, 26 (3), 49-68.
38
- LEONELLO, A., 2013. Government Guarantees and the Two-Way Feedback between Banking and Sovereign Debt Crises. In: FRATZSCHER, M., RIETH, M., 2015. Monetary Policy, Bank Bailouts and the Sovereign-bank Risk Nexus in the Euro Area [online]. Berlin: The German Institute for Economic Research (DIW Berlin). Available at < https://www.diw.de/en > [access date: 01/06/2016].
- MILESI-FERRETTI, G. M., TILLE, C,. 2011. The Great Retrenchment: International Capital Flows during the Global Financial Crisis. Economic Policy 26 (66), 285–342. In: LANE, P. R., 2012. The European sovereign debt crisis. Journal of Economic perpspectives, 26 (3), 49-68.
- MODY, A., SANDRI, D., 2012. The Eurozone Crisis: How Banks and Sovereigns Came to be Joined at the Hip. Economic Policy 27 (70), 199–230.
- ONGENA, S., POPOV, ALEXANDER A. VAN HOREN, N., 2016. The Invisible Hand of the Government: “Moral Suasion” During the European Sovereign Debt Crisis. Available at < http://ssrn.com/abstract=2745767 > [access date 10/06/2016].
- PANETTA, F., FAEH, T., GRANDE, G., HO, C., KING, M., LEVY, A, SIGNORETTI, F., TABOGA, M., ZAGHINI, A., 2009. An assessment of financial sector rescue programmes [online]. Available at < www.bis.org > [access date 10/06/2016]. In: ACHARYA, V., DRECHSLER, I., SCHNABL, F., 2014. A Pyrrhic Victory? Bank Bailouts and Sovereign Credit Risk. The Journal of Finance 69 (6), 2689–2739.
- www.ec.europa.eu [access date: 03/05/2016]
Words: 10 538