TESI DI DOTTORATO - core.ac.uk · I software utilizzati per il post processing garantiscono...
143
TESI DI DOTTORATO XXIX CICLO SISTEMI A MICROONDE DEDICATI AD APPLICAZIONI DEL GROUND PENETRATING RADAR E ALLA SPETTROSCOPIA DIELETTRICA DOTTORATO IN MODELLI MATEMATICI PER L’INGEGNERIA ELETTROMAGNETISMO E NANOSCIENZE DIPARTIMENTO DI INGEGNERIA DELL’INFORMAZIONE ELETTRONICA E TELECOMUNICAZIONI (DIET) Dottorando Santo Prontera Relatore Prof. Fabrizio Frezza
Transcript of TESI DI DOTTORATO - core.ac.uk · I software utilizzati per il post processing garantiscono...
TESI DI DOTTORATO XXIX CICLO
SISTEMI A MICROONDE DEDICATI AD APPLICAZIONI DEL GROUND PENETRATING RADAR E ALLA SPETTROSCOPIA DIELETTRICA
DOTTORATO IN MODELLI MATEMATICI PER L’INGEGNERIA
ELETTROMAGNETISMO E NANOSCIENZE
DIPARTIMENTO DI INGEGNERIA DELL’INFORMAZIONE
ELETTRONICA E TELECOMUNICAZIONI (DIET)
Dottorando
Santo Prontera
Relatore Prof. Fabrizio Frezza
2
Introduzione
Parte I
La presente tesi di dottorato espone il lavoro svolto durante i previsti tre anni
del corso di Dottorato di Ricerca, del XXIX ciclo in Modelli Matematici,
Elettromagnetismo e Nanoscienze.
Introduzione sul GPR L’interesse della presente tesi di dottorato si evidenzia su due argomenti, il
primo riguarda lo studio e la caratterizzazione di uno specifico radar, il GPR
(Ground Penetrating Radar) dispositivo di indagine non invasiva impiegato
primariamente per lo studio dell’adiacente sottosuolo o anche di strutture
visivamente non accessibili. Il termine radar deriva dalla denominazione
inglese “radio detection and ranging” impiegata universalmente per indicare
apparecchiature le quali effettuano, a mezzo di onde elettromagnetiche,
rilevamenti della posizione o del movimento di oggetti. Il principio di
funzionamento è basato sull'analisi delle riflessioni delle onde
elettromagnetiche trasmesse nel terreno o nella struttura da esaminare.
Il GPR usa lo stesso principio dei radar convenzionali, ma con alcune
differenze significative. In un radar convenzionale l’onda elettromagnetica
irradiata si propaga in aria per molti chilometri, nel GPR si propaga nel suolo
o in altri materiali solidi raggiungendo distanze di pochi metri o anche decine
di metri. La risoluzione dei radar convenzionali è dell’ordine delle decine o
3
centinaia di metri, il GPR ha risoluzioni dell’ordine delle decine di centimetri e
con alcuni tipi di antenne si possono avere risoluzioni dell’ordine dei
centimetri.
L’osservazione è realizzata con varie tecniche elettromagnetiche, fornisce con
elevata efficienza ed esattezza e in modo quasi continuo indicazioni sulla
composizione della struttura indagata. Nello specifico è possibile discriminare
interfacce di elementi dotati di differente costante dielettrica.
Con il termine Ground Penetrating Radar si intende, nella più generica delle
accezioni, anche la tecnica con cui si conduce l’indagine.
Il successo di questa tecnica di indagine scaturisce dalla compattezza e
dalla manovrabilità del sistema, dall’economia dei costi e dai tempi di
esecuzione e soprattutto dalla sua caratteristica non distruttiva e da una
semplice interpretabilità dei risultati.
L’utilizzo di questa tecnologia consente infatti di rilevare e localizzare
nel mezzo investigato la presenza di oggetti, quali manufatti archeologici,
danneggiamenti di generiche strutture viarie, strade ponti, gallerie, servizi
interrati, condotte idriche, fognarie e del gas, cavità, svolgere attività di
sminamento, misure di spessori, o evidenziare discontinuità correnti, in
maniera molto facile ed economica.
Cenni storici Le prime applicazioni delle tecniche GPR risalgono agli anni 30, con
applicazioni nella ricerca archeologica. In particolare il primo esperimento
condotto con questa tecnologia, fu quello per la determinazione della
profondità di un ghiacciaio (1951). Nell’immediato dopo guerra si è verificato
un rapido ed intenso sviluppo di questa tecnica, soprattutto con l’impiego
4
delle tecnologie di derivazione militare, quali i metal detector ed il radar. Per
l’epoca le strumentazioni utilizzate erano complesse, ingombranti e
richiedevano lunghi tempi per l’acquisizione dei dati.
Negli ultimi anni, i notevoli progressi tecnologici dell’elettronica di base
e dell’informatica hanno rivoluzionato la tecnologia dedicata a queste
apparecchiature, fornendo prodotti di contenute dimensioni, portatili e di
facile impiego.
Le antenne sono di ridotte dimensioni, lavorano a frequenze che vanno
in funzione dell’applicazione da 20 MHz ad alcuni GHz, consentono di ottenere
risoluzioni maggiori per gli oggetti rilevati, i sistemi GPS abbinati allo
strumento forniscono mappature automatiche e dettagliate per le scansioni su
vaste aree. I software utilizzati per il post processing garantiscono immagini
delle scansioni effettuate di notevole qualità.
Attività sul GPR in Italia In ambito del progetto COST Action TU1208 "Civil engineering applications of
Ground Penetrating Radar”, è stato fatto un censimento sulle attività che
coinvolgono l’uso GPR in Europa, in questo capitolo della tesi si mettono in
evidenza le attività svolte in Italia, quali progetti di ricerca, siti di test, aziende
produttrici, Università coinvolte etc.
In particolare nel nostro paese già partire dagli anni 80 i progetti di ricerca e
le varie iniziative, finanziate da enti istituzionali, Ministero dell’Università e
della Ricerca, consorzi pubblici quali, Consorzio Nazionale Interuniversitario
per le Telecomunicazioni (CNIT), aziende Selex-ES e Telespazio S.p.A., hanno
sviluppato molteplici tecnologie di radar “stepped frequency” e “ultra-wide
band” (UWB), usati sia in ambito civile, archeologico o militare.
5
Una importante azienda Italiana, fondata negli anni 80 è la IDS S.p.A. che da
oltre 30 anni è la principale fornitrice di innovative tecnologie e soluzioni
ingegneristiche per le diverse applicazioni cioè: navale, aeronautico, georadar
e militare.
Dal 1999 l'IDS ha iniziato la commercializzazione a livello mondiale di sistemi
GPR basati su sistemi array multi-frequenza e multi-canale e tutt’oggi è una
delle aziende leader in questo settore, una società multi-nazionale con una
rete di agenzie e uffici in posizione strategica non solo in Italia, ma anche nei
paesi europei e in tutto il mondo.
Alcuni siti test dislocati sul territorio Italiano sono: In Frosinone, dedicato
prevalentemente allo sviluppo e uso della tecnologia GPR in applicazioni
archeologiche, il secondo è localizzato in Pescate provincia di Lecco,
principalmente impiegato per studiare antiche strutture sepolte. Il sito di
Ispra in provincia di Varese, è prevalentemente usato per scopi militari e
dedicato soprattutto al rilevamento di mine antiuomo. Un altro sito di test
molto importante per la ricerca di base, si trova in provincia di Lecce.
Le facoltà scientifiche di molte Università Italiane, sono ampiamente coinvolte
nello studio e nella promozione del GPR. Interessanti corsi universitari sono
organizzati dall'Università di Roma Tre, Università di Genova, la Seconda
Università di Napoli, Politecnico di Milano, Università Mediterranea di Reggio
Calabria, Università di Pisa, Università di Siena, Università della Basilicata,
Università degli Studi di Bari e dall’Università degli Studi di Messina.
6
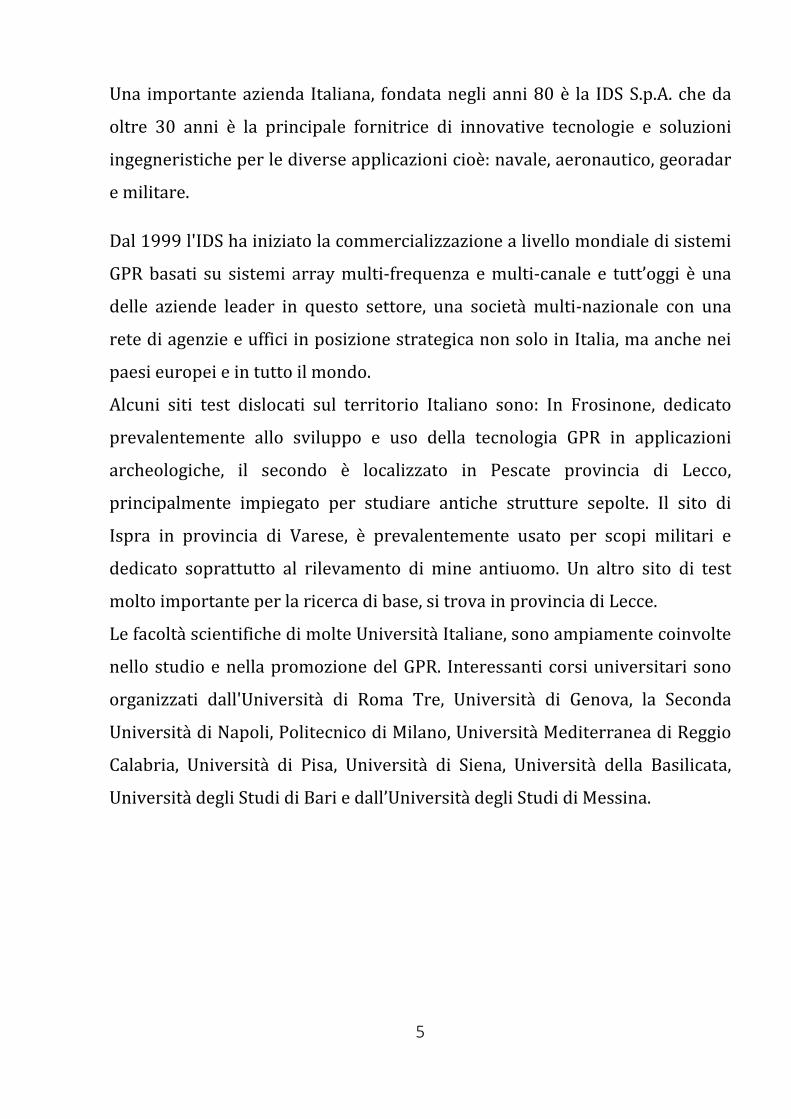
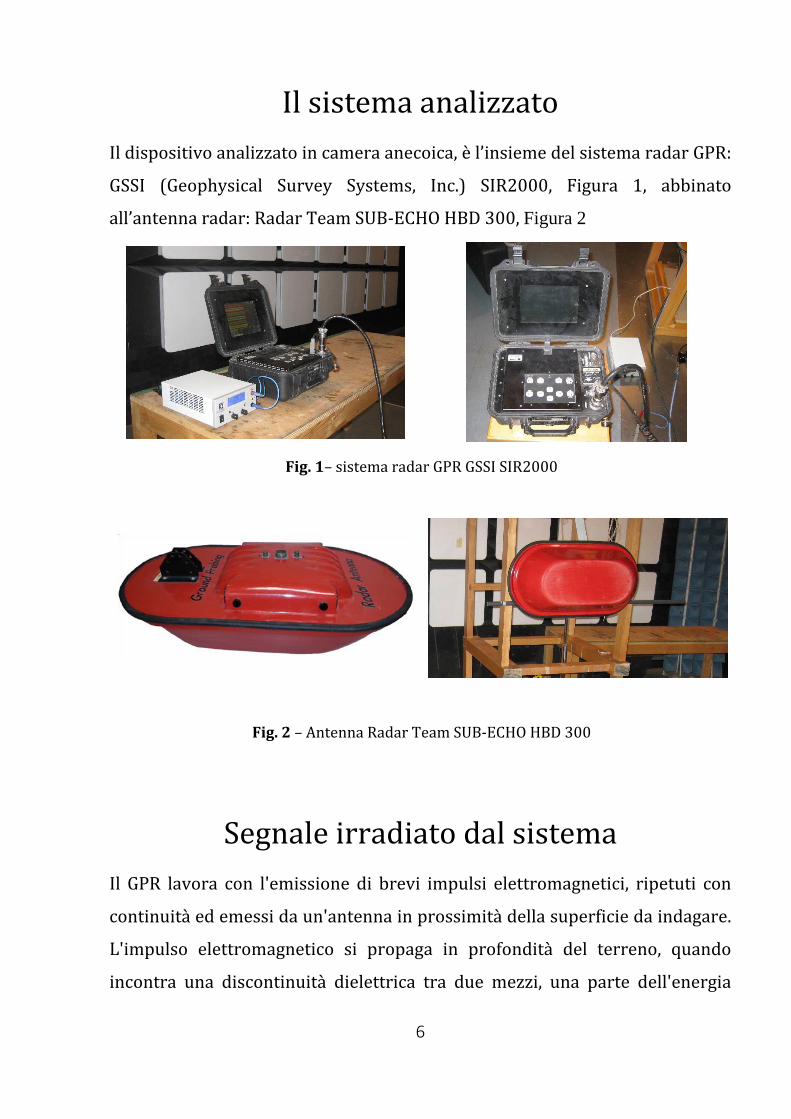
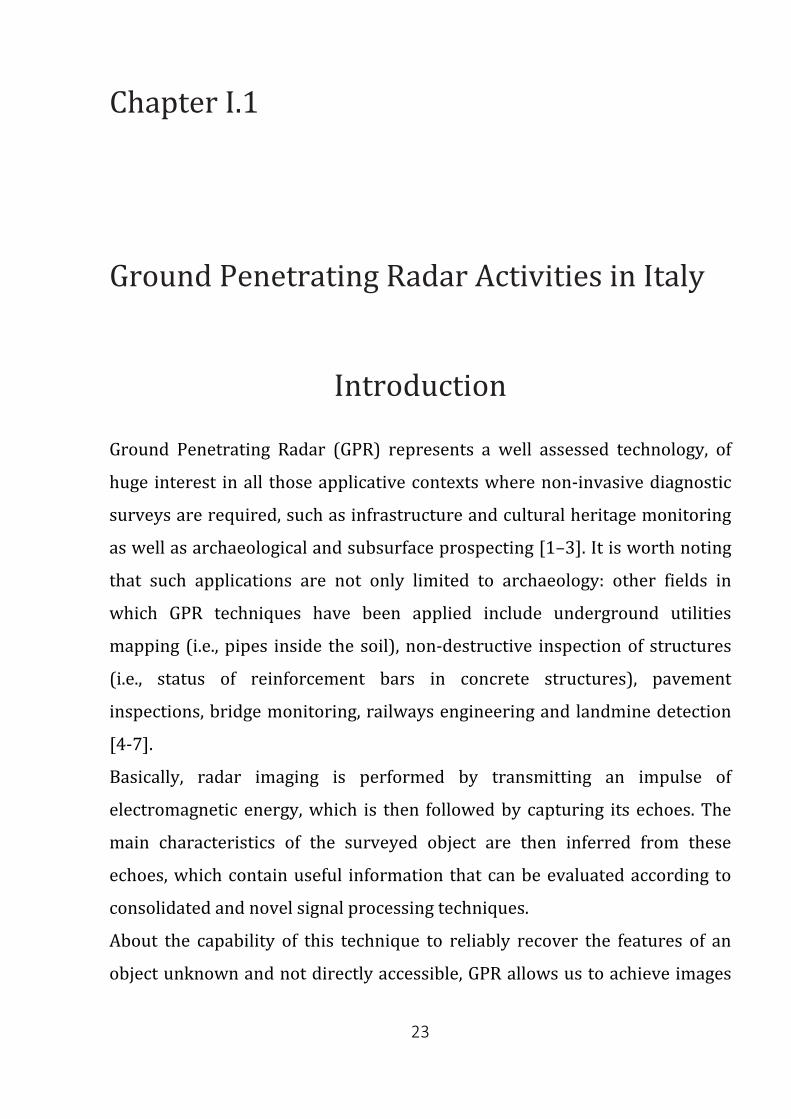
Il sistema analizzato Il dispositivo analizzato in camera anecoica, è l’insieme del sistema radar GPR:
GSSI (Geophysical Survey Systems, Inc.) SIR2000, Figura 1, abbinato
all’antenna radar: Radar Team SUB-ECHO HBD 300, Figura 2
Fig. 1– sistema radar GPR GSSI SIR2000
Fig. 2 – Antenna Radar Team SUB-ECHO HBD 300
Segnale irradiato dal sistema Il GPR lavora con l'emissione di brevi impulsi elettromagnetici, ripetuti con
continuità ed emessi da un'antenna in prossimità della superficie da indagare.
L'impulso elettromagnetico si propaga in profondità del terreno, quando
incontra una discontinuità dielettrica tra due mezzi, una parte dell'energia
7
incidente viene riflessa ed una parte prosegue nel secondo mezzo. Le onde
riflesse dalla discontinuità ritornano in superficie e vengono captate
dall'antenna ricevente ed analizzate dal sistema, la parte di impulso trasmesso
procede oltre la discontinuità stessa e può subire altre riflessioni su eventuali
discontinuità più profonde. La caratteristica generale di un GPR è quella di un
radar che trasmette segnali con una caratteristica banda UWB (Ultra Wide
Band) in un range di frequenze che va da 10 MHz a circa 5 GHz. La durata del
segnale trasmesso è dell'ordine dell'inverso della banda, che a sua volta è
dell'ordine della frequenza centrale dell’antenna in uso. Se siamo a centro
banda 20 MHz la durata è quindi dell'ordine di 50 ns, se siamo a 200 MHz la
durata dell'impulso è dell'ordine di 5 ns e se siamo a 2 GHz la durata è
dell'ordine di 0.5 ns.
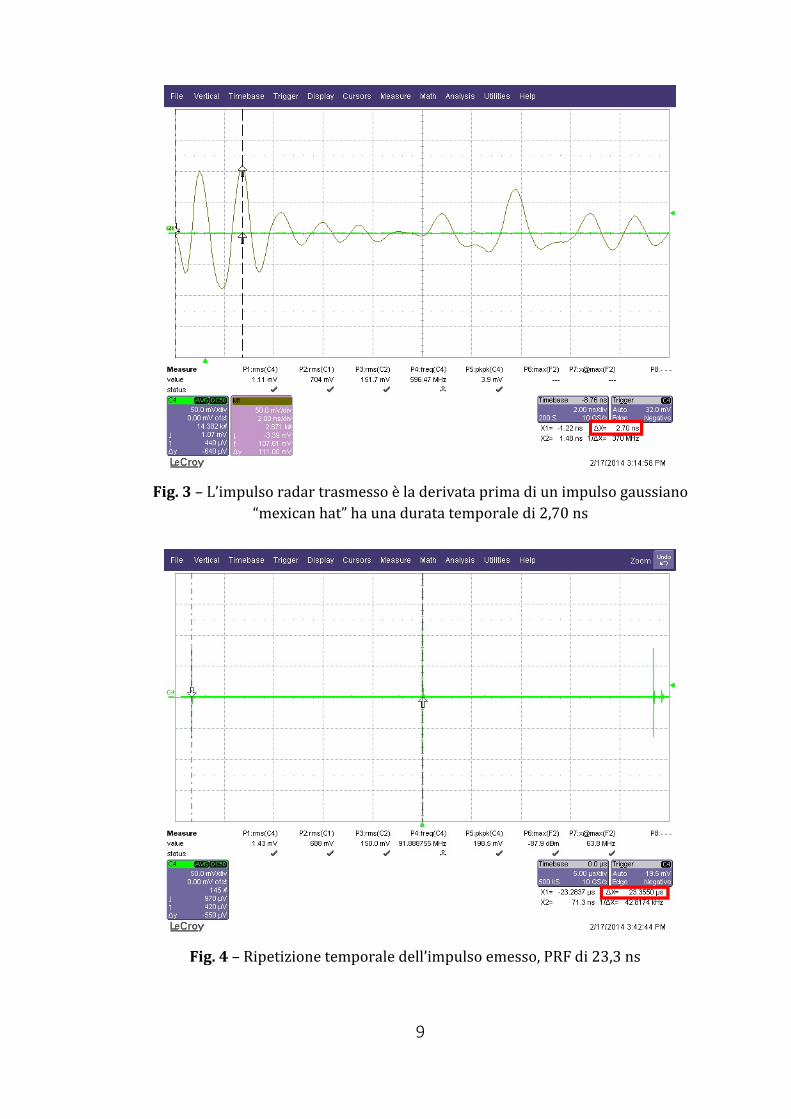
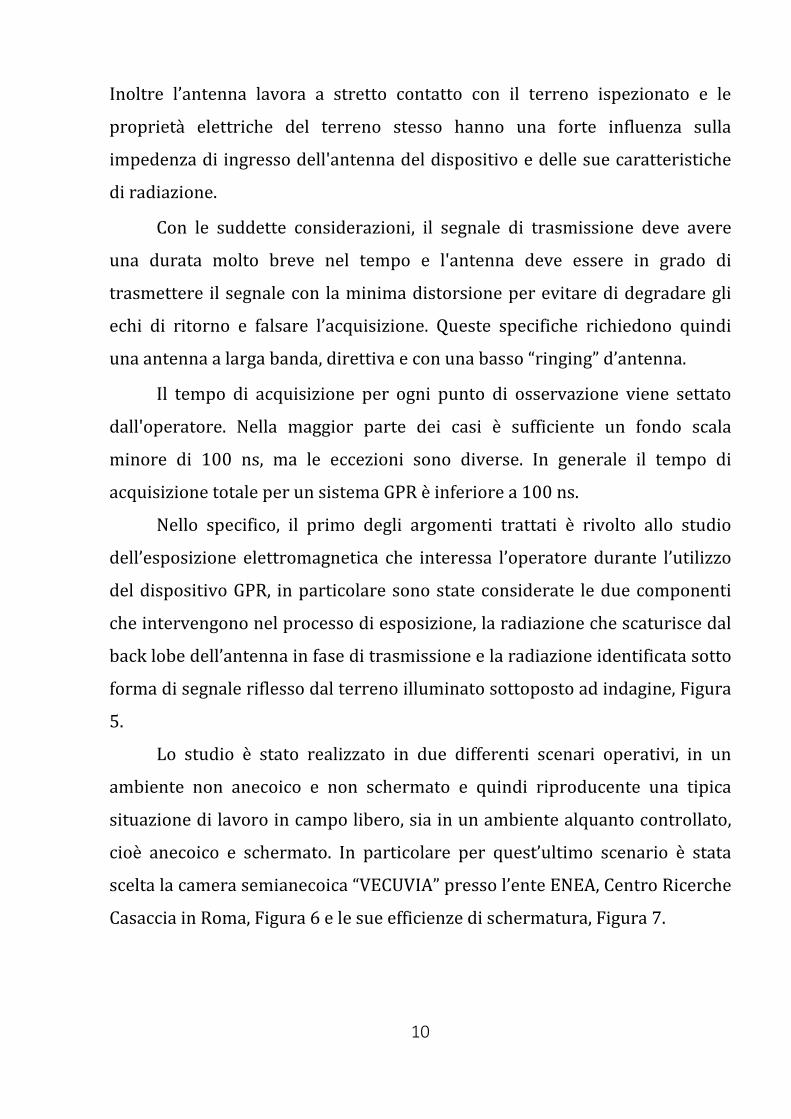
In questo caso il segnale trasmesso è un tipico segnale impulsato con una
durata temporale dell’ordine di circa 2.70 ns, Figura 3, ed è emesso dal
sistema con una determinata frequenza di ripetizione (Pulse Repetion
Frequency) PRF Figura 4.
Individuare queste caratteristiche di emissione in fase di misura richiede
molta accortezza, in quanto bisogna discriminare fra tutti gli altri segnali
ambientali e i disturbi casuali.
Il GPR è di dimensioni contenute e può essere fisicamente traslato
gradualmente lungo un prefissato tracciato rettilineo in superficie e ottenere
così una rappresentazione bidimensionale o “radargramma”, un grafico che
rappresenta lo spostamento lungo una direzione in funzione dei tempi di
ricezione del segnale riflesso.
L’energia media irradiata è molto bassa, confinata nel sottosuolo,
raggiunge svariati metri di profondità, in funzione della frequenza usata, il
tipo di terreno etc. e in parte è assorbita istantaneamente. Tutte queste
8
caratteristiche sono esclusive di un dispositivo GPR, in confronto ad altri
dispositivi di esplorazione quali il metal detector o un generico sensore di
movimento, che lavorano a piccole profondità e limitate gamme di frequenza.
9
Fig. 3 – L’impulso radar trasmesso è la derivata prima di un impulso gaussiano
“mexican hat” ha una durata temporale di 2,70 ns
Fig. 4 – Ripetizione temporale dell’impulso emesso, PRF di 23,3 ns
10
Inoltre l’antenna lavora a stretto contatto con il terreno ispezionato e le
proprietà elettriche del terreno stesso hanno una forte influenza sulla
impedenza di ingresso dell'antenna del dispositivo e delle sue caratteristiche
di radiazione.
Con le suddette considerazioni, il segnale di trasmissione deve avere
una durata molto breve nel tempo e l'antenna deve essere in grado di
trasmettere il segnale con la minima distorsione per evitare di degradare gli
echi di ritorno e falsare l’acquisizione. Queste specifiche richiedono quindi
una antenna a larga banda, direttiva e con una basso “ringing” d’antenna.
Il tempo di acquisizione per ogni punto di osservazione viene settato
dall'operatore. Nella maggior parte dei casi è sufficiente un fondo scala
minore di 100 ns, ma le eccezioni sono diverse. In generale il tempo di
acquisizione totale per un sistema GPR è inferiore a 100 ns.
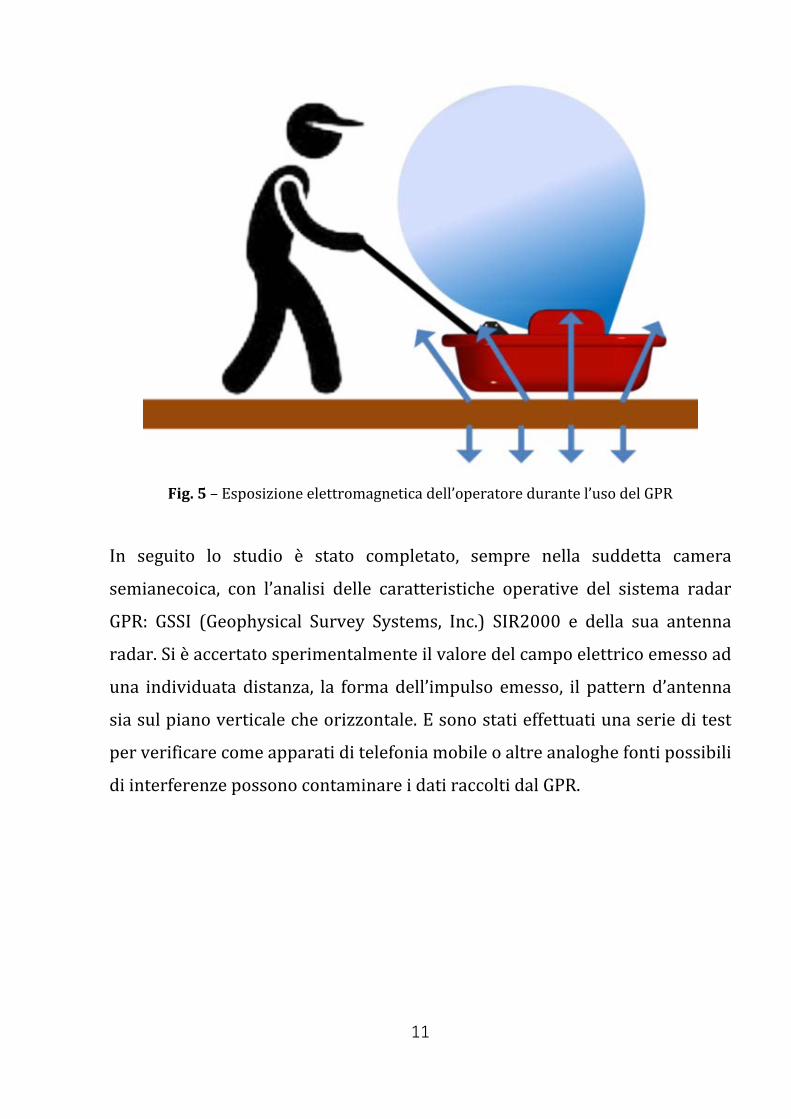
Nello specifico, il primo degli argomenti trattati è rivolto allo studio
dell’esposizione elettromagnetica che interessa l’operatore durante l’utilizzo
del dispositivo GPR, in particolare sono state considerate le due componenti
che intervengono nel processo di esposizione, la radiazione che scaturisce dal
back lobe dell’antenna in fase di trasmissione e la radiazione identificata sotto
forma di segnale riflesso dal terreno illuminato sottoposto ad indagine, Figura
5.
Lo studio è stato realizzato in due differenti scenari operativi, in un
ambiente non anecoico e non schermato e quindi riproducente una tipica
situazione di lavoro in campo libero, sia in un ambiente alquanto controllato,
cioè anecoico e schermato. In particolare per quest’ultimo scenario è stata
scelta la camera semianecoica “VECUVIA” presso l’ente ENEA, Centro Ricerche
Casaccia in Roma, Figura 6 e le sue efficienze di schermatura, Figura 7.
11
Fig. 5 – Esposizione elettromagnetica dell’operatore durante l’uso del GPR
In seguito lo studio è stato completato, sempre nella suddetta camera
semianecoica, con l’analisi delle caratteristiche operative del sistema radar
GPR: GSSI (Geophysical Survey Systems, Inc.) SIR2000 e della sua antenna
radar. Si è accertato sperimentalmente il valore del campo elettrico emesso ad
una individuata distanza, la forma dell’impulso emesso, il pattern d’antenna
sia sul piano verticale che orizzontale. E sono stati effettuati una serie di test
per verificare come apparati di telefonia mobile o altre analoghe fonti possibili
di interferenze possono contaminare i dati raccolti dal GPR.

12
Fig. 6 – Setup in camera semianecoica “VECUVIA” del sistema radar e della sua
antenna
Efficienze di schermatura camera semianecoica VECUVIA
Campo Elettrico
300 kHz – 30 MHz 120 dB
30 MHz – 400 MHz 105 dB
400 kHz – 18 GHz 100 dB
Campo Magnetico
10 kHz 60 dB
100 kHz 90 dB
Fig. 7 – Camera semianecoica “VECUVIA”, efficienze di schermatura

13
Modellizzazione di una griglia metallica per applicazioni GPR
Questa parte del lavoro è dedicata alla simulazione di scenari bidimensionali e
alle tematiche di scattering elettromagnetico, tipiche condizioni in cui si trova
ad operare il GPR. I risultati di questa attività sono stati conseguiti con l’uso
un noto software freeware che utilizza i metodi di calcolo alle differenze finite
(FDTD), GprMax.
In particolare si focalizza l’attenzione su un oggetto, un modello di griglia
metallica formata da cilindrici metallici lunghi e sottili, sepolti nel terreno o
incorporati in una struttura, questa è la tipica attività di controllo della qualità
del cemento armato o applicazioni simili.
La migliore modellizzazione di una griglia metallica si ottiene
considerando un elevato numero di fili metallici, ma è anche importante
valutare il raggio del filo metallico e la spaziatura stessa della griglia. A tal
proposito si fa riferimento alla cosiddetta regola (Equal Area Rule) EAR,
regola dedotta dall'osservazione empirica e descrive come la superficie totale
dei fili deve essere uguale alla superficie dell’oggetto da modellare.
Alcuni autori hanno studiato l’affidabilità della regola EAR comparando la
radiazione di campo magnetico trasverso, generata da un cilindro nel vuoto
con una corrente sulla sua superficie o illuminato da un'onda piana
monocromatica trasversa magnetica e confrontato con un modello a griglia
metallica. Deducendo così che il modello a griglia è compatibile con la regola
EAR. Inoltre i fili troppo spessi si comportano male come quelli troppo sottili.
Tutti i mezzi coinvolti sono assunti lineari ed isotropi, dispersivi, gli
oggetti metallici si presume siano perfettamente conduttivi. In questa
simulazione non sono state incluse le strutture fisiche sia del ricevitore che
14
del trasmettitore, la sorgente è rappresentata da una linea di corrente ed è
stato calcolato il campo elettrico incidente sul ricevitore.
La propagazione degli errori numerici è contenuta, decretando il passo
di discretizzazione spaziale di un fattore 10 volte più piccolo della lunghezza
d’onda minima del campo elettromagnetico. La frequenza massima da
considerare nella simulazione, è tre volte la frequenza centrale dell’impulso.
Per evitare l’effetto di frammentazione a scala del bordo degli oggetti
continui, le forme circolari sono approssimate con un numero di almeno 20
celle per il loro raggio.
E’ necessario limitare lo spazio computazionale, inserendo delle forme
Perfectly Matched Layer (PML) per i bordi in modalità di Absorbing Boundary
Conditions (ABS), usando 10 strati e ponendo sorgenti e target almeno 15
cellule distanziate dallo strato più interno.
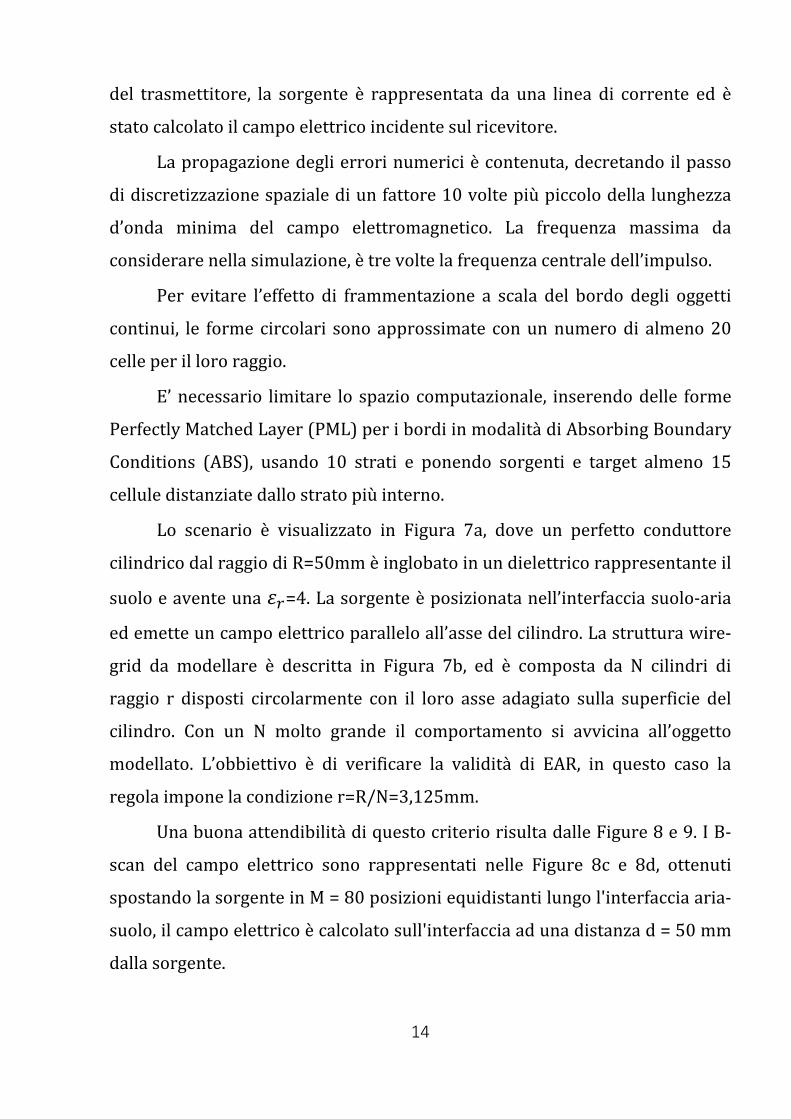
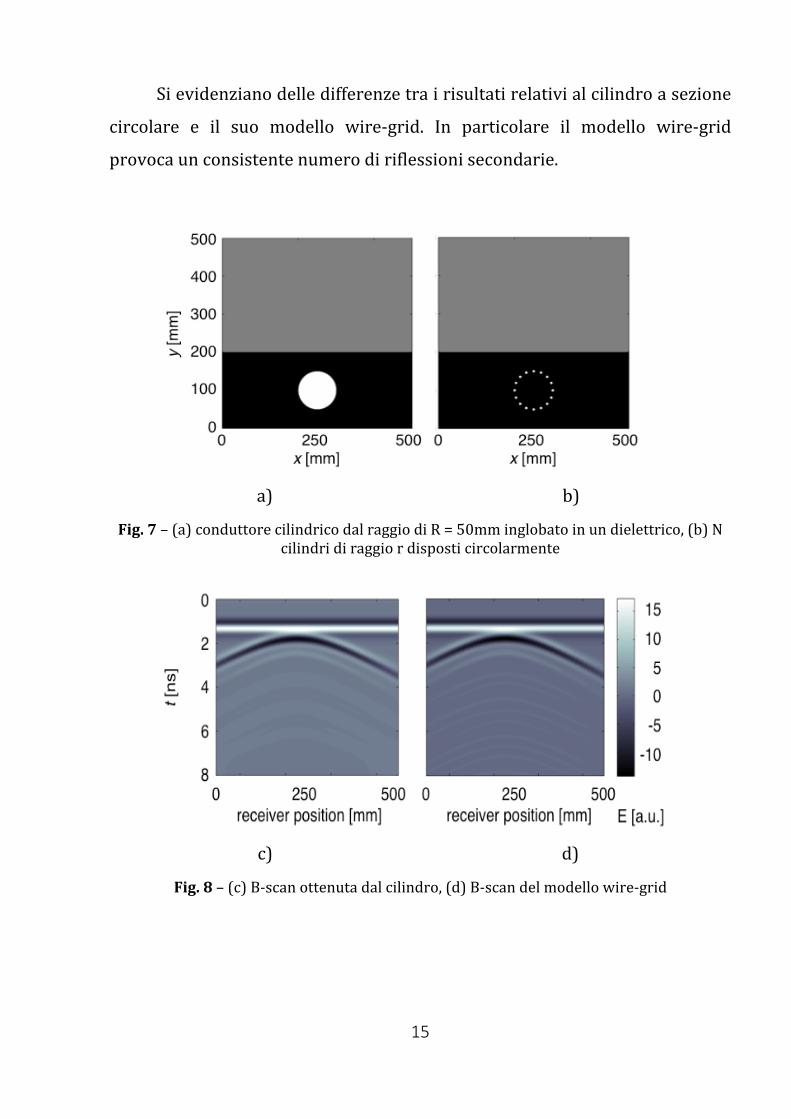
Lo scenario è visualizzato in Figura 7a, dove un perfetto conduttore
cilindrico dal raggio di R=50mm è inglobato in un dielettrico rappresentante il
suolo e avente una 𝜀𝜀𝑟𝑟=4. La sorgente è posizionata nell’interfaccia suolo-aria
ed emette un campo elettrico parallelo all’asse del cilindro. La struttura wire-
grid da modellare è descritta in Figura 7b, ed è composta da N cilindri di
raggio r disposti circolarmente con il loro asse adagiato sulla superficie del
cilindro. Con un N molto grande il comportamento si avvicina all’oggetto
modellato. L’obbiettivo è di verificare la validità di EAR, in questo caso la
regola impone la condizione r=R/N=3,125mm.
Una buona attendibilità di questo criterio risulta dalle Figure 8 e 9. I B-
scan del campo elettrico sono rappresentati nelle Figure 8c e 8d, ottenuti
spostando la sorgente in M = 80 posizioni equidistanti lungo l'interfaccia aria-
suolo, il campo elettrico è calcolato sull'interfaccia ad una distanza d = 50 mm
dalla sorgente.
15
Si evidenziano delle differenze tra i risultati relativi al cilindro a sezione
circolare e il suo modello wire-grid. In particolare il modello wire-grid
provoca un consistente numero di riflessioni secondarie.
a) b)
Fig. 7 – (a) conduttore cilindrico dal raggio di R = 50mm inglobato in un dielettrico, (b) N cilindri di raggio r disposti circolarmente
Fig. 8 – (c) B-scan ottenuta dal cilindro, (d) B-scan del modello wire-grid
c) d)
16
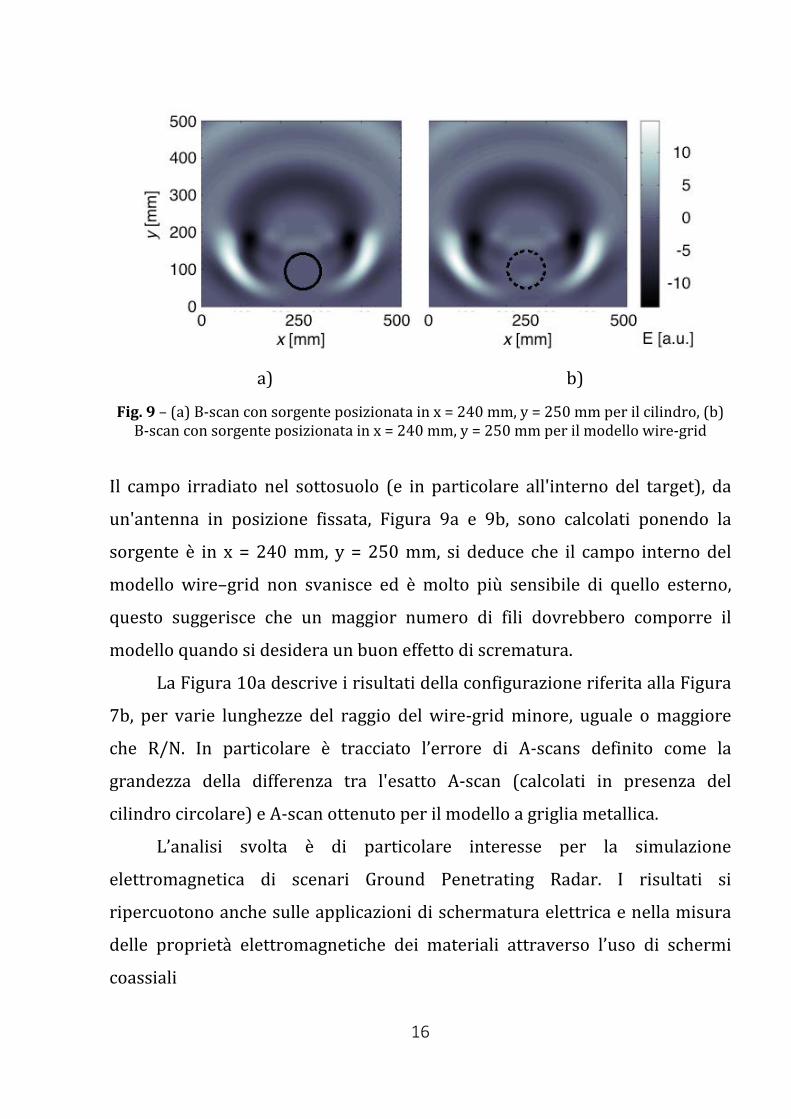
Fig. 9 – (a) B-scan con sorgente posizionata in x = 240 mm, y = 250 mm per il cilindro, (b) B-scan con sorgente posizionata in x = 240 mm, y = 250 mm per il modello wire-grid
Il campo irradiato nel sottosuolo (e in particolare all'interno del target), da
un'antenna in posizione fissata, Figura 9a e 9b, sono calcolati ponendo la
sorgente è in x = 240 mm, y = 250 mm, si deduce che il campo interno del
modello wire–grid non svanisce ed è molto più sensibile di quello esterno,
questo suggerisce che un maggior numero di fili dovrebbero comporre il
modello quando si desidera un buon effetto di scrematura.
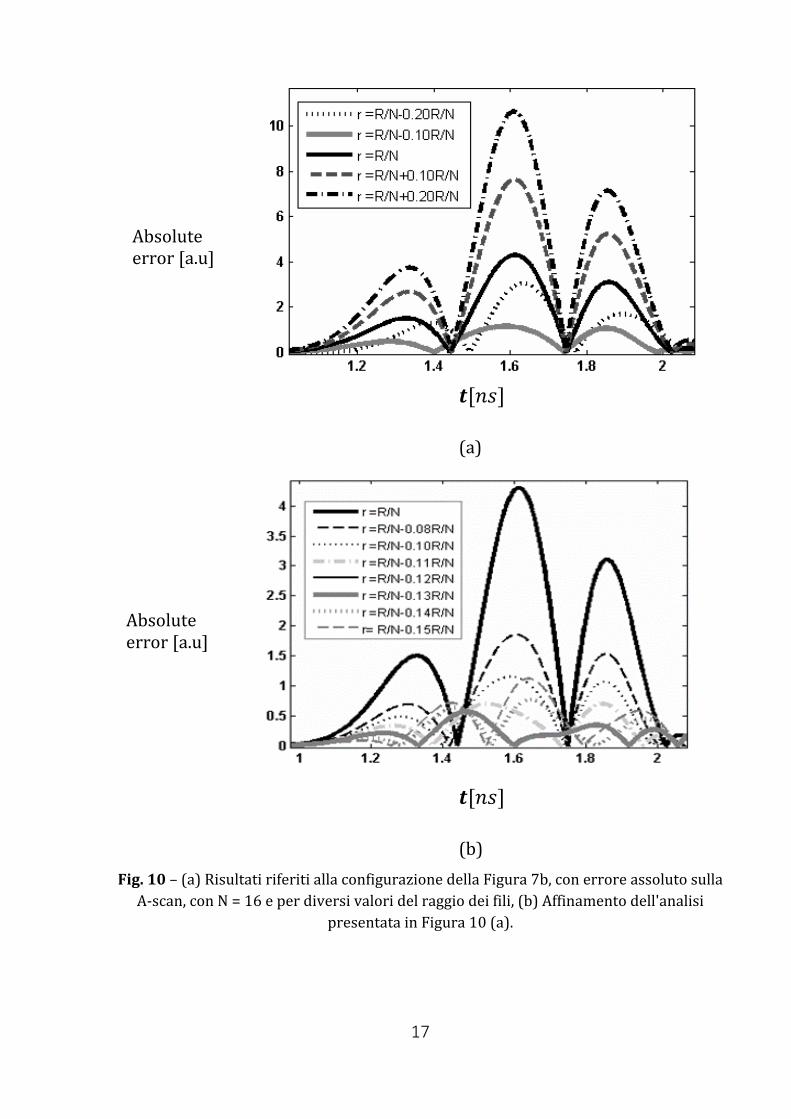
La Figura 10a descrive i risultati della configurazione riferita alla Figura
7b, per varie lunghezze del raggio del wire-grid minore, uguale o maggiore
che R/N. In particolare è tracciato l’errore di A-scans definito come la
grandezza della differenza tra l'esatto A-scan (calcolati in presenza del
cilindro circolare) e A-scan ottenuto per il modello a griglia metallica.
L’analisi svolta è di particolare interesse per la simulazione
elettromagnetica di scenari Ground Penetrating Radar. I risultati si
ripercuotono anche sulle applicazioni di schermatura elettrica e nella misura
delle proprietà elettromagnetiche dei materiali attraverso l’uso di schermi
coassiali
a) b)
17
𝒕𝒕[𝑛𝑛𝑛𝑛]
(a)
𝒕𝒕[𝑛𝑛𝑛𝑛]
(b) Fig. 10 – (a) Risultati riferiti alla configurazione della Figura 7b, con errore assoluto sulla
A-scan, con N = 16 e per diversi valori del raggio dei fili, (b) Affinamento dell'analisi presentata in Figura 10 (a).
Absolute error [a.u]
Absolute error [a.u]
18
Parte II
Tecniche elettromagnetiche per la valutazione della
permettività dielettrica di materiali
Il secondo argomento della tesi è dedicato all’analisi sperimentale della
permettività dielettrica complessa di un generico materiale coeso. Lo studio è
stato condotto per mezzo di una tecnica riflettometrica in guida d’onda a
sezione rettangolare e un (Vector Network Analyzer) VNA. La frequenza di
lavoro scelta è quella (Industrial, Scientific and Medical) ISM Band, cioè 2.45
GHz. L’indagine sperimentale è stata svolta presso il Laboratorio di Microonde
del Dipartimento di Ingegneria Elettronica dell'Università degli Studi di Roma
La Sapienza.
Le tecniche di spettroscopia dielettrica operanti nella banda delle
microonde sono sempre più di largo impiego per la misura della permettività
complessa di un campione di materiale. La conoscenza di questo importante
parametro infatti può fornire informazioni sulla sua qualità e definire
l'interazione del materiale e l'effetto di riscaldamento corrispondente.
Una applicazione del riscaldamento a microonde, soprattutto alla ISM
Band è dedicato alla manutenzione del manto stradale, infatti, riscaldando
l'asfalto attraverso l'uso di microonde, è possibile effettuare riparazioni in
loco di fori o fessure presenti sulla superficie stradale. Inoltre l’uso delle
microonde potrebbe anche essere impiegato durante la fase di produzione, in
sostituzione ai forni convenzionali usati per l'essiccazione e il riscaldamento
dei leganti minerali dell’asfalto e nel riciclo della pavimentazione con l’asfalto
19
rigenerato e bitume. Lo studio della permettività complessa del conglomerato
bituminoso, posso far capire come realizzare un sistema dedicato al
riscaldamento e all’analisi del sistema.
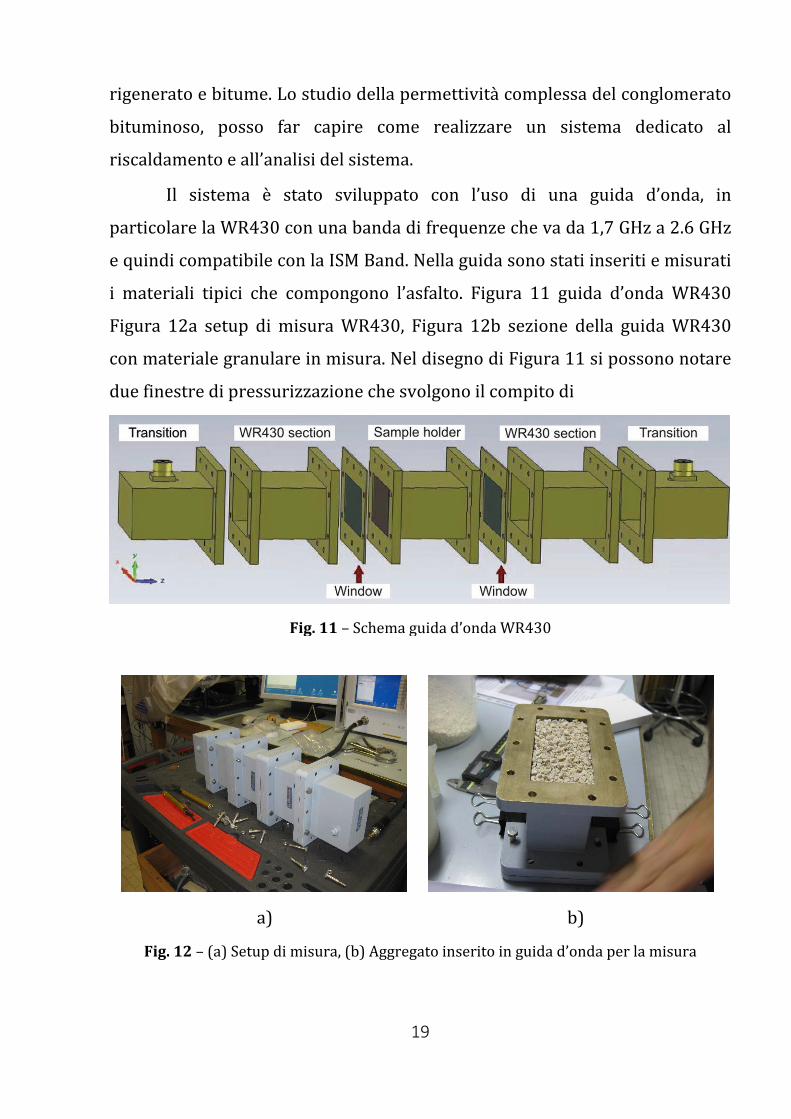
Il sistema è stato sviluppato con l’uso di una guida d’onda, in
particolare la WR430 con una banda di frequenze che va da 1,7 GHz a 2.6 GHz
e quindi compatibile con la ISM Band. Nella guida sono stati inseriti e misurati
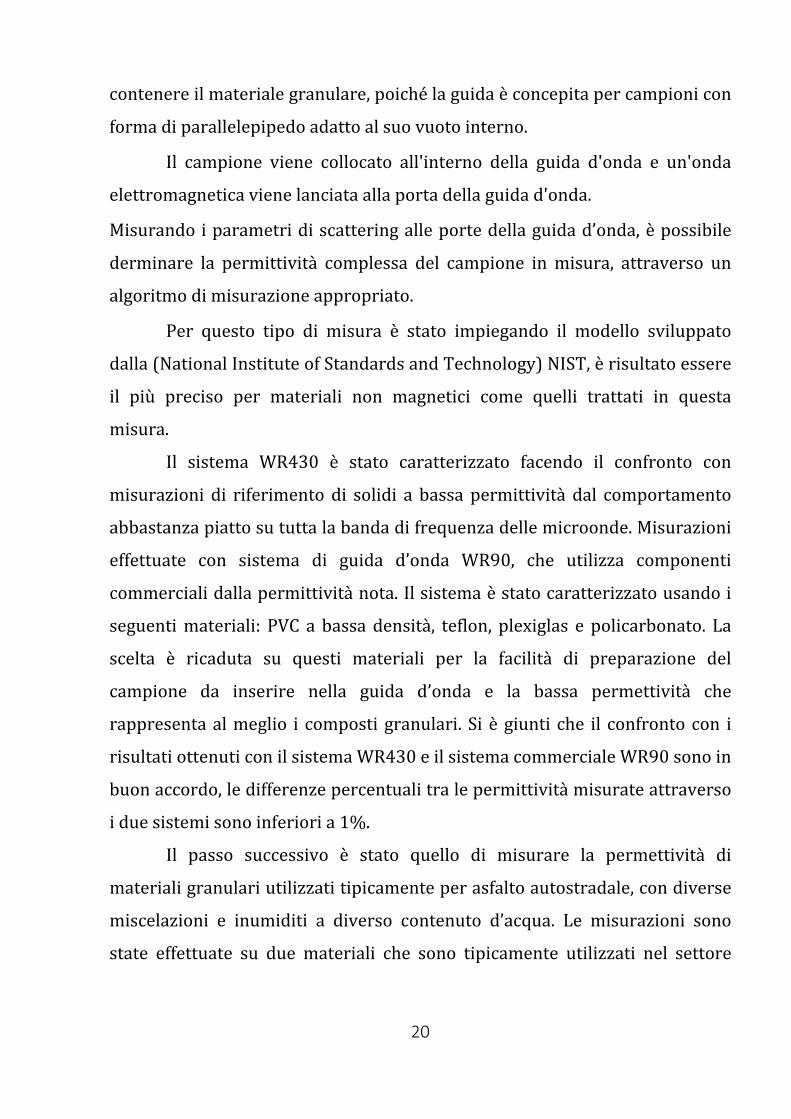
i materiali tipici che compongono l’asfalto. Figura 11 guida d’onda WR430
Figura 12a setup di misura WR430, Figura 12b sezione della guida WR430
con materiale granulare in misura. Nel disegno di Figura 11 si possono notare
due finestre di pressurizzazione che svolgono il compito di
Fig. 11 – Schema guida d’onda WR430
a) b)
Fig. 12 – (a) Setup di misura, (b) Aggregato inserito in guida d’onda per la misura
20
contenere il materiale granulare, poiché la guida è concepita per campioni con
forma di parallelepipedo adatto al suo vuoto interno.
Il campione viene collocato all'interno della guida d'onda e un'onda
elettromagnetica viene lanciata alla porta della guida d'onda.
Misurando i parametri di scattering alle porte della guida d’onda, è possibile
derminare la permittività complessa del campione in misura, attraverso un
algoritmo di misurazione appropriato.
Per questo tipo di misura è stato impiegando il modello sviluppato
dalla (National Institute of Standards and Technology) NIST, è risultato essere
il più preciso per materiali non magnetici come quelli trattati in questa
misura.
Il sistema WR430 è stato caratterizzato facendo il confronto con
misurazioni di riferimento di solidi a bassa permittività dal comportamento
abbastanza piatto su tutta la banda di frequenza delle microonde. Misurazioni
effettuate con sistema di guida d’onda WR90, che utilizza componenti
commerciali dalla permittività nota. Il sistema è stato caratterizzato usando i
seguenti materiali: PVC a bassa densità, teflon, plexiglas e policarbonato. La
scelta è ricaduta su questi materiali per la facilità di preparazione del
campione da inserire nella guida d’onda e la bassa permettività che
rappresenta al meglio i composti granulari. Si è giunti che il confronto con i
risultati ottenuti con il sistema WR430 e il sistema commerciale WR90 sono in
buon accordo, le differenze percentuali tra le permittività misurate attraverso
i due sistemi sono inferiori a 1%.
Il passo successivo è stato quello di misurare la permettività di
materiali granulari utilizzati tipicamente per asfalto autostradale, con diverse
miscelazioni e inumiditi a diverso contenuto d’acqua. Le misurazioni sono
state effettuate su due materiali che sono tipicamente utilizzati nel settore
21
dell'asfalto, roccia calcarea e aggregati basaltici. Entrambi questi materiali
sono stati selezionati in modo da ottenere pietre con un diametro compreso
tra 2 e 4 mm.
I risultati di misura ottenuti, confermano la flessibilità e l’uso pratico
del sistema in possibili applicazioni nell'industria per la manutenzione
stradale. I costi per produrre i componenti della guida d'onda si aggirano
intorno ai € 1000, la rendono una soluzione molto competitiva e conveniente.
La tecnica della spettroscopia dielettrica può essere applicata ai
materiali granulari in genere, in particolare al settore agroalimentare con la
misura di granaglie, farine alimentari etc.
22
Part I
Ground Penetrating Radar systems and applications
23
Chapter I.1
Ground Penetrating Radar Activities in Italy
Introduction
Ground Penetrating Radar (GPR) represents a well assessed technology, of
huge interest in all those applicative contexts where non-invasive diagnostic
surveys are required, such as infrastructure and cultural heritage monitoring
as well as archaeological and subsurface prospecting [1–3]. It is worth noting
that such applications are not only limited to archaeology: other fields in
which GPR techniques have been applied include underground utilities
mapping (i.e., pipes inside the soil), non-destructive inspection of structures
(i.e., status of reinforcement bars in concrete structures), pavement
inspections, bridge monitoring, railways engineering and landmine detection
[4-7].
Basically, radar imaging is performed by transmitting an impulse of
electromagnetic energy, which is then followed by capturing its echoes. The
main characteristics of the surveyed object are then inferred from these
echoes, which contain useful information that can be evaluated according to
consolidated and novel signal processing techniques.
About the capability of this technique to reliably recover the features of an
object unknown and not directly accessible, GPR allows us to achieve images
24
with a resolution ranging from centimeters or decimeters, depending on the
wavelength and on the situation, to a few meters within the investigated
region.
Results of a GPR measurement are usually represented by means of a 2D map,
known as B-scan, from which expert users may detect and localize hidden
objects and infer information about their geometrical features.
Nevertheless, the detection performances of GPR largely depend on a number
of factors that can be grouped under the term “clutter”, which can partially or
totally hide or distort the response of the buried objects. The main factors are:
• The antenna effects producing multiple reflections and signal distortion;
• The soil electromagnetic (EM) properties and their spatial distribution
governing wave propagation velocity, attenuation, and scattering;
• The EM contrast between the soil and the object, determining the strength
of the backscattered EM field;
• Soil roughness and inherent heterogeneities yielding diffuse scattering.
Therefore, there is a need to develop appropriate techniques for clutter
reduction and objects imaging; this is a quite challenging task due to the
complexity of the EM scattering phenomenon occurring in the a priori
unknown antenna–air–soil–scatterer system.
Nowadays GPR is currently the key subject characterized by intensive
research activities with respect to all the aforementioned applications, since it
permits to detect both metallic and non-metallic objects by imaging rapidly
and in a non-invasive way at least the shallow subsurface. Many works have
been presented in literature about this topic and, due to the considerable
interest in such type of activities, there have been a lot of research projects all
over the world.
25
In COST Action TU1208 "Civil engineering applications of Ground Penetrating
Radar" a census was done of the most significant activities involving GPR
carried out in Europe and beyond. Information was also collected about
available guidelines, test sites and training initiatives in the various Countries
participating to the Action. Members were requested to answer eight
questions. As a part of this PhD thesis, I worked at the development of the
answers concerned with GPR activities carried out in Italy. A resume of these
is presented in the following Sections of this Chapter.
1. Which are the most interesting (recent and ongoing) national research projects carried out in your Country?
More in details, such an interest in the GPR technology applied in several
fields has been proved by different Italian research projects starting from the
1980s. Within this framework, the Italian community took part in both
national and international initiatives, which have ranged from civil
engineering to forensic and security applications.
To the best of the authors’ knowledge, one of the first project the Italian
community joined in was represented by the ARCHEO project, which goes
back till the 1990s. This project, which was funded by the Italian Ministry for
Universities and Scientific and Technological Research (MURST), had as main
participants a lot of Italian researchers coming from different areas and
institutions. In a few words, this project has been focused on the combination
of several techniques for discovering and recognizing archaeological finds. In
particular, a ground penetrating radar system has been developed by the
Italian Consortium for Research on Advanced Remote Sensing Systems
(CORISTA). The system has been designed to meet archaeological
requirements and it has been conceived and realized as a stepped frequency
ultra-wide band (UWB) radar, working both in gated and ungated mode [8].
26
The choice of a stepped frequency GPR has been adopted for this system due
to the several advantages with respect to the traditional impulsive GPR
systems, that have been witnessed since the seventies and up to now [9],
while the possibility to use both gated and ungated modes is due to the aim of
reducing the coupling between the transmitting and receiving antennas.
Moreover, such radar was equipped with a positioning system [10-11] able to
move independently the antennas without any intervention by the operator.
Some outdoor tests on the GPR were therefore performed in a controlled test
site environment after laboratory tests [11]. In order to calibrate the system
and assess its performances, a dedicated outdoor test facility was realized. In
the framework of an agreement with the Italian Aerospace Research Centre
(CIRA) located in Capua, southern Italy, a 25m × 25m pool with a depth of 5 m
has been built up within the CIRA establishment and filled with river sand.
Several objects, such as metallic sheets, plastic pipes, and tanks at different
depth were buried as reference targets. For more details, the reader is invited
to see Alberti et al. [8].
Another important step in ARCHEO project dealt with the theoretical analysis
about the capability of the system to recover the features of unknown, buried
objects. Such an analysis was realized by both Universities of Napoli “Federico
II” and “Seconda Università” (SUN), which did not only focused on radar
techniques based on traditional approaches, but also moved on a more
innovative tomographic approach in order to improve the performances of
the imaging system. Under this perspective, the whole structure of the project
was split in different work packages which included the modeling of the
electromagnetic features of the soil (WP 2), the analysis of different scattering
models for the case of buried objects (WP 3-4), and the development of
inverse scattering techniques (WP 5).
27
A more recent GPR project, which goes back till 2001-2004, was the SMART-
RAD project, which was intended to response to specific limitations of existing
systems in order to develop an innovative technology able to set forth the
conditions for a widespread commercialization of GPR tools within a broad
range of industrial sectors where efficient underground inspection was
required [12].
Such a project had been funded by European Commission, and more in details
by CORDIS (Community Research and Development Information Service).
According to the guidelines proposed at that time, SMART-RAD was intended
to be able to reliably detect buried objects and will have easy on-field data
interpretation capability, such to be used by untrained operators. The system
had a broad class of potential users in the construction and re-development
industry, as efficient and cheap alternative to conventional ground inspection
methods in construction or de-commissioning sites, reducing the risk of
damages and accidents during excavation operations.
The main coordinator of the project was the Italian company D’Appolonia
S.p.A., which managed all the activities of international participants, among
which also another Italian institution, namely, the University of Pavia, took
place. More recently, another project called ORFEUS (Optimized Radar to Find
Every Utility in the Street) has been proposed. It was a collaborative research
project, with financial support from the European Commission, which started
in late 2006 with the overall aim of providing the capability to locate buried
infrastructure accurately and reliably. Amongst the technical objectives of
ORFEUS, a major task was the provision of a radar mounted on the drill heads
of Horizontal Directional Drilling machines to provide a real-time indication of
obstacles in the drill path to the operator, so that they can operate more safely
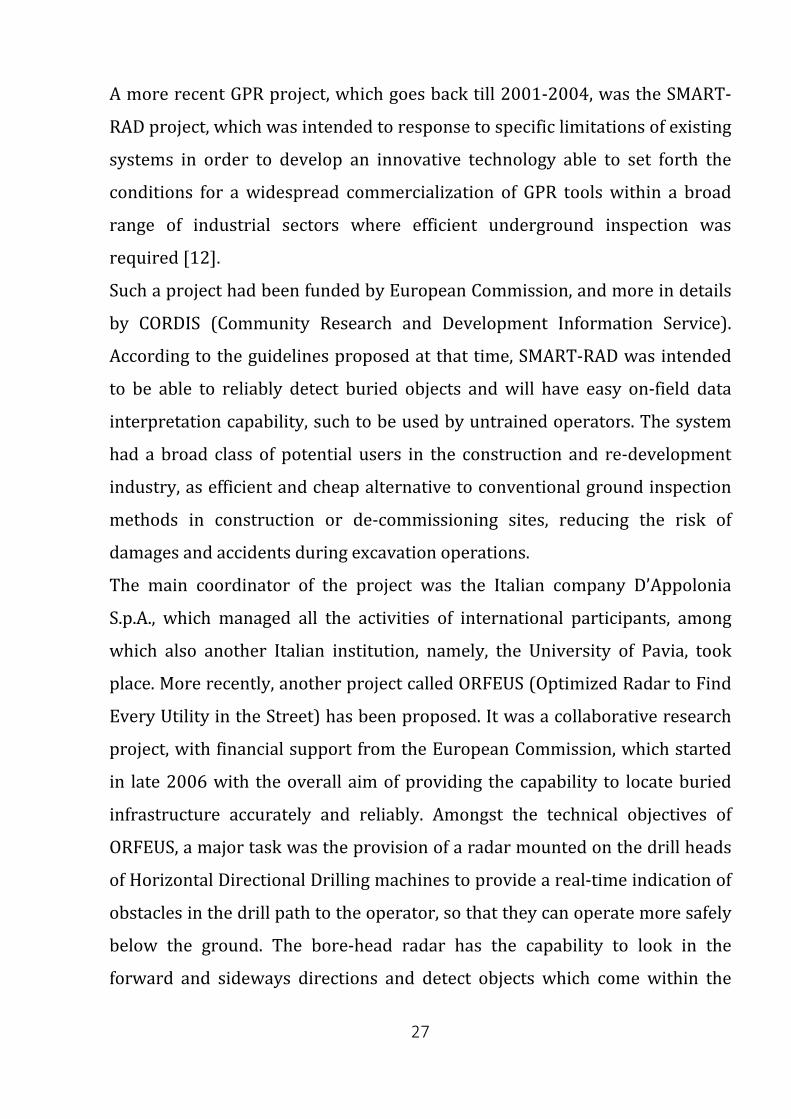
below the ground. The bore-head radar has the capability to look in the
forward and sideways directions and detect objects which come within the
28
cones of the antenna radiation patterns Figure 2. One of the main advantages
was that information can be transmitted from the radar to the operator on the
surface so that objects that would otherwise have been struck may be avoided.
In addition to fulfil its primary detection role, the radar also provided
information on the presence of objects that may cause problems for the
drilling and subsequent pipe-laying operations. This included the angular
position and distance of objects.
A comprehensive set of requirements was developed by the end-user group of
the consortium at the beginning of ORFEUS, including criteria for detection
distance, minimum detectable object size and resolution.
Fig. 2 – A possible operative situation for the bore-head radar.
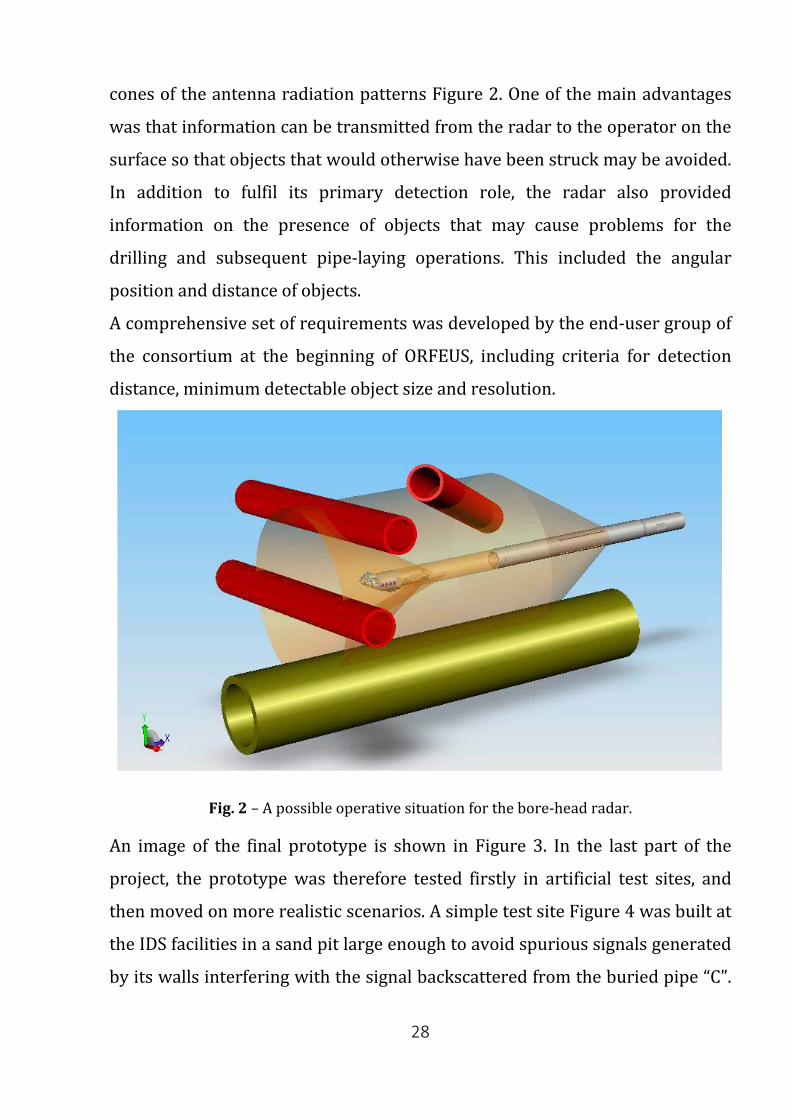
An image of the final prototype is shown in Figure 3. In the last part of the
project, the prototype was therefore tested firstly in artificial test sites, and
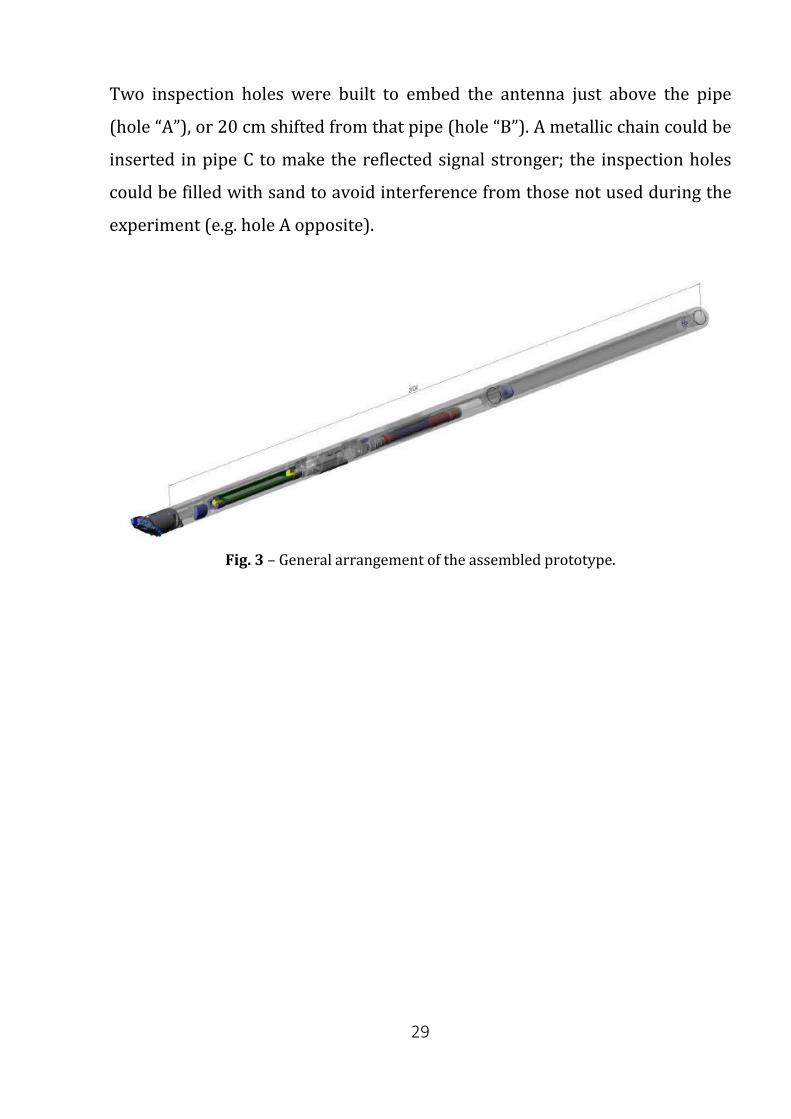
then moved on more realistic scenarios. A simple test site Figure 4 was built at
the IDS facilities in a sand pit large enough to avoid spurious signals generated
by its walls interfering with the signal backscattered from the buried pipe “C”.
29
Two inspection holes were built to embed the antenna just above the pipe
(hole “A”), or 20 cm shifted from that pipe (hole “B”). A metallic chain could be
inserted in pipe C to make the reflected signal stronger; the inspection holes
could be filled with sand to avoid interference from those not used during the
experiment (e.g. hole A opposite).
Fig. 3 – General arrangement of the assembled prototype.
30
Fig. 4 – Artificial test site implemented at IDS.
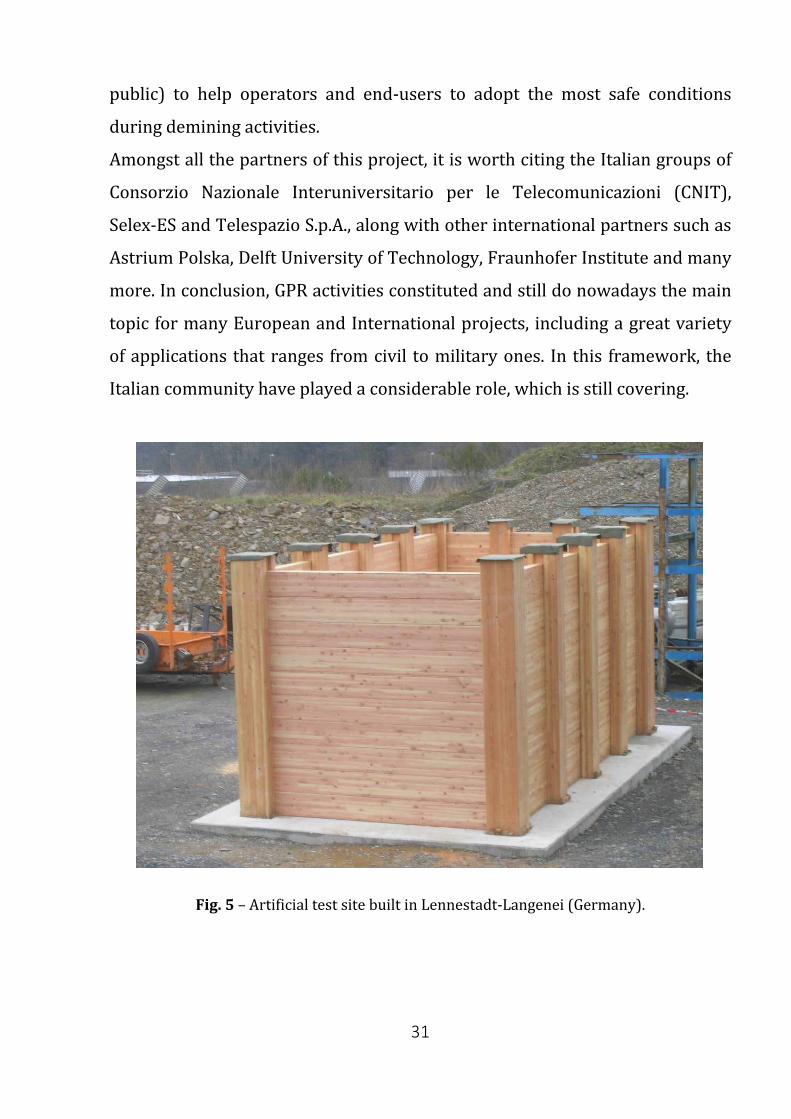
A more sophisticated dedicated test site consisting of a wooden chamber was
built near the facilities of Tracto-Technik in Lennestadt-Langenei Figure 5.
Such chamber enabled to measure the penetration depth in different soils as
well as the performance of the radar in detecting different obstacles of various
size and layout.
Concerning the demining application of GPR, the D-BOX project has been
developed for detecting and deactivating anti-personal landmines and cluster
munitions remaining from armed conflicts [13]. It has started in January 2013
and it is currently ongoing. The aim of such a project consists in the
development of an innovative, low-cost and easy-to-use demining toolbox, that
could be used during all demining activities (from the preparation of the
mission until the elimination of the mines including communication to general
31
public) to help operators and end-users to adopt the most safe conditions
during demining activities.
Amongst all the partners of this project, it is worth citing the Italian groups of
Consorzio Nazionale Interuniversitario per le Telecomunicazioni (CNIT),
Selex-ES and Telespazio S.p.A., along with other international partners such as
Astrium Polska, Delft University of Technology, Fraunhofer Institute and many
more. In conclusion, GPR activities constituted and still do nowadays the main
topic for many European and International projects, including a great variety
of applications that ranges from civil to military ones. In this framework, the
Italian community have played a considerable role, which is still covering.
Fig. 5 – Artificial test site built in Lennestadt-Langenei (Germany).
32
References [1] D. Daniels, 2004, “Ground Penetrating Radar, 2nd Edition”. The Institution of
Engineering and Technology, UK.
[2] L. B. Conyers, D. Goodman, 1997 “Ground Penetrating Radar: An Introduction for
Archaeologists”. Alta Mira Press, Walnut Creek, London and New Delhi.
[3] A. S. Turk, K.A. Hocaoglu, A. A. Vertiy, 2011. “Subsurface Sensing”. John Wiley & Sons
Inc., ISBN: 978-0-470-13388-0.
[4] M. Ambrosanio and V. Pascazio, “A compressive sensing based approach for microwave
tomography and GPR applications”, International Geoscience And Remote Sensing
Symposium, Quebec City, Canada, 2014.
[5] A. Benedetto, G. Manacorda, A. Simi and F. Tosti, “Novel perspectives in bridges
inspection using GPR”, Nondestructive Testing and Evaluation, vol. 27(3), 2012.
[6] A. Ihamouten, G. Villain, and X. Dérobert, “Complex permittivity frequency
variations from multi-offset GPR data: hydraulic concrete characterization”, IEEE
Trans. Instrum. Meas., vol. 61, 6, 2012, pp. 1636-1648.
[7] S. Meschino, L. Pajewski, M. Pastorino, A. Randazzo, and G. Schettini, “Detection of
subsurface metallic utilities by means of a SAP technique: Comparing MUSIC- and
SVM-based approaches,” J. Appl. Geophys., 2013.
[8] Giovanni Alberti, Luca Ciofaniello, Giovanni Galiero, Raffaele Persico, Marco
Sacchettino, Grazia Maria Signore and Sergio Vetrella, “An Italian experience on
stepped frequency GPR”, Ann. of Geophysics, vol. 46, n. 4, pp. 707-717, August 2003.
[9] L. Robinson, W. B. Weirand, L. Yung,“Location and Recognition of Discontinuities in
Dielectric Media Using Synthetic RF Pulses”, Proc IEEE, vol. 62, 1, pp. 36-44, 1974.
[10] G. Alberti, L. Ciofaniello, M. Della Noce, S. Esposito, G. Galiero, R. Persico, and S. Vetrella,
“Advanced stepped frequency GPR development”, Proc. of the Conference on
Subsurface Sensing Technologies and Applications II, at SPIE’s Annual Meeting in
July/August 2000, San Diego, USA.
[11] G. Alberti, L. Ciofaniello, G. Galiero, R. Persico, M. Sacchettino and S. Vetrella, “A stepped
frequency GPR system working both in ungated and gated mode”, Proc. of Workshop
on “Radar a bassa frequenza”, Napoli (Italy), September 2001.
[12] http://cordis.europa.eu/project/rcn/55370_en.html
33
[13] http://www.d-boxproject.eu
2. Outside the academic world, is GPR used in the management of your Country's resources and infrastructure?
The use of GPR for management of resources and infrastructures in Italy is a
well established practice also outside the academic world. In more recent
years, there has been an increasing interest in this geophysical technique, in
large part due to the rapidity of execution and high resolution capability that
modern GPR systems allow. These are key-features to the success of a non-
destructive testing (NDT). Currently, an increasing number of major Italian
companies operating in the civil engineering fields perform GPR surveys
within its own business. The following is an overview of applications and case
study from some of these Italian companies. The ANAS S.p.A. (acronym for
Azienda Nazionale Autonoma delle Strade) is the management authority for
the Italian road and motorway network of national importance. Amongst its
activities, there are studies, research and experimental tests on the
construction materials used for roads. These are carried out mainly at the
experimental center called Centro Sperimentale Stradale (CSS) in Cesano, near
Rome, Italy. Within this framework, it has been developed the so-called
THETIS project, which stands for Thickness Evaluation Technology and
Investigation radar System. THETIS is essentially a GPR system able to
continuously detect the stratigraphy and thickness of the road layers. The
system is equipped with radar antennas with different frequencies that allow
the simultaneous investigation at different depths and with different
resolutions.
The Sirti S.p.A. is a leading Italian company specialized in the design,
implementation and maintenance of large telecommunication networks for
mobile and internet connections as well as energy networks for railway
34
transport, underground railway, roads and motorways. It is well known that
the maintenance of these network infrastructures absorbs huge amounts of
money, also due to the inconveniences and interruptions caused to common
activities. To this purpose, Sirti S.p.A has developed owned solutions that
permit the time/space reduction of network realization limiting community
impact. One of these relies on a GPR-based system capable to minimizing the
costs and timing for scanning the subsurface. The so called S-GPR 3D
(acronym of Sirti Ground Penetrating Radar in 3 dimensions) is a 3D GPR
system developed by Sirti to obtain three-dimensional scans of the subsoil
in real time, without the need for further post-processing of the data [1].
The S-GPR 3D is equipped with two antenna arrays, for overall 12 antennas
per each array, which allow to obtain 3D scans with single pass along only one
direction. Its dedicated software developed by Sirti in collaboration with
Aresys s.r.l. takes advantage of algorithms that are routinely implemented in
seismic reflection data processing [2]. After the standard pre-processing
steps (band-pass filtering, gain, mean removal), the antenna records are
continuously focused during acquisition, by means of Kirchhoff depth-
migration algorithm, to build pre-stack reflection angle gathers while the
migration step is performed using a set of different velocities around the
typical soil velocity (generally 10 cm/ns). The comparison between the
identified targets on different antenna records (i.e. different B scans)
allows to greatly reduce the number of wrong detections and false alarms
(their number has shown to be less than a couple for each kilometer of
acquired data, implying a negligible decrease of overall acquisition
productivity). Moreover, since the S-GPR is equipped with a GPS receiver, once
identified the buried object, this can be directly georeferenced on a CAD map.
All these features allow to implement a reliable subsoil mapping process in
real-time, on a consumer laptop (based on, at least, an Intel Core 2 Duo
35
processor), and without the constrained need of skilled operators. This system
has been successfully tested in-field during the realization of new
infrastructures for optical network deployment in conjunction with new “mini-
trenching” standard, which is characterized by reduced dimensions of digging
(width and depth approximately of 5 cm and 30 cm, respectively). This limited
extent of the area to be investigated was coupled with a multi-antenna GPR
apparatus quite small, with central frequency of 900 MHz and different
polarizations. The results obtained at different working sites showed a
productivity index up to 1 km per hour (that includes the time required to
mark the detected ducts directly on pavement during acquisition). In line with
this, Sineco S.p.A is another important Italian company that makes extensive
use of GPR-based diagnostic systems. It mainly operates in the field of
engineering, with special reference to the NDT control and maintenance
planning of major transport infrastructures. Its main mission is to provide
support to road network operators in the control and surveillance of bridges,
viaducts, galleries road and airport. To provide these services, has been
performing pavement GPR (highway- airports-railways) and tunnel GPR
surveys since more than 20 years ago. Within the framework of pavement
surveys, Sineco S.p.A performs either standard GPR surveys to reconstruct the
pavement structure up to depth of 2-3 meters and/or to detect morphological
irregularities of the interfaces between layers, either signal attenuation
analyses to evaluate the moisture/water accumulation, the presence of porous
areas, density anomalies mapping and detection of inner distress in asphalt
layers. Tunnels GPR survey are performed to locate cortical and/or inner
discontinuities of the concrete (presence of voids, fractures, reinforcement
rebars, steel ribs), to evaluate the thickness of concrete (up to 1 m depth) as
well as the presence of moisture underneath the ground surface. In addition,
Sineco S.p.A performs GPR investigations aimed at defining the state of
36
conservation of reinforced structure in deck bridges. Specific provided service
are the reconstructions of 3D models of bridge deck (layers and rebars
location), assessment of rebars geometry and depth, studies of amplitude
maps of the main reflections surfaces (asphalt-concrete and upper rebars
level) to evaluate anomalies or deteriorations (i.e., identifying metallic
corrosion with weaker reflection). GPR surveys for utilities mapping (pipes,
cables etc.) are also part of its core business. A recent case study on the activity
routinely carried out by Sineco S.p.A., concerns the evaluation of the health
state of a motorway bridge deck located along the A15 Parma–La Spezia
motorway (Emilia Romagna, Italy) [3]. The main purposes of these surveys
were the evaluation of the state of health of the bridge decks of the Rio Vizzana
I bridge and the location of possible damaged areas among the concrete, steel
rebar and asphalt pavement layers. Using a GPR radar system equipped with
two rows of eight double polarized 2GHz antennas (mod. Ris Hi-Bright
manufactured by IDS S.p.A.) the GPR survey of the entire area of the bridge
deck (210 m2, approximately) was performed in about half an hour. After data
processing, the asphalt thickness and reinforcement rebar depth, rebar
geometry, amplitude maps as well as moisture maps were successfully
obtained. Such monitoring allowed to address the best strategy for a
preventive intervention of restoration of the optimal structural conditions.
The Istedil S.p.A (acronym for Istituto Sperimentale per l'Edilizia) is an Italian
company that develops its business in the field of monitoring surveys to assess
and ensure the safety and quality state of civil structures. In doing this, Istedil
S.p.A. routinely performs both 2D and 3D GPR surveys to acquire information
on construction techniques, structural elements, rebars geometry and defects
for both structures of great artistic value (where it is not possible to use
invasive methods) and for civil large infrastructures. Two case studies below
reported illustrate the type of activities carried out in this company [4]. The
37
first one is an example of application to a historic building of the architectural
heritage of Rome (Italy): an eighteenth-century building originated from the
expansion of a fifteenth-century building. Particularly, GPR surveys were
aimed at identifying the structures of two slabs, namely, that of the first floor
used as library, and that constituting the second floor. The acquisition phase
was organized in order to investigate the structures transversely and
longitudinally, using both a 1GHz antenna to investigate in detail the first 1.5
meters, and a 400 MHz antenna to have a global view of the structure. The
obtained 2D radar scans showed characteristic hyperbolic paths within the
first 20 cm in depth, at regular intervals of 80 cm, which were interpreted as
linked joists. Below this upper slab, some voids were identified, especially in
the neighborhood of the perimeter walls where they reached a maximum
thickness of about 35 cm. The second reported case study is an example of a
survey carried out to identify the position and geometry of rebars of a large
complex of civil buildings in Rome (Italy). In order to define of the rebars, the
GPR acquisition has been organized on a mesh of 4.4 m × 3.8 m, with
perpendicular profiles equally the texture spaced of 20 cm. 3D processing
allowed to obtain two depth slides (C scans), respectively at 5 cm and 15 cm,
which showed very clearly the geometry of two distinct meshes of rebar. The C
scan at 5 cm depth showed a mesh of rebars arranged regularly with a pitch of
20 cm. The C scan at 15 cm depth showed a second mesh of rebars composed
in groups of 3 bars with a pitch of 15 cm, which repeated every 60 cm. A zone
with moisture accumulation was also located.
The IDS (Ingegneria Dei Sistemi) S.p.A. georadar division from Pisa (Italy) is
not a company operating in the field of civil engineering. More specifically, it is
a company world leader in designing and providing GPR systems. Anyhow,
within the framework of its research and development activities, the IDS S.p.A.
georadar division has been involved in many kind of GPR surveys. In this
38
regard, one of the most significant and innovative applications is the GPR
survey carried out to support the geotechnical study of the Gorsexio tunnel
along the rail line Genova-Ovada, in Italy. The GPR survey was performed to
study the fractures, stratigraphy and anomaly in the tunnel in order to
evaluate the structure stability and the presence of area with a risk of water
infiltration. Using both 200 MHz and 600 MHz antennas, the contact between
tunnel structure and bedrock as well as the internal transition between two
different layers of bricks were successfully determined along the entire tunnel
structure. Fractures and fractured areas filled with water were also detected.
Another interesting geotechnical GPR application is the study of the fractures
and stratigraphy in a tunnel of limestone quarry located near to Bergamo,
Italy. Using a low-frequency antenna with central frequency of 80 MHz, the
GPR survey allowed to locate a dipping fault and to identify the contact
between the fault and a geological transition. There are also a number of
successful archaeological applications. A GPR survey conducted in Piazza dei
Miracoli, Pisa, with an array of 200 MHz antennas dragged by hand has
allowed to cover an area of 30.000 m2 (total coverage) in one day. This survey
has enabled to discover the presence of underground archaeological
structures. A similar GPR survey was carried out at the Cavallino
Archaeological park of Lecce, Italy, for the detection of buried structures. An
area of 10.000 m2 (total coverage) was covered in one day using a GPR system
towed by a van. The survey allowed to discover the presence of underground
structures. Finally, a very special application has been the GPR survey at the
Pre de Bard Glacier (Valle d’Aosta – Italy) to define the glacier internal
stratigraphy and the possible presence of erratic stones and/or crevasse. This
special need was addressed using a 100 MHz antenna dragged by a helicopter.
Finally, it is worth mentioning the large number of small Italian companies
providing geophysical services which regularly perform GPR investigations
39
throughout Italy for civil engineering, archaeological and environmental
studies. The large number of applications and case studies in which they are
currently involved, give a clear evidence of the continuing and widespread
demand for GPR surveys within the Italian contest.
References [1] Cottino E. and Di Buono N., A complete enabling solution for FTTx network
infrastructure, Proceedings of 58th International Wire & Cable and Connectivity
Symposium, Charlotte, North Carolina, USA, 2009.
[2] Molteni D., Mazzuchelli E., Cottino E. and Di Buono N., Real-time 3D GPR data processing
for automated detection of buried services, Proceedings of 30° GNGTS Convegno
Nazionale Gruppo Nazionale Geofisica Terra Solida, Trieste, 14-17 November 2011.
[3] Conti M., Use of Ground Penetrating Radar to evaluate the state of health of a motorway
bridge deck, available at http://www.gruppo-sina.it/, 2012.
[4] Cassioli D., Marchetti D., Olini F., Orlandi O., Seri R. and Spina S., Esempi Di applicazione
GPR (Ground Penetrating Radar) su beni architettonici e grandi complessi di edilizia
civile e industriale nel centro Italia, Proceedings of 13° Congress AIPnD (Associazione
Italiana Prove non Distruttive), Roma, 15-17 October 2009.
3. Do you have national guidelines, rules or protocols that can/have to be followed during GPR surveys?
The Italian body of laws and rules tackles the GPR applications only under
an indirect and partial approach.
• At the national level, it is worth citing the law 109/94 (art. 16-17-19-20)
[1] concerning the whole regulation of Public Works. In these articles, the
need for geognostic surveys in civil preliminary projects is introduced,
along with the possibility of subcontracting this activity to more
specialized companies.
40
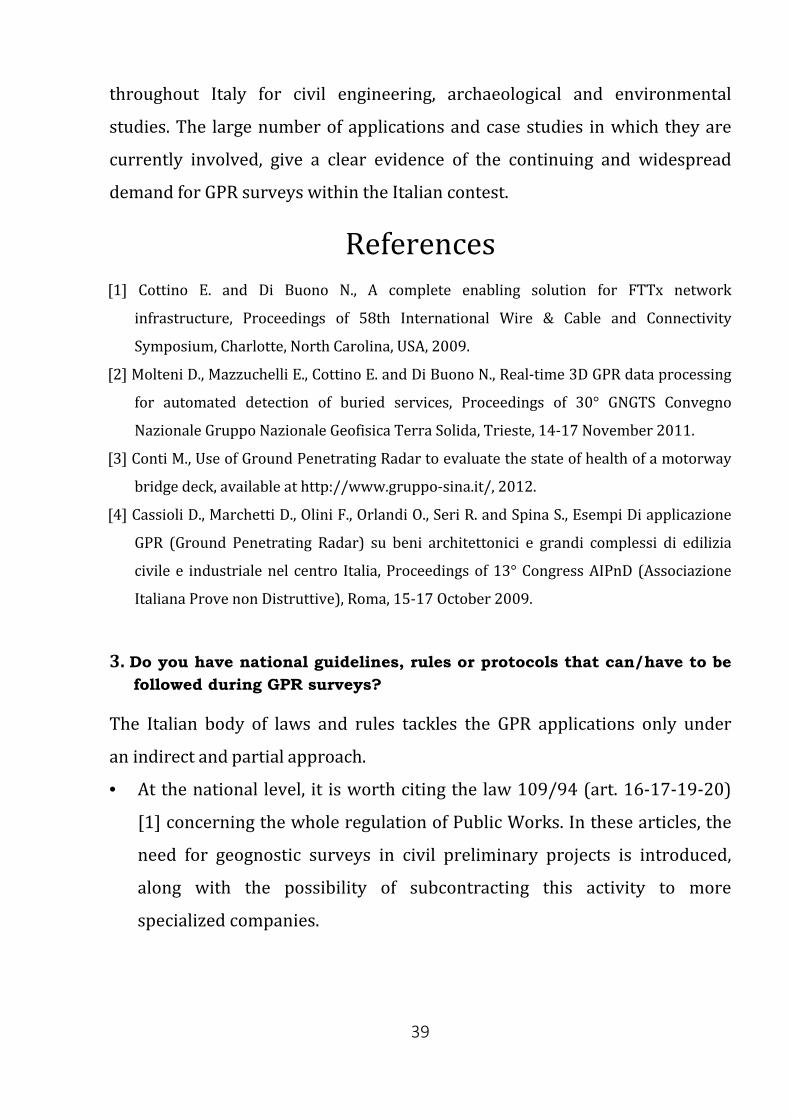
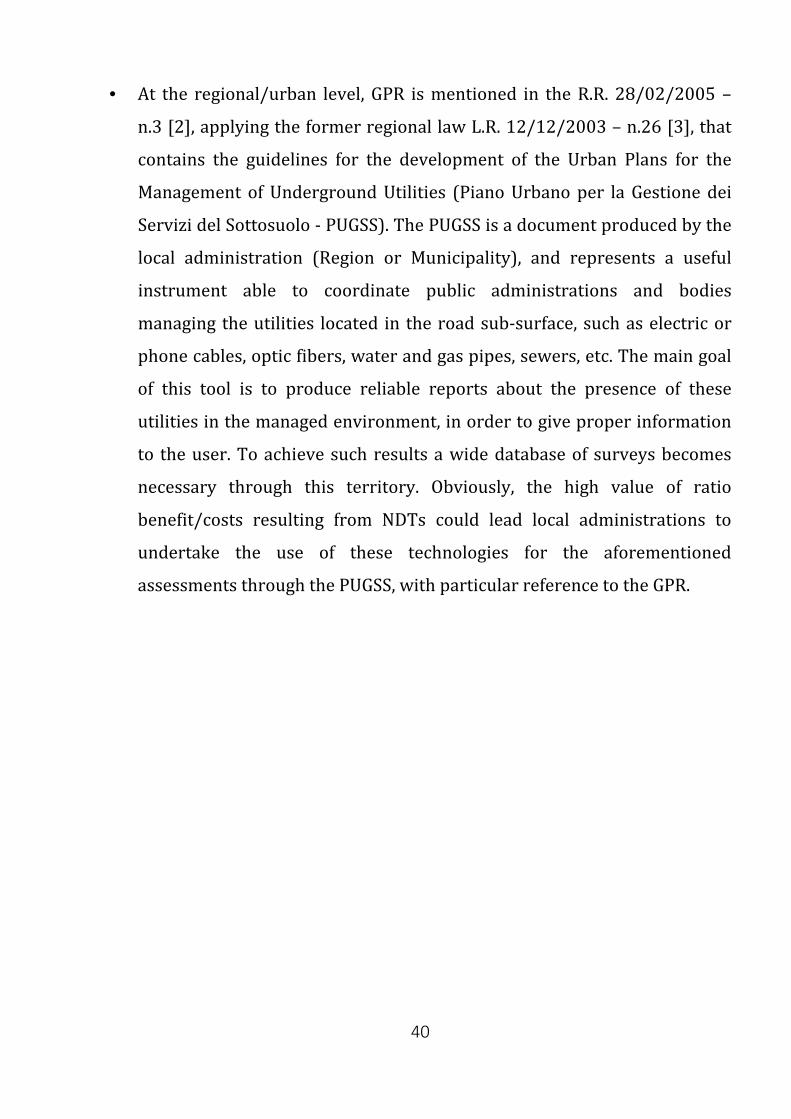
• At the regional/urban level, GPR is mentioned in the R.R. 28/02/2005 –
n.3 [2], applying the former regional law L.R. 12/12/2003 – n.26 [3], that
contains the guidelines for the development of the Urban Plans for the
Management of Underground Utilities (Piano Urbano per la Gestione dei
Servizi del Sottosuolo - PUGSS). The PUGSS is a document produced by the
local administration (Region or Municipality), and represents a useful
instrument able to coordinate public administrations and bodies
managing the utilities located in the road sub-surface, such as electric or
phone cables, optic fibers, water and gas pipes, sewers, etc. The main goal
of this tool is to produce reliable reports about the presence of these
utilities in the managed environment, in order to give proper information
to the user. To achieve such results a wide database of surveys becomes
necessary through this territory. Obviously, the high value of ratio
benefit/costs resulting from NDTs could lead local administrations to
undertake the use of these technologies for the aforementioned
assessments through the PUGSS, with particular reference to the GPR.
41
Fig. 6 – Phone – Internet cables network (PUGSS City of Milan).
• The main international reference, more technically speaking, is
represented by the American Society for Testing and Materials
International (ASTM International). This quality assurance body directly
approaches GPR thematic through two different issues:
• ASTM D 4748-98 [4]: this guide by ASTM illustrates a test method
covering the nondestructive determination of the thickness of the bound-
layers in road pavements, i.e. the upper layers of a pavement made of
bituminous or concrete materials, through the utilization of a short-pulse
42
radar equipment. The report focuses on the functioning principles of a
short-pulse radar, and on the test equipment configuration, then faces
more technical topics such as calibration and standardization, procedures,
calculation, and reliability of results. In this document, it is also
emphasized the importance of safety issues in GPR testing activities, since
every radar apparatus involves a potential microwave radiation hazard.
• ASTM D 6432-99 [5]: this guideline concerns equipment, field procedures
and data-interpretation for the electromagnetic evaluation of subsurface
materials using the GPR method. The method illustrated can be used in
geologic, engineering, hydrologic and environmental applications.
Equipment configuration and parameters being measured are presented
and then a table of representative values for different materials is shown.
The method limitation are hence properly explained. Lastly, the test
procedure is presented in details, and involves the following steps: (i)
qualification of personnel, (ii) planning the survey, (iii) selection of the
approach, (iv) survey design, (v) survey implementation, (vi) quality
control, (vii) interpretation of GPR Data, (viii) interpretation of results and
(ix) data processing.
• Although a general lack of normative technical protocols is shown by the
Italian normative framework, the aims of the aforementioned guides have
been gathered and exploited in a national guideline, even if concerning the
only utilities-detection activities. An executive work in this field, indeed,
can be considered well-developed and compliant to the standards of
quality, if the prescription contained in the guidelines package CEI 306-8
[6], emitted by Italian Electro- technical Committee in 2004, are properly
followed.
• The CEI regulation, as mentioned, concerns the utilization of GPR
technology in the field of infrastructural activities, with the aim of
43
detecting the underground utilities for avoiding any possible damage and
consequent time and money-loss. In this fields, moreover, the regulations
illustrate the possibility of using GPR with the goal of determining the
lithological characterization of the surveyed soil, which define its drilling
attitude. This document aims to properly define (i) the correct test-
performance modality, (ii) the right results interpretation, (iii) the
equipment characterization and (iv) the minimum requested standards for
the surveys.
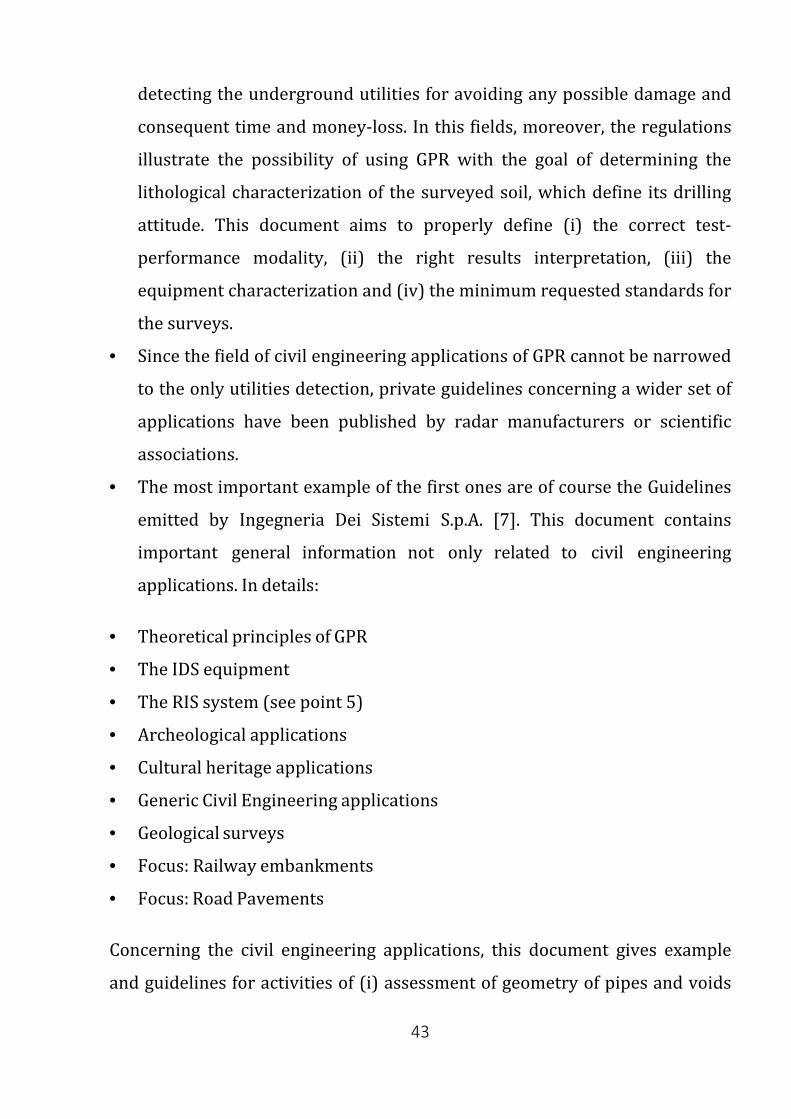
• Since the field of civil engineering applications of GPR cannot be narrowed
to the only utilities detection, private guidelines concerning a wider set of
applications have been published by radar manufacturers or scientific
associations.
• The most important example of the first ones are of course the Guidelines
emitted by Ingegneria Dei Sistemi S.p.A. [7]. This document contains
important general information not only related to civil engineering
applications. In details:
• Theoretical principles of GPR
• The IDS equipment
• The RIS system (see point 5)
• Archeological applications
• Cultural heritage applications
• Generic Civil Engineering applications
• Geological surveys
• Focus: Railway embankments
• Focus: Road Pavements
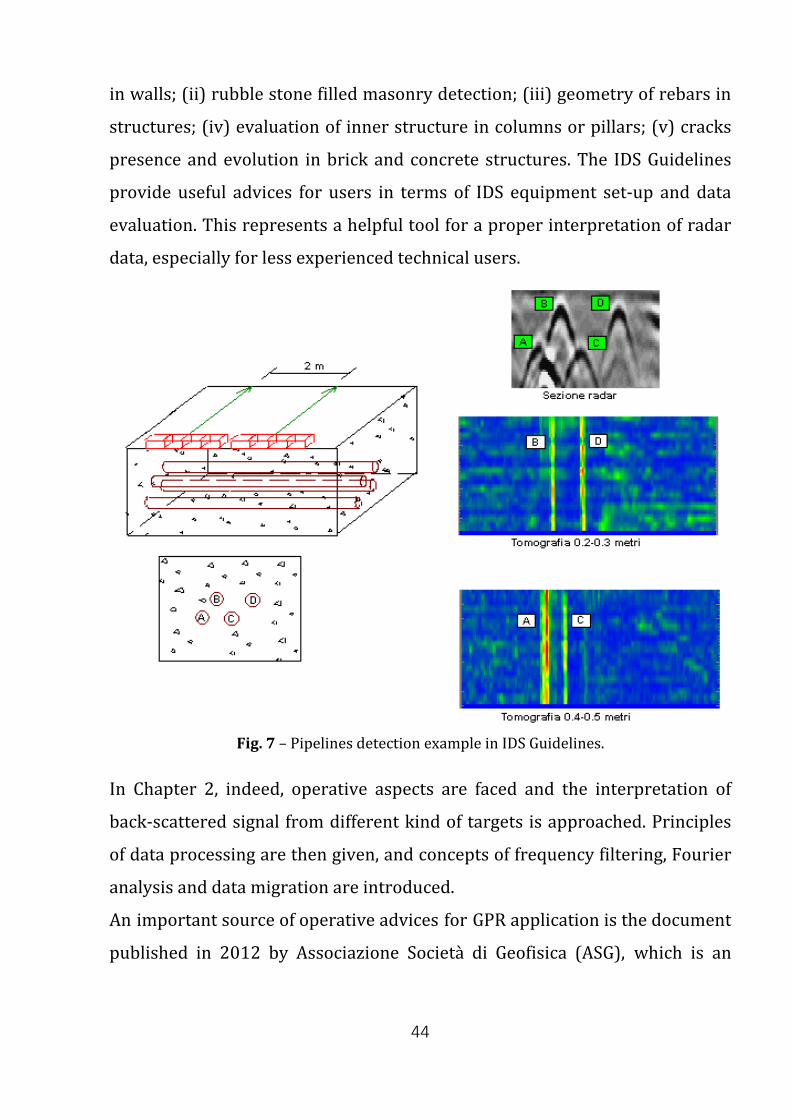
Concerning the civil engineering applications, this document gives example
and guidelines for activities of (i) assessment of geometry of pipes and voids
44
in walls; (ii) rubble stone filled masonry detection; (iii) geometry of rebars in
structures; (iv) evaluation of inner structure in columns or pillars; (v) cracks
presence and evolution in brick and concrete structures. The IDS Guidelines
provide useful advices for users in terms of IDS equipment set-up and data
evaluation. This represents a helpful tool for a proper interpretation of radar
data, especially for less experienced technical users.
Fig. 7 – Pipelines detection example in IDS Guidelines.
In Chapter 2, indeed, operative aspects are faced and the interpretation of
back-scattered signal from different kind of targets is approached. Principles
of data processing are then given, and concepts of frequency filtering, Fourier
analysis and data migration are introduced.
An important source of operative advices for GPR application is the document
published in 2012 by Associazione Società di Geofisica (ASG), which is an
45
association involving many companies operating in the geophysics fields [8].
This Report contains a very wide set of prescription about sub-surface
surveys, such as (i) seismic assessments, (ii) electrical explorations, (iii)
Georadar evaluations and (iv) electro-magnetic surveys. Lastly, a semi–non-
destructive approach is herein faced (coring). Particularly concerning the
GPR, helpful information are given about the principles of the tool
functioning and about the theoretical background. The most common
central-frequencies are presented in dependence on the requested survey and
then a common GPR-equipment is characterized. A very useful chapter is the
one concerning the tool calibration (i.e., Chapter 3) which could lead, if
wrongly developed, to an improper data interpretation. Principles of data
processing are given and the concept of filtering is explained. More in detail,
relevant filters like Horizontal High Pass (HHPF), Horizontal Low Pass
(HLPF), Band Pass (BPF), Background removal, Notch and Flattering filters
are briefly introduced.
Summarizing the state of the art of the regulation concerning the
aforementioned GPR activities, laws and regulations in which this kind of
surveys are provided were firstly presented. In this context, the role of the
municipal administration is becoming increasingly important, due to some
strategic plans called PUGSS, through which the mapping of utilities networks
in urban field can be more easily managed. After having introduced the most
known international references, the only officially recognized regulation in
the narrowed field of buried utilities detection was then presented. Lastly,
two guidelines regarding the whole set of civil engineering application of GPR
were reported, developed by private manufacturers or professional
association.
46
References [1] D.L. February 11st 1994, n. 109, concerning: “Legge quadro in materia di lavori
pubblici”.
[2] R.R. February 28th 2005, n.3, concerning: “Criteri guida per la redazione del PUGSS
comunale”.
[3] L.R. December 12nd 2003, n.26, concerning: “Disciplina dei servizi locali di interesse
economico generale”.
[4] ASTM D 4748-98: Standard Test Method for Determining the Thickness of Bound
Pavement Layers Using Short-Pulse Radar, American Society for Testing and Materials,
1998.
[5] ASTM D 6432-99: Standard Guide for Using the Surface Ground Penetrating Radar
Method for Subsurface Investigation, American Society for Testing and Materials, 1999.
[6] CEI 306-8, Impiego del radar per introspezione del suolo per prospezioni ad opera di
posa di servizi ed infrastrutture sotterranee, Comitato Elettrotecnico Italiano, 2004.
[7] Linee Guida: La tecnologia IDS nel settore GEORADAR, IDS Ingegneria Dei Sistem S.p.A.
[8] Linee Guida per indagini geofisiche, Associazione Società di Geofisica, 2012.
4. In your opinion, how could a wider and more effective use of the GPR technique be promoted in your Country?
Ground-penetrating radar (GPR) uses a high-frequency (e.g. 40 MHz to 1500
MHz) EM pulse transmitted from a radar antenna to probe the subsurface. The
transmitted radar pulses are reflected from various interfaces within the
ground, and this return is detected by the radar receiver. Reflecting interfaces
may be soil horizons, the groundwater surface, soil/rock interfaces, man-made
objects, or any other interface having a contrast in dielectric properties. The
dielectric properties of materials correlate with many of the mechanical and
geologic parameters of materials. The objective of GPR surveys is to map near-
surface interfaces at high resolution. Resolution and depth of investigation
depends on the antenna frequency used in the survey: the lower the

47
frequency of the antenna, the greater the depth of investigation but the
lower the resolution.
GPR covers a wide range of applications, such as the monitoring urban and
rural roads, highways, bridges, tunnels and the detection of underground
cavities and voids. It is also used for performing quality checks of
reinforced concrete in existing works, for analysing geological structures,
for mapping soil properties, and for characterizing materials under a
geotechnical perspective, such as for the design of structural foundations. In
addition, one of the most widespread applications of GPR concerns the
detection of buried structures such as pipelines, electrical cables, gas and
water pipes.
Combined with other geophysical techniques it can provide useful
information about many features of the subsurface. Given the broad range of
applications, the promotion of the technique can bring undoubtedly a huge
benefit to the community.
Why should you use the GPR?
First of all, it represents an effective, non-destructive and non-invasive
technique. Moreover, GPR surveys are carried out rapidly, and large areas can
be covered in a short time.
The planning of the work is undoubtedly a key point of a project and
sometimes this feature is overlooked, both at the design stage that during its
development.
Who can benefit more from the use of this technique?
Public authorities (regions, provinces, municipalities, public service
managers), constructors, police agencies, institutions of land protection,
industries, citizens can benefit from the use of GPR.
48
How to promote the GPR?
All the stakeholders such as manufacturers of the test equipment, software
developers, geophysical researchers, public authorities, public organizations,
geologists) should be involved to promote GPR.
They should encourage the use of GPR and show the usefulness of this
technique, for its ability to detect targets and to solve problems. Public service
managers should be aware of the importance of a continuous monitoring of
the plumbing in water distribution, gas, electric energy.
If a leak is effectively detected, it is possible to act locally, repairing the rift,
saving money and lowering the social costs for the community.
Constructors and designer should duly consider geophysical features of the
subsurface in order to properly design the building foundation. In particular,
cavities, joints, fractures, loosely compacted layers, filling materials, localized
anomalies must be carefully taken into account. At the same time, a careful
monitoring of the structure is important during the life cycle of a building to
repair possible fractures and damages and to ensure safety conditions for
safeguarding people's life.
GPR is relatively easy to use although, as all the other geophysical techniques,
it requires suitable levels of both experience and expertise to do it effectively
and without any improvisation.
All the work steps should be done properly, from a suitable set-up for field
activity, types of antennas, proper signal acquisition, signal processing,
modeling, cartographic representation of the maps, final interpretation and
finally editing the report. Particularly, the GPR modeling is a complex problem
and requires an accurate calibration procedure, combining observed data
with a-priori known characteristics of the soil. A great effort is required to
manufacturers of the test equipment, software developers, geophysical
researchers, universities, public organizations to work in cooperation, in
49
order to update constantly the community about the development of this
technique. In addition, a wide exchange of knowledge and experience about
different scientific-technical GPR-based techniques in various applications is
required, in order to highlight the strengths and limitations of current GPR
systems. Meetings, workshops, training courses should be regularly organized
in order to clarify the effectiveness and the progress beyond the state of the
art of this technique, to transfer research activities, to disseminate the results
of the last research activities, to detail study cases.
Software developers should be encouraged to develop open source tools and
share them amongst the GPR community.
Researchers from different field of applications that use GPR should regularly
follow training courses in order to enhance the quality of their work.
An interesting example of cooperation between the stakeholders is provided
by EuroGPR http://www.eurogpr.org/joomla/, an association made up of
users and manufacturers of GPR equipment, intent on raising standards
within the GPR industry and looking out for the rights of our members, giving
them voice at a pan-european level on matters such as licensing, health and
safety and market access.
5. Do you have GPR manufacturers in your Country? Which systems they produce?
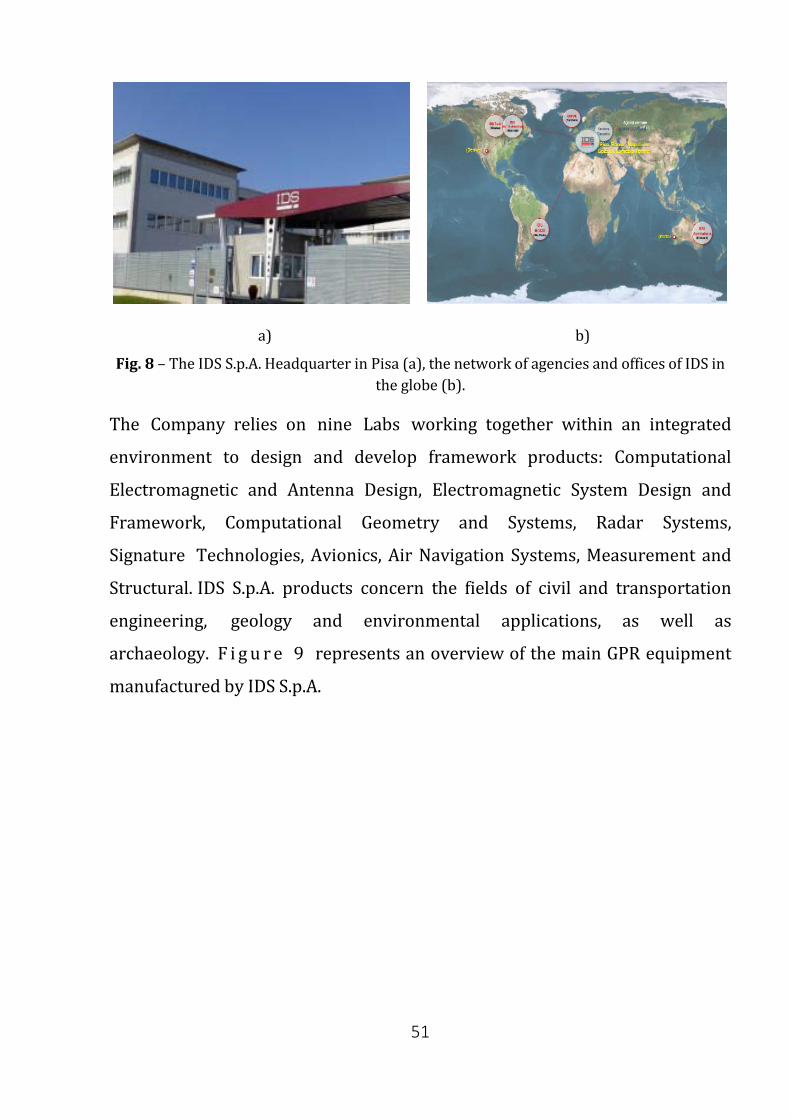
In Italy, IDS Ingegneria dei Sistemi S.p.A., Pisa, Italy, is no doubt the most
important GPR manufacturer, Figure 8a.
IDS S.p.A. was founded in 1980, and has over 30 years’ experience in
delivering innovative technologies and providing engineering solutions for
different applications in the field of Earth sciences and beyond. Basically, it
includes many divisions, namely, naval, aeronautical, air navigation,
georadar, as well as a military department.
50
In 1999, the IDS began the worldwide commercialization of GPR products,
especially concerning the manufacturing of multi-frequency and multi-
channel array systems, thereby paving the way for becoming one of the leader
companies in this field, and improving, amongst others, utilities detection
performances of different GPR systems. In 2007, IDS S.p.A. has introduced on
the market the first Ground-Based interferometric SAR IBIS.
The network offices in Italy are the following, each one with specific division:
• Pisa: Headquarters
• Roma: Air Navigation Division
• Napoli: Firmware development
• La Spezia: Ship Technological Mast design
• Lamezia Terme: Special materials for wind farms to mitigate their impact
on air navigation.
Nowadays the IDS has become a multi-national company with a network of
agencies and offices strategically placed not only in Italy, but also in
European Countries (i.e., UK), and worldwide (i.e., North America, Brazil
and Australia Figure 8b).
IDS S.p.A. has established and well-documented activities in the GPR
products, since it has been investing more than 20% of its turnover in
research and development programmers.
51
a) b) Fig. 8 – The IDS S.p.A. Headquarter in Pisa (a), the network of agencies and offices of IDS in
the globe (b).
The Company relies on nine Labs working together within an integrated
environment to design and develop framework products: Computational
Electromagnetic and Antenna Design, Electromagnetic System Design and
Framework, Computational Geometry and Systems, Radar Systems,
Signature Technologies, Avionics, Air Navigation Systems, Measurement and
Structural. IDS S.p.A. products concern the fields of civil and transportation
engineering, geology and environmental applications, as well as
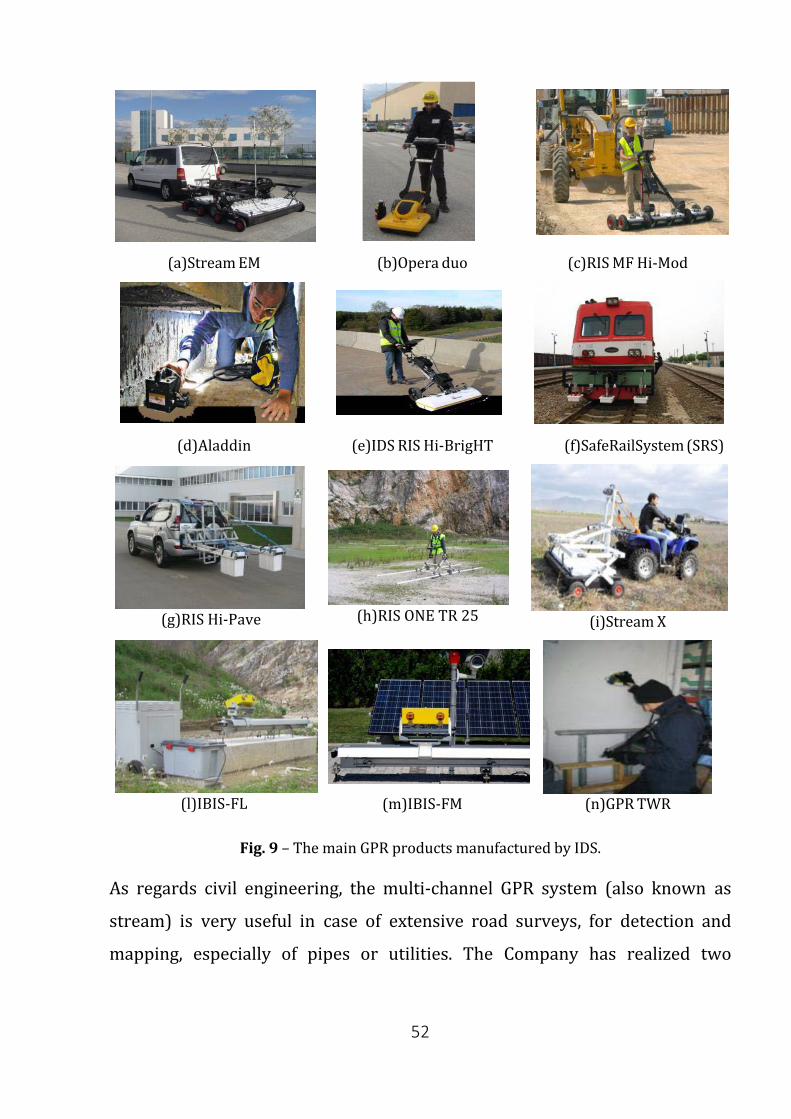
archaeology. F i g u r e 9 represents an overview of the main GPR equipment
manufactured by IDS S.p.A.
52
(a)Stream EM (b)Opera duo (c)RIS MF Hi-Mod
(d)Aladdin (e)IDS RIS Hi-BrigHT (f)SafeRailSystem (SRS)
(g)RIS Hi-Pave (h)RIS ONE TR 25 (i)Stream X
(l)IBIS-FL
(m)IBIS-FM (n)GPR TWR
Fig. 9 – The main GPR products manufactured by IDS.
As regards civil engineering, the multi-channel GPR system (also known as
stream) is very useful in case of extensive road surveys, for detection and
mapping, especially of pipes or utilities. The Company has realized two
53
different types of multi-channel GPR: one of these is used for civil engineering
applications, namely, the stream EM; the second one, i.e., the stream X, is used
instead for archaeological surveys.
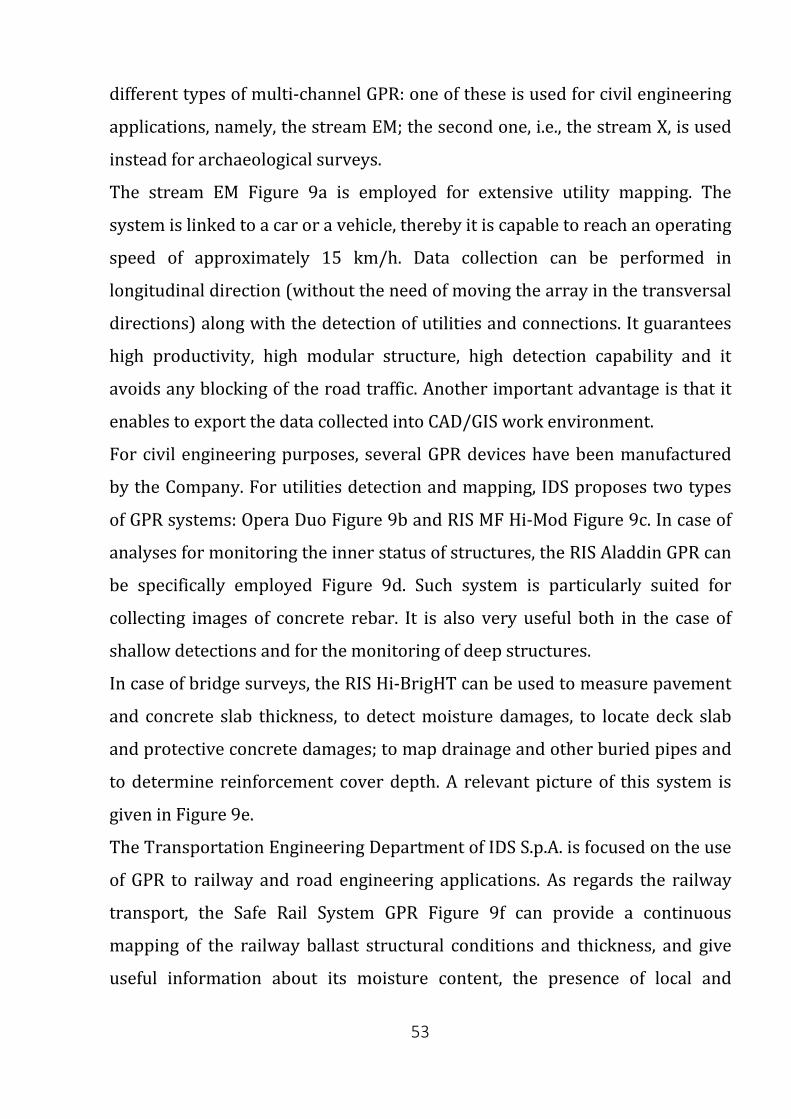
The stream EM Figure 9a is employed for extensive utility mapping. The
system is linked to a car or a vehicle, thereby it is capable to reach an operating
speed of approximately 15 km/h. Data collection can be performed in
longitudinal direction (without the need of moving the array in the transversal
directions) along with the detection of utilities and connections. It guarantees
high productivity, high modular structure, high detection capability and it
avoids any blocking of the road traffic. Another important advantage is that it
enables to export the data collected into CAD/GIS work environment.
For civil engineering purposes, several GPR devices have been manufactured
by the Company. For utilities detection and mapping, IDS proposes two types
of GPR systems: Opera Duo Figure 9b and RIS MF Hi-Mod Figure 9c. In case of
analyses for monitoring the inner status of structures, the RIS Aladdin GPR can
be specifically employed Figure 9d. Such system is particularly suited for
collecting images of concrete rebar. It is also very useful both in the case of
shallow detections and for the monitoring of deep structures.
In case of bridge surveys, the RIS Hi-BrigHT can be used to measure pavement
and concrete slab thickness, to detect moisture damages, to locate deck slab
and protective concrete damages; to map drainage and other buried pipes and
to determine reinforcement cover depth. A relevant picture of this system is
given in Figure 9e.
The Transportation Engineering Department of IDS S.p.A. is focused on the use
of GPR to railway and road engineering applications. As regards the railway
transport, the Safe Rail System GPR Figure 9f can provide a continuous
mapping of the railway ballast structural conditions and thickness, and give
useful information about its moisture content, the presence of local and
54
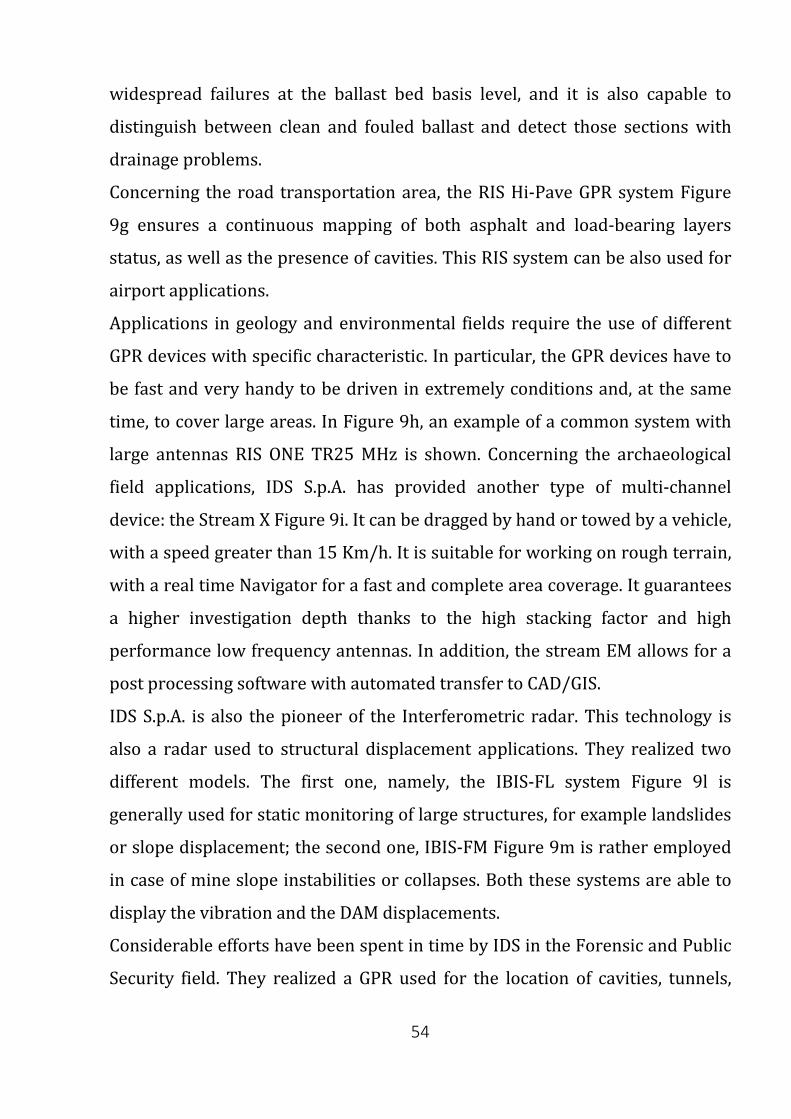
widespread failures at the ballast bed basis level, and it is also capable to
distinguish between clean and fouled ballast and detect those sections with
drainage problems.
Concerning the road transportation area, the RIS Hi-Pave GPR system Figure
9g ensures a continuous mapping of both asphalt and load-bearing layers
status, as well as the presence of cavities. This RIS system can be also used for
airport applications.
Applications in geology and environmental fields require the use of different
GPR devices with specific characteristic. In particular, the GPR devices have to
be fast and very handy to be driven in extremely conditions and, at the same
time, to cover large areas. In Figure 9h, an example of a common system with
large antennas RIS ONE TR25 MHz is shown. Concerning the archaeological
field applications, IDS S.p.A. has provided another type of multi-channel
device: the Stream X Figure 9i. It can be dragged by hand or towed by a vehicle,
with a speed greater than 15 Km/h. It is suitable for working on rough terrain,
with a real time Navigator for a fast and complete area coverage. It guarantees
a higher investigation depth thanks to the high stacking factor and high
performance low frequency antennas. In addition, the stream EM allows for a
post processing software with automated transfer to CAD/GIS.
IDS S.p.A. is also the pioneer of the Interferometric radar. This technology is
also a radar used to structural displacement applications. They realized two
different models. The first one, namely, the IBIS-FL system Figure 9l is
generally used for static monitoring of large structures, for example landslides
or slope displacement; the second one, IBIS-FM Figure 9m is rather employed
in case of mine slope instabilities or collapses. Both these systems are able to
display the vibration and the DAM displacements.
Considerable efforts have been spent in time by IDS in the Forensic and Public
Security field. They realized a GPR used for the location of cavities, tunnels,
55
buried bodies and a new generation of GPR TWR (Through Wall Radar) Figure
9n for the detection of people behind walls, very useful for military issues.
6. Do you have GPR test sites in your Country?
Although there is a lively research movement concerning the use of GPR in
Italy, the amount of test sites is still meager, to the best of the authors’
knowledge. We can recognize two test sites used for archaeological
researches, located in Frosinone [1] and Pescate [2]. The first one enabled
researchers to achieve a wide knowledge of the use of GPR technology in
archaeological applications, while the second was mainly employed to study
ancient buried structures.
The test site of Ispra [3], in Northern Italy, was used for military scopes, within
the framework of a European research project concerning the detection of
anti-personnel mines. Overall, the main test site built up for training GPR-
based research in civil engineering activities was realized at the University of
Salento, Lecce Figures 10 and 11. The test site area is located inside the
University Campus, about 4 kilometers from the city center. The campus
coasts the Lecce-Monteroni route, and has a dimension of about 2000 m2.
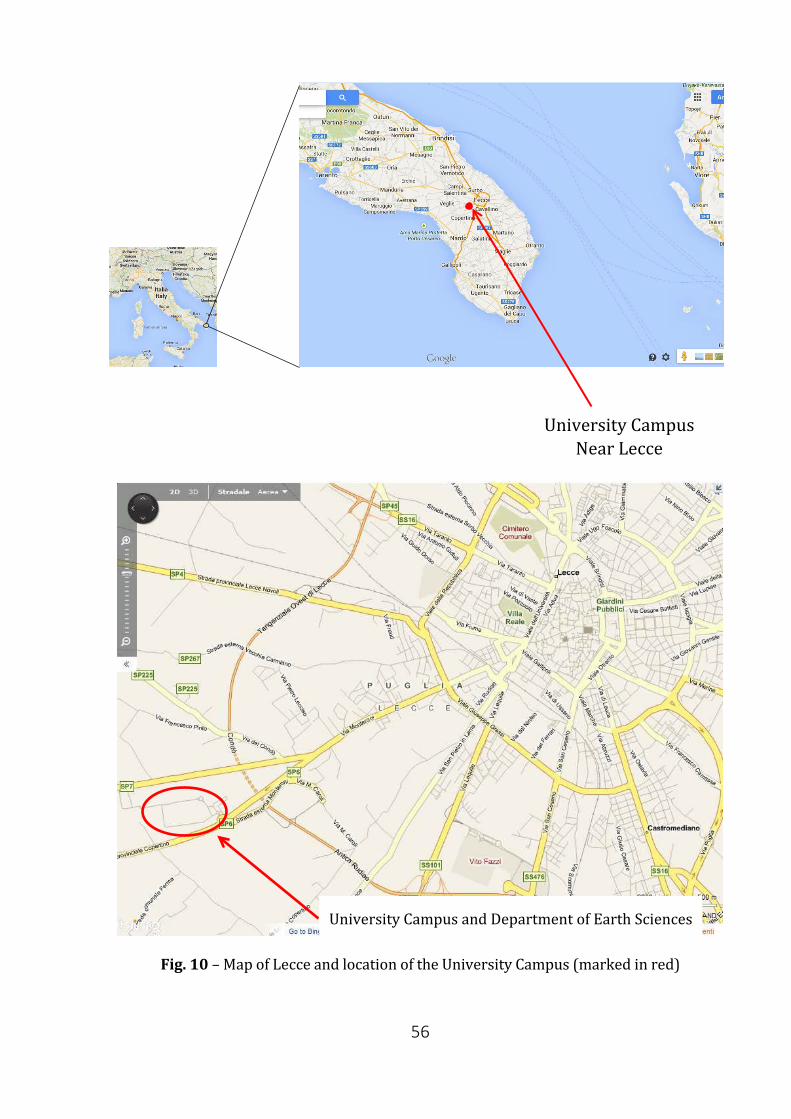
56
Fig. 10 – Map of Lecce and location of the University Campus (marked in red)
University Campus Near Lecce
University Campus and Department of Earth Sciences
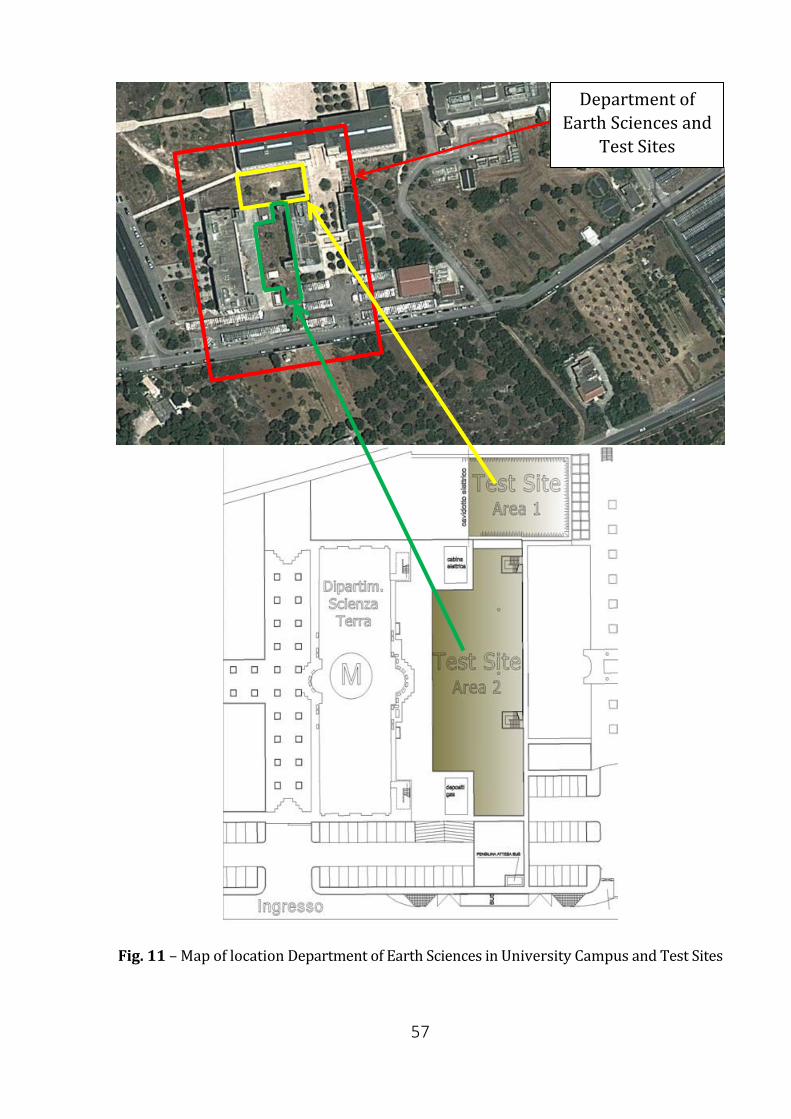
57
Fig. 11 – Map of location Department of Earth Sciences in University Campus and Test Sites
Department of Earth Sciences and
Test Sites
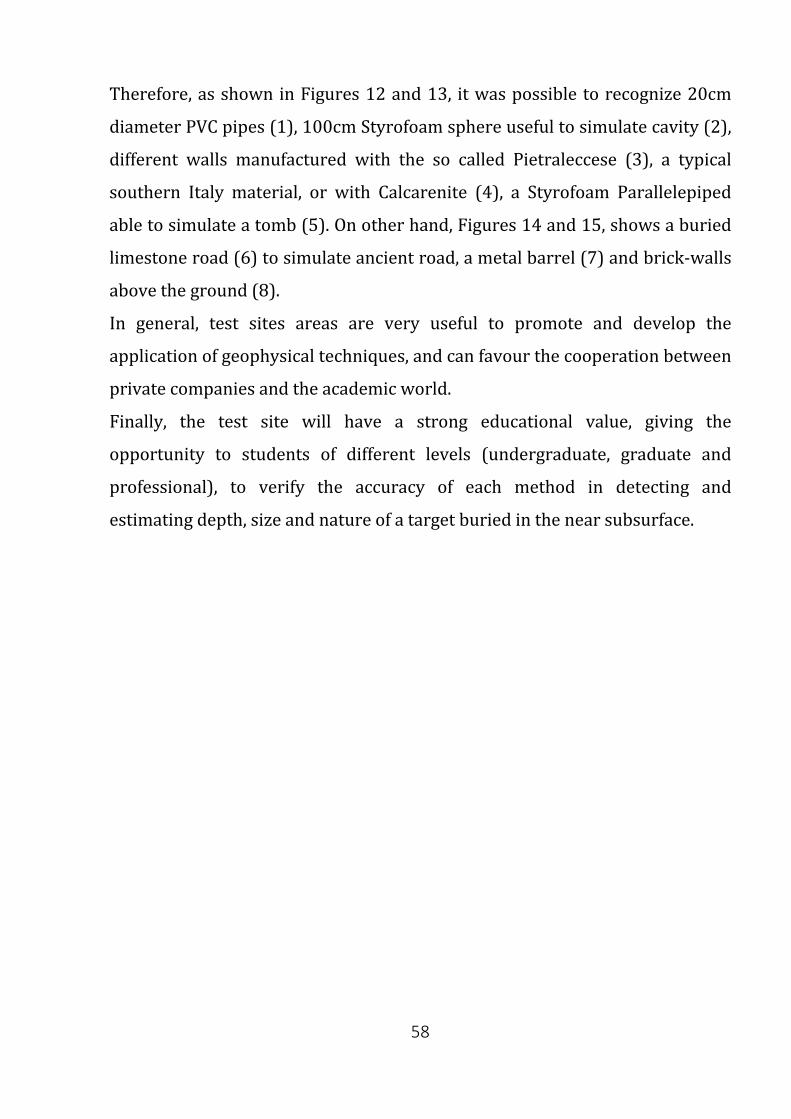
58
Therefore, as shown in Figures 12 and 13, it was possible to recognize 20cm
diameter PVC pipes (1), 100cm Styrofoam sphere useful to simulate cavity (2),
different walls manufactured with the so called Pietraleccese (3), a typical
southern Italy material, or with Calcarenite (4), a Styrofoam Parallelepiped
able to simulate a tomb (5). On other hand, Figures 14 and 15, shows a buried
limestone road (6) to simulate ancient road, a metal barrel (7) and brick-walls
above the ground (8).
In general, test sites areas are very useful to promote and develop the
application of geophysical techniques, and can favour the cooperation between
private companies and the academic world.
Finally, the test site will have a strong educational value, giving the
opportunity to students of different levels (undergraduate, graduate and
professional), to verify the accuracy of each method in detecting and
estimating depth, size and nature of a target buried in the near subsurface.
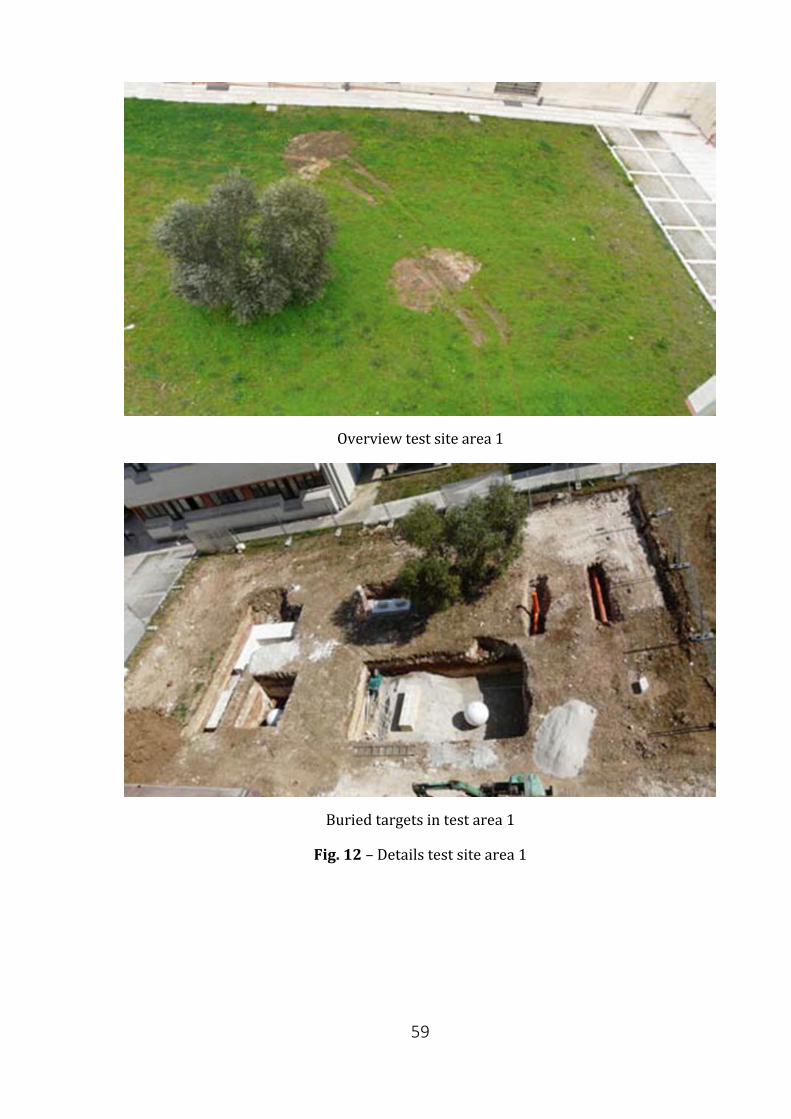
59
Overview test site area 1
Buried targets in test area 1
Fig. 12 – Details test site area 1
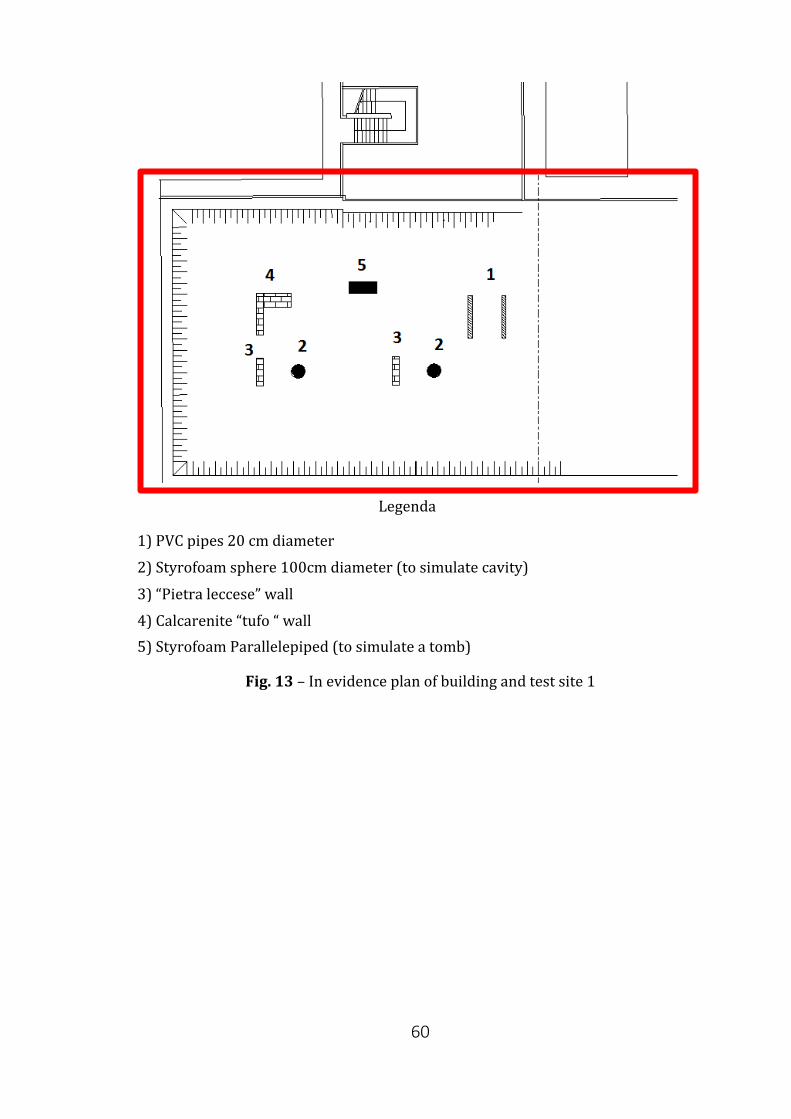
60
Legenda
1) PVC pipes 20 cm diameter
2) Styrofoam sphere 100cm diameter (to simulate cavity)
3) “Pietra leccese” wall
4) Calcarenite “tufo “ wall 5) Styrofoam Parallelepiped (to simulate a tomb)
Fig. 13 – In evidence plan of building and test site 1
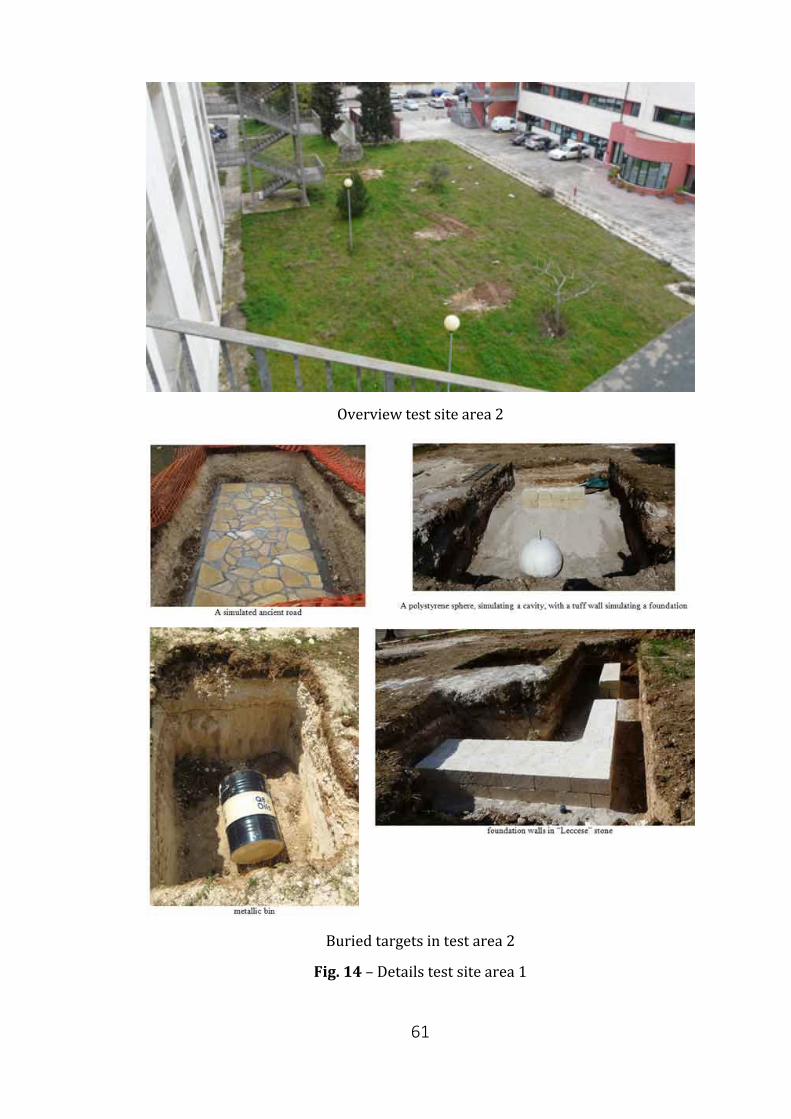
61
Overview test site area 2
Buried targets in test area 2
Fig. 14 – Details test site area 1
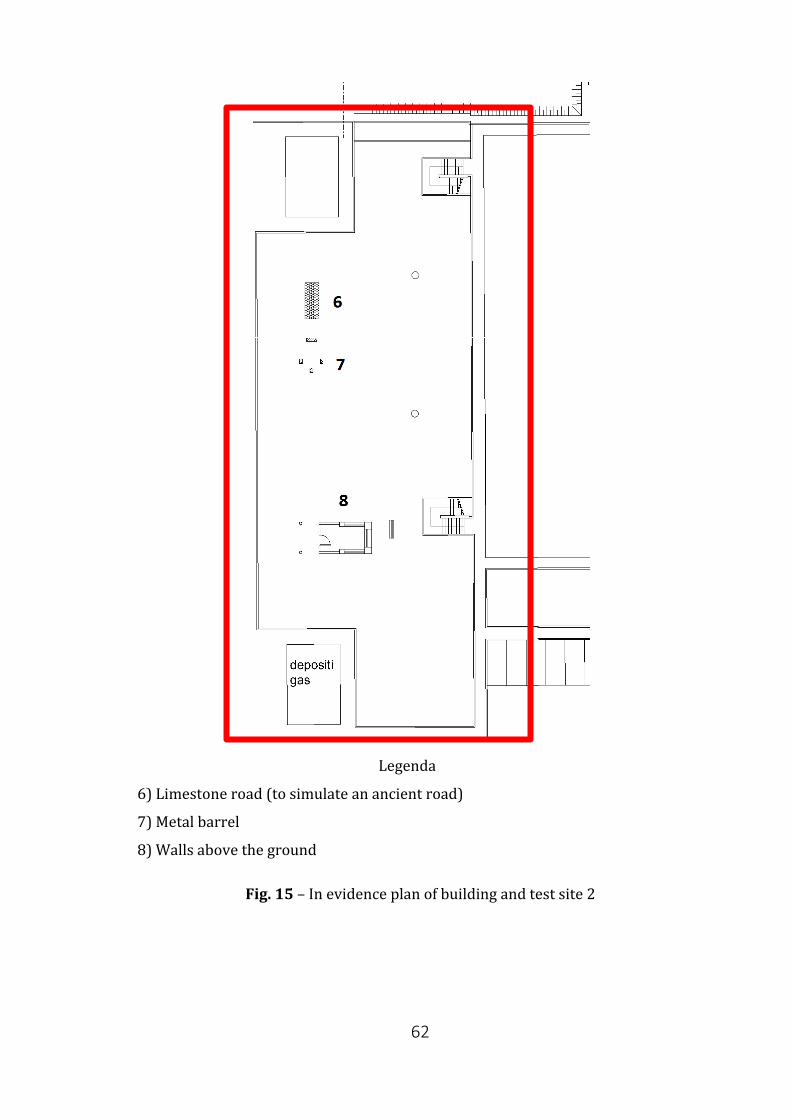
62
Legenda
6) Limestone road (to simulate an ancient road)
7) Metal barrel
8) Walls above the ground
Fig. 15 – In evidence plan of building and test site 2
63
The test site was opened during the XIII International Conference “GPR 2010”,
held on June 2010. It is composed of two main areas. In order to simulate
archaeological and urban subsurface scenarios, several objects and targets
made by different materials and geometries, manmade and natural, have been
buried. Moreover, small walls of buildings with different types of
constructions, both ancient and modern, have been also built. The main goal of
the test site is to offer to the manufacturing companies the opportunity to
acquire radar data on such targets and to show to the scientific community as
well as to the customers about the potential of their own systems [4]. The test
site is also available for testing new or existing geophysical instruments and
verify their target detection capability, both in terms of data acquisition
strategy and signal processing effectiveness. Different objects were buried in
both test site areas to simulate civil engineering and archaeological targets.
References [1] Goodman D., Piro S., GPR remote sensing in Archeology, Geotechnologies and the
environment, 2013.
[2] Lualdi M., Zanzi L., GPR investigation to reconstruct the geometry of the wooden
structures in historical buildings, Proceedings of Ninth International Conference on
Ground Penetrating Radar, 2002.
[3] HOPE project, Development of anti-personnel mines, Joint Research Centre (JRC), 2001.
[4] Negri S., Quarta T. A. M., Ground Penetrating Radar survey for civil-engineering
applications: results from the test site, Proceedings of 14th onference on Ground
Penetrating Radar (GPR), Shanghai, China, June 4-8, 2012.
7. Which are the most interesting university courses and training activities involving GPR?
At the moment, the most interesting training activities in Italy involving GPR
are:
64
• The COST Action TU1208 co-organized, jointly with Action TD1301
“Development of a European-based Collaborative Network to Accelerate
Technological, Clinical and Commercialization Progress in the Area of
Medical Microwave Imaging” and with the European School of Antennas, a
Training School on “Microwave Imaging and Diagnostics: Theory,
Techniques, Applications.”
• The training school “Civil Engineering Applications of Ground Penetrating
Radar” held in Italy took place at the School of Engineering of the
University of Pisa. The Training school has been organized within the
framework of the COST Action TU1208, chaired by Dr. Lara Pajewski.
• 33rd EARSeL Symposium 3-5 June 2013 - Matera, ESA Course on Remote
Sensing Applications for the Study and Observation of Archaeological sites
in the framework of the 4th EARSeL Workshop on Cultural and Natural
Heritage. 3 - 5 June 2013 - Matera, Italy.
Several courses on GPR are held by Scientific Faculties in many Italian
Universities. In each of these faculties, the GPR methodology is taught in
specific courses from both a theoretical and a practical approach, taking
into account also different applications according to the main curricula of the
degree course in the relevant scientific faculty.
The most interesting University courses are organized by Roma Tre
University, University of Genoa, the Second University of Naples, Politecnico
di Milano, University Mediterranea of Reggio Calabria, University of Pisa,
University of Siena, University of Basilicata, University of Bari and by the
University of Messina.
65
Inside the Roma Tre University there are several courses involving the
GPR technology, for example the “Laboratory of microwave antennas” within
the faculty of Electrical Engineering. This course provides theoretical and
practical elements for the experimental characterization of microwave
circuits and antennas. It also offers an introduction to the use of GPR and of
electromagnetic simulation software, as well as some elements for
electromagnetic subsurface investigations and diagnostic facilities with
ground penetrating radar techniques. Another course is “GPR Signal
processing-Ground penetrating radar (GPR) signal processing” organized by
the Applied Electronics Section of the Department of Engineering of the
University Roma Tre non-destructive technique, currently performed by
many agencies involved in the road management, which results particularly
promising for interpreting soil characteristics.
Inside the University of Genoa and in the Departments of Marine
Engineering, Electrical, Electronic and Telecommunications (DITEN) the
course “ADVANCED ANTENNA ENGINEERING” is taught. It concerns an
introduction to the most relevant theoretical and algorithmic aspects of the
modern microwave imaging approaches. The Microwave Imaging is a practical
resource for engineers, scientists, researchers, and professors in the fields of
civil and industrial engineering, nondestructive testing and evaluation,
geophysical prospecting, and biomedical engineering.
In the Second University of Naples within the Department of Industrial
Engineering and Information there are the courses of “Microwave Engineering
and RADAR” and “Biomedical Imaging”. This course aims to provide students
with an updated overview on the different methods of characterizing Imaging
Radar applications and in particular on Biomedical diagnostics. At the
Department of Civil and Environmental Engineering of the “Politecnico di
66
Milano” the course “Laboratory of Geology and Applied Geophysics” is given.
To cite a few amongst the topics covered, the non-destructive detection of civil
engineering structures with the Ultrasound techniques and the Ground
Penetrating Radar methodology is faced.
The Engineering Faculty of the University Mediterranea of Reggio Calabria, in
collaboration with the Institute of the National Research Council Irea organizes
the course of Electromagnetic Diagnostics. Such course aims at providing basic
knowledge about the electromagnetic diagnostics in the “near field” and in the
“far field” conditions, including techniques and applications. Through the study
of the mechanisms of interaction between electromagnetic waves and the
natural environment, the course provides the necessary tools to analyze and
formulate an application problem of electromagnetic diagnostics and identify
appropriate methods of solution.
The University of Pisa, within the Faculty of Engineering, organizes the course
of “Non-destructive analysis of works of civil engineering with Ultrasound
techniques and Ground Penetrating Radar.” In addition, the degree course of
EXPLORATION AND APPLIED GEOPHYSICS contains the course of
Geomorphology Radar which aims to provide students with the basic
principles of operation of the Ground Penetrating Radar (GPR), data
processing techniques and applications in the main geo-morphological
environments. The course regards also the practical use of the GPR and the
data processing.
The University of Siena within the CGT-Center for GeoTechnologies, organizes
several annual Short Course:
• “The Use of GPR for electromagnetic survey in archaeological contexts
(GPRA)”: the course includes an introduction to electromagnetic methods,
with particular attention to the theoretical principles that rule the
operation of GPR and its use in archaeological environments. The central
67
part of the course is dedicated to some investigation campaigns in which
participants have the opportunity to plan and carry out a survey using a
GPR geophysical methodology in an archaeological site with the aim to
identify the anthropogenic buried elements. In addition, the course is
focused on providing a general knowledge of the theory behind ground
penetrating radar, including some information on data processing and
interpretation, using specific software that are made available to all the
participants.
• Free Short Lecture GPR Methodologies 1 (PCGPR). The course on GPR
Methodologies is dedicated at investigating the use of GPR in urban areas,
as well as in geological and archaeological sites. The practical approach
that characterizes this course offers new incentives for increasing the
interest of the participants, and it is aimed at attracting especially the
professional world wherein a continuous update on both the methods and
the instruments of investigation is strictly required.
• Methods of Prospecting with Penetrating Radar. The main aim of this
course is to provide the knowledge necessary for the correct use of the
GPR in different environments, with particular focus at the study of
shallow depth subsurface (geology, archaeology, civil and environmental
engineering).
The University of Messina organizes the Master Course of “Diagnostics Town
& Country, the GPR method.” Such course regards the general equations of
the electric and magnetic field, the propagation velocity, the
electromagnetic properties of the medium, the waves propagation in a
dispersive medium, the parameters that affect the electromagnetic waves
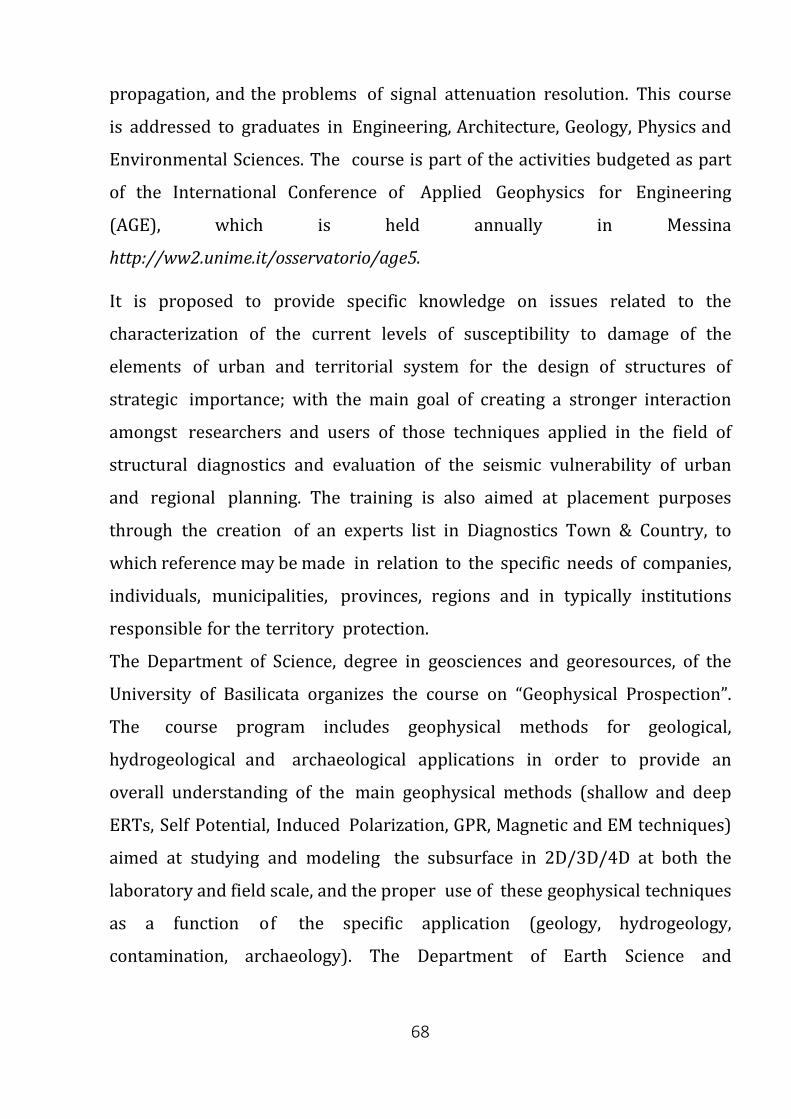
68
propagation, and the problems of signal attenuation resolution. This course
is addressed to graduates in Engineering, Architecture, Geology, Physics and
Environmental Sciences. The course is part of the activities budgeted as part
of the International Conference of Applied Geophysics for Engineering
(AGE), which is held annually in Messina
http://ww2.unime.it/osservatorio/age5.
It is proposed to provide specific knowledge on issues related to the
characterization of the current levels of susceptibility to damage of the
elements of urban and territorial system for the design of structures of
strategic importance; with the main goal of creating a stronger interaction
amongst researchers and users of those techniques applied in the field of
structural diagnostics and evaluation of the seismic vulnerability of urban
and regional planning. The training is also aimed at placement purposes
through the creation of an experts list in Diagnostics Town & Country, to
which reference may be made in relation to the specific needs of companies,
individuals, municipalities, provinces, regions and in typically institutions
responsible for the territory protection.
The Department of Science, degree in geosciences and georesources, of the
University of Basilicata organizes the course on “Geophysical Prospection”.
The course program includes geophysical methods for geological,
hydrogeological and archaeological applications in order to provide an
overall understanding of the main geophysical methods (shallow and deep
ERTs, Self Potential, Induced Polarization, GPR, Magnetic and EM techniques)
aimed at studying and modeling the subsurface in 2D/3D/4D at both the
laboratory and field scale, and the proper use of these geophysical techniques
as a function of the specific application (geology, hydrogeology,
contamination, archaeology). The Department of Earth Science and
69
Geoenvironmental of the University of Bari “Aldo Moro”, organizes the course
on “Geophysical Prospection”. The course regards geophysical methods for
geological and hydrogeological applications.
In addition to the above University courses, some professional orders and
sector companies, such as the Italian Geological Society regularly organize
training school for the spreading of the GPR technique and its integration
with other geophysical technologies. These courses are dedicated to students
and professionals in the field of geosciences and engineering.
Amongst them, the "Course of GPR in the areas Geological Survey, Structural
and Environmental", organized frequently by Novatest Srl is a 32-hour course
aimed at providing information on the main survey methods, instrumentation
and main features, applications in the construction industry, the technical
rules of construction NTC2008, on the contribution of GPR to the study of
geological problems, of structural and environmental, of road applications etc..
In addition, GeoSed organized a school last year, within the section of Geology
Stratigraphy and Sedimentology in an annual convention, on GPR in Alghero at
the Department of Architecture.
The school was mainly addressed to graduated students and fellows, GeoSed
Association and Geological Italian Society Members. The purpose of the school
was to provide basic knowledge on the operation and the processing of a radar
system.
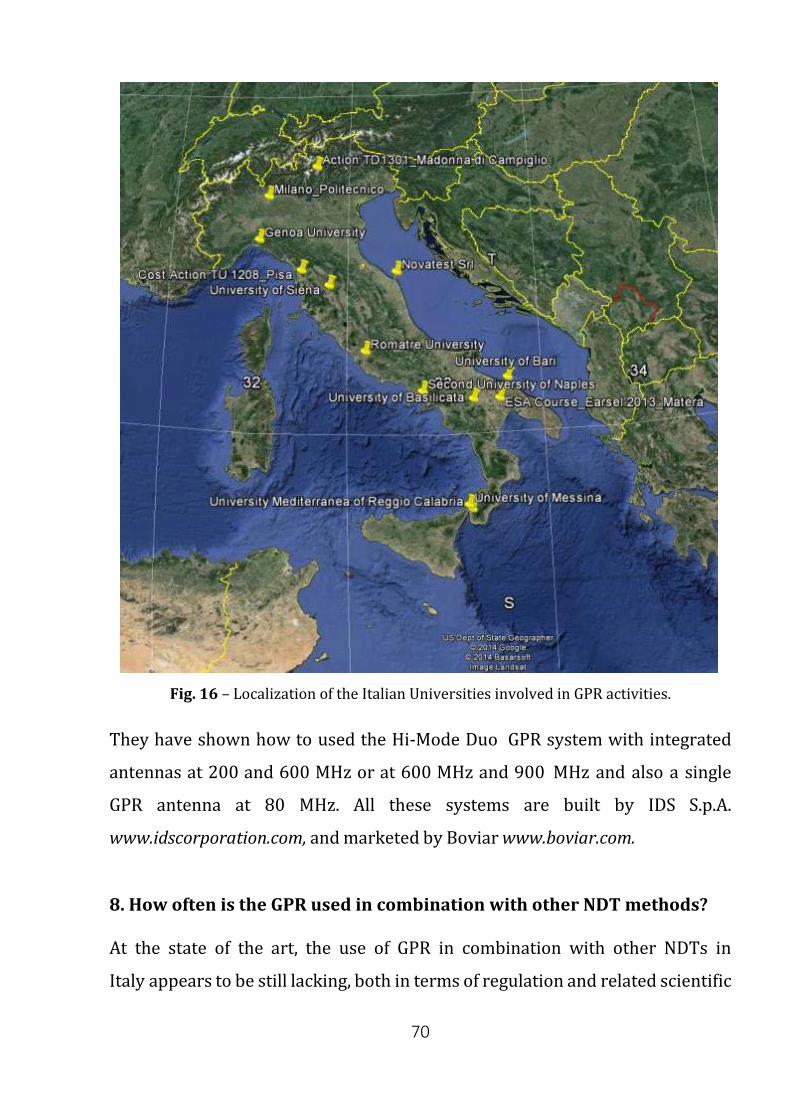
70
Fig. 16 – Localization of the Italian Universities involved in GPR activities.
They have shown how to used the Hi-Mode Duo GPR system with integrated
antennas at 200 and 600 MHz or at 600 MHz and 900 MHz and also a single
GPR antenna at 80 MHz. All these systems are built by IDS S.p.A.
www.idscorporation.com, and marketed by Boviar www.boviar.com.
8. How often is the GPR used in combination with other NDT methods?
At the state of the art, the use of GPR in combination with other NDTs in
Italy appears to be still lacking, both in terms of regulation and related scientific
71
works. Nevertheless, it is possible to identify some works concerning the
coupling of GPR and Light Falling Weight Deflectometer (LFWD), in order to
infer information about the mechanical properties of soils as a function of
their electromagnetic properties evaluated through radar systems.
Such scientific approach was mainly tackled in Italy by the University of Roma
Tre, and was aimed at evaluating the mechanical response of transport
infrastructures pavements with a high productivity.
Benedetto and Tosti [1] investigated the relationship between the dielectric
and strength properties of unbound materials. Basically, they assume that
dielectric properties of materials are related to their bulk densities
therefore, since it is known that mechanical characteristics of soils depend
on particles interaction, dielectrics of materials can be somehow related to
their mechanical properties.
GPR tests were performed both at the laboratory and field scale using
ground-coupled radar systems. The goal of the study was indeed to assess
the bearing ratio of soils in Runway Safety Areas (RSAs), in airport
environment.
Light Falling Weight Deflectometer was used for validating the procedure
through in-situ measurements. In addition, laboratory tests for CBR
evaluation were performed. Field tests took place at the Roma-Urbe
Airport in Rome, Italy. A vehicle of the Fire Department was preliminarily
used to simulate runway overruns of an aircraft in the RSA surface, defined
as the surface at the lateral boundary of the runway required to reduce the
risk of damage in case of landing or takeoff overruns.
GPR measurements were carried out along two trajectories of possible
overrunning. The procedure was validated through CBR tests and twenty-
nine LFWD measurements Figures 17 (a - c) were performed every 10 m
alongside the considered trajectory. Therefore, a promising empirical
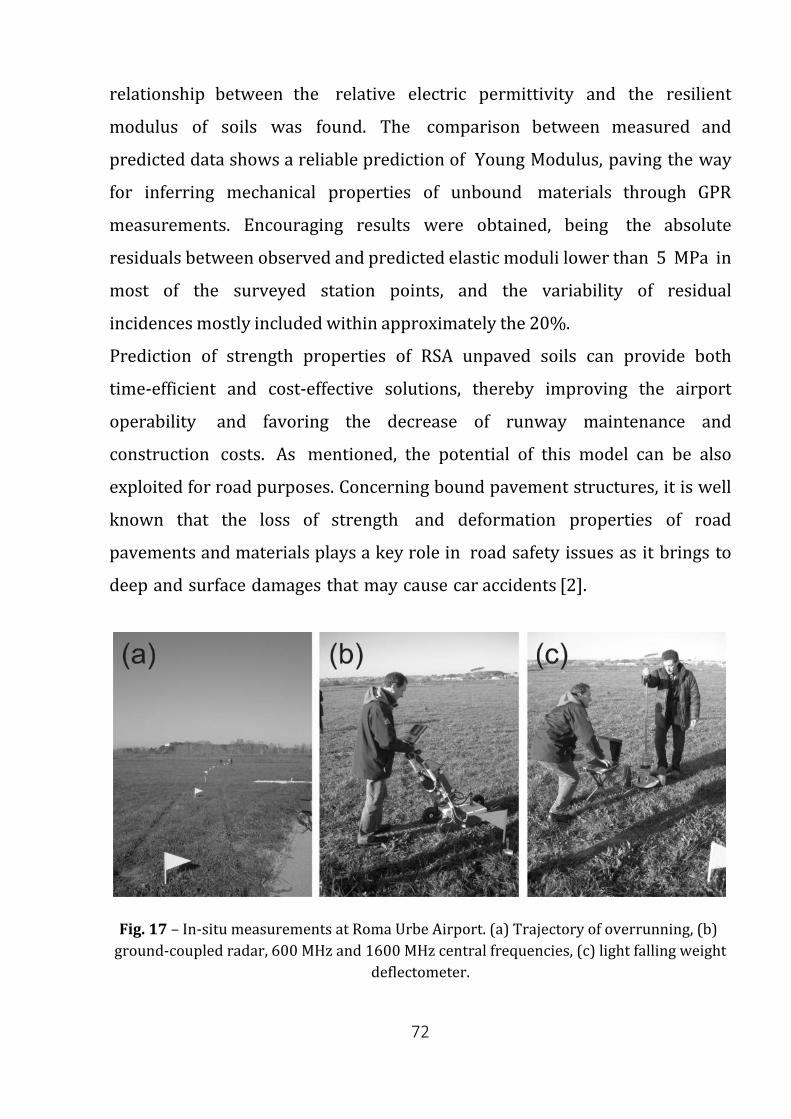
72
relationship between the relative electric permittivity and the resilient
modulus of soils was found. The comparison between measured and
predicted data shows a reliable prediction of Young Modulus, paving the way
for inferring mechanical properties of unbound materials through GPR
measurements. Encouraging results were obtained, being the absolute
residuals between observed and predicted elastic moduli lower than 5 MPa in
most of the surveyed station points, and the variability of residual
incidences mostly included within approximately the 20%.
Prediction of strength properties of RSA unpaved soils can provide both
time-efficient and cost-effective solutions, thereby improving the airport
operability and favoring the decrease of runway maintenance and
construction costs. As mentioned, the potential of this model can be also
exploited for road purposes. Concerning bound pavement structures, it is well
known that the loss of strength and deformation properties of road
pavements and materials plays a key role in road safety issues as it brings to
deep and surface damages that may cause car accidents [2].
Fig. 17 – In-situ measurements at Roma Urbe Airport. (a) Trajectory of overrunning, (b) ground-coupled radar, 600 MHz and 1600 MHz central frequencies, (c) light falling weight
deflectometer.
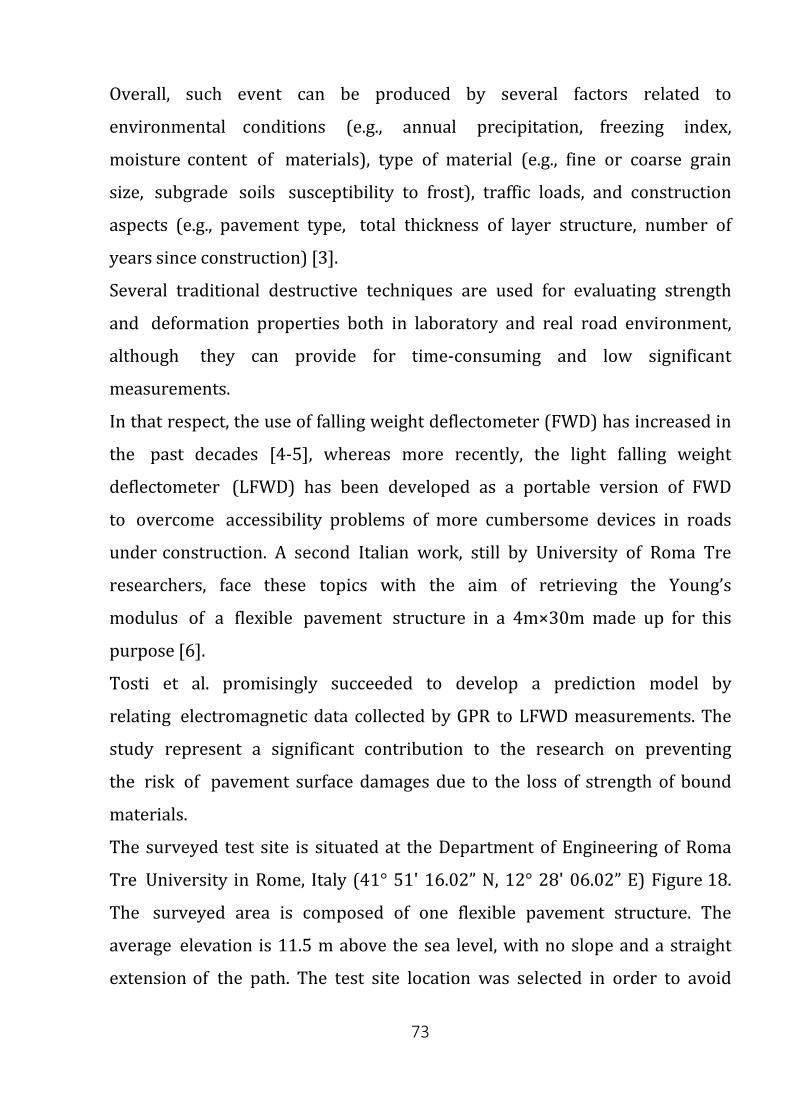
73
Overall, such event can be produced by several factors related to
environmental conditions (e.g., annual precipitation, freezing index,
moisture content of materials), type of material (e.g., fine or coarse grain
size, subgrade soils susceptibility to frost), traffic loads, and construction
aspects (e.g., pavement type, total thickness of layer structure, number of
years since construction) [3].
Several traditional destructive techniques are used for evaluating strength
and deformation properties both in laboratory and real road environment,
although they can provide for time-consuming and low significant
measurements.
In that respect, the use of falling weight deflectometer (FWD) has increased in
the past decades [4-5], whereas more recently, the light falling weight
deflectometer (LFWD) has been developed as a portable version of FWD
to overcome accessibility problems of more cumbersome devices in roads
under construction. A second Italian work, still by University of Roma Tre
researchers, face these topics with the aim of retrieving the Young’s
modulus of a flexible pavement structure in a 4m×30m made up for this
purpose [6].
Tosti et al. promisingly succeeded to develop a prediction model by
relating electromagnetic data collected by GPR to LFWD measurements. The
study represent a significant contribution to the research on preventing
the risk of pavement surface damages due to the loss of strength of bound
materials.
The surveyed test site is situated at the Department of Engineering of Roma
Tre University in Rome, Italy (41° 51' 16.02” N, 12° 28' 06.02” E) Figure 18.
The surveyed area is composed of one flexible pavement structure. The
average elevation is 11.5 m above the sea level, with no slope and a straight
extension of the path. The test site location was selected in order to avoid
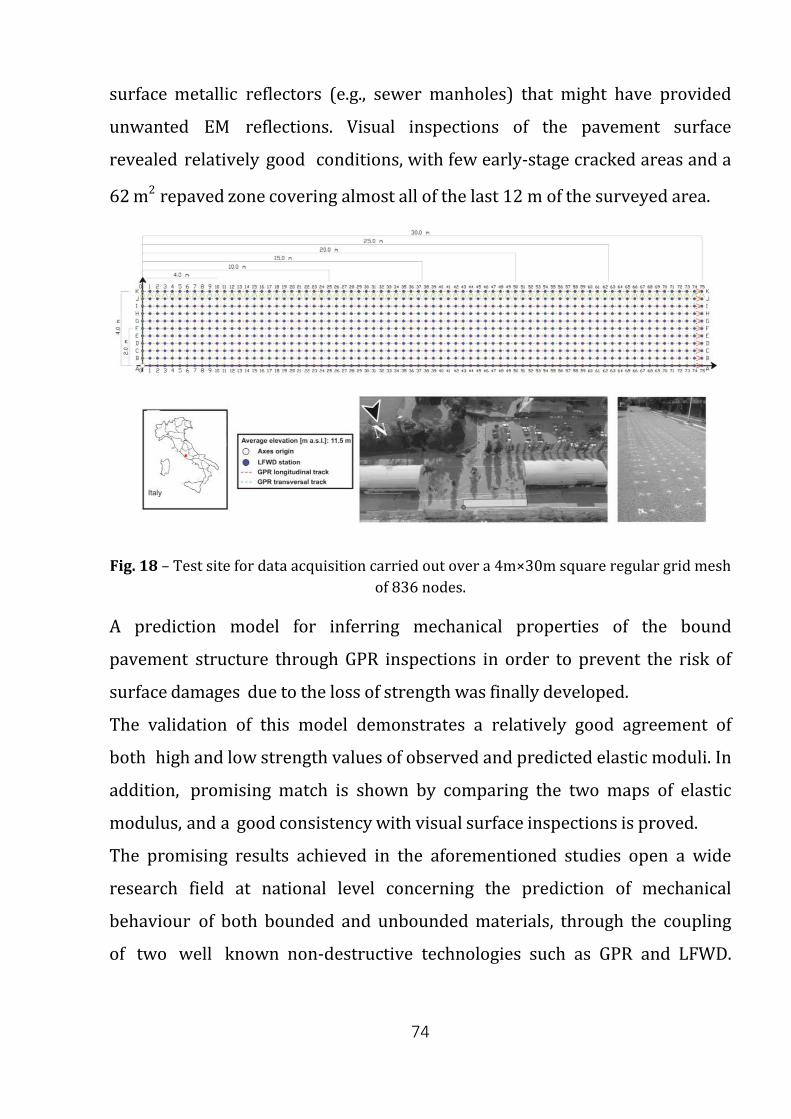
74
surface metallic reflectors (e.g., sewer manholes) that might have provided
unwanted EM reflections. Visual inspections of the pavement surface
revealed relatively good conditions, with few early-stage cracked areas and a
62 m2 repaved zone covering almost all of the last 12 m of the surveyed area.
Fig. 18 – Test site for data acquisition carried out over a 4m×30m square regular grid mesh
of 836 nodes.
A prediction model for inferring mechanical properties of the bound
pavement structure through GPR inspections in order to prevent the risk of
surface damages due to the loss of strength was finally developed.
The validation of this model demonstrates a relatively good agreement of
both high and low strength values of observed and predicted elastic moduli. In
addition, promising match is shown by comparing the two maps of elastic
modulus, and a good consistency with visual surface inspections is proved.
The promising results achieved in the aforementioned studies open a wide
research field at national level concerning the prediction of mechanical
behaviour of both bounded and unbounded materials, through the coupling
of two well known non-destructive technologies such as GPR and LFWD.
75
Moreover, it is worth noting that a deeper knowledge of the relationship
between electromagnetic and mechanical properties of materials commonly
used in civil engineering applications could represent a considerable break-
through also in terms of achieving effective maintenance management
programs. The attainment of the exact amount of deformation depending on
the known forces acting in the considered system can indeed lead to predict
the correct time beyond which it is necessary to start a maintenance activity
to ensure the relevant safety levels with the lowest impact in costs outlay.
References [1] Benedetto A., Tosti F., Inferring bearing ratio of unbound materials from dielectric
properties using GPR: the case of Runaway Safety Areas, Airfield & Highway Pavement
Conference, Los Angeles, USA, 2013
[2] Tighe, S., Li, N.Y., Falls, L.C., Haas, R, Incorporating road safety into pavement
management, 79th Annual Meeting of the Transportation-Research-Board,
Transportation Research Board Nat Research Council. pp. 1–10., 2000.
[3] Haas R., Hudson W.R., Zaniewski J., Modern pavement management. Malabar, FL: Krieger
Publishing Company, 1994
[4] American Society for Testing and Materials (ASTM), Standard test method for deflections
with a falling weight type impulse loading device, Annual Book of ASTM Standards
04.03, D4694.96., 2005
[5] Belt R., Morrison T., Weaver E., Long-term pavement performance program falling
weight deflectometer maintenance manual, Report No FHWA-HRT-05-153. Georgetown
Pike, VA, 2006
[6] Tosti F., Adabi S., Pajewski L., Schettini G., Benedetto A., Large-Scale Analysis of Dielectric
and Mechanical Properties of Pavement using GPR and LFWD, Proceedings of 15th
Conference on Ground Penetrating Radar (GPR2014), Brussels, Belgium, 2014.
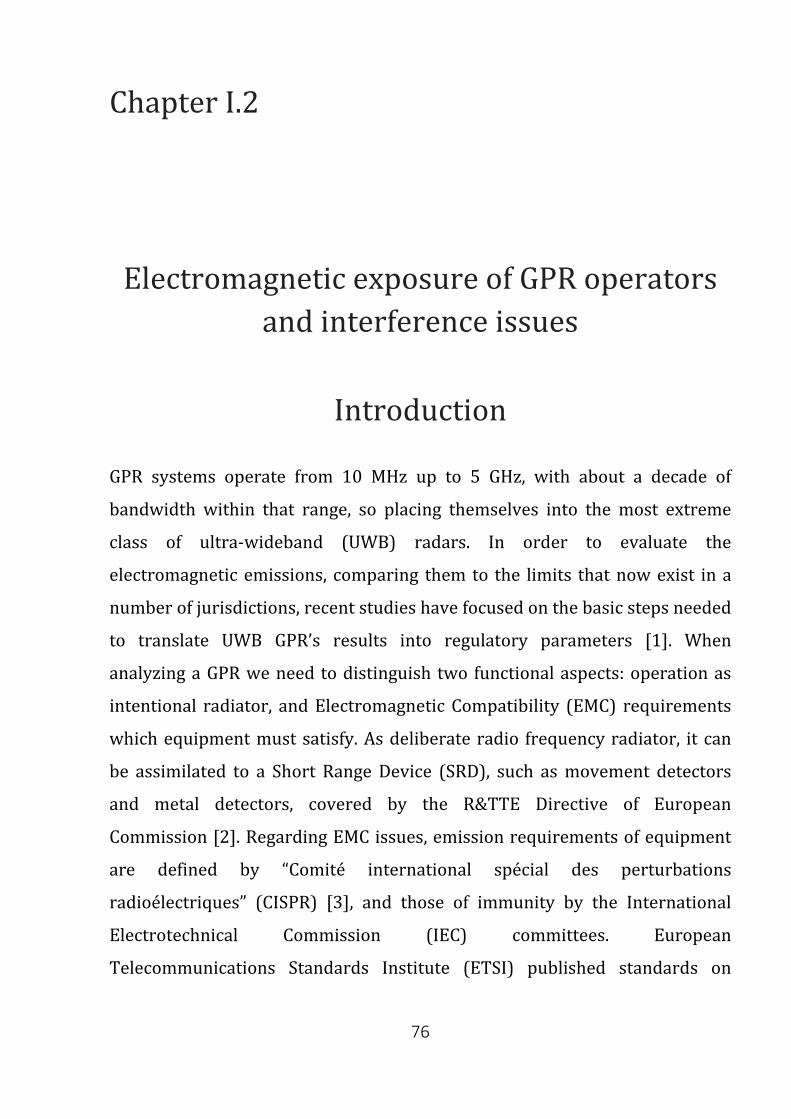
76
Chapter I.2
Electromagnetic exposure of GPR operators and interference issues
Introduction
GPR systems operate from 10 MHz up to 5 GHz, with about a decade of
bandwidth within that range, so placing themselves into the most extreme
class of ultra-wideband (UWB) radars. In order to evaluate the
electromagnetic emissions, comparing them to the limits that now exist in a
number of jurisdictions, recent studies have focused on the basic steps needed
to translate UWB GPR’s results into regulatory parameters [1]. When
analyzing a GPR we need to distinguish two functional aspects: operation as
intentional radiator, and Electromagnetic Compatibility (EMC) requirements
which equipment must satisfy. As deliberate radio frequency radiator, it can
be assimilated to a Short Range Device (SRD), such as movement detectors
and metal detectors, covered by the R&TTE Directive of European
Commission [2]. Regarding EMC issues, emission requirements of equipment
are defined by “Comité international spécial des perturbations
radioélectriques” (CISPR) [3], and those of immunity by the International
Electrotechnical Commission (IEC) committees. European
Telecommunications Standards Institute (ETSI) published standards on
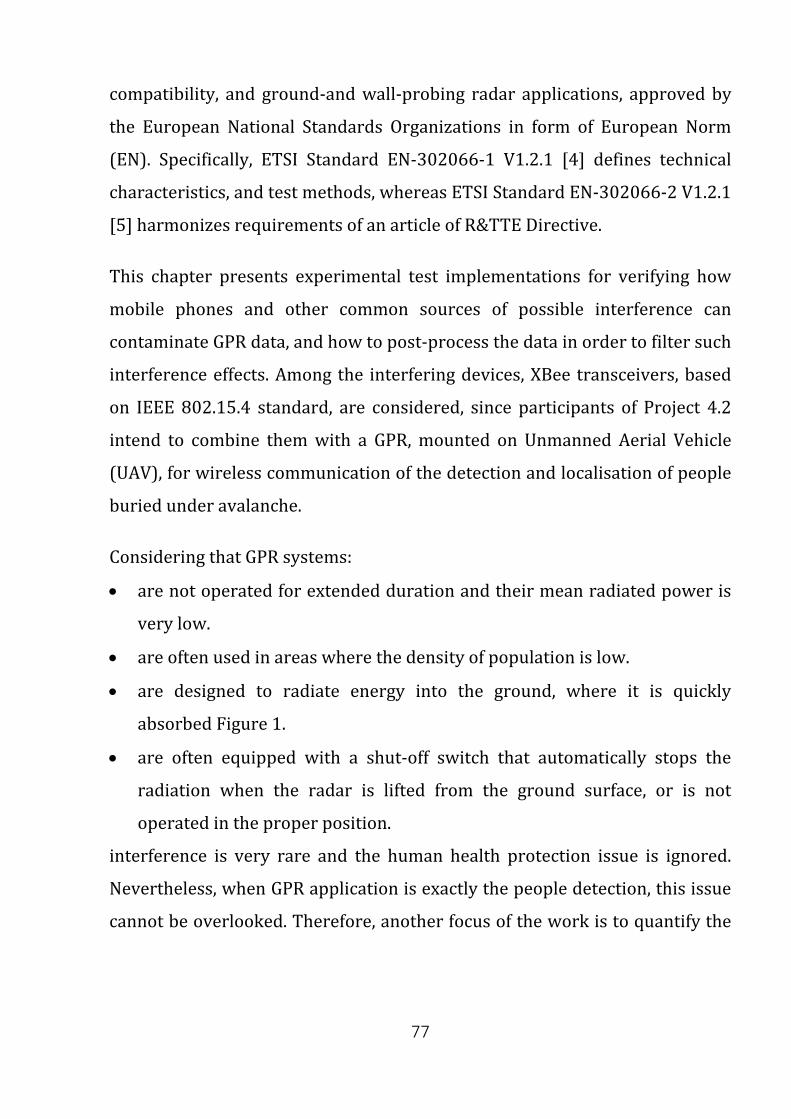
77
compatibility, and ground-and wall-probing radar applications, approved by
the European National Standards Organizations in form of European Norm
(EN). Specifically, ETSI Standard EN-302066-1 V1.2.1 [4] defines technical
characteristics, and test methods, whereas ETSI Standard EN-302066-2 V1.2.1
[5] harmonizes requirements of an article of R&TTE Directive.
This chapter presents experimental test implementations for verifying how
mobile phones and other common sources of possible interference can
contaminate GPR data, and how to post-process the data in order to filter such
interference effects. Among the interfering devices, XBee transceivers, based
on IEEE 802.15.4 standard, are considered, since participants of Project 4.2
intend to combine them with a GPR, mounted on Unmanned Aerial Vehicle
(UAV), for wireless communication of the detection and localisation of people
buried under avalanche.
Considering that GPR systems:
• are not operated for extended duration and their mean radiated power is
very low.
• are often used in areas where the density of population is low.
• are designed to radiate energy into the ground, where it is quickly
absorbed Figure 1.
• are often equipped with a shut-off switch that automatically stops the
radiation when the radar is lifted from the ground surface, or is not
operated in the proper position.
interference is very rare and the human health protection issue is ignored.
Nevertheless, when GPR application is exactly the people detection, this issue
cannot be overlooked. Therefore, another focus of the work is to quantify the
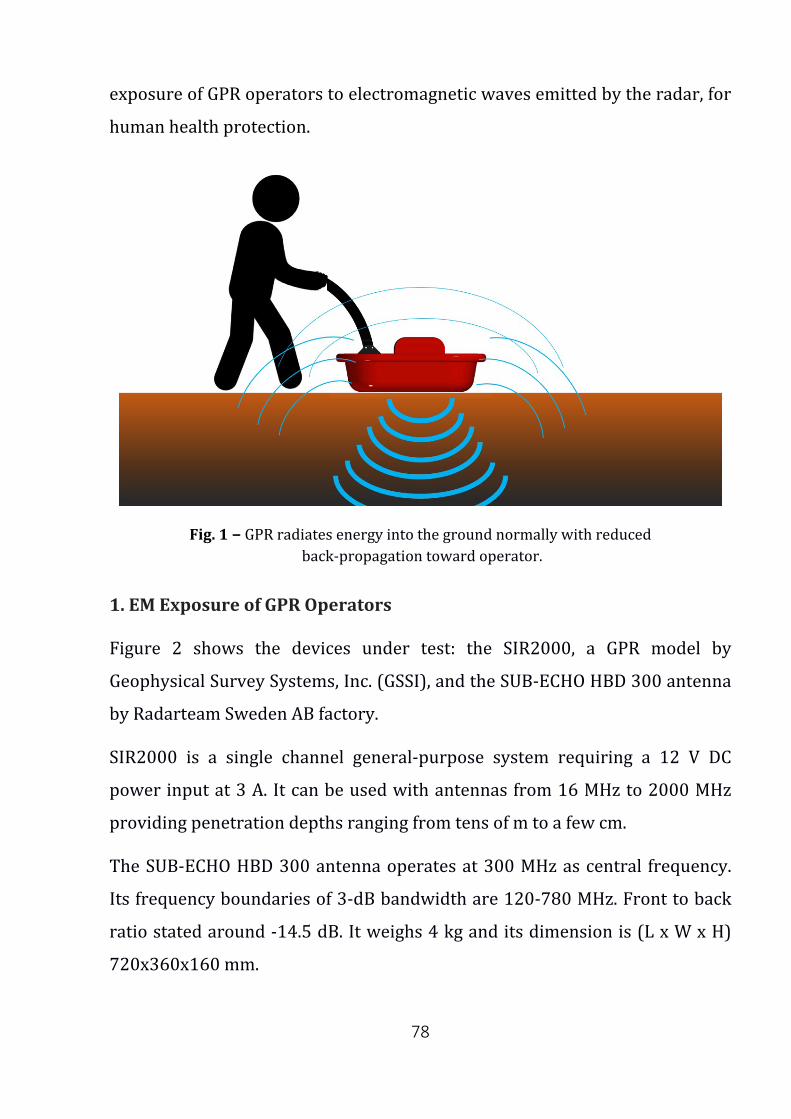
78
exposure of GPR operators to electromagnetic waves emitted by the radar, for
human health protection.
Fig. 1 − GPR radiates energy into the ground normally with reduced back-propagation toward operator.
1. EM Exposure of GPR Operators
Figure 2 shows the devices under test: the SIR2000, a GPR model by
Geophysical Survey Systems, Inc. (GSSI), and the SUB-ECHO HBD 300 antenna
by Radarteam Sweden AB factory.
SIR2000 is a single channel general-purpose system requiring a 12 V DC
power input at 3 A. It can be used with antennas from 16 MHz to 2000 MHz
providing penetration depths ranging from tens of m to a few cm.
The SUB-ECHO HBD 300 antenna operates at 300 MHz as central frequency.
Its frequency boundaries of 3-dB bandwidth are 120-780 MHz. Front to back
ratio stated around -14.5 dB. It weighs 4 kg and its dimension is (L x W x H)
720x360x160 mm.
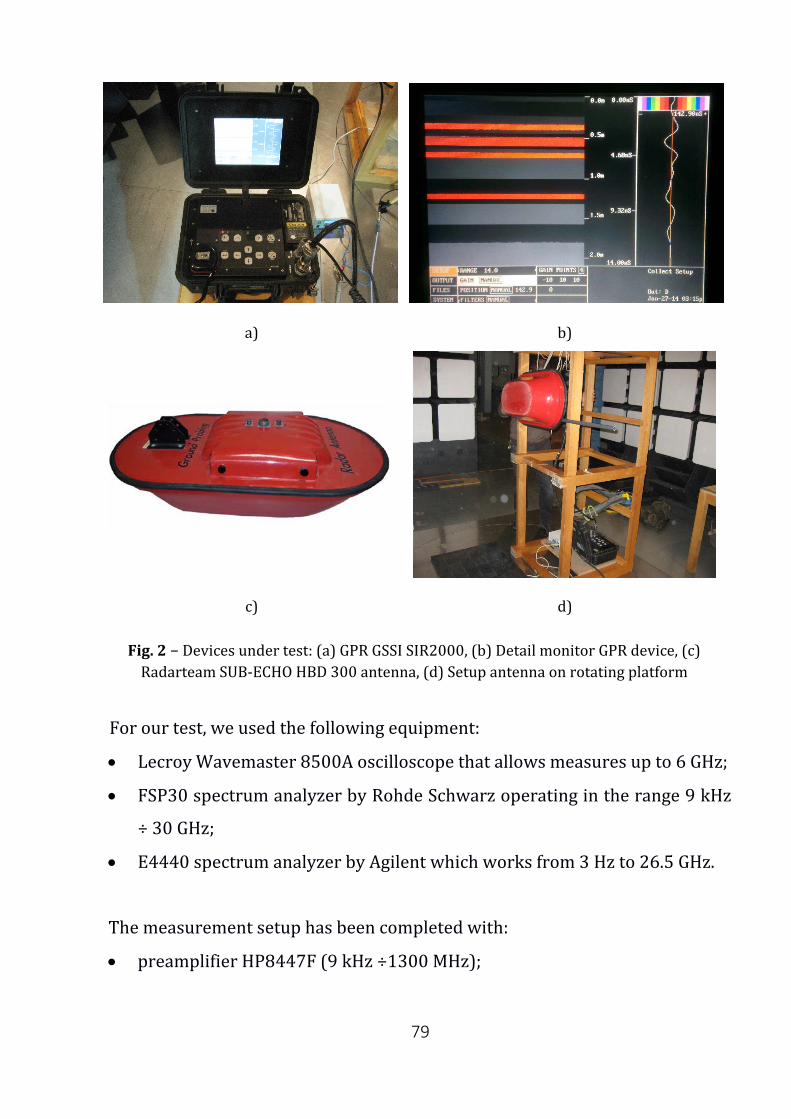
79
a) b)
c) d)
Fig. 2 − Devices under test: (a) GPR GSSI SIR2000, (b) Detail monitor GPR device, (c) Radarteam SUB-ECHO HBD 300 antenna, (d) Setup antenna on rotating platform
For our test, we used the following equipment:
• Lecroy Wavemaster 8500A oscilloscope that allows measures up to 6 GHz;
• FSP30 spectrum analyzer by Rohde Schwarz operating in the range 9 kHz
÷ 30 GHz;
• E4440 spectrum analyzer by Agilent which works from 3 Hz to 26.5 GHz.
The measurement setup has been completed with:
• preamplifier HP8447F (9 kHz ÷1300 MHz);
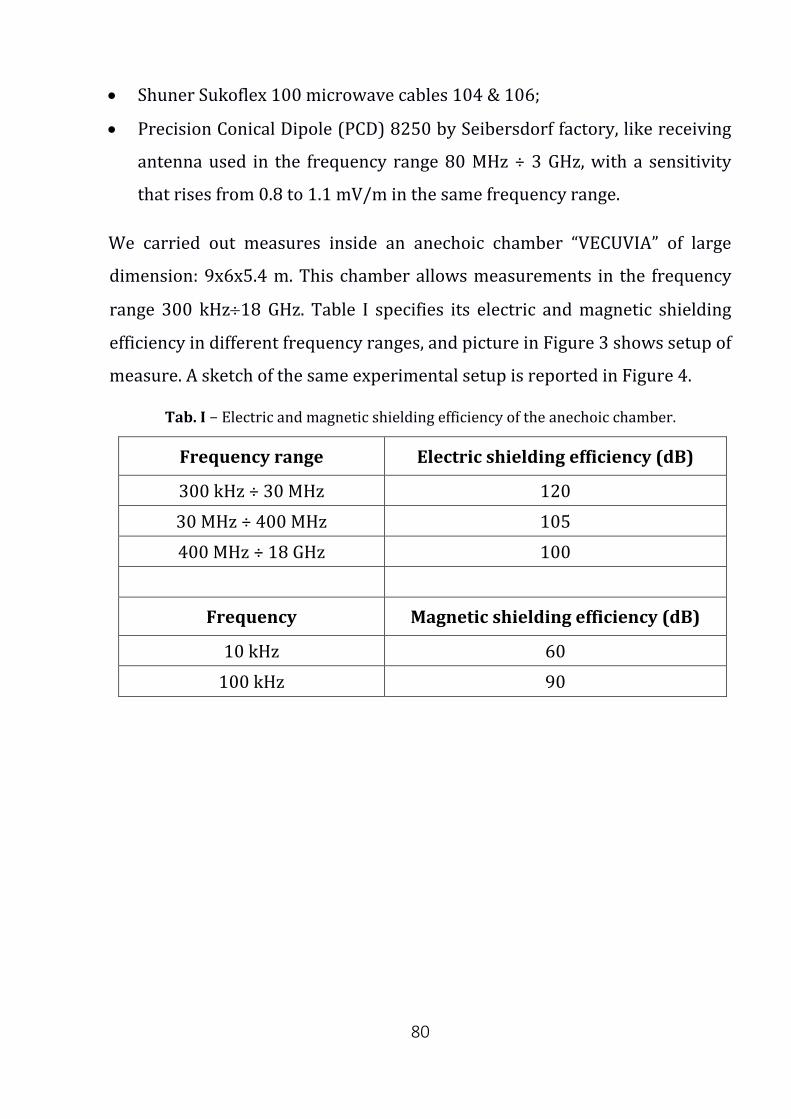
80
• Shuner Sukoflex 100 microwave cables 104 & 106;
• Precision Conical Dipole (PCD) 8250 by Seibersdorf factory, like receiving
antenna used in the frequency range 80 MHz ÷ 3 GHz, with a sensitivity
that rises from 0.8 to 1.1 mV/m in the same frequency range.
We carried out measures inside an anechoic chamber “VECUVIA” of large
dimension: 9x6x5.4 m. This chamber allows measurements in the frequency
range 300 kHz÷18 GHz. Table I specifies its electric and magnetic shielding
efficiency in different frequency ranges, and picture in Figure 3 shows setup of
measure. A sketch of the same experimental setup is reported in Figure 4.
Tab. I − Electric and magnetic shielding efficiency of the anechoic chamber.
Frequency range Electric shielding efficiency (dB)
300 kHz ÷ 30 MHz 120 30 MHz ÷ 400 MHz 105 400 MHz ÷ 18 GHz 100
Frequency Magnetic shielding efficiency (dB)
10 kHz 60 100 kHz 90
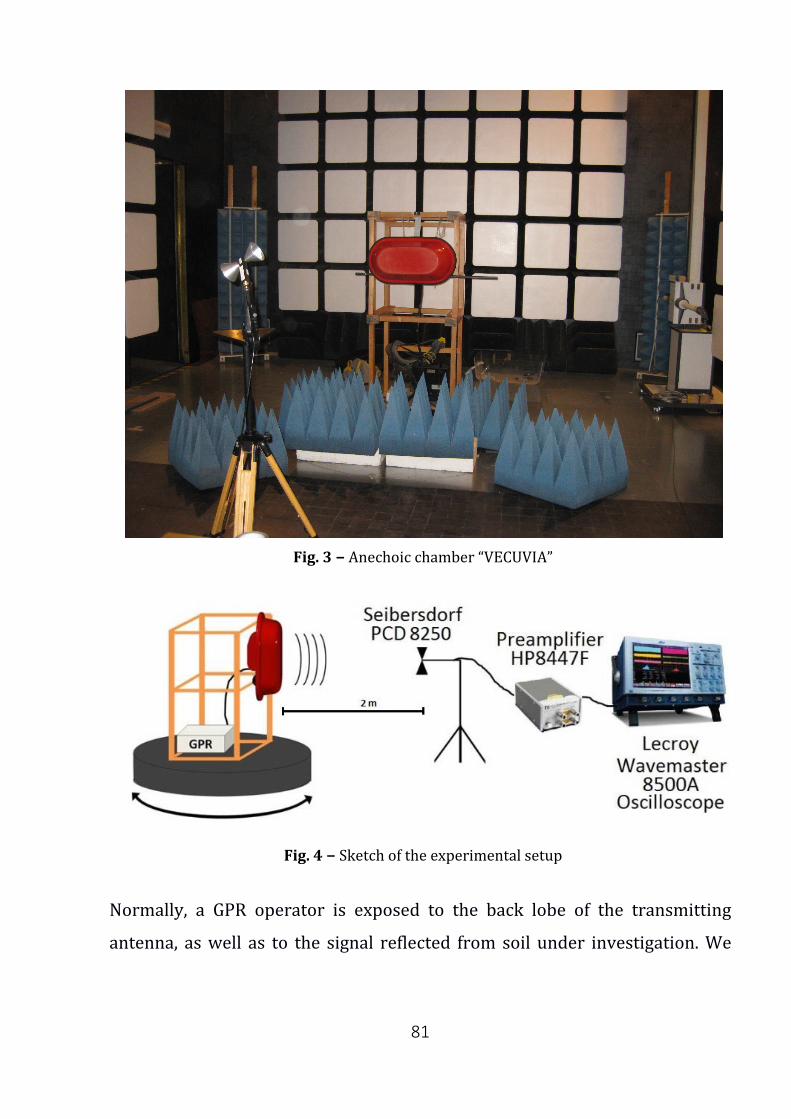
81
Fig. 3 − Anechoic chamber “VECUVIA”
Fig. 4 − Sketch of the experimental setup
Normally, a GPR operator is exposed to the back lobe of the transmitting
antenna, as well as to the signal reflected from soil under investigation. We
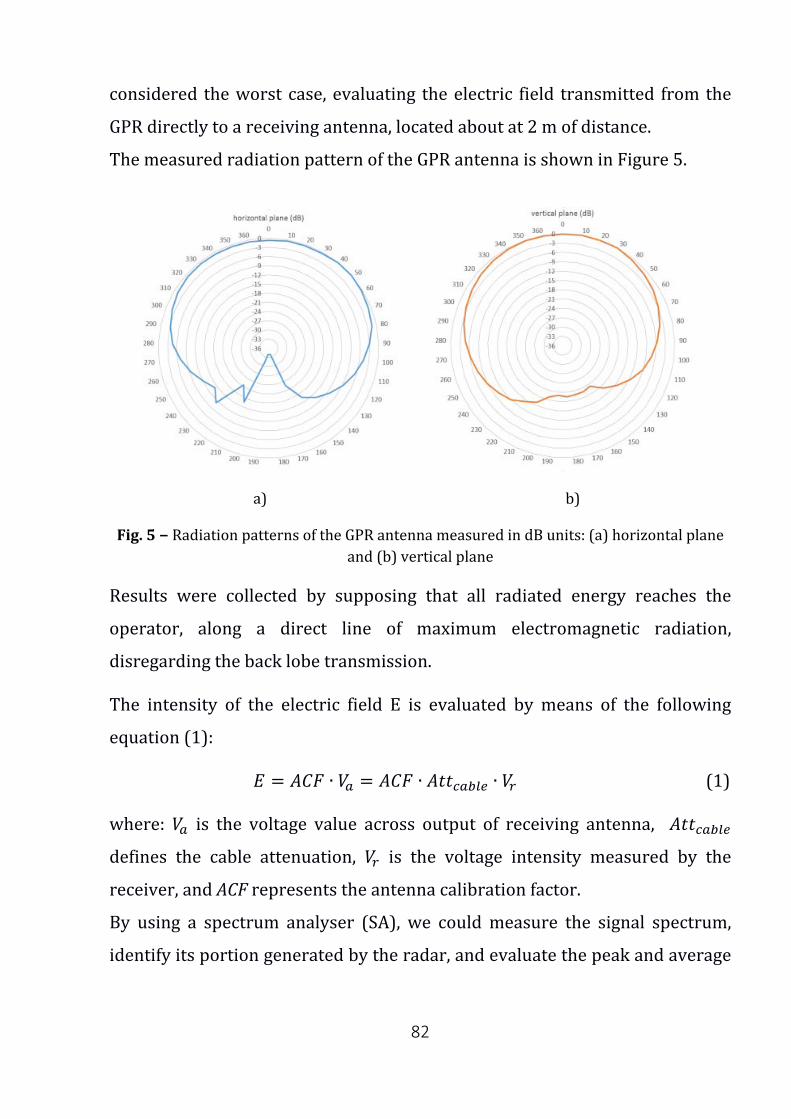
82
considered the worst case, evaluating the electric field transmitted from the
GPR directly to a receiving antenna, located about at 2 m of distance.
The measured radiation pattern of the GPR antenna is shown in Figure 5.
a) b)
Fig. 5 − Radiation patterns of the GPR antenna measured in dB units: (a) horizontal plane and (b) vertical plane
Results were collected by supposing that all radiated energy reaches the
operator, along a direct line of maximum electromagnetic radiation,
disregarding the back lobe transmission.
The intensity of the electric field E is evaluated by means of the following
equation (1):
𝐸𝐸 = 𝐴𝐴𝐴𝐴𝐴𝐴 ∙ 𝑉𝑉𝑎𝑎 = 𝐴𝐴𝐴𝐴𝐴𝐴 ∙ 𝐴𝐴𝐴𝐴𝐴𝐴𝑐𝑐𝑎𝑎𝑐𝑐𝑐𝑐𝑐𝑐 ∙ 𝑉𝑉𝑟𝑟 (1)
where: 𝑉𝑉𝑎𝑎 is the voltage value across output of receiving antenna, 𝐴𝐴𝐴𝐴𝐴𝐴𝑐𝑐𝑎𝑎𝑐𝑐𝑐𝑐𝑐𝑐
defines the cable attenuation, 𝑉𝑉𝑟𝑟 is the voltage intensity measured by the
receiver, and ACF represents the antenna calibration factor.
By using a spectrum analyser (SA), we could measure the signal spectrum,
identify its portion generated by the radar, and evaluate the peak and average
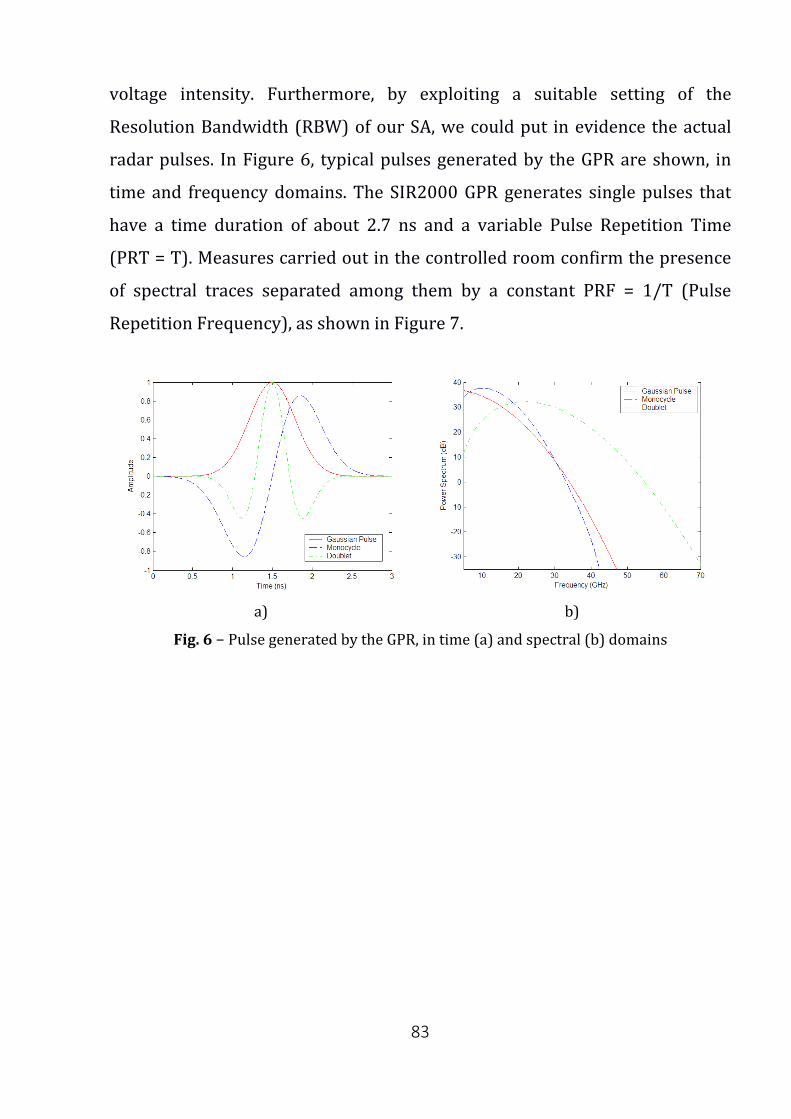
83
voltage intensity. Furthermore, by exploiting a suitable setting of the
Resolution Bandwidth (RBW) of our SA, we could put in evidence the actual
radar pulses. In Figure 6, typical pulses generated by the GPR are shown, in
time and frequency domains. The SIR2000 GPR generates single pulses that
have a time duration of about 2.7 ns and a variable Pulse Repetition Time
(PRT = T). Measures carried out in the controlled room confirm the presence
of spectral traces separated among them by a constant PRF = 1/T (Pulse
Repetition Frequency), as shown in Figure 7.
a) b)
Fig. 6 − Pulse generated by the GPR, in time (a) and spectral (b) domains
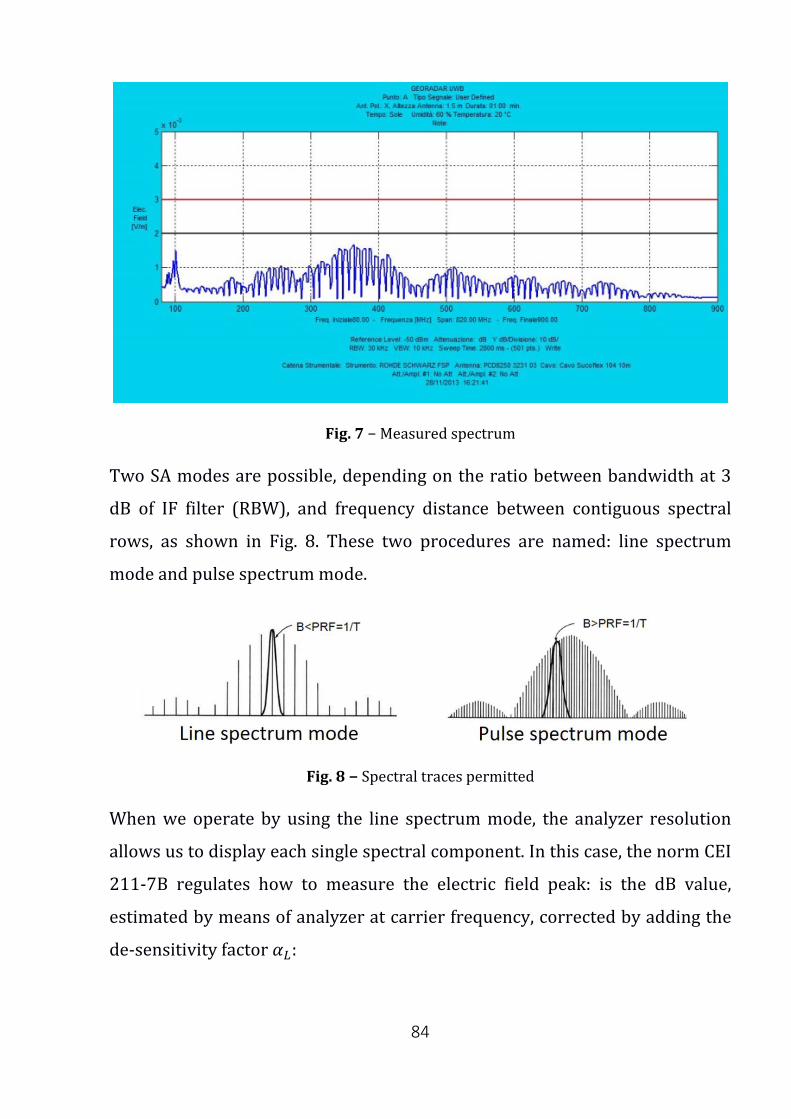
84
Fig. 7 − Measured spectrum
Two SA modes are possible, depending on the ratio between bandwidth at 3
dB of IF filter (RBW), and frequency distance between contiguous spectral
rows, as shown in Fig. 8. These two procedures are named: line spectrum
mode and pulse spectrum mode.
Fig. 8 − Spectral traces permitted
When we operate by using the line spectrum mode, the analyzer resolution
allows us to display each single spectral component. In this case, the norm CEI
211-7B regulates how to measure the electric field peak: is the dB value,
estimated by means of analyzer at carrier frequency, corrected by adding the
de-sensitivity factor 𝛼𝛼𝐿𝐿:
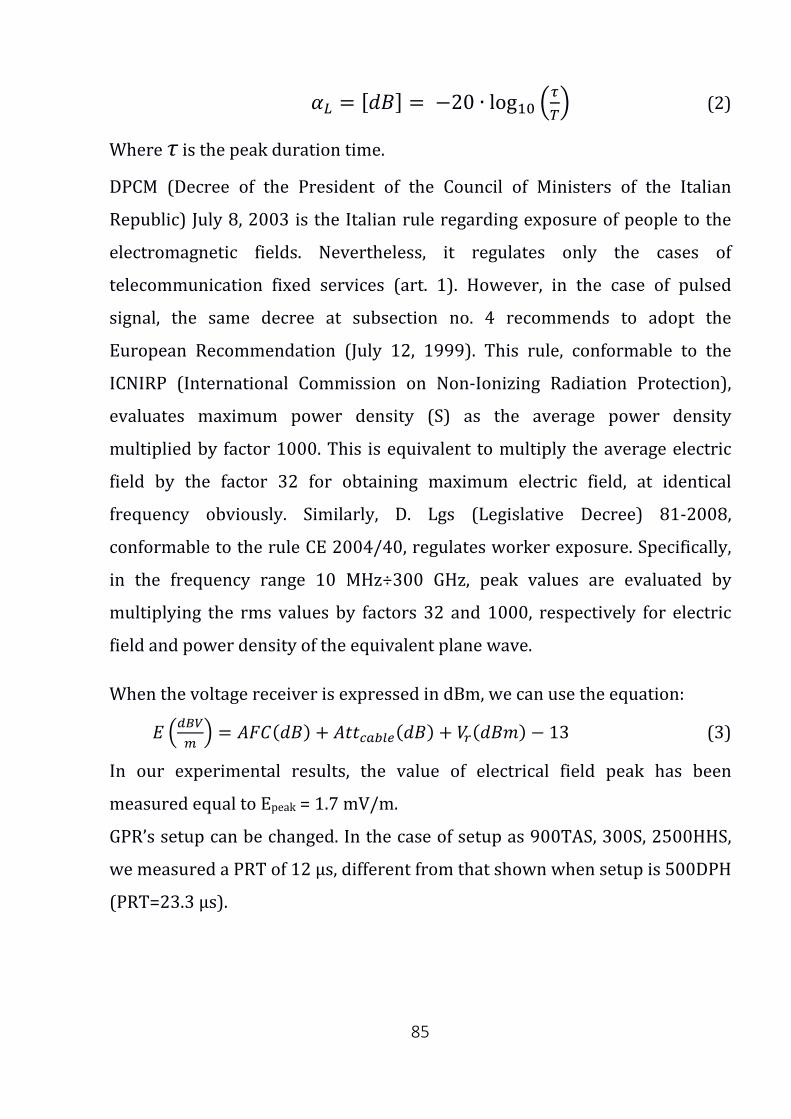
85
𝛼𝛼𝐿𝐿 = [𝑑𝑑𝑑𝑑] = −20 ∙ log10 �𝜏𝜏𝑇𝑇� (2)
Where τ is the peak duration time.
DPCM (Decree of the President of the Council of Ministers of the Italian
Republic) July 8, 2003 is the Italian rule regarding exposure of people to the
electromagnetic fields. Nevertheless, it regulates only the cases of
telecommunication fixed services (art. 1). However, in the case of pulsed
signal, the same decree at subsection no. 4 recommends to adopt the
European Recommendation (July 12, 1999). This rule, conformable to the
ICNIRP (International Commission on Non-Ionizing Radiation Protection),
evaluates maximum power density (S) as the average power density
multiplied by factor 1000. This is equivalent to multiply the average electric
field by the factor 32 for obtaining maximum electric field, at identical
frequency obviously. Similarly, D. Lgs (Legislative Decree) 81-2008,
conformable to the rule CE 2004/40, regulates worker exposure. Specifically,
in the frequency range 10 MHz÷300 GHz, peak values are evaluated by
multiplying the rms values by factors 32 and 1000, respectively for electric
field and power density of the equivalent plane wave.
When the voltage receiver is expressed in dBm, we can use the equation:
𝐸𝐸 �𝑑𝑑𝑑𝑑𝑑𝑑𝑚𝑚� = 𝐴𝐴𝐴𝐴𝐴𝐴(𝑑𝑑𝑑𝑑) + 𝐴𝐴𝐴𝐴𝐴𝐴𝑐𝑐𝑎𝑎𝑐𝑐𝑐𝑐𝑐𝑐(𝑑𝑑𝑑𝑑) + 𝑉𝑉𝑟𝑟(𝑑𝑑𝑑𝑑𝑑𝑑) − 13 (3)
In our experimental results, the value of electrical field peak has been
measured equal to Epeak = 1.7 mV/m.
GPR’s setup can be changed. In the case of setup as 900TAS, 300S, 2500HHS,
we measured a PRT of 12 μs, different from that shown when setup is 500DPH
(PRT=23.3 μs).
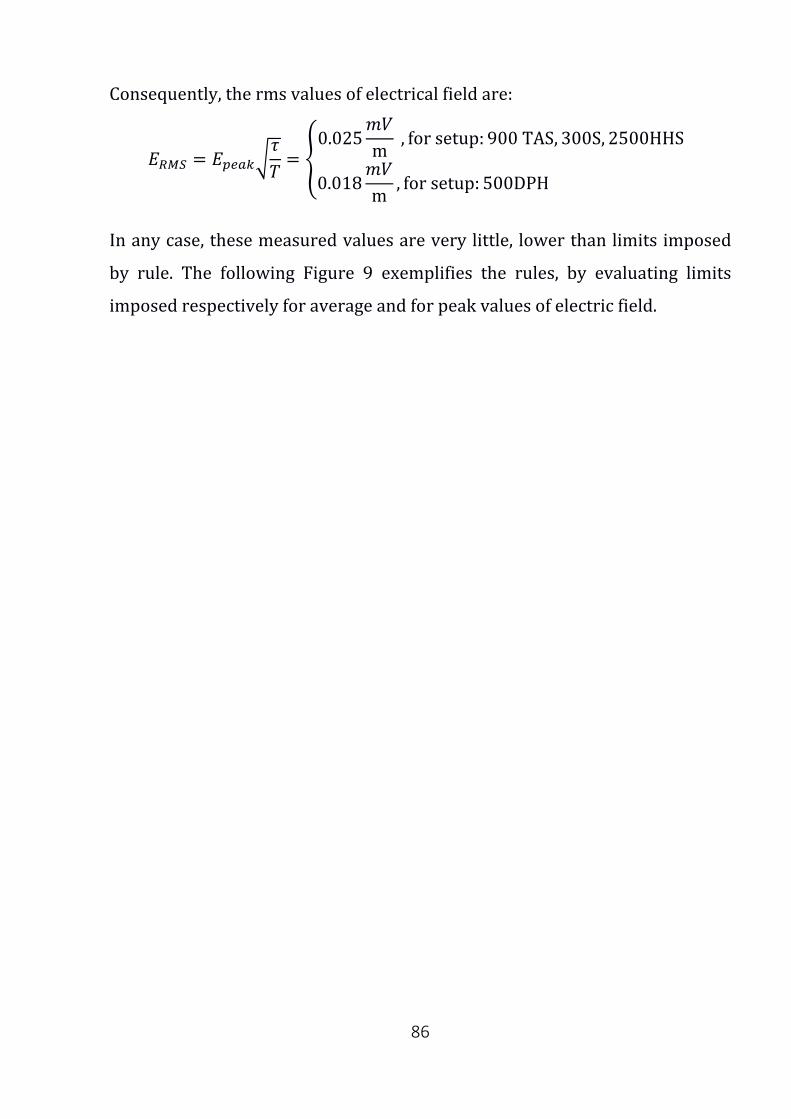
86
Consequently, the rms values of electrical field are:
𝐸𝐸𝑅𝑅𝑅𝑅𝑅𝑅 = 𝐸𝐸𝑝𝑝𝑐𝑐𝑎𝑎𝑝𝑝�𝜏𝜏𝑇𝑇
= �0.025
𝑑𝑑𝑉𝑉m
, for setup: 900 TAS, 300S, 2500HHS
0.018𝑑𝑑𝑉𝑉m
, for setup: 500DPH
In any case, these measured values are very little, lower than limits imposed
by rule. The following Figure 9 exemplifies the rules, by evaluating limits
imposed respectively for average and for peak values of electric field.
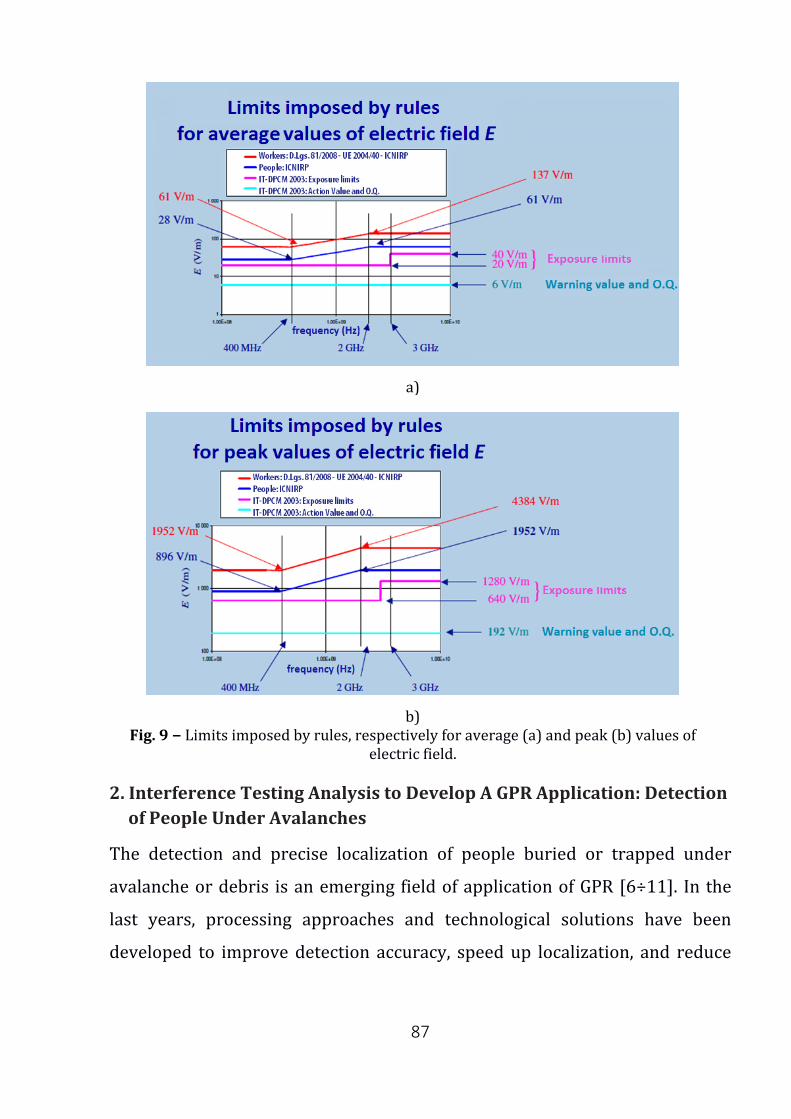
87
a)
b)
Fig. 9 − Limits imposed by rules, respectively for average (a) and peak (b) values of electric field.
2. Interference Testing Analysis to Develop A GPR Application: Detection
of People Under Avalanches
The detection and precise localization of people buried or trapped under
avalanche or debris is an emerging field of application of GPR [6÷11]. In the
last years, processing approaches and technological solutions have been
developed to improve detection accuracy, speed up localization, and reduce
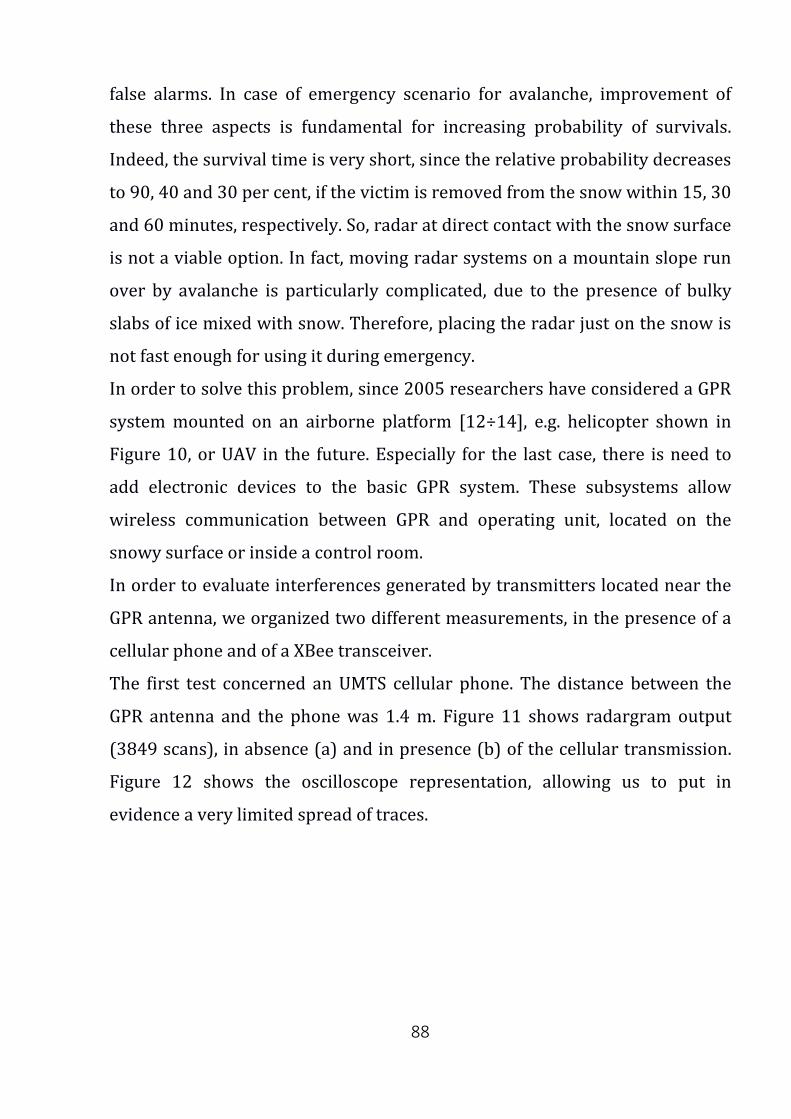
88
false alarms. In case of emergency scenario for avalanche, improvement of
these three aspects is fundamental for increasing probability of survivals.
Indeed, the survival time is very short, since the relative probability decreases
to 90, 40 and 30 per cent, if the victim is removed from the snow within 15, 30
and 60 minutes, respectively. So, radar at direct contact with the snow surface
is not a viable option. In fact, moving radar systems on a mountain slope run
over by avalanche is particularly complicated, due to the presence of bulky
slabs of ice mixed with snow. Therefore, placing the radar just on the snow is
not fast enough for using it during emergency.
In order to solve this problem, since 2005 researchers have considered a GPR
system mounted on an airborne platform [12÷14], e.g. helicopter shown in
Figure 10, or UAV in the future. Especially for the last case, there is need to
add electronic devices to the basic GPR system. These subsystems allow
wireless communication between GPR and operating unit, located on the
snowy surface or inside a control room.
In order to evaluate interferences generated by transmitters located near the
GPR antenna, we organized two different measurements, in the presence of a
cellular phone and of a XBee transceiver.
The first test concerned an UMTS cellular phone. The distance between the
GPR antenna and the phone was 1.4 m. Figure 11 shows radargram output
(3849 scans), in absence (a) and in presence (b) of the cellular transmission.
Figure 12 shows the oscilloscope representation, allowing us to put in
evidence a very limited spread of traces.
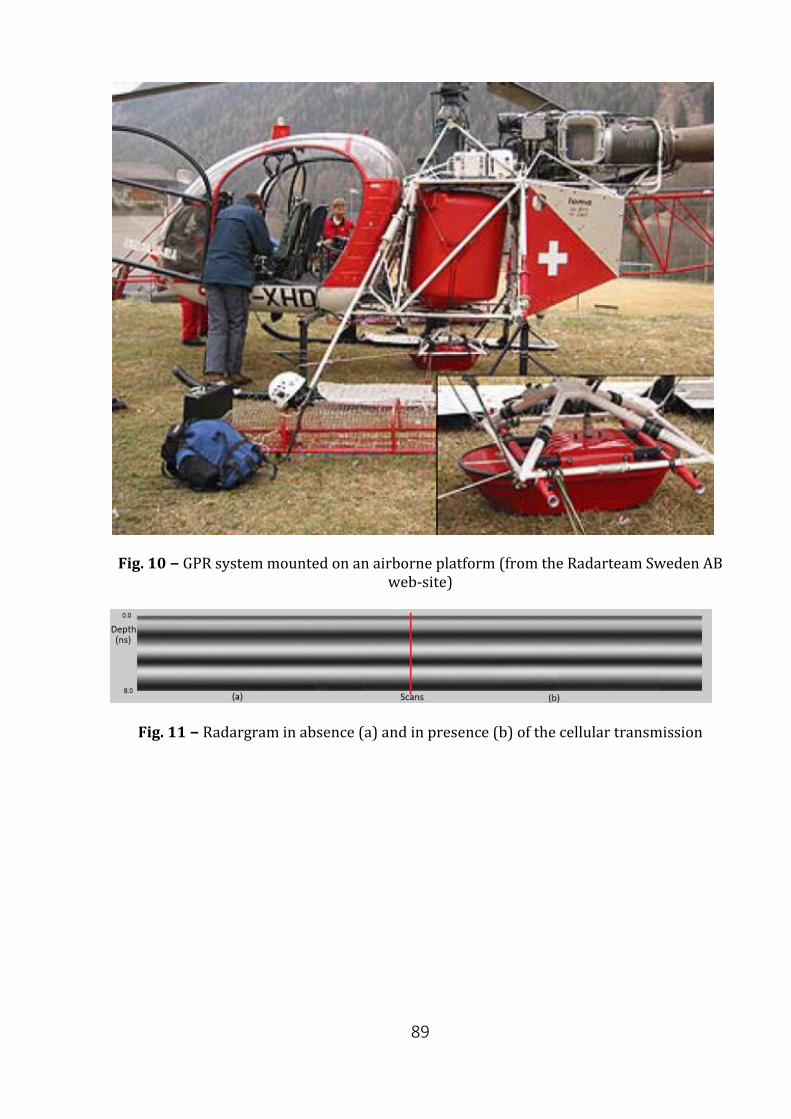
89
Fig. 10 − GPR system mounted on an airborne platform (from the Radarteam Sweden AB web-site)
Fig. 11 − Radargram in absence (a) and in presence (b) of the cellular transmission

90
Fig. 12 − Oscilloscope representation
For the second test, a transceiver XBee PRO-S2 (international variant by Digi
International), is arranged on the top at direct contact with GPR's antenna, as
shown in Figure 13. Specifications of the RF module are: transmitting power
output 10 mW, outdoor RF LOS range 1500 m, operating frequency band ISM
2.4 GHz, RF data rate 250 kbps, 14 direct sequence channels.
The radargram of Figure 14 shows a first interval of data acquisition with the
XBee in off state, and a following interval characterized by the XBee
continuously transmitting.
Both tests demonstrate a very low interference generated by the devices, due
to the fact that their operating frequency bands are different from the GPR
bandwidth. Therefore, the design for adding wireless communication devices
to the GPR is justified.
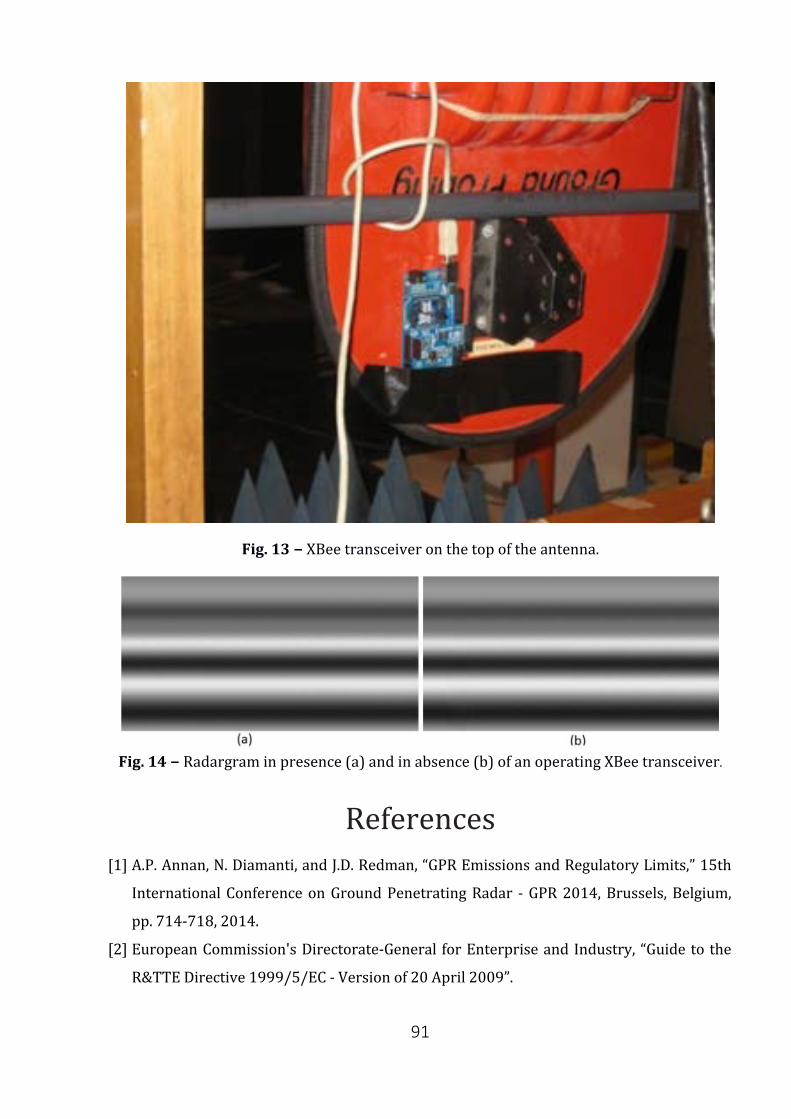
91
Fig. 13 − XBee transceiver on the top of the antenna.
Fig. 14 − Radargram in presence (a) and in absence (b) of an operating XBee transceiver.
References [1] A.P. Annan, N. Diamanti, and J.D. Redman, “GPR Emissions and Regulatory Limits,” 15th
International Conference on Ground Penetrating Radar - GPR 2014, Brussels, Belgium,
pp. 714-718, 2014.
[2] European Commission's Directorate-General for Enterprise and Industry, “Guide to the
R&TTE Directive 1999/5/EC - Version of 20 April 2009”.
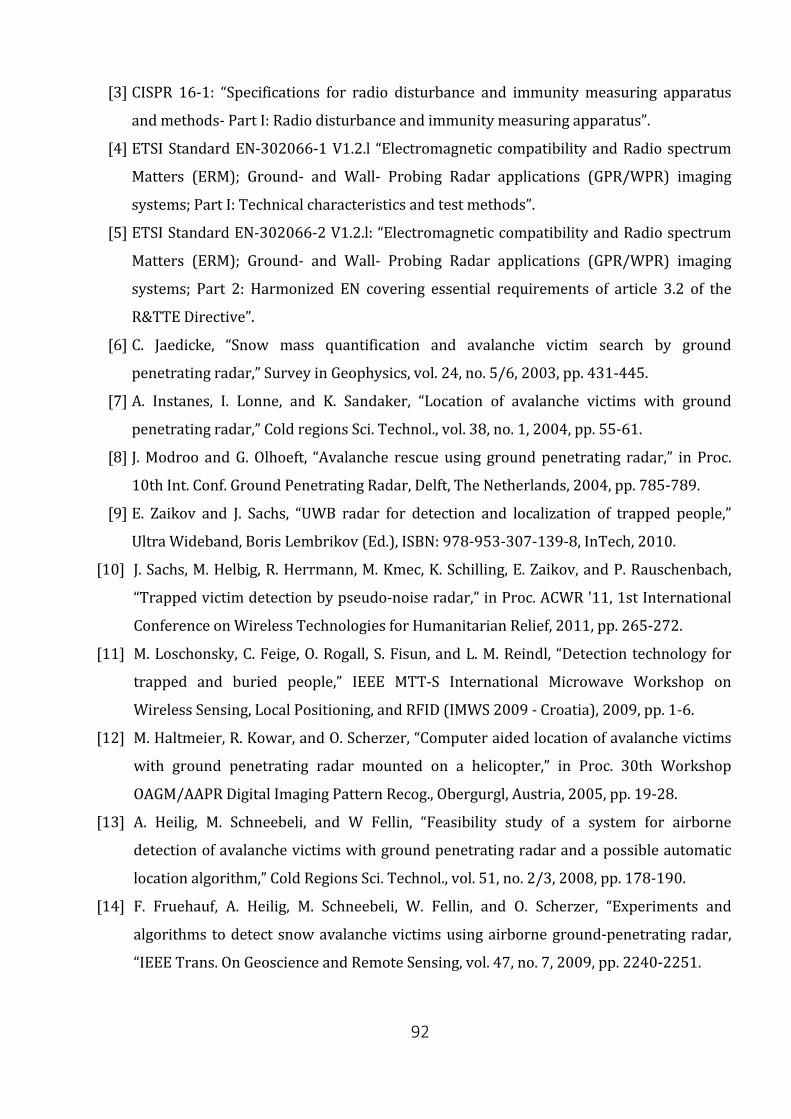
92
[3] CISPR 16-1: “Specifications for radio disturbance and immunity measuring apparatus
and methods- Part I: Radio disturbance and immunity measuring apparatus”.
[4] ETSI Standard EN-302066-1 V1.2.l “Electromagnetic compatibility and Radio spectrum
Matters (ERM); Ground- and Wall- Probing Radar applications (GPR/WPR) imaging
systems; Part I: Technical characteristics and test methods”.
[5] ETSI Standard EN-302066-2 V1.2.l: “Electromagnetic compatibility and Radio spectrum
Matters (ERM); Ground- and Wall- Probing Radar applications (GPR/WPR) imaging
systems; Part 2: Harmonized EN covering essential requirements of article 3.2 of the
R&TTE Directive”.
[6] C. Jaedicke, “Snow mass quantification and avalanche victim search by ground
penetrating radar,” Survey in Geophysics, vol. 24, no. 5/6, 2003, pp. 431-445.
[7] A. Instanes, I. Lonne, and K. Sandaker, “Location of avalanche victims with ground
penetrating radar,” Cold regions Sci. Technol., vol. 38, no. 1, 2004, pp. 55-61.
[8] J. Modroo and G. Olhoeft, “Avalanche rescue using ground penetrating radar,” in Proc.
10th Int. Conf. Ground Penetrating Radar, Delft, The Netherlands, 2004, pp. 785-789.
[9] E. Zaikov and J. Sachs, “UWB radar for detection and localization of trapped people,”
Ultra Wideband, Boris Lembrikov (Ed.), ISBN: 978-953-307-139-8, InTech, 2010.
[10] J. Sachs, M. Helbig, R. Herrmann, M. Kmec, K. Schilling, E. Zaikov, and P. Rauschenbach,
“Trapped victim detection by pseudo-noise radar,” in Proc. ACWR '11, 1st International
Conference on Wireless Technologies for Humanitarian Relief, 2011, pp. 265-272.
[11] M. Loschonsky, C. Feige, O. Rogall, S. Fisun, and L. M. Reindl, “Detection technology for
trapped and buried people,” IEEE MTT-S International Microwave Workshop on
Wireless Sensing, Local Positioning, and RFID (IMWS 2009 - Croatia), 2009, pp. 1-6.
[12] M. Haltmeier, R. Kowar, and O. Scherzer, “Computer aided location of avalanche victims
with ground penetrating radar mounted on a helicopter,” in Proc. 30th Workshop
OAGM/AAPR Digital Imaging Pattern Recog., Obergurgl, Austria, 2005, pp. 19-28.
[13] A. Heilig, M. Schneebeli, and W Fellin, “Feasibility study of a system for airborne
detection of avalanche victims with ground penetrating radar and a possible automatic
location algorithm,” Cold Regions Sci. Technol., vol. 51, no. 2/3, 2008, pp. 178-190.
[14] F. Fruehauf, A. Heilig, M. Schneebeli, W. Fellin, and O. Scherzer, “Experiments and
algorithms to detect snow avalanche victims using airborne ground-penetrating radar,
“IEEE Trans. On Geoscience and Remote Sensing, vol. 47, no. 7, 2009, pp. 2240-2251.
93
Chapter I.3
Electromagnetic Wire-Grid Modelling for Ground Penetrating Radar Applications
Introduction This chapter focuses on the electromagnetic wire-grid modelling of metallic
cylindrical objects buried in the ground or embedded in a structure. In utility
detection, quality controls of reinforced concrete, and many other GPR
applications, the sought targets often are long and thin: in these cases, two-
dimensional methods can be employed to model the scenario and solve the
electromagnetic scattering problem. In this chapter, all the results are
obtained by using GprMax2D [2], a well-known freeware tool implementing
the Finite-Difference Time-Domain (FDTD) method.
Wire-grid modelling of conducting objects was introduced by Richmond in
1966 [3] and, since then, the method has been extensively used over the years
to simulate arbitrarily-shaped objects and compute radiation patterns of
antennas, as well as the electromagnetic field scattered by targets. For any
wire-grid model, a better accuracy can be achieved with a larger number of
wires; moreover, a fundamental question is the choice of the optimum wire
radius and grid spacing. The most widely used criterion to fix the wire size is
94
the so-called equal-area rule (EAR) [3, 4]: the total surface area of the wires
has to be equal to the surface area of the object being modelled. This rule
comes from empirical observation and few authors have investigated its
reliability for 2D objects through the years. Ludwig [4] studied the reliability
of the rule by examining the canonical radiation problem of a transverse
magnetic field by a circular cylinder in a vacuum, fed with a uniform surface
current and compared with a wire-grid model; he concluded that the EAR is
optimum and that too thin wires are just as bad as too thick ones. Paknys [5]
investigated the accuracy of the rule for the modelling of a circular cylinder in
a vacuum with a uniform current on it, continuing the study initiated in [4], or
illuminated by a transverse magnetic monochromatic plane wave; he
confirmed that the EAR is optimum and observed that the field inside the
cylinder is most sensitive to the wire radius than the field outside the object.
In [6], a circular cylinder was considered, embedded in a dielectric half-space
and illuminated by a transverse magnetic monochromatic plane wave; the
scattered near field was calculated by using the Cylindrical-Wave Approach
(CWA) [7] and numerical results, obtained for different wire-grid models in
the spectral domain, were compared with the exact solution; it was shown
that more accurate results can be obtained with a wire radius shorter than
what is suggested by the rule. More recently, both the acoustic and
electromagnetic scattering problems by a periodic configuration of N wires
distributed on a ring, modelling a circular cage, were studied [8]; it was
demonstrated that, as N goes to ∞, the solution of the limiting problem is
approached very slowly, as (N−1) log N.
95
1. FDTD Modelling of Cylindrical Objects
Several methods can be employed, to solve electromagnetic forward-
scattering problems. One of the most versatile approaches is the well-known
FDTD technique [11], based on a spatial and temporal discretisation of
Maxwell’s curl equations in differential form, commonly within a rectilinear
Cartesian grid as originally proposed by Yee [12] in 1966. As mentioned in the
introduction, the results presented in this chapter are obtained by using
GprMax2D [2], a freeware FDTD tool for 2D numerical modelling, developed
by Prof. A. Giannopoulos. In our simulations, the physical structure of the
transmitter and receiver is not included in the model: the source is
represented through a line of current, as a consequence of the assumption of
the invariance of the problem in one direction, and the electric field impinging
on the receiver is calculated. A first derivative of Gaussian pulse is emitted by
the source, with 1 GHz centre frequency. All the involved media are assumed
to be linear and isotropic, possibly lossy, and their constitutive parameters do
not vary with frequency; metallic objects are assumed to be perfectly-
conducting. In order to keep the errors associated with numerical-induced
dispersion at a minimum, the spatial discretisation step is always at least ten
times smaller than the smallest wavelength of the propagating
electromagnetic fields; the highest frequency to be taken into account in the
simulations is estimated as three times the center frequency of the pulse. To
limit the effects of staircase approximation of continuous objects, circular
cylinders are modeled by discretising their radius through at least twenty
cells. Another crucial point in the FDTD approach is the approximation to be
made in order to limit the computational space: to guarantee reliable results,
we adopt Perfectly-Matched Layer boundaries as Absorbing Boundary
Conditions, which are very effectively implemented in GprMax2D; we use ten
96
layers and put source and targets at least fifteen cells away from the most
internal layer.
2. Numerical results
2.1 Accurate wire-grid modelling of objects buried in a soil
A perfectly-conducting circular cylinder is considered, embedded in a
dielectric half-space representing a soil, as sketched in Figure 1a. The source
is positioned at the air-soil interface and the emitted electric field is parallel to
the target axis. The relative permittivity of the soil is Ԑr = 4. The radius of the
cylinder is R = 50 mm, its axis is in x = 250 mm, y = 100 mm. A wire-grid
model of the object is shown in Figure 1b: it consists of N = 16 circular-section
cylinders with radius r, arranged in a uniformly-spaced circular array. The
best position for the wires is with axes lying on the surface of the cylinder to
be modeled [6]; with a larger N, the behaviour of the array gets closer to that
of the modelled object [7]. Our aim is to investigate the validity of the EAR. In
our case, the rule imposes the condition r = R/N = 3.125 mm has to be
satisfied. The good reliability of this criterion is apparent by the results shown
in Figures 1c-1f. In particular, in Figures 1c and 1d, the B-scans obtained for
the circular cylinder and its wire-grid model are presented, respectively. In
Figures 1e and 1f, electric-field maps calculated in t = 2.2 ns are shown, for the
circular cylinder and its wire-grid model (being t = 0 the time instant in which
the source starts to emit the pulse). Here and in the following, according to a
nomenclature widely accepted by the GPR community, the term ‘A-scan’
refers to an array of electric-field values calculated in a fixed spatial point and
in T consecutive instants (a GPR trace); the term ‘B-scan’ corresponds to a
matrix of electric-field values, calculated in T time instants and M different
spatial points, meaning M A-scans (this is equivalent to assuming that a GPR
‘stops’ in M positions, for example along a line parallel to the air-soil interface,
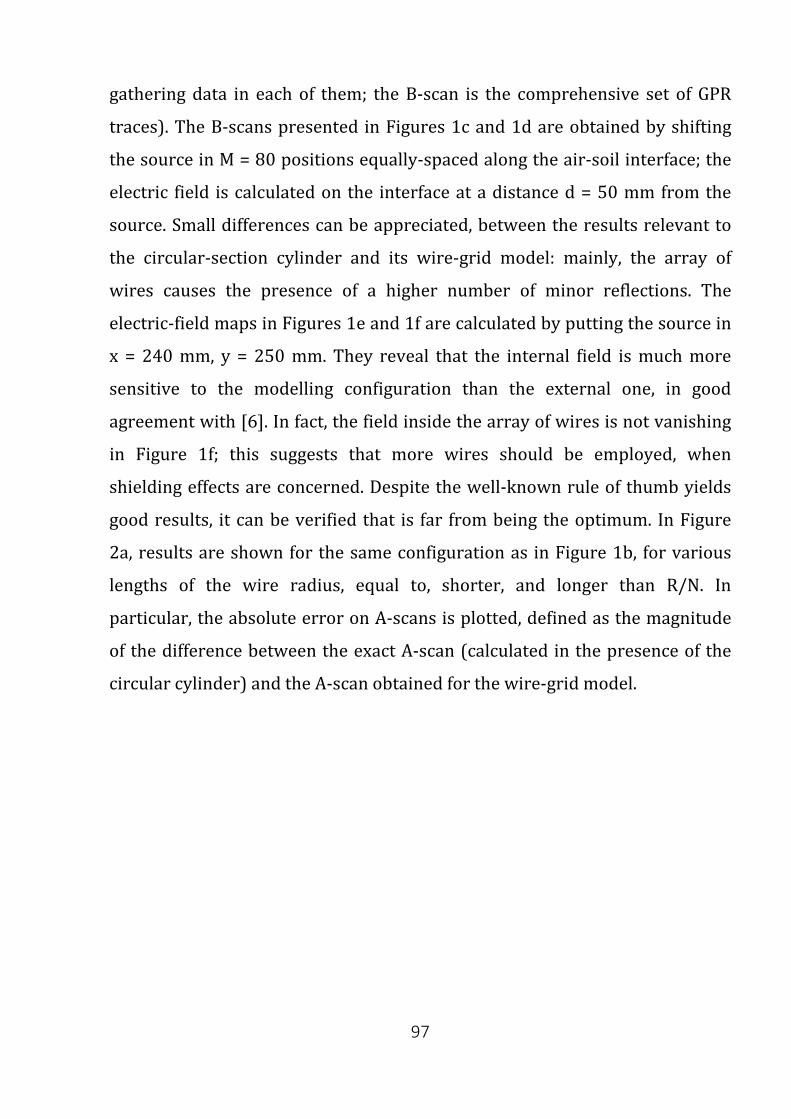
97
gathering data in each of them; the B-scan is the comprehensive set of GPR
traces). The B-scans presented in Figures 1c and 1d are obtained by shifting
the source in M = 80 positions equally-spaced along the air-soil interface; the
electric field is calculated on the interface at a distance d = 50 mm from the
source. Small differences can be appreciated, between the results relevant to
the circular-section cylinder and its wire-grid model: mainly, the array of
wires causes the presence of a higher number of minor reflections. The
electric-field maps in Figures 1e and 1f are calculated by putting the source in
x = 240 mm, y = 250 mm. They reveal that the internal field is much more
sensitive to the modelling configuration than the external one, in good
agreement with [6]. In fact, the field inside the array of wires is not vanishing
in Figure 1f; this suggests that more wires should be employed, when
shielding effects are concerned. Despite the well-known rule of thumb yields
good results, it can be verified that is far from being the optimum. In Figure
2a, results are shown for the same configuration as in Figure 1b, for various
lengths of the wire radius, equal to, shorter, and longer than R/N. In
particular, the absolute error on A-scans is plotted, defined as the magnitude
of the difference between the exact A-scan (calculated in the presence of the
circular cylinder) and the A-scan obtained for the wire-grid model.
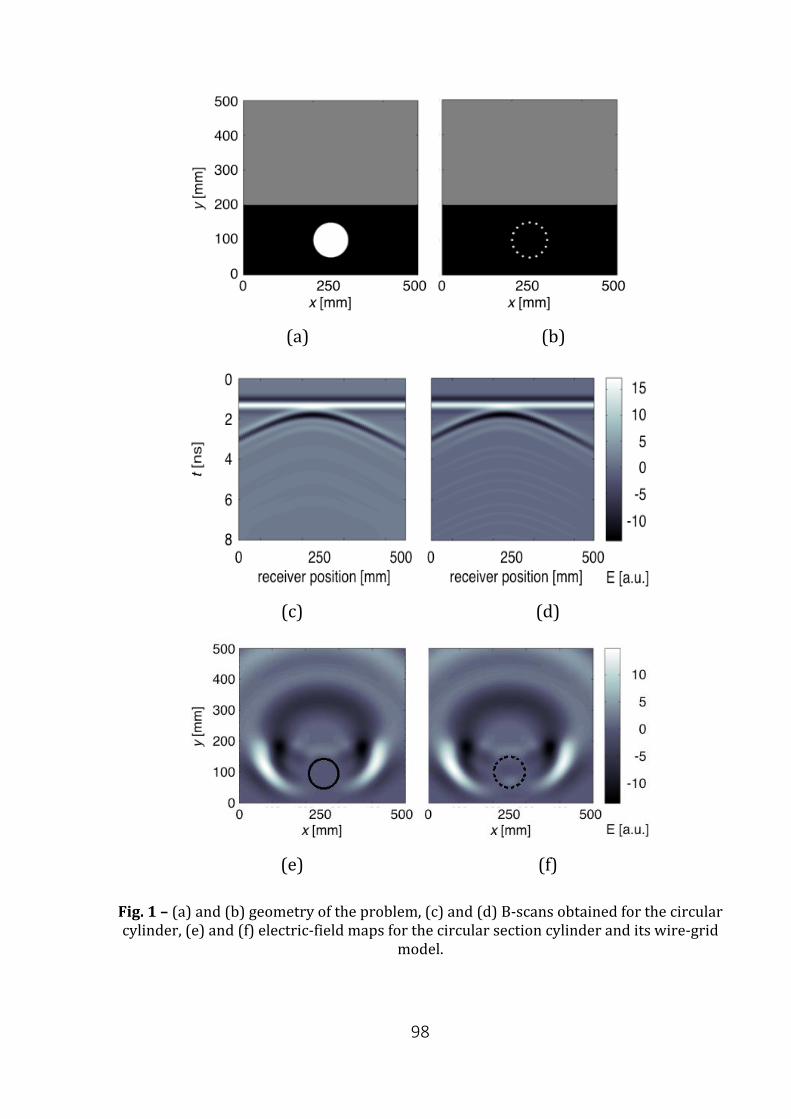
98
(a) (b)
(c) (d)
(e) (f)
Fig. 1 – (a) and (b) geometry of the problem, (c) and (d) B-scans obtained for the circular cylinder, (e) and (f) electric-field maps for the circular section cylinder and its wire-grid
model.
99
The source is in x = 240 mm, y = 250 mm and the field is computed in x = 250
mm, y = 250 mm. With a wire radius longer than the value suggested by the
EAR, worse results are obtained; the lowest error is achieved when r =
0.9R/N. A refinement of this analysis is presented in Figure 2b: it can be noted
that a shortening of about 12%, with respect to the well-known rule of thumb,
gives the best results (the error is reduced of about one order of magnitude).
In Figure 3, the same as in Figure 2 is reported, when N = 32. The error is
slightly lower than when N = 16, as expected. The highest accuracy is achieved
by shortening the radius of about 13%. Changing the radius of the modelled
object and keeping fixed the size of the wires, or varying the object burial
depth, we obtained analogous results. We now investigate whether similar
results are obtained for a buried object with a different shape. To this aim, we
consider a perfectly-conducting square-section cylinder, embedded in a
dielectric half-space, as sketched in Figure 4a. The relative permittivity of the
soil is again Ԑr= 4. The side-length of the square is L = 100 mm, the axis is in x
= 250 mm, y = 100 mm. A wire-grid model of the object is shown in Figure 4b:
it consists of an array of N = 16 circular-section cylinders, with a spacing equal
to 0.25L. To respect the EAR, the condition r = 2L/N𝜋𝜋 ≈ 3.979 mm has to be
satisfied. In Figures 4c and 4d, B-scans obtained for the square-section
cylinder and its wire-grid model are presented, respectively. In Figures. 4e
and 4f, electric-field maps calculated in t = 2.2 ns are shown, for both the
circular cylinder and its wire-grid model, when the source is in x = 240 mm, y
= 250 mm. These results are in agreement with Figure 1; similar comments
apply. In Figure 5, the absolute error on A-scans is shown. The source is in x =
240 mm, y = 250 mm, the field is computed in in x = 250 mm, y = 250 mm.
With a wire radius longer than what was suggested by the EAR, worse results
are obtained. A shortening of about 13-15%, instead, gives the best results. A
general guideline for wire-sizing can be extracted, suggesting that the same-
100
area criterion is affordable, but a higher accuracy can be achieved with wires
smaller than what suggested by the rule. A shortening of about 12-15 % is
recommended.
𝒕𝒕[𝑛𝑛𝑛𝑛]
(a)
𝒕𝒕[𝑛𝑛𝑛𝑛]
(b)
Fig. 2 – (a) Absolute error on A-scans, with N = 16 and for various lengths of the wire radius; (b) refinement of the analysis presented in (a).
Absolute error [a.u]
Absolute error [a.u]
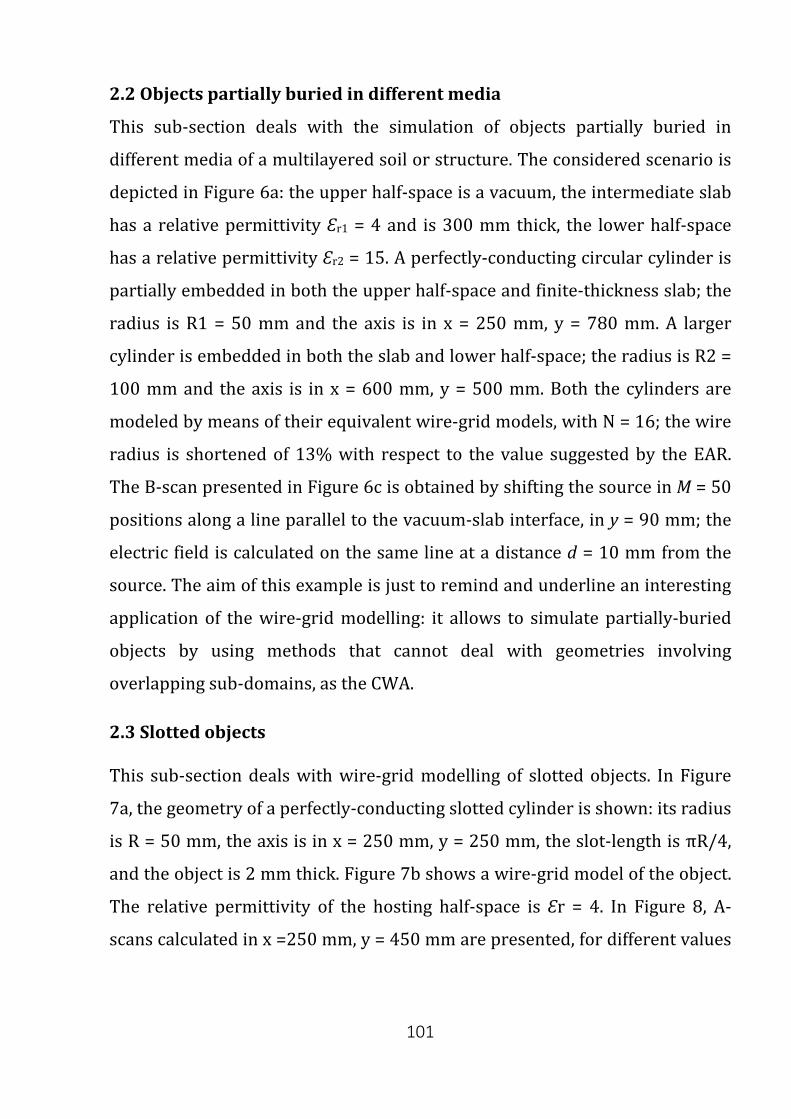
101
2.2 Objects partially buried in different media
This sub-section deals with the simulation of objects partially buried in
different media of a multilayered soil or structure. The considered scenario is
depicted in Figure 6a: the upper half-space is a vacuum, the intermediate slab
has a relative permittivity Ԑr1 = 4 and is 300 mm thick, the lower half-space
has a relative permittivity Ԑr2 = 15. A perfectly-conducting circular cylinder is
partially embedded in both the upper half-space and finite-thickness slab; the
radius is R1 = 50 mm and the axis is in x = 250 mm, y = 780 mm. A larger
cylinder is embedded in both the slab and lower half-space; the radius is R2 =
100 mm and the axis is in x = 600 mm, y = 500 mm. Both the cylinders are
modeled by means of their equivalent wire-grid models, with N = 16; the wire
radius is shortened of 13% with respect to the value suggested by the EAR.
The B-scan presented in Figure 6c is obtained by shifting the source in M = 50
positions along a line parallel to the vacuum-slab interface, in y = 90 mm; the
electric field is calculated on the same line at a distance d = 10 mm from the
source. The aim of this example is just to remind and underline an interesting
application of the wire-grid modelling: it allows to simulate partially-buried
objects by using methods that cannot deal with geometries involving
overlapping sub-domains, as the CWA.
2.3 Slotted objects
This sub-section deals with wire-grid modelling of slotted objects. In Figure
7a, the geometry of a perfectly-conducting slotted cylinder is shown: its radius
is R = 50 mm, the axis is in x = 250 mm, y = 250 mm, the slot-length is πR/4,
and the object is 2 mm thick. Figure 7b shows a wire-grid model of the object.
The relative permittivity of the hosting half-space is Ԑr = 4. In Figure 8, A-
scans calculated in x =250 mm, y = 450 mm are presented, for different values
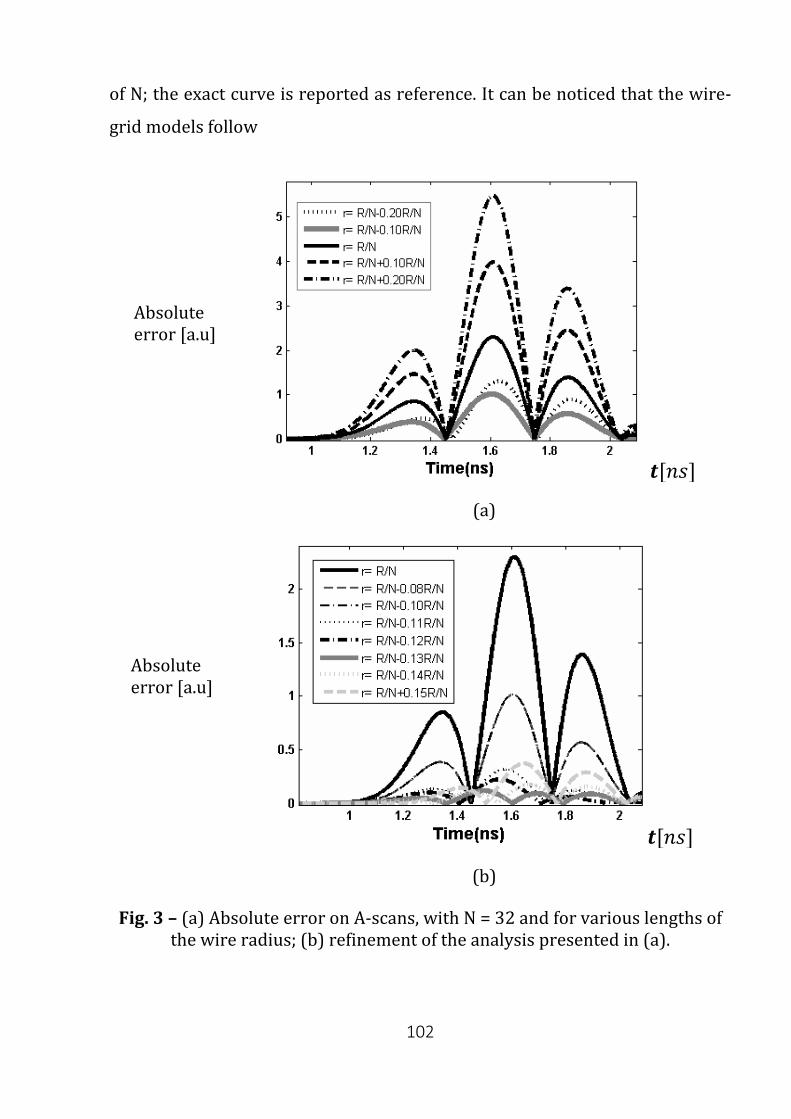
102
of N; the exact curve is reported as reference. It can be noticed that the wire-
grid models follow
𝒕𝒕[𝑛𝑛𝑛𝑛]
(a)
𝒕𝒕[𝑛𝑛𝑛𝑛]
(b)
Fig. 3 – (a) Absolute error on A-scans, with N = 32 and for various lengths of the wire radius; (b) refinement of the analysis presented in (a).
Absolute error [a.u]
Absolute error [a.u]
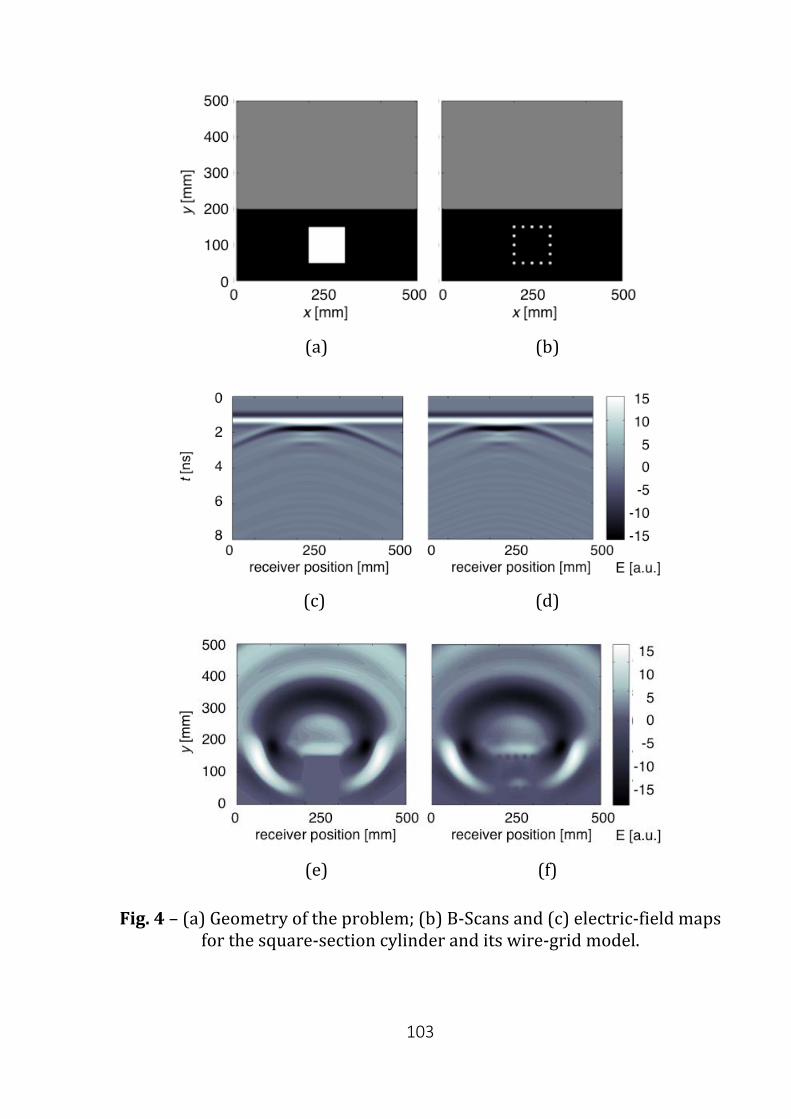
103
(a) (b)
(c) (d)
(e) (f)
Fig. 4 – (a) Geometry of the problem; (b) B-Scans and (c) electric-field maps for the square-section cylinder and its wire-grid model.
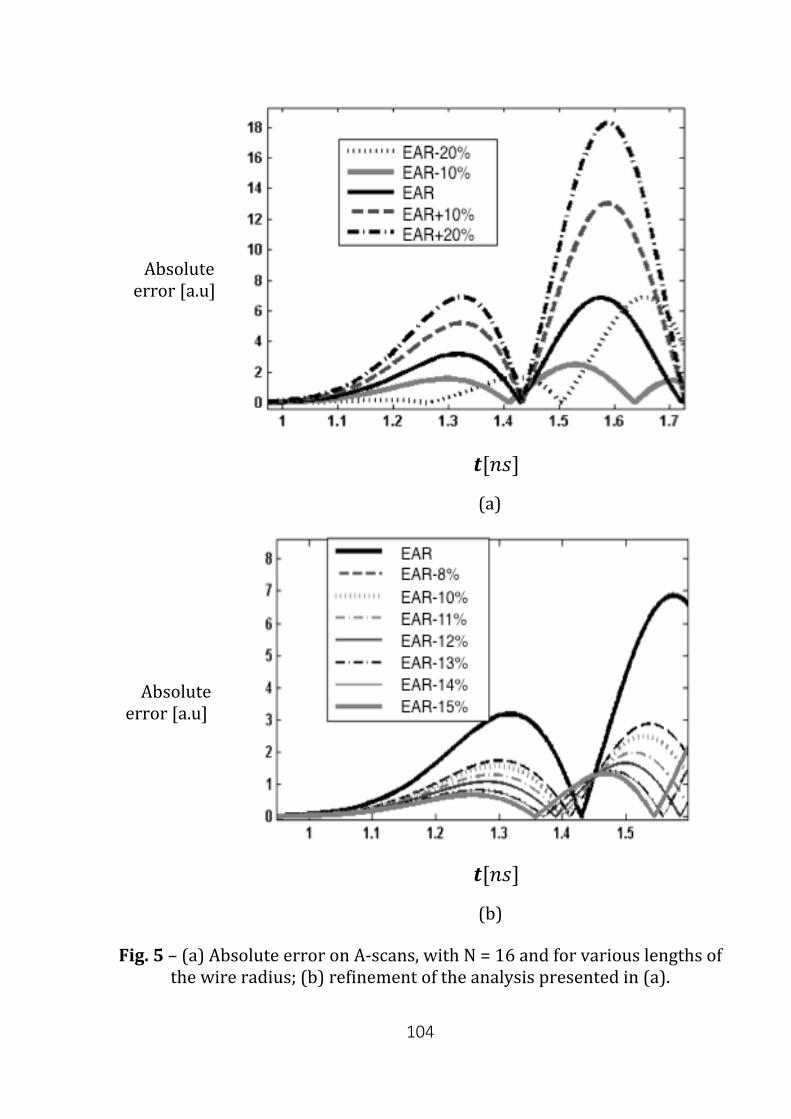
104
𝒕𝒕[𝑛𝑛𝑛𝑛]
(a)
𝒕𝒕[𝑛𝑛𝑛𝑛]
(b)
Fig. 5 – (a) Absolute error on A-scans, with N = 16 and for various lengths of the wire radius; (b) refinement of the analysis presented in (a).
Absolute error [a.u]
Absolute error [a.u]
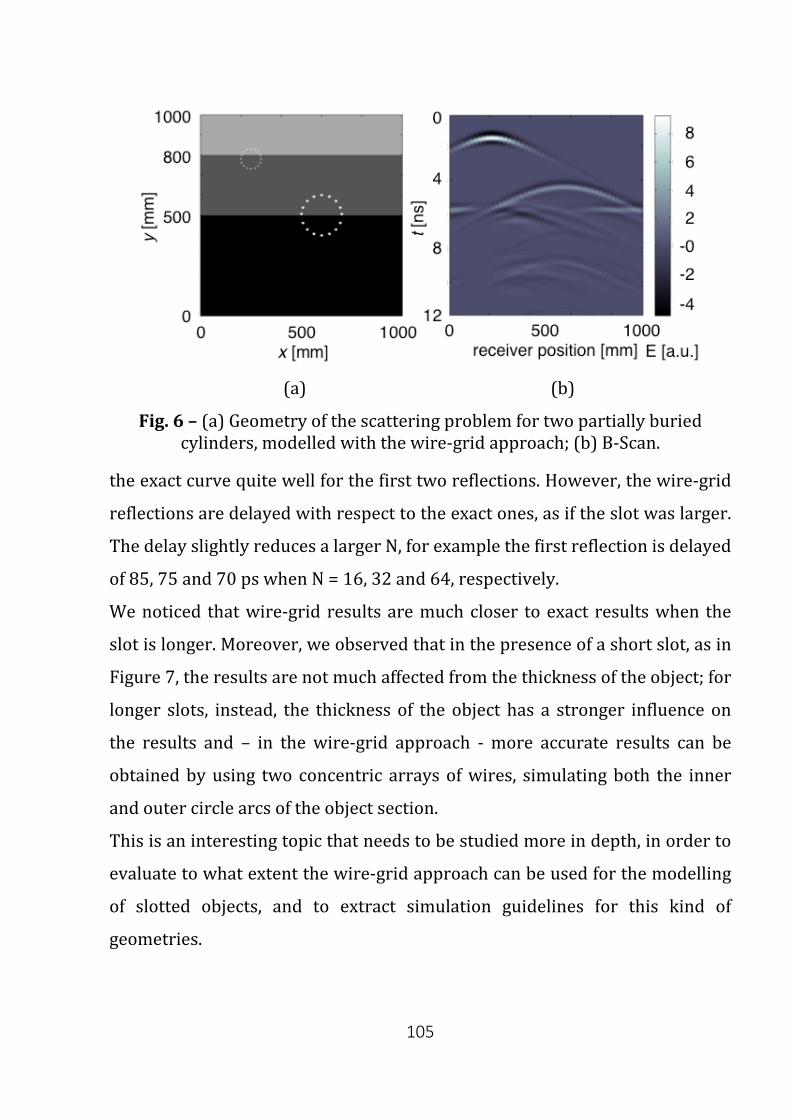
105
(a) (b)
Fig. 6 – (a) Geometry of the scattering problem for two partially buried cylinders, modelled with the wire-grid approach; (b) B-Scan.
the exact curve quite well for the first two reflections. However, the wire-grid
reflections are delayed with respect to the exact ones, as if the slot was larger.
The delay slightly reduces a larger N, for example the first reflection is delayed
of 85, 75 and 70 ps when N = 16, 32 and 64, respectively.
We noticed that wire-grid results are much closer to exact results when the
slot is longer. Moreover, we observed that in the presence of a short slot, as in
Figure 7, the results are not much affected from the thickness of the object; for
longer slots, instead, the thickness of the object has a stronger influence on
the results and – in the wire-grid approach - more accurate results can be
obtained by using two concentric arrays of wires, simulating both the inner
and outer circle arcs of the object section.
This is an interesting topic that needs to be studied more in depth, in order to
evaluate to what extent the wire-grid approach can be used for the modelling
of slotted objects, and to extract simulation guidelines for this kind of
geometries.
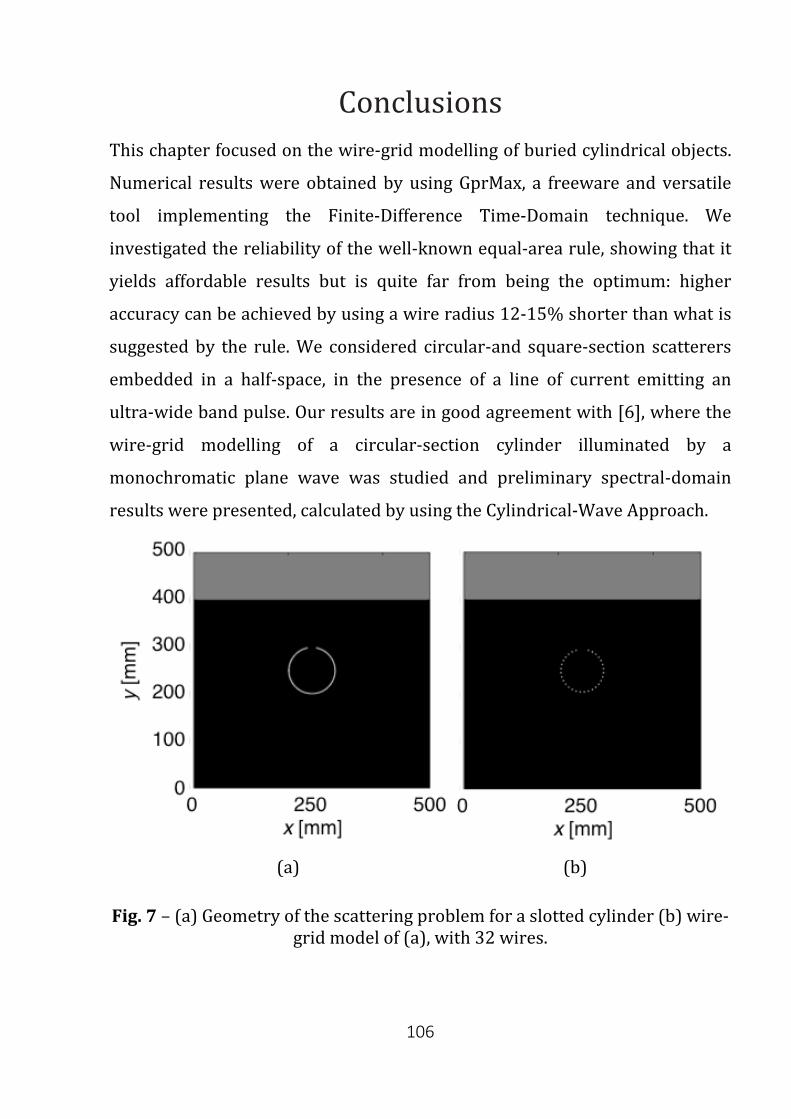
106
Conclusions This chapter focused on the wire-grid modelling of buried cylindrical objects.
Numerical results were obtained by using GprMax, a freeware and versatile
tool implementing the Finite-Difference Time-Domain technique. We
investigated the reliability of the well-known equal-area rule, showing that it
yields affordable results but is quite far from being the optimum: higher
accuracy can be achieved by using a wire radius 12-15% shorter than what is
suggested by the rule. We considered circular-and square-section scatterers
embedded in a half-space, in the presence of a line of current emitting an
ultra-wide band pulse. Our results are in good agreement with [6], where the
wire-grid modelling of a circular-section cylinder illuminated by a
monochromatic plane wave was studied and preliminary spectral-domain
results were presented, calculated by using the Cylindrical-Wave Approach.
(a) (b)
Fig. 7 – (a) Geometry of the scattering problem for a slotted cylinder (b) wire-grid model of (a), with 32 wires.
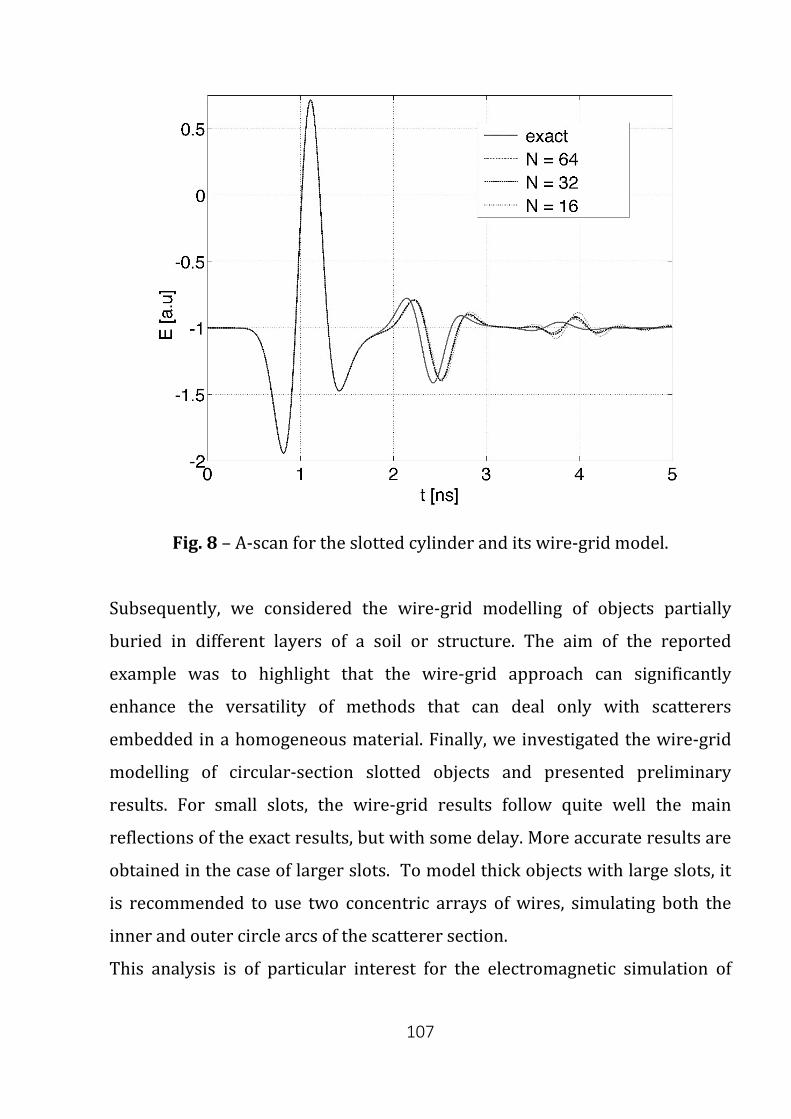
107
Fig. 8 – A-scan for the slotted cylinder and its wire-grid model.
Subsequently, we considered the wire-grid modelling of objects partially
buried in different layers of a soil or structure. The aim of the reported
example was to highlight that the wire-grid approach can significantly
enhance the versatility of methods that can deal only with scatterers
embedded in a homogeneous material. Finally, we investigated the wire-grid
modelling of circular-section slotted objects and presented preliminary
results. For small slots, the wire-grid results follow quite well the main
reflections of the exact results, but with some delay. More accurate results are
obtained in the case of larger slots. To model thick objects with large slots, it
is recommended to use two concentric arrays of wires, simulating both the
inner and outer circle arcs of the scatterer section.
This analysis is of particular interest for the electromagnetic simulation of
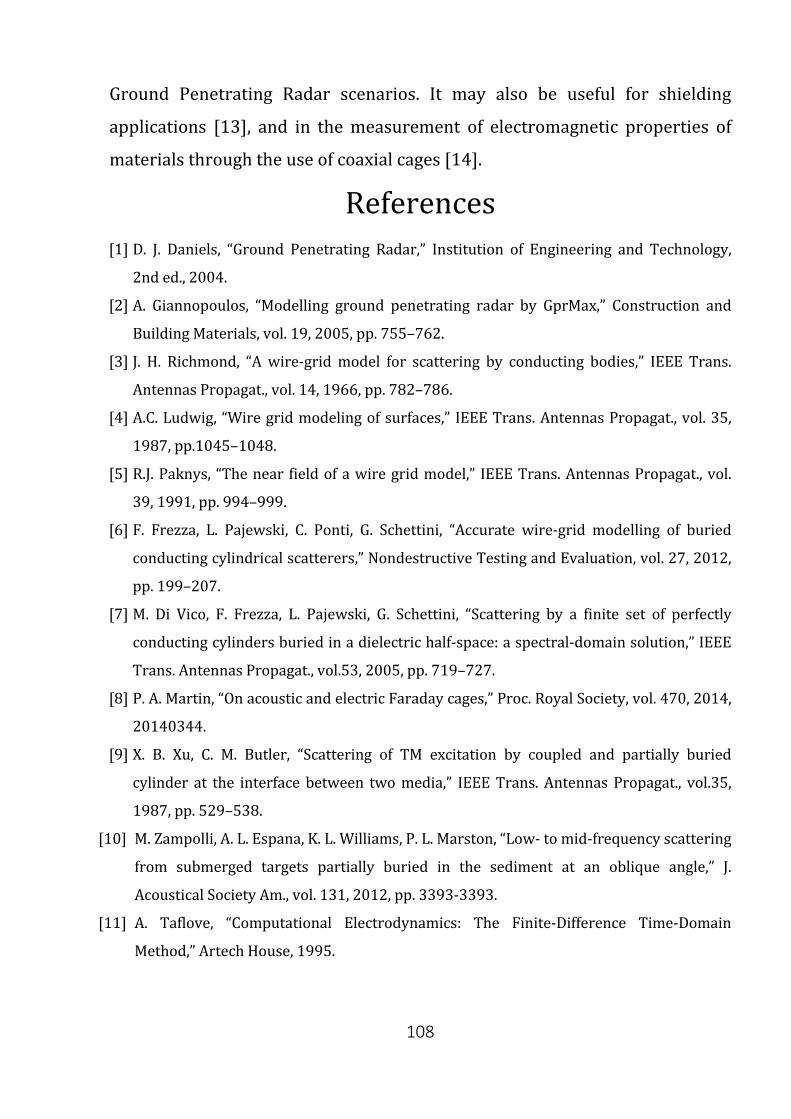
108
Ground Penetrating Radar scenarios. It may also be useful for shielding
applications [13], and in the measurement of electromagnetic properties of
materials through the use of coaxial cages [14].
References [1] D. J. Daniels, “Ground Penetrating Radar,” Institution of Engineering and Technology,
2nd ed., 2004.
[2] A. Giannopoulos, “Modelling ground penetrating radar by GprMax,” Construction and
Building Materials, vol. 19, 2005, pp. 755–762.
[3] J. H. Richmond, “A wire-grid model for scattering by conducting bodies,” IEEE Trans.
Antennas Propagat., vol. 14, 1966, pp. 782–786.
[4] A.C. Ludwig, “Wire grid modeling of surfaces,” IEEE Trans. Antennas Propagat., vol. 35,
1987, pp.1045–1048.
[5] R.J. Paknys, “The near field of a wire grid model,” IEEE Trans. Antennas Propagat., vol.
39, 1991, pp. 994–999.
[6] F. Frezza, L. Pajewski, C. Ponti, G. Schettini, “Accurate wire-grid modelling of buried
conducting cylindrical scatterers,” Nondestructive Testing and Evaluation, vol. 27, 2012,
pp. 199–207.
[7] M. Di Vico, F. Frezza, L. Pajewski, G. Schettini, “Scattering by a finite set of perfectly
conducting cylinders buried in a dielectric half-space: a spectral-domain solution,” IEEE
Trans. Antennas Propagat., vol.53, 2005, pp. 719–727.
[8] P. A. Martin, “On acoustic and electric Faraday cages,” Proc. Royal Society, vol. 470, 2014,
20140344.
[9] X. B. Xu, C. M. Butler, “Scattering of TM excitation by coupled and partially buried
cylinder at the interface between two media,” IEEE Trans. Antennas Propagat., vol.35,
1987, pp. 529–538.
[10] M. Zampolli, A. L. Espana, K. L. Williams, P. L. Marston, “Low- to mid-frequency scattering
from submerged targets partially buried in the sediment at an oblique angle,” J.
Acoustical Society Am., vol. 131, 2012, pp. 3393-3393.
[11] A. Taflove, “Computational Electrodynamics: The Finite-Difference Time-Domain
Method,” Artech House, 1995.
109
[12] K. Yee, “Numerical solution of initial boundary value problems involving Maxwell’s
equations in isotropic media,” IEEE Trans. Antennas Propagat., vol.14, 1966, pp. 302–
307.
[13] S. Celozzi, R. Araneo, G. Lovat, “Electromagnetic shielding,” Wiley-IEEE Press, 2008.
[14] E. Mattei, S. E. Lauro, E. Pettinelli, G. Vannaroni, “Coaxial-Cage Transmission Line for
Electromagnetic Parameters Estimation,” IEEE Trans. Instrumentation and
Measurements, vol. 62, 2013, pp. 2938-2942.
110
Part II
Electromagnetic techniques for the evaluation of the dielectric
permittivity of media
111
Chapter II.1
Measurement System for Evaluating Dielectrics Permittivity of Granular Materials
in the 1.7-2.6 GHz Band
Introduction The development of dielectric spectroscopy techniques, with particular
emphasis on those operating in the microwave frequency range, has attracted
an increasing interest in the last few years [1]. Such techniques permit
measurement of the frequency-dependent complex permittivity of a material
sample. Knowledge of this quantity can prove useful for quality-control
purposes [2], [3] or for understanding the interaction of the material with an
electromagnetic wave and the corresponding heating effect [4]. A specific field
of application of microwave heating, especially at the 2.45-GHz industrial,
scientific and medical (ISM) frequency, is road maintenance [5]. Indeed, by
heating the asphalt concrete through the use of microwaves, it is possible to
perform on-site repairs of holes or cracks present on the road surface. Still,
microwaves might even be employed in the production stage of the asphalt
concrete, as a substitute to conventional ovens currently exploited for drying
and heating the mineral aggregates, which are subsequently bound together
with asphalt. Microwave heating might also help for the recycling process of
112
reclaimed asphalt pavement. Mineral aggregates used inside the asphalt
concrete mixture have different sizes, typically ranging from less than 1 up to
25 mm in diameter. They are obtained from basalt or calcareous rocks. In the
final concrete, they are bound together by asphalt (or bitumen), which is
usually refined from petroleum. The key data needed for studying the
feasibility of a microwave system for asphalt concrete production or recycling
are the complex permittivities of the concrete components (asphalt and
mineral aggregates) and the concrete itself. Therefore, an accurate system
suitable to perform complex permittivity measurements around 2.45 GHz on
both compact and granular materials is needed. The most common solutions
in this frequency range exploit open-ended coaxial probes [6], whose tip is
placed in contact with the material [7]. However, such systems are not
suitable to perform measurements on granular materials and have a sensitive
area that is definitely too small to allow a correct characterization of asphalt
concrete, which is a mixture whose granular components can also be several
tens of millimeters in diameter. To overcome such limitation,
transmission/reflection solutions can be adopted, where the material is
placed inside a suitable section of transmission line [8]. However, currently,
implemented systems are based on a coaxial structure [9], [10] and operate in
a frequency region well below the ISM band at 2.45 GHz. On the other hand,
the most widespread waveguide measurement systems are based on the
WR90 standard waveguide, allowing measurements in the 8–12-GHz band (X-
band).
In this chapter, the design and the metrological characterization of a
waveguide system, suitable to perform complex permittivity measurements
on material samples of
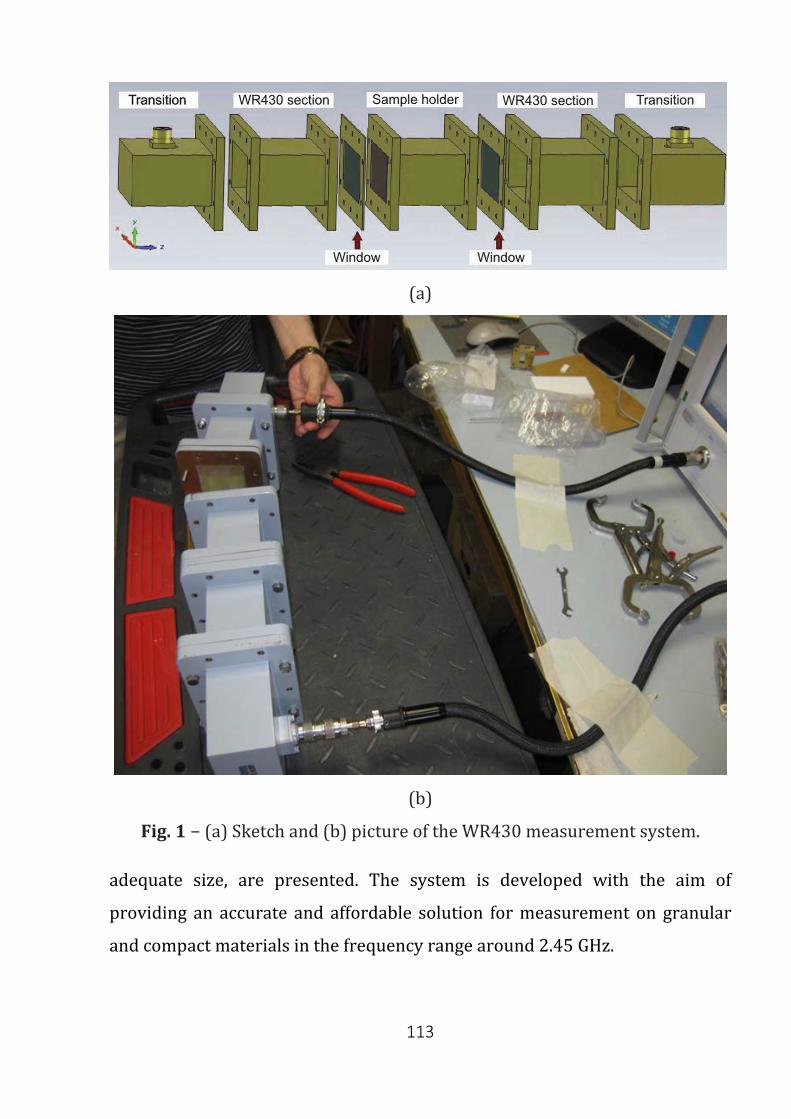
113
(a)
(b)
Fig. 1 − (a) Sketch and (b) picture of the WR430 measurement system.
adequate size, are presented. The system is developed with the aim of
providing an accurate and affordable solution for measurement on granular
and compact materials in the frequency range around 2.45 GHz.
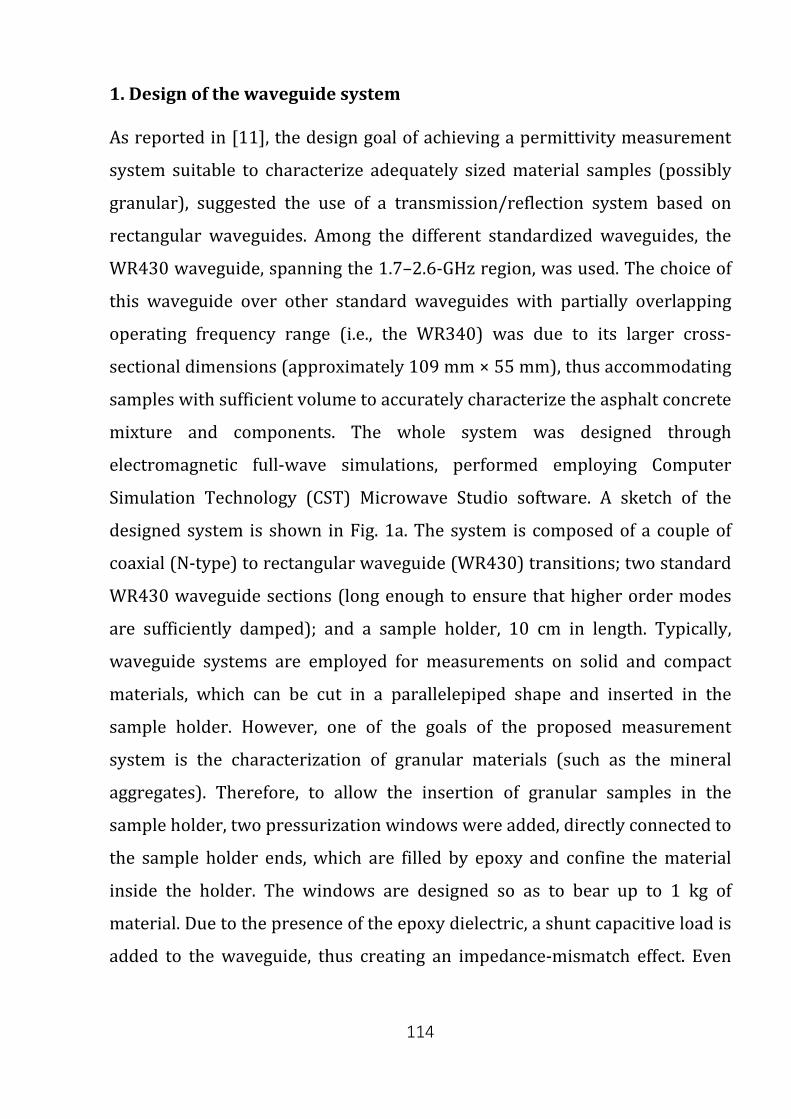
114
1. Design of the waveguide system
As reported in [11], the design goal of achieving a permittivity measurement
system suitable to characterize adequately sized material samples (possibly
granular), suggested the use of a transmission/reflection system based on
rectangular waveguides. Among the different standardized waveguides, the
WR430 waveguide, spanning the 1.7–2.6-GHz region, was used. The choice of
this waveguide over other standard waveguides with partially overlapping
operating frequency range (i.e., the WR340) was due to its larger cross-
sectional dimensions (approximately 109 mm × 55 mm), thus accommodating
samples with sufficient volume to accurately characterize the asphalt concrete
mixture and components. The whole system was designed through
electromagnetic full-wave simulations, performed employing Computer
Simulation Technology (CST) Microwave Studio software. A sketch of the
designed system is shown in Fig. 1a. The system is composed of a couple of
coaxial (N-type) to rectangular waveguide (WR430) transitions; two standard
WR430 waveguide sections (long enough to ensure that higher order modes
are sufficiently damped); and a sample holder, 10 cm in length. Typically,
waveguide systems are employed for measurements on solid and compact
materials, which can be cut in a parallelepiped shape and inserted in the
sample holder. However, one of the goals of the proposed measurement
system is the characterization of granular materials (such as the mineral
aggregates). Therefore, to allow the insertion of granular samples in the
sample holder, two pressurization windows were added, directly connected to
the sample holder ends, which are filled by epoxy and confine the material
inside the holder. The windows are designed so as to bear up to 1 kg of
material. Due to the presence of the epoxy dielectric, a shunt capacitive load is
added to the waveguide, thus creating an impedance-mismatch effect. Even
115
though this can be compensated for through standard vector error correction
procedures, the windows were equipped with a printed inductive copper iris.
Such an iris, typically realized through two thin rectangular metal patches
protruding from the narrow walls of the waveguide (so as to reduce its
effective width), is designed to provide a shunt inductance able to cancel,
through resonance, the capacitive mismatch at the target frequency of 2.45
GHz [12]. To slightly enlarge the matching bandwidth, the iris was designed
with an elliptically shaped (rather than straight) contour, whose eccentricity
was optimized through specific electromagnetic simulations. The whole
structure is made of brass, with copper-plated inner walls. To make the
system practically usable for performing reflection/transmission
measurements with a vector network analyzer, it is necessary to apply the
vector error correction procedure at the sample holder ports [13]. Such
procedure permits compensation for most of the systematic errors and
requires a specific calibration kit. The most simple calibration standards to be
employed for waveguide systems are the short circuit (i.e., a metallic end
plate) and a waveguide section of known length (typically equal to one-fourth
of the wavelength computed in the middle of the operating frequency band).
This set of standards accommodates the thru-reflect-line (TRL) vector error
correction procedure. Fortunately, there are several waveguide calibration
kits available on the market; however, to the best of authors’ knowledge, none
of them is suitable for the WR430 waveguide format. Therefore, the short
circuit and waveguide section standards were built as part of the whole
project. Starting from their geometrical and electrical characterization, a
custom model for the developed calibration kit was implemented and added
to the network analyzer data base [14].
116
2. Measurement model and uncertainty
In transmission/reflection measurements, the sample is placed inside the
waveguide and an electromagnetic wave is launched at the waveguide port.
By measuring the scattering parameters at the waveguide ports, it is possible
to retrieve the complex permittivity of the sample through an appropriate
measurement model. Historically, the first works that proposed permittivity
measurements with the transmission/reflection technique date back to the
mid-20th century [15]–[17]. However, it was only in the early 1970s that a
new model was developed in [18] and further optimized in [19]: such model,
known as Nicolson–Ross–Weir (NRW), accurately operates only at
frequencies far from the sample resonances, which occur whenever the
sample length becomes an integer multiple of half wavelength computed
inside the sample. An alternative model for evaluating the complex
permittivity of the sample, starting from the measured scattering parameters,
has been developed by the National Institute of Standards and Technology
(NIST) [8], [20]: such a model employs a mathematical formulation that
largely limits errors related to sample resonances. In this chapter,
measurements were performed using an Agilent E8363C vector network
analyzer, equipped with Agilent 85071E permittivity measurement software
[21]. In particular, this software provides different measurement models,
including the aforementioned NRW and NIST models. The measurement
results reported herein have been obtained employing the NIST model, which
has been proved to be the most accurate for nonmagnetic materials, like the
ones of interest for this chapter.
117
2.1 Uncertainty Contributions
A theoretical evaluation of permittivity measurement uncertainty for the NIST
model can be found in [8] and [20]. Applying such evaluation to the proposed
system, the following main uncertainty contributions can be identified: 1)
uncertainty in scattering parameters; 2) air gaps between sample and holder;
3) dimensional uncertainty in the sample holder; 4) uncertainty in sample
length; and 5) uncertainty in the exact sample positioning inside the holder. In
measurements on solid and compact materials, many of these contributions
were made negligible thanks to the chosen mechanical tolerances in the
system realization and to the accurate milling of the material samples.
Therefore, the main remaining contributions are likely those related to
scattering parameters and to the sample length. In particular, the uncertainty
in sample length is mainly the result of the imperfect planarity of the sample
surface, especially for pliable materials. Exploiting the results reported in [8]
for the sensitivity coefficients, using uncertainty figures taken from the
network analyzer datasheets for scattering parameter measurements, and
assuming a worst case uncertainty of 0.05 mm in sample length (on the basis
of the measured nonplanarity), the combined uncertainty on the real part of
the measured permittivity is about 2% (average value over the entire
frequency band). This result is in optimum agreement with typical uncertainty
stated in the 85071E software specifications [21]. Clearly, for measurements
on granular materials, some of the aforementioned uncertainty contributions
may become more prominent. For example, the sample length is harder to be
accurately evaluated. In addition, inhomogeneities in the sample may lead to
the propagation of higher order modes. Higher order mode propagation, in
particular, is responsible for a deterioration in the accuracy of scattering
parameter measurements, which become affected by spurious oscillations.
These artifacts on the scattering parameters can lead to an increased
118
uncertainty in estimated permittivity, especially around sample resonances,
where the sensitivity coefficients for the NIST model tend to become rather
large. However, as long as an average value of the permittivity is of interest,
because no significant relaxation processes are expected in the measurement
bandwidth, artifacts around sample resonances are not of great concern and
should not decrease measurement accuracy in a significant way.
3. Experimental characterization of the proposed system
To characterize the presented WR430 custom system, measurements were
performed on a set of different solid materials. Unfortunately, while for
reference liquid materials, very accurate databases of permittivity are
available [22], it is more complex to obtain reliable reference solid materials.
Therefore, we used low-permittivity solid materials that are known to exhibit
an extremely flat permittivity over the entire microwave frequency band. In
this way, it was possible to validate the system through a comparison with
measurements performed on the same materials employing a standard WR90
waveguide system operating between 8.2 and 12.4 GHz, and used as a
reference. Indeed, the WR90 waveguide system is entirely based on
commercial components (with the exception of the sample holder, realized
with a milling machine with 0.005 mm repeatability), and it is an excellent
candidate to be used as a reference for comparing the WR430 custom system
measurements, thanks to its stated typical worst case uncertainty equal to 2%
[21]. For the characterization of the system, the following materials were
chosen: 1) low-density polyvinyl chloride; 2) polytetrafluoroethylene; 3)
polymethyl methacrylate; and 4) polycarbonate. These test materials were
chosen to satisfy the following criteria: 1) flat permittivity spectrum so as to
allow a direct comparison between the results obtained with the WR430 and
the WR90 systems; 2) low permittivity (real part less than 8), in order to

119
better represent permittivities of asphalt concrete main components; 3) ease
of mechanical processing for preparing the parallelepiped samples. For each
material, two different samples were machined (both taken from the same
material block): 1) one to be inserted in the WR430 and 2) the other in the
WR90 waveguides. The experimental setup for the WR430 measurement
system is shown in Figure 1b. Measurements in both frequency bands were
performed using the Agilent E8363C precision network analyzer (PNA). In all
the measurements, the TRL error correction procedure was applied, thus
compensating for possible nonidealities (such as spurious reflections, wall
losses, and electrical delay introduced by the sample holder).
Table I − Values of the real part of the dielectric permittivity, as measured through the
WR430 waveguide and the standard WR90 system, for the reference solid materials. the
percentage difference is also reported
Throughout the experimental session, the environmental temperature,
monitored through a thermistor sensor, was within the (26.5±1.0) °C range.
Table I summarizes the measurement results for the different material
samples. In particular, for each tested material, the average value measured
for the real part of the permittivity, throughout the entire frequency
bandwidth, and the corresponding percentage differences are reported. The
results obtained with the proposed WR430 and with the traditional WR90
120
systems are in good agreement; in fact, the percentage differences between
the average permittivities measured through the two systems are below 1%.
References [1] E. Piuzzi et al., “A comparative analysis between customized and commercial systems
for complex permittivity measurements on liquid samples at microwave
frequencies,” IEEE Trans. Instrum. Meas., vol. 62, no. 5, pp. 1034–1046, May 2013.
[2] A. Cataldo, E. Piuzzi, G. Cannazza, E. De Benedetto, and L. Tarricone, “Quality and anti-
adulteration control of vegetable oils through microwave dielectric spectroscopy,”
Measurement, vol. 43, no. 8, pp. 1031–1039, 2010.
[3] A. Cataldo, E. Piuzzi, G. Cannazza, and E. De Benedetto, Classification and adulteration
control of vegetable oils based on microwave reflectom- etry analysis,” J. Food Eng.,
vol. 112, no. 4, pp. 338–345, 2012.
[4] J. M. Osepchuk, “A history of microwave heating applications,” IEEE Trans. Microw.
Theory Techn., vol. 32, no. 9, pp. 1200–1224, Sep. 1984.
[5] R. G. Bosisio, J. Spooner, and J. Granger, “Asphalt road maintenance with a mobile
microwave power unit,” J. Microw. Power, vol. 9, no. 4, pp. 381–386, 1974.
[6] M. Adous, P. Quéffélec, and L. Laguerre, “Coaxial/cylindrical transition line for
broadband permittivity measurement of civil engineering materials,” Meas. Sci.
Technol., vol. 17, no. 8, pp. 2241–2246, 2006.
[7] M. A. Stuchly and S. S. Stuchly, “Coaxial line reflection methods for measuring
dielectric properties of biological substances at radio and microwave frequencies-A
review,” IEEE Trans. Instrum. Meas., vol. 29, no. 3, pp. 176–183, Sep. 1980.
[8] J. Baker-Jarvis, M. D. Janezic, J. H. Grosvenor, Jr., and R. G. Geyer,
“Transmission/reflection and short-circuit line methods for measuring permittivity
and permeability,” NIST, Boulder, CO, USA, Tech. Note 1355-R, 1992.
[9] J. Q. Shang, “Effects of asphalt pavement properties on complex permittivity,” Int. J.
Pavement Eng., vol. 3, no. 4, pp. 217–226, 1999.
[10] J. Q. Shang, J. A. Umana, F. M. Bartlett, and J. R. Rossiter, “Measurement of complex
permittivity of asphalt pavement materials,” J. Transp. Eng., vol. 125, no. 4, pp. 347–
356, 1999.
121
[11] E. Piuzzi et al., “Design and characterization of a measurement system for dielectric
spectroscopy investigations on granular materials in the 2.45 GHz ISM band,” in Proc.
IEEE Int. Instrum. Meas. Technol. Conf. (I2MT), Pisa, Italy, May 2015, pp. 734-738.
[12] N. Marcuvitz, Waveguide Handbook. New York, NY, USA: Dover, 1951. [13] “Applying
error correction to network analyzer measurements,” Agilent Technol., Santa Clara,
CA, USA, Appl. Note 1287-3, 2002.
[14] “Specifying calibration standards and kits for Agilent vector network analyzers,”
Agilent Technol., Santa Clara, CA, USA, Appl. Note 1287-11, 2011.
[15] A. R. von Hippel, Ed., Dielectric Materials and Applications. New York, NY, USA: Wiley,
1954.
[16] M. Sucher and J. Fox, Eds., Handbook of Microwave Measurements. New York, NY, USA:
Polytechnic Institute of Brooklyn, 1963.
[17] C. G. Montgomery, Ed., Technique of Microwave Measurements. Boston, MA, USA:
Boston Technical Publishers, 1964.
[18] A. M. Nicolson and G. F. Ross, “Measurement of the intrinsic properties of materials by
time-domain techniques,” IEEE Trans. Instrum. Meas., vol. 19, no. 4, pp. 377-382, Nov.
1970.
[19] W. B. Weir, “Automatic measurement of complex dielectric constant and permeability
at microwave frequencies,” Proc. IEEE, vol. 62, no. 1, pp. 33–36, Jan. 1974.
[20] J. Baker-Jarvis, E. J. Vanzura, and W. A. Kissick, “Improved technique for determining
complex permittivity with the transmission/reflection method,” IEEE Trans. Microw.
Theory Techn., vol. 38, no. 8, pp. 1096-1103, Aug. 1990.
[21] “Materials measurement software: Technical overview,” Agilent Technol., Santa Clara,
CA, USA, Tech. Rep. 85071E, 2012.
[22] A. P. Gregory and R. N. Clarke, “Tables of the complex permittivity of dielectric
reference liquids at frequencies up to 5 GHz,” Nat. Phys. Lab., Teddington, U.K., Tech.
Rep. MAT 23, 2009.
122
Chapter II.2
Experimental results on granular inert materials
Introduction To test the performance of the proposed in chapter I, measurements were also
carried out on typical materials used for asphalt, moistened at different water
content levels. Finally, different dielectric mixing models were investigated
and their suitability for the considered materials was verified.
1. Results on basaltic and calcareous materials
To test the suitability of the proposed WR430 system for dielectric
spectroscopy investigations on asphalt materials, measurements were
performed on two materials that are typically used in the asphalt industry: 1)
calcareous and 2) basaltic aggregates. Both these materials were screened so
as to obtain stones with a diameter ranging from 2 to 4 mm.
The total porosity (ϕ), defined as the total pore space per unit volume of
granular material (including both air contained inside the single grains and air
filling the empty spaces between grains) [23], was estimated as follows. A
volume of dry material (Vdry) equal to the one required to fill the sample
holder was placed in a container. Some water was placed in another container
123
and weighed with an electronic balance (Wb). The water was poured inside
the material sample, until the material sample was filled with water. The
remaining water was then weighed (W f). The volume of the added water
(Va.w.) was evaluated as (Wb − W f)/ρwater, where ρwater is the density of water.
Finally, the porosity was estimated as 𝜙𝜙 = Va.w./ Vdry [24]. In this way, the 𝜙𝜙
values of the two materials were estimated to be 𝜙𝜙calc = 41.8% for the
calcareous material and 𝜙𝜙bas = 49.3% for the basaltic material. The same
samples used for estimating porosity were subsequently employed for
permittivity measurements. For each material, the dielectric spectroscopy
measurements were carried out as follows. Starting from the oven-dried
material, the sample was moistened at progressively higher values of
volumetric water content (θref)
𝜃𝜃𝑟𝑟𝑐𝑐𝑟𝑟 = � 𝑑𝑑𝑤𝑤𝑑𝑑𝑑𝑑𝑑𝑑𝑑𝑑
� × 100 (1)
where Vw is the volume of the added water.
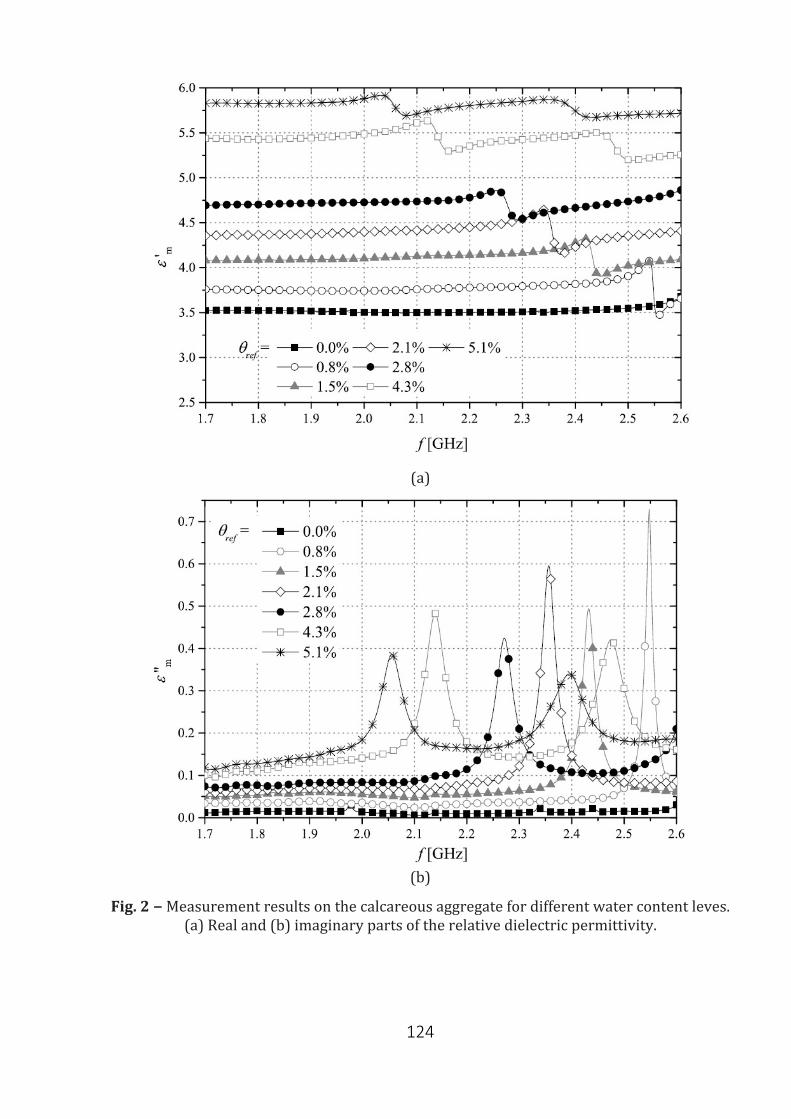
124
(a)
(b)
Fig. 2 − Measurement results on the calcareous aggregate for different water content leves. (a) Real and (b) imaginary parts of the relative dielectric permittivity.
125
For each moistening step, the sample was inserted in the sample holder and
shaken so as to ensure that its volume was constant, and the corresponding
real part 𝜀𝜀𝑚𝑚′ and imaginary part 𝜀𝜀𝑚𝑚′′ of the relative dielectric permittivity
were measured with the WR430 system. The actual water content was
estimated by weighing the sample immediately after its removal from the
sample holder. With regard to the calcareous aggregate, starting from the
oven-dried condition, it was moistened at θref = 0.8%, 1.5%, 2.1%, 2.8%, 4.3%,
and, finally, 5.1% (this final value corresponding to near saturation). Figures
2a and 2b shows the 𝜀𝜀𝑚𝑚′ and 𝜀𝜀𝑚𝑚′′ results in the considered frequency range,
respectively.
Similar experiments were performed on the basaltic material. Starting from
the oven-dried material, the sample was moistened at θref = 0.9%, 1.8%, 3.0%,
4.2%, 6.3%, and, finally, 7.1%. Also in this case, this final value corresponds to
near saturation. Figures 3a and 3b shows the 𝜀𝜀𝑚𝑚′ and 𝜀𝜀𝑚𝑚′′ results in the
considered frequency range, respectively. For both the considered materials
and for each considered θref value, the corresponding permittivity values are
generally constant in the considered frequency range, thus showing a low
dispersivity of the material. Indeed, some fluctuations and abrupt variations
are present. As previously discussed, they are attributable to the sample
resonances and are unavoidable
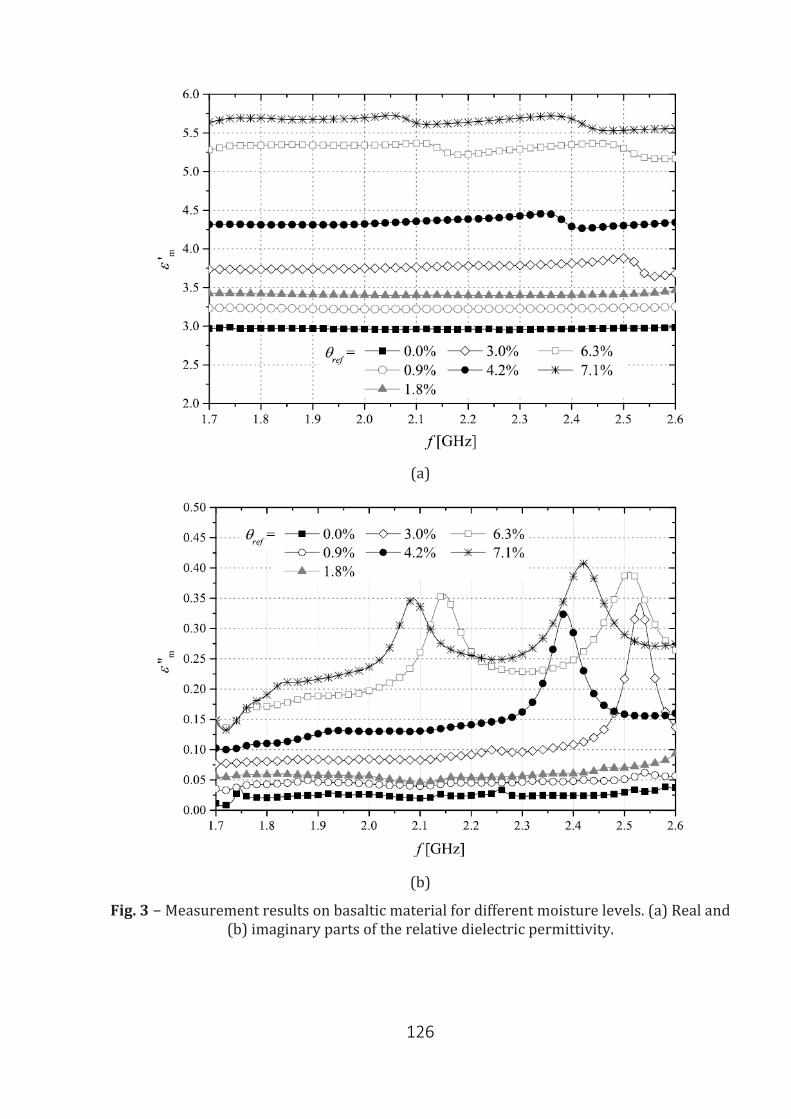
126
(a)
(b)
Fig. 3 − Measurement results on basaltic material for different moisture levels. (a) Real and (b) imaginary parts of the relative dielectric permittivity.
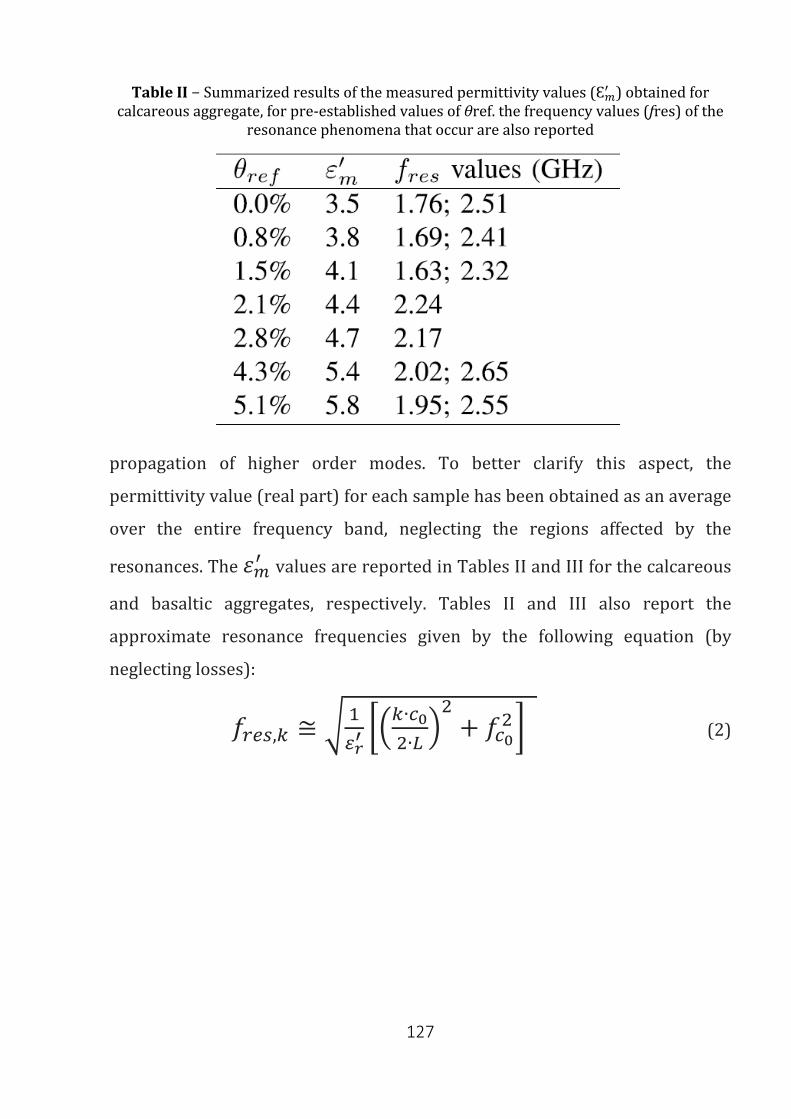
127
Table II − Summarized results of the measured permittivity values (Ԑ𝑚𝑚′ ) obtained for calcareous aggregate, for pre-established values of θref. the frequency values (fres) of the
resonance phenomena that occur are also reported
propagation of higher order modes. To better clarify this aspect, the
permittivity value (real part) for each sample has been obtained as an average
over the entire frequency band, neglecting the regions affected by the
resonances. The 𝜀𝜀𝑚𝑚′ values are reported in Tables II and III for the calcareous
and basaltic aggregates, respectively. Tables II and III also report the
approximate resonance frequencies given by the following equation (by
neglecting losses):
𝑓𝑓𝑟𝑟𝑐𝑐𝑟𝑟,𝑝𝑝 ≅ �1𝜀𝜀𝑑𝑑′��𝑝𝑝∙𝑐𝑐0
2∙𝐿𝐿�2
+ 𝑓𝑓𝑐𝑐02� (2)
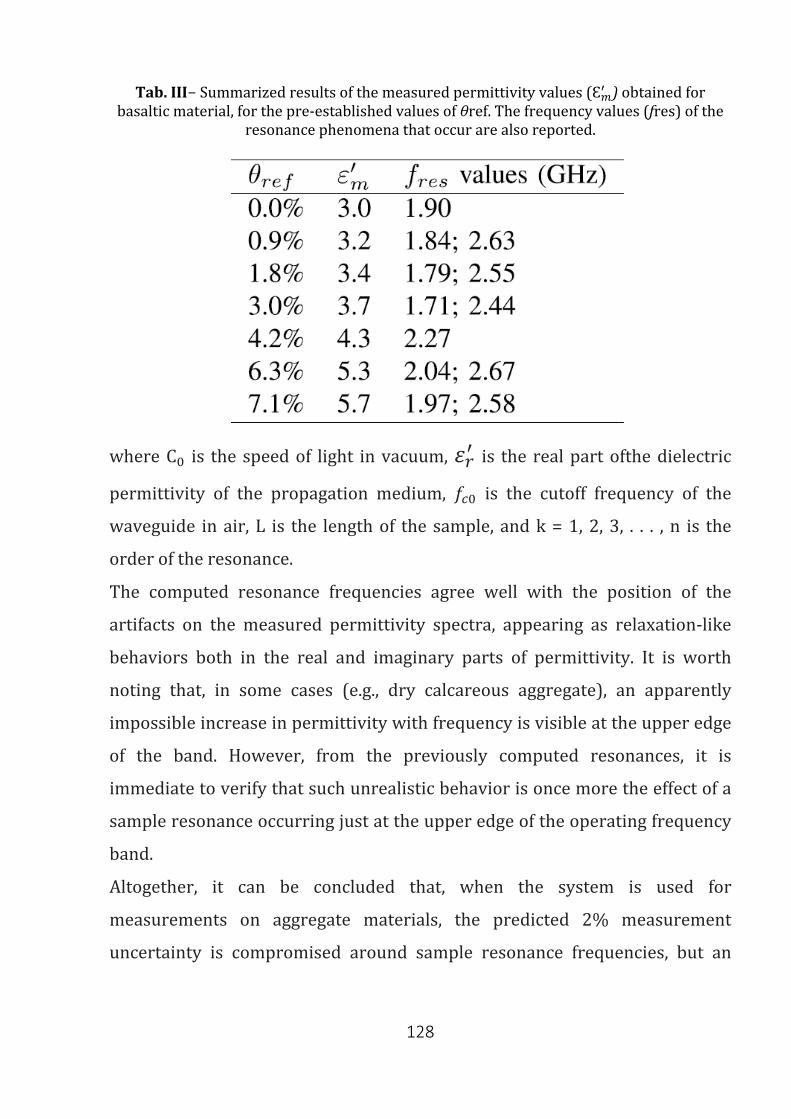
128
Tab. III− Summarized results of the measured permittivity values (Ԑ𝑚𝑚′ ) obtained for basaltic material, for the pre-established values of θref. The frequency values (fres) of the
resonance phenomena that occur are also reported.
where C0 is the speed of light in vacuum, 𝜀𝜀𝑟𝑟′ is the real part ofthe dielectric
permittivity of the propagation medium, 𝑓𝑓𝑐𝑐0 is the cutoff frequency of the
waveguide in air, L is the length of the sample, and k = 1, 2, 3, . . . , n is the
order of the resonance.
The computed resonance frequencies agree well with the position of the
artifacts on the measured permittivity spectra, appearing as relaxation-like
behaviors both in the real and imaginary parts of permittivity. It is worth
noting that, in some cases (e.g., dry calcareous aggregate), an apparently
impossible increase in permittivity with frequency is visible at the upper edge
of the band. However, from the previously computed resonances, it is
immediate to verify that such unrealistic behavior is once more the effect of a
sample resonance occurring just at the upper edge of the operating frequency
band.
Altogether, it can be concluded that, when the system is used for
measurements on aggregate materials, the predicted 2% measurement
uncertainty is compromised around sample resonance frequencies, but an
129
average permittivity value can still be safely and accurately estimated. Clearly,
the system would not be suitable to characterize materials with relaxation
phenomena and sample resonances within the explored frequency band. As a
last note, some experiments have been performed to assess measurement
repeatability, which was always better than 1%. Also system drift, assessed
through a measurement in air (empty sample holder) carried out at the end of
the measurement session (which could last up to 6 h), showed values of the
order of 0.1%.
2. Identification and validation of the θ − ԑ dielectric mixing models
The following step regarded the identification of dielectric mixing models that
could suitably describe the θ−ε relationship for the considered materials; in
particular, three different models were considered as candidates:
1) a semiempirical model (i.e., the four-component α-model [25], [26]);
2) a probabilistic model (i.e., Ansoult’s model [27], [28]);
3) an empirical model (i.e., Topp’s equation [29]).
These models adopt different approaches to infer the θ–ε relationship.
Semiempirical dielectric mixing models [25], [26], [30], [31] are largely used
for granular materials. In these models, several parameters are taken into
account (such as porosity of the material and distinction of free water from
bound water), which are crucial for an accurate physical description of the
considered materials, and are sometimes neglected by more general dielectric
models.
The probabilistic Ansoult’s model, instead, is based on the random
propagation of the pulse in a porous medium that is represented as an array
of capacitors. In this approach, the granular material is schematized as a set of
three capacitors, each associated with the dielectric constants of the different
material constituents (neglecting bound water). A computational algorithm,
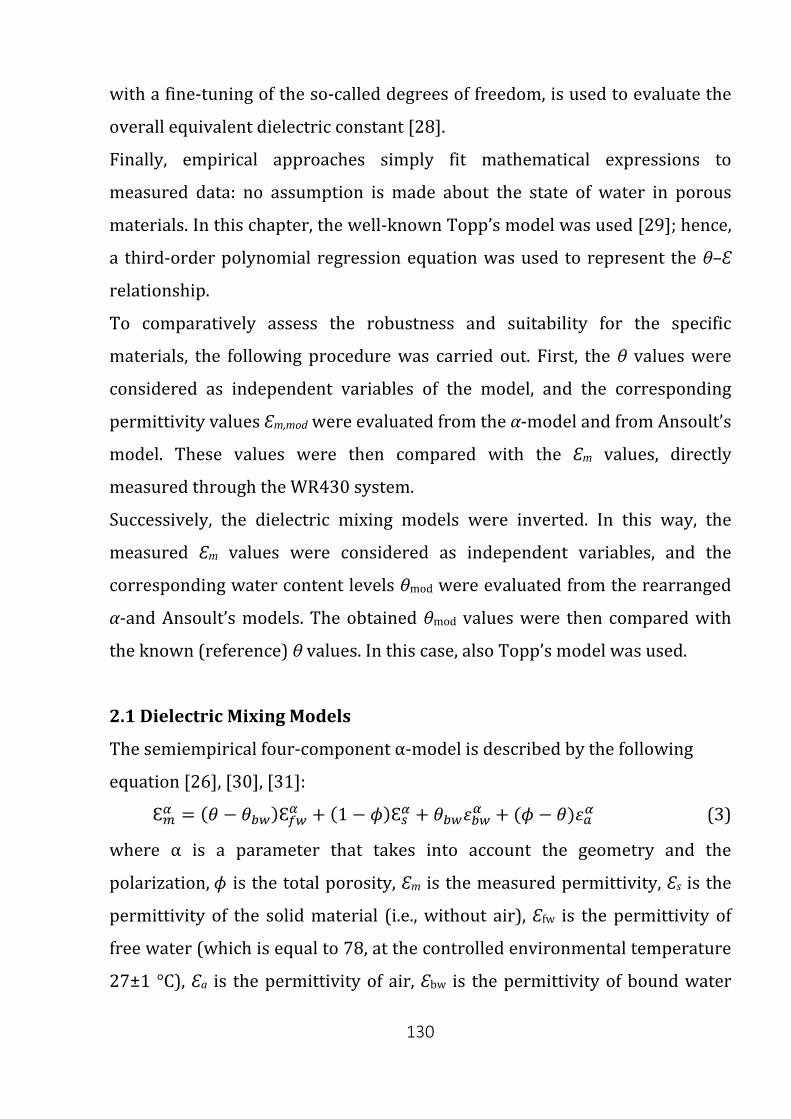
130
with a fine-tuning of the so-called degrees of freedom, is used to evaluate the
overall equivalent dielectric constant [28].
Finally, empirical approaches simply fit mathematical expressions to
measured data: no assumption is made about the state of water in porous
materials. In this chapter, the well-known Topp’s model was used [29]; hence,
a third-order polynomial regression equation was used to represent the θ–Ԑ
relationship.
To comparatively assess the robustness and suitability for the specific
materials, the following procedure was carried out. First, the θ values were
considered as independent variables of the model, and the corresponding
permittivity values Ԑm,mod were evaluated from the α-model and from Ansoult’s
model. These values were then compared with the Ԑm values, directly
measured through the WR430 system.
Successively, the dielectric mixing models were inverted. In this way, the
measured Ԑm values were considered as independent variables, and the
corresponding water content levels θmod were evaluated from the rearranged
α-and Ansoult’s models. The obtained θmod values were then compared with
the known (reference) θ values. In this case, also Topp’s model was used.
2.1 Dielectric Mixing Models
The semiempirical four-component α-model is described by the following
equation [26], [30], [31]:
Ԑ𝑚𝑚𝛼𝛼 = (𝜃𝜃 − 𝜃𝜃𝑐𝑐𝑏𝑏)Ԑ𝑟𝑟𝑏𝑏𝛼𝛼 + (1 − 𝜙𝜙)Ԑ𝑟𝑟𝛼𝛼 + 𝜃𝜃𝑐𝑐𝑏𝑏𝜀𝜀𝑐𝑐𝑏𝑏𝛼𝛼 + (𝜙𝜙 − 𝜃𝜃)𝜀𝜀𝑎𝑎𝛼𝛼 (3)
where α is a parameter that takes into account the geometry and the
polarization, 𝜙𝜙 is the total porosity, Ԑm is the measured permittivity, Ԑs is the
permittivity of the solid material (i.e., without air), Ԑfw is the permittivity of
free water (which is equal to 78, at the controlled environmental temperature
27±1 °C), Ԑa is the permittivity of air, Ԑbw is the permittivity of bound water
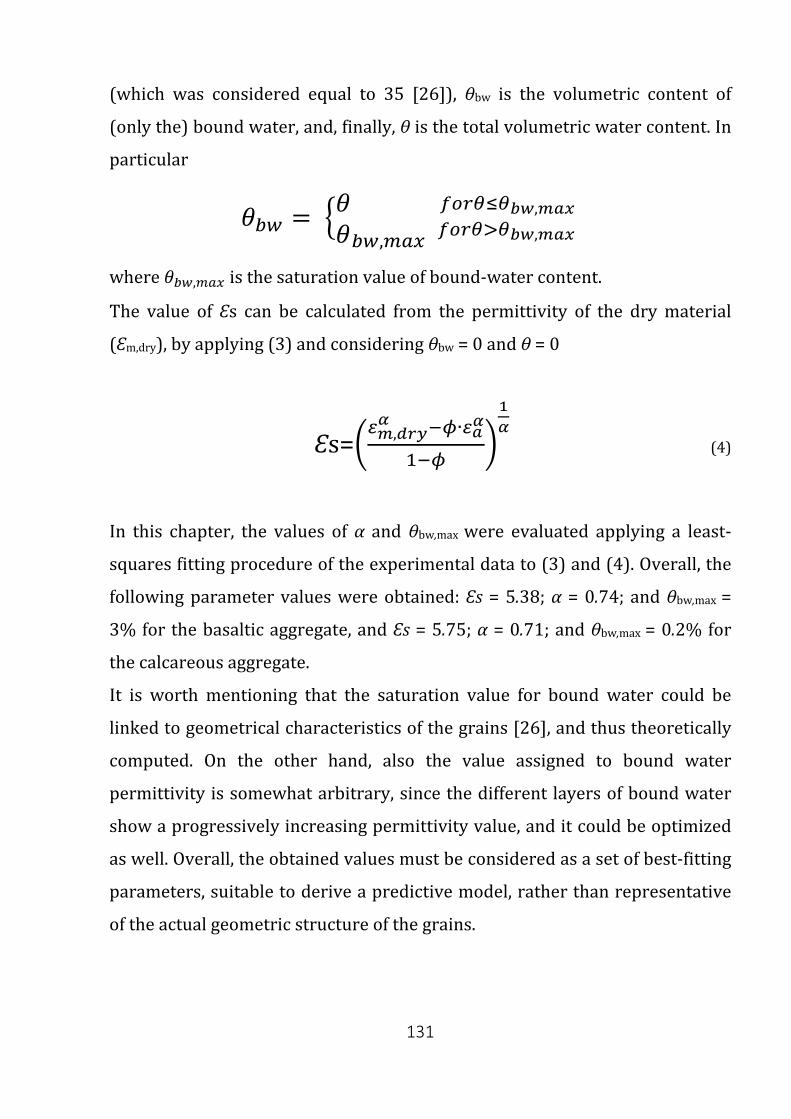
131
(which was considered equal to 35 [26]), θbw is the volumetric content of
(only the) bound water, and, finally, θ is the total volumetric water content. In
particular
𝜃𝜃𝑐𝑐𝑏𝑏 = �𝜃𝜃𝜃𝜃𝑐𝑐𝑏𝑏,𝑚𝑚𝑎𝑎𝑚𝑚 𝑟𝑟𝑓𝑓𝑟𝑟𝑓𝑓>𝑓𝑓𝑏𝑏𝑤𝑤,𝑚𝑚𝑚𝑚𝑚𝑚
𝑟𝑟𝑓𝑓𝑟𝑟𝑓𝑓≤𝑓𝑓𝑏𝑏𝑤𝑤,𝑚𝑚𝑚𝑚𝑚𝑚
where 𝜃𝜃𝑐𝑐𝑏𝑏,𝑚𝑚𝑎𝑎𝑚𝑚 is the saturation value of bound-water content.
The value of Ԑs can be calculated from the permittivity of the dry material
(Ԑm,dry), by applying (3) and considering θbw = 0 and θ = 0
Ԑs=�𝜀𝜀𝑚𝑚,𝑑𝑑𝑑𝑑𝑑𝑑𝛼𝛼 −𝜙𝜙∙𝜀𝜀𝑚𝑚𝛼𝛼
1−𝜙𝜙�1𝛼𝛼
(4)
In this chapter, the values of α and θbw,max were evaluated applying a least-
squares fitting procedure of the experimental data to (3) and (4). Overall, the
following parameter values were obtained: Ԑs = 5.38; α = 0.74; and θbw,max =
3% for the basaltic aggregate, and Ԑs = 5.75; α = 0.71; and θbw,max = 0.2% for
the calcareous aggregate.
It is worth mentioning that the saturation value for bound water could be
linked to geometrical characteristics of the grains [26], and thus theoretically
computed. On the other hand, also the value assigned to bound water
permittivity is somewhat arbitrary, since the different layers of bound water
show a progressively increasing permittivity value, and it could be optimized
as well. Overall, the obtained values must be considered as a set of best-fitting
parameters, suitable to derive a predictive model, rather than representative
of the actual geometric structure of the grains.
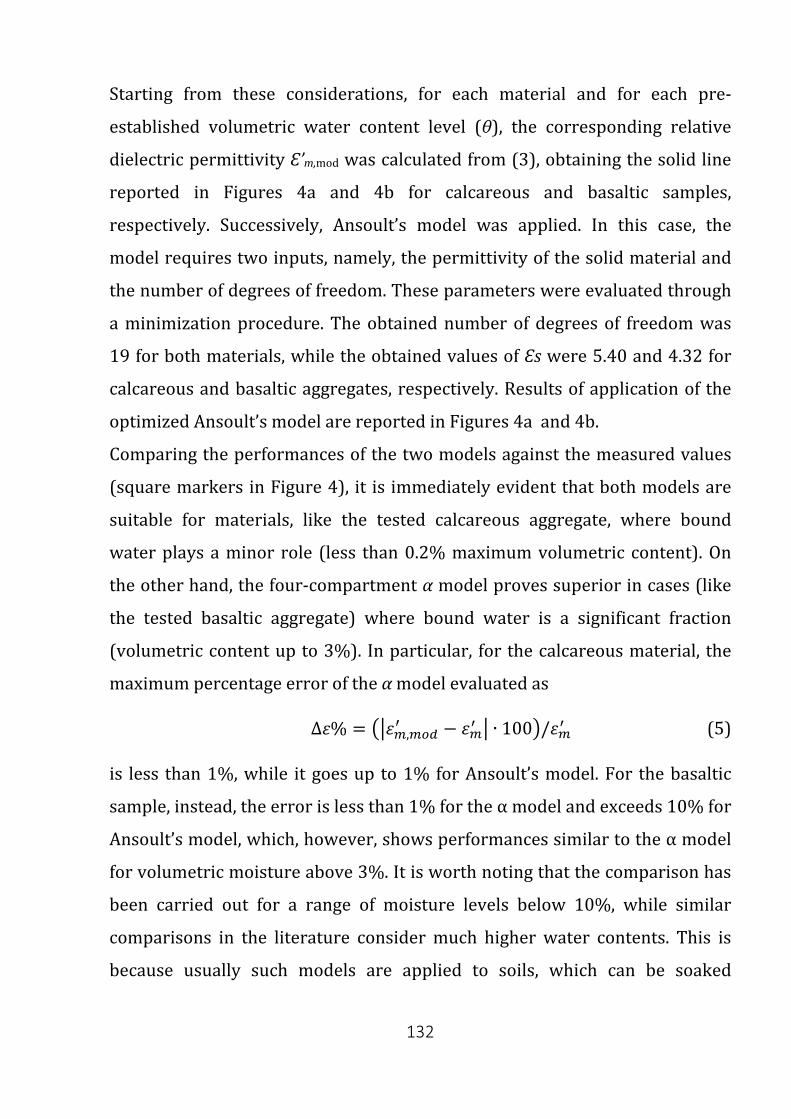
132
Starting from these considerations, for each material and for each pre-
established volumetric water content level (θ), the corresponding relative
dielectric permittivity Ԑ’m,mod was calculated from (3), obtaining the solid line
reported in Figures 4a and 4b for calcareous and basaltic samples,
respectively. Successively, Ansoult’s model was applied. In this case, the
model requires two inputs, namely, the permittivity of the solid material and
the number of degrees of freedom. These parameters were evaluated through
a minimization procedure. The obtained number of degrees of freedom was
19 for both materials, while the obtained values of Ԑs were 5.40 and 4.32 for
calcareous and basaltic aggregates, respectively. Results of application of the
optimized Ansoult’s model are reported in Figures 4a and 4b.
Comparing the performances of the two models against the measured values
(square markers in Figure 4), it is immediately evident that both models are
suitable for materials, like the tested calcareous aggregate, where bound
water plays a minor role (less than 0.2% maximum volumetric content). On
the other hand, the four-compartment α model proves superior in cases (like
the tested basaltic aggregate) where bound water is a significant fraction
(volumetric content up to 3%). In particular, for the calcareous material, the
maximum percentage error of the α model evaluated as
∆𝜀𝜀% = ��𝜀𝜀𝑚𝑚,𝑚𝑚𝑓𝑓𝑑𝑑′ − 𝜀𝜀𝑚𝑚′ � ∙ 100�/𝜀𝜀𝑚𝑚′ (5)
is less than 1%, while it goes up to 1% for Ansoult’s model. For the basaltic
sample, instead, the error is less than 1% for the α model and exceeds 10% for
Ansoult’s model, which, however, shows performances similar to the α model
for volumetric moisture above 3%. It is worth noting that the comparison has
been carried out for a range of moisture levels below 10%, while similar
comparisons in the literature consider much higher water contents. This is
because usually such models are applied to soils, which can be soaked
133
following rain or irrigation. On the other hand, an aggregate used for civil
applications, once taken from a stack, can at most be saturated. Therefore, the
results point toward the applicability of a four-compartment semiempirical
model as a suitable mixing model to describe mineral aggregates used in the
asphalt industry in the moisture conditions expected under typical scenarios.
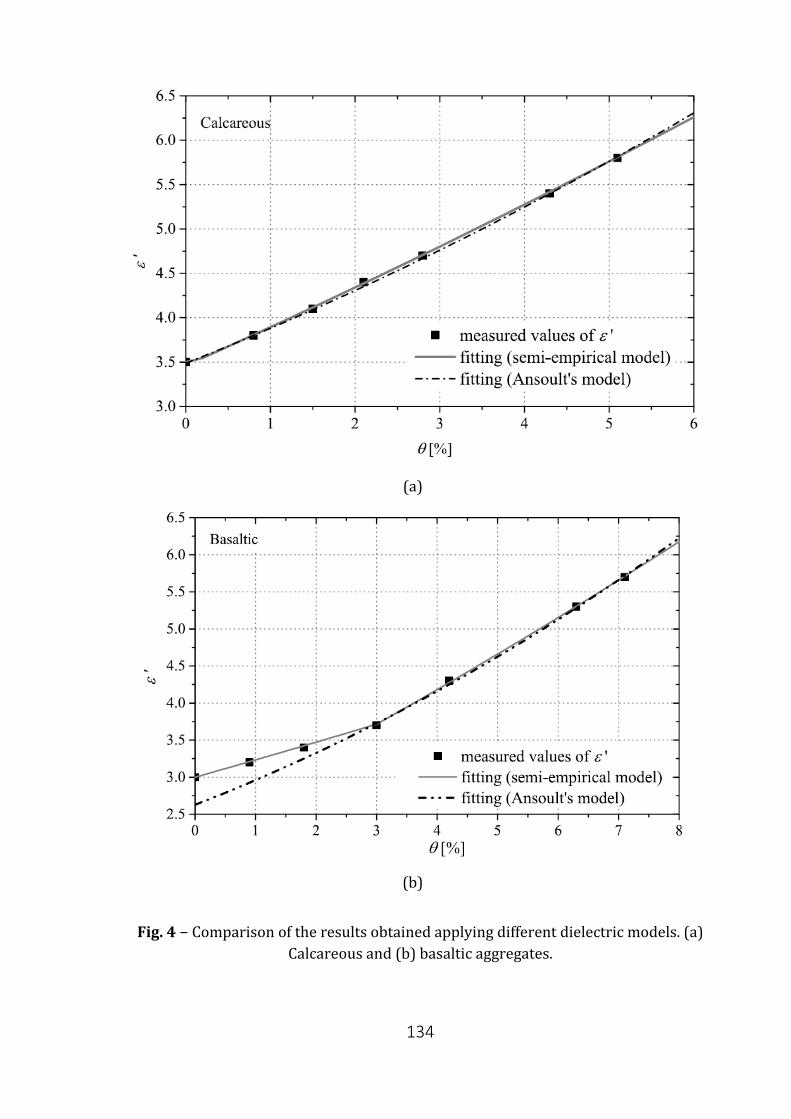
134
(a)
(b)
Fig. 4 − Comparison of the results obtained applying different dielectric models. (a)
Calcareous and (b) basaltic aggregates.
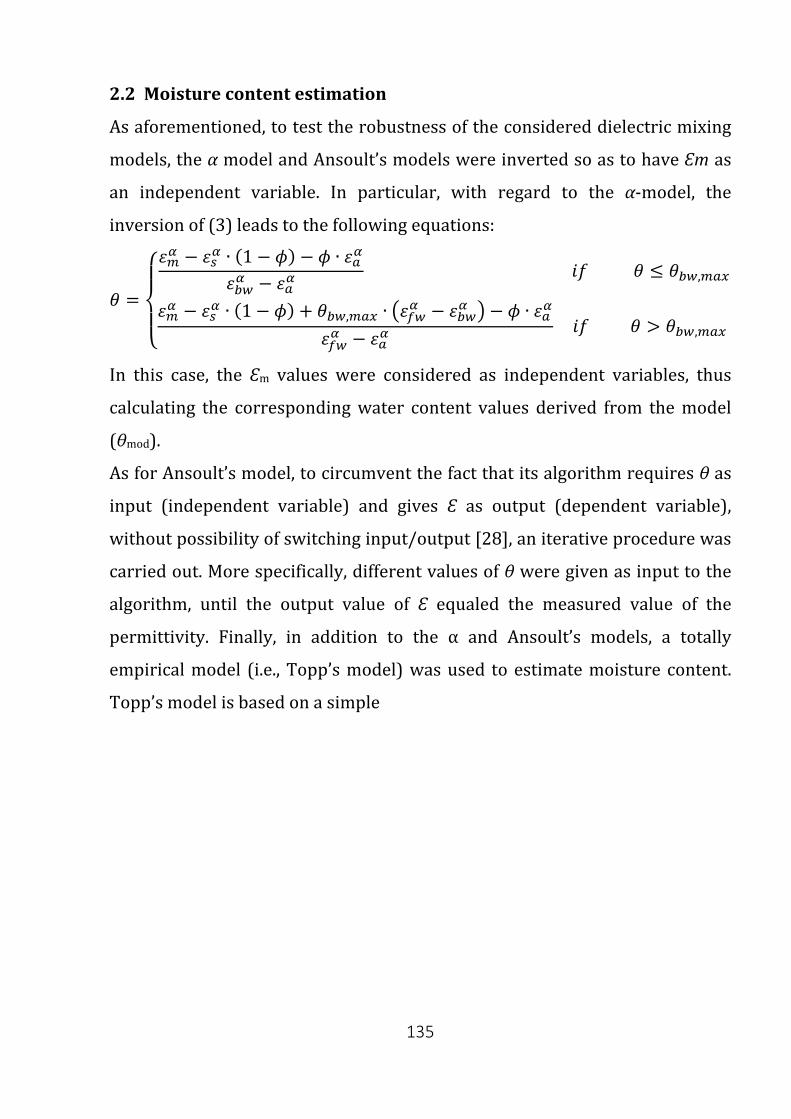
135
2.2 Moisture content estimation
As aforementioned, to test the robustness of the considered dielectric mixing
models, the α model and Ansoult’s models were inverted so as to have Ԑm as
an independent variable. In particular, with regard to the α-model, the
inversion of (3) leads to the following equations:
𝜃𝜃 =
⎩⎪⎨
⎪⎧𝜀𝜀𝑚𝑚
𝛼𝛼 − 𝜀𝜀𝑟𝑟𝛼𝛼 ∙ (1 − 𝜙𝜙) − 𝜙𝜙 ∙ 𝜀𝜀𝑎𝑎𝛼𝛼
𝜀𝜀𝑐𝑐𝑏𝑏𝛼𝛼 − 𝜀𝜀𝑎𝑎𝛼𝛼 𝑖𝑖𝑓𝑓 𝜃𝜃 ≤ 𝜃𝜃𝑐𝑐𝑏𝑏,𝑚𝑚𝑎𝑎𝑚𝑚
𝜀𝜀𝑚𝑚𝛼𝛼 − 𝜀𝜀𝑟𝑟𝛼𝛼 ∙ (1 − 𝜙𝜙) + 𝜃𝜃𝑐𝑐𝑏𝑏,𝑚𝑚𝑎𝑎𝑚𝑚 ∙ �𝜀𝜀𝑟𝑟𝑏𝑏𝛼𝛼 − 𝜀𝜀𝑐𝑐𝑏𝑏𝛼𝛼 � − 𝜙𝜙 ∙ 𝜀𝜀𝑎𝑎𝛼𝛼
𝜀𝜀𝑟𝑟𝑏𝑏𝛼𝛼 − 𝜀𝜀𝑎𝑎𝛼𝛼 𝑖𝑖𝑓𝑓 𝜃𝜃 > 𝜃𝜃𝑐𝑐𝑏𝑏,𝑚𝑚𝑎𝑎𝑚𝑚
In this case, the Ԑm values were considered as independent variables, thus
calculating the corresponding water content values derived from the model
(θmod).
As for Ansoult’s model, to circumvent the fact that its algorithm requires θ as
input (independent variable) and gives Ԑ as output (dependent variable),
without possibility of switching input/output [28], an iterative procedure was
carried out. More specifically, different values of θ were given as input to the
algorithm, until the output value of Ԑ equaled the measured value of the
permittivity. Finally, in addition to the α and Ansoult’s models, a totally
empirical model (i.e., Topp’s model) was used to estimate moisture content.
Topp’s model is based on a simple
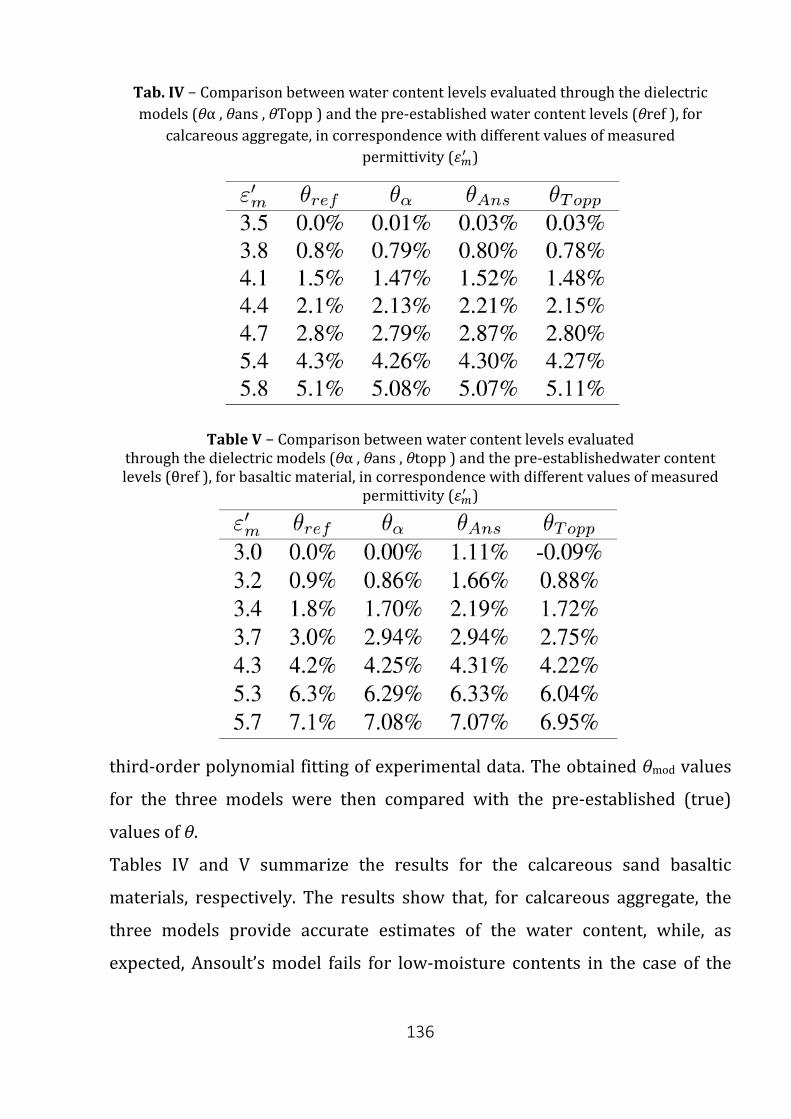
136
Tab. IV − Comparison between water content levels evaluated through the dielectric models (θα , θans , θTopp ) and the pre-established water content levels (θref ), for
calcareous aggregate, in correspondence with different values of measured permittivity (𝜀𝜀𝑚𝑚′ )
Table V − Comparison between water content levels evaluated
through the dielectric models (θα , θans , θtopp ) and the pre-establishedwater content levels (θref ), for basaltic material, in correspondence with different values of measured
permittivity (𝜀𝜀𝑚𝑚′ )
third-order polynomial fitting of experimental data. The obtained θmod values
for the three models were then compared with the pre-established (true)
values of θ.
Tables IV and V summarize the results for the calcareous sand basaltic
materials, respectively. The results show that, for calcareous aggregate, the
three models provide accurate estimates of the water content, while, as
expected, Ansoult’s model fails for low-moisture contents in the case of the
137
basaltic material. It is worth highlighting that the simple polynomial model
(Topp’s equation), suitably fitted to experimental data, provides very robust
estimations of water content for very different types of materials.
Conclusions The experimental characterization of the system was completed by
performing dielectric permittivity measurements on inert materials that are
typically used in the production of asphalt (calcareous and basaltic
aggregates). Finally, to analytically characterize the relationship between
water content of the granular materials and the corresponding permittivity
values, three different dielectric models (i.e., α model, Ansoult’s model, and
Topp’s equation) were comparatively assessed. Experimental tests were
performed to identify the most suitable ones in describing the water content
and dielectric permittivity relationship for the considered materials. The
results not only suggest the need to use a four-compartment model for
accurate characterization of the water/aggregate mixture, but also highlight
that, as far as moisture estimation from the measured permittivity is the main
aim, a third-order polynomial fitting proves an excellent candidate for a
simple and ready-to-use model. The obtained measurement results
demonstrate the flexibility and practical usability of the system for possible
applications in the road-maintenance related industry. Compared with
standard waveguide systems, the proposed custom solution is characterized
by the large sample holder volume, the optimized operating frequency range
allowing measurements around the ISM frequency of 2.45 GHz, and the
presence of the pressurization windows making the system suitable for
granular samples. Overall, the costs for manufacturing the custom-made
waveguide components are below €1000, making it a competitive and cost-
138
effective solution. Finally, it is worth emphasizing that the application of the
proposed system is not limited to the aggregate materials used in the asphalt
production; on the contrary, it could also be used for dielectric spectroscopy
of granular materials in general (with application, for example, in the agri-
food industry).
References [23] R. Lal, Ed., Encyclopedia of Soil Science, vol. 1, 2nd ed. Boca Raton, FL, USA: Taylor &
Francis, 2005.
[24] P. F. Hudak, Principles of Hydrogeology, 3rd ed. Boca Raton, FL, USA: CRC Press, 2005.
[25] J. R. Birchak, C. G. Gardner, J. E. Hipp, and J. M. Victor, “High dielectric constant
microwave probes for sensing soil moisture,” Proc. IEEE, vol. 62, no. 1, pp. 93–98, Jan.
1974.
[26] M. C. Dobson, F. T. Ulaby, M. T. Hallikainen, and M. A. El-Rayes, “Microwave dielectric
behavior of wet soil-Part II: Dielectric mixing models,” IEEE Trans. Geosci. Remote
Sens., vol. 23, no. 1, pp. 35–46, Jan. 1985.
[27] M. Ansoult, L. W. De Backer, and M. Declercq, “Statistical relationship between
apparent dielectric constant and water content in porous media,” Soil Sci. Soc. Amer. J.,
vol. 49, no. 1, pp. 47–50, 1985.
[28] P. Todoroff and P. Langellier, “Comparison of empirical and partly deterministic
methods of time domain reflectometry calibration, based on a study of two tropical
soils,” Soil Tillage Res., vol. 45, nos. 3–4, pp. 325–340, 1998.
[29] G. C. Topp, J. L. Davis, and A. P. Annan, “Electromagnetic determination of soil water
content: Measurements in coaxial transmission lines,” Water Resour. Res., vol. 16, no.
3, pp. 574–582, 1980.
[30] G. P. de Loor, “Dielectric properties of heterogeneous mixtures containing water,” J.
Microw. Power, vol. 3, no. 2, pp. 67–73, Mar. 1968.
[31] A. Cataldo, L. Tarricone, M. Vallone, G. Cannazza, and M. Cipressa, “TDR moisture
measurements in granular materials: From the siliceous sand test case to the
applications for agro-food industrial monitoring,” Comput. Standards Interfaces, vol.
32, no. 3, pp. 86–95, 2010.
139
Ringraziamenti
Desidero ringraziare con autentica gratitudine il Prof. Fabrizio Frezza
relatore di questa tesi, per la disponibilità, incoraggiamento e la particolare
sensibilità dimostratami
Un sentito e distinto ringraziamento alla Prof.ssa Lara Pajewski per il prezioso
aiuto fornito durante tutto il mio percorso di Dottorato
Un grazie di cuore ai Professori
Francesco Benedetto e Raffaele Persico
Grazie alla COST Action TU1208
“Civil Engineering Applications of Ground Penetrating Radar”
140
Table of Contents
Introduzione 2
Parte I 2
Introduzione sul GPR 2
Cenni storici 3
Attività sul GPR in Italia 4
Il sistema analizzato 5
Segnale irradiato dal sistema 6
Modellizzazione di una griglia metallica per applicazioni GPR 12
Parte II 12
Tecniche elettromagnetiche per la valutazione della permettività dielettrica di materiali
17
Part I 17
Ground Penetrating Radar systems and applications 21
Chapter I.1 22
Ground Penetrating Radar Activities in Italy 22
Introduction 22
1. Which are the most interesting (recent and ongoing) national research projects carried out in your Country?
24
141
References 30
2. Outside the academic world, is GPR used in the management of your Country's resources and infrastructure?
31
References 37
3. Do you have national guidelines, rules or protocols that can/have to be followed during GPR surveys?
38
References 44
4. In your opinion, how could a wider and more effective use of the GPR technique be promoted in your Country?
44
5. Do you have GPR manufacturers in your Country? Which systems they produce?
47
6. Do you have GPR test sites in your Country? 53
References 61
7. Which are the most interesting university courses and training activities involving GPR?
61
8. How often is the GPR used in combination with other NDT methods?
68
References 73
Chapter I.2 74
Electromagnetic exposure of GPR operators and interference issues
74
Introduction 74
1. EM Exposure of GPR Operators 76
2. Interference Testing Analysis to Develop A GPR Application: Detection of People Under Avalanches
85
References 88
142
Chapter I.3 90
Electromagnetic Wire-Grid Modelling for Ground Penetrating Radar Applications
90
Introduction 90
1. FDTD Modelling of Cylindrical Objects 92
2. Numerical results 93
2.1 Accurate wire-grid modelling of objects buried in a soil 93
2.2 Objects partially buried in different media 98
2.3 Slotted objects 98
Conclusions 103
References 105
Part II 107
Electromagnetic techniques for the evaluation of the dielectric permittivity of media
107
Chapter II.1 108
Measurement System for Evaluating Dielectrics Permittivity of Granular Materials in the 1.7-2.6 GHz Band
108
Introduction 108
1. Design of the waveguide system 111
2. Measurement model and uncertainty 113
143
2.1 Uncertainty Contributions 114
3. Experimental characterization of the proposed system 115
References 117
Chapter II.2 119
Experimental results on granular inert materials 119
Introduction 119
1. Results on basaltic and calcareous materials 119
2. Identification and validation of the θ − ԑ dielectric mixing models
126
2.1 Dielectric Mixing Models 127
2.2 Moisture content estimation 132
Conclusions 134
References 135
Ringraziamenti 136