Coseismic deformation pattern of the Emilia 2012 seismic ...
Upload
randolph-jacobsCategory
view
215download
0
SISMASeismic Information System for
Monitoring and Alert
Galileian PlusDipartimento di Scienze della Terra, Università di Milano, Italy
Politecnico di Milano, ItalyDipartimento di Scienze della Terra, Università di Trieste, Italy
Agenzia Spaziale Italiana, Sezione Osservazione della Terra
Università di Milano
Coupling geophysical modelling and geodesy to
unravel the physics of active faults
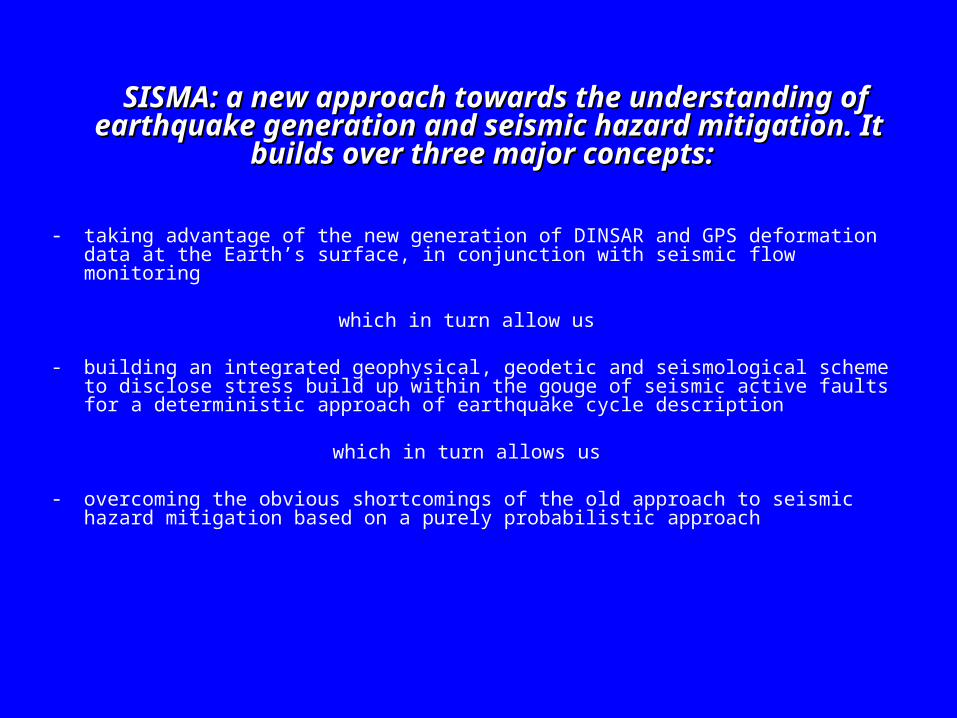
SISMA: a new approach towards the understanding SISMA: a new approach towards the understanding of earthquake generation and seismic hazard of earthquake generation and seismic hazard
mitigation. It builds over three major concepts:mitigation. It builds over three major concepts:
- taking advantage of the new generation of DINSAR and GPS deformation data at the Earth’s surface, in conjunction with seismic flow monitoring
which in turn allow us
- building an integrated geophysical, geodetic and seismological scheme to disclose stress build up within the gouge of seismic active faults for a deterministic approach of earthquake cycle description
which in turn allows us
- overcoming the obvious shortcomings of the old approach to seismic hazard mitigation based on a purely probabilistic approach

SISMA Overall Schema
1°
level
2°
level
3°
level
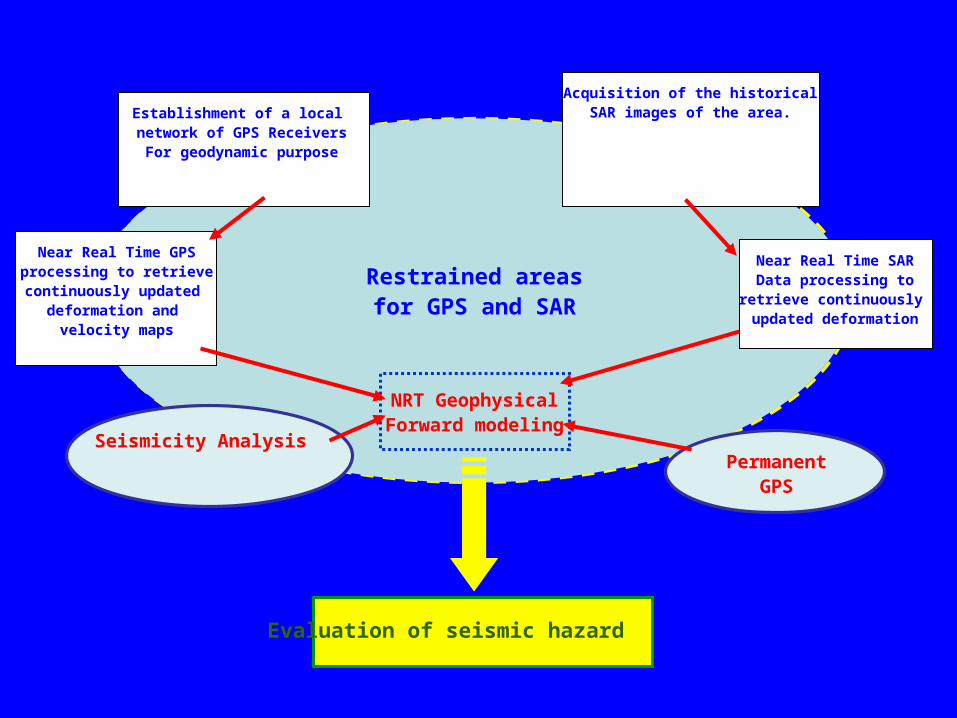
Restrained areasfor GPS and SAR
Establishment of a local network of GPS ReceiversFor geodynamic purpose
NRT GeophysicalForward modeling
PermanentGPS
Seismicity Analysis
Evaluation of seismic hazard
Near Real Time GPSprocessing to retrievecontinuously updated
deformation and velocity maps
Acquisition of the historicalSAR images of the area.
Near Real Time SARData processing to
retrieve continuously updated deformation
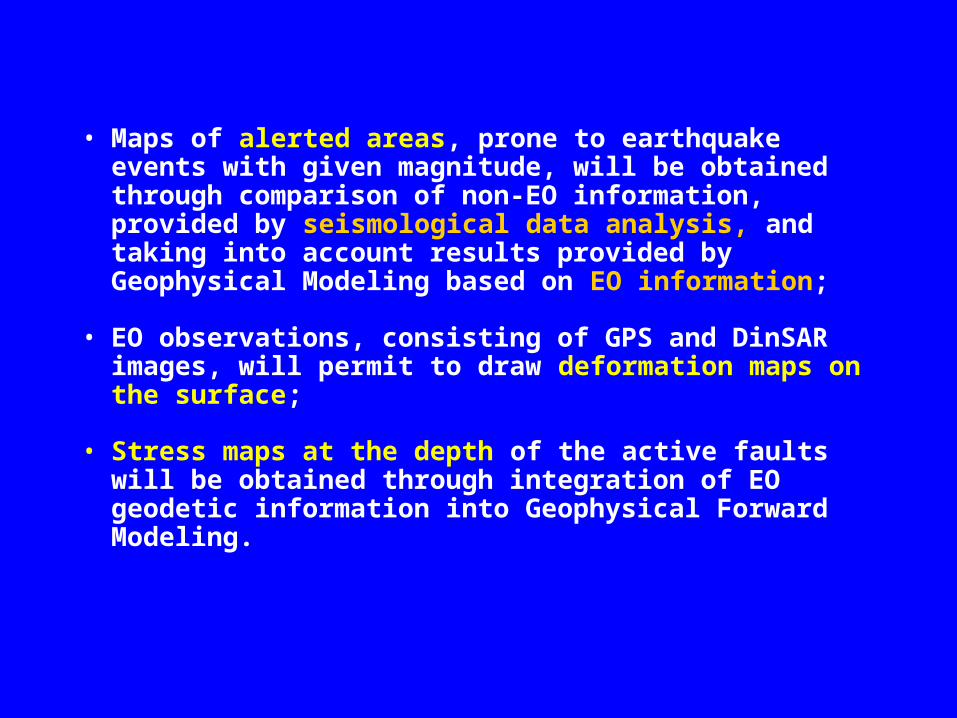
• Maps of alerted areas, prone to earthquake events with given magnitude, will be obtained through comparison of non-EO information, provided by seismological data analysis, and taking into account results provided by Geophysical Modeling based on EO information;
• EO observations, consisting of GPS and DinSAR images, will permit to draw deformation maps on the surface;
• Stress maps at the depth of the active faults will be obtained through integration of EO geodetic information into Geophysical Forward Modeling.
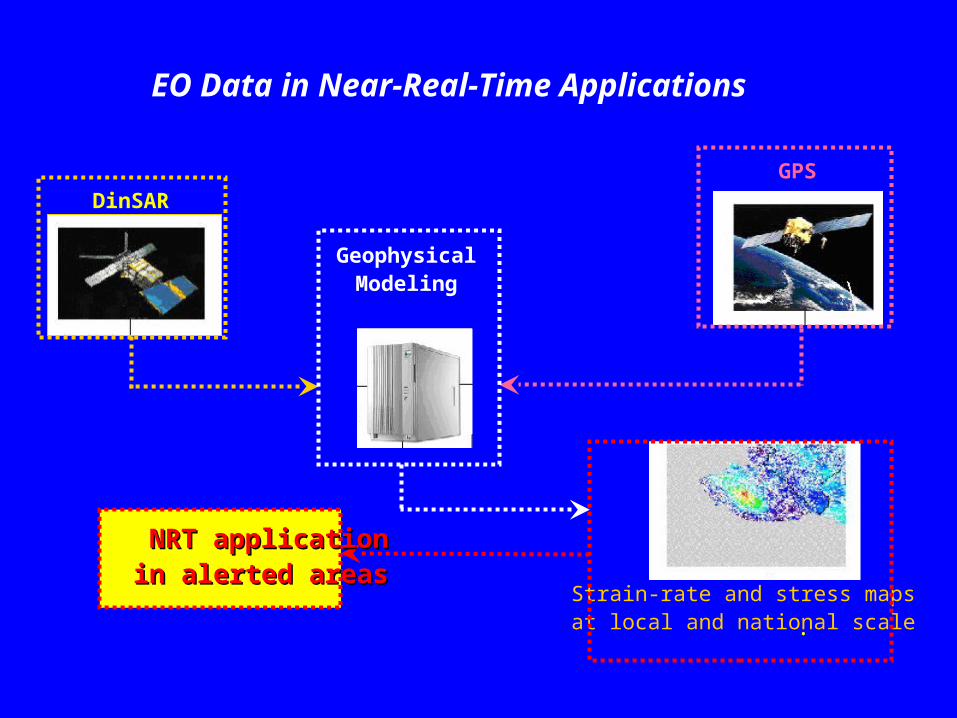
EO Data in Near-Real-Time Applications
•
DinSARGPS
GeophysicalModeling
Strain-rate and stress mapsat local and national scale
NRT applicationNRT applicationin alerted areasin alerted areas
Which is the contribution of Earth Observations?Which is the contribution of Earth Observations?
Inter- and pre-seismic phases: monitoring of surface deformation, which is a possible indicator of stress build up on faults
Co-seismic phase: improves the understanding of the process taking place along the fault plane and permits the estimation of the interactions between the stress field (modified after the seismic event) and the nearby faults.
Post-seismic phase: monitoring possible phenomena (e.g. after-slip, post-seismic relaxation) that may affect the stress field in the lithosphere

Three seismogenic zones,
Friuli-Venezia Giulia
Umbria-Marche
Pollino (Calabria)
are test sites for SISMA
These active seismogenic zones are embedded within the diffuse plate boundary between Africa
and Eurasia, in the central Mediterranean

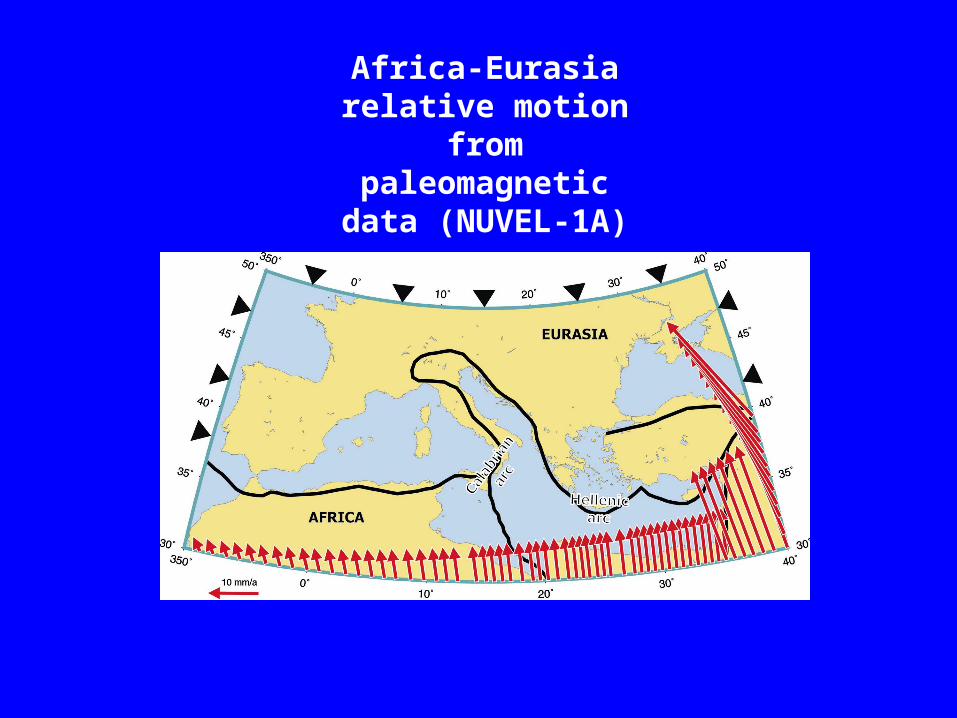
Africa-Eurasia relative motion
from paleomagnetic
data (NUVEL-1A)
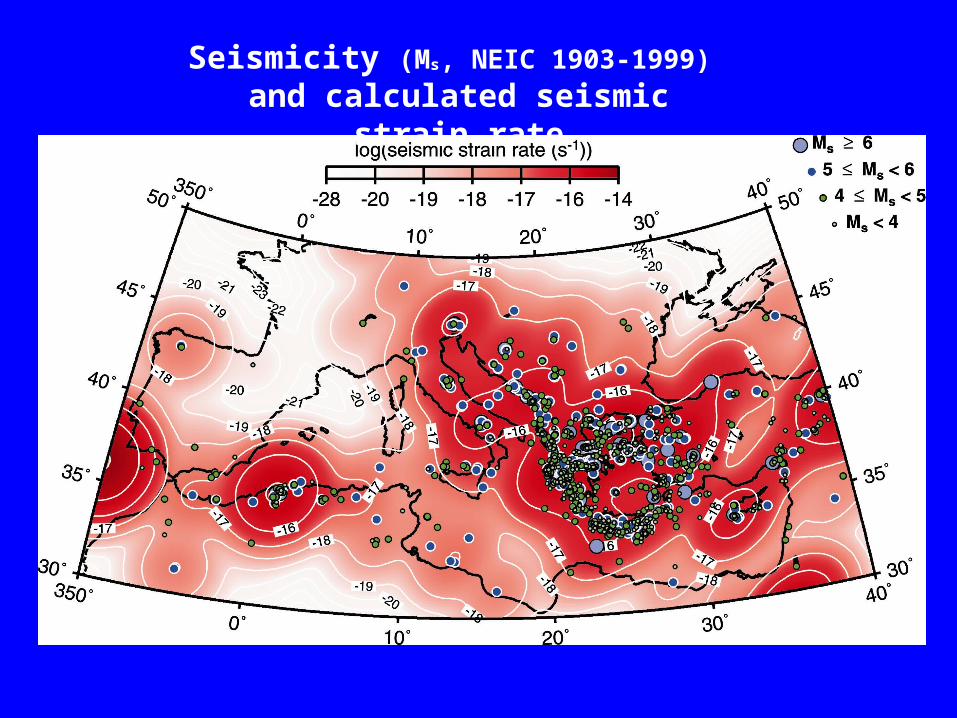
Seismicity (Ms, NEIC 1903-1999) and calculated seismic strain
rate
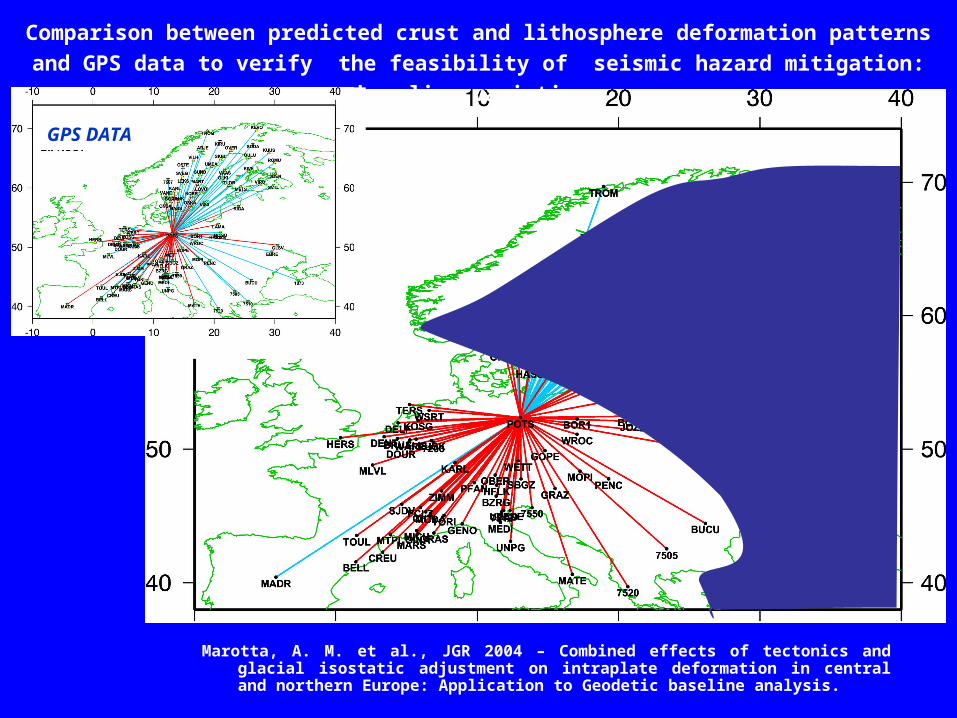
Comparison between predicted crust and lithosphere deformation patterns and GPS data to verify the feasibility of seismic hazard mitigation: baseline
variations
GPS DATA
Marotta, A. M. et al., JGR 2004 – Combined effects of tectonics and glacial isostatic adjustment on intraplate deformation in central and northern Europe: Application to Geodetic baseline analysis.

Horizontal principal strain rate tensor
Model B:active convergence
+subduction forces in the Hellenic (deep
slab) and Calabrian arcs
Jimenez-Munt, I. et al., (2003) Active deformation in the Mediterranean from Gibraltar to Anatolia inferred from numerical modeling and Geodetic and seismological data

Updated to March 1 2007Updated to March 1 2007
CNalgorithmTimes of Increased Times of Increased Probability for the Probability for the occurrence of occurrence of events with M>Mo events with M>Mo within the within the monitored regionsmonitored regionsNorthern Region, M o=5.4
6 .5 5 .4 5 .8 6 .0
1965 1975 1985 1995 2005
5 .5 5 .6 5 .5
Central Region, M o=5.65 .86 .0 6 .5
5 .76 .0
1955 1965 1975 1985 1995 2005
5 .7
Southern Region, M o=5.65 .86 .0 6 .55 .8
1955 1965 1975 1985 1995 2005
5 .7
M6.5 M5.5M6.0
Monitored region
Alerted region
2003.5-2004
2004-2004.5
2004.5-2005
Events with Mmax 5.5 occurred since July 2003
M8S algorithm
((Peresan al., Earth Sci. RevPeresan al., Earth Sci. Rev.. 200 20055))2006.5-
2007


Methodology for detecting the movements during the co-seismic phases in earthquake prone areas
(Crippa B. et al., 2006).
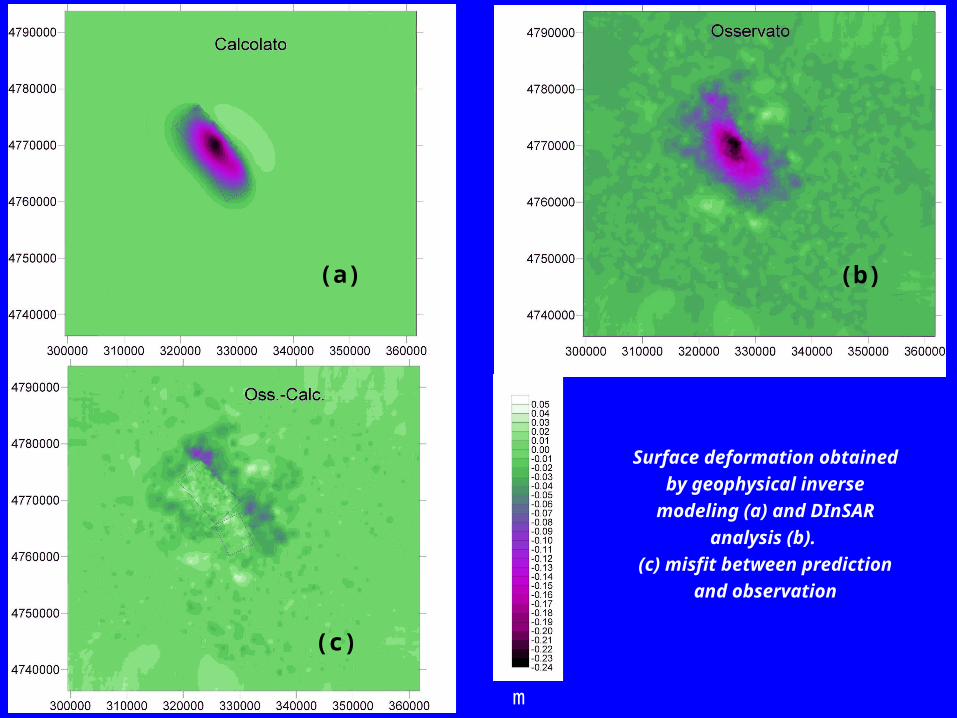
Surface deformation obtained by geophysical inverse modeling (a) and
DInSAR analysis (b). (c) misfit between
prediction and observation
m
(a) (b)
(c)


Our preliminary results confirm the benefits coming
from the usage of Earth Observation data to
improve the capability of monitoring active
faults in Near Real Time: an important
step toward the mitigation of seismic hazard