Semiannual Financial Report - Parmalat Semiannual Report.pdf · Semiannual Financial Report at June...
108
Semiannual Financial Report at June 30, 2010 issione Parmalat è un gruppo alimentare italiano a strategia multinazionale al servizio del benessere dei suoi consumatori nel mondo, il cui obiettivo finale è la creazione di valore per tutti i propri azionisti nel rispetto dell’etica degli affari e l’assolvimento di una funzione sociale, contribuendo alla crescita professionale dei dipendenti e collaboratori e trasferendo elementi di progresso economico e civile alle Comunità in cui opera.
-
Upload
nguyennguyet -
Category
Documents
-
view
217 -
download
0
Transcript of Semiannual Financial Report - Parmalat Semiannual Report.pdf · Semiannual Financial Report at June...

Semiannual Financial Report
at June 30, 2010
issione
Parmalat è un gruppo alimentare italiano a strategia multinazionale al servizio del benessere dei suoi consumatori nel mondo, il cui obiettivo finale è la creazione di valore per tutti i propri azionisti nel rispetto dell’etica degli affari e l’assolvimento di una funzione sociale, contribuendo alla crescita professionale dei dipendenti e collaboratori e trasferendo elementi di progresso economico e civile alle Comunità in cui opera.

Vogliamo affermare Parmalat come uno dei principali operatori mondiali nel settore degli “alimenti funzionali ad alto valore aggiunto” per la corretta nutrizione ed il benessere dei consumatori, raggiungendo un’importante leadership in alcune selezionate categorie di prodotto ed in alcuni paesi ad elevato potenziale per il Gruppo. Le categorie chiave per il Gruppo saranno il Latte con i suoi derivati e le Bevande Frutta, alimenti di valore insostituibile nell’alimentazione quotidiana.
I Paesi di attività
con presenza diretta
Europa Italia, Portogallo, Romania, Russia
Resto del Mondo
Australia, Botswana, Canada, Colombia, Cuba, Ecuador, Mozambico, Nicaragua, Paraguay,
Sud Africa, Swaziland, Venezuela, Zambia
con presenza tramite licenza
Brasile, Cile, Cina, Messico, Repubblica Dominicana, Spagna, Stati Uniti d’America, Ungheria, Uruguay

Contents 3
Contents
FINANCIAL HIGHLIGHTS ................................................................................................................................ 5 INFORMATION ABOUT PARMALAT’S SECURITIES .................................................................................... 7
PERFORMANCE OF THE PARMALAT STOCK......................................................................................................... 7 STOCK OWNERSHIP PROFILE ............................................................................................................................ 8 CHARACTERISTICS OF THE SECURITIES ............................................................................................................. 9
BOARD OF DIRECTORS, BOARD OF STATUTORY AUDITORS AND INDEPENDENT AUDITORS ....... 11 INTERIM REPORT ON OPERATIONS........................................................................................................... 13
REVIEW OF OPERATING AND FINANCIAL PERFORMANCE ................................................................................... 13 Parmalat Group ........................................................................................................................................ 13 Parmalat S.p.A. ........................................................................................................................................ 17
REVENUES AND PROFITABILITY ....................................................................................................................... 20 Italy ........................................................................................................................................................... 25 Other Countries in Europe........................................................................................................................ 27 Canada ..................................................................................................................................................... 31 Africa ........................................................................................................................................................ 33 Australia.................................................................................................................................................... 35 Central and South America ...................................................................................................................... 37
HUMAN RESOURCES ...................................................................................................................................... 42 Group Staffing .......................................................................................................................................... 42
CAPITAL EXPENDITURES................................................................................................................................. 43 RESEARCH AND DEVELOPMENT....................................................................................................................... 43 FINANCIAL PERFORMANCE.............................................................................................................................. 44
Structure of the Financial Position of the Group and Its Main Companies .............................................. 44 Change in Net Financial Position ............................................................................................................. 44
MANAGING BUSINESS RISKS ........................................................................................................................... 46 TAX CONSIDERATIONS.................................................................................................................................... 49 CORPORATE GOVERNANCE ............................................................................................................................ 49 KEY EVENTS IN THE FIRST HALF OF 2010........................................................................................................ 50 EVENTS OCCURRING AFTER JUNE 30, 2010.................................................................................................... 50 BUSINESS OUTLOOK....................................................................................................................................... 51
PARMALAT GROUP ...................................................................................................................................... 53 FINANCIAL STATEMENTS AT JUNE 30, 2010 ..................................................................................................... 55
Consolidated Statement of Financial Position.......................................................................................... 57 Consolidated Income Statement .............................................................................................................. 58 Consolidated Statement of Comprehensive Income................................................................................ 59 Consolidated Statement of Cash Flows ................................................................................................... 60 Changes in Consolidated Shareholders’ Equity....................................................................................... 61
NOTES TO THE CONDENSED CONSOLIDATED SEMIANNUAL FINANCIAL STATEMENTS .......................................... 62 Foreword .................................................................................................................................................. 62 Principles for the Preparation of the Condensed Consolidated Semiannual Financial Statements ........ 62 Seasonality of the Group’s Businesses.................................................................................................... 63 Scope of Consolidation ............................................................................................................................ 64 Transactions Between Group Companies and with Related Parties ....................................................... 66 Notes to the Statement of Financial Position – Assets ............................................................................ 68 Notes to the Statement of Financial Position – Shareholders’ Equity...................................................... 73 Notes to the Statement of Financial Position – Liabilities ........................................................................ 76 Guarantees and Commitments ................................................................................................................ 82 Legal Disputes and Contingent Liabilities at June 30, 2010 .................................................................... 83 Notes to the Income Statement................................................................................................................ 87 Other Information...................................................................................................................................... 91

4 Contents
CERTIFICATION OF THE CONDENSED CONSOLIDATED SEMIANNUAL FINANCIAL STATEMENTS PURSUANT TO ARTICLE 154-BIS, SECTION 5, OF LEGISLATIVE DECREE NO. 58/98, AS AMENDED....................................................................................................................................................................... 103 PARMALAT GROUP – REPORT OF THE INDEPENDENT AUDITORS.................................................... 104

Financial Highlights 5
Financial Highlights Income Statement Highlights (amounts in millions of euros)
PARMALAT GROUP First half 2010 First half 2009
- NET REVENUES 2,026.2 1,848.0- EBITDA 174.5 161.6- EBIT 176.7 288.5- NET PROFIT 148.6 249.2- EBIT/REVENUES (%) 8.6 15.5- NET PROFIT/REVENUES (%) 7.3 13.4
PARMALAT S.p.A.
- NET REVENUES 397.0 416.6- EBITDA 36.9 41.5- EBIT 44.7 194.6- NET PROFIT 77.7 228.6- EBIT/REVENUES (%) 10.7 45.3- NET PROFIT/REVENUES (%) 18.6 53.3
Balance Sheet Highlights (amounts in millions of euros)
PARMALAT GROUP 6/30/10 12/31/09
- NET FINANCIAL ASSETS 1,297.6 1,384.6- ROI (%) 1 17.9 37.1- ROE (%)1 9.0 17.1- EQUITY/ASSETS 0.7 0.7- NET FINANCIAL POSITION/EQUITY (0.4) (0.4)- OPERATING CASH FLOW FOR THE PERIOD PER SHARE 0.08 0.18
PARMALAT S.p.A.
- NET FINANCIAL ASSETS 1,380.1 1,486.8- ROI (%) 1 14.0 63.6- ROE (%)1 5.5 13.4- EQUITY/ASSETS 0.9 0.9- NET FINANCIAL POSITION/EQUITY (0.5) (0.5)- OPERATING CASH FLOW FOR THE PERIOD PER SHARE 0.04 0.06
1 Indices computed based on annualized income statement data and average balance sheet data for the period.

6 Financial Highlights

Information About Parmalat’s Securities 7
Information About Parmalat’s Securities
The securities of Parmalat S.p.A. have been trading on the Milan Online Stock Market since October 6, 2005. The key data for the first half of 2010 are summarized below:
Common Shares Warrants
Securities outstanding at 6/30/10 1,728,394,362 69,704,288
Closing price on 6/30/10 1.91 0.918
Capitalization 3,301,233,231.42 63,988,536.38
High for the year (in euros) 2.1275
April 14, 20101.082
April 26, 2010
Low for the year (in euros) 1.724
February 15, 20100.74
February 12, 2010
Average price in June (in euros) 1.970 0.968
Highest daily trading volume 65,236,340
April 13, 2010949,700
March 26, 2010
Lowest daily trading volume 3,753,648
May 31, 201033,149
June 17, 2010
Average trading volume in June 8,369,1191 135,739 1 0.48% of the share capital.
Performance of the Parmalat Stock The chart that follows compares the performance of the Parmalat stock with that of the main Italian market index: FTSE MIB. In the first half of 2010, as shown in the chart below, the performance of the Parmalat stock was markedly better than that of the FTSE MIB, the market benchmark index, which declined by about 16.9% compared with December 31, 2009. The lower stock price is explained in part by the impact of the challenging conditions that continued to shape the macroeconomic environment and consumer demand during the first six months of 2010. The Parmalat stock has been part of the DJ STOXX 600 Index since March 2006 and was included in the MSCI World Index on June 1, 2007. Performance of the Parmalat Stock in the First Half of 2009 2010
1.50
1.80
2.10
12/2009 02/2010 03/2010 04/2010 05/2010 06/20100
20
40
60
80
100
Volume PLT FTSE MIB normalized
Volumi
(2.0)%
Source: Bloomberg
euros (millions of shares)
(right scale) (left scale) (left scale)
(16.9)%

8 Information About Parmalat’s Securities
Stock Ownership Profile As required by Article 120 of the Uniform Financial Code, the table below lists the shareholders who held a significant interest in the Company at July 16, 2010: Equity interests computed on deposited share capital at July 28, 2010
Shareholder No. of shares Pledged shares Percentage No. of shares Percentage Mackenzie Cundill Investments Management Ltd 126,207,316 7.300%BlackRock, Inc. 117,910,625 6.820%shares held by: BlackRock Institutional Trust Company 67,803,612 3.922%
BlackRock Advisors Ltd 17,518,412 1.013%BlackRock Fund Advisors 8,481,139 0.491%
BlackRock Asset Management Japan Ltd 8,357,611 0.483%BlackRock Advisors LLC 4,387,700 0.254%
BlackRock Asset Management Australia Ltd 4,413,443 0.255%BlackRock Investment Management LLC 2,008,311 0.116%
BlackRock Asset Management Canada Ltd 1,399,106 0.081%BlackRock International Ltd 635,689 0.037%
BlackRock Capital Management Inc 580,300 0.034%BlackRock Financial Management Inc 491,745 0.028%
BlackRock Luxembourg SA 453,914 0.026%BlackRock Fund Managers Ltd 364,596 0.021%
BlackRock Netherlands BV 362,147 0.021%BlackRock Investment Management Dublin Ltd 313,875 0.018%
BlackRock Investment Management UK Ltd 186,575 0.011%BlackRock Investment Management Australia Ltd 152,450 0.009%
Goldman Sachs Asset Management LP 83,898,785 4.853%Total Intesa S. Paolo Group 40,274,358 2.329%
shares held by: Intesa Sanpaolo S.p.A. 36,930,518 411,658 0.00025 2.136%other banks of the Sanpaolo Imi Group 3,343,840 0.193%
Norges Bank Investment Management 35,108,360 2.031%Skagen AS 35,023,225 2.026%Total significant interests 438,422,669 25.358% For the sake of full disclosure, please note that, as a result of the share allocation process and the resulting allotment of shares to the creditors of the Parmalat Group, as of July 28, 2010, the Company's subscribed capital share increased by 16,373,847 euros. Consequently, the share capital, which totaled 1,712,558,142 euros at December 31, 2009, currently amounts to 1,728,931,989 euros. More specifically, 16,360,141 shares, equal to about 0.9% of the share capital, are still held on deposit by Parmalat S.p.A. A breakdown of these shares is as follows: - 7,240,079 shares, equal to 0.4% of the share capital, are owned by commercial creditors who have been
identified by name and are held by Parmalat S.p.A. as intermediary through the Monte Titoli centralized securities clearing system;
- 9,120,062 shares, equal to 0.5% of the share capital, are registered in the name of Fondazione Creditori Parmalat, broken down as follows:
• 120,000 shares represent the initial share capital of Parmalat S.p.A.; • 9,000,062 shares, equal to 0.5% of the share capital, belong to creditors who have not yet
claimed them. The maintenance of the Stock Register has been outsourced to Servizio Titoli S.p.A.

Information About Parmalat’s Securities 9
Characteristics of the Securities Shares The shares are common, registered shares, regular ranking for dividends as of January 1 of the year in which the capital increase through which they were issued was carried out. The Extraordinary Shareholders' Meeting of March 1, 2005 approved a capital increase of up to 2,009,967,908 euros, reserved as follows:
a) up to 1,502,374,237 euros for unsecured creditors with verified claims; b) up to 38,700,853 euros for Fondazione Creditori Parmalat; c) up to 238,892,818 euros for creditors with contested or conditional claims; d) up to 150,000,000 euros for late-filing creditors; e) up to 80,000,000 euros for the conversion of warrants.
The Extraordinary Shareholders' Meeting of September 19, 2005 approved a resolution making "permeable" the tranches into which the capital increase approved at the abovementioned Extraordinary Shareholders' Meeting of March 1, 2005 is divided. On April 28, 2007, the Shareholders' Meeting, convened in Extraordinary Session and acting pursuant to Article 5 of the Company Bylaws, approved a resolution increasing from 80 million euros to 95 million euros the share capital reserved for the conversion of warrants. Consequently, the Company's share capital totals 2,025 million euros, an amount that includes 95 million euros reserved for the exercise of warrants. If one of the tranches into which the abovementioned capital increase is divided (except for the first tranche – for an amount up to 1,502 million euros – and the last tranche of 80,000,000 euros – now 95,000,000 euros – reserved for warrant conversion purposes) should contain more shares than are needed to actually convert into share capital the claims for which it has been reserved, the surplus can be used to draw the resources needed to convert the claims of a different category of creditors, whose conversion needs are greater than those that can be accommodated with the capital increase tranche reserved for them pursuant to the resolution approved by the Extraordinary Shareholders' Meeting of March 1, 2005. Acting in accordance with the abovementioned resolutions of the Shareholders' Meeting, the Board of Directors carried out the requisite capital increases, as needed.

10 Information About Parmalat’s Securities
Warrants
Global Depositary Receipts Pursuant to the Composition with Creditors and with express exemption from any related liability, the Fondazione Creditori Parmalat and the Issuer have been authorized, each within the scope of its jurisdiction, to award to unsecured creditors who can be classified as "Qualified Institutional Buyers" or "Accredited Investors" (in accordance with the meaning that these terms have pursuant to the "General Rules and Regulations Under the U.S. Securities Act of 1933") the Issuer's shares and warrants that they are entitled to receive in the form of Global Depositary Receipts, and to take all steps necessary to establish the required Global Depositary Receipts programs. The credit institution that issues these financial instruments is the Bank of New York, which should be contacted for all related documents and transactions.
The warrants, which have a par value of 1 euro each, are issued in dematerialized form and have been negotiable on the Online Stock Market since the date of listing (October 28, 2005). Each warrant conveys the right to subscribe shares at par for cash on a continuous basis, effective on the tenth day of the month following the month when the application to exercise the warrants is filed in a given calendar year, from 2005 to 2015. The terms and conditions for the exercise of the warrants are set forth in the respective regulations, which were approved by the Company's Board of Directors on March 1, 2005 and are available at the Parmalat website (www.parmalat.com). The additional shares issued through the exercise of the warrants will be issued with regular ranking, i.e., with a valid coupon as of the effective exercise date of the warrants.

Board of Directors, Board of Statutory Auditors and Independent Auditors 11
Board of Directors, Board of Statutory Auditors and Independent Auditors Board of Directors
Chairman Raffaele Picella Chief Executive Officer Enrico Bondi Directors Piergiorgio Alberti (i)
Massimo Confortini (i) (3) Marco De Benedetti (i) (2) Andrea Guerra (i) (2) Vittorio Mincato (i) (3)
Erder Mingoli (i) Marzio Saà (i) (1) Carlo Secchi (i) (1) (2)
Ferdinando Superti Furga (i) (1) (3)
(i) Independent Director (1) Member of the Internal Control and Corporate Governance Committee (2) Member of the Nominating and Compensation Committee (3) Member of the Litigation Committee
Board of Statutory Auditors Chairman Alessandro Dolcetti Statutory Auditors Enzio Bermani
Renato Colavolpe Independent Auditors PricewaterhouseCoopers S.p.A.

12 Board of Directors, Board of Statutory Auditors and Independent Auditors

Interim Report on Operations – Review of Operating and Financial Performance 13
Interim Report on Operations
Review of Operating and Financial Performance Parmalat Group Net revenues increased by 9.6% compared with the first six months of 2009, thanks to the consolidation of Parmalat Food Products, an Australian company acquired in July 2009, the effect of a decrease in the value of the euro versus the main currencies of the countries where the Group operates and strong performances by the Australian and Canadian subsidiaries. These positive developments more than offset the negative impact of an across-the-board reduction in volumes in Venezuela, lower unit sales of fruit beverages in Italy and the streamlining of the product portfolio in South Africa, which included discontinuing some productions for private labels and exiting excessively competitive segments, such as fresh fruit juices and pasteurized milk. EBITDA grew to 174.5 million euros, for a gain of 12.9 million euros (+8.0%) compared with the 161.6 million euros earned in the first six months of 2009. The Group continued to face strong competitive pressure from competitors including private labels. Nevertheless, it improved its profitability, owing to price-list increases implemented in 2009 and a greater use of sales and advertising tools. EBIT amounted to 176.7 million euros, down 111.8 million euros, compared with 288.5 million euros in the first six months of 2009. Lower proceeds from litigation settlements reached during the first half of 2010 account for this decrease. Depreciation, amortization and writedowns of non-current assets totaled 58.3 million euros (46.7 million euros in the first six months of 2009). Group interest in net profit decreased to 147.4million euros, or 100.4 million euros less than the 247.8 million euros earned in the first six months of 2009, due mainly to a reduction in the contribution provided to the bottom line by litigation settlements, which generated total proceeds of 39.7 million euros after taxes (178.7 million euros in the first half of 2009). Net profit deriving from industrial activities amounted to approximately 113 million euros compared with 69 million euros in the first six months of 2009. Operating working capital grew to 364.7 million euros, or 21.6 million euros more than at December 31, 2009, when it amounted to 343.1 million euros. This increase is due mainly to the translation of the financial statements of companies that operate outside the euro zone. Net invested capital amounted to 2,083.4 million euros, for an increase of 211.2 million euros compared with 1,872.2 million euros at December 31, 2009. The impact of the translation of the financial statements of companies that operate outside the euro zone and the disbursement of the 2010 advance tax payment account for most of this increase. Net financial assets totaled 1,297.6 million euros, or 87.0 million euros less than the 1,384.6 million euros reported at December 31, 2009. This decrease reflects the combined impact of the following factors: the cash flow from operating activities (82.0 million euros), the cash flow used for nonrecurring activities (10.1 million euros, related mainly to the early partial repayment of a financing facility by the Canadian subsidiary), the cash flow from litigation settlements (8.9 million euros, as the net result of 60.6 million euros in proceeds from settlements reached during the period, 9.3 million euros in legal costs incurred to pursue legal actions and 60.2 million euros in income taxes on settlements), the cash flow from financial transactions (4.8 million euros), the payment of dividends (108.9 million euros, including 107.4 million euros paid by the Group’s Parent Company for the 2009 final dividend) and the impact of the translation of the net indebtedness of companies that operate outside the euros zone (36.3 million euros). Group interest in shareholders' equity grew to 3,356.0 million euros. The increase of 123.7 million euros compared with the amount at December 31, 2009 (3,232.3 million euros) is due mainly to the net profit for the period (147.4 million euros) and the translation of the financial statements of companies that operate outside the euro zone (84.1 million euros), offset in part by the payment of the final divided for 2009 (108.9 million euros), as approved by the Ordinary Shareholders’ Meeting on April 1, 2010.

14 Interim Report on Operations – Review of Operating and Financial Performance
Parmalat Group
RECLASSIFIED CONSOLIDATED INCOME STATEMENT (in millions of euros) First half 2010 First half 2009
REVENUES 2,048.9 1,860.9Net evenues 2,026.2 1,848.0Other revenues 22.7 12.9 OPERATING EXPENSES (1,864.9) (1,691.0)Purchases, services and miscellaneous costs (1,608.3) (1,466.2)Labor costs (256.6) (224.8) Subtotal 184.0 169.9 Writedowns of receivables and other provisions (9.5) (8.3) EBITDA 174.5 161.6 Depreciation, amortization and writedowns of non-current assets (58.3) (46.7)Other income and expenses: - Litigation-related legal expenses (5.1) (6.1)- Miscellaneous income and expenses 65.6 179.7 EBIT 176.7 288.5 Net financial income (expense) 0.5 3.8Interest in the results of companies valued by the equity method (0.7) -Other income from (charges for) equity investments 0.3 3.2 PROFIT BEFORE TAXES 176.8 295.5 Income taxes (28.2) (46.3) NET PROFIT FROM CONTINUING OPERATIONS 148.6 249.2 NET PROFIT FOR THE YEAR 148.6 249.2 Minority interest in net (profit) loss (1.2) (1.4)Group interest in net profit 147.4 247.8 Continuing operations:
Basic earnings per share 0.0854 0.1463
Diluted earnings per share 0.0836 0.1441

Interim Report on Operations – Review of Operating and Financial Performance 15
Parmalat Group
RECLASSIFIED CONSOLIDATED BALANCE SHEET
(in millions of euros) 6/30/10 12/31/09
NON-CURRENT ASSETS 2,028.4 1,900.1Intangibles 1,139.9 1,063.5Property, plant and equipment 819.9 774.0Non-current financial assets 13.1 11.4Deferred-tax assets 55.5 51.2 HELD-FOR-SALE ASSETS, NET OF CORRESPONDING LIABILITIES 0.5 1.0
NET WORKING CAPITAL 417.3 352.9Inventories 430.4 376.1Trade receivables 441.8 459.9Trade payables (-) (507.5) (492.9) Operating working capital 364.7 343.1
Other current assets 211.8 211.8Other current liabilities (-) (159.2) (202.0)
INVESTED CAPITAL NET OF OPERATING LIABILITIES 2,446.2 2,254.0
PROVISIONS FOR EMPLOYEE BENEFITS (-) (95.9) (92.6)PROVISIONS FOR RISKS AND CHARGES (-) (261.3) (282.6)PROVISION FOR LIABILITIES ON CONTESTED PREFERENTIAL AND PREDEDUCTION CLAIMS (5.6) (6.6) NET INVESTED CAPITAL 2,083.4 1,872.2 Covered by: SHAREHOLDERS' EQUITY1 3,381.0 3,256.8Share capital 1,728.4 1,712.6Reserve for creditor challenges and claims of late-filing creditors convertible into share capital 154.3 168.8Other reserves and retained earnings 1,325.9 901.7Interim dividend 0.0 (69.8)Profit for the year 147.4 519.0Minority interest in shareholders' equity 25.0 24.5
NET FINANCIAL ASSETS (1,297.6) (1,384.6)Loans payable to banks and other lenders 228.4 254.4Loans payable to investee companies 4.7 6.0Other financial assets (-) (1,227.9) (1,216.8)Cash and cash equivalents (-) (302.8) (428.2) TOTAL COVERAGE SOURCES 2,083.4 1,872.21 The schedule that reconciles the result and shareholders’ equity at June 30, 2010 of Parmalat S.p.A. to the consolidated result and shareholders’ equity is explained in the Notes to the Condensed Consolidated Semiannual Financial Statements.

16 Interim Report on Operations – Review of Operating and Financial Performance
Parmalat Group
STATEMENT OF CHANGES IN NET FINANCIAL POSITION IN THE FIRST HALF OF 2010
(in millions of euros) First half 2010 First half 2009Net (financial assets) borrowings at beginning of period (1,384.6) (1,108.8)Changes during the period: - Cash flow from operating activities for the period (143.7) (80.0)- Cash flow from investing activities 53.8 34.5- Accrued interest 24.4 16.9- Cash flow from settlements 8.9 (162.8)- Dividend payments 108.9 163.8- Exercise of warrants (1.3) (0.3)- Miscellaneous items (0.3) (4.8)- Translation effect 36.3 11.5Total changes during the period 87.0 (21.2)Net financial assets at end of period (1,297.6) (1,130.0)
BREAKDOWN OF NET FINANCIAL POSITION
(in millions of euros) 6/30/10 12/31/09Loans payable to banks and other lenders 228.4 254.4Loans payable to investee companies1 4.7 6.0Other financial assets (-) (1,227.9) (1,216.8)Cash and cash equivalents (-) (302.8) (428.2)Net (financial assets) borrowings (1,297.6) (1,384.6)1 Including 2.4 million euros owed to PPL Partecipações Ltda and 2.3 million euros owed to Wishaw Trading sa.
RECONCILIATION OF CHANGE IN NET FINANCIAL ASSETS TO CASH FLOW STATEMENT (Cash and Cash Equivalents)
(in millions of euros) Cash and cash
equivalentsOther financial
assetsGross
indebtedness Net (financial
assets) borrowings
Beginning balance (428.2) (1,216.8) 260.4 (1,384.6)Cash flow from operating activities for the period (143.7) - - (143.7)Cash flow from investing activities 53.8 - - 53.8New borrowings1 (4.3) - 4.3 -Loan repayments1 33.3 - (33.3) -Accrued interest - - 24.4 24.4Investments in current financial assets and sundry assets 17.1 (17.1) - -
Cash flow from settlements 63.1 - (54.2) 8.9Dividend payments 108.9 - - 108.9Exercise of warrants (1.3) - - (1.3)Miscellaneous items - 0.9 (1.2) (0.3)Translation effect (1.5) 5.1 32.7 36.3Ending balance (302.8) (1,227.9) 233.1 (1,297.6)1 See Note (14) to the Consolidated Financial Statements.

Interim Report on Operations – Review of Operating and Financial Performance 17
Parmalat S.p.A. Net revenues totaled 397.0 million euros, or 4.7% less than the 416.6 million euros booked in the first six months of 2009. This decrease is directly related to the behavior of consumers, who, even though GDP is again growing, continue to follow conservative shopping habits, favoring purchases of lower priced products (promotions, discount channel and private labels). As for the fruit beverage segment, sales volumes were down due to unfavorable seasonal weather conditions during the period. EBITDA amounted to 36.9 million euros, for a decrease of 4.6 million euros (-11.1%) compared with the 41.5 million euros earned in the first six months of 2009. This negative change reflects a reduction of 2.5 million euros in the sales margin that resulted from programs implemented to support sales volumes through an increase in advertising investments and the use of sales incentives (discounts/promotions and price cuts), increase the Company’s competitiveness and respond to the aggressive policies of competitors, especially in the conventional pasteurized milk segment. In addition, the allowance for doubtful accounts was increased by 2.1 million euros in the first half of 2010. EBIT decreased to 44.7 million euros. The reduction of 149.9 million euros, compared with the 194.6 million euros reported at June 30, 2009, is due mainly to the smaller proceeds generated by settlements with credit institutions and other creditors: 44.8 million euros in the first six months of 2010 compared with 181.7 million euros in the same period last year. The net profit for the period totaled 77.7 million euros, or 150.9 million euros less than the 228.6 million euros earned in the first six months of 2009. This negative change is chiefly the result of the decrease in proceeds from settlements mentioned above, which accounted for about 33.5 million euros of the period’s net profit (net of the applicable tax effect) compared with about 178.7 million euros in the same period last year. A reduction in net financial income (-10.0 million euros), offset in part by higher dividends from investee companies (42.4 million euros, up from 33.9 million euros in the first half of 2009) account for the balance of the decrease. Net invested capital amounted to 1,425.4 million euros, up 76.7 million euros compared with December 31, 2009 (1,348.7 million euros). This increase is due in part to the payment of income taxes of about 64 million euros (balance due for 2009 and first estimated payment for 2010) and the reversal/reclassification of provisions for risks concerning mainly amounts originally set aside in connection with equity investments (about 52 million euros). On the other hand, operating working capital decreased by about 22 million euros. A change in the net VAT credit balance, due to the collection of an amount that exceeded by 10 million euros the credit accrued during the period, was another reduction factor. Net financial assets fell from 1,486.8 million euros at December 31, 2009 to 1,380.1 million euros at June 30, 2010, for a decrease of 106.7 million euros. Dividend payments of about 107.4 million euros account for most of this change. The Company's shareholders' equity totaled 2,805.5 million euros, down from 2,835.5 million euros at December 31, 2009. The increase of 30.0 million euros is essentially the net result of the profit for the period, less the payment of the 2009 final dividend.

18 Interim Report on Operations – Review of Operating and Financial Performance
Parmalat S.p.A.
RECLASSIFIED INCOME STATEMENT (in millions of euros) First half 2010 First half 2009 REVENUES 417.9 429.1Net revenues 397.0 416.6Other revenues 20.9 12.5 OPERATING EXPENSES (374.9) (383.6)Purchases, services and miscellaneous costs (319.4) (330.8)Labor costs (55.5) (52.8) Subtotal 43.0 45.5 Writedowns of receivables and other provisions (6.1) (4.0) EBITDA 36.9 41.5 Depreciation, amortization and writedowns of non-current assets (21.2) (19.5)Other income and expenses: - Litigation-related legal expenses (5.1) (6.1)- Additions to provision for losses of investee companies (10.2) (6.3)- Miscellaneous income and expenses 44.3 185.0 EBIT 44.7 194.6 Net financial income (expense) 7.5 17.4Other income from (charges for) equity investments 42.4 33.9 PROFIT BEFORE TAXES 94.6 245.9 Income taxes (16.9) (17.3) NET PROFIT FROM CONTINUING OPERATIONS 77.7 228.6 Net profit from discontinuing operations 0.0 0.0 NET PROFIT FOR THE PERIOD 77.7 228.6

Interim Report on Operations – Review of Operating and Financial Performance 19
Parmalat S.p.A.
RECLASSIFIED BALANCE SHEET
(in millions of euros) 6/30/10 12/31/09
NON-CURRENT ASSETS 1,397.6 1,396.6Intangibles 382.0 388.9Property, plant and equipment 153.7 151.7Non-current financial assets 826.2 823.9Deferred-tax assets 35.7 32.1 HELD-FOR-SALE ASSETS, NET OF CORRESPONDING LIABILITIES 0.0 0.0
NET WORKING CAPITAL 114.8 91.1Inventories 42.5 37.1Trade receivables 150.0 180.0Trade payables (-) (176.7) (179.1) Operating working capital 15.8 38.0 Other current assets 153.2 140.2Other current liabilities (-) (54.2) (87.1)
INVESTED CAPITAL NET OF OPERATING LIABILITIES 1,512.4 1,487.7 PROVISIONS FOR EMPLOYEE BENEFITS (-) (26.1) (26.8)PROVISIONS FOR RISKS AND CHARGES (-) (55.8) (107.1)PROVISION FOR LIABILITIES ON CONTESTED PREFERENTIAL AND PREDEDUCTION CLAIMS
(5.1) (5.1)
NET INVESTED CAPITAL 1,425.4 1,348.7 Covered by: SHAREHOLDERS' EQUITY 2,805.5 2,835.5Share capital 1,728.4 1,712.6Reserve for creditor challenges and claims of late-filing creditors convertible into share capital 154.3 168.9Other reserves and retained earnings 845.1 651.0Interim dividend 0.0 (69.8)Profit for the period 77.7 372.8
NET FINANCIAL ASSETS (1,380.1) (1,486.8)Loans payable to banks and other lenders 6.8 9.2Loans payable to investee companies (14.8) (25.5)Other financial assets (-) (1,216.0) (1,188.1)Cash and cash equivalents (-) (156.1) (282.4) TOTAL COVERAGE SOURCES 1,425.4 1,348.7

20 Interim Report on Operations – Revenues and Profitability
Revenues and Profitability Note: The data are stated in millions of euros. As a result, the figures shown for change amounts and percentages could show apparent discrepancies caused exclusively by the rounding of figures. The overall macroeconomic environment that characterized the first half of 2010 enabled the Group to maximize the opportunities provided by development in the economies of the main countries outside the euro zone. A widespread recovery of consumer demand in many of these countries, combined with a positive currency translation effect and a prudent sales policy, produced significant growth, with which the Group compensated negative performances in countries where the economic environment had not yet turned positive and competition was more pronounced. After a period of unfavorable economic conditions, during which the Group was nevertheless able to demonstrate its skills as a countercyclical operator, the current recovery will provide it with an opportunity to operate as a strong player, ready to seize all developing opportunities. However, the current environment continues to be characterized by consumer buying habits that favor purchases of lower priced products, which is causing operators to develop corresponding product mix and market strategies. Parmalat Group In 2010, the Parmalat Group reported gains both in net revenues and EBITDA, compared with the first six months of 2009.
(in millions of euros)Cumulative at June 30, 2010
Cumulative at June 30, 2009 Variance Varian.%
Revenues 2,026.2 1,848.0 178.2 +9.6%
EBITDA 174.5 161.6 12.9 +8.0%
EBITDA % 8.6 8.7 -0.1 ppt
The increase in revenues achieved in the first half of 2010 (+9.6% compared with the same period last year) is chiefly the result of the following factors:
• A positive performance in Canada and Australia thanks in part to the consolidation of the Parmalat
Food Products operations acquired in July 2009 (change in scope of consolidation);
• The translation effect, which reflects two main developments: the decrease in the value of the euro versus most of the currencies of the countries where the Group operates, which had a positive impact on operating results, and the devaluation of the Venezuelan bolivar, which reduced in part the resulting benefit;
• A decrease in sales volumes, mainly in Venezuela due to energy shortages, the choice to streamline the portfolio of lower-margin products in South Africa (UHT milk produced for private labels, fresh fruit juices and pasteurized milk) and lower unit sales in Italy, mainly in the fruit beverage segment due to unfavorable weather conditions, which offset in part the positive effect of the trends discussed above.
EBITDA totaled 174.5 million euros, or 12.9 million euros more (+8.0%) than the 161.6 million euros earned in the first half of 2009.

Interim Report on Operations – Revenues and Profitability 21
The data at constant exchange rates and scope of consolidation are as follows:
(in millions of euros)Cumulative at June 30, 2010
Cumulative at June 30, 2009 Variance Varian.%
Revenues 1,720.2 1,734.8 (14.7) -0.8%
EBITDA 153.4 149.4 4.0 +2.7%
EBITDA % 8.9 8.6 0.3 ppt
A constant scope of consolidation is obtained by excluding the operations acquired in Australia in the third quarter of 2009 and without counting the 2009 contribution of the Nicaraguan operations, which were divested at the end of the year. Moreover, the data for 2009 have been restated to reflect the impact of the change in the official exchange rate that occurred on January 8, 2010, when the Venezuelan government decided to devalue the local currency, resetting the reference exchange rate from 2.15 bolivar fuerte (VEF) to 4.30 VEF for one U.S. dollar. The table with data at constant exchange rates does not reflect the impact of inflation accounting on the Venezuelan operations. Due to Venezuela’s high rate of inflation, which exceeded the 100% threshold in the past three years, the data for 2010 have been restated, making the accounting adjustments required by IAS 29, which provides guidelines for restating financial statement balances, except for cash items, by applying a general price index, in countries with hyperinflation. Like for Like Net Revenues and EBITDA Cumulative Net Revenues June 2010 vs 2009 (€ m)
1,848.0 -11.7 -101.5 1,734.8
55.0
-28.7 -52.1
15.6
-4.4 1,720.2
92.7 205.9 7.4
2,026.2
2009 netrevenues
before disp.
Disposals 2009 Venezuelaexch. devaluation
effect (1)
2009 netrevenues
Price Discounts/Returns
SalesVolume
Mix Other 2010 netrevenues
Perimeter Currencytranslation
Venezuelahyperinfl.
effect
2010 netrevenues incl.
Venezuelahyperinflation
-0.8%+9.6%
Cumulative EBITDA June 2010 vs 2009 (€ m)
(1) 2009 data restated including the effect of the devaluation of the "bolivar fuerte" versus the U.S. dollar (4.3 VEF = 1 USD) occurred on January 8, 2010
161.6 -1.1 -11.1 149.4
26.3
-9.0 -11.8
1.5
-6.1
3.7
-0.6 153.4
2.619.7
-1.1 174.5
2009EBITDAbeforedisp.
Disposals 2009 Venezuelaexch. devaluation
effect (1)
2009EBITDA
Price/Discounts
Variablecosts
Volume Mix Fixedand gen.
"Operationscosts"
CorporateOH
Receiv.write off& misc.
2010EBITDA
Perimeter Currencytranslation
Venezuelahyperinfl.
effect
2010EBITDA
incl. Venez.hyperinfl.
+2.7% +8.0%

22 Interim Report on Operations – Revenues and Profitability
Data by Geographic Region 15 17 3 5
(in millions of euros) Cumulative at June 30, 2010 Cumulative at June 30, 2009
Region Revenues EBITDA EBITDA % Revenues EBITDA EBITDA %
Italy 478.1 49.8 10.4 505.6 61.7 12.2
Other Europe 72.6 6.6 9.1 67.9 10.6 15.6
Russia 40.3 2.8 6.9 33.4 6.4 19.1
Portugal 27.7 3.0 10.9 29.5 3.8 12.9
Romania 4.6 0.8 16.7 5.0 0.4 8.7
Canada 749.1 64.8 8.6 638.6 51.1 8.0
Africa 192.0 17.2 9.0 165.5 6.2 3.7
South Africa 164.8 15.6 9.5 144.7 4.1 2.8
Other Africa 27.1 1.6 5.8 20.8 2.1 9.9
Australia 1 341.8 32.7 9.6 200.2 17.6 8.8
Central and South America 193.2 11.4 5.9 270.6 26.3 9.7
Venezuela 121.7 8.0 6.5 202.8 22.2 11.0
Colombia 60.1 3.6 6.0 47.0 3.4 7.1
Other Central and South America 11.4 (0.1) (1.2) 20.8 0.7 3.4
Other 2 (0.6) (8.1) n.s. (0.4) (11.9) n.s.
Group 2,026.2 174.5 8.6 1,848.0 161.6 8.7
Regions represent the consolidated countries
2. Include holding, other non core companies and eliminations between regions
1. 2010 data include net revenues of 92.7 million euros and EBITDA of 2.6 million euros relating to the acquisition of new operations
Net Revenues by Geographic Region
Italy24%
Other Europe4%
Canada36%
Central and South America
10% Africa9%
Australia17%
Interim Report on Operations – Revenues and Profitability 23
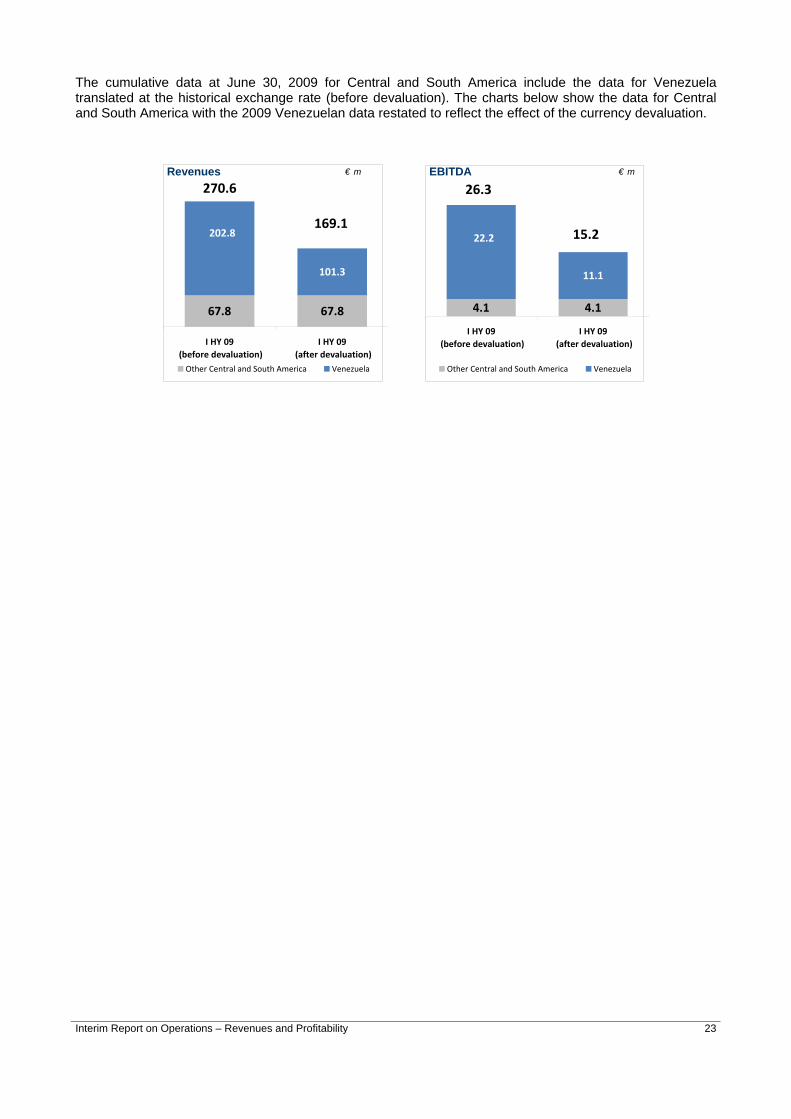
The cumulative data at June 30, 2009 for Central and South America include the data for Venezuela translated at the historical exchange rate (before devaluation). The charts below show the data for Central and South America with the 2009 Venezuelan data restated to reflect the effect of the currency devaluation.
Revenues € m EBITDA € m
270.6
169.1
67.8 67.8
101.3
202.8
I HY 09 (before devaluation)
I HY 09 (after devaluation)
Other Central and South America Venezuela
4.1
11.1
4.1
22.2
I HY 09 (before devaluation)
I HY 09 (after devaluation)
Other Central and South America Venezuela
26.3
15.2

24 Interim Report on Operations – Italy
Data by Product Division
(in millions of euros) Cumulative at June 30, 2010 Cumulative at June 30, 2009
Division Revenues EBITDA EBITDA % Revenues EBITDA EBITDA %
Milk 1 1,219.1 93.8 7.7 1,093.3 87.2 8.0
Fruit base drink 2 123.3 17.9 14.5 161.0 31.4 19.5
Milk derivative 3 634.5 69.6 11.0 561.7 52.6 9.4
Other 4 49.4 (6.8) (13.7) 32.0 (9.6) (30.0)
Group 2,026.2 174.5 8.6 1,848.0 161.6 8.7
1 Include milk, cream and bechamel2 Include fruit base drink and tea 3 Include yoghurt, dessert, cheese4 Include other products, Venezuela hyperinflation effects and Group's Parent company costs Net Revenues by Product Division
Cumulative at June 30, 2010 Cumulative at June 30, 2009
1 Include milk, cream and bechamel2 Include fruit base drink and tea 3 Include yoghurt, dessert, cheese4 Include other products and Venezuela hyperinflation effects
Milk (1)59.2%
Fruit base drink (2)
8.7%
Milk derivative (3)
30.4%
Other (4)1.7%
Other (4)2.4%
Milk derivative (3)
31.3%
Fruit base drink (2)
6.1%
Milk (1)60.2%
The table below shows the cumulative data at June 30, 2009 restated to reflect the impact of the devaluation of the Venezuelan currency.
(in millions of euros) Cumulative at June 30, 2010 Cumulative at June 30, 2009(after devaluation in Venezuela)
Division Revenues EBITDA EBITDA % Revenues EBITDA EBITDA %
Milk 1 1,219.1 93.8 7.7 1,048.4 91.9 8.8
Fruit base drink 2 123.3 17.9 14.5 125.0 18.9 15.2
Milk derivative 3 634.5 69.6 11.0 540.5 49.6 9.2
Other 4 49.4 (6.8) (13.7) 32.5 (9.9) (30.5)
Group 2,026.2 174.5 8.6 1,746.5 150.5 8.6

Interim Report on Operations – Italy 25
Italy Despite a few weak signs of recovery, consumer confidence and their propensity to spend remain low. Consumption of food products is down and many markets are characterized by an across-the-board decrease in prices, due to an increased use of promotions and the growth of private labels and the discount channel. Market and Products In the UHT milk market, where the environment continues to grow increasingly competitive, the trend was negative compared with the previous year, both on a volume basis (-1.1%) and, more significantly, on a value basis (-5%) due to rising promotional pressure and the resulting reductions in sales prices. Despite this environment, Parmalat posted positive results, strengthening its market leadership position and raising its value market share to 35.1%, owing mainly to the promotional and advertising programs carried out to support sales of the basic Parmalat milk and Zymil high digestibility milk. In the pasteurized milk market (which includes microfiltered milk) demand was down (-3.3% on a volume basis), due mainly to a lower business volume in the traditional channel. In the modern channel, however, sales were essentially steady on a volume basis but contracted on a value basis (-4.4%), due to increased price competition that affected private labels and all major operators. Parmalat’s value market share improved by almost one point, rising to 25.5%. In this environment, Parmalat grew faster than the market as a whole, gaining market share in the modern channel thanks to the implementation of promotional and advertising programs and a strong performance by its Blu Premium microfiltered milk. The yogurt market grew by 5.5% in volume terms, due mainly to rising demand in the functional yogurt segment. However, because of the growing use of sales promotions, which continues to be quite high, the increase was somewhat smaller on a value basis (+2.1%). Parmalat, in a highly competitive market environment, reported a reduction of one percentage point in its value market share, which currently stands at 5.6%. In the fruit beverage market, the trend was particularly negative compared with 2009, both on a volume basis (-5.3%) and on a value basis (-3.7%), due mainly to highly unfavorable weather conditions, especially in May and June. Private labels continued to grow, reaching a volume market share of 31.1%. Parmalat, with its Santàl brand, maintained its brand leadership position and improved its market share to 14.9%. In mid-March, Parmalat introduced a new refrigerated product, which is still in the launch phase, consisting of a 100% fruit smoothie called “Santàl 5 Colori Frullato,” marking its entry in this new market segment. The table below shows the market share held by the Italian SBU in the main market segments in which it operates:
Product Value market share UHT milk 35.1% Pasteurized milk1 25.5% UHT cream 34.4% Yogurt 5.6% Fruit beverages 14.9% Source: Nielsen – IRI Total Italy no Discount at July 4, 2010 1Source: Nielsen Modern Channel

26 Interim Report on Operations – Italy
(in millions of euros)Cumulative at June 30, 2010
Cumulative at June 30, 2009 Variance Varian.%
Revenues 478.1 505.6 (27.5) -5.4%
EBITDA 49.8 61.7 (11.9) -19.3%
EBITDA % 10.4 12.2 -1.8 ppt
Unit sales decreased by about 3% compared with the previous year. More specifically, sales of pasteurized milk, which account for 36% of total unit sales, were substantially in line with the previous year, while those of UHT milk, which account for 42% of sales, were down 1.7%. Shipments of fruit beverages contracted by 10%, due to unfavorable weather conditions. EBITDA were 19.3% lower, due mainly to the following factors: • an increase in promotional discounts for conventional pasteurized milk implemented in response to
programs launched by competitors; • higher investments in advertising to support the main brands; • a contraction in sales volumes, particularly in yogurt and fruit juice segments as a result of unfavorable
seasonal weather conditions.
The negative impact of these developments was offset in part by savings on fixed costs. Raw Materials and Packaging The signs pointing to cost increases that began to show at the end of 2009 became more pronounced during the first half of 2010. A reduced availability of powdered milk and butter on the world market, combined with an increased consumption of whole powdered milk in China, caused prices to rise slightly compared with the same period last year. The euro’s loss of value versus the U.S. dollar made European exports more competitive. The resulting reduction in the supply of milk offered on the spot market drove prices substantially above the level recorded in 2009. Packaging costs were also up, increasing by about 3% compared with the first half of 2009, as rising oil prices translated into higher prices for plastic-based materials. Industrial Investments In the first half of 2010, the SBU invested a total of 21 million euros, focusing on the following objectives:
• Improving production quality; • Ensuring employee safety and complying with occupational safety laws; • Reducing energy consumption and environmental impact; • Increasing the efficiency of production lines;
The sizable increase in capital expenditures in the first half of 2009, compared with the same period last year, was driven in part by the tax incentives provided by Article 5 of Decree Law No. 78 of July 1, 2009 (Tremonti-Ter) for investments carried out through June 30, 2010.

Interim Report on Operations – Other Countries in Europe 27
Other Countries in Europe Russia Market and Products Both the UHT milk market and the fruit beverage market are highly concentrated, due mainly to the consolidation of the market that occurred in recent years. In Russia, Parmalat operates throughout the country with unrefrigerated products (milk, cream and fruit beverages). All fresh dairy products (milk, cream, fresh cheese, yogurt and fermented milk) are marketed only at the regional level. As a result of the continuation of negative conditions in the economy, sales volumes of dairy products decreased steadily in the first half of 2010. More specifically, the UHT milk segment contracted by 3.4%, while demand for fruit beverages held relatively steady compared with the same period last year. Despite this challenging environment, the SBU was able to regain market shares in UHT milk, thanks to a more aggressive promotional policy, and hold its position in the premium segment of the beverage market. The table below shows the market share held by the Russian SBU in the main market segments in which it operates:
Product Value market share UHT cream* 5.4% UHT milk* 2.7% Flavored UHT milk* 3.8% Fruit beverages** 3.2% Source: *AC. Nielsen AM 10/** Business Analytica 2010 3-4
(in millions of euros)Cumulative at June 30, 2010
Cumulative at June 30, 2009 Variance Varian.%
Revenues 40.3 33.4 6.9 +20.6%
EBITDA 2.8 6.4 (3.6) -56.5%
EBITDA % 6.9 19.1 -12.2 ppt
Local currency figures
(local currency millions)Cumulative at June 30, 2010
Cumulative at June 30, 2009 Variance Varian.%
Revenues 1,606.9 1,471.4 135.6 +9.2%
EBITDA 110.7 281.5 (170.7) -60.7%
EBITDA % 6.9 19.1 -12.2 ppt
The Russian ruble increased in value by 9.5% compared with the exchange rate applied in the same period last year. The impact of this change on revenues and EBITDA was 3.8 million euros and 0.3 million euros, respectively. Overall, unit sales increased by 15.9% compared with the first six months of 2009. More specifically, shipments of UHT milk, which together with flavored milk account for 36% of total unit sales, were up 29.0%

28 Interim Report on Operations – Other Countries in Europe
compared with 2009, benefiting from increased investments in promotions, while sales of fruit beverages shrank by 6.0% year over year. Despite gains in sales volumes, the profitability of the SBU was heavily penalized by the effects of upward pressure on the cost of raw milk, mitigated in part by savings on the cost of packaging materials and other ingredients paid in foreign currencies. Raw Materials and Packaging The following developments characterized raw material prices in the first half of 2010:
• Because milk is a scarce resource and its price is strongly affected by supply levels both domestically and in the international market, its price increased during the first six months of 2010;
• Prices of fruit juice concentrates were lower during the first half of 2010.
Packaging material costs, which benefited from the appreciation of the ruble, had a positive impact on the SBU’s cost structure. Capital Expenditures Capital expenditures totaled 2.7 million euros in the first half of 2010. They were used mainly to increase the capacity and enhance the efficiency of production facilities, comply with current regulations and, most importantly, improve the distribution organization, including the start of construction of a central warehouse.

Interim Report on Operations – Other Countries in Europe 29
Portugal The market was affected by conditions in the global economy and the local business environment continued to be challenging, due to the limited purchasing power of consumers resulting from an unemployment rate that reached 10.6%. Market and Products The Portuguese milk market is highly concentrated and private labels have achieved a market share of about 50%. As a result of the economic crisis, private labels and, consequently, the market leader pursued a policy of lower prices, which, however, did not succeed in increasing consumption. The slump in consumer spending was particularly pronounced with regard to products with high value added, such as flavored milk and, among dairy products, cream and béchamel. In the fruit beverage market, private labels confirmed their strong position (market share of over 45%), while Santàl lost market share, especially in the modern channel.
Product Value market share Flavored milk1 28.4%
Fruit beverages2 1.6%
Source: 1 Reelaboration Parmalat, 2 AC Nielsen Homescan (end of April 2010)
Portogallo
(in millions of euros)Cumulative at June 30, 2010
Cumulative at June 30, 2009 Variance Varian.%
Revenues 27.7 29.5 (1.8) -6.0%
EBITDA 3.0 3.8 (0.8) -20.1%
EBITDA % 10.9 12.9 -1.9 ppt
In the first half of 2010, net revenues totaled 27.7 million euros, or 6.0% less than in the same period last year, due both to lower sales prices and a reduction in unit sales, which were down 6.0% compared with the previous year. Raw Materials and Packaging Raw milk prices decreased in the first half of 2010, but the cost of cream and cocoa were up sharply compared with 2009. Packaging material costs were roughly in line with the previous year and prices of glass containers were slightly lower than in 2009. Capital Expenditures In the first six months of 2010, capital expenditures totaled 0.6 million euros. The main projects included extraordinary maintenance of the production facilities, the purchase of a sterilizer and activities implemented to comply with new regulations.

30 Interim Report on Operations – Other Countries in Europe
Romania All sales of fruit beverages are made under the Santàl brand. With this brand, the Group is present in the nectars, juices and still drinks segments, in each of which it is positioned in the Premium Price group.
(in millions of euros)Cumulative at June 30, 2010
Cumulative at June 30, 2009 Variance Varian.%
Revenues 4.6 5.0 (0.4) -8.2%
EBITDA 0.8 0.4 0.3 +75.8%
EBITDA % 16.7 8.7 8.0 ppt
Local currency figures
(local currency millions)Cumulative at June 30, 2010
Cumulative at June 30, 2009 Variance Varian.%
Revenues 19.1 21.2 (2.1) -10.0%
EBITDA 3.2 1.9 1.3 +72.4%
EBITDA % 16.7 8.7 8.0 ppt
Unit sales of fruit beverages were down 10.7% compared with 2009 due mainly to a slump in consumption. Despite a contraction both in revenues and unit sales, the profitability of the Romanian SBU improved dramatically compared with the previous year due to the combined impact of the appreciation of the local currency versus the euro and the successful implementation of cost cutting programs.

Interim Report on Operations – Canada 31
Canada Canada came out of the recession quicker than other western countries due, on the one hand, to the healthier financial condition of its public sector, financial institutions and households and, on the other hand, the expansive effect generated by Asian demand for raw materials. The food market is extremely competitive, with large investments in advertising by all major competitors, while the propensity of consumers to seek out product promotion opportunities continues to increase steadily. Consumption was up slightly in the pasteurized milk market and Parmalat strengthened its market share, thanks primarily to a steadily positive performance by its high digestibility milk (36.6% volume market share). During the first half of 2010, the SBU completed the process of focusing its operations on its national brands—Lactantia in the premium segment and Beatrice in the basic segment—and streamlining its product portfolio. In the cheese market, which grew compared with the previous year, Parmalat continued to hold an extremely strong position, achieving the leadership of the all-important natural cheese segment with its Black Diamond brand and maintaining the leadership of the snack cheese segment. Yogurt consumption continued to expand at a rapid pace (+7% in the first half of 2010). Parmalat, which in the first three months of the year lost market share due to strong pressure from competitors, grew faster than the market as a whole during the second quarter. In a market characterized by a high degree of innovation, Parmalat pursued a policy of active engagement, launching new products in such important segments as low-fat, functional and organic yogurts. In addition to defending its strong position in Ontario, Parmalat is steadily increasing its penetration of the Québec market.
Product Value market share Pasteurized milk 20.0%
Yogurt 12.9% Snack cheese 37.9% “Natural” cheese 17.4% Source: ACNielsen, MarketTrack, National Grocery Banner+Drug+Mass Merch (June 5, 2010)

32 Interim Report on Operations – Canada
(in millions of euros)Cumulative at June 30, 2010
Cumulative at June 30, 2009 Variance Varian.%
Revenues 749.1 638.6 110.5 +17.3%
EBITDA 64.8 51.1 13.7 +26.9%
EBITDA % 8.6 8.0 0.7 ppt
Local currency figures
(local currency millions)Cumulative at June 30, 2010
Cumulative at June 30, 2009 Variance Varian.%
Revenues 1,029.1 1,025.0 4.1 +0.4%
EBITDA 89.0 82.0 7.0 +8.6%
EBITDA % 8.6 8.0 0.7 ppt
The Canadian dollar increased in value by 14.4% compared with the exchange rate applied in the same period last year, with an impact on revenues and EBITDA of 108.0 million euros and 9.3 million euros, respectively. In the first half of 2010, overall unit sales were little changed compared with the previous year. More specifically, shipments of pasteurized milk, which accounted for 59% of total sales volume, were in line with those of the same period last year. Compared with the first six months of 2009, unit sales were up 2.5% for cheese, but down 2.5% for yogurt. The Group’s success in protecting sales volumes in a challenging competitive environment was achieved thanks to an increase in investments in advertising and promotions. Despite this effort, EBITDA for the period increased by 8.6%, due mainly to savings in manufacturing costs. Raw Materials In the Canadian market for raw milk, the purchase price is regulated, which has limited the impact of price swings in the international market in recent years. However, because of this system, the average price of raw milk has been significantly higher than in other world markets. In the first six months of 2010, the cost of raw milk increased slightly compared with the price paid in the same period last year. Capital Expenditures Capital expenditures totaled 9.2 million euros in the first half of 2010. The main investments included projects to increase production capacity at the Brampton milk facility and at the Winchester and Victoriaville plants, complete the reconstruction of the Victoriaville factory, bring facilities into compliance with new regulations, revamp the distribution network and, in the IT area, develop a planning and resource management platform (SAP).

Interim Report on Operations – Africa 33
Africa South Africa Despite an improvement in macroeconomic conditions, consumer confidence has not yet fully recovered, nor has consumer spending. Market and Products Reflecting the impact of higher price levels, the UHT milk market showed significant growth on a value basis, even though the consumption trend was substantially stable. The local subsidiary suffered a loss in market share, having chosen to pursue a premium price strategy compared with its competitors and private labels. The cheese market enjoyed strong growth on a value basis in the first six months of 2010, expanding at a rate of 9.6% compared with the previous year. Parmalat South Africa strengthened its leadership of this market, thanks mainly to dominant positions in the spreadable cheese and wrapped slices segments. The positive trend continued in the yogurt market. However, the local subsidiary’s market share decreased, after an extended period of growth, due to intense promotional activity by the market leader and a different price positioning strategy. In the diary beverage segment, the local SBU performed particularly well in the flavored milk segment, retaining its position as the market leader, thanks mainly to Steri Stumpie branded products.
(in millions of euros)Cumulative at June 30, 2010
Cumulative at June 30, 2009 Variance Varian.%
Revenues 164.8 144.7 20.2 +13.9%
EBITDA 15.6 4.1 11.5 +279.9%
EBITDA % 9.5 2.8 6.6 ppt
Local currency figures
(local currency millions)Cumulative at June 30, 2010
Cumulative at June 30, 2009 Variance Varian.%
Revenues 1,649.1 1,772.6 (123.5) -7.0%
EBITDA 156.5 50.5 106.1 +210.2%
EBITDA % 9.5 2.8 6.6 ppt
The local currency (South African rand) increased in value by 18.3% compared with the exchange rate applied in the same period last year. The impact of this change on revenues and EBITDA was 30.2 million euros and 2.9 million euros, respectively. Overall, sales volumes fell by 26.7% compared with the previous year, due to the SBU’s decision to end production of some items for private labels and exit some unprofitable product categories, such as fresh fruit juices and pasteurized milk. Nevertheless, the local SBU achieved major improvements in profitability, thanks to a strategy that involved rationalizing production for private labels and focusing on the more profitable brands, to which it applied a more remunerative pricing policy. The effect of a decrease in sales volumes was offset by controlling production costs.
34 Interim Report on Operations – Africa
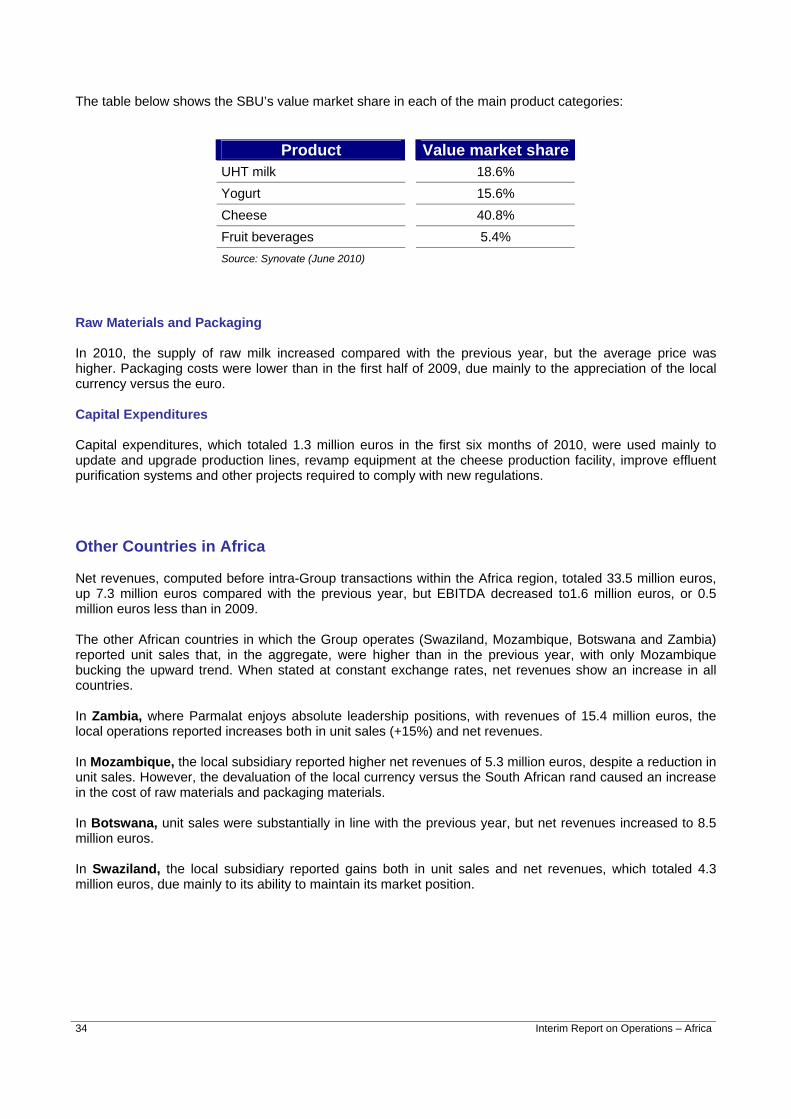
The table below shows the SBU’s value market share in each of the main product categories:
Product Value market share UHT milk 18.6% Yogurt 15.6% Cheese 40.8% Fruit beverages 5.4% Source: Synovate (June 2010)
Raw Materials and Packaging In 2010, the supply of raw milk increased compared with the previous year, but the average price was higher. Packaging costs were lower than in the first half of 2009, due mainly to the appreciation of the local currency versus the euro. Capital Expenditures Capital expenditures, which totaled 1.3 million euros in the first six months of 2010, were used mainly to update and upgrade production lines, revamp equipment at the cheese production facility, improve effluent purification systems and other projects required to comply with new regulations.
Other Countries in Africa Net revenues, computed before intra-Group transactions within the Africa region, totaled 33.5 million euros, up 7.3 million euros compared with the previous year, but EBITDA decreased to1.6 million euros, or 0.5 million euros less than in 2009. The other African countries in which the Group operates (Swaziland, Mozambique, Botswana and Zambia) reported unit sales that, in the aggregate, were higher than in the previous year, with only Mozambique bucking the upward trend. When stated at constant exchange rates, net revenues show an increase in all countries. In Zambia, where Parmalat enjoys absolute leadership positions, with revenues of 15.4 million euros, the local operations reported increases both in unit sales (+15%) and net revenues. In Mozambique, the local subsidiary reported higher net revenues of 5.3 million euros, despite a reduction in unit sales. However, the devaluation of the local currency versus the South African rand caused an increase in the cost of raw materials and packaging materials. In Botswana, unit sales were substantially in line with the previous year, but net revenues increased to 8.5 million euros. In Swaziland, the local subsidiary reported gains both in unit sales and net revenues, which totaled 4.3 million euros, due mainly to its ability to maintain its market position.

Interim Report on Operations – Australia 35
Australia
During the first half of 2010, the Australian economy enjoyed relative stability, with an improving consumer confidence index and a low level of unemployment. Market and Products The pasteurized milk market continued to show its fundamental stability, with private labels steadily increasing their market share, thanks to their substantial price differential compared with top-brand products. Nevertheless, Parmalat strengthened its market position thanks to a strong performance by its high digestibility and low fat milk and, most of all, to its expansion into new territories following the acquisition completed in 2009. As a result, its national market share improved from 19% to 22.1%. The flavored milk segment also performed well. In the modern channel, Parmalat increased both its value and volume market share and is continuing to implement plan to increase its penetration of the markets of New South Wales and South Australia. The positive trend continued in the yogurt market, with Parmalat increasing its market share from 12.8% to 13.5%, due mainly to an outstanding performance by the Vaalia brand, which retained the leadership position in the functional yogurt segment. In the dessert market, where demand increased, particularly in the second quarter of 2010, Parmalat reported gains that outpaced those of the market as a whole.
Product Value market share Pasteurized “white” milk 22.1% Flavored milk 24.1% Yogurt 13.5% Desserts 16.2% Source: Aztec Grocery Data (June 30, 2010)

36 Interim Report on Operations– Australia
The table that follows presents the consolidated data for Parmalat Australia and Parmalat Food Products (net revenues of 92.7 million euros and EBITDA of 2.6 million euros):
(in millions of euros)Cumulative at June 30, 2010
Cumulative at June 30, 2009 Variance Varian.%
Revenues 341.8 200.2 141.5 +70.7%
EBITDA 32.7 17.6 15.1 +85.6%
EBITDA % 9.6 8.8 0.8 ppt
Local currency figures
(local currency millions)Cumulative at June 30, 2010
Cumulative at June 30, 2009 Variance Varian.%
Revenues 507.8 376.2 131.6 +35.0%
EBITDA 48.6 33.1 15.5 +46.8%EBITDA % 9.6 8.8 0.8 ppt
The value of the Australian dollar increased by 20.9% compared with the exchange rate applied in the first six months of 2009. At a constant scope of consolidation, the impact of this change on revenues and EBITDA was 53.4 million euros and 6.3 million euros, respectively. The integration of Parmalat Food Products produced a significant sales increase, consolidating the local subsidiary’s position as a national player. Aside from the abovementioned acquisition, the local SBU focused its efforts on expanding in the product categories with greater value added, such as yogurt and flavored milk. Excluding the volumes sold by PFP, the local SBU reported unit sales of packaged products that showed relatively little change compared with a year ago. More specifically, unit sales of pasteurized milk were down 1.6%, even though shipments of flavored milk increased by 1.8%. Unit sales of yogurt were up 6.1%. A decrease in the cost of raw milk, compared with the first half of 2009, and positive results for high margin products, such as flavored milk and yogurt, are the primary reasons for the improvement in EBITDA. Raw Materials and Packaging Purchasing prices of raw milk benefited from the effect of fixed-price contracts, which helped reduce costs in the first six months of 2010. As for other materials and packaging materials, costs were substantially stable compared with the same period in 2009. Capital Expenditures Capital expenditures totaled 8.5 million euros in the first half of 2010. They were used mainly to install a new yogurt production line, upgrade production lines for dairy products at the Bendingo plant and for projects in the sales and distribution area.

Interim Report on Operations – Central and South America 37
Central and South America Venezuela The performance of the Venezuelan economy is affected both by international crude oil prices, a resource that Venezuela exports, and by the scarcity of electric power, which is generated for the most part by hydroelectric power plants and was heavily penalized by local weather conditions, particularly during the first quarter of 2010. Market and Products The Venezuelan market showed its resilience during the first half of 2010, with volume increases in the powdered milk (+2.9%) and fruit beverages (+5.1%) market segments, and a contraction in the yogurt (-12.3%) and milk beverages (-27.8%) market segments. The distribution system is still based mainly on traditional retailers, who account for most of the SBU’s sales. During the first six months of 2010, the local SBU was unable to continue the process of strengthening its market positions, as its production volumes decreased due to the lack of sufficient electric power at its production facilities and a reduction in the level of productivity. This situation affected mainly products with a high value added, such as yogurt and fruit beverages. These issues were completely resolved by July 2010 and the lost volumes should be made up during the second half of the year. The table below shows the SBU's value market share in the main product categories:
Product Value market share Fruit beverages 19.8% Milk beverages 32.4% Powdered milk 18.3% Yogurt 23.3% Source: ACNielsen; January 2010 – June 2010
The impact of the devaluation of the bolivar, on January 8, 2010, strongly affects comparisons with 2009. The data of the Venezuelan SBU are affected by the country’s high inflation rate, which, over the past three years, exceeded cumulatively the 100% threshold, requiring, as of December 2009, the adoption of the adjustments provided by IAS 29 for hyperinflationary economies.

38 Interim Report on Operations – Central and South America
In the table below, the data for 2010 are stated in accordance with IAS 29.
(in millions of euros)Cumulative at June 30, 2010
Cumulative at June 30, 2009 Variance Varian.%
Revenues 121.7 202.8 (81.0) -40.0%
EBITDA 8.0 22.2 (14.3) -64.1%
EBITDA % 6.5 11.0 -4.4 ppt
Local currency figures
(local currency millions)Cumulative at June 30, 2010
Cumulative at June 30, 2009 Variance Varian.%
Revenues 695.4 580.1 115.3 +19.9%
EBITDA 45.5 63.6 (18.0) -28.4%
EBITDA % 6.5 11.0 -4.4 ppt
Overall, unit sales decreased by 18.8% compared with 2009. Specifically, shipments were down 23.1% for fruit beverages, which accounted for 47% of the SBU’s total sales volume, and contracted by 11.6% for pasteurized milk and 29.8% for yogurt compared with the first half of 2009. The main reason for the decrease in the EBITDA amount, compared with the previous year, is a reduction in sales volumes. In addition, the SBU’s results were penalized by the high level of inflation, which reached 16.3% in the first half of 2010, causing large increases in purchasing costs for raw materials, ingredients and packaging materials and in overhead. The reduction in EBITDA was contained in part by an increase in sales of powdered milk, which helped absorb a significant portion of the increase in overhead. Raw Materials and Packaging The devaluation of the local currency and currency restrictions had a major inflationary impact on all imported packaging and raw materials, the prices of which are pegged to the U.S. dollar. Capital Expenditures Capital expenditures, which totaled 2.3 million euros in the first half of 2010, were used primarily to install UHT production lines at the Miranda and Barinas factories and increase creamery production in Quenaca. Devaluation of the Local Currency On January 8, 2010, the Venezuelan government approved a devaluation of the local currency, resetting the reference exchange rate from 2.15 VEF to 4.30 VEF for one U.S. dollar. In order to provide a clearer presentation of the actual impact of the developments described above, the SBU’s 2009 revenues and EBITDA shown in the table below have been recomputed using the new reference exchange rate of 4.30 VEF for one U.S. dollar.
(in millions of euros)Cumulative at June 30, 2009
2009 restated Variance
Revenues 202.8 101.3 (101.5)
EBITDA 22.2 11.1 (11.1)

Interim Report on Operations – Central and South America 39
Colombia The Colombian market was characterized by a decrease in consumption and competitive pressure on prices, due to a large extent to the impact of a reduction in the purchasing power of consumers, caused by an increase in the unemployment rate, and to an increasingly difficult political relationship with Venezuela, which resulted in significant cuts in cross-border trade. Market and Products Given this market environment and in view of the fact that consumption of milk and dairy products is relatively steady, the local subsidiary focused on expanding its distribution organization throughout Colombia, where the distribution system is still based on small traditional retailers. For quite some time, there has been a shift in consumption patterns in the milk market, away from pasteurized milk (-12% compared with 2009) and benefiting the segment of extended shelf life milk packaged in aseptic plastic pouches, which continued to show the upward trend enjoyed in recent years (+18% compared with 2009). The Colombian subsidiary, which has been focusing on this type of packaging, strengthened its market position by concentrating its efforts in the high digestibility milk segment and expanding distribution in the traditional channel. The powdered milk market was adversely affected by an influx of large quantities of low-price imports, which penalized local products. In the yogurt market, where demand continued to increase, the local subsidiary improved its market share by expanding distribution in the traditional channel and thanks to the launch of new products. The table below shows the SBU's value market share in the main segments in which it product categories:
Product Value market share Pasteurized milk 1 5.5% UHT milk 7.8% Powdered milk 11.0% Yogurt 3.5% 1Source: Fedegan; January 2010 – June 2010 Source: ACNielsen; January 2010 – June 2010

40 Interim Report on Operations – Central and South America
(in millions of euros)Cumulative at June 30, 2010
Cumulative at June 30, 2009 Variance Varian.%
Revenues 60.1 47.0 13.1 +27.8%
EBITDA 3.6 3.4 0.2 +7.4%
EBITDA % 6.0 7.1 -1.1 ppt
Local currency figures
(local currency millions)Cumulative at June 30, 2010
Cumulative at June 30, 2009 Variance Varian.%
Revenues 155,468 145,201 10,267 +7.1%
EBITDA 9,334 10,367 (1,033) -10.0%
EBITDA % 6.0 7.1 -1.1 ppt
The local currency (peso) increased in value by 16.2% compared with the exchange rate applied in the same period last year. The impact of this change on revenues and EBITDA was 9.7 million euros and 0.6 million euros, respectively. Against this background, total unit sales were up 16.4% compared with the previous year, with shipments of liquid milk (which accounted for about 90% of the total sales volume) rising by 16%. A positive performance in the Normal Trade channel made possible by the coverage of national points of sale is partly responsible for this improvement. The Normal Trade channel, the food segment in particular, continues to enjoy faster growth than the retail chain distribution channel. Raw Materials and Packaging Purchasing prices of raw milk held steady overall during the first six months of 2010. Packaging costs increased in line with the nation’s inflation rate. Capital Expenditures Capital expenditures, which totaled 0.9 million euros in the first six months of 2010, were used to complete the relocation of pasteurized milk production facilities from Bogotà to Chia and improve production efficiency.
Interim Report on Operations – Central and South America 41
Other Countries in Central and South America Net revenues and EBITDA, computed before intra-Group transactions in Central and South America, decreased compared with the results reported in 2009, due to the divestment of operations in Nicaragua in the last quarter of 2009. The Group’s SBU in Paraguay reported gains both in net revenues and EBITDA, which grew to 4.8 million euros and 0.2 million euros, respectively. The Group’s SBU in Ecuador markets primarily UHT milk packaged in aseptic plastic pouches (APP) and powdered milk. Even though revenues were up compared with the first half of 2009, the SBU’s profitability contracted, due mainly to an increase in raw milk purchasing costs caused by a severe drought during the summer months that reduced the availability of raw milk in the local market. Net revenues totaled 6.6 million euros, with EBITDA amounting to 0.2 million euros. The Group’s SBU in Cuba, which engages in the production of grapefruit juice and orange juice concentrate, fresh juices and orange and grapefruit essential oils, suspended operations during the first half of the year due to seasonal factors. Production will resume in the fourth quarter.

42 Interim Report on Operations – Human Resources
Human Resources
Group Staffing The table below provides a breakdown by geographic region of the employees of Group companies at June 30, 2010 and a comparison with the data at December 31, 2009. Total payroll by geographic region
Geographic region 6/30/10 12/31/09 Italy 2,158 2,233
Europe excluding Italy 1,411 1,383 Canada 2,929 2,919 Africa 2,357 2,343 Australia 1,709 1,707
Central and South America 3,368 3,203
Total 13,932 13,788 The number of employees on the Group’s payroll remained fairly constant during the first half of 2010. There were staff increases in the South American region, mainly in Venezuela and Colombia, primarily due to the hiring of temporary staff needed to meet seasonal production needs. On the other hand, the number of employees on the payroll of the Italian SBU decreased, as some companies, primarily Parmalat S.p.A. and Parmalat Distribuzione Alimenti S.r.l., availed themselves of the long-term unemployment benefits plan.

Interim Report on Operations – Capital Expenditures and Research and Development 43
Capital Expenditures Overview of the capital expenditures of the Parmalat Group at June 30, 2010 (excluding land and buildings)
(in millions of euros) First half 2010 First half 2009
Region Amount % of the total Amount % of the total Italy 21.0 44.0% 8.5 25.4% Europe excluding Italy 3.3 7.0% 3.0 9.0% Canada 9.2 19.2% 10.6 31.7% Africa 2.3 4.8% 2.6 7.8% Australia 8.5 17.7% 3.2 9.6% Central and South America 3.5 7.3% 5.5 16.5%
Total for the Group 47.8 100.0% 33.4 100.0% In the first half of 2010, the Group invested 47.8 million euros, or 43.1% more than in the same period last year. The main investment projects are discussed in the sections of this Report that review the performance of the individual SBUs.
Research and Development During the first six months of 2010, Parmalat continued to pursue research projects for the development of new products for Italy and other Group countries, such as juices for Romania and chocolate flavored milk for Portugal. Several projects focused on product diversification, development of new processes, cost reduction and development of new packaging, and addressed such basic issues as improving milk quality at the animal feed level.

44 Interim Report on Operations – Financial Performance
Financial Performance
Structure of the Financial Position of the Group and Its Main Companies The cash management policy pursued both by Parmalat S.p.A. individually and the Group as a whole is guided by a conservative approach. The Group’s Parent Company continued to hold most of the liquidity, with some of the subsidiaries still holding some debt positions, the amount of which has been reduced significantly. Consistent with the strategy pursued the previous year, the liquidity held by the Parent Company provides the Group with the financial flexibility needed to meet its operating and expansion needs. Group companies benefit from credit terms that are consistent with the best market terms with regard both to interest rates paid and yields earned. The Group’s liquid assets totaled 1,530.7 million euros, including 1,372.1 million euros held by Parmalat S.p.A. This liquidity has been invested in short-term bank deposits and in Italian, French and German treasury securities. More than one-half of these investments mature within three months and the balance matures between three and six months. The liquid assets not held by Parmalat S.p.A. are held by individual Group companies, which invest them in the same instruments as the Parent Company. At the Group level, income from securities and bank interest totaled 6.4 million euros, including 4.9 million euros attributable to Parmalat S.p.A. The decrease in financial income compared with the previous year is due mainly to a worldwide reduction in interest rates. Indebtedness owed to banks and other lenders decreased from 260.4 million euros at December 31, 2009 to 233.1 million euros at June 30, 2010, as a negative currency translation effect of 32.7 million euros on the debt exposure of foreign subsidiaries partly offset a positive impact of about 62 million euros generated by the settlement with Parmalat Capital Finance (“PCF”) and the early repayments of subordinated notes maturing in 2026.
Change in Net Financial Position The Group’s net financial assets decreased to 1,297.6 million euros at June 30, 2010, down from 1,384.6 million euros at December 31, 2009, after a negative foreign exchange effect of 36.3 million euros. As a result of the settlement with PCF, the gross financial debt of the Venezuelan subsidiaries denominated in foreign currencies was eliminated. The cash flow from operating activities amounted to 82.0 million euros. The cash flow from nonrecurring transactions, which amounted to 10.1 million euros, reflects mainly the impact of the early repayment of a long-term financing facility by the Canadian subsidiary. Litigation activities had a negative effect of 8.9 million euros on the net financial position. This amount is the net result of legal costs totaling 9.3 million euros, income taxes on settlements totaling 60.2 million euros (balance due for 2009 and 2010 estimated payment) and settlement proceeds of 60.6 million euros. In addition to the settlement reached with PCF for 52.4 million euros, Parmalat S.p.A. collected proceeds of 6.4 million euros, including 3.7 million euros from the settlement reached the previous year with Bank of America and, for the balance, proceeds from settlements reached during the first half of 2010 with Royal Bank of Scotland (0.2 million euros), Banca Popolare di Cividale (0.2 million euros), Commerzbank (1.8 million euros), Banca Popolare di Bari (0.5 million euros) and Caja de Ahorros y Monte de Piedad de Madrid (0.1 million euros).

Interim Report on Operations – Financial Performance 45
The cash flow from financial transactions totaled 4.8 million euros. Lastly, in addition to the negative foreign exchange effect of 36.3 million euros mentioned above, the Company paid dividends totaling 108.9 million euros.
Consolidated Cash Flow January 1 - June 30, 2010
-1,297.6
-1,384.6
-1,333.9
-60.6-14.9
-174.5
-1.3-4.9
36.310.8 51.44.2
108.960.215.041.0 9.3 6.1
Net
fina
ncia
las
sets
at 1
2.31
.200
9
EBIT
DA
Cha
nge
in n
etw
orki
ng c
apita
l
Tech
nica
l inv
estm
ents
+ la
nds
and
build
ings
Inve
stm
ents
in in
tang
ible
s
Cha
nges
in o
ther
asse
ts a
nd li
abilit
ies
Taxe
s re
latin
g to
oper
atin
g ac
tiviti
es
Dis
posa
ls a
ndot
her i
ncom
e
Acqu
isiti
on o
fce
rtain
ope
ratio
nsan
d ot
her c
harg
es
Settl
emen
ts
Litig
atio
n-re
late
dle
gal f
ees
Taxe
s pa
idon
set
tlem
ents
Net
fina
ncia
l int
eres
ts (n
et o
ftra
nsla
tion
diffe
renc
es a
ndta
x w
ithho
ldin
gs)
Exe
rcis
e of
war
rant
s
Div
iden
ds p
aid
Net
fina
ncia
l ass
ets
befo
re fo
rex Fo
rex
Net
fina
ncia
las
sets
at 6
.30.
2010
Cash flow from operating activities
-82.0 Mio€
Cash flow from litigations 8.9 Mio€
Cash flow from extraordinary transactions 10.1 Mio€
Cash flow from financial activities
4.8 Mio€
46 Interim Report on Operations – Managing Business Risks
Managing Business Risks In the normal course of its business operations, the Group is exposed to the operating risks that arise from the possible occurrence of accidents, malfunctions and breakdowns causing damages to persons, product quality or the environment, which could have an impact on the income statement and the balance sheet. The Group is also exposed to the following financial risks: • Risk from exposure to changes in interest rates and foreign exchange rates, country risk and risk related
to commodity prices; • Credit risk, which is the risk that a counterparty may become insolvent; • Liquidity risk, which is the risk that it may not be able to perform obligations associated with financial
liabilities; and risks of a general nature. Lastly, the Company and the Group are defendants in a series of civil and administrative lawsuits and the Company has filed a series of actions for damages, liability actions (both in civil and criminal venues) and actions to void in bankruptcy. An analysis of the main proceedings to which the Group is a party and of the related contingent liabilities is provided in the section of the Notes to the Financial Statements of the Parmalat Group entitled “Legal Disputes and Contingent Liabilities at June 30, 2010.” Operating Risks The quality of its products, the protection of the health of its customers and their full satisfaction are the Group’s primary objectives. To guarantee the quality of its products, in each of the countries where it operates, the Group adopted procedures and controls that are applied throughout the production process, from the procurement of raw materials to the distribution of finished products. Parmalat implemented at the Group level a project to allow individual SBUs to map operational risks. Operational risks are mapped by means of a special tool that ranks them based on probability of occurrence and potential economic impact. Risks are assessed in the following categories: competition, external context, regulatory environment, processes, procedures, sustainability, health and safety, trademarks, products, organization, systems and technology, and human resources. The results of these activities are updated every six months. However, despite the existing procedures and controls, the Group’s manufacturing processes are exposed to the risk of contamination both for products and packaging materials, as is the case for all processes in the food industry. This risk could result in the Group having to carry out a costly product recall. The Product Recall procedures adopted by the Group, which are based on its Consumer Safety and Health Protection guidelines, require that all activities be carried out in compliance with the applicable statutory requirements and in accordance with principles, standards and solutions that are consistent with best industry practices. Consistent with a policy of monitoring, reducing and transferring the operating risks that are inherent in its industrial and commercial activities, the Group has established an insurance system based on master policies that are negotiated and executed at the headquarters level and on primary risk local policies. The latter provide immediate coverage, which is supplemented with master policies when the magnitude of the damage exceeds the local coverage. Preventive procedures and controls at the manufacturing level and insurance coverages are constantly updated and are reviewed by independent auditors.
Interim Report on Operations – Managing Business Risks 47
Financial Risks The Group’s financial risk management policy is coordinated through guidelines defined by the Parent Company and adjusted by each company in local policies adopted to address specific issues that exist in the different markets. The guidelines establish benchmarks within which each company is required to operate and require compliance with some parameters. Specifically, the use of derivatives is allowed only to manage the exposure of cash flows, balance sheet items and income statement components to fluctuations in interest rates and foreign exchange rates. Speculative transactions are not allowed. Foreign Exchange Risk and Country Risk The Group has a limited exposure to foreign exchange risk because purchases and sales made by operations in the different target markets are denominated almost exclusively in local currencies. Any limited exposure to transactional foreign exchange risk is hedged with simple hedging instruments, such as forward contracts. From a more purely financial standpoint, the Group’s policy requires that any bank credit lines and investments of liquid assets be denominated in the local currency of the company involved, except for special needs, which require the approval of the Group’s Parent Company. Lastly, the companies that operate in countries with economies that are highly dependent on the oil industry are exposed to an economic risk. Specifically, the pressure that could develop on the currencies of such countries could translate into higher costs caused internally by the devaluation of the local currencies and these companies may not be able to fully reflect such increases in the prices of the products they sell. Information about the situation in Venezuela is provided in a separate section of the “Notes to the Condensed Consolidated Semiannual Financial Statements”. Interest Rate Risk The Parmalat Group manages the interest rate risk with simple financial hedging instruments. To cover their exposure to variable-rate indebtedness, the Australian and Canadian subsidiaries hedge their positions with interest rate swaps, which they executed when they refinanced their indebtedness, as required by the agreements executed with the lender banks. Price Risk The Group is not exposed to the risk related to changes in stock market prices because its investment policy forbids investments in such instruments. Credit Risk The Group is not exposed to significant credit risk with regard to its cash and cash equivalents, since all of its liquidity is deposited with banks that are rated “investment grade,” in the countries where this is possible, or it is invested in short-term Treasury securities. All of the liquidity of Parmalat S.p.A. is permanently held in Italy. At June 30, 2010, it was invested primarily on a fixed-term basis: almost 60% of the total amount was invested in Treasury securities (about two-thirds in Italian Treasury securities and one-third in German and French Treasury securities) and the remaining 40% was held in time deposits with banks rated “superior investment grade.”
48 Interim Report on Operations – Managing Business Risks
Commercial credit risk is monitored at the country level with the goal of achieving an acceptable quality level for the customer portfolio. Given the limited availability of independent ratings for their customer bases, each company implements internal procedures to minimize the risk related to trade receivable exposure. In any case, because the Group’s customer portfolio is diversified over different countries and within each country, the Group’s exposure to commercial credit risk is limited. Liquidity Risk The Group’s liquidity risk is managed mainly at the individual company level, with each company operating in accordance with guidelines defined by the Parent Company, which the main operating companies incorporated in special Cash Management Policies that take into account the specificities of individual markets. The Group’s Parent Company is kept constantly informed about changes in outlook concerning the financial position of its subsidiaries so that it may help them identify timely solutions to prevent the occurrence of financing problems. No situations causing financial stress occurred in the first half of 2010. The abundant liquid assets held by the Group’s Parent Company and the cash flow from operations that is being generated at the Group level provide ample coverage over the liquidity risk at all times. Risks of a General Nature The Group operates in the food industry, which, by its very nature, is less exposed than other activities to the negative effects of changes in economic conditions. Nevertheless, at this juncture, forecasting the effects and the timing of a recovery in the countries where the Group operates is a complex endeavor. Consequently, in light of the preceding remarks, a slow-paced the economic recovery could have an effect on the Group’s performance.
*** Neither the Parent Company nor its subsidiaries own any Parmalat S.p.A. shares.
*** Transactions among Group companies or between Group companies and related parties were neither atypical nor unusual and were conducted in the normal course of business. These transactions were carried out on market terms, i.e., on the same terms as those that would be applied by unrelated parties. Details about individual positions are provided in the Notes to the Financial Statements.
Interim Report on Operations – Tax Considerations and Corporate Governance 49
Tax Considerations The Group’s effective tax rate for the first half of 2010 was about 16%. In the case of the Italian Group companies, the tax rate was determined taking into account the regional tax (IRAP) component. The effective tax rate of Parmalat S.p.A., the Group’s Parent Company was about 18%. The main reason for the difference between the effective tax rate and the statutory tax rate is the tax treatment of dividends, as 95% of their amount is excluded from the taxable base. The effective tax rate also reflects the impact of the “Tremonti-Ter” tax incentives available under Article 5 of Decree Law No. 78 of 2009, which provides a 50% tax exemption for investments in plant and equipment made by June 30, 2010. On a percentage basis, this tax incentive is equal to 13.75% of the value of the capital expenditures made in the first six months of 2010. In the first half of 2010, some Italian Group companies that had elected to be included in the National Consolidated Tax Return renewed this option for an additional three years. Current income taxes for the first six months of 2010 totaled about 44 million euros, including 19 million euros owed by the Italian companies, 12 million euros owed by the Canadian companies, 8 million euros owed by the Australian companies and 3 million euros owed by the African companies. In the first half of 2010, the Group’s net deferred-tax liabilities decreased. The reversal of deferred-tax liabilities totaling 14.4 million euros in connection with the early repayment of a financing facility by the Canadian subsidiary is the main reason for this reduction. At the Group level, the expense for income taxes and other taxes for the first half of 2010 totaled about 112 million euros. The Italian Group companies paid about 64 million euros. The increase compared with the taxes paid in the same period last year (13.1 million euros) reflects the disbursement of larger estimated payments for 2010, which were determined based on historical data and the balance due for 2009.
Corporate Governance Parmalat’s corporate organization follows the so-called “conventional model,” which is based on corporate governance bodies that include the Shareholders’ Meeting, the Board of Directors (supported by Board Committees) and the Board of Statutory Auditors. The corporate governance model also includes the allocation of specific powers and the delegation of jurisdictional authority; the enactment of internal control procedures, of a Code of Conduct and of an Internal Dealing Code; and the adoption of an Organizational, Management and Control Model pursuant to Legislative Decree No. 231/01, which is binding on all members of the organization: Directors, Statutory Auditors and employees. Insofar as compliance with Legislative Decree No. 231/01 is concerned, after adopting its own Organizational, Management and Control Model in November 2006, Parmalat S.p.A. promoted the adoption of individual organizational models by its Italian subsidiaries and developed conduct guidelines for the Group’s main foreign subsidiaries. With regard to the organizational models of Parmalat S.p.A. and its Italian subsidiaries, specific audit plans have been developed and are being implemented to verify the effective and adequate implementation of protocols that are an integral part of the abovementioned models. In addition, on July 25, 2007, the Company appointed a Corporate Accounting Documents Officer, as required by Law No. 262/05, as amended. Also in this area, the Company is implementing a project that specifically addresses the need to define, when applicable, the special operating procedures required pursuant to Article 154-bis, Section 5, of the Uniform Financial Code. These procedures are being reviewed in accordance with a special conformity test implemented at major Group companies in Italy and abroad.

50 Interim Report on Operations – Key Events in the First Half of 2010 and Events Occurring After June 30, 2010
Key Events in the First Half of 2010 Devaluation of the Bolivar Subsequent to the devaluation of the bolivar fuerte on January 8, 2010, new regulations concerning transactions in foreign currencies were introduced on June 4, 2010. Settlement with Parmalat Capital Finance On February 25, 2010, Parmalat S.p.A. reached an agreement with Parmalat Capital Finance (“PCF”), in liquidation in the Cayman Islands. Under the settlement, Parmalat S.p.A. released 5.6 million shares previously issued for the benefit of PCF, which were the subject of an order of attachment by the Court of Parma, and awarded 12.4 million new shares (already issued) to PCF, while at the same time desisting from enforcing any claims against PCF in bankruptcy (without any assets) in the Cayman Islands. PCF waived all of its claims against Parmalat S.p.A., anywhere in the world, including claims filed past the statutory deadline against Parmalat S.p.A. and those filed as single shareholder against Parmalat Finanziaria (claim of 1.7 billion euros). Moreover, PCF transferred to Parmalat a receivable for a loan provided to Parmalat de Venezuela ($45 million, plus accrued interest) and other sundry claims. On March 30, 2010, the Court in the Cayman Islands approved the settlement between Parmalat S.p.A. and Parmalat Capital Finance, which thus became final. Centrale del Latte di Roma With regard to a provisions with effectiveness limited to the case at bar (incidenter tantum) contained in the decision handed down by the Council of State on March 1, 2010, Parmalat S.p.A. wishes to state that, in its opinion, the transfer of the shares of Centrale del Latte di Roma — recently the subject of comments in the daily press — should be viewed as irreversible. Summary Judgment Granted to Grant Thornton Proceedings challenging the decision by New York District Court granting a motion for summary judgment are pending before the Court of Appeals for the Second Circuit.
Events Occurring After June 30, 2010 No event requiring disclosure occurred after June 30, 2010.

Interim Report on Operations – Business Outlook 51
Business Outlook 2010 guidance Given the volatility of external factors (foreign exchange rates, Venezuela, global financial situation), the Company believes it prudent to confirm full year EBITDA guidance of 365 million euros.

52 Parmalat Group – Condensed Consolidated Semiannual Financial Statements at June 30, 2010

Parmalat Group – Condensed Consolidated Semiannual Financial Statements at June 30, 2010 53
Parmalat Group

54 Parmalat Group – Condensed Consolidated Semiannual Financial Statements at June 30, 2010
Parmalat Group – Condensed Consolidated Semiannual Financial Statements at June 30, 2010 55
Parmalat Group
Financial Statements at June 30, 2010

56 Parmalat Group – Condensed Consolidated Semiannual Financial Statements at June 30, 2010

Parmalat Group – Condensed Consolidated Semiannual Financial Statements at June 30, 2010 57
Consolidated Statement of Financial Position Note ref. (in millions of euros) 6/30/10 12/31/09 NON-CURRENT ASSETS 2,028.4 1,900.1(1) Goodwill 481.4 452.8(2) Trademarks with an indefinite useful life 615.2 561.3 Other intangibles 43.3 49.4(3) Property, plant and equipment 819.9 774.0 Investments in associates and other companies 3.2 3.5 Other non-current financial assets 9.9 7.9 amount from transactions with related parties 1.8 Deferred-tax assets 55.5 51.2 CURRENT ASSETS 2,614.7 2,692.8(4) Inventories 430.4 376.1(5) Trade receivables 441.8 459.9 Other current assets 211.8 211.8 amount from transactions with related parties 0.7 (6) Cash and cash equivalents 302.8 428.2(7) Current financial assets 1,227.9 1,216.8 Held-for-sale assets 0.5 1.0 TOTAL ASSETS 4,643.6 4,593.9 SHAREHOLDERS’ EQUITY 3,381.0 3,256.8(8) Share capital 1,728.4 1,712.6(9) Reserve for creditor challenges and claims of
late-filing creditors convertible into share capital 154.3 168.8 Other reserves and retained earnings: (10) - Reserve for currency translation differences 41.7 (42.7) - Shares subscribed upon exercise of warrants 0.0 0.0 - Cash-flow hedge reserve (1.0) (1.3)(11) - Miscellaneous reserves 1,285.2 945.7 Interim dividend 0.0 (69.8)(12) Profit for the period 147.4 519.0 Group interest in shareholders’ equity 3,356.0 3,232.3(13) Minority interest in shareholders’ equity 25.0 24.5 NON-CURRENT LIABILITIES 517.6 571.8(14) Long-term borrowings 154.8 190.0 amount from transactions with related parties 1.3 1.1 (15) Deferred-tax liabilities 184.9 181.2 Provisions for employee benefits 95.9 92.6(16) Provisions for risks and charges 76.4 101.4 Provision for contested preferential and prededuction claims 5.6 6.6 CURRENT LIABILITIES 745.0 765.3(14) Short-term borrowings 78.3 70.4 amount from transactions with related parties 3.4 4.9 (17) Trade payables 507.5 492.9 amount from transactions with related parties 0.1 0.1 (18) Other current liabilities 145.7 135.9(19) Income taxes payable 13.5 66.1 Liabilities directly attributable to held-for-sale assets 0.0 0.0 TOTAL LIABILITIES AND SHAREHOLDERS’ EQUITY 4,643.6 4,593.9

58 Parmalat Group – Condensed Consolidated Semiannual Financial Statements at June 30, 2010
Consolidated Income Statement Note ref. (in millions of euros) First half 2010 First half 2009 (20) REVENUES 2,048.9 1,860.9 Net revenues 2,026.2 1,848.0 Other revenues 22.7 12.9 (21) Cost of sales (1,588.1) (1,430.6)(21) Distribution costs (216.1) (204.8)(21) Administrative expenses (128.5) (110.6) Other income and expense: (22) - Litigation-related legal expenses (5.1) (6.1)(23) - Miscellaneous income and expense 65.6 179.7 EBIT 176.7 288.5 (24) Financial income 38.2 25.5(24) Financial expense (37.7) (21.7) Interest in the results of companies valued by the equity method (0.7) 0.0 Other income from (Expense for) equity investments 0.3 3.2 PROFIT BEFORE TAXES 176.8 295.5 (25) Income taxes (28.2) (46.3) PROFIT FROM CONTINUING OPERATIONS 148.6 249.2 PROFIT FOR THE PERIOD 148.6 249.2 Minority interest in (profit) loss (1.2) (1.4) Group interest in profit (loss) 147.4 247.8 Continuing Operations: Basic earnings per share 0.0854 0.1463
Diluted earnings per share 0.0836 0.1441

Parmalat Group – Condensed Consolidated Semiannual Financial Statements at June 30, 2010 59
Consolidated Statement of Comprehensive Income
(in millions of euros) First half
2010 First half
2009 Net profit for the period (A)
148.6 249.2
Other components of the comprehensive income statement
Change in fair value of derivatives, net of tax effect 0.3 0.2Difference on translation of financial statements in foreign currencies 84.9 56.6Recognition in earnings of the reserve for the measurement at fair value of held-for-sale securities upon the sale of securities
(0.8) -
Recognition in earnings of the reserve for currency translations upon the sale of equity investments 0.3 (3.2) Total other components of the comprehensive income statement, net of tax effect (B)
84.7 53.6
Total comprehensive net profit (loss) for the period (A) + (B)
233.3 302.8
Total comprehensive net profit (loss) for the period attributable to:
- Minority shareholders (2.0) (1.2)- Group shareholders 231.3 301.6

60 Parmalat Group – Condensed Consolidated Semiannual Financial Statements at June 30, 2010
Consolidated Statement of Cash Flows (in millions of euros) First half 2010 First half 2009OPERATING ACTIVITIES FOR THE PERIOD Profit from operating activities 148.6 249.2Depreciation, amortization and writedowns of non-current assets 58.3 46.7Additions to provisions 52.5 78.1Interest and other financial expense 23.8 12.8Non-cash (income) expense items (78.2) (14.2)(Gains) Losses on divestments (0.7) (0.4)Dividends received (0.7) (1.4)Proceeds from actions to void and actions for damages (3.6) (181.7)Litigation-related legal expenses 5.1 6.1Cash flow from operating activities before change in working capital 205.1 195.2 Change in net working capital and provisions: Operating working capital (10.8) (52.1)Payments of income taxes on operating results (41.0) (27.1)Other assets/Other liabilities and provisions (9.6) (24.3)Total change in net working capital and provisions (61.4) (103.5) CASH FLOWS FROM OPERATING ACTIVITIES FOR THE PERIOD 143.7 91.7 INVESTING ACTIVITIES Investments: - Intangibles (4.2) (2.5)- Property, plant and equipment (51.4) (34.7)- Non-current financial assets (1.8) (0.3)- Investments in associates and other companies (0.7) -Divestments and sundry items 3.6 1.6Dividends received 0.7 1.4 CASH FLOWS FROM INVESTING ACTIVITIES (53.8) (34.5) PROCEEDS FROM SETTLEMENTS 6.4 181.4 LITIGATION-RELATED LEGAL EXPENSES (9.3) (18.6) INCOME TAXES PAID ON SETTLEMENTS (60.2) (11.7) FINANCING ACTIVITIES New loans and finance leases 4.3 3.5Repayment of principal and accrued interest of loans and finance leases (33.3) (38.9)Investments in other current financial assets that mature later than three months after the date of purchase (17.1) (452.2)Dividends paid (108.9) (163.8)Exercise of warrants 1.3 0.3 CASH FLOWS FROM FINANCING ACTIVITIES (153.7) (651.1) INCREASE (DECREASE) IN CASH AND CASH EQUIVALENTS FROM JANUARY 1 TO JUNE 30 (126.9) (442.8) CASH AND CASH EQUIVALENTS AT JANUARY 1 428.2 901.2 Increase (decrease) in cash and cash equivalents from January 1 to June 30 (126.9) (442.8)Net impact of the translation of cash and cash equivalents denominated in foreign currencies 1.5 4.5 CASH AND CASH EQUIVALENTS AT JUNE 30 302.8 462.9“Net interest expense” amounted to 13.0 million euros.

Parmalat Group – Condensed Consolidated Semiannual Financial Statements at June 30, 2010 61
Changes in Consolidated Shareholders’ Equity
(in millions of euros) Other reserves and retained earnings
Share capital
Reserve convertible into share
capital1
Statu-tory
reserve
Res. for divid. to
challenges and condit.
claims
Reserve for
translation differences
Shares subscribed
through exercise of warrants
Cash-flow
hedge reserve
Sundry reserves2
Interim dividend
Profit (Loss) for the period
Group interest in sharehold.
equity
Minority interest in sharehold.
equity
Total sharehold.
equity
Balance at 1/1/09 1,687.4 193.2 31.9 21.7 (148.1) - (2.2) 490.2 (130.0) 673.1 2,817.2 24.9 2,842.1
Profit for the period 247.8 247.8 1.4 249.2 Difference from the translation of financial statements in foreign currencies
56.8 56.8 (0.2) 56.6
Change in fair value of derivatives 0.2 0.2 - 0.2
Recognition in earnings of the translation reserve upon the sale of equity investments
(3.2) (3.2) - (3.2)
Comprehensive profit for the period - - - - 53.6 - 0.2 - - 247.8 301.6 1.2 302.8
Share capital incr. from convertible reserves
15.2 (15.2) - - -
Exercise of warrants 0.3 0.3 - 0.3 Appropriation of the 2008 result 30.8 4.8 344.7 (380.3) - - -
2008 Dividend 130.3 (292.8) (162.5) (1.3) (163.8) Dividends to shareholders challenging awards
(0.6) (0.3) (0.9) - (0.9)
Purchase of minority interest - 0.6 0.6
Balance at 6/30/09 1,702.9 178.0 62.7 25.9 (94.5) - (2.0) 834.9 - 247.8 2,955.7 25.4 2,981.1
Balance at 1/1/10 1,712.6 168.8 62.7 25.9 (42.7) - (1.3) 857.1 (69.8) 519.0 3,232.3 24.5 3,256.8
Profit for the period 147.4 147.4 1.2 148.6 Difference from the translation of financial statements in foreign currencies
84.1 84.1 0.8 84.9
Change in fair value of derivatives 0.3 0.3 - 0.3
Recognition in earnings of the reserve for the measurement at fair value of held-for-sale securities upon the sale of securities
(0.8) (0.8) - (0.8)
Recognition in earnings of the translation reserve upon the sale of equity investments
0.3 0.3 - 0.3
Comprehensive profit for the period - - - - 84.4 - 0.3 (0.8) - 147.4 231.3 2.0 233.3
Share capital incr. from convertible reserves
14.5 (14.5) - - -
Exercise of warrants 1.3 1.3 - 1.3 Appropriation of the 2009 result 18.7 321.6 (340.3) - - -
2009 dividend 69.8 (178.7) (108.9) (1.5) (110.4)
Balance at 6/30/10 1,728.4 154.3 81.4 25.9 41.7 - (1.0) 1,177.9 - 147.4 3,356.0 25.0 3,381.01 For creditors challenging exclusions and late-filing creditors. 2 Limited to 65,723,000 euros (35,141,000 euros as per Shareholders’ Meeting resolution of April 29, 2007 and 30,582,000 euros as per Shareholders’ Meeting resolution of April 9, 2008), this reserve can be used to satisfy claims of late filing creditors and contested claims, when such claims are verified.

62 Parmalat Group – Condensed Consolidated Semiannual Financial Statements at June 30, 2010
Notes to the Condensed Consolidated Semiannual Financial Statements Foreword The registered office of Parmalat S.p.A. is located in Italy, at 4 via delle Nazioni Unite, in Collecchio (province of Parma). Its shares are traded on the Online Stock Exchange operated by Borsa Italiana. Parmalat S.p.A. and its subsidiaries are organized into a food industry group that pursues a multinational strategy. The Group operates in 16 countries worldwide divided into five geographic regions: Europe, North America, Central and South America, South Africa and Australia. The Group has an extensive and well structured product portfolio organized into three segments: Milk (UHT, pasteurized, condensed, powdered and flavored milk; cream and béchamel), Fresh Dairy (yogurt, fermented milk, desserts, cheese and butter) and Fruit Beverage (fruit juices, nectars and tea). The condensed consolidated semiannual financial statements at June 30, 2010 are denominated in euros, which is the reporting currency of Parmalat S.p.A., the Group’s Parent Company. They consist of a statement of financial position, an income statement and a statement of comprehensive income, a cash flow statement, a statement of changes in shareholders’ equity and the accompanying notes. All of the amounts listed in these notes are in millions of euros, except as noted. The presentation formats used for the statement of financial position, income statement, cash flow statement and statement of changes in shareholders’ equity are the same as those used for the annual financial statements. The condensed consolidated semiannual financial statements at June 30, 2010 were the subject of a limited audit by PricewaterhouseCoopers S.p.A. in accordance with the assignment it received pursuant to a resolution approved by the Shareholders’ Meeting on March 15, 2005, extended to include the 2008-2013 period. A limited audit entails a significantly smaller scope of auditing work than a full audit performed in accordance with statutory auditing principles.
The publication of these condensed consolidated semiannual financial statements at June 30, 2010 was authorized by the Board of Directors on July 29, 2010.
Principles for the Preparation of the Condensed Consolidated Semiannual Financial Statements The condensed consolidated semiannual financial statements at June 30, 2010 of the Parmalat Group were prepared in accordance with the provisions of Article 154-ter “Financial Reporting” of the Uniform Financial Code introduced with Legislative Decree No. 195 of November 6, 2007, by which the Italian legislature implemented Directive 2004/109/CE (so-called Transparency Directive) on regular financial reporting.
The condensed consolidated semiannual financial statements were prepared in accordance with IAS 34 – Interim Financial Reporting. The accounting principles applied are the same as those used to prepare the consolidated financial statements at December 31, 2009. Consequently, the former should be read in conjunction with the latter. The following recently published accounting principles and interpretations went into effect on January 1, 2010, as adopted by the European Commission: Amendments to IFRS 1 – First-time Adoption of International Financial Reporting Standards
Revisions to IFRS 2 – Share-based Payments
Amendments to IFRS 5 – Non-current Assets Held for Sale and Discontinued Operations
Amendments to IAS 39 – Financial Instruments: Recognition and Measurement

Parmalat Group – Condensed Consolidated Semiannual Financial Statements at June 30, 2010 63
Amendments to IFRIC 9 – Reassessment of Embedded Derivatives
Minor amendments to the IFRSs (“IFRS Improvements” – 2009 Release)
IFRIC 17 – Distribution of Non-cash Assets to Owners
IFRIC 18 – Transfers of Assets from Customers
However, these principles and interpretations concern situations and issues that did not exist or did not involve material amounts within the Group as of the date of this Semiannual Financial Report. As part of the process of preparing the condensed consolidated semiannual financial statements, Directors are required to use accounting principles and methods that, in some instances, require the use of difficult and subjective valuations and estimates based on historical data and assumptions that, in each case, are deemed to be reasonable and realistic under the circumstances existing at that time. The use of these estimates and assumptions has an impact on the amounts reported in the financial statements, which include the statement of financial position, the income statement and the cash flow statement, and affects the disclosures provided therein. The final amounts shown for the financial statement items for which the abovementioned estimates and assumptions were used may differ from the amounts shown on the financial statements due to the uncertainty that is inherent in all assumptions and the conditions upon which the estimates were based. Estimates and assumptions are reviewed periodically and any resulting change is recognized in the accounting records for the period in which the estimate was revised. The financial statement items that require more than others a subjective input by the Directors in the development of estimates and with regard to which a change in the conditions underlying the assumptions could have a material impact on the Interim Report on Operations are: goodwill, writedowns of non-current assets, depreciation and amortization, deferred taxes, the allowance for doubtful accounts, the provisions for risks, pension plans and other post-employment benefit plans, and the reserves for creditor challenges and claims of late-filing creditors.
A complete determination as to whether the value of non-current assets has been impaired is carried out only in connection with the preparation of the annual financial statements, when all necessary information is available, except in cases when impairment indicators that require an immediate assessment of any impairment losses are detected.
The income tax liability is recognized based on the best estimate of the tax rate projected for the entire year.
Seasonality of the Group’s Businesses Sales of some Group products are more seasonal than those of the rest of the product line, due to different buying habits and consumption patterns. However, the geographic diversification of the Group’s sales significantly reduces the impact of seasonal factors.

64 Parmalat Group – Condensed Consolidated Semiannual Financial Statements at June 30, 2010
Scope of Consolidation The equity investments of the Parmalat Group are listed in the schedules provided in the Annex. The guidelines followed in consolidating these equity investments are reviewed below. The scope of consolidation at June 30, 2010 includes the financial statements of the Group’s Parent Company and those of the Italian and foreign companies in which the Parent Company holds, either directly or indirectly, an interest equal to more than 50% of the voting shares. Control also exists when the Group’s Parent Company holds 50% or less of the votes that may be exercised at a Shareholders’ Meeting if: • It controls more than 50% of the voting rights by virtue of an agreement with other investors; • It has the power to determine the financial and operating policies of the investee company pursuant to a
clause in the Bylaws of the investee company or a contract; • It has the power to appoint or remove a majority of the members of the Board of Directors or equivalent
corporate governance body and said Board or body controls the investee company; • It has the power to exercise a majority of the votes at meetings of the Board of Directors or equivalent
corporate governance body. Because the Group’s Parent Company no longer has the power to determine their financial and operating policies nor benefits from their operations, the following companies are no longer consolidated line by line: • Companies in which the Parent Company holds, either directly or indirectly, an interest equal to more
than 50% of the voting shares but are now parties to separate bankruptcy proceedings under local laws and their subsidiaries. These companies include the following companies that have become eligible for extraordinary administration proceedings: Parmalat Mölkerei GmbH in A.S. (Germany), Deutsche Parmalat GmbH in A.S. (Germany), Dairies Holding International BV in A.S. (Netherlands) and Olex sa in A.S. (Luxembourg). The extraordinary administration proceedings applicable to these companies are nearing completion, pursuant to law. These companies have been included in the list of the Group’s equity investments because the Group owns their capital stock. However, at present, there is no expectation of a meaningful recovery of the investments in these companies upon completion of the individual bankruptcy proceedings. There is also no expectation that Parmalat S.p.A. will incur any liability in connection with these investments and there is no commitment or intent on the Company’s part to cover the negative equity of these companies.
• Companies earmarked for liquidation in the best available manner. The only company in this category is Wishaw Trading Sa (Uruguay). It is unlikely that the Group will incur any liability in connection with this investment and there is no commitment or desire on the Group’s part to cover the negative equity of this company. At January 1, 2004, Wishaw Trading SA had liabilities that amounted to 338.3 million euros. Unsecured claims amounting to 47.4 million euros have been verified and claims totaling 253.6 million euros have been excluded, but creditors have challenged these exclusions. Parmalat S.p.A. believes that it is probable that some of these challenges will be upheld. Net of the claim reduction, these claims could total 17.6 million euros and the Company has added this amount to its “Reserve for creditor challenges and claims of late-filing creditors convertible exclusively into share capital.” Based on information provided by counsel, Parmalat S.p.A. has learned that, in accordance with current Uruguayan law, the shareholders of a local limited liability company may be held personally responsible under certain conditions. More specifically, the principle of limited liability can be overridden when a company has been used (i) fraudulently to circumvent a law, (ii) to violate public order, (iii) fraudulently to injure the rights of shareholders or outsiders. While it is possible that the conduct of the previous management could result in an extension of liability to other companies of the Parmalat Group, Parmalat S.p.A. — in view of the provisions of Article 4-bis, Section 10 of the Marzano Law, which reaffirms the general principle set forth in Article 135 of the Bankruptcy Law that an approved composition with creditors is binding on all creditors with claims that predate the start of the composition with creditors proceedings and is also binding on all creditors who did not file for claim verification — believes that even if the existence and amount of any claims against it that are related to Wishaw Trading SA should ever be verified, the creditors would be unsecured creditors with claims the title and/or cause of which predates the start of the extraordinary administration proceedings for the companies that are parties to the Proposal of Composition with Creditors and, consequently, would only be entitled to receive shares and warrants of Parmalat S.p.A. based on an amount decreased by the claim reduction, in accordance with Section 7.8 of the Proposal of Composition with Creditors.
Parmalat Group – Condensed Consolidated Semiannual Financial Statements at June 30, 2010 65
• Companies in which the Parent Company holds, either directly or indirectly, an interest equal to more than 50% of the voting shares that are in voluntary liquidation and their subsidiaries. These companies, which are not large in size and operate in several countries, are:
o PRM Administraçao e Participaçao do Brasil (Brazil); o Swojas Energy Foods Limited (India).
• Companies in which the Parent Company holds, either directly or indirectly, an interest equal to more
than 50% of the voting shares but no longer has the power to determine their financial and operating policies and benefit from their operations and their subsidiaries. These companies, which are not large in size and operate in several countries, are:
o Airetcal SA (Uruguay); o Parmalat Chile SA (Chile); o Parmalat (Zhaodong) Dairy Corp. Ltd (China);
The following entries were made in connection with the companies that are no longer consolidated line by line: • The carrying value of the investments was written off; • The receivables owed by these companies to other Group companies were written off, except for 1.8
million euros owed by Deutsche Parmalat Gmbh in A.S.; • A provision for risks in connection with indebtedness guaranteed by Group companies was recognized; • The receivables owed to the companies listed above by Group companies continued to be included in
the indebtedness of Group companies.
Venezuela
The income statement and statement of financial position data of the Venezuelan subsidiaries, when stated in the local currency, are affected by a rate of inflation that, over the past three years, exceeded the cumulative threshold of 100%, which triggered the adoption of the adjustments required by IAS 29 – Financial Reporting in Hyperinflationary Economies, starting in 2009. According to this principle, the financial statements of an entity that reports in the currency of a hyperinflationary economy should be stated in terms of the measuring unit current on the date of the financial statements. All statement of financial position amounts that are not stated in terms of the measuring unit current on the date of the financial statements must be restated by applying a general price index. All income statement components must be stated in terms of the measuring unit current on the date of the financial statements, applying the change in the general price index that occurred since the date when revenues and expenses were originally recognized in the financial statements. The restatement of the financial statement amounts was carried out using Venezuela’s consumer price index (INPC). The average index for the first half of 2010 was 1.069 and the year-over-year change in the index was 1.163.
The Decree entitled Convenio Cambiario No. 14 setting new exchange rates for the local currency (bolivar fuerte) versus the U.S. dollar was published in the Official Gazette of the Republic of Venezuela on January 8, 2010. The previous exchange rate of 2.15 bolivars for 1 U.S. dollar (2.15 VEF/USD), which was in effect since 2005, was replaced with a system of mixed exchange rates, pursuant to which the Venezuelan monetary authorities (Comisión de Administración de Divisas – CADIVI) will allow an exchange rate of 2.60 VEF/USD for imports of a limited number of merchandise categories (e.g., food and medicines). but will apply an exchange rate of 4.3 VEF/USD for all other transactions.
The Decree entitled Convenio Cambiario No. 18 introducing a new system for transaction in securities denominated in foreign currencies (Sistema de Transacciones con Títulos en Moneda Extranjera – SITME) was published in the Official Gazette of the Republic of Venezuela on June 4, 2010. Pursuant to this Decree, the Venezuelan Central Bank has sole jurisdiction over regulating transactions, in local currency or through the SITME, involving securities of any issuer denominated in foreign currencies. Transactions in these securities, which are subject to limit on monthly amounts, provide residents with a source of foreign currency in addition the monetary authorities (CADIVI).
In preparing the consolidated financial statements for the Group at June 30, 2010, Parmalat used the exchange rate of 4.30 VEF for 1 USD to translate the income statement and statement of financial position data of its subsidiaries.

66 Parmalat Group – Condensed Consolidated Semiannual Financial Statements at June 30, 2010
Transactions Between Group Companies and with Related Parties Transactions between Group companies and with related parties were neither atypical nor unusual and were carried out by the Company in the normal course of business. Currently, the Group executes transactions with the following related parties:
Companies in which the Group has a majority equity stake but over which it no longer has control and, consequently, have been excluded from the scope of consolidation as explained in the Scope of Consolidation section of this Report.
A breakdown of receivables and payables by type is provided below: (in millions of euros) 6/30/10 Company
Country Trade
receiv-ables
Financial receiv-
ables
Other receiv-
ablesTrade
payables Financial payables
Other payables
PPL Participações Ltda Brazil 2.4 Wishaw Trading sa Uruguay 2.3 Deutsche Parmalat GMBH in A.S. Germany 1.8 Total - 1.8 - - 4.7 - (in millions of euros) 12/31/09 Company
Country Trade
receiv-ables
Financial receiv-
ables
Other receiv-
ablesTrade
payables Financial payables
Other payables
PPL Participações Ltda Brazil 3.7
Wishaw Trading sa Uruguay 2.3 Deutsche Parmalat GMBH in A.S. Germany
Total - - - - 6.0 - Revenues and expenses, broken down by type, and writedowns of receivables booked during the period were of inconsequential amount both in the first half of 2010 and 2009.
Companies that are currently included in the investment portfolios of Parmalat Finanziaria S.p.A. in A.S. and Parmalat S.p.A. in A.S. and companies that, because of the parties serving on their governance bodies, were deemed to be under common management with those of the Parmalat Finanziaria Group, currently under Extraordinary Administration pursuant to Article 80, Numeral 3, of Legislative Decree No. 270/99 (so-called “daughter” proceedings of the main Parmalat S.p.A. in AS proceedings).

Parmalat Group – Condensed Consolidated Semiannual Financial Statements at June 30, 2010 67
A breakdown of receivables and payables by type is provided below: (in millions of euros) 6/30/10 Company
Country Trade
receiv-ables1
Financial receiv-ables1
Other receiv-ables1
Trade payables
Financial payables
Other payables
Eliair S.r.l. in A.S. Italy 4.62 0.32 Parma A.C. S.p.A. in A.S. Italy 60.42 - Parmalat Capital Finance Ltd Cayman - - Bonlat Financing Corporation Cayman 788.02 2.0 Parmalat S.p.A. in A.S. Italy 0.7 Sundry items (less than €1 million) 0.1 Total - 853.0 1.0 0.1 2.0 -1 Before allowance for doubtful accounts. 2 Amounts written off. (in millions of euros) 12/31/09 Company
Country Trade
receiv-ables1
Financial receiv-ables1
Other receiv-ables1
Trade payables
Financial payables
Other payables
Eliair S.r.l. in A.S. Italy 4.6 0.3 Parma A.C. S.p.A. in A.S. Italy 60.4 0.2 Parmalat Capital Finance Ltd Cayman 3,432.0 1.8 Bonlat Financing Corporation Cayman 788.0 1.7 Parmalat S.p.A. in A.S. Italy 2.5 Sundry items (less than €1 million) 0.1 Total2 - 4,285.0 3.0 0.1 3.5 -1 Before allowance for doubtful accounts. 2 Amounts written off. Revenues and expenses, broken down by type, and writedowns of receivables booked during the period were of inconsequential amount both in the first half of 2010 and 2009. While not required to do so pursuant to law, the Group discloses that, due to the shareholder profile of Parmalat S.p.A. that developed following the approval of the Composition with Creditors, the Group engages in commercial and financial transactions with numerous former creditors of its member companies. The transactions executed with these counterparties are neither atypical nor unusual and are carried out by the Company in the normal course of business. These transactions are executed on market terms, i.e., on terms that would have been agreed to by independent parties, and were carried out in the interest of the Group headed by Parmalat S.p.A. Lastly, the Group has filed a series of legal actions against former creditors of companies under extraordinary administration. These lawsuits are discussed in detail in the section of the Report on Operations entitled Legal Disputes and Contingent Liabilities at June 30, 2010. Percentage of Total Amounts Attributable to Transactions with Related Parties (in millions of euros) Consolidated
assetsConsolidated
liabilities Net financial
assetsTotal consolidated amount 4,643.6 1,262.6 1,297.6Amount with related parties 2.5 4.8 (4.7)Percentage of the total n.m. 0.4% n.m.

68 Parmalat Group – Condensed Consolidated Semiannual Financial Statements at June 30, 2010
Notes to the Statement of Financial Position – Assets
(1) Goodwill Goodwill amounted to 481.4 million euros. The changes that occurred during the first six months of 2009 and 2010 are listed below: (in millions of euros) Goodwill
Balance at 1/1/09 425.1
- Currency translation differences 12.5
Balance at 6/30/09 437.6
Balance at 1/1/10 452.8
- Currency translation differences 28.6
Balance at 6/30/10 481.4 Goodwill was allocated to the cash generating units which, consistent with the structure of the Group’s organization and the manner in which control is exercised over the operating units, are the same as the Group’s geographic regions, while complying with the limitation on the scope of data aggregation, which may not exceed a business segment, as identified in accordance with IFRS 8.
Goodwill was allocated to the following cash generating units:
(in millions of euros) 6/30/10 12/31/09
Italy - Parmalat S.p.A. 184.0 184.0- Centrale del Latte di Roma S.p.A. 41.7 41.7- Carnini S.p.A. 4.0 4.0
Other countries in Europe - Portugal 34.2 34.2- Russia 6.2 5.5- Romania 0.1 0.1
Canada 140.3 119.5Australia 70.9 63.8
Total 481.4 452.8 Pursuant to IAS 36, goodwill is not amortized. However, it is tested for impairment at least once a year or more frequently in response to specific events or circumstances that could indicate that its value has been impaired. No impairment indicators affecting the value of goodwill were detected in the first half of 2010.

Parmalat Group – Condensed Consolidated Semiannual Financial Statements at June 30, 2010 69
(2) Trademarks with an Indefinite Useful Life Trademarks with an indefinite useful life were valued at 615.2 million euros. The changes that occurred during the first six months of 2009 and 2010 are listed below: (in millions of euros) Trademarks with an indefinite useful life
Balance at 1/1/09 518.2
- Other changes (2.1)- Currency translation differences 24.2
Balance at 6/30/09 540.3
Balance at 1/1/10 561.3
- Currency translation differences 53.9
Balance at 6/30/10 615.2 A breakdown of trademarks with an indefinite useful life, carried at 615.2 million euros, is as follows: (in millions of euros) 6/30/10 12/31/09
Italy - Parmalat 121.9 121.9- Santàl 32.6 32.6- Centrale del Latte di Roma 26.1 26.1- Chef 16.2 16.2Sundry trademarks 7.3 7.3
Other countries in Europe - Parmalat 8.4 8.0- Santàl 7.3 6.8- Sundry trademarks 8.3 8.3
Canada - Beatrice 91.5 78.0
- Lactantia 75.5 64.3- Black Diamond 34.3 29.2
- Astro 25.3 21.6- Sundry trademarks 15.5 13.2
Central and South America - Parmalat 18.9 15.1
Australia - Pauls 49.9 44.9- Rev, Skinny and Farmhouse 26.5 23.9- Parmalat 0.3 0.3- Sundry trademarks 8.5 7.6
Africa - Parmalat 18.6 16.4- Bonnita 15.1 13.2- Sundry trademarks 7.2 6.4
Total 615.2 561.3

70 Parmalat Group – Condensed Consolidated Semiannual Financial Statements at June 30, 2010
Pursuant to IAS 36, trademarks with an indefinite useful life are not amortized. However, they are tested for impairment at least once a year or more frequently in response to specific events or circumstances that could indicate that its value has been impaired.
No impairment indicators affecting the value of the trademarks with an indefinite useful life were detected in the first half of 2010.
(3) Property, Plant and Equipment Property, plant and equipment totaled 819.9 million euros. The table below provides a breakdown of this item and shows the changes that occurred in the first half of 2009 and 2010: (in millions of euros)
Land Buildings Plant and machinery
Industrial equip-ment
Other assets
Construc-tion in
progress Total
Balance at 1/1/09 100.7 206.5 242.0 9.9 33.5 53.7 646.3
- Additions - 1.4 8.0 0.2 3.1 22.0 34.7- Disposals (-) (0.3) (0.1) (0.1) - (0.3) - (0.8)- Depreciation (-) (5.9) (21.8) (1.6) (6.8) - (36.1)- Other changes 11.3 (4.4) 23.3 0.7 1.9 (32.8) -- Reclassifications from held-for-sale assets 3.4 0.4 - - - - 3.8- Currency translation differences 3.7 7.3 11.4 0.5 2.5 2.6 28.0
Balance at 6/30/09 118.8 205.2 262.8 9.7 33.9 45.5 675.9
Balance at 1/1/10 143.2 241.9 289.8 10.6 34.8 53.7 774.0- Monetary correction for hyperinflation 1.0 2.9 1.6 - - - 5.5- Additions 0.1 3.5 13.3 0.2 3.7 30.6 51.4- Disposals (-) (0.1) - (0.3) - (0.2) (0.1) (0.7)- Writedowns (-) (0.8) (3.0) - - - - (3.8)- Reversals of writedowns - - 0.1 - - - 0.1- Depreciation (-) - (7.3) (26.8) (2.0) (7.1) - (43.2)- Other changes - 4.9 18.8 1.5 3.6 (29.6) (0.8)- Currency translation differences 2.9 4.1 25.0 1.0 3.0 1.4 37.4
Balance at 6/30/10 146.3 247.0 321.5 11.3 37.8 56.0 819.9 Information about the Group’s investments in property, plant and equipment is provided in the Interim Report on Operations. Writedowns of 3.8 million euros reflect the loss in value suffered by the buildings of a production unit. A breakdown of property, plant and equipment acquired under finance leases, totaling 12.8 million euros, is as follows: (in millions of euros) 6/30/10 12/31/09
Buildings 1.1 1.0Plant and machinery 4.1 4.8Other assets 7.6 6.9
Total property, plant and equipment acquired under finance leases 12.8 12.7

Parmalat Group – Condensed Consolidated Semiannual Financial Statements at June 30, 2010 71
(4) Inventories Inventories totaled 430.4 million euros, or 54.3 million euros more than at December 31, 2009. (in millions of euros) 6/30/10 12/31/09
Raw materials, auxiliaries and supplies 139.2 127.5Work in progress and semifinished goods 23.2 21.1Finished goods and merchandise 270.9 219.5Advances 0.9 12.5Provision for inventory writedowns (3.8) (4.5)
Total inventories 430.4 376.1 The following items account for most of the increase in inventories:
40.7 million euros for a rise in the inventory of cheese and other finished products held by the Canadian subsidiary, due to the seasonal nature of its business, which is characterized by increased production of milk during the first six months of the year and higher sales during the second half. This increase also reflects sales of butter and powdered milk made to the Canadian Dairy Commission (CDC) under a forward repurchase agreement. In Canada, the CDC (the government entity that oversees the allocation and management of milk quotas to the dairy industry), in order to mitigate the impact of the abovementioned seasonality factors, agrees to absorb the temporary surpluses of manufacturers. The resulting increase is offset by a trade payable of equal amount reflecting the abovementioned repurchase commitment.
14.7 million euros for the loss of value of the euro versus the currencies of the main countries in which the Group operates.
(5) Trade Receivables Trade receivables totaled 441.8 million euros, or 18.1 million euros less than at December 31, 2009. The effect of a reduction in the numbers of days to collection and of lower sales by Parmalat S.p.A and Parmalat South Africa, offset in part by the loss of value of the euro versus the currencies of the main countries in which the Group operates, are the main reason for this decrease. The amount of 441.8 million euros shown for Trade receivables owed by customers is net of an Allowance for doubtful accounts of 167.7 million euros. The table that follows shows the changes that occurred in this allowance in the first half of 2009 and 2010: (in millions of euros)
Balance at 1/1/09 165.8- Additions 8.7- Utilizations (-) (2.0)- Other changes 0.1- Currency translation differences 0.7
Balance at 6/30/09 (A+B) 173.3
Balance at 1/1/10 176.0- Additions 8.9- Utilizations (-) (16.9)- Currency translation differences (0.3)Balance at 6/30/10 167.7

72 Parmalat Group – Condensed Consolidated Semiannual Financial Statements at June 30, 2010
(6) Cash and Cash Equivalents
Cash and investments in financial assets with an original maturity of three months or less at the time of purchase amounted to 302.8 million euros, for a decrease of 125.4 million euros compared with December 31, 2009: (in millions of euros) 6/30/10 12/31/09
- Bank and postal accounts 298.1 423.4- Cash and securities on hand 1.5 1.7- Financial assets 3.2 3.1 Total cash and cash equivalents 302.8 428.2 Bank and postal accounts of 298.1 million euros represent deposits held at top banking and financial institutions with a high credit rating. Financial assets, which totaled 3.2 million euros, consist of time deposits. The decrease of 125.4 million euros in Cash and cash equivalents reflects primarily the payment of dividends and the investment of cash flows from operations in highly liquid short-term interest-bearing assets. There are no circumstances under which the Group’s cash and cash equivalent assets would not be freely accessible. (7) Current Financial Assets Current financial assets totaled 1,227.9 million euros, or 11.1 million euros less than at December 31, 2009: (in millions of euros) 6/30/10 12/31/09
- Time bank deposits 462.5 552.4- Italian Treasury Bills 437.5 519.0- Foreign treasury securities (Germany) 120.1 27.9- Foreign treasury securities (France) 112.1 -- Italian Treasury Notes 77.7 -- Reverse repurchase agreements 2.0 2.0- Accrued interest 4.4 1.1- Italian Treasury Credit Certificates - 100.1- Derivatives - -- Other financial assets with an original maturity of more than three months but less than one year 11.6 14.3Total current financial assets 1,227.9 1,216.8 The increase of 11.1 million euros is due mainly to the investment of cash flows from operations in interest-bearing assets.

Parmalat Group – Condensed Consolidated Semiannual Financial Statements at June 30, 2010 73
Notes to the Statement of Financial Position – Shareholders’ Equity At June 30, 2010, the Group’s shareholders’ equity totaled 3,356.0 million euros. (8) Share Capital
The share capital amounted to 1,728,394,362 euros. The change that occurred compared with December 31, 2009 is the result of the following items: (i) the amount of the claims of late-filing creditors and/or of creditors who challenged successfully the exclusion of their claims (charged against reserves established for this purpose), which totaled 14,553,198 euros, and (ii) the amount generated by the exercise of warrants, which totaled 1,283,022 euros.
The table below shows a breakdown of the change in the number of shares outstanding (par value 1 euro each) that occurred in the first six months of 2010:
Number of shares Shares outstanding at 1/1/10 1,712,558,142 Shares issued for claims of late-filing creditors and/or upon the settlement of challenges (using reserves established for this purpose) 14,553,198
Shares issued upon the conversion of warrants 1,283,022 Shares outstanding at 6/30/10 1,728,394,362
Maximum Share Capital Amount In accordance with the resolutions approved by the Shareholders’ Meetings of March 1, 2005, September 19, 2005 and April 28, 2007, the Company’s share capital may be increased up to 2,025 million euros as follows:
- Increase reserved for creditors with unsecured claims included in the lists of verified claims
1,541.1
- Increase reserved for unsecured creditors with conditional claims and/or who are challenging their exclusion from the lists of verified claims 238.9
- Increase reserved for late-filing creditors 150.0Total increases reserved for creditors 1,930.0- Shares available for the conversion of warrants 95.0 Total capital increase 2,025.0
The Group’s Parent Company, having carried out a detailed analysis of the challenges filed by creditors excluded from the sum of liabilities and of the claims of late-filing creditors, believes that the equity reserves it has established in connection with these claims are adequate. Any additional claims of late-filing creditors that may arise in the future and are verified by a final court decision can be satisfied using the retained earnings set aside in 2009.
(9) Reserve for Creditor Challenges and Claims of Late-filing Creditors Convertible into Share Capital At June 30, 2010, this reserve convertible into share capital amounted to 154.3 million euros. Utilizations for the period totaled 14.5 million euros, causing the share capital to increase by the same amount.
The utilization of this reserve will cause the share capital of Parmalat S.p.A. to increase by an amount equal to the additional verified claims. The remainder of the reserve, equal to the amount of the rejected claims, will become a freely available reserve. As explained before, Parmalat S.p.A. has already approved a capital increase in an amount equal to the balance in this reserve.
With regard to the Citigroup litigation and, more specifically, the decision handed down by the Court of New Jersey in October 2008, an appeal is currently pending. In the unlikely event that this decision should become final after review at the appellate level, it will have to be submitted to the Court of Parma, as ordered

74 Parmalat Group – Condensed Consolidated Semiannual Financial Statements at June 30, 2010
by the New York Bankruptcy Court, and any amount restored to Citigroup will be reduced by the bankruptcy abatement.
(10) Reserve for Currency Translation Differences The Reserve for currency translation differences, positive by 41.7 million euros, reflects differences generated by the translation into euros of the financial statements of companies that operate in countries outside the euro zone.
(11) Other Reserves The Ordinary Shareholders’ Meeting of April 1, 2010 approved motions: (i) to add to the statutory reserve 5% of the balance of the net profit earned in 2009, equal to 18.6 million euros; (ii) to appropriate: (a) 50% of the remaining net profit as a dividend in the rounded up amount of 0.104 euros per share, which, after deducting the 2009 interim dividend of 0.041 euros distributed this past September, leaves a final dividend of 0.063 euros on each of the 1,728,205,752 common shares outstanding at March 26, 2010, for a total balance payable of 108.9 million euros and a total dividend payout (interim plus balance) of 178.7 million euros; (b) the balance of 175.5 euros to retained earnings.
At June 30, 2010, Other reserves of 1,285.2 million euros included the following items: (i) retained earnings and miscellaneous reserves of 1,177.9 million euros, which can be used to satisfy claims of late-filing creditors and creditors with contested claims, if and when their claims are verified, for an amount of up to 65.7 million euros; (ii) a statutory reserve of 81.4 million euros; (iii) and a reserve of 25.9 million euros for claims of creditors who challenged the exclusion of their claims from the sum of liabilities and creditors with conditional claims (as required under the terms of the Composition with Creditors) who may be entitled to receive Company shares.
(12) Profit for the Period The Group’s interest in the profit for the period amounted to 147.4 million euros.

Parmalat Group – Condensed Consolidated Semiannual Financial Statements at June 30, 2010 75
Reconciliation of the Shareholders’ Equity of Parmalat S.p.A. to Group Interest in Shareholders’ Equity (in millions of euros) Shareholders’ equity before
result for the period Result for
the periodShareholders’
equityShareholders’ equity of Parmalat S.p.A. at 6/30/10 2,727.8 77.8 2,805.6Elimination of the carrying value of consolidated investments in subsidiaries - Difference between the carrying amount and the pro rata interest in the underlying shareholders’ equity 422.7 - 422.7- Pro rata interest in the results of investee companies - 133.1 133.1- Reserve for currency translation differences 41.7 - 41.7Other adjustments: - Elimination of writedowns and coverage of losses by subsidiaries - 9.6 9.6- Elimination of writedowns of receivables owed by subsidiaries 16.4 12.8 29.2- Elimination of dividends - (44.7) (44.7)- Elimination of the reversal of the Venezuela equity provision - (41.2) (41.2)Group Interest in Shareholders’ Equity at 6/30/10 3,208.6 147.4 3,356.0Minority interest in shareholders’ equity and result for the period 23.8 1.2 25.0Consolidated shareholders’ equity at 6/30/10 3,232.4 148.6 3,381.0 (13) Minority Interest in Shareholder’s Equity At June 30, 2010, the Minority interest in shareholders’ equity totaled 25.0 million euros. This amount is represented almost entirely by the interest held by minority shareholders in the following companies:
(in millions of euros) 6/30/10 12/31/09
Centrale del Latte di Roma S.p.A. 13.0 13.2Citrus International SA 4.2 3.8Industria Lactea Venezolana CA (Indulac) 1.7 2.1Parmalat Colombia Ltda 2.6 1.9Sundry companies 3.5 3.5
Total 25.0 24.5

76 Parmalat Group – Condensed Consolidated Semiannual Financial Statements at June 30, 2010
Notes to the Statement of Financial Position – Liabilities (14) Long-term borrowings Long-term borrowings totaled 154.8 million euros. The table below shows the changes that occurred in the first six months of 2009 and 2010: (in millions of euros)
Due to banks
Due to other
lenders
Obligations under
finance leases
Due to asso-ciates
Liabilities represented
by credit instruments
Liabilities from
deriva-tives
Total
Balance at 1/1/09 198.7 47.7 5.9 1.2 0.6 7.8 261.9- New borrowings - - 1.4 - - - 1.4- Repayments (principal and interest) (-) (9.5) (1.5) (1.0) - - - (12.0)- Accrued interest 2.5 3.9 0.4 - - - 6.8- Discounting to present value 0.1 - - - - - 0.1- Mark to market - - - - - (1.5) (1.5)- Foreign exchange differences on borrowings in foreign currencies - (2.8) 0.1 - - - (2.7)- Reclassifications from non-current to current (-) (4.0) - (1.0) - - - (5.0)- Currency translation differences 15.1 2.1 - (0.1) - 0.4 17.5Balance at 6/30/09 202.9 49.4 5.8 1.1 0.6 6.7 266.5Balance at 1/1/10 163.6 10.2 8.6 1.1 0.7 5.8 190.0
- New borrowings - - 2.6 - - - 2.6- Repayments (principal and interest) (-) (0.1) (22.3) (0.5) - - - (22.9)- Accrued interest 0.1 13.0 - - - - 13.1- Mark to market - - - - - (0.6) (0.6)- Foreign exchange differences on borrowings in foreign currencies - (0.2) (0.2) - - - (0.4)- Reclassifications from non-current to current (-) (51.0) - (2.6) - - - (53.6)- Currency translation differences 23.8 1.1 0.4 0.2 0.1 1.0 26.6Balance at 6/30/10 136.4 1.8 8.3 1.3 0.8 6.2 154.8 New borrowings of 2.6 million euros refers to the signing of new finance leases for the use of plant and machinery. Repayments of 22.9 million euros refers to the early repayment, by the Canadian subsidiary, of 90% of the subordinated notes with a face value of US$75 million, which it issued in 1996 and mature in November 2026.

Parmalat Group – Condensed Consolidated Semiannual Financial Statements at June 30, 2010 77
Short-term borrowings totaled 78.3 million euros. The following changes occurred in the first six months of 2009 and 2010: (in millions of euros)
Due to banks
Due to other
lenders
Obligations under
finance leases
Due to related parties
Liabilities represented
by credit instruments
Liabilities from
deriva-tives
Total
Balance at 1/1/09 219.2 6.3 3.2 5.0 - 3.2 236.9- New borrowings 1.9 - 0.2 - - - 2.1- Repayments (principal and interest) (-) (24.5) - (2.4) - - - (26.9)- Accrued interest 9.5 - 0.6 - - - 10.1- Mark to market - - - - - (0.7) (0.7)- Translation differences on borrowings in foreign currencies 0.1 - 0.1 (0.1) - - 0.1- Reclassifications from non-current to current (-) 4.0 - 1.0 - - - 5.0- Currency translation differences (1.8) (0.1) (0.1) 0.1 - 0.5 (1.4)Balance at 6/30/09 208.4 6.2 2.6 5.0 - 3.0 225.2Balance at 1/1/10 52.5 6.1 4.6 4.9 - 2.3 70.4- Monetary adjustment for hyperinflation (0.3) - - - - - (0.3)- New borrowings 1.3 - 0.4 - - - 1.7- Repayments (principal and interest) (-) (7.6) - (2.8) - - - (10.4)- Accrued interest 11.0 - 0.3 - - - 11.3- Intra-Group consolidation of debt formerly owed to Parmalat Capital Finance Ltd in liquidation (50.2) (2.2) - - - - (52.4)- Cancellation of prior-period debt - - - (1.8) - - (1.8)- Mark to market - - - - - (0.3) (0.3)- Translation differences on borrowings in foreign currencies - 0.4 - - - - 0.4- Reclassifications from non-current to current (-) 51.0 - 2.6 - - - 53.6- Currency translation differences 4.9 0.4 0.2 0.3 - 0.3 6.1Balance at 6/30/10 62.6 4.7 5.3 3.4 - 2.3 78.3 Repayments of 10.4 million euros include the following:
Payment of accrued interest on a syndicated facility due in July 2011 in the amount of 3.3 million euros;
Closeout of finance leases for machinery and motor vehicles totaling 2.8 million euros; Semiannual payment due on a loan received from a major Italian bank for 1.1 million euros.
During the first half of 2010, Parmalat S.p.A. reached a settlement with Parmalat Capital Finance Limited in liquidation, pursuant to which the former acquired receivables owed to the latter by Group companies. More specifically, Parmalat S.p.A. acquired the following:
rights arising from a loan of US$45 million, plus accrued interest, provided to Parmalat de Venezuela;
rights arising from consulting services totaling US$2.5 million provided to Parmalat Nicaragua; rights arising from a loan of US$0.5 million provided to Parmalat de Mexico.
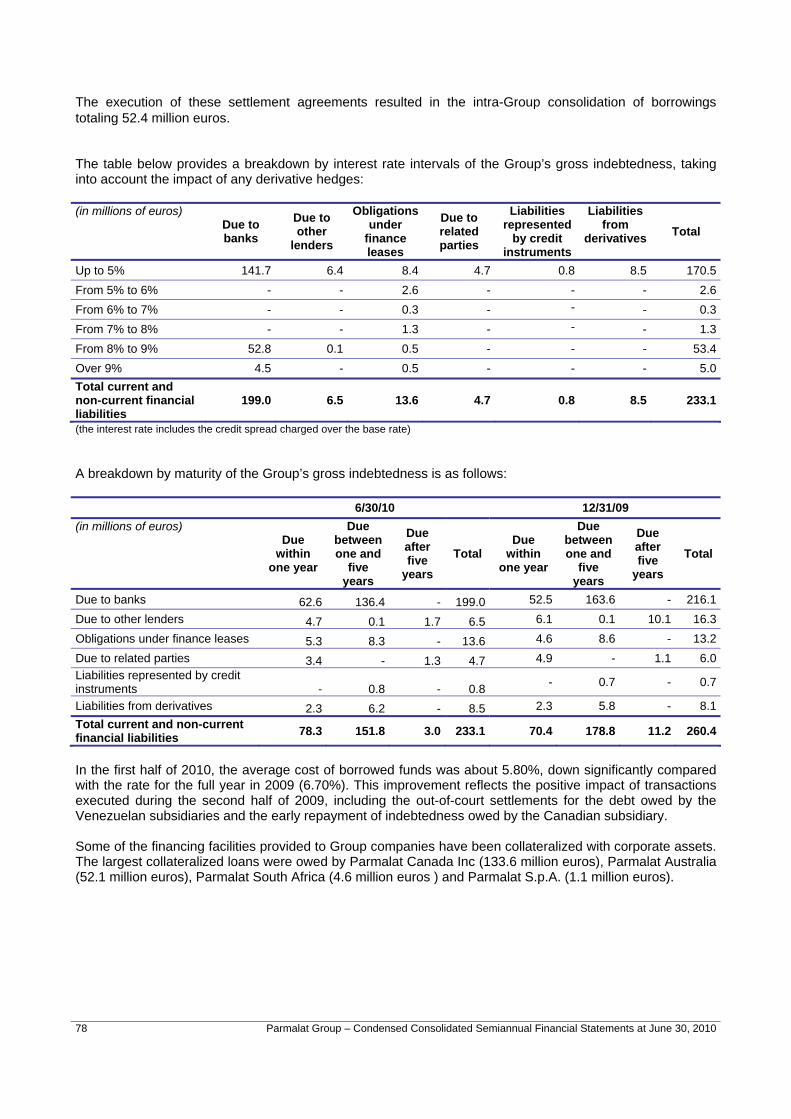
78 Parmalat Group – Condensed Consolidated Semiannual Financial Statements at June 30, 2010
The execution of these settlement agreements resulted in the intra-Group consolidation of borrowings totaling 52.4 million euros. The table below provides a breakdown by interest rate intervals of the Group’s gross indebtedness, taking into account the impact of any derivative hedges: (in millions of euros)
Due to banks
Due to other
lenders
Obligations under
finance leases
Due to related parties
Liabilities represented
by credit instruments
Liabilities from
derivatives Total
Up to 5% 141.7 6.4 8.4 4.7 0.8 8.5 170.5From 5% to 6% - - 2.6 - - - 2.6From 6% to 7% - - 0.3 - - - 0.3From 7% to 8% - - 1.3 - - - 1.3From 8% to 9% 52.8 0.1 0.5 - - - 53.4Over 9% 4.5 - 0.5 - - - 5.0Total current and non-current financial liabilities
199.0 6.5 13.6 4.7 0.8 8.5 233.1
(the interest rate includes the credit spread charged over the base rate) A breakdown by maturity of the Group’s gross indebtedness is as follows:
6/30/10 12/31/09 (in millions of euros)
Due within
one year
Due between one and
five years
Due after five
years Total
Due within
one year
Due between one and
five years
Due after five
years Total
Due to banks 62.6 136.4 - 199.0 52.5 163.6 - 216.1Due to other lenders 4.7 0.1 1.7 6.5 6.1 0.1 10.1 16.3Obligations under finance leases 5.3 8.3 - 13.6 4.6 8.6 - 13.2Due to related parties 3.4 - 1.3 4.7 4.9 - 1.1 6.0Liabilities represented by credit instruments - 0.8 - 0.8 - 0.7 - 0.7
Liabilities from derivatives 2.3 6.2 - 8.5 2.3 5.8 - 8.1Total current and non-current financial liabilities 78.3 151.8 3.0 233.1 70.4 178.8 11.2 260.4
In the first half of 2010, the average cost of borrowed funds was about 5.80%, down significantly compared with the rate for the full year in 2009 (6.70%). This improvement reflects the positive impact of transactions executed during the second half of 2009, including the out-of-court settlements for the debt owed by the Venezuelan subsidiaries and the early repayment of indebtedness owed by the Canadian subsidiary. Some of the financing facilities provided to Group companies have been collateralized with corporate assets. The largest collateralized loans were owed by Parmalat Canada Inc (133.6 million euros), Parmalat Australia (52.1 million euros), Parmalat South Africa (4.6 million euros ) and Parmalat S.p.A. (1.1 million euros).

Parmalat Group – Condensed Consolidated Semiannual Financial Statements at June 30, 2010 79
(15) Deferred-tax Liabilities Deferred-tax liabilities of 184.9 million euros are shown net of offsettable deferred-tax assets. The table below shows the changes that occurred in the first half of 2009 and 2010:: (in millions of euros)
Balance at 1/1/09 150.3- Additions 6.1- Utilizations (-) (2.7)- Other changes (0.2)- Currency translation differences 8.1Balance at 6/30/09 161.6Balance at 1/1/10 181.2- Additions 7.5- Utilizations (-) (20.4)- Currency translation differences 16.6Balance at 6/30/10 184.9 Increases of 7.5 million euros refer mainly to accelerated depreciation (2.5 million euros) and the amortization for tax purposes of goodwill (2.0 million euros) and trademarks (1.3 million euros). Utilizations of 20.4 million euros refer primarily to the elimination of temporary differences between the tax-related value and the carrying value of the subordinated notes issued by the Canadian subsidiary in 1996 (maturing in November 2026), almost all of which were bought back during the first half of 2010. The Deferred-tax liabilities account reflects the amounts set aside for deferred taxes on temporary differences between the carrying values of assets and liabilities and the values attributed to them for tax purposes. These differences concern mainly the following items: (in millions of euros) 6/30/10 12/31/09
- Trademarks and other intangibles 140.5 126.9- Land 8.6 8.9- Buildings 5.3 6.3- Plant and machinery 15.8 11.3- Present value of subordinated debt 1.4 14.3- Monetary adjustment for hyperinflation 4.0 6.6- Other items 9.3 6.9
Total 184.9 181.2

80 Parmalat Group – Condensed Consolidated Semiannual Financial Statements at June 30, 2010
(16) Provisions for Risks and Charges Provisions for risks and charges totaled 76.4 million euros. The changes that occurred in the first half of 2009 and 2010 are shown below: (in millions of euros) Provision for tax-
related risks and charges
Provision for other risks and
charges Total
Balance at 1/1/09 65.7 40.4 106.1- Increases 7.0 1.2 8.2- Decreases (-) (0.9) (2.8) (3.7)- Reversals (-) (1.0) (4.0) (5.0)- Other changes (0.7) 0.8 0.1- Currency translation differences (0.7) - (0.7)Balance at 6/30/09 69.4 35.6 105.0Balance at 1/1/10 59.9 41.5 101.4
- Monetary adjustment for hyperinflation 0.2 - 0.2- Increases 0.3 2.1 2.4- Decreases (-) (0.1) (1.2) (1.3)- Reversals (-) (6.3) (0.4) (6.7)- Currency translation differences (18.1) (1.5) (19.6)Balance at 6/30/10 35.9 40.5 76.4 Provision for Tax-related Risks and Charges The Group is not exposed to significant tax-related risks, except for a position involving a subsidiary in the Central and South America region concerning issues related to valuation adjustments of some assets. Adequate provisions for risks are recognized for all positions that entail a risk that is deemed to be probable. The changes that occurred in the first half of 2010 are essentially a reflection of a revision of the estimates of the probable tax liabilities of the Group’s subsidiaries in the Americas. Provision for Other Risks and Charges The Provision for other risks and charges of 40.5 million euros covers the following: (in millions of euros) 6/30/10 12/31/09
Staff downsizing programs 14.1 13.8Supplemental sales agent benefits 7.5 7.5Risks on investee companies 4.8 4.8Legal disputes with employees 3.5 5.0Litigation 2.4 2.4Risks on divestments of business operations 0.6 0.8Disputes with former Group companies 0.2 0.2Miscellaneous 7.4 7.0
Total provision for other risks and charges 40.5 41.5
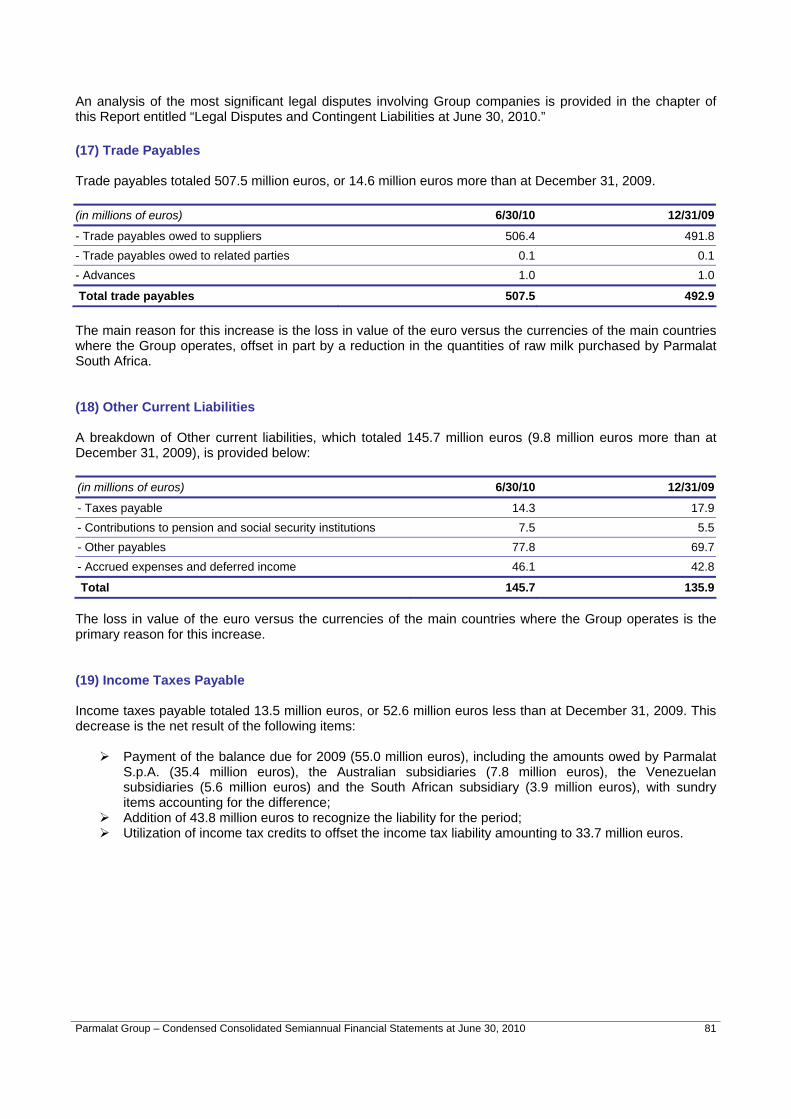
Parmalat Group – Condensed Consolidated Semiannual Financial Statements at June 30, 2010 81
An analysis of the most significant legal disputes involving Group companies is provided in the chapter of this Report entitled “Legal Disputes and Contingent Liabilities at June 30, 2010.” (17) Trade Payables Trade payables totaled 507.5 million euros, or 14.6 million euros more than at December 31, 2009. (in millions of euros) 6/30/10 12/31/09
- Trade payables owed to suppliers 506.4 491.8- Trade payables owed to related parties 0.1 0.1- Advances 1.0 1.0
Total trade payables 507.5 492.9 The main reason for this increase is the loss in value of the euro versus the currencies of the main countries where the Group operates, offset in part by a reduction in the quantities of raw milk purchased by Parmalat South Africa. (18) Other Current Liabilities A breakdown of Other current liabilities, which totaled 145.7 million euros (9.8 million euros more than at December 31, 2009), is provided below: (in millions of euros) 6/30/10 12/31/09
- Taxes payable 14.3 17.9- Contributions to pension and social security institutions 7.5 5.5- Other payables 77.8 69.7- Accrued expenses and deferred income 46.1 42.8
Total 145.7 135.9 The loss in value of the euro versus the currencies of the main countries where the Group operates is the primary reason for this increase. (19) Income Taxes Payable Income taxes payable totaled 13.5 million euros, or 52.6 million euros less than at December 31, 2009. This decrease is the net result of the following items:
Payment of the balance due for 2009 (55.0 million euros), including the amounts owed by Parmalat S.p.A. (35.4 million euros), the Australian subsidiaries (7.8 million euros), the Venezuelan subsidiaries (5.6 million euros) and the South African subsidiary (3.9 million euros), with sundry items accounting for the difference;
Addition of 43.8 million euros to recognize the liability for the period; Utilization of income tax credits to offset the income tax liability amounting to 33.7 million euros.

82 Parmalat Group – Condensed Consolidated Semiannual Financial Statements at June 30, 2010
Guarantees and Commitments Guarantees (in millions of euros) 6/30/10 12/31/09
Sureties Collateral Total Sureties Collateral Total
provided on behalf of Group companies - - - - - -provided on behalf of the Company 382.6 191.3 573.9 371.1 167.5 538.6
Total guarantees 382.6 191.3 573.9 371.1 167.5 538.6 The sureties provided by outsiders on behalf of the Company (382.6 million euros) refer mainly to guarantees provided by banks and/or insurance companies to government finance agencies in connection with VAT refunds and with prize contests. Collateral of 191.3 million euros was provided to banks and other credit institutions to secure financing and consists of assets of the companies receiving the facilities. The largest collateralized loans are owed by the Canadian subsidiary (133.6 million euros) and the Australian subsidiary (52.1 million euros). Commitments (in millions of euros) 6/30/10 12/31/09
Commitments: - Operating leases 74.4 71.3 within 1 year 13.2 13.2 from 1 to 5 years 33.7 32.9 after 5 years 27.5 25.2- Other commitments 33.1 28.3
Total commitments 107.5 99.6 Commitments under operating leases apply mainly to subsidiaries in Canada (38.1 million euros), Africa (19.7 million euros) and Australia (16.4 million euros). Other commitments of 33.1 million euros refer mainly to short-term contracts to purchase raw materials, packaging materials and non-current assets signed by Parmalat Canada Inc. (24.9 million euros), Parmalat Australia (4.7 million euros) and the African subsidiaries (3.5 million euros). In 2004, Parmalat Dairy and Bakery (PDBI) signed a loan agreement, the terms of which included an obligation to pay the lenders an amount equal to 10% of PDBI’s equity value, should there be a change of control for PDBI or its Parent Company, Parmalat S.p.A. Effective January 1, 2008, PDBI and Parmalat Canada Inc. carried out an amalgamation transaction. The amalgamated company is called Parmalat Canada Inc. However, the amalgamation is irrelevant for change of control purposes. The Group believes that there is only a remote possibility that the events referred to in the loan agreement may occur. Accordingly, it recognized only a nominal amount in its memorandum accounts to reflect the impact of this clause.

Parmalat Group – Condensed Consolidated Semiannual Financial Statements at June 30, 2010 83
Legal Disputes and Contingent Liabilities at June 30, 2010 The Group is a defendant in civil and administrative proceedings that, based on the information currently available and in view of the provisions that have already been set aside, are not expected to have a material negative impact on the financial statements. A number of actions for damages, liability actions and actions to void in bankruptcy are still pending. Challenge to the Composition with Creditors An appeal filed against a decision handed down on January 16, 2008 by the Bologna Court of Appeals, which was favorable to Parmalat, is pending before the Italian Court of Cassation.
* * * Information about the main proceedings involving the Parmalat Group, updated as of June 30, 2010, is provided below.
Criminal Proceedings Criminal Court of Milan In the proceedings for the crime of stock manipulation, the lower court handed down its sentencing decision in December 2008. The proceedings at the appellate level ended in May 2010. However, these proceedings are no longer relevant to Parmalat Finanziaria S.p.A. under extraordinary administration, since it reached a settlement with Bank of America. A sentence was handed down for the Grant Thornton auditors, whose position had been separated from the main proceedings. With regard to the second segment of the stock manipulation proceedings, which is pending before a different section of the Criminal Court of Milan, oral arguments that began in 2008 are continuing. No Parmalat company has joined these proceedings as a plaintiff seeking damages. Criminal Court of Parma Several trials of officers and/or employees of former Group companies and various third parties accused of fraudulent bankruptcy are pending before the Criminal Court of Parma. In one trial, in which the defendants are Directors, Statutory Auditors and former employees of Parmalat Group companies, the discovery phase ended in June. Oral arguments will take place after the summer break, with a sentencing decision expected by the end of the year. Companies of the Parmalat Group under extraordinary administration joined these proceedings as a plaintiffs seeking damages. In a second trial, the defendants are Directors, Statutory Auditors and former employees of companies in the so-called “tourism” operations and officers of some banks. Insofar as these bank officers are concerned, Parmalat has already withdrawn from the proceedings as a plaintiff seeking damages whenever settlements were reached. These proceedings are currently in the discovery phase. In other proceedings, the defendants are officers and employees of the former Banca di Roma. In these proceedings, the companies of the Parmalat Group under extraordinary administration, having reached an out-of-court settlement, withdrew the claims they put forth when they joined the proceedings as plaintiffs seeking damages. Lastly, oral arguments started in the trial of officers and/or employees of other banks. With regard to these proceedings, companies of the Parmalat Group under extraordinary administration, having reached out-of-court settlements, withdrew the claims they put forth when they joined the proceedings as plaintiffs seeking damages. As for preliminary hearings, one pending before the Preliminary Hearings Judge in which officers and employees of Citigroup/Citibank are being charged with fraudulent bankruptcy was completed. Parmalat
84 Parmalat Group – Condensed Consolidated Semiannual Financial Statements at June 30, 2010
joined the proceedings as a plaintiff seeking damages, summoning the bank as a civilly liable defendant for the actions of Citibank’s Milan, London and New York branches. At the end of the hearing, the Judge handed down a decision setting aside some minor charges, but indicted all major defendants for the crimes for which they were charged and scheduled for April 4, 2011 the first hearing for oral arguments. Lastly, proceedings targeting employees and/or officers of Standard & Poor’s and JP Morgan in connection with which companies of the Parmalat Group under extraordinary administration have the status of injured parties are still in the preliminary discovery phase. Bologna Court of Appeals In the proceedings concerning the challenge filed by Maurizio Bianchi, Luciano Del Soldato and Giampaolo Zini, the court awarded to Parmalat provisionally the amount of 1 billion euros as compensation for asset damages. Florence Court of Appeals Criminal proceedings against Carlo Alberto Steinhauslin are pending before the Florence Court of Appeals. In proceedings before the lower court, which Parmalat S.p.A. under extraordinary administration joined as a plaintiff seeking damages, Mr. Steinhauslin was found guilty of money laundering. Appellate hearings have not yet been set. Civil Lawsuits in the United States of America Parmalat filed the following lawsuits in the United States against certain banks and independent auditors. Summary Judgment Granted to Grant Thornton Proceedings challenging the decision by the New York District Court granting a motion for summary judgment are pending before the Court of Appeals for the Second Circuit. Parmalat vs Citigroup, Inc. et al. In the appellate proceedings filed against Citigroup, the judge has not yet set a date for oral arguments. Civil Proceedings Filed Against the Group Insurance Companies vs. Parmalat Finanziaria S.p.A. in A.S. An appeal filed by the insurance companies against a decisions handed down on September 25, 2007 by the Court of Milan denying the motions filed by some insurance companies asking that insurance policies taken out by the previous management of the Parmalat Group that provided protection from the risks inherent in the exercise of the offices of Director, Statutory Auditor and General Manager be declared null and void is pending before the Milan Court of Appeals. Giovanni Bonici vs Industria Lactea Venezolana The Court of Caracas upheld in part the claims of Giovanni Bonici, who, in February 2005, in his capacity as President of Industria Lactea Venezolana C.A., served a summons on the abovementioned company challenging his dismissal, of which he was informed in 2004. The plaintiff was asking that his dismissal be declared invalid and that Industria Lactea Venezolana C.A. be ordered to pay damages for various reasons totaling about US$20 million (equal to about 14.7 million euros). Mr. Bonici has been indicated in Italy, by the Court of Parma, with a decree dated July 25, 2007. Liability Actions Acting within the statutory deadlines, Parmalat S.p.A. reinstated its civil liability lawsuits against those defendants in the criminal proceedings that agreed to a plea bargaining arrangement. At a hearing held on June 4, 2008, the Court confirmed a decision dismissing the civil liability lawsuits filed by Parmalat
Parmalat Group – Condensed Consolidated Semiannual Financial Statements at June 30, 2010 85
Finanziaria S.p.A. in A.S. and Parmalat S.p.A. but, insofar as the Assumptor is concerned, ordered the resumption of the lawsuits against the parties included in the reinstatement decision. In the reinstated proceedings, the Court, after framing the issues requiring the input of an expert appraiser, ordered the production of a technical report. The next hearing in these proceedings is scheduled for January 19, 2011. In the other liability action, after the parties exchanged defense briefs, oral arguments followed on June 4, 2008. Subsequently, the Court, after framing the issues requiring the input of an expert appraiser, ordered the production of a technical report. The next hearing has been scheduled for October 13, 2010. Actions to Void in Bankruptcy A total of 8 actions to void in bankruptcy are still pending in the discovery phase. Boschi Luigi & Figli S.p.A. Liability Action In 2004, Parmalat S.p.A. in A.S., who at that time owned an interest of 89.44% in Boschi Luigi & Figli S.p.A., sued asking the court to find that the former Directors and Statutory Auditors of Boschi Luigi & Figli S.p.A. were liable for the company’s collapse. Due to the death of one of the defendants, the lawsuit was interrupted in 2006, but later resumed. At a hearing held on September 17, 2008, the Court dismissed the lawsuit against another defendant, the parties involved having reached a settlement. Following the filing of a technical report requested by the court, the lawsuit is continuing against the other defendants. The proceedings were adjourned to January 12, 2011 for a hearing before the full court. Administrative Proceedings Filed Against the Group Centrale del Latte di Roma S.p.A. The Court of Cassation upheld the challenge filed by Ariete Fattoria Latte Sano against the decision handed down on November 13, 2008 by the Council of State, sending the proceedings back to the Council of State, which, in turn, handed down a new decision on March 1, 2010 upholding the claims of Ariete Fattoria Latte Sano. Parmalat and other parties have filed new challenges against this decision. Antitrust Decisions and Investigative Proceedings On May 21, 2008, the Italian Antitrust Authority ordered Parmalat S.p.A. to pay an administrative fine of 2,226,000 euros. Parmalat, having complied fully with the Italian Antitrust Authority’s Resolution No. 16282 on April 18, 2008 (date when the contract to sell the shares of Newlat S.p.A. to TMT Finance SA was executed) and believing that the reasons that prevented it from complying with the October 30, 2007 deadline originally set by the Italian Antitrust Authority were beyond its control, challenged the Italian Antitrust Authority’s decision of May 21, 2008 before the Regional Administrative Court of Latium, asking that it be set aside. On February 4, 2009, the Regional Administrative Court of Latium handed down a decision denying Parmalat’s challenge and upholding the Italian Antitrust Authority’s decision. On July 7, 2009, Parmalat filed a complaint challenging this decision before the Council of State.

86 Parmalat Group – Condensed Consolidated Semiannual Financial Statements at June 30, 2010
Disputes Involving Challenges to the Composition of the Lists of Liabilities Challenges and Oppositions At June 30, 2010, disputes stemming from challenges to the composition of the lists of liabilities of the companies included in the Composition with Creditors and late filings of claims involved 61 lawsuits filed before the Court of Parma and 145 lawsuits pending before the Bologna Court of Appeals. A significant portion of these disputes (over 100 lawsuits pending before the lower courts or at the appellate level) involves issues related to Article 2362 of the Italian Civil Code (wording in force earlier) for the period during which Parmalat Finanziaria S.p.A. was the sole shareholder of Parmalat S.p.A.
* * * Information about the management of all of the risk areas to which the Company is exposed is provided in the section of the Interim Report on Operations entitled “Managing Business Risks.”

Parmalat Group – Condensed Consolidated Semiannual Financial Statements at June 30, 2010 87
Notes to the Income Statement (20) Revenues A breakdown of revenues is as follows:
(in millions of euros) First half 2010 First half 2009
Net sales revenues 2,026.2 1,848.0
Other revenues 22.7 12.9
Total revenues 2,048.9 1,860.9
A geographic breakdown of net revenues is as follows:
(in millions of euros) First half 2010 First half 2009
Italy 478.1 505.6Other countries in Europe 72.6 67.9Canada 749.1 638.6Central and South America 193.2 270.6Australia 341.8 200.2Africa 192.0 165.5Sundry items1 (0.6) (0.4)
Total sales revenues 2,026.2 1,848.01 Includes costs of the Group’s Parent Company, other minor companies and inter-area eliminations.
Other revenues include the following:
(in millions of euros) First half 2010 First half 2009
Royalties 5.4 1.1Damage compensation 3.0 -Prior-period items and restatements 2.9 2.3Rebilling of advertising expenses 2.6 3.0Rent 1.0 1.0Gains on the sale of non-current assets 1.0 0.5Operating grants 0.3 0.5Insurance settlements 0.2 0.1Expense reimbursements 0.2 0.1Miscellaneous 6.1 4.3
Total other revenues 22.7 12.9 The increase in Other revenues is due mainly to a settlement reached during the first half of 2010 that resulted in the payment of prior-period royalties and the collection of compensation for purchases of condensed milk in previous years that did not meet quality standards.

88 Parmalat Group – Condensed Consolidated Semiannual Financial Statements at June 30, 2010
(21) Costs A breakdown of the costs incurred in the first half of 2010 is as follows:
(in millions of euros) First half 2010 First half 2009
Cost of sales 1,588.1 1,430.6Distribution costs 216.1 204.8Administrative expenses 128.5 110.6
Total costs 1,932.7 1,746.0
A breakdown by type of the costs incurred in the first half of 2010 is as follows:
(in millions of euros) First half 2010 First half 2009
Raw materials and finished goods 1,109.5 996.0Labor costs 256.6 224.9Packaging materials 156.5 149.4Freight 86.6 83.5Depreciation, amortization and writedowns of non-current assets 58.3 46.7Sales commissions 55.0 47.8Advertising and promotions 46.9 37.7Energy, water and gas 39.5 37.6Other services 39.4 35.7Maintenance and repairs 25.9 23.0Storage, handling and outside processing services 21.0 19.6Supplies 20.4 21.7Use of property not owned 19.0 15.7Consulting services 13.6 11.0Postage, telephone and insurance 10.0 9.0Miscellaneous charges 9.8 9.7Writedowns of receivables and additions to provisions 9.5 8.3Auditing services 1.9 1.8Fees to Chairman and Directors 1.0 1.0Fees to Statutory Auditors 0.3 0.4Changes in inventories of raw materials and finished goods (48.0) (34.5)
Total cost of sales, distribution costs and administrative expenses 1,932.7 1,746.0

Parmalat Group – Condensed Consolidated Semiannual Financial Statements at June 30, 2010 89
(22) Litigation-related Expenses The balance in this account reflects the fees paid to law firms (5.1 million euros) retained as counsel in connection with the actions for damages and actions to void filed by the companies under extraordinary administration prior to the implementation of the Composition with Creditors, which the Company is currently pursuing. (23) Miscellaneous Income (Expense) Net miscellaneous income totaled 65.6 million euros. A breakdown is as follows: (in millions of euros) First half 2010 First half 2009Intra-Group consolidation of debt formerly owed by Parmalat Capital Finance Ltd in liquidation 52.4 -Proceeds from actions to void and actions for damages 3.6 181.7Benefit (expense) related to tax risks 6.0 (6.0)Restructuring costs (1.1) -Sundry income (expense) 4.7 4.0Total miscellaneous income (expense) 65.6 179.7 During the first half of 2010, Parmalat S.p.A. reached a settlement with Parmalat Capital Finance Limited in liquidation, pursuant to which the former acquired receivables owed to the latter by Group companies. More specifically, Parmalat S.p.A. acquired the following:
rights arising from a loan of US$45 million, plus accrued interest, provided to Parmalat de Venezuela;
rights arising from consulting services totaling US$2.5 million provided to Parmalat Nicaragua; rights arising from a loan of US$0.5 million provided to Parmalat de Mexico.
The execution of these settlement agreements resulted in the intra-Group consolidation of borrowings totaling 52.4 million euros. Proceeds from settlements and actions to void and actions for damages include the amounts collected from Commerzbank AG (1.8 million euros), Rabobank (0.9 million euros), Banca Popolare di Bari (0.5 million euros) and sundry items for the difference The benefit related to tax risks results from a restatement of the probable estimated tax liabilities of the Venezuelan and Canadian subsidiaries. Restructuring costs refer to the plan launched in the first half of 2010 to reorganize the logistics and distribution areas.

90 Parmalat Group – Condensed Consolidated Semiannual Financial Statements at June 30, 2010
(24) Financial Income (Expense) Net financial income amounted to 0.5 million euros, broken down as follows: (in millions of euros) First half 2010 First half 2009Foreign exchange translation gains 22.1 6.8Monetary gain due to hyperinflation 7.4 -Interest earned on accounts with banks and other financial institutions 4.3 11.2Income from cash-equivalent securities 2.1 5.5Income from held-for-sale securities 1.1 -Interest received from the tax authorities 0.9 1.2Other financial income 0.3 0.8Total financial income 38.2 25.5% Interest paid on loans (22.6) (14.8)Foreign exchange translation losses (13.5) (5.4)Bank fees (1.1) (0.9)Actuarial losses - (0.1)Other financial expense (0.5) (0.5)Total financial expense (37.7) (21.7)Net financial income (expense) 0.5 3.8 A reduction in interest rates at the global level is the reason for the decreases in Interest earned on accounts with banks and other financial institutions and Income from cash-equivalent securities. The increase in Interest paid on loans is due mainly to the early repayment of 90% of the indebtedness owed on long-term subordinated notes, which resulted in the recognition of interest expense amounting to 12.4 million euros. This charge was more than offset by the elimination of the corresponding deferred-tax liability. (25) Income Taxes Income taxes totaled 28.2 million euros, broken down as follows: (in millions of euros) First half 2010 First half 2009Current taxes - Italian companies 18.8 17.5- Foreign companies 24.9 25.4Deferred and prepaid taxes, net - Italian companies (2.0) 3.2- Foreign companies (13.5) 0.2 Total 28.2 46.3 Current taxes of Italian companies totaled 18.8 million euros, including 1.8 million euros in regional taxes (IRAP) and 17.0 million euros in corporate income taxes (IRES). Net deferred and prepaid taxes of 15.5 million euros were computed on the temporary differences between the values assigned to assets and liabilities for reporting purposes and tax purposes. The early repayment of 90% of the subordinated notes resulted in the elimination of temporary differences amounting to 14.4 million euros.

Parmalat Group – Condensed Consolidated Semiannual Financial Statements at June 30, 2010 91
Other Information
Significant Non-recurring Transactions The Group did not execute significant non-recurring transactions or transactions that were atypical or unusual. Net Financial Position In accordance with the requirements of the Consob Communication of July 28, 2006 and consistent with the CESR’s Recommendation of February 10, 2005 “Recommendations for a Uniform Implementation of the European Commission’s Prospectus Regulation,” a schedule showing the net financial position of the Parmalat Group at June 30, 2010 is provided below: (in millions of euros) 6/30/10 12/31/09
A) Cash 1.5 1.7B) Cash equivalents and readily available financial assets:
- Bank and postal accounts 298.1 423.4 - Italian Treasury securities 515.2 619.1
- Foreign Treasury securities (Germany) 120.1 27.9- Foreign Treasury securities (France) 112.1 -- Reverse repurchase agreements 2.0 2.0- Accrued interest 4.4 1.1- Time deposits 465.7 555.5
C) Negotiable securities 11.6 14.3
D) Liquid assets (A+B+C) 1,530.7 1,645.0
E) Current loans receivable - -F) Current bank debt 11.6 44.4G) Current portion of non-current indebtedness 53.6 12.3H) Other current borrowings 13.1 13.7
I) Current indebtedness (F+G+H) 78.3 70.4
J) Net current indebtedness (I-E-D) (1,452.4) (1,574.6)
K) Non-current bank debt 136.4 163.6L) Debt securities outstanding - -M) Other non-current borrowings 18.4 26.4
N) Non-current indebtedness (K+L+M) 154.8 190.0
O) Net borrowings (J+N) (1,297.6) (1,384.6) The section of the Interim Report on Operations entitled “Financial Performance” explains the main developments that occurred in this area.

92 Parmalat Group – Condensed Consolidated Semiannual Financial Statements at June 30, 2010
Breakdown of Labor Costs by Type A breakdown is as follows:
First half 2010 First half 2009Wages and salaries 184.0 157.6Social security contributions 32.1 28.8Severance benefits 21.9 22.0Other labor costs 18.6 16.5
Total labor costs 256.6 224.9 The increase in Labor costs is due mainly to the loss of value of the euro versus the currencies of the main countries in which the Group operates and the consolidation of the Australian operations acquired in July 2009. Depreciation, Amortization and Writedowns A breakdown is as follows:
(in millions of euros) First half 2010 First half 2009- Amortization of intangibles 11.4 10.6- Depreciation of property, plant and equipment 43.2 36.1- Writedowns of non-current assets 3.8 -- Reversals of writedowns (0.1) -Total depreciation, amortization and writedowns of non-current assets 58.3 46.7 No impairment indicators affecting the value of goodwill or trademarks with an indefinite useful life were detected during the first half of 2010. Writedowns of 3.8 million euros reflect the loss in value suffered by the buildings of a production unit.
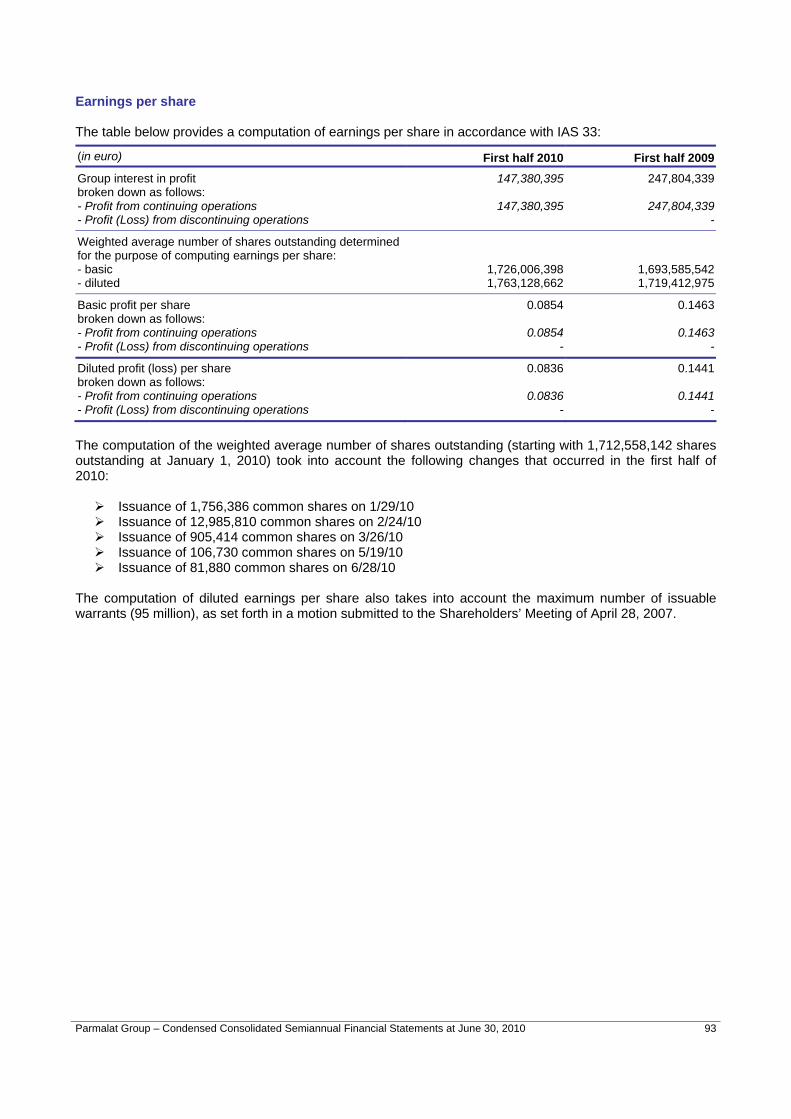
Parmalat Group – Condensed Consolidated Semiannual Financial Statements at June 30, 2010 93
Earnings per share The table below provides a computation of earnings per share in accordance with IAS 33:
(in euro) First half 2010 First half 2009Group interest in profit broken down as follows: - Profit from continuing operations - Profit (Loss) from discontinuing operations
147,380,395
147,380,395
247,804,339
247,804,339-
Weighted average number of shares outstanding determined for the purpose of computing earnings per share: - basic - diluted
1,726,006,398 1,763,128,662
1,693,585,5421,719,412,975
Basic profit per share broken down as follows: - Profit from continuing operations - Profit (Loss) from discontinuing operations
0.0854
0.0854 -
0.1463
0.1463-
Diluted profit (loss) per share broken down as follows: - Profit from continuing operations - Profit (Loss) from discontinuing operations
0.0836
0.0836 -
0.1441
0.1441-
The computation of the weighted average number of shares outstanding (starting with 1,712,558,142 shares outstanding at January 1, 2010) took into account the following changes that occurred in the first half of 2010:
Issuance of 1,756,386 common shares on 1/29/10 Issuance of 12,985,810 common shares on 2/24/10 Issuance of 905,414 common shares on 3/26/10 Issuance of 106,730 common shares on 5/19/10 Issuance of 81,880 common shares on 6/28/10
The computation of diluted earnings per share also takes into account the maximum number of issuable warrants (95 million), as set forth in a motion submitted to the Shareholders’ Meeting of April 28, 2007.

94 Parmalat Group – Condensed Consolidated Semiannual Financial Statements at June 30, 2010
Segment Information
The schedules that follow, which were prepared in accordance with the disclosure requirements of IFRS 8, provide segment information about the Group’s operations at June 30, 2010 and the comparable data for 2009. The breakdown by geographic region is consistent with the Group’s governance structure and is reflected on the income statement and balance sheet data provided below. The balance sheet data are end-of-period data.
(€ m)
Russia Portugal Romania Total Venezuela Colombia Other coun-tries
Total South Africa
Other coun-tries
Total
2010Net segment revenues 478.1 40.3 27.7 4.6 72.6 749.1 121.7 60.1 11.4 193.2 341.8 164.8 27.1 192.0 0.2 (0.7) 2,026.2Net inter-segment revenues (0.7) 0.0 0.0 0.0 0.0 0.0 0.0 (0.0) 0.0 0.0 0.0 (6.4) 6.4 0.0 0.0 0.7Net revenues from outsiders 477.4 40.3 27.7 4.6 72.6 749.1 121.7 60.0 11.4 193.2 341.8 158.5 33.5 192.0 0.2 2,026.2EBITDA 49.8 2.8 3.0 0.8 6.6 64.8 8.0 3.6 (0.1) 11.4 32.7 15.6 1.6 17.2 (0.1) (8.0) 174.5% of net revenues 10.4 6.9 10.9 16.7 9.1 8.6 6.5 6.0 (1.2) 5.9 9.6 9.5 5.8 9.0 8.6Depreciation, amortization and writedowns of non-current assets (29.6) (1.3) (0.5) (0.3) (2.1) (10.1) (2.8) (2.2) (0.3) (5.3) (6.7) (3.9) (0.6) (4.5) (0.0) (58.3)- Writedowns of goodwill and trademarks with indefinite useful life- Litigation related expenses (5.1)- Miscell. income and expense (1.7) 0.0 0.0 0.0 0.0 4.0 52.0 0.0 1.9 53.9 (0.3) 0.0 0.0 0.0 4.6 65.6EBIT 18.5 1.5 2.6 0.4 4.5 58.7 57.2 1.4 1.4 60.0 25.8 11.8 0.9 12.7 4.6 (8.0) 176.7Financial income 16.6 3.0 0.0 0.1 3.1 1.7 8.0 0.3 0.2 8.6 3.5 1.2 2.2 3.4 2.4 38.2Financial expense 0.1 (0.6) (0.1) (0.1) (0.9) (16.8) (8.4) (0.9) (0.3) (9.6) (2.7) (1.2) (3.9) (5.1) (3.8) (37.7)Interest in result of cos. valued by equity method (0.7) 0.0 0.0 0.0 0.0 0.0 0.0 0.0 0.0 0.0 0.0 0.0 0.0 0.0 0.0 (0.7)Other income from (expense for) equity investments 0.5 0.0 0.0 0.0 0.0 0.0 0.0 0.0 (0.2) (0.2) 0.1 0.0 0.0 0.0 0.0 0.3PROFIT BEFORE TAXES 26.9 3.9 2.5 0.5 6.8 43.5 56.9 0.8 1.1 58.8 26.7 11.7 (0.7) 11.0 3.2 176.8Income taxes (16.7) (1.2) (0.7) (0.1) (2.0) 2.8 (0.2) (0.5) (0.0) (0.7) (7.6) (3.3) (0.7) (4.0) (0.1) (28.2)NET PROFIT FROM CONTINUING OPERATIONS 10.2 2.6 1.8 0.4 4.8 46.4 56.7 0.3 1.1 58.1 19.0 8.4 (1.4) 7.0 3.1 0.0 148.6Net profit (loss) from discontinuing operations 0.0 0.0 0.0 0.0 0.0 0.0 0.0 0.0 0.0 0.0 0.0 0.0 0.0 0.0 0.0 0.0PROFIT FOR THE PERIOD 10.2 2.6 1.8 0.4 4.8 46.4 56.7 0.3 1.1 58.1 19.0 8.4 (1.4) 7.0 3.1 0.0 148.6Total segment assets 2,430.7 68.0 82.5 11.6 162.2 925.3 136.6 91.7 19.0 247.2 432.6 240.1 30.9 271.0 65.2 (5.8) 4,528.3Total non-segment assets 115.3Total assets 4,643.6Total segment liabilities 336.1 9.6 11.6 2.7 23.9 199.9 63.1 17.0 9.4 89.6 110.9 52.4 13.2 65.6 10.9 (5.8) 831.1Total non-segment liabilities 431.5Total liabilities 1,262.6Capital exp. (prop., plant & equip.) 23.6 2.7 0.6 0.0 3.3 9.2 2.6 1.4 0.3 4.4 8.5 1.4 1.0 2.4 0.1 51.4Capital expenditures (intangibles) 3.4 0.0 0.0 0.0 0.0 0.3 0.3 0.0 0.0 0.3 0.0 0.1 0.0 0.1 0.0 4.2Number of employees 2,158 1,020 262 129 1,411 2,929 1,978 1,116 274 3,368 1,709 1,778 579 2,357 13,932
ITALY OTHER COUNTRIES IN EUROPE CANADA HOLDING COS/ADJ. &
ELIM.
GROUPCENTRAL AND SOUTH AMERICA AUSTRALIA AFRICA GROUP CONTINUING NON-CORE &
OTHER
- Capital expenditures for property, plant and equipment include land and buildings.
Additional information about the performance of the different segments in the first half of 2010 is provided in the Interim Report on Operations.

Parmalat Group – Condensed Consolidated Semiannual Financial Statements at June 30, 2010 95
(€ m)
Russia Portugal Romania Total Venezuela Colombia Other coun-tries
Total South Africa
Other coun-tries
Total
2009Net segment revenues 505.6 33.4 29.5 5.0 67.9 638.6 202.8 47.0 20.8 270.6 200.2 144.7 20.8 165.5 0.3 (0.7) 1,848.0Net inter-segment revenues (0.7) (0.1) 0.1 (5.5) 5.5 0.7Net revenues from outsiders 505.0 33.4 29.5 5.0 67.9 638.6 202.8 47.0 20.9 270.6 200.2 139.2 26.2 165.5 0.3 1,848.0EBITDA 61.7 6.4 3.8 0.4 10.6 51.1 22.2 3.4 0.7 26.3 17.6 4.1 2.1 6.2 (0.2) (11.8) 161.6% of net revenues 12.2 19.1 12.9 8.7 15.6 8.0 11.0 7.1 3.4 9.7 8.8 2.8 9.9 3.7 8.7Depreciation, amortization and writedowns of non-current assets (24.2) (1.1) (0.4) (0.4) (1.9) (8.4) (2.0) (1.6) (0.6) (4.2) (4.5) (3.0) (0.5) (3.5) (46.7)- Writedowns of goodwill and trademarks with indefinite useful life- Litigation related expenses (6.1) (6.1)- Miscell. income and expense 190.1 (0.3) (4.7) (4.9) (9.6) (0.6) 179.7EBIT 221.5 5.3 3.3 0.1 8.7 42.4 15.5 1.7 (4.8) 12.5 12.6 1.1 1.6 2.6 (0.1) (11.8) 288.5Financial income 16.2 0.6 0.2 0.9 0.2 2.5 0.3 0.8 3.6 0.1 2.1 0.7 2.8 1.8 25.5Financial expense 1.2 (1.3) (0.3) (0.1) (1.8) (5.7) (6.0) (0.4) (1.0) (7.3) (2.3) (1.0) (1.5) (2.6) (3.2) (21.7)Other income from (expense for) equity investments 1.3 (3.4) (3.4) 5.4 3.2PROFIT BEFORE TAXES 240.1 4.5 3.0 0.1 7.7 36.9 12.0 1.7 (4.9) 8.8 10.4 2.2 (2.7) (0.6) 3.9 (11.8) 295.5Income taxes (20.7) (0.9) (0.8) (1.8) (10.7) (7.9) (0.6) (0.1) (8.6) (3.7) (0.4) (0.5) (0.9) (46.3)NET PROFIT FROM CONTINUING OPERATIONS 219.4 3.7 2.2 0.1 5.9 26.2 4.1 1.1 (5.0) 0.2 6.7 1.8 (3.2) (1.4) 3.9 (11.8) 249.2Net profit (loss) from discontinuing operationsPROFIT FOR THE PERIOD 219.4 3.7 2.2 0.1 5.9 26.2 4.1 1.1 (5.0) 0.2 6.7 1.8 (3.2) (1.4) 3.9 (11.8) 249.2Total segment assets 2,579.1 55.9 87.1 13.3 156.4 764.4 155.3 69.1 23.8 248.2 298.9 197.9 25.9 223.8 68.6 (10.4) 4,329.0Total non-segment assets 94.5Total assets 4,423.5Total segment liabilities 322.3 11.1 15.8 4.1 31.0 176.7 91.5 13.4 10.1 114.9 75.6 44.4 7.9 52.2 10.4 (10.4) 772.8Total non-segment liabilities 669.6Total liabilities 1,442.4Capital exp. (prop., plant & equip.) 9.5 2.7 0.3 0.2 3.1 10.6 3.5 1.9 0.4 5.8 3.2 1.8 0.8 2.6 34.7Capital expenditures (intangibles) 2.5 2.5Number of employees 2,254 984 265 143 1,392 3,002 1,872 1,066 776 3,714 1,460 1,768 587 2,355 14,177
ITALY OTHER COUNTRIES IN EUROPE CANADA HOLDING COS/ADJ. &
ELIM.
GROUPCENTRAL AND SOUTH AMERICA AUSTRALIA AFRICA GROUP CONTINUING NON-CORE &
OTHER
- Capital expenditures for property, plant and equipment include land and buildings.
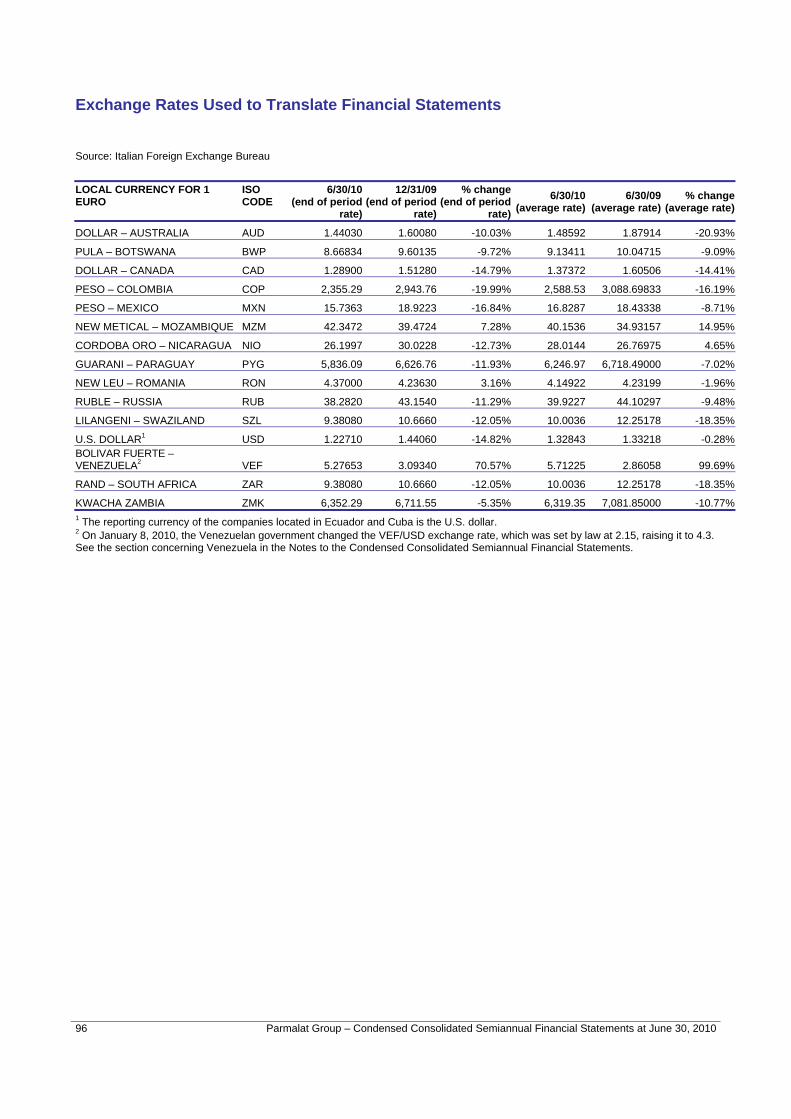
96 Parmalat Group – Condensed Consolidated Semiannual Financial Statements at June 30, 2010
Exchange Rates Used to Translate Financial Statements Source: Italian Foreign Exchange Bureau
LOCAL CURRENCY FOR 1 EURO
ISO CODE
6/30/10(end of period
rate)
12/31/09(end of period
rate)
% change(end of period
rate)
6/30/10 (average rate)
6/30/09(average rate)
% change (average rate)
DOLLAR – AUSTRALIA AUD 1.44030 1.60080 -10.03% 1.48592 1.87914 -20.93%
PULA – BOTSWANA BWP 8.66834 9.60135 -9.72% 9.13411 10.04715 -9.09%
DOLLAR – CANADA CAD 1.28900 1.51280 -14.79% 1.37372 1.60506 -14.41%
PESO – COLOMBIA COP 2,355.29 2,943.76 -19.99% 2,588.53 3,088.69833 -16.19%
PESO – MEXICO MXN 15.7363 18.9223 -16.84% 16.8287 18.43338 -8.71%
NEW METICAL – MOZAMBIQUE MZM 42.3472 39.4724 7.28% 40.1536 34.93157 14.95%
CORDOBA ORO – NICARAGUA NIO 26.1997 30.0228 -12.73% 28.0144 26.76975 4.65%
GUARANI – PARAGUAY PYG 5,836.09 6,626.76 -11.93% 6,246.97 6,718.49000 -7.02%
NEW LEU – ROMANIA RON 4.37000 4.23630 3.16% 4.14922 4.23199 -1.96%
RUBLE – RUSSIA RUB 38.2820 43.1540 -11.29% 39.9227 44.10297 -9.48%
LILANGENI – SWAZILAND SZL 9.38080 10.6660 -12.05% 10.0036 12.25178 -18.35%
U.S. DOLLAR1 USD 1.22710 1.44060 -14.82% 1.32843 1.33218 -0.28%BOLIVAR FUERTE – VENEZUELA2 VEF 5.27653 3.09340 70.57% 5.71225 2.86058 99.69%
RAND – SOUTH AFRICA ZAR 9.38080 10.6660 -12.05% 10.0036 12.25178 -18.35%
KWACHA ZAMBIA ZMK 6,352.29 6,711.55 -5.35% 6,319.35 7,081.85000 -10.77%1 The reporting currency of the companies located in Ecuador and Cuba is the U.S. dollar. 2 On January 8, 2010, the Venezuelan government changed the VEF/USD exchange rate, which was set by law at 2.15, raising it to 4.3. See the section concerning Venezuela in the Notes to the Condensed Consolidated Semiannual Financial Statements.

1 C = Corporation; PC = Publicly traded corporation; LLP = Limited liability partnership; F = Foreign company 2 L = Company consolidated line by line; C = Company valued at cost; EM = Company valued by the equity method 3 Company in liquidation and subsidiaries 4 Company party to local composition-with-creditors proceedings and subsidiaries 5 Company under extraordinary administration or noncore company Parmalat Group – Condensed Consolidated Semiannual Financial Statements at June 30, 2010 97
Investments in subsidiaries, joint ventures and affiliated companies of the Parmalat Group
Company Share capital Equity investment Name Head office
Type 1
Curr Amount Tot. number ofvoting shares/capi.interests
held
Held by Number of shares/cap.
interests
% (based on No. of shares/
cap. int.)
Group interest
Consolid.or valu-
ation method2
GROUP’S PARENT COMPANY
PARMALAT S.P.A.
Collecchio
PC EUR 1,728,394,362
100.0000
L
EUROPE
ITALY
ALBALAT SRL
Albano Laziale (Rome)
LLP EUR 20,000 100 Sata S.r.l. 100 0.500
0.500 C
BONATTI S.P.A.
Parma
C EUR 28,813,404 572,674 Parmalat S.p.A. 572,674 10.256
10.256
C
BOSCHI LUIGI & FIGLI S.P.A.
Collecchio
C EUR 10,140,000 10,140,000 Parmalat S.p.A. 10,140,000 100.000
100.000 100.0000 L
CARNINI S.P.A.
Villa Guardia (CO)
C EUR 3,300,000 600 Parmalat S.p.A. 600 100.000
100.000 100.0000 L
CE.PI.M S.P.A.
Fontevivo
C EUR 6,642,928 464,193 Parmalat S.p.A. 464,193 0.840
0.840 C
CENTRALE DEL LATTE DI ROMA S.P.A.
Rome
C EUR 37,736,000 5,661,400 Parmalat S.p.A. 5,661,400 75.013
75.013 75.0130 L
COMPAGNIA FINANZIARIA ALIMENTI SRL in
liquidation(3)
Collecchio
LLP EUR 10,000 10,000 Dalmata S.r.l. 10,000 100.000
100.000 100.0000 L
COOPERFACTOR S.P.A.
Bologna
C EUR 11,000,000 10,329 Parmalat S.p.A. 10,329
0,094
0.094
C
DALMATA SRL
Collecchio
LLP EUR 120,000 1 Parmalat S.p.A. 1 100.000
100.000 100.0000 L
DALMATA DUE SRL
Collecchio
LLP EUR 10,000 1 Dalmata S.r.l. 1 100.000
100.000 100.0000 L
FIORDILATTE SRL in liquidation(3)
Collecchio
LLP EUR 10,000 4,000 Dalmata S.r.l. 4,000 40.000
40.000 EM
HORUS SRL(4)
LLP EUR n.d. n.d. Sata S.r.l. n.d. 1.000
1.000 C
LATTE SOLE S.P.A.
Collecchio
C EUR 6,000,000 6,000,000 Parmalat S.p.A. 6,000,000 100.000
100.000 100.0000 L
NUOVA HOLDING S.P.A. in A.S. (4)
Parma
C EUR 25,410,000 100 Sata S.r.l. 100 0.0003
0.0003 C
PARMALAT AFRICA S.P.A.
Collecchio
C EUR 38,860,408 38,860,408 Parmalat S.p.A. 38,860,408 100.000
100.000 100.0000 L
PARMALAT DISTRIBUZIONE ALIMENTI SRL
Collecchio
LLP EUR 1,000,000 1 Parmalat S.p.A. 1 100.000
100.000 100.0000 L
PISORNO AGRICOLA SRL
Collecchio
LLP EUR 516,400 511,236
5,164
Sata S.r.l.
Parmalat S.p.A.
511,236
5,164
99.000
1.000
100.000 100.0000 L
SATA SRL
Collecchio
LLP EUR 500,000 500,000 Parmalat S.p.A. 500,000 100.000
100.000 100.0000 L

1 C = Corporation; PC = Publicly traded corporation; LLP = Limited liability partnership; F = Foreign company 2 L = Company consolidated line by line; C = Company valued at cost; EM = Company valued by the equity method 3 company in liquidation and subsidiaries 4 company party to local composition-with-creditors proceedings and subsidiaries 5 company under extraordinary administration or noncore company 98 Parmalat Group – Condensed Consolidated Semiannual Financial Statements at June 30, 2010
Company Share capital Equity investment Name Head office
Type 1
Curr Amount Tot. number ofvoting shares/capi.interests
held
Held by Number of shares/cap.
interests
% (based on No. of shares/
cap. int.)
Group interest
Consolid.or valu-
ation method2
SO.GE.AP S.P.A.
Parma
C EUR 19,454,528 526 Parmalat S.p.A. 526 0.135
0.135 C
TECNOALIMENTI SCPA
Milan
C EUR 780,000 33,800 Parmalat S.p.A. 33,800 4.330
4.330 C
BELGIUM
PARMALAT BELGIUM SA
Brussels
F EUR
1,000,000
40,000
Parmalat S.p.A.
40,000 100.000
100.000
100.0000
L
NETHERLANDS
DAIRIES HOLDING INTERNATIONAL BV
in A.S. (5)
Rotterdam
F EUR
244,264,623.05
40 ord.
542,765,829 pref.
Dalmata S.r.l.
Dalmata S.r.l.
40
542,765,829
0.008
99.992
100,000
C
GERMANY
DEUTSCHE PARMALAT GMBH in A.S. (5)
Weissenhorn
F EUR 4,400,000 4,400,000 Dalmata S.r.l. 4,400,000 100.000
100.000 C
PARMALAT MOLKEREI GMBH in A.S. (5)
Gransee
F EUR 600,000 540,000 Deutsche Parmalat Gmbh in
AS
540,000 90.000
90.000 C
LUXEMBOURG
OLEX SA in A.S. (5)
Luxembourg
F EUR 578,125 22,894 Dairies Holding Int.l Bv in A.S. 22,894 99.001
99.001 C
PORTUGAL
PARMALAT PORTUGAL PROD. ALIMENT.
LDA
Sintra
F EUR 11,651,450.04 11,651,450 Parmalat S.p.A.
Latte Sole S.p.A.
Parmalat Distribuz. Alim. S.r.l.
11,646,450
3,500
1,500
99.957
0.030
0.013
100.000 100.0000 L
EMBOPAR
Lisbon
F EUR 241,500 4,830 Parmalat Portugal 70 1.449
1.449 C
CNE – Centro Nacional de Embalagem
Lisbon
F EUR 488,871.88 897 Parmalat Portugal 1 0.111
0.111 C
ROMANIA
LA SANTAMARA SRL
Baia Mare
F RON 6,667.50 635 Parmalat S.p.A.
Parmalat Romania sa
535
100
84.252
15.748
100.000 99.9999 L
PARMALAT ROMANIA SA
Comuna Tunari
F RON 26,089,760 2,608,957 Parmalat S.p.A. 2,608,957 99.993
99.993 99.9993 L
RUSSIA
OAO BELGORODSKIJ MOLOCNIJ KOMBINAT
Belgorod
F RUB 67,123,000 66,958,000 Parmalat S.p.A. 66,958,000 99.754
99.754 99,7542 L
OOO DEKALAT
Saint Petersburg
F RUB 100,000 1 Parmalat S.p.A. 1 100.000
100.000 100.0000 L
OOO PARMALAT MK
Moscow
F RUB 81,015,950 1 Parmalat S.p.A. 1 100.000
100.000 100.0000 L
OOO URALLAT
Berezovsky
F RUB 129,618,210 1 Parmalat S.p.A. 1 100.000
100.000 100.0000 L
OOO FORUM
Severovo
F RUB 10,000 1 OOO Parmalat MK 1 100.000
100.000 100.0000 L

1 C = Corporation; PC = Publicly traded corporation; LLP = Limited liability partnership; F = Foreign company 2 L = Company consolidated line by line; C = Company valued at cost; EM = Company valued by the equity method 3 Company in liquidation and subsidiaries 4 Company party to local composition-with-creditors proceedings and subsidiaries 5 Company under extraordinary administration or noncore company Parmalat Group – Condensed Consolidated Semiannual Financial Statements at June 30, 2010 99
Company Share capital Equity investment Name Head office
Type 1
Curr Amount Tot. number ofvoting shares/capi.interests
held
Held by Number of shares/cap.
interests
% (based on No. of shares/
cap. int.)
Group interest
Consolid.or valu-
ation method2
NORTH AMERICA
CANADA
PARMALAT CANADA INC.
Toronto
F CAD 982,479,550 848,019 Class A
134,460 Class B
Parmalat S.p.A.
Parmalat S.p.A.
848,019
134,460
86.314
13.685
100.000 100.0000 L
MEXICO
PARMALAT DE MEXICO S.A. de C.V. (3)
Jalisco
F MXN 390,261,812 390,261,812 Parmalat S.p.A.
390,261,812
100.000
100.000 100.0000 L
CENTRAL AMERICA
CUBA
CITRUS INTERNATIONAL CORPORATION SA
Pinar del Rio
F USD 11,400,000 627 Parmalat S.p.A. 627 55.000
55.000 55.0000 L
NICARAGUA
PARMALAT NICARAGUA SA in liquidation(3)
Managua
F NIO 2,000,000 2,000 Curcastle Corporation nv
Parmalat S.p.A.
1,943
57
97.150
2.850
100.000 100.0000 L
SOUTH AMERICA
NETHERLANDS ANTILLES
CURCASTLE CORPORATION NV
Willemstad
F USD 6,000 6,000 Dalmata Due S.r.l. 6,000 100.000
100.000 100.0000 L
BRAZIL
PRM ADMIN E PART DO BRASIL LTDA(3)
São Paulo
F BRL 1,000,000 810,348 Parmalat S.p.A. 810,348 81.035
81.035 C
CHILE
PARMALAT CHILE SA(5)
Santiago
F CLP 13,267,315,372 2,096,083 Parmalat S.p.A. 2,096,083 99.999
99.999 C
COLOMBIA
PARMALAT COLOMBIA LTDA
Bogotá
F COP
20,466,360,000
18,621,581 Parmalat S.p.A.
18,621,581
90.986
90.986 90.9860 L
PROCESADORA DE LECHES SA (Proleche
sa)
Bogotá
F COP
173,062,136
138,102,792
Parmalat S.p.A.
Dalmata S.r.l.
Parmalat Colombia Ltda
131,212,931
4,101,258
2,788,603
94.773
2.962
2.014
99.749 99.5676 L
ECUADOR
PARMALAT DEL ECUADOR SA (formerly
Leche Cotopaxi Lecocem SA)
Latacunga
F USD
6,167,720
100,067,937
Parmalat S.p.A.
100,067,937 64.897
64.897 64.8978 L
LACTEOSMILK SA (formerly Parmalat del
Ecuador sa)
Quito
F USD
345,344
8,633,599
Parmalat S.p.A.
Parmalat Colombia Ltda
8,633,598
1
100.000
0.000
100.000 100.0000 L
PARAGUAY
PARMALAT PARAGUAY SA
Asuncion
F PYG
9,730,000,000
9,632
Parmalat S.p.A.
9,632 99.000
99,000 99.000 L

1 C = Corporation; PC = Publicly traded corporation; LLP = Limited liability partnership; F = Foreign company 2 L = Company consolidated line by line; C = Company valued at cost; EM = Company valued by the equity method 3 company in liquidation and subsidiaries 4 company party to local composition-with-creditors proceedings and subsidiaries 5 company under extraordinary administration or noncore company 100 Parmalat Group – Condensed Consolidated Semiannual Financial Statements at June 30, 2010
Company Share capital Equity investment Name Head office
Type 1
Curr Amount Tot. number ofvoting shares/capi.interests
held
Held by Number of shares/cap.
interests
% (based on No. of shares/
cap. int.)
Group interest
Consolid.or valu-
ation method2
URUGUAY
AIRETCAL SA(5)
Montevideo
F UYU
9,198,000 9,198,000
Parmalat S.p.A.
9,198,000 100.000
100.000 EM
WISHAW TRADING SA(5)
Montevideo
F USD
30,000 230 Parmalat S.p.A.
Parmalat Paraguay sa
Parmalat de Venezuela ca
50
90
90
16.667
30.000
30.000
76.667
C
VENEZUELA
DISTRIBUIDORA MIXTA DE ALIMENTOS CA
(DISMALCA)(3)
Caracas
F VEF
3,300 3,300
Indu.Lac.Venezol. ca-Indulac
3,300 100.000
100.000 98.8202 L
INDUSTRIA LACTEA VENEZOLANA CA
(INDULAC)
Caracas
F VEF
34,720,471.6
343,108,495
Parmalat de Venezuela ca
343,108,495 98.820
98.820 98.8202 L
PARMALAT DE VENEZUELA CA
Caracas
F VEF
2,324,134
2,324,134
Parmalat S.p.A.
2,324,134 100.000
100.000 100.0000 L
QUESOS NACIONALES CA QUENACA
Caracas
F VEF
3,000,000
3,000,000
Indu.Lac.Venezol. ca-Indulac
3,000,000 100.000
100.000 98.8202 L
AFRICA
BOTSWANA
PARMALAT BOTSWANA (PTY) LTD
Gaborone
F BWP
3,000
2,900
Parmalat Africa S.p.A.
2,900 96.667
96.667 96.6670 L
MOZAMBIQUE
PARMALAT PRODUTOS ALIMENTARES
SARL
Matola
F MZM
57,841,500
536,415 Parmalat Africa S.p.A.
536,415 92.739
92.739
92.7390 L
SOUTH AFRICA
ANDIAMO AFRIKA (PTY) LTD(3)
Stellenbosch
F ZAR 100 51 Parmalat South Africa (Pty) Ltd 51 51.000
51.000 51.0000 L
PARMALAT SOUTH AFRICA (PTY) LTD
Stellenbosch
F ZAR
1,368,288.73
122,000,000 pref.
10,000 ord.
14,818,873
Parmalat Africa S.p.A.
Parmalat Africa S.p.A.
Parmalat S.p.A.
122,000,000
10,000
14,818,873
89.163
0.007
10.830
100.000 100.0000 L
NEW FARMERS DEVELOPMENT CO LTD
Durbanville
F ZAR 51,420,173 150,000 Parmalat South Africa (Pty) Ltd 150,000 0.292
0.292 C
SWAZILAND
PARMALAT SWAZILAND (PTY) LTD
Mbabane
F SZL
100
60
Parmalat Africa S.p.A.
60 60.000
60.000 60.0000 L
ZAMBIA
PARMALAT ZAMBIA LIMITED
Lusaka
F ZMK
27,281,000
19,505,915
Parmalat Africa S.p.A.
19,505,915 71.500
71.500 71.5000 L
ASIA
CHINA
PARMALAT (ZHAODONG) DAIRY CORP.
LTD(5)
Zhaodong
F CNY
56,517,260
53,301,760
Parmalat S.p.A.
53,301,760 94.311
94.311
C

1 C = Corporation; PC = Publicly traded corporation; LLP = Limited liability partnership; F = Foreign company 2 L = Company consolidated line by line; C = Company valued at cost; EM = Company valued by the equity method 3 Company in liquidation and subsidiaries 4 Company party to local composition-with-creditors proceedings and subsidiaries 5 Company under extraordinary administration or noncore company Parmalat Group – Condensed Consolidated Semiannual Financial Statements at June 30, 2010 101
Company Share capital Equity investment Name Head office
Type 1
Curr Amount Tot. number ofvoting shares/capi.interests
held
Held by Number of shares/cap.
interests
% (based on No. of shares/
cap. int.)
Group interest
Consolid.or valu-
ation method2
INDIA
SWOJAS ENERGY FOODS LIMITED in
liquidation(3)
Shivajinagar
F INR
309,626,500
21,624,311
Parmalat S.p.A.
21,624,311 69.840
69.840
C
THAILAND
PATTANA MILK CO LTD
Bangkok
F THB 50,000,000 2,500,000 Parmalat Australia Ltd
2,500,000 5.000
5.000 C
SINGAPORE
QBB SINGAPORE PTE LTD
F SGD 1,000 338 Parmalat Australia Ltd
338 33.800
33.800 C
OCEANIA
AUSTRALIA
PARMALAT AUSTRALIA LTD
South Brisbane
F AUD
222,627,759
22,314,388 ord.
200,313,371 pr.
Parmalat Belgium sa
Parmalat S.p.A.
22,314,388
200,313,371
100.000
0.000
100.000 100.0000 L
PARMALAT FOOD PRODUCTS PTY LTD
South Brisbane
F AUD 27,000,000 27,000,000 Parmalat Investments Pty Ltd 27,000,000 100.000
100.000 100.0000 L
PARMALAT INVESTMENTS PTY LTD
South Brisbane
F AUD 27,000,000 27,000,000 Parmalat S.p.A. 27,000,000 100.000
100.000 100.0000 L
QUANTUM DISTRIBUTION SERV. PTY LTD
South Brisbane
F AUD 8,000,000 8,000,000 Parmalat Australia Ltd
8,000,000 100.000
100.000 100.0000 L
PIPPAK PTY LTD
South Brisbane
F AUD 2,143,070 161 Parmalat Food Products Pty
Ltd
161 70.000
70.000 70.000 L
WOODVALE MOULDERS PTY LTD*
South Brisbane
F AUD 184,100 42,055 Parmalat Food Products Pty
Ltd
42,055 50.000
50.000 50.000 L
* Company consolidated line by line because the Group’s Parent Company has the power to appoint and dismiss the majority of the members of the Board of Directors.

102 Parmalat Group – Condensed Consolidated Semiannual Financial Statements at June 30, 2010
Companies Removed from the Parmalat Group in the First Half of 2010
Company Country Reason Consolidation method
Ecuadorian Foods Company B.V.I. Dissolved Line by line
Parmalat Austria Gmbh in liquidation Austria Dissolved Line by line
Jonicalatte S.p.A. Italy Sold Cost
signed: Raffaele Picella signed: Enrico Bondi Chairman Chief Executive Officer

Certification of the Condensed Consolidated Semiannual Financial Statements 103
Certification of the Condensed Consolidated Semiannual Financial Statements Pursuant to Article 154-bis, Section 5, of Legislative Decree No. 58/98, as Amended We, the undersigned, Enrico Bondi, in my capacity as Chief Executive Officer, and Pier Luigi De Angelis, in my capacity as Corporate Accounting Documents Officer, of Parmalat S.p.A., taking into account the provisions of Article 154-bis, Sections 3 and 4, of Legislative Decree No. 58 of February 24, 1998, as amended,
CERTIFY
1. that the administrative and accounting procedures for the preparation of the condensed semiannual financial statements for the first half of 2010 are adequate in light of the characteristics of the business enterprise and were effectively applied. The process of assessing the adequacy of the administrative and accounting procedures for the preparation of the condensed semiannual financial statements at June 30, 2010 was carried out consistent with the Internal Control – Integrated Framework model published by the Committee of Sponsoring Organizations of the Treadway Commission, which constitutes a frame of reference generally accepted at the international level;
2. and that:
a) the condensed semiannual financial statements are consistent with the data in the Group’s
documents and accounting records; b) the condensed semiannual financial statements were prepared in accordance with the
International Financial Reporting Standards, as adopted by the European Union, and the statutes enacted to implement Legislative Decree No. 38/2005 and are suitable for providing a truthful and fair presentation of the balance sheet, income statement and financial position of the issuer company and all of the companies included in the scope of consolidation.
c) lastly, the Interim Report on Operations provides information about material events that occurred
during the first half of 2010 and their impact on the condensed semiannual financial statements, together with a description of the main risks and uncertainties for the remaining six months of the year and information about significant transactions with related parties, as required by Article 154-ter, Section 4, of Legislative Decree No. 58 of February 24, 1998.
July 29, 2010 The Chief Executive Officer The Corporate Accounting Documents Officer
104 Parmalat Group – Report of the Independent Auditors
Parmalat Group – Report of the Independent Auditors

Parmalat Group – Report of the Independent Auditors 105

106 Parmalat Group – Report of the Independent Auditors

Parmalat S.p.A.
Via delle Nazioni Unite 4 43044 Collecchio (Parma) - Italy
Tel. +39,0521,808,1 www.parmalat.com
Share Capital: 1,728,394,362 euros fully paid-in Parma R.E.A. No. 228069
Parma Company Register No. 04030970968 Tax I.D. and VAT No. 04030970968