Scheda tecnica stazione Davis Vantage Pro 2
18
Scheda tecnica stazione Davis Vantage Pro 2 Meteo Lazio Shop 1
Transcript of Scheda tecnica stazione Davis Vantage Pro 2

Scheda tecnica stazione Davis Vantage Pro 2
Meteo Lazio Shop
1
Indice1 Stazione Davis Vantage Pro 2 3
1.1 Il necessario per l’ installazione . . . . . . . . . . . . . . . . . . . . . . 3
2 Gruppo Sensori 32.1 Specifiche tecniche . . . . . . . . . . . . . . . . . . . . . . . . . . . . . 4
3 Gruppo di Ricezione e trasmissione 53.1 Modulo 1: CDR . . . . . . . . . . . . . . . . . . . . . . . . . . . . . . . 53.2 Modulo 2: ER . . . . . . . . . . . . . . . . . . . . . . . . . . . . . . . . 63.3 Il Raspberry Pi . . . . . . . . . . . . . . . . . . . . . . . . . . . . . . . 63.4 Moduli a confronto . . . . . . . . . . . . . . . . . . . . . . . . . . . . . 7
4 Manutenzione 7
2

1 Stazione Davis Vantage Pro 2
La stazione meteorologica Davis Vantage Pro 2 (Davis VP2) appartiene alla categoriadelle semi-professionali e si compone di:
1. Gruppo sensori, alimentato da un pannello solare integrato, posizionato all’ester-no;
2. Gruppo di ricezione e trasmissione, posizionato all’interno di un edificio.
I dati raccolti da questa stazione1 sono da ritenersi scientificamente validi e utilizzabiliper uno studio osservativo e climatologico della propria zona.
1.1 Il necessario per l’ installazione
per l’installazione sono necessari
• un luogo aperto a 360°, dove andrà posizionato il palo (alto almeno 2 metri edeventualmente provvisto di tiranti) che ospita i sensori. In ambiente urbano,tale luogo è necessariamente il tetto della propria abitazione; in ambiente extraurbano, si può optare per il campo aperto (a una distanza di almeno 10 metri daqualsiasi ostacolo verticale) su manto erboso. Non è necessario disporre di cor-rente elettrica nel luogo di installazione dei sensori: questi ultimi sono alimentatida pannello solare e sono provvisti di una batteria tampone.
• una stanza, all’interno di un edifico, per ospitare il gruppo di ricezione e trasmis-sione. Tale stanza deve disporre di corrente elettrica e connessione internet LANoppure Wi-Fi.
2 Gruppo Sensori
Il gruppo sensori effettua le misurazioni dei principali parametri meteorologici quali:
• temperatura;
• umidità relativa;
• precipitazioni (intensità e cumulate);
• direzione del vento;
• velocità del vento.
Opzionalmente, possono essere richiesti i sensori di:
• radiazione solare;
• indice UV.1purché sia installata a norma
3

Figura 1: Gruppo sensori Davis Vantage Pro 2
Esso va posizionato all’esterno in una zona aperta a 360° e ad una altezza di almeno 2metri dal pavimento sottostante. Il Gruppo sensori è alimentato da un pannello solareed è dotato di un’antenna per trasmettere i dati ad un ricevitore, ogni 2.5 secondi, conuna frequenza di 868 MHz. La distanza massima tra Gruppo sensori e ricevitore è di300 metri in campo aperto.
2.1 Specifiche tecniche
Si riportano di seguito le specifiche tecniche dei sensori.
Parametro Range Risoluzione AccuratezzaTemperatura −40÷ 65°C 0.1°C ±0.3°CUmidità relativa 1÷100% 1% ±2%Precipitazioni ∞ 0.2 mm ± (4%+0.2) mmDirezione Vento 1÷360° 1° ±3°Velocità Vento 0÷322 km/h 1 km/h ±3.2 km/h
Tabella 1: Range, risoluzione e accuratezza dei parametri misurati dal Gruppo sensori.
Parametro Tempo di campionamento (s) # pacchetti in 5 min.Temperatura 10 30Umidità relativa 50 6Precipitazioni 10 30Direzione Vento 2.5 120Velocità Vento 2.5 120
Tabella 2: Tempi di campionamento dei parametri misurati dal Gruppo sensori enumero di pacchetti dati inviati in 5 minuti.
4
3 Gruppo di Ricezione e trasmissione
Il Gruppo di ricezione e trasmissione, da collocarsi all’interno di un edificio, si occupadi ricevere i pacchetti dati dal Gruppo sensori, di elaborarli, archiviarli e inviarli on-linein tempo reale. Per il suo funzionamento sono necessari:
• due o una prese di corrente (rispettivamente, per il modulo CDR e ER);
• una connessione internet LAN oppure Wi-Fi (consumo ∼ 6 GigaByte/mese).
Si possono scegliere due tipologie di questo modulo, descritte nelle successive duesezioni.
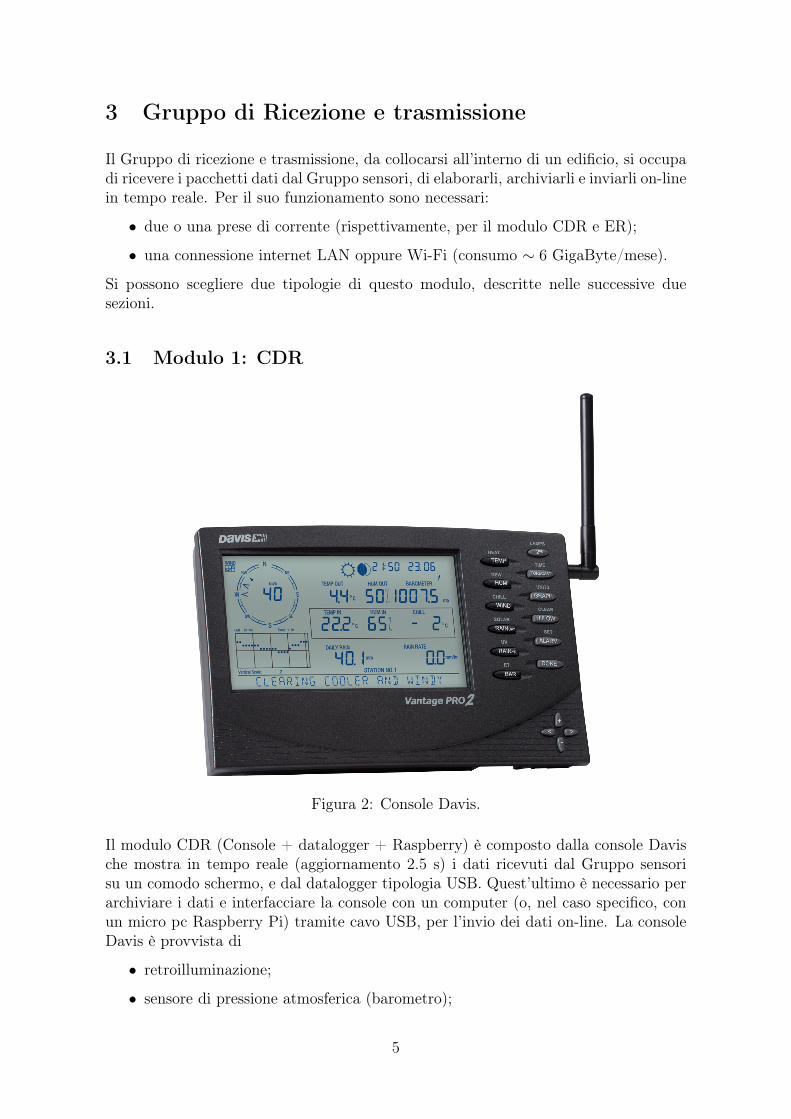
3.1 Modulo 1: CDR
Figura 2: Console Davis.
Il modulo CDR (Console + datalogger + Raspberry) è composto dalla console Davische mostra in tempo reale (aggiornamento 2.5 s) i dati ricevuti dal Gruppo sensorisu un comodo schermo, e dal datalogger tipologia USB. Quest’ultimo è necessario perarchiviare i dati e interfacciare la console con un computer (o, nel caso specifico, conun micro pc Raspberry Pi) tramite cavo USB, per l’invio dei dati on-line. La consoleDavis è provvista di
• retroilluminazione;
• sensore di pressione atmosferica (barometro);
5
• sensore di temperatura e umidità interne;
• allarmi vari per ciascun parametro, settabili dall’utente;
• previsioni per le prossime 24 ore basate sull’andamento della pressione atmosfe-rica.
• alimentazione elettrica, con batterie tampone in caso questa dovesse saltare.
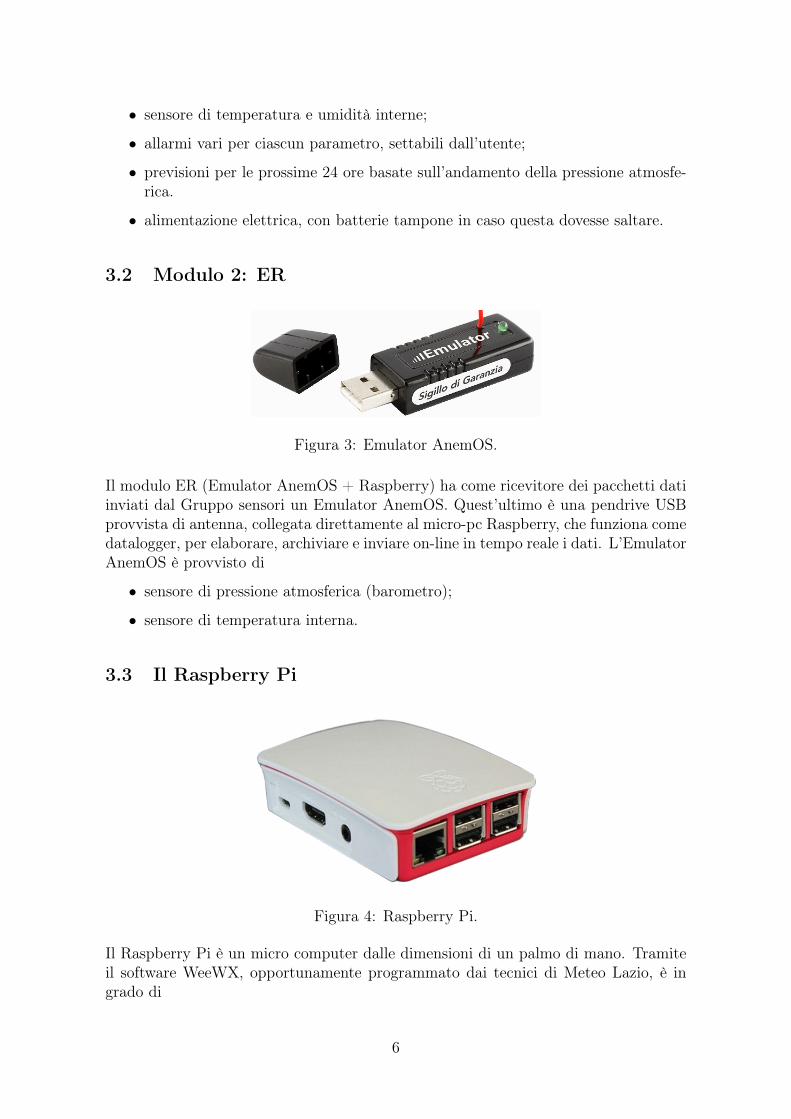
3.2 Modulo 2: ER
Figura 3: Emulator AnemOS.
Il modulo ER (Emulator AnemOS + Raspberry) ha come ricevitore dei pacchetti datiinviati dal Gruppo sensori un Emulator AnemOS. Quest’ultimo è una pendrive USBprovvista di antenna, collegata direttamente al micro-pc Raspberry, che funziona comedatalogger, per elaborare, archiviare e inviare on-line in tempo reale i dati. L’EmulatorAnemOS è provvisto di
• sensore di pressione atmosferica (barometro);
• sensore di temperatura interna.
3.3 Il Raspberry Pi
Figura 4: Raspberry Pi.
Il Raspberry Pi è un micro computer dalle dimensioni di un palmo di mano. Tramiteil software WeeWX, opportunamente programmato dai tecnici di Meteo Lazio, è ingrado di
6

• archiviare in maniera automatica i dati in un database;
• inviare i dati on-line in tempo reale;
• generare report NOAA mensili e annuali;
• generare grafici giornalieri, settimanali, mensili e annuali dei principali parametrimeteorologici, visualizzabili su una comoda pagina web;
• generare un API real time da cui poter prendere i dati.
Con il Raspberry Pi finisce l’era dei computer accesi 24 ore per gestire una stazionemeteo, e non è più necessario scaricare manualmente i dati a intervalli periodici. Sipossono richiedere ulteriori personalizzazioni per la pagina web su cui appaiono i dation-line.
3.4 Moduli a confronto
Le principali differenze tra i moduli CDR e ER sono le seguenti:
• scegliere il modulo ER permette un risparmio di circa il 40%;
• il modulo ER non permette la visualizzazione dei dati su uno schermo, a diffe-renza del modulo CDR;
• con il modulo ER la ricezione dei dati avviene solamente se è attiva la correnteelettrica: in caso di sua assenza, i dati smettono di essere ricevuti; il moduloCDR è invece provvisto di batterie tampone che permettono di registrare i datianche se la corrente dovesse venire a mancare.
4 Manutenzione
La manutenzione ordinaria prevede:
• la sostituzione della batteria tampone all’interno del Gruppo sensori ogni 2 annicirca;
• di effettuare la pulizia dei sensori ogni 1 anno circa, per garantirne prestazioniottimali e la durata nel tempo;
• la sostituzione delle batterie nella console (nel caso si sia scelto il modulo CDR)ogni 1 anno circa.
7

Po
we
rS
ta
tu
sD
SL
WL
AN
12
34
LA
NIn
te
rn
et
Figura5:
Schemadi
unatipica
installazion
e.
8

(510) 732-9229 FAX (510) 670-0589 sales@davis instruments .com www.davis instruments .com3465 Diablo Ave., Hayward, CA 94545-27783465 Diablo Ave., Hayward, CA 94545-2778 USA®
WIRELESS VANTAGE PRO2™
N
S
W E
N E
S E
N W
SWC H IL L
W IN D
R A IN R AT E
in /h r
T E M P O U T
H U M IN
H U M O U T
DA ILY R A IN
in
T E M P IN
in m b
B A RO M E T E R
S TAT IO N N O.1
F
F
p m
M P H
L a st 2 4h rs h rE ve ry 1
N
W
S
E
N
6152 61626153 6163
Wireless Vantage Pro2™ & Vantage Pro2™ Plus Stations
(Including Fan-Aspirated Models)
Vantage Pro2™ (6152, 6153) and Vantage Pro2™ Plus (6162, 6163) Wireless Weather Stations include two components: the Integrated Sensor Suite (ISS) which houses and manages the external sensor array, and the console which provides the user interface, data display, and calculations. The ISS and Vantage Pro2 console communicate via an FCC-certified, license-free, spread-spectrum frequency-hopping (FHSS) transmitter and receiver. User-selectable transmitter ID codes allow up to eight stations to coexist in the same geographic area. The frequency hopping spread spectrum technology provides greater communication strength over longer distances and areas of weaker reception. The Wireless Vantage Pro2 Plus weather station includes two additional sensors that are optional on the Vantage Pro2: the UV sensor and the solar radiation sensor.
The console may be powered by batteries or by the included AC-power adapter. The wireless ISS is solar powered with a battery backup. Use WeatherLink® for Vantage Pro2 and Vantage Vue® to let your weather station interface with a computer, to log weather data, and to upload weather information to the internet.
The 6152 and 6162 rely on passive shielding to reduce solar-radiation induced temperature errors in the outside temperature sensor readings. The Fan-aspirated 6153 and 6163 combine passive shielding with a solar-powered fan that draws outside air in over the temperature and humidity sensors, providing a much more accurate temperature reading than that available using passive shielding alone.
In tegrated Sensor Sui te ( ISS)(Includes product numbers: 6152, 6153, 6162, 6163, 6322, 6323, 6327 & 6328)
Operating Temperature . . . . . . . . . . . . . . . . . . . . . . . . . . -40° to +150°F (-40° to +65°C)
Non-operating Temperature . . . . . . . . . . . . . . . . . . . . . . . -40° to +158°F (-40° to +70°C)
Current Draw (ISS SIM only) . . . . . . . . . . . . . . . . . . . . . . 0.14 mA (average), 30 mA (peak) at 4 to 6 VDC
Solar Power Panel . . . . . . . . . . . . . . . . . . . . . . . . . . . . . . 0.5 Watts (ISS SIM), plus 0.75 Watts (Fan-Aspirated)
Battery (ISS SIM /Fan-Aspirated) . . . . . . . . . . . . . . . . . . . CR-123 3-Volt Lithium cell / 2 - 1.2 Volt NiMH C-cells
Battery Life (3-Volt Lithium cell) . . . . . . . . . . . . . . . . . . . . 8 months without sunlight - greater than 2 years depending on solar charging
Battery Life (NiMH C-cells, Fan-Aspirated) . . . . . . . . . . . . Up to 2 years
Fan Aspiration Rate (Fan-Aspirated only)
Intake Flow Rate, full sun . . . . . . . . . . . . . . . . . . . . . 190 feet/min. (0.9 m/s)
Intake Flow Rate, battery only . . . . . . . . . . . . . . . . . . 80 feet/min. (0.4 m/s)
Sensor Chamber Flow Rate, full sun . . . . . . . . . . . . . 500 feet/min. (2.5 m/s)
Sensor Chamber Flow Rate, battery only . . . . . . . . . 180 feet/min. (0.9 m/s)
Connectors, Sensor . . . . . . . . . . . . . . . . . . . . . . . . . . . . . Modular RJ-11
Cable Type . . . . . . . . . . . . . . . . . . . . . . . . . . . . . . . . . . . 4-conductor, 26 AWG
Cable Length, Anemometer . . . . . . . . . . . . . . . . . . . . . . . 40 feet (12 m) (included) 240 feet (73 m) (maximum recommended)
Note: Maximum displayable wind decreases as the length of cable increases. At 140’ (42 m) of cable, the maximum wind speed displayed is 135 mph (60 m/s); at 240’ (73 m), the maximum wind speed displayed is 100 mph (34 m/s).
Wind Speed Sensor . . . . . . . . . . . . . . . . . . . . . . . . . . . . Solid state magnetic sensor
Wind Direction Sensor . . . . . . . . . . . . . . . . . . . . . . . . . . Wind vane with potentiometer
Rain Collector Type . . . . . . . . . . . . . . . . . . . . . . . . . . . . Tipping bucket, 0.01" per tip (0.2 mm with metric rain adapter), 33.2 in2 (214 cm2) collection area
Temperature Sensor Type . . . . . . . . . . . . . . . . . . . . . . . . PN Junction Silicon Diode
Relative Humidity Sensor Type . . . . . . . . . . . . . . . . . . . . Film capacitor element
Housing Material . . . . . . . . . . . . . . . . . . . . . . . . . . . . . . . UV-resistant ABS, polypropylene
DS6152_62_53_63 (Rev Z 12/7/18)

2Wireless Vantage Pro2™
ISS Dimensions (not including anemometer or bird spikes):
Vantage Pro2 with Standard Rad Shield. . . . . . . . . . . . . . 14.0" x 9.4" x 14.5" (356 mm x 239 mm x 368 mm)
Vantage Pro2 with Fan-Aspirated Rad Shield . . . . . . . . . . 20.8" x 9.4" x 16.0" (528 mm x 239 mm x 406 mm)
Vantage Pro2 Plus with Standard Rad Shield . . . . . . . . . 14.3" x 9.7" x 14.5" (363 mm x 246 mm x 368 mm)
Vantage Pro2 Plus with Fan-Aspirated Rad Shield . . . . . . 21.1" x 9.7" x 16.0" (536 mm x 246 mm x 406 mm)
Console(Includes product number 6312)
Console Operating Temperature . . . . . . . . . . . . . . . . . . . +32° to +140°F (0° to +60°C)
Non-Operating (Storage) Temperature . . . . . . . . . . . . . . . +14° to +158°F (-10° to +70°C)
Current Draw . . . . . . . . . . . . . . . . . . . . . . . . . . . . . . . . . 0.9 mA average, 30 mA peak, (add 120 mA for display lamps, add 0.125 mA for each optional wireless transmitter received by the console) at 4 - 6 VDC
AC Power Adapter . . . . . . . . . . . . . . . . . . . . . . . . . . . . . . 5 VDC, 300 mA, regulated
Batteries . . . . . . . . . . . . . . . . . . . . . . . . . . . . . . . . . . . . . 3 C-cells
Battery Life . . . . . . . . . . . . . . . . . . . . . . . . . . . . . . . . . . . up to 9 months
Connectors . . . . . . . . . . . . . . . . . . . . . . . . . . . . . . . . . . . Modular RJ-11
Housing Material . . . . . . . . . . . . . . . . . . . . . . . . . . . . . . . UV-resistant ABS plastic
Console Display Type . . . . . . . . . . . . . . . . . . . . . . . . . . . LCD Transflective
Display Backlight . . . . . . . . . . . . . . . . . . . . . . . . . . . . . . . LEDs
Console Dimensions
Console with antenna down (L x H x D) . . . . . . . . . . 10.625" x 6.125" x 1.625" (270 mm x 156 mm x 41 mm)Console with antenna extended up (L x H x D) . . . . . 10.625" x 9.625" x 1.625" (270 mm x 245 mm x 41 mm)Display (L x H) . . . . . . . . . . . . . . . . . . . . . . . . . . . . . 5.94" x 3.375" (151 mm x 86 mm)
Weight (with batteries) . . . . . . . . . . . . . . . . . . . . . . . . . . . 1.88 lbs. (.85 kg)
Data Displayed on Console
Data display categories are listed with General first, then in alphabetical order.
GeneralHistorical Data . . . . . . . . . . . . . . . . . . . . . . . . . . . . . . . . . Includes the past 24 values listed unless otherwise noted; all can be cleared and
all totals reset
Daily Data . . . . . . . . . . . . . . . . . . . . . . . . . . . . . . . . . . . . Includes the earliest time of occurrence of highs and lows; period begins/ends at 12:00 am
Monthly Data . . . . . . . . . . . . . . . . . . . . . . . . . . . . . . . . . . Period begins/ends at 12:00 am on the first of the month
Yearly Data . . . . . . . . . . . . . . . . . . . . . . . . . . . . . . . . . . . Period begins/ends at 12:00 am on the first of January unless otherwise noted
Current Display Data . . . . . . . . . . . . . . . . . . . . . . . . . . . . Current display data describes the current reading for each weather variable. In most cases, the variable lists the most recently updated reading or calculation. Some current variable displays can be adjusted so there is an offset for the reading
Current Graph Data . . . . . . . . . . . . . . . . . . . . . . . . . . . . . Current graph data appears in the right-most column in the console graph and represents the latest value within the last period on the graph; totals can be set or reset. Display intervals vary. Examples include: Instant, 15-min., and Hourly Reading; Daily, Monthly, High and Low
Graph Time Interval . . . . . . . . . . . . . . . . . . . . . . . . . . . . 1 min., 10 min., 15 min., 1 hour, 1 day, 1 month, 1 year (user-selectable, availability depends upon variable selected)
Graph Time Span . . . . . . . . . . . . . . . . . . . . . . . . . . . . . . . 24 Intervals + Current Interval (see Graph Intervals to determine time span)
Graph Variable Span (Vertical Scale) . . . . . . . . . . . . . . . . Automatic (varies depending upon data range); Maximum and Minimum value in range appear in ticker
Alarm Indication . . . . . . . . . . . . . . . . . . . . . . . . . . . . . . . . Alarms sound for only 2 minutes (time alarm is always 1 minute) if operating on battery power. Alarm message is displayed in ticker as long as threshold is met or exceeded. Alarms can be silenced (but not cleared) by pressing the DONE key.
Transmission Interval . . . . . . . . . . . . . . . . . . . . . . . . . . . . Varies with transmitter ID code from 2.25 seconds (#1=shortest), to 3 seconds (#8=longest)
Update Interval . . . . . . . . . . . . . . . . . . . . . . . . . . . . . . . . Varies with sensor - see individual sensor specs

3Wireless Vantage Pro2™
Barometric PressureResolution and Units. . . . . . . . . . . . . . . . . . . . . . . . . . . . 0.01" Hg, 0.1 mm Hg, 0.1 hPa/mb (user-selectable)
Range. . . . . . . . . . . . . . . . . . . . . . . . . . . . . . . . . . . . . . . 16.00" to 32.50" Hg, 410 to 820 mm Hg, 540 to 1100 hPa/mb
Elevation Range . . . . . . . . . . . . . . . . . . . . . . . . . . . . . . . -999’ to +15,000’ (-600 m to 4570 m) (Note that console screen limits entry of lower elevation to -999’ when using feet as elevation unit.)
Uncorrected Reading Accuracy. . . . . . . . . . . . . . . . . . . . ±0.03" Hg (±0.8 mm Hg, ±1.0 hPa/mb) (at room temperature)
Sea-Level Reduction Equation Used . . . . . . . . . . . . . . . . United States Method employed prior to use of current “R Factor” method
Equation Source . . . . . . . . . . . . . . . . . . . . . . . . . . . . . . . Smithsonian Meteorological Tables
Equation Accuracy . . . . . . . . . . . . . . . . . . . . . . . . . . . . . ±0.01" Hg (±0.3 mm Hg, ±0.3 hPa/mb)
Elevation Accuracy Required . . . . . . . . . . . . . . . . . . . . . ±10’ (3m) to meet equation accuracy specification
Overall Accuracy . . . . . . . . . . . . . . . . . . . . . . . . . . . . . . ±0.03" Hg (±0.8 mm Hg, ±1.0 hPa/mb)
Trend (change in 3 hours). . . . . . . . . . . . . . . . . . . . . . . . Change 0.06" (2 hPa/mb,1.5 mm Hg) = RapidlyChange 0.02" (0.7hPa/mb, 0.5 mm Hg)= Slowly
Trend Indication . . . . . . . . . . . . . . . . . . . . . . . . . . . . . . . 5 position arrow: Rising (rapidly or slowly), Steady, or Falling (rapidly or slowly)
Update Interval . . . . . . . . . . . . . . . . . . . . . . . . . . . . . . . . 1 minute or when console BAR key is pressed twice
Current Display . . . . . . . . . . . . . . . . . . . . . . . . . . . . . . . Instant
Current Graph Data . . . . . . . . . . . . . . . . . . . . . . . . . . . . Instant, 15-min., and Hourly Reading; Daily, Monthly, High and Low
Historical Graph Data . . . . . . . . . . . . . . . . . . . . . . . . . . . 15-min. and Hourly Reading; Daily, Monthly Highs and Lows
Alarms . . . . . . . . . . . . . . . . . . . . . . . . . . . . . . . . . . . . . . High Threshold from Current Trend for Storm Clearing (Rising TrendLow Threshold from Current Trend for Storm Warning (Falling Trend)
Range for Rising and Falling Trend Alarms . . . . . . . . . . . 0.01 to 0.25" Hg (0.1 to 6.4 mm Hg, 0.1 to 8.5 hPa/mb)
ClockResolution . . . . . . . . . . . . . . . . . . . . . . . . . . . . . . . . . . . 1 minute
Units . . . . . . . . . . . . . . . . . . . . . . . . . . . . . . . . . . . . . . . . Time: 12 or 24 hour format (user-selectable)
Date . . . . . . . . . . . . . . . . . . . . . . . . . . . . . . . . . . . . . . . . US or International format (user-selectable)
Accuracy . . . . . . . . . . . . . . . . . . . . . . . . . . . . . . . . . . . . ±8 seconds/month
Adjustments . . . . . . . . . . . . . . . . . . . . . . . . . . . . . . . . . . Time: Automatic Daylight Savings Time (for users in North America and Europe that observe it in AUTO mode, MANUAL setting available for all other areas) Date: Automatic Leap Year
Alarms . . . . . . . . . . . . . . . . . . . . . . . . . . . . . . . . . . . . . . Once per day at set time when active
Dewpoint (calculated)Resolution and Units. . . . . . . . . . . . . . . . . . . . . . . . . . . . 1°F or 1°C (user-selectable) °C is converted from °F rounded to the nearest 1°C
Range. . . . . . . . . . . . . . . . . . . . . . . . . . . . . . . . . . . . . . . -105° to +130°F (-76° to +54°C)
Accuracy . . . . . . . . . . . . . . . . . . . . . . . . . . . . . . . . . . . . ±2°F (±1°C) (typical)
Update Interval . . . . . . . . . . . . . . . . . . . . . . . . . . . . . . . . 10 to 12 seconds
Source . . . . . . . . . . . . . . . . . . . . . . . . . . . . . . . . . . . . . . World Meteorological Organization (WMO)
Equation Used . . . . . . . . . . . . . . . . . . . . . . . . . . . . . . . . WMO Equation with respect to saturation of moist air over water
Variables Used . . . . . . . . . . . . . . . . . . . . . . . . . . . . . . . . Instant Outside Temperature and Instant Outside Relative Humidity
Current Display Data . . . . . . . . . . . . . . . . . . . . . . . . . . . Instant Calculation
Current Graph Data . . . . . . . . . . . . . . . . . . . . . . . . . . . . Instant Calculation; Daily, Monthly High and Low
Historical Graph Data . . . . . . . . . . . . . . . . . . . . . . . . . . . Hourly Calculations; Daily, Monthly Highs and Lows
Alarms . . . . . . . . . . . . . . . . . . . . . . . . . . . . . . . . . . . . . . High and Low Threshold from Instant Calculation
Evapotranspiration (calculated, requires solar radiation sensor) Resolution and Units. . . . . . . . . . . . . . . . . . . . . . . . . . . . 0.01" or 0.1 mm (user-selectable)
Range. . . . . . . . . . . . . . . . . . . . . . . . . . . . . . . . . . . . . . . Daily to 32.67" (832.1 mm); Monthly & Yearly to 199.99" (1999.9 mm)
Accuracy . . . . . . . . . . . . . . . . . . . . . . . . . . . . . . . . . . . . Greater of 0.01" (0.25 mm) or ±5%, Reference: side-by-side comparison against a CIMIS ET weather station
Update Interval . . . . . . . . . . . . . . . . . . . . . . . . . . . . . . . . 1 hour
Calculation and Source . . . . . . . . . . . . . . . . . . . . . . . . . . Modified Penman Equation as implemented by CIMIS (California Irrigation Management Information System) including Net Radiation calculation
Current Display Data . . . . . . . . . . . . . . . . . . . . . . . . . . . Latest Hourly Total Calculation
Current Graph Data . . . . . . . . . . . . . . . . . . . . . . . . . . . . Latest Hourly Total Calculation, Daily, Monthly, Yearly Total
Historical Graph Data . . . . . . . . . . . . . . . . . . . . . . . . . . . Hourly, Daily, Monthly, Yearly Totals
Alarm . . . . . . . . . . . . . . . . . . . . . . . . . . . . . . . . . . . . . . . High Threshold from Latest Daily Total Calculation

4Wireless Vantage Pro2™
ForecastVariables Used. . . . . . . . . . . . . . . . . . . . . . . . . . . . . . . . . Barometric Reading & Trend, Wind Speed & Direction, Rainfall, Temperature,
Humidity, Latitude & Longitude, Time of Year
Update Interval . . . . . . . . . . . . . . . . . . . . . . . . . . . . . . . . 1 hour
Display Format . . . . . . . . . . . . . . . . . . . . . . . . . . . . . . . . . Icons on top center of display; detailed message in ticker at bottom
Variables Predicted . . . . . . . . . . . . . . . . . . . . . . . . . . . . . Sky Condition, Precipitation, Temperature Changes, Wind Direction and Speed
Heat Index (calculated)Resolution and Units . . . . . . . . . . . . . . . . . . . . . . . . . . . . 1°F or 1°C (user-selectable) °C is converted from °F rounded to the nearest 1°C
Range . . . . . . . . . . . . . . . . . . . . . . . . . . . . . . . . . . . . . . . -40° to +165°F (-40° to +74°C)
Accuracy . . . . . . . . . . . . . . . . . . . . . . . . . . . . . . . . . . . . . ±2°F (±1°C) (typical)
Update Interval . . . . . . . . . . . . . . . . . . . . . . . . . . . . . . . . 10 to 12 seconds
Source . . . . . . . . . . . . . . . . . . . . . . . . . . . . . . . . . . . . . . . United States National Weather Service (NWS)/NOAA
Formulation Used. . . . . . . . . . . . . . . . . . . . . . . . . . . . . . . Steadman (1979) modified by US NWS/NOAA and Davis Instruments to increase range of use
Variables Used. . . . . . . . . . . . . . . . . . . . . . . . . . . . . . . . . Instant Outside Temperature and Instant Outside Relative Humidity
Current Display Data . . . . . . . . . . . . . . . . . . . . . . . . . . . . Instant Calculation
Current Graph Data . . . . . . . . . . . . . . . . . . . . . . . . . . . . . Instant Calculation; Daily, Monthly High
Historical Graph Data . . . . . . . . . . . . . . . . . . . . . . . . . . . . Hourly Calculations; Daily, Monthly Highs
Alarm . . . . . . . . . . . . . . . . . . . . . . . . . . . . . . . . . . . . . . . . High Threshold from Instant Calculation
HumidityInside Relative Humidity (sensor located in console)
Resolution and Units. . . . . . . . . . . . . . . . . . . . . . . . . 1%Range. . . . . . . . . . . . . . . . . . . . . . . . . . . . . . . . . . . . 1 to 100% RHAccuracy . . . . . . . . . . . . . . . . . . . . . . . . . . . . . . . . . ±2% Update Interval . . . . . . . . . . . . . . . . . . . . . . . . . . . . . 1 minuteCurrent Display Data . . . . . . . . . . . . . . . . . . . . . . . . Instant (user-adjustable offset available)Current Graph Data . . . . . . . . . . . . . . . . . . . . . . . . . Instant; Hourly Reading; Daily, Monthly High and LowHistorical Graph Data . . . . . . . . . . . . . . . . . . . . . . . . Hourly Readings; Daily, Monthly Highs and LowsAlarms . . . . . . . . . . . . . . . . . . . . . . . . . . . . . . . . . . . High and Low Threshold from Instant Reading
Outside Relative Humidity (sensor located in ISS)
Resolution and Units. . . . . . . . . . . . . . . . . . . . . . . . . 1%Range. . . . . . . . . . . . . . . . . . . . . . . . . . . . . . . . . . . . 1 to 100% RHAccuracy . . . . . . . . . . . . . . . . . . . . . . . . . . . . . . . . . ±2% Drift . . . . . . . . . . . . . . . . . . . . . . . . . . . . . . . . . . . . . <0.25% per yearUpdate Interval . . . . . . . . . . . . . . . . . . . . . . . . . . . . . 50 seconds to 1 minute Current Display Data . . . . . . . . . . . . . . . . . . . . . . . . Instant (user-adjustable offset available)Current Graph Data . . . . . . . . . . . . . . . . . . . . . . . . . Instant; Hourly Reading; Daily, Monthly High and LowHistorical Graph Data . . . . . . . . . . . . . . . . . . . . . . . . Hourly Readings; Daily, Monthly Highs and LowsAlarms . . . . . . . . . . . . . . . . . . . . . . . . . . . . . . . . . . . High and Low Threshold from Instant Reading
Extra Outside Relative Humidity (sensor located inside Temperature/Humidity Station)
Resolution and Units. . . . . . . . . . . . . . . . . . . . . . . . . 1%Range. . . . . . . . . . . . . . . . . . . . . . . . . . . . . . . . . . . . 1 to 100% RHAccuracy . . . . . . . . . . . . . . . . . . . . . . . . . . . . . . . . . ±2%Drift . . . . . . . . . . . . . . . . . . . . . . . . . . . . . . . . . . . . . <0.25% per yearUpdate Interval . . . . . . . . . . . . . . . . . . . . . . . . . . . . . 50 seconds to 1 minuteCurrent Display Data . . . . . . . . . . . . . . . . . . . . . . . . Instant Reading (user adjustable) Alarms . . . . . . . . . . . . . . . . . . . . . . . . . . . . . . . . . . . High and Low Threshold from Instant Reading

5Wireless Vantage Pro2™
Leaf Wetness (requires leaf wetness sensor)Resolution . . . . . . . . . . . . . . . . . . . . . . . . . . . . . . . . . . . 1
Range. . . . . . . . . . . . . . . . . . . . . . . . . . . . . . . . . . . . . . . 0 to 15
Dry/Wet Threshold . . . . . . . . . . . . . . . . . . . . . . . . . . . . . User-selectable
Accuracy . . . . . . . . . . . . . . . . . . . . . . . . . . . . . . . . . . . . ±0.5
Update Interval . . . . . . . . . . . . . . . . . . . . . . . . . . . . . . . . 46 to 54 seconds
Current Graph Data . . . . . . . . . . . . . . . . . . . . . . . . . . . . Instant Reading; Daily High and Low; Monthly High
Historical Graph Data . . . . . . . . . . . . . . . . . . . . . . . . . . . Hourly Readings; Daily Highs and Lows; Monthly Highs
Alarms . . . . . . . . . . . . . . . . . . . . . . . . . . . . . . . . . . . . . . High and Low Thresholds from Instant Reading
Moon PhaseConsole Resolution. . . . . . . . . . . . . . . . . . . . . . . . . . . . . 1/8 (12.5%) of a lunar cycle, 1/4 (25%) of lighted face on console
WeatherLink Resolution . . . . . . . . . . . . . . . . . . . . . . . . . 0.09% of a lunar cycle, 0.18% of lighted face maximum (depends on screen resolution)
Range. . . . . . . . . . . . . . . . . . . . . . . . . . . . . . . . . . . . . . . New Moon, Waxing Crescent, First Quarter, Waxing Gibbous, Full Moon, Waning Gibbous, Last Quarter, Waning Crescent
Accuracy . . . . . . . . . . . . . . . . . . . . . . . . . . . . . . . . . . . . ±38 minutes
RainfallResolution and Units. . . . . . . . . . . . . . . . . . . . . . . . . . . . 0.01" or 0.2 mm (user-selectable) (1 mm at totals 2000 mm)
Daily/Storm Rainfall Range . . . . . . . . . . . . . . . . . . . . . . . 0 to 99.99" (0 to 999.8 mm)
Monthly/Yearly/Total Rainfall Range . . . . . . . . . . . . . . . . 0 to 199.99" (0 to 6553 mm)
Accuracy . . . . . . . . . . . . . . . . . . . . . . . . . . . . . . . . . . . . For rain rates up to 4"/hr (100 mm/hr): ±4% of total or ± one tip of the bucket (0.01"/0.2mm), whichever is greater.
Update Interval . . . . . . . . . . . . . . . . . . . . . . . . . . . . . . . . 20 to 24 seconds
Storm Determination Method . . . . . . . . . . . . . . . . . . . . . 0.02" (0.5 mm) begins a storm event, 24 hours without further accumulation ends a storm event
Current Display Data . . . . . . . . . . . . . . . . . . . . . . . . . . . Totals for Past 15-min
Current Graph Data . . . . . . . . . . . . . . . . . . . . . . . . . . . . Totals for Past 15-min, Past 24-hour, Daily, Monthly, Yearly (start date user-selectable) and Storm (with begin date); Umbrella is displayed when 15-minute total exceeds zero
Historical Graph Data . . . . . . . . . . . . . . . . . . . . . . . . . . . Totals for 15-min, Daily, Monthly, Yearly (start date user-selectable) and Storm (with begin and end dates)
Alarms . . . . . . . . . . . . . . . . . . . . . . . . . . . . . . . . . . . . . . High Threshold from Latest Flash Flood (15-min. total, default is 0.50", 12.7 mm), 24-Hour Total, Storm Total,
Range for Rain Alarms . . . . . . . . . . . . . . . . . . . . . . . . . . 0 to 99.99" (0 to 999.7 mm)
Rain RateResolution and Units. . . . . . . . . . . . . . . . . . . . . . . . . . . . 0.01" or 0.1 mm (user-selectable) at typical rates (see Fig. 1 and 2)
Range. . . . . . . . . . . . . . . . . . . . . . . . . . . . . . . . . . . . . . . 0, 0.04"/hr (1 mm/hr) to 82"/hr (0 to 2090 mm/hr)
Accuracy . . . . . . . . . . . . . . . . . . . . . . . . . . . . . . . . . . . . ±5% for rates less than 5" per hour (127 mm/hr)
Update Interval . . . . . . . . . . . . . . . . . . . . . . . . . . . . . . . . 20 to 24 seconds
Calculation Method . . . . . . . . . . . . . . . . . . . . . . . . . . . . . Measures time between successive tips of tipping bucket. Elapsed time greater than 15 minutes or only one tip of the rain collector constitutes a rain rate of zero.
Current Display Data . . . . . . . . . . . . . . . . . . . . . . . . . . . Instant
Current Graph Data . . . . . . . . . . . . . . . . . . . . . . . . . . . . Instant and 1-min. Reading; Hourly, Daily, Monthly and Yearly High
Historical Graph Data . . . . . . . . . . . . . . . . . . . . . . . . . . . 1-min Reading; Hourly, Daily, Monthly and Yearly Highs
Alarm . . . . . . . . . . . . . . . . . . . . . . . . . . . . . . . . . . . . . . . High Threshold from Instant Reading
Soil Moisture (requires soil moisture sensor)Resolution . . . . . . . . . . . . . . . . . . . . . . . . . . . . . . . . . . . 1 cb
Range. . . . . . . . . . . . . . . . . . . . . . . . . . . . . . . . . . . . . . . 0 to 200 cb
Update Interval . . . . . . . . . . . . . . . . . . . . . . . . . . . . . . . . 77 to 90 seconds
Current Graph Data . . . . . . . . . . . . . . . . . . . . . . . . . . . . Instant Reading; Daily and Monthly High and Low
Historical Graph Data . . . . . . . . . . . . . . . . . . . . . . . . . . . Hourly Readings; Daily and Monthly Highs and Lows
Alarms . . . . . . . . . . . . . . . . . . . . . . . . . . . . . . . . . . . . . . High and Low Thresholds from Instant Reading

6Wireless Vantage Pro2™
Solar Radiation (requires solar radiation sensor)Resolution and Units . . . . . . . . . . . . . . . . . . . . . . . . . . . . 1 W/m2
Range . . . . . . . . . . . . . . . . . . . . . . . . . . . . . . . . . . . . . . . 0 to 1800 W/m2
Accuracy . . . . . . . . . . . . . . . . . . . . . . . . . . . . . . . . . . . . . ±5% of full scale (Reference: Eppley PSP at 1000 W/m2)
Drift . . . . . . . . . . . . . . . . . . . . . . . . . . . . . . . . . . . . . . . . . up to ±2% per year
Cosine Response . . . . . . . . . . . . . . . . . . . . . . . . . . . . . . . ±3% for angle of incidence from 0° to 75°
Temperature Coefficient . . . . . . . . . . . . . . . . . . . . . . . . . . -0.067% per °F (-0.12% per °C); reference temperature = 77°F (25 °C)
Update Interval . . . . . . . . . . . . . . . . . . . . . . . . . . . . . . . . 50 seconds to 1 minute (5 minutes when dark)
Current Graph Data . . . . . . . . . . . . . . . . . . . . . . . . . . . . . Instant Reading and Hourly Average; Daily, Monthly High
Historical Graph Data . . . . . . . . . . . . . . . . . . . . . . . . . . . . Hourly Average, Daily, Monthly Highs
Alarm . . . . . . . . . . . . . . . . . . . . . . . . . . . . . . . . . . . . . . . . High Threshold from Instant Reading
Sunrise and SunsetResolution . . . . . . . . . . . . . . . . . . . . . . . . . . . . . . . . . . . . 1 minute
Accuracy . . . . . . . . . . . . . . . . . . . . . . . . . . . . . . . . . . . . . ±1 minute
Reference . . . . . . . . . . . . . . . . . . . . . . . . . . . . . . . . . . . . United States Naval Observatory
TemperatureInside Temperature (sensor located in console)
Resolution and Units. . . . . . . . . . . . . . . . . . . . . . . . . Current Data: 0.1°F or 1°F or 0.1°C or 1°C (user-selectable) °C is converted from °F rounded to the nearest 1°CHistorical Data and Alarms: 1°F or 1°C (user-selectable)
Range. . . . . . . . . . . . . . . . . . . . . . . . . . . . . . . . . . . . +32° to +140°F (0° to +60°C)Sensor Accuracy . . . . . . . . . . . . . . . . . . . . . . . . . . . ±0.5°F (±0.3°C)Update Interval . . . . . . . . . . . . . . . . . . . . . . . . . . . . . 1 minuteCurrent Display Data . . . . . . . . . . . . . . . . . . . . . . . . Instant (user-adjustable offset available)Current Graph Data . . . . . . . . . . . . . . . . . . . . . . . . . Instant Reading; Daily and Monthly High and LowHistorical Graph Data . . . . . . . . . . . . . . . . . . . . . . . . Hourly Readings; Daily and Monthly Highs and LowsAlarms . . . . . . . . . . . . . . . . . . . . . . . . . . . . . . . . . . . High and Low Thresholds from Instant Reading
Outside Temperature (sensor located in ISS)
Resolution and Units. . . . . . . . . . . . . . . . . . . . . . . . . Current Data: 0.1°F or 1°F or 0.1°C or 1°C (user-selectable) nominal °C is converted from °F rounded to the nearest 1°C Historical Data and Alarms: 1°F or 1°C (user-selectable)
Range. . . . . . . . . . . . . . . . . . . . . . . . . . . . . . . . . . . . -40° to +150°F (-40° to +65°C)Sensor Accuracy . . . . . . . . . . . . . . . . . . . . . . . . . . . ±0.5°F (±0.3°C)Radiation Induced Error (Passive Shield) . . . . . . . . . +4°F (2°C) at solar noon (insolation = 1040 W/m2, avg. wind speed 2 mph (1 ms))
(reference: RM Young Model 43408 Fan-Aspirated Radiation Shield)Radiation Induced Error (Fan-Aspirated Shield) . . . . +0.6°F (0.3°C) at solar noon (insolation = 1040 W/m2, avg. wind speed 2 mph
(1 m/s)) (reference: RM Young Model 43408 Fan-Aspirated Radiation Shield)Update Interval . . . . . . . . . . . . . . . . . . . . . . . . . . . . . 10 to 12 secondsCurrent Display Data . . . . . . . . . . . . . . . . . . . . . . . . Instant (user-adjustable offset available)Current Graph Data . . . . . . . . . . . . . . . . . . . . . . . . . Instant Reading; Daily, Monthly, Yearly High and LowHistorical Graph Data . . . . . . . . . . . . . . . . . . . . . . . . Hourly Readings; Daily, Monthly, Yearly Highs and LowsAlarms . . . . . . . . . . . . . . . . . . . . . . . . . . . . . . . . . . . High and Low Thresholds from Instant Reading
Extra Temperature Probes
Resolution and Units. . . . . . . . . . . . . . . . . . . . . . . . . Current Data: 1°F or 1°C (user-selectable) °C is converted from °F rounded to the nearest 1°CHistorical Data and Alarms: 1°F or 1°C (user-selectable)
Range. . . . . . . . . . . . . . . . . . . . . . . . . . . . . . . . . . . . -40° to +150°F (-40° to +65°C)Sensor Accuracy . . . . . . . . . . . . . . . . . . . . . . . . . . . ±1°F (±0.5°C) (typical) See Fig. 3Update Interval . . . . . . . . . . . . . . . . . . . . . . . . . . . . . 10 to 12 seconds (77 to 90 seconds for Leaf Wetness/Temperature and Soil
Moisture/Temperature Stations)Current Display Data . . . . . . . . . . . . . . . . . . . . . . . . Instant Reading (user-adjustable offset available)Alarms . . . . . . . . . . . . . . . . . . . . . . . . . . . . . . . . . . . High and Low Thresholds from Instant Reading

7Wireless Vantage Pro2™
Temperature Humidity Sun Wind Index (requires solar radiation sensor)Resolution and Units. . . . . . . . . . . . . . . . . . . . . . . . . . . . 1°F or 1°C (user-selectable) °C is converted from °F rounded to the nearest 1°C
Range. . . . . . . . . . . . . . . . . . . . . . . . . . . . . . . . . . . . . . . -90° to +165°F (-68° to +74°C)
Accuracy . . . . . . . . . . . . . . . . . . . . . . . . . . . . . . . . . . . . ±4°F (±2°C) (typical)
Update Interval . . . . . . . . . . . . . . . . . . . . . . . . . . . . . . . . 10 to 12 seconds
Sources and Formulation Used . . . . . . . . . . . . . . . . . . . . United States National Weather Service (NWS)/NOAASteadman (1979) modified by US NWS/NOAA and Davis Instruments to increase range of use and allow for cold weather use
Variables Used . . . . . . . . . . . . . . . . . . . . . . . . . . . . . . . . Instant Outside Temperature, Instant Outside Relative Humidity, 10-minute Average Wind Speed, 10-minute Average Solar Radiation
Formulation Description . . . . . . . . . . . . . . . . . . . . . . . . . Uses Heat Index as base temperature, affects of wind and solar radiation are either added or subtracted from this base to give an overall effective temperature
Current Graph Data . . . . . . . . . . . . . . . . . . . . . . . . . . . . Instant and Hourly Calculation; Daily, Monthly High
Historical Graph Data . . . . . . . . . . . . . . . . . . . . . . . . . . . Hourly Calculation; Daily, Monthly Highs
Alarm . . . . . . . . . . . . . . . . . . . . . . . . . . . . . . . . . . . . . . . High Threshold from Instant Reading
Ultra Violet (UV) Radiation Dose (requires UV sensor)Resolution and Units. . . . . . . . . . . . . . . . . . . . . . . . . . . . 0.1 MEDs to 19.9 MEDs; 1 MED above 19.9 MEDS
Range. . . . . . . . . . . . . . . . . . . . . . . . . . . . . . . . . . . . . . . 0 to 199 MEDs
Accuracy . . . . . . . . . . . . . . . . . . . . . . . . . . . . . . . . . . . . ±5% of daily total
Drift . . . . . . . . . . . . . . . . . . . . . . . . . . . . . . . . . . . . . . . . up to ±2% per year
Update Interval . . . . . . . . . . . . . . . . . . . . . . . . . . . . . . . . 50 seconds to 1 minute (5 minutes when dark)
Current Graph Data . . . . . . . . . . . . . . . . . . . . . . . . . . . . Latest Daily Total (user resettable at any time from Current Screen)
Historical Graph Data . . . . . . . . . . . . . . . . . . . . . . . . . . . Hourly, Daily Totals (user reset from Current Screen does not affect these values)
Alarm . . . . . . . . . . . . . . . . . . . . . . . . . . . . . . . . . . . . . . . High Threshold from Daily Total
Alarm Range. . . . . . . . . . . . . . . . . . . . . . . . . . . . . . . . . . 0 to 19.9 MEDs
Ultra Violet (UV) Radiation Index (requires UV sensor)Resolution and Units. . . . . . . . . . . . . . . . . . . . . . . . . . . . 0.1 Index
Range. . . . . . . . . . . . . . . . . . . . . . . . . . . . . . . . . . . . . . . 0 to 16 Index
Accuracy . . . . . . . . . . . . . . . . . . . . . . . . . . . . . . . . . . . . ±5% of full scale (Reference: Yankee UVB-1 at UV index 10 (Extremely High))
Cosine Response . . . . . . . . . . . . . . . . . . . . . . . . . . . . . . ±4% FS (0° to 90° zenith angle)
Update Interval . . . . . . . . . . . . . . . . . . . . . . . . . . . . . . . . 50 seconds to 1 minute (5 minutes when dark)
Current Graph Data . . . . . . . . . . . . . . . . . . . . . . . . . . . . Instant Reading and Hourly Average; Daily, Monthly High
Historical Graph Data . . . . . . . . . . . . . . . . . . . . . . . . . . . Hourly Average, Daily, Monthly Highs
Alarm . . . . . . . . . . . . . . . . . . . . . . . . . . . . . . . . . . . . . . . High Threshold from Instant Calculation

8Wireless Vantage Pro2™
WindWind Chill (Calculated)
Resolution and Units. . . . . . . . . . . . . . . . . . . . . . . . . 1°F or 1°C (user-selectable) °C is converted from °F rounded to the nearest 1°CRange. . . . . . . . . . . . . . . . . . . . . . . . . . . . . . . . . . . . -110° to +135°F (-79° to +57°C)Accuracy . . . . . . . . . . . . . . . . . . . . . . . . . . . . . . . . . ±2°F (±1°C) (typical)Update Interval . . . . . . . . . . . . . . . . . . . . . . . . . . . . . 10 to 12 secondsSource . . . . . . . . . . . . . . . . . . . . . . . . . . . . . . . . . . . United States National Weather Service (NWS)/NOAAEquation Used . . . . . . . . . . . . . . . . . . . . . . . . . . . . . Osczevski (1995) (adopted by US NWS in 2001)Variables Used . . . . . . . . . . . . . . . . . . . . . . . . . . . . . Instant Outside Temperature and 10-min. Avg. Wind SpeedCurrent Display Data . . . . . . . . . . . . . . . . . . . . . . . . Instant CalculationCurrent Graph Data . . . . . . . . . . . . . . . . . . . . . . . . . Instant Calculation; Hourly, Daily and Monthly LowHistorical Graph Data . . . . . . . . . . . . . . . . . . . . . . . . Hourly, Daily and Monthly LowsAlarm . . . . . . . . . . . . . . . . . . . . . . . . . . . . . . . . . . . . Low Threshold from Instant Calculation
Wind Direction
Range. . . . . . . . . . . . . . . . . . . . . . . . . . . . . . . . . . . . 1 - 360°Display Resolution . . . . . . . . . . . . . . . . . . . . . . . . . . 16 points (22.5°) on compass rose, 1° in numeric displayAccuracy . . . . . . . . . . . . . . . . . . . . . . . . . . . . . . . . . ±3°Update Interval . . . . . . . . . . . . . . . . . . . . . . . . . . . . . 2.5 to 3 secondsCurrent Display Data . . . . . . . . . . . . . . . . . . . . . . . . Instant (user-adjustable offset available)Current Graph Data . . . . . . . . . . . . . . . . . . . . . . . . . Instant; 10-min. Dominant; Hourly, Daily, Monthly DominantHistorical Graph Data . . . . . . . . . . . . . . . . . . . . . . . . Past 6 10-min. Dominants on compass rose only; Hourly, Daily, Monthly Dominants
Wind Speed
Resolution and Units. . . . . . . . . . . . . . . . . . . . . . . . . 1 mph, 1 km/h, 0.4 m/s, or 1 knot (user-selectable). Measured in mph, other units are converted from mph and rounded to nearest 1 km/hr, 0.1 m/s, or 1 knot.
Range. . . . . . . . . . . . . . . . . . . . . . . . . . . . . . . . . . . . 0 to 200 mph, 0 to 173 knots, 0 to 89 m/s, 0 to 322 km/hUpdate Interval . . . . . . . . . . . . . . . . . . . . . . . . . . . . . Instant Reading: 2.5 to 3 seconds, 10-minute Average: 1 minuteAccuracy . . . . . . . . . . . . . . . . . . . . . . . . . . . . . . . . . ±2 mph (2 kts, 3.2 km/h, 0.9 m/s) or ±5%, whichever is greaterMaximum Cable Length . . . . . . . . . . . . . . . . . . . . . . 240 feet (73 m) (See note on page 1)Current Display Data . . . . . . . . . . . . . . . . . . . . . . . . InstantCurrent Graph Data . . . . . . . . . . . . . . . . . . . . . . . . . Instant; 10-minute and Hourly Average; Hourly High; Daily, Monthly and Yearly
High with Direction of HighHistorical Graph Data . . . . . . . . . . . . . . . . . . . . . . . . 10-min. and Hourly Averages; Hourly Highs; Daily, Monthly and Yearly Highs with
Direction of Highs Alarms . . . . . . . . . . . . . . . . . . . . . . . . . . . . . . . . . . . High Thresholds from Instant Reading and 10-minute Average
Wireless Communicat ions
Transmit/Receive Frequency
US Models . . . . . . . . . . . . . . . . . . . . . . . . . . . . . . . . 902 - 928 MHz FHSS,
EU Models . . . . . . . . . . . . . . . . . . . . . . . . . . . . . . . . 868.0 - 868.6 MHz FHSS
Japan Models . . . . . . . . . . . . . . . . . . . . . . . . . . . . . . 928.15 - 929.65 MHz FHSS
NZ Models . . . . . . . . . . . . . . . . . . . . . . . . . . . . . . . . 921 - 928 MHz FHSS
India Models . . . . . . . . . . . . . . . . . . . . . . . . . . . . . . . 865.0 - 867.0 MHz FHSS
ID Codes Available. . . . . . . . . . . . . . . . . . . . . . . . . . . . . . 8
Output Power
US Models . . . . . . . . . . . . . . . . . . . . . . . . . . . . . . . . 902 - 928 MHz FHSS: FCC-certified low power, less than 8 mW, no license required
EU Models . . . . . . . . . . . . . . . . . . . . . . . . . . . . . . . . 868.0 - 868.6 MHz FHSS. CE-certified, less than 8 mW, no license required.
Japan Models . . . . . . . . . . . . . . . . . . . . . . . . . . . . . . 928.15 - 929.65 MHz FHSS, less than 1 mW, no license required.
NZ Models . . . . . . . . . . . . . . . . . . . . . . . . . . . . . . . . 921- 928 MHz FHSS, less than 10mW, no license required.
India Models. . . . . . . . . . . . . . . . . . . . . . . . . . . . . . . 865.0 - 867.0 MHz, less than 10mW, no license required.
Range: All models except Japan
Line of Sight . . . . . . . . . . . . . . . . . . . . . . . . . . . . . . . up to 1000 feet (300 m)Through Walls . . . . . . . . . . . . . . . . . . . . . . . . . . . . . 200 to 400 feet (60 to 120 m)
Range: Japan modelsLine of Sight . . . . . . . . . . . . . . . . . . . . . . . . . . . . . . . up to 300 feet (100 m)Through Walls . . . . . . . . . . . . . . . . . . . . . . . . . . . . . 50 to 200 feet (15 to 60m)
Sensor Inputs
RF Filtering. . . . . . . . . . . . . . . . . . . . . . . . . . . . . . . . RC low-pass filter on each signal line

9Wireless Vantage Pro2™
Sensor Charts
Figure 3. External Temperature Probe Accuracy
Figure 1. Low Range Rain Rate Resolution Figure 2: Full Range Rain Rate Resolution
10Wireless Vantage Pro2™
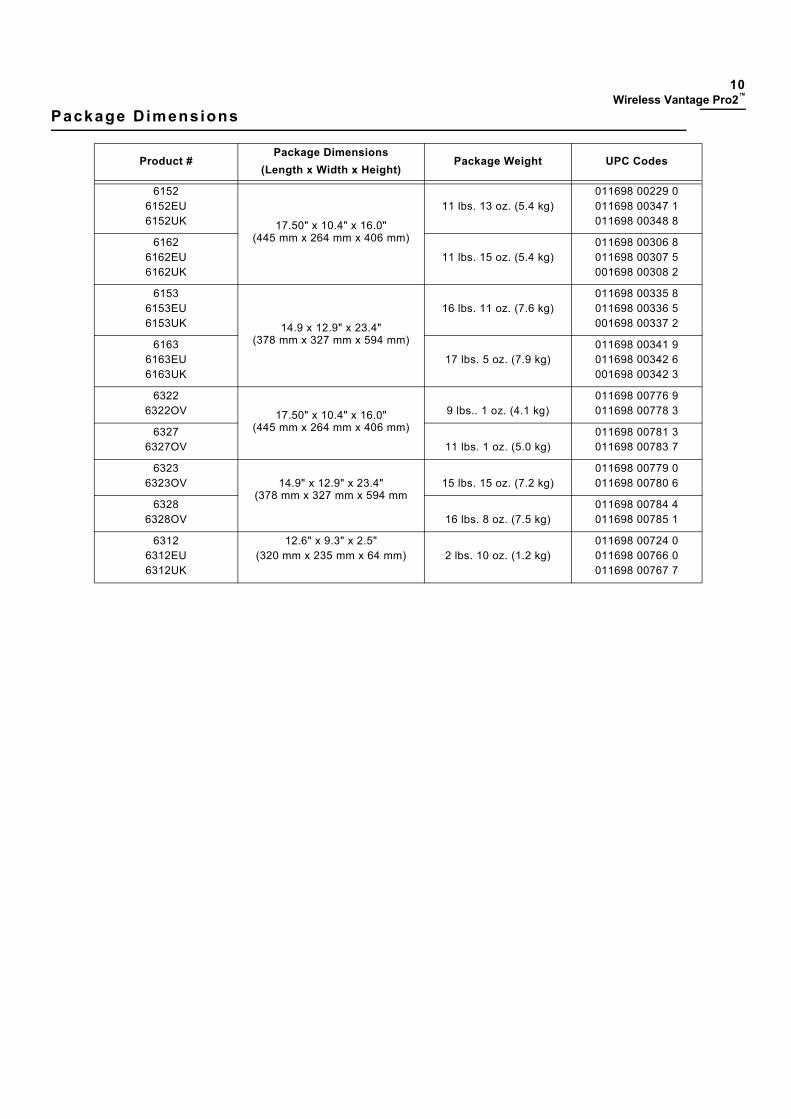
Package Dimensions
Product #Package Dimensions
(Length x Width x Height)Package Weight UPC Codes
61526152EU 6152UK 17.50" x 10.4" x 16.0"
(445 mm x 264 mm x 406 mm)
11 lbs. 13 oz. (5.4 kg)011698 00229 0011698 00347 1011698 00348 8
6162 6162EU6162UK
11 lbs. 15 oz. (5.4 kg)011698 00306 8011698 00307 5001698 00308 2
6153 6153EU 6153UK 14.9 x 12.9" x 23.4"
(378 mm x 327 mm x 594 mm)
16 lbs. 11 oz. (7.6 kg)011698 00335 8011698 00336 5001698 00337 2
6163 6163EU 6163UK
17 lbs. 5 oz. (7.9 kg)011698 00341 9011698 00342 6001698 00342 3
63226322OV 17.50" x 10.4" x 16.0"
(445 mm x 264 mm x 406 mm)
9 lbs.. 1 oz. (4.1 kg)011698 00776 9011698 00778 3
63276327OV 11 lbs. 1 oz. (5.0 kg)
011698 00781 3011698 00783 7
63236323OV 14.9" x 12.9" x 23.4"
(378 mm x 327 mm x 594 mm15 lbs. 15 oz. (7.2 kg)
011698 00779 0011698 00780 6
63286328OV 16 lbs. 8 oz. (7.5 kg)
011698 00784 4011698 00785 1
63126312EU6312UK
12.6" x 9.3" x 2.5"(320 mm x 235 mm x 64 mm) 2 lbs. 10 oz. (1.2 kg)
011698 00724 0011698 00766 0011698 00767 7