Rapporto Enter-Vet 2010
76
Report 2010 Centro di referenza nazionale per le salmonellosi C E N T R O D I R E F E R E N Z A N A Z I O N A L E SALMONELLOSI Istituto Zooprofilattico Sperimentale delle Venezie
-
Upload
istituto-zooprofilattico-sperimentale-delle-venezie -
Category
Documents
-
view
218 -
download
0
description
Â
Transcript of Rapporto Enter-Vet 2010
Report 2010
Centro di referenza nazionale per le salmonellosi
CEN
TRO D
I REFERENZA NAZION
ALE
SALMONELLOSIIstituto Zooprofilattico Sperimentale delle Venezie

CEN
TRO D
I REFERENZA NAZION
ALE
PER LE SALMONELLOSIIstituto Zooprofilattico Sperimentale delle Venezie
Report 2010
Enter-Vet Report 2010
A cura di | EditorsCentro di referenza nazionale per le salmonellosiIstituto Zooprofilattico Sperimentale delle VenezieViale dell’Università,10 - 35020 Legnaro (PD)Tel.: +39 049 8084 296 - 283 - 293Fax: +39 049 8830268E-mail: [email protected]
Grafica e impaginazione | Development, design, composition:Valentina Boscolo Bragadin, SCS7 - IZSVe
Foto | PhotoIstituto Zooprofilattico Sperimentale delle VenezieFotografo | PhotographerAlessandro Dalla Pozza
Il report è disponibile anche nel sito www.izsvenezie.it The report is also available at: www.izsvenezie.it.
Qualsiasi utilizzo dei dati qui citati dovrebbe fare specifico riferimento al presente report Any use of the present data should include specific reference to this report
Copyright © 2012 by Istituto Zooprofilattico Sperimentale delle Venezie
Pubblicazione non in venditaNot for sale
I lettori che desiderano informazioni e aggiornamenti sulle attività dell’Istituto Zooprofilattico Sperimentale delle Venezie possono visitare il sito web www.izsvenezie.itReaders that would like to obtain information and updates on the activities of Istituto Zooprofilattico Sperimentale delle Venezie can link to the website www.izsvenezie.it

Indice
PrefazioneIntroduction
1 3
Elenco dei laboratori di riferimentoEnter-Vet Laboratories
55
Riepilogo delle notifiche Reports of Salmonella spp. isolates
99
Sierotipizzazione: risultati Serotyping: results
1515
Fagotipizzazione: risultati Phage typing: results
3333
Test di suscettibilità agli antibiotici: risultati Antimicrobial susceptibility testing: results
4141
Legenda: pannello di antimicrobici testati Legend: panel of antimicrobials tested
6161
BibliografiaReferences
6363
Sommario Summary
6565

1
Report 2010
Prefazione
Il presente Report ricalca il layout degli anni precedenti e si articola nelle seguenti sezioni:• riepilogo delle notifiche• esiti della sierotipizzazione• esiti della fagotipizzazione di Salmonella Enteritidis, Salmonella Typhimurium e della variante
monofasica di Salmonella Typhimurium• esiti della determinazione del profilo di antibioticoresistenza
Quando disponibili, sono riportati anche i dati raccolti nei precedenti anni di attività a titolo di confronto. Tuttavia particolare attenzione deve essere prestata nella comparazione di tali dati, dal momento che fluttuazioni nelle prevalenze potrebbero essere riconducibili esclusivamente a variazioni nel numero e nella tipologia di campioni esaminati nei diversi anni di attività.
A garanzia della qualità dei dati raccolti e delle prestazioni dei laboratori partecipanti, il Centro di referenza nazionale per le salmonellosi ha organizzato, anche nel 2010, come di consuetudine un circuito interlaboratorio di isolamento di Salmonella spp. e uno di sierotipizzazione a cui hanno preso parte tutti i laboratori afferenti alla rete Enter-Vet.
Si ricorda inoltre che il presente Report, come quelli relativi ai precedenti anni di attività, è disponibile anche on-line, accedendo al sito www.izsvenezie.it, quindi alle pagine dedicate al Centro di referenza nazionale per le salmonellosi (sezione “Centri di eccellenza”, “Salmonellosi”, alla voce “Attività e Servizi”).
Nell’ambito della presente pubblicazione, un ringraziamento particolare deve essere rivolto a tutti coloro che hanno partecipato e in particolare ai colleghi degli Istituti Zooprofilattici che raccolgono e inviano i dati.
Ormai ci stiamo avvicinando al decimo anno di attività della rete di sorveglianza e la costante partecipazione dei laboratori coinvolti dimostra che l’interesse verso questo progetto continua a rimanere vivo. Ciò rappresenta una condizione essenziale per garantire l’attendibilità dei dati raccolti a livello nazionale.
Infine, come ormai d’abitudine, invitiamo tutti coloro che utilizzano queste informazioni, a trasmetterci commenti e suggerimenti che prenderemo certamente in considerazione al fine di migliore la qualità del servizio offerto.
AntoniA Ricci
Direttore del Centro di referenza nazionale e OIE per le salmonellosidell’Istituto Zooprofilattico Sperimentale delle Venezie


3
Report 2010
Introduction
This report follows the layout of previous years and is divided into the following sections: • summary of notifications• results of serotyping • results of phage typing for Salmonella Enteritidis, Salmonella Typhimurium and the monophasic
variant of Salmonella Typhimurium• results of antimicrobial susceptibility testing
When available a comparison with the data collected in previous years has been reported.However, special attention should be paid in the comparison of such data, as fluctuations in the prevalence could be attributed only to changes in the number and type of samples tested over the years.
In order to guarantee the quality of collected data and the performance of participating laborato-ries, the National Reference Laboratory for salmonellosis has organized also in 2010, interlabo-ratory studies on isolation and serotyping of Salmonella spp.; all Entervet laboratories took part in these studies.
The present report, as the previous one, is also available on-line, through the site www.izsvenezie.itin the pages dedicated to the National Reference Laboratory for salmonellosis (section “Centers of Excellence”, “Salmonellosis”, “Activities and Services”).
Special thanks must be given to all people who participated in the realization of this work, and in particular the colleagues of Istituti Zooprofilattici that collect and send data.
It is almost the tenth year of activity of the surveillance network and the continuous participation of the involved laboratories demonstrate their constant interest toward this project. This represents an essential condition to guarantee the reliability of the data collected.
Eventually, we would be glad to receive from everyone, who uses this information, comments and suggestions that will certainly be taken into account in order to improve the quality of the service provided.
AntoniA Ricci
Head of National and OIE Reference Laboratory for salmonellosisIstituto Zooprofilattico Sperimentale delle Venezie

5
Report 2010
Elenco dei laboratori di riferimentoEnter-Vet Laboratories
Istituto Zooprofilattico Sperimentale Piemonte, Liguria e Valle d’AostaVia Bologna, 148 - 10154 TorinoReferente | Contact person: dott.ssa Lucia De CastelliLaboratorio controllo alimentiTel.: 011 2686303 | Fax: 011 2473450E-mail: [email protected]
Istituto Zooprofilattico Sperimentale Lombardia ed Emilia RomagnaVia A. Bianchi, 9 - 25124 BresciaReferente | Contact person: dott.ssa Silvia Tagliabue Dipartimento di diagnostica specializzata – Reparto di batteriologia specializzataTel.: 030 2290323 | Fax: 030 2290570E-mail: [email protected]
Istituto Zooprofilattico Sperimentale Umbria e MarcheVia G. Salvemini, 1 - 06126 PerugiaReferente | Contact person: dott.ssa Stefania ScuotaLaboratorio di microbiologia degli alimentiTel.: 075 343269 | Fax: 075 35047E-mail: [email protected]
Istituto Zooprofilattico Sperimentale Umbria e Marche (sezione di Macerata)Via dei Velini, 11 - 62100 MacerataReferente | Contact person: dott.ssa Monica StaffolaniTel.: 0733 262206 | Fax: 0733 262069E-mail: [email protected]
Istituto Zooprofilattico Sperimentale Lazio e ToscanaVia Appia Nuova, 1411 - 00178 RomaReferente | Contact person: dott. Stefano BileiMicrobiologia degli alimenti Tel.: 06 79099423 | Fax: 06 79340724E-mail: [email protected]
Istituto Zooprofilattico Sperimentale Lazio e ToscanaVia Appia Nuova, 1411 - 00178 RomaReferente | Contact person: dott. Antonio BattistiCentro di referenza nazionale per l’antibioticoresistenzaTel.: 06 79099469 | Fax: 06 79340724E-mail: [email protected]
6
Report 2010
Istituto Zooprofilattico Sperimentale Abruzzo e MoliseCampo Boario - 64100 TeramoReferente | Contact person: dott.ssa Elisabetta Di GiannataleReparto di igiene delle tecnologie alimentari e dell’alimentazione animaleTel.: 0861 332259 | Fax: 0861 332251E-mail: [email protected]
Istituto Zooprofilattico Sperimentale del MezzogiornoVia Salute, 2 - 80055 Portici (Na)Referente | Contact person: dott.ssa. Maria Rosaria CarulloDipartimento di ispezione degli alimenti di origine animaleTel.: 081 7865213 | Fax: 081 7766495E-mail: [email protected]
Istituto Zooprofilattico Sperimentale Puglia e BasilicataVia Manfredonia, 20 - 71100 FoggiaReferente | Contact person: dott.ssa Elisa GoffredoUnità operativa batteriologia alimentareTel.: 0881 786319 | Fax: 0881 786374E-mail: [email protected]
Istituto Zooprofilattico Sperimentale della SiciliaVia Rocco Dicillo, 4 - 90129 PalermoReferente | Contact person: dott.ssa Chiara PirainoSettore diagnostica specialistica - Laboratorio di batteriologia specialeTel.: 091 6565305 | Fax: 091 6570803E-mail: [email protected]
Istituto Zooprofilattico Sperimentale della SiciliaVia Gino Marinuzzi, 3 - 90129 PalermoReferente | Contact person: dott.ssa Annamaria di NotoArea di microbiologia degli alimentiTel.: 091 6565226 | Fax: 091 6565362E-mail: [email protected]
Istituto Zooprofilattico Sperimentale della SardegnaVia Duca degli Abruzzi, 8 - 07100 Sassari Referente | Contact person: dott. Antonio VidiliDipartimento Territoriale di OristanoLaboratorio di diagnostica clinica e anatomia patologicaVia Atene-Zona Industriale 09170 OristanoTel.: 0783 351003 | Fax: 0783/58931E-mail: [email protected]

9
Report 2010
Riepilogo delle notifiche
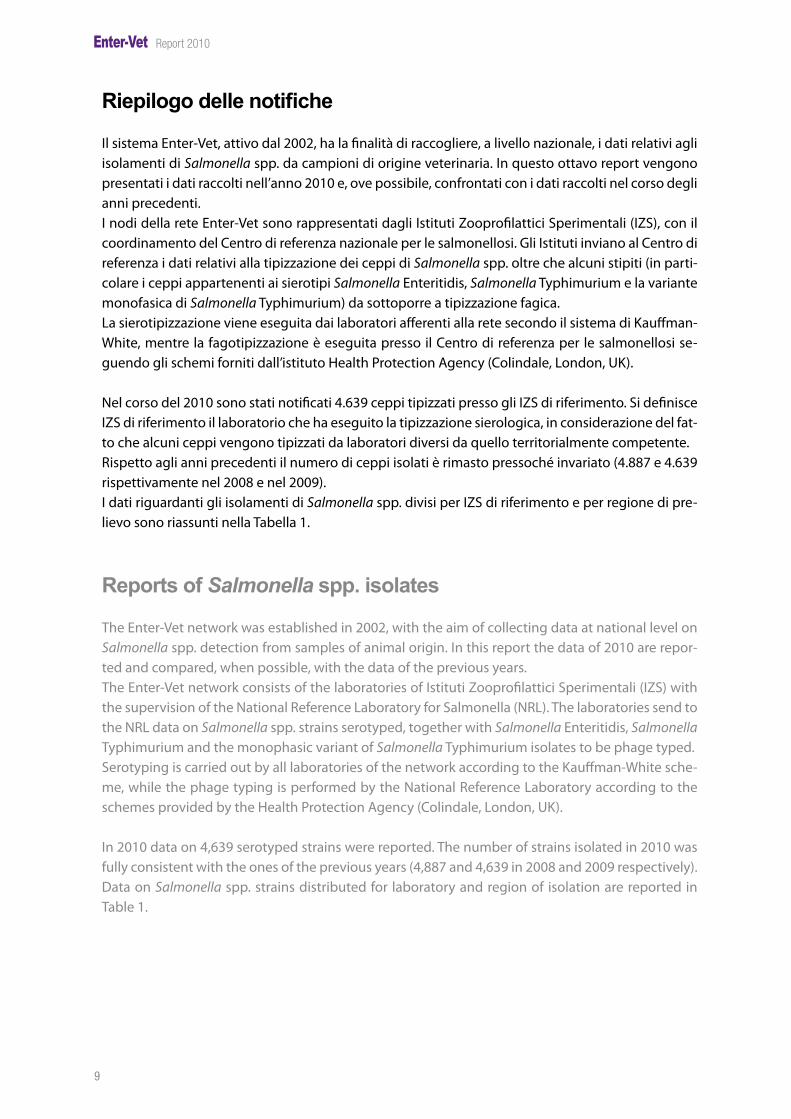
Il sistema Enter-Vet, attivo dal 2002, ha la finalità di raccogliere, a livello nazionale, i dati relativi agli isolamenti di Salmonella spp. da campioni di origine veterinaria. In questo ottavo report vengono presentati i dati raccolti nell’anno 2010 e, ove possibile, confrontati con i dati raccolti nel corso degli anni precedenti.I nodi della rete Enter-Vet sono rappresentati dagli Istituti Zooprofilattici Sperimentali (IZS), con il coordinamento del Centro di referenza nazionale per le salmonellosi. Gli Istituti inviano al Centro di referenza i dati relativi alla tipizzazione dei ceppi di Salmonella spp. oltre che alcuni stipiti (in parti-colare i ceppi appartenenti ai sierotipi Salmonella Enteritidis, Salmonella Typhimurium e la variante monofasica di Salmonella Typhimurium) da sottoporre a tipizzazione fagica. La sierotipizzazione viene eseguita dai laboratori afferenti alla rete secondo il sistema di Kauffman-White, mentre la fagotipizzazione è eseguita presso il Centro di referenza per le salmonellosi se-guendo gli schemi forniti dall’istituto Health Protection Agency (Colindale, London, UK).
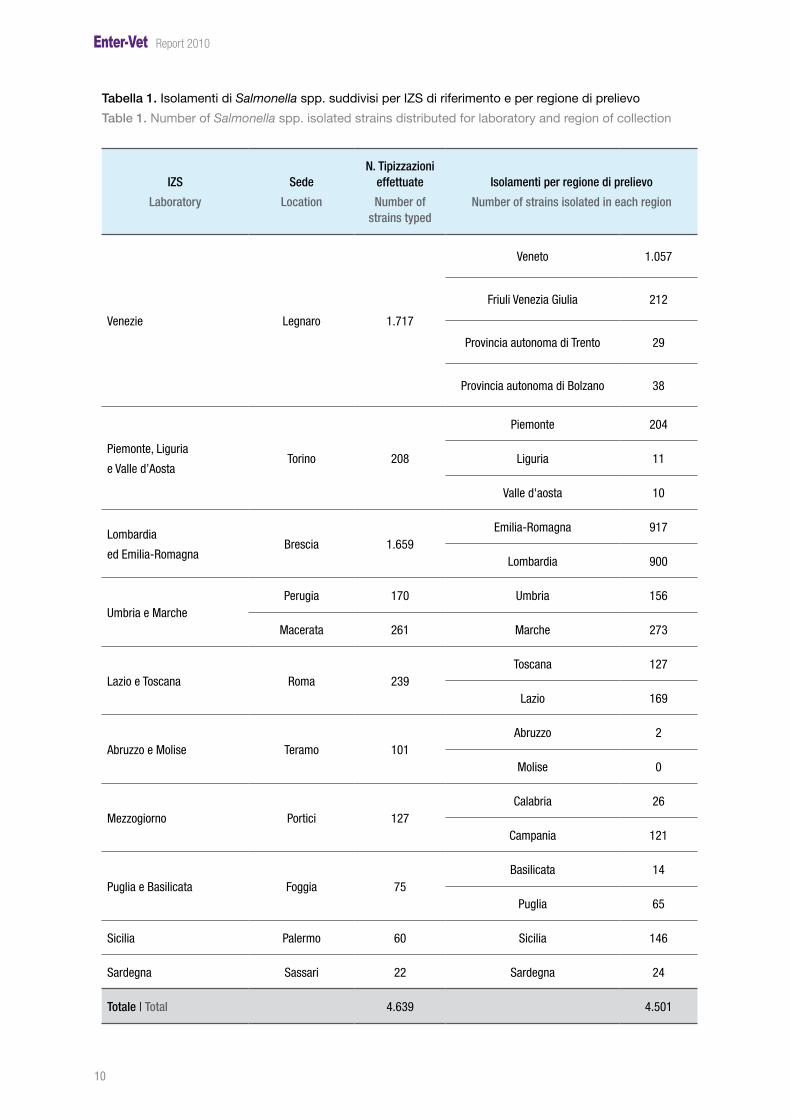
Nel corso del 2010 sono stati notificati 4.639 ceppi tipizzati presso gli IZS di riferimento. Si definisce IZS di riferimento il laboratorio che ha eseguito la tipizzazione sierologica, in considerazione del fat-to che alcuni ceppi vengono tipizzati da laboratori diversi da quello territorialmente competente.Rispetto agli anni precedenti il numero di ceppi isolati è rimasto pressoché invariato (4.887 e 4.639 rispettivamente nel 2008 e nel 2009).I dati riguardanti gli isolamenti di Salmonella spp. divisi per IZS di riferimento e per regione di pre-lievo sono riassunti nella Tabella 1.
Reports of Salmonella spp. isolates
The Enter-Vet network was established in 2002, with the aim of collecting data at national level on Salmonella spp. detection from samples of animal origin. In this report the data of 2010 are repor-ted and compared, when possible, with the data of the previous years.The Enter-Vet network consists of the laboratories of Istituti Zooprofilattici Sperimentali (IZS) with the supervision of the National Reference Laboratory for Salmonella (NRL). The laboratories send to the NRL data on Salmonella spp. strains serotyped, together with Salmonella Enteritidis, Salmonella Typhimurium and the monophasic variant of Salmonella Typhimurium isolates to be phage typed.Serotyping is carried out by all laboratories of the network according to the Kauffman-White sche-me, while the phage typing is performed by the National Reference Laboratory according to the schemes provided by the Health Protection Agency (Colindale, London, UK).
In 2010 data on 4,639 serotyped strains were reported. The number of strains isolated in 2010 was fully consistent with the ones of the previous years (4,887 and 4,639 in 2008 and 2009 respectively).Data on Salmonella spp. strains distributed for laboratory and region of isolation are reported in Table 1.
10
Report 2010
Tabella 1. Isolamenti di Salmonella spp. suddivisi per IZS di riferimento e per regione di prelievo
Table 1. Number of Salmonella spp. isolated strains distributed for laboratory and region of collection
IZS
Laboratory
Sede
Location
N. Tipizzazioni effettuate
Number of strains typed
Isolamenti per regione di prelievo
Number of strains isolated in each region
Venezie Legnaro 1.717
Veneto 1.057
Friuli Venezia Giulia 212
Provincia autonoma di Trento 29
Provincia autonoma di Bolzano 38
Piemonte, Liguria
e Valle d’AostaTorino 208
Piemonte 204
Liguria 11
Valle d'aosta 10
Lombardia
ed Emilia-RomagnaBrescia 1.659
Emilia-Romagna 917
Lombardia 900
Umbria e MarchePerugia 170 Umbria 156
Macerata 261 Marche 273
Lazio e Toscana Roma 239Toscana 127
Lazio 169
Abruzzo e Molise Teramo 101Abruzzo 2
Molise 0
Mezzogiorno Portici 127Calabria 26
Campania 121
Puglia e Basilicata Foggia 75Basilicata 14
Puglia 65
Sicilia Palermo 60 Sicilia 146
Sardegna Sassari 22 Sardegna 24
Totale | Total 4.639 4.501
11
Report 2010
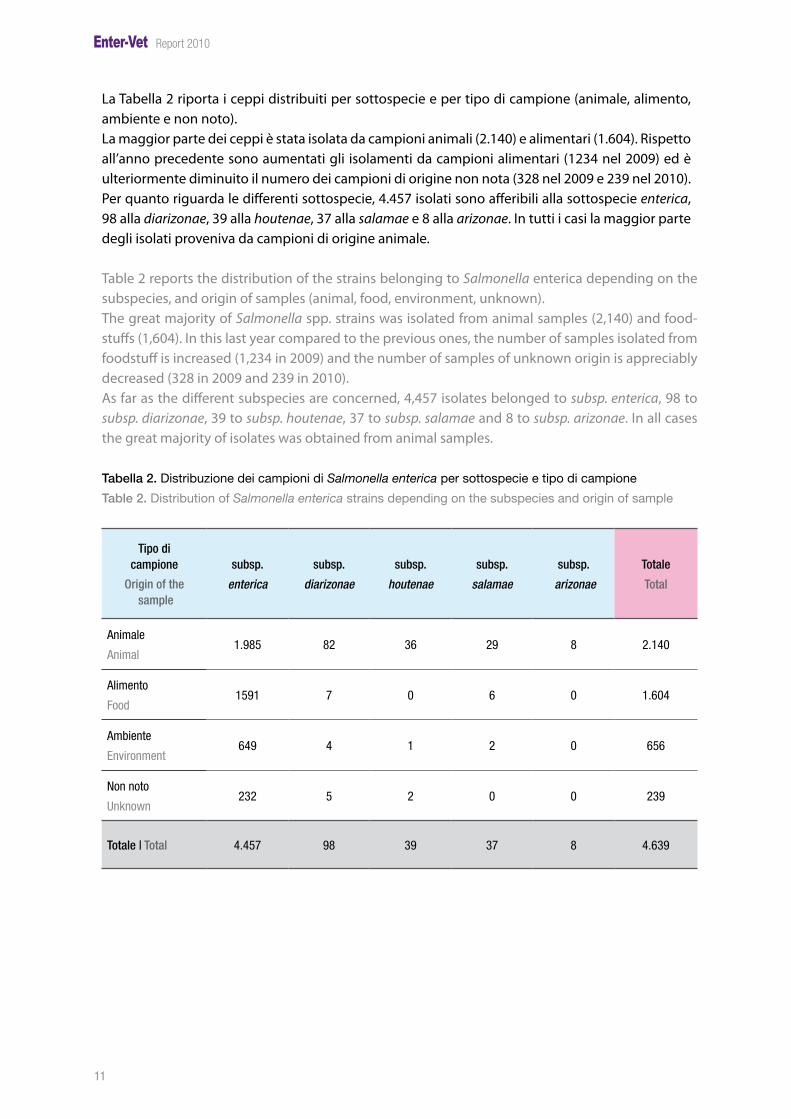
La Tabella 2 riporta i ceppi distribuiti per sottospecie e per tipo di campione (animale, alimento, ambiente e non noto).La maggior parte dei ceppi è stata isolata da campioni animali (2.140) e alimentari (1.604). Rispetto all’anno precedente sono aumentati gli isolamenti da campioni alimentari (1234 nel 2009) ed è ulteriormente diminuito il numero dei campioni di origine non nota (328 nel 2009 e 239 nel 2010).Per quanto riguarda le differenti sottospecie, 4.457 isolati sono afferibili alla sottospecie enterica, 98 alla diarizonae, 39 alla houtenae, 37 alla salamae e 8 alla arizonae. In tutti i casi la maggior parte degli isolati proveniva da campioni di origine animale.
Table 2 reports the distribution of the strains belonging to Salmonella enterica depending on the subspecies, and origin of samples (animal, food, environment, unknown).The great majority of Salmonella spp. strains was isolated from animal samples (2,140) and food-stuffs (1,604). In this last year compared to the previous ones, the number of samples isolated from foodstuff is increased (1,234 in 2009) and the number of samples of unknown origin is appreciably decreased (328 in 2009 and 239 in 2010).As far as the different subspecies are concerned, 4,457 isolates belonged to subsp. enterica, 98 to subsp. diarizonae, 39 to subsp. houtenae, 37 to subsp. salamae and 8 to subsp. arizonae. In all cases the great majority of isolates was obtained from animal samples.
Tabella 2. Distribuzione dei campioni di Salmonella enterica per sottospecie e tipo di campione
Table 2. Distribution of Salmonella enterica strains depending on the subspecies and origin of sample
Tipo di campione
Origin of the sample
subsp.
enterica
subsp.
diarizonae
subsp.
houtenae
subsp.
salamae
subsp.
arizonae
Totale
Total
Animale
Animal1.985 82 36 29 8 2.140
Alimento
Food1591 7 0 6 0 1.604
Ambiente
Environment649 4 1 2 0 656
Non noto
Unknown232 5 2 0 0 239
Totale | Total 4.457 98 39 37 8 4.639
12
Report 2010
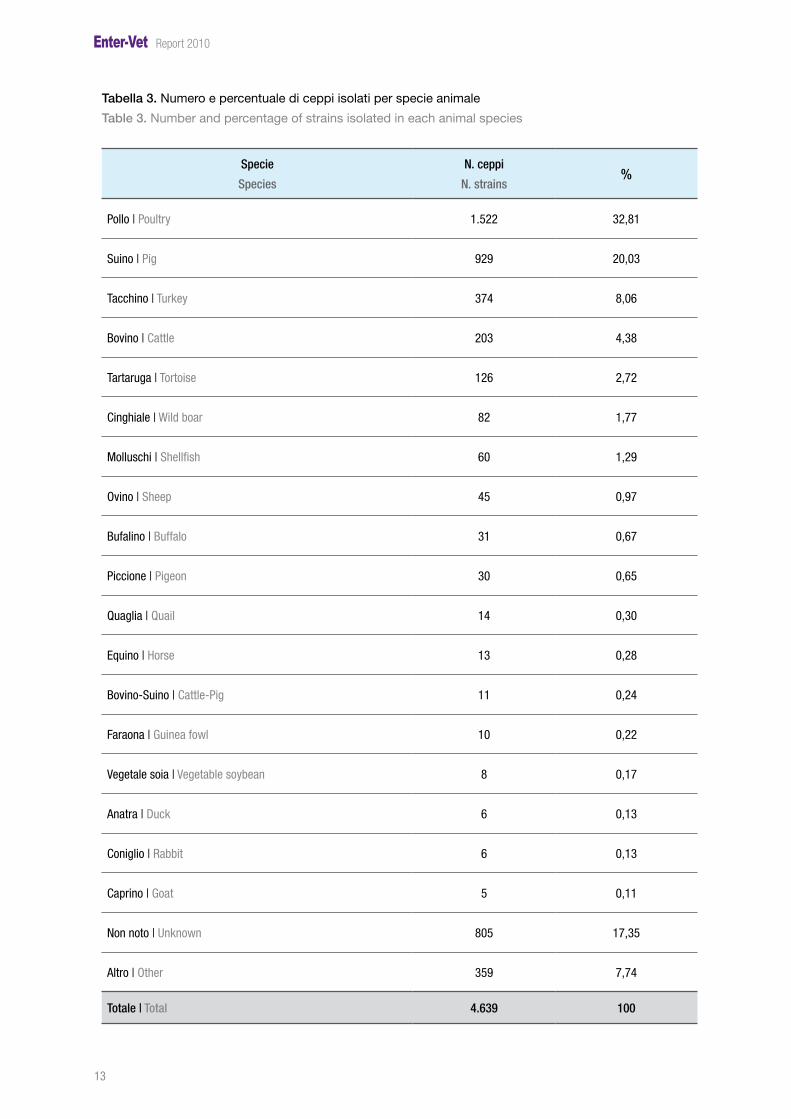
La Tabella 3 riporta la distribuzione dei campioni per specie di isolamento. Anche nel 2010, come negli anni precedenti, gli stipiti isolati da pollo, suino e tacchino rappresentano la grande maggio-ranza dei ceppi isolati (60,9%), sebbene rispetto all’anno precedente è possibile notare una notevo-le riduzione nella percentuale di isolati da pollo (45,70% nel 2009 e 32,81% nel 2010), un incre-mento della percentuale di isolati da suino (16,02% nel 2009 e 20,03% nel 2010), tacchino (4,14% nel 2009 e 8,06% nel 2010) e bovino (2,87% nel 2009 e 4,38% nel 2010). Come già verificato nel 2005 e nel 2007, anche nel 2010 è stato tipizzato un discreto numero di ceppi isolati da tartarughe (126 isolati pari a 2,72%).
In Table 3 the distribution of strains is reported depending on the species of isolation. In 2010, as in the previous years, the great majority of strains was collected from poultry, swine and turkey samples (60,9%). Compared to the previous years it was evidenced a decreasing in the percentage of isolates from poultry (45,70% in 2009 and 32,81% in 2010), an increasing in the percentage of isolates from swine (16,02% in 2009 and 20,03% in 2010), turkey (4,14% in 2009 and 8,06% in 2010) and cattle (2,87% in 2009 and 4,38% in 2010). As already verified in 2005 and 2007, also in 2010 a notable number of strains isolated from turtles has been recorded (126 isolates equal to 2,72%).
13
Report 2010
Tabella 3. Numero e percentuale di ceppi isolati per specie animale
Table 3. Number and percentage of strains isolated in each animal species
Specie
Species
N. ceppi
N. strains%
Pollo | Poultry 1.522 32,81
Suino | Pig 929 20,03
Tacchino | Turkey 374 8,06
Bovino | Cattle 203 4,38
Tartaruga | Tortoise 126 2,72
Cinghiale | Wild boar 82 1,77
Molluschi | Shellfish 60 1,29
Ovino | Sheep 45 0,97
Bufalino | Buffalo 31 0,67
Piccione | Pigeon 30 0,65
Quaglia | Quail 14 0,30
Equino | Horse 13 0,28
Bovino-Suino | Cattle-Pig 11 0,24
Faraona | Guinea fowl 10 0,22
Vegetale soia | Vegetable soybean 8 0,17
Anatra | Duck 6 0,13
Coniglio | Rabbit 6 0,13
Caprino | Goat 5 0,11
Non noto | Unknown 805 17,35
Altro | Other 359 7,74
Totale | Total 4.639 100
15
Report 2010
Sierotipizzazione: risultati
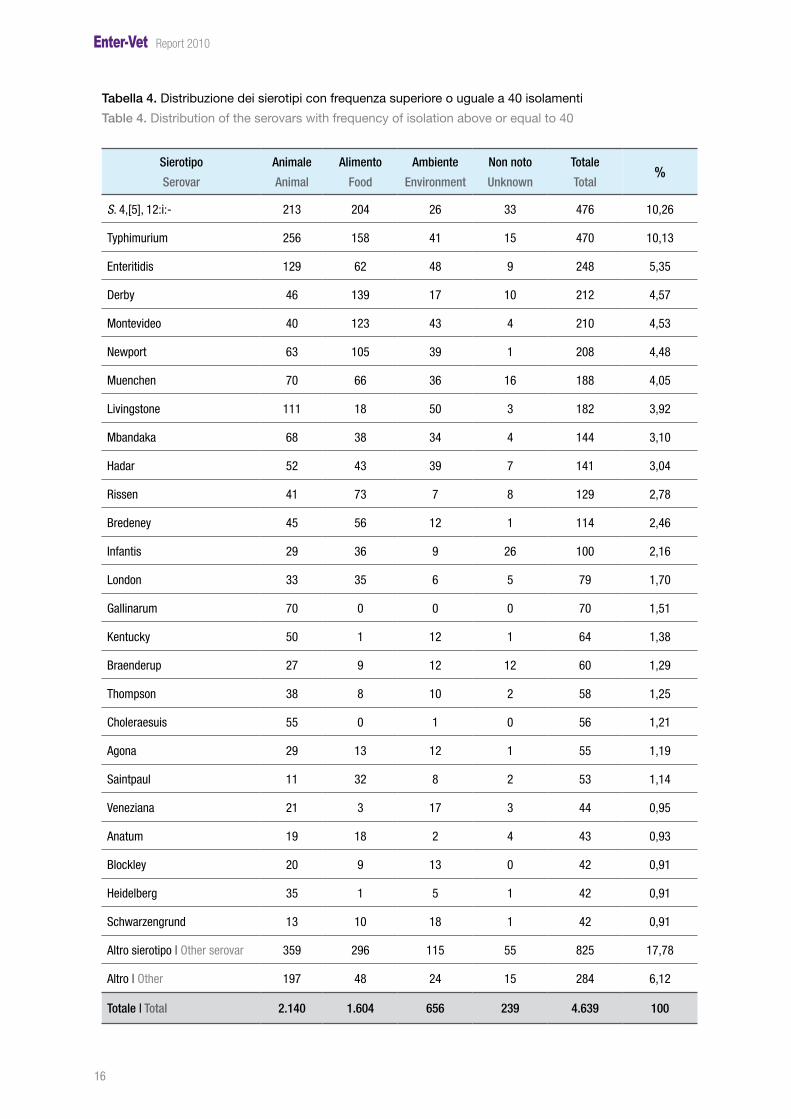
In Tabella 4 è rappresentata la distribuzione dei sierotipi con frequenza di isolamento superiore a 40. I sierotipi con frequenza di isolamento inferiore a 40 sono stati raggruppati sotto la voce “Altro”. Non sono invece riportati i ceppi appartenenti a subspecie diverse da enterica e i ceppi per cui non è stato possibile identificare il sierotipo.
Serotyping: results
In Table 4 the distribution of the serovars with frequency of isolation above 40 is reported. The serovars isolated with a frequency below 40 are grouped in the category “Other”. The strains be-longing to subspecies other than enterica and the strains for which it was not possible to identify the serovar are not reported.
Dalla Tabella 4 si evince che nel 2010 i sierotipi più frequentemente isolati sono la variante mo-nofasica di Salmonella Typhimurium (S. 4,[5],12:i:-) con una frequenza pari a 10,26%, Salmonella Typhimurium (frequenza pari a 10,13%), e Salmonella Enteritidis (frequenza pari a 5,35%). Nel 2010 per la prima volta da quando è stata attivata la rete di sorveglianza, Salmonella Typhimurium non è risultato il primo sierotipo isolato. Per Salmonella 4,[5],12:i:- negli ultimi anni la frequenza di isola-mento è progressivamente incrementata fino a diventare il primo sierotipo. Rispetto al 2009 si è registrato un incremento anche nelle percentuali di isolamento di Salmonella Montevideo (1,92% nel 2009 e 4,53% nel 2010) e Salmonella Newport (2% nel 2009 e 4,48% nel 2010), e un decremento nelle percentuali di isolamento di Salmonella Enteritidis (7,82% nel 2009 e 5,35 nel 2010) e Salmonella Livingstone (7,31% nel 2009 e 3,92% nel 2010).
Table 4 shows that the most common serovars isolated in 2010 were the monophasic variant of Salmonella Typhimurium (S. 4,[5],12:i:-) (10,26%), Salmonella Typhimurium (10,13%) and Salmonella Enteritidis (5,35%). In 2010, for the first time since the network was established, Salmonella Typhimurium was not the most common serovar isolated. The prevalence of isolation of Salmonella 4,[5],12:i:- has been progressively increased during the last years. In 2010 an increasing in the isolation of Salmonella Montevideo (1,92% in 2009 and 4,53% in 2010) and Salmonella Newport (2% in 2009 and 4,48% in 2010), and a decrease in the isolation of Salmonella Enteritidis (7,82% in 2009 and 5,35 in 2010) and Salmonella Livingstone (7,31% in 2009 and 3,92% in 2010) was reported.
16
Report 2010
Tabella 4. Distribuzione dei sierotipi con frequenza superiore o uguale a 40 isolamenti
Table 4. Distribution of the serovars with frequency of isolation above or equal to 40
Sierotipo
Serovar
Animale
Animal
Alimento
Food
Ambiente
Environment
Non noto
Unknown
Totale
Total%
S. 4,[5], 12:i:- 213 204 26 33 476 10,26
Typhimurium 256 158 41 15 470 10,13
Enteritidis 129 62 48 9 248 5,35
Derby 46 139 17 10 212 4,57
Montevideo 40 123 43 4 210 4,53
Newport 63 105 39 1 208 4,48
Muenchen 70 66 36 16 188 4,05
Livingstone 111 18 50 3 182 3,92
Mbandaka 68 38 34 4 144 3,10
Hadar 52 43 39 7 141 3,04
Rissen 41 73 7 8 129 2,78
Bredeney 45 56 12 1 114 2,46
Infantis 29 36 9 26 100 2,16
London 33 35 6 5 79 1,70
Gallinarum 70 0 0 0 70 1,51
Kentucky 50 1 12 1 64 1,38
Braenderup 27 9 12 12 60 1,29
Thompson 38 8 10 2 58 1,25
Choleraesuis 55 0 1 0 56 1,21
Agona 29 13 12 1 55 1,19
Saintpaul 11 32 8 2 53 1,14
Veneziana 21 3 17 3 44 0,95
Anatum 19 18 2 4 43 0,93
Blockley 20 9 13 0 42 0,91
Heidelberg 35 1 5 1 42 0,91
Schwarzengrund 13 10 18 1 42 0,91
Altro sierotipo | Other serovar 359 296 115 55 825 17,78
Altro | Other 197 48 24 15 284 6,12
Totale | Total 2.140 1.604 656 239 4.639 100
17
Report 2010
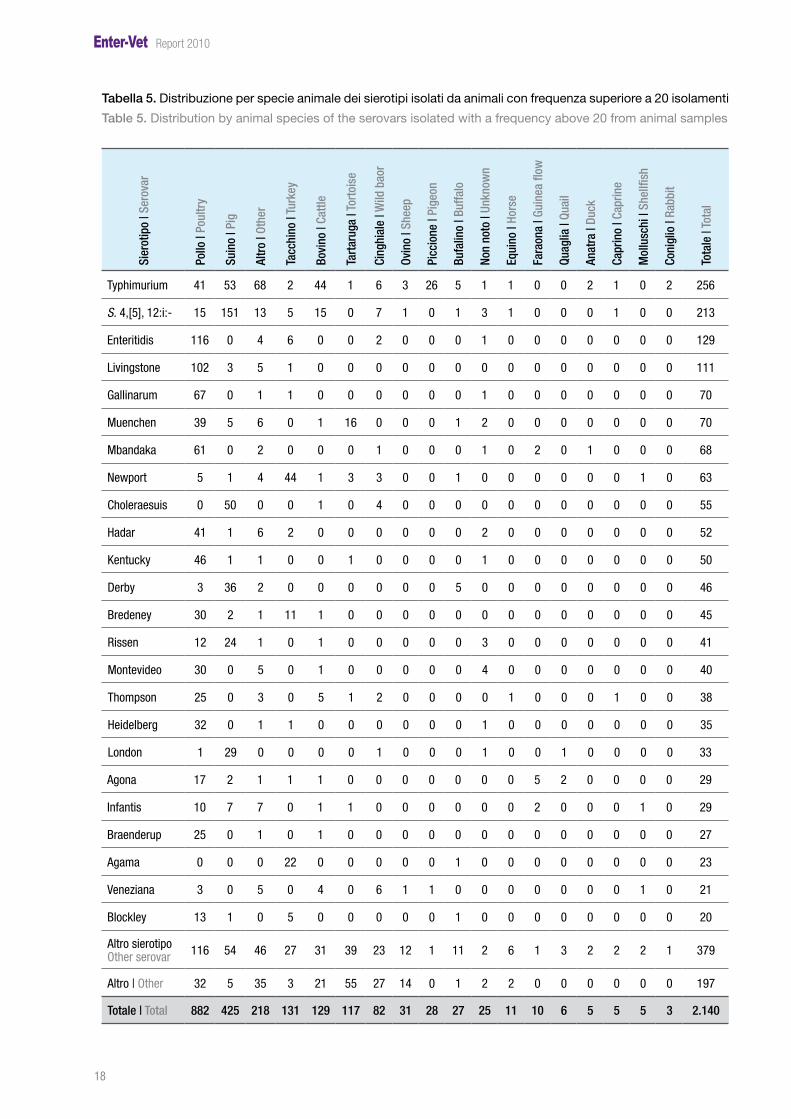
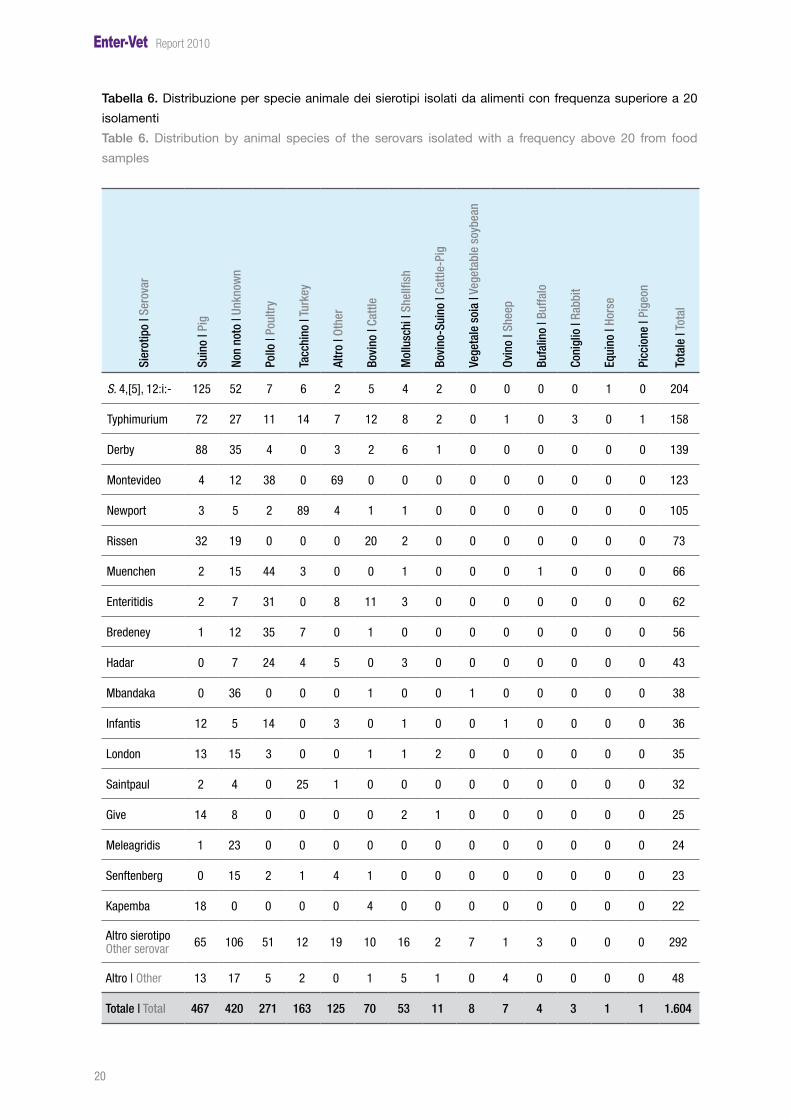
Le Tabelle 5, 6, 7 e 8 riportano la distribuzione dei sierotipi di Salmonella spp. isolati nel 2010 ri-spettivamente da campioni animali, alimenti, ambiente e di origine non nota. Per quanto riguarda i ceppi isolati da animali e alimenti sono considerati solo i sierotipi con frequenza di isolamento superiore a 20, mentre per i ceppi isolati da ambiente e di origine non nota solo i sierotipi con frequenza d’isolamento superiore a 10. Tutti i sierotipi con frequenze d’isolamento inferiori sono raggruppati nella categoria “Altro”.
Tables 5, 6, 7 and 8 report the distribution of Salmonella spp. serovars isolated during 2010 from animals, food, environment and of unknown origin. As far as the strains isolated from animals and food are concerned only the strains with a frequency of isolation above 20 are considered, while for strains isolated from environment and of unknown origin only the serovars isolated with a fre-quency above 10 are reported. All the serovars with an isolation rate below those reported in details are grouped in the category “Other”.
I tre sierotipi che al momento sono considerati come target di riduzione di Salmonella negli al-levamenti avicoli (Salmonella Enteritidis, Salmonella Typhimurium, Salmonella 4,[5],12:i:-) rappre-sentano i primi tre sierotipi isolati da campioni di origine animale. Mentre Salmonella Typhimurium ha una distribuzione piuttosto eterogenea nelle diverse specie, Salmonella 4,[5],12:i e Salmonella Enteritidis sono particolarmente adattate rispettivamente al suino e agli avicoli. Altri sierotipi associati agli avicoli sono Salmonella Livingstone, Salmonella Gallinarum, Salmonella Mbandaka, Salmonella Hadar, Salmonella Kentucky e Salmonella Heidelberg, ai tacchini Salmonella Newport, ai suini Salmonella Choleraesuis, Salmonella Derby e Salmonella London.E’ da notare inoltre che nell’elenco dei sierotipi isolati da animali ricompare dopo 4 anni Salmonella Gallinarum.
The three serovars that are currently considered as targets for Salmonella reduction in poultry flocks (Salmonella Enteritidis, Salmonella Typhimurium and Salmonella 4,[5],12:i:-) represent the three most common serovars isolated from animal samples. Salmonella Typhimurium is rather heteroge-neous and it is isolated from different animal species, whereas Salmonella 4,[5],12:i and Salmonella Enteritidis are most frequently isolated from pigs and poultry respectively. Other serovars associated to poultry are Salmonella Livingstone, Salmonella Gallinarum, Salmonella Mbandaka, Salmonella Hadar, Salmonella Kentucky and Salmonella Heidelberg, to turkeys Salmo-nella Newport, to pigs Salmonella Choleraesuis, Salmonella Derby and Salmonella London. In the list of the most common serovars isolated from animals it was found also Salmonella Gallinarum after 4 years of absence.
18
Report 2010
Tabella 5. Distribuzione per specie animale dei sierotipi isolati da animali con frequenza superiore a 20 isolamenti
Table 5. Distribution by animal species of the serovars isolated with a frequency above 20 from animal samples
Sier
otip
o | S
erov
ar
Pollo
| Po
ultr
y
Suin
o | P
ig
Altr
o | O
ther
Tacc
hino
| Tu
rkey
Bovi
no |
Cattl
e
Tart
arug
a | T
orto
ise
Cing
hial
e | W
ild b
aor
Ovin
o | S
heep
Picc
ione
| Pi
geon
Bufa
lino
| Buf
falo
Non
noto
| Un
know
n
Equi
no |
Hors
e
Fara
ona
| Gui
nea
flow
Quag
lia |
Quai
l
Anat
ra |
Duck
Capr
ino
| Cap
rine
Mol
lusc
hi |
Shel
lfish
Coni
glio
| Ra
bbit
Tota
le |
Tota
l
Typhimurium 41 53 68 2 44 1 6 3 26 5 1 1 0 0 2 1 0 2 256
S. 4,[5], 12:i:- 15 151 13 5 15 0 7 1 0 1 3 1 0 0 0 1 0 0 213
Enteritidis 116 0 4 6 0 0 2 0 0 0 1 0 0 0 0 0 0 0 129
Livingstone 102 3 5 1 0 0 0 0 0 0 0 0 0 0 0 0 0 0 111
Gallinarum 67 0 1 1 0 0 0 0 0 0 1 0 0 0 0 0 0 0 70
Muenchen 39 5 6 0 1 16 0 0 0 1 2 0 0 0 0 0 0 0 70
Mbandaka 61 0 2 0 0 0 1 0 0 0 1 0 2 0 1 0 0 0 68
Newport 5 1 4 44 1 3 3 0 0 1 0 0 0 0 0 0 1 0 63
Choleraesuis 0 50 0 0 1 0 4 0 0 0 0 0 0 0 0 0 0 0 55
Hadar 41 1 6 2 0 0 0 0 0 0 2 0 0 0 0 0 0 0 52
Kentucky 46 1 1 0 0 1 0 0 0 0 1 0 0 0 0 0 0 0 50
Derby 3 36 2 0 0 0 0 0 0 5 0 0 0 0 0 0 0 0 46
Bredeney 30 2 1 11 1 0 0 0 0 0 0 0 0 0 0 0 0 0 45
Rissen 12 24 1 0 1 0 0 0 0 0 3 0 0 0 0 0 0 0 41
Montevideo 30 0 5 0 1 0 0 0 0 0 4 0 0 0 0 0 0 0 40
Thompson 25 0 3 0 5 1 2 0 0 0 0 1 0 0 0 1 0 0 38
Heidelberg 32 0 1 1 0 0 0 0 0 0 1 0 0 0 0 0 0 0 35
London 1 29 0 0 0 0 1 0 0 0 1 0 0 1 0 0 0 0 33
Agona 17 2 1 1 1 0 0 0 0 0 0 0 5 2 0 0 0 0 29
Infantis 10 7 7 0 1 1 0 0 0 0 0 0 2 0 0 0 1 0 29
Braenderup 25 0 1 0 1 0 0 0 0 0 0 0 0 0 0 0 0 0 27
Agama 0 0 0 22 0 0 0 0 0 1 0 0 0 0 0 0 0 0 23
Veneziana 3 0 5 0 4 0 6 1 1 0 0 0 0 0 0 0 1 0 21
Blockley 13 1 0 5 0 0 0 0 0 1 0 0 0 0 0 0 0 0 20
Altro sierotipoOther serovar 116 54 46 27 31 39 23 12 1 11 2 6 1 3 2 2 2 1 379
Altro | Other 32 5 35 3 21 55 27 14 0 1 2 2 0 0 0 0 0 0 197
Totale | Total 882 425 218 131 129 117 82 31 28 27 25 11 10 6 5 5 5 3 2.140

19
Report 2010
I tre sierotipi isolati con frequenza maggiore dagli alimenti sono Salmonella 4,[5],12:i:-, Salmonella Typhimurium e Salmonella Derby, e nello specifico questi sierotipi sono stati isolati prevalente-mente da alimenti di origine suina. Di seguito, tra i sierotipi isolati da alimenti, si trova Salmonella Montevideo, per la quale la maggior parte degli isolamenti rientra nella categoria “Altro”, infine Sal-monella Newport è stata isolata prevalentemente da alimenti contenenti carne di tacchino.
The most common serovars isolated from foodstuffs were Salmonella 4,[5],12:i:-, Salmonella Typh-imurium and Salmonella Derby. These serovars were isolated mainly form foodstuffs of swine origin. Then, among the most common serovars there was Salmonella Montevideo, for which for the great majority of strains is included in the category “Other”, whereas Salmonella Newport was isolated mainly from foodstuffs containing turkey meat.
20
Report 2010
Tabella 6. Distribuzione per specie animale dei sierotipi isolati da alimenti con frequenza superiore a 20
isolamenti
Table 6. Distribution by animal species of the serovars isolated with a frequency above 20 from food
samples Si
erot
ipo
| Ser
ovar
Suin
o | P
ig
Non
noto
| Un
know
n
Pollo
| Po
ultr
y
Tacc
hino
| Tu
rkey
Altr
o | O
ther
Bovi
no |
Cattl
e
Mol
lusc
hi |
Shel
lfish
Bovi
no-S
uino
| Ca
ttle-
Pig
Vege
tale
soi
a | V
eget
able
soy
bean
Ovin
o | S
heep
Bufa
lino
| Buf
falo
Coni
glio
| Ra
bbit
Equi
no |
Hors
e
Picc
ione
| Pi
geon
Tota
le |
Tota
l
S. 4,[5], 12:i:- 125 52 7 6 2 5 4 2 0 0 0 0 1 0 204
Typhimurium 72 27 11 14 7 12 8 2 0 1 0 3 0 1 158
Derby 88 35 4 0 3 2 6 1 0 0 0 0 0 0 139
Montevideo 4 12 38 0 69 0 0 0 0 0 0 0 0 0 123
Newport 3 5 2 89 4 1 1 0 0 0 0 0 0 0 105
Rissen 32 19 0 0 0 20 2 0 0 0 0 0 0 0 73
Muenchen 2 15 44 3 0 0 1 0 0 0 1 0 0 0 66
Enteritidis 2 7 31 0 8 11 3 0 0 0 0 0 0 0 62
Bredeney 1 12 35 7 0 1 0 0 0 0 0 0 0 0 56
Hadar 0 7 24 4 5 0 3 0 0 0 0 0 0 0 43
Mbandaka 0 36 0 0 0 1 0 0 1 0 0 0 0 0 38
Infantis 12 5 14 0 3 0 1 0 0 1 0 0 0 0 36
London 13 15 3 0 0 1 1 2 0 0 0 0 0 0 35
Saintpaul 2 4 0 25 1 0 0 0 0 0 0 0 0 0 32
Give 14 8 0 0 0 0 2 1 0 0 0 0 0 0 25
Meleagridis 1 23 0 0 0 0 0 0 0 0 0 0 0 0 24
Senftenberg 0 15 2 1 4 1 0 0 0 0 0 0 0 0 23
Kapemba 18 0 0 0 0 4 0 0 0 0 0 0 0 0 22
Altro sierotipoOther serovar 65 106 51 12 19 10 16 2 7 1 3 0 0 0 292
Altro | Other 13 17 5 2 0 1 5 1 0 4 0 0 0 0 48
Totale | Total 467 420 271 163 125 70 53 11 8 7 4 3 1 1 1.604

21
Report 2010
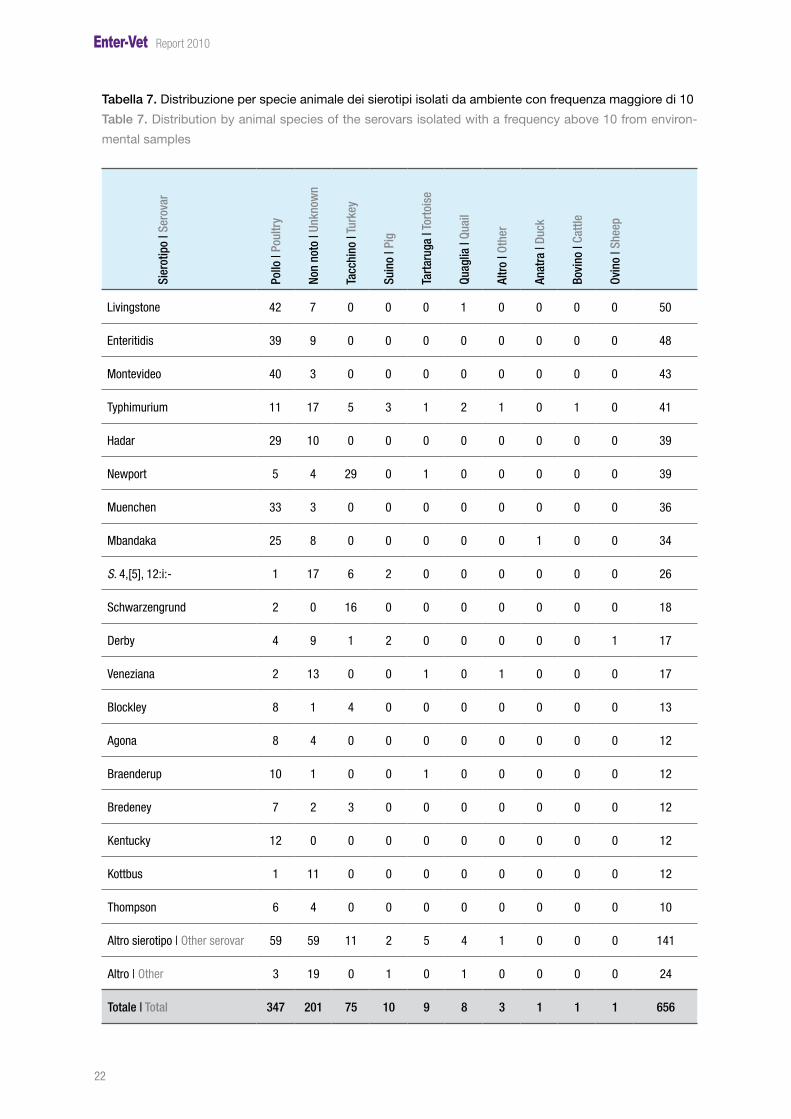
I sierotipi isolati più frequentemente dall’ambiente sono Salmonella Livingstone, Salmonella Ente-ritidis, Salmonella Montevideo e Salmonella Typhimurium. I primi tre sono stati isolati prevalente-mente in ambienti connessi con il pollo, mentre Salmonella Typhimurium risulta essere più ubiqui-tario.
The most common serovars isolated from environment were Salmonella Livingstone, Salmonella Enteritidis, Salmonella Montevideo and Salmonella Typhimurium. The first three serovars were iso-lated mainly from poultry environment, whereas Salmonella Typhimurium was a more ubiquitous serovar.
22
Report 2010
Tabella 7. Distribuzione per specie animale dei sierotipi isolati da ambiente con frequenza maggiore di 10
Table 7. Distribution by animal species of the serovars isolated with a frequency above 10 from environ-
mental samples
Sier
otip
o | S
erov
ar
Pollo
| Po
ultr
y
Non
noto
| Un
know
n
Tacc
hino
| Tu
rkey
Suin
o | P
ig
Tart
arug
a | T
orto
ise
Quag
lia |
Quai
l
Altr
o | O
ther
Anat
ra |
Duck
Bovi
no |
Cattl
e
Ovin
o | S
heep
Livingstone 42 7 0 0 0 1 0 0 0 0 50
Enteritidis 39 9 0 0 0 0 0 0 0 0 48
Montevideo 40 3 0 0 0 0 0 0 0 0 43
Typhimurium 11 17 5 3 1 2 1 0 1 0 41
Hadar 29 10 0 0 0 0 0 0 0 0 39
Newport 5 4 29 0 1 0 0 0 0 0 39
Muenchen 33 3 0 0 0 0 0 0 0 0 36
Mbandaka 25 8 0 0 0 0 0 1 0 0 34
S. 4,[5], 12:i:- 1 17 6 2 0 0 0 0 0 0 26
Schwarzengrund 2 0 16 0 0 0 0 0 0 0 18
Derby 4 9 1 2 0 0 0 0 0 1 17
Veneziana 2 13 0 0 1 0 1 0 0 0 17
Blockley 8 1 4 0 0 0 0 0 0 0 13
Agona 8 4 0 0 0 0 0 0 0 0 12
Braenderup 10 1 0 0 1 0 0 0 0 0 12
Bredeney 7 2 3 0 0 0 0 0 0 0 12
Kentucky 12 0 0 0 0 0 0 0 0 0 12
Kottbus 1 11 0 0 0 0 0 0 0 0 12
Thompson 6 4 0 0 0 0 0 0 0 0 10
Altro sierotipo | Other serovar 59 59 11 2 5 4 1 0 0 0 141
Altro | Other 3 19 0 1 0 1 0 0 0 0 24
Totale | Total 347 201 75 10 9 8 3 1 1 1 656
23
Report 2010
Tabella 8. Distribuzione per specie animale dei sierotipi isolati da matrice non nota con frequenza maggiore
di 10
Table 8. Distribution by animal species of the serovars isolated with a frequency above 10 from samples
of unknown originSi
erot
ipo
| Ser
ovar
Non
noto
| Un
know
n
Suin
o | P
ig
Pollo
| Po
ultr
y
Altr
o | O
ther
Ovin
o | S
heep
Tacc
hino
| Tu
rkey
Bovi
no |
Cattl
e
Mol
lusc
hi |
Shel
lfish
Equi
no |
Hors
e
Picc
ione
| Pi
geon
Tota
le |
Tota
l
S. 4,[5], 12:i:- 22 11 0 0 0 0 0 0 0 0 33
Infantis 25 1 0 0 0 0 0 0 0 0 26
Muenchen 7 0 4 0 4 1 0 0 0 0 16
Typhimurium 6 2 2 1 0 0 2 1 0 1 15
Orion 12 0 1 0 0 0 0 0 0 0 13
Braenderup 11 0 1 0 0 0 0 0 0 0 12
Agama 3 0 1 3 1 1 0 0 1 0 10
Derby 7 3 0 0 0 0 0 0 0 0 10
Altro sierotipo | Other serovar 52 9 13 9 1 3 1 1 0 0 89
Altro | Other 14 1 0 0 0 0 0 0 0 0 15
Totale | Total 159 27 22 13 6 5 3 2 1 1 239
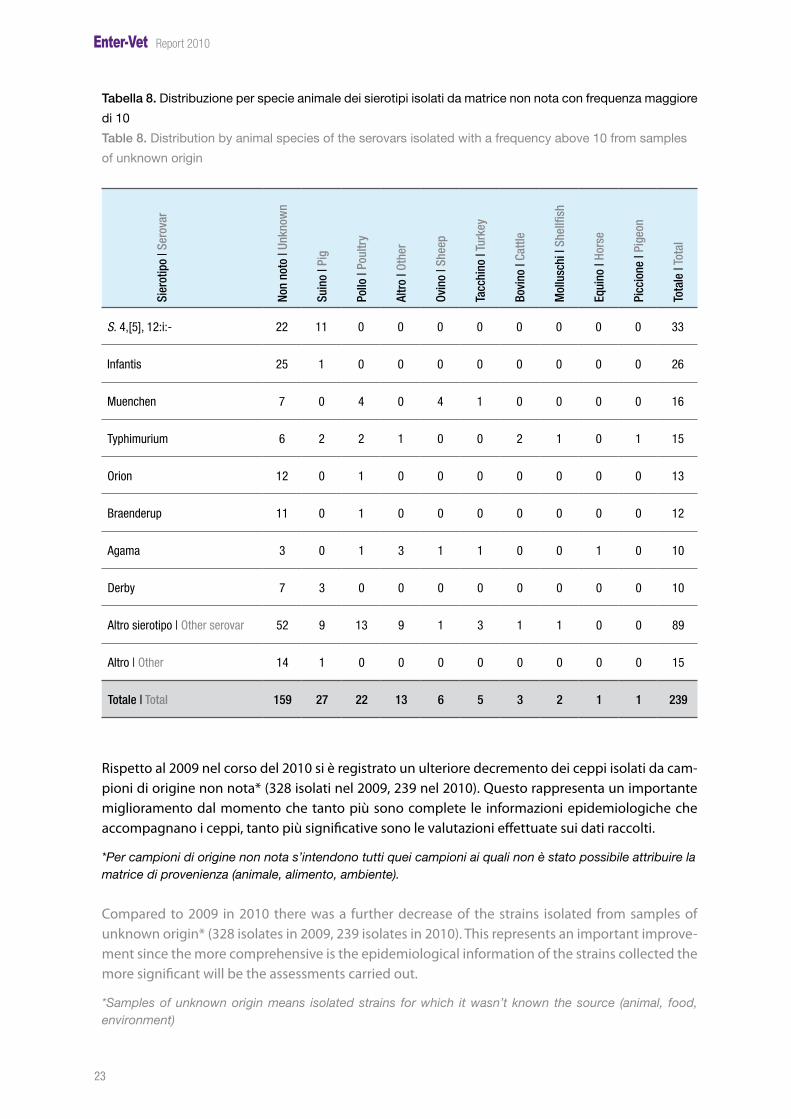
Rispetto al 2009 nel corso del 2010 si è registrato un ulteriore decremento dei ceppi isolati da cam-pioni di origine non nota* (328 isolati nel 2009, 239 nel 2010). Questo rappresenta un importante miglioramento dal momento che tanto più sono complete le informazioni epidemiologiche che accompagnano i ceppi, tanto più significative sono le valutazioni effettuate sui dati raccolti.
*Per campioni di origine non nota s’intendono tutti quei campioni ai quali non è stato possibile attribuire lamatrice di provenienza (animale, alimento, ambiente).
Compared to 2009 in 2010 there was a further decrease of the strains isolated from samples of unknown origin* (328 isolates in 2009, 239 isolates in 2010). This represents an important improve-ment since the more comprehensive is the epidemiological information of the strains collected the more significant will be the assessments carried out.
*Samples of unknown origin means isolated strains for which it wasn’t known the source (animal, food, environment)
24
Report 2010
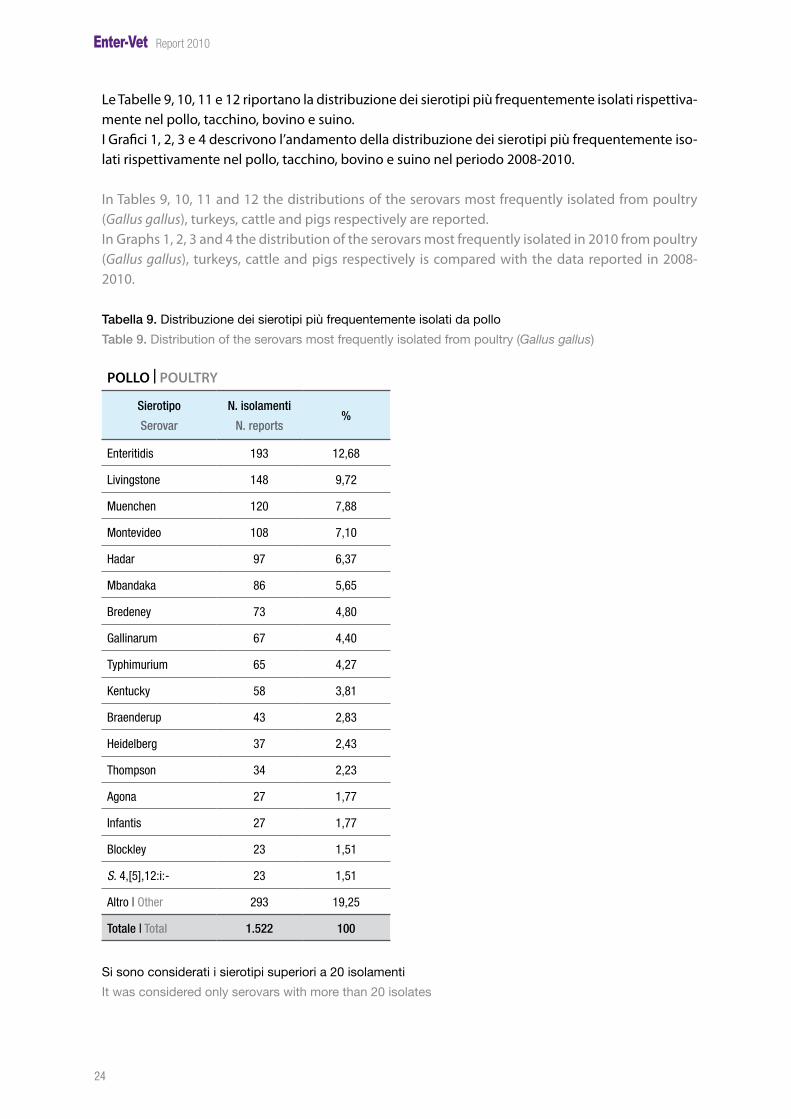
Le Tabelle 9, 10, 11 e 12 riportano la distribuzione dei sierotipi più frequentemente isolati rispettiva-mente nel pollo, tacchino, bovino e suino.I Grafici 1, 2, 3 e 4 descrivono l’andamento della distribuzione dei sierotipi più frequentemente iso-lati rispettivamente nel pollo, tacchino, bovino e suino nel periodo 2008-2010.
In Tables 9, 10, 11 and 12 the distributions of the serovars most frequently isolated from poultry (Gallus gallus), turkeys, cattle and pigs respectively are reported. In Graphs 1, 2, 3 and 4 the distribution of the serovars most frequently isolated in 2010 from poultry (Gallus gallus), turkeys, cattle and pigs respectively is compared with the data reported in 2008-2010.
Tabella 9. Distribuzione dei sierotipi più frequentemente isolati da pollo
Table 9. Distribution of the serovars most frequently isolated from poultry (Gallus gallus)
POLLO | POULTRY
Sierotipo
Serovar
N. isolamenti
N. reports%
Enteritidis 193 12,68
Livingstone 148 9,72
Muenchen 120 7,88
Montevideo 108 7,10
Hadar 97 6,37
Mbandaka 86 5,65
Bredeney 73 4,80
Gallinarum 67 4,40
Typhimurium 65 4,27
Kentucky 58 3,81
Braenderup 43 2,83
Heidelberg 37 2,43
Thompson 34 2,23
Agona 27 1,77
Infantis 27 1,77
Blockley 23 1,51
S. 4,[5],12:i:- 23 1,51
Altro | Other 293 19,25
Totale | Total 1.522 100
Si sono considerati i sierotipi superiori a 20 isolamenti
It was considered only serovars with more than 20 isolates
25
Report 2010
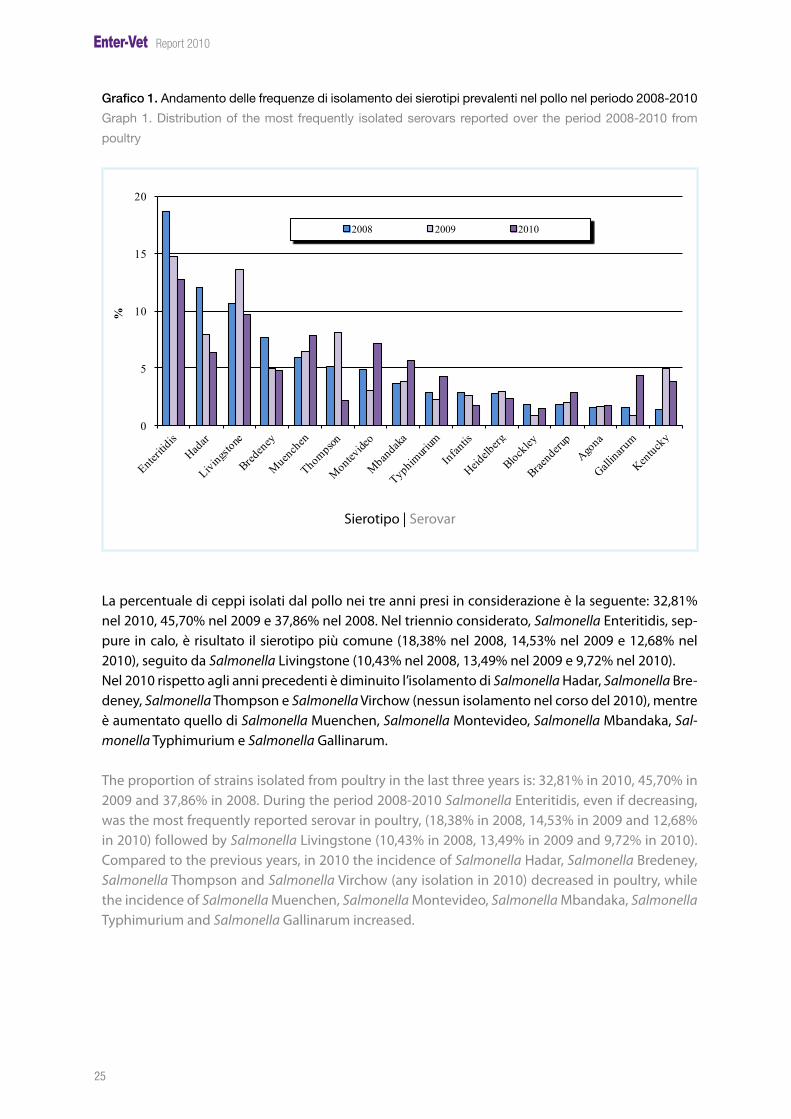
Grafico 1. Andamento delle frequenze di isolamento dei sierotipi prevalenti nel pollo nel periodo 2008-2010
Graph 1. Distribution of the most frequently isolated serovars reported over the period 2008-2010 from
poultry
0
5
10
15
20
%
2008 2009 2010
Sierotipo |Serovar
La percentuale di ceppi isolati dal pollo nei tre anni presi in considerazione è la seguente: 32,81% nel 2010, 45,70% nel 2009 e 37,86% nel 2008. Nel triennio considerato, Salmonella Enteritidis, sep-pure in calo, è risultato il sierotipo più comune (18,38% nel 2008, 14,53% nel 2009 e 12,68% nel 2010), seguito da Salmonella Livingstone (10,43% nel 2008, 13,49% nel 2009 e 9,72% nel 2010). Nel 2010 rispetto agli anni precedenti è diminuito l’isolamento di Salmonella Hadar, Salmonella Bre-deney, Salmonella Thompson e Salmonella Virchow (nessun isolamento nel corso del 2010), mentre è aumentato quello di Salmonella Muenchen, Salmonella Montevideo, Salmonella Mbandaka, Sal-monella Typhimurium e Salmonella Gallinarum.
The proportion of strains isolated from poultry in the last three years is: 32,81% in 2010, 45,70% in 2009 and 37,86% in 2008. During the period 2008-2010 Salmonella Enteritidis, even if decreasing, was the most frequently reported serovar in poultry, (18,38% in 2008, 14,53% in 2009 and 12,68% in 2010) followed by Salmonella Livingstone (10,43% in 2008, 13,49% in 2009 and 9,72% in 2010). Compared to the previous years, in 2010 the incidence of Salmonella Hadar, Salmonella Bredeney, Salmonella Thompson and Salmonella Virchow (any isolation in 2010) decreased in poultry, while the incidence of Salmonella Muenchen, Salmonella Montevideo, Salmonella Mbandaka, Salmonella Typhimurium and Salmonella Gallinarum increased.

26
Report 2010
Tabella 10. Distribuzione dei sierotipi più frequentemente isolati da tacchino
Table 10. Distribution of the serovars most frequently isolated from turkeys
TACChINO | TURKEY
Sierotipo
Serovar
N. isolamenti
N. reports%
Newport 162 43,32
Saintpaul 42 11,23
Schwarzengrund 35 9,36
Agama 23 6,15
Bredeney 21 5,61
Typhimurium 21 5,61
S. 4,[5],12:i:- 17 4,55
Blockley 9 2,41
Brandenburg 6 1,60
Enteritidis 6 1,60
Hadar 6 1,60
Kottbus 4 1,07
Muenchen 4 1,07
Altro | Other 18 4,81
Totale | Total 374 100
Si sono considerati i sierotipi superiori a 4 isolamenti
It was considered only serovars with more than 4 isolates
27
Report 2010
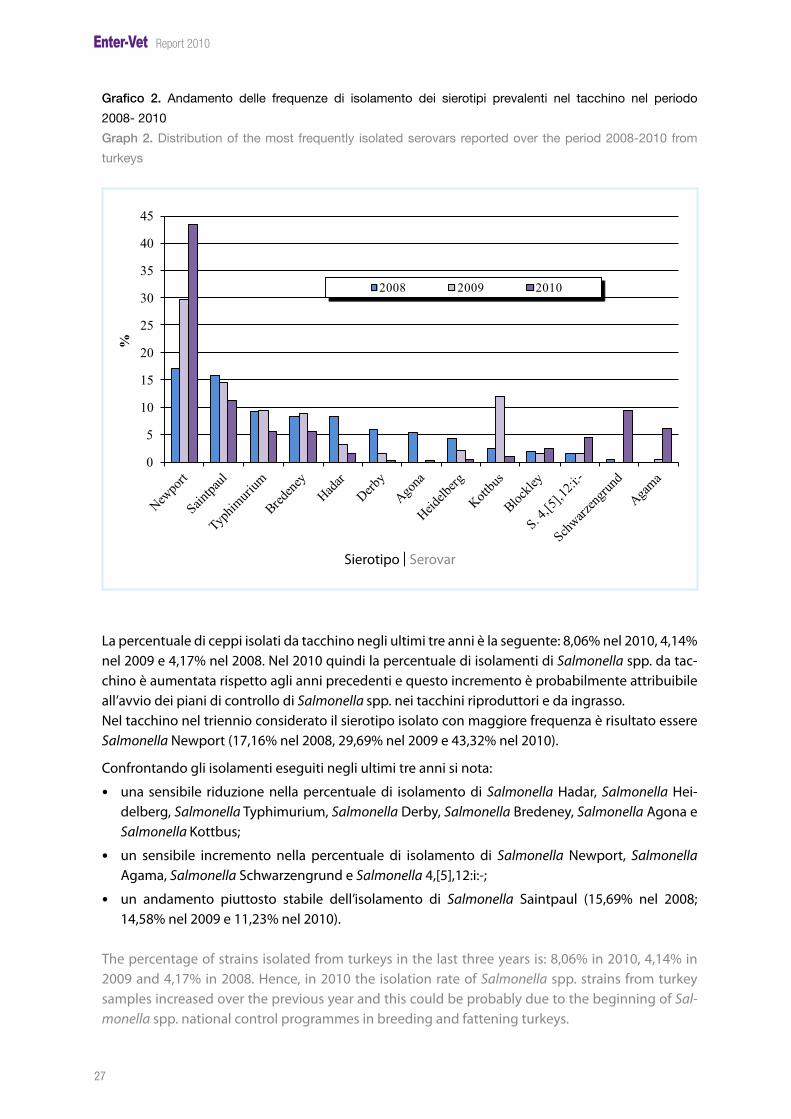
Grafico 2. Andamento delle frequenze di isolamento dei sierotipi prevalenti nel tacchino nel periodo
2008- 2010
Graph 2. Distribution of the most frequently isolated serovars reported over the period 2008-2010 from
turkeys
0
5
10
15
20
25
30
35
40
45
%
2008 2009 2010
Sierotipo |Serovar
La percentuale di ceppi isolati da tacchino negli ultimi tre anni è la seguente: 8,06% nel 2010, 4,14% nel 2009 e 4,17% nel 2008. Nel 2010 quindi la percentuale di isolamenti di Salmonella spp. da tac-chino è aumentata rispetto agli anni precedenti e questo incremento è probabilmente attribuibile all’avvio dei piani di controllo di Salmonella spp. nei tacchini riproduttori e da ingrasso. Nel tacchino nel triennio considerato il sierotipo isolato con maggiore frequenza è risultato essere Salmonella Newport (17,16% nel 2008, 29,69% nel 2009 e 43,32% nel 2010).
Confrontando gli isolamenti eseguiti negli ultimi tre anni si nota:
• una sensibile riduzione nella percentuale di isolamento di Salmonella Hadar, Salmonella Hei-delberg, Salmonella Typhimurium, Salmonella Derby, Salmonella Bredeney, Salmonella Agona e Salmonella Kottbus;
• un sensibile incremento nella percentuale di isolamento di Salmonella Newport, Salmonella Agama, Salmonella Schwarzengrund e Salmonella 4,[5],12:i:-;
• un andamento piuttosto stabile dell’isolamento di Salmonella Saintpaul (15,69% nel 2008; 14,58% nel 2009 e 11,23% nel 2010).
The percentage of strains isolated from turkeys in the last three years is: 8,06% in 2010, 4,14% in 2009 and 4,17% in 2008. Hence, in 2010 the isolation rate of Salmonella spp. strains from turkey samples increased over the previous year and this could be probably due to the beginning of Sal-monella spp. national control programmes in breeding and fattening turkeys.
28
Report 2010
During 2008-2010 Salmonella Newport (17,16% in 2008, 29,69% in 2009 and 43,32% in 2010) was the most common serotype in turkeys.
Comparing the frequency of isolation in the three years it can be noted that there was:
• a relevant decrease in the rate of isolation of Salmonella Hadar, Salmonella Heidelberg, Salmo-nella Typhimurium, Salmonella Derby, Salmonella Bredeney, Salmonella Agona and Salmonella Kottbus;
• a relevant increase in the rate of isolation of Salmonella Newport, Salmonella Agama, Salmonella Schwarzengrund and Salmonella 4,[5],12:i:-;
• a substantial variation among years of the rate of isolation of Salmonella Saintpaul (15,69% in 2008; 14,58% in 2009 and 11,23% in 2010).
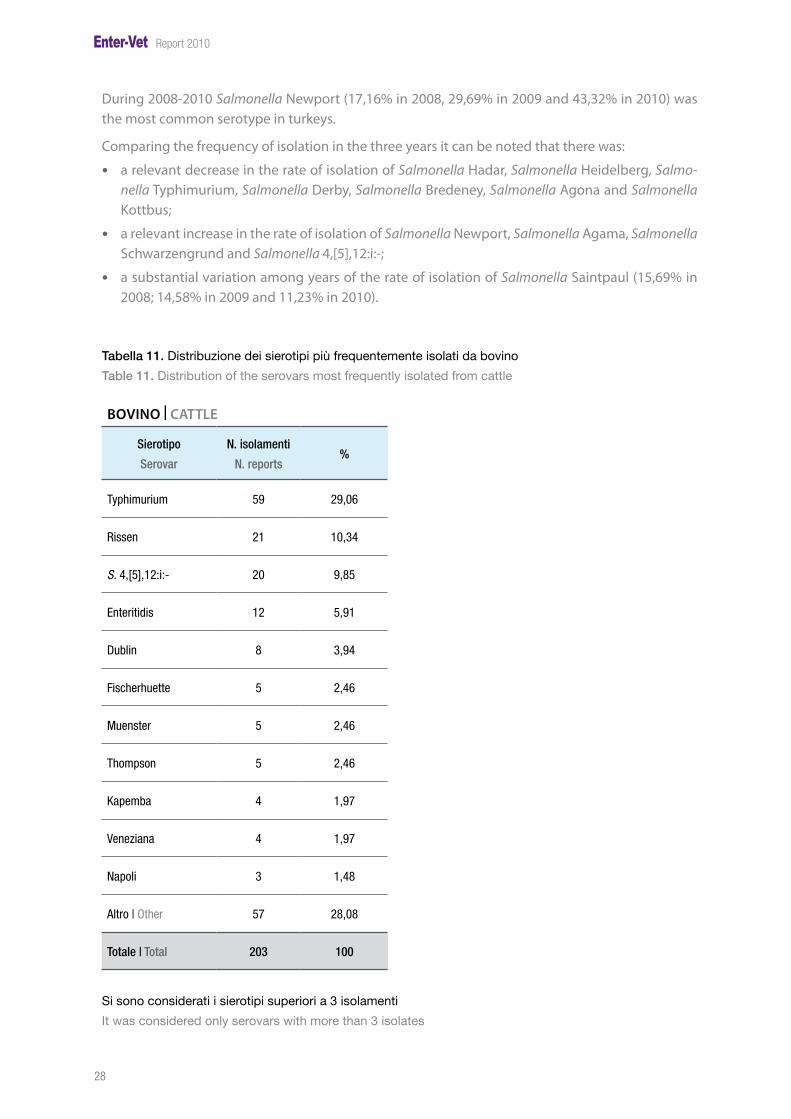
Tabella 11. Distribuzione dei sierotipi più frequentemente isolati da bovino
Table 11. Distribution of the serovars most frequently isolated from cattle
BOVINO | CATTLE
Sierotipo
Serovar
N. isolamenti
N. reports%
Typhimurium 59 29,06
Rissen 21 10,34
S. 4,[5],12:i:- 20 9,85
Enteritidis 12 5,91
Dublin 8 3,94
Fischerhuette 5 2,46
Muenster 5 2,46
Thompson 5 2,46
Kapemba 4 1,97
Veneziana 4 1,97
Napoli 3 1,48
Altro | Other 57 28,08
Totale | Total 203 100
Si sono considerati i sierotipi superiori a 3 isolamenti
It was considered only serovars with more than 3 isolates
29
Report 2010
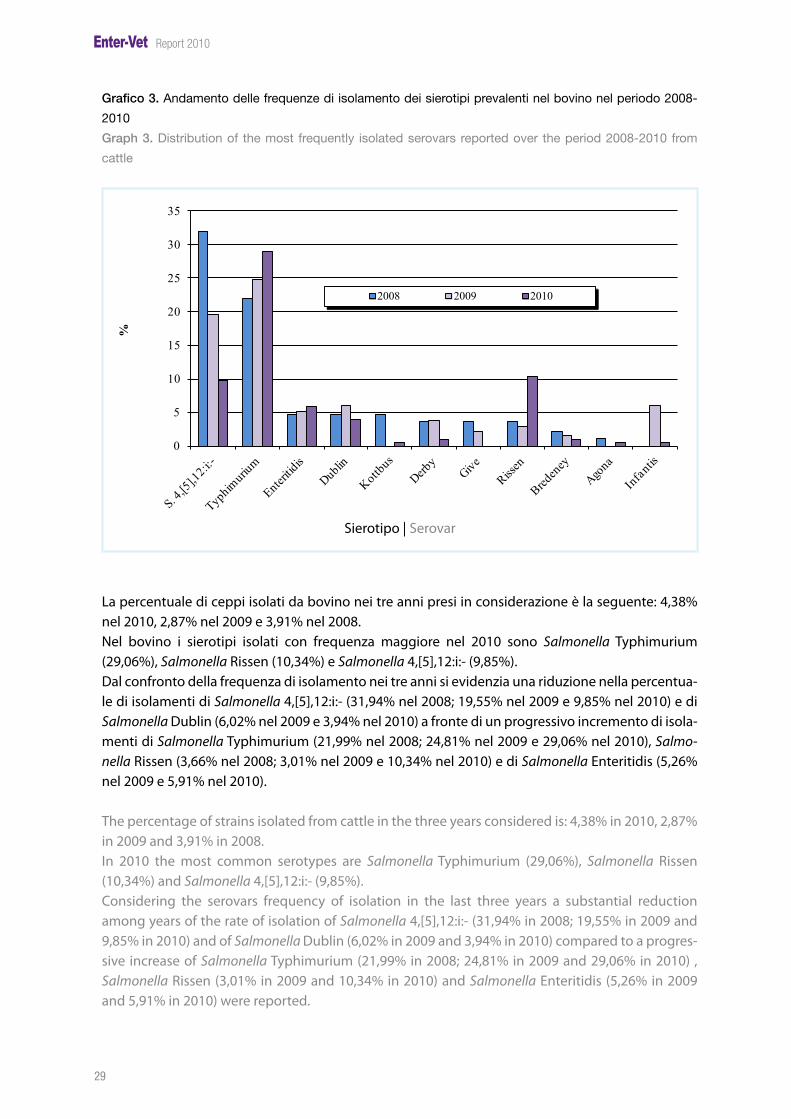
Grafico 3. Andamento delle frequenze di isolamento dei sierotipi prevalenti nel bovino nel periodo 2008-
2010
Graph 3. Distribution of the most frequently isolated serovars reported over the period 2008-2010 from
cattle
0
5
10
15
20
25
30
35
%
2008 2009 2010
Sierotipo |Serovar
La percentuale di ceppi isolati da bovino nei tre anni presi in considerazione è la seguente: 4,38% nel 2010, 2,87% nel 2009 e 3,91% nel 2008. Nel bovino i sierotipi isolati con frequenza maggiore nel 2010 sono Salmonella Typhimurium (29,06%), Salmonella Rissen (10,34%) e Salmonella 4,[5],12:i:- (9,85%).Dal confronto della frequenza di isolamento nei tre anni si evidenzia una riduzione nella percentua-le di isolamenti di Salmonella 4,[5],12:i:- (31,94% nel 2008; 19,55% nel 2009 e 9,85% nel 2010) e di Salmonella Dublin (6,02% nel 2009 e 3,94% nel 2010) a fronte di un progressivo incremento di isola-menti di Salmonella Typhimurium (21,99% nel 2008; 24,81% nel 2009 e 29,06% nel 2010), Salmo-nella Rissen (3,66% nel 2008; 3,01% nel 2009 e 10,34% nel 2010) e di Salmonella Enteritidis (5,26% nel 2009 e 5,91% nel 2010).
The percentage of strains isolated from cattle in the three years considered is: 4,38% in 2010, 2,87% in 2009 and 3,91% in 2008. In 2010 the most common serotypes are Salmonella Typhimurium (29,06%), Salmonella Rissen (10,34%) and Salmonella 4,[5],12:i:- (9,85%).Considering the serovars frequency of isolation in the last three years a substantial reduction among years of the rate of isolation of Salmonella 4,[5],12:i:- (31,94% in 2008; 19,55% in 2009 and 9,85% in 2010) and of Salmonella Dublin (6,02% in 2009 and 3,94% in 2010) compared to a progres-sive increase of Salmonella Typhimurium (21,99% in 2008; 24,81% in 2009 and 29,06% in 2010) , Salmonella Rissen (3,01% in 2009 and 10,34% in 2010) and Salmonella Enteritidis (5,26% in 2009 and 5,91% in 2010) were reported.
30
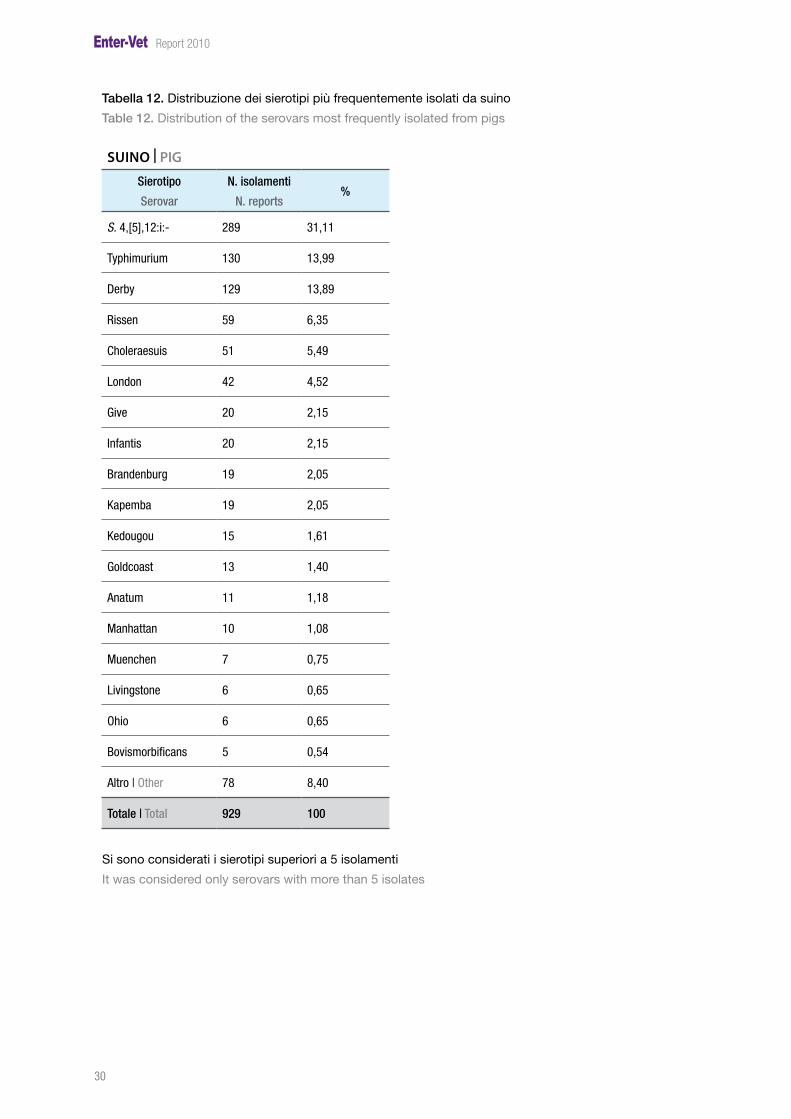
Report 2010
Tabella 12. Distribuzione dei sierotipi più frequentemente isolati da suino
Table 12. Distribution of the serovars most frequently isolated from pigs
SUINO | PIG
Sierotipo
Serovar
N. isolamenti
N. reports%
S. 4,[5],12:i:- 289 31,11
Typhimurium 130 13,99
Derby 129 13,89
Rissen 59 6,35
Choleraesuis 51 5,49
London 42 4,52
Give 20 2,15
Infantis 20 2,15
Brandenburg 19 2,05
Kapemba 19 2,05
Kedougou 15 1,61
Goldcoast 13 1,40
Anatum 11 1,18
Manhattan 10 1,08
Muenchen 7 0,75
Livingstone 6 0,65
Ohio 6 0,65
Bovismorbificans 5 0,54
Altro | Other 78 8,40
Totale | Total 929 100
Si sono considerati i sierotipi superiori a 5 isolamenti
It was considered only serovars with more than 5 isolates
31
Report 2010
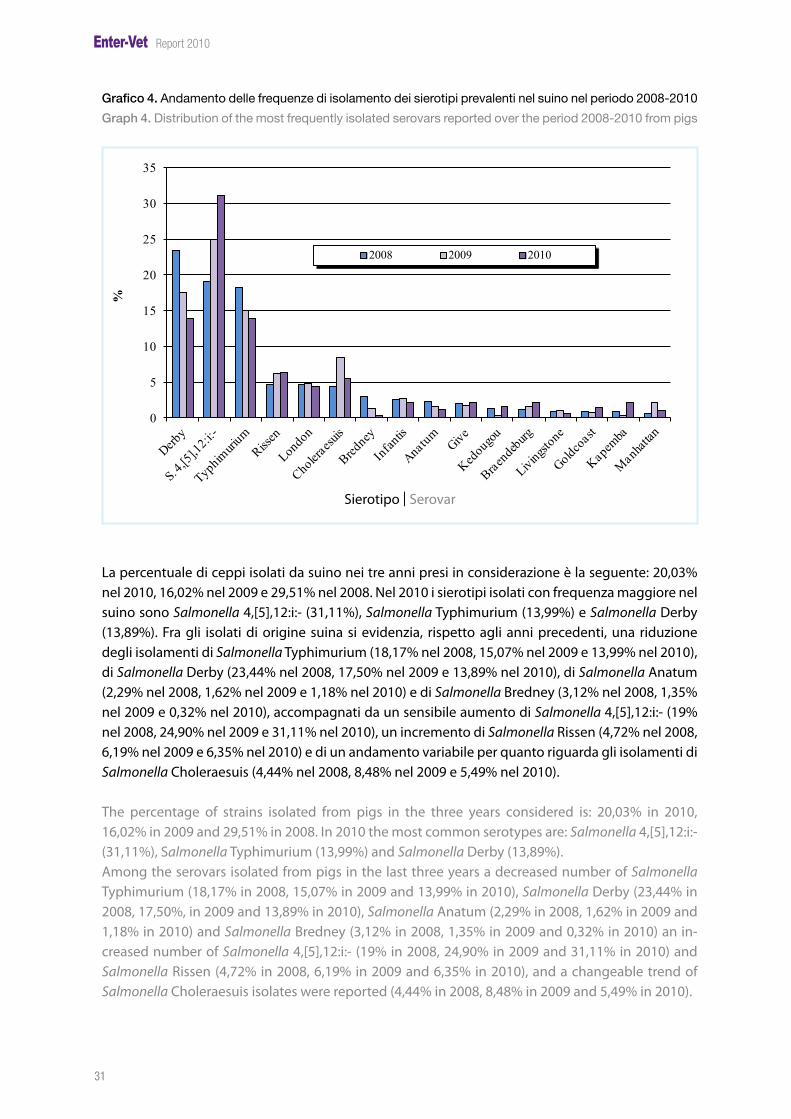
Grafico 4. Andamento delle frequenze di isolamento dei sierotipi prevalenti nel suino nel periodo 2008-2010
Graph 4. Distribution of the most frequently isolated serovars reported over the period 2008-2010 from pigs
0
5
10
15
20
25
30
35
%
2008 2009 2010
Sierotipo |Serovar
La percentuale di ceppi isolati da suino nei tre anni presi in considerazione è la seguente: 20,03% nel 2010, 16,02% nel 2009 e 29,51% nel 2008. Nel 2010 i sierotipi isolati con frequenza maggiore nel suino sono Salmonella 4,[5],12:i:- (31,11%), Salmonella Typhimurium (13,99%) e Salmonella Derby (13,89%). Fra gli isolati di origine suina si evidenzia, rispetto agli anni precedenti, una riduzione degli isolamenti di Salmonella Typhimurium (18,17% nel 2008, 15,07% nel 2009 e 13,99% nel 2010), di Salmonella Derby (23,44% nel 2008, 17,50% nel 2009 e 13,89% nel 2010), di Salmonella Anatum (2,29% nel 2008, 1,62% nel 2009 e 1,18% nel 2010) e di Salmonella Bredney (3,12% nel 2008, 1,35% nel 2009 e 0,32% nel 2010), accompagnati da un sensibile aumento di Salmonella 4,[5],12:i:- (19% nel 2008, 24,90% nel 2009 e 31,11% nel 2010), un incremento di Salmonella Rissen (4,72% nel 2008, 6,19% nel 2009 e 6,35% nel 2010) e di un andamento variabile per quanto riguarda gli isolamenti di Salmonella Choleraesuis (4,44% nel 2008, 8,48% nel 2009 e 5,49% nel 2010).
The percentage of strains isolated from pigs in the three years considered is: 20,03% in 2010, 16,02% in 2009 and 29,51% in 2008. In 2010 the most common serotypes are: Salmonella 4,[5],12:i:- (31,11%), Salmonella Typhimurium (13,99%) and Salmonella Derby (13,89%). Among the serovars isolated from pigs in the last three years a decreased number of Salmonella Typhimurium (18,17% in 2008, 15,07% in 2009 and 13,99% in 2010), Salmonella Derby (23,44% in 2008, 17,50%, in 2009 and 13,89% in 2010), Salmonella Anatum (2,29% in 2008, 1,62% in 2009 and 1,18% in 2010) and Salmonella Bredney (3,12% in 2008, 1,35% in 2009 and 0,32% in 2010) an in-creased number of Salmonella 4,[5],12:i:- (19% in 2008, 24,90% in 2009 and 31,11% in 2010) and Salmonella Rissen (4,72% in 2008, 6,19% in 2009 and 6,35% in 2010), and a changeable trend of Salmonella Choleraesuis isolates were reported (4,44% in 2008, 8,48% in 2009 and 5,49% in 2010).
33
Report 2010
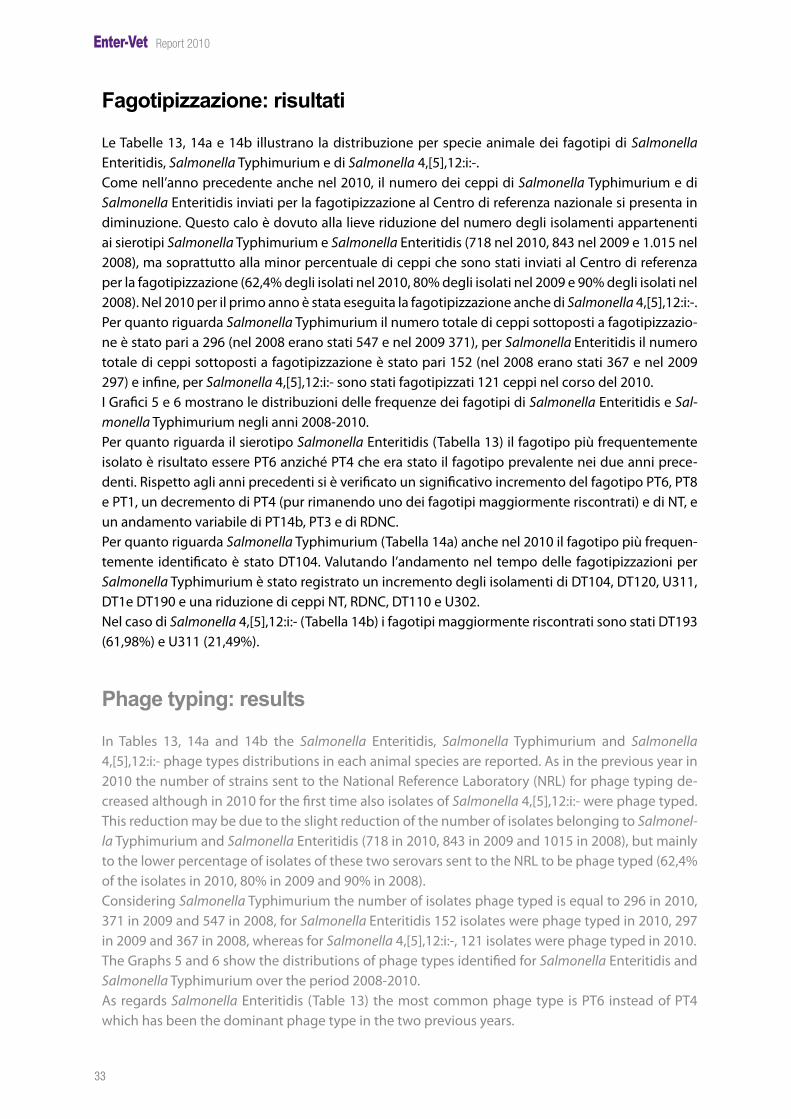
Fagotipizzazione: risultati
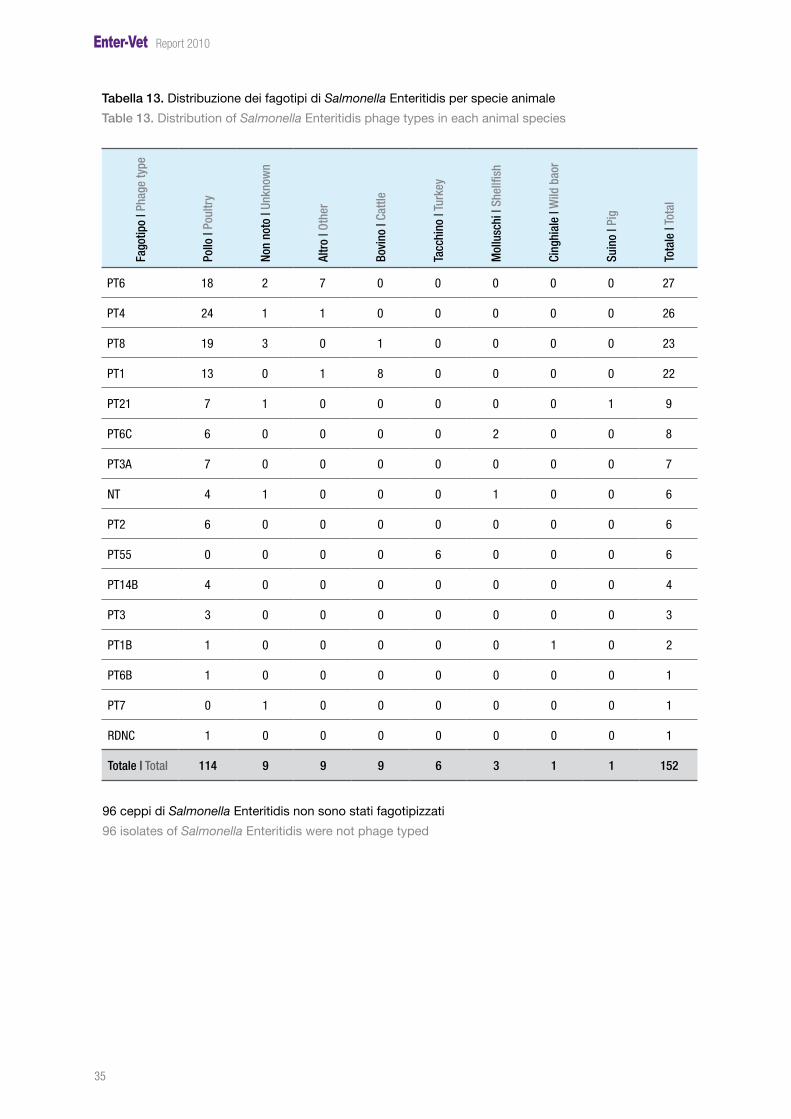
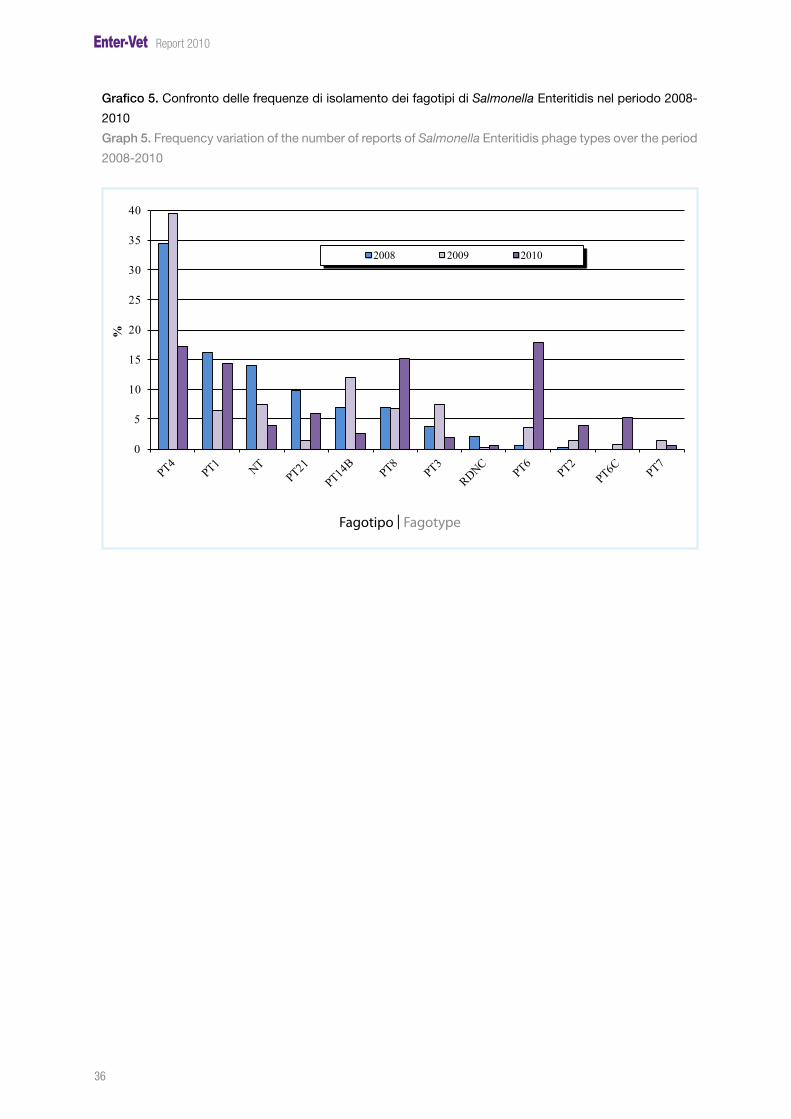
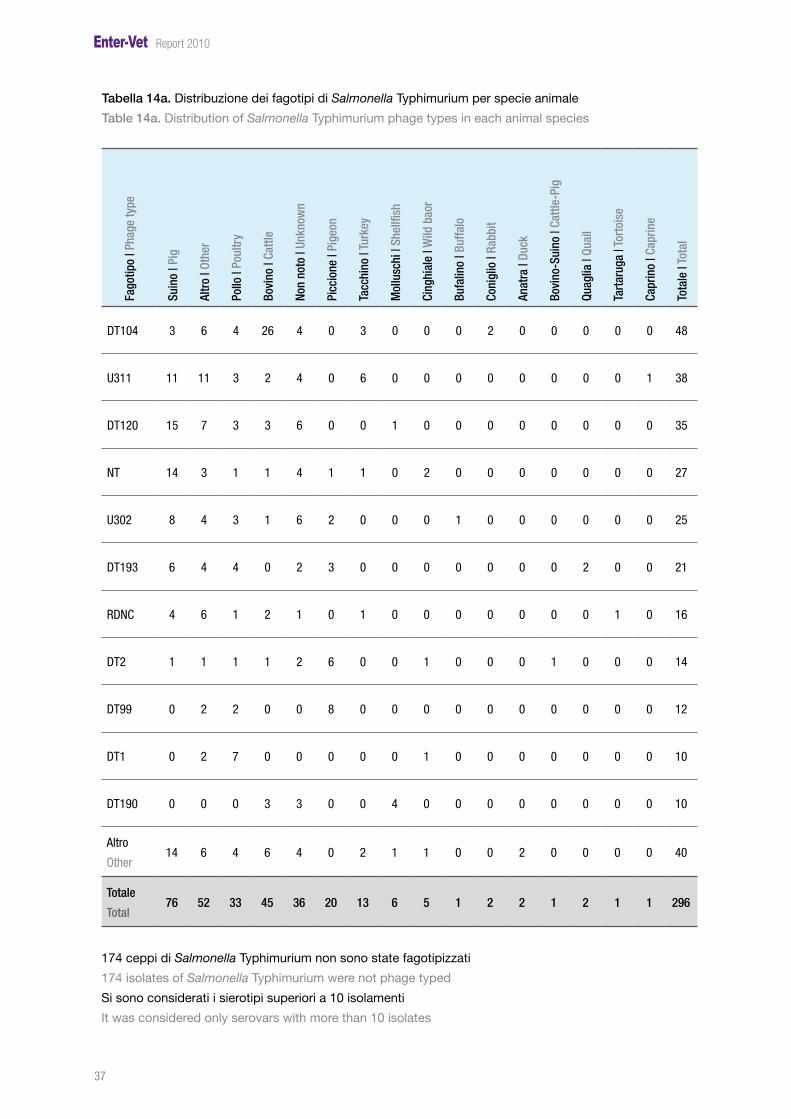
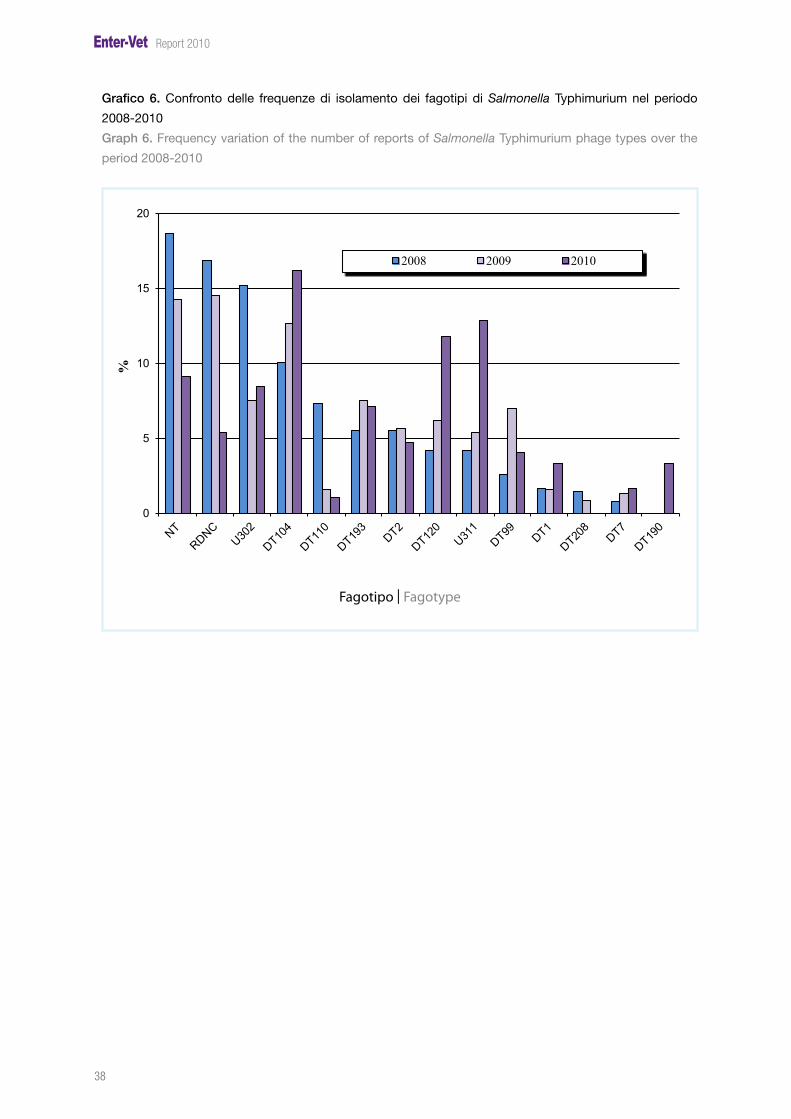
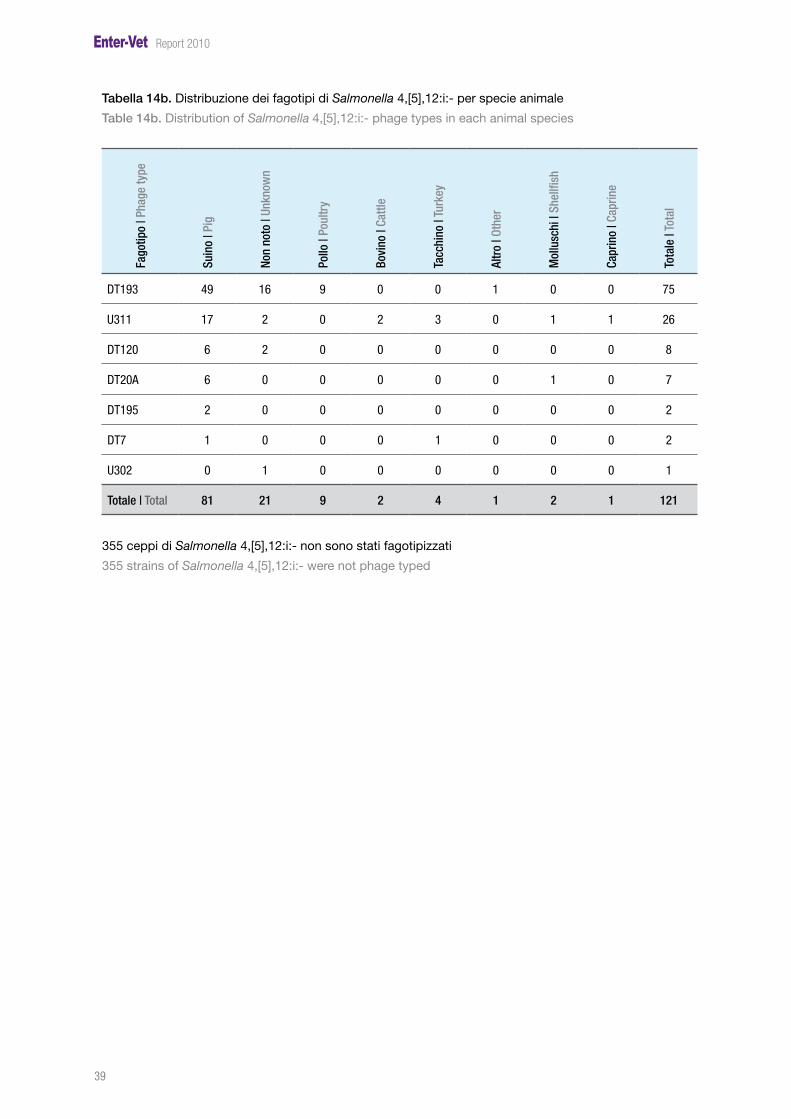
Le Tabelle 13, 14a e 14b illustrano la distribuzione per specie animale dei fagotipi di Salmonella Enteritidis, Salmonella Typhimurium e di Salmonella 4,[5],12:i:-.Come nell’anno precedente anche nel 2010, il numero dei ceppi di Salmonella Typhimurium e di Salmonella Enteritidis inviati per la fagotipizzazione al Centro di referenza nazionale si presenta in diminuzione. Questo calo è dovuto alla lieve riduzione del numero degli isolamenti appartenenti ai sierotipi Salmonella Typhimurium e Salmonella Enteritidis (718 nel 2010, 843 nel 2009 e 1.015 nel 2008), ma soprattutto alla minor percentuale di ceppi che sono stati inviati al Centro di referenza per la fagotipizzazione (62,4% degli isolati nel 2010, 80% degli isolati nel 2009 e 90% degli isolati nel 2008). Nel 2010 per il primo anno è stata eseguita la fagotipizzazione anche di Salmonella 4,[5],12:i:-.Per quanto riguarda Salmonella Typhimurium il numero totale di ceppi sottoposti a fagotipizzazio-ne è stato pari a 296 (nel 2008 erano stati 547 e nel 2009 371), per Salmonella Enteritidis il numero totale di ceppi sottoposti a fagotipizzazione è stato pari 152 (nel 2008 erano stati 367 e nel 2009 297) e infine, per Salmonella 4,[5],12:i:- sono stati fagotipizzati 121 ceppi nel corso del 2010. I Grafici 5 e 6 mostrano le distribuzioni delle frequenze dei fagotipi di Salmonella Enteritidis e Sal-monella Typhimurium negli anni 2008-2010. Per quanto riguarda il sierotipo Salmonella Enteritidis (Tabella 13) il fagotipo più frequentemente isolato è risultato essere PT6 anziché PT4 che era stato il fagotipo prevalente nei due anni prece-denti. Rispetto agli anni precedenti si è verificato un significativo incremento del fagotipo PT6, PT8 e PT1, un decremento di PT4 (pur rimanendo uno dei fagotipi maggiormente riscontrati) e di NT, e un andamento variabile di PT14b, PT3 e di RDNC. Per quanto riguarda Salmonella Typhimurium (Tabella 14a) anche nel 2010 il fagotipo più frequen-temente identificato è stato DT104. Valutando l’andamento nel tempo delle fagotipizzazioni per Salmonella Typhimurium è stato registrato un incremento degli isolamenti di DT104, DT120, U311, DT1e DT190 e una riduzione di ceppi NT, RDNC, DT110 e U302. Nel caso di Salmonella 4,[5],12:i:- (Tabella 14b) i fagotipi maggiormente riscontrati sono stati DT193 (61,98%) e U311 (21,49%).
Phage typing: results
In Tables 13, 14a and 14b the Salmonella Enteritidis, Salmonella Typhimurium and Salmonella 4,[5],12:i:- phage types distributions in each animal species are reported. As in the previous year in 2010 the number of strains sent to the National Reference Laboratory (NRL) for phage typing de-creased although in 2010 for the first time also isolates of Salmonella 4,[5],12:i:- were phage typed. This reduction may be due to the slight reduction of the number of isolates belonging to Salmonel-la Typhimurium and Salmonella Enteritidis (718 in 2010, 843 in 2009 and 1015 in 2008), but mainly to the lower percentage of isolates of these two serovars sent to the NRL to be phage typed (62,4% of the isolates in 2010, 80% in 2009 and 90% in 2008). Considering Salmonella Typhimurium the number of isolates phage typed is equal to 296 in 2010, 371 in 2009 and 547 in 2008, for Salmonella Enteritidis 152 isolates were phage typed in 2010, 297 in 2009 and 367 in 2008, whereas for Salmonella 4,[5],12:i:-, 121 isolates were phage typed in 2010. The Graphs 5 and 6 show the distributions of phage types identified for Salmonella Enteritidis and Salmonella Typhimurium over the period 2008-2010.As regards Salmonella Enteritidis (Table 13) the most common phage type is PT6 instead of PT4 which has been the dominant phage type in the two previous years.
34
Report 2010
Compared to previous years there has been a significant increase of phage type PT6, PT8 and PT1, a reduction in the frequency of identification of PT4 (anyway, it remained one of the phage types mostly found) and NT, and a variable trend for PT14b, PT3 and RDNC. As far as Salmonella Typhimurium is concerned (Table 14a) the most frequently isolated phage type in 2010 was DT104. Considering the trend of identification of different phage types of Salmonella Typhimurium, an increase in the identification of DT104, DT120, U311, DT1 and DT190 and a de-crease in the identification of NT, RDNC, DT110 and U302 was recorded.Considering Salmonella 4,[5],12:i:- (Table 14b) the most common phage types were DT 193 (61,98%) and U311 (21,49%).
35
Report 2010
Tabella 13. Distribuzione dei fagotipi di Salmonella Enteritidis per specie animale
Table 13. Distribution of Salmonella Enteritidis phage types in each animal species
Fago
tipo
| Pha
ge ty
pe
Pollo
| Po
ultr
y
Non
noto
| Un
know
n
Altr
o | O
ther
Bovi
no |
Cattl
e
Tacc
hino
| Tu
rkey
Mol
lusc
hi |
Shel
lfish
Cing
hial
e | W
ild b
aor
Suin
o | P
ig
Tota
le |
Tota
l
PT6 18 2 7 0 0 0 0 0 27
PT4 24 1 1 0 0 0 0 0 26
PT8 19 3 0 1 0 0 0 0 23
PT1 13 0 1 8 0 0 0 0 22
PT21 7 1 0 0 0 0 0 1 9
PT6C 6 0 0 0 0 2 0 0 8
PT3A 7 0 0 0 0 0 0 0 7
NT 4 1 0 0 0 1 0 0 6
PT2 6 0 0 0 0 0 0 0 6
PT55 0 0 0 0 6 0 0 0 6
PT14B 4 0 0 0 0 0 0 0 4
PT3 3 0 0 0 0 0 0 0 3
PT1B 1 0 0 0 0 0 1 0 2
PT6B 1 0 0 0 0 0 0 0 1
PT7 0 1 0 0 0 0 0 0 1
RDNC 1 0 0 0 0 0 0 0 1
Totale | Total 114 9 9 9 6 3 1 1 152
96 ceppi di Salmonella Enteritidis non sono stati fagotipizzati
96 isolates of Salmonella Enteritidis were not phage typed
36
Report 2010
Grafico 5. Confronto delle frequenze di isolamento dei fagotipi di Salmonella Enteritidis nel periodo 2008-
2010
Graph 5. Frequency variation of the number of reports of Salmonella Enteritidis phage types over the period
2008-2010
0
5
10
15
20
25
30
35
40
%
2008 2009 2010
Fagotipo |Fagotype
37
Report 2010
Tabella 14a. Distribuzione dei fagotipi di Salmonella Typhimurium per specie animale
Table 14a. Distribution of Salmonella Typhimurium phage types in each animal speciesFa
gotip
o | P
hage
type
Suin
o | P
ig
Altr
o | O
ther
Pollo
| Po
ultr
y
Bovi
no |
Cattl
e
Non
noto
| Un
know
n
Picc
ione
| Pi
geon
Tacc
hino
| Tu
rkey
Mol
lusc
hi |
Shel
lfish
Cing
hial
e | W
ild b
aor
Bufa
lino
| Buf
falo
Coni
glio
| Ra
bbit
Anat
ra |
Duck
Bovi
no-S
uino
| Ca
ttle-
Pig
Quag
lia |
Quai
l
Tart
arug
a | T
orto
ise
Capr
ino
| Cap
rine
Tota
le |
Tota
l
DT104 3 6 4 26 4 0 3 0 0 0 2 0 0 0 0 0 48
U311 11 11 3 2 4 0 6 0 0 0 0 0 0 0 0 1 38
DT120 15 7 3 3 6 0 0 1 0 0 0 0 0 0 0 0 35
NT 14 3 1 1 4 1 1 0 2 0 0 0 0 0 0 0 27
U302 8 4 3 1 6 2 0 0 0 1 0 0 0 0 0 0 25
DT193 6 4 4 0 2 3 0 0 0 0 0 0 0 2 0 0 21
RDNC 4 6 1 2 1 0 1 0 0 0 0 0 0 0 1 0 16
DT2 1 1 1 1 2 6 0 0 1 0 0 0 1 0 0 0 14
DT99 0 2 2 0 0 8 0 0 0 0 0 0 0 0 0 0 12
DT1 0 2 7 0 0 0 0 0 1 0 0 0 0 0 0 0 10
DT190 0 0 0 3 3 0 0 4 0 0 0 0 0 0 0 0 10
Altro
Other14 6 4 6 4 0 2 1 1 0 0 2 0 0 0 0 40
Totale
Total76 52 33 45 36 20 13 6 5 1 2 2 1 2 1 1 296
174 ceppi di Salmonella Typhimurium non sono state fagotipizzati
174 isolates of Salmonella Typhimurium were not phage typed
Si sono considerati i sierotipi superiori a 10 isolamenti
It was considered only serovars with more than 10 isolates
38
Report 2010
Grafico 6. Confronto delle frequenze di isolamento dei fagotipi di Salmonella Typhimurium nel periodo
2008-2010
Graph 6. Frequency variation of the number of reports of Salmonella Typhimurium phage types over the
period 2008-2010
0
5
10
15
20
%
2008 2009 2010
Fagotipo |Fagotype
39
Report 2010
Tabella 14b. Distribuzione dei fagotipi di Salmonella 4,[5],12:i:- per specie animale
Table 14b. Distribution of Salmonella 4,[5],12:i:- phage types in each animal species
Fago
tipo
| Pha
ge ty
pe
Suin
o | P
ig
Non
noto
| Un
know
n
Pollo
| Po
ultr
y
Bovi
no |
Cattl
e
Tacc
hino
| Tu
rkey
Altr
o | O
ther
Mol
lusc
hi |
Shel
lfish
Capr
ino
| Cap
rine
Tota
le |
Tota
l
DT193 49 16 9 0 0 1 0 0 75
U311 17 2 0 2 3 0 1 1 26
DT120 6 2 0 0 0 0 0 0 8
DT20A 6 0 0 0 0 0 1 0 7
DT195 2 0 0 0 0 0 0 0 2
DT7 1 0 0 0 1 0 0 0 2
U302 0 1 0 0 0 0 0 0 1
Totale | Total 81 21 9 2 4 1 2 1 121
355 ceppi di Salmonella 4,[5],12:i:- non sono stati fagotipizzati
355 strains of Salmonella 4,[5],12:i:- were not phage typed
41
Report 2010
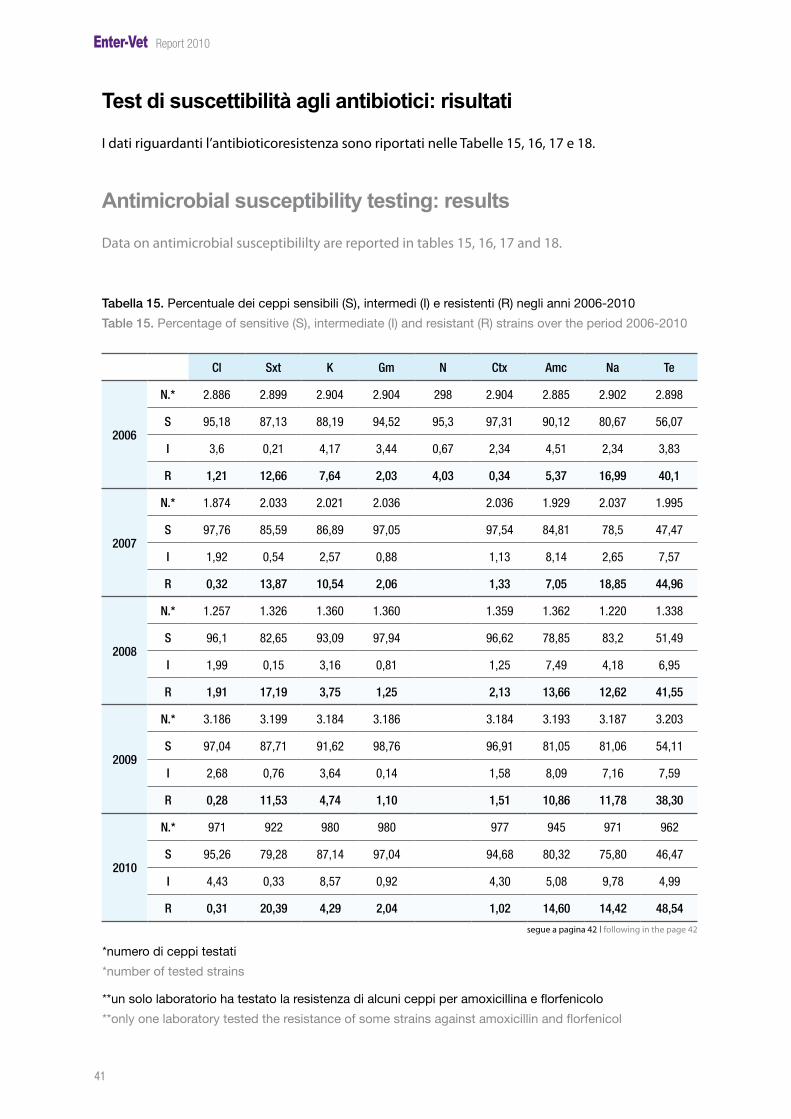
Test di suscettibilità agli antibiotici: risultati
I dati riguardanti l’antibioticoresistenza sono riportati nelle Tabelle 15, 16, 17 e 18.
Antimicrobial susceptibility testing: results
Data on antimicrobial susceptibililty are reported in tables 15, 16, 17 and 18.
Tabella 15. Percentuale dei ceppi sensibili (S), intermedi (I) e resistenti (R) negli anni 2006-2010
Table 15. Percentage of sensitive (S), intermediate (I) and resistant (R) strains over the period 2006-2010
Cl Sxt K Gm N Ctx Amc Na Te
2006
N.* 2.886 2.899 2.904 2.904 298 2.904 2.885 2.902 2.898
S 95,18 87,13 88,19 94,52 95,3 97,31 90,12 80,67 56,07
I 3,6 0,21 4,17 3,44 0,67 2,34 4,51 2,34 3,83
R 1,21 12,66 7,64 2,03 4,03 0,34 5,37 16,99 40,1
2007
N.* 1.874 2.033 2.021 2.036 2.036 1.929 2.037 1.995
S 97,76 85,59 86,89 97,05 97,54 84,81 78,5 47,47
I 1,92 0,54 2,57 0,88 1,13 8,14 2,65 7,57
R 0,32 13,87 10,54 2,06 1,33 7,05 18,85 44,96
2008
N.* 1.257 1.326 1.360 1.360 1.359 1.362 1.220 1.338
S 96,1 82,65 93,09 97,94 96,62 78,85 83,2 51,49
I 1,99 0,15 3,16 0,81 1,25 7,49 4,18 6,95
R 1,91 17,19 3,75 1,25 2,13 13,66 12,62 41,55
2009
N.* 3.186 3.199 3.184 3.186 3.184 3.193 3.187 3.203
S 97,04 87,71 91,62 98,76 96,91 81,05 81,06 54,11
I 2,68 0,76 3,64 0,14 1,58 8,09 7,16 7,59
R 0,28 11,53 4,74 1,10 1,51 10,86 11,78 38,30
2010
N.* 971 922 980 980 977 945 971 962
S 95,26 79,28 87,14 97,04 94,68 80,32 75,80 46,47
I 4,43 0,33 8,57 0,92 4,30 5,08 9,78 4,99
R 0,31 20,39 4,29 2,04 1,02 14,60 14,42 48,54
*numero di ceppi testati
*number of tested strains
**un solo laboratorio ha testato la resistenza di alcuni ceppi per amoxicillina e florfenicolo
**only one laboratory tested the resistance of some strains against amoxicillin and florfenicol
segue a pagina 42 | following in the page 42
42
Report 2010
Am S S3 C Cf Enr Cip Caz
2006
N.* 2.904 2.901 2.875 2.904 2.902 2.888 2.904 2.502
S 73,69 61,19 66,12 91,77 88,35 90,2 99,17 97,52
I 0,41 10,48 6,96 1 7 8,69 0,52 1,44
R 25,9 28,34 26,92 7,23 4,65 1,11 0,31 1,04 Amx** Flo**
2007
N.* 2.016 2.034 1.980 2.032 1.910 2.033 2.012 1.717 117 113
S 64,98 52,85 61,21 92,81 94,92 86,82 99,35 96,33 47,01 84,96
I 1,74 14,5 10,71 1,08 6,34 11,66 0,6 1,28 0,85 4,42
R 33,28 32,65 38,08 6,1 8,74 1,52 0,05 2,39 52,14 10,62
2008
N.* 1.343 1.363 1.313 1.299 1.326 1.354 1.361 1.276
S 69,55 52,6 59,41 88,38 90,12 92,25 99,56 97,73
I 2,01 12,91 5,86 3,77 3,02 5,1 0,15 1,41
R 28,44 34,48 34,73 7,85 6,86 2,66 0,29 0,86
2009
N.* 3.184 3.211 3.189 3.188 3.184 3.189 3.225 3.187
S 70,24 55,11 46,97 91,80 85,50 92,35 99,36 99,24
I 1,24 17,16 9,03 1,38 4,53 6,48 0,43 0,34
R 28,52 27,73 44,00 6,82 9,97 1,17 0,21 0,42
2010
N.* 981 956 899 982 974 979 941 970
S 61,88 55,02 62,07 91,45 76,39 93,05 98,51 95,57
I 2,24 11,82 2,33 1,93 7,70 5,42 1,28 2,58
R 35,88 33,16 35,60 6,62 15,91 1,53 0,21 1,85
*numero di ceppi testati
*number of tested strains
**un solo laboratorio ha testato la resistenza di alcuni ceppi per amoxicillina e florfenicolo
**only one laboratory tested the resistance of some strains against amoxicillin and florfenicol
43
Report 2010
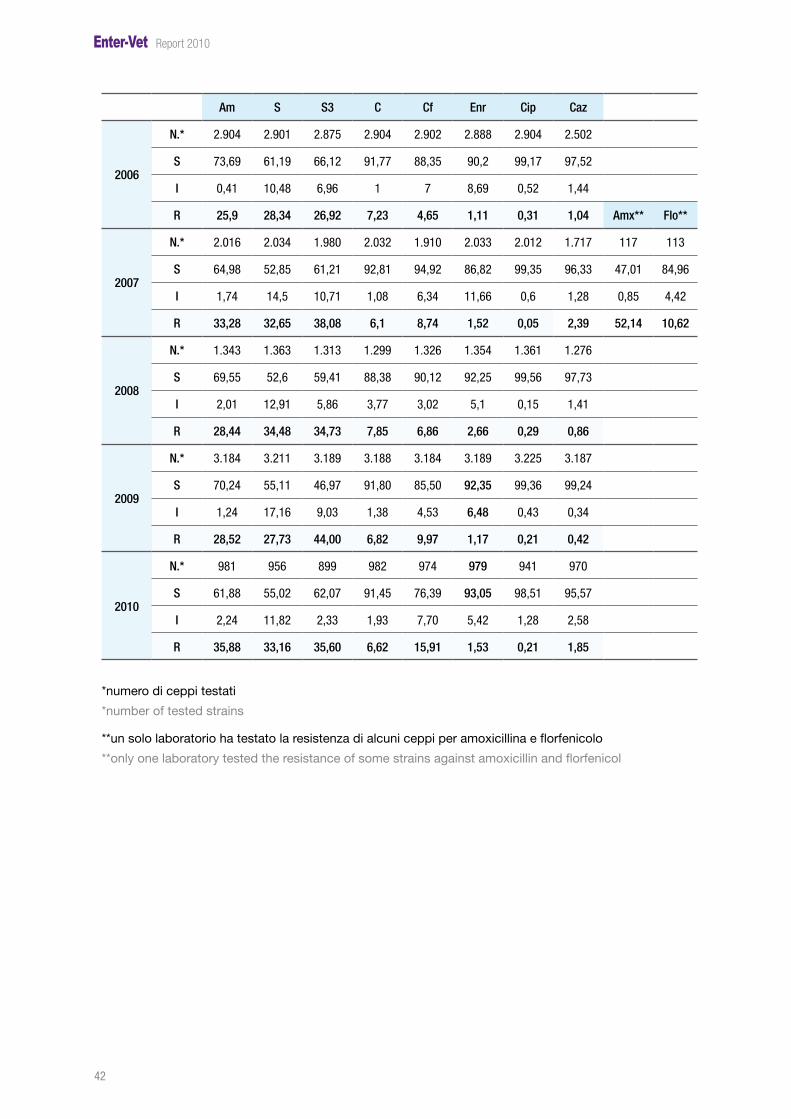
Come si evince dalla Tabella 15 il numero di ceppi testati varia per ciascuna molecola; ciò è ricondu-cibile al fatto che a volte non vengono testate tutte le molecole previste dal pannello, in quanto o vengono adottati pannelli diversi rispetto a quello previsto o non vengono testate tutte le molecole per mancata disponibilità di alcune di esse presso il laboratorio di analisi. L’analisi dei dati permette di confermare quanto già evidenziato negli anni precedenti, sottoline-ando l’elevata percentuale di ceppi resistenti a Tetraciclina (41,55% nel 2008, 38,30% nel 2009 e 48,54% nel 2010), Ampicillina (28,44% nel 2008, 28,52% nel 2009 e 35,88% nel 2010), Sulfonamidi (34,73% nel 2008, 44% nel 2009 e 35,60% nel 2010) e Streptomicina (34,48% nel 2008, 27,73% nel 2009 e 33,16% nel 2010). L’andamento delle resistenze risulta piuttosto variabile. Nel 2010 le percentuali di resistenza an-tibiotica non si discostano molto da quelle registrate nel 2009, a eccezione di Sulfametoxazolo/Trimetoprim, Cefalotina e Ceftazidime che hanno fatto registrare un incremento di resistenza. Le Tabelle 16, 17a e 17b riportano il dettaglio delle resistenze distribuite rispettivamente per siero-tipo, per specie animale e per alimento.
Table 15 shows that the number of strains tested is different for each drug, this is due to the fact that sometimes not all the drugs included in the panel are tested because either different panels from the prescribed one are used or some drugs are temporary not available in the laboratories performing the analysis. The data collected allow to confirm the results of the previous years since a high percentage of strains remain resistant to Tetracycline (41,55% in 2008, 38,30% in 2009 and 48,54% in 2010), Ampi-cillin (28,44% in 2008, 28,52% in 2009 and 35,88% in 2010), Sulphonamides (34,73% in 2008, 44% in 2009 and 35,60% in 2010) and Streptomycin (34,48% in 2008, 27,73% in 2009 and 33,16% in 2010). The antibiotic resistance trend is quite variable; during 2010 the antibiotic resistance percentages were not much different from those recorded in 2009, with the exception of Sulphametoxazole/Tri-methoprim, Cephalotin and Ceftazidime, for which an increase of resistance have been recorded. In Tables 16, 17a and 17b details about the antimicrobial sensitivity considering the serovars, animal species and food are reported.

44
Report 2010
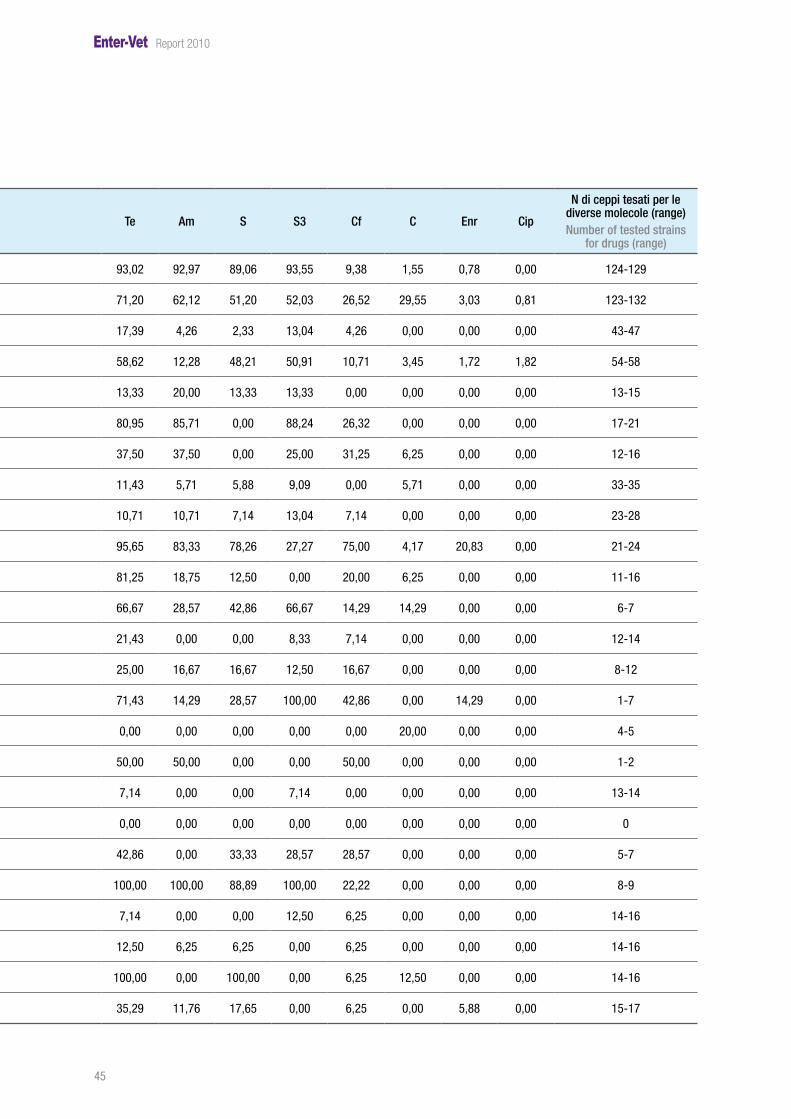
Tabella 16. Percentuali di resistenza (%R) nei sierotipi isolati con frequenza superiore a 40 e numero totale
di ceppi testati per ciascuna molecola (N) nel 2010
Table 16. Rate of resistance (%R) in each isolated serovar (only serovars with a frequency of isolation
above 40 are considered) and number of tested strains for each drug (N) in 2010
Sierotipo | Serovar Cl Sxt K Gm Caz Ctx Amc Na Te Am S S3 Cf C Enr Cip
N di ceppi tesati per le diverse molecole (range)
Number of tested strains for drugs (range)
S. 4,[5],12:i:- %R 0,78 11,20 1,55 2,33 0,78 0,00 14,96 15,63 93,02 92,97 89,06 93,55 9,38 1,55 0,78 0,00 124-129
Typhimurium %R 0,00 35,20 5,30 3,05 6,06 4,55 29,92 19,08 71,20 62,12 51,20 52,03 26,52 29,55 3,03 0,81 123-132
Enteritidis %R 0,00 24,44 0,00 0,00 0,00 0,00 8,70 8,70 17,39 4,26 2,33 13,04 4,26 0,00 0,00 0,00 43-47
Derby %R 0,00 16,67 5,26 1,72 0,00 0,00 12,73 1,79 58,62 12,28 48,21 50,91 10,71 3,45 1,72 1,82 54-58
Montevideo %R 0,00 20,00 0,00 0,00 6,67 0,00 0,00 6,67 13,33 20,00 13,33 13,33 0,00 0,00 0,00 0,00 13-15
Newport %R 0,00 90,00 0,00 0,00 0,00 0,00 35,00 5,00 80,95 85,71 0,00 88,24 26,32 0,00 0,00 0,00 17-21
Muenchen %R 0,00 42,86 0,00 0,00 0,00 0,00 33,33 6,25 37,50 37,50 0,00 25,00 31,25 6,25 0,00 0,00 12-16
Livingstone %R 0,00 8,57 0,00 0,00 0,00 0,00 0,00 0,00 11,43 5,71 5,88 9,09 0,00 5,71 0,00 0,00 33-35
Mbandaka %R 0,00 0,00 0,00 0,00 0,00 0,00 0,00 0,00 10,71 10,71 7,14 13,04 7,14 0,00 0,00 0,00 23-28
Hadar %R 0,00 23,81 4,17 4,35 0,00 0,00 56,52 86,96 95,65 83,33 78,26 27,27 75,00 4,17 20,83 0,00 21-24
Rissen %R 0,00 13,33 0,00 0,00 0,00 0,00 0,00 13,33 81,25 18,75 12,50 0,00 20,00 6,25 0,00 0,00 11-16
Bredeney %R 0,00 33,33 42,86 16,67 0,00 0,00 14,29 0,00 66,67 28,57 42,86 66,67 14,29 14,29 0,00 0,00 6-7
Infantis %R 0,00 0,00 0,00 0,00 0,00 0,00 0,00 0,00 21,43 0,00 0,00 8,33 7,14 0,00 0,00 0,00 12-14
London %R 0,00 0,00 8,33 0,00 0,00 0,00 0,00 16,67 25,00 16,67 16,67 12,50 16,67 0,00 0,00 0,00 8-12
Gallinarum %R 0,00 28,57 14,29 0,00 0,00 14,29 0,00 71,43 71,43 14,29 28,57 100,00 42,86 0,00 14,29 0,00 1-7
Kentucky %R 0,00 0,00 0,00 0,00 0,00 0,00 0,00 100,00 0,00 0,00 0,00 0,00 0,00 20,00 0,00 0,00 4-5
Braenderup %R 0,00 100,00 0,00 0,00 0,00 0,00 50,00 0,00 50,00 50,00 0,00 0,00 50,00 0,00 0,00 0,00 1-2
Thompson %R 0,00 7,14 0,00 0,00 0,00 0,00 0,00 0,00 7,14 0,00 0,00 7,14 0,00 0,00 0,00 0,00 13-14
Choleraesuis %R 0,00 0,00 0,00 0,00 0,00 0,00 0,00 0,00 0,00 0,00 0,00 0,00 0,00 0,00 0,00 0,00 0
Agona %R 0,00 20,00 0,00 0,00 0,00 0,00 0,00 14,29 42,86 0,00 33,33 28,57 28,57 0,00 0,00 0,00 5-7
Saintpaul %R 0,00 100,00 0,00 0,00 0,00 11,11 88,89 11,11 100,00 100,00 88,89 100,00 22,22 0,00 0,00 0,00 8-9
Veneziana %R 0,00 18,75 0,00 0,00 0,00 6,25 6,25 12,50 7,14 0,00 0,00 12,50 6,25 0,00 0,00 0,00 14-16
Anatum %R 0,00 0,00 0,00 6,25 0,00 0,00 6,25 0,00 12,50 6,25 6,25 0,00 6,25 0,00 0,00 0,00 14-16
Blockley %R 6,25 0,00 100,00 0,00 0,00 0,00 0,00 100,00 100,00 0,00 100,00 0,00 6,25 12,50 0,00 0,00 14-16
Heidelberg %R 0,00 37,50 0,00 0,00 0,00 0,00 12,50 25,00 35,29 11,76 17,65 0,00 6,25 0,00 5,88 0,00 15-17
45
Report 2010
Tabella 16. Percentuali di resistenza (%R) nei sierotipi isolati con frequenza superiore a 40 e numero totale
di ceppi testati per ciascuna molecola (N) nel 2010
Table 16. Rate of resistance (%R) in each isolated serovar (only serovars with a frequency of isolation
above 40 are considered) and number of tested strains for each drug (N) in 2010
Sierotipo | Serovar Cl Sxt K Gm Caz Ctx Amc Na Te Am S S3 Cf C Enr Cip
N di ceppi tesati per le diverse molecole (range)Number of tested strains
for drugs (range)
S. 4,[5],12:i:- %R 0,78 11,20 1,55 2,33 0,78 0,00 14,96 15,63 93,02 92,97 89,06 93,55 9,38 1,55 0,78 0,00 124-129
Typhimurium %R 0,00 35,20 5,30 3,05 6,06 4,55 29,92 19,08 71,20 62,12 51,20 52,03 26,52 29,55 3,03 0,81 123-132
Enteritidis %R 0,00 24,44 0,00 0,00 0,00 0,00 8,70 8,70 17,39 4,26 2,33 13,04 4,26 0,00 0,00 0,00 43-47
Derby %R 0,00 16,67 5,26 1,72 0,00 0,00 12,73 1,79 58,62 12,28 48,21 50,91 10,71 3,45 1,72 1,82 54-58
Montevideo %R 0,00 20,00 0,00 0,00 6,67 0,00 0,00 6,67 13,33 20,00 13,33 13,33 0,00 0,00 0,00 0,00 13-15
Newport %R 0,00 90,00 0,00 0,00 0,00 0,00 35,00 5,00 80,95 85,71 0,00 88,24 26,32 0,00 0,00 0,00 17-21
Muenchen %R 0,00 42,86 0,00 0,00 0,00 0,00 33,33 6,25 37,50 37,50 0,00 25,00 31,25 6,25 0,00 0,00 12-16
Livingstone %R 0,00 8,57 0,00 0,00 0,00 0,00 0,00 0,00 11,43 5,71 5,88 9,09 0,00 5,71 0,00 0,00 33-35
Mbandaka %R 0,00 0,00 0,00 0,00 0,00 0,00 0,00 0,00 10,71 10,71 7,14 13,04 7,14 0,00 0,00 0,00 23-28
Hadar %R 0,00 23,81 4,17 4,35 0,00 0,00 56,52 86,96 95,65 83,33 78,26 27,27 75,00 4,17 20,83 0,00 21-24
Rissen %R 0,00 13,33 0,00 0,00 0,00 0,00 0,00 13,33 81,25 18,75 12,50 0,00 20,00 6,25 0,00 0,00 11-16
Bredeney %R 0,00 33,33 42,86 16,67 0,00 0,00 14,29 0,00 66,67 28,57 42,86 66,67 14,29 14,29 0,00 0,00 6-7
Infantis %R 0,00 0,00 0,00 0,00 0,00 0,00 0,00 0,00 21,43 0,00 0,00 8,33 7,14 0,00 0,00 0,00 12-14
London %R 0,00 0,00 8,33 0,00 0,00 0,00 0,00 16,67 25,00 16,67 16,67 12,50 16,67 0,00 0,00 0,00 8-12
Gallinarum %R 0,00 28,57 14,29 0,00 0,00 14,29 0,00 71,43 71,43 14,29 28,57 100,00 42,86 0,00 14,29 0,00 1-7
Kentucky %R 0,00 0,00 0,00 0,00 0,00 0,00 0,00 100,00 0,00 0,00 0,00 0,00 0,00 20,00 0,00 0,00 4-5
Braenderup %R 0,00 100,00 0,00 0,00 0,00 0,00 50,00 0,00 50,00 50,00 0,00 0,00 50,00 0,00 0,00 0,00 1-2
Thompson %R 0,00 7,14 0,00 0,00 0,00 0,00 0,00 0,00 7,14 0,00 0,00 7,14 0,00 0,00 0,00 0,00 13-14
Choleraesuis %R 0,00 0,00 0,00 0,00 0,00 0,00 0,00 0,00 0,00 0,00 0,00 0,00 0,00 0,00 0,00 0,00 0
Agona %R 0,00 20,00 0,00 0,00 0,00 0,00 0,00 14,29 42,86 0,00 33,33 28,57 28,57 0,00 0,00 0,00 5-7
Saintpaul %R 0,00 100,00 0,00 0,00 0,00 11,11 88,89 11,11 100,00 100,00 88,89 100,00 22,22 0,00 0,00 0,00 8-9
Veneziana %R 0,00 18,75 0,00 0,00 0,00 6,25 6,25 12,50 7,14 0,00 0,00 12,50 6,25 0,00 0,00 0,00 14-16
Anatum %R 0,00 0,00 0,00 6,25 0,00 0,00 6,25 0,00 12,50 6,25 6,25 0,00 6,25 0,00 0,00 0,00 14-16
Blockley %R 6,25 0,00 100,00 0,00 0,00 0,00 0,00 100,00 100,00 0,00 100,00 0,00 6,25 12,50 0,00 0,00 14-16
Heidelberg %R 0,00 37,50 0,00 0,00 0,00 0,00 12,50 25,00 35,29 11,76 17,65 0,00 6,25 0,00 5,88 0,00 15-17
46
Report 2010
I sierotipi per cui sono state rilevate le percentuali maggiori di resistenza antimicrobica sono risul-tati essere: Salmonella Hadar, Salmonella 4,[5],12:i:-, Salmonella Bredeney, Salmonella Typhimurium, Salmonella Saintpaul e Salmonella Newport. In particolare per Salmonella Hadar è da mettere in evidenza la percentuale di resistenza ai chi-noloni e ai fluorochinoloni (percentuale di resistenza all’Acido Nalidixico e all’Enrofloxacin pari ris-pettivamente a 86,96% e 20,83%), alla Cefalotina (75%), alla Tetraciclina (95,65%), all’Ampicillina (83,33%) e alla Streptomicina (78,26%). Per quanto concerne Salmonella 4,[5],12:i:- circa il 90% dei ceppi analizzati presentava il profilo di tetraresistenza Ampicillina – Streptomicina – Sulfonamidi – Tetraciclina. Anche in Salmonella Typhimurium tale profilo è molto rappresentato, ma questo sierotipo ha dimostrato resistenza anche nei confronti di molti altri antibiotici (Sulfametoxazolo + Trimetoprim: 35,20%, Amoxicillina + Acido Clavulanico: 29,92%, Cefalotina: 26,52%, Cloranfeni-colo: 29,55% e Acido Nalidixico: 19,08%). Tutti i ceppi di Salmonella Saintpaul testati sono risultati resistenti a Sulfametoxazolo/ Trimetoprim, Tetraciclina, Ampicillina e Sulfonamidi (100%), molto elevati per questo sierotipo anche i livelli di resistenza nei confronti di Amoxicillina-Acido Clavu-lanico (88,89%) e Streptomicina (88,89%). Per Salmonella Newport molto elevate sono risultate le resistenze verso Sulfametoxazolo + Trimetoprim (90%), Tetraciclina (80,95%), Ampicillina (85,71%) e Sulfonamidi (88,24%).
The serovars, for which the higher level of resistance was evidenced were: Salmonella Hadar, Salmo-nella 4,[5],12:i:-, Salmonella Bredeney, Salmonella Typhimurium, Salmonella Saintpaul and Salmo-nella Newport. Regarding Salmonella Hadar it is to point out the high level of resistance to quinolones and fluo-roquinolones (resistance to Nalidixic Acid and to Enrofloxacin equal to 89,96% and 20,83% respec-tively), Cephalotin (75%), Tetracycline (95,65%), Ampicillin (83,33%) and Streptomycin (78,26%). As far as Salmonella 4,[5],12:i:- is concerned about 90% of the strains tested showed the following tetraresistance profile: Ampicillin – Streptomycin – Sulphonamide compounds - Tetracycline. The same profile was very common also for Salmonella Typhimurium isolates, but this last serovar pre-sented high level of resistance also to other antimicrobials (Sulphamethoxazole + Trimethoprim: 35,20%, Amoxicyllin + Clavulanic acid: 29,92%, Cephalotin: 26,52%, Chloramphenicol: 29,55% and Nalidixic Acid: 19,08%). All strains of Salmonella Saintpaul were resistant to Sulphametoxazole/ Tri-methoprim, Tetracycline, Ampicillin and Sulphonamide compounds. For this serovar high levels of resistance were identified also for Amoxicyllin-Clavulanic Acid (88,89%) and Streptomycin (88,89%). As regard Salmonella Newport high levels of resistance were identified for Sulphametoxazole + Trimethoprim (90%), Tetracycline (80,95)%, Ampicillin (85,71%) and Sulphonamide compounds (88,24%).
47
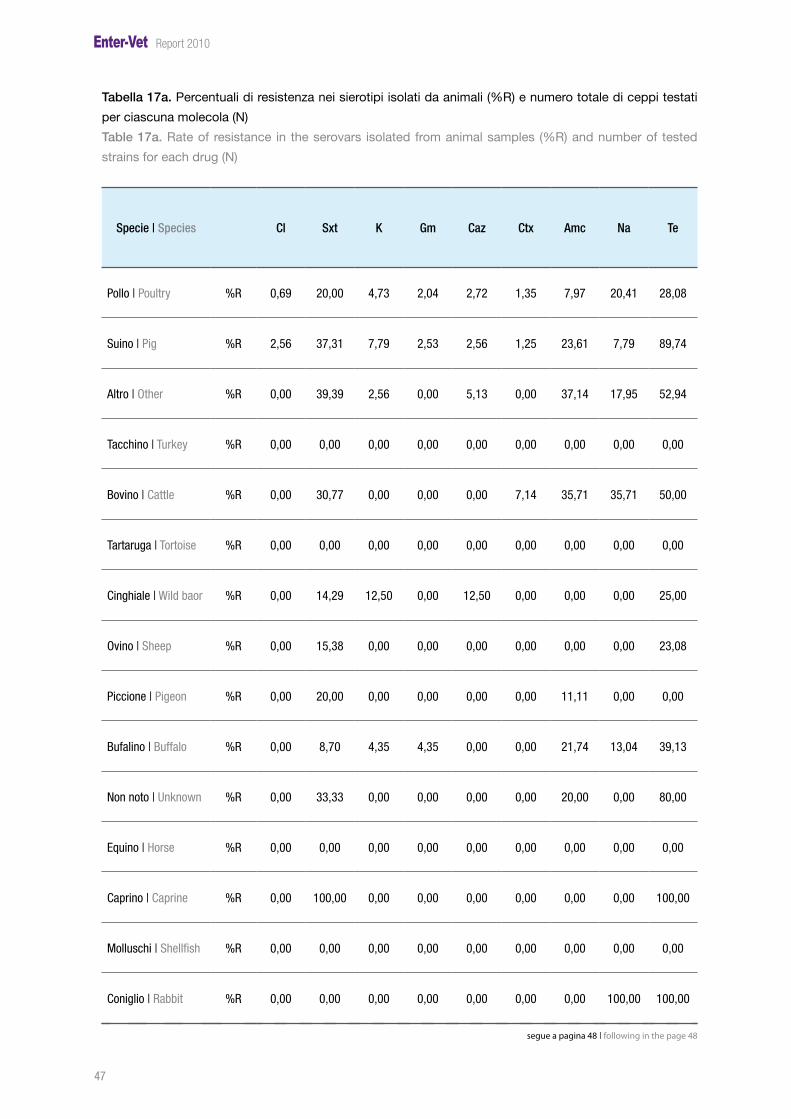
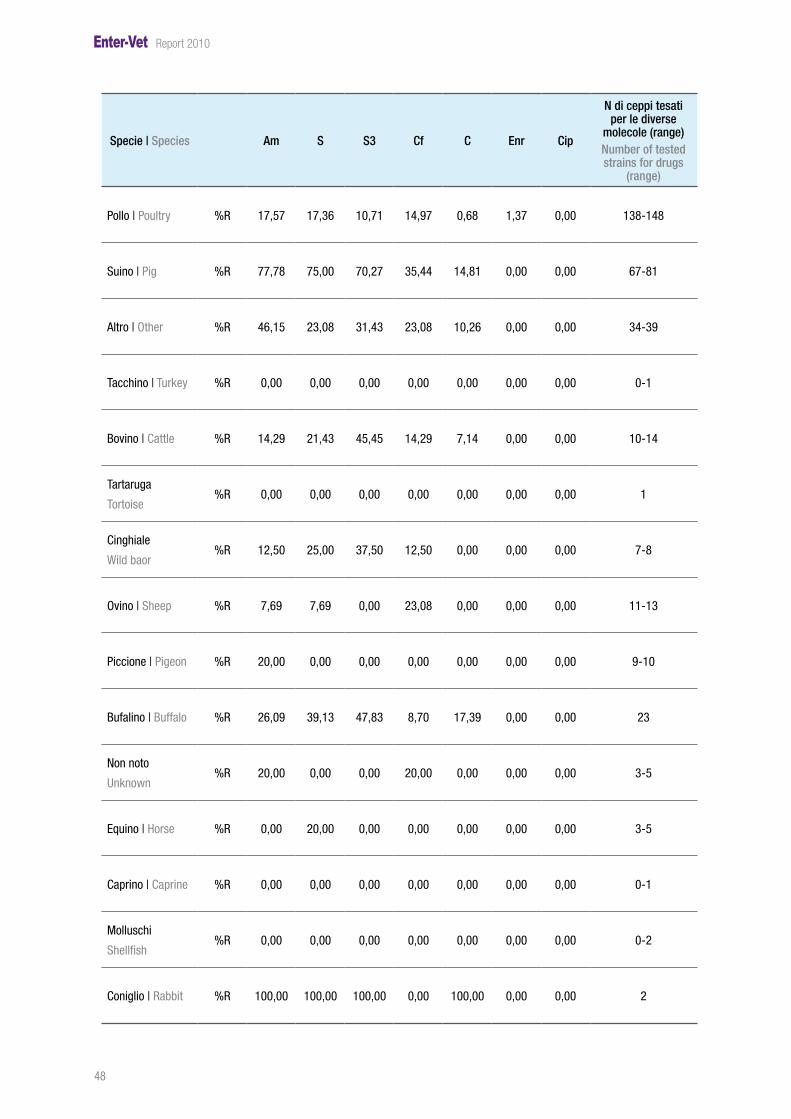
Report 2010
Tabella 17a. Percentuali di resistenza nei sierotipi isolati da animali (%R) e numero totale di ceppi testati
per ciascuna molecola (N)
Table 17a. Rate of resistance in the serovars isolated from animal samples (%R) and number of tested
strains for each drug (N)
Specie | Species Cl Sxt K Gm Caz Ctx Amc Na Te
Pollo | Poultry %R 0,69 20,00 4,73 2,04 2,72 1,35 7,97 20,41 28,08
Suino | Pig %R 2,56 37,31 7,79 2,53 2,56 1,25 23,61 7,79 89,74
Altro | Other %R 0,00 39,39 2,56 0,00 5,13 0,00 37,14 17,95 52,94
Tacchino | Turkey %R 0,00 0,00 0,00 0,00 0,00 0,00 0,00 0,00 0,00
Bovino | Cattle %R 0,00 30,77 0,00 0,00 0,00 7,14 35,71 35,71 50,00
Tartaruga | Tortoise %R 0,00 0,00 0,00 0,00 0,00 0,00 0,00 0,00 0,00
Cinghiale | Wild baor %R 0,00 14,29 12,50 0,00 12,50 0,00 0,00 0,00 25,00
Ovino | Sheep %R 0,00 15,38 0,00 0,00 0,00 0,00 0,00 0,00 23,08
Piccione | Pigeon %R 0,00 20,00 0,00 0,00 0,00 0,00 11,11 0,00 0,00
Bufalino | Buffalo %R 0,00 8,70 4,35 4,35 0,00 0,00 21,74 13,04 39,13
Non noto | Unknown %R 0,00 33,33 0,00 0,00 0,00 0,00 20,00 0,00 80,00
Equino | Horse %R 0,00 0,00 0,00 0,00 0,00 0,00 0,00 0,00 0,00
Caprino | Caprine %R 0,00 100,00 0,00 0,00 0,00 0,00 0,00 0,00 100,00
Molluschi | Shellfish %R 0,00 0,00 0,00 0,00 0,00 0,00 0,00 0,00 0,00
Coniglio | Rabbit %R 0,00 0,00 0,00 0,00 0,00 0,00 0,00 100,00 100,00
segue a pagina 48 | following in the page 48
48
Report 2010
Specie | Species Am S S3 Cf C Enr Cip
N di ceppi tesati per le diverse
molecole (range)Number of tested strains for drugs
(range)
Pollo | Poultry %R 17,57 17,36 10,71 14,97 0,68 1,37 0,00 138-148
Suino | Pig %R 77,78 75,00 70,27 35,44 14,81 0,00 0,00 67-81
Altro | Other %R 46,15 23,08 31,43 23,08 10,26 0,00 0,00 34-39
Tacchino | Turkey %R 0,00 0,00 0,00 0,00 0,00 0,00 0,00 0-1
Bovino | Cattle %R 14,29 21,43 45,45 14,29 7,14 0,00 0,00 10-14
Tartaruga
Tortoise%R 0,00 0,00 0,00 0,00 0,00 0,00 0,00 1
Cinghiale
Wild baor%R 12,50 25,00 37,50 12,50 0,00 0,00 0,00 7-8
Ovino | Sheep %R 7,69 7,69 0,00 23,08 0,00 0,00 0,00 11-13
Piccione | Pigeon %R 20,00 0,00 0,00 0,00 0,00 0,00 0,00 9-10
Bufalino | Buffalo %R 26,09 39,13 47,83 8,70 17,39 0,00 0,00 23
Non noto
Unknown%R 20,00 0,00 0,00 20,00 0,00 0,00 0,00 3-5
Equino | Horse %R 0,00 20,00 0,00 0,00 0,00 0,00 0,00 3-5
Caprino | Caprine %R 0,00 0,00 0,00 0,00 0,00 0,00 0,00 0-1
Molluschi
Shellfish%R 0,00 0,00 0,00 0,00 0,00 0,00 0,00 0-2
Coniglio | Rabbit %R 100,00 100,00 100,00 0,00 100,00 0,00 0,00 2
49
Report 2010
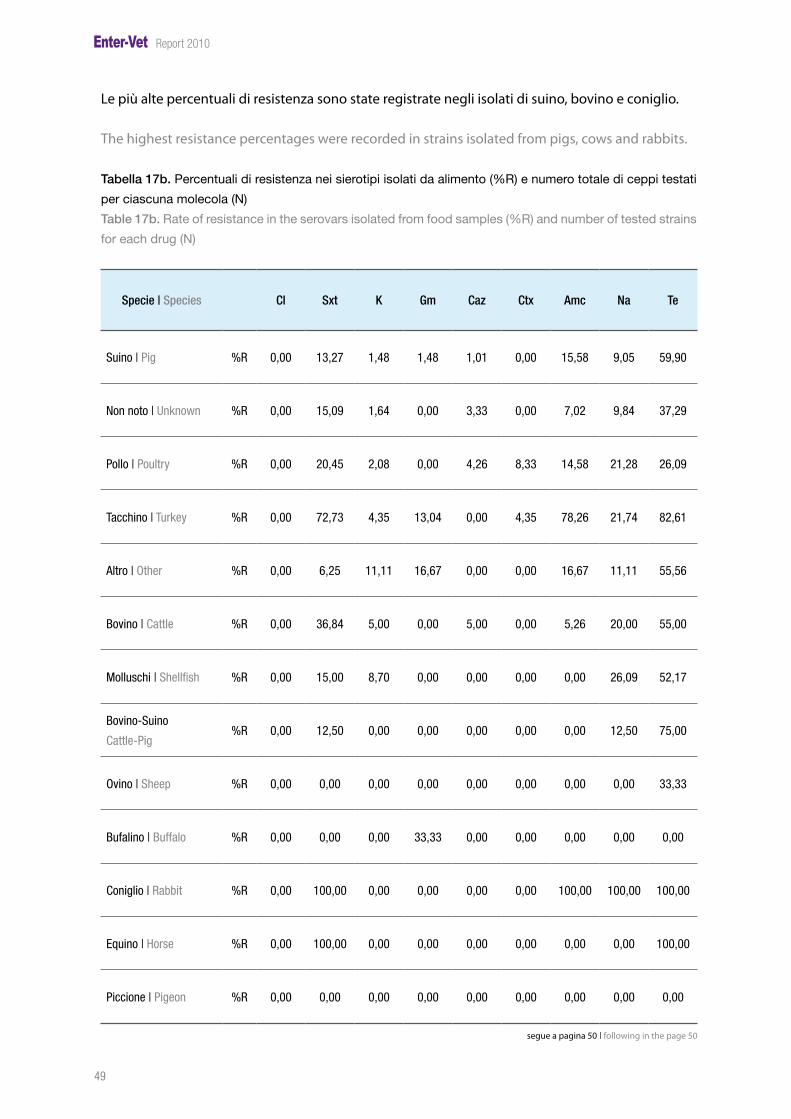
Le più alte percentuali di resistenza sono state registrate negli isolati di suino, bovino e coniglio.
The highest resistance percentages were recorded in strains isolated from pigs, cows and rabbits.
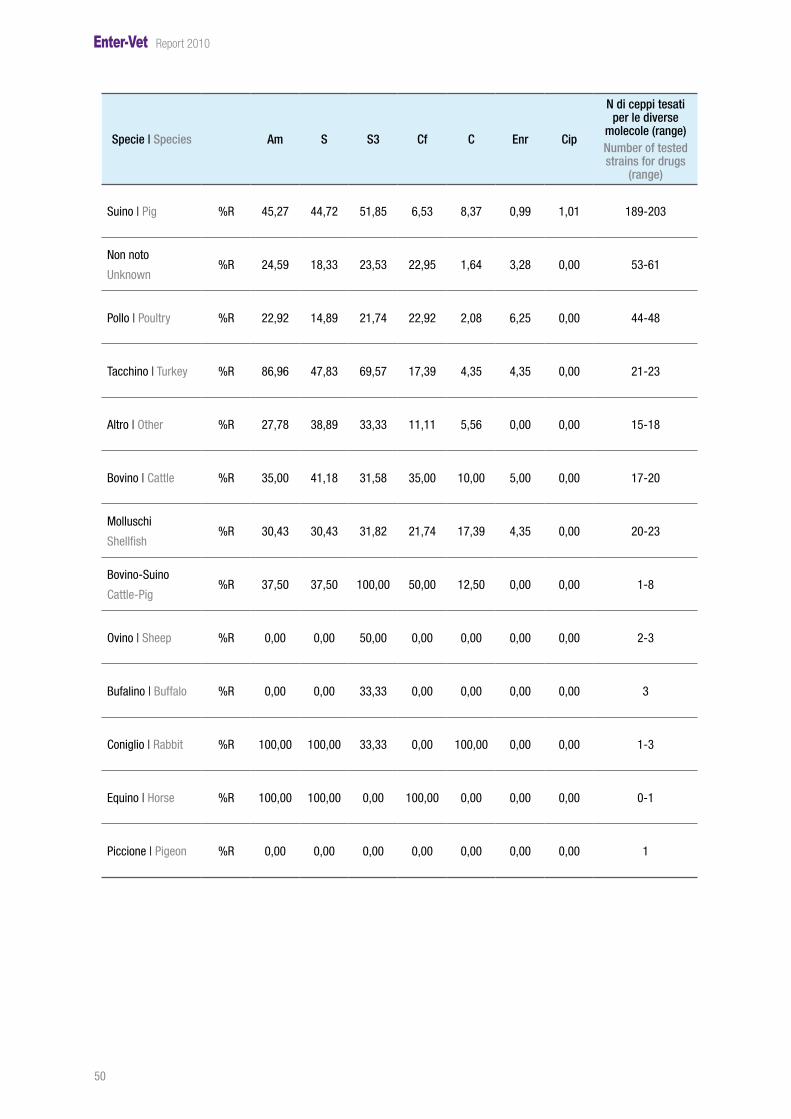
Tabella 17b. Percentuali di resistenza nei sierotipi isolati da alimento (%R) e numero totale di ceppi testati
per ciascuna molecola (N)
Table 17b. Rate of resistance in the serovars isolated from food samples (%R) and number of tested strains
for each drug (N)
Specie | Species Cl Sxt K Gm Caz Ctx Amc Na Te
Suino | Pig %R 0,00 13,27 1,48 1,48 1,01 0,00 15,58 9,05 59,90
Non noto | Unknown %R 0,00 15,09 1,64 0,00 3,33 0,00 7,02 9,84 37,29
Pollo | Poultry %R 0,00 20,45 2,08 0,00 4,26 8,33 14,58 21,28 26,09
Tacchino | Turkey %R 0,00 72,73 4,35 13,04 0,00 4,35 78,26 21,74 82,61
Altro | Other %R 0,00 6,25 11,11 16,67 0,00 0,00 16,67 11,11 55,56
Bovino | Cattle %R 0,00 36,84 5,00 0,00 5,00 0,00 5,26 20,00 55,00
Molluschi | Shellfish %R 0,00 15,00 8,70 0,00 0,00 0,00 0,00 26,09 52,17
Bovino-Suino
Cattle-Pig%R 0,00 12,50 0,00 0,00 0,00 0,00 0,00 12,50 75,00
Ovino | Sheep %R 0,00 0,00 0,00 0,00 0,00 0,00 0,00 0,00 33,33
Bufalino | Buffalo %R 0,00 0,00 0,00 33,33 0,00 0,00 0,00 0,00 0,00
Coniglio | Rabbit %R 0,00 100,00 0,00 0,00 0,00 0,00 100,00 100,00 100,00
Equino | Horse %R 0,00 100,00 0,00 0,00 0,00 0,00 0,00 0,00 100,00
Piccione | Pigeon %R 0,00 0,00 0,00 0,00 0,00 0,00 0,00 0,00 0,00
segue a pagina 50 | following in the page 50
50
Report 2010
Specie | Species Am S S3 Cf C Enr Cip
N di ceppi tesati per le diverse
molecole (range)Number of tested strains for drugs
(range)
Suino | Pig %R 45,27 44,72 51,85 6,53 8,37 0,99 1,01 189-203
Non noto
Unknown%R 24,59 18,33 23,53 22,95 1,64 3,28 0,00 53-61
Pollo | Poultry %R 22,92 14,89 21,74 22,92 2,08 6,25 0,00 44-48
Tacchino | Turkey %R 86,96 47,83 69,57 17,39 4,35 4,35 0,00 21-23
Altro | Other %R 27,78 38,89 33,33 11,11 5,56 0,00 0,00 15-18
Bovino | Cattle %R 35,00 41,18 31,58 35,00 10,00 5,00 0,00 17-20
Molluschi
Shellfish%R 30,43 30,43 31,82 21,74 17,39 4,35 0,00 20-23
Bovino-Suino
Cattle-Pig%R 37,50 37,50 100,00 50,00 12,50 0,00 0,00 1-8
Ovino | Sheep %R 0,00 0,00 50,00 0,00 0,00 0,00 0,00 2-3
Bufalino | Buffalo %R 0,00 0,00 33,33 0,00 0,00 0,00 0,00 3
Coniglio | Rabbit %R 100,00 100,00 33,33 0,00 100,00 0,00 0,00 1-3
Equino | Horse %R 100,00 100,00 0,00 100,00 0,00 0,00 0,00 0-1
Piccione | Pigeon %R 0,00 0,00 0,00 0,00 0,00 0,00 0,00 1
51
Report 2010
Analisi della multiresistenza
I risultati degli antibiogrammi sono stati elaborati al fine di evidenziare la presenza e le caratteristi-che dei ceppi multiresistenti. Un ceppo è considerato “multiresistente” quando presenta resistenza verso differenti molecole antibiotiche determinata da diversi meccanismi di resistenza. Nello speci-fico, si considera multiresistente un ceppo che presenta resistenza nei confronti di almeno quattro fra le molecole testate.Nella Tabella 18 vengono riportati i risultati relativi alla distribuzione delle multiresistenze per sie-rotipo. Complessivamente sono stati identificati 251 ceppi multiresistenti pari a 35,91% degli isolati. Nel 2010 la percentuale di multiresistenza risulta superiore rispetto ai due anni precedenti (309 ceppi, pari al 32% degli isolati nel 2008 e 351 ceppi pari al 28,56% degli isolati nel 2009). Nei Grafici da 7 a 10 vengono evidenziati i pattern di resistenza dei principali sierotipi multiresisten-ti nel periodo 2008- 2010.
Multiresistance analysis
The results of the antimicrobial sensitivity testing have been analysed in order to highlight the presence and the characteristics of multiresistant strains. A strain is considered multiresistant if it presents resistance toward different unrelated antimicrobials by several resistance mechanisms. In particular a multiresistant isolate is resistant to at least 4 of the compounds tested. In Table 18 the distribution of multiresistant strains for each serovar is reported. Totally 251 isolates were classified as multiresistant in 2010, equal to 35,91% of the isolated strains. Compared to the two previous years, in 2010 the percentage of multiresistance was higher (309 strains, equal to 32% of isolates in 2008; 351 strains, equal to 28,56% of isolates in 2009). In Graphs 7 - 10 the resistance patterns of the most frequent multiresistant serotypes from 2008 to 2010 are reported.
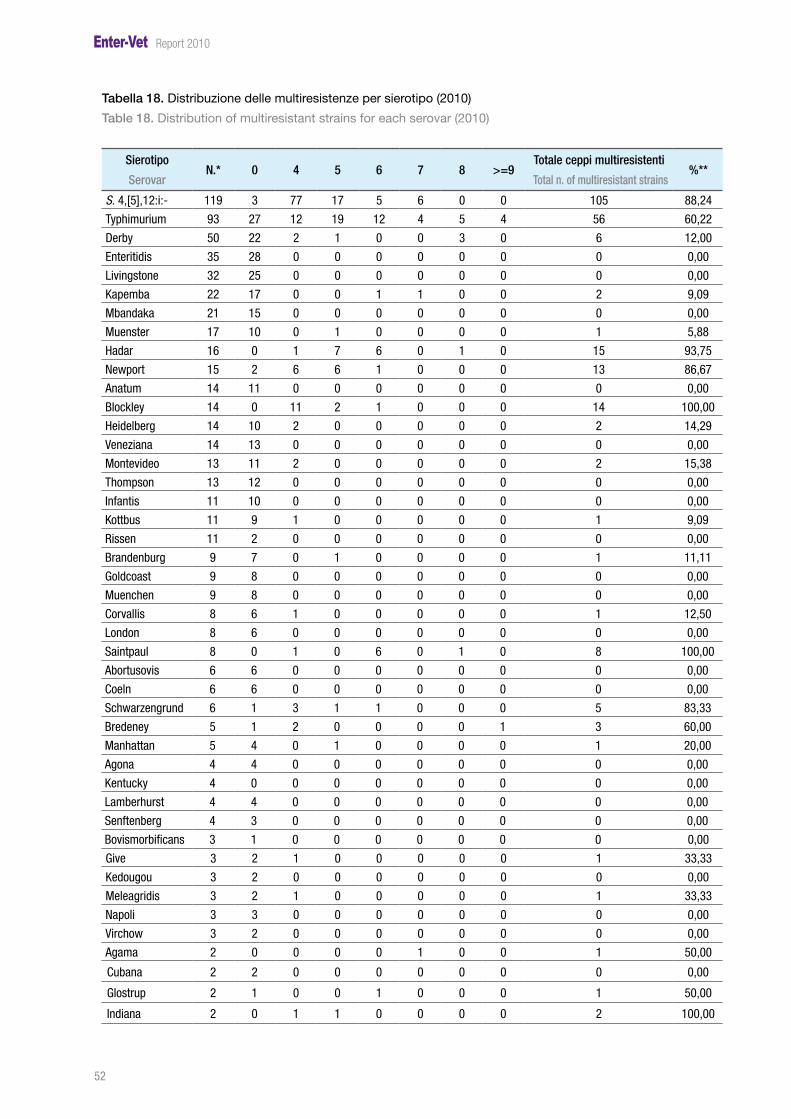
52
Report 2010
Tabella 18. Distribuzione delle multiresistenze per sierotipo (2010)
Table 18. Distribution of multiresistant strains for each serovar (2010)
Sierotipo
SerovarN.* 0 4 5 6 7 8 >=9
Totale ceppi multiresistenti
Total n. of multiresistant strains%**
S. 4,[5],12:i:- 119 3 77 17 5 6 0 0 105 88,24
Typhimurium 93 27 12 19 12 4 5 4 56 60,22
Derby 50 22 2 1 0 0 3 0 6 12,00
Enteritidis 35 28 0 0 0 0 0 0 0 0,00
Livingstone 32 25 0 0 0 0 0 0 0 0,00
Kapemba 22 17 0 0 1 1 0 0 2 9,09
Mbandaka 21 15 0 0 0 0 0 0 0 0,00
Muenster 17 10 0 1 0 0 0 0 1 5,88
Hadar 16 0 1 7 6 0 1 0 15 93,75
Newport 15 2 6 6 1 0 0 0 13 86,67
Anatum 14 11 0 0 0 0 0 0 0 0,00
Blockley 14 0 11 2 1 0 0 0 14 100,00
Heidelberg 14 10 2 0 0 0 0 0 2 14,29
Veneziana 14 13 0 0 0 0 0 0 0 0,00
Montevideo 13 11 2 0 0 0 0 0 2 15,38
Thompson 13 12 0 0 0 0 0 0 0 0,00
Infantis 11 10 0 0 0 0 0 0 0 0,00
Kottbus 11 9 1 0 0 0 0 0 1 9,09
Rissen 11 2 0 0 0 0 0 0 0 0,00
Brandenburg 9 7 0 1 0 0 0 0 1 11,11
Goldcoast 9 8 0 0 0 0 0 0 0 0,00
Muenchen 9 8 0 0 0 0 0 0 0 0,00
Corvallis 8 6 1 0 0 0 0 0 1 12,50
London 8 6 0 0 0 0 0 0 0 0,00
Saintpaul 8 0 1 0 6 0 1 0 8 100,00
Abortusovis 6 6 0 0 0 0 0 0 0 0,00
Coeln 6 6 0 0 0 0 0 0 0 0,00
Schwarzengrund 6 1 3 1 1 0 0 0 5 83,33
Bredeney 5 1 2 0 0 0 0 1 3 60,00
Manhattan 5 4 0 1 0 0 0 0 1 20,00
Agona 4 4 0 0 0 0 0 0 0 0,00
Kentucky 4 0 0 0 0 0 0 0 0 0,00
Lamberhurst 4 4 0 0 0 0 0 0 0 0,00
Senftenberg 4 3 0 0 0 0 0 0 0 0,00
Bovismorbificans 3 1 0 0 0 0 0 0 0 0,00
Give 3 2 1 0 0 0 0 0 1 33,33
Kedougou 3 2 0 0 0 0 0 0 0 0,00
Meleagridis 3 2 1 0 0 0 0 0 1 33,33
Napoli 3 3 0 0 0 0 0 0 0 0,00
Virchow 3 2 0 0 0 0 0 0 0 0,00
Agama 2 0 0 0 0 1 0 0 1 50,00
Cubana 2 2 0 0 0 0 0 0 0 0,00
Glostrup 2 1 0 0 1 0 0 0 1 50,00
Indiana 2 0 1 1 0 0 0 0 2 100,00
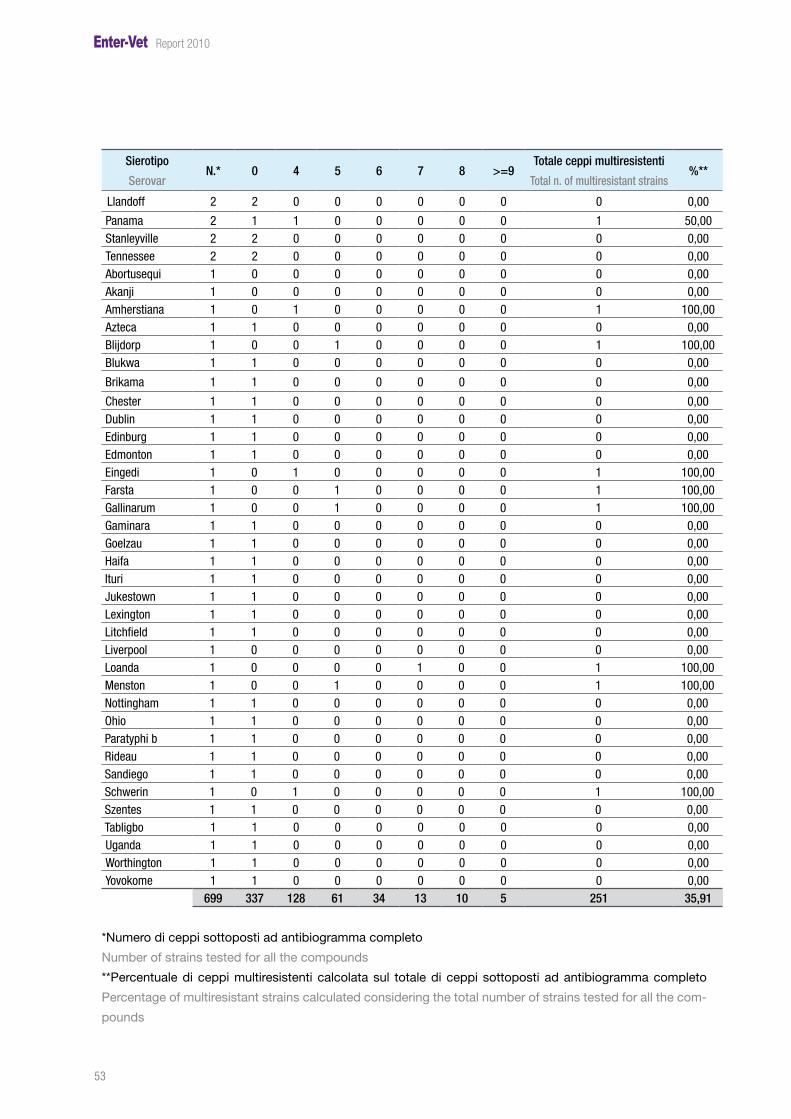
53
Report 2010
Sierotipo
SerovarN.* 0 4 5 6 7 8 >=9
Totale ceppi multiresistenti
Total n. of multiresistant strains%**
Llandoff 2 2 0 0 0 0 0 0 0 0,00
Panama 2 1 1 0 0 0 0 0 1 50,00Stanleyville 2 2 0 0 0 0 0 0 0 0,00Tennessee 2 2 0 0 0 0 0 0 0 0,00Abortusequi 1 0 0 0 0 0 0 0 0 0,00Akanji 1 0 0 0 0 0 0 0 0 0,00Amherstiana 1 0 1 0 0 0 0 0 1 100,00Azteca 1 1 0 0 0 0 0 0 0 0,00Blijdorp 1 0 0 1 0 0 0 0 1 100,00Blukwa 1 1 0 0 0 0 0 0 0 0,00
Brikama 1 1 0 0 0 0 0 0 0 0,00
Chester 1 1 0 0 0 0 0 0 0 0,00Dublin 1 1 0 0 0 0 0 0 0 0,00Edinburg 1 1 0 0 0 0 0 0 0 0,00Edmonton 1 1 0 0 0 0 0 0 0 0,00Eingedi 1 0 1 0 0 0 0 0 1 100,00Farsta 1 0 0 1 0 0 0 0 1 100,00Gallinarum 1 0 0 1 0 0 0 0 1 100,00Gaminara 1 1 0 0 0 0 0 0 0 0,00Goelzau 1 1 0 0 0 0 0 0 0 0,00Haifa 1 1 0 0 0 0 0 0 0 0,00Ituri 1 1 0 0 0 0 0 0 0 0,00Jukestown 1 1 0 0 0 0 0 0 0 0,00Lexington 1 1 0 0 0 0 0 0 0 0,00Litchfield 1 1 0 0 0 0 0 0 0 0,00Liverpool 1 0 0 0 0 0 0 0 0 0,00Loanda 1 0 0 0 0 1 0 0 1 100,00Menston 1 0 0 1 0 0 0 0 1 100,00Nottingham 1 1 0 0 0 0 0 0 0 0,00Ohio 1 1 0 0 0 0 0 0 0 0,00Paratyphi b 1 1 0 0 0 0 0 0 0 0,00Rideau 1 1 0 0 0 0 0 0 0 0,00Sandiego 1 1 0 0 0 0 0 0 0 0,00Schwerin 1 0 1 0 0 0 0 0 1 100,00Szentes 1 1 0 0 0 0 0 0 0 0,00Tabligbo 1 1 0 0 0 0 0 0 0 0,00Uganda 1 1 0 0 0 0 0 0 0 0,00Worthington 1 1 0 0 0 0 0 0 0 0,00Yovokome 1 1 0 0 0 0 0 0 0 0,00
699 337 128 61 34 13 10 5 251 35,91
*Numero di ceppi sottoposti ad antibiogramma completo
Number of strains tested for all the compounds
**Percentuale di ceppi multiresistenti calcolata sul totale di ceppi sottoposti ad antibiogramma completo
Percentage of multiresistant strains calculated considering the total number of strains tested for all the com-
pounds

54
Report 2010
Grafico 7. Andamento multiresistenze ripartite per sierotipo nel periodo 2008-2010
Graph 7. Trends of multiresistance distributed for serovar during the period 2008-2010
Confronto multiresistenza 2007-2008-2009 |Comparison multiresistance 2007-2008-2009
0
20
40
60
80
100
%
Confronto multiresistenza 2008-2009-2010Comparison multiresistance 2008-2009-2010
%2008 %2009 %2010
Sierotipo |Serovar

55
Report 2010
Valutando poi il trend di multiresistenza dei singoli sierotipi nel triennio 2008-2010 è stato regis-trato un sensibile incremento degli isolati multiresistenti appartenenti ai sierotipi Salmonella Hadar, Salmonella 4,[5],12:i:-, Salmonella Saintpaul, Salmonella Typhimurium e Salmonella Newport. Per Salmonella Bredeney invece si è registrato una netta riduzione del livello di multiresistenza rispetto all’anno precedente.
Considering the trends of multiresistances per serotype in the period 2008-2010 a sensitive increase of multiresistant isolates of serovars Salmonella Hadar, Salmonella 4,[5],12:i:-, Salmonella Saintpaul, Salmonella Typhimurium and Salmonella Newport was reported. On the other hand for Salmonella Bredeney an evident reduction of multiresistance was registered, compared to the previous year.
Nei grafici seguenti vengono riportati i principali profili di multiresistenza identificati per Salmo-nella Typhimurium, Salmonella 4,[5],12:i:-, Salmonella Hadar e Salmonella Bredeney. Per Salmonella Bredeney come negli anni precedenti il profilo più comune è risultato essere KSS3Te (66,67% degli isolati), mentre per Salmonella Hadar i profili più comuni sono NaAmSTeCf (40%) seguito da NaAm-STeAmcCf (33,33%).Nel corso del 2010 non si sono verificati importanti cambiamenti rispetto agli anni precedenti per quanto riguarda i profili di multiresistenza di Salmonella 4,[5],12:i:- e di Salmonella Typhimurium. Da segnalare in particolare per quest’ultimo sierotipo, una riduzione dei ceppi con profilo AmSS3Te (27,17% nel 2009 e 16,07% nel 2010), mentre lo stesso profilo di antibioticoresistenza si mantiene stabile per Salmonella 4,[5],12:i:- nel corso del 2010 (71,62% nel 2009 e 70,48% nel 2010).
In the following graphs the main profiles of multiresistance identified for Salmonella Typhimurium, Salmonella 4,[5],12:i:-, Salmonella Hadar and Salmonella Bredeney are reported. As in the previous year, for Salmonella Bredeney the most common multiresistance profile was KSS3Te (66,67% of the isolates), while for Salmonella Hadar the most common multiresistance profiles were NaAmSTeCf (40%) followed by NaAmSTeAmcCf (33,33%).During 2010 important variations on the profiles of multiresistance were not reported for Salmo-nella 4,[5],12:i:- and Salmonella Typhimurium. However, it is to point out that for this last serovar a decrease of strains with the multiresistance profile AmSS3Te (27,17% in 2009 and 16,07% in 2010) was reported, while the same multiresistant profile shows a stable trend during 2010 (71,62% in 2009 and 70,48% in 2010) for Salmonella 4,[5],12:i:-.
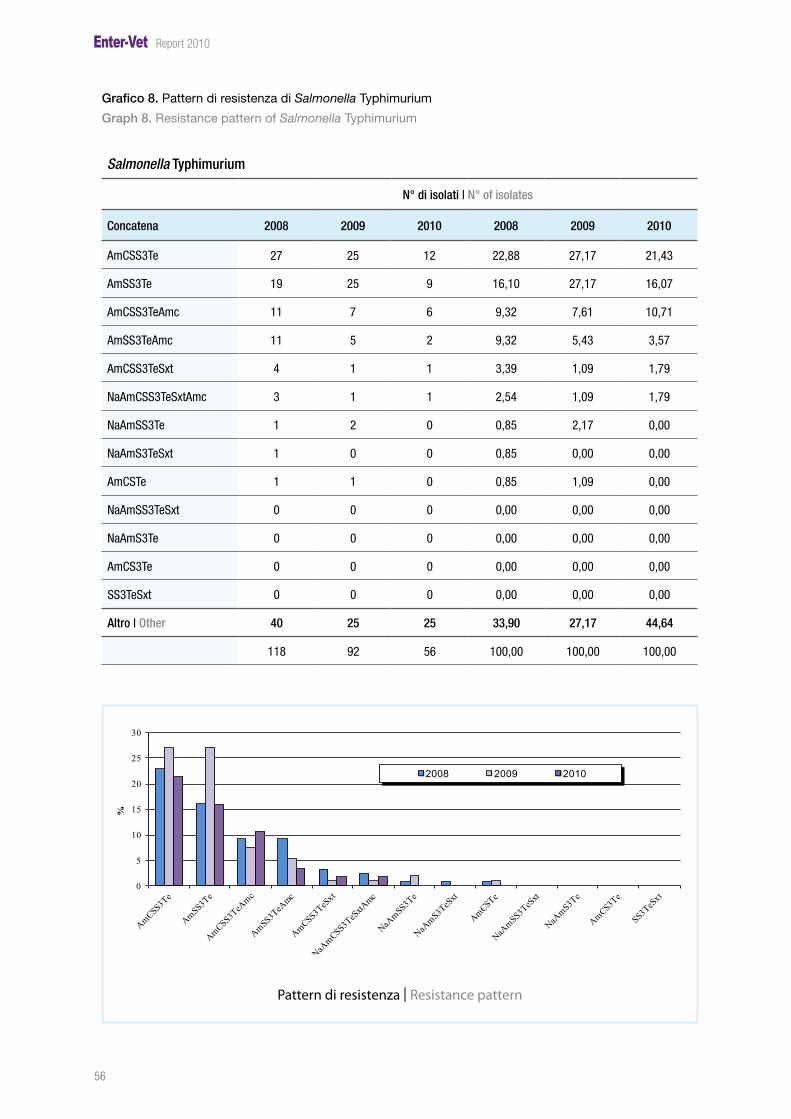
56
Report 2010
Grafico 8. Pattern di resistenza di Salmonella Typhimurium
Graph 8. Resistance pattern of Salmonella Typhimurium
Salmonella Typhimurium
N° di isolati | N° of isolates
Concatena 2008 2009 2010 2008 2009 2010
AmCSS3Te 27 25 12 22,88 27,17 21,43
AmSS3Te 19 25 9 16,10 27,17 16,07
AmCSS3TeAmc 11 7 6 9,32 7,61 10,71
AmSS3TeAmc 11 5 2 9,32 5,43 3,57
AmCSS3TeSxt 4 1 1 3,39 1,09 1,79
NaAmCSS3TeSxtAmc 3 1 1 2,54 1,09 1,79
NaAmSS3Te 1 2 0 0,85 2,17 0,00
NaAmS3TeSxt 1 0 0 0,85 0,00 0,00
AmCSTe 1 1 0 0,85 1,09 0,00
NaAmSS3TeSxt 0 0 0 0,00 0,00 0,00
NaAmS3Te 0 0 0 0,00 0,00 0,00
AmCS3Te 0 0 0 0,00 0,00 0,00
SS3TeSxt 0 0 0 0,00 0,00 0,00
Altro | Other 40 25 25 33,90 27,17 44,64
118 92 56 100,00 100,00 100,00
0
5
10
15
20
25
30
%
2008 2009 2010
Pattern di resistenza |Resistance pattern
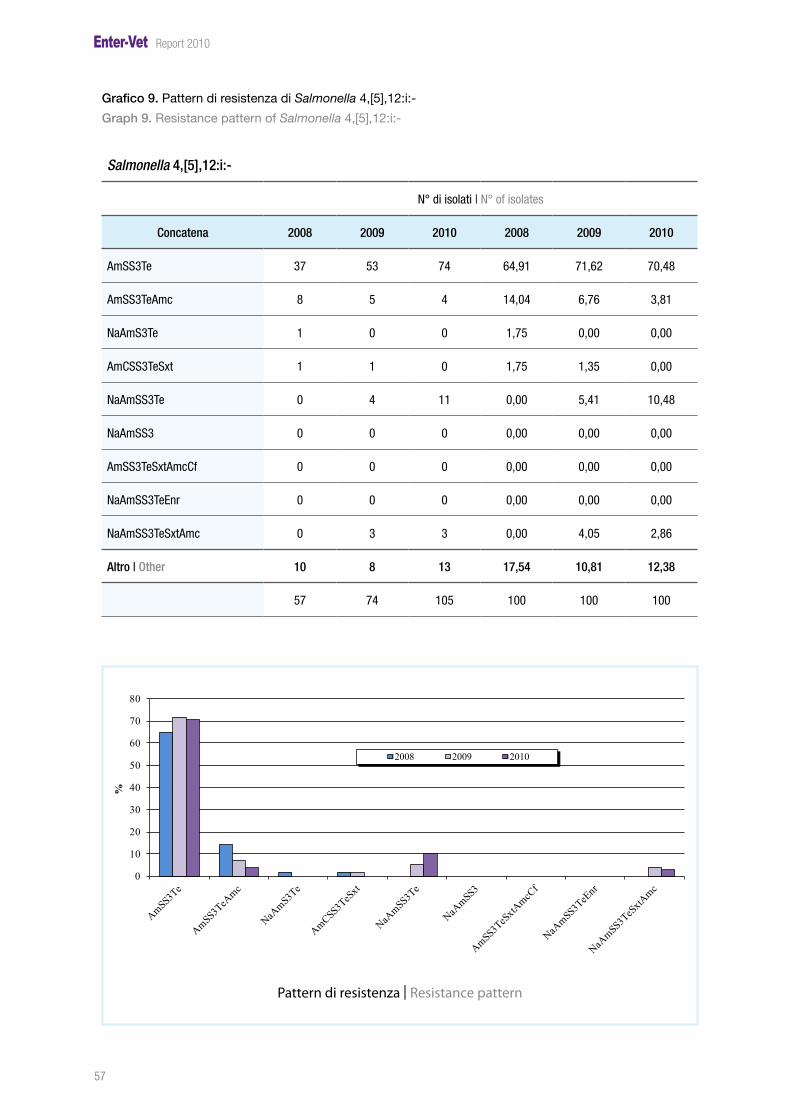
57
Report 2010
Grafico 9. Pattern di resistenza di Salmonella 4,[5],12:i:-
Graph 9. Resistance pattern of Salmonella 4,[5],12:i:-
Salmonella 4,[5],12:i:-
N° di isolati | N° of isolates
Concatena 2008 2009 2010 2008 2009 2010
AmSS3Te 37 53 74 64,91 71,62 70,48
AmSS3TeAmc 8 5 4 14,04 6,76 3,81
NaAmS3Te 1 0 0 1,75 0,00 0,00
AmCSS3TeSxt 1 1 0 1,75 1,35 0,00
NaAmSS3Te 0 4 11 0,00 5,41 10,48
NaAmSS3 0 0 0 0,00 0,00 0,00
AmSS3TeSxtAmcCf 0 0 0 0,00 0,00 0,00
NaAmSS3TeEnr 0 0 0 0,00 0,00 0,00
NaAmSS3TeSxtAmc 0 3 3 0,00 4,05 2,86
Altro | Other 10 8 13 17,54 10,81 12,38
57 74 105 100 100 100
0
10
20
30
40
50
60
70
80
%
2008 2009 2010
Pattern di resistenza |Resistance pattern
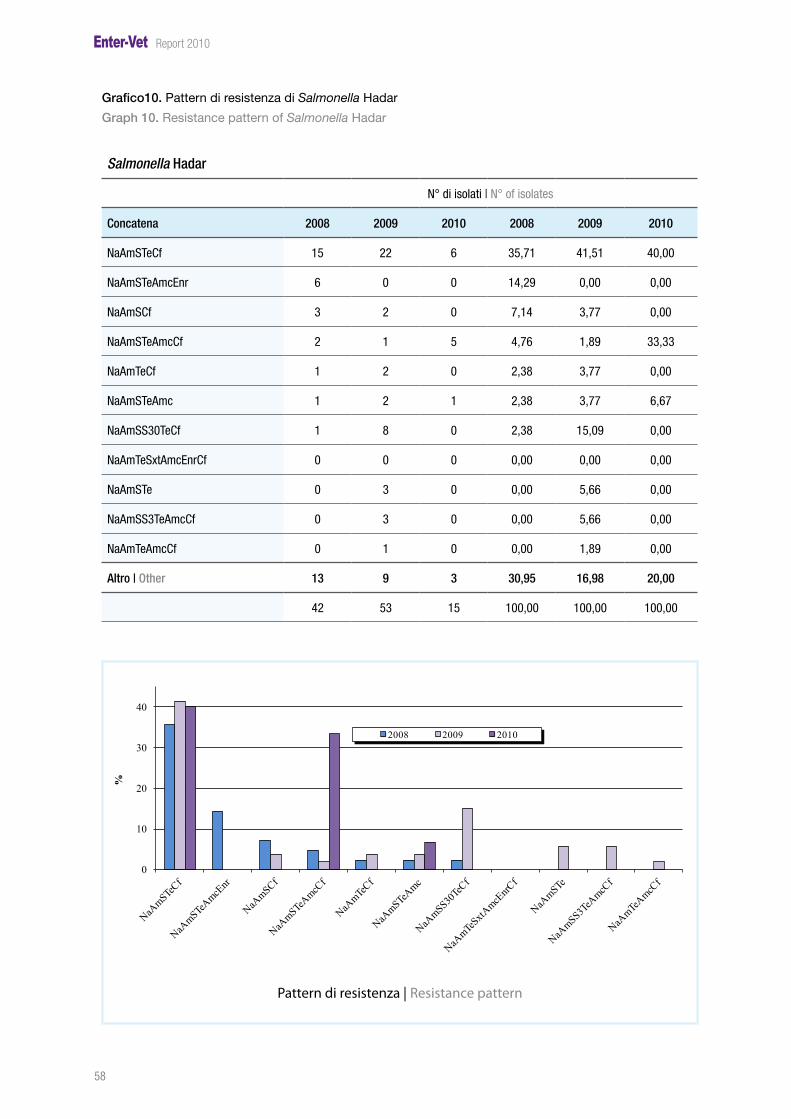
58
Report 2010
Grafico10. Pattern di resistenza di Salmonella Hadar
Graph 10. Resistance pattern of Salmonella Hadar
Salmonella Hadar
N° di isolati | N° of isolates
Concatena 2008 2009 2010 2008 2009 2010
NaAmSTeCf 15 22 6 35,71 41,51 40,00
NaAmSTeAmcEnr 6 0 0 14,29 0,00 0,00
NaAmSCf 3 2 0 7,14 3,77 0,00
NaAmSTeAmcCf 2 1 5 4,76 1,89 33,33
NaAmTeCf 1 2 0 2,38 3,77 0,00
NaAmSTeAmc 1 2 1 2,38 3,77 6,67
NaAmSS30TeCf 1 8 0 2,38 15,09 0,00
NaAmTeSxtAmcEnrCf 0 0 0 0,00 0,00 0,00
NaAmSTe 0 3 0 0,00 5,66 0,00
NaAmSS3TeAmcCf 0 3 0 0,00 5,66 0,00
NaAmTeAmcCf 0 1 0 0,00 1,89 0,00
Altro | Other 13 9 3 30,95 16,98 20,00
42 53 15 100,00 100,00 100,00
0
10
20
30
40
%
2008 2009 2010
Pattern di resistenza |Resistance pattern
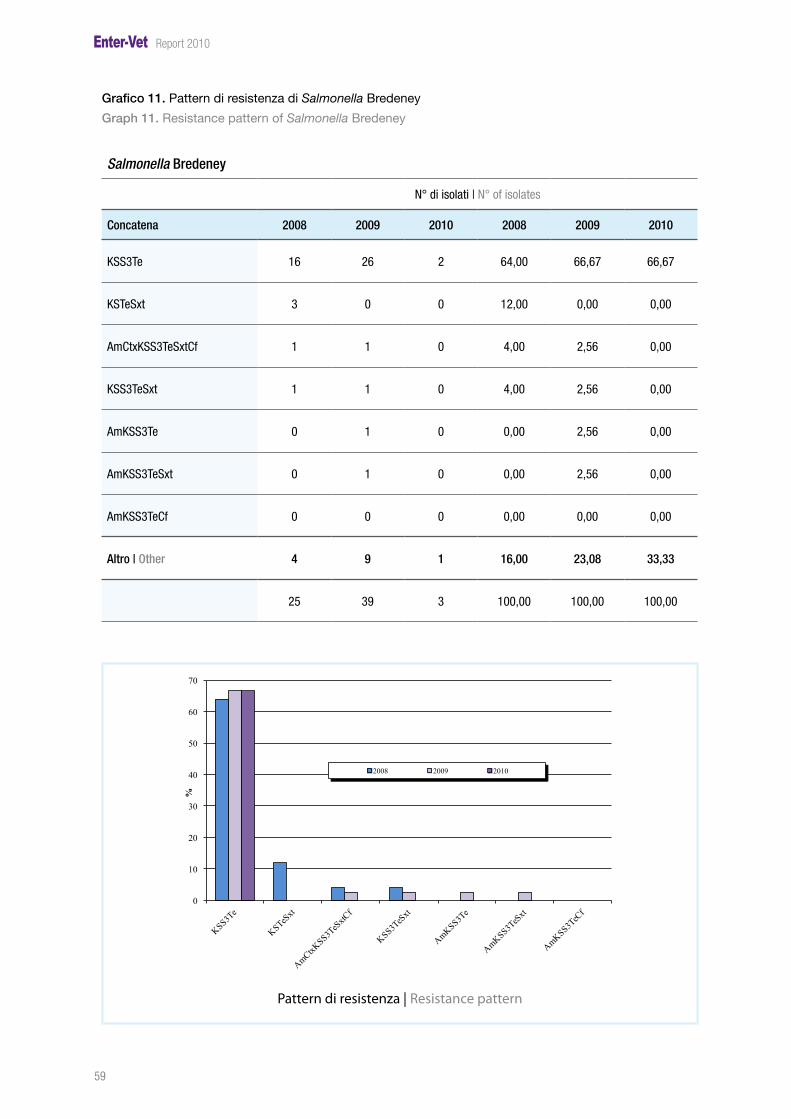
59
Report 2010
Grafico 11. Pattern di resistenza di Salmonella Bredeney
Graph 11. Resistance pattern of Salmonella Bredeney
Salmonella Bredeney
N° di isolati | N° of isolates
Concatena 2008 2009 2010 2008 2009 2010
KSS3Te 16 26 2 64,00 66,67 66,67
KSTeSxt 3 0 0 12,00 0,00 0,00
AmCtxKSS3TeSxtCf 1 1 0 4,00 2,56 0,00
KSS3TeSxt 1 1 0 4,00 2,56 0,00
AmKSS3Te 0 1 0 0,00 2,56 0,00
AmKSS3TeSxt 0 1 0 0,00 2,56 0,00
AmKSS3TeCf 0 0 0 0,00 0,00 0,00
Altro | Other 4 9 1 16,00 23,08 33,33
25 39 3 100,00 100,00 100,00
0
10
20
30
40
50
60
70
%
Pattern di resistenza/Resistance pattern
2008 2009 2010
Pattern di resistenza |Resistance pattern

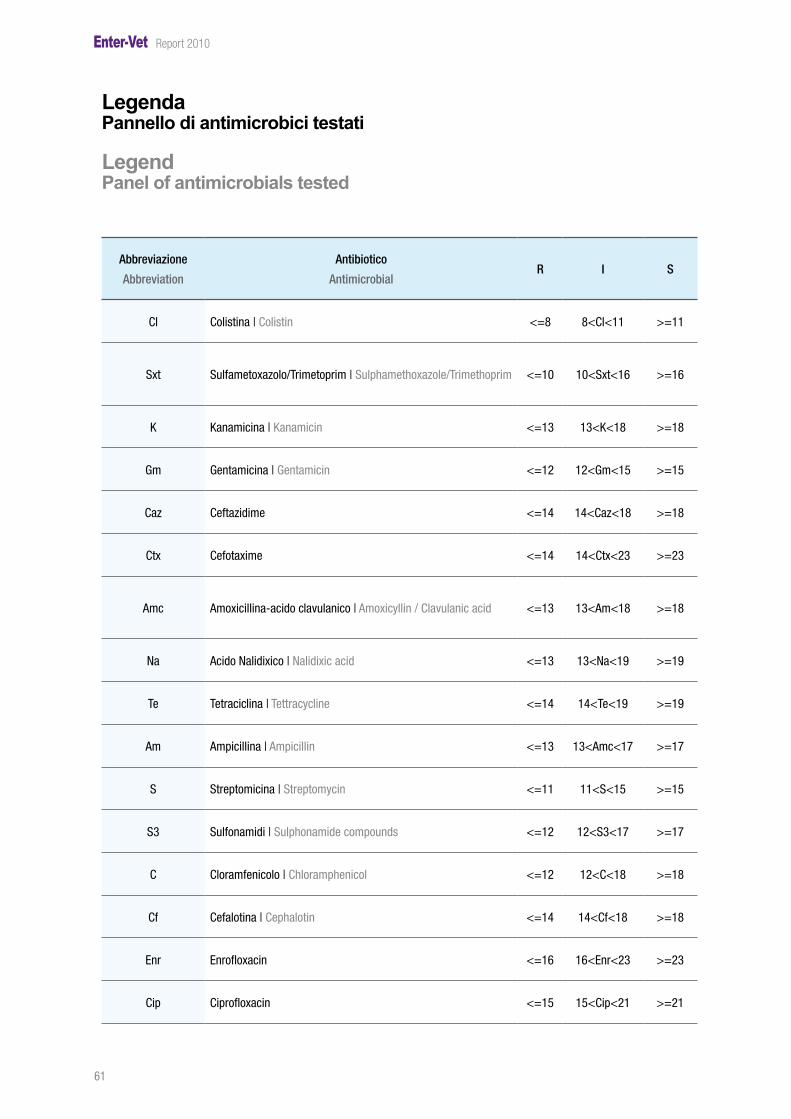
61
Report 2010
LegendaPannello di antimicrobici testati
Legend Panel of antimicrobials tested
Abbreviazione
Abbreviation
Antibiotico
AntimicrobialR I S
Cl Colistina | Colistin <=8 8<Cl<11 >=11
Sxt Sulfametoxazolo/Trimetoprim | Sulphamethoxazole/Trimethoprim <=10 10<Sxt<16 >=16
K Kanamicina | Kanamicin <=13 13<K<18 >=18
Gm Gentamicina | Gentamicin <=12 12<Gm<15 >=15
Caz Ceftazidime <=14 14<Caz<18 >=18
Ctx Cefotaxime <=14 14<Ctx<23 >=23
Amc Amoxicillina-acido clavulanico | Amoxicyllin / Clavulanic acid <=13 13<Am<18 >=18
Na Acido Nalidixico | Nalidixic acid <=13 13<Na<19 >=19
Te Tetraciclina | Tettracycline <=14 14<Te<19 >=19
Am Ampicillina | Ampicillin <=13 13<Amc<17 >=17
S Streptomicina | Streptomycin <=11 11<S<15 >=15
S3 Sulfonamidi | Sulphonamide compounds <=12 12<S3<17 >=17
C Cloramfenicolo | Chloramphenicol <=12 12<C<18 >=18
Cf Cefalotina | Cephalotin <=14 14<Cf<18 >=18
Enr Enrofloxacin <=16 16<Enr<23 >=23
Cip Ciprofloxacin <=15 15<Cip<21 >=21


63
Report 2010
BibliografiaReferencesPerformance Standards for Antimicrobial Disk and Dilution Susceptibility tests for Bacteria isolated from Animals; approved standard. Third edition CLSI Document M31-A3. CLSI, Wayne, Pennsylva-nia, USA. 2002 (Clinical and Laboratory Standard Institute, ex NCCLS).
Performance Standards for Antimicrobial Susceptibility Testing: Fourteenth Information supple-ment. NCCLS Document M100-S14. NCCLS, Wayne, Pennsylvania, USA. 2008 (The national commit-tee for clinical laboratory standards).

65
Report 2010
Sommario
Il presente report fornisce dati dettagliati sugli isolati di Salmonella spp. raccolti dai laboratori affe-renti alla rete Enter-Vet nel corso del 2010. Anche nel corso del 2010 sono stati isolati più di 4.600 ceppi di Salmonella spp.; il 65% di questi isolati sono stati ottenuti da campioni di pollo, suino, tacchino e bovino. Nel 2010 sono diminuiti i ceppi isolati da pollo, mentre sono aumentati quelli da suino e tacchino. Rispetto agli anni precedenti è notevolmente diminuito il numero di isolati di origine non nota e complessivamente il numero di isolati che risultano accompagnati dalle relative informazioni epi-demiologiche è sensibilmente aumentato. Per la prima volta da quando è attiva la rete di sorve-glianza il sierotipo più frequentemente isolato è risultato essere Salmonella 4,[5],12:i:-, seguito da Salmonella Typhimurium e Salmonella Enteritidis. Nel 2010, per la prima volta sono disponibili anche i risultati della fagotipizzazione per gli isolati di Salmonella 4,[5],12:i:-. I risultati della fagotipizzazione mostrano come per Salmonella Typhimurium il fagotipo più frequente continua ad essere DT104 (16,22%) seguito da U311 (12,84%). Nel caso di Salmonella Enteritidis i fagotipi più diffusi sono PT4 (17,11%) confermando i dati dei due anni precedenti e PT1 (14,47%), mentre per Salmonella 4,[5],12:i:- i fagotipi maggiormente identificati sono stati DT193 (61,98%) e U311 (21,49%). La frequenza di isolamento di ceppi NT (non fagotipiz-zabili) e RDNC (lettura stabile non identificata) è nettamente diminuita rispetto all’anno precedente soprattutto per il sierotipo Salmonella Typhimurium. Nel 2010 infatti per la prima volta da quando è attivo il sistema di sorveglianza, NT e RDNC non sono rientrati tra i primi tre fagotipi per entrambi i sierotipi.In merito alla fagotipizzazione comunque deve essere sottolineato che nel 2010 si è registrato un netto calo dei ceppi di Salmonella Typhimurium e Salmonella Enteritidis che sono stati analizzati e questo è da attribuire in parte a una riduzione degli isolati ascrivibili a questi due sierotipi, ma anche a un decremento della percentuale dei ceppi trasmessi dai singoli laboratori al Centro di referenza per l’esecuzione di tale analisi. Per quanto riguarda l’antibioticoresistenza in generale, rispetto al 2009, nel 2010 si è verificato un mantenimento delle resistenze e un incremento della percentuali di alcuni antibiotici testati, quali Sulfametoxazolo/ Trimetoprim, Tetraciclina, Ampicillina, Streptomicina e Cefalotina. I sierotipi per cui sono state rilevate percentuali superiori di resistenza antimicrobica sono risultati essere: Salmonella 4,[5],12:i:-, Salmonella Typhimurium, Salmonella Newport, Salmonella Saintpaul e Salmonella Hadar. La percentuale di multiresistenza nel corso del 2010 è aumentata rispetto ai due anni precedenti attestandosi sul 35,91% .
Summary
This report gives details of the isolates of Salmonella spp. collected by the labs of the Enter-Vet network during 2010. Totally, more than 4,600 Salmonella spp. strains were isolated during this year. The 65% of strains were isolated from poultry, swine, turkey and cattle samples. A decrease of the strains isolated from poultry and an increase of isolates from pigs and turkeys was registered. The number of samples of unknown origin was further decreased in the last year compared to the previous ones. A marked decrease of the strains isolated from samples of unknown origin and an increase of the strains with relevant epidemiological information was evidenced. This represents an important improvement since the more comprehensive are the epidemiological information of the strains collected the more significant will be the assessments carried out.

In 2010, for the first time since the network was implemented, the most common serovar was Sal-monella 4,[5],12:i:-, followed by Salmonella Typhimurium, and Salmonella Enteritidis. Compared to the previous years, also strains of Salmonella 4,[5],12:i:- have been phage typed. Considering Sal-monella Typhimurium the most common phage type continued to be DT104 (16,22%), followed by U311 (12,84%). As far as Salmonella Enteritidis is concerned the most common phage types are PT4 (17,11%), as already happened during the previous years, and PT1 (14,47%), while for Salmonella 4,[5],12:i:- the phage types mostly identified are DT193 (61,98%) and U311 (21,49%). The prevalence of NT and RDNC strains is notably decreased compared to the previous years especially for Salmo-nella Typhimurium.Moreover, it should be point out that in 2010 it was registered a clear reduction in the number of strains phage typed. This may be partly due to the reduction of the isolates belonging to these two serovars, but also to a reduction of the strains transmitted by the laboratories to the Reference La-boratory to be phage typed. As regard antimicrobial resistance in 2010 the trend of antimicrobial resistance has been stable and an increasing of percentage of resistance for some tested antibiotics as Sulphamethoxazole/ Trime-thoprim, Tetracycline, Ampicillin, Streptomycin and Cephalotin were recorded. The serovars characterized by the higher level of resistance were: Salmonella 4,[5],12:i:-, Salmonella Typhimurium, Salmonella Newport, Salmonella Saintpaul and Salmonella Hadar. Compared to the two previous years, during 2010 the percentage of multiresistance increased reaching the percen-tage of 35,91%.


Finito di stampare nel mese di maggio 2012Printed in May 2012


Centro di referenza nazionale per le salmonellosiIstituto Zooprofilattico Sperimentale delle VenezieViale dell’Università n. 10 - 35020 Legnaro (PD)Tel.: +39 049 8084 296 - 283 - 293 | Fax: +39 049 8830 268E-mail: [email protected]


![>> v = [1, 2, 3];...vet = [1 : 1 : 10] % 11 numeri interi da 1 a 10 vet = [1 : 0.1 : 10] % [1, 1.1,..., 9.9, 10] vet = [1 : 2 : 10] % 5 numeri dispari da 1 a 9 vet = [10 : -1 : 0]](https://static.fdocumenti.com/doc/165x107/61171c2c4e216a4142707b4c/-v-1-2-3-vet-1-1-10-11-numeri-interi-da-1-a-10-vet.jpg)
![N°delModelloNETL12807.2 MANUALEDʼISTRUZIONI · programmadiallenamento.PremereInvio [ENTER]perselezionareilprogrammadiallena - mento. Nonappena vieneselezion - atoilpro - grammapre](https://static.fdocumenti.com/doc/165x107/5c65efeb09d3f20f218b858d/ndelmodellonetl128072-manualedistruzioni-programmadiallenamentopremereinvio.jpg)