Enter-Vet Report 2013-2014 - Azienda USL 3 Pistoia CERTA/DATI EPIDEMIOLOGICI... · Enter-Vet Report...
41
1 Enter-Vet Report 2013-2014 Centro di Referenza Nazionale per le Salmonellosi
Transcript of Enter-Vet Report 2013-2014 - Azienda USL 3 Pistoia CERTA/DATI EPIDEMIOLOGICI... · Enter-Vet Report...

1
Enter-Vet Report 2013-2014
Centro di Referenza Nazionale per le Salmonellosi

2
Enter-Vet Report 2013-2014 A cura di/ Editor: Centro di Referenza Nazionale per le Salmonellosi Istituto Zooprofilattico Sperimentale delle Venezie Viale dell’Università n. 10 - 35020 Legnaro (PD) La preparazione del report è stata curata da/ The report was prepared by: Veronica Cibin, Lisa Barco, Marzia Mancin, Antonia Ricci
Il report è disponibile esclusivamente nel sito www.izsvenezie.it The report is available at: www.izsvenezie.it Qualsiasi utilizzo dei dati qui citati dovrebbe fare specifico riferimento al presente report Any use of the present data should include specific reference to this report

3
Sommario
INTRODUZIONE .................................................................................................................................... 4
INTRODUCTION .................................................................................................................................... 5
ELENCO DEI LABORATORI DI RIFERIMENTO/ ENTER-VET LABORATORIES .......................................... 6
GESTIONE DEI DATI E RIEPILOGO DELLE NOTIFICHE ............................................................................ 8
DATA MANAGEMENT AND REPORTS OF SALMONELLA SPP. ISOLATES .............................................. 9
DATI RELATIVI ALLA DISTRIBUZIONE DEI SIEROTIPI ........................................................................... 12
DATA ON SERVAR DISTRIBUTION ....................................................................................................... 12
DISTRIBUZIONE DEI SIEROTIPI PER TIPO DI CAMPIONE .................................................................... 12
SEROVAR DISTRIBUTION BY TYPE OF SAMPLE ................................................................................... 13
DISTRIBUZIONE DEI SIEROTIPI PER SPECIE ANIMALE ........................................................................ 13
SEROVAR DISTRIBUTION BY ANIMAL SPECIES ................................................................................... 14
DATI RELATIVI ALLA DISTRIBUZIONE DEI FAGOTIPI ........................................................................... 31
DATA ON DISTRIBUTION OF PHAGETYPES ......................................................................................... 31
CONCLUSIONI ..................................................................................................................................... 41
CONCLUSIONS .................................................................................................................................... 41

4
Introduzione Il report presenta i dati relativi a sierotipi e fagotipi di ceppi di Salmonella isolati da matrici veterinarie nel periodo 2013-2014, raccolti dai laboratori di riferimento della rete Enter-vet e trasmessi al Centro di Referenza Nazionale per le Salmonellosi (CRNS). Il report si articola nelle seguenti sezioni: • gestione dei dati e riepilogo delle notifiche; • esiti della sierotipizzazione delle salmonelle; • esiti della fagotipizzazione di S. Enteritidis, S. Typhimurium e della variante monofasica di S. Typhimurium. Il report, disponibile esclusivamente online (accedendo al sito www.izsvenezie.it, quindi alle pagine dedicate al Centro di Referenza Nazionale per le Salmonellosi) non presenta differenze sostanziali rispetto al precedente (dati 2011-2012). A garanzia della qualità dei dati analitici prodotti dai laboratori, il Centro di Referenza Nazionale per le Salmonellosi ha organizzato, anche nel 2013 e 2014, come di consuetudine, un circuito interlaboratorio di isolamento di Salmonella spp. e uno di sierotipizzazione a cui hanno preso parte tutti i laboratori afferenti alla rete Enter-Vet. Nell’ambito della presente pubblicazione, un ringraziamento particolare deve essere rivolto a tutti coloro che hanno partecipato ed in particolare ai colleghi degli Istituti Zooprofilattici che analizzano i campioni, raccolgono e inviano i dati su base volontaria. Infine, invito tutti coloro che utilizzano queste informazioni a trasmetterci commenti e suggerimenti che saranno presi , in considerazione al fine di migliore la qualità del report.
Antonia Ricci Direttore del Laboratorio Nazionale di Riferimento per le Salmonelle

5
Introduction The report presents data on serovars and phage-types of Salmonella isolates from veterinary matrices in the period 2013-2014, collected by the laboratories participating in the Enter-vet net and submitted to the Italian Reference Laboratory for Salmonella (CRNS). The report includes the following sections:
• data management and summary of the reported data • results of Salmonella serotyping • results of S. Enteritidis and S. Typhimurium (including the monophasic variant) phage-
typing This report is available only as an on-line version (www.izsvenezie.it, pages dedicated to the reference laboratory) and does not present major differences compared to the previous one (based on 2011-2012 data). In order to guarantee the quality of the data obtained by Enter-vet laboratories, the National Reference Laboratory for Salmonella organized, in 2013 and 2014, as in the previous years, interlaboratory comparison studies to test the ability of the participating laboratories to isolate and serotype Salmonella. Hereby I express my gratitude to all persons whose job has been fundamental for the preparation of this report and in particular to colleagues at the Istituti Zooprofilattici who analyze samples, collect and send data on a voluntary basis. Finally, I would like to invite people using the data reported in this document to send us comments and suggestions that will be taken into account in order to improve the quality of the report.
Antonia Ricci
Director of the National Reference Laboratory for Salmonella

6
Elenco dei Laboratori di Riferimento/ Enter-Vet Laboratories
1. Istituto Zooprofilattico Sperimentale Piemonte, Liguria e Valle d’Aosta Via Bologna, 148 10154 Torino Referente/ Contact person: Dott.ssa Lucia De Castelli Laboratorio Controllo Alimenti Tel 011/2686303 | Fax 011/2473450 e-mail: [email protected]
2. Istituto Zooprofilattico Sperimentale Lombardia ed Emilia Romagna
Via A. Bianchi, 9 25124 Brescia Referente/Contact person: Dott. Mario D’Incau Dipartimento di Diagnostica Specializzata – Reparto di Batteriologia Specializzata Tel 030/2290323 | Fax 030/2290570 e-mail: [email protected] Tel 030/2290570 | Fax 030/2290323
3. Istituto Zooprofilattico Sperimentale Umbria e Marche
Via G. Salvemini, 1 06126 Perugia Referente/ Contact person: Dott.ssa Stefania Scuota Laboratorio di Microbiologia degli Alimenti Tel 075/343269 | Fax 075/35047 e-mail: [email protected]
4. Istituto Zooprofilattico Sperimentale Umbria e Marche (sezione di Macerata)
Via dei Velini, 11 62100 Macerata Referente/ Contact person: Dott.ssa Monica Staffolani Tel 0733/262206 | Fax 0733/262069 e-mail: [email protected]
5. Istituto Zooprofilattico Sperimentale Lazio e Toscana
Via Appia Nuova, 1411 00178 Roma Referente/ Contact person: Dott. Stefano Bilei Microbiologia degli alimenti Tel 06/79099423 | Fax 06/79340724 e-mail: [email protected]
6. Istituto Zooprofilattico Sperimentale Abruzzo e Molise
Campo Boario, 64100 Teramo Referente/ Contact person: Dott.ssa Elisabetta Di Giannatale Reparto di Igiene delle Tecnologie Alimentari e dell’Alimentazione Animale Tel 0861/332259 | Fax 0861/332251 e-mail: [email protected]
7. Istituto Zooprofilattico Sperimentale del Mezzogiorno Via Salute, 2 80055 Portici (Na) Referente/ Contact person: Dott.ssa. Maria Rosaria Carullo Dipartimento di Ispezione degli Alimenti di Origine Animale Tel 081/7865213 | Fax 081/7766495
7
e-mail: [email protected]
8. Istituto Zooprofilattico Sperimentale Puglia e Basilicata Via Manfredonia, 20 71100 Foggia Referente: Dott.ssa Elisa Goffredo Unità Operativa Batteriologia Alimentare Tel 0881/786319 | Fax 0881/786374 e-mail: [email protected]
9. Istituto Zooprofilattico Sperimentale della Sicilia
Via Rocco Dicillo, 4 90129 Palermo Referente/ Contact person: Dott.ssa Chiara Piraino Settore Diagnostica Specialistica - Laboratorio di Batteriologia Speciale Tel 091/6565305 | Fax 091/6570803 e-mail: [email protected]
10. Istituto Zooprofilattico Sperimentale della Sardegna
Via Duca degli Abruzzi, 8 07100 Sassari Referente/ Contact person: Dott. Stefano Lollai Sede centrale di Sassari- Dipartimento di Sanità animale Laboratorio di Batteriologia Speciale e-mail: [email protected] Tel. 079 2892327-Fax 079 2892324

8
Gestione dei dati e riepilogo delle notifiche Il sistema Enter-Vet, attivo dal 2002, ha la finalità di raccogliere, a livello nazionale, i dati relativi alla caratterizzazione degli isolati di Salmonella spp. da campioni di origine veterinaria, nonché i correlati dati epidemiologici. In questo IX report vengono presentati i dati raccolti negli anni 2013 e 2014. I nodi della rete Enter-Vet sono rappresentati dagli Istituti Zooprofilattici Sperimentali (IIZZSS), con il coordinamento del Centro di Referenza Nazionale per le Salmonellosi (CRNS). Gli Istituti inviano al CRNS, su base volontaria, i dati relativi alla tipizzazione dei ceppi di Salmonella spp. oltre che alcuni stipiti (in particolare i ceppi appartenenti ai sierotipi S. Enteritidis, S. Typhimurium e la variante monofasica di S. Typhimurium) da sottoporre a tipizzazione fagica. I dati, comprensivi delle informazioni epidemiologiche, vengono trasmessi attraverso un database Access che viene annualmente fornito ai laboratori dal CRNS. È importante sottolineare che la trasmissione volontaria dei dati, nonché la mancanza di criteri specifici per la selezione dei campioni da sottoporre ad analisi, rende poco affidabile la valutazione di trend ma permette di ottenere indicazioni sulla persistenza ed emergenza di particolari sierotipi/fagotipi in specifici contesti. La sierotipizzazione viene eseguita dai laboratori afferenti alla rete secondo il sistema di Kauffmann-White-Le Minor, mentre la fagotipizzazione è eseguita presso il CRNS seguendo gli schemi forniti dall’istituto Health Protection Agency (Colindale, London, UK). La tipologia di campioni di origine veterinaria da cui viene isolata Salmonella spp. e previsti nel database Enter-Vet sono presentati in figura 1.
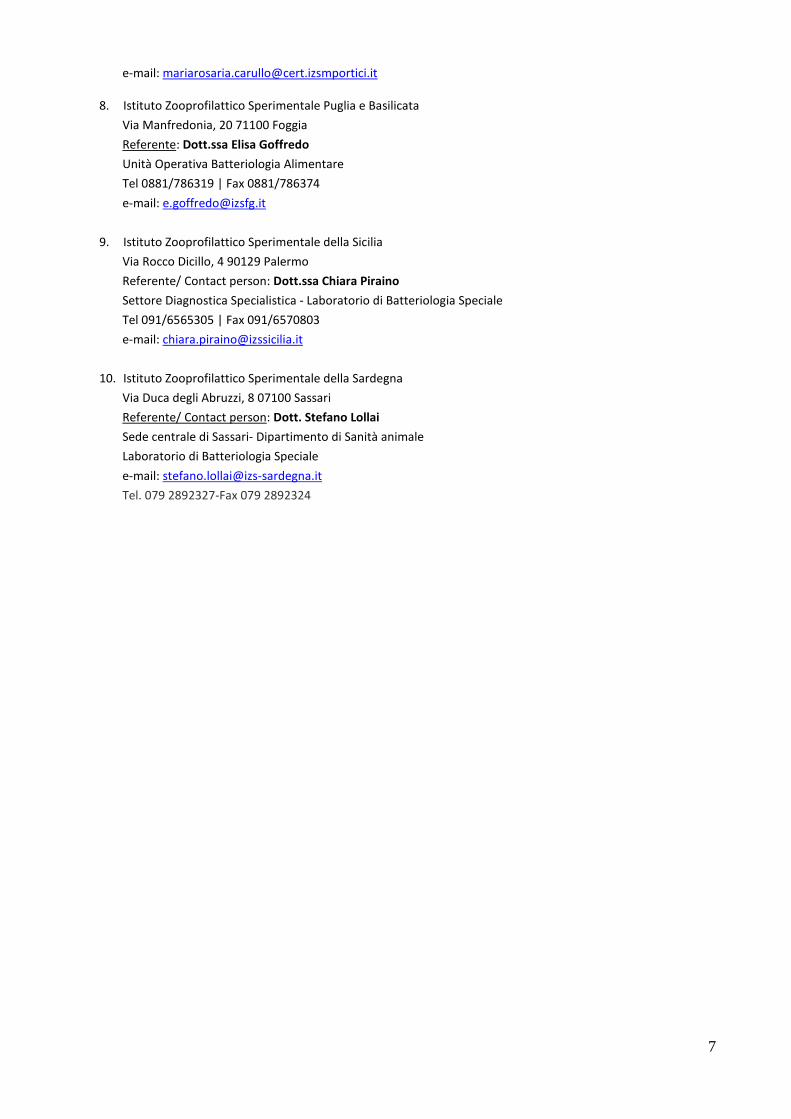
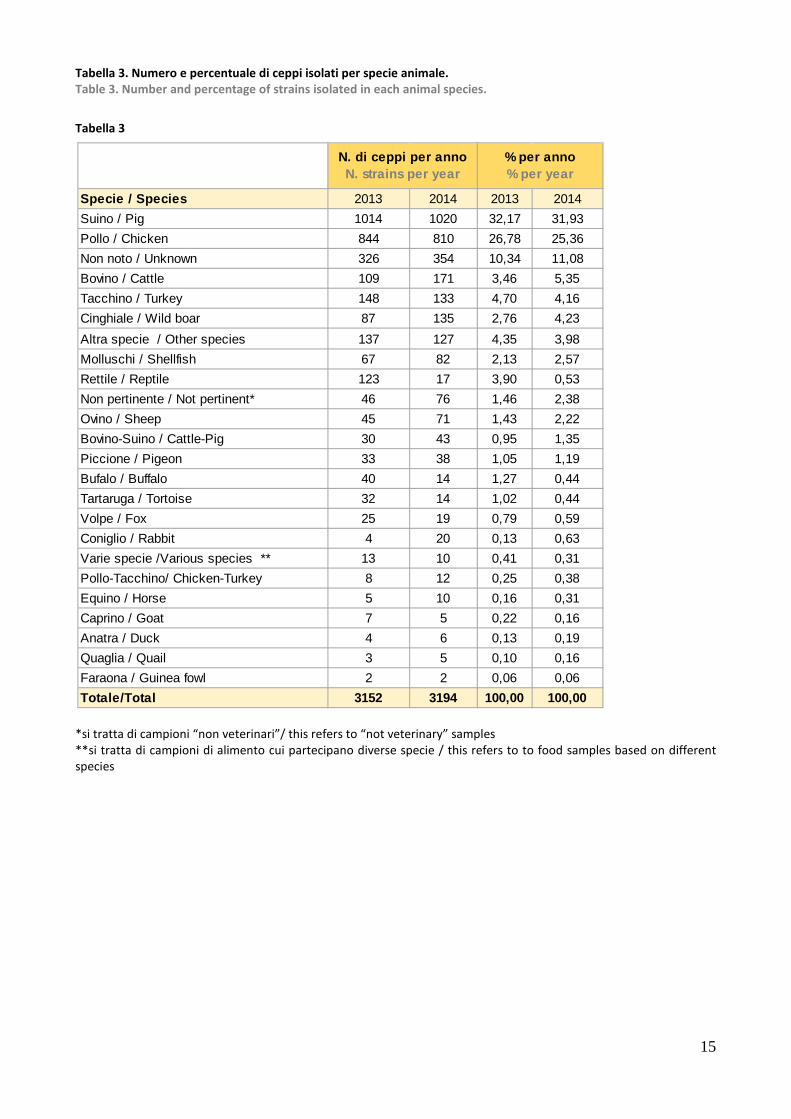
Figura 1: Classificazione dei campioni di origine veterinaria inclusi in Enter-Vet Indipendentemente dal tipo di matrice, i campioni vengono sempre riferiti alla specie animale a cui il campione risulta, direttamente o indirettamente, riconducibile. In riferimento agli anni 2013 e 2014, sono stati trasmessi dati per un totale di 3.152 isolati nel 2013, e 3.194 isolati nel 2014 (Tabella 1). Il maggior numero di ceppi deriva da animale e alimento mentre ambiente, acqua e mangime sono rappresentati in percentuale più limitata. Per quanto riguarda le specie animali principalmente interessate dagli isolamenti di Salmonella spp. al primo posto troviamo suino, cui si riferisce circa il 30% del totale degli isolati in entrambi gli anni, seguito

9
da pollo (26 e 25% rispettivamente in 2013 e 2014), con una inversione di tendenza quindi rispetto agli anni precedenti. Data management and Reports of Salmonella spp. isolates The Enter-Vet system, which was conceived in 2002, has the objective to collect, at national level, analytical data on Salmonella isolates from samples of veterinary origin, as well as the relevant epidemiological data. In this IX report, data collected in 2013 and 2014 are presented. The Enter-Vet net nodes are the Istituti Zooprofilattici Sperimentali (IIZZSS) coordinated by the National reference Laboratory for Salmonella (CRNS); IIZZSS send to CRNS, on a voluntary basis, data resulting from serotyping of Salmonella isolates. Moreover, they submit a selection of isolates belonging to S. Enteritidis, Typhimurium and monophasic variant S. Typhimurium for phage typing. Data, including epidemiological information, are submitted through an Access data base that is annually provided by the CRNS. It is important to underline that the absence of an obligation to send data as well as of criteria to select samples to be submitted means the evaluation of trends is not robust, although this data collection does allow information on persistence and emergence of certain serovars/phage-types in specific contexts to be obtained. Serotyping is performed by laboratories of the Enter-vet net according to the Kauffmann-White-Le Minor scheme, while phage typing is performed by CRNS following the schemes provided by the Health Protection Agency (Colindale, London, UK). The type of samples of veterinary origin from which Salmonella were isolated and included in the Enter-Vet data base are shown in Figure 1.
Figure 1: Classification of samples of veterinary origin included in Enter-Vet Samples were always categorized independently by the type of matrix, according to the animal species to which the sample was directly or indirectly related. In 2013 and 2014, data on 3,152 and 3,194 isolates, respectively, were submitted (Table 1). Most of the isolates were from animals or food while isolates from the environment, water or feed were reported less frequently. As far as the animal species is concerned, the most frequently reported species was pig with 32% of the isolates in both the reporting years, followed by poultry (27 and 25% in 2013 and 2014, respectively) differently from the previous years.
10
Tabella 1. Isolamenti di Salmonella spp. suddivisi per laboratorio Enter-Vet di riferimento. Table 1. Number of Salmonella spp. isolated strains distributed for laboratory.
N° di tipizzazioni effettuate nel biennio Number of strains typed in the two years
Laboratorio EnterVet di riferimento 2013 2014 2013-2014IZS Abruzzo e Molise 96 108 204IZS Del Mezzogiorno 179 144 323IZS delle Venezie 592 714 1306IZS Lazio e Toscana 159 172 331IZS Lombardia ed Emilia Romagna 1540 1162 2702IZS Umbria e Marche (Macerata) 131 327 458IZS Umbria e Marche (Perugia) 154 143 297IZS Piemonte, Liguria e Valle d'Aosta 122 232 354IZS Puglia e Basilicata 81 60 141IZS Sardegna 44 72 116IZS Sicilia 54 60 114Totale/Total 3152 3194 6346
N° di tipizzazioni effettuate per anno Number of strains typed per year
11
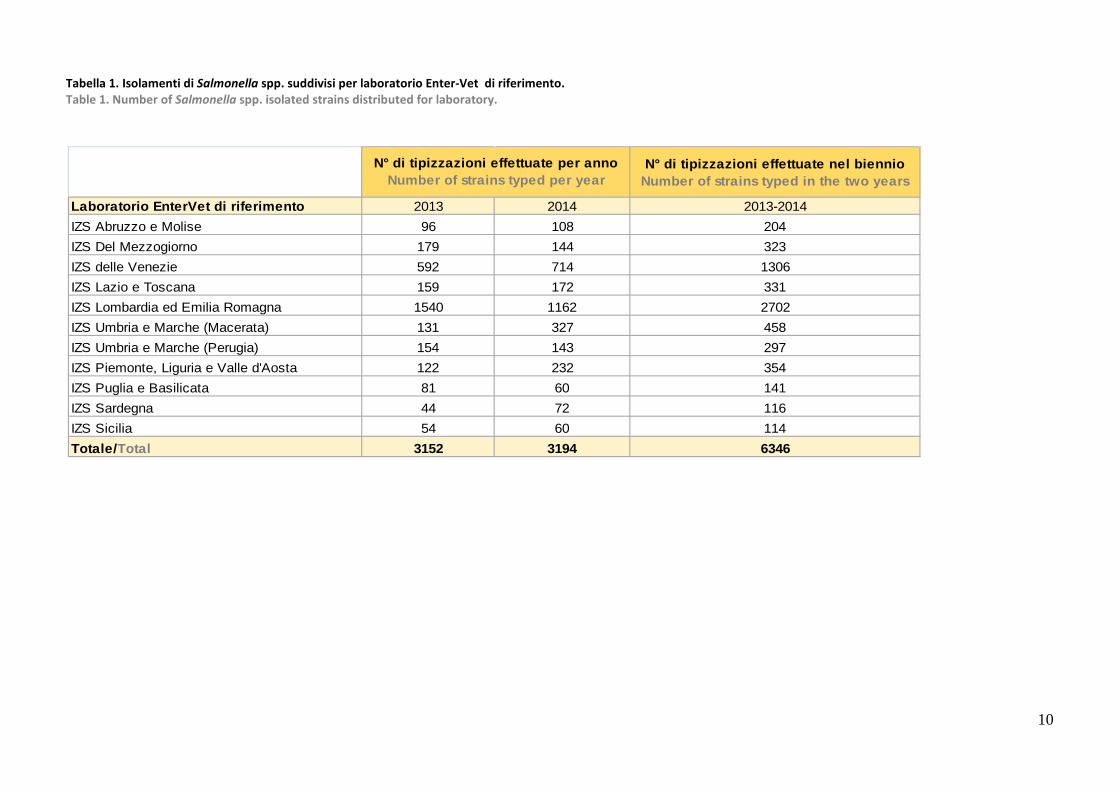
Tabella 2. Distribuzione degli isolati di Salmonella spp. per specie e sottospecie e tipo di campione. Table 2. Distribution of Salmonella spp. strains depending on the species, subspecies and origin of the sample.
Anno Year
Tipo di campioneOrigin of the sample
enterica sub. enterica
enterica sub. diarizonae
enterica sub. salamae
enterica sub. houtenae
enterica sub. arizonae bongori
Totale Total
Animale / Animal 1740 46 26 28 3 1 1844Alimento / Food 974 3 2 979Mangime / Feed 161 2 163Ambiente / Environment 41 41Acqua / Water 26 5 31Non noto / Unknown 91 1 1 1 94
2013 Totale/ Total 3033 55 31 28 4 1 3152
Animale / Animal 1341 53 31 13 8 2 1448Alimento / Food 904 12 6 1 2 925Mangime / Feed 67 1 68Ambiente / Environment 44 44Acqua / Water 23 1 24Non noto / Unknown 671 10 1 3 685
2014 Totale/ Total 3050 76 38 14 12 4 3194

12
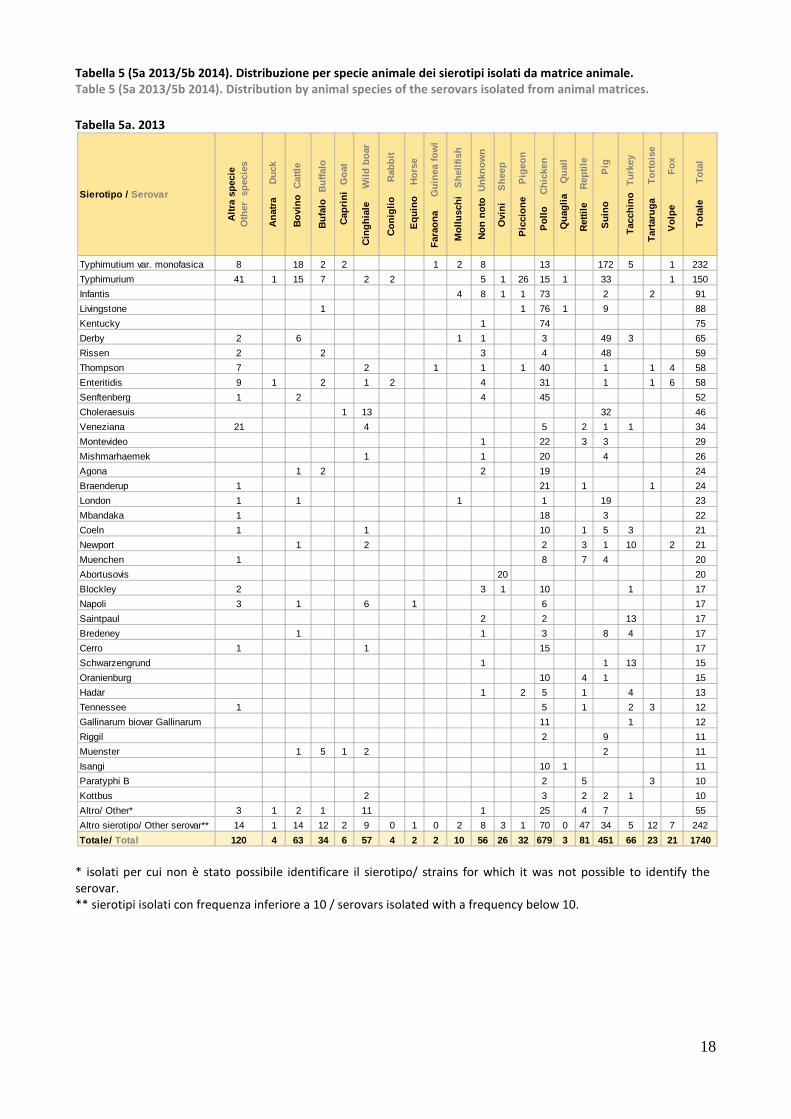
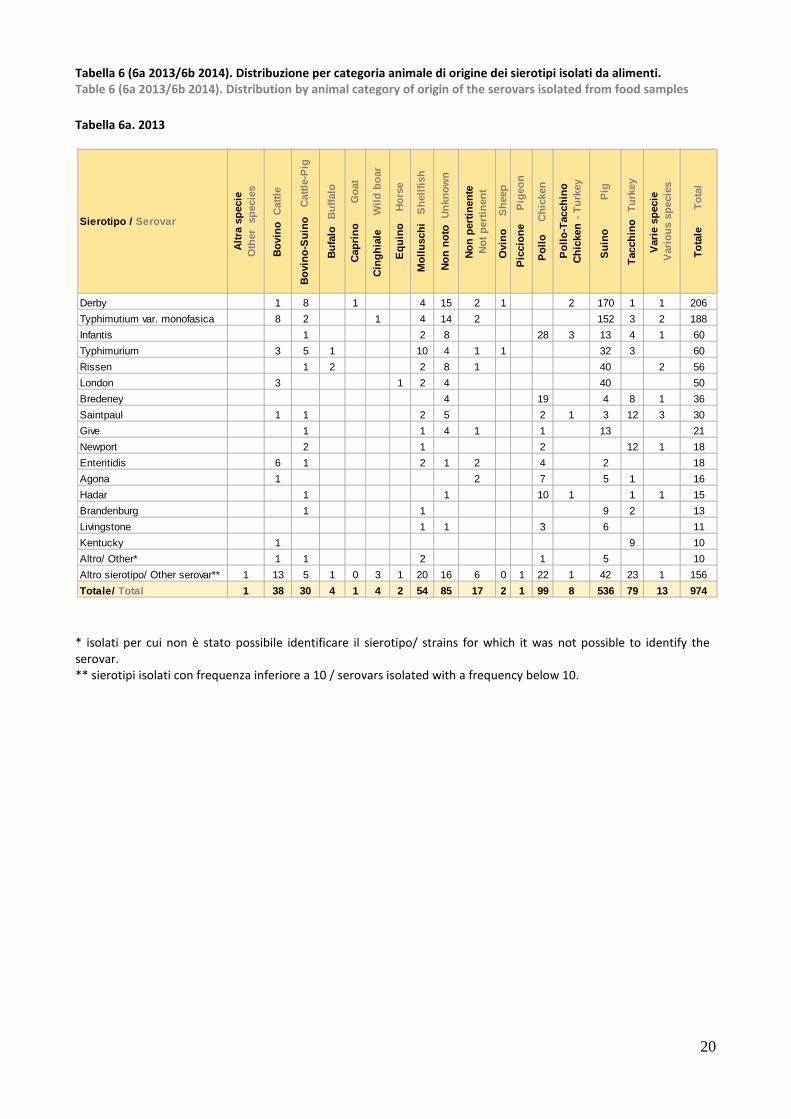
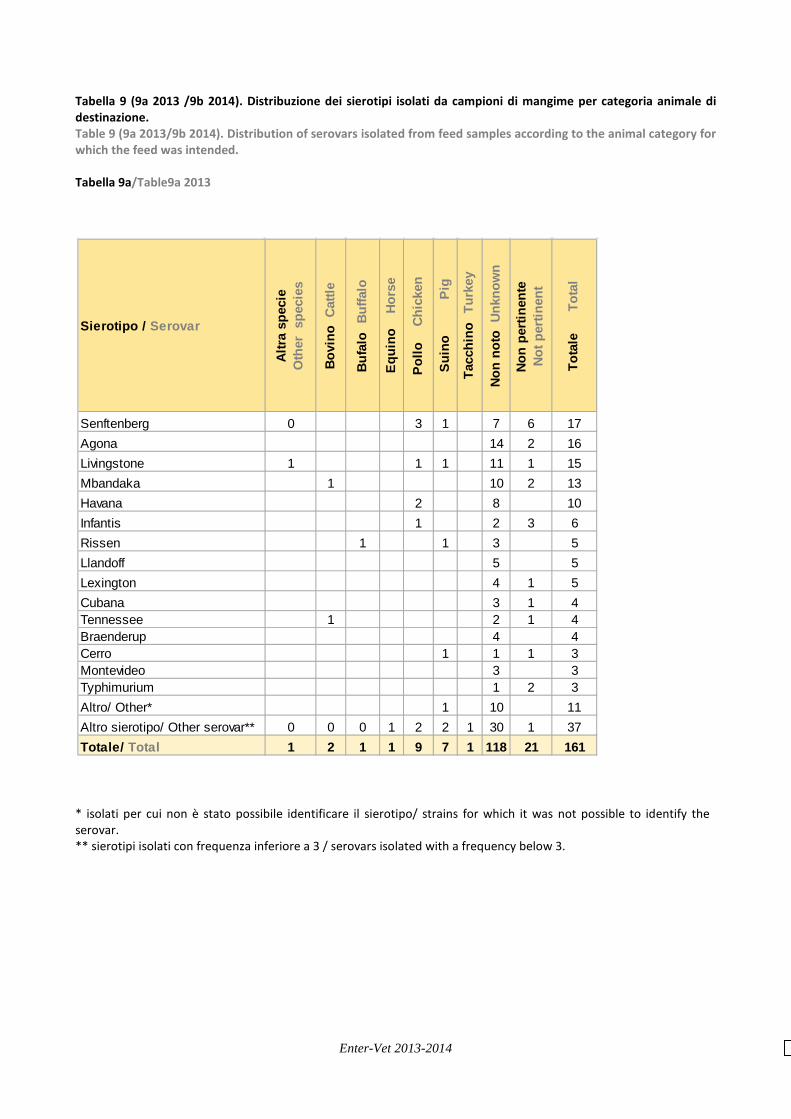
Dati relativi alla distribuzione dei sierotipi Analisi di dettaglio in merito alla distribuzione dei sierotipi sono effettuate esclusivamente per Salmonelle appartenenti alla specie enterica sub-specie enterica. Osservazioni sui dati relativi alla frequenza di distribuzione dei sierotipi devono necessariamente tenere conto del fatto che sono possibili delle variazioni nel tempo anche significative nel numero di isolati sottoposti a sierotipizzazione per specie animale e/o matrice. Si evidenzia che nel 2014 in particolare vi è un aumento significativo di isolati sierotipizzati di cui non è nota l’origine (tabella 2) e che, per quanto riguarda la specie animale cui i campioni sono riconducibili, vi è un aumento importante degli isolati da suino (tabella 3). Negli anni oggetto di indagine l’isolamento di sierotipi di Salmonella considerati rilevanti per la salute pubblica, ovvero S. Enteritidis, S. Typhimurium, S. Typhimurium variante monofasica, è avvenuto con una frequenza, nel complesso, pari al 34% nel 2013 e al 36% nel 2014. Si conferma l’aumento degli isolati riconducibili alla variante monofasica di S. Typhimurium, che si mantiene intorno al 19 e la riduzione degli isolati di S. Typhimurium, che cedono la seconda posizione a S. Derby nel 2013 e a S. Infantis nel 2014. La frequenza di isolamento di S. Enteritidis non presenta significative modifiche rispetto al biennio precedente (frequenza di isolamento sempre inferiore al 5%), (tabella 4). Data on servar distribution Any possible conclusions on the frequency of the distribution of the serovars must be made considering that significant variations over time in the number of isolates submitted to serotyping per animal species and/or type of matrix are possible. It is possible to observe the increasing number of isolates in 2014 with no information on the origin (table 2) and as regards isolates linked to a specific species an increasing number of strains from pig is highlighted (Table 3). As regards serovars with public health significance, S. Enteritidis, S. Typhimurium and S. Typhimurium monophasic variant, they were isolated (all three together) with frequencies equal to 34% and 36 in 2013 and 2014, respectively. It is confirmed the increase of S. Typhimurium monophasic variant (about 19% in both 2013 and 2014) and the decrease of S. Typhumurium, which left the second position to S. Derby in 2013 and to S. Infantis in 2014. The isolation frequency of S. Enteritidis didn’t present major changes (always inferior to 5%), (table 4). Distribuzione dei sierotipi per tipo di campione Osservando i dati relativi agli isolati da matrice animale (tabella 5) si può notare come, per quanto riguarda il pollo , i sierotipi più frequentemente isolati sono S. Livingstone, S. Kentucky e S. Infantis nel 2013, mentre nel 2012 spicca S. Infantis seguita da S. Kentucky. S. Enteritidis occupa la sesta posizione nel 2013 e la terza nel 2014. Nel caso dei suini il sierotipo più frequentemente isolato risulta essere S. Typhimurium variante monofasica (circa il 40% dei casi); per il bovino la variante monofasica di S. Typhimurium e S. Typhimurium occupano le prime due posizioni ed insieme presentano una frequenza di isolamento maggiore del 50%. Nel caso degli isolati da alimenti (tabella 6), la più alta percentuale di isolati deriva dal suino (circa il 50%) dove dominano S. Typhimurium variante monofasica e S. Derby.

13
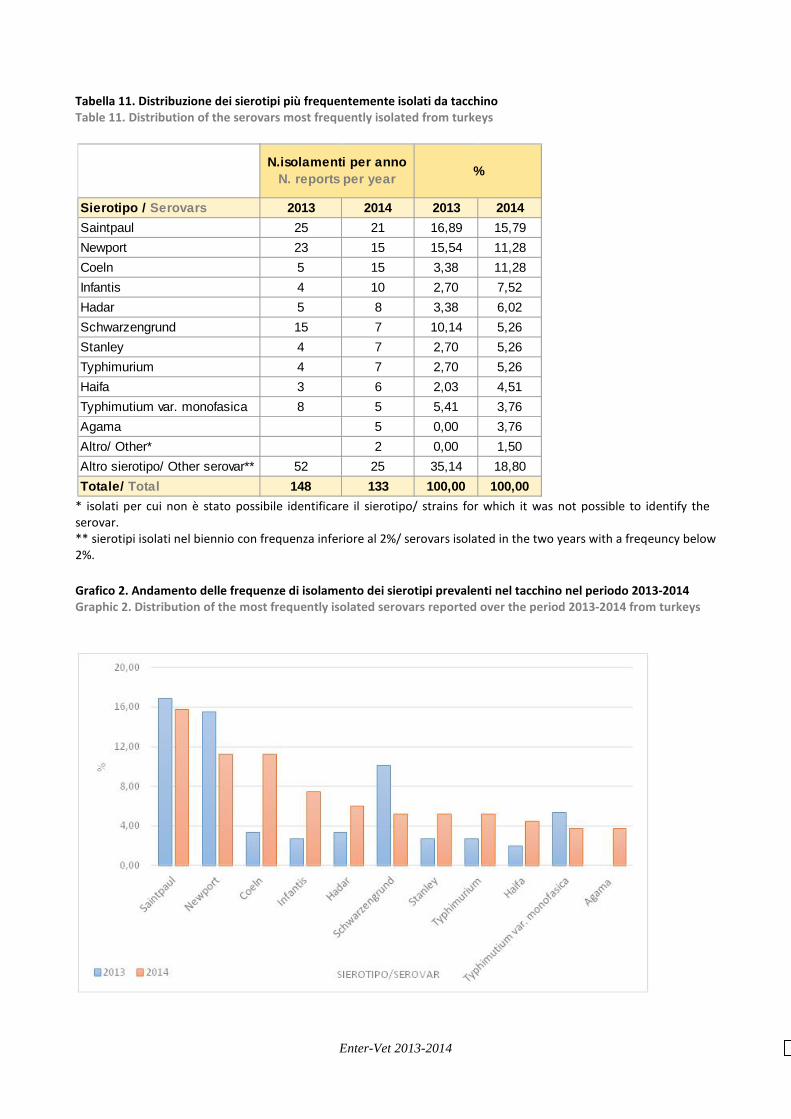
Nel caso di isolati da ambiente il pollo torna a rivestire il ruolo predominante nel 2013 (16/41) mentre nel 2014 pollo e suino contribuiscono quasi in egual misura (15 e 13 isolati rispettivamente /44); in generale si nota una maggiore eterogeneità di sierotipi (tabella 7). Inoltre rispetto agli anni precedenti si nota un significativo calo degli isolati riferibile a questa categoria (207 nel 2011 e 149 nel 2012). Per quanto riguarda l’acqua (tabella 8), pur diminuendo il numero di isolati riferibili a questa matrice si nota una inferiore eterogeneità con il 50% circa degli isolati riferibili a S. Typhimurium e variante monobasica di S. Typhimurium. Infine, per quanto riguarda il mangime (tabella 9) risulta particolarmente elevato il numero di isolati che non sono riconducibili ad una specie definita (118/161 nel 2013 e 27/67 nel 2014); per quanto riguarda i sierotipi più frequentemente isolati, nel biennio è costante la presenza di S. Agona, S. Livingstone e S. Mbandaka nelle prime posizioni. Serovar distribution by type of sample Observing the data on isolates from animal matrices (Table 5), as far as poultry was concerned, the most frequently identified serovars were: S. Livingstone, S. Kentucky and S. Infantis in 2013, while in 2014, S. Infantis followed by S. Kentucky were the most common serovars. S. Enteritidis occupied the sixth position in 2013 and the third one in 2014. In the case of pigs, the most frequently isolated serovar was S. Typhimurium monophasic variant (about 40% of the isolates), while for cattle, S. Typhimurium together with S. Typhimurium monophasic variant were isolated more frequently (more than the 50% of the isolates). Regarding isolates from food (Table 6), the isolates derived most frequently from pigs (around 50%), and S. Typhimurium monophasic variant together with S. Derby predominated. In environmental samples, poultry was again the main cohort in 2013 (16/41) while in 2014 poultry and pig contributed equally (15 and 13 isolates, respectively , out of 44); generally for this type of sample e greater heterogeneity of serovars was noticed (table 7). Moreover as regards environmental samples e significant decrease was highlighted compared to the previous years ( 207 in 2011 and 149 in 2012). As far as water was concerned (Table 8), a general decrease of reports for this category was observed; however a minor heterogeneity of serovars was highlighted with about the 50% of isolates belonging to S. Typhimurium monophasic variant and S. Typhimurium. Finally, in feed (Table 9) It is important to highlight that a huge number of isolates were not related to any particular animal species (118/161 in 2013 and 27/67 in 2014); the serovars most frequently isolated were: S. Agona, S. Mbandaka and S. Livingstone. Distribuzione dei sierotipi per specie animale Entrando nel dettaglio delle singole specie animali si nota come nel caso del pollame (tabella 10) S. Infantis risulti essere il sierotipo più isolato in entrambi gli anni, a differenza di quanto avveniva nel 2012 quando S. Livingstone rappresentava il sierotipo dominante. S. Enteritidis nel 2013 e 2014 si posiziona al quarto posto in termini di frequenza di isolamento, così come nel 2012. Nel caso del tacchino (tabella 11) S. Saintpaul e S. Newport risultano i sierotipi più frequentemente isolati confermando parzialmente quanto osservato nel triennio 2010-2012.

14
Il bovino vede sempre S. Typhimurium e S. Typhimurium variante monofasica come sierotipi frequentemente isolati (tabella 12 e grafico 3), il trend crescente di S. Dublin è riferibile ad un focolaio in un allevamento Veneto. Nel caso del suino, S. Typhimurium variante monofasica rappresenta il 32 e il 35% degli isolati rispettivamente per il 2013 e il 2014 (tabella 13). In entrambi i casi questo sierotipo, sommato a S. Derby, supera il 50% del totale degli isolati. Non si evidenziano quindi differenze rispetto al biennio precedente. Inoltre è confermato il trend decrescente riferibile a S. Typhimurium. Serovar distribution by animal species Looking at the isolates by animal species, it is evident that in poultry (Table 10), S. Infantis was the most frequent serovar in both years, as opposed to 2012, when S. Livingstone was the dominant poultry serovar. S. Enteritidis in 2013 and 2014, was the fourth most frequently isolated serovar, as in 2013. In turkeys (Table 11), S. Newport and S. Saintpaul were the predominant serovars, in line with the observation referred to 2010-2012. In cattle, S. Typhimurium and its monophasic variant have consistently remained the predominating serovars (Table 12 and Graph 3); the increasing trend for S. Dublin was due to an outbreak in a farm of the Veneto region. In pigs, S. Typhimurium monophasic variant accounted for 32 and 35% of the isolates in 2013 and 2014, respectively (Table 13). In both these years, this serovar, together with S. Derby, accounted for more than 50% of the isolates. No major changes were observed compared to the previus two years. Moreover, it was confirmed the decreasing trend for S. Typhimurium.
15
Tabella 3. Numero e percentuale di ceppi isolati per specie animale. Table 3. Number and percentage of strains isolated in each animal species.
Tabella 3
*si tratta di campioni “non veterinari”/ this refers to “not veterinary” samples **si tratta di campioni di alimento cui partecipano diverse specie / this refers to to food samples based on different species
Specie / Species 2013 2014 2013 2014Suino / Pig 1014 1020 32,17 31,93Pollo / Chicken 844 810 26,78 25,36Non noto / Unknown 326 354 10,34 11,08Bovino / Cattle 109 171 3,46 5,35Tacchino / Turkey 148 133 4,70 4,16Cinghiale / Wild boar 87 135 2,76 4,23Altra specie / Other species 137 127 4,35 3,98Molluschi / Shellfish 67 82 2,13 2,57Rettile / Reptile 123 17 3,90 0,53Non pertinente / Not pertinent* 46 76 1,46 2,38Ovino / Sheep 45 71 1,43 2,22Bovino-Suino / Cattle-Pig 30 43 0,95 1,35Piccione / Pigeon 33 38 1,05 1,19Bufalo / Buffalo 40 14 1,27 0,44Tartaruga / Tortoise 32 14 1,02 0,44Volpe / Fox 25 19 0,79 0,59Coniglio / Rabbit 4 20 0,13 0,63Varie specie /Various species ** 13 10 0,41 0,31Pollo-Tacchino/ Chicken-Turkey 8 12 0,25 0,38Equino / Horse 5 10 0,16 0,31Caprino / Goat 7 5 0,22 0,16Anatra / Duck 4 6 0,13 0,19Quaglia / Quail 3 5 0,10 0,16Faraona / Guinea fowl 2 2 0,06 0,06Totale/Total 3152 3194 100,00 100,00
N. di ceppi per anno N. strains per year
% per anno % per year

16
Tabella 4 (4a 2013/4b 2014). Distribuzione dei sierotipi isolati nelle diverse matrici. Table 4 (4a 2011/4b 2012). Distribution of serovars isolated from different matrices. Tabella 4a. 2013
* isolati per cui non è stato possibile identificare il sierotipo/strains for which it was not possible to identify the serovar. ** sierotipi isolati con frequenza inferiore a 29/ serovars isolated with a frequency below 29.
Typhimutium var. monofasica 5 188 4 232 2 9 440 19,02Derby 206 4 65 1 1 277 11,98Typhimurium 8 60 2 150 3 9 232 10,03Infantis 60 1 91 6 21 179 7,74Rissen 56 59 5 120 5,19Livingstone 11 3 88 15 2 119 5,14Kentucky 10 3 75 6 94 4,06Enteritidis 1 18 6 58 1 8 92 3,98Senftenberg 1 7 1 52 17 78 3,37London 1 50 23 74 3,20Thompson 4 2 58 2 3 69 2,98Agona 16 24 16 2 58 2,51Bredeney 36 17 2 55 2,38Choleraesuis 3 46 49 2,12Saintpaul 30 1 17 48 2,08Mbandaka 6 22 13 3 44 1,90Newport 1 18 1 21 1 42 1,82Veneziana 4 34 1 39 1,69Montevideo 2 29 3 34 1,47Give 21 3 2 6 32 1,38Braenderup 3 24 4 31 1,34Muenchen 2 5 20 1 3 31 1,34Altro/ Other* 10 55 11 76 3,29Altro sierotipo/ Other serovar** 7 150 13 477 58 15 720 31,13Totale/ Total 19 824 28 1263 103 76 2313 100,00
%Animale Animal
Alimento Food
Sierotipo / Serovar Mangime Feed
Ambiente Environment
Acqua Water
Non noto Unknown
Totale Total

17
Tabella 4b. 2014
* isolati per cui non è stato possibile identificare il sierotipo/strains for which it was not possible to identify the serovar. ** sierotipi isolati con frequenza inferiore a 29/ serovars isolated with a frequency below 29.
Typhimutium var.monofasica 6 203 5 180 3 94 491 19,84Infantis 112 9 132 1 79 333 13,45Typhimurium 6 57 2 147 5 73 290 11,72Derby 1 110 4 111 1 63 290 11,72Rissen 58 1 60 34 153 6,18Enteritidis 19 2 72 31 124 5,01Kentucky 3 2 98 14 117 4,73Livingstone 14 3 36 4 49 106 4,28Brandenburg 29 5 15 49 1,98London 26 14 2 6 48 1,94Mbandaka 2 20 7 15 44 1,78Agona 23 9 6 4 42 1,70Thompson 2 2 1 23 14 42 1,70Bredeney 12 8 21 41 1,66Newport 12 1 19 4 36 1,45Coeln 10 2 17 7 36 1,45Saintpaul 17 11 6 34 1,37Dublin 7 16 10 33 1,33Napoli 1 3 26 1 1 32 1,29Abortusovis 31 31 1,25Cerro 2 1 21 2 4 30 1,21Altro/ Other* 16 28 9 20 73 2,95Altro sierotipo/ Other serovar** 7 167 11 257 26 107 575 23,23Totale/ Total 16 737 33 1084 41 564 2475 100,00
%Sierotipo / Serovar Acqua Water
Alimento Food
Ambiente Environment
Animale Animal
Non noto Unknown
Totale Total
Mangime Feed
18
Tabella 5 (5a 2013/5b 2014). Distribuzione per specie animale dei sierotipi isolati da matrice animale. Table 5 (5a 2013/5b 2014). Distribution by animal species of the serovars isolated from animal matrices. Tabella 5a. 2013
* isolati per cui non è stato possibile identificare il sierotipo/ strains for which it was not possible to identify the serovar. ** sierotipi isolati con frequenza inferiore a 10 / serovars isolated with a frequency below 10.
Sierotipo / Serovar
Altra
spe
cie
O
ther
spe
cies
Anat
ra
Duc
k
Bovi
no C
attle
Bufa
lo B
uffa
lo
Capr
ini
Goa
t
Cing
hial
e
Wild
boa
r
Coni
glio
R
abbi
t
Equi
no
Hor
se
Fara
ona
G
uine
a fo
wl
Mol
lusc
hi
Shel
lfish
Non
noto
Unk
now
n
Ovi
ni
She
ep
Picc
ione
P
igeo
n
Pollo
C
hick
en
Qua
glia
Q
uail
Retti
le
Rep
tile
Suin
o
P
ig
Tacc
hino
Tur
key
Tarta
ruga
T
orto
ise
Volp
e
Fox
Tota
le
To
tal
Typhimutium var. monofasica 8 18 2 2 1 2 8 13 172 5 1 232Typhimurium 41 1 15 7 2 2 5 1 26 15 1 33 1 150Infantis 4 8 1 1 73 2 2 91Livingstone 1 1 76 1 9 88Kentucky 1 74 75Derby 2 6 1 1 3 49 3 65Rissen 2 2 3 4 48 59Thompson 7 2 1 1 1 40 1 1 4 58Enteritidis 9 1 2 1 2 4 31 1 1 6 58Senftenberg 1 2 4 45 52Choleraesuis 1 13 32 46Veneziana 21 4 5 2 1 1 34Montevideo 1 22 3 3 29Mishmarhaemek 1 1 20 4 26Agona 1 2 2 19 24Braenderup 1 21 1 1 24London 1 1 1 1 19 23Mbandaka 1 18 3 22Coeln 1 1 10 1 5 3 21Newport 1 2 2 3 1 10 2 21Muenchen 1 8 7 4 20Abortusovis 20 20Blockley 2 3 1 10 1 17Napoli 3 1 6 1 6 17Saintpaul 2 2 13 17Bredeney 1 1 3 8 4 17Cerro 1 1 15 17Schwarzengrund 1 1 13 15Oranienburg 10 4 1 15Hadar 1 2 5 1 4 13Tennessee 1 5 1 2 3 12Gallinarum biovar Gallinarum 11 1 12Riggil 2 9 11Muenster 1 5 1 2 2 11Isangi 10 1 11Paratyphi B 2 5 3 10Kottbus 2 3 2 2 1 10Altro/ Other* 3 1 2 1 11 1 25 4 7 55Altro sierotipo/ Other serovar** 14 1 14 12 2 9 0 1 0 2 8 3 1 70 0 47 34 5 12 7 242Totale/ Total 120 4 63 34 6 57 4 2 2 10 56 26 32 679 3 81 451 66 23 21 1740

19
Tabella 5b. 2014
* isolati per cui non è stato possibile identificare il sierotipo/ strains for which it was not possible to identify the serovar. ** sierotipi isolati con frequenza inferiore a 10 / serovars isolated with a frequency below 10.
Sierotipo / Serovar
Altra
spe
cie
O
ther
spe
cies
Anat
ra
Duc
k
Bovi
no C
attle
Bufa
lo B
uffa
lo
Capr
ino
G
oat
Cing
hial
e
Wild
boa
r
Coni
glio
R
abbi
t
Equi
no
Hor
se
Fara
ona
G
uine
a fo
wl
Mol
lusc
hi
Shel
lfish
Non
noto
Unk
now
n
Non
perti
nent
e
Not p
ertin
ent
Ovi
no
She
epPi
ccio
ne
Pig
eon
Pollo
C
hick
en
Qua
glia
Q
uail
Retti
le
Rep
tile
Suin
o
P
ig
Tacc
hino
Tur
key
Tarta
ruga
T
orto
ise
Volp
e
Fox
Tota
le
To
tal
Typhimutium var. monofasica 3 13 1 5 4 1 4 149 180Typhimurium 26 1 28 3 5 3 4 1 2 24 10 1 28 5 6 147 Infantis 4 3 12 1 2 105 5 132Derby 3 1 1 1 1 102 2 111Kentucky 3 94 1 98Enteritidis 28 1 2 2 2 1 33 3 72Rissen 4 3 1 52 60Livingstone 2 28 6 36Abortusovis 31 31Napoli 6 13 1 1 4 1 26Thompson 1 3 17 1 1 23Cerro 4 1 1 14 1 21Mbandaka 1 1 18 20Newport 1 1 8 1 1 1 6 19Coeln 4 1 2 5 1 4 17Dublin 15 1 16Choleraesuis 15 15Senftenberg 1 1 13 15London 1 1 4 8 14Gallinarum 1 2 1 9 13Goldcoast 2 1 9 12Saintpaul 11 11Kottbus 1 5 1 1 3 11Stanley 1 2 7 10Altro/ Other* 3 2 3 3 1 5 1 8 1 1 28Altro sierotipo/ Other serovar** 24 0 4 5 1 13 0 8 0 5 9 1 2 2 78 0 6 23 10 9 3 203Totale/ Total 110 2 67 14 3 61 6 8 2 15 37 4 36 36 446 1 8 412 48 11 14 1341
20
Tabella 6 (6a 2013/6b 2014). Distribuzione per categoria animale di origine dei sierotipi isolati da alimenti. Table 6 (6a 2013/6b 2014). Distribution by animal category of origin of the serovars isolated from food samples Tabella 6a. 2013
* isolati per cui non è stato possibile identificare il sierotipo/ strains for which it was not possible to identify the serovar. ** sierotipi isolati con frequenza inferiore a 10 / serovars isolated with a frequency below 10.
Sierotipo / SerovarAl
tra s
peci
e
O
ther
spe
cies
Bovi
no C
attle
Bovi
no-S
uino
Ca
ttle-
Pig
Bufa
lo B
uffa
lo
Capr
ino
G
oat
Cing
hial
e
Wild
boa
r
Equi
no
Hor
se
Mol
lusc
hi
Shel
lfish
Non
noto
Unk
now
n
Non
perti
nent
e
No
t per
tinen
t
Ovi
no
She
epPi
ccio
ne
Pig
eon
Pollo
C
hick
en
Pollo
-Tac
chin
o
Ch
icke
n - T
urke
y
Suin
o
P
ig
Tacc
hino
Tur
key
Varie
spe
cie
Vario
us s
peci
es
Tota
le
To
tal
Derby 1 8 1 4 15 2 1 2 170 1 1 206Typhimutium var. monofasica 8 2 1 4 14 2 152 3 2 188Infantis 1 2 8 28 3 13 4 1 60Typhimurium 3 5 1 10 4 1 1 32 3 60Rissen 1 2 2 8 1 40 2 56London 3 1 2 4 40 50Bredeney 4 19 4 8 1 36Saintpaul 1 1 2 5 2 1 3 12 3 30Give 1 1 4 1 1 13 21Newport 2 1 2 12 1 18Enteritidis 6 1 2 1 2 4 2 18Agona 1 2 7 5 1 16Hadar 1 1 10 1 1 1 15Brandenburg 1 1 9 2 13Livingstone 1 1 3 6 11Kentucky 1 9 10Altro/ Other* 1 1 2 1 5 10Altro sierotipo/ Other serovar** 1 13 5 1 0 3 1 20 16 6 0 1 22 1 42 23 1 156Totale/ Total 1 38 30 4 1 4 2 54 85 17 2 1 99 8 536 79 13 974

21
Tabella 6b. 2014
* isolati per cui non è stato possibile identificare il sierotipo/ strains for which it was not possible to identify the serovar. ** sierotipi isolati con frequenza inferiore a 10 / serovars isolated with a frequency below 10.
Sierotipo / Serovar
Altra
spe
cie
Oth
er s
peci
es
Anat
ra
Duc
k
Bovi
no C
attle
Bovi
no-S
uino
Ca
ttle-
Pig
Capr
ino
G
oat
Cing
hial
e
Wild
boa
r
Mol
lusc
hi
Shel
lfish
Non
noto
Unk
now
n
Non
perti
nent
e
No
t per
tinen
t
Ovi
no
She
ep
Picc
ione
P
igeo
n
Pollo
C
hick
en
Pollo
-Tac
chin
o
Ch
icke
n - T
urke
y
Qua
glia
Q
uail
Suin
o
P
ig
Tacc
hino
Tur
key
Varie
spe
cie
Vario
us s
peci
es
Tota
le
To
tal
Typhimutium var. monofasica 9 15 1 4 17 3 150 3 1 203Infantis 1 4 2 11 2 1 66 5 16 3 1 112Derby 3 9 2 11 2 1 1 79 2 110Rissen 2 1 9 1 44 1 58Typhimurium 1 5 8 5 5 1 1 1 29 1 57Brandenburg 5 1 1 4 1 1 16 29London 1 1 1 2 1 1 18 1 26Agona 6 1 13 3 23Enteritidis 2 1 1 2 9 4 19Saintpaul 5 1 1 2 5 3 17Give 1 3 13 17Livingstone 1 2 6 5 14Newport 5 7 12Bredeney 1 1 5 2 1 2 12Haifa 4 3 4 1 12Panama 1 10 11Coeln 1 1 2 5 1 10Altro/ Other* 1 2 2 2 1 1 6 1 16Altro sierotipo/ Other serovar** 0 1 12 2 0 0 15 36 13 3 0 24 0 0 26 13 1 146Totale/ Total 1 1 39 43 1 2 41 120 26 8 1 119 12 1 430 49 10 904

Enter-Vet 2013-2014
Tabella 7 (7a 2013/7b 2014). Distribuzione per specie animale dei sierotipi isolati da ambiente. Table 7 (7a 2011/7b 2012). Distribution by animal species of the serovars isolated from environmental samples. Tabella7a. 2013
Sierotipo / SerovarBo
vino
Cat
tle
Bufa
lo B
uffa
lo
Pollo
C
hick
en
Suin
o
P
ig
Tacc
hino
Tur
key
Non
noto
Unk
now
n
Non
perti
nent
e
Not p
ertin
ent
Tota
le
To
tal
Enteritidis 3 3 6Typhimutium var. monofasica 1 1 1 1 4Derby 1 1 2 4Kentucky 3 3Livingstone 1 2 3Thompson 1 1 2Blockley 1 1 2Typhimurium 1 1 2Kedougou 1 1 2Albany 2 2Infantis 1 1Senftenberg 1 1Saintpaul 1 1Liverpool 1 1Szentes 1 1Coeln 1 1Panama 1 1Worthington 1 1Newport 1 1Goldcoast 1 1Nyborg 1 1Totale/ Total 1 1 16 3 1 15 4 41

Enter-Vet 2013-2014
Tabella 7b.2014
Sierotipo / Serovar
Picc
ione
P
igeo
n
Pollo
C
hick
en
Suin
o
P
ig
Tacc
hino
Tur
key
Non
noto
Unk
now
n
Non
perti
nent
e
No
t per
tinen
t
Tota
le
To
tal
Infantis 4 4 1 9Typhimutium var. monofasica 4 1 5Derby 4 4Livingstone 3 3Kentucky 2 2Typhimurium 1 1 2Coeln 1 1 2Enteritidis 1 1 2Kapemba 1 1 2Muenchen 1 1Give 1 1Rissen 1 1Aarhus 1 1Cerro 1 1Kasenyi 1 1Newport 1 1Kedougou 1 1Thompson 1 1Bradford 1 1Goldcoast 1 1Fischerhuette 1 1Montevideo 1 1Totale/ Total 1 15 13 1 6 8 44

Enter-Vet 2013-2014
Tabella 8. Distribuzione dei sierotipi isolati da campioni di acqua. Table 8. Distribution of serovars isolated from water samples.
Tabella 8d. Distribuzione dei campioni di acqua per tipologia. Table 8d. Distribution of water samples according to type.
2013 2014Typhimurium 8 6 14 28,57Typhimutium var. monofasica 5 6 11 22,45Give 2 2 4,08Thompson 2 2 4,08Poona 2 2 4,08Muenchen 2 2 4,08Paratyphi B 1 1 2,04Senftenberg 1 1 2,04Derby 1 1 2,04London 1 1 2,04Kapemba 1 1 2,04Messina 1 1 2,04Pomona 1 1 2,04Veneziana 1 1 2,04Potsdam 1 1 2,04Enteritidis 1 1 2,04Goettingen 1 1 2,04Newport 1 1 2,04Kottbus 1 1 2,04Panama 1 1 2,04Agbeni 1 1 2,04Napoli 1 1 2,04Totale/ Total 26 23 49 100
Sierotipo / Serovar Totale Total %Anno/ Year
2013 2014Di mare/ seawater 20 19 39Potabile/ tap water 10 1 11Superficiale/ surface water 1 4 5Totale/ Total 31 24 55
Totale TotalTipo di acqua/ Type of water Anno/ Year
Enter-Vet 2013-2014
Tabella 9 (9a 2013 /9b 2014). Distribuzione dei sierotipi isolati da campioni di mangime per categoria animale di destinazione. Table 9 (9a 2013/9b 2014). Distribution of serovars isolated from feed samples according to the animal category for which the feed was intended. Tabella 9a/Table9a 2013
* isolati per cui non è stato possibile identificare il sierotipo/ strains for which it was not possible to identify the serovar. ** sierotipi isolati con frequenza inferiore a 3 / serovars isolated with a frequency below 3.
Sierotipo / Serovar
Altra
spe
cie
Oth
er s
peci
es
Bovi
no C
attle
Bufa
lo B
uffa
lo
Equi
no
Hor
se
Pollo
C
hick
en
Suin
o
P
ig
Tacc
hino
Tur
key
Non
noto
Unk
now
n
Non
perti
nent
e
Not p
ertin
ent
Tota
le
To
tal
Senftenberg 0 3 1 7 6 17Agona 14 2 16Livingstone 1 1 1 11 1 15Mbandaka 1 10 2 13Havana 2 8 10Infantis 1 2 3 6Rissen 1 1 3 5Llandoff 5 5Lexington 4 1 5Cubana 3 1 4Tennessee 1 2 1 4Braenderup 4 4Cerro 1 1 1 3Montevideo 3 3Typhimurium 1 2 3Altro/ Other* 1 10 11Altro sierotipo/ Other serovar** 0 0 0 1 2 2 1 30 1 37Totale/ Total 1 2 1 1 9 7 1 118 21 161

Enter-Vet 2013-2014
Tabella 9b/Table9b 2014
* isolati per cui non è stato possibile identificare il sierotipo/ strains for which it was not possible to identify the serovar. ** sierotipi isolati con frequenza inferiore a 3 / serovars isolated with a frequency below 3.
Sierotipo / Serovar
Altra
spe
cie
Oth
er s
peci
es
Bovi
no C
attle
Pollo
C
hick
en
Suin
o
P
ig
Non
noto
Unk
now
n
Non
perti
nent
e
Not p
ertin
ent
Tota
le
To
tal
Mbandaka 1 2 1 1 2 7Agona 1 5 6Typhimurium 2 3 5Livingstone 1 1 2 4Schwarzengrund 2 2 4Havana 1 3 4Tennessee 1 2 3Senftenberg 1 1 1 3Typhimutium var.monofasica 1 2 3Altro/ Other* 1 3 1 2 1 1 9Altro sierotipo/ Other serovar** 4 1 8 6 19Totale/ Total 2 7 7 10 27 14 67

Enter-Vet 2013-2014
Tabella 10. Distribuzione dei sierotipi più frequentemente isolati da pollo Table 10.Distribution of the serovars most frequently isolated from poultry
* isolati per cui non è stato possibile identificare il sierotipo/ strains for which it was not possible to identify the serovar. ** sierotipi isolati nel biennio con frequenza inferiore al 2%/ serovars isolated in the two years with a freqeuncy below 2%. Grafico 1. Andamento delle frequenze di isolamento dei sierotipi prevalenti nel pollo nel periodo 2013-2014 Graphic 1. Distribution of the most frequently isolated serovars reported over the period 2013-2014 from poultry
Sierotipo / Serovars 2013 2014 2013 2014Infantis 124 220 14,69 27,16
Kentucky 80 107 9,48 13,21Livingstone 82 85 9,72 10,49Enteritidis 40 68 4,74 8,40Mbandaka 22 33 2,61 4,07Thompson 46 30 5,45 3,70Cerro 16 18 1,90 2,22Typhimurium 15 16 1,78 1,98Gallinarum biovar Gallinarum 11 15 1,30 1,85Senftenberg 50 14 5,92 1,73Bredeney 24 14 2,84 1,73Altro/ Other* 30 20 3,55 2,47Altro sierotipo/ Other serovar** 304 170 36,02 20,99Totale/ Total 844 810 100,00 100,00
N.isolamenti per anno N. reports per year %
Enter-Vet 2013-2014
Tabella 11. Distribuzione dei sierotipi più frequentemente isolati da tacchino Table 11. Distribution of the serovars most frequently isolated from turkeys
* isolati per cui non è stato possibile identificare il sierotipo/ strains for which it was not possible to identify the serovar. ** sierotipi isolati nel biennio con frequenza inferiore al 2%/ serovars isolated in the two years with a freqeuncy below 2%. Grafico 2. Andamento delle frequenze di isolamento dei sierotipi prevalenti nel tacchino nel periodo 2013-2014 Graphic 2. Distribution of the most frequently isolated serovars reported over the period 2013-2014 from turkeys
Sierotipo / Serovars 2013 2014 2013 2014Saintpaul 25 21 16,89 15,79Newport 23 15 15,54 11,28Coeln 5 15 3,38 11,28Infantis 4 10 2,70 7,52Hadar 5 8 3,38 6,02Schwarzengrund 15 7 10,14 5,26Stanley 4 7 2,70 5,26Typhimurium 4 7 2,70 5,26Haifa 3 6 2,03 4,51Typhimutium var. monofasica 8 5 5,41 3,76Agama 5 0,00 3,76Altro/ Other* 2 0,00 1,50Altro sierotipo/ Other serovar** 52 25 35,14 18,80Totale/ Total 148 133 100,00 100,00
N.isolamenti per anno N. reports per year %

Enter-Vet 2013-2014
Tabella 12. Distribuzione dei sierotipi più frequentemente isolati da bovino Table 12. Distribution of the serovars most frequently isolated from cattle
* isolati per cui non è stato possibile identificare il sierotipo/ strains for which it was not possible to identify the serovar. ** sierotipi isolati nel biennio con frequenza inferiore al 2%/ serovars isolated in the two years with a freqeuncy below 1%. Grafico 3. Andamento delle frequenze di isolamento dei sierotipi prevalenti nel bovino nel periodo 2013-2014 Graphic 3. Distribution of the most frequently isolated serovars reported over the period 2013-2014 from cattle
Sierotipo / Serovars 2013 2014 2013 2014Typhimurium 22 65 20,18 38,01Dublin 11 26 10,09 15,20Typhimutium var.monofasica 26 25 23,85 14,62Rissen 14 0,00 8,19Brandenburg 5 0,00 2,92Derby 8 4 7,34 2,34Enteritidis 6 4 5,50 2,34Mbandaka 2 3 1,83 1,75Muenster 3 2 2,75 1,17Agbeni 2 2 1,83 1,17Goldcoast 1 2 0,92 1,17Infantis 2 0,00 1,17Kasenyi 2 0,00 1,17Altro/ Other* 4 6 3,67 3,51Altro sierotipo/ Other serovar** 24 9 22,02 5,26Totale/ Total 109 171 100,00 100,00
N.isolamenti per anno N. reports per year %

Enter-Vet 2013-2014
Tabella 13. Distribuzione dei sierotipi più frequentemente isolati da suino Table 13. Distribution of the serovars most frequently isolated from pigs
* isolati per cui non è stato possibile identificare il sierotipo/ strains for which it was not possible to identify the serovar. ** sierotipi isolati nel biennio con frequenza inferiore al 2%/ serovars isolated in the two years with a freqeuncy below 1%. Grafico 4. Andamento delle frequenze di isolamento dei sierotipi prevalenti nel suino nel periodo 2013-2014 Graph 4. Distribution of the most frequently isolated serovars reported over the period 2010-2012 from pigs
Sierotipo / Serovars 2013 2014 2013 2014Typhimutium var.monofasica 333 359 32,84 35,20Derby 221 220 21,79 21,57Rissen 89 117 8,78 11,47Typhimurium 65 61 6,41 5,98Brandenburg 12 32 1,18 3,14London 59 31 5,82 3,04Infantis 15 24 1,48 2,35Choleraesuis 34 19 3,35 1,86Give 15 16 1,48 1,57Agona 5 15 0,49 1,47Panama 9 14 0,89 1,37Anatum 3 13 0,30 1,27Livingstone 16 12 1,58 1,18Goldcoast 3 12 0,30 1,18Altro/ Other* 15 17 1,48 1,67Altro sierotipo/ Other serovar** 120 58 11,83 5,69Totale/ Total 1014 1020 100,00 100,00
N.isolamenti per anno N. reports per year %

Enter-Vet 2013-2014
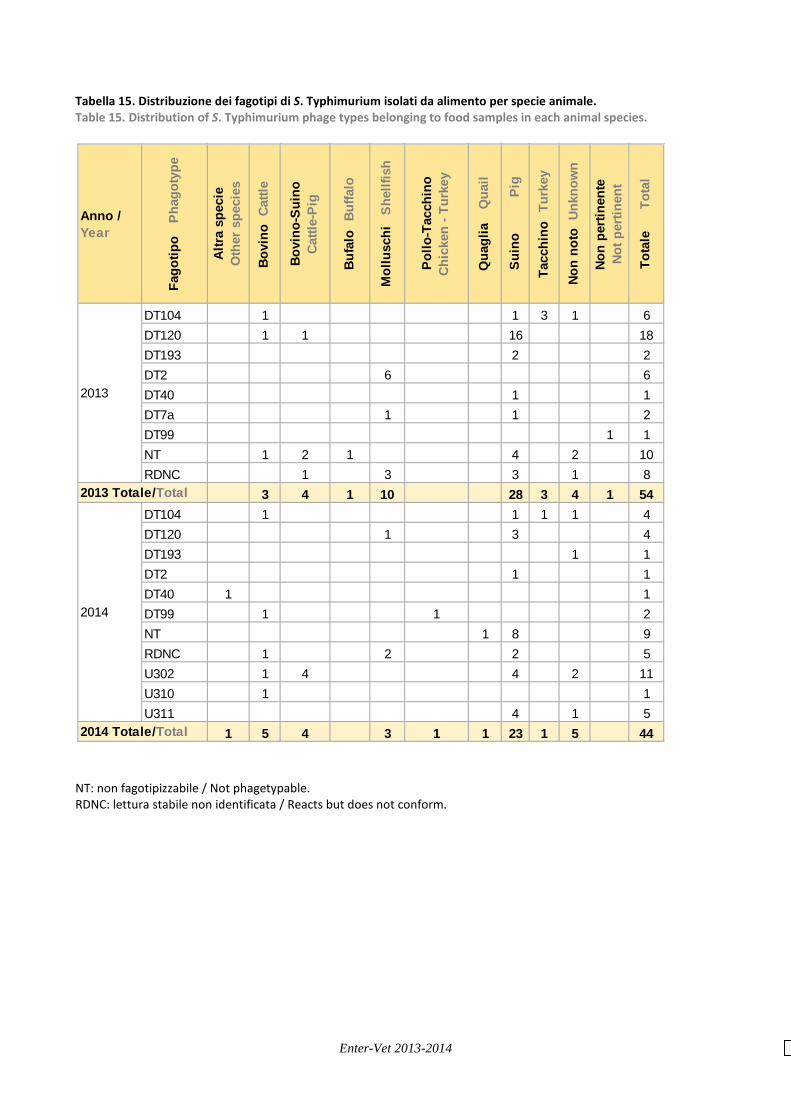
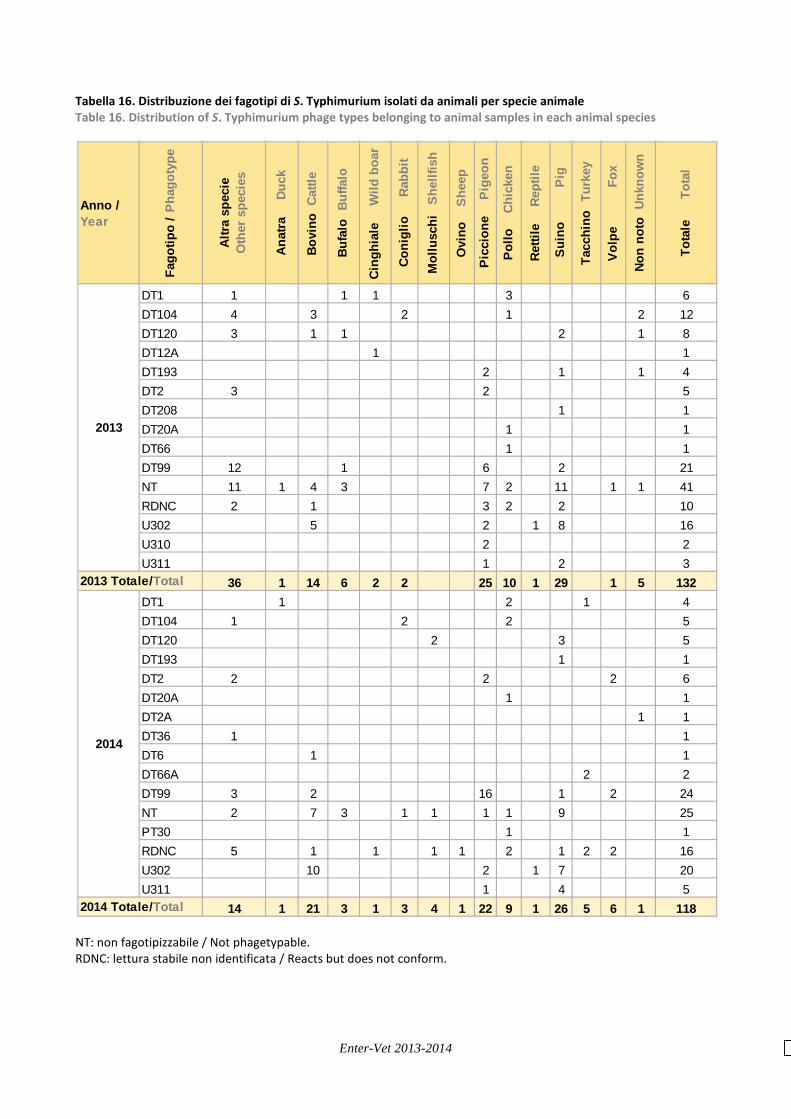
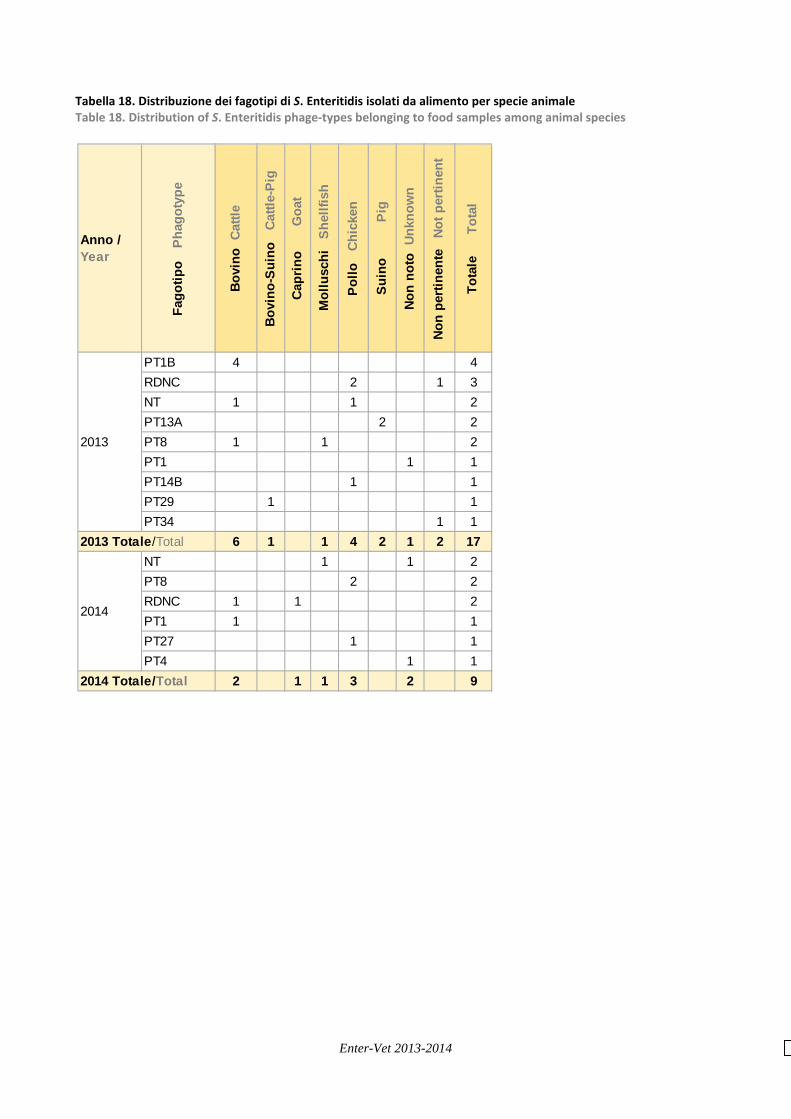
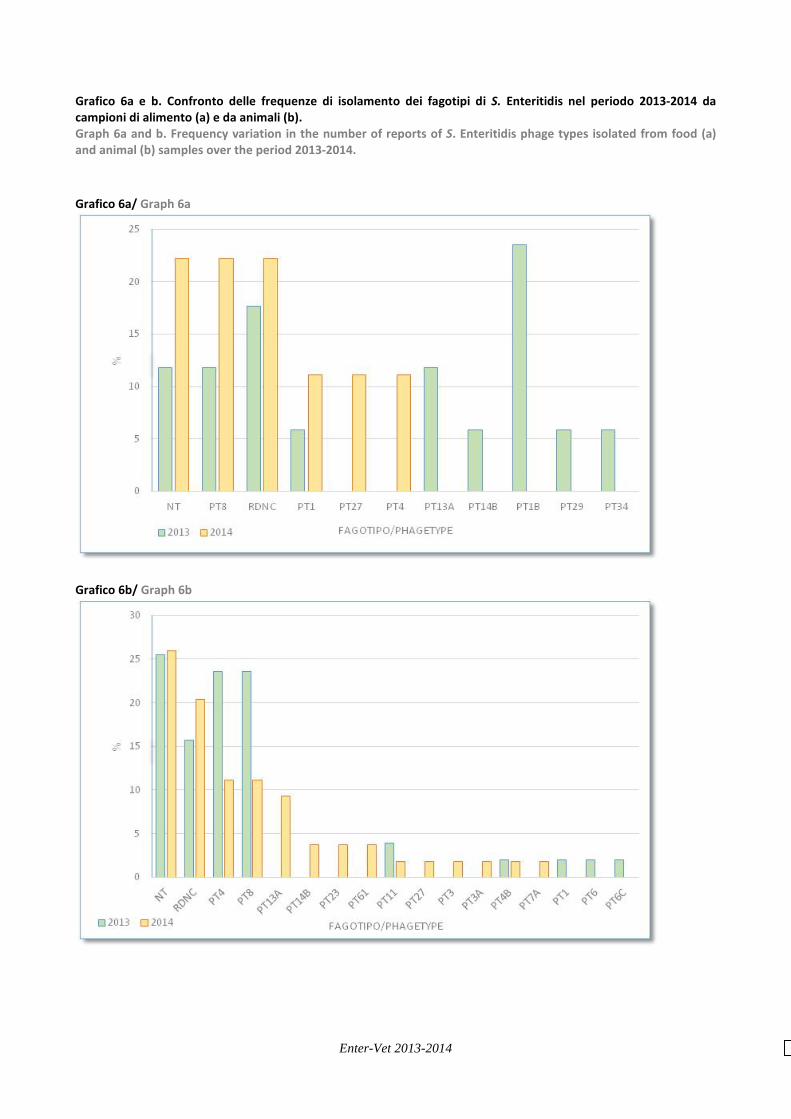
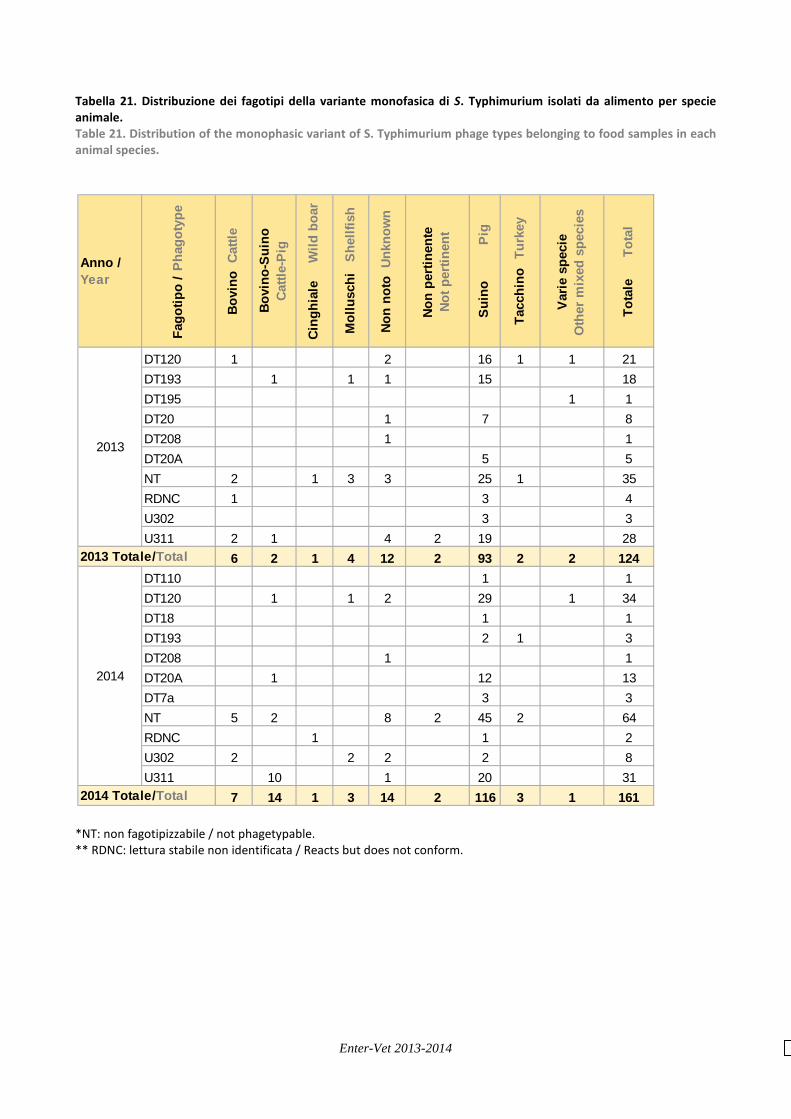
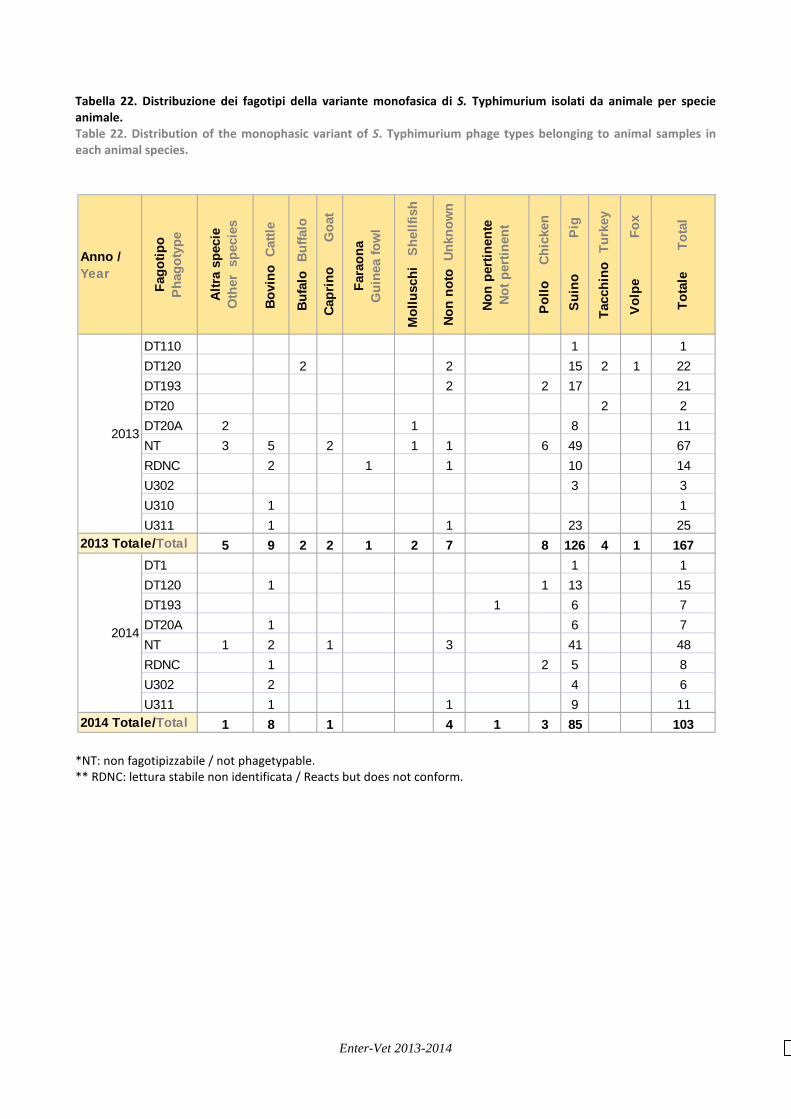
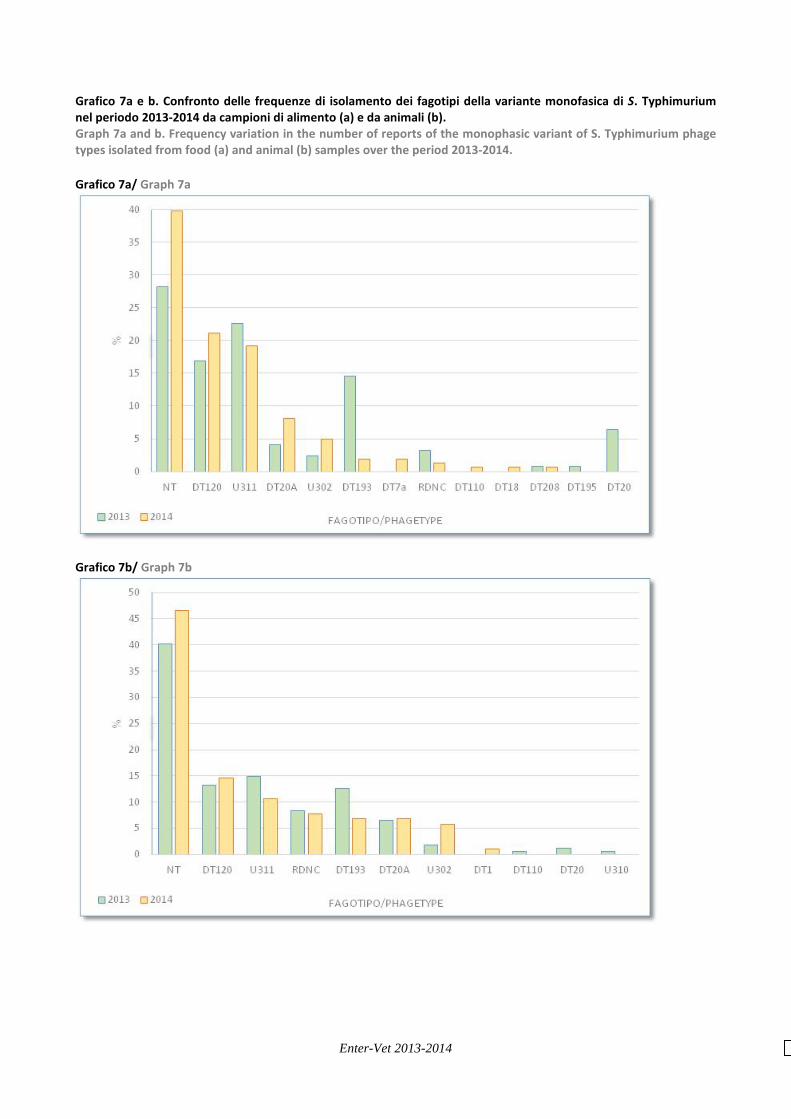
Dati relativi alla distribuzione dei fagotipi In questa sezione vengono riportate le frequenze di distribuzione dei fagotipi relativi a S. Typhimurium, S. Enteritidis e S. Typhimurium variante monofasica nelle tipologie di campioni “alimento” e “animale". Nel caso di S. Typhimurium da campioni di alimento (tabella 15) il fagotipo più frequentemente evidenziato nel 2013 risulta essere DT120 diversamente da quanto avviene nel 2014 in cui il primo posto risulta occupato da U302. In merito a campioni “animali” (tabella 16) nel 2013 occupano le prime posizioni DT99, U302 e DT104 ed esclusivamente DT99 e U302 nel 2014. Principalmente DT99 è riferibile nel biennio a campioni di piccione, U302 è riferibile a suino e bovino, DT120 a suino. S. Enteritidis, come si può osservare dai dati di sierotipizzazione, è isolata principalmente da matrice animale (tabella 18 e 19). In questo caso la specie prevalentemente interessata è il pollo e i fagotipi maggiormente rappresentati sono PT4 e PT8. Un quadro quindi sovrapponibile al biennio prendente. Infine, per quanto riguarda S. Typhimurium variante monofasica, questo sierotipo costituisce la parte più consistente del dataset relativo alla fagotipizzazione. In merito agli isolati da alimento (tabella 21) la maggior parte è riferibile a suino ed i fagotipi più frequenti sono U311 e DT120, con un numero non indifferente di isolati riferibili a DT193 nel 2013. Situazione analoga per quanto riguarda gli isolati da animale (tabella 22). Data on distribution of phagetypes In this section, the frequency of distribution of phage types for S. Typhimurium, S. Enteritidis and S. Typhimurium monophasic variant referred to food and animal samples is reported. With regard to S. Typhimurium referred to food samples (table 15), the most common phage-type was DT120 in 2013 and U302in 2014. As regards animal samples (table 16) the predominat phage types in 2013 were DT99, U302 and DT104 in 2013 and only DT99 and U302 in 2014. DT99 were isolated mostly from pigeons, U302 from pigs and cattle and DT120 from pigs. As was noted from the serotyping data, S. Enteritidis was mainly isolated from animal matrices (Table 18 and 19). In particular, the most common species was poultry (Gallus gallus) and the most common phage-types were PT4 and PT8, a picture very similar to the previous two years. Finally, for the monophasic variant of S. Typhimurium, this is the major contributor to the phage types dataset. As regards isolates referred to food (table 21) most of them are pig related and the most frequent phage types were U311 and DT120, with a consistent number of isolates belonging to DT193 in 2013. A similar picture was observed for isolates referred to animals (table 22).
Enter-Vet 2013-2014
Tabella 15. Distribuzione dei fagotipi di S. Typhimurium isolati da alimento per specie animale. Table 15. Distribution of S. Typhimurium phage types belonging to food samples in each animal species.
NT: non fagotipizzabile / Not phagetypable. RDNC: lettura stabile non identificata / Reacts but does not conform.
Anno / Year
Fago
tipo
Pha
goty
pe
Altra
spe
cie
O
ther
spe
cies
Bovi
no C
attle
Bovi
no-S
uino
Ca
ttle-
Pig
Bufa
lo B
uffa
lo
Mol
lusc
hi
Shel
lfish
Pollo
-Tac
chin
o
Ch
icke
n - T
urke
y
Qua
glia
Q
uail
Suin
o
P
ig
Tacc
hino
Tur
key
Non
noto
Unk
now
n
Non
perti
nent
e
Not p
ertin
ent
Tota
le
To
tal
DT104 1 1 3 1 6DT120 1 1 16 18DT193 2 2DT2 6 6DT40 1 1DT7a 1 1 2DT99 1 1NT 1 2 1 4 2 10RDNC 1 3 3 1 8
2013 Totale/Total 3 4 1 10 28 3 4 1 54DT104 1 1 1 1 4DT120 1 3 4DT193 1 1DT2 1 1DT40 1 1DT99 1 1 2NT 1 8 9RDNC 1 2 2 5U302 1 4 4 2 11U310 1 1U311 4 1 5
2014 Totale/Total 1 5 4 3 1 1 23 1 5 44
2013
2014
Enter-Vet 2013-2014
Tabella 16. Distribuzione dei fagotipi di S. Typhimurium isolati da animali per specie animale Table 16. Distribution of S. Typhimurium phage types belonging to animal samples in each animal species
NT: non fagotipizzabile / Not phagetypable. RDNC: lettura stabile non identificata / Reacts but does not conform.
Anno / Year
Fago
tipo
/ Pha
goty
pe
Altra
spe
cie
Oth
er s
peci
es
Anat
ra
Duc
k
Bovi
no C
attle
Bufa
lo B
uffa
lo
Cing
hial
e
Wild
boa
r
Coni
glio
R
abbi
t
Mol
lusc
hi
Shel
lfish
Ovi
no
She
ep
Picc
ione
P
igeo
n
Pollo
C
hick
en
Retti
le
Rep
tile
Suin
o
P
ig
Tacc
hino
Tur
key
Volp
e
Fox
Non
noto
Unk
now
n
Tota
le
To
tal
DT1 1 1 1 3 6DT104 4 3 2 1 2 12DT120 3 1 1 2 1 8DT12A 1 1DT193 2 1 1 4DT2 3 2 5DT208 1 1DT20A 1 1DT66 1 1DT99 12 1 6 2 21NT 11 1 4 3 7 2 11 1 1 41RDNC 2 1 3 2 2 10U302 5 2 1 8 16U310 2 2U311 1 2 3
2013 Totale/Total 36 1 14 6 2 2 25 10 1 29 1 5 132DT1 1 2 1 4DT104 1 2 2 5DT120 2 3 5DT193 1 1DT2 2 2 2 6DT20A 1 1DT2A 1 1DT36 1 1DT6 1 1DT66A 2 2DT99 3 2 16 1 2 24NT 2 7 3 1 1 1 1 9 25PT30 1 1RDNC 5 1 1 1 1 2 1 2 2 16U302 10 2 1 7 20U311 1 4 5
2014 Totale/Total 14 1 21 3 1 3 4 1 22 9 1 26 5 6 1 118
2013
2014

Enter-Vet 2013-2014
Grafico 5a e b . Confronto delle frequenze di isolamento dei fagotipi di S. Typhimurium nel periodo 2013-2014 da campioni di alimento (a) e da animali (b) Graph 5a and b. Frequency variation in the number of reports of S. Typhimurium phage- ypes isolated from food (a) and animal (b) samples over the period 2013-2014 Grafico 5a/ Graph 5a
Grafico 5b/ Graph 5b
Enter-Vet 2013-2014
Tabella 18. Distribuzione dei fagotipi di S. Enteritidis isolati da alimento per specie animale Table 18. Distribution of S. Enteritidis phage-types belonging to food samples among animal species
Anno / Year
Fago
tipo
Pha
goty
pe
Bovi
no C
attle
Bovi
no-S
uino
Ca
ttle-
Pig
Capr
ino
G
oat
Mol
lusc
hi
Shel
lfish
Pollo
Ch
icke
n
Suin
o
P
ig
Non
noto
Unk
now
n
Non
perti
nent
e N
ot p
ertin
ent
Tota
le
To
tal
PT1B 4 4RDNC 2 1 3NT 1 1 2PT13A 2 2PT8 1 1 2PT1 1 1PT14B 1 1PT29 1 1PT34 1 1
2013 Totale/Total 6 1 1 4 2 1 2 17NT 1 1 2PT8 2 2RDNC 1 1 2PT1 1 1PT27 1 1PT4 1 1
2014 Totale/Total 2 1 1 3 2 9
2013
2014

Enter-Vet 2013-2014
Tabella 19( 19a 2011/19b 2012). Distribuzione dei fagotipi di S. Enteritidis isolati da animali per specie animale. Table 19 (19a 2011/19b 2012). Distribution of S. Enteritidis phage types belonging to animal samples among animal species.
*NT: non fagotipizzabile / not phagetypable. ** RDNC: lettura stabile non identificata / Reacts but does not conform.
Anno / Year
Fago
tipo
Ph
agot
ype
Altra
spe
cie
Oth
er s
peci
es
Anat
ra
Duc
k
Bovi
no C
attle
Bufa
lo B
uffa
lo
Cing
hial
e
Wild
boa
r
Coni
glio
R
abbi
t
Picc
ione
P
igeo
n
Pollo
C
hick
en
Suin
o
P
ig
Volp
e
Fox
Non
noto
Unk
now
n
Tota
le
To
tal
NT 2 6 1 1 3 13PT1 1 1PT11 2 2PT4 1 10 1 12PT4b 1 1PT6 1 1PT6C 1 1PT8 1 1 2 7 1 12RDNC 3 1 4 8
2013 Totale/Total 8 1 2 1 2 26 1 6 4 51NT 5 1 1 1 5 1 14PT11 1 1PT13A 1 1 3 5PT14B 1 1 2PT23 2 2PT27 1 1PT3 1 1PT3A 1 1PT4 1 5 6PT4b 1 1PT61 2 2PT7A 1 1PT8 2 1 3 6RDNC 5 1 5 11
2014 Totale/Total 20 1 2 2 1 26 1 1 54
2013
2014
Enter-Vet 2013-2014
Grafico 6a e b. Confronto delle frequenze di isolamento dei fagotipi di S. Enteritidis nel periodo 2013-2014 da campioni di alimento (a) e da animali (b). Graph 6a and b. Frequency variation in the number of reports of S. Enteritidis phage types isolated from food (a) and animal (b) samples over the period 2013-2014. Grafico 6a/ Graph 6a
Grafico 6b/ Graph 6b
Enter-Vet 2013-2014
Tabella 21. Distribuzione dei fagotipi della variante monofasica di S. Typhimurium isolati da alimento per specie animale. Table 21. Distribution of the monophasic variant of S. Typhimurium phage types belonging to food samples in each animal species.
*NT: non fagotipizzabile / not phagetypable. ** RDNC: lettura stabile non identificata / Reacts but does not conform.
Anno / Year
Fago
tipo
/ Pha
goty
pe
Bovi
no C
attle
Bovi
no-S
uino
Ca
ttle-
Pig
Cing
hial
e
Wild
boa
r
Mol
lusc
hi
Shel
lfish
Non
noto
Unk
now
n
Non
perti
nent
e
No
t per
tinen
t
Suin
o
P
ig
Tacc
hino
Tur
key
Varie
spe
cie
O
ther
mix
ed s
peci
es
Tota
le
To
tal
DT120 1 2 16 1 1 21DT193 1 1 1 15 18DT195 1 1DT20 1 7 8DT208 1 1DT20A 5 5NT 2 1 3 3 25 1 35RDNC 1 3 4U302 3 3U311 2 1 4 2 19 28
2013 Totale/Total 6 2 1 4 12 2 93 2 2 124DT110 1 1DT120 1 1 2 29 1 34DT18 1 1DT193 2 1 3DT208 1 1DT20A 1 12 13DT7a 3 3NT 5 2 8 2 45 2 64RDNC 1 1 2U302 2 2 2 2 8U311 10 1 20 31
2014 Totale/Total 7 14 1 3 14 2 116 3 1 161
2013
2014
Enter-Vet 2013-2014
Tabella 22. Distribuzione dei fagotipi della variante monofasica di S. Typhimurium isolati da animale per specie animale. Table 22. Distribution of the monophasic variant of S. Typhimurium phage types belonging to animal samples in each animal species.
*NT: non fagotipizzabile / not phagetypable. ** RDNC: lettura stabile non identificata / Reacts but does not conform.
Anno / Year
Fago
tipo
Ph
agot
ype
Altra
spe
cie
O
ther
spe
cies
Bovi
no C
attle
Bufa
lo B
uffa
lo
Capr
ino
G
oat
Fara
ona
G
uine
a fo
wl
Mol
lusc
hi
Shel
lfish
Non
noto
Unk
now
n
Non
perti
nent
e
Not p
ertin
ent
Pollo
C
hick
en
Suin
o
P
ig
Tacc
hino
Tur
key
Volp
e
Fox
Tota
le
To
tal
DT110 1 1DT120 2 2 15 2 1 22DT193 2 2 17 21DT20 2 2DT20A 2 1 8 11NT 3 5 2 1 1 6 49 67RDNC 2 1 1 10 14U302 3 3U310 1 1U311 1 1 23 25
2013 Totale/Total 5 9 2 2 1 2 7 8 126 4 1 167DT1 1 1DT120 1 1 13 15DT193 1 6 7DT20A 1 6 7NT 1 2 1 3 41 48RDNC 1 2 5 8U302 2 4 6U311 1 1 9 11
2014 Totale/Total 1 8 1 4 1 3 85 103
2013
2014
Enter-Vet 2013-2014
Grafico 7a e b. Confronto delle frequenze di isolamento dei fagotipi della variante monofasica di S. Typhimurium nel periodo 2013-2014 da campioni di alimento (a) e da animali (b). Graph 7a and b. Frequency variation in the number of reports of the monophasic variant of S. Typhimurium phage types isolated from food (a) and animal (b) samples over the period 2013-2014. Grafico 7a/ Graph 7a
Grafico 7b/ Graph 7b

Enter-Vet 2013-2014
Conclusioni I dati relativi agli approfondimenti sulle caratteristiche degli isolati di salmonella da matrici di origine veterinaria corredati da alcune informazioni di tipo epidemiologico hanno permesso di avere un quadro generale dei principali ceppi di salmonella circolanti in specifici contesti. Le informazioni di dettaglio in merito ad acqua e mangime hanno permesso di fornire nuove evidenze rispetto alle potenziali fonti di contaminazione. Il CRNS auspica quindi che la raccolta dei dati da parte dei laboratori della rete Enter-vet possa mantenersi nel tempo costante e che possa eventualmente arricchirsi rendendo possibili ulteriori approfondimenti. Conclusions The data about the characteristics of Salmonella strains from veterinary matrices combined with epidemiological information allowed to get a general overview about the most common Salmonella isolates from different contexts. Detailed data about water and feed samples provided new evidences about the potential sources of contamination. Therefore, the CRNS hopes that the collection of data by the laboratories of the Enter-vet network could remain constant and eventually become more detailed in order to allow to conduct further investigations.
Lo staff del Centro di Referenza Nazionale per le Salmonellosi The Staff of National Reference Laboratory for Salmonellosis


![N°delModelloNETL12807.2 MANUALEDʼISTRUZIONI · programmadiallenamento.PremereInvio [ENTER]perselezionareilprogrammadiallena - mento. Nonappena vieneselezion - atoilpro - grammapre](https://static.fdocumenti.com/doc/165x107/5c65efeb09d3f20f218b858d/ndelmodellonetl128072-manualedistruzioni-programmadiallenamentopremereinvio.jpg)