
QUADERNI DEL DIPARTIMENTO DI SCIENZE ECONOMICHE E ...
32
1 QUADERNI DEL DIPARTIMENTO DI SCIENZE ECONOMICHE E SOCIALI UNIVERSITÀ CATTOLICA DEL SACRO CUORE PIACENZA YOUNG FIRMS AND INNOVATION: A MICROECONOMETRIC ANALYSIS Gabriele Pellegrino, Mariacristina Piva e Marco Vivarelli Serie Rossa: Economia – Quaderno N. 68 dicembre 2010
Transcript of QUADERNI DEL DIPARTIMENTO DI SCIENZE ECONOMICHE E ...

1
QUADERNI DEL DIPARTIMENTO DI SCIENZE ECONOMICHE E SOCIALI
UNIVERSITÀ CATTOLICA DEL SACRO CUORE PIACENZA
YOUNG FIRMS AND INNOVATION:
A MICROECONOMETRIC ANALYSIS
Gabriele Pellegrino, Mariacristina Piva e Marco Vivarelli
Serie Rossa: Economia – Quaderno N. 68 dicembre 2010
2
Young firms and innovation: a microeconometric analysis
Gabriele Pellegrino
Università Cattolica del Sacro Cuore, Piacenza
Mariacristina Piva Università Cattolica del Sacro Cuore, Piacenza
Marco Vivarelli Università Cattolica del Sacro Cuore, Piacenza;
IZA, Bonn; Max Planck Institute of Economics, Jena
Abstract This paper discusses the determinants of product innovation in young innovative companies (YICs) by looking at in-house and external R&D and at the acquisition of external technology in its embodied and disembodied components. These ‘innovative’ input-output relationships are tested on a sample of 2,713 innovative Italian firms. A sample-selection approach is applied to study both the determinants of product innovation and the factors affecting the intensity of innovation. Results show that in-house R&D is linked to the propensity to introduce product innovation both in mature firms and YICs; however, innovation intensity in the YICs is mainly dependent on embodied technical change from external sources, while in-house R&D does not play a significant role. JEL Classification: O31 Keywords: R&D; Embodied technological change; Product innovation; New firms; Sample selection.
Corresponding author:
Prof. Marco Vivarelli Facoltà di Economia Università Cattolica del Sacro Cuore Via Emilia Parmense 84 I-29122 Piacenza, Italy Phone: +39 0523 599301 E-mail: [email protected]
3
1. Introduction
Increasing interest is being shown by both the scientific community and policy makers in the role
of young innovative companies (YICs) in the new technology implementation process, which contributes
to the renewal of the industrial structure and ultimately to aggregate economic growth1. For instance, one
of the possible explanations of the transatlantic productivity gap could be found in the revealed capacity
of the US economy to generate an increasing flow of young innovative firms which manage to survive
and introduce new products, taking their place at the core of emerging sectors. On the contrary, young
European firms reveal lower innovative capacity and most of them are doomed to early failure, the
process resulting in churning rather than innovative industrial dynamics (see Bartelsman et al., 2004;
Santarelli and Vivarelli, 2007).
There are several different sources of innovation at the firm level; together with in-house and
external R&D activities, technological acquisition (TA) in its embodied (machinery and equipment) and
disembodied components also has to be taken into account. This ‘innovative’ input-output framework can
be seen as an extension of the ‘Knowledge Production Function’ (KPF, initially put forward by Griliches,
1979), a feasible tool for describing the transformation process running from innovative inputs to
innovative outputs (see Section 2).
While most previous microeconometric research has focused on the R&D-Innovation-Productivity
chain (see next section), few studies have explicitly discussed the role of TA and the possible differences
in the KPF across firms of different ages. By using microdata from the European Community Innovation
Survey 3 (CIS 3) for the Italian manufacturing sector, the main novelty of this paper lies in the authors’
investigation of whether R&D and TA lead to significant differences in determining innovative output in
1 For instance, several EU Member States have introduced new measures to support the creation and growth of YICs,
especially by improving their access to funding (see BEPA, 2008; Schneider and Veugelers, 2008).
4
firms of different ages. In particular, it will be tested whether the KPF of YICs exhibits some peculiarities
in comparison with what emerges in the case of mature incumbent firms.
The remainder of the paper is organised as follows: a discussion of the theoretical framework on
which this work is based (Section 2) is followed by a description of the data and indicators used in the
empirical analysis and by discussion of the adopted econometric methodology (Section 3). Subsequently,
the empirical outcomes derived from the descriptive analysis and the econometric estimates (Section 4)
are discussed. Section 5 concludes the paper by briefly summarising the main findings obtained.
2. The literature
Previous economic literature has taken R&D and patents as a starting point for the analysis of
innovative activities across economies, industries and firms. In particular, the relationship between
innovative inputs and outputs explicitly appears as one of the components of those analyses whose main
target is to measure the returns on innovation. In this stream of literature, the first contribution to discuss
the innovative input-output relationship was by Griliches (1979 and 1990), through a three-equation
model in which one of the equations is what he called the Knowledge Production Function (KPF), a
function intended to represent the transformation process leading from innovative inputs (R&D) to
innovative outputs (patents)2. Similarly, the KFP is also included in the models provided by Crèpon et al.
(1998) and Lööf and Heshmati (2001).
The theoretical framework so far described has provided the background for understanding the
link between innovative inputs and outputs and for the empirical assessment of this relationship.
However, for the particular purpose of this paper, most of the previous empirical studies suffer from two
2 The other two equations in Griliches’ simultaneous model represent the production function (augmented by the innovation
term) and the determinants of R&D investment. See also Hall (1996), Hall (2000), Mairesse and Mohnen (2002), Harhoff et al.
(2003) and Hall et al. (2005).

5
main limitations. Firstly, the relationship between innovation inputs and innovation outputs is not their
main focus but rather a secondary equation, ancillary to the authors’ main purpose of investigating firms’
performance in terms of productivity and/or profitability. Secondly, and more importantly, the KPF is
simplified as a link between R&D and patents. Historically driven by relative availability with respect to
other measures of innovation, the relationship between a firm’s R&D investment and patenting activity
leaves room today for a more comprehensive approach to the determinants of its innovativeness. In
particular, nowadays innovation surveys provide more precise and comprehensive measures of both
innovative inputs and outputs.
Consistently, different innovation outputs can be seen as the outcomes of several innovation
inputs and not only as the consequence of formal R&D investments3. For instance, it is important to
consider the role of technological acquisition (TA), both through ‘embodied technical change’4 acquired
by means of investment in new machinery and equipment, and through the purchasing of external
technology incorporated in licences, consultancies, and know-how (Freeman, 1982; Freeman et al., 1982;
Freeman and Soete, 1987).
This paper represents an attempt to open up this broader perspective. Once it has been recognized
that innovative inputs are not confined to formal R&D and that innovative outputs can be measured by
3 This broader perspective is also endorsed in methodological advice as to the collection of data regarding innovation; in
particular, this is well represented by the shift from the R&D-focused Frascati Manual (‘Guidelines for the collection of R&D
data’, first published in 1963) to the Oslo Manual in the 1990s (OECD, 1997).
4 The embodied nature of technological progress and the effects related to its spread in the economy were originally discussed
by Salter (1960) and Solow (1960); in particular, vintage capital models describe an endogenous process of innovation in
which the replacement of old equipment is the main way through which firms update their own technologies (see also
Jorgenson, 1966; Hulten, 1992; Greenwood et al. 1997; Hercowitz, 1998).

6
other indicators rather than patents5, we pave the way for a deeper analysis of firms’ peculiarities in the
KPF. In this framework, firms adapt their innovative strategy to their own particular economic
environment by choosing the most effective combination of innovative inputs and outputs. In doing so,
they distribute economic resources between formal in-house and external R&D, technological change
embodied in machinery and equipment and the purchasing of external know-how and licenses.
In particular, we wonder whether YICs differ from mature incumbents in their input-output
innovative relationships. Are YICs more R&D-based and conducive to a science-based reorientation of
the current industrial structure?6 Or - on the contrary - are YICs weaker than innovative incumbents and
so less R&D-based and basically dependent on external knowledge provided by larger mature firms and
research institutions?
The hypothesis of small and newly established firms being more science-based and
technologically advanced is consistent with the entrepreneurial process of ‘creative destruction’
(Schumpeter, 1934; the so-called Schumpeter Mark I), while the process of ‘creative accumulation’ calls
for large and established firms to take a leading role in the innovative process (Schumpeter, 1942;
Schumpeter Mark II). Adopting evolutionary terminology, the former context can be seen as an
‘entrepreneurial regime’, where new firms and the industrial dynamics are the basic factors of change,
5 See Nelson and Winter (1982) and Dosi (1988) for an extended and more articulated view of the innovative process across
firms.
6 This seems to be the view implicitly accepted in the literature on the so-called ‘New Technology Based Firms’ (NTBFs, see
Storey and Tether, 1998; Colombo and Grilli, 2005), where only YICs in the high-tech sectors are analyzed; in contrast, in this
paper YICs across all sectors are studied. While in this study we compare YICs with mature innovative incumbents, a related
stream of literature investigates the role of innovation in facilitating the entry and post-entry performance of newborn firms
(see Audretsch and Vivarelli, 1996; Arrighetti and Vivarelli, 1999; Cefis and Marsili, 2006). Finally, in this paper only
innovative firms are studied, while another related field of studies investigates the different propensity to innovate according to
a firm’s age (see Hansen, 1992; Huergo and Jaumandreu, 2004).

7
while the latter can be considered a ‘routinized regime’, where larger and older incumbents are the
engines of change and lead the innovative process (see Winter, 1984; Malerba and Orsenigo, 1996;
Breschi et al., 2000).
Indeed, when focusing on all the industrial sectors and not only the emerging or the high-tech
ones, several arguments sustain the view that larger mature firms might turn out to be more R&D based
than their younger counterparts. Firstly, mature larger incumbents are not affected by liquidity constraints
since they have both easier access to external finance and more internal funds to support R&D activities
which are both costly and uncertain. Secondly, larger incumbent firms possess a higher degree of market
power and so enjoy a higher degree of ‘appropriability’ (Gilbert and Newbery, 1982). Empirically, Cohen
and Klepper (1996) provide stylised facts supporting the view that the likelihood of a firm carrying out
R&D increases with size, while Mairesse and Mohnen (2002) highlight the scale economies and the
differences in the organisation of work that make larger established incumbents more inclined to carry out
R&D activities. Thirdly, learning economies (see Arrow, 1962; Malerba, 1992) are often crucial in
innovative dynamics and older (experienced) firms are obviously at an advantage from this perspective.
However, not all innovative firms are large established corporations. Indeed, economic literature
supports the hypothesis that small and young firms face a different technological and economic
environment from large mature firms with respect to innovative activities (see Acs and Audretsch, 1988
and 1990; Acs et al., 1994). In particular, as discussed above, R&D does not represent the sole input
through which firms can produce some innovative outcomes. While the financial and competitive reasons
discussed above can hamper an R&D-based innovative strategy for YICs, it seems much easier for them
to rely on the market and choose ‘to buy’ instead of ‘to make’ technology (Acs and Audretsch, 1990).
One of the hypotheses to be tested in this paper is therefore whether an innovation outcome in YICs relies
more on external sources of knowledge than on formal in-house R&D. This hypothesis appears even
more plausible in a middle-technology economy, such as that of Italy, where middle-tech and traditional

8
sectors represent the core of the industrial structure (for evidence on the crucial role of embodied
technical change and other external sources of knowledge in spurring innovation in the medium and low-
tech sectors, see Santarelli and Sterlacchini, 1994 and Santamaría et al., 2009).
In other words – in the specific Italian ‘national innovation system’ (see Freeman, 1987, Lundvall,
1992 and Nelson, 1993, for an introduction to the concept; Malerba, 1993, for an application to the Italian
case) - NTBFs may be an exception, while for YICs the main way to acquire knowledge might be through
embodied technical change and technological acquisition (for previous evidence on the role of embodied
technological change in fostering innovation in Italian manufacturing firms, see Santarelli and
Sterlacchini, 1990, and Conte and Vivarelli, 2005).
3. Dataset, indicators and methodology
The empirical analysis was carried out using microdata drawn from the third Italian CIS,
conducted over a three-year period (1998-2000) by the Italian National Institute of Statistics (ISTAT) (as
part of the third iteration of the wider Community Innovation Survey project covering EU countries) .
This survey is representative at both the sector and the firm size level of the entire population of Italian
firms with more than 10 employees. The CIS 3 dataset adopts a weighting procedure that relates the
sample of firms interviewed to the entire population7 (ISTAT, 2004).
7 Firm selection was carried out through a ‘one step stratified sample design’. The sample in each stratum was selected with
equal probability and without reimmission. The stratification of the sample was based on the following three variables: firm
size, sector, regional location. Technically, in the generic stratum h, the random selection of n_{h} sample observations among
the N_{h} belonging to the entire population was realized through the following procedure:
- a random number in the 0-1 interval was attributed to each Nh population unit;
- Nh population units were sorted by increasing values of the random number;
- units in the first nh positions in the order previously mentioned were selected.
9
The dataset comprises a set of general information (main industry of affiliation, group belonging,
turnover, employment, exports) and a (much larger) set of innovation variables measuring the firms’
innovativeness, economic and non-economic measures of the effects of innovation, subjective evaluations
of factors hampering or fostering innovation, participation in cooperative innovation activities and access
to public funding. The response rate was 53%, determining a full sample size of 15,512 firms, 9,034 of
which (58.24%) in the manufacturing sector, our focus of attention. The manufacturing sample was then
cleaned of outliers and firms involved in mergers or acquisitions during the previous three years, which
would have biased our results8. We thus ended up with 7,965 innovating and not-innovating firms.
The sub-sample of innovators was then selected following the standard practice of identifying
innovators as those firms declaring that in the previous three years they had introduced product or process
innovations, or had started innovative projects (then dropped or still-to-complete at December 31st, 2000).
The same definition was implemented by ISTAT as a filter to save non-innovators having to plough
through all the questions not relevant to them (with the risk of non-innovating firms not responding to the
rest of the questionnaire). Thus, firms identified as non-innovators were allowed to skip a large number of
‘innovation questions’, leaving us with very little information about their propensity to innovate or to
invest in innovative inputs. This means that the CIS database provides information relevant to this study
Estimates obtained from the selected sample are very close to the actual values in the national population. The weighting
procedure follows Eurostat and Oslo Manual (OECD, 1997) recommendations: weights indicate the inverse of the probability
that the observation is sampled. Therefore, sampling weights ensure that each group of firms is properly represented and
correct for sample selection. Moreover, sampling weights help in reducing heteroscedasticity commonly arising when the
analysis focuses on survey data.
8 In fact, mergers and acquisitions may break the link between innovative inputs and outputs (a link that must be studied within
the context of a single firm).

10
only for innovative firms; therefore only these firms were considered in the following analysis9, ending
up with 3,045 firms. This sample was further reduced to 2,713 firms by keeping only firms the age of
which is available and investing in at least one of the four innovative inputs we focus on. Finally, YICs
were identified as young firms with less than eight years of activity (293 out of 2,713)10.
3.1. Innovative outputs
Innovative outputs (such as patents and product innovations) can be distinguished with respect to
their position in the innovation process. For instance, while patents are better defined as the outcome of
the inventive process, product innovation properly represents the result of the market-oriented innovative
process. However, even though product innovation is driven by demand considerations, it represents a
pre-market result. In contrast, the share of sales deriving from innovative products (Mairesse and
Mohnen, 2002) represents an ex-post result in which the market has positively welcomed the new
products introduced by the firm (Barlet et al., 2000).
Taking these considerations and the interpretative background discussed in Section 2 into account,
this paper uses two available output indicators for the empirical analysis: namely, the introduction of
9 Given that our aim is that of analyzing the nature of the relationships within the innovative process (and not, for example, the
effect of different inputs in determining the probability of innovating), this data limitation does not raise a problem of selection
bias. Since we are interested in the internal mechanisms of the innovative process, we have to focus on a randomly selected
sample of innovative firms (that is, randomness must hold within the innovative sub-sample, not in comparison with the non-
innovative one where such mechanisms are obviously absent). For a study based on a comparison between innovative and non-
innovative Italian firms, see Parisi et al. 2006.
10 As far as the age of the firms in the ‘young firms’ sub-sample is concerned, the threshold of 8 years was chosen to take into
account the trade-off between a lower age and the representativeness of the sub-sample of YICs (here almost 10% of the entire
sample). However, estimates in Section 3.4 were replicated using a larger sample of young firms no more than 10 years old.
The results, available from the authors upon request, do not change substantially.
11
product innovation (PROD), and the share of turnover (sales) derived from innovative products
(TURNIN)11. It is worth noting that this sales-weighted measure of innovation is the only continuous
output indicator provided by the CIS and it indicates the intensity of innovation (Lööf and Heshmati,
2002; Mairesse and Mohnen, 2002).
3.2. Innovative inputs
Bearing in mind the theoretical discussion presented in Section 2, four innovative inputs (inputs in
the ‘knowledge production function’) are used in this paper: in-house and external expenditures in formal
Research and Development (intra muros R&D = IR); Research and Development outsourced to other
firms or research institutes (extra muros R&D = ER); expenditures in embodied technological change
(innovative investment in equipment and machinery = MAC); and expenditures in technology acquisition
(disembodied technology such as know-how, projects and consultancies, licenses and software = TA).
3.3. Control variables
CIS 3 provides further information on firms beyond their innovative activity. Econometric estimates
in this paper adopt some of these indicators as further controls and explanatory variables. Attention is
paid to the following control variables:
1. Firm’s export propensity (EXPint): global competition can spur innovation and capabilities, while
technologically inactive firms are doomed to exclusion from the international arena (e.g.
Archibugi and Iammarino, 1999; Narula and Zanfei, 2003).
11 It is worth emphasizing the link adopted in the questionnaire design; this link goes from product innovation to the sales ratio
indicator since only firms that have introduced product innovation can record a positive percentage of their sales as being
derived from product innovation. This raises an issue of sample selection that will be discussed in the next methodological
Section 3.4.

12
2. Firm’s belonging to an industrial group (IG): Mairesse and Mohnen (2002) underline the expected
innovative benefits due to easier access to (internal) finance and to the effect of intra-group
knowledge links for firms that are members of industrial groups.
3. Firm’s access to policy support (SUPPORT): a government subsidy or a fiscal incentive should
increase a firm’s innovative performance, although the empirical evidence on this is quite
controversial12.
4. Firms participating in a cooperation agreement (COOP): as regards the important role of
cooperation agreements in affecting the innovative output of firms see Cassiman and Veugelers
(2002), Piga and Vivarelli (2003 and 2004), Fritsch and Franke (2004), Parker (2008).
5. Appropriability: the availability and use of different instruments for achieving a larger degree of
appropriability of the innovation rent, such as patents (PATENT), trademarks, secrecy, etc.
(PROT) (see Levin et al., 1987) should positively affect the innovative performance.
6. While the recognized obstacles to innovation (such as financial constraints or organizational
hindrances) (HURDLE) should obviously damage innovative performance, the occurrence of
12 In fact, while public funding should stimulate (in absolute terms) both the input and the output side of innovation, a
crowding out effect seems to operate, displacing (totally or partly) privately funded innovation activities. Using a dataset of
firms which benefited from the Small Business Innovation Research Program, Wallsten (2000) even comes to the conclusion
that R&D grants completely crowd out firm-financed R&D spending, dollar for dollar. The view of Gonzáles et al. (2005) is
much more optimistic: they found no evidence of crowding out. Using an unbalanced panel of more than 2000 Spanish
manufacturing firms, the authors show that government intervention stimulates R&D activities. Midway between such extreme
results, the majority of existing empirical literature on the subject shows that public support fosters innovation, crowding out
effects operating only partially (see Busom, 2000).
13
other forms of innovation (such as organizational change, see Bresnahan et al 2002; Hitt and
Brynjolfsson, 2002; Piva et al, 2005) (OTHERIN) should be complementary to the four
innovative inputs described in the previous section.
Finally Pavitt’s sectoral dummies (Pavitt, 1984) were added to the econometric specification in
order to control for the different sectoral technological opportunity and appropriability conditions.
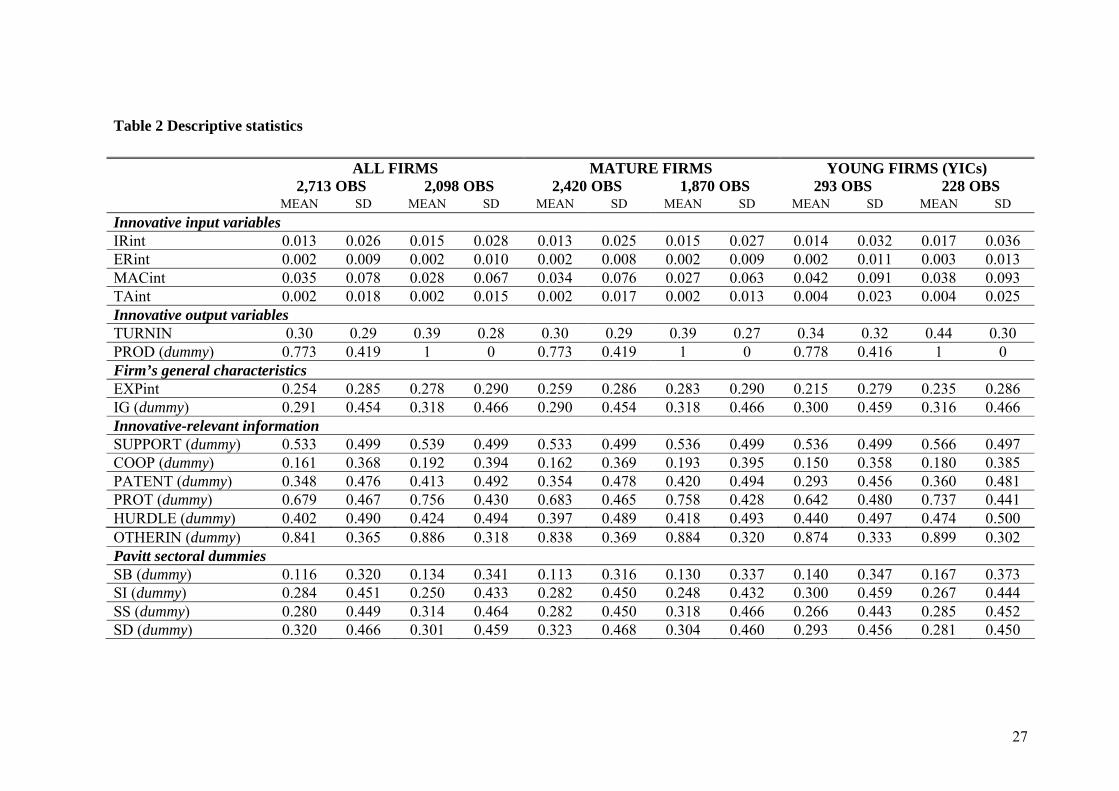
Table 1 describes the variables used in the empirical analysis, while Table 2 reports the
corresponding descriptive statistics, distinguishing all firms, mature firms and YICs and – within each of
these three categories – innovative firms from the subsets characterised by having introduced a product
innovation13.
< INSERT TABLES 1 AND 2 >
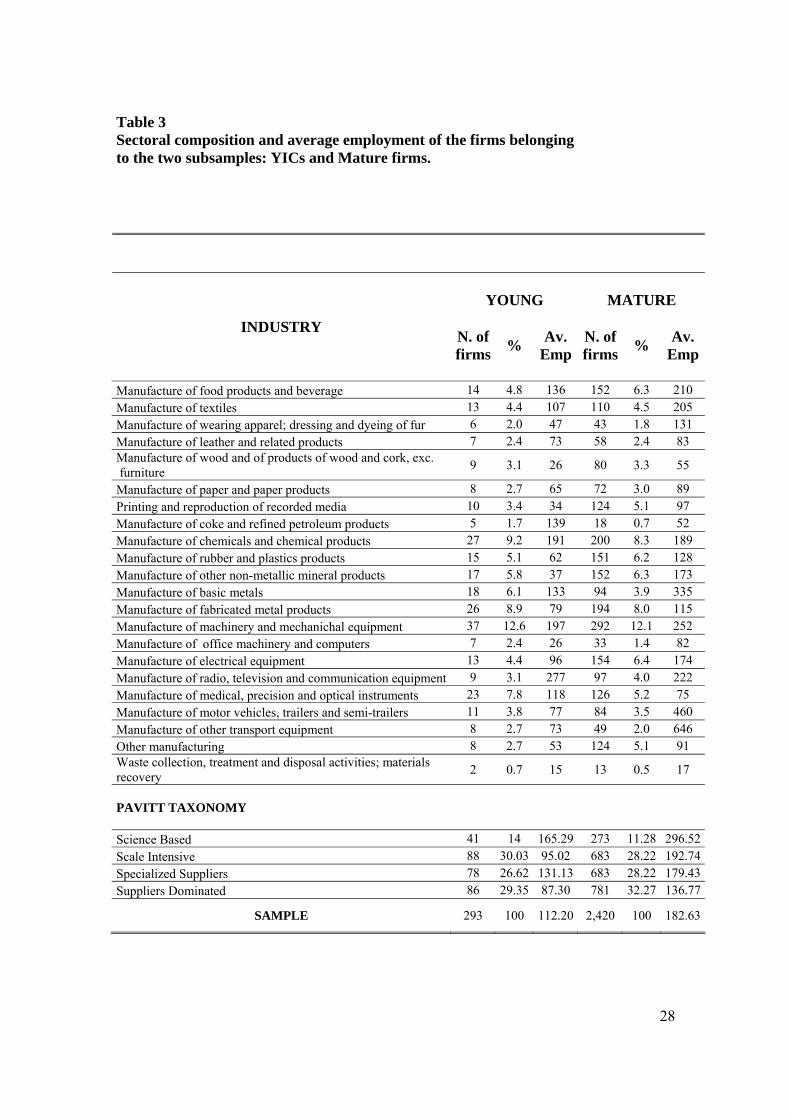
Table 3 reports the sectoral compositions of the two subsamples of mature firms and YICs: as can
be seen, with regard to most sectors and the four Pavitt (1984) categories, no significant differences
emerge; however - to be on the safe side - all the regressions were controlled for Pavitt’s sectoral
dummies. Differently, as far as the size of the firms is concerned, YICs turn out to be relatively smaller
(112 employees on average) than their older counterparts (183 employees). This means that the
subsample of YICs – in contrast with the mature firms - may be affected by those advantages and
disadvantages discussed at the end of Section 2 with reference to small innovative firms (Schumpeter
Mark I type).
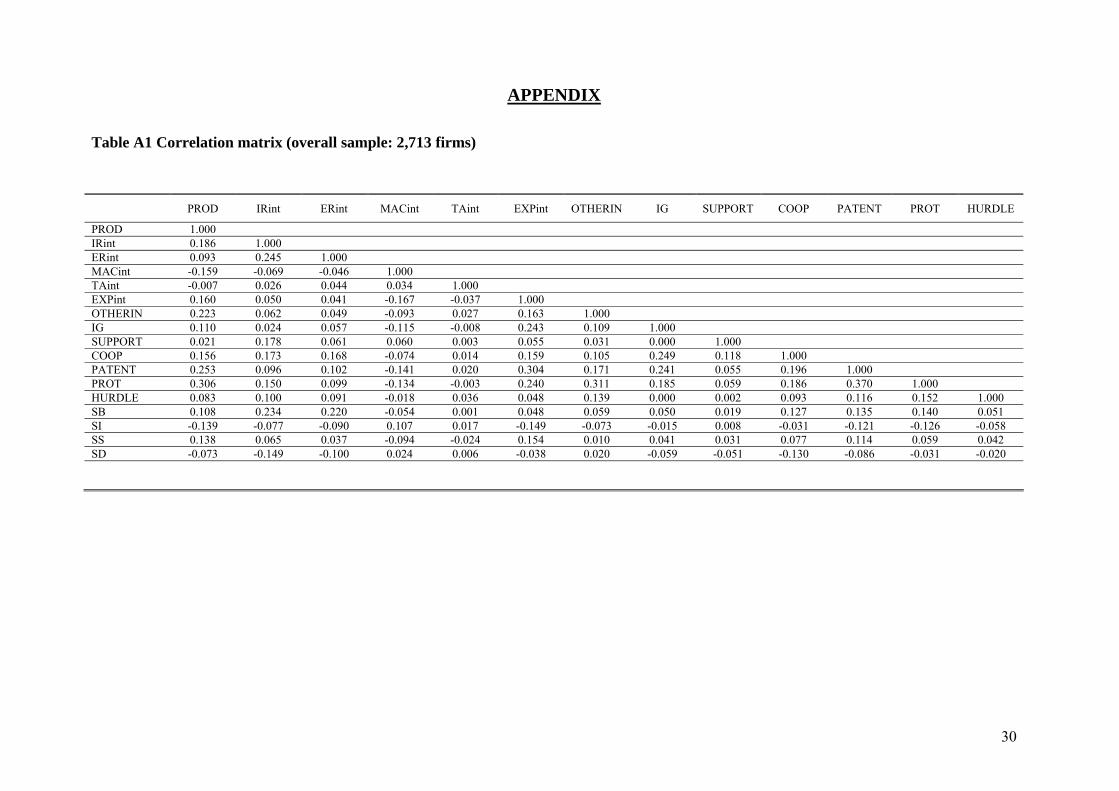
13 In the Appendix, Table A1 reports the correlation matrix for the entire sample; as can be seen, all the correlation coefficients
are less than 0.371, showing that data are not affected by serious collinearity problems. Finally, Table A2 reports the CIS
questions on the basis of which the variables were constructed.
14
< INSERT TABLE 3 >
3.4. Econometric issues
Equation (1) describes the general specification adopted for the aggregate empirical test of the
innovative input-output relationship:
TURNINi = C + β1IRinti + β2ERinti + β3MACinti + β4TAinti + ∑ βJXji + ∑γkPAVITT ki + (1)
where C is the constant, i is the firm-index, TURNIN represents the innovative output in terms of the
percentage of sales due to innovative products, IR, ER, MAC and TA indicate the innovative inputs we
are interested in, X is the vector of the (max j=8) control variables and PAVITT are the sectoral dummies
(Science-based, Scale intensive and Specialised suppliers, with the Suppliers-dominated as the default
category; k=3). Consistently with the dependent variable, the four innovative inputs were normalized by
sales; this makes the inputs homogeneous to the output and also controls for the scale effect due to the
different sizes of the investigated firms.
As a consequence of the questionnaire’s design, the adopted sales-weighted measure of a firm's
innovativeness (TURNIN) assumes a positive value only for firms that have introduced product
innovation (PROD). This raises an obvious problem of sample selection that has to be dealt with. In
particular equation (1) was tested jointly with a selection probit equation (2) of the type:
P(PRODi=1) = C + β1IRinti + β2ERinti + β3MACinti + β4TAinti + ∑ βJZji +∑γkPAVITT ki + i (2)

15
where Z is an extended vector of controls in equation (1), with X Z14.
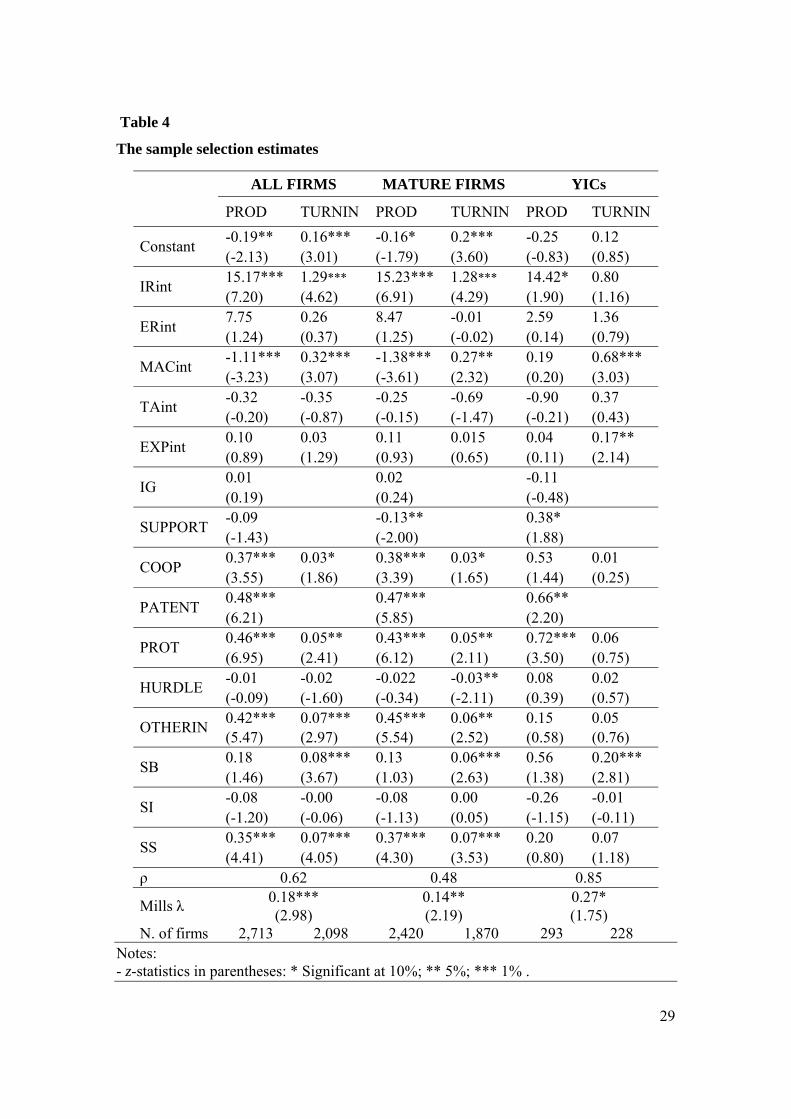
Both the high values of the correlation coefficients (ρ) between the selection and the main equation
and the statistical significances of the Mills ratios in the three models (all firms, mature firms, YICs) (see
Table 4) confirm the validity of the choice of a Heckman-Type (see Heckman, 1979) specification.
Besides these statistical reasons, the advantage of running a Heckman-Type model is the possibility to
separately assess the impact of the different regressors on: (1) the probability to engage in product
innovation (PROD); (2) the intensity of innovation (TURNIN). As we will discuss in the next Section,
this is important from an interpretative point of view. The possible alternative TOBIT methodology (the
results of which are reported in Table A3 for completeness) looses this degree of freedom, arbitrarily
assuming ‘ex-ante’ that the same model can explain both the decision to engage in product innovation and
the intensity of such an innovative behaviour.
< INSERT TABLE 4 >
4. Empirical results
Table 4 reports the econometric results of the sample selection model applied to the entire sample and
separately to the two sub-samples of the mature incumbents and the YICs. As can be seen, in-house
R&D is important in increasing the likelihood of product innovation for the entire sample, although this
link is less significant for the YICs. More importantly and in contrast with the mature firms, innovation
14 X and Z were differentiated, taking into account the statistical significance of the different controls in the two equations, the
occurrence of convergence in all the three models and the need for a homogeneous comparison between them. However,
results are robust to different specifications of the sample selection model (available upon request).
16
intensity (TURNIN) is not related to internal R&D (IR) as far as the YICs are concerned. Far from being
NTBFs, Italian YICs do not turn out to be R&D based, but rather dependent on external sources of
knowledge.
The above result becomes obvious if we turn our attention to the other three innovative inputs.
Neither external research (ER) nor technological acquisition (TA) seem to play a significant role in
spurring product innovation in Italian manufacturing firms. However, in contrast with what happens for
well-established incumbents, their impact is positive, although not significant, with regard to the YICs.
Although statistically very weak, this outcome may suggest a possible role of ER and TA in facilitating
innovation in the young firms.
Much more statistically robust is the outcome concerning the ‘embodied technical change’ variable
MAC. While rendering product innovation less likely15, MAC is positively and significantly linked to the
innovation intensity in all the three models.
However, the coefficient is more than double the size in the case of the YICs. This means that Italian
YICs are particularly dependent on the embodied technical change incorporated in machinery and
equipment purchased from external sources. Together with what was found in relation to the non-
significant impact of IR, this means that the investigated YICs lack endogenous technological
capabilities, while they are massively dependent on technologies coming from other firms through input-
output relationships. On the whole, these results highlight a potential weakness of Italian YICs, which
seem to lack an endogenous capacity to sustain their own innovative activities.
15 This result is consistent with previous studies (see Conte and Vivarelli, 2005) and is not surprising; indeed, it can be seen as
a direct consequence of the sample selection procedure. In fact, MAC is strictly related to process innovation, which is the
innovative category excluded in the selected sample. The 615 excluded firms are those only engaged in process innovation,
while the 2,098 firms included are those exhibiting either product innovation only or product and process innovation jointly.
17
Briefly looking at the control variables (see Section 3.3), not surprisingly we notice that exporting
and science-based YICs are more likely to perform better in terms of innovative intensity. Instead, and in
contrast with the mature firms, YICs do not seem to be established enough to be responsive to variables
such as HURDLE, OTHERIN and PROT. This can be seen as a sign that these firms are still too young
and inexperienced to set up a proper appropriability regime and to develop complementary innovative
strategies.
The results from the alternative TOBIT methodology – pooling together those firms not engaged in
product innovation with those involved into it – are reported in Table A3 in the Appendix. As mentioned
at the end of the previous section, this approach does not allow to disentangle the impact on the
probability to introduce a product innovation from the impact on the intensity of innovation16. However,
the main outcome showing that Italian YICs are mainly dependent on embodied technical change, with
in-house R&D not playing a significant role, is fully confirmed by the TOBIT estimates.
5. Concluding remarks
This paper has discussed the determinants of innovative output in YICs and mature firms, by looking both
at firms’ internal and external R&D activities and at the acquisition of external technology in its
embodied and disembodied components. These innovative input-output relationships have been tested
through a sample selection procedure which takes into account the fact that our measure of innovative
performance only refers to product innovation.
16 For instance, we miss the possibility to single out the peculiar role of MAC within the mature firms, rendering product
innovation less likely but increasing innovation intensity: not surprisingly, the two significant and opposite effects singled out
in the first two models of Table 4 average down into a not significant impact in the first two columns of Table A3.

18
Looking at the aggregate results, it turns out that in-house R&D is closely linked to innovative
performance, while external R&D does not seem to play a relevant role in Italian manufacturing.
However, once the YICs are distinguished from the established firms, in the former internal R&D
expenditures no longer play a role in increasing innovation intensity, although they do increase the
probability of engaging in product innovation. The crucial innovative input for YICs turns out to be the
external acquisition of technology in its embodied component (MAC). The correspondent coefficient is
also positive and significant with regard to the mature firms, but it more than doubles in the case of the
YICs.
These results suggest that in a intermediate-technology context such as Italian manufacturing where
middle-tech and traditional sectors represent the core of the industrial structure, on average YICs cannot
be considered as NTBFs. Rather, they do not turn out to be particularly creative and autonomous in
shaping their innovative KPFs and, therefore, they need to acquire external knowledge in order to foster
their own innovation activity. Indeed they crucially depend on the external environment.
Looking at the sectoral dimension, not surprisingly, the science-based and specialised suppliers firms
(the two high-tech categories in Pavitt’s taxonomy) are significantly more inclined to product innovation
and this is true both for the entire sample and for the mature firms. Interestingly enough, with regard to
the YICs, only the SB dummy turns out to be significant with a coefficient that is more than two times the
correspondent one for the mature firms. This means that – for the YICs – is even more important to
belong to the science-based category, in order to obtain an above-average innovative outcome.
In terms of policy implications, these outcomes highlight a potential weakness of Italian YICs, which
seem to lack a fully-fledged endogenous capacity to sustain their own innovative activities. In turn, this
calls for an industrial and innovation policy able to foster pure NTBFs and able to support the adoption of
more creative behaviours based on R&D-innovation strategies.
19
Acknowledgments
The authors would like to thank Andrea Conte, Giovanni Seri and the ADELE Laboratory at
ISTAT in Rome for the provision of CIS 3 data.
References
Acs, Z.J., Audretsch, D.B., 1988. Innovation in large and small firms: an empirical analysis. The
American Economic Review 78(4), 678-690.
Acs, Z.J., Audretsch, D.B., 1990. Innovation and Small Firms. MIT Press, Cambridge, Mass..
Acs, Z.J., Audretsch, D.B., Feldman, M.P., 1994. R&D spillovers and recipient firm size. The Review of
Economics and Statistics 76(2), 336-340.
Archibugi, D., Iammarino, S., 1999. The policy implications of the globalisation of innovation. Research
Policy 28(2-3), 317-336.
Arrighetti, A., Vivarelli, M., 1999. The role of innovation in the post-entry performance of new small
firms: evidence from Italy. Southern Economic Journal 65(4), 927-939.
Arrow, K., 1962. The economic implications of Learning by Doing. Review of Economic Studies 29(3),
155-173.
Audretsch, D., Vivarelli, M., 1996. Determinants of new-firm startups in Italy. Empirica 23(2), 91-105.
Barlet, C., Duguet, E., Encaoua, D., Pradel, J., 2000. The commercial success of innovations: an
econometric analysis at the firm level in French manufacturing, in D. Encaoua, B.H. Hall, F.
Laisney, J. Mairesse (Eds.), The Economics and Econometrics of Innovation. Kluwer Academic
Publishers, Boston, 435-456.
Bartelsman, E., Haltiwanger, J., Scarpetta, S., 2004. Microeconometric evidence of creative destruction in
industrial and developing countries. IZA Discussion Paper No. 1374.

20
BEPA, 2008. Innovation and Growth in the EU: The Role of SME Policy. European Commission,
Brussels.
Breschi, S., Malerba, F., Orsenigo, L., 2000. Technological regimes and Schumpeterian patterns of
innovation. The Economic Journal 110(463), 388-410.
Bresnahan, T.F., Brynjolfsson, E., Hitt, L.M., 2002. Information technology, workplace organization and
the demand for skilled labor: firm-level evidence. Quarterly Journal of Economics 117(1), 339-376.
Busom, I., 2000. An empirical evaluation of the effects of R&D subsidies. Economics of Innovation and
New Technology 9(2), 111–148.
Cassiman, B., Veugelers, R., 2002. R&D cooperation and spillovers: some empirical evidence from
Belgium. The American Economic Review 92(4), 1169-1184.
Cefis, E., Marsili, O., 2006. Survivor: the role of innovation in firm’s survival. Research Policy 35(5),
626-641.
Cohen, W.M., Klepper, S., 1996. A reprise of size and R&D. The Economic Journal 106(437), 925-951.
Colombo, M.G., Grilli, L., 2005. Founders’ human capital and the growth of New Technology-Based
Firms: a competence-based view. Research Policy 34(6), 795-816.
Conte, A., Vivarelli, M., 2005. One or many knowledge production functions? Mapping innovative
activity using microdata. IZA Discussion Paper No. 1878.
Crépon, B., Duguet, E., Mairesse, J., 1998. Research, innovation and productivity: an econometric
analysis at the firm level. Economics of Innovation and New Technology 7(2), 115-158.
Dosi, G., 1988. Sources, procedures, and microeconomic effects of innovation. Journal of Economic
Literature 26(3), 1120-1171.
Freeman, C., 1982. The Economics of Industrial Innovation, 2nd ed. Pinter, London.
Freeman, C., 1987. Technology Policy and Economic Performance. Lessons from Japan. Pinter, London.
21
Freeman, C., Clark, J., Soete, L., 1982. Unemployment and Technical Innovation: A Study of Long
Waves in Economic Development. Pinter, London.
Freeman, C., Soete, L., 1987. Technical Change and Full Employment. Basil Blackwell, London.
Fritsch, M., Franke, G., 2004. Innovation, regional knowledge spillovers and R&D cooperation. Research
Policy 33(2), 245-255.
Gilbert, R., Newbery, D., 1982. Preemptive patenting and the persistence of monopoly. The American
Economic Review 72(3), 514-526.
Gonzáles, X., Jaumandreu, J., Pazó, C., 2005. Barriers to innovation and subsidy effectiveness. The
RAND Journal of Economics 36 (4), 930-949.
Greenwood, J., Hercowitz, Z., Krusell, P., 1997. Long-run implications of investment-specific
technological change. The American Economic Review 87(3), 342-362.
Griliches, Z., 1979. Issues in assessing the contribution of Research and Development to productivity
growth. The Bell Journal of Economics 10(1), 92-116.
Griliches, Z., 1990. Patent statistics as economic indicators: a survey. Journal of Economic Literature
28(4), 1661-1707.
Hall, B.H., 1996. The private and social returns to Research and Development, in B.L.R. Smith, C.E.
Barfield (Eds.), Technology, R&D, and the Economy. Brookings Institution and American
Enterprise Institute, Washington, DC, 140-183.
Hall, B.H., 2000. Innovation and market value, in R. Barrell, G. Mason, M. O’Mahoney (Eds.),
Productivity, Innovation and Economic Performance. Cambridge University Press, Cambridge, 177-
198.
Hall, B.H., Jaffe, A., Trajtenberg, M., 2005. Market value and patent citations. RAND Journal of
Economics 36(1), 16-38.
Hansen, J.A., 1992. Innovation, firm size, and firm age. Small Business Economics 4(1), 37-44.
22
Harhoff, D., Scherer, F.M., Vopel, K., 2003. Citations, family size, opposition, and the value of patent
rights. Research Policy 32(8), 1343-1364.
Heckman, J., 1979. Sample selection as a specification error. Econometrica 47(1), 153-161.
Hercowitz, Z., 1998. The ‘embodiment’ controversy: A review essay. Journal of Monetary Economics 41,
217-24.
Hitt, L.M., Brynjolfsson, E., 2002. Information technology, organizational transformation, and business
performance, in N. Greenan, Y. L’Horty, J. Mairesse (Eds.) Productivity, Inequality, and the Digital
Economy. A Transatlantic Perspective. MIT Press, Cambridge, Mass., 55-91.
Huergo, E., Jaumandreu, J., 2004. How does probability of process innovation change with firm age.
Small Business Economics 22(3-4), 193-207.
Hulten, C.R., 1992. Growth accounting when technical change is embodied in capital. The American
Economic Review 82(4), 964-980.
ISTAT, 2004. Statistiche sull’Innovazione delle Imprese. Settore Industria. Anni 1998-2000. ISTAT,
Rome.
Jorgenson, D.W., 1966. The embodiment hypothesis. Journal of Political Economy 74(1), 1-17.
Lööf, H., Heshmati, A., 2001. On the relationship between innovation and performance: a sensitivity
analysis. ECIS – Stockholm School of Economics, Working Paper Series in Economics and Finance
No. 446.
Lööf, H., Heshmati, A., 2002. Knowledge capital and performance heterogeneity: a firm-level innovation
study. International Journal of Production Economics 76(1), 61-85.
Lundvall, B.-Å., 1992. National Systems of Innovation. Pinter, London.
Mairesse, J., Mohnen, P., 2002. Accounting for innovation and measuring innovativeness: an illustrative
framework and an application. The American Economic Review, Papers and Proceedings 92(2),
226-230.
23
Malerba, F., 1992. Learning by firms and incremental technical change. Economic Journal 102(413), 845-
859.
Malerba, F., 1993. The National System of Innovation: Italy, in R.R. Nelson (Ed.), National Systems of
Innovation: A Comparative Study. Oxford University Press, Oxford, 230-260.
Malerba, F., Orsenigo, L., 1996. Schumpeterian patterns of innovation. Cambridge Journal of Economics
19(1), 47-65.
Narula, R., Zanfei, A., 2003. The international dimension of innovation, in J. Fagerberg, D.C. Mowery,
R.R. Nelson (Eds.), The Oxford Handbook of Innovation. Oxford University Press, Oxford, 318-
345.
Nelson, R.R., 1993. National Innovation Systems: A Comparative Analysis. Oxford University Press,
Oxford.
Nelson, R.R., Winter, S.G., 1982. An Evolutionary Theory of Economic Change. Harvard University
Press, Harvard.
OECD, 1997. Oslo Manual: The Measurement of Scientific and Technological Activities. Proposed
Guideline for Collecting and Interpreting Technological Innovation Data. OECD, Paris.
Parisi, M.L., Schiantarelli, F., Sembenelli, A., 2006. Productivity, innovation and R&D: micro evidence
for Italy. European Economic Review 50(8), 2037-2061.
Parker, S., 2008. The economics of formal business networks. Journal of Business Venturing 23(6), 627-
640.
Pavitt, K., 1984. Sectoral patterns of technical change: towards a taxonomy and a theory. Research Policy
13(6), 343-373.
Piga, C.A., Vivarelli, M., 2003. Sample selection in estimating the determinants of cooperative R&D.
Applied Economics Letters 10(4), 243-246.
24
Piga, C.A., Vivarelli, M., 2004. Internal and external R&D: a sample selection approach. Oxford Bulletin
of Economics and Statistics 66 (4), 457-482.
Piva, M., Santarelli, E., Vivarelli, M., 2005. The skill bias effect of technological and organisational
change: evidence and policy implications. Research Policy 34(2), 141-157.
Salter, W.E.G., 1960. Productivity and Technical Change. Cambridge University Press, Cambridge.
Santamaría, L., Nieto, M.J., Barge-Gil, A., 2009. Beyond formal R&D: taking advantage of other sources
of innovation in low-and medium-technology industries. Research Policy 38(3), 507-517.
Santarelli, E., Sterlacchini, A., 1990. Innovation, formal vs. informal R&D, and firm size: some evidence
from Italian manufacturing firms. Small Business Economics 2(2), 223-228.
Santarelli, E., Sterlacchini, A. 1994. Embodied technological change in supplier dominated firms.
Empirica 21, 313-27.
Santarelli, E., Vivarelli, M., 2007. Entrepreneurship and the process of firms’ entry, survival and growth.
Industrial and Corporate Change 16(3), 455-488.
Schneider, C., Veugelers, R., 2008. On young innovative companies: why they matter and how (not) to
policy support them. Department of Economics, Copenhagen Business School Working Paper 4-
2008.
Schumpeter, J.A., 1934. The Theory of Economic Development. Harvard University Press, Cambridge,
Mass.
Schumpeter, J.A., 1942. Capitalism, Socialism and Democracy. Harper and Brothers, New York.
Solow, R.M., 1960. Investment and technical progress, in K.J. Arrow, S. Karlin, P. Suppes (Eds.),
Mathematical Methods in the Social Sciences. Stanford University Press, Stanford, 89-104.
Storey, D.J., Tether, B.S., 1998. New Technology-Based Firms in the European Union: an introduction.
Research Policy 26(9), 933-946.

25
Wallsten, S.J., 2000. The effects of government-industry R&D programs on private R&D: the case of the
Small Business Innovation Research Program. The RAND Journal of Economics 31(1), 82-100.
Winter, S.G., 1984. Schumpeterian competition in alternative technological regimes. Journal of Economic
Behavior and Organization 5(3), 287-320.

26
Table 1
The variables
Innovative input variables IRint Internal R&D expenditure in 2000, normalized by total turnover ERint External R&D expenditure in 2000, normalized by total turnover MACint Investments in innovative machinery and equipment in 2000,
normalized by total turnover TAint Technological acquisitions in 2000, normalized by total turnover Innovative output variables TURNIN Share of firm’s total sales due to sale of new products PROD Product innovation: dummy = 1 if TURNIN > 0 Firm’s general characteristics EXPint Export intensity ( (turnover from export) / turnover) IG Dummy = 1 if belonging to an industrial group Innovative-relevant information SUPPORT Dummy = 1 if the firm has received public support for innovation COOP Dummy = 1 if the firm takes part in cooperative innovative activities PATENT Dummy = 1 if the firm uses patents
PROT Dummy = 1 if the firm adopts other instruments of protection than patents
HURDLE Dummy = 1 if the firm has faced some kind of obstacle to innovation
OTHERIN Dummy = 1 if the firm has realized managerial, strategic or organizational innovation
Pavitt sectoral dummies SB Dummy = 1 if science-based firm SI Dummy = 1 if scale intensive firm SS Dummy = 1 if specialized supplier firm SD Dummy = 1 if supplier-dominated firm
27
Table 2 Descriptive statistics
OTHERIN (dummy) 0.841 0.365 0.886 0.318 0.838 0.369 0.884 0.320 0.874 0.333 0.899 0.302 Pavitt sectoral dummies SB (dummy) 0.116 0.320 0.134 0.341 0.113 0.316 0.130 0.337 0.140 0.347 0.167 0.373 SI (dummy) 0.284 0.451 0.250 0.433 0.282 0.450 0.248 0.432 0.300 0.459 0.267 0.444 SS (dummy) 0.280 0.449 0.314 0.464 0.282 0.450 0.318 0.466 0.266 0.443 0.285 0.452 SD (dummy) 0.320 0.466 0.301 0.459 0.323 0.468 0.304 0.460 0.293 0.456 0.281 0.450
ALL FIRMS MATURE FIRMS YOUNG FIRMS (YICs) 2,713 OBS 2,098 OBS 2,420 OBS 1,870 OBS 293 OBS 228 OBS MEAN SD MEAN SD MEAN SD MEAN SD MEAN SD MEAN SD
Innovative input variables IRint 0.013 0.026 0.015 0.028 0.013 0.025 0.015 0.027 0.014 0.032 0.017 0.036 ERint 0.002 0.009 0.002 0.010 0.002 0.008 0.002 0.009 0.002 0.011 0.003 0.013 MACint 0.035 0.078 0.028 0.067 0.034 0.076 0.027 0.063 0.042 0.091 0.038 0.093 TAint 0.002 0.018 0.002 0.015 0.002 0.017 0.002 0.013 0.004 0.023 0.004 0.025 Innovative output variables TURNIN 0.30 0.29 0.39 0.28 0.30 0.29 0.39 0.27 0.34 0.32 0.44 0.30 PROD (dummy) 0.773 0.419 1 0 0.773 0.419 1 0 0.778 0.416 1 0 Firm’s general characteristics EXPint 0.254 0.285 0.278 0.290 0.259 0.286 0.283 0.290 0.215 0.279 0.235 0.286 IG (dummy) 0.291 0.454 0.318 0.466 0.290 0.454 0.318 0.466 0.300 0.459 0.316 0.466 Innovative-relevant information SUPPORT (dummy) 0.533 0.499 0.539 0.499 0.533 0.499 0.536 0.499 0.536 0.499 0.566 0.497 COOP (dummy) 0.161 0.368 0.192 0.394 0.162 0.369 0.193 0.395 0.150 0.358 0.180 0.385 PATENT (dummy) 0.348 0.476 0.413 0.492 0.354 0.478 0.420 0.494 0.293 0.456 0.360 0.481 PROT (dummy) 0.679 0.467 0.756 0.430 0.683 0.465 0.758 0.428 0.642 0.480 0.737 0.441 HURDLE (dummy) 0.402 0.490 0.424 0.494 0.397 0.489 0.418 0.493 0.440 0.497 0.474 0.500
28
Table 3 Sectoral composition and average employment of the firms belonging to the two subsamples: YICs and Mature firms.
YOUNG MATURE
INDUSTRY N. offirms
% Av.
Emp
N. of firms
% Av.
Emp
Manufacture of food products and beverage 14 4.8 136 152 6.3 210
Manufacture of textiles 13 4.4 107 110 4.5 205
Manufacture of wearing apparel; dressing and dyeing of fur 6 2.0 47 43 1.8 131 Manufacture of leather and related products 7 2.4 73 58 2.4 83 Manufacture of wood and of products of wood and cork, exc. furniture
9 3.1 26 80 3.3 55
Manufacture of paper and paper products 8 2.7 65 72 3.0 89
Printing and reproduction of recorded media 10 3.4 34 124 5.1 97
Manufacture of coke and refined petroleum products 5 1.7 139 18 0.7 52 Manufacture of chemicals and chemical products 27 9.2 191 200 8.3 189
Manufacture of rubber and plastics products 15 5.1 62 151 6.2 128
Manufacture of other non-metallic mineral products 17 5.8 37 152 6.3 173
Manufacture of basic metals 18 6.1 133 94 3.9 335
Manufacture of fabricated metal products 26 8.9 79 194 8.0 115
Manufacture of machinery and mechanichal equipment 37 12.6 197 292 12.1 252
Manufacture of office machinery and computers 7 2.4 26 33 1.4 82
Manufacture of electrical equipment 13 4.4 96 154 6.4 174
Manufacture of radio, television and communication equipment 9 3.1 277 97 4.0 222
Manufacture of medical, precision and optical instruments 23 7.8 118 126 5.2 75
Manufacture of motor vehicles, trailers and semi-trailers 11 3.8 77 84 3.5 460
Manufacture of other transport equipment 8 2.7 73 49 2.0 646 Other manufacturing 8 2.7 53 124 5.1 91 Waste collection, treatment and disposal activities; materials recovery
2 0.7 15 13 0.5 17
PAVITT TAXONOMY
Science Based 41 14 165.29 273 11.28 296.52
Scale Intensive 88 30.03 95.02 683 28.22 192.74
Specialized Suppliers 78 26.62 131.13 683 28.22 179.43
Suppliers Dominated 86 29.35 87.30 781 32.27 136.77
SAMPLE 293 100 112.20 2,420 100 182.63
29
Table 4
The sample selection estimates
ALL FIRMS MATURE FIRMS YICs
PROD TURNIN PROD TURNIN PROD TURNIN
-0.19** 0.16*** -0.16* 0.2*** -0.25 0.12 Constant
(-2.13) (3.01) (-1.79) (3.60) (-0.83) (0.85) 15.17*** 1.29*** 15.23*** 1.28*** 14.42* 0.80
IRint (7.20) (4.62) (6.91) (4.29) (1.90) (1.16) 7.75 0.26 8.47 -0.01 2.59 1.36
ERint (1.24) (0.37) (1.25) (-0.02) (0.14) (0.79) -1.11*** 0.32*** -1.38*** 0.27** 0.19 0.68***
MACint (-3.23) (3.07) (-3.61) (2.32) (0.20) (3.03) -0.32 -0.35 -0.25 -0.69 -0.90 0.37
TAint (-0.20) (-0.87) (-0.15) (-1.47) (-0.21) (0.43) 0.10 0.03 0.11 0.015 0.04 0.17**
EXPint (0.89) (1.29) (0.93) (0.65) (0.11) (2.14) 0.01 0.02 -0.11
IG (0.19) (0.24) (-0.48) -0.09 -0.13** 0.38*
SUPPORT (-1.43) (-2.00) (1.88) 0.37*** 0.03* 0.38*** 0.03* 0.53 0.01
COOP (3.55) (1.86) (3.39) (1.65) (1.44) (0.25) 0.48*** 0.47*** 0.66**
PATENT (6.21) (5.85) (2.20) 0.46*** 0.05** 0.43*** 0.05** 0.72*** 0.06
PROT (6.95) (2.41) (6.12) (2.11) (3.50) (0.75) -0.01 -0.02 -0.022 -0.03** 0.08 0.02
HURDLE (-0.09) (-1.60) (-0.34) (-2.11) (0.39) (0.57) 0.42*** 0.07*** 0.45*** 0.06** 0.15 0.05
OTHERIN (5.47) (2.97) (5.54) (2.52) (0.58) (0.76) 0.18 0.08*** 0.13 0.06*** 0.56 0.20***
SB (1.46) (3.67) (1.03) (2.63) (1.38) (2.81) -0.08 -0.00 -0.08 0.00 -0.26 -0.01
SI (-1.20) (-0.06) (-1.13) (0.05) (-1.15) (-0.11) 0.35*** 0.07*** 0.37*** 0.07*** 0.20 0.07
SS (4.41) (4.05) (4.30) (3.53) (0.80) (1.18)
ρ 0.62 0.48 0.85 0.18*** 0.14** 0.27*
Mills λ (2.98) (2.19) (1.75)
N. of firms 2,713 2,098 2,420 1,870 293 228 Notes: - z-statistics in parentheses: * Significant at 10%; ** 5%; *** 1% .
30
APPENDIX
Table A1 Correlation matrix (overall sample: 2,713 firms)
PROD IRint ERint MACint TAint EXPint OTHERIN IG SUPPORT COOP PATENT PROT HURDLE
PROD 1.000 IRint 0.186 1.000 ERint 0.093 0.245 1.000 MACint -0.159 -0.069 -0.046 1.000 TAint -0.007 0.026 0.044 0.034 1.000 EXPint 0.160 0.050 0.041 -0.167 -0.037 1.000 OTHERIN 0.223 0.062 0.049 -0.093 0.027 0.163 1.000 IG 0.110 0.024 0.057 -0.115 -0.008 0.243 0.109 1.000 SUPPORT 0.021 0.178 0.061 0.060 0.003 0.055 0.031 0.000 1.000 COOP 0.156 0.173 0.168 -0.074 0.014 0.159 0.105 0.249 0.118 1.000 PATENT 0.253 0.096 0.102 -0.141 0.020 0.304 0.171 0.241 0.055 0.196 1.000 PROT 0.306 0.150 0.099 -0.134 -0.003 0.240 0.311 0.185 0.059 0.186 0.370 1.000 HURDLE 0.083 0.100 0.091 -0.018 0.036 0.048 0.139 0.000 0.002 0.093 0.116 0.152 1.000 SB 0.108 0.234 0.220 -0.054 0.001 0.048 0.059 0.050 0.019 0.127 0.135 0.140 0.051 SI -0.139 -0.077 -0.090 0.107 0.017 -0.149 -0.073 -0.015 0.008 -0.031 -0.121 -0.126 -0.058 SS 0.138 0.065 0.037 -0.094 -0.024 0.154 0.010 0.041 0.031 0.077 0.114 0.059 0.042 SD -0.073 -0.149 -0.100 0.024 0.006 -0.038 0.020 -0.059 -0.051 -0.130 -0.086 -0.031 -0.020

31
Table A2 The questionnaire
Innovative input variables Did your enterprise engage in the following innovation activities in 2000?:
IR: Intramural research & experimental development (R&D)
All creative work undertaken within your enterprise on a systematic basis in order to increase the stock of knowledge, and the use of this stock of knowledge to devise new applications, such as new and improved products (goods/ services) and processes (including software research)
ER: Acquisition of R&D (extramural R&D)
Same activities as above, but performed by other companies (including other enterprises within the group) or other public or private research organisations
MAC: Acquisition of machinery and equipment
Advanced machinery, computer hardware specifically purchased to implement new or significantly improved products (goods/services) and/or processes
TA: Acquisition of other external knowledge
Purchase of rights to use patents and non-patented inventions, licenses, know-how, trademarks, software and other types of knowledge from others for use in your enterprise’s innovations
Innovative output variable: TURNIN - Estimate how your turnover in 2000 was distributed between: - New or significantly improved products (goods or services) introduced during the period 1998-2000 - Unchanged or only marginally modified products (goods or services) during the period 1998–2000
Firm’s general characteristics
IG
▪ Is your enterprise part of an enterprise group?
Innovative-relevant information
SUPPORT
▪ Did your enterprise receive any public financial support for innovation activities during the period 1998-2000? (from: local or regional authorities; central government; the European Union) ▪ Has your enterprise received funding from the EU’s 4th (1994-98) or 5th (1998-2002) Framework Programmes for RTD?
COOP ▪ Did your enterprise have any co-operation arrangements on innovation activities with other enterprises or institutions during 1998-2000?
PATENT ▪ Did your enterprise, or enterprise group, have any valid patents at the end of 2000 protecting inventions or innovations developed by your enterprise?
PROT ▪ During the period 1998-2000, did your enterprise, or enterprise group, make use of any of these other methods to protect inventions or innovations developed in your enterprise? (such as registration of design patterns; trademarks; copyright; secrecy; complexity of design; lead-time advantage on competitors)
OTHERIN
▪ Did your enterprise during the period 1998-2000 undertake any of the following activities?: -Strategy (Implementation of new or significantly changed corporate Strategies) -Management (Implementation of advanced management techniques within your enterprise) -Organisation (Implementation of new or significantly changed organizational structures) -Marketing (Changing significantly your enterprise’s marketing concepts/strategies) -Aesthetic change (Significant changes in the aesthetic appearance or design or other subjective changes in at least one of your products)
HURDLE
▪ If your enterprise experienced any hampering factors during the period 1998-2000? Economics factors (excessive perceived economic risks; innovation costs too high; lack of appropriate sources of finance); internal factors (organisational rigidities within the enterprise; lack of qualified personnel; lack of information on technology; lack of information on markets); other factors (insufficient flexibility of regulations or standards; lack of customer responsiveness to new goods or services)

32
Table A3 The TOBIT estimates
ALL FIRMS MATURE FIRMS YICs
Dependent variable: TURNIN 0.01 0.02 -0.01
Constant (0.61) (0.87) (-0.15)
1.94*** 2.07*** 1.07 IRint
(7.12) (6.99) (1.48) 0.37 0.11 0.97
ERint (0.47) (0.12) (0.50) 0.01 -0.11 0.63**
MACint (0.06) (-1.12) (2.58) -0.34 -0.46 0.26
TAint (-0.84) (-1.00) (0.27) 0.05* 0.04 0.09
EXPINT (1.78) (1.54) (1.13) -0.03* -0.03* -0.02
IG (-1.76) (-1.82) (-0.37) -0.03** -0.04*** 0.02
SUPPORT (-2.44) (-2.74) (0.38)
0.06*** 0.06*** 0.04 COOP
(3.11) (3.14) (0.64) 0.03** 0.03* 0.09*
PATENT (2.11) (1.78) (1.72)
0.11*** 0.11*** 0.11** PROT
(6.74) (6.41) (2.17) -0.02 -0.03* 0.03
HURDLE (-1.29) (-1.72) (0.67)
0.13*** 0.13*** 0.08 OTHERINN
(6.03) (5.96) (1.15) 0.09*** 0.07*** 0.19***
SB (3.60) (2.66) (2.64) -0.01 -0.01 -0.03
SI (-0.71) (-0.65) (-0.44)
0.09*** 0.09*** 0.08 SS
(5.24) (4.94) (1.32) N. of firms 2,713 2,420 293 Censored 615 550 65 Uncensored 2,098 1,870 228 Notes t- statistics in parentheses: * Significant at 10%; ** 5%; *** 1%