pubs.ccmsi.uspubs.ccmsi.us/pubs/ESPR15-745.pdf · A. A. Toropov(*) E. Benfenati IRCCS, Istituto di...
15
1 23 Environmental Science and Pollution Research ISSN 0944-1344 Volume 22 Number 1 Environ Sci Pollut Res (2015) 22:745-757 DOI 10.1007/s11356-014-3566-4 Optimal nano-descriptors as translators of eclectic data into prediction of the cell membrane damage by means of nano metal-oxides Alla P. Toropova, Andrey A. Toropov, Emilio Benfenati, Rafi Korenstein, Danuta Leszczynska & Jerzy Leszczynski
Transcript of pubs.ccmsi.uspubs.ccmsi.us/pubs/ESPR15-745.pdf · A. A. Toropov(*) E. Benfenati IRCCS, Istituto di...
1 23
Environmental Science and PollutionResearch ISSN 0944-1344Volume 22Number 1 Environ Sci Pollut Res (2015) 22:745-757DOI 10.1007/s11356-014-3566-4
Optimal nano-descriptors as translatorsof eclectic data into prediction of the cellmembrane damage by means of nanometal-oxides
Alla P. Toropova, Andrey A. Toropov,Emilio Benfenati, Rafi Korenstein,Danuta Leszczynska & Jerzy Leszczynski

1 23
Your article is protected by copyright and
all rights are held exclusively by Springer-
Verlag Berlin Heidelberg. This e-offprint is
for personal use only and shall not be self-
archived in electronic repositories. If you wish
to self-archive your article, please use the
accepted manuscript version for posting on
your own website. You may further deposit
the accepted manuscript version in any
repository, provided it is only made publicly
available 12 months after official publication
or later and provided acknowledgement is
given to the original source of publication
and a link is inserted to the published article
on Springer's website. The link must be
accompanied by the following text: "The final
publication is available at link.springer.com”.
SHORT RESEARCH AND DISCUSSION ARTICLE
Optimal nano-descriptors as translators of eclectic datainto prediction of the cell membrane damage by meansof nano metal-oxides
Alla P. Toropova & Andrey A. Toropov & Emilio Benfenati &Rafi Korenstein & Danuta Leszczynska & Jerzy Leszczynski
Received: 6 June 2014 /Accepted: 3 September 2014 /Published online: 17 September 2014# Springer-Verlag Berlin Heidelberg 2014
Abstract Systematization of knowledge on nanomaterialshas become a necessity with the fast growth of applicationsof these species. Building up predictive models that describeproperties (both beneficial and hazardous) of nanomaterials isvital for computational sciences. Classic quantitative struc-ture– property/activity relationships (QSPR/QSAR) are notsuitable for investigating nanomaterials because of the com-plexity of their molecular architecture. However, some char-acteristics such as size, concentration, and exposure time caninfluence endpoints (beneficial or hazardous) related to nano-particles and they can therefore be involved in building amodel. Application of the optimal descriptors calculated withthe so-called correlation weights of various concentrations anddifferent exposure times are suggested in order to build up apredictivemodel for cell membrane damage caused by a series
of nano metal-oxides. The numerical data on correlationweights are calculated by the Monte Carlo method. The ob-tained results are in good agreement with the experimentaldata.
Keywords Nanometal-oxide . Cellular membrane damage .
MonteCarlomethod .Quasi-QSAR .Optimalnano-descriptor
Introduction
Nanomaterials are a large class of substances engineeredat the molecular level to achieve unique optical, me-chanical, electrical, and therapeutic properties (Patelet al. 2012). The innovative ability to make and controlnanoparticles of various sizes and shapes for differentindustrial applications makes possible to put hundredsof products involving these materials on supermarketshelves. The list of consumer goods developed in thenano-field is steadily growing. According to currentanalysis, approximately 1300 different products contain-ing nanomaterials were marketed in 2012. However, theunique characteristics of nanomaterials can lead (viabiological interactions) to unexpected hazardous effects(Leszczynski 2010; Rasulev et al. 2012; Toropov et al.2012; Puzyn et al. 2011).
For traditional substances such as organic (Furtulaand Gutman 2011; Hollas et al. 2005; Gutman et al.2005; Afantitis et al. 2011), inorganic (Toropova et al.2011a), and organometallic (Toropova et al. 2011b)compounds, quantitative structure–property/activity rela-tionships (QSPR/QSAR) provide an efficient and inex-pensive approach to estimate beneficial or hazardousendpoints. Such predictions are based on the compari-son of descriptor values calculated using the molecularstructure of known substances with some of the characteristics
Responsible editor: Michael Matthies
Electronic supplementary material The online version of this article(doi:10.1007/s11356-014-3566-4) contains supplementary material,which is available to authorized users.
A. P. Toropova :A. A. Toropov (*) : E. BenfenatiIRCCS, Istituto di Ricerche Farmacologiche Mario Negri, 20156ViaLa Masa 19, Milan, Italye-mail: [email protected]
R. KorensteinDepartment of Physiology and Pharmacology Faculty of Medicine,Tel Aviv University, 69978 Tel Aviv, Israel
D. LeszczynskaInterdisciplinary Nanotoxicity Center, Department of Civil andEnvironmental Engineering, Jackson State University, 1325 LynchSt, Jackson, MS 39217-0510, USA
J. LeszczynskiInterdisciplinary Nanotoxicity Center, Department of Chemistry andBiochemistry, Jackson State University, P.O. Box 17910, 1400 J. R.Lynch Street, Jackson, MS 39217, USA
Environ Sci Pollut Res (2015) 22:745–757DOI 10.1007/s11356-014-3566-4
Author's personal copy
of the substances that have not been studied. This task can beaddressed according to paradigm:
Endpoint ¼ F molecular fragments; molecular featuresð Þð1Þ
Since the molecular structure of nanomaterials does notprovide a convenient representation for developing descrip-tors of these species, an alternative approach is needed for thepredictive modeling of the related endpoints. In fact, the aimof the classic QSPR/QSAR analysis is definition of suchmolecular structure, which can be useful to solve certain task.The physicochemical conditions of acting of the substance arenot taking into account for the majority of the classic QSPR/QSAR analyses. In the case of nanomaterials, the molecularstructure is not a convenient basis for the prediction of theirbehavior, because, (i) the molecular structure of nanomaterialsinvolves the large number of atoms and (ii) as a rule, only asmall number of different nanomaterials is available for re-search because the synthesis of the large number of indeeddifferent nanomaterials is a very difficult experimental task.
Under such circumstances, there are two possibilities tobuild up model for endpoint related to nanomaterials: (1)QSPR/QSAR analysis of influence of various small molecules(Toropova et al. 2011d; Toropov et al. 2013) upon ananomaterial (e.g. fullerene, graphene, etc.); and (2) quasi-QSPR/QSAR where a model for endpoint related tonanomaterials is a mathematical function of all availableeclectic data such as conditions of synthesis, concentration,dose, time of exposure, etc. (Toropova and Toropov 2013).
For the quasi-QSPR/QSAR (Toropov and Toropova 2014),one should use another paradigm that can be expressed as thefollowing:
Endpoint ¼ F available eclectic informationð Þ ð2Þ
Optimal descriptors (Toropov and Toropova 2003) can beused to translate the eclectic information into a predictivemodel (i) for pharmaceutical tasks (Ibezim et al. 2012; GarroMartinez et al. 2011; García et al. 2011; Mullen et al. 2011;Veselinović et al. 2013a,b), (ii) for toxicity of organic com-pounds (Toropova et al. 2011a) and their mixtures (Toropovaet al. 2012), and (iii) for endpoints which are related tonanomaterials (Toropov et al. 2012; Toropova et al. 2011b).It is to be noted that paradigm (2) gives possibility to involvemolecular fragments and/or molecular features for building upa model.
The aim of the present study is to build up the quasi-QSARmodel for cell membrane damage caused by variousnano metal-oxides at various doses and with different
exposure times and to estimate the predictive potentialof this model.
Method
Data
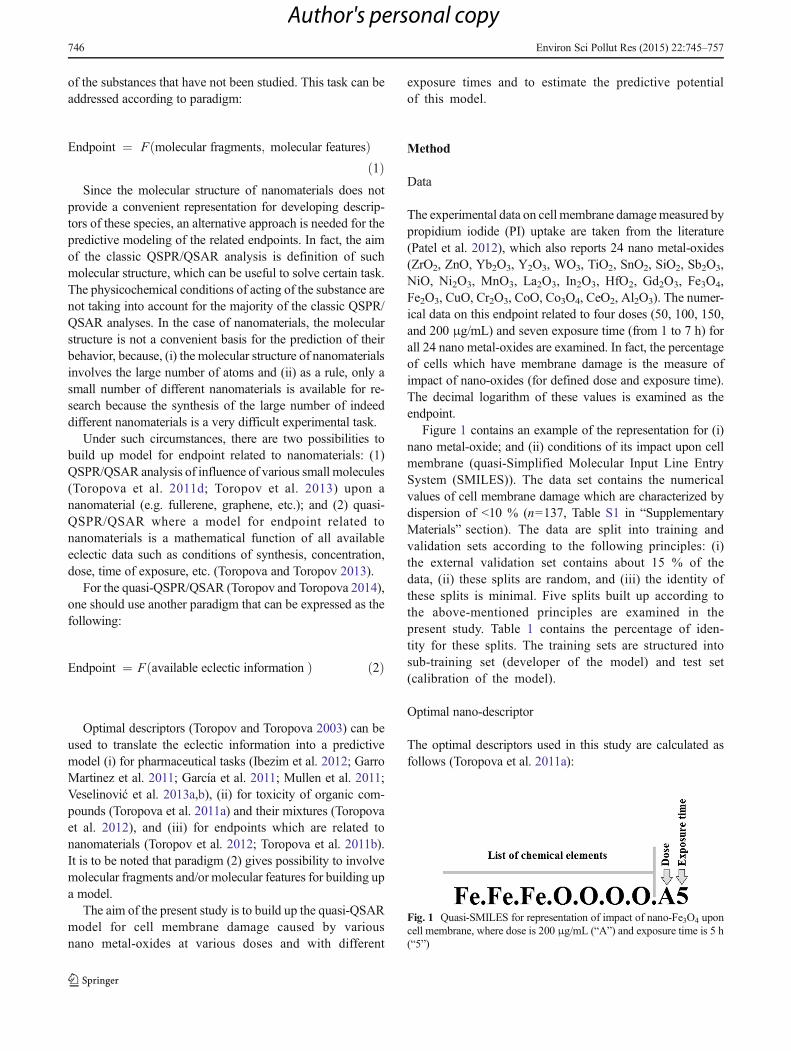
The experimental data on cell membrane damagemeasured bypropidium iodide (PI) uptake are taken from the literature(Patel et al. 2012), which also reports 24 nano metal-oxides(ZrO2, ZnO, Yb2O3, Y2O3, WO3, TiO2, SnO2, SiO2, Sb2O3,NiO, Ni2O3, MnO3, La2O3, In2O3, HfO2, Gd2O3, Fe3O4,Fe2O3, CuO, Cr2O3, CoO, Co3O4, CeO2, Al2O3). The numer-ical data on this endpoint related to four doses (50, 100, 150,and 200 μg/mL) and seven exposure time (from 1 to 7 h) forall 24 nano metal-oxides are examined. In fact, the percentageof cells which have membrane damage is the measure ofimpact of nano-oxides (for defined dose and exposure time).The decimal logarithm of these values is examined as theendpoint.
Figure 1 contains an example of the representation for (i)nano metal-oxide; and (ii) conditions of its impact upon cellmembrane (quasi-Simplified Molecular Input Line EntrySystem (SMILES)). The data set contains the numericalvalues of cell membrane damage which are characterized bydispersion of <10 % (n=137, Table S1 in “SupplementaryMaterials” section). The data are split into training andvalidation sets according to the following principles: (i)the external validation set contains about 15 % of thedata, (ii) these splits are random, and (iii) the identity ofthese splits is minimal. Five splits built up according tothe above-mentioned principles are examined in thepresent study. Table 1 contains the percentage of iden-tity for these splits. The training sets are structured intosub-training set (developer of the model) and test set(calibration of the model).
Optimal nano-descriptor
The optimal descriptors used in this study are calculated asfollows (Toropova et al. 2011a):
Fig. 1 Quasi-SMILES for representation of impact of nano-Fe3O4 uponcell membrane, where dose is 200 μg/mL (“A”) and exposure time is 5 h(“5”)
746 Environ Sci Pollut Res (2015) 22:745–757
Author's personal copy
DCW T ;NEpoch
� � ¼ ΣCW Ckð Þ ð3Þ
Where Ck are codes of eclectic data related to nano metal-oxides. In fact, the eclectic data represented by a sequence ofsymbols is similar to well-known SMILES (Weininger 1988,1990; Weininger et al. 1989). However, these sequences ofsymbols are representations of eclectic data (information oncomposition of chemical elements is a special case of theeclectic data); consequently, these are not the above-mentioned “classic” SMILES. In order to avoid ambiguity,the sequence of symbols used in this work is namedquasi-SMILES. The using of quasi-SMILES instead ofthe classic SMILES gives possibility to build up models(quasi-QSARs) by the CORAL software (http://www.insilico.eu/coral), aimed to QSPR/QSAR analyses ofvarious endpoints related to substances represented by theirclassic SMILES.
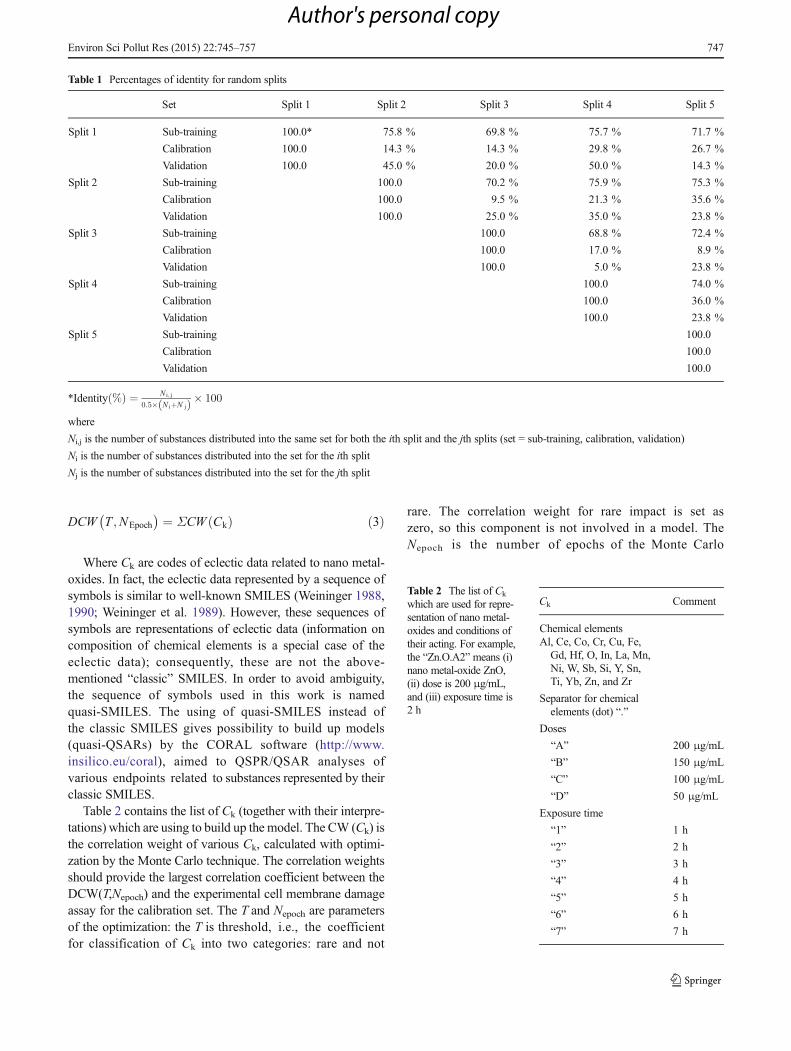
Table 2 contains the list of Ck (together with their interpre-tations) which are using to build up the model. The CW (Ck) isthe correlation weight of various Ck, calculated with optimi-zation by the Monte Carlo technique. The correlation weightsshould provide the largest correlation coefficient between theDCW(T,Nepoch) and the experimental cell membrane damageassay for the calibration set. The T and Nepoch are parametersof the optimization: the T is threshold, i.e., the coefficientfor classification of Ck into two categories: rare and not
rare. The correlation weight for rare impact is set aszero, so this component is not involved in a model. TheNepoch is the number of epochs of the Monte Carlo
Table 1 Percentages of identity for random splits
Set Split 1 Split 2 Split 3 Split 4 Split 5
Split 1 Sub-training 100.0* 75.8 % 69.8 % 75.7 % 71.7 %
Calibration 100.0 14.3 % 14.3 % 29.8 % 26.7 %
Validation 100.0 45.0 % 20.0 % 50.0 % 14.3 %
Split 2 Sub-training 100.0 70.2 % 75.9 % 75.3 %
Calibration 100.0 9.5 % 21.3 % 35.6 %
Validation 100.0 25.0 % 35.0 % 23.8 %
Split 3 Sub-training 100.0 68.8 % 72.4 %
Calibration 100.0 17.0 % 8.9 %
Validation 100.0 5.0 % 23.8 %
Split 4 Sub-training 100.0 74.0 %
Calibration 100.0 36.0 %
Validation 100.0 23.8 %
Split 5 Sub-training 100.0
Calibration 100.0
Validation 100.0
*Identity %ð Þ ¼ N i; j
0:5� N iþN jð Þ � 100
where
Ni,j is the number of substances distributed into the same set for both the ith split and the jth splits (set = sub-training, calibration, validation)
Ni is the number of substances distributed into the set for the ith split
Nj is the number of substances distributed into the set for the jth split
Table 2 The list of Ck
which are used for repre-sentation of nano metal-oxides and conditions oftheir acting. For example,the “Zn.O.A2” means (i)nano metal-oxide ZnO,(ii) dose is 200 μg/mL,and (iii) exposure time is2 h
Ck Comment
Chemical elementsAl, Ce, Co, Cr, Cu, Fe,Gd, Hf, O, In, La, Mn,Ni, W, Sb, Si, Y, Sn,Ti, Yb, Zn, and Zr
Separator for chemicalelements (dot) “.”
Doses
“A” 200 μg/mL
“B” 150 μg/mL
“C” 100 μg/mL
“D” 50 μg/mL
Exposure time
“1” 1 h
“2” 2 h
“3” 3 h
“4” 4 h
“5” 5 h
“6” 6 h
“7” 7 h
Environ Sci Pollut Res (2015) 22:745–757 747
Author's personal copy
optimization that gives the preferable statistical qualityfor the calibration set.
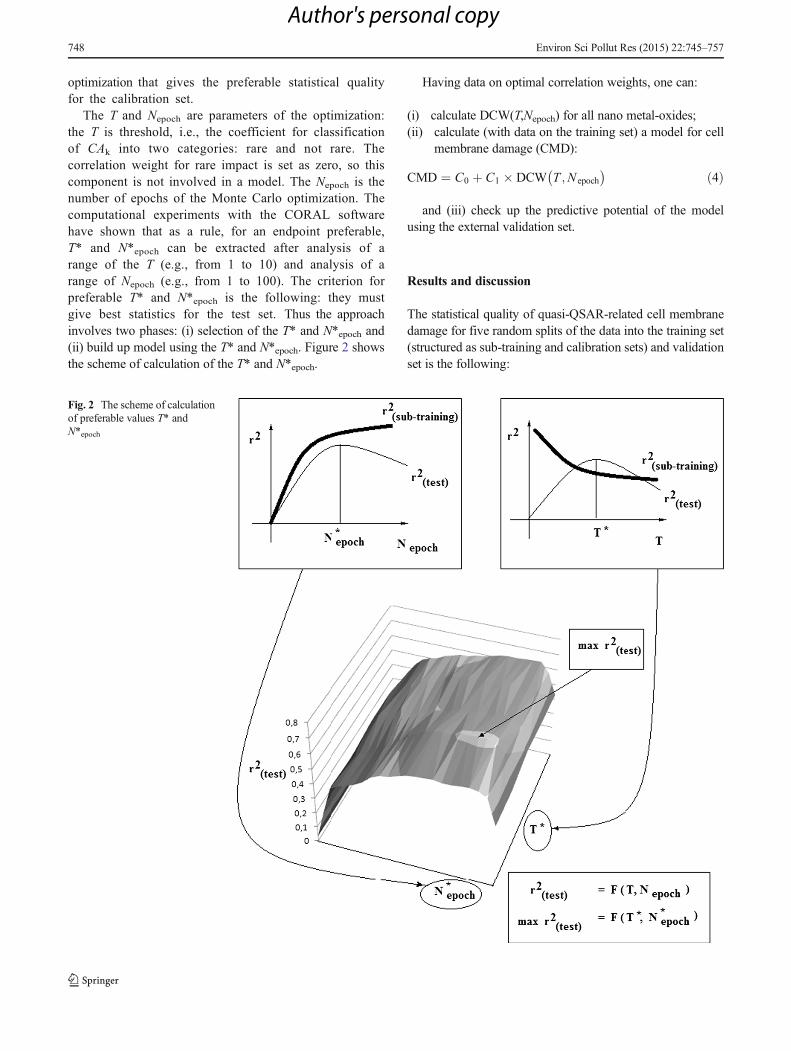
The T and Nepoch are parameters of the optimization:the T is threshold, i.e., the coefficient for classificationof CAk into two categories: rare and not rare. Thecorrelation weight for rare impact is set as zero, so thiscomponent is not involved in a model. The Nepoch is thenumber of epochs of the Monte Carlo optimization. Thecomputational experiments with the CORAL softwarehave shown that as a rule, for an endpoint preferable,T* and N*epoch can be extracted after analysis of arange of the T (e.g., from 1 to 10) and analysis of arange of Nepoch (e.g., from 1 to 100). The criterion forpreferable T* and N*epoch is the following: they mustgive best statistics for the test set. Thus the approachinvolves two phases: (i) selection of the T* and N*epoch and(ii) build up model using the T* and N*epoch. Figure 2 showsthe scheme of calculation of the T* and N*epoch.
Having data on optimal correlation weights, one can:
(i) calculate DCW(T,Nepoch) for all nano metal-oxides;(ii) calculate (with data on the training set) a model for cell
membrane damage (CMD):
CMD ¼ C0 þ C1 � DCW T ;N epoch
� � ð4Þ
and (iii) check up the predictive potential of the modelusing the external validation set.
Results and discussion
The statistical quality of quasi-QSAR-related cell membranedamage for five random splits of the data into the training set(structured as sub-training and calibration sets) and validationset is the following:
Fig. 2 The scheme of calculationof preferable values T* andN*epoch
748 Environ Sci Pollut Res (2015) 22:745–757
Author's personal copy
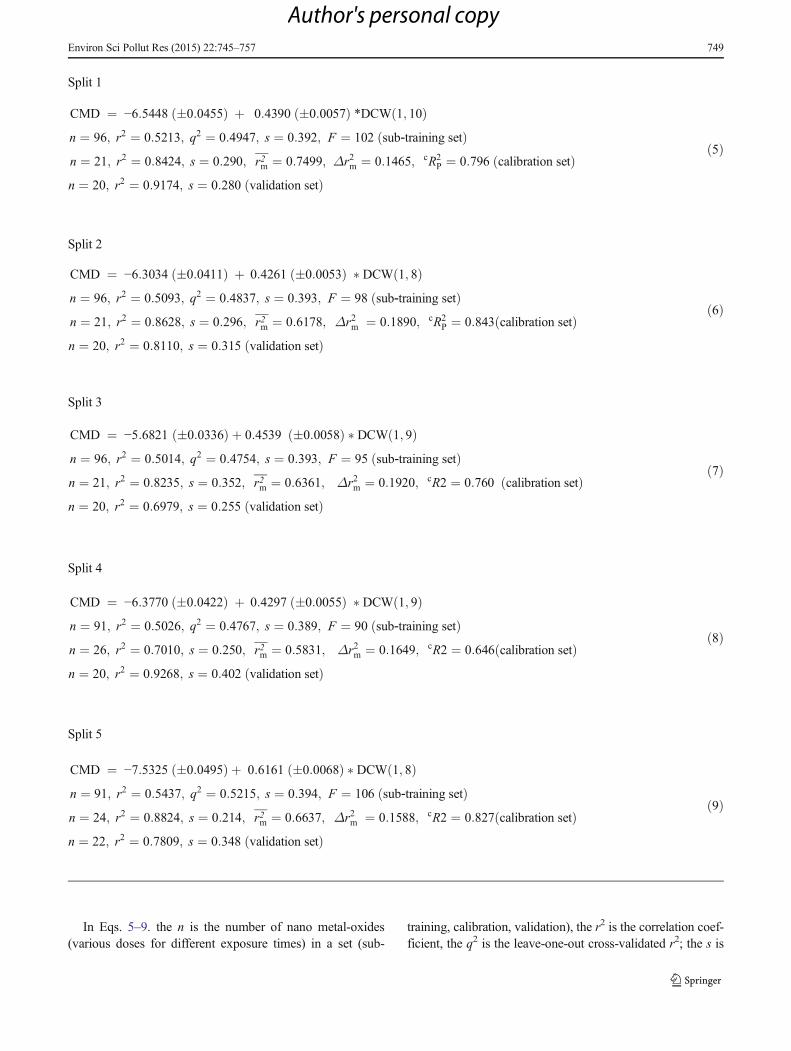
Split 1
CMD ¼ −6:5448 �0:0455ð Þ þ 0:4390 �0:0057ð Þ *DCW 1; 10ð Þn ¼ 96; r2 ¼ 0:5213; q2 ¼ 0:4947; s ¼ 0:392; F ¼ 102 sub‐training setð Þn ¼ 21; r2 ¼ 0:8424; s ¼ 0:290; r2m ¼ 0:7499; Δr2m ¼ 0:1465; cR2
P ¼ 0:796 calibration setð Þn ¼ 20; r2 ¼ 0:9174; s ¼ 0:280 validation setð Þ
ð5Þ
Split 2
CMD ¼ −6:3034 �0:0411ð Þ þ 0:4261 �0:0053ð Þ � DCW 1; 8ð Þn ¼ 96; r2 ¼ 0:5093; q2 ¼ 0:4837; s ¼ 0:393; F ¼ 98 sub‐training setð Þn ¼ 21; r2 ¼ 0:8628; s ¼ 0:296; r2m ¼ 0:6178; Δr2m ¼ 0:1890; cR2
P ¼ 0:843 calibration setð Þn ¼ 20; r2 ¼ 0:8110; s ¼ 0:315 validation setð Þ
ð6Þ
Split 3
CMD ¼ −5:6821 �0:0336ð Þ þ 0:4539 �0:0058ð Þ � DCW 1; 9ð Þn ¼ 96; r2 ¼ 0:5014; q2 ¼ 0:4754; s ¼ 0:393; F ¼ 95 sub‐training setð Þn ¼ 21; r2 ¼ 0:8235; s ¼ 0:352; r2m ¼ 0:6361; Δr2m ¼ 0:1920; cR2 ¼ 0:760 calibration setð Þn ¼ 20; r2 ¼ 0:6979; s ¼ 0:255 validation setð Þ
ð7Þ
Split 4
CMD ¼ −6:3770 �0:0422ð Þ þ 0:4297 �0:0055ð Þ � DCW 1; 9ð Þn ¼ 91; r2 ¼ 0:5026; q2 ¼ 0:4767; s ¼ 0:389; F ¼ 90 sub‐training setð Þn ¼ 26; r2 ¼ 0:7010; s ¼ 0:250; r2m ¼ 0:5831; Δr2m ¼ 0:1649; cR2 ¼ 0:646 calibration setð Þn ¼ 20; r2 ¼ 0:9268; s ¼ 0:402 validation setð Þ
ð8Þ
Split 5
CMD ¼ −7:5325 �0:0495ð Þ þ 0:6161 �0:0068ð Þ � DCW 1; 8ð Þn ¼ 91; r2 ¼ 0:5437; q2 ¼ 0:5215; s ¼ 0:394; F ¼ 106 sub‐training setð Þn ¼ 24; r2 ¼ 0:8824; s ¼ 0:214; r2m ¼ 0:6637; Δr2m ¼ 0:1588; cR2 ¼ 0:827 calibration setð Þn ¼ 22; r2 ¼ 0:7809; s ¼ 0:348 validation setð Þ
ð9Þ
In Eqs. 5–9. the n is the number of nano metal-oxides(various doses for different exposure times) in a set (sub-
training, calibration, validation), the r2 is the correlation coef-ficient, the q2 is the leave-one-out cross-validated r2; the s is
Environ Sci Pollut Res (2015) 22:745–757 749
Author's personal copy
the root-mean-square error; the r2m and Δrm2 are measures of
predictability (Roy et al. 2012a,b)
r2m x; yð Þ ¼ r2 � 1−ffiffiffiffiffiffiffiffiffiffiffiffiffiffir2−r20�� ��q� �
r2m ¼ r2m x; yð Þ þ r2m y; xð Þ2
Δr2m ¼ r2m x; yð Þ−r2m y; xð Þ
where x and y are vectors of predicted and experimentalendpoint values, respectively; r0
2 is the correlation coefficientbetween experimental and predicted values calculated withoutintercept.
The parameter cRp2 (Ojha and Roy 2011) ensures that the
models developed are not obtained by chance (Y-randomiza-tion test). For an acceptable QSAR model, the value of cRp
2
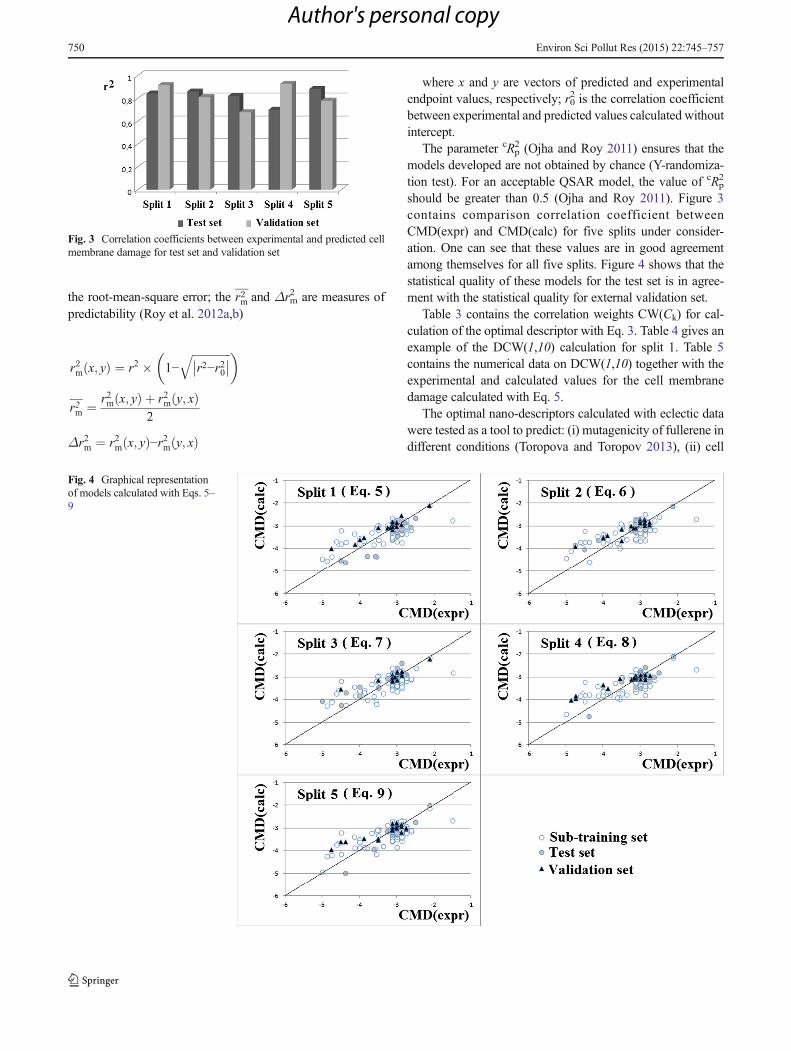
should be greater than 0.5 (Ojha and Roy 2011). Figure 3contains comparison correlation coefficient betweenCMD(expr) and CMD(calc) for five splits under consider-ation. One can see that these values are in good agreementamong themselves for all five splits. Figure 4 shows that thestatistical quality of these models for the test set is in agree-ment with the statistical quality for external validation set.
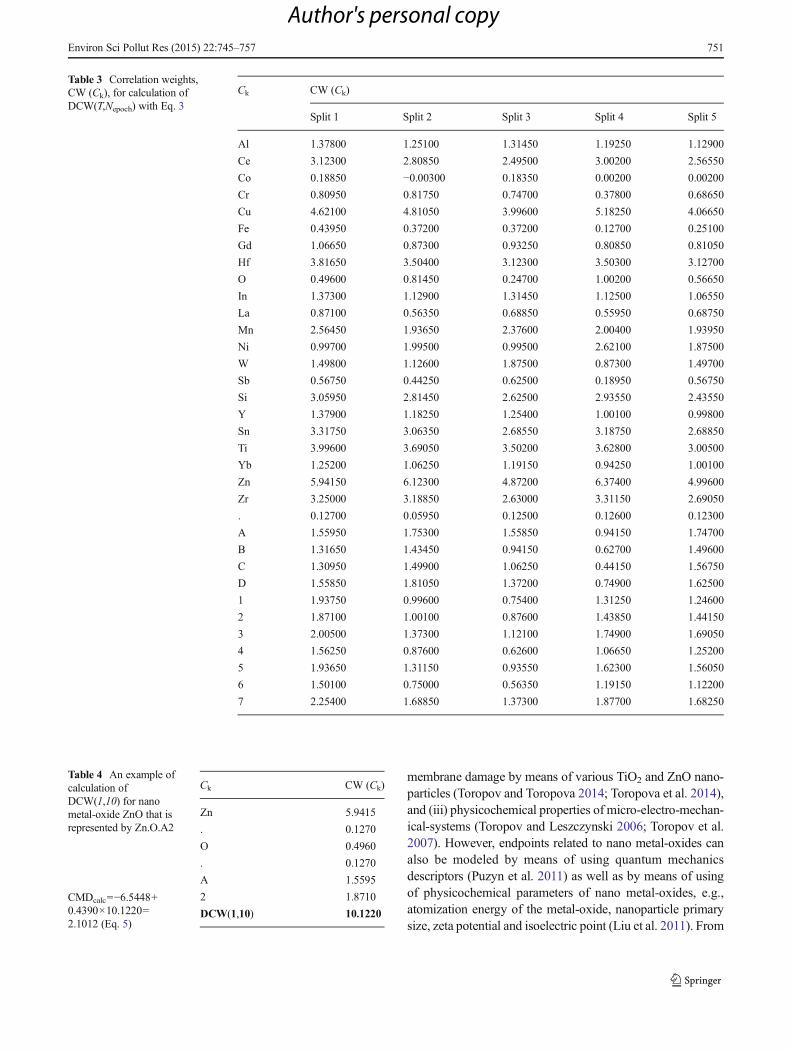
Table 3 contains the correlation weights CW(Ck) for cal-culation of the optimal descriptor with Eq. 3. Table 4 gives anexample of the DCW(1,10) calculation for split 1. Table 5contains the numerical data on DCW(1,10) together with theexperimental and calculated values for the cell membranedamage calculated with Eq. 5.
The optimal nano-descriptors calculated with eclectic datawere tested as a tool to predict: (i) mutagenicity of fullerene indifferent conditions (Toropova and Toropov 2013), (ii) cell
Fig. 3 Correlation coefficients between experimental and predicted cellmembrane damage for test set and validation set
Fig. 4 Graphical representationof models calculated with Eqs. 5–9
750 Environ Sci Pollut Res (2015) 22:745–757
Author's personal copy
membrane damage by means of various TiO2 and ZnO nano-particles (Toropov and Toropova 2014; Toropova et al. 2014),and (iii) physicochemical properties of micro-electro-mechan-ical-systems (Toropov and Leszczynski 2006; Toropov et al.2007). However, endpoints related to nano metal-oxides canalso be modeled by means of using quantum mechanicsdescriptors (Puzyn et al. 2011) as well as by means of usingof physicochemical parameters of nano metal-oxides, e.g.,atomization energy of the metal-oxide, nanoparticle primarysize, zeta potential and isoelectric point (Liu et al. 2011). From
Table 3 Correlation weights,CW (Ck), for calculation ofDCW(T,Nepoch) with Eq. 3
Ck CW (Ck)
Split 1 Split 2 Split 3 Split 4 Split 5
Al 1.37800 1.25100 1.31450 1.19250 1.12900
Ce 3.12300 2.80850 2.49500 3.00200 2.56550
Co 0.18850 −0.00300 0.18350 0.00200 0.00200
Cr 0.80950 0.81750 0.74700 0.37800 0.68650
Cu 4.62100 4.81050 3.99600 5.18250 4.06650
Fe 0.43950 0.37200 0.37200 0.12700 0.25100
Gd 1.06650 0.87300 0.93250 0.80850 0.81050
Hf 3.81650 3.50400 3.12300 3.50300 3.12700
O 0.49600 0.81450 0.24700 1.00200 0.56650
In 1.37300 1.12900 1.31450 1.12500 1.06550
La 0.87100 0.56350 0.68850 0.55950 0.68750
Mn 2.56450 1.93650 2.37600 2.00400 1.93950
Ni 0.99700 1.99500 0.99500 2.62100 1.87500
W 1.49800 1.12600 1.87500 0.87300 1.49700
Sb 0.56750 0.44250 0.62500 0.18950 0.56750
Si 3.05950 2.81450 2.62500 2.93550 2.43550
Y 1.37900 1.18250 1.25400 1.00100 0.99800
Sn 3.31750 3.06350 2.68550 3.18750 2.68850
Ti 3.99600 3.69050 3.50200 3.62800 3.00500
Yb 1.25200 1.06250 1.19150 0.94250 1.00100
Zn 5.94150 6.12300 4.87200 6.37400 4.99600
Zr 3.25000 3.18850 2.63000 3.31150 2.69050
. 0.12700 0.05950 0.12500 0.12600 0.12300
A 1.55950 1.75300 1.55850 0.94150 1.74700
B 1.31650 1.43450 0.94150 0.62700 1.49600
C 1.30950 1.49900 1.06250 0.44150 1.56750
D 1.55850 1.81050 1.37200 0.74900 1.62500
1 1.93750 0.99600 0.75400 1.31250 1.24600
2 1.87100 1.00100 0.87600 1.43850 1.44150
3 2.00500 1.37300 1.12100 1.74900 1.69050
4 1.56250 0.87600 0.62600 1.06650 1.25200
5 1.93650 1.31150 0.93550 1.62300 1.56050
6 1.50100 0.75000 0.56350 1.19150 1.12200
7 2.25400 1.68850 1.37300 1.87700 1.68250
Table 4 An example ofcalculation ofDCW(1,10) for nanometal-oxide ZnO that isrepresented by Zn.O.A2
CMDcalc=−6.5448+0.4390×10.1220=2.1012 (Eq. 5)
Ck CW (Ck)
Zn 5.9415
. 0.1270
O 0.4960
. 0.1270
A 1.5595
2 1.8710
DCW(1,10) 10.1220
Environ Sci Pollut Res (2015) 22:745–757 751
Author's personal copy
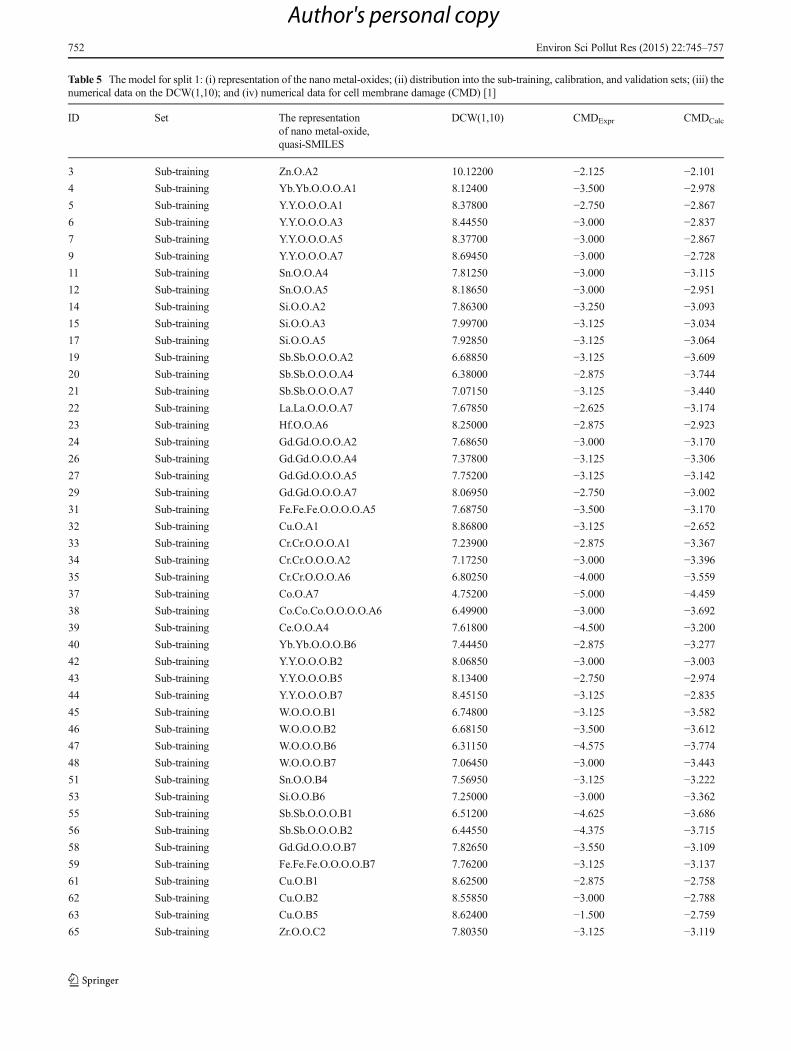
Table 5 The model for split 1: (i) representation of the nano metal-oxides; (ii) distribution into the sub-training, calibration, and validation sets; (iii) thenumerical data on the DCW(1,10); and (iv) numerical data for cell membrane damage (CMD) [1]
ID Set The representationof nano metal-oxide,quasi-SMILES
DCW(1,10) CMDExpr CMDCalc
3 Sub-training Zn.O.A2 10.12200 −2.125 −2.1014 Sub-training Yb.Yb.O.O.O.A1 8.12400 −3.500 −2.9785 Sub-training Y.Y.O.O.O.A1 8.37800 −2.750 −2.8676 Sub-training Y.Y.O.O.O.A3 8.44550 −3.000 −2.8377 Sub-training Y.Y.O.O.O.A5 8.37700 −3.000 −2.8679 Sub-training Y.Y.O.O.O.A7 8.69450 −3.000 −2.72811 Sub-training Sn.O.O.A4 7.81250 −3.000 −3.11512 Sub-training Sn.O.O.A5 8.18650 −3.000 −2.95114 Sub-training Si.O.O.A2 7.86300 −3.250 −3.09315 Sub-training Si.O.O.A3 7.99700 −3.125 −3.03417 Sub-training Si.O.O.A5 7.92850 −3.125 −3.06419 Sub-training Sb.Sb.O.O.O.A2 6.68850 −3.125 −3.60920 Sub-training Sb.Sb.O.O.O.A4 6.38000 −2.875 −3.74421 Sub-training Sb.Sb.O.O.O.A7 7.07150 −3.125 −3.44022 Sub-training La.La.O.O.O.A7 7.67850 −2.625 −3.17423 Sub-training Hf.O.O.A6 8.25000 −2.875 −2.92324 Sub-training Gd.Gd.O.O.O.A2 7.68650 −3.000 −3.17026 Sub-training Gd.Gd.O.O.O.A4 7.37800 −3.125 −3.30627 Sub-training Gd.Gd.O.O.O.A5 7.75200 −3.125 −3.14229 Sub-training Gd.Gd.O.O.O.A7 8.06950 −2.750 −3.00231 Sub-training Fe.Fe.Fe.O.O.O.O.A5 7.68750 −3.500 −3.17032 Sub-training Cu.O.A1 8.86800 −3.125 −2.65233 Sub-training Cr.Cr.O.O.O.A1 7.23900 −2.875 −3.36734 Sub-training Cr.Cr.O.O.O.A2 7.17250 −3.000 −3.39635 Sub-training Cr.Cr.O.O.O.A6 6.80250 −4.000 −3.55937 Sub-training Co.O.A7 4.75200 −5.000 −4.45938 Sub-training Co.Co.Co.O.O.O.O.A6 6.49900 −3.000 −3.69239 Sub-training Ce.O.O.A4 7.61800 −4.500 −3.20040 Sub-training Yb.Yb.O.O.O.B6 7.44450 −2.875 −3.27742 Sub-training Y.Y.O.O.O.B2 8.06850 −3.000 −3.00343 Sub-training Y.Y.O.O.O.B5 8.13400 −2.750 −2.97444 Sub-training Y.Y.O.O.O.B7 8.45150 −3.125 −2.83545 Sub-training W.O.O.O.B1 6.74800 −3.125 −3.58246 Sub-training W.O.O.O.B2 6.68150 −3.500 −3.61247 Sub-training W.O.O.O.B6 6.31150 −4.575 −3.77448 Sub-training W.O.O.O.B7 7.06450 −3.000 −3.44351 Sub-training Sn.O.O.B4 7.56950 −3.125 −3.22253 Sub-training Si.O.O.B6 7.25000 −3.000 −3.36255 Sub-training Sb.Sb.O.O.O.B1 6.51200 −4.625 −3.68656 Sub-training Sb.Sb.O.O.O.B2 6.44550 −4.375 −3.71558 Sub-training Gd.Gd.O.O.O.B7 7.82650 −3.550 −3.10959 Sub-training Fe.Fe.Fe.O.O.O.O.B7 7.76200 −3.125 −3.13761 Sub-training Cu.O.B1 8.62500 −2.875 −2.75862 Sub-training Cu.O.B2 8.55850 −3.000 −2.78863 Sub-training Cu.O.B5 8.62400 −1.500 −2.75965 Sub-training Zr.O.O.C2 7.80350 −3.125 −3.119
752 Environ Sci Pollut Res (2015) 22:745–757
Author's personal copy
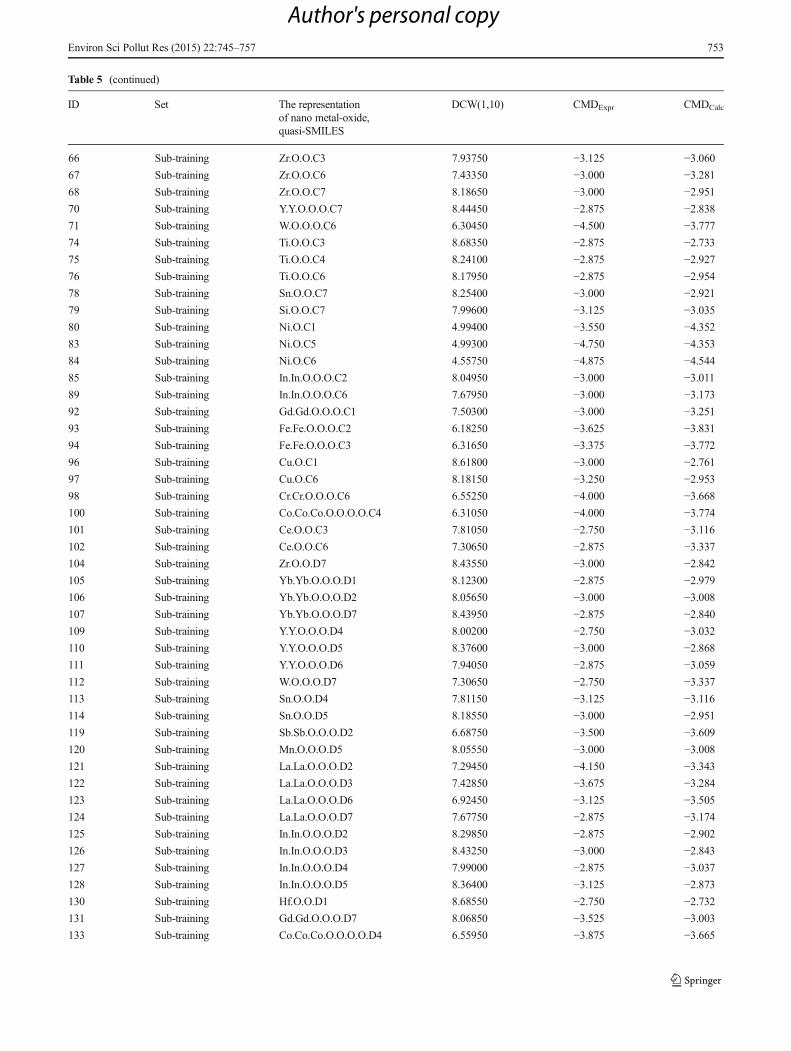
Table 5 (continued)
ID Set The representationof nano metal-oxide,quasi-SMILES
DCW(1,10) CMDExpr CMDCalc
66 Sub-training Zr.O.O.C3 7.93750 −3.125 −3.06067 Sub-training Zr.O.O.C6 7.43350 −3.000 −3.28168 Sub-training Zr.O.O.C7 8.18650 −3.000 −2.95170 Sub-training Y.Y.O.O.O.C7 8.44450 −2.875 −2.83871 Sub-training W.O.O.O.C6 6.30450 −4.500 −3.77774 Sub-training Ti.O.O.C3 8.68350 −2.875 −2.73375 Sub-training Ti.O.O.C4 8.24100 −2.875 −2.92776 Sub-training Ti.O.O.C6 8.17950 −2.875 −2.95478 Sub-training Sn.O.O.C7 8.25400 −3.000 −2.92179 Sub-training Si.O.O.C7 7.99600 −3.125 −3.03580 Sub-training Ni.O.C1 4.99400 −3.550 −4.35283 Sub-training Ni.O.C5 4.99300 −4.750 −4.35384 Sub-training Ni.O.C6 4.55750 −4.875 −4.54485 Sub-training In.In.O.O.O.C2 8.04950 −3.000 −3.01189 Sub-training In.In.O.O.O.C6 7.67950 −3.000 −3.17392 Sub-training Gd.Gd.O.O.O.C1 7.50300 −3.000 −3.25193 Sub-training Fe.Fe.O.O.O.C2 6.18250 −3.625 −3.83194 Sub-training Fe.Fe.O.O.O.C3 6.31650 −3.375 −3.77296 Sub-training Cu.O.C1 8.61800 −3.000 −2.76197 Sub-training Cu.O.C6 8.18150 −3.250 −2.95398 Sub-training Cr.Cr.O.O.O.C6 6.55250 −4.000 −3.668100 Sub-training Co.Co.Co.O.O.O.O.C4 6.31050 −4.000 −3.774101 Sub-training Ce.O.O.C3 7.81050 −2.750 −3.116102 Sub-training Ce.O.O.C6 7.30650 −2.875 −3.337104 Sub-training Zr.O.O.D7 8.43550 −3.000 −2.842105 Sub-training Yb.Yb.O.O.O.D1 8.12300 −2.875 −2.979106 Sub-training Yb.Yb.O.O.O.D2 8.05650 −3.000 −3.008107 Sub-training Yb.Yb.O.O.O.D7 8.43950 −2.875 −2.840109 Sub-training Y.Y.O.O.O.D4 8.00200 −2.750 −3.032110 Sub-training Y.Y.O.O.O.D5 8.37600 −3.000 −2.868111 Sub-training Y.Y.O.O.O.D6 7.94050 −2.875 −3.059112 Sub-training W.O.O.O.D7 7.30650 −2.750 −3.337113 Sub-training Sn.O.O.D4 7.81150 −3.125 −3.116114 Sub-training Sn.O.O.D5 8.18550 −3.000 −2.951119 Sub-training Sb.Sb.O.O.O.D2 6.68750 −3.500 −3.609120 Sub-training Mn.O.O.O.D5 8.05550 −3.000 −3.008121 Sub-training La.La.O.O.O.D2 7.29450 −4.150 −3.343122 Sub-training La.La.O.O.O.D3 7.42850 −3.675 −3.284123 Sub-training La.La.O.O.O.D6 6.92450 −3.125 −3.505124 Sub-training La.La.O.O.O.D7 7.67750 −2.875 −3.174125 Sub-training In.In.O.O.O.D2 8.29850 −2.875 −2.902126 Sub-training In.In.O.O.O.D3 8.43250 −3.000 −2.843127 Sub-training In.In.O.O.O.D4 7.99000 −2.875 −3.037128 Sub-training In.In.O.O.O.D5 8.36400 −3.125 −2.873130 Sub-training Hf.O.O.D1 8.68550 −2.750 −2.732131 Sub-training Gd.Gd.O.O.O.D7 8.06850 −3.525 −3.003133 Sub-training Co.Co.Co.O.O.O.O.D4 6.55950 −3.875 −3.665
Environ Sci Pollut Res (2015) 22:745–757 753
Author's personal copy
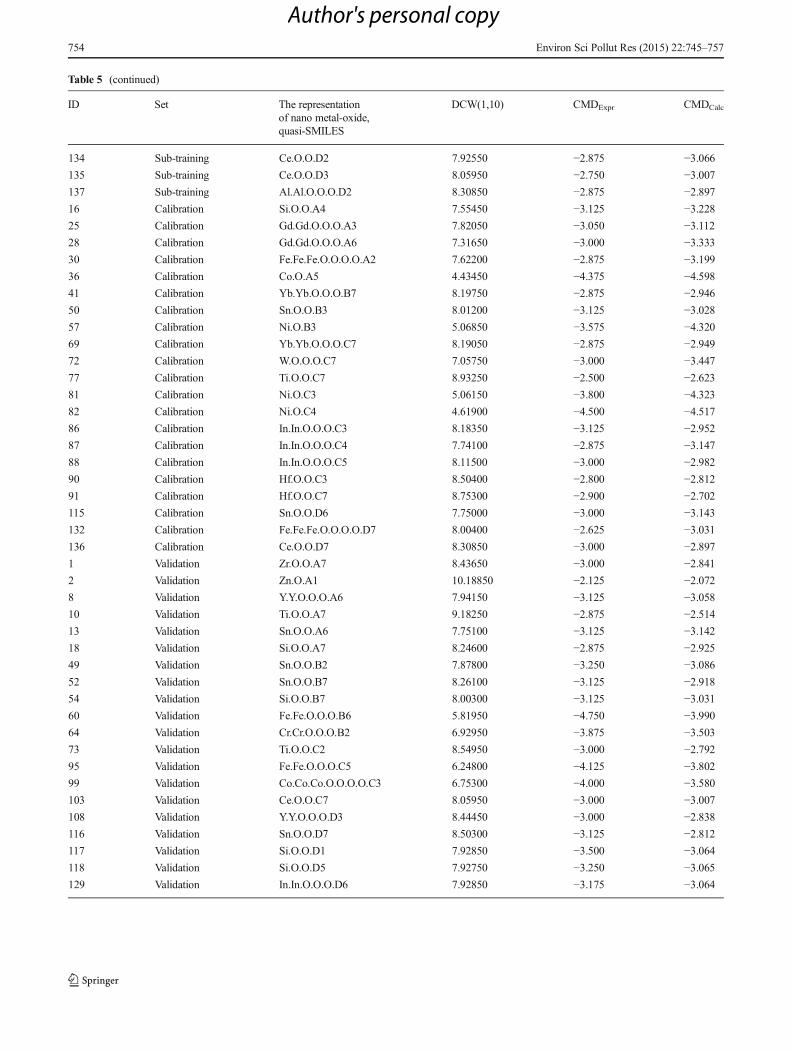
Table 5 (continued)
ID Set The representationof nano metal-oxide,quasi-SMILES
DCW(1,10) CMDExpr CMDCalc
134 Sub-training Ce.O.O.D2 7.92550 −2.875 −3.066135 Sub-training Ce.O.O.D3 8.05950 −2.750 −3.007137 Sub-training Al.Al.O.O.O.D2 8.30850 −2.875 −2.89716 Calibration Si.O.O.A4 7.55450 −3.125 −3.22825 Calibration Gd.Gd.O.O.O.A3 7.82050 −3.050 −3.11228 Calibration Gd.Gd.O.O.O.A6 7.31650 −3.000 −3.33330 Calibration Fe.Fe.Fe.O.O.O.O.A2 7.62200 −2.875 −3.19936 Calibration Co.O.A5 4.43450 −4.375 −4.59841 Calibration Yb.Yb.O.O.O.B7 8.19750 −2.875 −2.94650 Calibration Sn.O.O.B3 8.01200 −3.125 −3.02857 Calibration Ni.O.B3 5.06850 −3.575 −4.32069 Calibration Yb.Yb.O.O.O.C7 8.19050 −2.875 −2.94972 Calibration W.O.O.O.C7 7.05750 −3.000 −3.44777 Calibration Ti.O.O.C7 8.93250 −2.500 −2.62381 Calibration Ni.O.C3 5.06150 −3.800 −4.32382 Calibration Ni.O.C4 4.61900 −4.500 −4.51786 Calibration In.In.O.O.O.C3 8.18350 −3.125 −2.95287 Calibration In.In.O.O.O.C4 7.74100 −2.875 −3.14788 Calibration In.In.O.O.O.C5 8.11500 −3.000 −2.98290 Calibration Hf.O.O.C3 8.50400 −2.800 −2.81291 Calibration Hf.O.O.C7 8.75300 −2.900 −2.702115 Calibration Sn.O.O.D6 7.75000 −3.000 −3.143132 Calibration Fe.Fe.Fe.O.O.O.O.D7 8.00400 −2.625 −3.031136 Calibration Ce.O.O.D7 8.30850 −3.000 −2.8971 Validation Zr.O.O.A7 8.43650 −3.000 −2.8412 Validation Zn.O.A1 10.18850 −2.125 −2.0728 Validation Y.Y.O.O.O.A6 7.94150 −3.125 −3.05810 Validation Ti.O.O.A7 9.18250 −2.875 −2.51413 Validation Sn.O.O.A6 7.75100 −3.125 −3.14218 Validation Si.O.O.A7 8.24600 −2.875 −2.92549 Validation Sn.O.O.B2 7.87800 −3.250 −3.08652 Validation Sn.O.O.B7 8.26100 −3.125 −2.91854 Validation Si.O.O.B7 8.00300 −3.125 −3.03160 Validation Fe.Fe.O.O.O.B6 5.81950 −4.750 −3.99064 Validation Cr.Cr.O.O.O.B2 6.92950 −3.875 −3.50373 Validation Ti.O.O.C2 8.54950 −3.000 −2.79295 Validation Fe.Fe.O.O.O.C5 6.24800 −4.125 −3.80299 Validation Co.Co.Co.O.O.O.O.C3 6.75300 −4.000 −3.580103 Validation Ce.O.O.C7 8.05950 −3.000 −3.007108 Validation Y.Y.O.O.O.D3 8.44450 −3.000 −2.838116 Validation Sn.O.O.D7 8.50300 −3.125 −2.812117 Validation Si.O.O.D1 7.92850 −3.500 −3.064118 Validation Si.O.O.D5 7.92750 −3.250 −3.065129 Validation In.In.O.O.O.D6 7.92850 −3.175 −3.064
754 Environ Sci Pollut Res (2015) 22:745–757
Author's personal copy
the heuristic point of view, three above-mentioned approachesare equivalent, but from the point of view of the practicalapplications, the optimal descriptor calculated with eclecticdata seems to be a more attractive tool for building up amodel.
The applicability domain for an approach can be definedaccording to probabilistic criteria. In the case of models cal-culated with Eqs. 5–9, one should use for nano metal-oxideswhich are containing only prevalent (in the “visible” trainingset) codes of various model components (chemical elements,dose and exposure time), associated with cell membrane dam-age. There are seven nano metal-oxides which give consider-able decrease of statistical quality of models for the trainingset. These are Zn.O.A2, Co.Co.Co.O.O.O.O.A6, Ce.O.O.A4,Ni.O.C1, Cu.O.B5, Cu.O.A1, and Sb.Sb.O.O.O.A4. The sta-tistical quality of the model for training set (split 1, Eq. 5) afterremoving of these nano metal-oxides becomes r2=0.68 ands=0.29. However, attempts to build up a model without thesenano metal-oxides have indicated that predictive potential ofthe model is lower: r2calibration≈0.79 and r2validation≈0.80. It isto be noted in this case, the Zn.O.A1 (in validation set)becomes the influential outlier. Thus, the model that seemsuntrustworthy (for the training set) has better predictive po-tential than the model after removing of nano metal-oxideswith untypical behavior. It is similar to a situation that isdescribed in the works (Toropova et al. 2011b).
Themechanistic interpretation of the optimal descriptors canbe obtained from several runs of the Monte Carlo optimization.In this case, codes of model components involved in themodeling process will fall into three classes: (i) stable pro-moters of an increase in the endpoint—if they have onlypositive values of correlation weights, (ii) stable promoters ofa decrease in the endpoint—if they have only negative corre-lation weights, and (iii) codes of model components with anunclear role—if they have both positive and negative values ofthe correlation weights revealed in several runs of the MonteCarlo optimization (Toropova et al. 2011c). In the case ofEqs. 5–9, there are only positive (except Co, in Split 2) valuesof the correlation weights; however, there are significant dif-ference between correlation weights of various Ck (e.g., aver-age CW(Al)≈1.253±0.088, whereas CW(Zn)≈5.661±0.611).It is to be noted that influence of chemical elements is mostsignificant, vice versa the influence of dose according to theircorrelation weights is lowest (e.g., average CW(A)≈1.511±0.298, whereas average CW(D)≈1.423±0.365). The exposuretime has a middle level of influence (e.g., average CW(1)≈1.249±0.398, whereas average CW(7)≈1.775±0.289).
The interpretation of the models as random events by theanalogy with recently described QSPR/QSAR (Toropov et al.2013) lead to necessity of a reliable evaluation of their pre-dictability, i.e., an approach should be checked up for severalsplits into the visible training set and invisible validation set.Since the statistical quality of models calculated with Eqs. 5–9are quite similar, one can estimate the approach as reliable
one. Thus the suggested models are built up in accordancewith OECD principles (OECD 2007).
The “Supplementary Materials” section contains five ran-dom splits into the visible sub-training and calibration setstogether with an “invisible” external validation set (Table S2).
Conclusions
The cell membrane damage by means of nano metal-oxides isa complex function of many factors besides chemical compo-sition, dose, and exposure time. However, the comparison offive models, which are built up for different distribution intothe visible training set and invisible validation set indicatesthat chemical composition, dose, and exposure time can be abasis to predict the endpoint using the Monte Carlo method.
There are seven nano metal-oxides (in the visible trainingset) which are characterized by low accuracy of the modelcalculated by described approach. However, removing of thesenano metal-oxides leads to the decrease of predictive potentialof the model. In other words, unexpectedly, the involving ofthese nano metal-oxides into the modeling process improvesthe predictive potential of the model for external validation set.
For the case of examined nano metal-oxides, the chemicalcomposition has the most important influence for the cellmembrane damage because the correlation weights of chemicalelements are characterized by maximal range. Unexpectedly,the influence of dose for the cell membrane damage is mostlow. The exposure time is characterized by intermediate levelof influence for the endpoint.
The models which are calculated with Eqs. 5–9 are vali-dated according to the OECD guidelines (OECD 2007). Thedescribed approach is flexible and can be modified to assessand use various types of eclectic data which will becomeavailable in the future.
One can reproduce the described computational experimentsby means of using the CORAL software available online (http://www.insilico.eu/coral); it is to be noted also that this softwarecan be used for other endpoints related to both “traditional”substances (Mullen et al 2011; Veselinović et al 2013a, b;Achary 2014a, b; Worachartcheewan et al. 2014; Comelli et al.2014; Deng et al. 2014a, b) and endpoints which are related tonanomaterials (Toropova et al. 2011c; Toropova et al. 2014;Toropova and Toropov 2013; Toropov and Toropova 2014).
Acknowledgments The authors are grateful to the EC FP7 projectNanoPUZZLES (Project Reference: 309837) and EU FP7 projectPreNanoTox (contract 309666). D.L. and J.L. acknowledge support fromthe National Science Foundation (NSF/CREST HRD-0833178). Theauthors also express their gratitude to Dr. L. Cappellini, Dr. G. Bianchiand Dr. R. Bagnati for valuable consultations on the computer science.
Conflict of interest The authors declare that there are no conflicts ofinterest.
Environ Sci Pollut Res (2015) 22:745–757 755
Author's personal copy
References
Achary PGR (2014a) QSPR modelling of dielectric constants of π-conjugated organic compounds by means of the CORAL software.SAR and QSAR Environ Res 25:507–526
Achary PGR (2014b) Simplified molecular input line entrysystem-based optimal descriptors: QSAR modelling for voltage-gated potassium channel subunit Kv7.2. SAR and QSAR EnvironRes 25:73–90
Afantitis A, Melagraki G, Koutentis PA, Sarimveis H, Kollias G (2011)Ligand-based virtual screening procedure for the prediction and theidentification of novel β-amyloid aggregation inhibitors usingKohonen maps and counterpropagation artificial neural networks.Eur J Med Chem 46:497–508
Comelli NC, Ortiz EV, Kolacz M, Toropova AP, Toropov AA,Duchowicz PR, Castro EA (2014) Conformation-independentQSAR on c-Src tyrosine kinase inhibitors. Chemometr Intell LabSyst 134:47–52
Deng F, Xie M, Zhang X, Li P, Tian Y, Zhai H, Li Y (2014a) Combinedmolecular docking, molecular dynamics simulation and quantitativestructure-activity relationship study of pyrimido[1,2-c][1,3]benzothiazin-6- imine derivatives as potent anti-HIV drugs. JMol Struct 1067:1–13
Deng F-F, Xie M-H, Li P-Z, Tian Y-L, Zhang X-Y, Zhai H-L (2014b)Study on the antagonists for the orphan G protein-coupled receptorGPR55 by quantitative structure-activity relationship. ChemometrIntell Lab Syst 131:51–60
Furtula B, Gutman I (2011) Relation between second and third geometric-arithmetic indices of trees. J Chemometr 25:87–91
García J, Duchowicz PR, Rozas MF, Caram JA, Mirífico MV,Fernández FM, Castro EA (2011) A comparative QSAR on1,2,5-thiadiazolidin-3-one 1,1-dioxide compounds as selectiveinhibitors of human serine proteinases. J Mol Graph Model31:10–19
Garro Martinez JC, Duchowicz PR, Estrada MR, Zamarbide GN,Castro EA (2011) QSAR study and molecular design ofopen-chain enaminones as anticonvulsant agents. Int J MolSci 12:9354–9368
Gutman I, Hansen P, Mélot H (2005) Variable neighborhood search forextremal graphs. 10. Comparison of irregularity indices for chemicaltrees. J Chem Inf Model 45:222–230
Hollas B, Gutman I, Trinajstić N (2005) On reducing correlations be-tween topological indices. Croat Chem Acta 78:489–492
Ibezim E, Duchowicz PR, Ortiz EV, Castro EA (2012) QSAR on aryl-piperazine derivatives with activity on malaria. Chemometr IntellLab Syst 110:81–88
Leszczynski J (2010) Bionanoscience: nano meets bio at the interface.Nat Nanotech 5:633–634
Liu R, Rallo R, George S, Ji Z, Nair S, Nel AE, Cohen Y (2011)Classification NanoSAR development for cytotoxicity of metaloxide nanoparticles. Small 7:1118–1126
Mullen LMA, Duchowicz PR, Castro EA (2011) QSAR treatmenton a new class of triphenylmethyl-containing compounds aspotent anticancer agents. Chemometr Intell Lab Syst 107:269–275
OECD, Organisation for Economic Co-operation and Development(2007) Guidance document on the validation of (quantitative)structure-activity relationships [(Q)SAR] models, OECD, Paris.http://www.oecd.org/dataoecd/55/35/38130292.pdf
Ojha PK, Roy K (2011) Comparative QSARs for antimalarialendochins: importance of descriptor-thinning and noise reduc-tion prior to feature selection. Chemometr Intell Lab 109:146–161
Patel T, Low-Kam C, Ji ZH, Zhang H, Xia T, Nel AE, Zinc JI, Telesca D(2012) Relating nanoparticle properties to biological outcomes in
exposure escalation experiments COBRA preprint series 2012,Working Paper 101. http://biostats.bepress.com/cobra/art101
Puzyn T, Rasulev B, Gajewicz A, Hu X, Dasari TP, Michalkova A,Hwang HM, Toropov A, Leszczynska D, Leszczynski J (2011)Using nano-QSAR to predict the cytotoxicity of metal oxide nano-particles. Nat Nanotech 6:175–178
Rasulev B, Gajewicz A, Puzyn T, Leszczynska D, Leszczynski J (2012)Nano-QSAR: advances and challenges. RSC Nanosci Nanotech2012:220–256
RoyK,Mitra I, Ojha PK, Kar S, Das RN, Kabir H (2012a) Introduction ofrm
2 (rank) metric incorporating rank-order predictions as an addi-tional tool for validation of QSAR/QSPRmodels. Chemometr IntellLab Syst 118:200–210
Roy K, Mitra I, Kar S, Ojha PK, Das RN, Kabir H (2012b) Comparativestudies on some metrics for external validation of QSPR models. JChem Inf Model 52:396–408
Toropov AA, Leszczynski J (2006) A new approach to the characteriza-tion of nanomaterials: predicting Young’s modulus by correlationweighting of nanomaterials codes (2006) Chem. Phys Lett 433:125–129
Toropov AA, Toropova AP (2003) QSPRmodeling of alkanes propertiesbased on graph of atomic orbitals. J Mol Struct THEOCHEM 637:1–10
Toropov AA, Toropova AP (2014) Optimal descriptor as a trans-lator of eclectic data into endpoint prediction: mutagenicityof fullerene as a mathematical function of conditions. Chemosphere104:262–264
Toropov AA, Leszczynska D, Leszczynski J (2007) Predicting thermalconductivity of nanomaterials by correlation weighting technologi-cal attributes codes. Mater Lett 61:4777–4780
Toropov AA, Toropova AP, Benfenati E, Gini G, Puzyn T, LeszczynskaD, Leszczynski J (2012) Novel application of the CORAL softwareto model cytotoxicity of metal oxide nanoparticles to bacteriaEscherichia coli. Chemosphere 89:1098–1102
Toropov AA, Toropova AP, Puzyn T, Benfenati E, Gini G,Leszczynska D, Leszczynski J (2013) QSAR as a randomevent: modeling of nanoparticles uptake in PaCa2 cancer cells.Chemosphere 92:31–37
Toropova AP, Toropov AA (2013) Optimal descriptor as a translator ofeclectic information into the prediction of membrane damage bymeans of various TiO2 nanoparticles. Chemosphere 93:2650–2655
Toropova AP, Toropov AA, Benfenati E, Gini G (2011a) QSAR model-ling toxicity toward rats of inorganic substances by means ofCORAL. Cent Eur J Chem 9:75–85
Toropova AP, Toropov AA, Benfenati E, Gini G, Leszczynska D,Leszczynski J (2011b) CORAL: quantitative structure-activity rela-tionship models for estimating toxicity of organic compounds inrats. J Comput Chem 32:2727–2733
Toropova AP, Toropov AA, Benfenati E, Gini G (2011c) Co-evolutions of correlations for QSAR of toxicity of organo-metallic and inorganic substances: an unexpected good predic-tion based on a model that seems untrustworthy. Chemometr IntellLab Syst 105:215–219
Toropova AP, Toropov AA, Benfenati E, Gini G, Leszczynska D,Leszczynski J (2011d) CORAL: QSPR models for solubility of[C60] and [C70] fullerene derivatives. Mol Divers 15:249–256
Toropova AP, Toropov AA, Benfenati E, Gini G, Leszczynska D,Leszczynski J (2012) CORAL: models of toxicity of binary mix-tures. Chemometr Intell Lab Syst 119:39–43
Toropova AP, Toropov AA, Benfenati E, Puzyn T, Leszczynska D,Leszczynski J (2014) Optimal descriptor as a translator of eclecticinformation into the prediction of membrane damage: the case of agroup of ZnO and TiO2 nanoparticles. Ecotox Environ Safe 108:203–209
Veselinović AM, Milosavljević JB, Toropov AA, Nikolić GM(2013a) SMILES-based QSAR model for arylpiperazines as
756 Environ Sci Pollut Res (2015) 22:745–757
Author's personal copy

high-affinity 5-HT1A receptor ligands using CORAL. Eur JPharm Sci 48:532–541
Veselinović AM, Milosavljević JB, Toropov AA, Nikolić GM (2013b)SMILES-based QSAR models for the calcium channel-antagonisticeffect of 1,4-dihydropyridines. Arch Pharm 346:134–139
Weininger D (1988) SMILES, a chemical language and informationsystem. 1. Introduction to methodology and encoding rules. JChem Inf Comput Sci 28:31–36
Weininger D (1990) Smiles. 3. Depict. Graphical depiction of chemicalstructures. J Chem Inf Comput Sci 30:237–243
Weininger D, Weininger A, Weininger JL (1989) SMILES. 2. Algorithmfor generation of unique SMILES notation. JChemInfComputSci29:97–101
Worachartcheewan A, Nantasenamat C, Isarankura-Na-Ayudhya C,Prachayasittikul V (2014) QSAR study of H1N1 neuraminidaseinhibitors from influenza Avirus. Lett Drug Des Discov 11:420–427
Environ Sci Pollut Res (2015) 22:745–757 757
Author's personal copy