
PROXIMITY, NETWORKS AND KNOWLEDGE FISCALITÀ LOCALE E …
44
PROXIMITY, NETWORKS AND KNOWLEDGE PRODUCTION IN EUROPE Emanuela Marrocu Raffaele Paci Stefano Usai WORKING PAPERS 2011/09 CONTRIBUTI DI RICERCA CRENOS !"#!
Transcript of PROXIMITY, NETWORKS AND KNOWLEDGE FISCALITÀ LOCALE E …

PROXIMITY, NETWORKS AND KNOWLEDGE PRODUCTION IN EUROPE
Emanuela Marrocu
Raffaele Paci Stefano Usai
WORKING PAPERS
2 0 1 1 / 0 9
C O N T R I B U T I D I R I C E R C A C R E N O S
FISCALITÀ LOCALE E TURISMO LA PERCEZIONE DELL’IMPOSTA DI SOGGIORNO E DELLA
TUTELA AMBIENTALE A VILLASIMIUS
Carlo Perelli Giovanni Sistu Andrea Zara
QUADERNI DI LAVORO
2 0 1 1 / 0 1
T E M I E C O N O M I C I D E L L A S A R D E G N A
!"#!$

C E N T R O R I C E R C H E E C O N O M I C H E N O R D S U D
( C R E N O S ) U N I V E R S I T À D I C A G L I A R I U N I V E R S I T À D I S A S S A R I
C R E N O S w a s s e t u p i n 1 9 9 3 w i t h t h e p u r p o s e o f o r g a n i s i n g t h e j o i n t r e s e a r c h e f f o r t o f e c o n o m i s t s f r o m t h e t w o S a r d i n i a n u n i v e r s i t i e s ( C a g l i a r i a n d S a s s a r i ) i n v e s t i g a t i n g d u a l i s m a t t h e i n t e r n a t i o n a l a n d r e g i o n a l l e v e l . C R E N o S ’ p r i m a r y a i m i s t o i m p r o v e k n o w l e d g e o n t h e e c o n o m i c g a p b e t w e e n a r e a s a n d t o p r o v i d e u s e f u l i n f o r m a t i o n f o r p o l i c y i n t e r v e n t i o n . P a r t i c u l a r a t t e n t i o n i s p a i d t o t h e r o l e o f i n s t i t u t i o n s , t e c h n o l o g i c a l p r o g r e s s a n d d i f f u s i o n o f i n n o v a t i o n i n t h e p r o c e s s o f c o n v e r g e n c e o r d i v e r g e n c e b e t w e e n e c o n o m i c a r e a s . T o c a r r y o u t i t s r e s e a r c h , C R E N o S c o l l a b o r a t e s w i t h r e s e a r c h c e n t r e s a n d u n i v e r s i t i e s a t b o t h n a t i o n a l a n d i n t e r n a t i o n a l l e v e l . T h e c e n t r e i s a l s o a c t i v e i n t h e f i e l d o f s c i e n t i f i c d i s s e m i n a t i o n , o r g a n i z i n g c o n f e r e n c e s a n d w o r k s h o p s a l o n g w i t h o t h e r a c t i v i t i e s s u c h a s s e m i n a r s a n d s u m m e r s c h o o l s . C R E N o S c r e a t e s a n d m a n a g e s s e v e r a l d a t a b a s e s o f v a r i o u s s o c i o - e c o n o m i c v a r i a b l e s o n I t a l y a n d S a r d i n i a . A t t h e l o c a l l e v e l , C R E N o S p r o m o t e s a n d p a r t i c i p a t e s t o p r o j e c t s i m p a c t i n g o n t h e m o s t r e l e v a n t i s s u e s i n t h e S a r d i n i a n e c o n o m y , s u c h a s t o u r i s m , e n v i r o n m e n t , t r a n s p o r t s a n d m a c r o e c o n o m i c f o r e c a s t s . w w w . c r e n o s . i t i n f o @ c r e n o s . i t
C R E N O S – C A G L I A R I V I A S A N G I O R G I O 1 2 , I - 0 9 1 0 0 C A G L I A R I , I T A L I A
T E L . + 3 9 - 0 7 0 - 6 7 5 6 4 0 6 ; F A X + 3 9 - 0 7 0 - 6 7 5 6 4 0 2
C R E N O S - S A S S A R I V I A T O R R E T O N D A 3 4 , I - 0 7 1 0 0 S A S S A R I , I T A L I A
T E L . + 3 9 - 0 7 9 - 2 0 1 7 3 0 1 ; F A X + 3 9 - 0 7 9 - 2 0 1 7 3 1 2 T i t l e : PROX IMITY , NETWORKS AND KNOWLEDGE PRODUCT ION IN EUROPE I SBN: 978 88 84 67 774 7 F i r s t Ed i t i on : June 2011 S e c o n d E d i t i o n : N o v e m b e r 2 0 1 1 T h i r d E d i t i o n : N o v e m b e r 2 0 1 2 © CUEC 2012 V i a I s M i r r i o n i s , 1 09123 C a g l i a r i T e l . / F a x 070 291201 w w w . c u e c . i t
1
Proximity, Networks and Knowledge Production in Europe
Emanuela Marrocu, Raffaele Paci, Stefano Usai University of Cagliari and CRENOS
Abstract This paper aims at assessing the role of various dimension of proximity on the innovative capacity of a region within the context of a knowledge production function where we consider as main internal inputs R&D expenditures and human capital. We want to assess if, and how much, the creation of new ideas in a certain region is the result of flows of information and knowledge coming from proximate regions. In particular, we examine in details the concept of proximity combining the usual geographical dimension with the institutional, the technological, the social and the organizational proximity. The analysis is implemented for an ample dataset referring to 287 regions in 29 countries (EU27 plus Norway, Switzerland) for the last decade. Results show that human capital and R&D are clearly essential for innovative activity but with an impact which is much higher for the former factor. As for the proximity and network effects, we find that geography is important but less than technological and cognitive proximity. Social and organizational networks are also relevant but their role is more modest. Finally, most of these proximities prove to have a complementary role in shaping innovative activity across regions in Europe. Keywords: knowledge production, technological spillover, proximity, networks. Jel classification: C31, O31, O18, O52, R12 Acknowledgments: The research leading to these results has received funding from the ESPON project KIT, Knowledge, Innovation, Territory. We would like to thank Barbara Dettori and Marta Foddi for excellent research assistance.
2
1. Introduction
According to the European Council, regional policy, within the Europe 2020 strategy, is essential in unlocking the growth potential of the EU by promoting innovation in all regions. In this perspective, regions have a central role since they are the institutions which deal with all the actors involved in the regional innovation system and its local dynamics.
The capacity of a region to generate, transmit and acquire knowledge and innovation depends on many factors: investment in R&D, work force experience, education and training, collaboration networks, technology transfer mechanisms, mobility of researchers, among many others. In particular, the literature has distinguished between the creation of new ideas and inventions and the absorption of innovations generated in other regions. Several works both on the theoretical (Grossman and Helpman, 1990; Rallet and Torre, 1999) and the empirical side (Jaffe, 1989; Coe and Helpman, 1995) have argued and shown that innovation depends on investments in knowledge as much as on interactive learning and on ideas circulation. Both aspects are strictly related to the concept of proximity across economic agents and how this may affect their ability to connect and, possibly, cooperate within networks. This concept has several dimensions and interpretations, the most common of which applies to geography: spatial concentration is widely believed crucial in the dynamics of innovation thanks to local knowledge spillovers. However, local relations go often together with wider links and networks. In this respect, territory may be just a counterpart of other forms of proximity: institutional, cognitive/technological, social/relational and organizational, as exhaustively argued and commented by Boschma (2005).
The main object of this paper is to analyse the interaction of these internal and external factors in determining the technological performance of European regions. We want to understand how much of the regional innovative capacity depends on intra-regional characteristics (mainly R&D expenditure and human capital) and how much on the ability to exploit inter-regional spillovers. The original feature of this contribution is that we extend the usual model of the Knowledge Production Function (KPF) in order to assess the role of different types of proximity and networks in channeling technological spillovers across regions.
3
Therefore we try to address the following questions: 1) what is the balance of internal and external factors in shaping regional innovative performance? 2) what kind of proximity drives technological spillovers across regions? 3) are these externalities complementary or substitute?
These questions refer to the European regional setting, which represents an extremely interesting case of study because of the high heterogeneity of regions with respect to economic as well as innovative performance (Hollander et al., 2009). Most importantly, the European Union clearly regards policy interventions at the regional level in favor of innovative activity as strategic for both economic growth and cohesion targets. Our results may therefore support a better understanding of this process in the European Union.
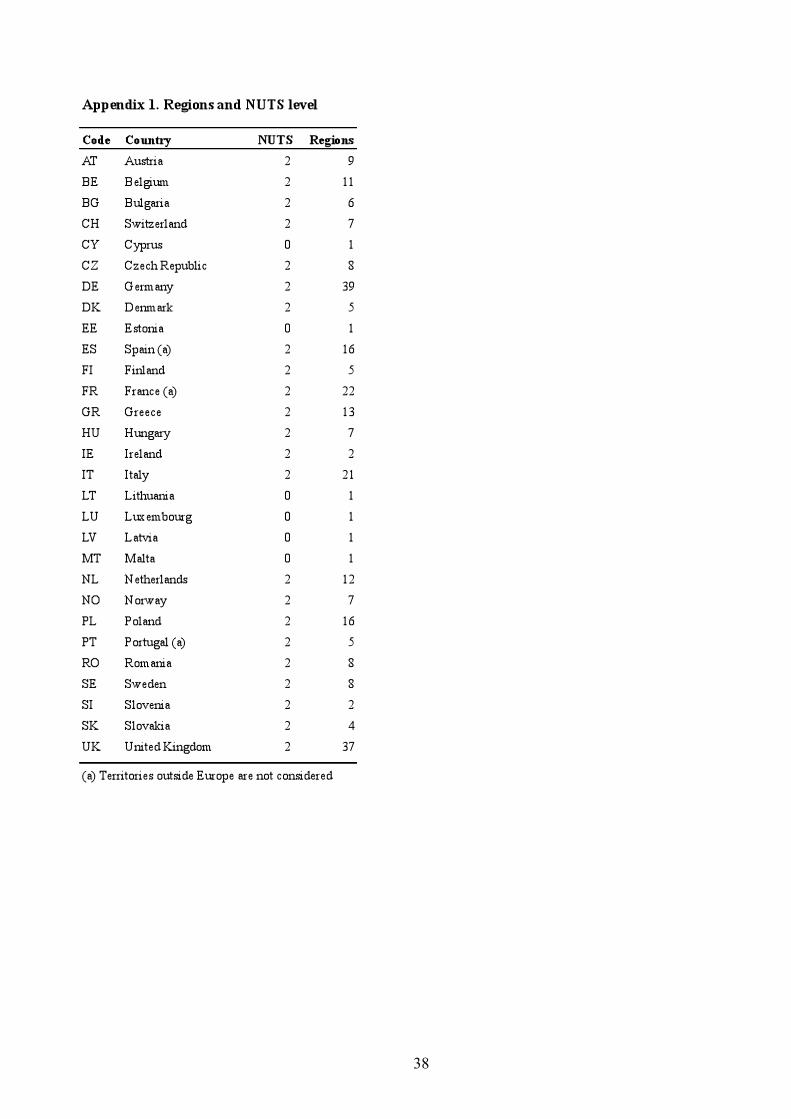
The analysis is implemented for an ample dataset referring to 276 regions in 29 countries (EU27 plus Norway, Switzerland) in the first decade of the new century. More specifically, we try to measure the impact of local factors at the beginning of the decade (2002-2004) on innovative performance measured at the second half of the decade (2005-2007). Further, the role of external factors, that is proximity and networks, is assessed thanks to spatial econometric techniques where distinct matrices for each dimension are tested first singularly and secondly in couples. This allows to evaluate and compare, on the one hand, the importance of internal and external determinants and, on the other hand, the influence of five types of proximities on regional innovation.
Main results confirm the importance of investment in research and development and reveal the even greater role of human capital in enhancing innovative activity. More importantly, our empirical analysis shows that geography is not the only dimension which may help knowledge diffusion and not even the most important one. Technological proximity always proves the most relevant one while the other types of proximities may have a complementary decisive role.
The paper is structured as follows. Section 2 presents the literature background on knowledge production function and on the application of proximity within this framework. Section 3 deals with the variables description dealing, in particular, with the search for adequate ways to measure the different dimensions of proximities across regions. Section 4 introduces the econometric model and the main estimation issues. In section 5 results for the different proximity measures are presented. Section 6 concludes.
4
2. Literature background
The idea that technological progress is a complex process which combines local and global factors is by now widely shared. Endogenous growth and New Economic Geography literature provide theoretical backing to this idea, which is based on the presence of technological spillovers both within and across regions and countries. Such spillovers are obviously related to the geographical dimension since close-by agents are believed to have a better innovative performance because or pecuniary and pure technological advantages. More specifically, they can access information less costly and they can share tacit knowledge (a local public good) through face to face contacts. Nonetheless, the French School of Proximity argues that geographical proximity is neither necessary nor sufficient and that there may be a separate role for a-spatial links among economic entities (see Carrincazeaux and Coris, 2011, for a recent review). The exchange of knowledge and technological interdependence, in other words, may be related, according to Boschma (2005), to proximities across agents with respect to at least four other dimensions: institutional, technological (or cognitive), social (or relational) and organizational. In this section we first define each concept of proximity and then we analyse how they have been measured and implemented in the empirical studies based on the knowledge production function.
Institutional proximity means that the effective transmission of knowledge may be facilitated by the presence of a common institutional framework. Institutions, such as laws and norms, can provide a set of standard procedures and mechanisms which are shared by agents and, therefore, taken for granted. This mutual endowment proves relevant in reducing uncertainty and lowering transaction costs and, thus, favouring cooperative behaviours in the regional context (Maskell and Malmberg ,1999; Gertler, 2003)
Technological (or cognitive) proximity indicates that knowledge transfer requires appropriate absorptive capacity (Cohen and Levinthal, 1990), which entails an homogenous cognitive base with respect to the original knowledge in order to understand and process it effectively. In practical terms we expect that economic agents which share the same knowledge, or territories which have in common the same specialisation structure, can exchange information more easily and less costly, and this may favour innovation.
5
Social (or relational) proximity refers to the fact that economic relationships may reflect social ties and vice versa (Granovetter, 1985). In the context of innovation processes, this implies that social closeness facilitates firms capacity to learn, absorb external knowledge and innovate since this breeds trust which lowers transaction costs and facilitate collaboration. This aspect can be particularly relevant in a risky and uncertain phenomenon such as technological progress.
Organisational proximity refers to the relations within the same group or organisation which influence the individual capacity to acquire new knowledge coming from different agents. It thus reduces uncertainty and incentives to opportunistic behaviours since it provides an area of definition of practices and strategies within a set of rules based on an organizational arrangement (Kirat and Lung, 1999). Such an arrangement can be either within or among firms and take different forms along a range which goes from informal relations among companies to formally organised firms.
The different dimensions of proximity discussed above can be seen as a critical condition for firms interaction and cooperation aimed at innovation. Boschma and Frenken (2010), in particular, explain how proximity (or similarity) can act as a driving force for the formation and the evolution of networks. The interconnected role of proximity and networks on local innovation performance is going to be analysed thanks to the KPF approach, introduced by Griliches (1979) to study the relationship, at the firm level, between knowledge inputs and outputs. Since then it has been extensively used to analyze how such a relationship works both at the firm and at the territorial level. In particular, regional KPF’s have been estimated to assess the role of internal as much as external factors on regional innovation systems. The seminal paper is due to Jaffe (1989), who proves the existence of geographically mediated spillovers from university research to commercial innovation among US metropolitan areas. The main results of this paper have been later extended and strengthened by many other authors who observe the presence of local externalities both within and across regions in the US (Acs et al., 1992; Anselin et al., 1997; O´hUallacha´in and Leslie, 2007). Most of these studies introduce the concept of geographical proximity and test for its importance by means of spatial econometric techniques.
6
Along the same vein, several studies have been proposed for the EU regions (Tappeiner et al., 2008; Acosta et al., 2009; Buesa et al., 2010 are among the latest contributions).1 All in all, these studies find that innovation performance is partly due to internal factors and partly to technological spillovers which flow from one region to another. Contrary to the studies on the US, some of these papers start introducing other possible dimensions of proximity to assess their role on knowledge production together with the geographical one. In particular Bottazzi and Peri (2003), Greunz (2003) and Moreno et al. (2005) investigate inter-regional knowledge spillovers across European regions, trying to assess if technological proximity influences the creation of new knowledge within European regions. Results show that interregional knowledge spillovers exist both between close-by regions and between regions with similar technological profiles. This indicates that geographical distance is not the only dimension to be investigated and that knowledge spillovers may be affected also by cognitive distance. Furthermore, all these studies consider institutional proximity (measured by means of country dummies) and find it relevant in discriminating among more and less innovative regions.
There are only few contributions which examine the role of social/relational networks2 together with geographical proximity within a KPF. Maggioni et al. (2007), Kroll (2009) and Ponds et al. (2010) find that both the local neighborhood and the co-operation based connectedness to other regions matter for the local process of knowledge generation. The former paper measures social proximity by means of cooperation networks for the fifth framework programme, the second one uses co-patenting across regions, whilst the latter uses co-
1 The only contributions which analyse different continents at the regional level are Crescenzi et al. (2007) for US and EU with data coming from USPTO and EPO respectively and Usai (2011) on OECD regions with homogenous information coming from the Patent Cooperation Treaty. 2 The social proximity has been also included in studies of R&D cooperation networks, such as that of Autant-Bernard et al (2007), who find that the probability of collaboration is influenced by each individual’s position within the network and in particular that social distance seems to matter more than geographical distance. In the same vein, Hoekman et al (2009), with data on inter-regional research collaboration measured by scientific publications and patents in Europe, find negative effects of both geographical and institutional distance on research collaboration.
7
publications. Other papers have introduced various features of inventors’ network in a knowledge production function framework: Lobo and Strumsky (2008) for the case of US MSA’s and Miguelez and Moreno (2010) for the European NUTS2 regions. They all find that the scale and extent of networks have a positive impact on innovative performance. However, none of these studies implement this concept in order to measure proximity for each couple of regions but rather as a regional indicator which measures its degree of connectivity and openness.
Finally, to the best of our knowledge, there are no contributions which focus directly on the role of organizational proximity on regional innovation performance. The only partial exceptions is the paper by Sorensen et al. (2006) where organizational proximity is considered as a determinant of knowledge flows proxied by citations. The use of micro data allows to introduce organizational proximity as a binary variable which is equal to unity when the citation comes from employees of the same firm even though they reside in different regions. Another interesting study on the impact of organizational proximity on innovation, even though at the firm level, is Oerlemans and Meeus (2005), who, thanks to survey based micro data on the Netherlands, conclude that interregional relations with business agents (users and suppliers) are conducive to a better innovative performance.
3. Data description and proximity measures
The literature on the determinants of innovative activity at firm and regional level has been traditionally based on the estimation of a KPF where the output is mainly measured by the patenting activity and the input by the R&D expenditure. We follow this approach but we augment the KPF by introducing human capital as an additional input given its well known effects on knowledge creation.
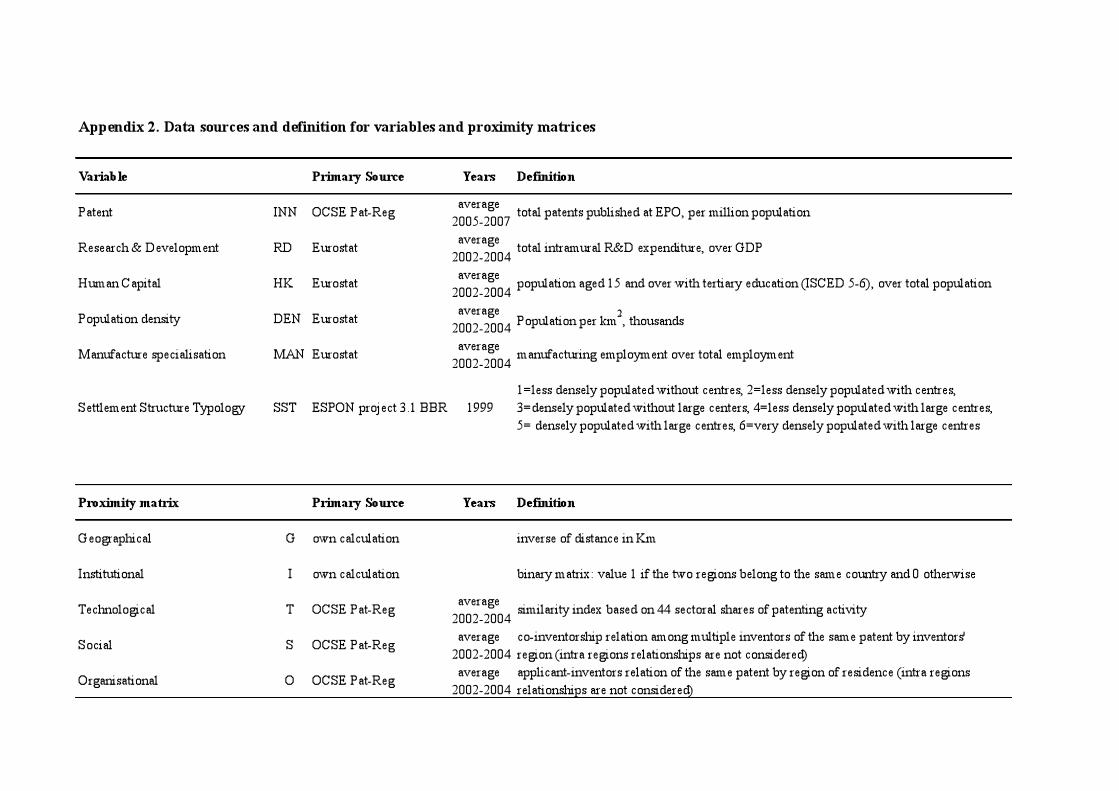
More specifically, as a proxy of the innovative activity we use the number of patents application filed at the European Patent Office (EPO) classified by priority year and by inventor’s region. In case of multiple inventors we assign a proportional fraction of each patent to the different inventors’ regions of residence. Since patenting activity, especially at the regional level, is quite irregular over time we smooth the variable by computing a three-year average. Moreover, to control for the different size of the regions, the number of patent is divided by total population. Thus our dependent variable is measured as the yearly average of patents per million inhabitants in 2005-2007.

8
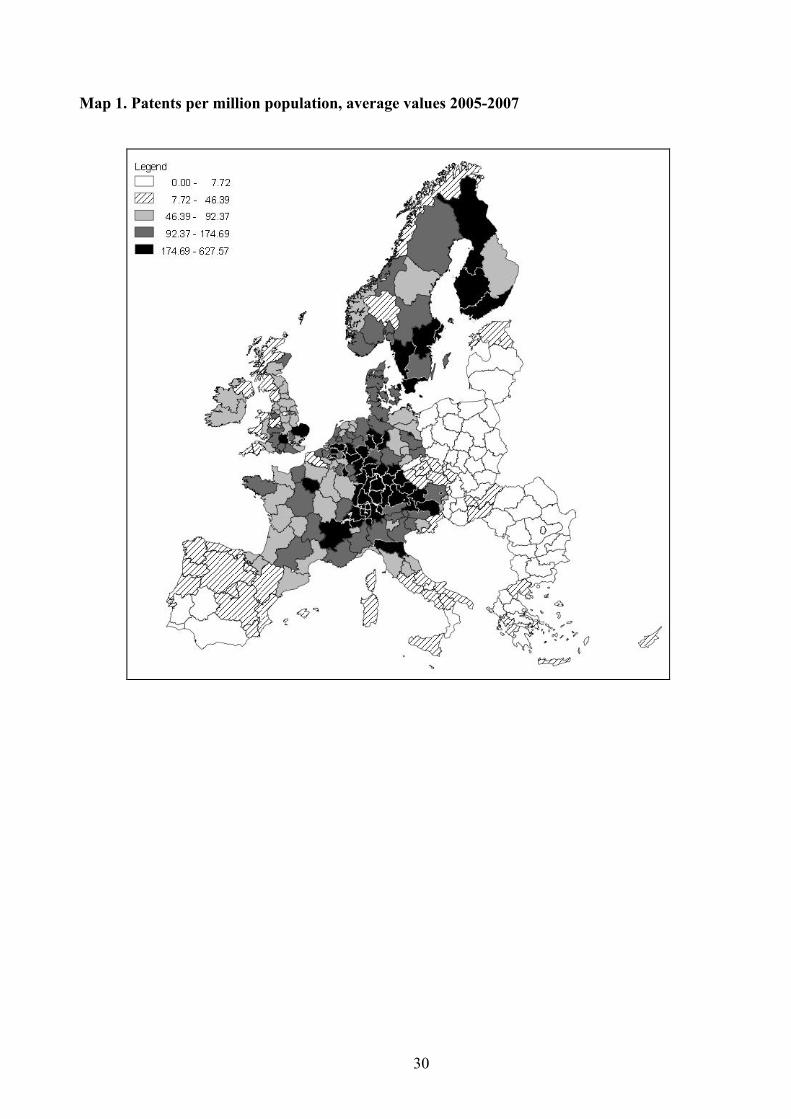
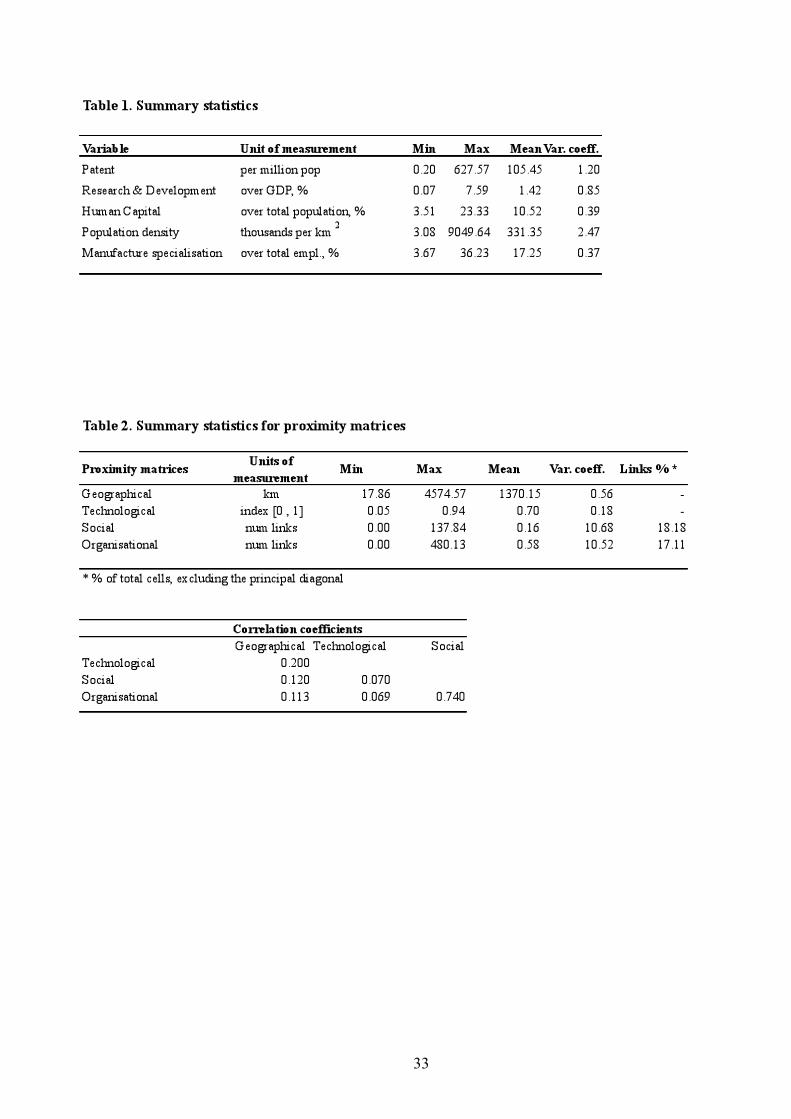
The summary statistics, reported in Table 1, show the substantial differences in patenting activity among European regions ranging from nearly zero in Sud-Vest Oltenia in Romania to 627 in the German region of Stuttgart. The high value (1.2) of the coefficient of variation (CV) confirms the great degree of spatial concentration of innovative activity. Map 1 shows the distribution of patenting activity in Europe and highlights its strong spatial divide with a concentration of innovation in the north-centre of Europe and a scarce patenting activity in the eastern and southern regions.
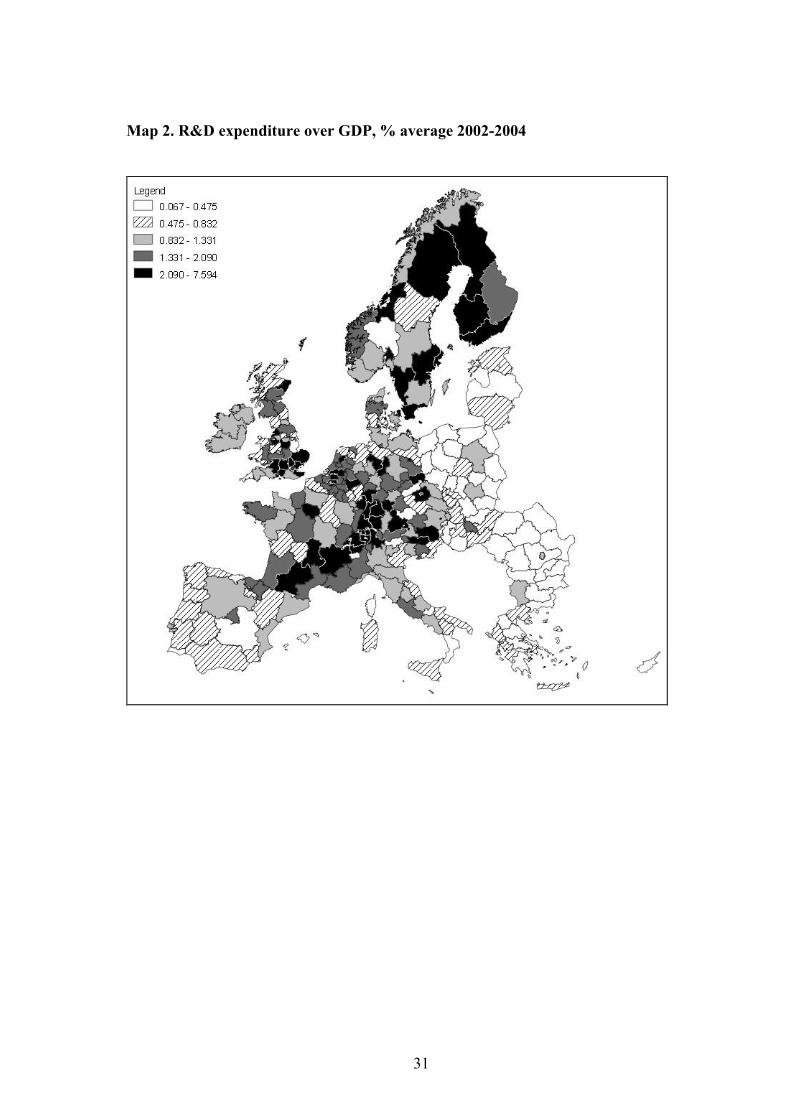
The traditional input in the KPF is the R&D expenditure computed as a share of GDP. The average R&D expenditure in Europe is 1.4% with a minimum of 0.07% and a maximum of 7.6% in Braunschweig (Germany). In this case, yet again, the spatial distribution in Europe appears quite concentrated (CV= 0.85) in Scandinavia, Central Europe (Germany, Switzerland, France) and in Southern England (see Map 2).
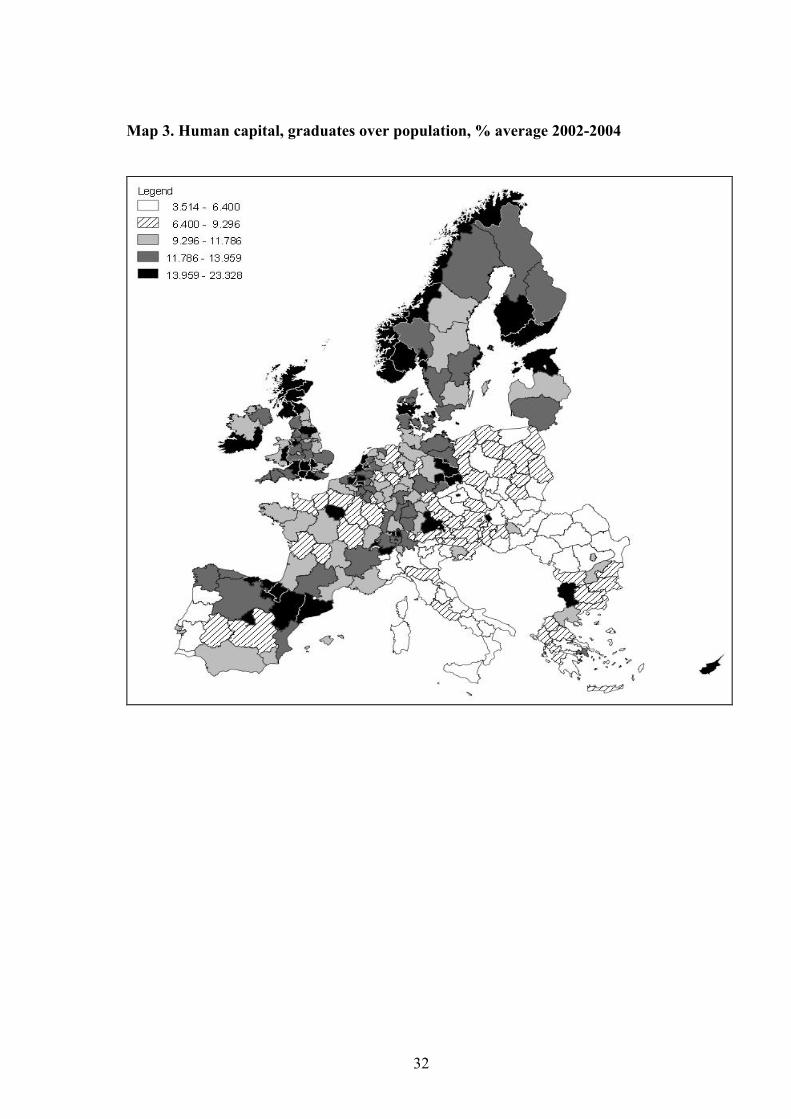
As an additional input, expected to influence the process of knowledge production at the local level, we consider the availability of human capital. Indeed, in the case of traditional sectors and small enterprises the creation of innovation is not necessarily the result of a formal investment in research but it is often derived from an informal process of learning by doing (Nelson and Winter, 1982) strictly linked to the presence of well educated labour forces. Following a well established literature we measure human capital as the share of population with tertiary education (ISCED 5-6) over total population. The spatial distribution of this variable across European regions appears more uniform (CV = 0.39) and with a clearly identifiable national pattern. A high endowment of human capital characterizes the Scandinavian countries, UK, Germany, Spain while lower values are generally detected in the Eastern countries, France and Italy.
As discussed in the Introduction, one of the original elements of this paper is to consider different measures of proximity among regions which may influence the exchange and diffusion of knowledge: geographical, institutional, technological, social and organizational. Let us now analyze in detail the different measures of proximities, which are summarized in Table 2.
Geographical proximity. This is the standard and widely used indicator of proximity measured by the distance in Km between the centroids of each couple of regions. This measure is preferred with respect to the contiguity matrix since it allows to consider all the

9
potential interactions among regions so that spillovers are not limited to the those regions which share a border. The average spatial distance across regions in Europe is 1370 km ranging from a lowest value of 18 km among Belgium regions to the maximum distance, that is 4574 km, between Cyprus and Ireland. In the econometric analysis we use the inverse of the distance so that high values indicates more proximate regions and thus a higher probability to exchange knowledge.
Institutional proximity. Knowledge is transmitted more easily when individuals and firms share the same institutional framework, a common language and similar cultural, ethnic and religious values. A simple way to account for these time invariant common factors is to include country dummies or, alternatively, model institutional proximity by means of a weight matrix, whose elements take value 1 if two regions belong to the same country and zero otherwise. We anticipate here that the empirical specification based on such a proximity matrix is outperformed by the estimation which includes country dummies to account for the importance of institutional similarity across regions.
Technological proximity. In order to attract new knowledge from outside, firms and regions need to build up an absorptive capacity around the existing knowledge base and carry out technological activity in similar fields. In other words, cognitive capacity is bounded and only companies and regions sharing an analogous knowledge base may exchange information and knowledge and learn from each other. To measure the technological, or cognitive, proximity across regions we have computed two matrices based on the distribution of patenting activity among 44 sectors. The first measure is a similarity index between region i and region j defined as:
where lik is the sectoral share of sector k in region i. The coefficient tij is defined between zero (perfect dissimilarity of the sectoral distribution) and one (perfect similarity). The index has been computed for each couple of regions to build up a technological proximity matrix T with generic element tij .
Similarly, we have computed a second matrix based on the correlation coefficient among the sectoral patent shares between regions i and j as in Jaffe (1986) and Moreno et al. (2005). For both matrices the higher the index value, the more similar in the technological structure are
10
the two regions, the higher is the probability that they can exchange knowledge. The two matrices are highly correlated (r=0.91) and they give very similar results; therefore in the following sections we present only the results based on the similarity index.
In Table 2 we see that the two most technologically distant regions (Ionia Nisia and Notio Aigaio in Greece) have an index of 0.05. Interestingly, the higher degree of technological similarity (0.94) is found in two not spatially contiguous regions, located in different countries: Piedmont in Italy and Niederbayern in Germany. The econometric estimation allows to test if regions with a similar technological specialization, for instance in high tech industries, and therefore with a common cognitive background are more likely to benefit from mutual knowledge flows independently from their geographical location.
Social proximity. The main idea is that individuals who have socially embedded relations are more likely to trust each other and therefore to exchange tacit knowledge smoothly. It is clear that social proximity refers mainly to individuals’ characteristic and its measurement at the regional level is not an easy task. The suggested solution here is to measure this proximity by means of co-inventorship relations among multiple inventors of the same patent in case they are resident in different regions. As a result, the generic element sij of the symmetric social matrix S is defined as the number of inventors located in region i which have co-operated with inventors located in region j to conceive a patented invention. In this matrix we do not consider the intra-regional relationships, i.e. the principal diagonal in our matrix which, as usual in the spatial econometric analysis, is equal to zero. The rationale is that the number and the intensity of links among inventors located in different regions is able to catch the existence of a social network between regions which facilitates the exchange of knowledge.
We also compute another matrix to measure social interaction thanks to migration flows. The idea is that a migration flow between two areas creates a bilateral link which may favor the exchange of knowledge. Unfortunately, data on migration flows, with the specification of the origin and destination, are available only at the national level so we have regionalized them using the population shares. Not surprisingly, results were not satisfactory.
Table 2 shows that the number of non-zero links (co-inventorships) in the matrix represents only a small fraction (18%) of all potential relationships, while the remaining 82% of cells is empty. The highest social interaction (137) is reached by the two contiguous German
11
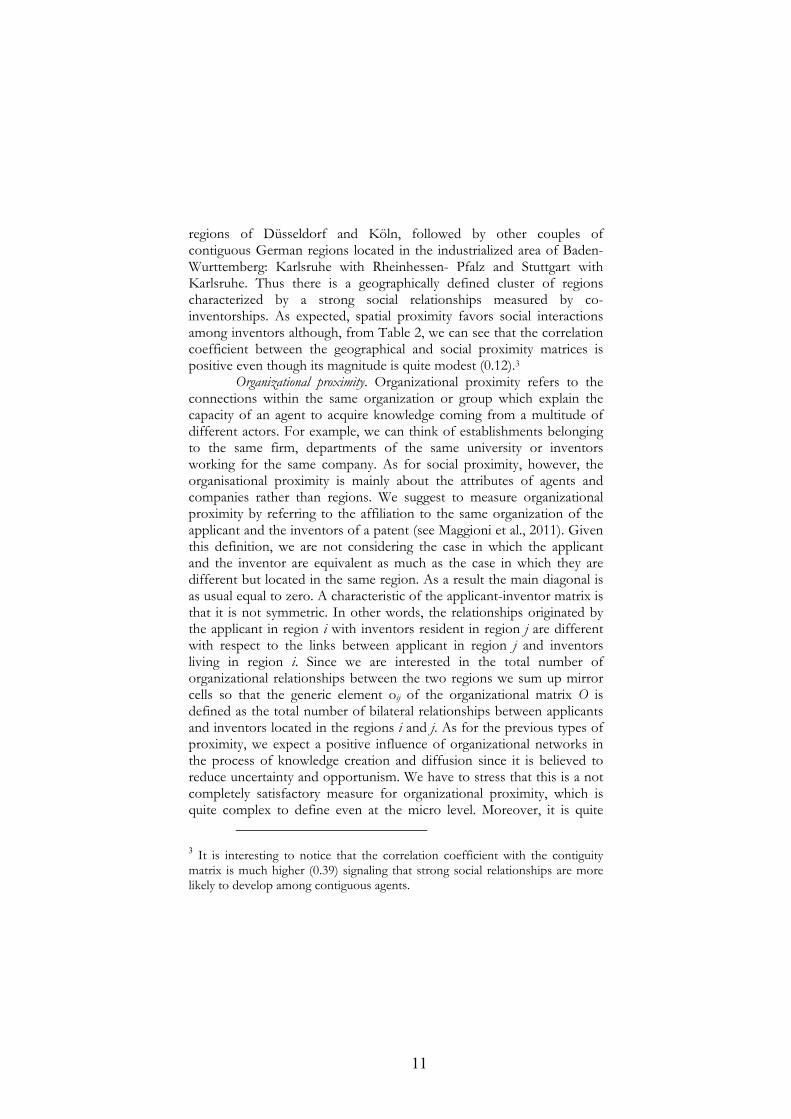
regions of Düsseldorf and Köln, followed by other couples of contiguous German regions located in the industrialized area of Baden-Wurttemberg: Karlsruhe with Rheinhessen- Pfalz and Stuttgart with Karlsruhe. Thus there is a geographically defined cluster of regions characterized by a strong social relationships measured by co-inventorships. As expected, spatial proximity favors social interactions among inventors although, from Table 2, we can see that the correlation coefficient between the geographical and social proximity matrices is positive even though its magnitude is quite modest (0.12).3
Organizational proximity. Organizational proximity refers to the connections within the same organization or group which explain the capacity of an agent to acquire knowledge coming from a multitude of different actors. For example, we can think of establishments belonging to the same firm, departments of the same university or inventors working for the same company. As for social proximity, however, the organisational proximity is mainly about the attributes of agents and companies rather than regions. We suggest to measure organizational proximity by referring to the affiliation to the same organization of the applicant and the inventors of a patent (see Maggioni et al., 2011). Given this definition, we are not considering the case in which the applicant and the inventor are equivalent as much as the case in which they are different but located in the same region. As a result the main diagonal is as usual equal to zero. A characteristic of the applicant-inventor matrix is that it is not symmetric. In other words, the relationships originated by the applicant in region i with inventors resident in region j are different with respect to the links between applicant in region j and inventors living in region i. Since we are interested in the total number of organizational relationships between the two regions we sum up mirror cells so that the generic element oij of the organizational matrix O is defined as the total number of bilateral relationships between applicants and inventors located in the regions i and j. As for the previous types of proximity, we expect a positive influence of organizational networks in the process of knowledge creation and diffusion since it is believed to reduce uncertainty and opportunism. We have to stress that this is a not completely satisfactory measure for organizational proximity, which is quite complex to define even at the micro level. Moreover, it is quite
3 It is interesting to notice that the correlation coefficient with the contiguity matrix is much higher (0.39) signaling that strong social relationships are more likely to develop among contiguous agents.
12
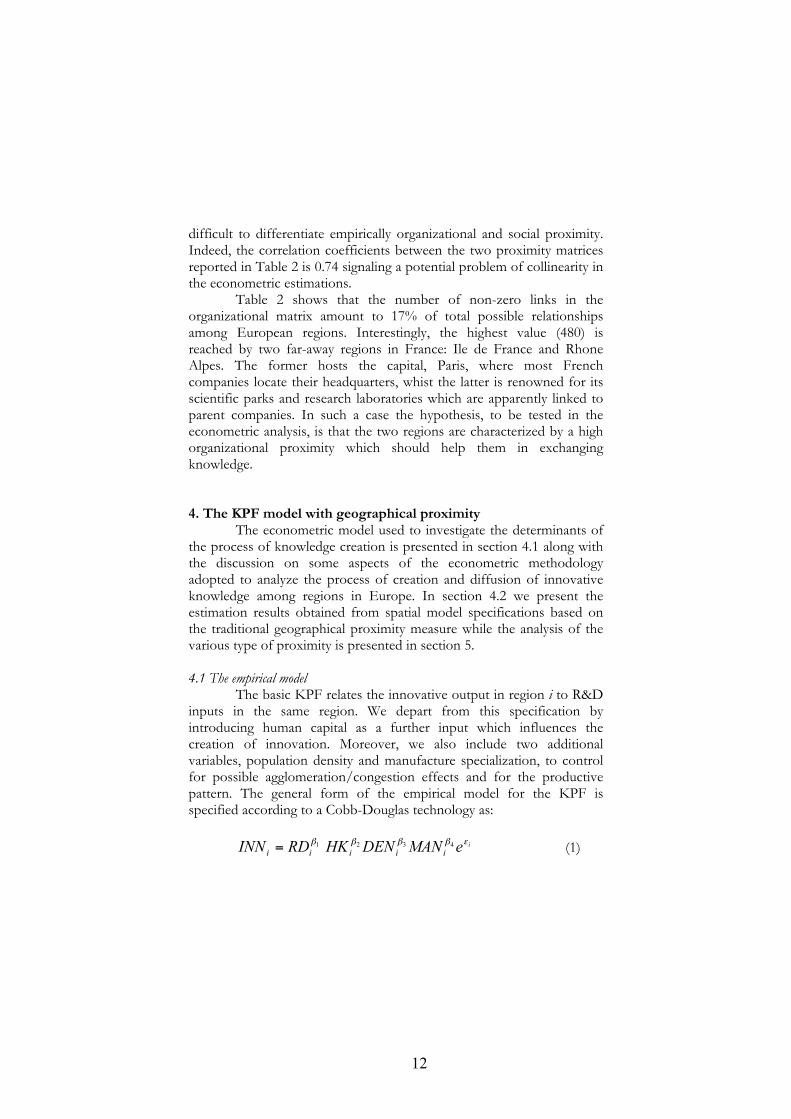
difficult to differentiate empirically organizational and social proximity. Indeed, the correlation coefficients between the two proximity matrices reported in Table 2 is 0.74 signaling a potential problem of collinearity in the econometric estimations.
Table 2 shows that the number of non-zero links in the organizational matrix amount to 17% of total possible relationships among European regions. Interestingly, the highest value (480) is reached by two far-away regions in France: Ile de France and Rhone Alpes. The former hosts the capital, Paris, where most French companies locate their headquarters, whist the latter is renowned for its scientific parks and research laboratories which are apparently linked to parent companies. In such a case the hypothesis, to be tested in the econometric analysis, is that the two regions are characterized by a high organizational proximity which should help them in exchanging knowledge.
4. The KPF model with geographical proximity The econometric model used to investigate the determinants of
the process of knowledge creation is presented in section 4.1 along with the discussion on some aspects of the econometric methodology adopted to analyze the process of creation and diffusion of innovative knowledge among regions in Europe. In section 4.2 we present the estimation results obtained from spatial model specifications based on the traditional geographical proximity measure while the analysis of the various type of proximity is presented in section 5.
4.1 The empirical model
The basic KPF relates the innovative output in region i to R&D inputs in the same region. We depart from this specification by introducing human capital as a further input which influences the creation of innovation. Moreover, we also include two additional variables, population density and manufacture specialization, to control for possible agglomeration/congestion effects and for the productive pattern. The general form of the empirical model for the KPF is specified according to a Cobb-Douglas technology as:
(1)

13
where the innovative output INN is proxied by the yearly average of patents per capita in 2005-20074, RD indicates R&D expenditures, HK human capital, DEN population density and MAN the regional share of manufacturing activities, ei is the random error term. All explanatory variables are averaged over the three-year period 2002-2004 to smooth away cycle effects and to avoid potential endogeneity problems.
Model (1) is estimated in the log-linearized form, for which we consider alternative spatial specifications to take into account the well documented spatial dependence for geo-referenced data in general, and for the knowledge diffusion process in particular (Moreno et al. 2005, LeSage et al. 2007, Parent and LeSage 2008, Autant-Bernard and LeSage, 2010). We start from the simplest specification, the Spatial Error Model (SEM), which allows only for spatial dependence in the disturbance term, and proceed with the Spatial Autoregressive model (SAR), which includes the spatial lag of the dependent variable. The Spatial Durbin Model (SDM), which includes the spatially lagged terms for both the dependent and the independent variables, should be the preferred specification (LeSage and Pace, 2009) in all cases in which there are omitted variables featuring a spatial pattern correlated with the one characterizing the included explanatory variables. In the case of KPF the omitted variables may be related to informal not directly observable inputs of the innovation production process. We also consider the alternative specification of spatial spillovers based on the SLX model, which includes spatial lags only for the explanatory variables and its variant, the Spatial Durbin error model (SDEM), which also allows for spatially correlated errors.
A part from the SEM model, all other specifications specify spatial dependence as due to the presence of spatial spillovers, as we think that knowledge spreads over territories by a diffusion process nourished by spatial externalities. Consequently, we devote limited attention to SEM models, since they remove spatial spillovers by construction, and we focus on the alternative specifications.5
4 See section 3 and Appendix 2 for a detailed description of the variables. 5 For a comprehensive description of spatial models and related specifications, estimation and testing issues refer to Le Sage and Pace (2009) and references therein. We are very grateful to J. LeSage and R. K. Pace for making publicly available the Matlab scripts used for the analysis carried out in this paper in the websites spatial-econometrics.com and spatial-statistics.com.
14
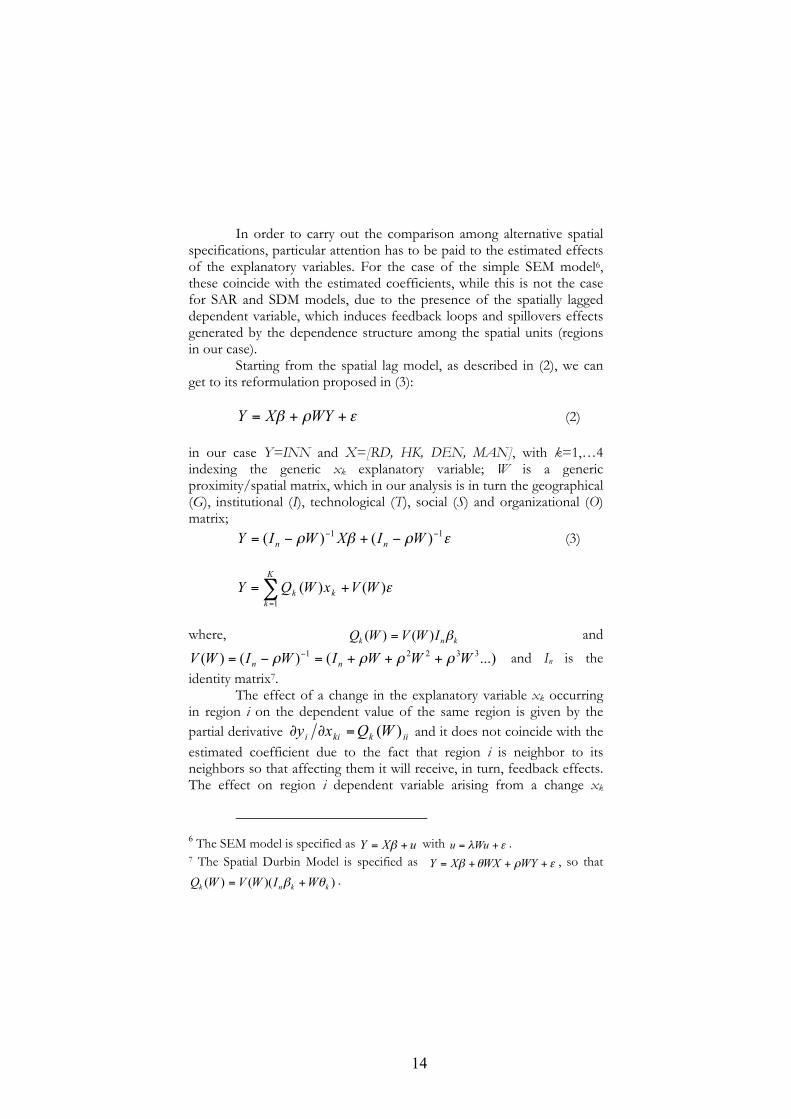
In order to carry out the comparison among alternative spatial specifications, particular attention has to be paid to the estimated effects of the explanatory variables. For the case of the simple SEM model6, these coincide with the estimated coefficients, while this is not the case for SAR and SDM models, due to the presence of the spatially lagged dependent variable, which induces feedback loops and spillovers effects generated by the dependence structure among the spatial units (regions in our case).
Starting from the spatial lag model, as described in (2), we can get to its reformulation proposed in (3):
(2)
in our case Y=INN and X=[RD, HK, DEN, MAN], with k=1,…4 indexing the generic xk explanatory variable; W is a generic proximity/spatial matrix, which in our analysis is in turn the geographical (G), institutional (I), technological (T), social (S) and organizational (O) matrix;
(3)
where, and
and In is the identity matrix7.
The effect of a change in the explanatory variable xk occurring in region i on the dependent value of the same region is given by the partial derivative and it does not coincide with the estimated coefficient due to the fact that region i is neighbor to its neighbors so that affecting them it will receive, in turn, feedback effects. The effect on region i dependent variable arising from a change xk
6 The SEM model is specified as with . 7 The Spatial Durbin Model is specified as , so that
.
15
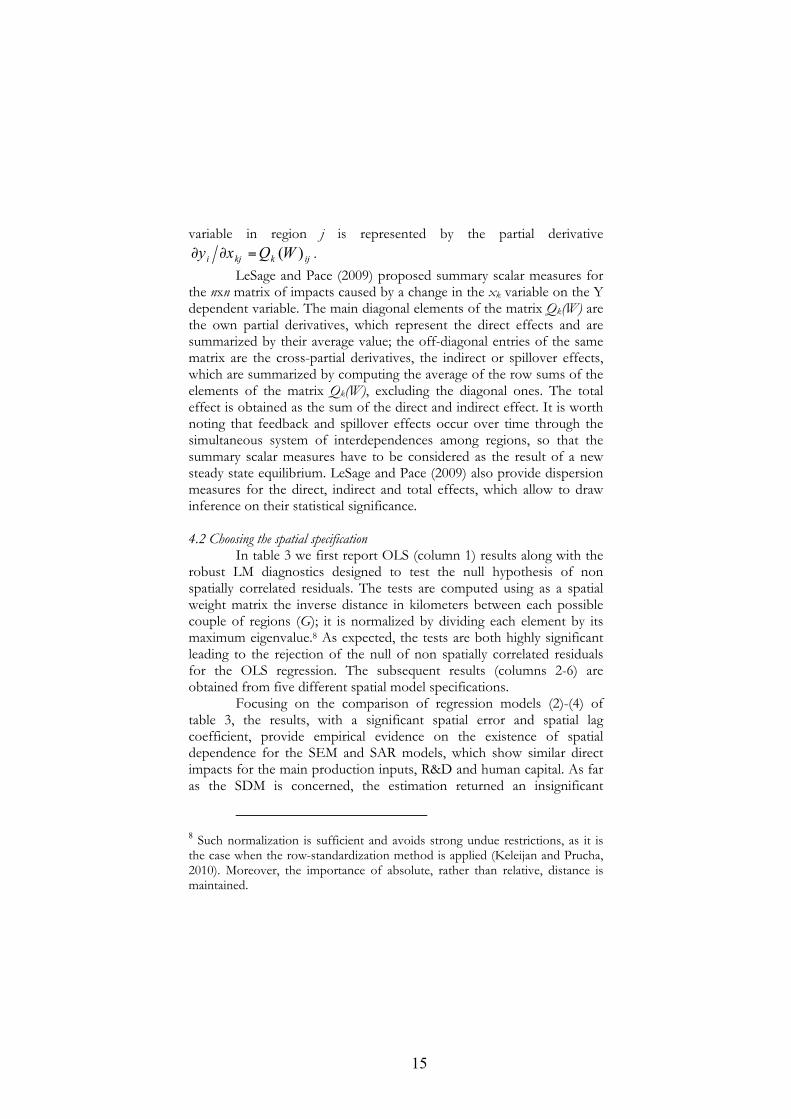
variable in region j is represented by the partial derivative .
LeSage and Pace (2009) proposed summary scalar measures for the nxn matrix of impacts caused by a change in the xk variable on the Y dependent variable. The main diagonal elements of the matrix Qk(W) are the own partial derivatives, which represent the direct effects and are summarized by their average value; the off-diagonal entries of the same matrix are the cross-partial derivatives, the indirect or spillover effects, which are summarized by computing the average of the row sums of the elements of the matrix Qk(W), excluding the diagonal ones. The total effect is obtained as the sum of the direct and indirect effect. It is worth noting that feedback and spillover effects occur over time through the simultaneous system of interdependences among regions, so that the summary scalar measures have to be considered as the result of a new steady state equilibrium. LeSage and Pace (2009) also provide dispersion measures for the direct, indirect and total effects, which allow to draw inference on their statistical significance. 4.2 Choosing the spatial specification
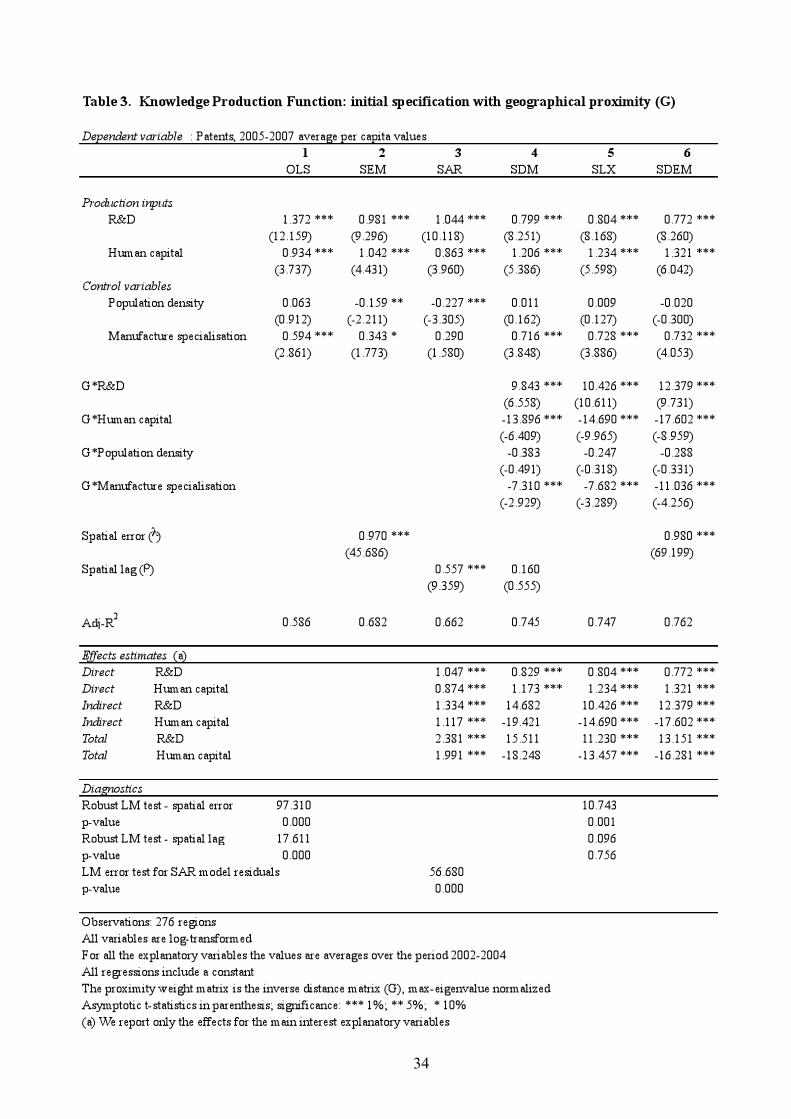
In table 3 we first report OLS (column 1) results along with the robust LM diagnostics designed to test the null hypothesis of non spatially correlated residuals. The tests are computed using as a spatial weight matrix the inverse distance in kilometers between each possible couple of regions (G); it is normalized by dividing each element by its maximum eigenvalue.8 As expected, the tests are both highly significant leading to the rejection of the null of non spatially correlated residuals for the OLS regression. The subsequent results (columns 2-6) are obtained from five different spatial model specifications.
Focusing on the comparison of regression models (2)-(4) of table 3, the results, with a significant spatial error and spatial lag coefficient, provide empirical evidence on the existence of spatial dependence for the SEM and SAR models, which show similar direct impacts for the main production inputs, R&D and human capital. As far as the SDM is concerned, the estimation returned an insignificant
8 Such normalization is sufficient and avoids strong undue restrictions, as it is the case when the row-standardization method is applied (Keleijan and Prucha, 2010). Moreover, the importance of absolute, rather than relative, distance is maintained.

16
coefficient associated with the dependent variable spatially lagged term, this in turn yields indirect and total effects that are not significant at conventional levels. This unexpected result should lead us to exclude the presence of relevant spillovers effects; however, this conclusion seems rather inappropriate for the case of the innovation production process and we argue that the SDM specification is not supported by our data. This may be due to the fact that the knowledge unobservable factors are not correlated with the included variables and they are not playing a determinant role or that the inclusion of the human capital variable - a variant of the usual KPF model - being itself spatially correlated is capturing most of the unmeasurable factors.
As a robustness check for the presence of spillovers effects we also estimate the SLX specification, which includes only the spatially lagged terms of the explanatory variables. For this model the direct effects are represented by the estimated coefficients of the non-lagged variables, while the spillover/indirect ones are given by the estimated coefficients of the spatially lagged independent regressors. For this model (column 5) the direct effects are similar to the ones provided by the SAR model, while the indirect effects are much higher in absolute terms and in the case of human capital they exhibit a counterintuitive and unexpected negative sign. This would imply that a region surrounded or close to regions with a high endowment of human capital has, ceteris paribus, a reduced innovation output. The same kind of result is obtained when we allow for spatial correlated disturbances in the (6) model specification (SDEM), which allows for spatially dependent residuals, signaled by the robust error LM test carried out for model (5) errors. The negative human capital spillover does not seem plausible on economic grounds and it is sharply at odds with previous empirical evidence provided on the mechanics of knowledge diffusion and with the results provided by the SAR model specification (3), which yield positive and significant spillover effects for both R&D and human capital. On the basis of these considerations we argue that the SAR specification is the most adequate in representing the spatial pattern featured by the knowledge production process taking place in the 276 European regions included in our sample. For the SAR model the significance of the LM test on the estimated residuals points out that the complexity of the inter-connectivity among the regions is not entirely captured by the geographical weight matrix, this provides a further rationale to investigate whether other proximity measures have a role to play in unveiling other aspects of the innovation process.
17
5. The KPF models with different proximity measures In this section we consider the various types of proximity
measures - geographical, institutional, technological, social and organizational - discussed in detail in section 3. In section 5.1 we first consider them as alternative measures by relying, temporarily, on the simplifying assumption that, in principle, they are all equally relevant proxies for capturing the closeness among regions and that their relative importance can be established only on empirical grounds. However, it is more realistic to consider proximity measures in a more complementary guise since, as emphasized in the previous sections, they capture quite different, non-overlapping aspects of interregional connections. In section 5.2 we take into consideration such a complementarity by estimating spatial models based on all possible couples of proximity matrices. 5.1 KPF models with single proximity dimensions
We start by specifying a SAR model with the weight matrix represented by the institutional proximity matrix, where the generic element Iij takes value 1 if the two regions belong to the same country and zero otherwise. With respect to the SAR model reported in table 3 (column 3), the estimated direct effects are pretty similar, while the indirect effects obtained from the Institutional SAR model (table 4, column 1) are much smaller, yielding to lower total effects as well. Note that all the estimated effects are significant. The institutional proximity among regions seems to be relevant, as pointed out by the positive and significant coefficient associated with lagged dependent variable term; however the LM test designed to detect the presence of “spatial” dependence in the residuals is highly significant.
In light of this result, we propose an alternative specification based on the inclusion of country dummies, as anticipated in section 3, since these are expected to be informative enough to capture the institutional similarity among regions. We thus proceed by re-estimating our baseline model with OLS and testing the residuals for “spatial/proximity” dependence by using the five alternative proximity measures. Being applied to the same residuals to test the same null hypothesis, the LM tests reported in the bottom panel of model (2) in table 4 cannot be interpreted formally. Nonetheless, they are useful in providing further suggestive indications on the presence of spatial
18
dependence in the OLS residuals, due to the omission of the spatially lagged dependent variable.
The LM test designed to detect the presence of spatially lagged terms is highly significant confirming that the SAR specification is the adequate one. Thus in columns 3-6 we estimate SAR models with the four different proximity measures, while controlling at the same time for the institutional factors through the inclusion of country dummies.
Specification (3) reports the results obtained from the geographical proximity matrix model. The first remarkable finding is that the coefficient of the lagged dependent variable (r=0.33) is positive and statistically significant, signaling that the innovation activity in a region is positively affected by knowledge spillovers coming from other regions.
Turning to the input variables, R&D shows an estimated direct elasticity of 0.27 and an indirect one of about in 0.15, thus direct effects account for almost two-thirds of the total effect estimated in 0.41 and the spillovers for the remaining one-third. This means that if the ratio between R&D expenditure and GDP increase by 10% from an average actual value of 1.4% to 1.56% it produces a total increase on patents (per million population) from the observed value of 105 to the new estimated value of 110.
Comparing our findings with similar studies on the European regions, we see that our direct effect is very similar to the elasticity of 0.26 estimated by Moreno et al. (2005) for 17 EU countries. While Bottazzi and Peri (2003) for a sample of patents of 86 regions in 12 European countries found a higher value of 0.8. However both studies do not consider the indirect effects coming from other regions.
As for human capital, we find a direct elasticity of 1.5, which is much higher than the one estimated for R&D. This is an important result offering further support to the idea that a high endowment of well educated labour forces in a region strongly enhances the innovative activity once we control for the R&D expenditure. In some industries the process of knowledge production is not derived by formal R&D activity but is rather the result of the capacity of human capital to produce new ideas. Moreover, we have also to consider the indirect effect of human capital which has an elasticity of 0.83; thus the total effect of human capital on innovation reach the value of 2.3. It implies that an increase of the share of graduates on population by, say, 10% (that means an increase of the average European value from 10.5% to 11.6%) has a total effect on the production of knowledge that determines an increase from 105 to 130 patents (per million population).
19
The only two comparable studies are the one by Greunz (2003) for 153 NUTS2 regions and the one by Usai (2011) for 342 regions in OECD countries, which report estimates of 2.0 and 1.0, respectively.
Another interesting comparison applies to the value of the coefficient of the lagged dependent variable, which measures the strength of spatial dependence. For the case of the geographical proximity matrix, this value goes from 0.09 for EU regions in Moreno et al. (2005) to a much higher 0.4 for the US in Carlino et al. (2007). In the middle we find the estimate suggested in Usai (2011), 0.18, which refers to both US and EU. Our estimate of 0.33 is in between the minimum and the maximum value provided so far by the existing empirical literature.
It is also worth remarking that most of the country dummies turn out to be significant, meaning that the institutional and cultural factors play a relevant role in affecting the regional innovative activity. From model (3) we have also calculated a sort of Knowledge total factor productivity, derived from the estimated coefficient of the country dummies.9 In table 5, we rank the 29 countries values in descending order: higher values indicate a better innovation performance of the regions belonging to the same country, once the role of the inputs (R&D and human capital) and other regional characteristics has already been accounted for. In general, more advanced old countries turned out to be more efficient in the production process of knowledge with respect to the new developing ones.
We now consider the results of the SAR models estimated with the other three proximity measures (column 4-6). Interestingly, the coefficients of the innovative inputs – R&D and human capital – appear all positive and significant and their magnitude is rather stable. In model (4) direct elasticities for both R&D and human capital are slightly lower than the one obtained for model (3) while the indirect ones although positive are not significant, however the total effects are both significant and greater in magnitude than the one yielded by the SAR-G model. The direct effect of R&D in models (5) and (6) is lower when compared to SAR-G and SAR-T models, it is estimated in 0.19 for the Social SAR model and nearly 0.21 for the Organizational one. Higher elasticity are found for human capital, which are comparable in magnitude with the geographical specification. Indirect effects are not significant for R&D in
9 The other specifications reported in Table 4 yielded similar results.
20
both models, while human capital spillovers are found to be positive and significant, they are estimated in 0.20 for the SAR-S model and half the size for the SAR-O model (0.12). The total effects are also positive and significant, for both models (5) and (6); for R&D they are around half the value of the corresponding effects obtained from models (3) and (4), higher total elasticities (1.74 and 1.61) are found for human capital.
Looking at the coefficients of the dependent lagged variable they are always positive and significant: there is a process of knowledge spillover across regions which is determined not only by the geographical distance but also from other proximity measures like technological, social and organizational. The strength of the spatial dependence is quite low for the case of the relational proximities (0.11 for the social and 0.07 for the organisational) while it reaches its highest value for the case of the cognitive proximity (0.49). Previous comparable studies for this last proximity measure are Greunz (2003), who reports an estimate of 0.25 and Moreno et al. (2005) with a value of 0.05. Moreover, we confirm Greunz (2003), rather than Moreno et al. (2005), since technological proximity in the former study is more important than the geographical one (estimated coefficient of 0.22).
So far we have focused on the discussion of the impacts of the knowledge production inputs, R&D and human capital; turning to the control variables, the population density and the manufacture specialization structure, it is worth reporting that for most of the estimated models the first one turns out to be not significant10, while for the second one we found a total elasticity ranging from 1.14 (SAR-O) to 1.92 (SAR-T).
Note that, according to the LM test on the estimated residuals, all SAR models (3)-(6) are able to capture the “spatial” dependence present in the data, once accounting for the institutional factors.
Due to model uncertainty it is quite a difficult task to select a preferred model among the one presented in table 4, although they provide quite interesting evidence on the role played by the knowledge productive inputs and on the relevance of different regional connectivity measures. It is the object of current research to undertake a model comparison by applying the recent approach proposed by LeSage and Pace (2009), based on the computation of posterior model probabilities
10 In place of the population density we have also used other measure of population agglomeration process such as the settlement structure typology (SST), but it also turned to be not significant.

21
or Bayes’ factors, which is particularly suitable for the case of non-nested models, as it is the case for SAR models estimated with alternative weight matrices. The posterior model probabilities can also be used to obtain - rather than a preferred model - a combined one resulting from the average of all possible alternative specifications. This route seems very promising for future research since the combined model is expected to encompass all the relevant dimensions of the complex interconnectivity linking the European regions in the production process of knowledge. 5.2 KPF models with a couple of proximity dimensions
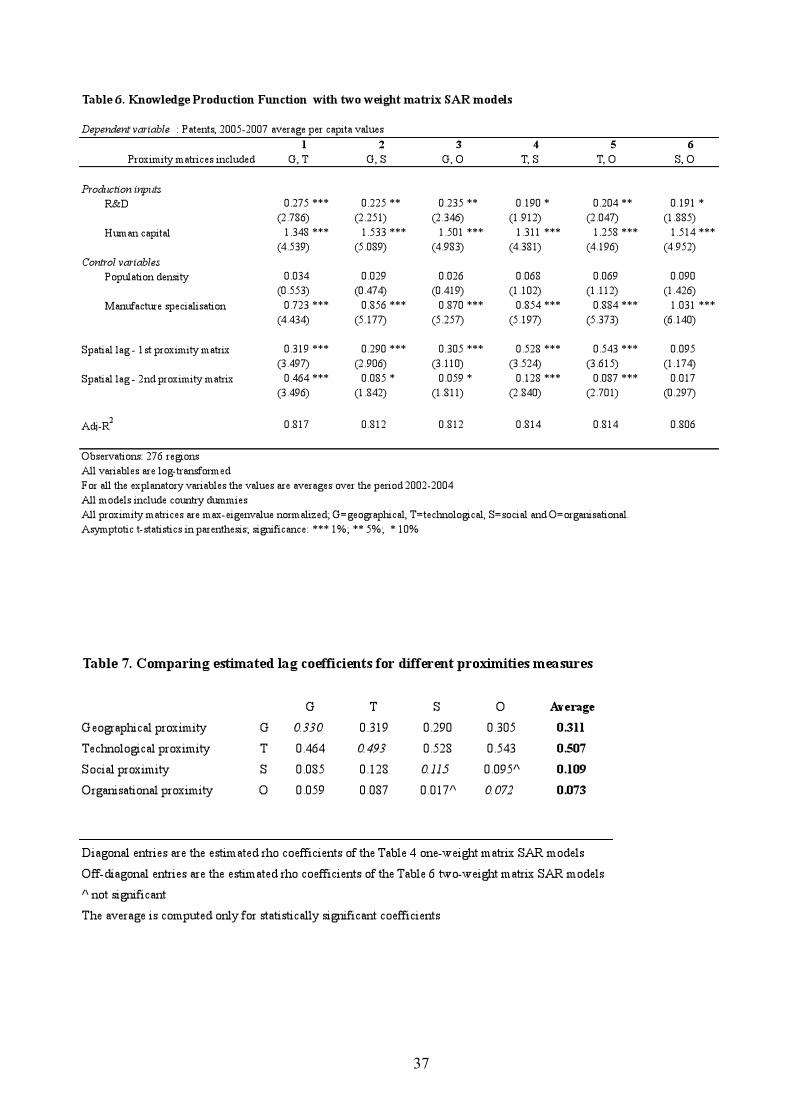
In order to check whether the results presented in the previous section for one-weight matrix models are robust to the inclusion of an additional proximity measure, in this section we present the results for the SAR models estimated by including two different proximity weight matrices at a time. This kind of models was first proposed by Lacombe (2004) to carry out a policy spending evaluation analysis while controlling for spatial dependence11. Such models are a useful estimation device when the connectivity among spatial units cannot be entirely captured by the traditional geographical measures (distance, contiguity, nearest-neighbors) since it also features other “intangible” kinds of links.12
The results for models estimated by using each possible couple of weight matrices are reported in table 6, in all models we control for institutional factors by including country dummies. In order to ease the comparison of the strength of proximity dependence the estimated coefficients of the lagged dependent variable terms are summarized in table 7. In general we find that the strength of the geographical connectivity is confirmed, for all the three models it is estimated in about 0.3 (it was 0.33 for the single weight matrix SAR model of table 4). This is also the case for the proximity measure based on technological
11 We are very grateful to D.J. Lacombe for making available to us the Matlab scripts to estimate two-weight matrix SAR models. Although ideally it would be preferable to specify a model which includes all the four proximity matrix used in this paper, the estimation codes are not readily available so that this extension is left for future research. 12 The two-weight matrix SAR model is specified as:
and it requires to solve a bivariate optimization problem over the range of feasible values for the parameters r1 and r2 . See LeSage and Pace (2009) for a detailed description of the estimation procedures.
22
similarity, which exhibits across all the models a much higher impact (average value 0.5) when compared with the geographical one.
The regional connectivity based on both the social and the organizational proximity show a weak degree of dependence, with an estimated coefficient which on average is equal to 0.11 and 0.07, respectively. It is interesting to note that when this matrices are included together (model 6 in table 6) both the coefficients of the spatially lagged terms are no longer significant, signaling a sort of multicollinearity problem. This is plausibly due to the fact that the information contained in the two matrices somehow overlaps (the correlation coefficient is estimated in 0.74). For future research we plan to represent social interactions by using the information on participation in the European research Framework Program for all the 29 countries considered in this paper, such a measure is expected to be less correlated with the organizational one.
As far as the knowledge production inputs, R&D and human capital, the results provided in the previous section on the estimated coefficients are broadly confirmed. More specifically, for R&D the highest coefficient estimates, 0.275, was found in the case of model (1), which includes the geographical and the technological weight matrices; for all the other models the estimates are lower, ranging from 0.19, for the model based on the technological and the social matrix, to 0.235 for the model including the geographical and the organizational proximity matrix. For human capital the estimated coefficient is highly significant across all models and it exhibits a lower variability with respect to R&D, ranging from 1.25 for model (5) to 1.53 for model (2).
The results presented in this section, while offering further support to the crucial role of R&D and human capital as determinants of innovation outcomes, provide novel and interesting evidence on the importance of five different proximity measures - geographical, institutional, technological, social and organizational - in capturing the complementary channels through which the creation and diffusion of knowledge take place among European regions.
6. Concluding remarks
Both economists and politicians agree that the availability of knowledge and its diffusion are crucial ingredients of growth processes at the regional level in Europe. The same agreement is shared for the idea that technological diffusion depends on the relative location of
23
regions along different dimensions, which go beyond the geographical space. Several authors, from different schools of thoughts, believe that knowledge transmission can be facilitated by the simultaneous presence of proximity and networking in social, institutional, technological and organizational “space”.
In spite of this common belief, most studies in the past have relied on the geographical proximity measure as a sort of all-encompassing connectivity measures and thus have overlooked the concurrent effects of all these types of proximities in order to understand their complementarity and/or substitutability and, therefore, to assess their relative importance. This importance can be evaluated in several context of the innovation process: knowledge generation, ideas transmission or network formation and dynamics. In this paper we focus on the first and most important phase of technological progress: the creation and production of new knowledge and therefore we move along the research line of KPF. We should remember, however, that while assessing proximities of several types we also investigate the relative strength of internal factors (that is mainly investments in R&D and human capital) in order to provide a comprehensive picture for a complex and multifaceted phenomenon.
The chosen field of analysis is the European space, which represents the most important economic system characterized by high heterogeneity at the regional and country level in innovative performance, a reflection of differences in investments in R&D and human capital. Furthermore, regions in Europe clearly feature diverse scenarios with respect to institutional, technological, organizational and social characteristics and their respective networks.
Our empirical analysis starts carrying out a careful investigation of the spatial dependence present in our data in order to select the most adequate model specification; this turned out to be the spatial autoregressive model (SAR) when compared with the spatial error and spatial Durbin alternative specifications. The SAR model permits to compute the direct and the indirect effects of the explanatory variables and thus to assess the relative importance of the internal endowments of production factors (R&D expenditure and human capital) with respect to the spatial spillover effects.
After considering the traditional geographical distance as a measure of proximity, we estimate SAR models based on the other four proximity measures (institutional, technological, social and organizational) proposed in this paper. While controlling for institutional
24
factors proxied by country dummies, we first introduce them one at a time and then, by implementing the two-weight matrix SAR model, we estimate models based on all possible couples of proximity matrices. This allows us to take into account, at least partially, the complementarity of these different connectivity matrices. We are aware that a fully comprehensive approach would entail the estimation of a multi-matrix SAR model, however this extension is left for future research as it requires to tackle some non trivial econometric aspects. Alternatively, we are also currently investigating the possibility of “averaging” in one model the evidence provided by the single-matrix SAR models, such an average model should encompass and thus account for the different complementary information embodied in each proximity matrix.
The results presented in this paper, while confirming some outcomes of the previous literature, introduce interesting novelties. As far as the internal factors are concerned, we find that both R&D and human capital are essential components for technological progress but with quite a different impact. The latter, once institutional proximity is considered, has an impact which is around six times higher than the former. This outcome is a clear indication of the importance of a skillful and qualified labour force for incremental technological progress based on continuous learning and experience accumulation.
Regarding the external factors, we ascertain that all dimensions of proximities are significantly related to innovative performance and they represent complementary channels of knowledge transmission. Nonetheless, we find that their relative influence differs significantly. Cognitive or technological proximity has an average impact, across our estimations, which is 1.7 times that of geographical proximity and at least five times higher than that of social and organizational networking. The existence of a common knowledge and productive base can be, in other words, more important than information sharing which happens at the local level thanks to spatial proximity. Moreover, we prove that the social and organizational dimensions are important too, although the size of their spatial lag is more modest. Besides, these two dimensions turn out to be not always substitute since the two proxies suffers from some overlapping.
In general, our results confirm that the complexity of the inter-connectivity among regions is not entirely captured by the geographical weight matrix and that there are other forms of proximity – institutional, technological, social - which play a decisive role in the innovation process across the European regions.

25
Finally, we find evidence that a relevant part of the total effects of R&D expenditures and human capital endowments on the knowledge creation in a certain region derives from the spillover effect coming from other regions which are interconnected in a variety of dimensions. These estimated indirect effects vary according with the proximity dimension employed, but it is crucial to consider these feedback and spillover effects which occur through the simultaneous system of interdependences among regions.
There are at least two main policy implications which can be drawn from the outcomes of the present paper. The first is the importance of policies aiming at increasing the endowments of well educated labor forces, given their strong and pervasive role in determining both the internal creation and the external diffusion and absorption of knowledge. The impact of graduates on innovation activities is much stronger than formal R&D expenditures. New ideas, inventions, product and process innovations come mainly from the inventive capacity of well educated people and thus university education must be adequately supported in Europe.
The second policy implication derives from the fact that technological proximity matter even more than the geographical one in influencing innovation spillovers. Knowledge diffusion is facilitated within a sort a-spatial technological clusters, where regions which share a common cognitive base are more likely to cooperate and exchange technology. This suggests the implementation of specific industrial policies to support the formation and the functioning throughout Europe of such a-spatial industrial clusters characterized by proximate technology.
26
References Acosta, M., Coronado, D., León, M. D. and Martínez, M. Á. (2009)
Production of University Technological Knowledge in European Regions: Evidence from Patent Data, Regional Studies, 43: 9, 1167-1181
Acs Z.J., Anselin, L. and Varga A. (2002) Patents and innovation counts as measures of regional production of new knowledge, Research Policy, 31, 1069-1085.
Anselin L., Acs Z.J., and Varga A. (1997) Local Geographic Spillovers between University Research and High Technology Innovations, Journal of Urban Economics, 42, 422-448.
Autant-Bernard C., Billand P., Frachisse D. and N. Massard (2007) Social distance versus spatial distance in R&D cooperation: Empirical evidence from European collaboration choices in micro and nanotechnologies, Papers in Regional Science 86, 495-519.
Autant-Bernard C. and J. LeSage (2010) Quantifying knowledge spillovers using spatial econometric models, Journal of Regional Science, 20, 1–26
Boschma R.A. (2005) Proximity and innovation. A critical assessment, Regional Studies 39, 61–74.
Boschma, R. and K. Frenken (2010) The spatial evolution of innovation networks. A proximity perspective, in: R. Boschma and R. Martin (eds.) The Handbook of Evolutionary Economic Geography, Cheltenham: Edward Elgar.
Bottazzi L. and Peri G. (2003) Innovation and spillovers in regions: Evidence from European patent data, European Economic Review, 47, 687-710.
Buesa M., Heijs J., Baumert T. (2010) The determinants of regional innovation in Europe: A combined factorial and regression knowledge production function approach, Research Policy 39, 722–735.
Carlino G.A., Chatterjee S. and Hunt R.M. (2007) Urban Density and the Rate of Innovation, Journal of Urban Economics, 61, 389-419.
27
Carrincazeaux C. and Coris M. (2011) Proximity and Innovation, in Cooke P, Asheim B.T. and Boschma R. (Eds), Handbook of Regional Innovation and Growth. Cheltenham: Edward Elgar.
Coe, D. T. and Helpman, E. (1995), International R&D spillovers, European Economic Review, 39, 859-887.
Cohen W. M. and Levinthal D. A. (1990) Absorptive capacity: a new perspective on learning an innovation, Administrative, Science Quarterly, 35, 128–152.
Crescenzi R., Rodriguez-Pose A. and Storper M. (2007) The territorial dynamics of innovation: a Europe–United States comparative analysis, Journal of Economic Geography, 7, 673–709.
Gertler M.S. (2003) Tacit knowledge and the economic geography of context, or The undefinable tacitness of being (there), Journal of Economic Geography, 3, 75-99.
Granovetter, M. (1985) Economic action and social structure: the problem of embeddedness. American Journal of Sociology 91, 481-510.
Greunz, L. (2003) Geographically and Technologically Mediated Knowledge Spillovers between European Regions, Annals of Regional Science, 37, 657-80.
Griliches Z. (1979) Issues in Assessing the Contribution of Research and Development to Productivity Growth, Bell Journal of Economics, 10, 92-116.
Grossman G.M and Helpman E. (1990) Trade, Innovation, and Growth, American Economic Review, 80, 86-91.
Hoekman J., Frenken K. and van Oort F. (2009) The geography of collaborative knowledge production in Europe, The Annals of Regional Science 43, 721-738.
Hollander H., Tarantola S. and Loschky A. (2009) Regional Innovation Scoreboard (RIS) 2009, ProInno Europe.
Jaffe A.B. (1986) Technological Opportunity and Spillovers of R&D: evidence from Firms’ Patents, Profits and Market Value, American Economic Review, 76, 984-1001.
28
Jaffe A.B. (1989) Real Effects of Academic Research, American Economic Review, 79, 957-70.
Kelejian H.H. and Prucha I.R. (2010) Specification and estimation of spatial autoregressive models with autoregressive and heteroskedastic disturbances, Journal of Econometrics, 157, 53-67.
Kirat T. and Lung Y. (1999) Innovation and proximity - Territories as loci of collective learning processes, European Urban and Regional Studies 6, 27-38.
Knoben J. and Oerlemans L.A.G. (2006) Proximity and inter-organizational collaboration: A literature review, International Journal of Management Reviews, 8, 71–89
Kroll H., (2009) Spillovers and Proximity in Perspective. A Network Approach to Improving the Operationalisation of Proximity, Fraunhofer Working Papers Firms and Region, No. R2/2009
Lacombe D.J. (2004) Does econometric methodology matter? An analysis of public policy using spatial econometric techniques, Geographical Analysis, 36, 105-118.
Le Sage J.P. and Pace R.K. (2009) Introduction to Spatial Econometrics. Boca Raton: CRC.
LeSage J. P., M.M. Fischer and T. Scherngell (2007) Knowledge Spillovers across Europe. Evidence from a Poisson Spatial Interaction Model with Spatial Effects, Papers in Regional Science, 86, 393-421.
Lobo J. and Strumsky D. (2008) Metropolitan patenting, inventor agglomeration and social networks: A tale of two effects, Journal of Urban Economics 63, 871-84
Maggioni M. A., Nosvelli M. And Uberti T.E. (2007) Space versus networks in the geography of innovation: A European analysis, Papers in Regional Science, 86(3), 471–493.
Maggioni M.A., Uberti T.E. and Usai S. (2011) Treating Patents as Relational Data: Knowledge Transfers and Spillovers across Italian Provinces, Industry & Innovation, 18, 39-67
Maskell P. and Malmberg A. (1999) The competitiveness of firms and regions. ‘Ubiquitification’ and the importance of localized learning, European Urban and Regional Studies 6, 9–25.
29
Miguelez E. and Moreno R. (2010) Research Networks and Inventors’ Mobility as Drivers of Innovation: Evidence from Europe, IREA Working Papers 201001, University of Barcelona.
Moreno R., R. Paci, S. Usai (2005) Spatial spillovers and innovation activity in European Regions, Environment and Planning A, 37, 1793-1812.
Nelson R.R. and Winter S.G. (1982) An Evolutionary Theory of Economic Change. Cambridge, MA: Harvard University Press
O´hUallacha´in B. and Leslie T., (2007) Rethinking the regional knowledge production function, Journal of Economic Geography, 7, 737-752
Oerlemans L., and Meeus M. (2005) Do organizational and spatial proximity impact on firm performance? Regional Studies, 39, 89–104
Parent O. and J. LeSage (2008) Using the Variance Structure of the Conditional Autoregressive Specification to Model Knowledge Spillovers, Journal of Applied Econometrics, 23, 235-256.
Ponds, R.; van Oort, F.; and Frenken, K. (2010) Innovation, spillovers and university-industry collaboration: An extended knowledge production function approach. Journal of Economic Geography 10:231–55.
Rallet A. and Torre A. (1999) Is geographical proximity necessary in the innovation networks in the era of the global economy?, GeoJournal 49, 373–380.
Sorensen O., Rivkin J.W and Fleming L. (2006) Complexity, networks and knowledge flow, Research Policy, 35, 994–1017
Tappeiner G., C. Hauser and J. Walde (2008) Regional knowledge spillovers: Fact or artifact?, in Research Policy 37, 861–874
Usai S. (2011) The Geography of Inventive Activity in OECD Regions, forthcoming Regional Studies.
30
Map 1. Patents per million population, average values 2005-2007
31
Map 2. R&D expenditure over GDP, % average 2002-2004
32
Map 3. Human capital, graduates over population, % average 2002-2004
33
34

35

36
37
38
Ultimi Contributi di Ricerca CRENoS I Paper sono disponibili in: Uhttp://www.crenos.itU
11/08 Vit t o r i o Pe l l i g ra , “Empathy , Gui l t -Avers ion and Pat terns of Rec iproc i ty”
11/07 Claud io De to t t o , Edoardo Otran to , “Cyc les in Cr ime and Economy Revised”
11/06 Juan Gabr i e l Br ida , Mar ta Me l eddu , Manue la Pu l ina , “The a t t ract iveness of a modern and contemporary ar t museum”
11/05 Juan Gabr i e l Br ida , Mar ta Me l eddu , Manue la Pu l ina , “An urban icon? The case of the Iceman Ötz i ”
11/04 Si l v ia Ba l ia , R ina ldo Brau , “A Country for Old Men? An Analys i s of the Determinants of Long-Term Home Care in Europe”
11/03 Luc iano Mauro , Fran c e s c o P i g l i a ru , “Socia l Capi ta l , Ins t i tut ions and Growth: Further Lessons f rom the I ta l i an Reg iona l Div ide”
11/02 Juan Gabriel Brida, Claudio Detotto, Manuela Pulina, “How efficient is the Italian hospitality sector? A window DEA and truncated-Tobit analysis”
11/01 Berard ino Ce s i , Dimi t r i Pao l in i , “Univers i ty choice , peer group and d is tance”
10/33 Oliv i e r o A. Carbon i , Gius epp e Medda , “A Neoclass ica l Growth Model wi th Publ ic Spending”
10/32 Vit t o r i o Pe l l i g ra , Luca S tan ca , “To Give or Not To Give? Equi ty , Eff ic iency and Al t ru is t ic Behavior in a Survey-Based Exper iment”
10/31 Emanue la Marro cu , Ra f fa e l e Pa c i , “Educat ion or jus t Creat iv i ty : what mat ters most for economic performance?”
10/30 Adr iana Di Lib e r t o , S t e f ano Usa i , TFP convergence across European reg ions : a comparat ive spat ia l dynamics ana lys i s
10/29 Oliv i e r o A. Carbon i , He t e r o g en e i t y in R&D Coope ra t i on : An Empi r i ca l Inv e s t i ga t i on
10/28 Maur iz i o Con t i , Giovann i Su l i s , “Human Capi ta l , Employment Protect ion and Growth in Europe”
10/27 Juan Gabr i e l Br ida , Manuela Pulina, Eugen ia Riaño , Sandra Zapa ta -Agu i r r e “Invest iga t ing the behavior of embark ing cru isers in a Car ibbean homeport : a factor and a censured-Tobi t ana lys i s”
10/26 Juan Gabr i e l Br ida , Manuela Pulina, Eugen ia Riaño , “Vis i tors ’ exper ience in a modern ar t museum: a s t ructura l equat ion model”
10/25 Gerardo Mar l e t t o , Cé c i l e S i l l i n g , “Distance matters – The envi ronmenta l impact of reg iona l and nat iona l supply cha ins of canned tomatoes”
10/24 Manue la Marro cu , Ra f fa e l e Pa c i , S t e f ano Usa i , “Product iv i ty Growth in the Old and New Europe : the Role of Agglomerat ion Externa l i t ies
10/23 Claud io De to t t o , Edoardo Otran to , “Cycles in Cr ime and Economy: Leading , Lagg ing and Coinc ident Behaviors”
10/22 Fede r i c o Crudu , “Z-Est imators and Auxi l i a ry Informat ion under Weak Dependence”
10/21 Franc e s c o L ipp i , Fab iano S ch i va rd i , “Corporate Contro l and Execut ive Se lect ion”
10/20 Claud io De to t t o , Val e r i o S t e rz i , “The ro le of fami ly in su ic ide ra te in I ta ly”

Finito di stampare nel mese di Dicembre 2012 Presso Copy…Right! studio grafico & stampa digitale Via Turritana 3/B – Tel. 079.200395 – Fax 079.4360444
07100 Sassari

www.crenos.it