Politecnico di Torino Porto Institutional Repository · È quindi stata effettuata un’analisi...
13
Politecnico di Torino Porto Institutional Repository [Article] Investigating the effects of bench geometry and delay times on the blast induced vibrations in an open-pit quarry Original Citation: Cardu, Marilena; Mucci, Alfonso; Uyar, Gülsev G.U. (2015). Investigating the effects of bench geometry and delay times on the blast induced vibrations in an open-pit quarry. In: GEAM. GEOINGEGNERIA AMBIENTALE E MINERARIA, vol. 52 n. 1, pp. 45-56. - ISSN 1121-9041 Availability: This version is available at : http://porto.polito.it/2620139/ since: October 2015 Publisher: Patron Terms of use: This article is made available under terms and conditions applicable to Open Access Policy Article ("Public - All rights reserved") , as described at http://porto.polito.it/terms_and_conditions. html Porto, the institutional repository of the Politecnico di Torino, is provided by the University Library and the IT-Services. The aim is to enable open access to all the world. Please share with us how this access benefits you. Your story matters. (Article begins on next page)
Transcript of Politecnico di Torino Porto Institutional Repository · È quindi stata effettuata un’analisi...

Politecnico di Torino
Porto Institutional Repository
[Article] Investigating the effects of bench geometry and delay times on theblast induced vibrations in an open-pit quarry
Original Citation:Cardu, Marilena; Mucci, Alfonso; Uyar, Gülsev G.U. (2015). Investigating the effects of benchgeometry and delay times on the blast induced vibrations in an open-pit quarry. In: GEAM.GEOINGEGNERIA AMBIENTALE E MINERARIA, vol. 52 n. 1, pp. 45-56. - ISSN 1121-9041
Availability:This version is available at : http://porto.polito.it/2620139/ since: October 2015
Publisher:Patron
Terms of use:This article is made available under terms and conditions applicable to Open Access Policy Article("Public - All rights reserved") , as described at http://porto.polito.it/terms_and_conditions.html
Porto, the institutional repository of the Politecnico di Torino, is provided by the University Libraryand the IT-Services. The aim is to enable open access to all the world. Please share with us howthis access benefits you. Your story matters.
(Article begins on next page)
Geoingegneria Ambientale e Mineraria, Anno LII, n. 1, aprile 2015, 45-56 45
The paper analyzes the results of research aimed to monitor, predict and minimize the ground vi-brations induced by blasting in an open pit limestone quarry in Italy. Data on 135 vibrations taken from 18 production blasts and 2 signature blasts were examined, including the effects of the bench orientations. Blast vibrations at the quarry were monitored for approximately three months. The blast vibration magnitudes and frequencies and their effects were analysed by both the conventional PPV concept and a software that is able to predict the vibration amplitudes of a production blast at the target sites by modelling signature blast data. The results have been rated and classifi ed considering the peak particle velocities (PPV) measured in a number of critical areas near the quarry. A compa-rative analysis between the results predicted by the software and actual blast results was carried out. The benefi ts of the software were then highlighted, proving able to predict ground vibrations induced by blasting more reliably than the conventional site laws. Finally, based on the results, some arrange-ments were provided for two bench geometries employed at the quarry site.Keywords: explosive, vibrations, peak particle velocity, charge per delay, SeisBlast.
Indagine sugli effetti della geometria di scavo e della temporizzazione sulle vibrazioni indotte in una cava a cielo aperto. La nota analizza i risultati di una ricerca avente per oggetto il monitoraggio, la previsione e la minimizzazione delle vibrazioni indotte dallo scavo con esplosivo in una cava di calcare a cielo aperto in Italia. La campagna sperimentale è consistita nell’esame di 135 dati relativi alle vibrazioni rilevate da 18 volate di produzione e da 2 segnali pilota, considerando an-che l’effetto dell’orientazione delle fornti di scavo. Il monitoraggio ha avuto durata di circa 3 mesi; l’in-tensità e la frequenza delle vibrazioni sono state analizzate sia secondo il classico approccio della PPV (velocità particellare di picco) sia mediante un software che, grazie alla modellazione dei dati ottenuti dal brillamento di un segnale pilota, è in grado di prevedere le ampiezze delle vibrazioni ottenute da volate di produzione in corrispondenza di obiettivi critici da salvaguardare. I risultati sono stati valutati e classifi cati considerando le PPV misurate in un certo numero di aree critiche in prossimità della cava. È quindi stata effettuata un’analisi comparativa fra i risultati predetti dal software e quelli effettiva-mente ottenuti dalle volate. Sono stati quindi evidenziati i vantaggi del software, dimostrandone la capacità di prevedere l’entità delle vibrazioni indotte da esplosivi in modo più affi dabile rispetto alle convenzionali leggi di sito. Infi ne, sulla base dei risultati ottenuti, sono state proposte alcune modifi che da adottare in cava in funzione dell’orientazione delle fronti di scavo.Parole chiave: esplosivo, vibrazioni, velocità particellare di picco, carica per ritardo, software SeisBlast.
Investigation sur les effets de la géométrie du banc et des temps de retard sur les vi-brations induites dans une carrière à ciel ouvert par l’abattage á l’explosif. Le document analyse les résultats d’une recherche visant à contrôler, prévoir et minimiser les vibrations induites par excavations à l'explosif dans une carrière de calcaire à ciel ouvert en Italie. Les données sur 135 vibra-tions prises à partir de 18 abattages et deux signaux pilotes ont été examinés, y compris les effets des orientations du banc. Les contrôles des vibrations à la carrière ont été suivis pendant environ trois mois. Les grandeurs et les fréquences des vibrations et leurs effets ont été analysés à la fois par le concept de PPV classique et d'un logiciel qui, grâce à la modélisation des données obtenues par la génération d'un signal pilote, est capable de prédire les amplitudes des vibrations dues aux abattages à l’explosif par rapport aux objectifs essentiels qui doivent être sauvegardés. Les résultats ont été notés et classés compte tenu des PPV mesurées dans un certain nombre de domaines critiques près de la carrière. Une analyse comparative entre les résultats prédits par le logiciel et les résultats réels des abattages a été réalisée. Les avantages du logiciel ont ensuite été mises en évidence, ce qui prouve la capacité de prédi-re les vibrations du sol de manière plus fi able que les lois de site classiques. Enfi n, sur la base des résul-tats, certains arrangements ont été fournis pour deux géométries du banc employés dans la carrière.Mots-clés: explosif, vibrations, pic de vitesse des particules, charge par retard, software SeisBlast.
Investigating the effects of
bench geometry and delay
times on the blast induced
vibrations in an open-pit
quarry
Marilena Cardu*,**
Alfonso Mucci*
Gülsev G.U. Uyar***
* Politecnico di Torino, Torino, Italy
** IGAG CNR, Torino, Italy
*** Hacettepe University Mining
Engineering Department, Ankara, Turkey
1. Introduction
Although blasting is an eco-nomical and prevailing method for rock excavation in mining as well as in civil construction works, blast-induced vibrations cannot be completely avoided, though these certainly be mini-mized to an acceptable level, to avoid damage to the surrounding environment and to construc-tions to be safeguarded.
Blast-induced ground vibrations and their mitigation have been dis-cussed for years. It is commonly as-sumed by many researchers (Du-val and Fogelson, 1962; Ambraseys and Hendron, 1968; Indian Standard Institute, 1973; Langefors and Kihl-ström, 1967) that site laws are a reliable predictor for determining the PPV. They stated that peak blast vibration always increases with increasing charge. Based on this idea, many other works were conducted (Siskind et al., 1980; Anderson et al.,1982; Dowding, 1985; Siskind et al., 1989; Ander-son, 1993; Persson et al.,1994; Mul-ler, 1997; Muller and Hohlfeld,1997; Hoshino et al.,2000; Siskind, 2000; Chen and Huang, 2001; Tripathy and Gupta, 2002; Adhikari et al., 2004; Singh and Roy, 2010) as exhaustive empirical studies, taking into ac-count frequencies, charge per delay (CPD), and distance effects of blast vibrations on structural response and damage. Blair (2004) however, stated that the traditional site laws used to predict the peak vibration levels from a blast are plagued with many prob-
GEOINGEGNERIA E ATTIVITÀ ESTRATTIVA
46 Aprile 2015
GEOINGEGNERIA E ATTIVITÀ ESTRATTIVA
lems. Aldas and Ecevitoglu (2008) have also developed a methodology, different from conventional charge weight scaling law, based on the sup-pression of surface waves by using proper delay intervals. In their meth-odology, contrary to the common assumption, vibration amplitudes can be reduced by applying suitable delays between blast-holes, with-out making any reduction in charge weights. Blair (2010) predicted that, in the near-fi eld, the blast-induced seismic transmission is completely dominated by P-Mach and S-Mach wave propagation, which depends on detonation velocity (VoD).
Blair (2014) stated that Mach waves introduce a high near-fi eld correlation of vibration within a uniform viscoelastic medium: this means that the diameter of a blast-hole being known, both near-fi eld and far-fi eld are included within a volume where the PPV is independ-ent of the charge weight, on con-dition that the charge length is ap-proximately 0.25 times greater than the blast-hole diameter. Large sets of vibration data from both under-ground and surface blasts were ana-lysed by Blair (2014). He found that
the PPV measured underground due to underground blasting is not sig-nifi cantly dependent on the charge weight, and this is consistent with the predictive models about an in-defi nitely extended viscoelastic me-dium. However, the PPV measured at the surface and due to surface blasting was found to be strongly dependent upon the charge weight due to geological infl uences such as near-surface layering. This concept may disprove the classical percep-tion of blast vibration analysis.
In addition, in the last 10 years many researchers have developed some artificial neural network (ANN) methods to predict PPV and shown their suitability over the widely used vibration predictors (Khandelwal and Singh, 2007; Ka-mali and Ataei, 2011; Mohammad-nejad et al., 2012; Ataei and Kamali, 2013; Ghasemi et al., 2013; Khan-delwal, 2012; Xue and Yang, 2013).
In the case under study, the com-pliance of PPV values with those sug-gested by the German standard DIN 4150-3 (1999) commonly adopted in Italy was evaluated, principally to avoid damage to surrounding struc-tures due to blasts. The vibration data were analysed with both the conventional CPD method and a new technique that makes it possible to identify the most suitable delay times between groups of blast-holes: the methodology aims to employ the most suitable delay times among blast-hole groupings to render de-structive interference of surface waves at the target location (where the blast-induced vibrations are to be minimized). In refl ection seismol-ogy, surface waves are suppressed in the fi eld using source/receiver pat-terns. The delay times necessary to destructively interfere with the sur-face waves are controlled by arrang-ing the distances between individual sources within the source array, and between individual receivers within the receiver array. In rock blasting, however, the delay times necessary to conveniently fragment the rocks
and to mitigate the blast-induced vi-brations are controlled by selecting appropriate delay elements.
Moreover, all the data obtained from the monitoring were analysed in order to identify the critical is-sues, such as the bench geometry, the blasting pattern and the delay times. Two site laws were found, one of them parallel to the “strike” direc-tion of the rock’s discontinuity beds (“Along the strike”) and the other perpendicular (“Across the strike”). However, especially due to the pres-ence of numerous discontinuities that characterize the rock mass un-der investigation, no meaningful correlations between the PPV and scaled distances were obtained.
Software specifi cally designed to evaluate the vibrations induced by explosives, called SeisBlast, was employed and accepted as a reliable predictor, considering a compara-tive analysis with results from actual blasts. Since two different bench ge-ometries showed different respons-es to blasts, two different blasting schemes were proposed.
2. Data acquisition
A typical production blast is made by 98 blast-holes, arranged in three rows and blasted in two groups (50/48 or 30/68 blast-holes), with a total charge of 750 kg (cartridged emulsion explosives with a density of 1.2 kg/dm3). A non-electrical sys-tem is employed to initiate the blast, using 500 ms delays at the bottom of each blast-hole, 25 ms surface shock tubes connections between the holes of the same row and 42 ms between the rows. Each blast-hole has a 7.5 kg CPD: this limit comes from the results of a previous monitoring campaign (Giraudi et al., 2009), whose aim was the evaluation of the compliance with a 5 mm/s PPV (residential buildings). Hence an exploitation design based on limited bench heights (5 m) was developed,
Tab. 1. General blast design of the quarry.Dati salienti sul piano di tiro impiegato in cava.
Bench height [m] 5.0
Drill-hole length [m] 5.3
Drill-hole diameter [mm] 76
Bench inclination [°] 80
Burden [m] 2.5
Spacing [m] 2.5
Stemming [m] 2.0
Cartridge diameter [mm] 50.00
Cartridges/hole [-] 5.5
CPD [kg] 7.63
Holes/blast[-] 98
Total charge/blast [kg] 750.00
Delay between blast-holes of the same row [ms]
25/500
Delay between rows [ms] 42
Aprile 2015 47
GEOINGEGNERIA E ATTIVITÀ ESTRATTIVA
in order to avoid diffi cult schemes of charging and timing along the same hole, whence issues could arise with the organization of the initiating sys-tem. As a consequence, to remove the same rock volume, a greater number of blast-holes and blasting caps are involved, with an increase of SD (specifi c drilling) and DC (detonator consumption).
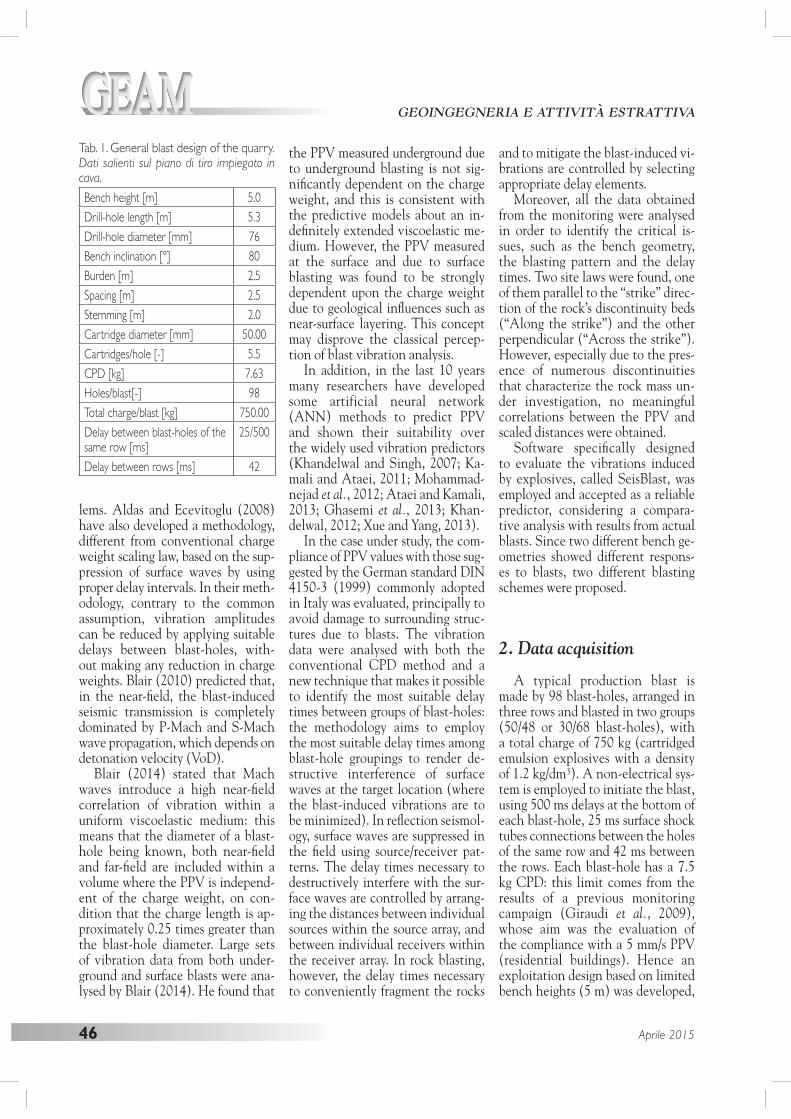
The data pertaining to the blast design are provided in Table 1. Dur-ing the experimental campaign, vi-brations were measured by means of 10 instruments (n. 3 Instantel Mini-matePlus and n. 7 Nomis MiniGraph 7000, all of them equipped with tri-axial geophones) placed at different positions (the most signifi cant are pointed out in fi g. 1). The natural frequency adopted was 1 Hz, which means that geophones were able to record signals in the range 1-250Hz, including 15-50Hz, that are the natu-ral frequencies of typical quarry blasts. All geophones were synchronized.
The following requirements were taken into account when choosing the location of the measurement stations: a) monitoring the seismic events in different directions, in order to detect the wave propaga-tion phenomena; b) monitoring the seismic events at different distanc-es, to obtain the relation between PPV and scaled distances; c) placing the instruments in continuity with the rock mass; d) choosing the lo-cations near to the structures to be preserved, following the suggested standard DIN 4150-3.
Point 1 and 2 (fi g. 1) are particu-larly important: point 1 is located in the vicinity of a residential building at a distance up to 195 m from the blasts. This point was found to be highly critical, as the results of mon-itoring produced very high PPV val-ues, exceeding the limits suggested by the standard DIN 4150-3. Point 2 is a sensitive building (a furnace from the Roman period), being lo-cated 240 m from the quarry site.
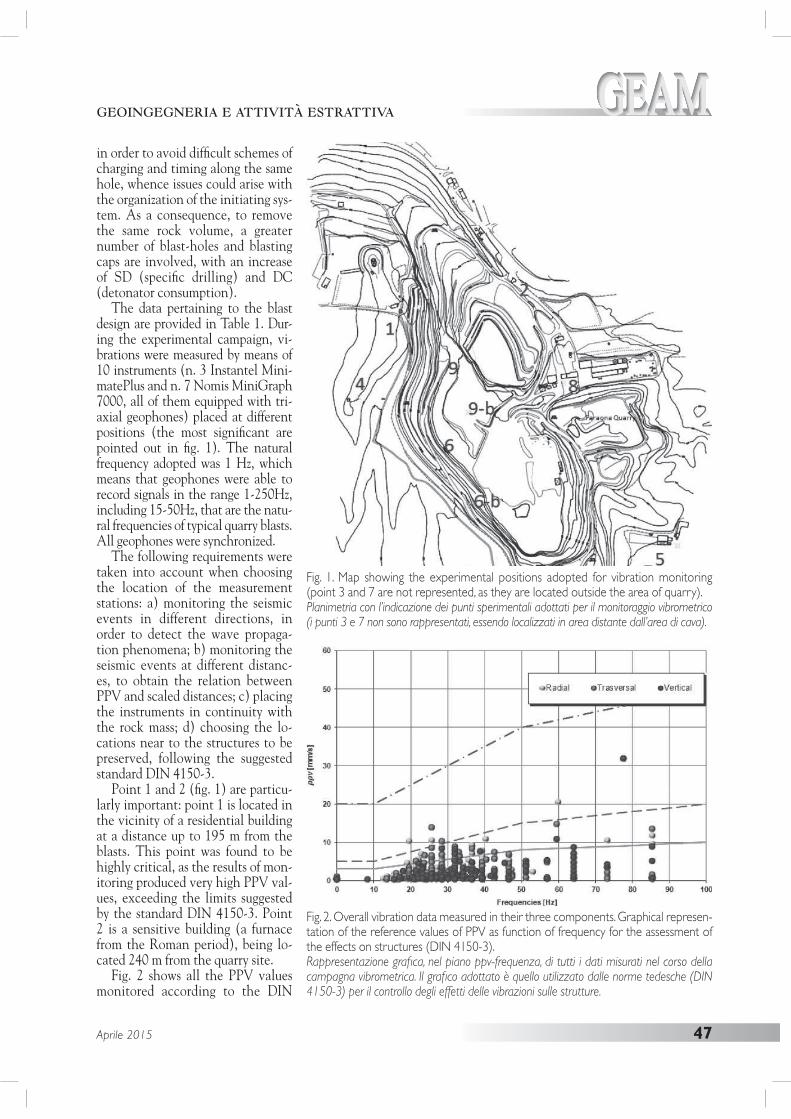
Fig. 2 shows all the PPV values monitored according to the DIN
Fig. 1. Map showing the experimental positions adopted for vibration monitoring (point 3 and 7 are not represented, as they are located outside the area of quarry).Planimetria con l’indicazione dei punti sperimentali adottati per il monitoraggio vibrometrico (i punti 3 e 7 non sono rappresentati, essendo localizzati in area distante dall’area di cava).
Fig. 2. Overall vibration data measured in their three components. Graphical represen-tation of the reference values of PPV as function of frequency for the assessment of the effects on structures (DIN 4150-3).Rappresentazione grafi ca, nel piano ppv-frequenza, di tutti i dati misurati nel corso della campagna vibrometrica. Il grafi co adottato è quello utilizzato dalle norme tedesche (DIN 4150-3) per il controllo degli effetti delle vibrazioni sulle strutture.
48 Aprile 2015
GEOINGEGNERIA E ATTIVITÀ ESTRATTIVA
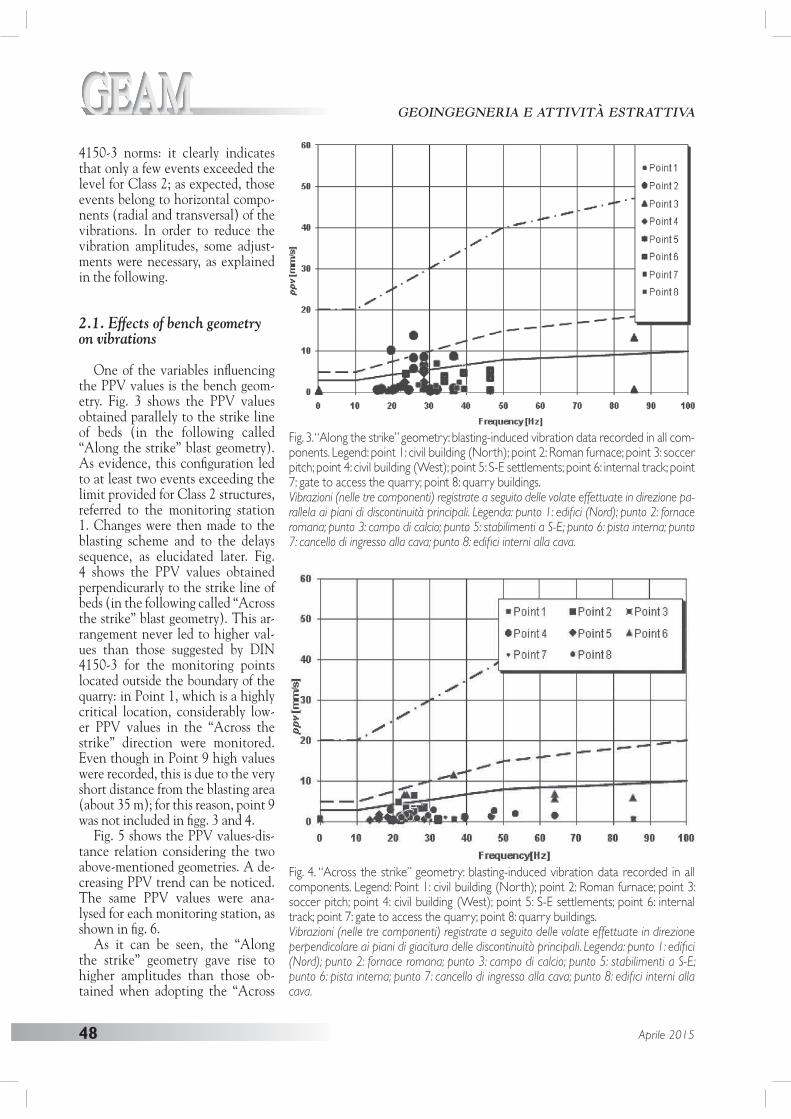
4150-3 norms: it clearly indicates that only a few events exceeded the level for Class 2; as expected, those events belong to horizontal compo-nents (radial and transversal) of the vibrations. In order to reduce the vibration amplitudes, some adjust-ments were necessary, as explained in the following.
2.1. Effects of bench geometry on vibrations
One of the variables infl uencing the PPV values is the bench geom-etry. Fig. 3 shows the PPV values obtained parallely to the strike line of beds (in the following called “Along the strike” blast geometry). As evidence, this confi guration led to at least two events exceeding the limit provided for Class 2 structures, referred to the monitoring station 1. Changes were then made to the blasting scheme and to the delays sequence, as elucidated later. Fig. 4 shows the PPV values obtained perpendicurarly to the strike line of beds (in the following called “Across the strike” blast geometry). This ar-rangement never led to higher val-ues than those suggested by DIN 4150-3 for the monitoring points located outside the boundary of the quarry: in Point 1, which is a highly critical location, considerably low-er PPV values in the “Across the strike” direction were monitored. Even though in Point 9 high values were recorded, this is due to the very short distance from the blasting area (about 35 m); for this reason, point 9 was not included in fi gg. 3 and 4.
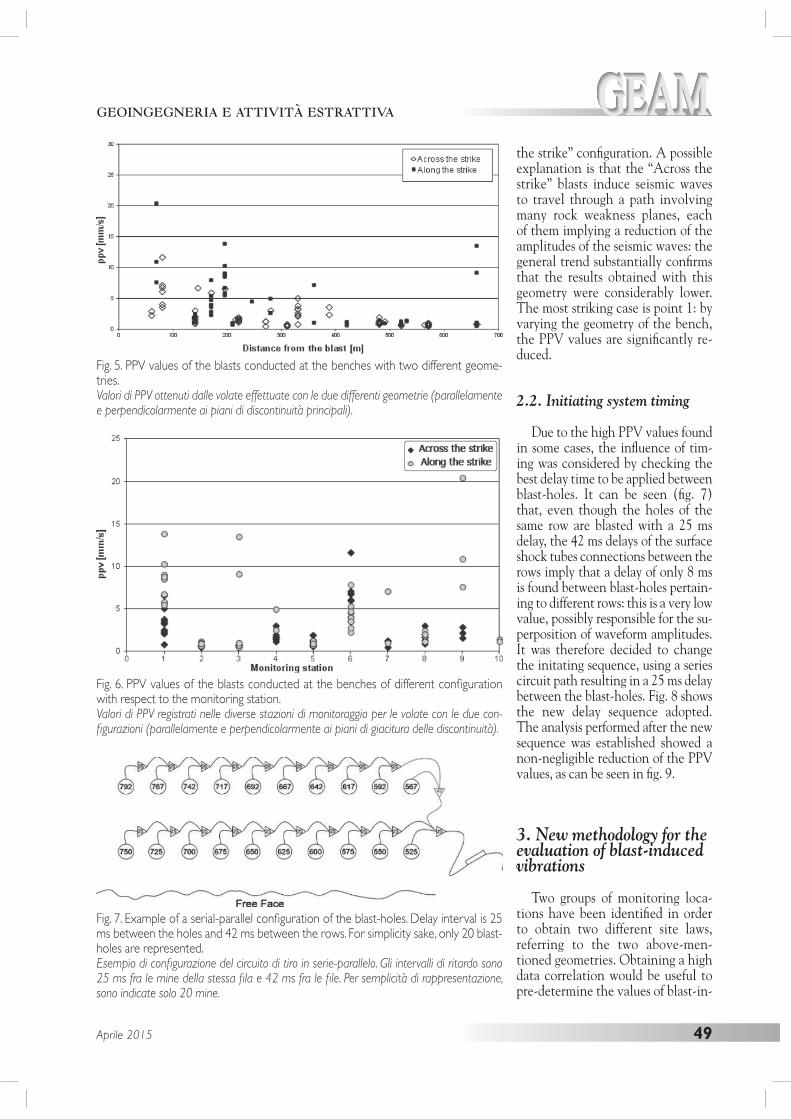
Fig. 5 shows the PPV values-dis-tance relation considering the two above-mentioned geometries. A de-creasing PPV trend can be noticed. The same PPV values were ana-lysed for each monitoring station, as shown in fi g. 6.
As it can be seen, the “Along the strike” geometry gave rise to higher amplitudes than those ob-tained when adopting the “Across
Fig. 3. “Along the strike” geometry: blasting-induced vibration data recorded in all com-ponents. Legend: point 1: civil building (North); point 2: Roman furnace; point 3: soccer pitch; point 4: civil building (West); point 5: S-E settlements; point 6: internal track; point 7: gate to access the quarry; point 8: quarry buildings.Vibrazioni (nelle tre componenti) registrate a seguito delle volate effettuate in direzione pa-rallela ai piani di discontinuità principali. Legenda: punto 1: edifi ci (Nord); punto 2: fornace romana; punto 3: campo di calcio; punto 5: stabilimenti a S-E; punto 6: pista interna; punto 7: cancello di ingresso alla cava; punto 8: edifi ci interni alla cava.
Fig. 4. “Across the strike” geometry: blasting-induced vibration data recorded in all components. Legend: Point 1: civil building (North); point 2: Roman furnace; point 3: soccer pitch; point 4: civil building (West); point 5: S-E settlements; point 6: internal track; point 7: gate to access the quarry; point 8: quarry buildings.Vibrazioni (nelle tre componenti) registrate a seguito delle volate effettuate in direzione perpendicolare ai piani di giacitura delle discontinuità principali. Legenda: punto 1: edifi ci (Nord); punto 2: fornace romana; punto 3: campo di calcio; punto 5: stabilimenti a S-E; punto 6: pista interna; punto 7: cancello di ingresso alla cava; punto 8: edifi ci interni alla cava.
Aprile 2015 49
GEOINGEGNERIA E ATTIVITÀ ESTRATTIVA
the strike” confi guration. A possible explanation is that the “Across the strike” blasts induce seismic waves to travel through a path involving many rock weakness planes, each of them implying a reduction of the amplitudes of the seismic waves: the general trend substantially confi rms that the results obtained with this geometry were considerably lower. The most striking case is point 1: by varying the geometry of the bench, the PPV values are signifi cantly re-duced.
2.2. Initiating system timing
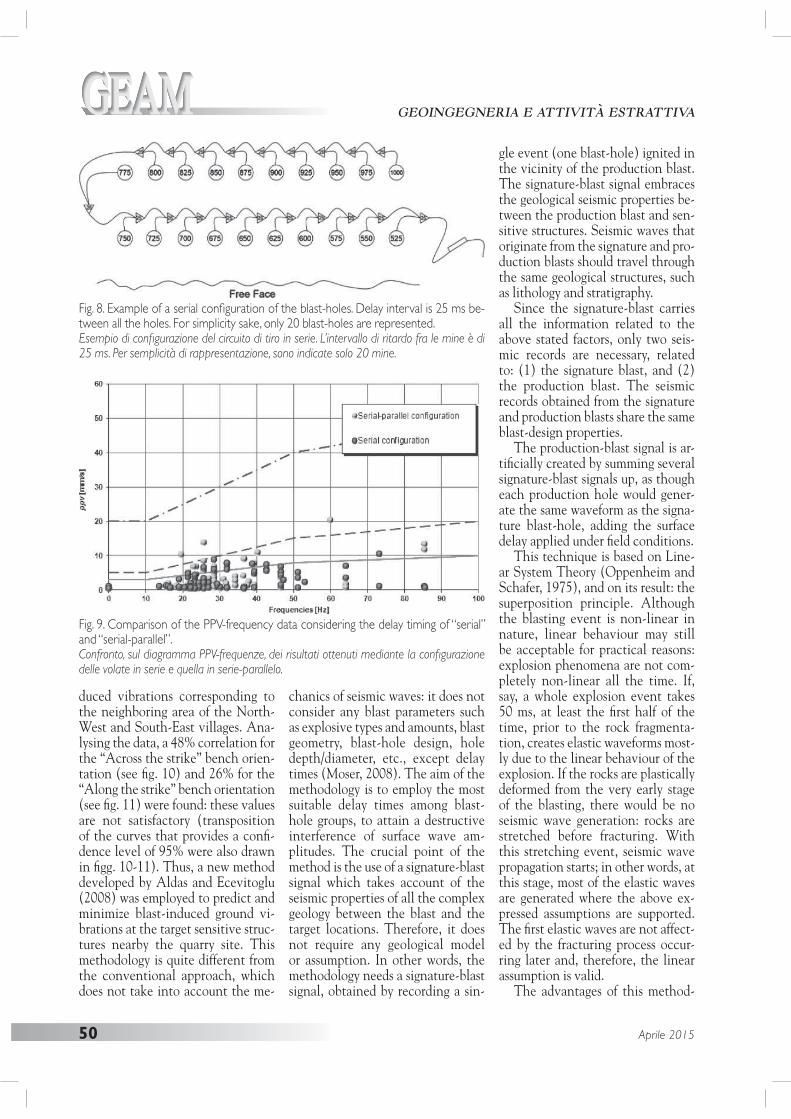
Due to the high PPV values found in some cases, the infl uence of tim-ing was considered by checking the best delay time to be applied between blast-holes. It can be seen (fi g. 7) that, even though the holes of the same row are blasted with a 25 ms delay, the 42 ms delays of the surface shock tubes connections between the rows imply that a delay of only 8 ms is found between blast-holes pertain-ing to different rows: this is a very low value, possibly responsible for the su-perposition of waveform amplitudes. It was therefore decided to change the initating sequence, using a series circuit path resulting in a 25 ms delay between the blast-holes. Fig. 8 shows the new delay sequence adopted. The analysis performed after the new sequence was established showed a non-negligible reduction of the PPV values, as can be seen in fi g. 9.
3. New methodology for the evaluation of blast-induced vibrations
Two groups of monitoring loca-tions have been identifi ed in order to obtain two different site laws, referring to the two above-men-tioned geometries. Obtaining a high data correlation would be useful to pre-determine the values of blast-in-
Fig. 5. PPV values of the blasts conducted at the benches with two different geome-tries.Valori di PPV ottenuti dalle volate effettuate con le due differenti geometrie (parallelamente e perpendicolarmente ai piani di discontinuità principali).
Fig. 7. Example of a serial-parallel confi guration of the blast-holes. Delay interval is 25 ms between the holes and 42 ms between the rows. For simplicity sake, only 20 blast-holes are represented.Esempio di confi gurazione del circuito di tiro in serie-parallelo. Gli intervalli di ritardo sono 25 ms fra le mine della stessa fi la e 42 ms fra le fi le. Per semplicità di rappresentazione, sono indicate solo 20 mine.
Fig. 6. PPV values of the blasts conducted at the benches of different confi guration with respect to the monitoring station.Valori di PPV registrati nelle diverse stazioni di monitoraggio per le volate con le due con-fi gurazioni (parallelamente e perpendicolarmente ai piani di giacitura delle discontinuità).
50 Aprile 2015
GEOINGEGNERIA E ATTIVITÀ ESTRATTIVA
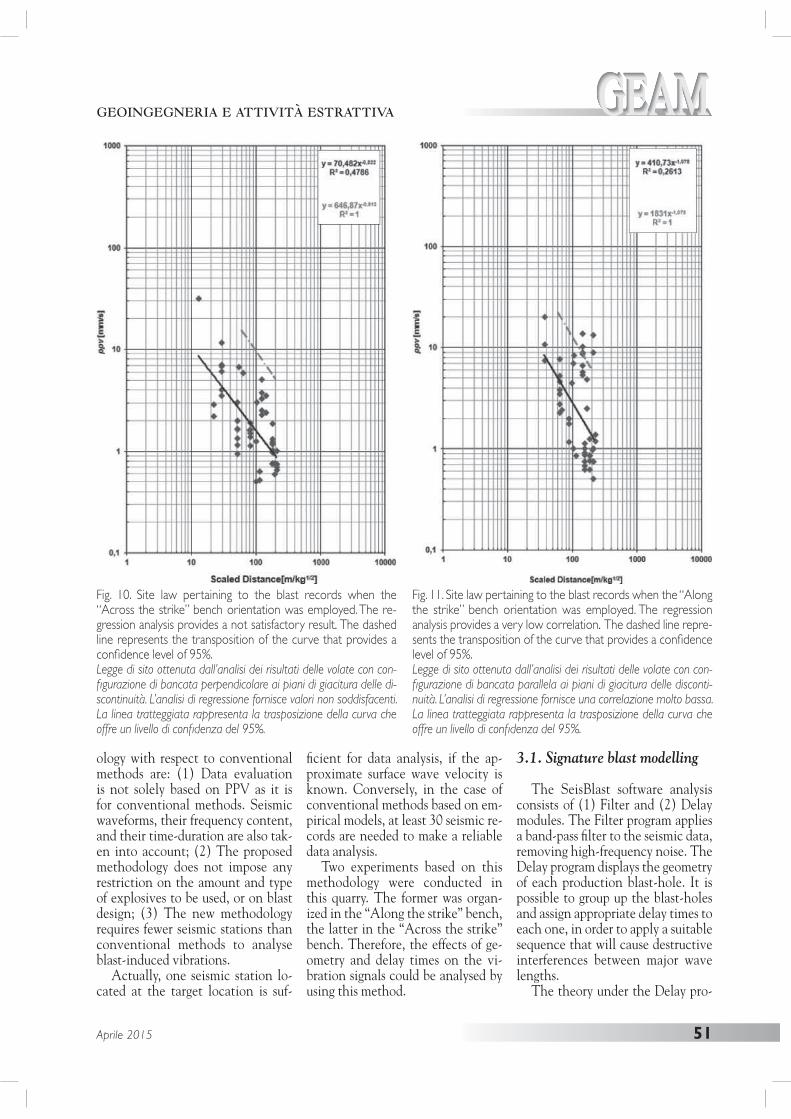
duced vibrations corresponding to the neighboring area of the North-West and South-East villages. Ana-lysing the data, a 48% correlation for the “Across the strike” bench orien-tation (see fi g. 10) and 26% for the “Along the strike” bench orientation (see fi g. 11) were found: these values are not satisfactory (transposition of the curves that provides a confi -dence level of 95% were also drawn in fi gg. 10-11). Thus, a new method developed by Aldas and Ecevitoglu (2008) was employed to predict and minimize blast-induced ground vi-brations at the target sensitive struc-tures nearby the quarry site. This methodology is quite different from the conventional approach, which does not take into account the me-
chanics of seismic waves: it does not consider any blast parameters such as explosive types and amounts, blast geometry, blast-hole design, hole depth/diameter, etc., except delay times (Moser, 2008). The aim of the methodology is to employ the most suitable delay times among blast-hole groups, to attain a destructive interference of surface wave am-plitudes. The crucial point of the method is the use of a signature-blast signal which takes account of the seismic properties of all the complex geology between the blast and the target locations. Therefore, it does not require any geological model or assumption. In other words, the methodology needs a signature-blast signal, obtained by recording a sin-
gle event (one blast-hole) ignited in the vicinity of the production blast. The signature-blast signal embraces the geological seismic properties be-tween the production blast and sen-sitive structures. Seismic waves that originate from the signature and pro-duction blasts should travel through the same geological structures, such as lithology and stratigraphy.
Since the signature-blast carries all the information related to the above stated factors, only two seis-mic records are necessary, related to: (1) the signature blast, and (2) the production blast. The seismic records obtained from the signature and production blasts share the same blast-design properties.
The production-blast signal is ar-tifi cially created by summing several signature-blast signals up, as though each production hole would gener-ate the same waveform as the signa-ture blast-hole, adding the surface delay applied under fi eld conditions.
This technique is based on Line-ar System Theory (Oppenheim and Schafer, 1975), and on its result: the superposition principle. Although the blasting event is non-linear in nature, linear behaviour may still be acceptable for practical reasons: explosion phenomena are not com-pletely non-linear all the time. If, say, a whole explosion event takes 50 ms, at least the fi rst half of the time, prior to the rock fragmenta-tion, creates elastic waveforms most-ly due to the linear behaviour of the explosion. If the rocks are plastically deformed from the very early stage of the blasting, there would be no seismic wave generation: rocks are stretched before fracturing. With this stretching event, seismic wave propagation starts; in other words, at this stage, most of the elastic waves are generated where the above ex-pressed assumptions are supported. The fi rst elastic waves are not affect-ed by the fracturing process occur-ring later and, therefore, the linear assumption is valid.
The advantages of this method-
Fig. 8. Example of a serial confi guration of the blast-holes. Delay interval is 25 ms be-tween all the holes. For simplicity sake, only 20 blast-holes are represented.Esempio di confi gurazione del circuito di tiro in serie. L’intervallo di ritardo fra le mine è di 25 ms. Per semplicità di rappresentazione, sono indicate solo 20 mine.
Fig. 9. Comparison of the PPV-frequency data considering the delay timing of “serial” and “serial-parallel”.Confronto, sul diagramma PPV-frequenze, dei risultati ottenuti mediante la confi gurazione delle volate in serie e quella in serie-parallelo.
Aprile 2015 51
GEOINGEGNERIA E ATTIVITÀ ESTRATTIVA
ology with respect to conventional methods are: (1) Data evaluation is not solely based on PPV as it is for conventional methods. Seismic waveforms, their frequency content, and their time-duration are also tak-en into account; (2) The proposed methodology does not impose any restriction on the amount and type of explosives to be used, or on blast design; (3) The new methodology requires fewer seismic stations than conventional methods to analyse blast-induced vibrations.
Actually, one seismic station lo-cated at the target location is suf-
fi cient for data analysis, if the ap-proximate surface wave velocity is known. Conversely, in the case of conventional methods based on em-pirical models, at least 30 seismic re-cords are needed to make a reliable data analysis.
Two experiments based on this methodology were conducted in this quarry. The former was organ-ized in the “Along the strike” bench, the latter in the “Across the strike” bench. Therefore, the effects of ge-ometry and delay times on the vi-bration signals could be analysed by using this method.
3.1. Signature blast modelling
The SeisBlast software analysis consists of (1) Filter and (2) Delay modules. The Filter program applies a band-pass fi lter to the seismic data, removing high-frequency noise. The Delay program displays the geometry of each production blast-hole. It is possible to group up the blast-holes and assign appropriate delay times to each one, in order to apply a suitable sequence that will cause destructive interferences between major wave lengths.
The theory under the Delay pro-
Fig. 10. Site law pertaining to the blast records when the “Across the strike” bench orientation was employed. The re-gression analysis provides a not satisfactory result. The dashed line represents the transposition of the curve that provides a confi dence level of 95%.Legge di sito ottenuta dall’analisi dei risultati delle volate con con-fi gurazione di bancata perpendicolare ai piani di giacitura delle di-scontinuità. L’analisi di regressione fornisce valori non soddisfacenti. La linea tratteggiata rappresenta la trasposizione della curva che offre un livello di confi denza del 95%.
Fig. 11. Site law pertaining to the blast records when the “Along the strike” bench orientation was employed. The regression analysis provides a very low correlation. The dashed line repre-sents the transposition of the curve that provides a confi dence level of 95%.Legge di sito ottenuta dall’analisi dei risultati delle vol ate con con-fi gurazione di bancata parallela ai piani di giacitura delle disconti-nuità. L’analisi di regressione fornisce una correlazione molto bassa. La linea tratteggiata rappresenta la trasposizione della curva che offre un livello di confi denza del 95%.
52 Aprile 2015
GEOINGEGNERIA E ATTIVITÀ ESTRATTIVA
gram is based on the Linear Super-position Principle. After recording the signature-blast signal, the seis-mic signals of each blast-hole in the production-blast are simulated as if they were the same as the signature blast signal. The assumption made is that the linear superposition of each blast-hole signal, which is actually the signature blast signal, represents the group blast signal. Using the De-lay program, it is possible to modify the delay times among blast-holes, applying suitable lags to produce de-structive interferences between ma-jor wave lengths.
As is well known, the prime ob-jective of mining is to properly frag-ment the rock. Therefore, when designing the blast with the aim of minimizing the vibration prob-lem, it is also important to consider the rock’s proper fragmentation to comply with the mining purposes. According to Aldas & Ecevitoglu (2008), most of the effects on con-structions are caused by lateral com-pounds of vibration (transversal and longitudinal). Therefore the Delay program works on the lateral compo-nent, presenting higher amplitudes. Proper delay times are applied to this
selected component. Practice shows a substantial minimization of vibra-tion occurring in the other compo-nents as well.
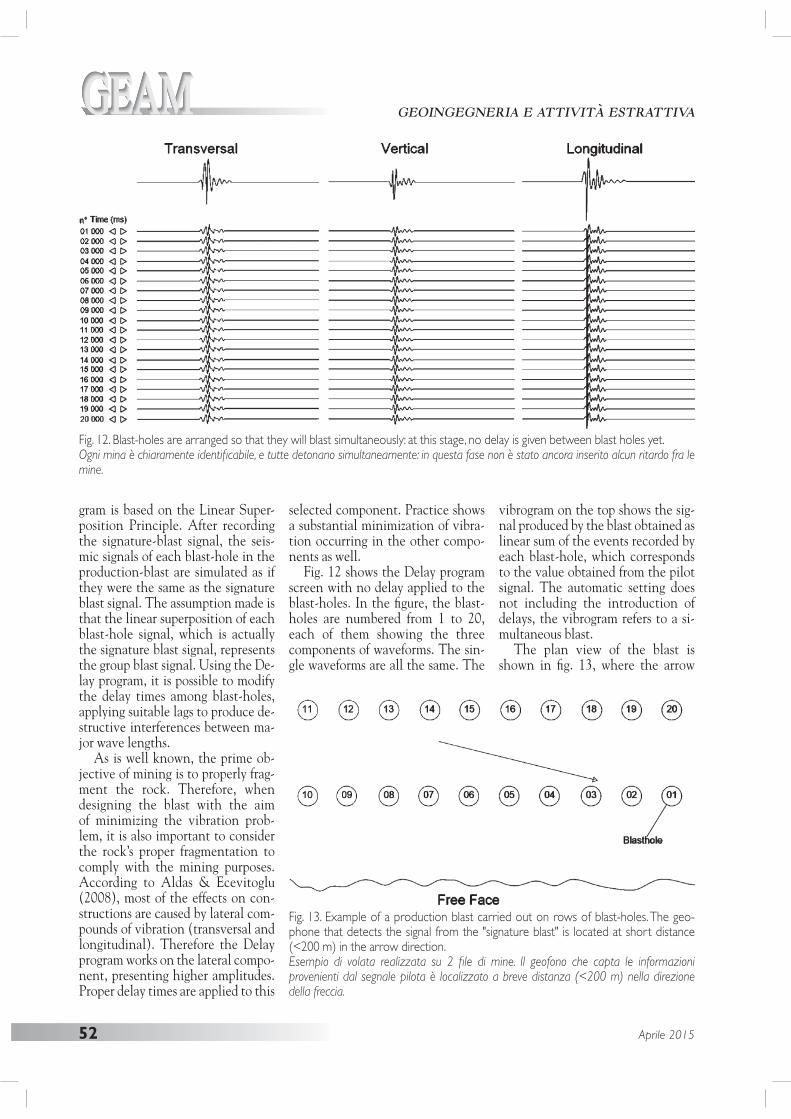
Fig. 12 shows the Delay program screen with no delay applied to the blast-holes. In the fi gure, the blast-holes are numbered from 1 to 20, each of them showing the three components of waveforms. The sin-gle waveforms are all the same. The
vibrogram on the top shows the sig-nal produced by the blast obtained as linear sum of the events recorded by each blast-hole, which corresponds to the value obtained from the pilot signal. The automatic setting does not including the introduction of delays, the vibrogram refers to a si-multaneous blast.
The plan view of the blast is shown in fi g. 13, where the arrow
Fig. 13. Example of a production blast carried out on rows of blast-holes. The geo-phone that detects the signal from the "signature blast" is located at short distance (<200 m) in the arrow direction.Esempio di volata realizzata su 2 fi le di mine. Il geofono che capta le informazioni provenienti dal segnale pilota è localizzato a breve distanza (<200 m) nella direzione della freccia.
Fig. 12. Blast-holes are arranged so that they will blast simultaneously: at this stage, no delay is given between blast holes yet.Ogni mina è chiaramente identifi cabile, e tutte detonano simultaneamente: in questa fase non è stato ancora inserito alcun ritardo fra le mine.
Aprile 2015 53
GEOINGEGNERIA E ATTIVITÀ ESTRATTIVA
shows the direction of the measure-ment location.
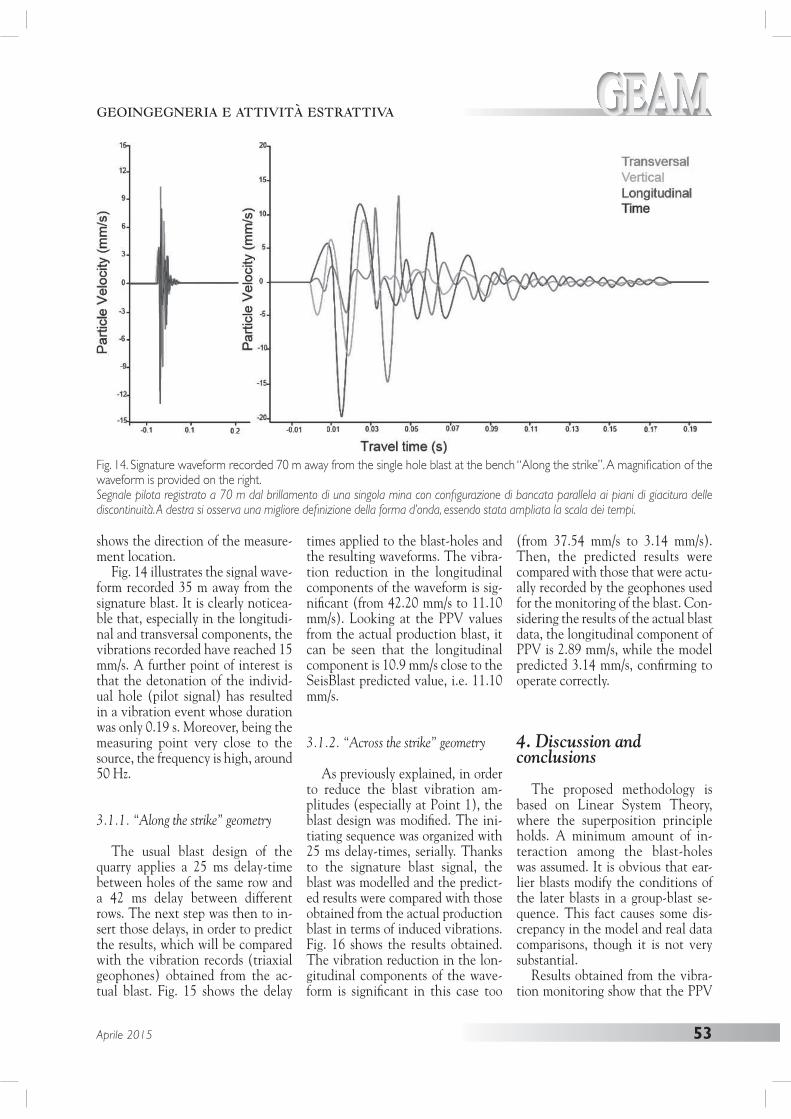
Fig. 14 illustrates the signal wave-form recorded 35 m away from the signature blast. It is clearly noticea-ble that, especially in the longitudi-nal and transversal components, the vibrations recorded have reached 15 mm/s. A further point of interest is that the detonation of the individ-ual hole (pilot signal) has resulted in a vibration event whose duration was only 0.19 s. Moreover, being the measuring point very close to the source, the frequency is high, around 50 Hz.
3.1.1. “Along the strike” geometry
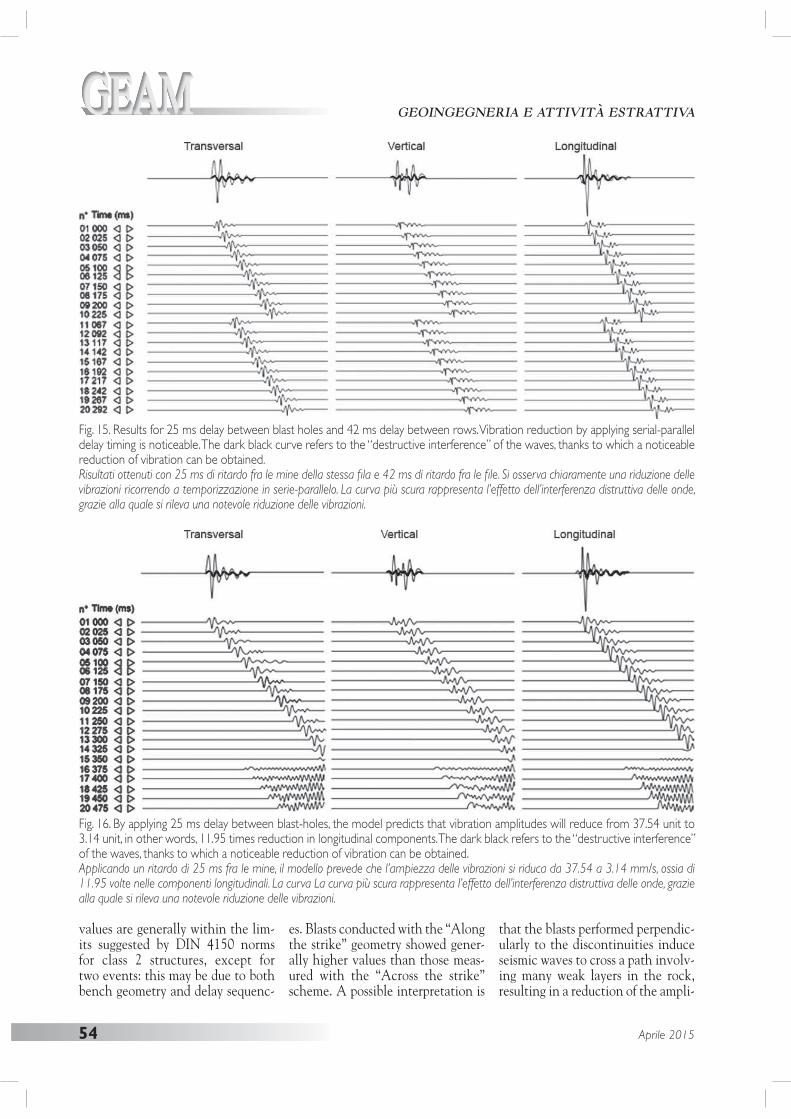
The usual blast design of the quarry applies a 25 ms delay-time between holes of the same row and a 42 ms delay between different rows. The next step was then to in-sert those delays, in order to predict the results, which will be compared with the vibration records (triaxial geophones) obtained from the ac-tual blast. Fig. 15 shows the delay
times applied to the blast-holes and the resulting waveforms. The vibra-tion reduction in the longitudinal components of the waveform is sig-nifi cant (from 42.20 mm/s to 11.10 mm/s). Looking at the PPV values from the actual production blast, it can be seen that the longitudinal component is 10.9 mm/s close to the SeisBlast predicted value, i.e. 11.10 mm/s.
3.1.2. “Across the strike” geometry
As previously explained, in order to reduce the blast vibration am-plitudes (especially at Point 1), the blast design was modifi ed. The ini-tiating sequence was organized with 25 ms delay-times, serially. Thanks to the signature blast signal, the blast was modelled and the predict-ed results were compared with those obtained from the actual production blast in terms of induced vibrations. Fig. 16 shows the results obtained. The vibration reduction in the lon-gitudinal components of the wave-form is signifi cant in this case too
(from 37.54 mm/s to 3.14 mm/s). Then, the predicted results were compared with those that were actu-ally recorded by the geophones used for the monitoring of the blast. Con-sidering the results of the actual blast data, the longitudinal component of PPV is 2.89 mm/s, while the model predicted 3.14 mm/s, confi rming to operate correctly.
4. Discussion and conclusions
The proposed methodology is based on Linear System Theory, where the superposition principle holds. A minimum amount of in-teraction among the blast-holes was assumed. It is obvious that ear-lier blasts modify the conditions of the later blasts in a group-blast se-quence. This fact causes some dis-crepancy in the model and real data comparisons, though it is not very substantial.
Results obtained from the vibra-tion monitoring show that the PPV
Fig. 14. Signature waveform recorded 70 m away from the single hole blast at the bench “Along the strike”. A magnifi cation of the waveform is provided on the right.Segnale pilota registrato a 70 m dal brillamento di una singola mina con confi gurazione di bancata parallela ai piani di giacitura delle discontinuità. A destra si osserva una migliore defi nizione della forma d’onda, essendo stata ampliata la scala dei tempi.
54 Aprile 2015
GEOINGEGNERIA E ATTIVITÀ ESTRATTIVA
values are generally within the lim-its suggested by DIN 4150 norms for class 2 structures, except for two events: this may be due to both bench geometry and delay sequenc-
es. Blasts conducted with the “Along the strike” geometry showed gener-ally higher values than those meas-ured with the “Across the strike” scheme. A possible interpretation is
that the blasts performed perpendic-ularly to the discontinuities induce seismic waves to cross a path involv-ing many weak layers in the rock, resulting in a reduction of the ampli-
Fig. 15. Results for 25 ms delay between blast holes and 42 ms delay between rows. Vibration reduction by applying serial-parallel delay timing is noticeable. The dark black curve refers to the “destructive interference” of the waves, thanks to which a noticeable reduction of vibration can be obtained.Risultati ottenuti con 25 ms di ritardo fra le mine della stessa fi la e 42 ms di ritardo fra le fi le. Si osserva chiaramente una riduzione delle vibrazioni ricorrendo a temporizzazione in serie-parallelo. La curva più scura rappresenta l’effetto dell’interferenza distruttiva delle onde, grazie alla quale si rileva una notevole riduzione delle vibrazioni.
Fig. 16. By applying 25 ms delay between blast-holes, the model predicts that vibration amplitudes will reduce from 37.54 unit to 3.14 unit, in other words, 11.95 times reduction in longitudinal components. The dark black refers to the “destructive interference” of the waves, thanks to which a noticeable reduction of vibration can be obtained.Applicando un ritardo di 25 ms fra le mine, il modello prevede che l’ampiezza delle vibrazioni si riduca da 37.54 a 3.14 mm/s, ossia di 11.95 volte nelle componenti longitudinali. La curva La curva più scura rappresenta l’effetto dell’interferenza distruttiva delle onde, grazie alla quale si rileva una notevole riduzione delle vibrazioni.

Aprile 2015 55
GEOINGEGNERIA E ATTIVITÀ ESTRATTIVA
tudes of the seismic waves.As for the analysis of the delay
blasting sequence, all the surface shock tubes connections (25 ms delay caps) were organized in series instead of series-parallel. This led to a signifi cant reduction of vibration amplitudes.
Approval of the delay sequence was also assessed by means of the SeisBlast software. Two signature blasts were performed. The fi rst test refers to blasts organized with the “Along the strike” geometry. The model prediction (11.95 mm/s) and production-blast results (10.9 mm/s) matched properly. Other tri-al tests were performed grouping the blast-holes differently (i.e., grouping blast-holes in pairs) but no reduc-tion of vibration was noticed.
The second test refers to blasts or-ganized with the “Across the strike” geometry. In order to reduce the blast vibration amplitudes especial-ly in critical areas, the blast delay sequence was changed. Blast-holes were delayed by 25 ms, serially. The longitudinal component of real PPV was 2.89 mm/s. Then, the 3.14 mm/s value predicted by the model is defi -nitely comparable.
Another interesting conclusion was inferred by setting the simulta-neous blasting of two blast-holes in the group: the software in this case predicted an extremely large reduc-tion of vibrations: indeed, the lon-gitudinal component of the PPV reduced from 30.29 to 0.91 mm/s (with a ratio of 33.28). This implies that, although increasing CPD, by adopting a value double than the usual, the PPV could be considera-bly reduced.
This approach certainly involves the need for further testing, to com-pare more reliably the results ob-tained from the numerical analysis with the real ones. In any case, it has to be pointed out that the CPD currently employed at the quarry is the result of a great number of pre-vious tests for the evaluation of an appropriate site law. Therefore, the
new CPD proposed by the results ob-tained should be tested in the quarry.
The method here presented, not based on extrapolations of data ob-tained from the PPV-Scaled Dis-tance graphs but on concrete analy-sis of the waveform obtained from a signature blast signal representative of the medium, although requiring further investigation, represents an attractive alternative approach for the evaluation of induced PPVs.
If these assumptions were verifi ed, it would be possible to adopt inter-esting changes to the blasts geome-try, by increasing the CPD without impairments to sensitive construc-tions.
References
Adhikari, G.R., Theresraj, A.I., Venka-tesh, S., Balachander, R., Gupta, R.N., 2004. Ground vibration due to blasting in limestone quarri-es. FRAGBLAST – International Journal of Blasting and Fragmenta-tion, 8(2), pp. 85-94.
Aldas, G.U., Ecevitoglu B., 2008. Wa-veform analysis in mitigation of blast-induced vibrations. Journal of Applied Geophysics, 66, pp. 25-30.
Ambraseys N.R., Hendron AJ, 1968. Dynamic behaviour of rock masses. Rock Mechanics in Engineering Practices. London: Wiley, pp. 203-7.
Anderson, DA, Winzer, S.R. and Ritter, A.P., 1982. Blast design for optimi-zing fragmentation while controlling frequency of ground vibration. Pro-ceedings of the 8th Conference on Explosives and Blasting Techni-que, New Orleans, pp. 69-89.
Anderson, D.A., 1993. Blast Moni-toring: Regulations, Methods and Control Techniques. Comprehensi-ve Rock Engineering (4) Hudson JA, editor, Pergamon Press, pp. 95-110.
Ataei, M., Kamali, M., 2013. Prediction of blast-induced vibration by adap-tive neuro-fuzzy inference system
in Karoun 3 power plant and dam. Journal of Vibration and Control, 19(12), pp. 1906-1914.
Blair, D.P., 2004. Charge weight scaling laws and the superposition of blast vibration waves. Fragblast, 8(4), pp. 221-239.
Blair, D.P., 2010. Seismic radiation from an explosive column. Geophysics, 75(1), pp. E55-E65.
Blair, D.P., 2014. Blast vibration depen-dence on charge length, velocity of detonation and layered media. In-ternational Journal of Rock Me-chanics and Mining Sciences, 65, pp. 29-39.
Chen, G., Huang, S., 2001. Analysis of ground vibrations caused by open pit production blasts: A case study. FRAGBLAST, 5(1), pp. 91-107.
DIN 4150-3, 1999. Structural vibra-tion-Effects of vibration on structu-res. http://webstore.ansi.org/.
Dowding, C.H., 1985. Blast Vibration Monitoring and Control. Englewood Cliffs, NJ: Prentice Hall.
Duvall, W.I., Fogleson DE, 1962. Re-view of criteria for estimating dama-ge to residences from blasting vibra-tion. USBM-I, 5968.
Ghasemi, E., Ataei, M., Hashemol-hosseini, H., 2013. Development of a fuzzy model for predicting ground vibration caused by rock blasting in surface mining. Journal of Vibra-tion and Control, 19(5), pp. 755-770.
Giraudi, A., Cardu, M., Kecojevic, V., 2009. An Assessment of Blasting Vibrations: A Case Study on Quar-ry Operation. American Journal of Environmental Sciences ISSN 1553-345X. 5 (4), pp. 467-473.
Hoshino, T., Mogi, G., Shaoquan, K., 2000. Optimum delay interval de-sign in delay blasting. FRAGBLAST, 4, pp. 139-148.
Kamali, M., Ataei, M., 2011. Prediction of blast induced vibrations in the structures of Karoun III power plant and dam. Journal of Vibration and Control, 17(4), pp. 541-548.
Khandelwal, M., Singh, T.N., 2007. Evaluation of blast-induced ground vibration predictors. Soil Dynamics

56 Aprile 2015
GEOINGEGNERIA E ATTIVITÀ ESTRATTIVA
and Earthquake Engineering, 27, pp. 116-125.
Khandelwal, M., 2012. Application of an expert system for the asses-sment of blast vibration. Geotech Geol Eng, 30, pp. 205-217.
Indian Standard Institute, 1973. Crite-ria for safety and design of structu-res subjected to underground blast. ISI Bull; IS-6922.
Langefors, U., Kihlström, B., 1967. The modern technique of rock blasting. Stockholm: Almqvist & Wiksell.
Mohammadnejad, M., Gholam, R., Ra-mezanzadeh, A., Jalali, M.E., 2012. Prediction of blast-induced vibra-tions in limestone quarries using Support Vector Machine. Journal of Vibration and Control, 18(9), pp. 1322-1329.
Moser, P., 2008. Energy Controlled Bla-sting. Geoingegneria Ambientale e
Mineraria, 123, 1, gennaio-aprile.Muller, B., 1997. Adapting blasting
technologies to the characteristics of rock masses in order to improve blasting results and reduce blasting vibrations. FRAGBLAST, 1, pp. 361-378.
Muller, B., Hohlfeld, T.H., 1997. New possibility of reducing blasting vibra-tions with an improved prognosis. FRAGBLAST, 1, pp. 379-392.
Oppenheim, A.V., Schafer, R.W., 1975. Digital signal processing. Prentice-Hall Print.
Persson, P.A., Holmberg, R., Lee, J, 1994. Rock Blasting and Explosives Engineering. CRC Press.
Singh, P.K., Roy, M.P., 2010. Damage to surface structures due to blast vibra-tion. International Journal of Rock Mechanics and Mining Sciences, 47(6), pp. 949-961.
Siskind, D.E., Stagg, M.S., Kopp, J.W., Dowding, C.H., 1980. Structure re-sponse and damage produced by ground vibrations from surface mine blasting. USBM RI 8507.
Siskind, D.E., Crum, S.V., Otterness, R.E., Kopp, J.W., 1989. Comparative study of blasting vibrations from In-diana surface coal mine. USBM RI 9226.
Siskind, D.E., 2000. Vibrations from blasting, International Society of Explosives Engineers.
Tripathy, G., Gupta, I.D., 2002. Predic-tion of ground vibrations due to con-struction blasts in different types of rock. Rock Mech Rock Eng, 35(3), pp. 195-204.
Xue, X., Yang, X., 2013. Predicting blast-induced ground vibration using general regression neural network. Journal of Vibration and Control.
Acknowledgement
Authors acknowledge Holcim Italia SpA for their support during the experimental tests.