PhD Thesis Luca Patriarca Final Version - Politecnico di Milano · 2013-05-03 · DOC EX MICR...
120
DOC EX MICR Supervisor Prof. Stefa Prof. Huse Tutor: Prof. Tulli The Chair o Prof. Bian CTORAL PROG XPERIME ROSTRU s: ano Beretta eyin Sehitog io Tolio of the Docto nca Maria C POLITE MECHAN GRAMME IN ENTAL C UCTURA (Politecnico glu (Universi ral Program: olosimo 201 ECNICO DI M ANICAL DEPA ENGINEERIN CHARA AL DAM o di Milano) ity of Illinoi : 13 – Cicle X MILANO ARTMENT NG OF MECHA ACTERIZ MAGE M D is at Urbana XXV ANICAL SYST ZATION ECHAN Doctoral Diss Luca a-Champaig TEMS OF NISMS sertation of: a Patriarca gn)
Transcript of PhD Thesis Luca Patriarca Final Version - Politecnico di Milano · 2013-05-03 · DOC EX MICR...
DOC
EX
MICR
SupervisorProf. StefaProf. Huse
Tutor: Prof. Tulli
The Chair oProf. Bian
CTORAL PROG
XPERIME
ROSTRU
s: ano Beretta eyin Sehitog
io Tolio
of the Doctonca Maria C
POLITE
MECHAN
GRAMME IN
ENTAL C
UCTURA
(Politecnicoglu (Universi
ral Program:olosimo
201
ECNICO DI MANICAL DEPA
ENGINEERIN
CHARA
AL DAM
o di Milano)ity of Illinoi
:
13 – Cicle X
MILANO ARTMENT NG OF MECHA
ACTERIZ
MAGE M
D
is at Urbana
XXV
ANICAL SYST
ZATION
ECHAN
Doctoral DissLuca
a-Champaig
TEMS
OF
NISMS
sertation of: a Patriarca
gn)


i
AbstractThis work presents an experimental approach to investigate the material behavior at
the micro-scale of two important alloys (FeCr and γ-TiAl) for structural applications.
Local strain fields at multiple length scales are measured using an advanced optical
technique. Local strain heterogeneities arises as a consequence of the local
microstructure and deformation mechanisms. This work aims to gain further insights
into the relation between the mechanical behavior of metals at the micro-scale with
the observed mechanical behavior on the meso and macro scales. The main findings
presented here provide valuable information into the deformation mechanisms
activated in bcc metals (slip and twinning), which can be utilized by researchers as
the basis of analytical models to be developed in the next future.
The work is divided into three main parts. In the first part, tension and compression
experiments were conducted on multiple single crystal orientations of body-centered
cubic Fe-47.8Cr single crystals. The critical resolved shear stress magnitudes for slip,
twin nucleation and twin migration were established. The results show that the
nucleation of slip always precedes twinning which nucleates with an associated load
drop at an higher critical resolved shear stress. Following twin nucleation, twin
migration proceeds at a critical resolved shear stress that is lower than the initiation
stress. The experimental results of the nucleation stresses indicate that the Schmid
law holds to a first approximation for the slip and twin nucleation cases, but to a
lesser extent for twin migration particularly when considerable slip strains preceded
twinning. The critical resolved shear stresses were determined experimentally using
digital image correlation in conjunction with electron back scattering diffraction. The
digital image correlation enabled pinpointing the precise stress on the stress-strain
curves where twins or slip were activated. The crystal orientations were obtained
using electron back scattering diffraction and used to determine the activated twin
and slip systems through trace analysis. The results presented in Chapter 2 provide a
considerable contribution in understanding the micro-mechanical behavior of bcc
alloys.

ii
In the second part of the present work slip transmission through grain boundaries is
investigated. The full slip dislocation blockage, or the partial slip dislocation
transmission processes at grain interfaces provide a significant contribution at the
material strengthening. The study focuses on the link from the deformation
mechanisms at the micro-scale to the global mechanical behavior (macro-scale).
Strain fields across grain boundaries were measured using advanced digital image
correlation techniques. In conjunction with strain measurements, grain orientations
from electron back-scattered diffraction were used to establish the dislocation
reactions at each boundary, providing the corresponding residual Burgers vectors due
to slip transmission across the interfaces. A close correlation was found between the
magnitude of the residual Burgers vector and the local strain change across the
boundary. When the residual Burgers vector magnitude (with respect to the lattice
spacing) exceeds 1.0, the high strains on one side of the boundary are paired with
low strains across the boundary. When the residual Burgers vector approaches zero,
the strain fields vary smoothly across the boundary. The FeCr bcc alloy exhibits
single slip per grain making the measurements and dislocation reactions rather
straightforward. The work points to the need to incorporate details of slip dislocation-
grain boundary interaction (slip transmission) in modeling research.
In the last part of the work, a γ-TiAl alloy manufactured with electron beam melting
technology is examined. The electron beam melting technology enables to avoid
typical manufacturing defects. It follows that experiments carried out on this material
provide several insights into the microstructural damage mechanisms leading to crack
initiation. Classical experimental methodologies for the fatigue characterization were
conducted adopting plain fatigue specimens, fatigue specimens with an initial artificial
defect, and crack propagation specimens. Preliminary considerations from these
experiments indicate that the interfaces between lamellar-lamellar grains, and
lamellar-equiaxed grains act as potential crack initiation sites. Taking into account the
typical lamellar grain size, the fatigue resistance of the duplex γ-TiAl alloy can be
predicted. Further investigations on the influence of the microstructure were obtained
using residual strain fields via high resolution digital image correlation in combination
with high resolution images of the local microstructure after etching.

iii
To all those who live their passions
And
To all those who let be led by those of others

iv

v
AcknowledgementsFirst of all I would like to thank my parents, Paola and Oreste, for letting me follow my
dreams, even if this implied to give something up in their life. I’m also thankful for my
friends Mauro Madia and Paolo Berbenni (in Italy), and Wael Abuzaid (in US) who,
during my PhD program, never missed their support (especially in my difficult
periods), they became friends other than just colleagues. I’m also thankful for all the
other friends who came in my life in these three years, in which I crossed for five
times the ocean between Italy and US. In US I’d like to thank Piyas, Garrett, Mallory,
Tawhid, Jay, Avinesh, Jifeng, Alpay, Emre with whom I enjoyed the time in the office
and the lab. Simone, Claudia, Hannah, Beatriz, Riccardo, Giovanni, Francesco,
Chiara, Francesca, Lynn, Federico, Dave, Aya, Arnulfo for being my housemates,
friends, and “snack mates”. In Russia, my ex-colleague, and very close friend
Khaydar. In Italy I’d like to thank Daniele, Michele, Stefano and all the other
colleagues in Polimi, also Marta, Isabella, Paolo, Ottavio, Francesco, Andrea, Massi,
Sara, Enrico, Romina, Nonna for being a necessary support.
Special thanks go to my two advisors and mentors Prof. Huseyin Sehitoglu, and Prof.
Stefano Beretta. Prof. Huseyin Sehitoglu for helping me in my scientific and personal
growth with his weekly meetings, his daily suggestions, his strong encouragements in
improving the quality of the work, his persistence in helping me with my writings (for
sure not one of my best skills, at least in English), and his kindness in supporting and
being interested not only in our work in the office, but also in our life outside the office.
Prof. Stefano Beretta for letting me develop my research topic with no time-limits in
US, for his encouragements even from Italy, his visits in Champaign, his continuous
ideas and enthusiasm in the research work, and his patience in waiting for me for
setting up the lab in Polimi with the experimental tools I’ve been using in US.
Finally I’d like to thank everybody who shared my feelings, my ideas, my passions in
these three years. Without deep relations among people, the pure work would not
mean a thing.

vi

1
TableofContents
INTRODUCTION ........................................................................................................................................... 5
I.1. EXPERIMENTAL APPROACH ........................................................................................................................... 6
I.2. TWIN NUCLEATION AND MIGRATION, SLIP ONSET IN FECR SINGLE CRYSTALS ............................................................ 7
I.3. SLIP TRANSMISSION THROUGH GRAIN BOUNDARIES IN FECR ............................................................................. 11
I.4. STRAIN LOCALIZATIONS IN A Γ‐TIAL ALLOY ..................................................................................................... 14
CHAPTER 1
EXPERIMENTAL METHODOLOGY ............................................................................................................... 17
1.1. DIGITAL IMAGE CORRELATION ..................................................................................................................... 17
1.1.1. In situ DIC ..................................................................................................................................... 19
1.1.2. Ex situ DIC .................................................................................................................................... 21
1.1.3. In situ versus ex situ DIC .............................................................................................................. 23
1.2. DIC APPLICATION FOR MEASURING TWIN NUCLEATION AND MIGRATION STRESSES IN FECR SINGLE CRYSTALS ............. 25
1.2.1. Incremental Digital Image Correlation ........................................................................................ 25
1.3. SLIP ONSET IN FECR SINGLE CRYSTALS ........................................................................................................... 27
1.4. STRAIN FIELDS FROM GRAIN‐BOUNDARY ‐ SLIP INTERACTION ............................................................................ 29
1.4.1. Strain accumulation on FeCr grain boundaries ............................................................................ 29
1.4.2. Strain accumulation on TiAl ......................................................................................................... 31
1.5. SLIP AND TWIN INDEXING ........................................................................................................................... 32
CHAPTER 2
TWIN NUCLEATION AND MIGRATION IN FECR SINGLE CRYSTALS ................................................................ 35
2.1. EXPERIMENTAL SETUP ................................................................................................................................ 36
2.1.1. Sample geometries ...................................................................................................................... 36
2.1.2. Digital Image Correlation setup ................................................................................................... 37
2.2. STRESS‐STRAIN CURVES .............................................................................................................................. 38
2.3. ACTIVATED TWIN AND SLIP SYSTEMS ............................................................................................................. 40
2.4. CRYSTAL ORIENTATION [010] ................................................................................................................... 42
2.4.1. Tension experiments .................................................................................................................... 43
2.4.2. Compression experiments ............................................................................................................ 46

2
2.5. CRYSTAL ORIENTATION [111] ................................................................................................................... 47
2.5.1. Compression experiments ............................................................................................................ 47
2.6. CRYSTAL ORIENTATION [ 10 1] ................................................................................................................... 49
2.6.1. Tension experiments .................................................................................................................... 49
2.6.2. Compression experiments ............................................................................................................ 52
2.7. CRYSTAL ORIENTATION [314] ................................................................................................................... 55
2.7.1. Compression experiments ............................................................................................................ 55
2.8. FURTHER ANALYSIS OF THE RESULTS .............................................................................................................. 56
2.8.1. Twin Migration Stress .................................................................................................................. 57
2.8.2. Strain Hardening .......................................................................................................................... 57
2.8.3. Twin Nucleation Stress ................................................................................................................. 58
2.8.4. Slip Nucleation Stress ................................................................................................................... 58
CHAPTER 3
SLIP TRANSMISSION THROUGH GRAIN BOUNDARIES IN FECR POLYCRYSTAL .............................................. 59
3.1. SCHEMATIC OF SLIP DISLOCATION–GRAIN BOUNDARY INTERACTION .................................................................. 59
3.2. MATERIAL AND METHODS .......................................................................................................................... 61
3.2.1. Microstructure characterization .................................................................................................. 61
3.2.2. Experimental set‐up and strain measurements ........................................................................... 62
3.3. RESULTS ................................................................................................................................................. 63
3.3.1. Stress‐strain curve and DIC strain measurements ....................................................................... 63
3.3.2. High resolution DIC strain measurements ................................................................................... 67
3.3.3. Strain measurements across grain boundaries ............................................................................ 70
3.4. DISCUSSION ............................................................................................................................................. 73
CHAPTER 4
DAMAGE ACCUMULATION ON Γ‐TIAL ......................................................................................................... 75
4.1 MANUFACTURING PROCESS ........................................................................................................................ 75
4.2 MATERIAL ............................................................................................................................................... 77
4.2.1 Microstructure ............................................................................................................................. 77
4.3 FATIGUE EXPERIMENTS WITH PLAIN SPECIMENS .............................................................................................. 80
4.3.1 Experimental set‐up ..................................................................................................................... 80
4.3.2 Results .......................................................................................................................................... 80
4.4 FATIGUE EXPERIMENTS WITH ARTIFICIAL DEFECTS ............................................................................................ 82

3
4.4.1 Experimental set‐up ..................................................................................................................... 82
4.4.2 Results.......................................................................................................................................... 82
4.5 FATIGUE CRACK GROWTH EXPERIMENTS ........................................................................................................ 84
4.5.1 Experimental set‐up ..................................................................................................................... 84
4.5.2 Results.......................................................................................................................................... 86
4.6 UNIAXIAL STATIC EXPERIMENTS USING DIC .................................................................................................... 90
4.6.1 Experimental set‐up ..................................................................................................................... 90
4.6.2 Results.......................................................................................................................................... 92
4.6.3 Compression experiment ............................................................................................................. 92
4.6.4 Tension experiment ..................................................................................................................... 93
4.7 FINAL CONSIDERATIONS ............................................................................................................................. 95
CHAPTER 5
CONCLUDING REMARKS AND FUTURE DEVELOPMENTS ............................................................................. 97
5.5 CONCLUDING REMARKS ............................................................................................................................. 97
5.1.1. Results of Chapter 2 ..................................................................................................................... 97
5.1.2. Results of Chapter 3 ..................................................................................................................... 98
5.1.3. Results of Chapter 4 ..................................................................................................................... 98
5.2. FUTURE DEVELOPMENTS ............................................................................................................................ 99
5.2.1. High Temperature experiments on FeCr ...................................................................................... 99
5.2.2. Ex Situ Digital Image Correlation using SEM ............................................................................. 102
REFERENCES ............................................................................................................................................ 105

4
5
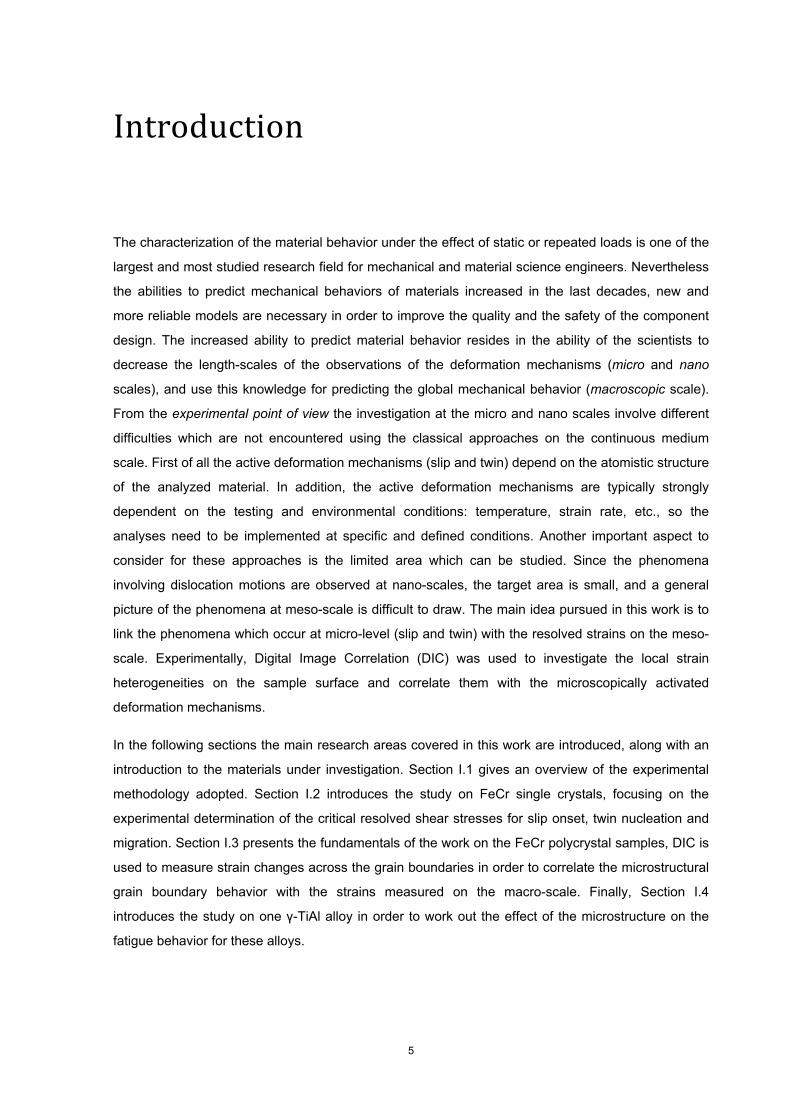
Introduction
The characterization of the material behavior under the effect of static or repeated loads is one of the
largest and most studied research field for mechanical and material science engineers. Nevertheless
the abilities to predict mechanical behaviors of materials increased in the last decades, new and
more reliable models are necessary in order to improve the quality and the safety of the component
design. The increased ability to predict material behavior resides in the ability of the scientists to
decrease the length-scales of the observations of the deformation mechanisms (micro and nano
scales), and use this knowledge for predicting the global mechanical behavior (macroscopic scale).
From the experimental point of view the investigation at the micro and nano scales involve different
difficulties which are not encountered using the classical approaches on the continuous medium
scale. First of all the active deformation mechanisms (slip and twin) depend on the atomistic structure
of the analyzed material. In addition, the active deformation mechanisms are typically strongly
dependent on the testing and environmental conditions: temperature, strain rate, etc., so the
analyses need to be implemented at specific and defined conditions. Another important aspect to
consider for these approaches is the limited area which can be studied. Since the phenomena
involving dislocation motions are observed at nano-scales, the target area is small, and a general
picture of the phenomena at meso-scale is difficult to draw. The main idea pursued in this work is to
link the phenomena which occur at micro-level (slip and twin) with the resolved strains on the meso-
scale. Experimentally, Digital Image Correlation (DIC) was used to investigate the local strain
heterogeneities on the sample surface and correlate them with the microscopically activated
deformation mechanisms.
In the following sections the main research areas covered in this work are introduced, along with an
introduction to the materials under investigation. Section I.1 gives an overview of the experimental
methodology adopted. Section I.2 introduces the study on FeCr single crystals, focusing on the
experimental determination of the critical resolved shear stresses for slip onset, twin nucleation and
migration. Section I.3 presents the fundamentals of the work on the FeCr polycrystal samples, DIC is
used to measure strain changes across the grain boundaries in order to correlate the microstructural
grain boundary behavior with the strains measured on the macro-scale. Finally, Section I.4
introduces the study on one γ-TiAl alloy in order to work out the effect of the microstructure on the
fatigue behavior for these alloys.
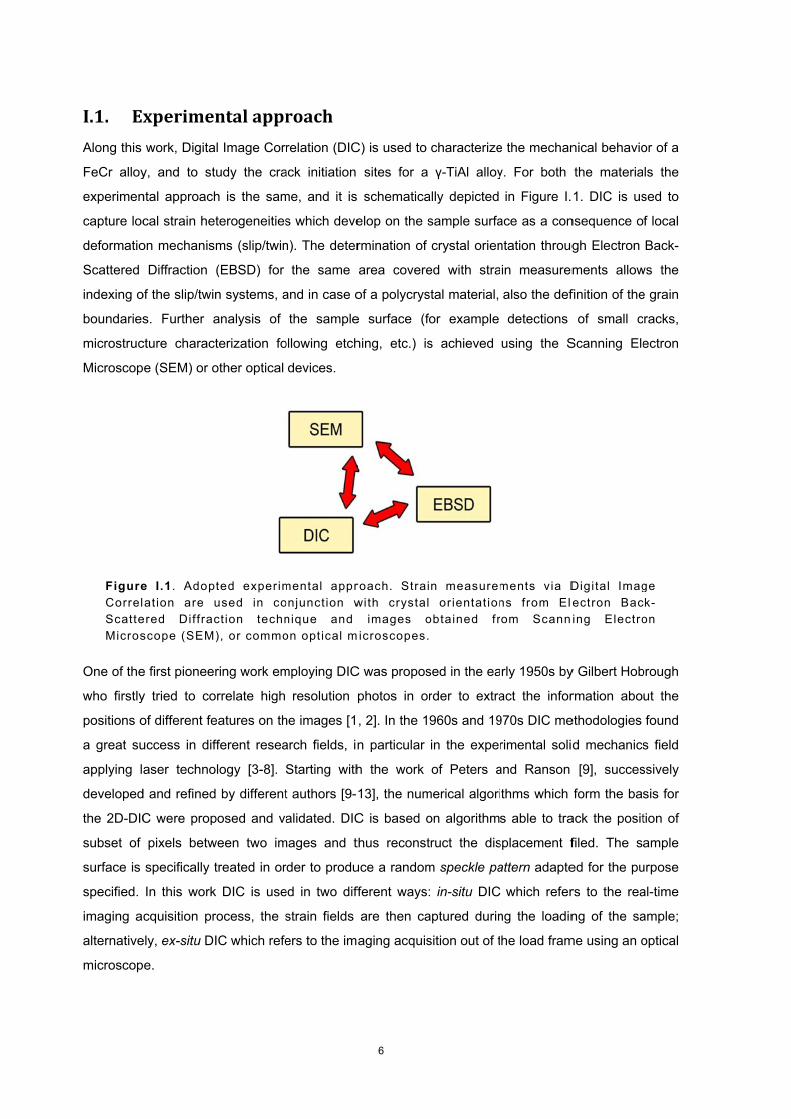
I.1. Ex
Along this
FeCr alloy
experimen
capture loc
deformatio
Scattered
indexing o
boundaries
microstruc
Microscop
FigureCorrelScatteMicros
One of the
who firstly
positions o
a great su
applying l
developed
the 2D-DIC
subset of
surface is
specified.
imaging a
alternative
microscop
xperime
work, Digita
y, and to st
ntal approach
cal strain he
on mechanis
Diffraction
of the slip/twi
s. Further a
cture charac
pe (SEM) or o
e I.1. Adopation are
ered Diffracscope (SEM
e first pionee
y tried to co
of different fe
uccess in dif
aser techno
d and refined
C were prop
pixels betw
specifically t
In this work
cquisition pr
ely, ex-situ D
pe.
ntalappr
al Image Cor
tudy the cra
h is the sam
eterogeneities
ms (slip/twin
(EBSD) for
n systems, a
analysis of
cterization fo
other optical
ted experimused in coction techn), or commo
ring work em
orrelate high
eatures on th
fferent resea
ology [3-8].
d by different
posed and va
ween two im
treated in or
k DIC is use
rocess, the s
IC which refe
roach
relation (DIC
ack initiation
me, and it is
s which deve
n). The deter
the same
and in case o
the sample
ollowing etch
devices.
mental appronjunction wnique and on optical m
mploying DIC
resolution p
he images [1
arch fields, in
Starting with
t authors [9-
alidated. DIC
mages and t
rder to produ
ed in two diff
strain fields
ers to the im
6
C) is used to
sites for a
schematica
elop on the s
rmination of
area covere
of a polycrys
e surface (f
hing, etc.) is
roach. Straiwith crystal
images oicroscopes.
C was propos
photos in o
, 2]. In the 1
n particular
h the work
13], the num
C is based o
thus reconst
uce a random
fferent ways:
are then ca
aging acquis
characterize
γ-TiAl alloy
ally depicted
sample surfa
crystal orien
ed with stra
stal material,
for example
s achieved
n measurem orientation
obtained fr
sed in the ea
rder to extra
960s and 19
in the exper
of Peters a
merical algori
on algorithm
truct the dis
m speckle pa
: in-situ DIC
aptured durin
sition out of t
e the mechan
y. For both
in Figure I.
ace as a con
ntation throug
in measurem
also the def
detections
using the S
ments via Dns from Eleom Scann
rly 1950s by
act the infor
970s DIC me
rimental solid
and Ranson
thms which
s able to tra
splacement f
attern adapte
which refer
ng the loadin
he load fram
nical behavio
the materia
1. DIC is us
nsequence o
gh Electron
ments allow
finition of the
of small c
Scanning Ele
Digital Imagectron Bacing Electro
y Gilbert Hob
rmation abo
ethodologies
d mechanics
[9], succes
form the bas
ack the posit
filed. The sa
ed for the pu
rs to the rea
ng of the sa
me using an o
or of a
ls the
sed to
f local
Back-
ws the
e grain
racks,
ectron
ge k-on
brough
ut the
found
s field
ssively
sis for
tion of
ample
urpose
al-time
ample;
optical

7
Generally speaking, deformation mechanisms (slip and twinning) produce local strain heterogeneities
on the sample surface. Adopting an in-situ DIC set-up is possible to capture the onset of slip and
twinning measuring the localized strains on the sample area detected with the camera. This
experimental set-up is particularly suited for the experiments on the FeCr single crystal samples,
since the analyzed sample areas are characterized by the same crystal orientation, thus displaying
an homogeneous mechanical behavior in terms of active twin and slip systems. Moving the attention
to the polycrystal cases (FeCr and γ-TiAl alloy), the adoption of the DIC in-situ set-up is not adapted
for capturing local strain heterogeneities and correlate them with the local microstructure. In fact, for
these cases, the microstructure is small compared with the strain resolution typically used for in-situ
applications. Higher image resolutions are required, and they can be obtained only using ex-situ DIC.
The characteristics of the implementation of in-situ and ex-situ DIC are described in Chapter 1. In
particular, the chapter explains the different DIC applications for the specific cases addressed along
the work.
I.2. Twinnucleationandmigration,sliponsetinFeCrsinglecrystals
Chapter 1 presents the experimental results obtained from experiments on iron-chromium (FeCr)
single crystal samples loaded along selected crystal orientations. Understanding the deformation
response of iron based body-centered cubic (bcc) alloys has significant merit, as these alloys form
the basis of materials that are widely utilized in structures. In particular, the Fe-Cr alloys are widely
used in chemical and nuclear applications. For common structural applications, the percentage of
chromium content doesn’t exceed 30 at. pct. since higher chromium contents favor cleavage
fractures, as a consequence of the high stresses present at twin-twin intersections [14-16]. However,
adopting heat treatments that remove interstitial impurities drastically improve the brittleness of these
alloys, and good mechanical properties (in particular ductility) are obtained. It is of great importance
to provide a complete material characterization for these alloys, which can be also useful in order to
gain further insides into the mechanical behavior of bcc materials. The majority of the previous
investigations on FeCr alloys were carried out on polycrystals [17-22], whereas in the first part of this
study single crystals have been employed to activate specific twin and slip systems.
Macroscopically, deformation by slip is accommodated by the sliding of planes of atoms one over the
other as schematically reported in Figure I.2a. From the atomistic point of view, slip is originated by
dislocation motion. Depending on the crystal structure (fcc, bcc, hcp) different crystallographic planes
and different shear directions can be activated. For bcc materials, the typical slip planes are
contained on the well-known 011{ } , 112{ } , 123{ } families of planes, while the directions are
contained on the 111 family.
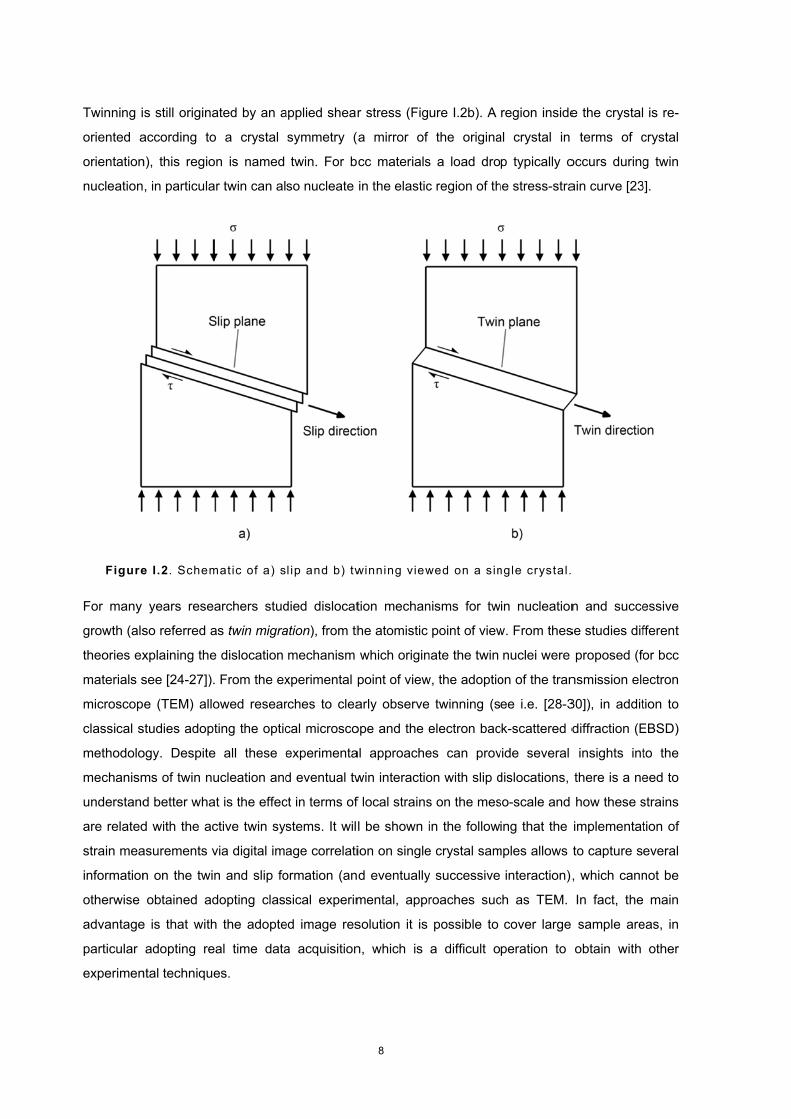
Twinning i
oriented a
orientation
nucleation
Figure
For many
growth (als
theories ex
materials s
microscop
classical s
methodolo
mechanism
understand
are related
strain mea
information
otherwise
advantage
particular
experimen
s still origina
according to
n), this regio
, in particula
e I.2. Schem
years resea
so referred a
xplaining the
see [24-27]).
pe (TEM) allo
studies adopt
ogy. Despite
ms of twin nu
d better wha
d with the ac
asurements v
n on the twin
obtained ad
e is that with
adopting re
ntal technique
ated by an a
o a crystal
on is named
ar twin can al
matic of a) s
archers stud
as twin migra
e dislocation
. From the ex
owed resear
ting the optic
e all these e
ucleation and
at is the effec
ctive twin sys
via digital ima
n and slip fo
dopting class
h the adopte
al time data
es.
applied shear
symmetry (
twin. For b
so nucleate
l ip and b) tw
died dislocat
ation), from th
mechanism
xperimental p
rches to clea
cal microsco
experimenta
d eventual tw
ct in terms of
stems. It wil
age correlati
ormation (an
sical experim
ed image res
a acquisition
8
r stress (Fig
a mirror of
cc materials
in the elastic
winning view
tion mechan
he atomistic
which origin
point of view
arly observe
ope and the e
al approache
win interactio
f local strains
l be shown i
ion on single
d eventually
mental, appr
solution it is
n, which is
ure I.2b). A
the origina
s a load dro
c region of th
wed on a sin
nisms for tw
point of view
nate the twin
w, the adoptio
twinning (s
electron bac
es can prov
on with slip d
s on the mes
in the follow
e crystal sam
y successive
roaches suc
possible to
a difficult o
region inside
al crystal in
p typically o
he stress-stra
ngle crystal.
in nucleation
w. From thes
nuclei were
on of the tran
ee i.e. [28-3
ck-scattered d
vide several
dislocations,
so-scale and
ing that the
mples allows
interaction),
ch as TEM.
cover large
peration to
e the crystal
terms of c
occurs during
ain curve [23
n and succe
se studies dif
proposed (fo
nsmission ele
30]), in addit
diffraction (E
insights int
there is a ne
how these s
implementat
to capture s
, which cann
In fact, the
sample are
obtain with
is re-
crystal
g twin
3].
essive
fferent
or bcc
ectron
tion to
EBSD)
to the
eed to
strains
tion of
everal
not be
main
eas, in
other
9
Another important aspect of this approach is that the use of specimens manufactured as single
crystals with a specific crystal orientation in the load direction enables to study separately crystal
orientations which display predominantly slip and crystal orientations that display also twinning. The
complexity of using a polycrystal material relates to the difficulties of neglecting the effects of the
grain boundaries, and more important, the random choice of the grain orientation. The idea pursued
here is to load statically (in compression and tension) and study each selected crystal orientation
using a defined experimental approach (crystal orientation from EBSD and strain measurements
from DIC), and provide for each orientation the evolution of the local strain fields associated with slip
and twinning. Since by using DIC methodology it is also possible to capture the real-time evolution of
the strains during loading, the first point of the analysis is the measure of the exact point of twin and
slip nucleation along the stress-strain curve. Different works dealt already the existence of a critical
resolved shear stress for both slip and twinning. In particular, it is well established that the resolved
shear stress for twinning is constant when different factors are fixed: alloy composition, temperature,
strain rate, etc. For an exhaustive review on this topic and references see [23]. Many studies have
been carried out on the dependence of these factors on the occurrence of twinning, but less interest
has been devoted in understanding what is the effect of twinning on the local strain field, and more
important what is the effect on the crystal behavior based on the point of twin nucleation on the
stress-strain curve. In this sense, the use of EBSD and DIC can shed light into the study of twin
nucleation and subsequent twin growth, in particular in terms of associated strain fields. Moreover,
this work can provide a solid basis of experimental results which can be useful for understanding the
subsequent slip and twin evolution (for example twin migration) and the interactions (slip/twin,
slip/slip and twin/twin). In fact, since all the observed slip and twin systems have been indexed, the
results can also be useful for testing plasticity framework based on active slip and twin systems.
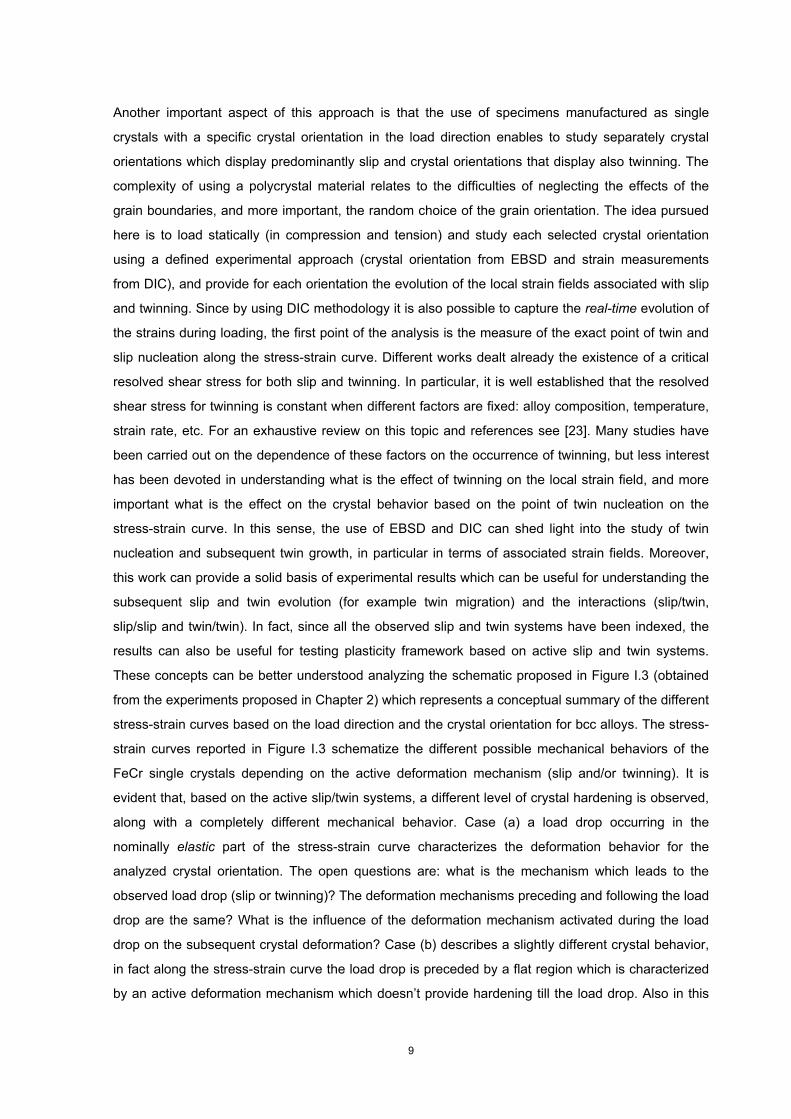
These concepts can be better understood analyzing the schematic proposed in Figure I.3 (obtained
from the experiments proposed in Chapter 2) which represents a conceptual summary of the different
stress-strain curves based on the load direction and the crystal orientation for bcc alloys. The stress-
strain curves reported in Figure I.3 schematize the different possible mechanical behaviors of the
FeCr single crystals depending on the active deformation mechanism (slip and/or twinning). It is
evident that, based on the active slip/twin systems, a different level of crystal hardening is observed,
along with a completely different mechanical behavior. Case (a) a load drop occurring in the
nominally elastic part of the stress-strain curve characterizes the deformation behavior for the
analyzed crystal orientation. The open questions are: what is the mechanism which leads to the
observed load drop (slip or twinning)? The deformation mechanisms preceding and following the load
drop are the same? What is the influence of the deformation mechanism activated during the load
drop on the subsequent crystal deformation? Case (b) describes a slightly different crystal behavior,
in fact along the stress-strain curve the load drop is preceded by a flat region which is characterized
by an active deformation mechanism which doesn’t provide hardening till the load drop. Also in this

case it is
mechanism
two possib
been obse
the strain
active defo
These que
(Chapter 2
Figurealloy. (tensildirectiand/or
The knowl
on the ha
twin-slip in
obstacle to
twin boun
example, b
s interesting
ms interact a
ble deformat
erved, but tw
fields, along
ormation me
estions can b
2) will cover t
e I.3. ScheThe stresse versus con depende
r twin system
ledge of the
ardening indu
nteractions
o a slip dislo
dary can pr
based on the
to analyze
and provide
tion behavior
wo different h
g with crysta
echanisms, a
be answered
this topic.
matic of th-strain curvcompressiveence of bcc ms.
active slip a
uced by the
and twin-tw
ocation or to
rovide a sig
e reaction at
e what are
the measure
rs which can
hardening m
al orientation
and the expl
only with a r
e possible ve depends e load). Thalloys deriv
and twin syst
e different po
win interactio
another inco
nificant influ
the twin bou
10
the active
ed strain fiel
n be observe
modulus are m
ns from EBS
anation of th
real-time dat
crystal defo on the cryhe differentve from the
tems can als
ossible inter
ons. In gene
oming twin. I
uence on th
undary, a slip
slip and tw
lds. The last
ed. In the lat
measured. In
SD can prov
he different
ta acquisition
ormation beystal orientat deformatipossibi l ity o
so be useful
raction mech
eral, a twin
It follows tha
e mechanic
p dislocation
win systems,
t cases (c an
tter cases no
n this case t
vide useful in
observed ha
n, and the firs
ehaviors foration and loon behavio
of differently
in order to
hanisms: slip
boundary c
at the reactio
cal behavior
needs to ove
, and how
nd d) define
o load drops
the observat
nformation o
ardening mo
st part of this
r a bcc FeCoad directio
ors and loay activate sl
analyze the
p-slip interac
can represe
on occurring
of the alloy
ercome an e
these
other
s have
tion of
on the
dulus.
s work
Cr on ad ip
effect
ctions,
ent an
at the
y. For
energy
11
barrier in order to react with the twin boundary [31], thus leading to an increment of the material
strength. Twin-twin and twin-slip interactions can be beneficial for the strengthening of the material,
but on the other side, the intersection regions can promote high strain and stress localizations. For
example, twin-twin interactions are well-known for generating high localized stresses in the region of
interaction, in particular when one twin is blocked in front of another twin [32-34]. Moreover, when
loaded in tension, the reaction between some of the possible active twin systems for a particular
crystal orientation can lead to the formation of the Cottrell dislocation which leads to cleavage
fractures [32]. In general, in order to study the effect of the twin-twin interaction observed, it is useful
to study the possible outcome in terms of dislocation reaction. For bcc materials different authors
provided experimental studies showing the possible twin-twin and twin-slip reactions and the
consequences on the mechanical behavior, see for example [35-38]. It is not the objective of the
present work to focus on each twin-twin and twin-slip interaction observed and study the possible
dislocation reactions. On the other side, giving the local strain measurements in correspondence of
the twin-twin and twin-slip interactions can help in understanding the role of the interactions on the
observed crystal hardening.
I.3. SliptransmissionthroughGrainBoundariesinFeCr
Considerable research efforts have been devoted to incorporate dislocation slip at the crystal level to
predict the overall response of metals. Substantial progress has been gained in predicting crystal
orientation effects, strain hardening [39], slip-twin interactions [40], and change in crystallographic
texture [41, 42]. Grain boundaries have been treated as a contributor to geometric hardening and the
obstacle length has been incorporated in the models [40]. These models typically allow for predicting
the overall macroscopic stress-strain response upon use of various homogenization schemes.
Further advances in these models should encompass developments on grain boundary specifics. In
fact, one of the strengthening mechanism at grain level is provided by the presence of grain
boundaries which influence the slip dislocation transmission process. Grain boundaries act as a
barrier to dislocation motion, thus inducing a contribution to the hardening of the alloy. The level of
strengthening of the grain boundaries depends on the incoming and outgoing slip because of the
different residual Burgers vectors that remain at the boundary. The level of strengthening associated
with the grain boundaries can be quantified measuring the energetics of the slip transfer process.
Using molecular dynamics simulations, Abuzaid at all established the energy barrier levels for
different grain boundaries [43]. In particular, they analyzed different grain boundary specifics,
showing that high energy barriers result in case of high residual Burgers vector magnitudes. The
influence of the grain boundary specifics on the slip dislocation-GB interactions can also be
experimentally studied on the meso-scales, since the slip transmission process influences the local
deformation behavior at the grain boundaries. Over the years, studies examining dislocation-grain
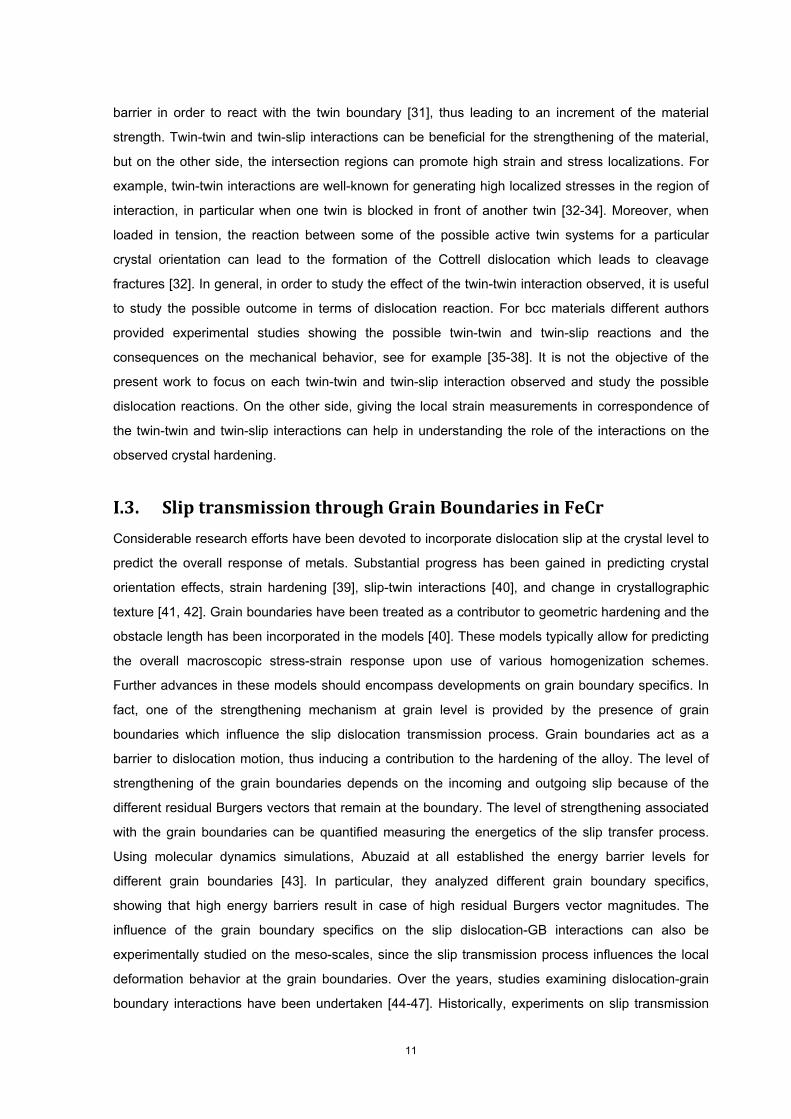
boundary interactions have been undertaken [44-47]. Historically, experiments on slip transmission

were cond
techniques
Grain Bou
vector of
preceding
experimen
boundaries
through g
boundaries
systems th
in order to
formation,
introduced
one main s
In this sc
dislocation
Figuretransmdislocadisloca
ducted with o
s different a
ndary (see f
the residual
paragraphs
nts [49-53], e
s. The idea
grain bounda
s, and corre
hrough the g
o remove oth
strain aging
d by dislocati
slip system,
enario, the
n-grain bound
e I.4a. Sl imission, i.eation on thations are in
optical micro
uthors estab
for example [
l dislocation
s, experime
etc., provide
pursued in C
aries on th
elate these s
rain interface
er hardening
g in steels
ion-grain bou
even the pos
selected Fe
dary interact
p dislocati. cross sl ipe grain bouncorporated
oscopes or,
blished a ser
[48]). The ma
left at the
ental techniq
an exhaustiv
Chapter 3 is
he meso-sca
strain fields w
es. The use
g factors (for
[54]), allowe
undary intera
ssible harden
eCr polycrys
ions.
on-GB intep; b) directundary; c) inside the g
12
more recen
ries of poss
ain outcome
grain bound
ques such
ve, but locali
to study and
ale measuri
with the inte
of the FeCr
r example fin
ed to focus
actions. Sinc
ning introduc
stal represen
eractions int transmissindirect tragrain bound
tly, using TE
ible dislocat
e of these stu
dary. As alre
as TEM, m
ized analysis
d analyze th
ng the loca
eraction of th
polycrystal s
ne dispersion
the study o
ce every gra
ced by slip-s
nts the perfe
n polycrystsion with gnsmission;
dary.
EM (Figure I
ion reactions
udies is the r
eady briefly
micro and
s of the proc
he slip transm
al strain fie
he incoming
samples, pro
ns of hard pa
only on the
in analyzed
lip interaction
ect material
al materialeneration od) no trans
I.4b). Using
s occurring
role of the Bu
discussed
nano inden
cesses at the
mission proc
elds across
and outgoin
operly heat-tr
articles, mart
crystal hard
also display
ns is avoided
for studyin
ls: a) direof a residusmission, th
these
at the
urgers
in the
ntation
e grain
cesses
grain
ng slip
reated
ensite
dening
s only
d [55].
g slip
ct al
he
FDrebdb
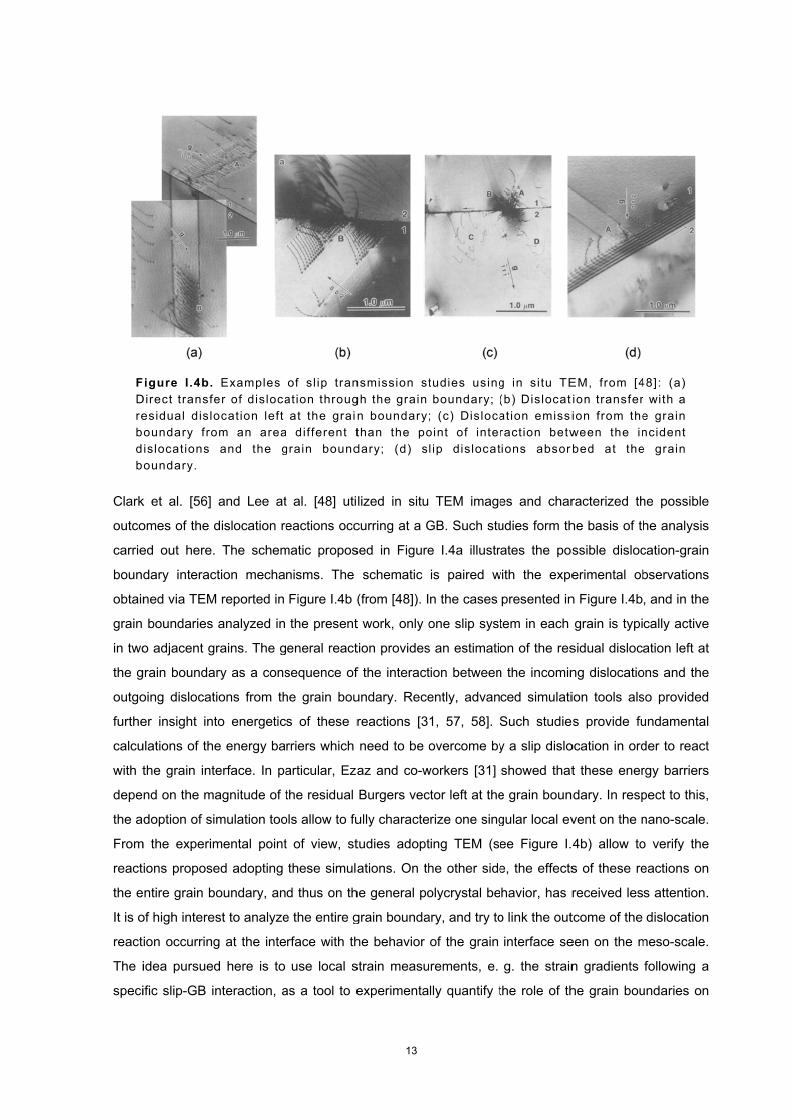
Clark
outco
carrie
boun
obtain
grain
in two
the g
outgo
furthe
calcu
with t
depe
the a
From
react
the e
It is o
react
The i
speci
igure I.4b. Direct transfeesidual dislooundary froislocations oundary.
k et al. [56]
omes of the d
ed out here.
dary interac
ned via TEM
boundaries
o adjacent g
grain bounda
oing dislocat
er insight int
ulations of the
the grain int
nd on the m
doption of si
m the experim
ions propose
entire grain b
of high intere
ion occurring
idea pursued
ific slip-GB i
Examples er of dislocaocation left om an area
and the g
and Lee at
dislocation re
. The schem
ction mecha
M reported in
analyzed in
rains. The g
ary as a cons
tions from th
to energetic
e energy ba
terface. In pa
agnitude of t
mulation too
mental point
ed adopting
boundary, an
st to analyze
g at the inte
d here is to
nteraction, a
of sl ip tranation througat the grain
a different tgrain bound
t al. [48] uti
eactions occ
matic propos
nisms. The
Figure I.4b (
the present
eneral react
sequence of
he grain bou
s of these r
rriers which
articular, Eza
the residual
ols allow to fu
t of view, st
these simula
d thus on th
e the entire g
rface with th
use local s
as a tool to e
13
nsmission stgh the grain n boundary;than the podary; (d) s
lized in situ
curring at a G
sed in Figure
schematic
(from [48]). I
t work, only o
tion provides
f the interact
undary. Rece
reactions [3
need to be o
az and co-w
Burgers vec
ully characte
tudies adopt
ations. On th
he general po
grain bounda
he behavior
strain measu
experimenta
tudies usingboundary; (
; (c) Dislocaoint of interl ip dislocat
TEM image
GB. Such stu
e I.4a illustr
is paired w
n the cases
one slip syst
s an estimatio
tion between
ently, advan
1, 57, 58]. S
overcome by
workers [31]
ctor left at the
rize one sing
ting TEM (se
he other side
olycrystal be
ary, and try to
of the grain
rements, e.
lly quantify t
g in situ TE(b) Dislocatation emissiraction betwions absor
es and char
udies form th
ates the pos
with the expe
presented in
tem in each
on of the res
n the incomin
ced simulati
Such studie
y a slip dislo
showed that
e grain boun
gular local ev
ee Figure I.4
e, the effects
havior, has r
o link the out
interface se
g. the strain
the role of th
EM, from [4ion transferion from theween the inbed at the
racterized th
he basis of th
ssible disloc
erimental ob
n Figure I.4b
grain is typi
sidual disloca
ng dislocatio
ion tools als
es provide fu
ocation in ord
t these ener
ndary. In resp
vent on the n
4b) allow to
s of these re
received les
tcome of the
een on the m
n gradients
he grain bou
48]: (a) with a e grain ncident e grain
he possible
he analysis
cation-grain
bservations
, and in the
cally active
ation left at
ons and the
so provided
undamental
der to react
rgy barriers
pect to this,
nano-scale.
o verify the
eactions on
s attention.
dislocation
meso-scale.
following a
undaries on

14
the meso-scale. To this aim, Chapter 3 analyzes and correlates the potential outcome of the
dislocation reactions (local parameter) with the measured strain changes across grain boundaries
(meso-scale behavior). The open question is: is there any possible parameter which is able to
describe an average grain boundary behavior? Chapter 3 aims to answer this question, and shed
further light into the localization of plastic strains due to dislocation-GB interactions.
I.4. Strainlocalizationsinaγ‐TiAlalloy
Gamma titanium aluminide based alloys (γ-TiAl) have become an important alternative for high
temperature structural applications in the aircraft industry to supplant current nickel-based
superalloys as the material of choice for low-pressure turbine blades [59, 60]. The advantages
achieved by the use of γ-TiAl intermetallics are principally their low density (3.9-4.2 g/cm3 as a
function of their composition [61]), high specific yield strength, high specific stiffness, substantial
resistance to oxidation and good creep properties up to high temperatures. Although the application
of such materials appears very encouraging for the turbine engine industry, optimizing the
performance improvements requires more advanced approaches to accurately predict fatigue
strength and to demonstrate the damage tolerance of TiAl materials with respect to intrinsic or
service-generated defects. Therefore, there is a need to understand and address the specific fatigue
properties of these materials to assure adequate reliability of these alloys in structural applications
[62]. The peculiarity of the alloy analyzed here is that components (and thus the samples) are
manufactured using Electron Beam melting (EBM) technology. EBM is a technology based on a
manufacturing process “layer by layer”, which allows a drastic reduction of the presence of defects
such as inclusions, pores etc. In this scenario the influence of the material microstructure on the
fatigue resistance becomes more important since the possible crack initiation sites are found in
correspondence of defined microstructural features.
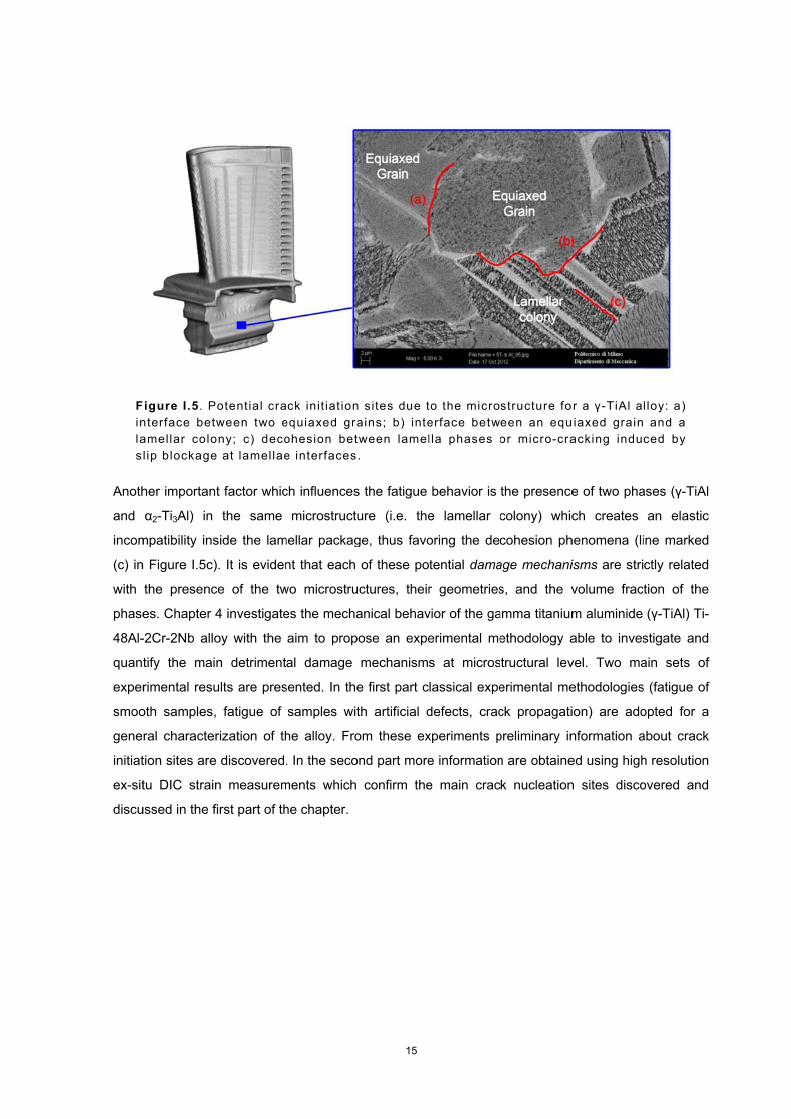
Figure I.5 shows the typical microstructures generally present on γ-TiAl alloys (this alloy is also
indicated as a duplex microstructure alloy): the equiaxed grains and the lamellar colonies. The
regions marked in red represent the critical regions for these alloys in terms of potential crack
nucleation sites. Strains can accumulate at the grain boundaries as other polycrystalline materials
(line marked (a) in Figure I.5a), or localized strains are detected in grain boundary regions where
twins are blocked [63], or in triple points where strain incompatibilities are large [64]. The presence of
the lamellar colonies create other potential sites where cracks can nucleate, for example as a
consequence of the interfacial delamination and decohesion of the lamellar colonies [65].
Finlas
Anoth
and
incom
(c) in
with
phase
48Al-
quant
exper
smoo
gene
initiat
ex-sit
discu
igure I.5. Pnterface betamellar colol ip blockage
her importan
α2-Ti3Al) in
mpatibility ins
n Figure I.5c)
the presenc
es. Chapter
-2Cr-2Nb allo
tify the mai
rimental resu
oth samples,
ral characte
tion sites are
tu DIC strai
ussed in the f
Potential cratween two eony; c) decoe at lamellae
nt factor whic
the same
side the lam
). It is eviden
ce of the tw
4 investigate
oy with the
in detriment
ults are pres
, fatigue of
rization of th
e discovered
n measurem
first part of th
ck init iationequiaxed graohesion bete interfaces
ch influences
microstructu
mellar packag
nt that each
wo microstru
es the mecha
aim to prop
al damage
sented. In the
samples wit
he alloy. Fro
. In the seco
ments which
he chapter.
15
n sites due tains; b) intetween lamel.
s the fatigue
ure (i.e. the
ge, thus favo
of these po
uctures, their
anical behav
pose an expe
mechanism
e first part c
th artificial d
om these ex
ond part more
confirm the
to the microerface betwlla phases o
behavior is
e lamellar c
oring the dec
tential dama
r geometries
vior of the ga
erimental me
s at micros
lassical expe
defects, crac
xperiments p
e information
e main crac
structure foeen an equor micro-cra
the presence
colony) whic
cohesion ph
age mechani
s, and the v
amma titanium
ethodology a
tructural lev
erimental me
ck propagati
preliminary in
n are obtaine
k nucleation
r a γ-TiAl aiaxed grain
acking indu
e of two pha
ch creates
henomena (li
isms are stri
volume frac
m aluminide
able to inves
vel. Two ma
ethodologies
ion) are ado
nformation a
ed using high
n sites disco
lloy: a) and a ced by
ases (γ-TiAl
an elastic
ine marked
ctly related
tion of the
(γ-TiAl) Ti-
stigate and
ain sets of
s (fatigue of
opted for a
about crack
h resolution
overed and

16
17
Chapter1
Experimentalmethodology
The present work is characterized by an extensive usage of experimental strain measurements
obtained via digital image correlation (DIC) methodology. An exhaustive reference on this technique
is contained in [2]. In this chapter are briefly introduced the basic concepts and the details of the
experimental techniques adopted along the work. Strain measurements from DIC and crystal
orientations from electron back scattered diffraction methodologies (EBSD) were mainly used for
studying the local strain fields associated with the different deformation mechanisms (slip, twinning,
slip transmission across grain boundaries, twin-twin and twin-slip interactions). Each application
requires a specific experimental set-up which will be analyzed in this chapter.
Section 1.1 contains general details on the DIC methodology. The first application of DIC is
introduced in Section 1.2 with the measurements of the twin nucleation and migration stresses. The
measurement of the stress required to initiate slip is analyzed separately in Section 1.3. High
resolution strain measurements were also used to capture the strain changes across grain
boundaries (GBs) on FeCr polycrystal (Section 1.4), the same section also provides the details of the
strain averaging process. Finally, section 1.5 describes the slip and twin indexing calculations using
grain orientations from EBSD and slip/twin traces on the sample surface.
1.1. DigitalImageCorrelation
DIC is a non-contact methodology for measuring local displacements on a flat area of the sample
surface. The extension of the analyzed area depends on the research purposes that indicate the
image resolution required (macro-scale, meso-scale, micro-scale, nano-scale), on the type of strain
measurements (real time or out of the load frame), on the available experimental set-up (lens,
camera), and on the preparation of the surface. The technique is based on reproducing on the target
surface a random speckle pattern which results in a groups of pixels on the grey scale (from 0 to
255) in the images captured with a monochrome digital camera. This speckle pattern can be
produced using different methodologies, in particular its preparation depends on the resolution
adopted for the images. For example, it is possible to obtain the speckle pattern painting the sample
using a commercial airbrush and a black paint. In other cases for which higher image resolutions are
required (i.e. for measuring the strain localization produced by slip) a different procedure for

generating
application
Figurepixel o
Figure 1.1
sample at
the applica
deformatio
square gr
(deformed
more than
visual prog
subsets in
of the sub
deposition
pixels. Th
defined ma
the resolut
mean size
has been
period grid
subset spa
subset). U
g the speckle
n in terms of
e 1.1. DIC on the defor
shows an e
zero load, w
ation of a lo
on of the sam
oupings of
) image is n
n one possib
gram used in
the deforme
bset (correla
, are typicall
e length of
arker that ca
tion of the im
e of the spec
successfully
d pattern us
acing which
Usually the ty
e patterns is
image resolu
technique ismed image,
xample of a
while the defo
oad. In this c
mple surface.
pixels called
ot unique. F
bility exists f
n this work (V
ed image, th
ation point).
ly used subs
the edge n
an be localize
mages strictly
ckle features
y used by d
sed in grid m
represents t
ypical subset
used. The a
ution is the c
s based on it is not po
speckle patt
ormed image
case the pix
. The ability o
d subsets, s
or example,
for the pixel
VIC 2D) cont
us allowing t
In this wor
set sizes from
eeds to con
ed in the def
y depends on
s. In the pres
ifferent auth
methods. An
the number o
t spacing ran
18
ability to gen
critical point o
the recognossible to tra
tern. The firs
e represents
xels on the s
of the DIC al
since the po
as shown in
with value
tains adapted
the definition
rk, with the
m 31 to 51 p
ntain a suffic
formed imag
n the quality
sent work is
ors (see i.e.
nother impor
of pixels bet
nges from 5 t
nerate the co
of the DIC m
nit ion of theack one sing
st reference i
the same ar
second imag
lgorithms res
osition of th
n Figure 1.1,
50 in the se
d algorithms
n of the vect
adopted m
ixels for eac
cient group
ge. It follows
of the speck
s adopted a
. [66]), and
rtant parame
ween each c
to 10 pixels
orrect speckl
ethodology.
e posit ion ofgle pixel.
mage is capt
rea of the spe
ges moved f
sides in track
e single pix
for the first
econd (defor
for defining
or displacem
methodologies
h edge of th
of pixels wh
that the cap
kle pattern, in
random spe
it is conside
eter for the
correlation p
(in the prese
le for the req
f a subset
tured on the
eckle pattern
following the
king the posit
xel in the se
(reference)
rmed) image
the position
ment for the c
s for the sp
he square gro
hich represe
pability to inc
n particular o
eckle patter,
ered better t
correlation
point (center
ent work is a
quired
of
virgin
n after
e local
tion of
econd
image
e. The
of the
center
peckle
oup of
ents a
crease
on the
which
han a
is the
of the
always
19
used 5 pixels). Repeating the process for different points inside the reference image determines the
displacement field of the deformed image.
Along this work DIC is used in two different modalities:
In situ DIC; the deformed images are captured during the experiment, the strain fields
obtained represent a real-time strain measurement.
Ex situ DIC; both the reference and deformed images are captured out of the load frame (at
zero load), the strain fields obtained represent the residual strains that remain on the sample
surface.
Digital image correlation is used to measure the evolution of local strains, in situ, on a full field basis
[11, 12, 67, 68]. In addition to in situ DIC (sample under stress in the load frame), was also used
higher resolution DIC strain measurements obtained ex situ (out of the load frame) for analyzing the
local effect of slip and twinning. In the following sections are described the methodologies along with
examples of the adopted speckles for both in situ and ex situ DIC.
1.1.1. InsituDIC
The typical experimental set-up for the implementation of in situ DIC is shown in Figure 1.2, in the
schematic is described a tension experiment. The nominal strain is measured using an
extensometer, and the strain signal is used to control the load during the experiment. An IMI model
IMB-202 FT CCD camera (1600 x 1200 pixels) with a Navitar optical lens (the resolved resolution is
about 3.0 μm/px) was used to capture the reference and deformed images. Using a dedicated
software was possible to capture the images during the loading and un-loading steps at an arbitrary
time interval. This DIC set-up is adapted for measuring increments of deformation, in situ DIC is also
referred to be a real time strain acquisition technique. The speckle pattern for DIC was obtained
using black paint and an Iwata Micron B airbrush. An example of the speckle pattern used for in situ
DIC is shown in Figure 1.3, in this case is shown a compression sample. This speckle pattern allows
to use a subset size of 51 px (4 μm/px).

Figurethe cacapturrefere
Figurecamerusing
magni
Typically, t
mm x 5 m
for examp
deformatio
allows to
e 1.2. Expeamera are cring imagesnce image i
e 1.3. Imagea (1600 x 1black paint
f ication ado
the speckle
m region (se
ple crack cl
on mechanis
capture a s
rimental secontrolled b during thes captured
e of the sam200 pixels) and an Iwa
opted is 51 p
pattern gene
ee Figure 1.3
losure meas
ms (slip/twin
significant po
t-up for they a central experimenbefore the e
mple surfacewith a Navi
ata Micron B
px (200 μm)
erated with th
3). Using this
surements d
n) for fcc mat
ortion of the
20
e in situ DICcomputer.
t providing experiment a
e captured uitar optical lB airbrush. T
.
he airbrush i
s DIC set-up
during fatigu
terials [70]. I
e surface in
C methodoloA monochra real t ime
at zero-load
using an IMIens. The spThe approxi
s adapted fo
several app
ue [69], or
n the presen
nvolved in th
ogy. The loaome camera
e image acq.
model IMBpeckle pattemate subse
or strain mea
plications can
similar stud
nt case, the s
he deformati
ad frame ana is used fquisit ion. Th
B-202 FT CCer is produceet size for th
asurements o
n be impleme
dies on act
selected DIC
ion, and wit
nd or he
CD ed he
on a 4
ented,
ivated
C area
th the

adopt
exam
Fin
Finall
nucle
1.1.2
For e
micro
image
meas
chara
twin-s
The a
when
intera
resolu
exper
increa
targe
the a
not fo
and r
sectio
cover
40 x 4
ted resolutio
mple Figure 1
igure 1.4 . ntroduced by
ly, as deform
eation and tw
2. Exsi
ex situ DIC, a
oscope allow
es (2x vers
surement res
acterization o
slip and slip-
adoption of e
n a local eva
action mecha
ution images
rimental poi
ased resolut
et area can m
pplied load.
ound on the
relates to the
on of the ten
ring all the s
4 = 160 imag
on strain hete
.4).
Strain hetey twinning a
mation meas
win migration
ituDIC
an optical mic
ws the images
sus 20x for
solution (3.0
of the local s
-slip interactio
ex situ high
aluation of t
anism (slip/s
s (from a min
nt of view.
tion the cove
move out of t
In this case
sequent def
e number of
nsion sample
urface of the
ges are need
erogeneities
rogeneit ies are much hig
surements v
can be eval
croscope wa
s to be captu
ex situ). T
0 μm/pixel v
train magnitu
on regions.
resolution D
he strain fie
slip, twin/slip
nimum resolu
First of all
ered region
he area cove
the correlat
formed imag
images to be
e, using the 5
e sample. Inc
ded in this ca
21
derived from
introducedgher than th
via in situ D
uated using
as used to ca
ured at a mu
The increas
versus 0.44
udes that are
DIC provides
eld is needed
p, slip/slip, s
ution of abou
real time a
becomes sm
ered by the c
ion cannot b
ges. A secon
e acquired. A
5x set up (re
creasing the
ase. If a furth
m slip or twin
by sl ip anhat of sl ip.
IC are made
the full field
apture the re
uch higher m
sed imaging
μm/pixel for
e associated
s the necess
d in order to
slip/GB). On
ut 1 µm/px) i
cquisition is
maller. It follo
camera beca
be implemen
nd issue is s
Adopting ex
esolution 0.87
image resolu
her incremen
nning can be
d twinning.
e real time,
strain contou
ference and
agnification
magnificati
r ex situ) [6
with slip-gra
ary strain fie
o study the
the other s
ntroduces m
partially ex
ows that dur
ause of the s
ted since the
chematically
situ DIC, for
7 µm/px) 40
ution (10x, re
nt of the imag
e recognized
The local
the onset o
ur plots obta
deformed im
compared to
on improve
66] and ena
ain boundary
eld resolution
particular ef
ide, the usa
more difficultie
xcluded sinc
ring the expe
specimen mo
e reference
y reported in
r covering the
images are
esolution 0.4
ge resolution
(see as an
strains
of slip, twin
ined.
mages. The
o the in situ
s the DIC
bles better
y, twin-twin,
ns required
ffect of the
age of high
es from the
ce with the
eriment the
oves due to
images are
Figure 1.5
e entire net
needed for
437 µm/px),
n is needed

(20x, reso
resolution
Moreover,
deformatio
introduce a
Figureallow sampleorder imageresolu
An examp
The rando
µm/px. In t
implement
contained
olution 0.22 µ
is required
further incr
ons the out-o
a problem on
e 1.5. Imagto use diff
es can be to improve s (10x), wtion (20x).
ple of the spe
om speckle
the inset ima
ted with the
inside the su
µm/px), a tot
, the numbe
rements of t
of-plane disp
n maintaining
ge acquisit ioferent opticcovered st ithe strain f i
while 640 im
eckle patter a
pattern is pa
age of Figure
adopted spe
ubset, this is
tal of 160 x
er of image
the resolutio
placements (
g a uniform fo
on for ex scal microsctching 40 ield resolutimages are
adopted for t
articularly ad
e 1.6 is also r
eckle. It is p
a first indica
22
4 = 640 ima
es quickly in
on limit the
(and potenti
focus of the i
itu DIC. Thope magnifmages withon is possib
needed w
the ex situ D
dapted for im
reported the
possible to n
ation of the g
ages are req
ncreases wit
applicable lo
ally also the
mage.
he adopted f ications. Th a nominalble to cover
with a furth
DIC along thi
mages captu
typical subs
notice that th
oodness of t
quired. So, w
h the adopt
oads since w
e non-planari
speckle forhe area of magnif icat
r the same aer improve
s work is sho
ured with a
et selected f
he features o
the correlatio
when a high
ted magnific
with high le
ity of the su
r ex situ Df the tensiot ion of 5x. area with 16ement of th
own in Figur
resolution o
for the correl
of the speck
on.
strain
cation.
evel of
urface)
IC on In
60 he
re 1.6.
f 0.44
ations
kle are
FTe
is
1.1.3
A sim
in Fig
the lo
the ce
(2.37
left,
meas
the s
using
the a
provid
strain
possi
evolu
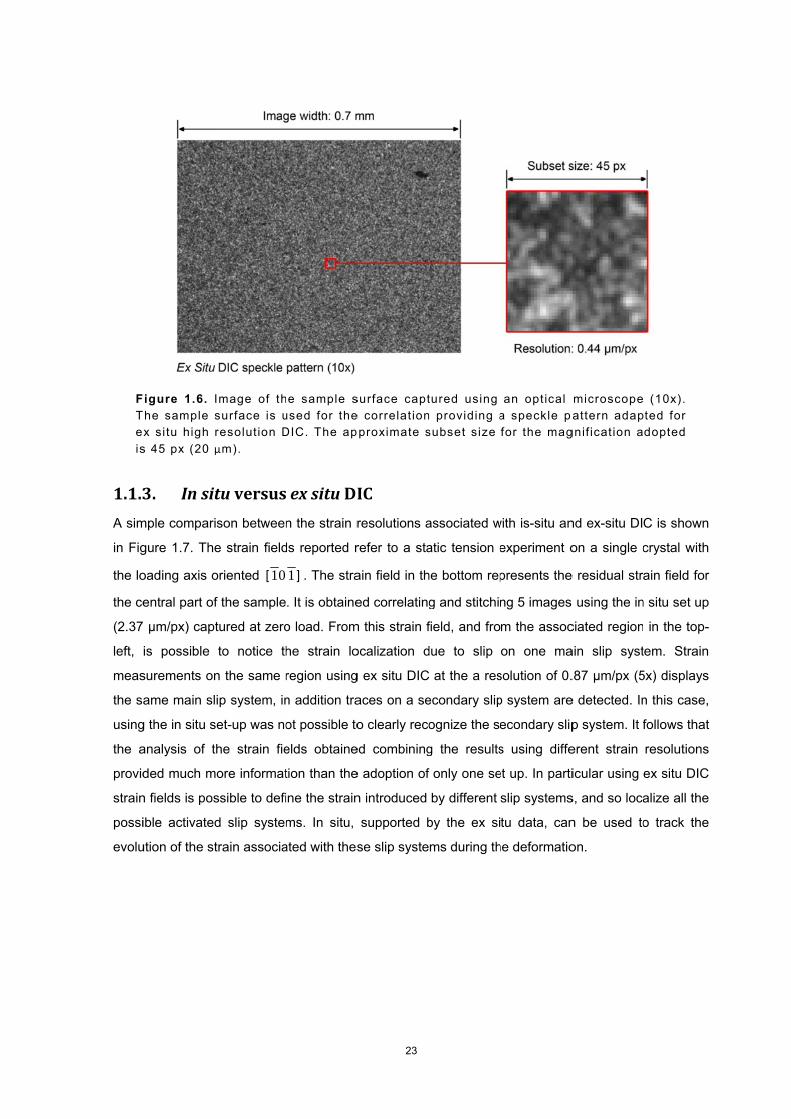
igure 1.6. he sample x situ high
s 45 px (20
3. Insi
mple compari
gure 1.7. Th
oading axis o
entral part of
7 µm/px) cap
is possible
surements on
ame main sl
g the in situ s
analysis of t
ded much m
n fields is pos
ible activate
ution of the st
Image of thsurface is uresolution D
μm).
tuversus
ison between
e strain field
oriented 10[
f the sample
tured at zero
to notice th
n the same r
lip system, in
set-up was no
the strain fie
more informat
ssible to defi
d slip system
train associa
he sample sused for theDIC. The ap
exsituDI
n the strain r
ds reported r
1] . The stra
. It is obtaine
o load. From
he strain lo
region using
n addition tra
ot possible to
elds obtaine
tion than the
ine the strain
ms. In situ,
ated with thes
23
surface capte correlation
proximate s
IC
resolutions a
refer to a sta
ain field in th
ed correlating
m this strain f
ocalization d
g ex situ DIC
aces on a se
o clearly reco
ed combining
e adoption of
n introduced
supported b
se slip syste
tured using n providing asubset size
associated w
atic tension e
he bottom rep
g and stitchin
field, and fro
due to slip
at the a res
econdary slip
ognize the se
g the results
f only one se
by different
by the ex si
ms during th
an optical a speckle pfor the mag
with is-situ an
experiment o
presents the
ng 5 images
m the assoc
on one ma
solution of 0.
p system are
econdary slip
s using diffe
et up. In parti
slip systems
tu data, can
he deformatio
microscopeattern adap
gnif ication a
nd ex-situ DI
on a single c
e residual str
s using the in
ciated region
ain slip syst
.87 µm/px (5
e detected. In
p system. It f
erent strain
icular using
s, and so loca
n be used to
on.
(10x). ted for dopted
C is shown
crystal with
ain field for
n situ set up
in the top-
tem. Strain
5x) displays
n this case,
follows that
resolutions
ex situ DIC
alize all the
o track the

Figureobtainresoluactive
e 1.7. Comped with in-stion obtainedeformation
parison betwsitu DIC anded using exn mechanism
ween strain d ex situ DICx situ DIC m (slip or tw
24
f ields displaC methodoloallows to c
win).
aying strainogies for a scorrelate th
localizationsingle crystae strain f ie
ns due to slal. The stra
eld with eac
ip in
ch

25
1.2. DIC application formeasuringTwinNucleation andMigration
stressesinFeCrsinglecrystals
As introduced in Chapter I, adopting in situ DIC in conjunction with EBSD, the mechanical behavior in
terms of active slip and twin systems for different FeCr single crystal orientations was studied (see
Chapter 2). Real time strain fields enable to capture the strain heterogeneities associated with slip, or
twinning, during loading. In particular the application of this methodology for the selected single
crystals allow to establish the points on the stress-strain curve where slip and twin nucleate, and
follow the associated local strain evolution. The main advantage of using DIC relates to the possibility
to quantify the local strain values associated with the deformation mechanisms. Typically, for bcc
materials twin nucleation can also be identified on the stress-strain curve when a load drop occurs. In
some cases the load drop can occur even in the 'elastic' region of the stress-strain curve [23, 71]. It is
always better to verify the presence of twinned regions on the sample using for example EBSD, since
for some bcc materials, under particular conditions, also slip nucleation can produce noticeable load
drops [23]. In the following, all the crystal orientations displaying twinning have been successively
analyzed using EBSD and, in some cases, also Transmission Electron Microscope (TEM). Moreover,
as already described in the previous section, the local strains associated with slip and twinning are
different. It follows that twinning can also be detected when a high local strain increment is measured
following the load drop.
In general, depending on the alloy composition and in particular grain orientations, twinning can
occur in conjunction with slip resulting in complex mechanical behavior which is difficult to detect and
track with classical experimental approaches. For example, following twin nucleation at a critical
resolved shear stress level (CRSS) τT, usually twin migration proceeds at a stress level τM which is
lower [23]. Twin migration is also the result of twin-twin and twin-slip dislocation reactions occurring
at twin boundaries. Experimental evidence of twin migration, supported by local strain
measurements, can provide further insight for developments of bcc plasticity models, in particular on
the hardening effect related to twin growth induced by twin/slip interactions. From the experimental
point of view, measuring τT and τM requires local strain measurements and knowledge of the
activated twin systems. The idea is to establish the twin nucleation and migration stresses using real
time in situ strain measurements. In the following section are described the experimental details
adopting incremental in situ DIC for correctly detect the τT and τM stresses.
1.2.1. IncrementalDigitalImageCorrelation
The complexity of the strain fields when both slip and twin activate and provide strain localizations
can be overcome using in situ incremental DIC. The idea is described schematically in Figure 1.8. In
the schematic is represented a general stress-strain curve for a crystal orientation that displays both

slip and tw
marked. E
point on th
between th
initiation o
Figureand twenabledetails
Following
between th
system. Tw
the Refere
provided b
contributio
the stress-
for examp
contributio
developed
winning defor
Each point re
he stress-str
he reference
n the meso-s
e 1.8. Schemwin migratioes the charas).
the stress-s
he Referenc
win nucleatio
ence Image w
by the strain
ons due to sl
-strain curve
ple, the cor
on of twin n
d till Image 2
rmation for a
efers to a pa
ain curve ma
e Image and
scale.
matic of theon stressesacterization
strain curve,
ce Image with
on occurs be
with Image 3
fields of bo
ip and twinn
e using as th
rrelation betw
nucleation o
2. An examp
particular lo
articular ima
arked as Ima
the Image 1
process for using in sof the stra
only one m
h Image 2 q
etween Image
3 provides th
th slip and t
ing. Increme
e reference
ween Image
on the strain
ple of strain
26
oad direction
age captured
age 1 refers
1 enables to
r the identifsitu DIC. Uin associate
main slip syst
uantifies the
e 2 and Ima
he strain field
twinning. In
ental DIC is i
image the p
e 2 and Im
n field, thus
fields obtai
. Along the s
d during the
s to the point
o capture the
ication of slsage of difed by each
tem is active
e strain accum
ge 3. The su
d in which the
this cases is
implemented
point of slip o
mage 3 ena
s neglecting
ned using in
stress-strain
experiment.
t of slip onse
e strain local
ip onset, twferent refermechanism
e till Image 2
mulation due
ubsequent co
e local strain
s useful to s
d correlating
or twin nucle
ables to em
the contrib
ncremental D
curve 5 poin
. For examp
et. The corre
lization due t
win nucleatiorences imag (see text f
2. The corre
e to the activ
orrelation be
n contribution
separate the
two images
eation. In this
mphasize onl
bution of th
DIC is repor
nts are
ple the
elation
to slip
on ge or
elation
ve slip
tween
ns are
strain
along
s case
ly the
e slip
rted in

Figur
Figur
displa
mark
stress
Incre
indica
the lo
meas
nucle
F
o
to
(i
im
1.3.
Other
chara
re 1.9 in wh
re 1.9 refers
ays both slip
ed A display
s-strain curv
mental DIC
ates that bet
ocalized stra
sured correla
eated twins a
igure 1.9.
r ientation in
o twin nucle
nset image
mplemented
Slipon
r important r
acterization o
ich incremen
to an experi
p and twinnin
ys the strain
ve, the reso
is used in t
tween point
ains detecte
ating point B
at τT.
Stress-stra
n compressi
ation occur
marked B
using the im
nsetinFe
results using
of the slip on
ntal DIC disp
ment on a co
ng (for more
n field due to
olved shear
this case to
B and point
ed on the in
B and point
ain curve a
ion. The ins
red at τT (tw
- Bi) is use
mage B as t
eCrsingle
both the in s
nset. Differe
27
plays twin m
ompression
details on th
o the activa
stress τT in
o detect twin
Bi there is a
nset strain fi
Bi indicates
and in situ
set image m
win systems
ed to show
the referenc
ecrystals
situ and ex s
ent DIC imag
migration. Th
sample 10[
his crystal or
tion of one
ndicates nuc
n migration.
a strain accu
ield A. It fo
s increment
u DIC stra
marked A sh
1 11 121[ ]( ) an
twin migra
ce.
s
situ DIC on t
ge resolution
e stress-stra
1] oriented.
rientation see
slip system.
cleation of tw
The inset st
umulation in
llows that th
of local stra
in measure
ows the loc
nd 111 121[ ]( ) )
t ion τM , the
he single cry
s can be us
ain curve int
This crystal
e Chapter 2)
. Proceeding
twins on two
train field m
a region dif
he strain ac
rains on the
ements for
calized strai
). Increment
e correlat ion
ystal sample
sed for estab
troduced in
orientation
). The inset
g along the
o systems.
marked B-Bi
fferent than
ccumulation
previously
10 1[ ]
ns due
tal DIC
ns was
s cover the
blishing the

critical res
resolution
formed on
acquisition
the estima
available w
Figurethree f ield aimage
The solutio
the elastic
interval of
[010] crys
and a fine
resolution
solved shear
images are
n the sampl
n since the im
ation of the
with the in sit
e 1.10. Highdifferent loa
after each los are acquir
on adopted i
c region of t
stresses be
stal orientatio
e speckle has
of 0.87 µm/p
r stress for s
required to c
le surface.
mage acquis
point of sli
tu set-up.
h resolution ad stages. Hoad stage ared out of th
n the followi
the stress-st
etween which
on in compre
s been depo
px (nominal
slip onset τS.
capture the s
As previous
sition proces
p onset req
DIC strain High resolutl lowing to e
he load fram
ng is to use
train curve (
h slip initiate
ession. One
osed on the
5x magnifica
28
Along this w
strain localiza
sly described
s is obtained
quires higher
fields (5x) ot ion images estimate theme using an
ex situ DIC
(Figure 1.10)
es. The exam
side of the s
target surfac
ation) has be
work, ex situ
ations develo
d, ex situ D
d out of the
r image res
obtained aftal low to ca
e stress requoptical micr
implementin
). In this wa
mple reporte
sample has b
ce. 40 image
een captured
u DIC was ad
oping from th
DIC is not a
load frame. A
olution than
er loading tapture the reuired to initroscope.
g different sm
ay is possibl
ed in Figure
been prepare
es of the targ
d before the
dopted since
he initial slip t
a real-time
At the same
n the typical
the sample esidual straiate sl ip. Th
mall load ste
le to estima
1.10 refers
ed for ex situ
get surface w
experiment
e high
traces
strain
e time,
ones
at in
he
eps on
te the
to the
u DIC,
with a
(virgin
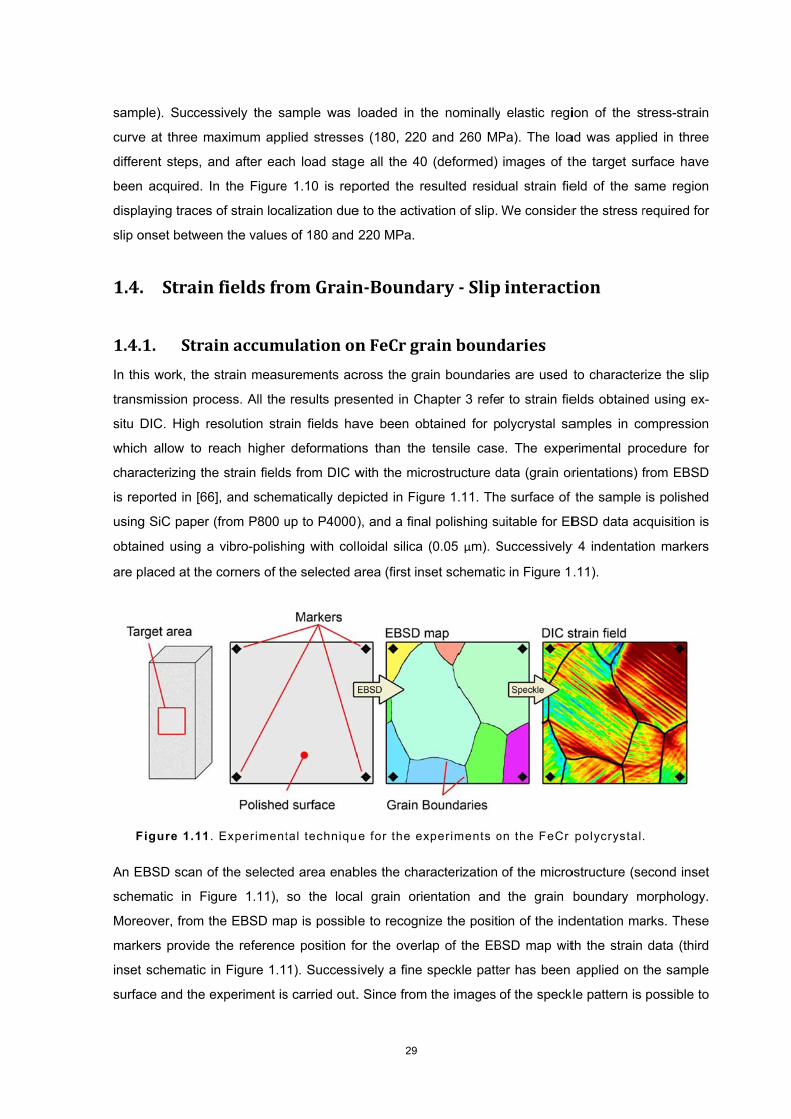
samp
curve
differ
been
displa
slip o
1.4.
1.4.1
In thi
trans
situ D
which
chara
is rep
using
obtain
are p
F
An E
schem
More
mark
inset
surfa
ple). Succes
e at three m
ent steps, a
acquired. In
aying traces
onset betwee
Strain
1. Strai
s work, the s
mission proc
DIC. High re
h allow to re
acterizing the
ported in [66
g SiC paper (
ned using a
placed at the
igure 1.11 .
BSD scan o
matic in Fig
eover, from th
ers provide
schematic i
ce and the e
sively the sa
aximum app
nd after eac
n the Figure
of strain loca
en the values
fieldsfro
inaccumu
strain measu
cess. All the
esolution stra
each higher
e strain fields
], and schem
(from P800 u
vibro-polish
corners of th
Experiment
f the selecte
gure 1.11),
he EBSD ma
the referenc
n Figure 1.1
experiment is
ample was
plied stresses
ch load stage
e 1.10 is rep
alization due
s of 180 and
omGrain
ulationon
urements ac
results pres
ain fields ha
deformation
s from DIC w
matically dep
up to P4000)
hing with coll
he selected a
tal techniqu
ed area enab
so the loca
ap is possibl
ce position fo
1). Success
s carried out.
29
loaded in th
s (180, 220
e all the 40
ported the re
e to the activa
220 MPa.
n‐Bounda
nFeCrgra
cross the gra
sented in Ch
ave been ob
ns than the
with the micr
picted in Figu
), and a fina
loidal silica
area (first ins
e for the ex
bles the char
al grain orie
e to recogniz
or the overla
ively a fine s
. Since from
he nominally
and 260 MP
(deformed)
esulted resid
ation of slip.
ary‐Slip
ainbound
ain boundarie
hapter 3 refe
btained for p
tensile case
rostructure d
ure 1.11. The
l polishing su
(0.05 μm). S
set schematic
periments o
racterization
entation and
ze the positi
ap of the EB
speckle patte
the images
elastic regi
Pa). The loa
images of th
ual strain fie
We consider
interact
daries
es are used
r to strain fie
olycrystal sa
e. The expe
data (grain or
e surface of
uitable for EB
Successively
c in Figure 1
on the FeCr
of the micro
the grain
on of the ind
BSD map wit
er has been
of the speck
ion of the s
ad was appli
he target su
eld of the sa
r the stress r
tion
to character
elds obtained
amples in co
erimental pro
rientations) f
the sample
BSD data ac
y 4 indentatio
.11).
polycrystal.
ostructure (se
boundary m
dentation ma
th the strain
applied on
kle pattern is
tress-strain
ed in three
urface have
ame region
required for
rize the slip
d using ex-
ompression
ocedure for
from EBSD
is polished
cquisition is
on markers
.
econd inset
morphology.
arks. These
data (third
the sample
possible to

detect the
obtained.
orientation
the trace a
grain boun
grain bou
polycrysta
Figure 1.1
boundary.
was possi
are availa
through a
with the re
residual B
of the grain
Figurerefer tfrom twith th
Special co
Figure 1.1
same show
were deter
was overla
the surface
position of t
This experim
n prior loadin
analysis for
ndary map w
ndaries whi
l hardening.
2 shows an
While with t
ble to chara
able with the
measure of
esult of the
urgers vecto
n boundary t
e 1.12. Strao the grain he EBSD dahe measured
odes for the c
3 shows an
wn in Figure
rmined using
apped at the
e. In order to
he indentatio
mental appr
ng and the d
slip and twi
with the resid
ch represen
n example o
the approach
cterize the r
ese techniqu
f the strain g
dislocation
or to predict t
to the materi
ain f ield in boundary re
ata acquiredd strain f ield
calculation o
n example of
e 1.12. The
g EBSD. Suc
EBSD map
o establish t
on markers, t
roach has tw
irection of th
n indexing (
dual strain fie
nts a critica
f the local s
hes adopted
reaction occu
ues. The ide
gradient acro
reaction. Th
the strain gra
al strengthen
proximity oeported in thd allow the id.
of the strains
f such calcu
crystal orien
ccessively the
. The strain
the strain fie
30
the final ove
wo main ad
he slip traces
(see Section
eld enables
l aspect on
strains assoc
in the literat
urring at the
ea pursued
oss the grain
e idea is to
adient at the
ning.
f a Grain Bhe EBSD maindexing of
across the g
ulation. The
ntation of the
e strain field
localizations
eld across th
rlap of the gr
dvantages. F
s on the sam
n 1.5). Secon
to character
n the grain
ciated with t
ture (as show
grain bound
here is to
n boundary,
show the p
e grain bound
Boundary. Tap. The graithe sl ip sys
grain bounda
strain field r
e grains, and
obtained us
s along band
e grain boun
rain map with
First of all k
mple surface
ndly, the ove
rize the strai
boundary c
the slip trace
wn for examp
dary, no stra
characterize
and relate th
possibility of
daries, and s
he strain min orientatiotems and th
aries are ado
reported in F
d the grain
sing high reso
s indicate th
ndary, and m
h the strain f
knowing the
is possible t
erlap betwee
in field acros
characterizat
es across a
ple in Figure
ain measure
e the slip pr
his strain gr
the usage
so the contri
measuremenon determinehe correlat io
opted in this
Figure 1.13
boundary po
olution ex sit
e traces of s
measure the
field is
grain
to use
en the
ss the
ion in
grain
e 1.4b)
ments
rocess
adient
of the
bution
ts ed on
work.
is the
osition
tu DIC
slip on
strain

gradi
Succ
recta
meas
selec
for th
Fmfothadb
The f
this c
is det
Burge
allow
trans
1.4.2
Strain
in Se
same
ent across
essively wa
ngular selec
surements a
ction side (pe
e Grain 1 so
igure 1.13magnitude aor the case he DIC straveraged, anetermined boundary det
final plot obta
case the stra
tected. In Ch
ers vector m
wing to derive
mission proc
2. Strai
n accumulati
ection 1.4.1 (
e experimen
it, a rectang
s determine
ction and the
and the grai
erpendicular
ome points be
3. Strain mssociated wreported in
ain f ields. And the f inalbetween thetermined pro
ained averag
in values ap
hapter 3 are
magnitudes. T
e important
cess.
inaccumu
ion on TiAl s
Figure 1.11)
ntal approac
gular selecti
ed the distan
e grain boun
n boundary
to the grain
elonging to G
measuremenwith the inco
Figure 1.1All the exp value is pl
e center of tojecting the
ging the stra
proaching th
also derived
These inform
consideratio
ulationon
samples is s
) for FeCr po
h for the T
31
ion of strain
nce betwee
ndary. The m
is represen
boundary),
Grain 2.
t methodoloming slip s2. The blac
perimental slotted versuthe rectang center of th
ains across th
he grain boun
d the disloca
mation help
ons on the r
nTiAl
studied follow
olycrystal sam
iAl experime
n measurem
n the coord
minimum dist
nted by half
avoiding to i
ogy for thsystem app
ck box represtrain valueus the distaular selectiohe selection
he grain bou
ndary are sim
ation reaction
in understan
role of the r
wing the sam
mples. Figur
ents. Due to
ments are ca
inates of th
tance betwee
f of the len
include in the
e calculat iroaching th
esents the ss containednce from th
on and the on the grai
ndary is rep
milar, a full s
ns for the es
nding the str
esidual Burg
me experime
e 1.14 show
o the fine m
aptured and
he central p
en the avera
gth of the
e strain mea
on of the e Grain Bo
selected regd in this bhe grain bopoint on thein boundary
ported in Figu
strain transm
stimation of t
rain plot obta
gers vector
ntal approac
ws the applica
microstructur
averaged.
oint of the
aged strain
rectangular
asurements
strain undary
gion on ox are undary e grain .
ure 1.13. In
ission case
he residual
ained, thus
on the slip
ch depicted
ation of the
re and the
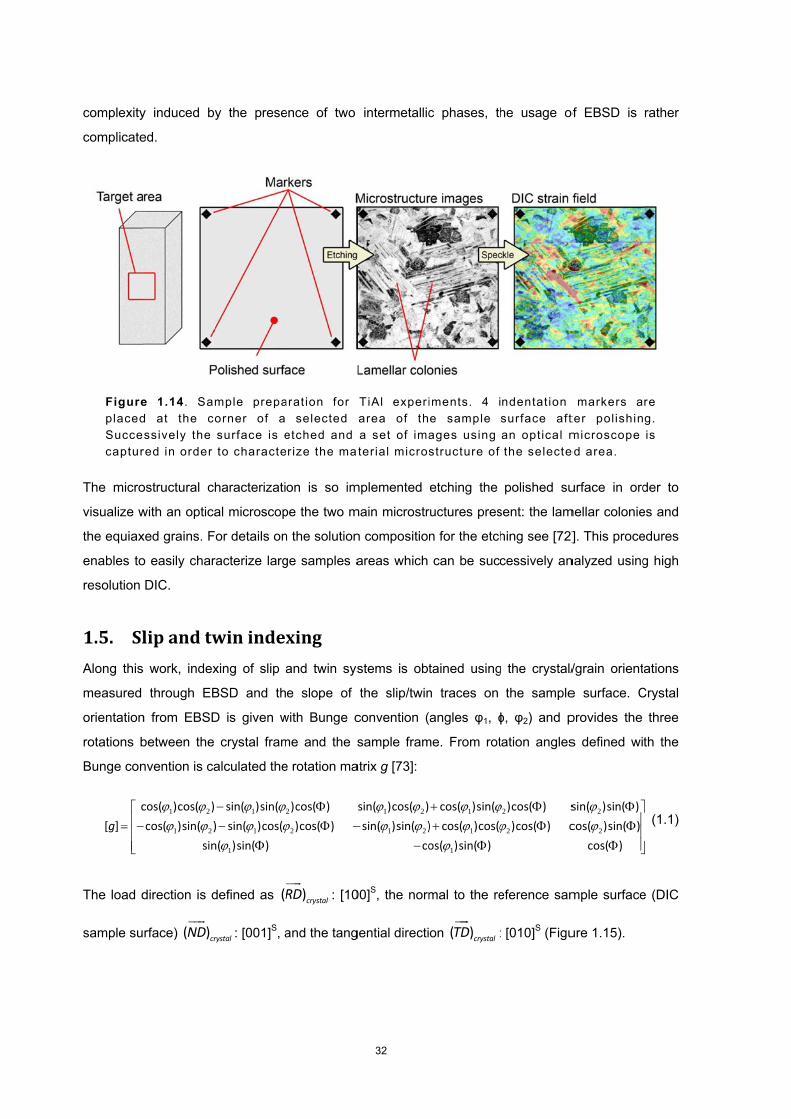
complexity
complicate
FigureplacedSuccecaptur
The micro
visualize w
the equiax
enables to
resolution
1.5. Sl
Along this
measured
orientation
rotations b
Bunge con
c
[ ]g
The load d
sample su
y induced b
ed.
e 1.14. Sad at the cssively the
red in order
ostructural c
with an optica
xed grains. F
o easily char
DIC.
lipandtw
s work, index
through EB
n from EBSD
between the
nvention is ca
1 2
1 2
cos( )cos( )
cos( )sin( )
sin
direction is d
rface) ( )cr
ND
y the prese
mple prepaorner of asurface is eto characte
haracterizati
al microscop
For details on
racterize larg
winindex
xing of slip
BSD and th
D is given w
crystal fram
alculated the
1
1
1
sin( )sin(
) sin( )cos(
n( )sin( )
defined as (R
rystal : [001]S, a
ence of two
aration for selected etched and rize the ma
on is so im
pe the two m
n the solution
ge samples a
and twin sys
e slope of
with Bunge c
me and the s
e rotation ma
2
2
)cos( )
)cos( )
)crystal
RD
: [10
and the tang
32
intermetallic
TiAl experiarea of tha set of imaterial micros
mplemented
main microstr
n compositio
areas which
stems is obt
the slip/twin
convention (
sample fram
atrix g [73]:
1 2
1 2
sin( )cos( )
sin( )sin( )
co
00]S, the norm
gential directi
c phases, th
iments. 4 ie sample ages using structure of
etching the
ructures pres
n for the etch
can be succ
tained using
n traces on
angles φ1, ϕ
me. From rot
1
1
1
cos( )sin(
) cos( )cos(
os( )sin( )
mal to the re
on ( )crystal
TD
:
he usage of
ndentation surface aftan optical mthe selecte
polished su
sent: the lam
hing see [72]
cessively an
g the crystal/
the sample
ϕ, φ2) and p
tation angles
2
2
)cos( ) s
)cos( ) c
eference sam
: [010]S (Figu
of EBSD is
markers ater polishinmicroscope
ed area.
urface in ord
mellar colonie
]. This proce
nalyzed using
/grain orient
e surface. C
provides the
s defined wi
2
2
sin( )sin( )
cos( )sin( )
c
os( )
mple surface
ure 1.15).
rather
re g. is
der to
es and
edures
g high
ations
Crystal
three
th the
(1.1)
e (DIC
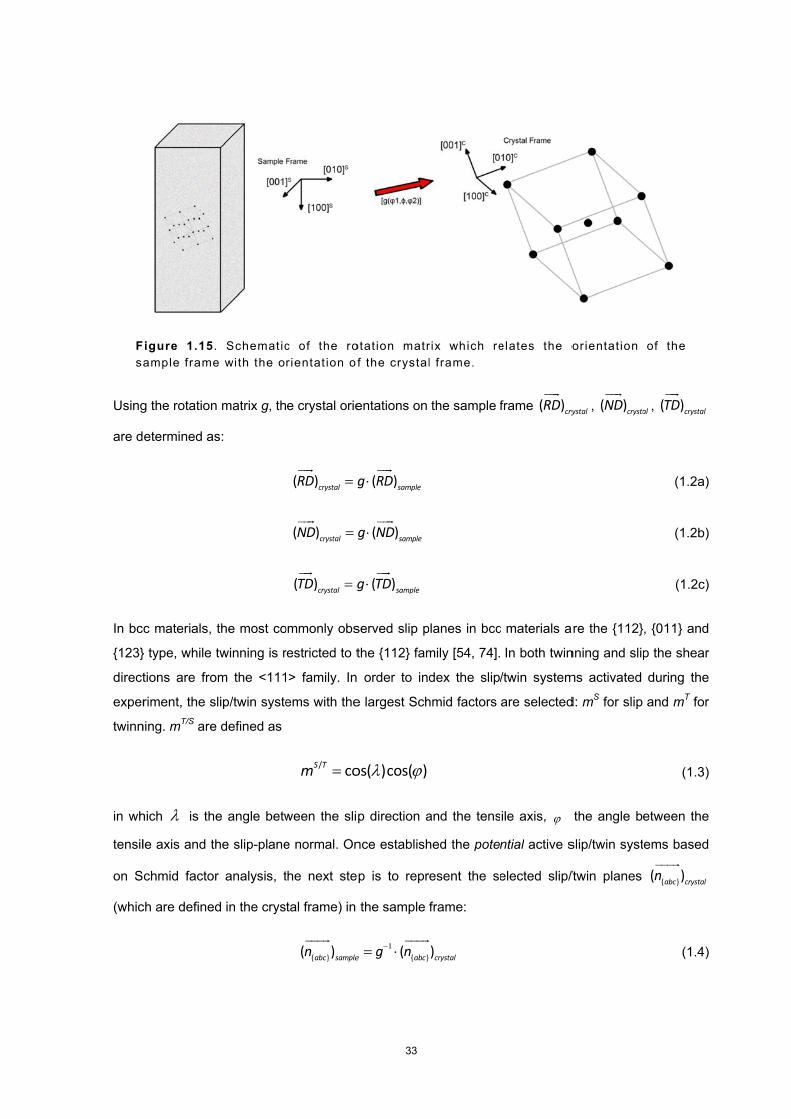
Fs
Using
are d
In bc
{123}
direct
exper
twinn
in wh
tensil
on S
(whic
igure 1.15ample frame
g the rotation
etermined as
c materials,
} type, while
tions are fro
riment, the s
ning. mT/S are
hich is th
le axis and t
chmid facto
ch are define
. Schematice with the o
n matrix g, th
s:
the most co
twinning is r
om the <111
slip/twin syste
e defined as
e angle betw
he slip-plane
r analysis, t
d in the crys
c of the rorientation of
e crystal orie
( )crystal
RD g
( )crystal
ND
( )crystal
TD g
ommonly obs
restricted to t
> family. In
ems with the
/ coS Tm
ween the sli
e normal. On
the next ste
tal frame) in
{ }( )
abc samplen
33
otation matrf the crystal
entations on
( )sample
g RD
( )sample
g ND
( )sample
g TD
served slip p
the {112} fam
order to ind
e largest Sch
os( )cos( )
p direction a
nce establish
p is to repr
the sample
1
{ }(
e abcg n
r ix which rel frame.
the sample f
planes in bcc
mily [54, 74].
dex the slip/
hmid factors
and the tens
hed the pote
esent the se
frame:
)crystal
elates the o
frame ( )cry
RD
c materials a
In both twin
/twin system
are selected
ile axis,
ntial active s
elected slip/
orientation
rystal , ( )crysta
ND
are the {112}
nning and slip
ms activated
d: mS for slip
the angle be
slip/twin syst
/twin planes
of the
al , ( )crystal
TD
(1.2a)
(1.2b)
(1.2c)
, {011} and
p the shear
during the
and mT for
(1.3)
etween the
ems based
{ }( )
abc crystaln
(1.4)

Successiv
sample fra
From equ
compared
Figureslip pl
ely is determ
ame { }( )
abc samn
ation 1.5 is
with the slip
e 1.16. Slip anes (see te
mined the p
mple with the p
(tra
obtained a
p/twin traces
traces on text for deta
projection of
lane defining
) (sample
ace n
a vector whi
experimenta
the sample i ls).
34
f the interse
g the analyze
{ }) (
abc samplen N
ch lies on t
ally observed
surface whi
ction betwee
ed sample su
)sample
ND
the ( )sampl
ND
d on the sam
ich are com
en the slip/t
urface ( )sa
ND
le plane. Th
ple surface (
pared with
twin plane o
ample
his vector ca
(Figure 1.16)
the projecte
on the
(1.5)
an be
).
ed
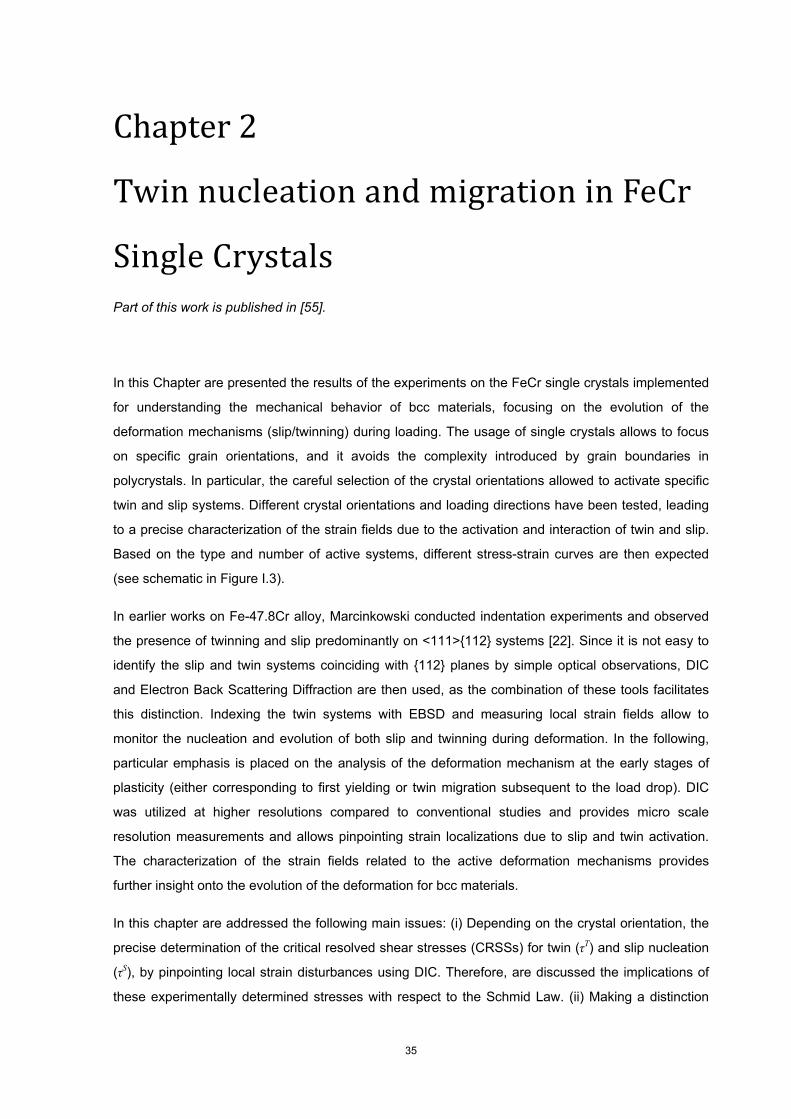
35
Chapter2
TwinnucleationandmigrationinFeCr
SingleCrystalsPart of this work is published in [55].
In this Chapter are presented the results of the experiments on the FeCr single crystals implemented
for understanding the mechanical behavior of bcc materials, focusing on the evolution of the
deformation mechanisms (slip/twinning) during loading. The usage of single crystals allows to focus
on specific grain orientations, and it avoids the complexity introduced by grain boundaries in
polycrystals. In particular, the careful selection of the crystal orientations allowed to activate specific
twin and slip systems. Different crystal orientations and loading directions have been tested, leading
to a precise characterization of the strain fields due to the activation and interaction of twin and slip.
Based on the type and number of active systems, different stress-strain curves are then expected
(see schematic in Figure I.3).
In earlier works on Fe-47.8Cr alloy, Marcinkowski conducted indentation experiments and observed
the presence of twinning and slip predominantly on <111>{112} systems [22]. Since it is not easy to
identify the slip and twin systems coinciding with {112} planes by simple optical observations, DIC
and Electron Back Scattering Diffraction are then used, as the combination of these tools facilitates
this distinction. Indexing the twin systems with EBSD and measuring local strain fields allow to
monitor the nucleation and evolution of both slip and twinning during deformation. In the following,
particular emphasis is placed on the analysis of the deformation mechanism at the early stages of
plasticity (either corresponding to first yielding or twin migration subsequent to the load drop). DIC
was utilized at higher resolutions compared to conventional studies and provides micro scale
resolution measurements and allows pinpointing strain localizations due to slip and twin activation.
The characterization of the strain fields related to the active deformation mechanisms provides
further insight onto the evolution of the deformation for bcc materials.
In this chapter are addressed the following main issues: (i) Depending on the crystal orientation, the
precise determination of the critical resolved shear stresses (CRSSs) for twin (τT) and slip nucleation
(τS), by pinpointing local strain disturbances using DIC. Therefore, are discussed the implications of
these experimentally determined stresses with respect to the Schmid Law. (ii) Making a distinction

between tw
particular
cases of s
confirmed
2.1. Ex
2.1.1.
Single crys
technique
and a 10 m
0 10[ ] and
Figureusing cross-contro
Compress
loading ax
side of the
and throug
(EBSD). P
quench.
win nucleati
their influenc
slip-twin inte
with DIC res
xperime
Sampleg
stals of FeC
in a He atmo
mm gage len
d 10 1[ ] crys
e 2.1. SampElectron-Disection and
ol.
sion samples
xis was norm
e sample. Th
gh the thickn
Prior to loadi
on τT and tw
ce on the fo
eraction, whi
sults.
ntalsetu
geometri
Cr with a com
osphere. Ten
ngth were el
stallographic
ple geometrischarged M
d a 10 mm g
s were also s
mal to the 1[
e crystallogr
ness of each
ng, all samp
win migration
ormation of la
ich leads to
up
es
mposition of 4
nsile dog-bo
ectro-discha
directions (F
y adopted fMachining (gage. The e
sectioned into
0 1] , 11 1[ ]
raphic orienta
h sample, w
ples were so
36
n τM critical
arge local st
impedance
47.8 wt. % C
ne shaped s
arged machin
Figure 2.1).
for tension EDM). The
experiments
o 4 mm x 4 m
, 0 10[ ] , an
ations in the
were determi
olution annea
stresses. (ii)
trains and in
of slip and
Cr were man
specimens w
ned (EDM) w
experimentssamples hwere gener
mm x 10 mm
nd 314[ ] plan
other two di
ned using e
aled at 900
) The interac
ncrease in ha
ensuing str
nufactured us
ith a 1.5 x 3
with the load
s. The sampave a 1.5
ral ly conduc
m using EDM
nes and para
irections, i.e.
electron back
ºC for 1h fol
ctions of twi
ardening. (iv
rain hardeni
sing the Brid
mm cross-s
ing axis alon
ples were cmm x 3 m
cted on stra
M (Figure 2.2
allel to the 1
., across the
kscatter diffr
llowed by a
ins, in
v) The
ng as
dgman
ection
ng the
ut m in
). The
0 mm
width
action
water

Fcc
The e
Tens
while
2.1.2
The w
Chap
crysta
in situ
for a
samp
lower
for co
case
igure 2.2. Sut using Eleross-section
experiments
ion experime
e compressio
2. Digit
work present
pter 1). The s
al orientation
u DIC metho
tension sam
ples before th
r resolution (
ompression e
of compress
Sample geoectron-Discn. The expe
were condu
ents were c
on experimen
talImage
ted in this ch
stresses nece
ns using real
odology was
mple (Figure
he experime
(tension: 2.40
experiments
sive loads.
metry adoptharged Macriments wer
ucted at room
onducted on
nts were run
Correlati
hapter is mai
essary to nu
time strain m
2.5 µm/px. I
2.3a) and c
nt in the un-
0 µm/px vers
is higher, an
37
ted for comchining (EDre generally
m temperatu
n strain cont
in displacem
ionsetup
inly based on
cleate slip a
measuremen
n Figure 2.3
compression
-tested condi
sus compres
nd since duri
pression exM). The saconducted
ure by mean
trol, using a
ment control,
p
n experimen
nd twinning w
nts. The reso
3 are reported
sample (Fig
itions. For th
ssion: 3.94 µm
ing the test t
periments. Tmples haveon displace
ns of a servo
5 mm gage
both at a stra
ts conducted
were determ
olution of the
d two examp
gure 2.3b). T
he compressi
m/px) since t
he width of t
The samplee a 4 mm xment contro
o hydraulic l
e length exte
rain rate of 5X
d using in sit
mined for diffe
images cap
ples of spack
The images r
ion sample w
the width of
the sample in
s were 4 mm
ol.
oad frame.
ensometer,
X10-5 s.1.
tu DIC (see
erent single
tured using
kle patterns
refer to the
was used a
the sample
ncreases in
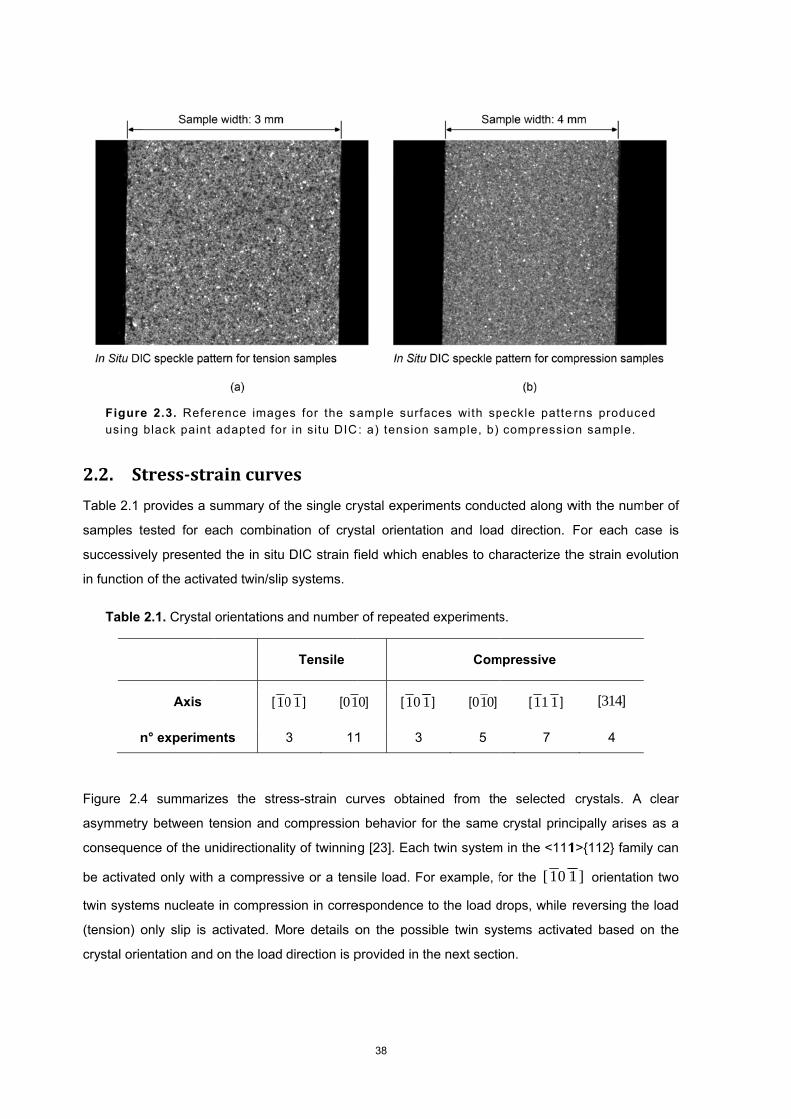
Figureusing
2.2. St
Table 2.1
samples t
successive
in function
Table
n
Figure 2.4
asymmetry
consequen
be activate
twin system
(tension) o
crystal orie
e 2.3. Referblack paint
tress‐str
provides a s
ested for ea
ely presented
of the activa
2.1. Crystal
Axis
n° experime
4 summariz
y between te
nce of the un
ed only with
ms nucleate
only slip is a
entation and
rence imageadapted for
aincurve
summary of t
ach combina
d the in situ
ated twin/slip
orientations
10[
ents
es the stre
ension and c
nidirectionali
a compress
in compress
activated. M
on the load
es for the sar in situ DIC
es
the single cry
ation of crys
DIC strain f
p systems.
and number
Tensile
0 1] 01[
3 11
ss-strain cu
compression
ty of twinning
sive or a tens
sion in corre
ore details o
direction is p
38
ample surfa: a) tension
ystal experim
stal orientati
field which e
r of repeated
0] 10 1[
1 3
urves obtain
n behavior fo
g [23]. Each
sile load. Fo
espondence t
on the poss
provided in th
aces with sp sample, b)
ments condu
on and load
nables to ch
experiments
Com
] 010[ ]
5
ned from th
or the same
twin system
or example, f
to the load d
ible twin sys
he next secti
peckle pattecompressio
cted along w
d direction.
haracterize th
s.
mpressive
11 1[ ]
7
e selected
crystal princ
m in the <111
for the [10 1
drops, while r
stems activa
on.
erns produceon sample.
with the num
For each ca
he strain evo
314[ ]
4
crystals. A
cipally arises
1>{112} fami
1] orientatio
reversing the
ated based o
ed
ber of
ase is
olution
clear
s as a
ly can
on two
e load
on the
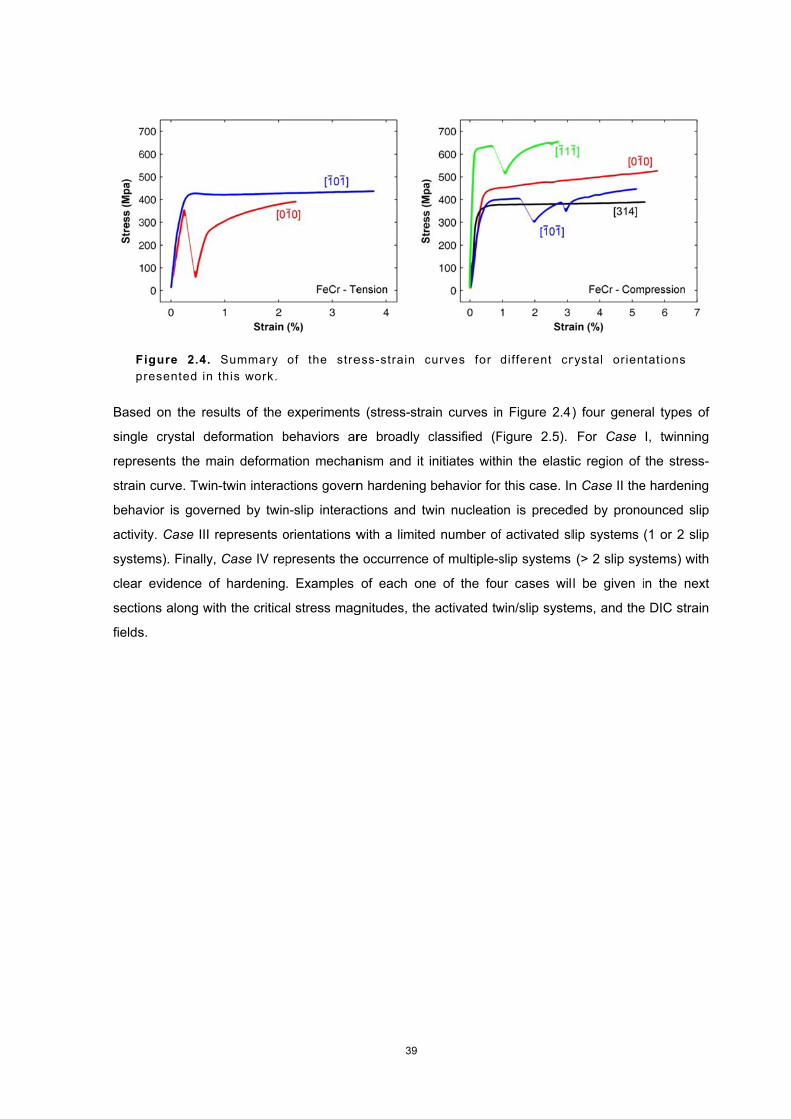
Fp
Base
single
repre
strain
behav
activi
syste
clear
sectio
fields
igure 2.4. resented in
ed on the res
e crystal de
esents the m
n curve. Twin
vior is gove
ty. Case III
ems). Finally,
evidence o
ons along wi
s.
Summary this work.
sults of the
eformation b
main deforma
n-twin interac
rned by twin
represents o
, Case IV rep
of hardening
ith the critica
of the stre
experiments
behaviors ar
ation mechan
ctions govern
n-slip interac
orientations w
presents the
. Examples
al stress mag
39
ess-strain c
s (stress-stra
re broadly c
nism and it
n hardening
ctions and tw
with a limited
e occurrence
of each on
gnitudes, the
curves for
ain curves in
classified (F
initiates with
behavior for
win nucleatio
d number of
of multiple-s
e of the fou
e activated tw
different cr
n Figure 2.4)
Figure 2.5).
hin the elasti
r this case. In
on is preced
f activated sl
slip systems
ur cases wil
win/slip syste
rystal orien
) four gener
For Case
ic region of
n Case II the
ded by prono
lip systems
(> 2 slip sys
l be given i
ems, and the
tations
ral types of
I, twinning
the stress-
e hardening
ounced slip
(1 or 2 slip
stems) with
in the next
e DIC strain

Figureslip nmult ipactive
by twitwin-scharacsystem
2.3. A
The most
twinning is
<111> fam
the loading
the activat
using Schm
e 2.5. Scheucleation (τlying the aslip (mS) an
n-twin interl ip interacticterized by ms develop
Activated
commonly
s restricted t
mily. The acti
g direction (t
ted slip/twin
mid Factors
ematic of thτS), twin nuxial stress
nd/or twin (m
ractions. In ons dominaa l imited nleading to c
twinand
observed sli
o the {112}
ivation of cer
tension vers
systems is t
[75]: mS for s
/S
e possible ucleation (τT
in the loadmT) systems
Case II laate the hardumber of arystal harde
dslipsys
ip planes in
family. In bo
rtain twin/slip
us compress
the calculatio
slip and mT fo
/ /T Sm
40
crystal defoT) and twinding directios. Case I rep
rge sl ip acdening. Casctivated sl ip
ening.
stems
bcc materia
oth twinning
p systems de
sion). One o
on of the re
or twinning. m
/ cos(T
ormation be migration
on with thepresents cry
tivity precee III represp systems.
als are the
and slip the
epends on b
of the widely
solved shea
mS/T are defin
( )cos( )
haviors. Th(τM) are de Schmid fa
ystal harden
des twin nuents crystaIn Case IV
{112}, {011}
shear direct
both the cryst
used approa
r stress on t
ed as
he CRSSs fetermined b
actors for thning governe
ucleation anl orientation mult iple sl
} and {123},
ctions are fro
tal orientatio
aches to est
the slip/twin
or by he ed
nd ns ip
while
om the
on and
tablish
plane
(2.1)
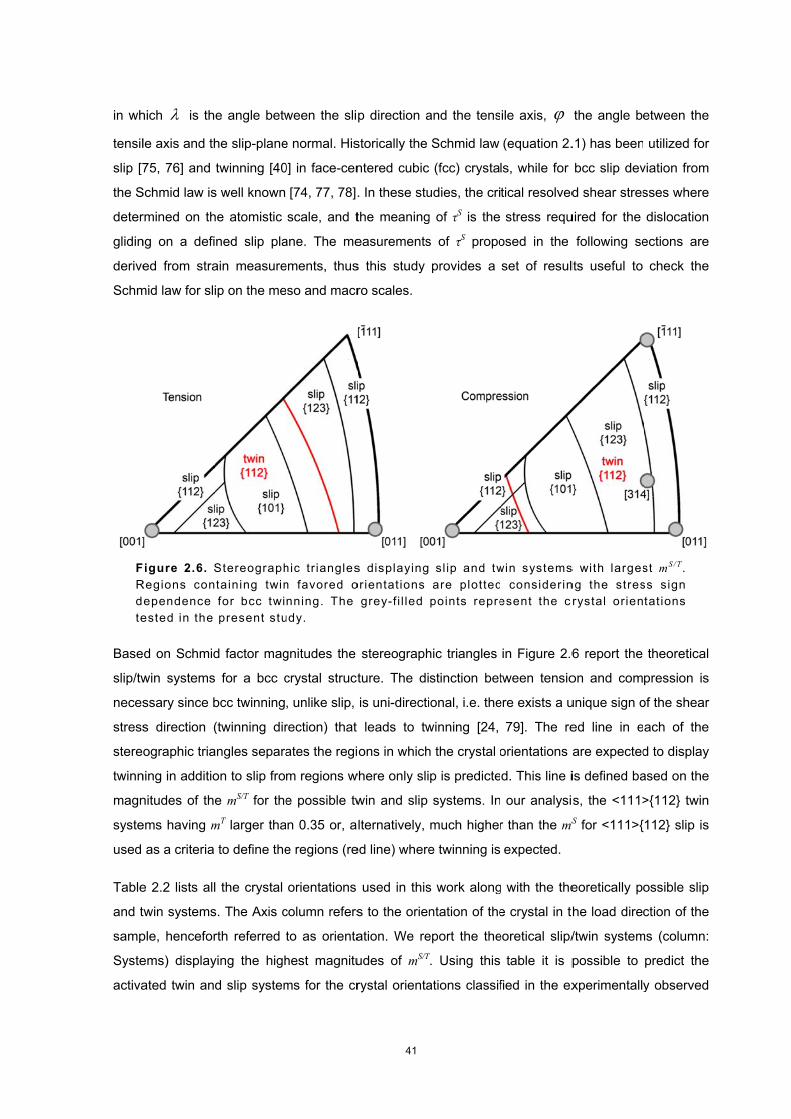
in wh
tensil
slip [7
the S
deter
glidin
derive
Schm
FRdte
Base
slip/tw
neces
stress
stere
twinn
magn
syste
used
Table
and t
samp
Syste
activa
hich is th
le axis and th
75, 76] and
Schmid law is
rmined on th
ng on a defi
ed from stra
mid law for sl
igure 2.6. SRegions con
ependence ested in the
ed on Schmid
win systems
ssary since b
s direction (
ographic tria
ning in additio
nitudes of th
ems having m
as a criteria
e 2.2 lists all
twin systems
ple, hencefor
ems) display
ated twin an
e angle betw
he slip-plane
twinning [40
s well known
he atomistic
ned slip pla
ain measure
ip on the me
Stereographtaining twinfor bcc twipresent stu
d factor mag
s for a bcc c
bcc twinning
(twinning dir
angles separa
on to slip fro
e mS/T for the
mT larger tha
to define the
l the crystal
s. The Axis c
rth referred
ying the high
d slip system
ween the sli
e normal. His
0] in face-cen
[74, 77, 78].
scale, and t
ane. The me
ements, thus
eso and macr
hic tr ianglesn favored onning. The
udy.
gnitudes the
crystal struct
, unlike slip,
rection) that
ates the regi
m regions w
e possible tw
an 0.35 or, a
e regions (re
orientations
column refers
to as orienta
hest magnitu
ms for the cr
41
p direction a
storically the
ntered cubic
. In these stu
the meaning
easurements
s this study
ro scales.
s displayingorientations
grey-f i l led
stereograph
ture. The di
is uni-directi
leads to tw
ons in which
where only sli
win and slip
lternatively,
ed line) where
used in this
s to the orien
ation. We re
udes of mS/T
rystal orienta
and the tens
Schmid law
(fcc) crysta
udies, the cri
g of τS is the
s of τS propo
provides a
sl ip and tware plottedpoints repre
hic triangles
stinction bet
ional, i.e. the
winning [24,
h the crystal o
p is predicte
systems. In
much higher
e twinning is
s work along
ntation of the
eport the theT. Using this
ations classif
ile axis,
(equation 2.
ls, while for
tical resolved
stress requ
osed in the
set of resul
win systems considerin
esent the c
in Figure 2.6
tween tensio
ere exists a u
79]. The re
orientations
d. This line i
our analysi
r than the mS
expected.
g with the the
e crystal in t
eoretical slip/
table it is p
fied in the ex
the angle be
.1) has been
bcc slip dev
d shear stres
uired for the
following se
lts useful to
s with largesng the stresrystal orien
6 report the
on and com
unique sign o
ed line in e
are expected
is defined ba
s, the <111>
S for <111>{
eoretically po
the load direc
/twin system
possible to
xperimentally
etween the
utilized for
viation from
sses where
dislocation
ections are
check the
st mS/T. ss sign tat ions
theoretical
pression is
of the shear
ach of the
d to display
ased on the
>{112} twin
112} slip is
ossible slip
ction of the
ms (column:
predict the
y observed
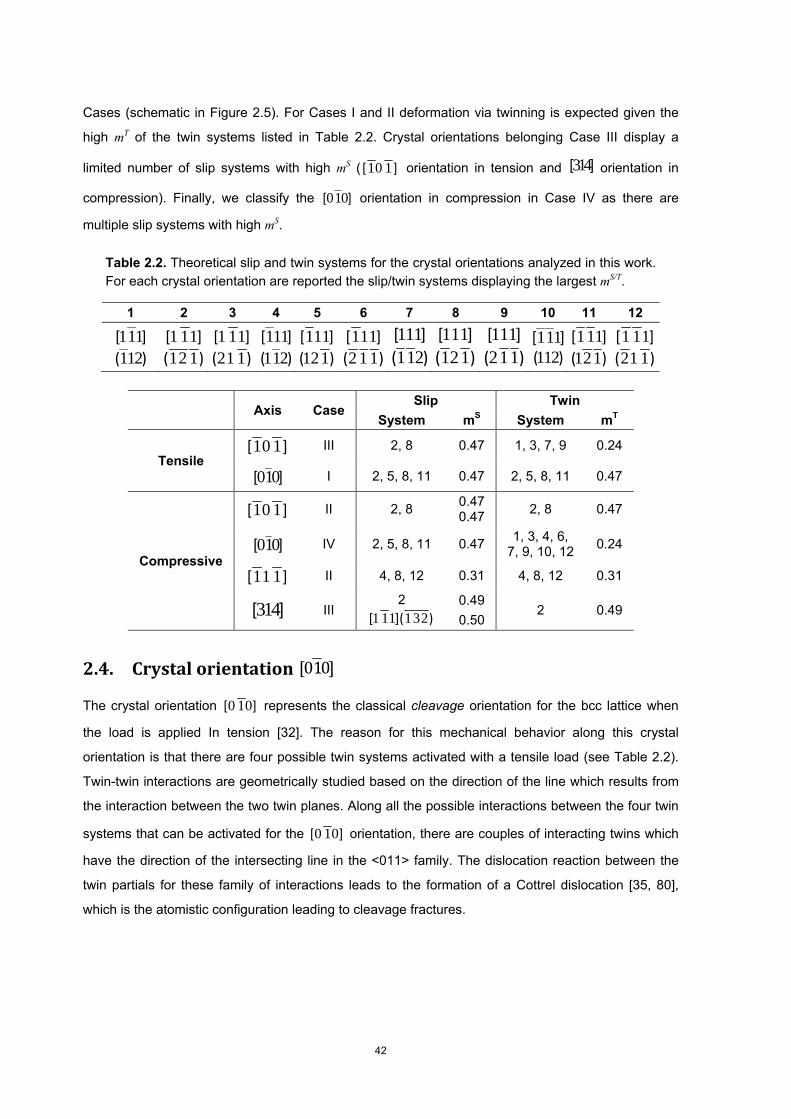
42
Cases (schematic in Figure 2.5). For Cases I and II deformation via twinning is expected given the
high mT of the twin systems listed in Table 2.2. Crystal orientations belonging Case III display a
limited number of slip systems with high mS ( 10 1[ ] orientation in tension and 314[ ] orientation in
compression). Finally, we classify the 010[ ] orientation in compression in Case IV as there are
multiple slip systems with high mS.
Table 2.2. Theoretical slip and twin systems for the crystal orientations analyzed in this work. For each crystal orientation are reported the slip/twin systems displaying the largest mS/T.
1 2 3 4 5 6 7 8 9 10 11 12
111112[ ]
( ) 1 1112 1[ ]
( ) 1 1121 1[ ]
( ) 111112[ ]
( ) 111121[ ]
( )
1112 1 1[ ]
( )
111112[ ]
( )
111121[ ]
( )
111211[ ]
( )111112[ ]( )
111121[ ]
( ) 1 1121 1[ ]
( )
Axis Case Slip Twin
System mS System mT
Tensile 10 1[ ] III 2, 8 0.47 1, 3, 7, 9 0.24
010[ ] I 2, 5, 8, 11 0.47 2, 5, 8, 11 0.47
Compressive
10 1[ ] II 2, 8 0.47 0.47
2, 8 0.47
010[ ] IV 2, 5, 8, 11 0.47 1, 3, 4, 6,
7, 9, 10, 12 0.24
11 1[ ] II 4, 8, 12 0.31 4, 8, 12 0.31
314[ ] III 2
1 11 132[ ]( ) 0.49
0.50 2 0.49
2.4. Crystalorientation[010]
The crystal orientation 0 10[ ] represents the classical cleavage orientation for the bcc lattice when
the load is applied In tension [32]. The reason for this mechanical behavior along this crystal
orientation is that there are four possible twin systems activated with a tensile load (see Table 2.2).
Twin-twin interactions are geometrically studied based on the direction of the line which results from
the interaction between the two twin planes. Along all the possible interactions between the four twin
systems that can be activated for the 0 10[ ] orientation, there are couples of interacting twins which
have the direction of the intersecting line in the <011> family. The dislocation reaction between the
twin partials for these family of interactions leads to the formation of a Cottrel dislocation [35, 80],
which is the atomistic configuration leading to cleavage fractures.

2.4.1
Figur
repor
load d
high
inset
orient
more
match
locali
onset
onset
F
tesτT
fo
th(b
1. Tens
re 2.7 show
rted strains o
direction) in
resolution D
image mark
tation, we pr
e details see
hes the trac
zed strains
t of slip and
t of slip is τS=
igure 2.7.
ension (Caslip. ProceedT. The inset
our twin sys
he local strabands) form
sionexpe
s the stress
on the x-axis
the region co
DIC measure
ked A in Fig
roject all of t
Section 1.5)
ce of the 1[
appear mar
d the activate
=85 MPa (equ
Stress-strai
se I). The inding along tht image mar
stems in the
ain incremened at τT.
eriments
s-strain curv
s correspond
overed by D
ments indica
gure 2.7 (no
he possible s
). For the ins
11 1 121]( ) sl
ks the onse
ed slip syste
uation 2.1).
n curve and
nset image he stress-strked B disp
e 111 112{ nts visualize
43
ve for the 0[
d to the DIC
IC. In the no
ate localized
otice the hig
slip planes (
set marked A
lip system w
t of slip σS=
em (from tra
d DIC strain
marked A train curve tlays localiz
2} family. T
ed in the in
010] crystal
field averag
ominally elas
d slip initiatio
gh localized
(and twin pla
A, the strains
with mS=0.47
181 MPa. W
ace analysis)
n measurem
shows locathe load droation of str
Twin migrati
set image m
orientation
ges, i.e. aver
tic region of
on. This can
strains). Us
nes) onto th
s localize in b
7. The stress
With knowledg
), the resolv
ments for 0[
l ized strainp indicates ains due to
on starts at
marked C in
tested in te
rage axial st
the stress-s
be clearly s
sing the orig
he sample’s s
bands with a
s level at w
ge of the st
ved shear st
0 10] orienta
s due to ontwin nuclea the nuclea
t τM and pro
the same r
nsion. The
train (in the
train curve,
seen in the
inal crystal
surface (for
a slope that
which these
ress at the
ress at the
ation in
nset of ation at ation of
oduces
regions

With contin
observed
measurem
trace analy
mT=0.47, a
Following
shown by
plastic res
The strain
to twin nuc
bands. Th
Conseque
which plas
Twin migra
2.8 shows
were captu
situ DIC st
images ca
during the
Figure
situ Dblack to the
nued loading
(σT=373 M
ments show
ysis the activ
and the crit
the load dro
the second
ponse is obs
accumulatio
cleation (inse
ese observa
ently, the ons
stic strains st
ation is also
s five strain f
ured using th
train fields si
aptured mov
experiment.
e 2.8. Local
IC. In the scolor the ststrain meas
g, a stress le
MPa). This lo
high strain l
vated twin sy
ical resolved
p associated
linear region
served at a s
on beyond th
et market C,
ations indicat
set of twin m
tart to accum
observed fo
fields repres
he camera in
nce the sam
ving manually
strain f ield
stress-straintrain measusured using
vel is reache
oad drop is
ocalizations
ystems are id
d shear stre
d with twin nu
n of the stre
stress that is
his point take
Figure 2.7).
te that the p
migration τM=
mulate in the s
or the same
senting the r
n situ, so the
mple was at z
y the micros
on the 0 10[
curves on red using thDIC (averag
44
ed where a p
s associated
in four ban
dentified. All
ess for twin
ucleation, the
ess-strain cu
lower than t
es place in t
. The strain
plastic respo
114 MPa (Fi
same bands
010[ ] orienta
residual axia
sample was
zero load, an
scope used
0] tension s
the bottom he extensomge strain on
pronounced a
d with twin
nds (inset m
the activated
n nucleation
e material ap
rve in Figure
the stress re
the same reg
level increas
nse may be
gure 2.7) is
s that formed
ation using e
al strain after
in the load f
d each strain
for monitori
sample after
of the strameter, whilen the DIC re
and instantan
nucleation.
arked B in F
d twin system
is obtained
ppears to de
e 2.7. With a
ached prior t
gions (bands
ses as well a
dominated
marked as t
following tw
ex situ DIC st
r each load
frame. They
n field was ob
ng the surfa
r each load
in f ields is e blue coloregion).
neous load d
. Full field
Figure 2.7),
ms have the
d as τT=177
eform elastica
additional loa
to twin nucle
s) that were
as the width
by twin migr
the stress le
win nucleation
train fields. F
step. The im
are consider
btained stitc
ace of the s
step using e
reported wied l ine refe
drop is
strain
using
same
MPa.
ally as
ading,
eation.
linked
of the
ration.
evel at
n.
Figure
mages
red ex
hing 5
ample
ex
th rs

The t
the s
differ
The d
throu
the lo
field
green
misor
the o
F
re
in
re
m
In ad
SEM
obtain
B in F
block
twins nuclea
strains along
ent sample l
determinatio
gh EBSD m
ocal crystal o
represents t
n points ind
rientation wit
bserved twin
igure 2.9.
epresent a
ndicate the
espectively,
misorientatio
dition the tra
as shown i
ned from the
Figure 2.7. In
kage of the in
ted after the
the same b
location durin
n of the act
measurement
orientation fo
he orientatio
dicate region
th the matrix
ns matches w
EBSD data
400 μm x
crystal o
111 121[ ]( )
on (with resp
ace of the ac
n Figure 2.1
e ex situ stra
n particular b
ncoming twin
e load 1 (first
bands forme
ng load 4 (to
ivated twin a
s and SEM
or a 400 μm
on of the ma
ns displayin
x is about 60
with the trace
a for 0 10[ ]
200 μm re
rientation o
and 111[ ](
pect to the m
ctivated twin
0. Both of t
in field and t
both the twin-
n.
45
t strain field
ed after the
op area of th
and slip syst
images. Fig
x 200 μm re
trix (very clo
ng a differe
0°, this indica
es of 11 1 1[ ](
orientation
egion on th
of the mat
121( ) twin s
matrix crysta
and slip for
these observ
trace analysi
-twin interse
in Figure 2.8
load drop. O
e sample su
tems using
gure 2.9 repo
egion on the
ose to the or
nt crystal o
ates that the
121) and 11[
n in tensio
e sample’s
tr ix. Green
systems as
al orientatio
the 010[ ] or
vations are i
is previously
ctions shown
8) display pr
Other twinne
rface, see w
high resoluti
orts post-exp
sample’s su
riginal crysta
orientation. F
regions are
11 12 1]( ) twin
n (Case I).
surface. R
and blue
these two
n) of about
ientation can
n good agre
reported in
n in Figure 2
rogressive in
ed regions fo
white box in F
ion DIC was
periment EB
urface. The r
al orientation
For both re
twinned. Th
n systems.
. The EBSD
Red-colored
e points in
o regions s
60°.
n be detecte
eement with
the inset ima
2.10a-d displa
ncrement of
ormed in a
Figure 2.8).
s confirmed
SD data of
red-colored
). Blue and
egions, the
he slope on
D data
points
dicate,
show a
d using the
the results
ages A and
ay cases of

Figure
interse
2.4.2.
We classif
there are
stress-stra
image ma
111 121[ ]( )
stain band
(inset imag
slip system
oriented d
systems in
the slip sys
e 2.10. SEM
ections disp
Compres
fy the 0 10[ ]
four possibl
ain curve for
arked A repr
) slip system
ds of the sec
ge marked C
ms involved
differently fro
nvolved, but
stems involv
M image of t
play blockag
ssionexp
orientation
e slip syste
this crystal
resents the
m at a CRR
cond slip sys
C, Figure 2.1
in the crys
om the two
not clearly
ved lead to cr
twins in 0 1[
e of the inc
periments
in compress
ms in the <
orientation d
first evidenc
S of τS=85 M
stem 11 1 2[ ](
1) shows a d
tal deformat
main syste
visualized w
rystal harden
46
10] orientati
oming twin.
s
sion as a mul
<111>{112} f
displays a co
ce of strain
MPa. Succes
231) with mS
direct eviden
tion. Moreov
ems indicatin
with the avail
ning.
ion in tensio
lti-slip case (
family with h
onstant hard
localizations
ssively (inse
S=0.46 appea
ce of the inte
ver, the stra
ng the prese
able DIC re
on. Each of
schematic in
high mS=0.47
ening (Figure
s due to the
et image ma
ar. The in sit
eraction betw
in field disp
ence of othe
solution. In t
the twin-tw
n Figure 2.5)
7 (Table 2.2)
re 2.11). The
e activation
arked B), loc
tu axial strai
ween the two
plays strain
er secondar
this specific
win
since
). The
e inset
of the
calized
in plot
o main
bands
ry slip
case,

F
o
re
m
2.5.
2.5.1
Figur
(Case
syste
accum
obser
seen
obser
stress
displa
1 1 1[
igure 2.11
r ientation i
espectively,
marked C dis
Crysta
1. Com
re 2.12 disp
e II). High re
em with mS=0
mulates up
rved. With t
by the low
rve twinning
s σT=646 MP
ays the stra
1 12]( ) and [
. Stress-St
in compres
sl ip onset
splays evolu
alorienta
mpression
lays the stre
esolution DIC
0.31 at σS=2
to εB=1.07%
he activation
w slope of th
g nucleating
Pa leading to
ain field afte
1 11 2 11[ ]( ) .
rain curve
ssion (Case
t on the 1[
ution of the s
ation[11
experime
ess-strain cu
C measurem
84 MPa, lea
% (inset ima
n of only on
he stress-str
with a stres
a CRRS for
er twin nuc
47
and DIC s
e IV). The
111 121]( ) an
strain f ield a
1]
ents
urve for a [
ments (inset
ading to a C
age marked
ne single slip
rain curve (h
ss drop. Thr
r twin nuclea
cleation of t
strain f ield
inset ima
d 111 231[ ]( )
and slip-sl ip
11 1] orient
image marke
RRS of τS=8
B). No trac
p system, no
h=dσ/dε=0.00
ree twins sy
ation of τT=20
the three ob
measurem
ages marke
) systems.
p interaction
ed sample l
ed A) reveal
88 MPa. Slip
ces of slip
o significant
03E). Procee
ystems were
03 MPa. The
bserved twin
ment for the
ed A-B i l lu
The inset
ns.
loaded in co
l slip on the
p on the sa
on other sy
hardening r
eding with lo
e activated a
e inset image
n systems
e 010[ ]
ustrate,
image
ompression
111 121[ ]( )
me system
ystems are
resulted as
oading, we
at a critical
e marked C
111 121[ ]( ) ,

Figure
orienta
slip on
nuclealocalizfamily
In addition
provided. I
on various
e 2.12. St
ation in com
n the 111 2[ ](
ation (inset zations intro. All the stra
n to DIC stra
In Figure 2.1
s systems; an
ress-Strain
mpression (
211) system
image maoduced by tain plots are
ain fields, T
3 are report
nd (b) an hig
curve and
Case II). In
. Slip develo
rked B). Thhe nucleati
e obtained u
EM analyse
ed two TEM
h resolution
48
d DIC stra
set image m
ops on the s
he inset imon of three
using ex situ
es for the 1[
micrographs
image displa
ain f ield m
marked A s
same system
mage marke twin syste
u high resolu
11 1] orienta
s showing: (a
aying a twin.
easurement
hows traces
ms unti l the
d C displayms from theution DIC.
ation in com
a) different d
ts for 11[
s of localize
onset of tw
ys the strae <111>{11
mpression are
dislocations g
1] ed
win
in 2}
e also
gliding

F
d
2.6.
2.6.1
Case
Figur
mark
syste
fields
strain
111[ ]
igure 2.13
islocations
Crysta
1. Tens
e III represen
re 2.14 show
ed A, the st
em ( 0 4.Sm
s through the
ns developin
121( ) system
. TEM imag
from various
alorienta
sionexpe
nts cases ch
ws the stres
trains localiz
47 ), leading
e in situ DIC
g still on ba
m are also de
ges of a tw
s systems; b
ation[101
eriments
haracterized
ss-strain curv
ze in bands
to a CRSS
measuremen
nds correspo
etected (inset
49
win for the
b) High reso
1]
by limited
ve of a 10[
with a slope
of τS=87 MP
nts (inset ima
onding to th
t images ma
e 11 1[ ] or
olution imag
number of a
0 1] oriented
e that match
Pa. By follow
ages marked
e 111 121[ ]( )
rked B, C an
ientation in
e displaying
activated slip
d sample in
hes the trace
ing the evolu
d A, B, C and
slip system
nd D).
n compressi
g a twin.
p systems (
tension. Fo
e of the 11[
ution of the
d D) we obse
m. Traces of
ion: a)
Table 2.2).
or the inset
1 121]( ) slip
axial strain
erve higher
slip on the

Figure
orienta
111 1[ ](
image
are als
The in situ
elucidate t
reveals ag
(ε=1.8%). T
bands corr
crystal orie
conclusion
or two slip
e 2.14. Str
ation in tens
121) system
s marked B
so detected
u DIC also s
the differenc
gain how the
This can be
responding t
entation 10[
n that for rela
systems are
ess-Strain
sion (Case
. Sl ip on the
B-C-D. From
.
hows that th
ce, we utilize
slip system
clearly seen
to the 111 1[ ](
1] in tensio
atively low a
e active (Cas
curve and
III). The ins
e same syst
m the latter
e activated s
e high resol
111 121[ ]( ) p
n from the in
121) slip syst
on is an exam
pplied strain
se III, double
50
DIC strain
set image m
tem proceed
strain plots
slip systems
ution ex situ
provides high
set image m
tem display a
mple of the d
s (up to 3%)
e slip).
f ield meas
marked A sh
ds with load
traces of s
s accommoda
u axial strain
her strains a
marked A whe
axial strains
double slip c
) no hardeni
surement fo
ows onset o
ing as show
slip on 111[
ate deformat
n measurem
t this stage o
ere localized
up to 3%. Th
case (Table 2
ng is observ
or the 10 1[
of slip on th
wn in the ins
1 121]( ) syste
tion different
ments. Figure
of the deform
d strains alon
he specific ca
2.2). We dra
ved since on
1]
he
et
em
tly. To
e 2.15
mation
ng the
ase of
aw the
ly one

F
ofi
st
sy
F
fr
In Fi
disloc
strain
igure 2.15
r ientation ineld on the
train localiz
ystems (hig
igure 2.16.
rom mostly t
gure 2.16 T
cations glidin
n measureme
. Local str
n tension (Centire sam
zations alo
h resolution
. TEM imag
two sl ip sys
TEM microg
ng on two s
ents (Figure
rain measu
Case II I). Thple (low re
ng two tra
n DIC).
e for the [
tems.
graphs (obta
slip systems
2.15).
51
rements us
he inset imsolution DI
ces corres
10 1] orien
ained from t
confirming
sing high-re
age markedC). The ins
ponding to
tation in te
two differen
what observ
esolution D
d A shows tset image m
111 121[ ]( ) a
nsion displa
t samples)
ved on the m
IC for the
the residualmarked B d
and 111 12[ ](
aying disloc
providing e
macro-scale
101[ ]
strain isplays
21) sl ip
cations
evidence of
using DIC

2.6.2.
The results
both twin
migration f
orientation
as the 11[
strain curv
analyzed.
occurring a
Figure
orienta
localiz
nucleain the
Proceedin
indicates t
systems (
Compres
s presented
and slip. It
for that sam
n leading to t
1 1] orientati
ve for the 1[
The inset im
at σS=185 MP
e 2.17. St
ation in com
zed slip on
ation (inset inset image
g along the
twin nucleat
τT=194 MPa)
ssionexp
in Figure 2.1
t follows tha
ple is not po
twin-slip inter
on (both 11[
0 1] orienta
mage marked
Pa leading to
ress-Strain
mpression (
the 111 12[ ](
image marke marked C-
stress-strain
tion. Trace
). Increment
periments
12 for the 1[
at accurate
ossible. To ad
raction on a
1 1] and 10[
ation is show
d A indicates
a CRRS of
curve and
Case I I). T
21) system.
ked B). IncreCi (see text
n curve, at p
analysis ind
tal DIC is us
52
s
1 1] orientat
assessment
ddress this i
10 1[ ] sam
0 1] orientati
wn in Figure
s activation o
τS=87 MPa.
d DIC stra
The inset im
Slip on the
emental DIC for detai ls)
point B (σT=4
dicates twin
sed to analy
tion show ev
of strain a
ssue, we an
ple, having t
ions are clas
2.17. Three
of the 111[ ](
ain f ield m
mage marke
e same sys
C is used to.
413 MPa) the
nucleation
yze the evo
vidence of hig
accumulation
nalyze a simi
he same me
ssified as Ca
critical in sit
121) slip sys
easurement
d A shows
tem procee
o i l lustrate tw
e occurrence
on 111 121[ ](
lution of the
gh local stra
n induced by
ilar case of c
echanical be
ase II). The s
tu strain field
stem with mS
ts for 10[
the onset
eds unti l tw
win migratio
e of the load
1) and 111[
e axial strain
ins for
y twin
crystal
havior
stress-
ds are
S=0.47
1] of
win
on
d drop
121]( )
n field

betwe
point
accum
Twins
B). (ii
were
domin
band
point
F
o
Ex-sit
residu
surfa
obtain
visua
een point C
C as the r
mulation betw
s nucleated
i) The strain
linked to t
nated by twi
s that forme
Ci, another l
igure 2.18 .
r ientation in
tu high reso
ual strain fie
ce enable to
ned for a sm
alized the inc
(following tw
eference. Th
ween C and
in a region d
accumulatio
twin nucleat
n migration.
ed following t
load drop is
. Case of l
n compressi
olution DIC w
elds associat
o locate a re
mall sample a
coming twin
win nucleation
he strains d
C’ only. Ref
different from
on between p
ion. These
The stress le
twin nucleati
observed, th
ocal strain
on.
was also use
ted with larg
egion contain
area. In the
s which are
53
n) and Ci, the
isplayed in
ferring to this
m the preced
point C and C
observation
evel at which
ion marks th
his indicates
fields in ca
ed for analyz
ge twinned re
ned in the D
EBSD map
e stopped in
e correlation
the inset im
s inset image
ding region d
Ci takes plac
s indicate t
h plastic stra
he onset of tw
the nucleatio
ase of Twin
zing 101[ ]
egions. The
DIC region, a
reported in
n front of an
is implemen
mage marked
e two observ
displaying sli
ce in the sam
hat the plas
ains start to a
win migratio
on of addition
n-Twin inter
orientation.
markers intr
and overlap
the bottom-r
n obstacle tw
nted using th
d C-Ci repre
vations are p
ip (inset ima
me regions (b
stic respons
accumulate i
n τM=149 MP
nal twins.
ractions for
Figure 2.18
roduced on t
it with the E
right of Figu
win. In this
he image at
esent strain
provided. (i)
age marked
bands) that
se may be
n the same
Pa. Beyond
r 10 1[ ]
shows the
the sample
EBSD data
re 2.18 are
cases, the

resolved s
incoming t
regions ar
reported in
measured
Figure
Figure
two sy
Further ex
of twin-slip
are blocke
strain measu
twin reaches
re stopped i
n Figure 2.19
strain on the
e 2.19 . Stra
e 2.20. TEM
ystems; b) tw
xperiments u
p interaction
ed on the twin
red along th
s the obstac
n front of a
9), the assoc
e other side o
in measurem
M image for
win.
sing TEM co
(Figure 2.20
n boundary).
e incoming t
le twin interf
n obstacle t
ciated avera
of the obstac
ments acros
10 1[ ] orien
onfirm the pr
0b) which sho
54
twin is high o
face. It is ea
twin (Figure
ge strain fiel
cle twin (stra
ss the grain
ntation in co
resence of tw
ows a case o
on the side o
asily observe
2.18 and s
ld of the inco
in plot on the
boundary o
ompression:
wo slip syste
of slip blocka
of the obstac
ed that when
uccessively
oming twins
e right side o
f an obstacl
a) Planar d
ms (Figure 2
age (incomin
cle twin whe
n different tw
in the strain
is higher tha
of Figure 2.19
le twin.
dislocation o
2.20a) and a
ng slip disloc
ere the
winned
n field
an the
9).
on
a case
ations
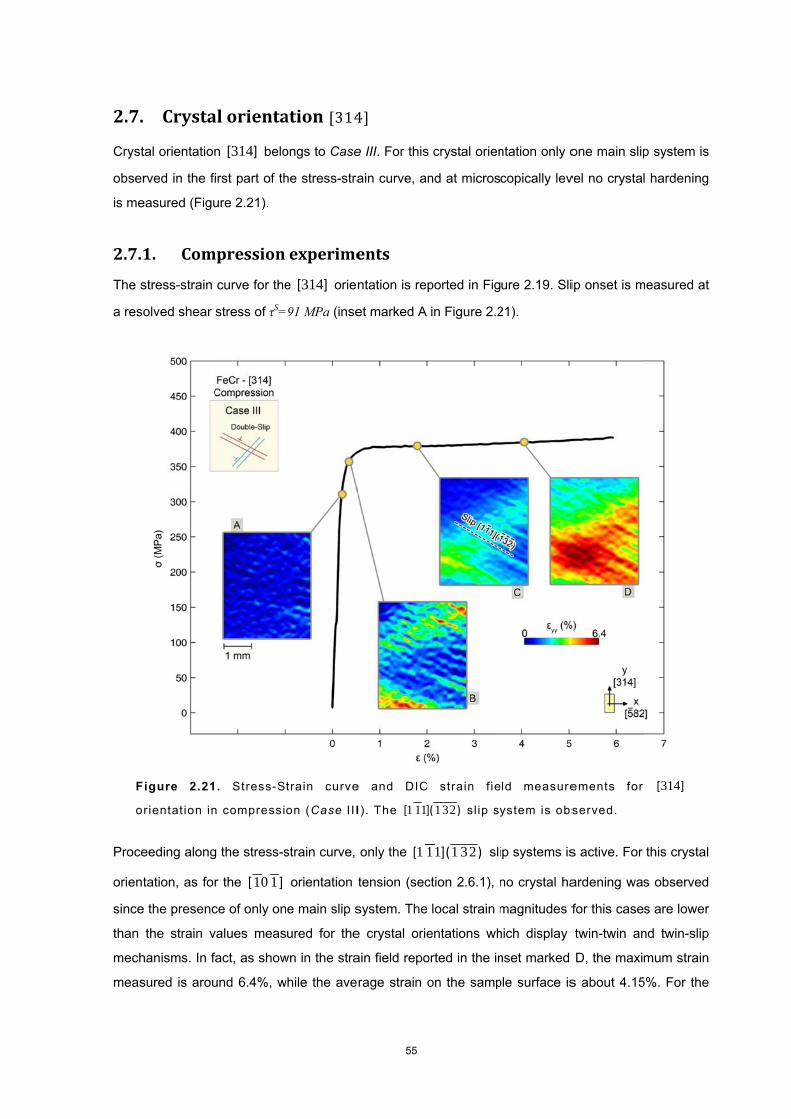
2.7.
Cryst
obser
is me
2.7.1
The s
a res
F
o
Proce
orient
since
than
mech
meas
Crysta
tal orientation
rved in the f
easured (Figu
1. Com
stress-strain
olved shear
igure 2.21
r ientation in
eeding along
tation, as fo
e the presenc
the strain v
hanisms. In f
sured is arou
alorienta
n 314[ ] belo
irst part of th
ure 2.21).
mpression
curve for the
stress of τS=
. Stress-S
n compressi
g the stress-s
r the 10 1[ ]
ce of only on
values meas
fact, as show
und 6.4%, w
ation[314
ongs to Case
he stress-stra
experime
e 314[ ] orien
91 MPa (inse
train curve
on (Case III
strain curve,
orientation
e main slip s
ured for the
wn in the stra
while the ave
55
4]
e III. For this
ain curve, an
ents
ntation is rep
et marked A
e and DIC
I). The 1 11[ ]
only the 1 1[
tension (sec
system. The
e crystal orie
ain field repo
rage strain o
crystal orien
nd at micros
ported in Fig
in Figure 2.2
strain f ie
132( ) sl ip sy
11 1 32]( ) sli
ction 2.6.1), n
local strain m
entations wh
orted in the in
on the samp
ntation only o
copically lev
ure 2.19. Sli
21).
ld measure
ystem is obs
ip systems is
no crystal ha
magnitudes f
hich display
nset marked
ple surface is
one main slip
vel no crysta
ip onset is m
ements for
served.
s active. For
ardening wa
for this case
twin-twin an
D, the maxi
s about 4.15
p system is
l hardening
measured at
314[ ]
this crystal
s observed
s are lower
nd twin-slip
mum strain
5%. For the

56
twin-twin and twin-slip cases presented before much higher differences between local strains and
average strains were measured.
2.8. Furtheranalysisoftheresults
The usage of local deformation measurements from DIC allow for the precise determination of the
critical stresses associated with the activation of slip τS, twin τT, and twin migration τM which are
otherwise not accessible utilizing nominal sample response measurements. For example, slip can
occur locally despite the overall elastic response in a number of cases. Twin nucleation is associated
with a sudden load drop and can be measured by various experimental techniques, but the
subsequent migration can occur immediately after the load drop or after further deformation. In situ
local strain measurements via DIC permitted measurement of corresponding stress level at which
twin migration initiates. The results from all the crystal orientations tested are summarized in Table
2.3.
The crystal orientations analyzed are classified in four different cases (see schematic in Figure 2.5).
These four cases represent the possible crystal deformation behaviors based on the type of
deformation mechanism involved (slip/twin). Each case displays a crystal hardening that is function
of the main mechanism involved (twin-twin, twin/slip or slip/slip interactions). The real-time acquisition
of the strain fields using DIC in conjunction with crystal orientations from EBSD determined the
systems (planes and directions) and the CRSSs for slip onset τS, twin nucleation τT and migration τM
for each crystal orientation analyzed (Table 2.3). While for slip and twin nucleation the CRSSs are
constant, the twin migration stresses display deviations which are discussed in the following section.
Table 2.3. CRRSs for onset of slip τS, twin nucleation τT, twin migration τM as a function of the crystal orientation and load direction. The sequences S-T, S-S refer to slip-twin and slip-slip cases.
Mechanism Twinning (T) Slip (S)
Axis Case Sequence τT
(MPa) τM
(MPa) τS
(MPa)
Compressive
10 1[ ] II S-T 194±8 149±19 87±16
0 10[ ] IV S-S Not observed 85
11 1[ ] II S-T 203±3 157±3 88
314[ ] III S-S Not observed 91
Tensile 10 1[ ] III S-S Not observed 93±1
0 10[ ] I S-T 173±13 114±3 85

57
2.8.1. TwinMigrationStress
In the experimental results reported in this chapter, the twin migration stress σM (τM) represents the
point of macroscopic yielding on the stress-strain curves subsequent to twin nucleation. In fact, as
evident from DIC strain measurements (Figure 2.7, 2.8 and 2.17), strains localize starting from τM in
the same region formed after the load drop. In Table 2.3, the reported values for the CRSS for twin
migration show variation depending on crystal orientation. The CRSS magnitudes for the 0 10[ ]
orientation in tension was 114 MPa while for 11 1[ ] and 10 1[ ] orientations in compression 153
MPa was measured. The first case is classified as Case I, and the second one as Case II. Two
possible explanations are introduced to explain the difference in the CRSS values for twin migration
for Case I and Case II. First of all, for the 11 1[ ] and 10 1[ ] crystal orientations in compression
(Case II) twin nucleation is preceded by appreciable deformation (1.5% slip strain) developing in one
primary slip system (Figure 2.12 and 2.17). It is conceivable to argue that this large slip activity
preceding twin nucleation influences the subsequent twin growth process. A growing twin can
encounter slip bands [23] thus having difficulties in penetrating them. Secondly, twin growth is
influenced by the dominant intersection mechanism involved, i. e. twin-twin (Case I) or twin-slip
(Case II), hence the product of the dislocation reactions occurring in the intersection region. The high
stresses in the intersecting regions can promote the dislocation reactions that facilitate twin growth.
Therefore for Case I, where twin activity is not preceded by prior large slip activity, and twin-twin
interaction (high local stress) is the primary intersection mechanism, we measured lower τM.
2.8.2. StrainHardening
It is also well-known that twin-twin, twin-slip and slip-slip intersections have an important effect on the
crystal hardening. As shown in an analogous work on fcc steel by Efstathiou at al. [81], the visualized
accumulation of plastic deformation in the twin-twin and twin-slip intersection regions can be
correlated with the observed crystal hardening. In our experiments, at the point where twin migration
is observed (at twin migration stress σM (τM)) on the stress-strain curves, all the crystal orientations
displaying twinning (leading to twin-twin and twin-slip interactions) show high values of the hardening
parameter h=dσ/dεpl=0.2E, and high localized strains (up to 10% for the 0 10[ ] orientation in tension,
and up to 8% for the 11 1[ ] orientation in compression). For the same level of deformation, the
double-slip case doesn’t show hardening ( 1 0 1[ ] in tension, Case III, Figure 9), while the multi-slip
case analyzed ( 0 10[ ] in compression, Case IV, Figure 11) displays a constant hardening
parameter from the onset of macroscopic plasticity (h=dσ/dεpl=0.01E) that is lower compared to the
twin-twin and twin-slip cases. For both the cases displaying slip, the localized strains (up to 3%) are
much lower than the localized strains measured for Case I and II indicating that the level of strain

58
accumulation in the region of twin/twin, twin/slip and slip/slip intersection can be correlated with the
observed level of hardening.
2.8.3. TwinNucleationStress
For each of the crystal orientations displaying twinning ( 0 10[ ] in tension, 11 1[ ] and 10 1[ ] in
compression, Table 2.2), a CRSS of 191 MPa was measured for twin nucleation (see Table 2.3).
Moreover, all the twin systems having the highest magnitudes of the Schmid factors mT activate
simultaneously. These observations support the prediction of the activated twin systems using
Schmid factor analysis along with the knowledge of the twinning direction for each crystal orientation
and load direction (see Section 3). The existence of a constant CRSS is noteworthy because if the
measurement techniques is not precise, it is possible to report a deviation contrary to the current
findings. For the crystal orientations 0 10[ ] and 314[ ] in compression, and 10 1[ ] in tension only
slip is observed since the resolved shear stress for twinning is rather low mT=0.24 (Table 2.2). The
choice of single crystals in this study is rather unique to isolate specific mechanisms.
2.8.4. SlipNucleationStress
For all the crystal orientations tested in our study (Table 2.2), slip develops on planes and directions
having the highest SFs, <111>{112} in most cases and <111>{123} in others. Using high resolution
images (3.0 - 0.44 μm/pixel) we pinpoint strain localization due to the slip onset appearing for each
crystal orientation and load direction at a constant CRSS of 88 MPa. This type of resolution during
deformation is rather unique. The results conform to the Schmid law for slip (Table 2.3) and slip
precedes twin nucleation. Precise measurements are needed because slip nucleation in the elastic
region of the stress-strain curve (see inset image marked A in Figure 2.7, image resolution used for
DIC is 0.9 μm/pixel) was detected which cannot be gleaned clearly from macroscopic observations.
Overall, the experimental results point to the utility of DIC to analyze the response of metals
undergoing complex slip-twin evolution. The progression of these mechanisms are not readily
explainable by macroscopic stress-strain measurements alone, and localized strain measurements
shed light to the activation of slip and twinning during deformation and their interactions. Hence, the
present approach provides insight for bridging the scales ranging from macroscopic response to
localized behavior at micro-scales.

59
Chapter3
SlipTransmissionthroughGrain
BoundariesinFeCrpolycrystal
Understanding the interaction between slip dislocations and grain boundaries (GBs) has a paramount
importance on the mechanical response of metals [82, 83]. In fact, extensive research has been
reported during the last decades on the strengthening effect introduced by partial or full blockage of
slip dislocations at GBs. In particular, much interest has been devoted on the results of the slip
dislocation-GB reactions which provide deep insight into the slip transmission process across the
GB. In this regard, early research focused on the details of these reactions at GBs utilized
transmission electron microscopy (TEM) [48, 56]. Several insights into the transmission of the
incoming dislocation, and incorporation into the GB with extrinsic (residual) dislocations have been
gained as a result of these studies. Further experimental efforts are required to overcome the
difficulties in correlating the results of these dislocation reactions with the associated strain fields
across the GBs (on the meso-scale). A measure of the strengthening associated with a GB is
decided based on whether dislocation strain fields undergo a continuous variation (full dislocation
transmission), or whether large strains accumulate on one side of the GB (dislocation blockage).
Therefore, a focused study on the experimental determination of the localized strains across GBs is
important and will provide considerable insight into dislocation transmission and GB contribution to
hardening. In this chapter are studied local strain fields at the meso-length scales covering multiple
grains in Fe-Cr alloy. The strain measurements are used to establish the possible outcome of slip-GB
interaction and provide further insight into the importance of the residual dislocation due to slip
transmission.
3.1. SchematicofSlipDislocation–GrainBoundaryinteraction
A schematic of a GB is shown in Figure 3.1. Grain 1 contains the incoming slip system, while Grain 2
contains the outgoing slip system. In this schematic, the dislocations leave the GB in the second
crystal (outgoing slip plane) as a result of the dislocation-GB interaction. Of particular importance is
the residual Burgers vector of the dislocation left at the GB [84-86].

Figurethe incand n2
betweeBurge
1 2b b
Based on
occur [83]
0 whe
dislocation
parallel, a
not paralle
cross the
from zero
residual Bu
where 1b
the GB res
with the st
as a funct
in case o
e 3.1. Schemcoming and
2) and the B
en the l inesrs vector of
rb
.
the geometr
: a) transmis
ere is the
n is left on th
partial resid
el, a partial r
GB and rem
for the case
urgers vecto
(incoming) a
sistance to s
trains induce
ion of the re
of low residu
matic of the outgoing s
Burgers vec
s of intersethe residua
ry of the inco
ssion by cros
e intersecting
e grain boun
ual dislocatio
esidual dislo
main in the G
e (a) to highe
or magnitude
1b
and 2b
are d
slip transmiss
ed by disloca
esidual Burge
ual Burgers
e dislocationslip planes actors of the
ction betweal dislocation
oming and o
ss-slip: the s
g angle), 1b
ndary; b) dire
on is left on t
ocation is left
GB. For these
er values in
, | |rb
, can b
2 |r
b b b
determined o
sion, with the
ation slip on
ers vector m
vector mag
60
n-grain bounare indicatedislocation
en the two n left at the
outgoing slip
slip planes in
and 2b
are p
ect transmiss
the GB; c) in
t on the GB;
e cases the
case (b) an
be evaluated
1 2| | |rb b b
on the same
e aim to link
the meso-sc
magnitude, th
gnitudes, wh
ndary interaed the norms (b1 and b
slip planesGB is deter
p systems, di
ntersect the
parallel to th
sion: 0 ,
ndirect transm
d) no trans
residual Bu
d (c) [48], a
d from
|
coordinate b
the reaction
cale. For the
e strains are
hile they acc
ction geomemal to the sl
2). ϑ indicat
and the Grmined from
ifferent poss
GB plane on
e intersectio
in this case
mission:
mission, the
rgers vector
nd to a max
basis. | |rb
i
n occurring a
GBs analyz
e transmitted
cumulate on
etry. For bolip planes (tes the ang
B plane. Thm the equatio
sible reaction
n a common
on line, no re
1b
and 2b
a
0 , 1b
and b
dislocations
magnitude
ximum for (d
s used to qu
at the atomic
zed is shown
d almost una
n one side o
th n1
le
he on
ns can
line (
esidual
are not
2b
are
s don’t
varies
). The
(3.1)
uantify
scale
n how,
altered
of the

interf
accum
confid
choos
makin
assoc
gene
magn
trans
3.2.
3.2.1
A Fe
comp
900 º
(from
a vibr
Fmsd
A sel
(the p
the se
the a
Bung
face in the h
mulation acr
ded to small
sing the FeC
ng the Burg
ciated with m
rated at the
nitude of the
mission at a
Materi
1. Micros
Cr alloy with
pression sam
ºC for 1 h fo
m P800 up to
ro-polishing w
igure 3.2. Gmm region o
hown in thisplaying th
ected 2 mm
procedure is
elected regio
rea analyzed
ge convention
igh residual
ross GBs is
deformation
Cr alloy is tha
ers vector c
multiple slip
e GBs. The
residual Bur
GB.
ialandM
tructure
h a composi
mple by elect
ollowed by a
P4000), and
with colloida
Grain orienton the same stereograe largest SF
x 2 mm reg
discussed i
on of the spe
d in the pres
n (φ1, Φ, φ2)
Burgers vec
achieved a
ns in compre
at we could
conservation
systems. Su
correlation
rgers vector
Methods
character
tion of 47.8
ro-discharge
a water quen
d a final polis
l silica (0.05
tations in thple surfaceaphic tr iangFs.
ion of the sa
n [66], also u
ecimen surfa
sent paper is
for each gra
61
ctor magnitu
as a result o
ession with e
observe pre
analysis rat
uccessively,
between th
provides an
rization
at. pct. % C
ed machining
nch. For EB
shing suitable
μm).
he load dire. Grain orie
gle along w
ample surfac
used in [43,
ce were obta
shown in Fi
ain are report
de cases. A
of this expe
external strai
dominantly o
ther simple,
the analysis
he strain gr
excellent too
Cr was secti
g (EDM). The
SD the surfa
e for EBSD d
ction obtainentations in
with the sl ip
ce was mark
87]). The cr
ained using E
gure 3.2 and
ted in Table
clear charac
rimental stu
ns less than
one single sl
and avoidin
s is focused
radients acro
ol to quantify
oned into 4
e material wa
ace was pol
data acquisit
ned via EBSn the load dp systems
ed using Vic
ystallograph
EBSD. The g
d the corresp
3.1.
cterization o
udy. The exp
2%. The ad
lip system in
ng complex i
on the strain
oss the GB
y the capabil
mm x 4 mm
as solution a
lished using
tion was obta
SD for a 2 mdirection arfor bcc ma
ckers indenta
ic grain orie
grain orienta
ponding Eule
of the strain
periment is
dvantage of
n the grains
nteractions
n gradients
Bs with the
ity of strain
m x 10 mm
annealed at
SiC paper
ained using
mm x 2 re also aterials
ation marks
ntations for
tion map of
er angles in

62
A total of nine grains are visualized in the selected area, with an approximately mean grain size of
about 1 mm. In Figure 3.2, the stereographic triangle along with the crystal orientations of each grain
in the load direction is also reported. The stereographic triangle is subdivided into five regions ([88])
that indicate the slip systems with the largest Schmidt Factors (SFs) for bcc materials. SF analysis
was used in combination with slip trace analysis (from strain fields) for indexing the observed slip
systems (see Section 1.5).
Table 3.1. Euler angles obtained from EBSD for each grain in the selected area of the sample surface.
Grain 1 2 3 4 5 6 7 8 9
φ1 [°] 205.8 314.95 260.11 286.41 300.41 220.23 236.51 242.12 231.9
Φ [°] 41.56 49.86 19.92 32.46 34.42 46.03 45.97 43.49 37.21
φ2 [°] 46.47 52.21 359.49 2.24 52.63 34.38 28.82 19.69 19.42
3.2.2. Experimentalset‐upandstrainmeasurements
The experiments were conducted at room temperature using a servo hydraulic load frame. The
sample was deformed in displacement control at a mean strain rate of 5x10⁻⁵ s-1. In situ DIC [2, 11,
12, 89] was used for measuring the real-time evolution of the strain fields during loading (see also
Chapter 1). The images were captured using an IMI model IMB-202 FT CCD camera (1600 x 1200
pixels) with a Navitar optical lens, providing for a resolution of 3.0 μm/pixel. The speckle pattern for
DIC was obtained using black paint and an Iwata Micron B airbrush. A reference image of the sample
surface was captured at zero load, and the deformed images of the same area every 2 seconds
during the loading. The strain data obtained from in situ DIC were used to construct the stress-strain
curve using the average axial strain for the selected in situ DIC region.
The main results were obtained using ex situ high resolution DIC. Adopting special fine speckles, the
strain resolution obtained reveals the local strain intensities at grain level, in particular strain
heterogeneities across grain boundaries were clearly established. As already explained in Chapter 1,
the usage of ex situ DIC requires that the reference and deformed images are acquired out of the
load frame using an optical microscope which enables capturing higher magnification images. The
strain fields obtained refer to the un-loaded condition (residual strains). A speckle pattern suitable for
high resolution DIC was applied on the surface sample after the initial EBSD scan (Figure 3.2). A set
of 140 images covering the analyzed region was captured before the experiment (reference
condition) and after loading the sample (deformed condition). The correlation was implemented for
each pair of images (reference and deformed) and the results were successively stitched together.
The grain map was overlaid with the strain fields using the Vickers indentation marks which are
visible in the EBSD grain orientation map and the optical microscope images. The observed slip
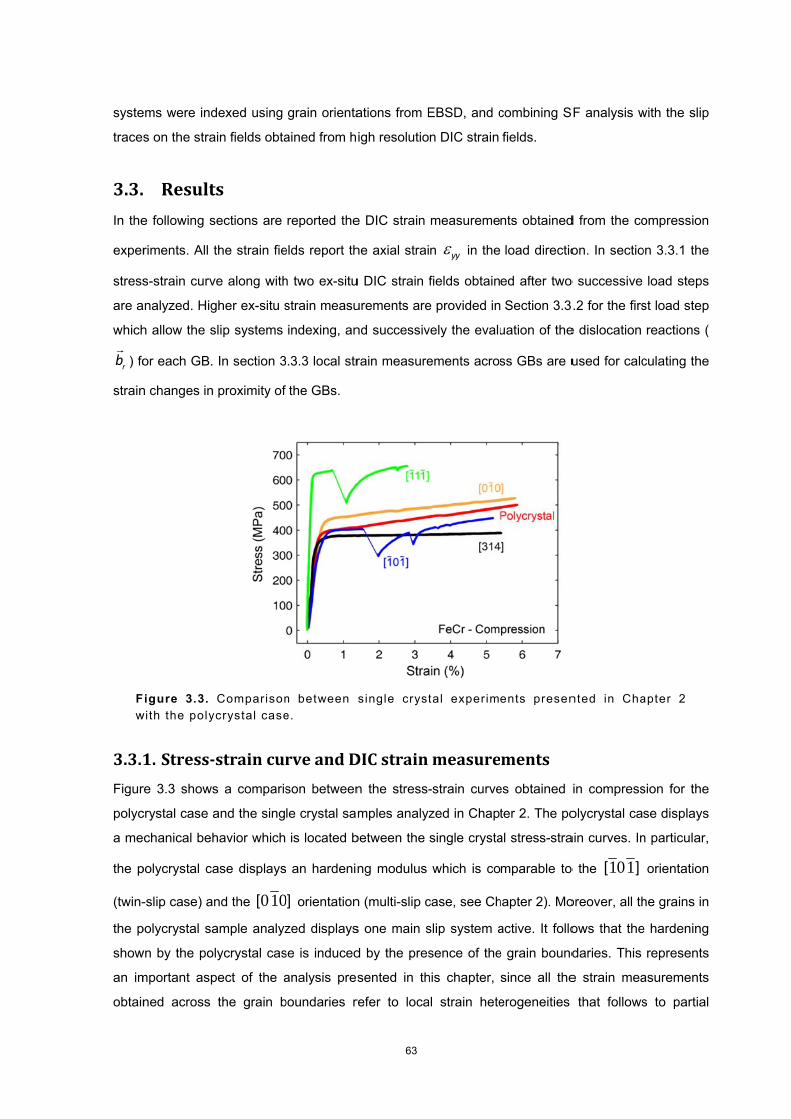
syste
trace
3.3.
In the
exper
stress
are a
which
rb
) fo
strain
Fw
3.3.1
Figur
polyc
a me
the p
(twin-
the p
show
an im
obtain
ems were ind
s on the stra
Result
e following s
riments. All t
s-strain curv
analyzed. Hig
h allow the s
or each GB.
n changes in
igure 3.3. with the poly
1. Stress‐
re 3.3 shows
crystal case a
chanical beh
polycrystal ca
-slip case) an
polycrystal sa
wn by the po
mportant asp
ned across
dexed using
ain fields obta
ts
sections are
the strain fie
ve along with
gher ex-situ s
slip systems
In section 3
proximity of
Comparisoncrystal case
straincur
s a comparis
and the sing
havior which
ase displays
nd the 010[
ample analyz
lycrystal cas
pect of the a
the grain b
grain orienta
ained from h
reported the
elds report th
h two ex-situ
strain measu
indexing, an
3.3.3 local str
the GBs.
n between e.
rveandD
son between
le crystal sam
is located b
an hardenin
0] orientation
zed displays
se is induced
analysis pres
boundaries re
63
ations from E
igh resolutio
e DIC strain
he axial strai
u DIC strain f
urements are
nd successiv
rain measure
single cryst
DICstrain
n the stress-
mples analyz
between the
ng modulus
n (multi-slip c
s one main s
d by the pres
sented in th
refer to loca
EBSD, and c
n DIC strain
measureme
n yy in the
fields obtain
e provided in
vely the evalu
ements acros
tal experim
measure
-strain curve
zed in Chapt
single crysta
which is co
case, see Ch
slip system a
sence of the
his chapter,
al strain hete
combining S
fields.
nts obtained
load directio
ed after two
Section 3.3
uation of the
ss GBs are u
ents presen
ments
es obtained
ter 2. The po
al stress-stra
mparable to
hapter 2). Mo
active. It follo
e grain bound
since all the
erogeneities
F analysis w
d from the co
on. In sectio
o successive
.2 for the firs
e dislocation
used for calc
nted in Cha
in compress
olycrystal ca
ain curves. In
o the 101[ ]
oreover, all th
ows that the
daries. This
e strain mea
that follows
with the slip
ompression
on 3.3.1 the
load steps
st load step
reactions (
culating the
apter 2
sion for the
se displays
n particular,
orientation
he grains in
e hardening
represents
asurements
s to partial
64
transmission of slip dislocations and that induce hardening due to the presence of the grain
boundaries.
In Figure 3.4a, the strain fields shown in the inset images marked Ai and Bi represent the residual
axial strain fields for the 2 mm x 2 mm region obtained via ex-situ DIC. Each strain field is a
composition of 9 images (resolution 0.87 μm/pixel) captured outside the load frame and after
unloading from points A and B on the stress-strain curve. Strain heterogeneities develop as a
consequence of the local material microstructure (see also the EBSD map in Figure 3.2).
Two regions are selected from the global strain fields: 1A and 2A after load step Ai, and 1B and 2B
after load step Bi (Figure 3.4a). In Figure 3.4b the same regions are paired with the schematic of the
slip plane geometries. The GB plane is drawn using the GB trace from the EBSD map assuming that
the normal lies on the plane of the sample surface. For the region marked 1, the observed incoming
slip system is 11 1 231[ ]( ) , while the outgoing slip system is 11 1 321[ ]( ) . In that case, the residual
Burgers vector magnitude is low:
2 4111 111 0 382 2[ ] [ ] | | .
Grain Grain r r
a ab b a
(3.2)
The strain fields 1A and 1B clearly show an accumulation of strains for both sides of the GB. In
particular, this condition of strain transmission is held for both the loading steps. For the second case
shown, a GB for which the reaction occurring between the incoming and the outgoing slip systems
leads to a high residual Burgers vector magnitude was selected:
2 7111 111 1 282 2[ ] [ ] | | .
Grain Grain r r
a ab b a
(3.3)
The incoming slip system is 11 1 231[ ]( ) , while the outgoing slip system is 11 1 2 11[ ]( ) .
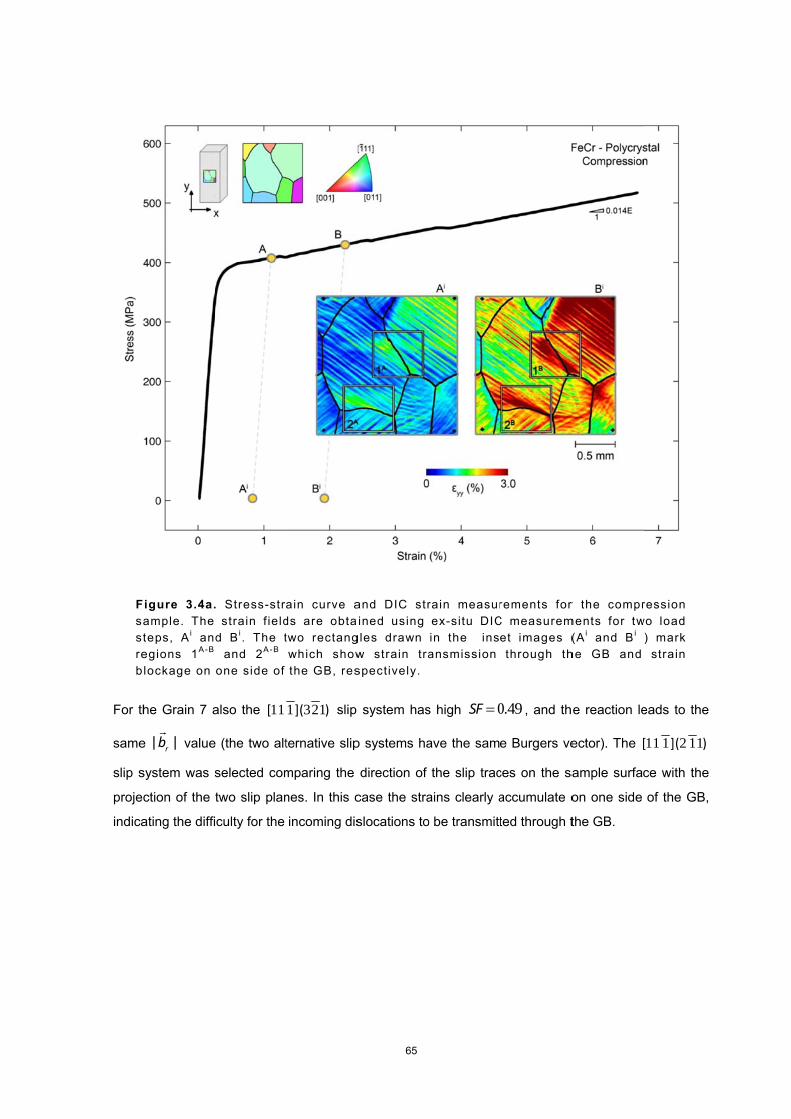
Fsstreb
For th
same
slip s
proje
indica
igure 3.4a.ample. Theteps, Ai anegions 1A-B
lockage on
he Grain 7 a
e | |rb
value
system was
ction of the
ating the diffi
. Stress-str strain f ieldd Bi. The t and 2A-B one side of
also the 11[
e (the two alt
selected com
two slip plan
iculty for the
ain curve ads are obtatwo rectangwhich showthe GB, res
1 321]( ) slip
ternative slip
mparing the
nes. In this c
incoming dis
65
and DIC strined using
gles drawn w strain traspectively.
system has
p systems ha
direction of
case the stra
slocations to
rain measurex-situ DICin the insansmission
s high 0SF
ave the sam
the slip trac
ains clearly a
o be transmitt
rements forC measuremet images (through th
0 49. , and th
e Burgers ve
ces on the sa
accumulate o
ted through t
r the comprments for tw
(Ai and Bi he GB and
e reaction le
ector). The [
ample surfac
on one side
the GB.
ression wo load
) mark strain
eads to the
11 1 2 11[ ]( )
ce with the
of the GB,

Figurefrom
disloca
across
side o
The accum
loading ste
are given
shear plan
higher for
17 6.
e 3.4b. GeoFigure 3a.
ation left at
s the GB. F
f the GB an
mulation of s
eps. More de
in Figure 3.4
ne which has
the case of
and 0| |rb
ometric analOn the to
t the GB ha
For the seco
d the assoc
strains on th
etails on the
4c. All the ac
s SF=0.5. Th
f slip blocka
0 38. ).
ysis of the op a sl ip t
s a low | rb
ond case sh
iated | |rb
i
he GB side
slip-GB inter
ctive slip sys
he angle
age ( 1| | .rb
66
sl ip systemtransmission
|r and the s
hown strain
is high.
of the incom
raction for th
stems have S
and the res
28 , 48.
ms for the sen case is
strains are
ns accumula
ming slip sys
e cases ana
SF values cl
sidual Burge
5 ) than for
elected graidescribed,
continuousl
ate preferen
stem is obse
lyzed in equ
ose to the m
rs vector ma
r the slip tra
in boundariethe residu
y transmitte
ntially on on
erved for bo
uations 3.2 an
maximum res
agnitude | rb
ansmission c
es al
ed
ne
th the
nd 3.3
solved
|r are
case (

F
a
c
s
v
b
3.3.2
Figur
of 14
3.4a)
plane
famili
Facto
surfa
In Ta
and 8
igure 3.4c.
ngle for
ases the SF
hear stress
ector magn
lockage cas
2. Highre
re 3.5 display
0 images we
). Slip system
es for bcc ma
ies were pro
ors are succ
ce.
able 3.2 the s
8 only one s
. SFs for th
the sl ip-GB
F values of
plane ( SF
i tude | |rb
se ( 1 28| | .rb
esolution
ys the strain
ere captured
ms were inde
aterials on th
ojected on th
essively sele
slip systems
lip system is
he incoming
B interaction
the activat
0 5. ). In c
0 38. and th
8, 48 5.
DICstrai
field obtaine
d before the
exed using g
he well-know
he plane of t
ected compa
for each gra
s observed, w
67
g and outgo
n cases sho
ted sl ip pla
case of sl ip
he angle
).
nmeasur
ed using ima
experiment a
grain orientat
wn 111 1{
the sample
aring the pro
ain along wit
while for gra
oing sl ip sy
own in Figu
nes are clo
transmissio
17 6. are
rements
ages at highe
and after loa
tions from EB
110} , 111
surface. The
ojected lines
th the SFs a
ains 1 and 6
stems, | |r
b
re 3a. For
ose to the m
on both the
e low compa
er resolution
ading the sam
BSD. In part
112{ } , 1
e slip system
with the slip
re reported.
traces of a s
| magnitude
both the an
maximum re
e residual B
ared to the
(0.18 μm/pix
mple (point A
ticular, the p
111 123{ } s
ms with large
p traces on t
For grains 2
secondary s
es and
nalyzed
esolved
Burgers
to the
xel). A total
Ai in Figure
ossible slip
slip system
est Schmid
the sample
2, 3, 4, 5, 7
lip systems

68
are visualized. In the schematic on the bottom of Figure 3.5 the | |rb
values for each GB are also
reported. GBs on the DIC strain field with T indicate case of strain transmission visualized as a strain
continuity along the slip traces, while B indicates the GBs for which no strain continuity is observed.
For GBs 1-2, 2-4, 2-6, 7-8, 7-6 it is evident how the strains induced by slip continued almost
unaltered through the interfaces, while for GBs 2-3, 3-4, 4-5, 5-6, 2-7, 2-8, 6-4 the strains accumulate
on one side of the GB. Strain accumulation is particularly evident for GBs 4-5 and 2-7. Each GB can
be also characterized by the estimation of the | |rb
magnitude (see schematic in Figure 3.5). In
Table 3.3 a summary of the observed slip mechanism (T: slip transmission, B: slip blockage) and the
correlation with the | |rb
magnitudes is given. It is clear that slip transmission corresponds to low
| |rb
, while for high | |rb
magnitudes the slip mechanism observed is blockage.
Table 3.2. Activated slip systems and SFs.
Grain 1 2 3 4 5 6 7 8
Slip
System
(SF)
111011[ ]
( )
0.46
111123[ ]
( )
0.45
111231[ ]
( )
0.48
111110[ ]
( )
0.49
111321[ ]
( )
0.47
111121[ ]
( )
0.45
111211[ ]
( )
0.42
111123[ ]
( )
0.37
111211[ ]
( )
0.49
111211[ ]
( )
0.49
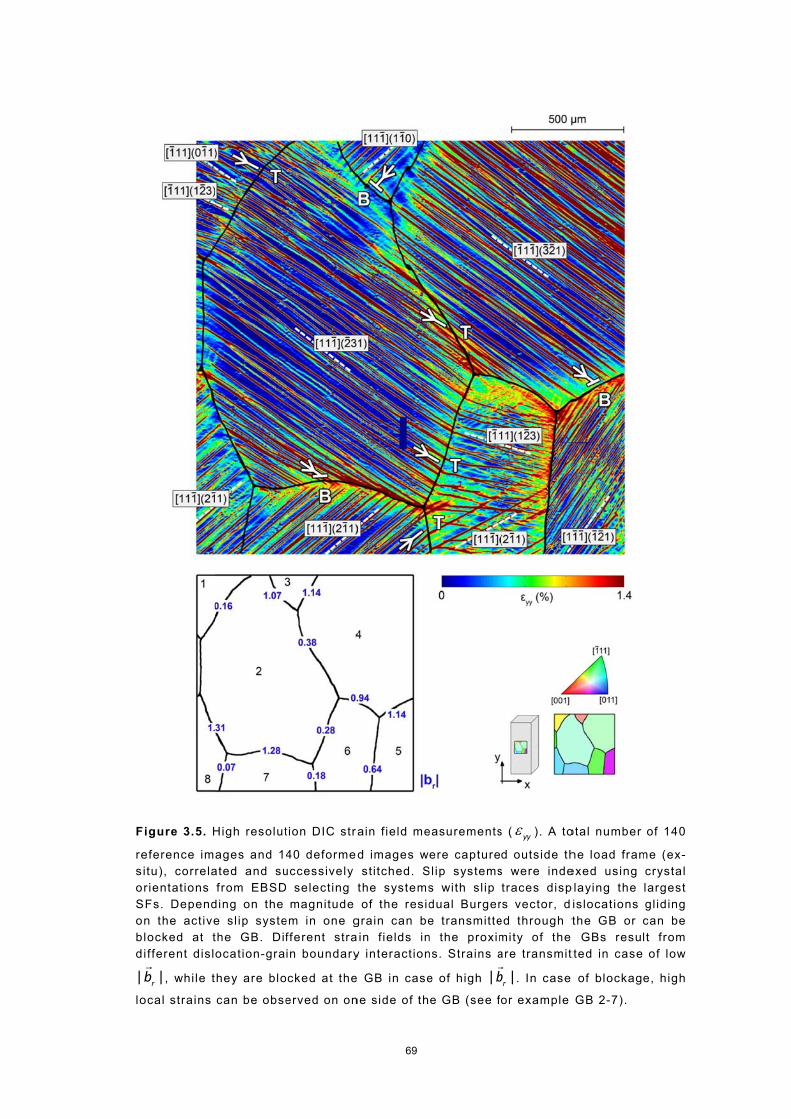
F
resoSobd
|
lo
igure 3.5. H
eference imitu), correlarientations
SFs. Dependn the activelocked at ti f ferent disl
|rb
, while t
ocal strains
High resolut
ages and 14ated and sufrom EBSD
ding on the e sl ip systethe GB. Difocation-gra
they are blo
can be obse
tion DIC stra
40 deformeduccessively selecting tmagnitude
em in one gfferent strain boundary
cked at the
erved on on
69
ain f ield me
d images wstitched. S
the systemsof the resid
grain can bein f ields in
y interaction
GB in case
ne side of th
easurements
ere captureSlip systemss with sl ipdual Burgere transmitte
n the proximns. Strains a
e of high |b
e GB (see f
s ( yy ). A to
d outside ths were indetraces disp
rs vector, ded through tmity of the are transmit
|rb
. In case
or example
otal number
he load framexed using playing the islocations the GB or c GBs resul
tted in case
of blockag
GB 2-7).
of 140
me (ex-crystal largest gl iding can be lt from of low
e, high

70
3.3.3. Strainmeasurementsacrossgrainboundaries
In order to quantify the magnitude of the strain change across the GB sides, we provide two sets of
strain measurements for low and high | |rb
magnitudes. The inset image marked A in Figure 3.6
shows the strain field across grains 1 and 2 (see also Figure 3.5). In this case a clear strain continuity
associated with the incoming slip system 111 123[ ]( ) and outgoing slip system 11 1 231[ ]( ) is
observed through the GB, and the residual Burgers vector magnitude is low:
1 2111 111 0 162 2[ ] [ ] | | .
Grain Grain r r
a ab b a
(3.4)
Each point on the strain plots reported (Figures 3.6 and 3.7) refers to the average axial strain of a
rectangular selection of strain values oriented along the GB side with an approximate size of 40 μm x
400 μm. For the case A (GB 1-2, Figure 3.6) the difference of the strain magnitudes approaching the
GB is equal to 1 2 0 09| | . %GB .
Table 3.3. Comparison between the observations on the DIC strain field on the slip
mechanism (T: strain transmission, B: strain blockage) with the residual Burgers vector | |rb
.
GB 1-2 2-3 3-4 2-4 4-5 5-6 2-6 2-7 2-8 7-8 7-6 6-4
Slip mechanism
T B B T B B T B B T T B
| |rb
0.16 1.07 1.14 0.38 1.14 0.64 0.28 1.28 1.31 0.07 0.18 0.94
The second case (inset marked B, Figure 3.6) represents the strain measurements through grains 2
and 6 (see also Figure 3.5). Strain bands associated with the incoming slip system 11 1 231[ ]( ) and
the outgoing slip system 111 123[ ]( ) are still observed to propagate continuously across the GB. The
DIC strain field displays also intermediate values of strain bands (green color) between the incoming
slip bands on the left side of the GB. These additional strain bands developing in proximity of the GB
can be associated with the partial dislocations left in the GB having a residual Burgers vector
magnitude equal to:
2 6111 111 0 282 2[ ] [ ] | | .
Grain Grain r r
a ab b a
(3.5)
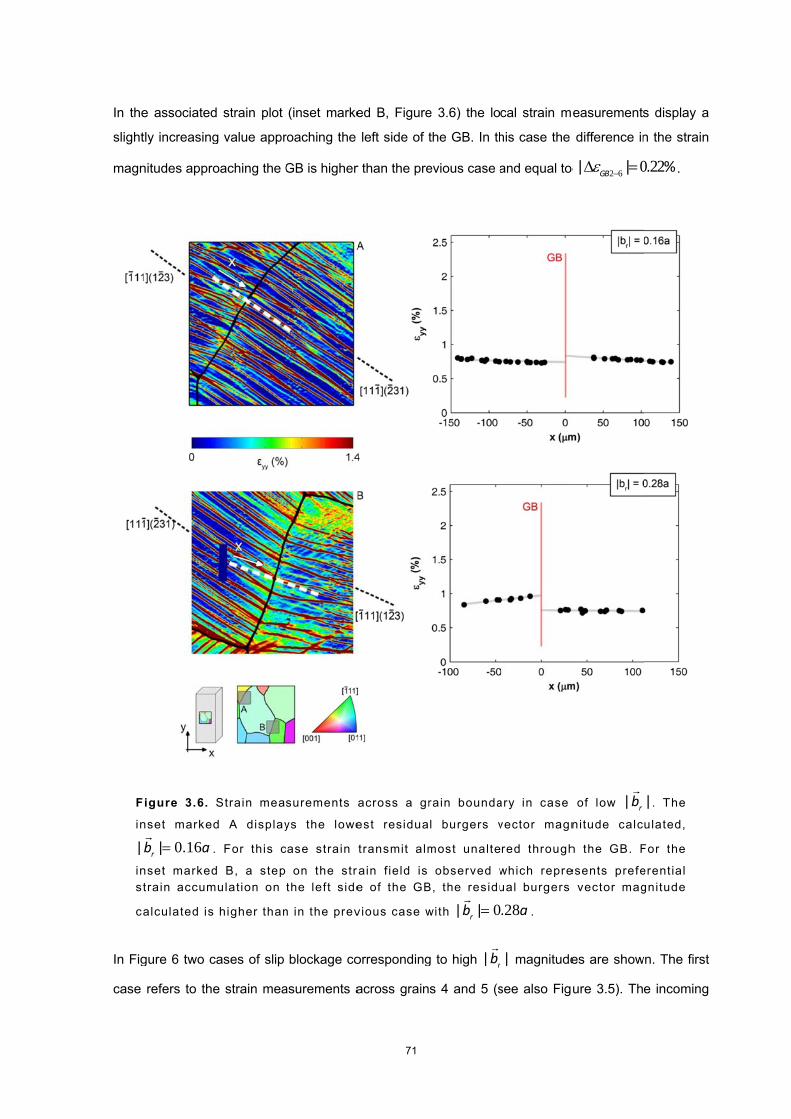
In the
slight
magn
F
in
|
inst
c
In Fig
case
e associated
tly increasing
nitudes appro
igure 3.6.
nset marked
0 16| .rb a
.
nset markedtrain accum
alculated is
gure 6 two c
refers to the
d strain plot
g value appr
oaching the G
Strain mea
d A display
. For this c
d B, a stepmulation on
higher than
cases of slip
e strain mea
(inset marke
roaching the
GB is higher
surements
ys the lowe
ase strain
on the strthe left side
n in the prev
blockage co
asurements a
71
ed B, Figure
left side of t
r than the pre
across a gr
est residua
transmit alm
ain f ield is e of the GB
vious case w
orresponding
across grain
e 3.6) the lo
the GB. In th
evious case a
rain bounda
l burgers v
most unalte
observed wB, the residu
with 0| |rb
g to high | rb
s 4 and 5 (s
cal strain m
his case the
and equal to
ary in case
vector magn
red through
which repreual burgers
28. a .
| magnitude
see also Fig
easurements
difference in
o 2 6 0| |GB
of low | rb
nitude calc
h the GB. F
esents prefevector mag
es are show
ure 3.5). Th
s display a
n the strain
0 22. % .
|. The
ulated,
For the
erential gnitude
wn. The first
e incoming
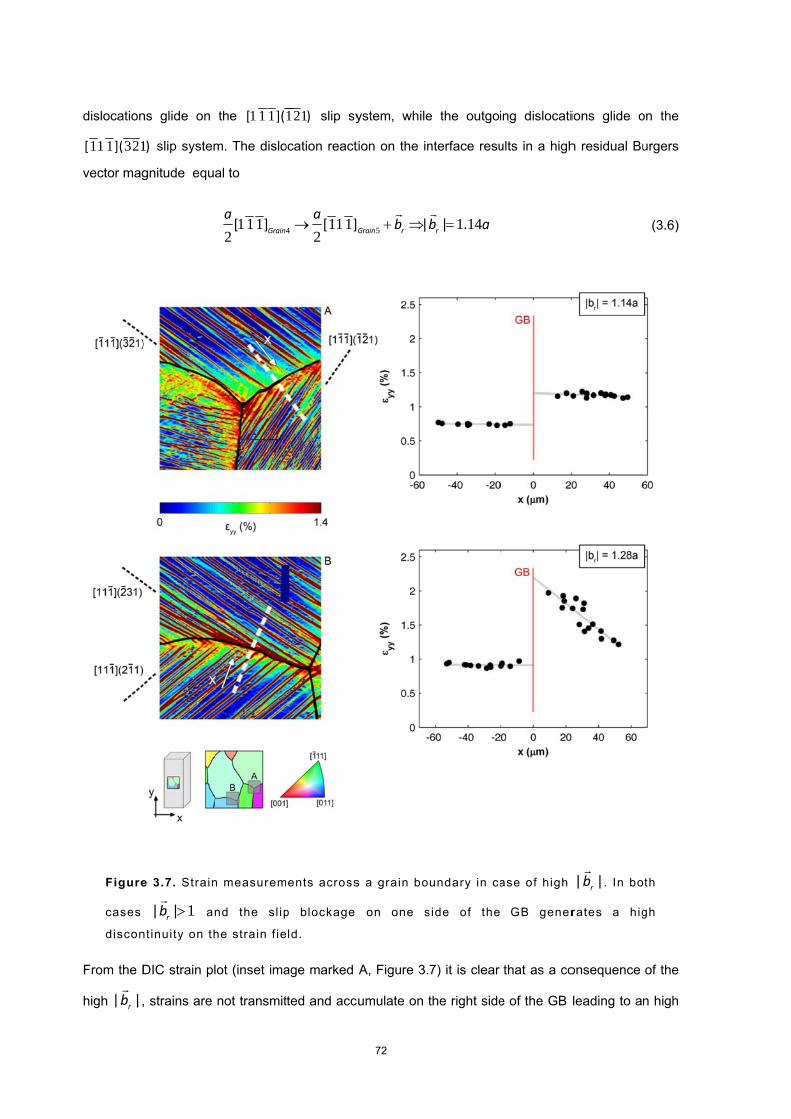
dislocation
11 1 321[ ](
vector mag
Figure
cases
discon
From the D
high | |rb
,
ns glide on
1) slip system
gnitude equ
e 3.7. Strain
1| |rb
a
ntinuity on th
DIC strain pl
, strains are
the 1 1 1[ ](
m. The dislo
al to
1112[ ]
Grain
a
n measurem
nd the sl ip
he strain f ie
lot (inset ima
not transmit
121) slip sy
ocation react
4 1112[ ]
G
a
ents across
p blockage
ld.
age marked
tted and acc
72
ystem, while
tion on the in
5 |Grain r
b
s a grain bo
on one s
A, Figure 3.
umulate on t
e the outgo
nterface resu
1 14| .rb a
undary in ca
side of the
7) it is clear
the right side
ing dislocati
ults in a high
ase of high
GB gener
that as a co
e of the GB
ions glide o
h residual Bu
| |rb
. In bo
rates a hig
onsequence
leading to an
on the
urgers
(3.6)
th
gh
of the
n high

73
strain gradient equal to 4 5 0 47| | . %GB . The last case analyzed (inset image marked B, Figure 3.7)
has been already introduced in Figure 3.4b (strain field 2A) using lower image resolution (0.87 versus
0.18 μm/pixel). For the dislocation reaction between the incoming 11 1 231[ ]( ) and the outgoing
11 1 2 11[ ]( ) slip systems see Eq. (3.2). From the strain measurements obtained, the strain change
across the GB is particularly high 2 7 1 29| | . %GB .
3.4. Discussion
The concept of residual Burgers vector has been established in earlier works and its importance is
well known in the materials science community [83, 90]. What has been lacking is a quantitative
illustration of the link between the residual Burgers vector and the local strain fields. This became
possible with the development of digital image correlation techniques, and special codes in this
study, written for the purpose of analyzing the strains as the slip approaches the boundary, and
emanates or gets blocked at the boundary. Using this methodology, in Section 3.3 are provided
different types of strain fields across selected GBs which display different residual Burgers vector
magnitudes. The strain fields are directly correlated with the mechanism of interaction:
Low 0| |rb
, the dislocations are transmitted through the grain boundary and the strains
are continuous across the interface (Figure 5, inset marked A, 0 16| | .rb a
).
Intermediate 0 2 1| | ( . )rb a to
, a residual dislocation is left on the grain boundary, this
represents the most common case, the strains accumulate on one side of the grain boundary
depending on the | |rb
magnitude (Figure 5, inset marked B, 0 28| | .rb a
).
High 1| |rb
, dislocations are blocked at the grain boundary, high strain accumulation is
measured on one side of the grain boundary (Figure 6, insets marked A and B, 1 14| | .rb a
and 1 28| | .rb a
).
These results can be utilized to illustrate the significant role that grain boundaries play in the slip
transfer process, in particular they can be useful in further modeling efforts, which include the
strengthening associated with slip dislocation-GB interactions. The accumulation of residual
dislocations at the grain boundary induces a strain discontinuity across the interface that is
proportional to the | |rb
magnitude. It follows that | |rb
can be used as a parameter to quantify (i) the
strain accumulation at the grain boundaries, and (ii) the strengthening effect due to the single grain
boundary. We note the judicial choice of FeCr polycrystals with relatively large grain sizes, and most
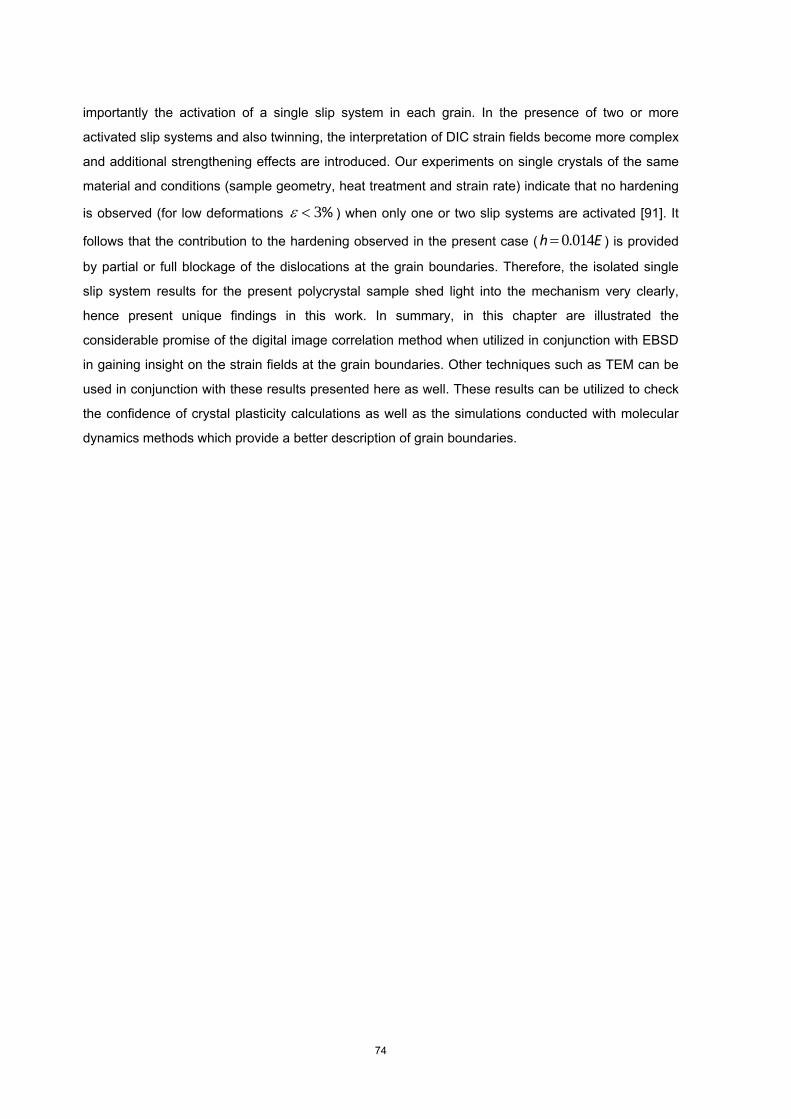
74
importantly the activation of a single slip system in each grain. In the presence of two or more
activated slip systems and also twinning, the interpretation of DIC strain fields become more complex
and additional strengthening effects are introduced. Our experiments on single crystals of the same
material and conditions (sample geometry, heat treatment and strain rate) indicate that no hardening
is observed (for low deformations 3% ) when only one or two slip systems are activated [91]. It
follows that the contribution to the hardening observed in the present case ( 0 014.h E ) is provided
by partial or full blockage of the dislocations at the grain boundaries. Therefore, the isolated single
slip system results for the present polycrystal sample shed light into the mechanism very clearly,
hence present unique findings in this work. In summary, in this chapter are illustrated the
considerable promise of the digital image correlation method when utilized in conjunction with EBSD
in gaining insight on the strain fields at the grain boundaries. Other techniques such as TEM can be
used in conjunction with these results presented here as well. These results can be utilized to check
the confidence of crystal plasticity calculations as well as the simulations conducted with molecular
dynamics methods which provide a better description of grain boundaries.

Ch
DaPart o
In thi
2Nb a
analy
The
techn
class
micro
4.1
It is d
and m
meltin
condi
F
EBM
comp
hapte
amagof this work i
s chapter ar
alloy. Local s
yze the influe
analyzed T
nology. EMD
sical manufac
ostructure of
Manufa
difficult to ob
microstructu
ng (EBM) te
itions, thereb
igure 4.1. S
technology
peting techno
er4
geaccis published
re presented
strain measu
ence of the m
Ti-48Al-2Cr-2
D allows to
cturing proce
γ-TiAl alloys
acturingp
btain a comp
re desired a
echnology (F
by reducing t
Schematic o
for “layer b
ologies and
cumuin [91].
d the results
urements via
microstructur
2Nb alloy w
manufactur
esses. Such
s in the dama
process
ponent produ
adopting the
igure 4.1), t
the risk of ox
of the EBM m
by layer” pro
it is possible
75
ulation
obtained fro
a high resolu
re on the da
was manufa
re compone
‘defect-free
age accumula
uced with γ-T
classical m
the process
xidation in the
machine (fro
oductions off
e to operate
non
om the fatigu
ution digital im
amage accum
ctured using
ents without
’ alloy enabl
ation proces
TiAl interme
manufacturing
of material p
e material of
om [92]).
fers several
at temperat
γ‐TiA
ue experimen
mage correla
mulation for t
g Electron
the typical
es to focus
s.
tallics with e
g processes.
production o
the final com
advantages
ures closer t
Al
nts on the T
ation enable
this duplex γ
Beam Melt
defects de
on the influe
exactly the c
. Using Elec
operates und
mponents.
s with respe
to the meltin
Ti-48Al-2Cr-
d to further
γ-TiAl alloy.
ting (EBM)
erived from
ence of the
composition
ctron Beam
der vacuum
ect to other
ng points of

the interm
the powde
titanium an
componen
defects su
has to be
between e
necessitat
concept is
correspond
shows how
initiation s
strains loc
formation o
In the fol
approache
material se
samples w
C(T) spec
cracks).
Figuretempe
The classi
neglecting
order to o
attempt to
etallic alloys
ers of the in
nd aluminum
nts are produ
uch as inclus
accounted
equiaxed and
es to focus
s shown in F
dence of a
w the EBM p
sites derive f
calize before
of a crack.
lowing para
es based on
ensibility to d
with an artific
cimens allow
e 4.2. Typicrature fai led
cal experime
all the effec
overcome th
o rationalize
s [93]. In the
nitial materia
m with the sa
uced. The m
ions, pores e
since the p
d lamellar gra
on the effec
Figure 4.2. T
flat area res
process dras
from the loca
crack initiat
agraphs the
fatigue exp
defects in hig
cial defect ar
wed to analy
al fai lure inid after 3.2 1
ental method
cts correlated
he limitations
e the effec
e EBM proce
al and the p
ame chemica
main advanta
etc. In this sc
possible crac
ains. In this s
ct of the mat
The crack in
sulted from t
stically reduc
al microstruc
ion occurs, a
Ti-48Al-2Cr
periments. A
gh cycle fatig
e firstly pres
yze the crac
it iat ion site 06 cycles (R
dologies allow
d with the loc
s of the cla
ct of the m
76
ess, compon
owders are
al compositio
age of the E
cenario more
ck initiation
scenario the
terial micros
nitiation site
the decohes
ces the pres
ctural feature
and determin
r-2Nb alloy
series of ex
gue (HCF) re
sented. Furth
ck growth fo
found in fatR=0; σmax=3
w to charact
cal material c
ssical exper
material mic
ents are pro
made of an
on as the fin
EBM process
e relevance
sites can be
e application
structure. An
after a fatig
sion of a lam
ence of man
es. It is so im
ne the critica
is character
xperiments f
egime using
her crack gro
or different c
tigue tests. 340 MPa), fr
terize the ma
composition
rimental met
rostructure
oduced witho
n intermetall
nal intermeta
s consists on
on the mate
e found at g
of the defec
example w
gue experim
mellar packa
nufacturing d
mportant to u
al conditions
rized using
for the chara
classical sm
owth experim
crack lengths
Specimen teom [91].
aterial on the
on the micro
thodologies,
using high
out vaporizat
ic alloy bas
allic with whic
n the reduct
erial microstru
general inte
ct tolerance d
which support
ment was fou
age. This exa
defects, and
understand w
which lead
the experim
acterization
mooth sample
ments by mea
s (short and
ested at roo
e meso-scale
o-scale lengt
we made
resolution
tion of
ed on
ch the
tion of
ucture
rfaces
design
ts this
und in
ample
crack
where
to the
mental
of the
es and
ans of
d long
om
e, thus
ths. In
a first
strain

meas
of str
alloy
4.2
The g
by m
paten
condi
press
to ob
Figur
altern
no ev
Mate
geom
remo
4.2.1
Interm
those
F
The p
is ma
surements vi
rains and co
(lamellar or
Materia
gamma titani
eans of the
nted process
itions (Figure
sure of 1700
btain the dup
re 4.5, the d
nated with la
vidence of m
rial has bee
metry was ma
oving the mac
1 Micros
metallics are
e of the cons
igure 4.3. B
present alloy
ainly compo
ia digital ima
orrelate thes
equiaxed gra
al
ium aluminid
EBM A2 ma
s [94] which
e 4.1). The E
bar for 4 h.
plex microst
uplex micros
amellar grain
material defe
en produced
anufactured b
chining allow
tructure
e defined as
stituent metal
Binary Ti-Al
y examined i
osed by the
age correlatio
se localizatio
ains).
de (γ-TiAl) Ti-
achine produc
h allows foc
EBM materia
An heat trea
ructure (2h
structure is
ns with rando
ects like inc
in the form
by conventio
wance.
the compou
ls, and thus i
phase diag
n this chapte
e intermetall
77
on (DIC) tec
ons with the
-48Al-2Cr-2N
ced and dist
used electro
al was hot is
atment (TT),
at 1320 °C)
composed o
omly distribu
clusions, por
m of near-ne
onal machinin
unds of met
intermetallic
ram, [96].
er, the gamm
ic phase γ-
hnique. The
local micros
Nb alloy stud
tributed by A
on beam me
ostatically p
to be perfor
. As it may
of aggregate
uted orientati
res or dendr
et-shape spe
ng with caref
tals whose c
phases and
ma titanium a
-TiAl. From
idea is to m
structural fea
died in this w
Arcam AB (Sw
elting to be
ressed (HIPe
rmed after H
be observed
es (or cluste
ons. From t
rites was fou
ecimens and
fully selected
crystal struct
ordered allo
aluminide (γ
the phase
measure the
atures of the
work has bee
weden), acc
performed
ed) at 1260
HIP, was set
d in the mic
ers) of equia
the observat
und in the s
d final the fin
d cutting para
tures are dif
oys are includ
γ-TiAl) Ti-48A
diagram pr
localization
e analyzed
n produced
cording to a
in vacuum
°C under a
up in order
crograph of
axed grains
ions made,
specimens.
nal sample
ameters for
fferent from
ded [95].
Al-2Cr-2Nb,
oposed by
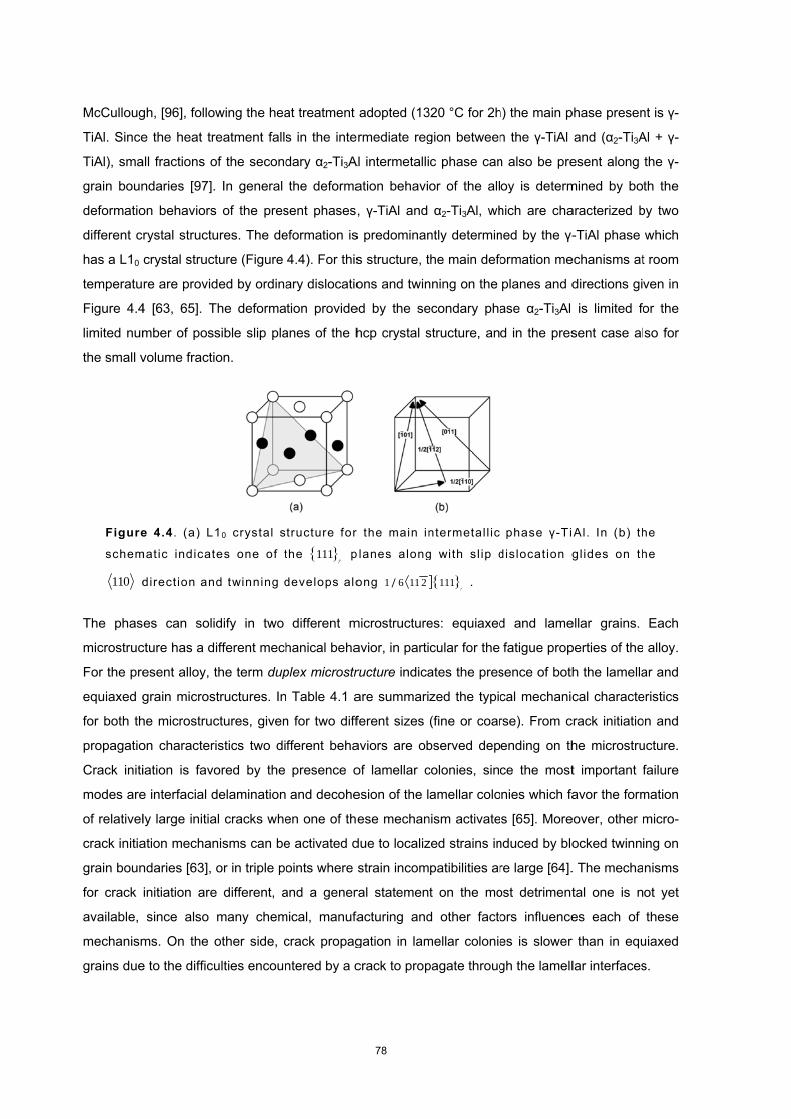
McCulloug
TiAl. Since
TiAl), sma
grain boun
deformatio
different c
has a L10
temperatu
Figure 4.4
limited num
the small v
Figure
schem
110 d
The phas
microstruc
For the pre
equiaxed g
for both th
propagatio
Crack initi
modes are
of relativel
crack initia
grain boun
for crack
available,
mechanism
grains due
gh, [96], follo
e the heat tr
all fractions o
ndaries [97].
on behaviors
rystal structu
crystal struc
re are provid
4 [63, 65]. T
mber of poss
volume fracti
e 4.4. (a) L
matic indicat
direction an
es can soli
cture has a d
esent alloy, t
grain micros
he microstruc
on character
iation is favo
e interfacial d
ly large initia
ation mechan
ndaries [63],
initiation are
since also
ms. On the
e to the difficu
owing the hea
reatment falls
of the second
. In general
s of the pres
ures. The de
ture (Figure
ded by ordina
The deforma
sible slip pla
on.
10 crystal s
tes one of t
d twinning d
idify in two
ifferent mech
the term dup
structures. In
ctures, given
ristics two di
ored by the
delamination
al cracks whe
nisms can be
or in triple po
e different, a
many chem
other side, c
ulties encoun
at treatment
s in the inte
dary α2-Ti3A
the deforma
sent phases,
eformation is
4.4). For this
ary dislocatio
tion provide
anes of the h
tructure for
the 111 p
develops alo
different m
hanical beha
plex microstr
Table 4.1 a
n for two diff
fferent beha
presence o
and decohe
en one of the
e activated d
oints where s
and a gener
mical, manufa
crack propag
ntered by a c
78
adopted (13
rmediate reg
Al intermetalli
ation behavi
, γ-TiAl and
s predominan
s structure, t
ons and twin
ed by the se
hcp crystal s
the main in
lanes along
ong 1 6 11 2/
microstructure
avior, in parti
ructure indica
are summari
ferent sizes
aviors are ob
of lamellar c
esion of the l
ese mechan
due to localiz
strain incom
ral statemen
acturing and
gation in lam
crack to prop
320 °C for 2h
gion between
c phase can
or of the all
α2-Ti3Al, wh
ntly determin
the main defo
nning on the
econdary pha
structure, an
ntermetall ic
g with sl ip d
111 .
es: equiaxed
cular for the
ates the pres
zed the typic
(fine or coar
bserved dep
colonies, sinc
amellar colo
nism activate
zed strains in
patibilities ar
t on the mo
d other facto
mellar colonie
pagate throug
h) the main p
n the γ-TiAl
n also be pre
oy is determ
hich are cha
ned by the γ-
ormation me
planes and d
ase α2-Ti3Al
d in the pres
phase γ-Ti
dislocation g
d and lame
fatigue prop
sence of both
cal mechanic
rse). From c
ending on th
ce the most
nies which fa
s [65]. More
nduced by blo
re large [64].
ost detriment
ors influence
es is slower
gh the lamell
phase presen
and (α2-Ti3A
esent along
mined by bo
aracterized b
-TiAl phase
echanisms at
directions giv
is limited fo
sent case al
Al. In (b) th
glides on th
ellar grains.
perties of the
h the lamella
cal characte
crack initiatio
he microstru
t important f
favor the form
eover, other m
ocked twinni
. The mecha
tal one is n
es each of
r than in equ
lar interfaces
nt is γ-
Al + γ-
the γ-
th the
by two
which
t room
ven in
or the
so for
he
he
Each
alloy.
ar and
eristics
on and
ucture.
failure
mation
micro-
ing on
nisms
ot yet
these
uiaxed
s.

Tfr
In F
micro
a me
avera
Fm[9
Seve
micro
the F
resolu
local
the
micro
exper
obser
Table 4.1. Mrom [65].
igure 4.5 i
ostructures a
ean colony s
age grain siz
igure 4.5. material is c98]) is repor
ral difficultie
omechanical
FeCr alloy. F
ution. It follow
strains introd
microstructu
omechanical
rimental set-
rve differenc
Mechanical c
s shown a
are clearly ob
size of 100 μ
e of 15 μm [9
Optical micomposed byrted the typi
es arise fo
deformation
First of all th
ws that with
duced by slip
re have tw
deformation
-up. The sca
ces in the loc
haracteristic
a micrograp
bserved. Lam
μm, while th
92].
croscope imy uniaxial gcal compos
or adopting
n mechanism
he average g
the adopted
p and twinnin
wo different
n behaviors
ale adopted
cal microstru
79
cs of the lam
h obtained
mellar colonie
he equiaxed
mage followgrains and lit ion of the
an experim
ms (slip and t
grain size is
d DIC experim
ng separately
crystal lat
. These asp
in the proce
ucture, with a
mellar and e
after etchi
es have a m
grained mic
wing etchingamellar cololamellae.
mental proc
twinning) as
s too small c
mental set-up
y. On the oth
ttices, leadi
pects canno
eeding will b
a clear chara
equiaxed gra
ng a samp
ean fraction
crostructure
g. The micronies. In the
edure which
shown in the
compared w
p, it is not po
her hand, the
ng to com
ot be overta
e the length
acterization o
ain microstru
ple, the tw
in volume o
is character
rostructure e schematic
h considers
e previous c
with the avai
ossible to rec
e phases ins
mpletely diffe
aken with th
h scale whic
of the lamell
uctures,
o different
of 40%, and
rized by an
of the c (from
s also the
chapters for
lable strain
cognize the
ide each of
erent local
he adopted
h allows to
ar colonies
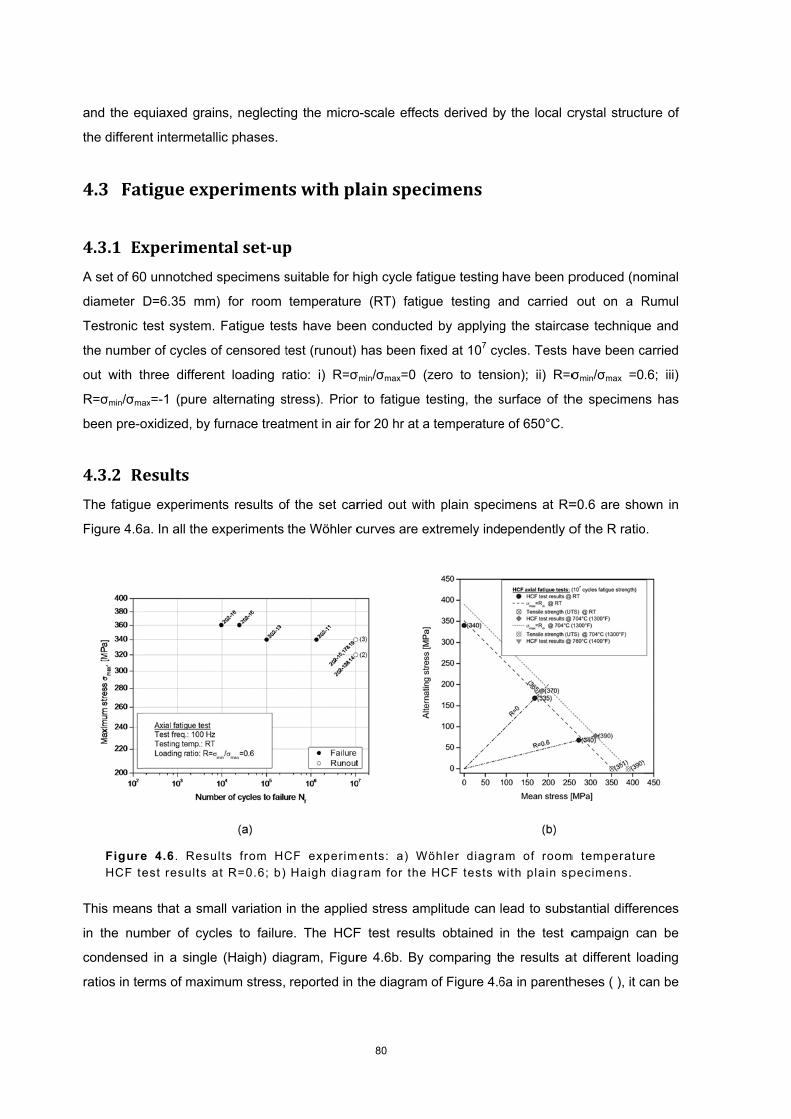
and the eq
the differen
4.3 Fat
4.3.1 Ex
A set of 60
diameter
Testronic t
the numbe
out with t
R=σmin/σma
been pre-o
4.3.2 Re
The fatigu
Figure 4.6
FigureHCF te
This mean
in the num
condensed
ratios in te
quiaxed grai
nt intermetal
tigueexp
xperimen
0 unnotched
D=6.35 mm
test system.
er of cycles o
hree differe
ax=-1 (pure a
oxidized, by f
esults
e experimen
a. In all the e
e 4.6 . Resuest results a
ns that a sma
mber of cyc
d in a single
erms of maxim
ns, neglectin
llic phases.
periment
ntalset‐up
specimens s
m) for room
Fatigue tes
of censored t
nt loading r
alternating s
furnace treat
nts results o
experiments
ults from HCat R=0.6; b)
all variation
cles to failur
e (Haigh) dia
mum stress,
ng the micro
tswithpl
p
suitable for h
temperature
sts have bee
test (runout)
atio: i) R=σ
stress). Prior
tment in air f
f the set car
the Wöhler c
CF experim Haigh diag
in the applie
e. The HCF
agram, Figur
reported in t
80
o-scale effec
lainspec
high cycle fat
e (RT) fatig
en conducted
has been fix
σmin/σmax=0 (z
r to fatigue t
for 20 hr at a
rried out with
curves are e
ents: a) Wöram for the
ed stress am
F test result
re 4.6b. By
the diagram
ts derived by
cimens
tigue testing
ue testing a
d by applying
xed at 107 cy
zero to tens
testing, the s
a temperature
h plain spec
xtremely ind
öhler diagraHCF tests w
mplitude can
s obtained
comparing t
of Figure 4.6
y the local c
have been p
and carried
g the stairca
ycles. Tests
sion); ii) R=σ
surface of th
e of 650°C.
cimens at R=
ependently o
am of roomwith plain sp
lead to subs
in the test c
he results a
6a in parenth
crystal struct
produced (no
out on a R
ase techniqu
have been c
σmin/σmax =0
he specimen
=0.6 are sho
of the R ratio
m temperatupecimens.
stantial differ
campaign ca
at different lo
heses ( ), it c
ure of
ominal
Rumul
e and
carried
.6; iii)
ns has
own in
o.
re
rences
an be
oading
can be
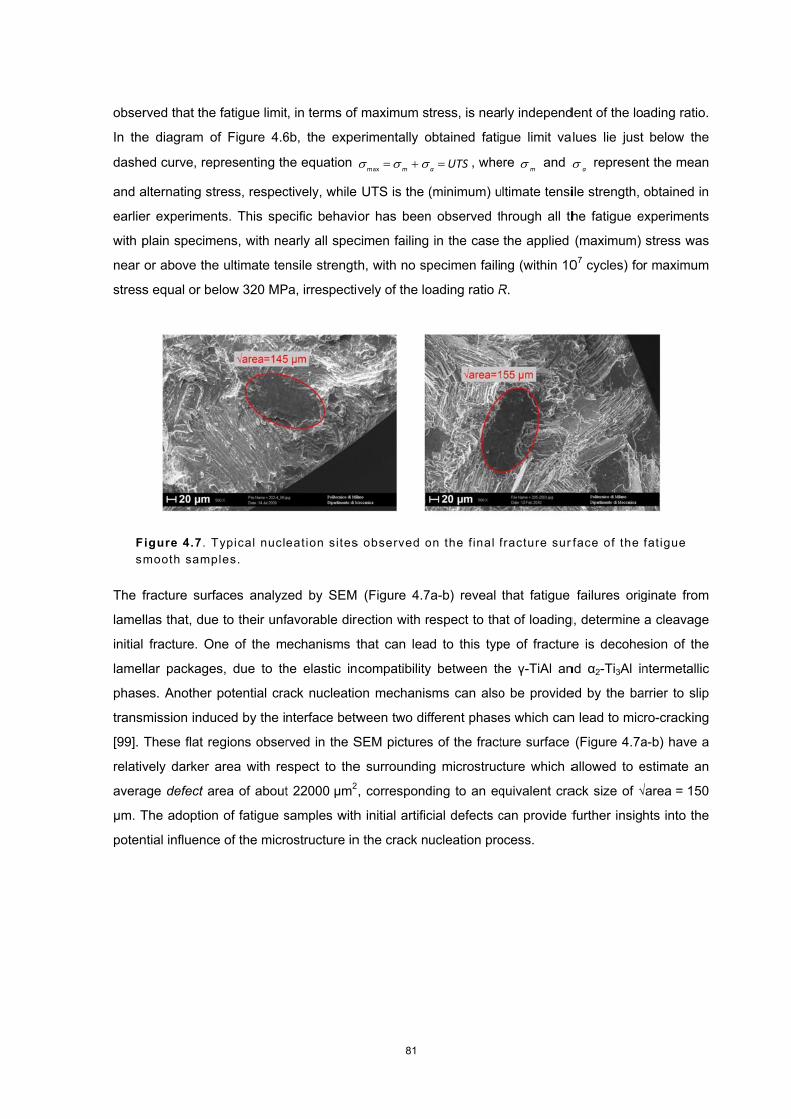
obser
In the
dashe
and a
earlie
with p
near
stress
Fs
The f
lamel
initial
lamel
phase
trans
[99].
relativ
avera
µm. T
poten
rved that the
e diagram o
ed curve, rep
alternating st
er experimen
plain specim
or above the
s equal or be
igure 4.7. Tmooth samp
fracture surf
llas that, due
fracture. O
llar package
es. Another
mission indu
These flat re
vely darker
age defect a
The adoption
ntial influence
e fatigue limit
of Figure 4.6
presenting th
tress, respec
nts. This spe
mens, with ne
e ultimate te
elow 320 MP
Typical nuclples.
faces analyz
e to their unf
ne of the m
es, due to th
potential cra
uced by the i
egions obser
area with re
rea of about
n of fatigue s
e of the micr
t, in terms of
6b, the expe
he equation
ctively, while
ecific behavio
early all spec
nsile strengt
Pa, irrespectiv
eation sites
zed by SEM
favorable dire
echanisms t
he elastic in
ack nucleatio
nterface betw
rved in the S
espect to the
t 22000 µm2
samples with
rostructure in
81
f maximum s
erimentally o
max m
UTS is the (
or has been
cimen failing
th, with no sp
vely of the lo
s observed o
(Figure 4.7
ection with r
that can lea
compatibility
on mechanis
ween two dif
SEM pictures
e surroundin
, correspond
h initial artific
n the crack n
tress, is nea
obtained fatig
aUTS , whe
(minimum) u
n observed t
in the case
pecimen faili
oading ratio R
on the f inal f
7a-b) reveal
respect to tha
d to this typ
y between th
sms can also
fferent phase
s of the fract
g microstruc
ding to an eq
cial defects c
ucleation pro
rly independ
gue limit va
ere m
and
ultimate tensi
hrough all th
the applied
ng (within 10
R.
fracture surf
that fatigue
at of loading
pe of fracture
he γ-TiAl an
o be provide
es which can
ture surface
cture which a
quivalent cra
can provide f
ocess.
dent of the lo
lues lie just
a represen
ile strength,
he fatigue e
(maximum)
07 cycles) fo
face of the
failures orig
g, determine
e is decohe
nd α2-Ti3Al in
ed by the ba
n lead to mic
(Figure 4.7a
allowed to e
ack size of √
further insig
ading ratio.
below the
nt the mean
obtained in
experiments
stress was
r maximum
fatigue
ginate from
a cleavage
sion of the
ntermetallic
arrier to slip
ro-cracking
a-b) have a
estimate an
√area = 150
hts into the

4.4 Fat
4.4.1 Ex
A set of 40
defects in
the specim
a)
Figurefat igue√area=
The artifici
x 100 µm
notches, a
consisting
procedure
minimum
pre-oxidize
unnotched
staircase
respective
4.4.2 Re
By employ
defects) as
R ratio can
(Figure 4.9
√area. In t
non-propa
4.10a. A f
indicate th
tigueexp
xperimen
0 specimens
the form of t
mens by EDM
e 4.8. Geome experimen=644 µm; b)
ial defects in
(√area=220
all specimen
of fatigue lo
ensures tha
compressive
ed by furna
d and FCG s
procedure a
ely.
esults
ying the Mura
s ∆K=0.65∆σ
n be evaluat
9b) enduranc
he case of ru
agating crack
fracture surf
e lamellar co
periment
ntalset‐up
s with a gaug
tiny rectangu
M, as shown
metry of thents (8 mm g) SEM pictur
ntroduced ha
0 µm), Figur
ns with artif
oading in cy
at fatigue cr
e residual st
ce treatmen
specimens. F
at R=0 and
akami mode
σ (π√area)1/2
ted. In the pl
ce strength s
un-out specim
ks has been
face of a sa
olonies wher
tswithar
p
ge diameter o
ular micro-slo
in Figure 4.8
specimensauge diamere of art if icia
ave dimensio
e 4.8. In ord
icial defects
ycling compr
racks are ge
resses at cr
nt in air for
Finally, fatigu
R=0.6, with
l for the asse2, the thresh
ots of Figure
stress range
mens tested
observed in
ample failed
re crack prop
82
rtificiald
of 8 mm hav
ots have bee
8.
s for assesseter) and a) al defects p
ons of 1500 µ
der to gener
s have been
ression for a
enerated at t
rack tip. Afte
20h at a te
ue experimen
h defects wit
essment of t
old correspo
e 4.9, for loa
es are given
at stress am
corresponde
at R=0.6 is
pagated throu
defects
ve been prod
en carefully p
b)
sing defect snominal shroduced by
µm x 300 µm
rate small c
n submitted
a number of
the root of t
er pre-cracki
emperature
nts have bee
th √area eq
he range of
onding to the
ading ratio of
as a function
mplitudes cor
ence of the i
s shown in
ugh two lame
uced, and tw
produced in
sensit ivity iape of arti f iEDM.
m (√area=644
racks at the
to a pre-cr
cycles up to
he EDM not
ng, all spec
of 650°C, a
en performed
ual to 220
stress intens
e endurance
f R=0 (Figure
n of the equi
rresponding t
nitial (artificia
Figure 4.10b
ellar colonies
wo type of ar
the mid-sect
n short cracicial defect
4 µm) and 50
e root of the
racking proc
o 107 cycles
tch by keep
cimens have
as in the ca
d according
µm and 644
sity factor (su
strength for
e 4.9a) and
ivalent defec
to the fatigue
al) defects, F
b, the red a
s.
rtificial
tion of
ck of
00 µm
EDM
cedure
s. This
ping to
been
ase of
to the
4 µm,
urface
r each
R=0.6
ct size
e limit,
Figure
arrows
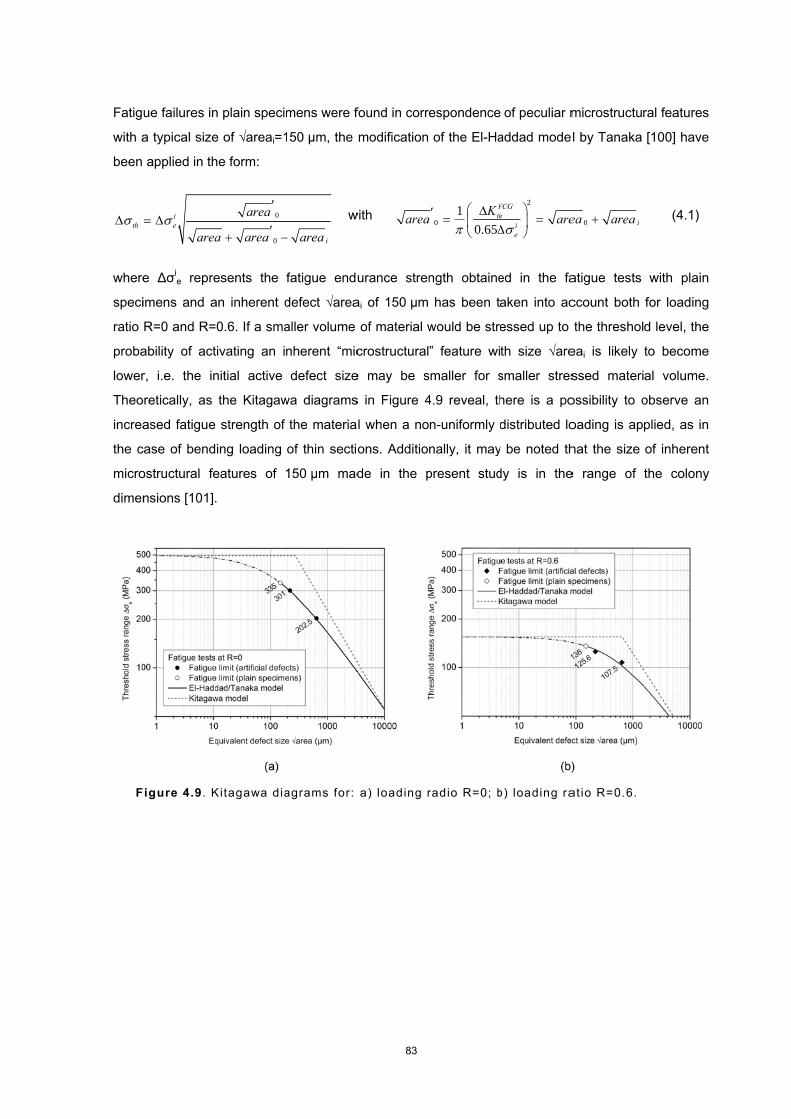
Fatig
with a
been
th
where
speci
ratio
proba
lower
Theo
increa
the c
micro
dimen
F
ue failures in
a typical size
applied in th
ie
are
e ∆σie repre
imens and a
R=0 and R=
ability of act
r, i.e. the in
oretically, as
ased fatigue
case of bend
ostructural fe
nsions [101]
igure 4.9. K
n plain speci
e of √areai=1
he form:
0
0
area
a area
esents the
an inherent d
=0.6. If a sma
tivating an i
nitial active
the Kitagaw
e strength of
ding loading
eatures of
.
Kitagawa dia
mens were f
150 µm, the
iarea
w
fatigue endu
defect √area
aller volume
nherent “mic
defect size
wa diagrams
the materia
of thin sectio
150 µm mad
agrams for:
83
found in corr
modification
with area
urance stren
ai of 150 µm
of material w
crostructural
e may be s
s in Figure 4
l when a no
ons. Additio
de in the p
a) loading r
espondence
of the El-Ha
01
0.65
FthK
a
ngth obtaine
has been ta
would be stre
” feature wi
smaller for s
4.9 reveal, th
n-uniformly d
nally, it may
present stud
radio R=0; b
of peculiar m
addad mode
2
FCGh
ie
are
ed in the fa
aken into ac
essed up to
th size √are
smaller stres
here is a po
distributed lo
y be noted th
dy is in the
b) loading ra
microstructu
l by Tanaka
0 iea area
atigue tests
ccount both
the threshol
eai is likely
ssed materi
ossibility to o
oading is ap
hat the size
e range of
at io R=0.6.
ral features
[100] have
(4.1)
with plain
for loading
d level, the
to become
al volume.
observe an
plied, as in
of inherent
the colony
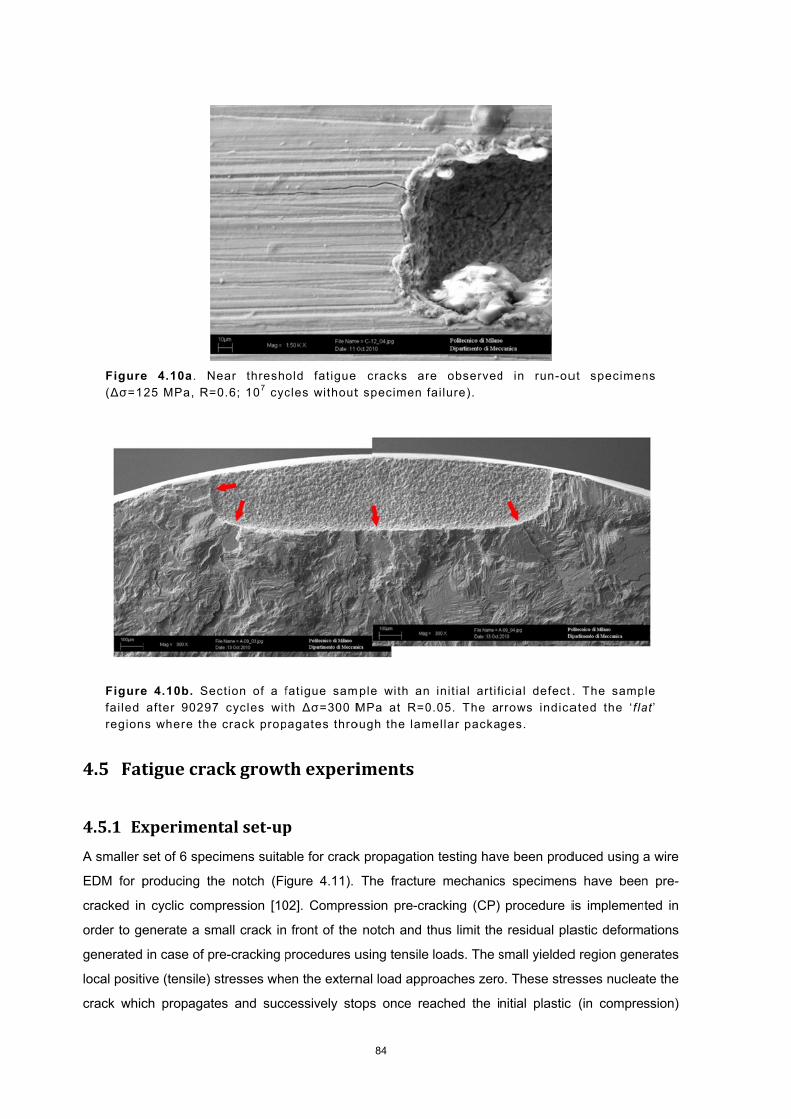
Figure(∆σ=1
Figurefai led region
4.5 Fat
4.5.1 Ex
A smaller
EDM for p
cracked in
order to ge
generated
local posit
crack whic
e 4.10a . N25 MPa, R=
e 4.10b. Seafter 90297
ns where the
tiguecra
xperimen
set of 6 spec
producing th
n cyclic com
enerate a sm
in case of p
ive (tensile)
ch propagat
Near thresh=0.6; 107 cyc
ection of a f7 cycles wite crack prop
ackgrowt
ntalset‐up
cimens suita
he notch (Fi
pression [10
mall crack in
re-cracking p
stresses whe
es and succ
old fatigue cles without
fat igue samth ∆σ=300 M
pagates thro
thexperi
p
ble for crack
gure 4.11).
02]. Compres
front of the
procedures u
en the extern
cessively sto
84
cracks art specimen f
ple with anMPa at R=0
ough the lam
iments
k propagation
The fractur
ssion pre-cr
notch and t
using tensile
nal load appr
ops once re
re observedfailure).
init ial art i f0.05. The a
mellar packa
n testing hav
e mechanics
acking (CP)
thus limit the
loads. The s
roaches zero
ached the i
d in run-ou
icial defectrrows indicages.
ve been prod
s specimens
procedure i
e residual pla
small yielded
o. These stre
nitial plastic
ut specimen
. The sampated the ‘f la
duced using
s have been
is implemen
astic deform
d region gene
esses nuclea
(in compre
ns
le at ’
a wire
n pre-
ted in
ations
erates
ate the
ssion)

mono
of th
ampli
F
For s
blade
Fnn
Fatig
mach
deter
behav
(R=0
value
otonic region
e crack gro
itude the fina
igure 4.11 .
starting a cra
e polishing te
igure 4.12.otch which ucleation of
ue crack gro
hine (Figure
rmine the thr
vior, fatigue
.05 and R=0
e for a long c
n. Using the p
owth test ar
al pre-crack l
Sample geo
ack in cyclic
echnique (Fig
SENVB medisplay hig
f non-propag
owth tests h
4.13a) and
reshold stres
crack growt
0.6) by increa
rack is reach
pre-cracking
re cancelled
ength can be
ometry for c
c compressio
gure 4.12).
ethod appliegh localizedgating small
ave been ca
the crack le
ss intensity f
th tests at ro
asing the ap
hed.
85
procedure, t
d. Moreover,
e controlled.
crack growth
on the wire
ed to the ord strains al cracks in f
arried out by
ength monito
factor for lon
oom tempera
pplied ∆K (lo
the effects o
, selecting t
h experimen
EDM starter
riginal notchnd stressesront of the o
y means of
ored by COD
ng cracks ∆K
ature have b
ad amplitude
f the crack c
the appropr
ts.
r notch was
h in order tos. This metoriginal notc
a servo-hydr
D gage (Figu
Kth and the l
een carried
e) in small st
closure at the
riate compre
sharpened
o obtain a sthodology ech.
raulic MTS 8
ure 4.13b).
long crack p
out at const
steps until the
e beginning
essive load
by a razor
shallow nables
810 testing
In order to
propagation
tant R ratio
e threshold

Figuregrip se
4.5.2 Re
In the fatig
at R=0.05
about 4 M
crack grow
cases wa
advancem
Cr
3.2
ob
∆K
Ho
ap
to
to
e 4.13. Expeet-up; b) pa
esults
gue crack gr
no crack gro
MPa√m. Two
wth curve dis
s observed
ments were m
rack growth
25x106 cycl
bserved. Foll
K=6.13 MPa
olding the lo
ppreciable cr
∆K=6.70 MP
the final failu
erimental serticular of th
rowth experim
owth was ob
crack growt
splays a simi
a stable c
measured wh
curve 1 (Fi
es (with a
lowing an in
a√m) an ins
oad at ∆K=6
rack propaga
Pa√m) starte
ure.
et-up for crahe COD gag
ments a coh
served for ∆
th curves for
lar crack pro
crack propag
en the load w
igure 4.14a)
final ∆K=5.
ncrement of t
stantaneous
6.13 MPa√m
ation. A furth
ed the fast c
86
ack propagage for the me
herent behav
∆K below 6 M
r each load
opagation be
gation beha
was increase
), R=0.05. In
.77 MPa√m)
the applied
crack adva
m for about
her small inc
crack propag
ation experimeasure of th
vior was obse
MPa√m, while
ratio R are
havior. In pa
avior, while
ed.
nitially, the s
) and a sm
load amplitu
ancement o
additional
rement of th
ation which
ments, a) loe crack leng
erved: for th
e for the tests
reported in F
rticular, in an
several ins
sample was
mall crack a
ude (from ∆K
of ∆a=0.6mm
1.5x10⁶ cycl
e load (from
quickly cond
ad frame angth.
e tests cond
ts at R=0.6, ∆
Figure 4.14.
ny of the ana
stantaneous
s cycled for
advancemen
K=5.77 MPa
m was obse
les didn’t le
m ∆K=6.13 M
ducted the s
nd
ducted
∆Kth is
Each
alyzed
crack
about
t was
√m to
erved.
ead to
Pa√m
ample

F2c
igure 4.14a refers to eonducted at
Crack gro
MPa√m f
incremen
produced
MPa√m t
Crack gro
also for t
amplitude
doesn’t d
curves, 1
(as cases
enabled t
Crack gr
technique
to a final
a . Crack groexperiments t load ratio R
owth curve 2
for more tha
nt was succ
d a small cra
o ∆K=6.24 M
owth curve 3
he experime
e equivalent
display any s
and 2, the f
s 3 and 4). In
to measure s
rowth curve
e in order to
value of a=7
owth curvesconducted
R=0.6.
(Figure 4.14
an 9x10⁶ cyc
essively app
ck advancem
MPa√m) gene
3 (Figure 4.1
ents carried o
to ∆K=3.8 M
stable crack
final propaga
n the previou
several point
4 (Figure 4
measure the
7.5mm for 5x
87
from differat load rati
4a), R=0.05.
cles without
plied (from
ment of ∆a=0
erated the fa
14a), R=0.6.
out at a load
MPa√m was r
k propagation
ation stage w
us cases, thi
ts for the fatig
4.14a). In th
e threshold s
x106 cycles, a
ent samplesio R=0.05, w
The initial lo
appreciable
∆K=5.75 MP
0.5mm. A fur
ast crack prop
Similar crac
d ration R=0.
required to s
n region. In
was “almost-
s characteris
gue crack gr
his case was
tress intensit
at this point (
s. Crack growhile 3 and
oad was hold
crack adva
Pa√m to ∆K
rther load inc
pagation.
ck growth be
6. For crack
tart the prop
fact, in the
-unstable”, b
stic of the fin
owth rate cu
s implement
ty range ∆Kth
(∆K=4.1 MPa
owth curvesd 4 to exper
d at a consta
ncement. A
K=6.04 MPa
crement (fro
ehaviors were
k growth curv
pagation whic
first two cra
but not “totall
nal crack gro
urves (Figure
ted the load
h. The crack
a√m) the loa
s 1 and riments
nt ∆K=5.75
small load
a√m) which
m ∆K=6.04
e observed
ve 3 a load
ch basically
ack growth
ly-unstable”
owth curves
4.16).
d reduction
was grown
d reduction

pr
re
dis
im
(w
the
The crack
crack grow
paths due
stages of
propagatio
particular,
barrier to t
applied ΔK
crack pro
advancem
Figurecrack from e
The increm
progressiv
explained
sliding of
microstruc
ocedure wa
ducing the a
splayed on
mplies that th
where we firs
e load of the
k growth cur
wth curves d
to local micr
small crac
on. The loc
the crack en
the crack adv
K) is necessa
pagation sin
ments (Figure
e 4.14b. Varlength. Dat
experiment a
ment of ∆Kt
ve developm
that the obs
the crack
ctural effects
as implemen
applied ∆K w
the crack gr
he value of
st observed a
e unstable pro
rves present
isplay a non
rostructural e
k propagatio
al microstru
ncountered l
vancement.
ary to advanc
nce it incre
e 4.14b).
r iat ion of tha extrapolatat R=0.05.
th with crack
ment of crack
served closu
flanks indu
s. This effec
nted. The l
while the cra
rowth curve
the thresho
a crack adva
opagation).
ed here allo
-linear crack
effects [103,
on for whic
ucture strong
lamellar colo
In this scena
ce the crack.
eases the ra
e stress inteted from the
k advanceme
k closure eff
ure effects (e
uced by the
ct becomes
88
oad reducti
ack is propag
4, the crac
old is contai
ancement) to
owed to prov
k growth beh
104]. Figure
ch is eviden
gly influence
onies which
ario, a load in
. This effect
ange of str
ensity threse crack grow
ent for sma
fects. In the
especially w
e non-linear
important
on procedu
gating till the
ck didn’t stop
ned in the
o ∆K=4.06 M
vide two ma
avior which
e 4.15 shows
nt the non-li
es the sma
are not well
ncrement (an
is beneficial
ress intensit
hold range wth curves
ll crack leng
eir work, Gar
when the cra
r nature of
especially fo
re consists
e crack front
p during this
interval from
MPa√m (whic
ain considera
characterize
s two images
inear charac
ll crack gro
oriented and
nd so also an
in terms of r
ty threshold
with the increported in
gths can be
rcia and Seh
ck is small)
the growin
or materials
of progres
t stops. As c
s procedure
m ∆K=3.8 M
ch correspon
ations. First
es non-linear
s obtained at
cter of the
owth behavi
d provided a
n increment
resistance of
∆Kth with
rement of thFigure 4.14
correlated t
hitoglu [103
derive from
ng crack d
s that exhib
ssively
clearly
. This
Pa√m
nds to
of all
r crack
t early
crack
or. In
a local
of the
f small
crack
he 4a
to the
, 104]
m local
ue to
it low
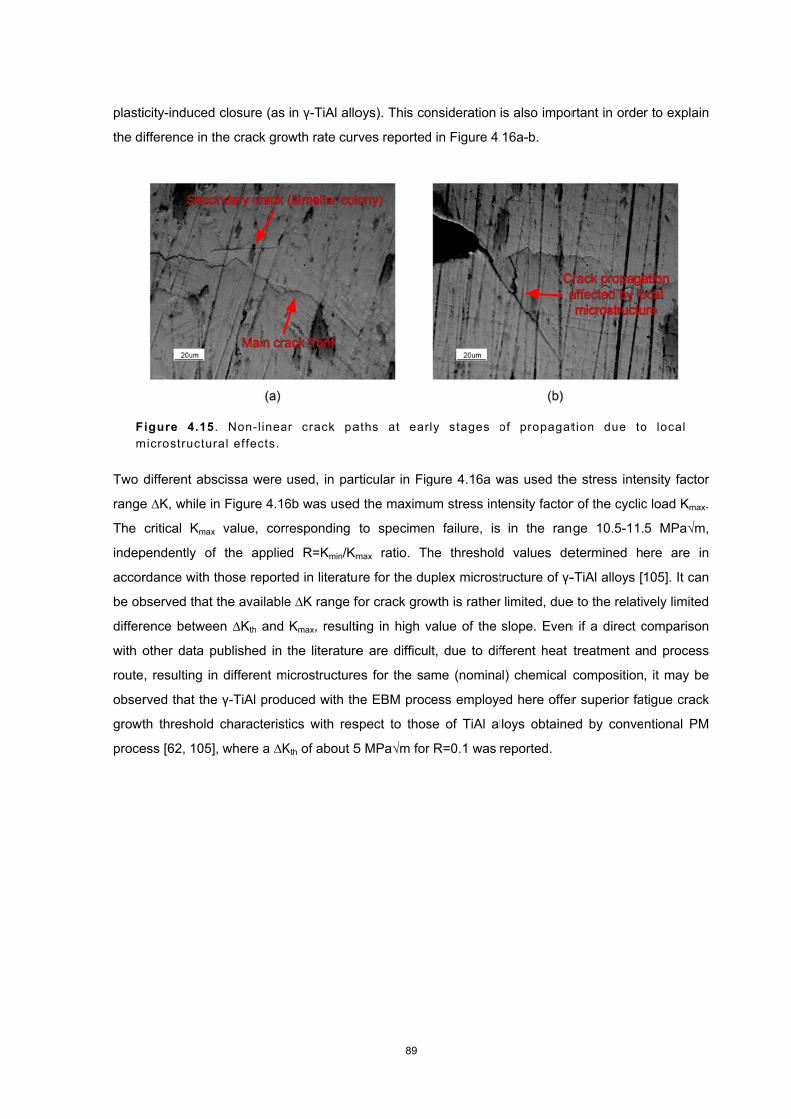
plasti
the d
Fm
Two
range
The
indep
accor
be ob
differ
with o
route
obser
growt
proce
icity-induced
ifference in t
igure 4.15microstructur
different abs
e ∆K, while in
critical Kmax
pendently of
rdance with t
bserved that
ence betwee
other data p
e, resulting in
rved that the
th threshold
ess [62, 105]
closure (as
the crack gro
. Non-l inearal effects.
scissa were
n Figure 4.16
x value, corr
f the applie
those reporte
the available
en ∆Kth and
published in
n different m
e γ-TiAl prod
characterist
, where a ∆K
in γ-TiAl allo
owth rate cur
ar crack pa
used, in par
6b was used
responding
ed R=Kmin/Km
ed in literatu
e ∆K range f
Kmax, resulti
the literature
microstructure
uced with th
tics with res
Kth of about 5
89
oys). This co
rves reported
aths at ear
rticular in Fig
d the maximu
to specimen
max ratio. Th
re for the du
for crack grow
ing in high v
e are difficu
es for the sa
he EBM proc
spect to thos
5 MPa√m for
onsideration
d in Figure 4.
ly stages o
gure 4.16a w
um stress int
n failure, is
he threshold
uplex microst
wth is rather
value of the
lt, due to dif
ame (nomina
cess employe
se of TiAl al
r R=0.1 was
is also impor
16a-b.
of propagat
was used the
tensity factor
in the ran
d values de
tructure of γ-
r limited, due
slope. Even
fferent heat
al) chemical
ed here offer
loys obtaine
reported.
rtant in orde
tion due to
e stress inte
r of the cyclic
nge 10.5-11.
etermined h
-TiAl alloys [
e to the relati
n if a direct c
treatment an
composition
r superior fa
ed by conve
r to explain
o local
nsity factor
c load Kmax.
5 MPa√m,
ere are in
105]. It can
vely limited
comparison
nd process
, it may be
tigue crack
ntional PM
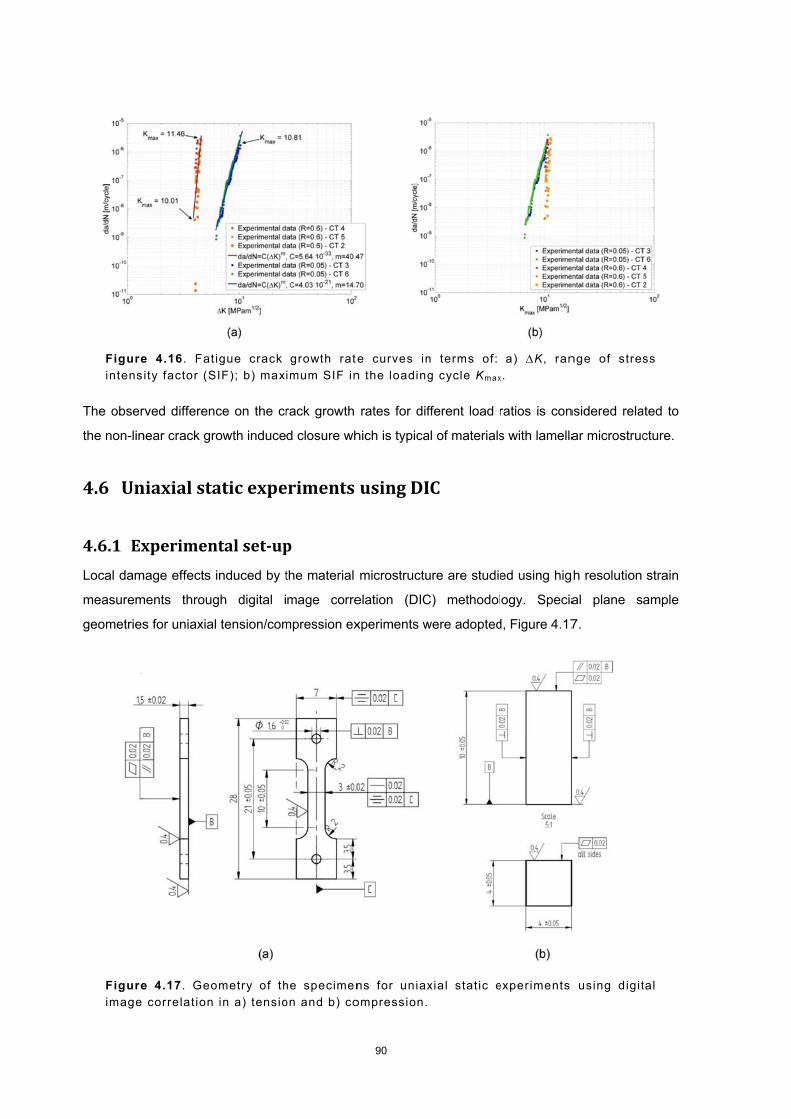
Figureintens
The obser
the non-lin
4.6 Un
4.6.1 Ex
Local dam
measurem
geometries
Figureimage
e 4.16. Fatity factor (S
rved differen
near crack gr
niaxialsta
xperimen
mage effects
ments throug
s for uniaxia
e 4.17. Geo correlation
igue crack SIF); b) max
ce on the cr
rowth induce
aticexpe
ntalset‐up
induced by t
gh digital i
l tension/com
ometry of thin a) tensio
growth rateimum SIF in
rack growth
d closure wh
eriments
p
the material
mage corre
mpression ex
he specimenon and b) co
90
e curves inn the loading
rates for dif
hich is typica
usingDI
microstructu
elation (DIC
xperiments w
ns for uniaxompression.
n terms of: g cycle Kmax
fferent load r
al of materials
C
ure are studie
C) methodol
were adopted
xial stat ic e
a) ∆K, ran
x.
ratios is con
s with lamella
ed using hig
ogy. Specia
d, Figure 4.17
experiments
nge of stres
nsidered rela
ar microstruc
h resolution
al plane sa
7.
using digit
ss
ated to
cture.
strain
ample
tal
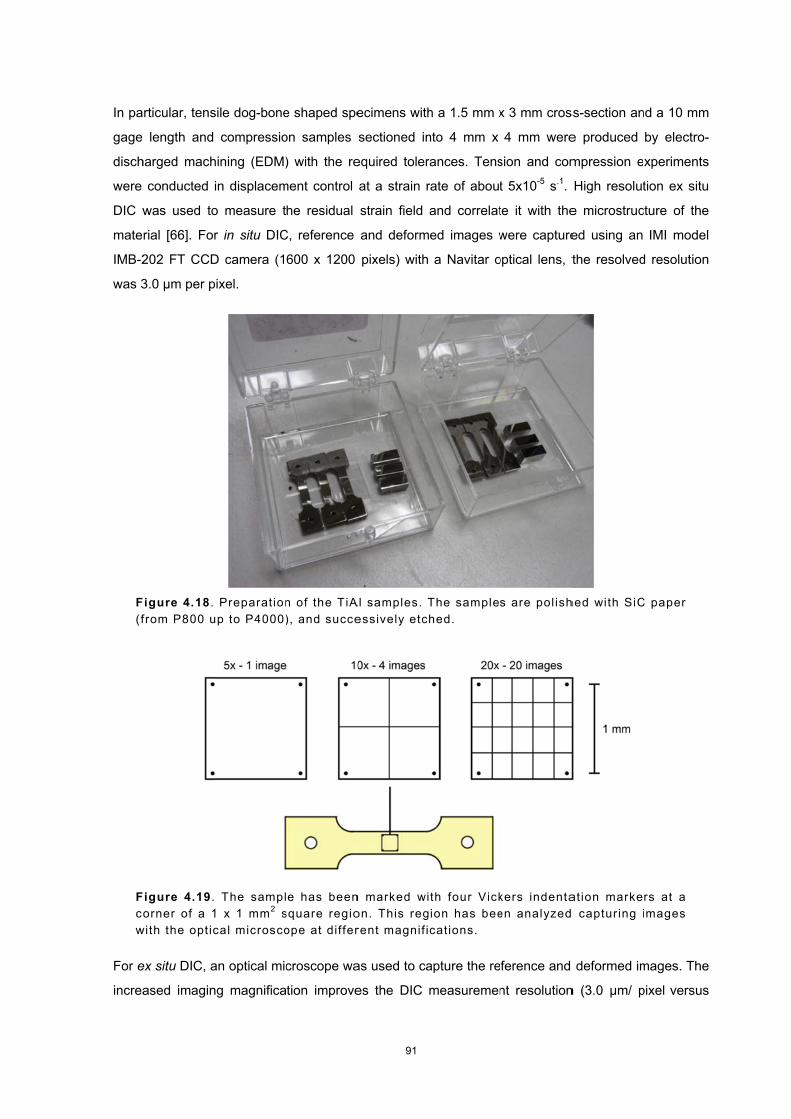
In pa
gage
disch
were
DIC w
mate
IMB-2
was 3
F(f
Fcw
For e
increa
rticular, tens
length and
harged mach
conducted
was used to
rial [66]. For
202 FT CCD
3.0 μm per p
igure 4.18.from P800 u
igure 4.19 .orner of a 1
with the optic
ex situ DIC, a
ased imagin
sile dog-bone
compressio
hining (EDM)
in displacem
o measure t
r in situ DIC
D camera (1
pixel.
Preparationup to P4000)
The sampl1 x 1 mm2 scal microsco
an optical mic
ng magnifica
e shaped spe
on samples
) with the re
ment control
he residual
C, reference
600 x 1200
n of the TiA), and succe
e has beensquare regioope at differ
croscope wa
tion improve
91
ecimens with
sectioned in
equired toler
at a strain r
strain field
and deform
pixels) with
Al samples. Tessively etc
n marked wion. This regrent magnif i
as used to ca
es the DIC
h a 1.5 mm x
nto 4 mm x
rances. Tens
rate of about
and correlat
ed images w
a Navitar o
The samplehed.
th four Vickion has beecations.
apture the re
measuremen
x 3 mm cros
4 mm were
sion and com
t 5x10⁻⁵ s.1.
te it with the
were capture
optical lens, t
s are polish
kers indentaen analyzed
ference and
nt resolution
ss-section an
e produced
mpression e
High resolut
e microstruc
ed using an
the resolved
hed with SiC
ation marke capturing i
deformed im
n (3.0 μm/ p
nd a 10 mm
by electro-
xperiments
tion ex situ
cture of the
IMI model
d resolution
C paper
rs at a images
mages. The
pixel versus
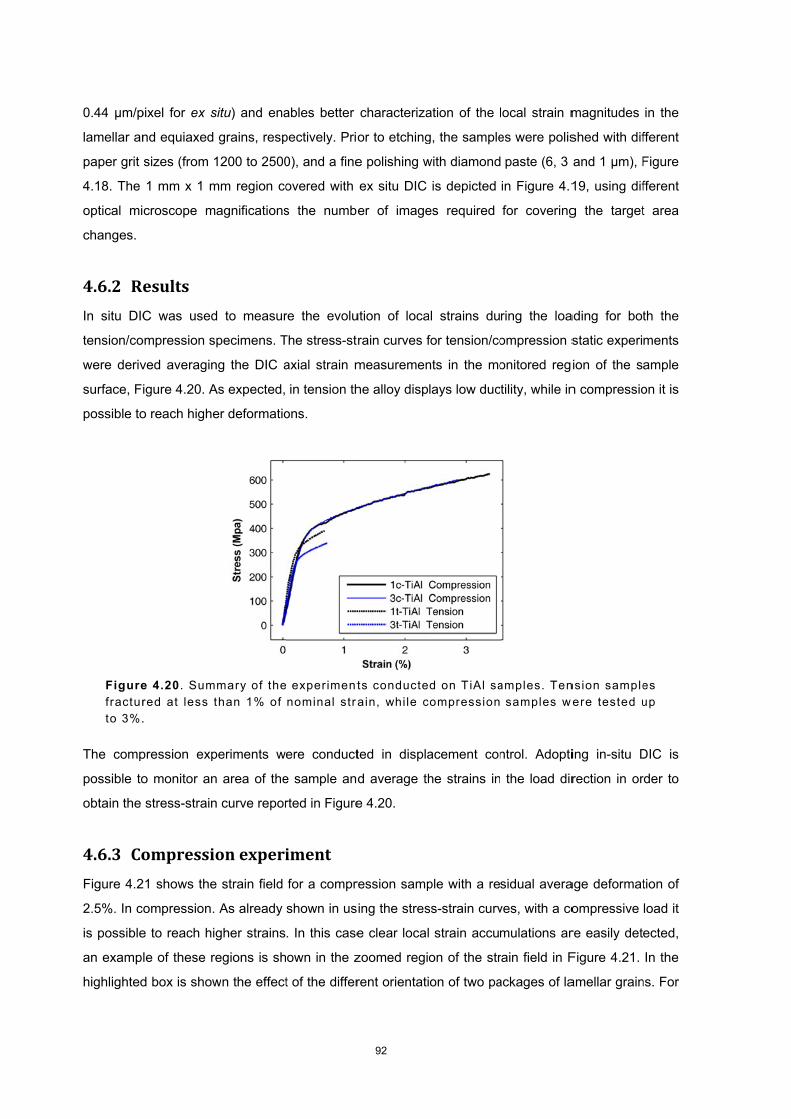
0.44 μm/p
lamellar an
paper grit
4.18. The
optical mi
changes.
4.6.2 Re
In situ DIC
tension/co
were deriv
surface, F
possible to
Figurefracturto 3%.
The comp
possible to
obtain the
4.6.3 Co
Figure 4.2
2.5%. In c
is possible
an examp
highlighted
pixel for ex s
nd equiaxed
sizes (from 1
1 mm x 1 m
croscope m
esults
C was used
ompression s
ved averagin
igure 4.20. A
o reach highe
e 4.20 . Sumred at less t.
pression exp
o monitor an
stress-strain
ompressi
21 shows the
ompression.
e to reach hi
le of these r
d box is show
situ) and ena
grains, resp
1200 to 2500
mm region co
magnifications
d to measur
specimens. T
ng the DIC a
As expected,
er deformatio
mmary of thethan 1% of
periments w
n area of the
n curve repor
onexperi
e strain field
As already
gher strains
regions is sh
wn the effect
ables better
pectively. Prio
0), and a fine
overed with
s the numbe
re the evolu
The stress-st
axial strain m
in tension th
ons.
experimentnominal stra
ere conduct
e sample and
rted in Figure
iment
for a compr
shown in us
. In this case
own in the z
t of the differ
92
characteriza
or to etching
e polishing w
ex situ DIC
er of image
ution of loca
rain curves f
measuremen
he alloy disp
ts conducteain, while c
ted in displa
d average th
e 4.20.
ression samp
ing the stres
e clear local
zoomed regio
rent orientati
ation of the l
g, the sample
with diamond
is depicted
es required
al strains du
for tension/co
nts in the mo
lays low duc
d on TiAl saompression
acement con
he strains in
ple with a re
ss-strain curv
strain accu
on of the str
on of two pa
local strain m
es were polis
paste (6, 3
in Figure 4.1
for covering
ring the loa
ompression s
onitored reg
tility, while in
amples. Ten samples we
ntrol. Adopti
the load dir
sidual avera
ves, with a co
mulations ar
rain field in F
ackages of la
magnitudes
shed with dif
and 1 µm), F
19, using dif
g the target
ading for bot
static experi
ion of the sa
n compressio
nsion sampleere tested u
ing in-situ D
rection in or
age deformat
ompressive
re easily dete
Figure 4.21.
amellar grain
in the
fferent
Figure
fferent
t area
th the
ments
ample
on it is
es up
DIC is
rder to
tion of
load it
ected,
In the
ns. For

the p
plane
orient
high r
Fmlod7dde
4.6.4
Unde
comp
curve
stress
interm
succe
not re
than
micro
introd
present level
e which resp
ted lamellar
residual stra
igure 4.21microstructuroad directioisplay differ% are obseformation. ecohesion xperiments.
4 Tensio
er tensile lo
parison betw
e of the tensi
s of about σ
mediate load
essively unlo
eported in th
the compres
ostructure on
ducing cyclin
of the anal
pect to the lo
colony (on
ins, while for
. Example re map obtan. In the serent strain fserved, whi
The localimechanism
nexperim
oads, the a
ween compre
on experime
σ=400 MPa
ding step. The
oaded till a fi
he stress-str
ssion case. T
n the local
g loadings.
lysis is not p
oad direction
the left insid
r the other la
of ex situ ained after elected regioields. On thle on the ized strains between
ment
nalyzed ma
ession-tensio
ent analyzed
at a deform
e sample wa
nal residual
rain curve). I
This analysis
strain fields
93
possible to d
n. Neverthel
de the analyz
amellar colon
high resoluetching. Th
on is possibe lamellar ccolony on
s observed lamellar co
aterial shows
on stress-str
is reported i
mation of up
as statically l
deformation
In this case,
s is only a fir
in tension,
determine th
ess this limi
zed strain fie
ny no residua
ution DIC ohe strain f i leble to obsercolony on th the right
in the lamolonies alre
s the typica
rain curves
in Figure 4.2
to 0.7%. Ex
oaded till a m
n of 0.24% (t
, it is expect
rst attempt to
and newel
he third com
itation, it is c
eld selection
al strains wer
overlapped ed refers torve two lamee left strainis almost
mellar packeady obser
al brittleness
in Figure 4
2. The samp
x-situ DIC w
maximum str
he unloading
ted much low
o understand
experiments
mponent of th
clear how a
n, Figure 4.2
re observed.
with the mo the strain el lar colonie
n localizatiofree of re
kage confirmrved in the
ss of TiAl a
4.20). The s
ple failed at a
was impleme
ress of σ=35
g part of the
wer strain lo
d the effect
ts will be im
he lamellar
a favorable-
1) displays
material in the
es that n up to esidual ms the e HCF
alloys (see
tress-strain
a maximum
ented at an
50 MPa and
diagram is
ocalizations
of the local
mplemented

Figurerefere
(ex-sit
Figure 4.2
about 340
capturing t
localized r
Figureof 0.2microson the
From the
region of
intersects
e 4.22. Strnce images
tu) with an a
3 reports the
0 µm x 640
the images
residual strai
e 4.23. Stra24%. Locastructure; ine interface re
local residua
high localize
also the inte
ress-Strain and deform
average res
e residual str
µm, success
before the e
ns was succ
in plot for al ization of
n particular egions betw
al strain field
ed strains pr
erface with th
curve for med images
idual strain
rain field for
sively overla
experiment. A
essively sele
region of thstrains a
on the regioween two lam
d and the sc
ropagates al
e upper grai
94
the tensions has been
of ε=0.24%
a selected re
apped with th
A smaller re
ected and an
he sample wre measuron analyzedmellar colon
chematic of t
long the inte
n.
n experimeimplemente
.
ectangular re
he images o
gion of 225
nalyzed.
with an avered in diffe
d the high loies.
the local mic
erface betwe
nt. Correlated out of th
egion of the
of the micros
µm x 225 µ
age residuaerent locatocalized stra
crostructure i
een the lame
tion betweehe load fram
sample surfa
structure obt
µm displaying
al deformatiotions of thains nuclea
is evident th
ellar colonie
en me
ace of
tained
g high
on he te
at the
es and

95
4.7 Finalconsiderations
A potential disadvantage of cast and PM γ-TiAl alloys, in terms of component design, is their limited
fatigue crack growth resistance and damage tolerance. Additionally, in the case of cast and
conventional PM TiAl alloys, due to the unfavourable combination of fatigue crack growth threshold,
propagation behaviour and bigger inherent defects-porosity, non-metallic inclusions and metallurgical
defects, like dendrites, the usable fatigue endurance strength may be quite limited. In general, there
is a small difference between the fatigue threshold stress-intensity-range of long cracks and the
apparent fracture toughness, leading to shortened lifetimes for small changes in applied stress. For
the analysed Ti-48Al-2Cr-2Nb alloy, the manufacturing process adopted (EBM) allows to avoid the
typical defects of cast or PM materials, providing higher fatigue threshold and fatigue strength.
In this chapter were firstly depicted the results adopting the classical fatigue experiments. Fatigue
experiments were implemented on fatigue specimens with an artificial defect, in this case the fatigue
threshold were estimated for two different initial defect depths. The experimental results can be
accurately described by a modified El-Haddad model, see equation (4.1). In Figure 4.9 is reported
the equation representing the adopted model, along with the experimental fatigue limits for the
samples with the artificial defects. In addition, the results obtained for plain samples are also reported
in the same diagrams (see Figure 4.9). HCF limits for plain specimens are required to be translated
at an initial defect size of √areai of 150 µm for both for loading ratio R=0 and R=0.6 in order to match
the prevision made with equation (4.1). This fundamental consideration points to the fact that
nevertheless the material is free from initial manufacturing defects, the fatigue limits for smooth
samples display values which can be explained only assuming the presence of initial defects with an
average size of √areai=150 µm. Analyses of the fracture surfaces show the presence of flat areas
corresponding to the lamellar colonies which are considered to be potential crack initiation sites
(Figure 4.7). In particular these regions display an average area √areaLamellarColonies=150 µm which
corresponds to the observed initial crack length defect √areai. Not only fatigue limits are affected by
the microstructure, but also the small crack propagation, and thus stress intensity threshold ranges
(section 4.4). The lamellar colonies are observed to provide an initial tortuous crack path which
provides barriers to crack advancement when the crack front encounters unfavourable lamellar
packages (see micrographs in Figure 4.15). Moreover, roughness induced crack closure also
develops as a consequence of the non-linear crack path (Section 4.5.2). This observation suggests
that the reduction of the grain size is potentially detrimental for the capability to develop roughness-
induced crack closure, thus reducing the crack propagation resistance of the alloy.
Along the classical experimental approaches just discussed, in this chapter is also introduced the
implementation of high resolution DIC for determining the local effect of the material microstructure
on the strain fields. The results presented using DIC strain fields clearly confirm the critical role on
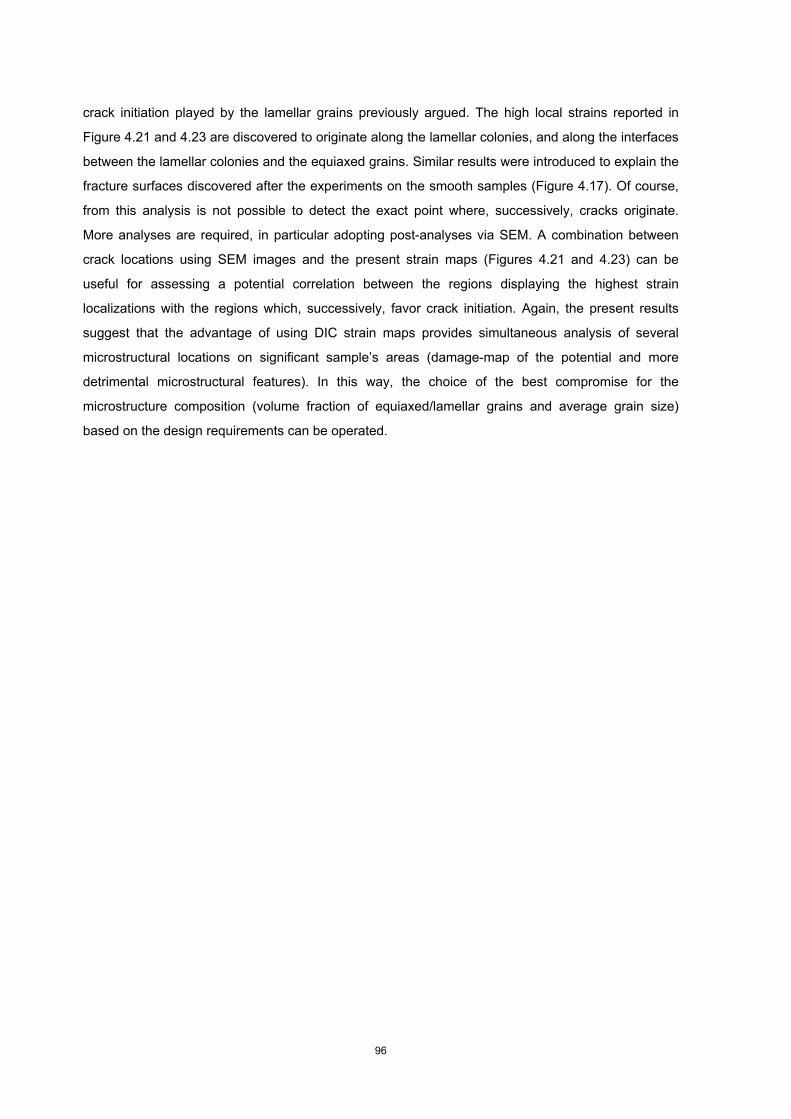
96
crack initiation played by the lamellar grains previously argued. The high local strains reported in
Figure 4.21 and 4.23 are discovered to originate along the lamellar colonies, and along the interfaces
between the lamellar colonies and the equiaxed grains. Similar results were introduced to explain the
fracture surfaces discovered after the experiments on the smooth samples (Figure 4.17). Of course,
from this analysis is not possible to detect the exact point where, successively, cracks originate.
More analyses are required, in particular adopting post-analyses via SEM. A combination between
crack locations using SEM images and the present strain maps (Figures 4.21 and 4.23) can be
useful for assessing a potential correlation between the regions displaying the highest strain
localizations with the regions which, successively, favor crack initiation. Again, the present results
suggest that the advantage of using DIC strain maps provides simultaneous analysis of several
microstructural locations on significant sample’s areas (damage-map of the potential and more
detrimental microstructural features). In this way, the choice of the best compromise for the
microstructure composition (volume fraction of equiaxed/lamellar grains and average grain size)
based on the design requirements can be operated.

97
Chapter5
ConcludingRemarksandFuture
Developments
5.5 ConcludingRemarks
In order to continuously improve the knowledge of the material behavior and provide more reliable
models able to correctly predict the stresses and deformations inside components, newel
experimental approaches are required to follow the natural evolution of the research. This work
presented the usage of a promising experimental approach which is able to link the material behavior
on the microscopic scales with the material behavior on the meso and macro scales through local
strain measurements. High resolution strain fields have been obtained from Digital Image Correlation
(DIC), and the combination of these results with the microstructural information of the alloy provided
important conclusions on bcc crystal plasticity, and on damage accumulation on γ-TiAl alloys. The
main results obtained are summarized in the following paragraphs.
5.1.1. ResultsofChapter2
In Chapter 2, the results provide the basis for discussion of pertinent issues regarding deformation in
bcc materials when both slip and twinning occurs, and support the following conclusions: (i) the
observed stress-strain behaviors are classified in four different Cases (schematic in Figure 2.5)
based on the activated mechanisms (twin/slip) that lead to a different crystal hardening (twin-twin and
twin-slip interactions display higher hardening than slip-slip interactions). (ii) For Case I (twinning
dominated) is observed a lower critical resolved shear stress for twin migration (124 MPa) compared
to the Case II (153 MPa) where twin nucleation is preceded by significant slip activity. (iii) Twin
nucleation occurs at an average critical resolved shear stress of 190 MPa. For the cases analyzed in
this study this observation suggests that a critical shear stress for twin nucleation holds to a first
approximation. (iv) The nucleation of slip occurs at an average critical resolved shear stress of 90
MPa and always precedes twin nucleation. (v) Local strain measurements are provided on twin-twin
and twin-slip intersection regions for two specific crystal orientations. Twin-twin intersections lead to
higher strain localizations (up to 10%) compared to the twin-slip case (up to 6%).

98
These conclusions provide deep insight into deformation behavior of bcc alloys, in particular on the
active deformation mechanisms based on the crystal orientation. Moreover, strain fields can be used
as a check of crystal plasticity calculations.
5.1.2. ResultsofChapter3
In Chapter 3 were investigated dislocation-grain boundary interactions for a FeCr alloy using strain
fields determined by digital image correlation. Strain fields across GBs provide a direct quantification
of the GB capability to transmit or block slip dislocations. The study elucidates the role of the residual
Burgers vector magnitude in predicting full/partial slip transmission, or slip blockage. Along the
Chapter are provided the strain fields across four GBs displaying different residual Burgers vector
magnitudes. In particular, for low 0| |r
b
no residual dislocation is left on the grain boundary. In this
case slip is observed to transmit unaltered across the interface and the resulting strain field is
continuous. For intermediate 0 2 1| | ( . )rb a to
, depending on the | |r
b
magnitude a step on the strain
field is observed on the interface that represents the strain accumulation on the GB side of the
incoming slip system. Finally, for high 1| |r
b a
, dislocations are blocked at the grain boundary, and
high strain accumulation is measured on one side of the grain. The results clearly show a direct
correlation of the strain change across the interfaces with the | |r
b
magnitude thus indicating the
possibility to use the | |r
b
as a parameter for predicting the slip transmission capability of the grain
boundaries in a polycrystal material.
5.1.3. ResultsofChapter4
In the case of the Ti-48Al-2Cr-2Nb alloy examined in Chapter 4, the advantage of the γ-TiAl
produced by the EBM process is that typical defects of cast or PM materials can be avoided and
higher fatigue threshold and fatigue strength with respect to competing technologies can be obtained.
Thus, the experiments carried out on this duplex γ-TiAl alloy allow to focus on the influence of the
microstructure (lamellar and equiaxed grains) on the fatigue properties. From the observation of the
experimental results the following conclusions may be drawn. (i) The fatigue experiments with
artificial defects show that ∆Kth for defects larger than 100-150 µm can be described very accurately
by a modified El-Haddad relationship, taking into account the inherent microstructural features of the
material; the values of the threshold stress intensity factor range depend on the loading ratio R, so
that the mechanism does not seem to be governed by Kmax. only, as it might be assumed from the
fatigue experiments with un-notched specimens at different R ratios. This apparently simple material
model, illustrated in the diagrams of Figure 4.17 gives to the designers useful indications about the
influence of defects size on the fatigue endurance strength that may employed for the safe design of
gas turbine components. (ii) High resolution DIC strain fields were also measured in conjunction with

99
microstructural maps for determining the local effect of the material microstructure and locate
potential micro-crack sites. From the static uniaxial tension/compression experiments were observed
high localized strains accumulated along lamellar colonies and in the interfaces regions between
lamellar and equiaxed grains. (iii) Further experiments adopting high resolution DIC will be carried
out under cyclic loads in order to obtain more detailed damage maps of the microstructure. As shown
in this work, these tools provide valuable information on the microstructure design (volume fraction
and average size of the lamellar and equiaxed grains) in order to reach the required mechanical
properties.
5.2. Futuredevelopments
Following the experiments depicted in the preceding chapters, some possible developments on the
DIC technique, and some different applications are here presented. Some of these results refer to
experiments obtained by the author and aim to provide further insight for future research works. The
aim of this chapter is to show potential advanced applications of the experimental methodology
adopted. In section 5.1 is presented an application of the in situ DIC methodology at high
temperature (400°C) for a FeCr single crystal with 10 1[ ] crystal orientation. A comparison between
the strain fields obtained at room temperature (chapter 2) and at high temperature is shown. In
section 5.2 a promising application of ex situ DIC via SEM is investigated for studying twin-twin
interactions. The strain field in correspondence of a twin-twin intersection is analyzed and the
improvements obtained using these high resolution images are compared with the previous strain
field resolutions available.
5.2.1. HighTemperatureexperimentsonFeCr
One of the main issues in the usage of DIC at high temperature arises with the choice of the correct
speckle. In fact, the increment of the temperature introduces difficulties in generating a speckle patter
that doesn’t change during the experiment. Paint burning and oxidation are the main sources of
modification of the speckle pattern during the experiment. If the experiment is particularly long (e. g.
fatigue, creep, etc.) these problems can void the strain measurements. Different solutions for
producing the speckle are available depending on the type of the experiment. The experiments
carried out in this study are all static experiments, in this case the duration of the experiment is
limited. Moreover also the temperature is limited (400°C). This allows to use the same type of
speckle patter (black pain applied with an Iwata airbrush) providing that the speckle is pre-heated
before the experiment.

Figure(a) roopreced
The pre-he
Figure 5.1
Figure 5.1
Figurehorizohomogon thethe sa
This proce
occur to th
heated ag
a final cor
e 5.1. Compom temperading the exp
eating phase
. Figure 5.1
b shows the
e 5.2. The ntal directio
geneous dise induction hmple-grips
edure enable
he speckle p
ain at the tes
rrelation betw
parison betwature, and (bperiment is n
e induces a
a shows the
same samp
sample heons. The mestribution ofheating. Mosystem.
es to stabiliz
pattern durin
st temperatu
ween the sur
ween the speb) after heanecessary fo
modification
e speckle pa
le heated up
eating produeasure of th the displacreover it is
ze the speck
g the experi
ure (400°C).
rface at room
100
eckle patterating the saor the stabil
on the origi
attern used
p to 400 °C u
uces elonghe displacecement, andpossible to
kle pattern, it
ment. Follow
During this p
m temperatu
produced wmple at 400lization of th
inal speckle
for room te
using load co
ations in thment using d verify eve verify also
t is so expec
wing the pre-
procedure so
ure and the s
with the Iwat0 C. The sahe black pai
patter, whic
mperature e
ntrol with no
he (a) vertDIC allows
entual dis-hthe correct
cted that lim
-heating pha
ome images
surface at hi
ta airbrush ample heatinnt at 400 C
ch can be se
experiments,
ominal stress
ical, and ( to verify thomogeneit ie
t al ignment
mited modific
ase, the sam
are acquired
igh temperat
at ng .
een on
while
σ=0.
b) he es in
ations
mple is
d, and
ture is

availa
samp
set-u
from
In fig
(400
obtain
temp
temp
Fhdn
Digita
mark
mark
displa
C) th
able. The dis
ple induced
p. The expe
the averaged
ure 5.3 is pr
°C) experim
ned two mai
erature (R
erature is sm
igure 5.3. Cigh temperaecreases thucleation of
al Image Cor
ed A in Fig
ed B and C
ay two activa
he strain fie
splacement
by the temp
eriment is co
d strains obt
roposed a co
ents for the
in observatio
420T MPa
mooth, while
Comparisonature (400°he yield strf the slip ba
rrelation ena
ure 5.3 disp
C show the
ated slip syst
elds (inset
filed (Figure
perature grad
onducted in d
ained from th
omparison be
10 1[ ] crysta
ons are evide
and HT
for the high t
between roC) experimess. At hignds leads to
ables also to
plays the str
strain fields
tems as desc
marked A,
101
e 5.2) can be
dient, and so
displacemen
he DIC strain
etween the r
al orientation
ent. First of
330MPa ).
temperature
oom temperment (A). As
h temperato small load
compare th
rain field for
for the room
cribed in Cha
B and C)
e used to ve
o is an indire
t control, an
n fields.
oom temper
n.in tension.
all the nomi
Secondly,
experiment
ature (23°Cs expected,ure two sl ip
d drops in th
e strain field
the high te
m temperatu
apter 2. At th
display diffe
erify the corr
ect verificatio
nd the nomin
ature (23 °C
Comparing t
nal yield stre
the stress-s
are observe
) experimen increasing
p systems ae stress-str
s at the sam
emperature e
ure experime
he same nom
erences bet
rect deforma
on of the gr
nal strain is d
C) and high te
the stress-st
ess decreas
strain curve
ed small load
nts (B and Cg the tempeare activaterain curve.
me nominal s
experiment,
ents. Both s
minal strain (
tween room
ation of the
rips-sample
determined
emperature
train curves
es with the
e for room
drops.
C), and erature ed, the
strain. Inset
while inset
strain fields
points A-B-
m and high

temperatu
the slip lin
Moreover,
systems cl
5.2.2.
Further im
Scanning
used as a
shows one
strain field
cannot be
from the re
Figure(a) Spaxial interac
For the ca
field surro
re experime
es appear in
strains are
learly appea
ExSituD
mprovements
Electron Mic
speckle pat
e of the firs
d surrounding
correlated.
egions which
e 5.4. Twin-peckle pattedirection, hction, in par
ase of twin-tw
unding the r
nts. In partic
nstantaneous
more local
r on the surf
DigitalIm
in the strain
croscope (S
ttern, this all
st correlation
g the twins. D
Nevertheles
h were correl
-twin interacern adopted high strain rt icular on th
win interacti
region of int
cular for high
sly (similar to
ized than th
ace.
ageCorre
n resolution c
EM). In the
lowed to rea
ns implemen
Due to the p
ss these limi
ated.
ction studieand subset
localizationhe obstacle
on reported
teraction, tha
102
h temperatur
o twinning at
he room tem
elationus
can be achie
experiment
ach very high
nted. Twin-tw
particular spe
itations, othe
d using higt size 5x5 µ are obsertwin side w
in Figure 5.
at is the reg
e strain field
t room tempe
mperature st
singSEM
eved using hi
presented h
h image mag
win interactio
eckle pattern
er important
h resolutionµm2; (b) Reved in the here the inc
.4 is possibl
gion where th
s, localizatio
erature) with
train fields, a
gh resolution
here the sam
gnifications (
on is studied
adopted, th
information
n DIC from sidual strairegion of
coming twin
e to notice t
he 111 12[ ](
on of strains
h small load d
and both th
n images fro
mple surface
(900x). Figu
d focusing o
he twinned re
can be extr
SEM imagen field in ththe twin-twis blocked.
the residual
1) twin syst
along
drops.
he slip
om the
e was
re 5.4
on the
egions
racted
s. he
win
strain
tem is

103
blocked in front of the obstacle 11 1 121[ ]( ) twin system. In particular on the twin boundary where the
incoming 111 121[ ]( ) is blocked high strains are measured in the surrounding matrix. This is true for
the intersection region (zoomed region on Figure 5.4b), and also along the blocked twin, on the side
of the incoming twin. These results can be analyzed and interpreted with Molecular Dynamics. The
dislocation mechanisms can be derived and used to interpret the measured strain fields shown.

104

105
References1. Hobrough, A.G.L., The Photogrammetric Record. 2003. 18(104): p. 337-340.
2. Sutton, M.A., J.-J. Orteu, and H. W. Schreier, Image Correlation for Shape, Motion and
Deformation Measurements: Basic Concepts, Theory and Applications. 2009.
3. Dainty, J.C., Laser Speckle and Related Phenomena. Laser Speckle and Related
Phenomena, 1984. XVII.
4. Archbold, E., J.M. Burch, and A.E. Ennos, Recording of In-plane Surface Displacement by
Double-exposure Speckle Photography. Optica Acta: International Journal of Optics, 1970. 17(12): p.
883-898.
5. Archbold, E. and A.E. Ennos, Displacement Measurement from Double-exposure Laser
Photographs. Optica Acta: International Journal of Optics, 1972. 19(4): p. 253-271.
6. Forno, C., White-light speckle photography for measuring deformation, strain, and shape.
Optics & Laser Technology, 1975. 7(5): p. 217-221.
7. Luxmoore, A.R., F.A.A. Amin, and W.T. Evans, In-plane strain measurement by speckle
photography: A practical assessment of the use of Young's fringes. The Journal of Strain Analysis for
Engineering Design, 1974. 9(1): p. 26-35.
8. Stetson, K.A., New design for laser image—speckle interferometer. Optics Technology,
1970. 2(4): p. 179-181.
9. Peters, W.H. and W.F. Ranson, Digital Imaging Techniques In Experimental Stress Analysis.
Optical Engineering, 1982. 21(3): p. 213427-213427.
10. Peters, W.H., et al., Application Of Digital Correlation Methods To Rigid Body Mechanics.
Optical Engineering, 1983. 22(6): p. 226738-226738.
11. Sutton, M.A., et al., Determination of displacements using an improved digital correlation
method. Image and Vision Computing, 1983. 1(3): p. 133.
12. Sutton, M.A., et al., Application of an optimized digital correlation method to planar
deformation analysis. Image and Vision Computing, 1986. 4(3): p. 143.
13. Tian, Q. and M.N. Huhns, Algorithms for subpixel registration. Computer Vision, Graphics,
and Image Processing, 1986. 35(2): p. 220-233.
106
14. Reid, C., The association of twinning and fracture in bcc metals. Metallurgical and Materials
Transactions A, 1981. 12(3): p. 371.
15. Ha, K.F., H.M. Zhang, and K.L. Jing, An investigation on the mechanism of 475°C
embrittlement in High-Cr ferritic stainless steel. Metallurgical Transactions A, 1989. 20(11): p. 2563-
2567.
16. Hull, D., Effect of grain size and temperature on slip, twinning and fracture in 3% silicon iron.
Acta Metallurgica, 1961. 9(3): p. 191.
17. Isozaki, S., S. Takaki, and K. Abiko, High Temperature Deformation Mechanism of a High-
Purity Fe–50 mass% Cr Alloy. physica status solidi (a), 1998. 167(2): p. 471.
18. Kako, et al., Effect of grain size on the deformation properties of a high-purity Fe-50Cr alloy
at 293 and 773 K. 2000, Sendai, JAPON: Japan Institute of Metals. 251.
19. Kako, K., et al., Deformation Mechanisms in High-Purity Fe–50Cr(–5W) Alloys at Elevated
Temperatures. physica status solidi (a), 1998. 167(2): p. 481.
20. Lagneborg, R., Deformation in an iron-30% chromium alloy aged at 475°c. Acta Metallurgica,
1967. 15(11): p. 1737.
21. Mahajan, S., S. Jin, and D. Brasen, Micro-twinning in a spinodally decomposed Fe-Cr-Co
alloy. Acta Metallurgica, 1980. 28(7): p. 971.
22. Marcinkowski, M.J.F., R. M.; Sziemae, A., Effect of 500°C aging on the deformation behavior
of an iron-chromium alloy. Transaction of the American Institute of Mining, Metallurgical and
Petroleum Engineers, 1964. 230: p. 676-89.
23. Christian, J.W. and S. Mahajan, Deformation twinning. Progress in Materials Science, 1995.
39(1-2): p. 1.
24. A.W, S., Twinning and the origin of cleavage nuclei in α-iron. Acta Metallurgica, 1962. 10(9):
p. 803.
25. Sleeswyk, A.W., ½<111> screw dislocations and the nucleation of {112}<111> twins in the
b.c.c. lattice. Philosophical Magazine, 1963. 8(93): p. 1467.
26. Cottrell, A.H. and B.A. Bilby, LX. A mechanism for the growth of deformation twins in
crystals. Philosophical Magazine Series 7, 1951. 42(329): p. 573-581.
27. Mahajan, S., Nucleation and growth of deformation twins in Mo-35 at. % Re alloy.
Philosophical Magazine, 1972. 26(1): p. 161.

107
28. Cahn, R.W., Plastic deformation of alpha-uranium; twinning and slip. Acta Metallurgica,
1953. 1(1): p. 49.
29. Karaman, I., et al., Deformation of single crystal Hadfield steel by twinning and slip. Acta
Materialia, 2000. 48(6): p. 1345.
30. Venables, J.A., The electron microscopy of deformation twinning. Journal of Physics and
Chemistry of Solids, 1964. 25(7): p. 685.
31. Ezaz, T., M.D. Sangid, and H. Sehitoglu, Energy barriers associated with slip-twin
interactions. Philosophical Magazine, 2011. 91(10): p. 1464.
32. Honda, R., Cleavage Fracture in Single Crystals of Silicon Iron. Journal of the Physical
Society of Japan, 1961. 16(7): p. 1309.
33. Kirillov, V.A., et al., The relation between twinning and brittle failure in single crystals of Fe-
Cr-Co-Mo. Phys. Met. Metall., 1989. 68: p. 133-138.
34. Priestner, R. and N. Louat, Twinning and fracture in grain-oriented silicon steel. Acta
Metallurgica, 1963. 11(3): p. 195.
35. Levasseur, J., Étude géometrique de l'intersection des macles et de l'interaction macle-
glissement dans le fer [alpha]. Materials Science and Engineering, 1969. 4(6): p. 343.
36. Magnin, T., L. Coudreuse, and A. Fourdeux, Consequences of slip-twinning interactions on
the monotonic and cyclic deformation of b.c.c. stainless steels. Materials Science and Engineering,
1984. 63(1): p. L5.
37. Mahajan, S. and G.Y. Chin, Twin-slip, twin-twin and slip-twin interactions in Co-8 wt.% Fe
alloy single crystals. Acta Metallurgica, 1973. 21(2): p. 173.
38. Mahajan, S., Twin-Slip And Twin-Twin Interactions In Mo-35 At Per Cent Re Alloy.
Philosophical Magazine, 1971. 23(184): p. 781-&.
39. Mathur, K.K. and P.R. Dawson, On modeling the development of crystallographic texture in
bulk forming processes. International Journal of Plasticity, 1989. 5(1): p. 67.
40. Karaman, I., et al., Modeling the deformation behavior of Hadfield steel single and
polycrystals due to twinning and slip. Acta Materialia, 2000. 48(9): p. 2031.
41. Kalidindi, S.R., C.A. Bronkhorst, and L. Anand, Crystallographic texture evolution in bulk
deformation processing of FCC metals. Journal of the Mechanics and Physics of Solids, 1992. 40(3):
p. 537.
108
42. Lebensohn, R.A. and C.N. Tomé, A self-consistent anisotropic approach for the simulation of
plastic deformation and texture development of polycrystals: Application to zirconium alloys. Acta
Metallurgica et Materialia, 1993. 41(9): p. 2611-2624.
43. Abuzaid, W., et al., Slip transfer and plastic accumulation across grain boundaries in
hastelloy X. J. Mech. Phys. Solids, 2012.
44. Hook, R.E. and J.P. Hirth, The deformation behavior of isoaxial bicrystals of Fe-3%Si. Acta
Metallurgica, 1967. 15(3): p. 535.
45. Hook, R.E. and J.P. Hirth, The deformation behavior of non-isoaxial bicrystals of Fe-3% Si.
Acta Metallurgica, 1967. 15(7): p. 1099.
46. Šittner, P., V. Novák, and J. Brádler, Persistent slip band - Grain boundary interactions in low
strain fatigue of isoaxial Fe-14wt. %Cr bicrystals. Scripta Metallurgica et Materialia, 1992. 27(6): p.
705.
47. Šittner, P. and V. Paidar, Observation and interpretation of grain boundary compatibility
effects in Fe-3.3wt%Si bicrystals. Acta Metallurgica, 1989. 37(7): p. 1717.
48. Lee, T., I. Robertson, and H. Birnbaum, An In Situ transmission electron microscope
deformation study of the slip transfer mechanisms in metals. Metallurgical and Materials
Transactions A, 1990. 21(9): p. 2437.
49. Aifantis, K.E., et al., Interfaces within strain gradient plasticity: Theory and experiments. Acta
Materialia, 2006. 54(19): p. 5077.
50. Soifer, Y.M., et al., Nanohardness of copper in the vicinity of grain boundaries. Scripta
Materialia, 2002. 47(12): p. 799.
51. Wang, M.G. and A.H.W. Ngan, Indentation strain burst phenomenon induced by grain
boundaries in niobium. Jouenal of Materials Research, 2004. 19: p. 2478-2486.
52. Britton, T.B., D. Randman, and A.J. Wilkinson, Nanoindentation study of slip transfer
phenomenon at grain boundaries. Journal of Materials Research, 2009. 24(03): p. 607-615.
53. Wo, P.C. and A.H.W. Ngan, Investigation of slip transmission behavior across grain
boundaries in polycrystalline Ni3Al using nanoindentation. Journal of Materials Research, 2004.
19(01): p. 189-201.
54. Hosford, W.F., Mechanical Behavior of Materials. 2005: Cambridge University Press.

109
55. Patriarca, L., et al., Twin nucleation and migration in FeCr single crystals. Materials
Characterization, 2013. 75(0): p. 165-175.
56. Clark, W.A.T., et al., The use of the transmission electron microscope in analyzing slip
propagation across interfaces. Ultramicroscopy, 1989. 30(1–2): p. 76.
57. Sangid, M.D., et al., Energy of slip transmission and nucleation at grain boundaries. Acta
Materialia. 59(1): p. 283.
58. de Koning, M., et al., Modeling of dislocation–grain boundary interactions in FCC metals.
Journal of Nuclear Materials, 2003. 323(2–3): p. 281.
59. Dimiduk, D.M., Gamma titanium aluminide alloys—an assessment within the competition of
aerospace structural materials. Materials Science and Engineering: A, 1999. 263(2): p. 281.
60. Winstone, M.R., A. Partridge, and J.W. Brooks, The contribution of advanced high-
temperature materials to future aero-engines. Proceedings of the Institution of Mechanical Engineers,
Part L: Journal of Materials Design and Applications, 2001. 215(2): p. 63-73.
61. Bartolotta, P., et al., The use of cast Ti−48Al−2Cr−2Nb in jet engines. JOM Journal of the
Minerals, Metals and Materials Society, 1997. 49(5): p. 48.
62. Hénaff, G. and A.-L. Gloanec, Fatigue properties of TiAl alloys. Intermetallics, 2005. 13(5): p.
543.
63. Ng, B.C., et al., The role of mechanical twinning on microcrack nucleation and crack
propagation in a near-γ TiAl alloy. Intermetallics, 2004. 12(12): p. 1317-1323.
64. Kad, B.K., M. Dao, and R.J. Asaro, Numerical simulations of plastic deformation and fracture
effects in two phase γ-TiAl + α2-Ti3Al lamellar microstructures. Philosophical Magazine A, 1995.
71(3): p. 567-604.
65. Leyens, C. and M. Peters, Titanium and Titanium Alloys. 2003: WILEY-VCH.
66. Carroll, J., et al., An experimental methodology to relate local strain to microstructural
texture. Review of Scientific Instruments, 2010. 81(8).
67. Bruck, H., et al., Digital image correlation using Newton-Raphson method of partial
differential correction. Experimental Mechanics, 1989. 29(3): p. 261.
68. Chu, T., W. Ranson, and M. Sutton, Applications of digital-image-correlation techniques to
experimental mechanics. Experimental Mechanics, 1985. 25(3): p. 232.

110
69. Carroll, J., et al., Investigation of fatigue crack closure using multiscale image correlation
experiments. Engineering Fracture Mechanics, 2009. 76(15): p. 2384-2398.
70. Efstathiou, C., H. Sehitoglu, and J. Lambros, Multiscale strain measurements of plastically
deforming polycrystalline titanium: Role of deformation heterogeneities. International Journal of
Plasticity. 26(1): p. 93.
71. Deformation Twinning. 1963. Gainesville, Florida: Gordon and Breach Science Publishers /
New York - London - Paris.
72. Baeslack Iii, W.A., et al., Metallography of gamma titanium aluminides. Materials
Characterization, 1993. 31(4): p. 197-207.
73. Engler, O. and V. Randle, Introduction to Texture Analysis. 2010: CRC Press.
74. Christian, J., Some surprising features of the plastic deformation of body-centered cubic
metals and alloys. Metallurgical and Materials Transactions A, 1983. 14(7): p. 1237.
75. Schmid, E., Proc. Internat. Cong. Appl. Mech., 1924.
76. Nabarro, F.R.N., Extended dislocations and the schmid law of resolved shear stress.
Philosophical Magazine, 1966. 14(130): p. 861.
77. Vitek, V., M. Mrovec, and J.L. Bassani, Influence of non-glide stresses on plastic flow: from
atomistic to continuum modeling. Materials Science and Engineering: A, 2004. 365(1-2): p. 31.
78. Duesbery, M.S. and V. Vitek, Plastic anisotropy in b.c.c. transition metals. Acta Materialia,
1998. 46(5): p. 1481.
79. Sleeswyk, A.W. and J.N. Helle, Zigzag configurations of twins in α-iron. Acta Metallurgica,
1961. 9(4): p. 344.
80. Weertman, J. and J.R. Weertman, Elementary Dislocation Theory. 1992: Oxford University
Press.
81. Efstathiou, C. and H. Sehitoglu, Strain hardening and heterogeneous deformation during
twinning in Hadfield steel. Acta Materialia, 2009. 58(5): p. 1479.
82. Hirth, J., The influence of grain boundaries on mechanical properties. Metallurgical and
Materials Transactions B, 1972. 3(12): p. 3047.
83. Sutton, A.P. and R.W. Balluffi, Interfaces in crystalline materials. 1995: Clarendon Press.
111
84. Lim, L.C., Slip-twin interactions in nickel at 573K at large strains. Scripta Metallurgica, 1984.
18(10): p. 1139.
85. Lim, L.C. and R. Raj, Continuity of slip screw and mixed crystal dislocations across bicrystals
of nickel at 573 K. Acta Metallurgica, 1985. 33(8): p. 1577.
86. Lim, L.C. and R. Raj, The role of residual dislocation arrays in slip induced cavitation,
migration and dynamic recrystallization at grain boundaries. Acta Metallurgica, 1985. 33(12): p. 2205.
87. Abuzaid, W., et al., The Role of Slip Transmission on Plastic Strain accumulationacross
Grain Boundaries. Procedia IUTAM. 4(0): p. 169.
88. Seeger, A., Experimental evidence for the {110} ↔ {112} transformation of the screw-
dislocation cores in body-centred cubic metals. physica status solidi (a), 2004. 201(4): p. R21.
89. Sutton, M., et al., Full-field representation of discretely sampled surface deformation for
displacement and strain analysis. Experimental Mechanics, 1991. 31(2): p. 168.
90. Hirth, J. and J. Lothe, Theory of Dislocations. Second ed. 1982: John Wiley and Sons, Inc.
91. Filippini, M., et al., Defect tolerance of a gamma titanium aluminide alloy. Procedia
Engineering, 2011. 10(0): p. 3677-3682.
92. Biamino, S., et al., Electron beam melting of Ti-48Al-2Cr-2Nb alloy: Microstructure and
mechanical properties investigation. Intermetallics. 19(6): p. 776.
93. Murr, L.E., et al., Characterization of titanium aluminide alloy components fabricated by
additive manufacturing using electron beam melting. Acta Materialia. 58(5): p. 1887.
94. Andersson, L.E. and M. Larsson, Device and Arrangement for producing a Three-
Dimensional Object, 2001.
95. Sauthoff, G., Intermetallics. 1995: VCH.
96. McCullough, C., et al., Phase equilibria and solidification in Ti-Al alloys. Acta Metallurgica,
1989. 37(5): p. 1321-1336.
97. Gloanec, A.L., et al., Cyclic deformation mechanisms in a gamma titanium aluminide alloy at
room temperature. Scripta Materialia, 2005. 52(2): p. 107-111.
98. Appel, F., J.D.H. Paul, and M. Oehring, Gamma Titanium Aluminide Alloys. 2011: Wiley.
99. Yoo, M.H., J. Zou, and C.L. Fu, Mechanistic modeling of deformation and fracture behavior in
TiAl and Ti3Al. Materials Science and Engineering: A, 1995. 192-193, Part 1(0): p. 14.

112
100. Tanaka, K., Y. Nakai, and M. Yamashita, Fatigue growth threshold of small cracks.
International Journal of Fracture, 1981. 17(5): p. 519.
101. Voice, W.E., et al., Gamma titanium aluminide, TNB. Intermetallics, 2005. 13(9): p. 959.
102. Pippan, R., et al., Fatigue threshold and crack propagation in γ-TiAl sheets. Intermetallics,
2001. 9(1): p. 89.
103. García, A. and H. Sehitoglu, Contact of crack surfaces during fatigue: Part 1. formulation of
the model. Metallurgical and Materials Transactions A, 1997. 28(11): p. 2263-2275.
104. Sehitoglu, H. and A. García, Contact of crack surfaces during fatigue: Part 2. Simulations.
Metallurgical and Materials Transactions A, 1997. 28(11): p. 2277-2289.
105. Gloanec, A.L., et al., Fatigue crack growth behaviour of a gamma-titanium-aluminide alloy
prepared by casting and powder metallurgy. Scripta Materialia, 2003. 49(9): p. 825.